| ID |
Date |
Author |
Subject |
|
5
|
Thu Jan 9 15:38:54 2025 |
CLW | Irradiation |
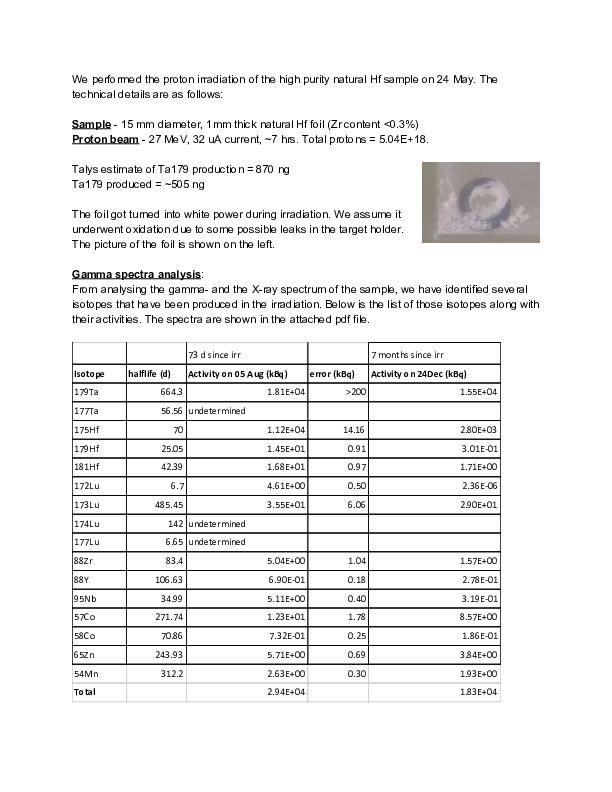
More documentation on 179TA sample production
Publication: https://journals.aps.org/prc/abstract/10.1103/PhysRevC.107.045805
|
| Attachment 1: SummaryIrradiation.pdf
|
|
| Attachment 2: 179Ta_separation.docx
|
|
4
|
Wed Jul 29 14:09:40 2020 |
RG | Activation calculations sheet |
Google sheet with activation calculations: https://docs.google.com/spreadsheets/d/1fqBw-iCkZ_v45S6PhKZxoU0qtBy8W_HfurwcGsZw_c4/edit?usp=sharing |
| Attachment 1: Shared_ActivationCalculations.xlsx
|
|
3
|
Wed Jul 29 13:05:10 2020 |
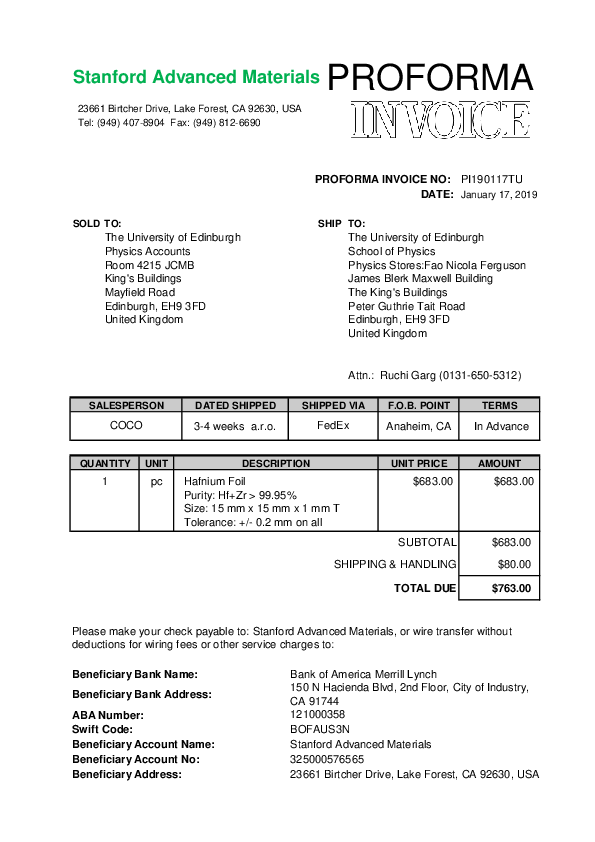
RG | High purity hafnium foil documents |
|
| Attachment 1: Proforma_Invoice-PI190117TU.pdf
|

|
| Attachment 2: Hf_foil_impurities.pdf
|

|
|
2
|
Tue Jul 28 21:56:03 2020 |
RG | Gamma spectra |
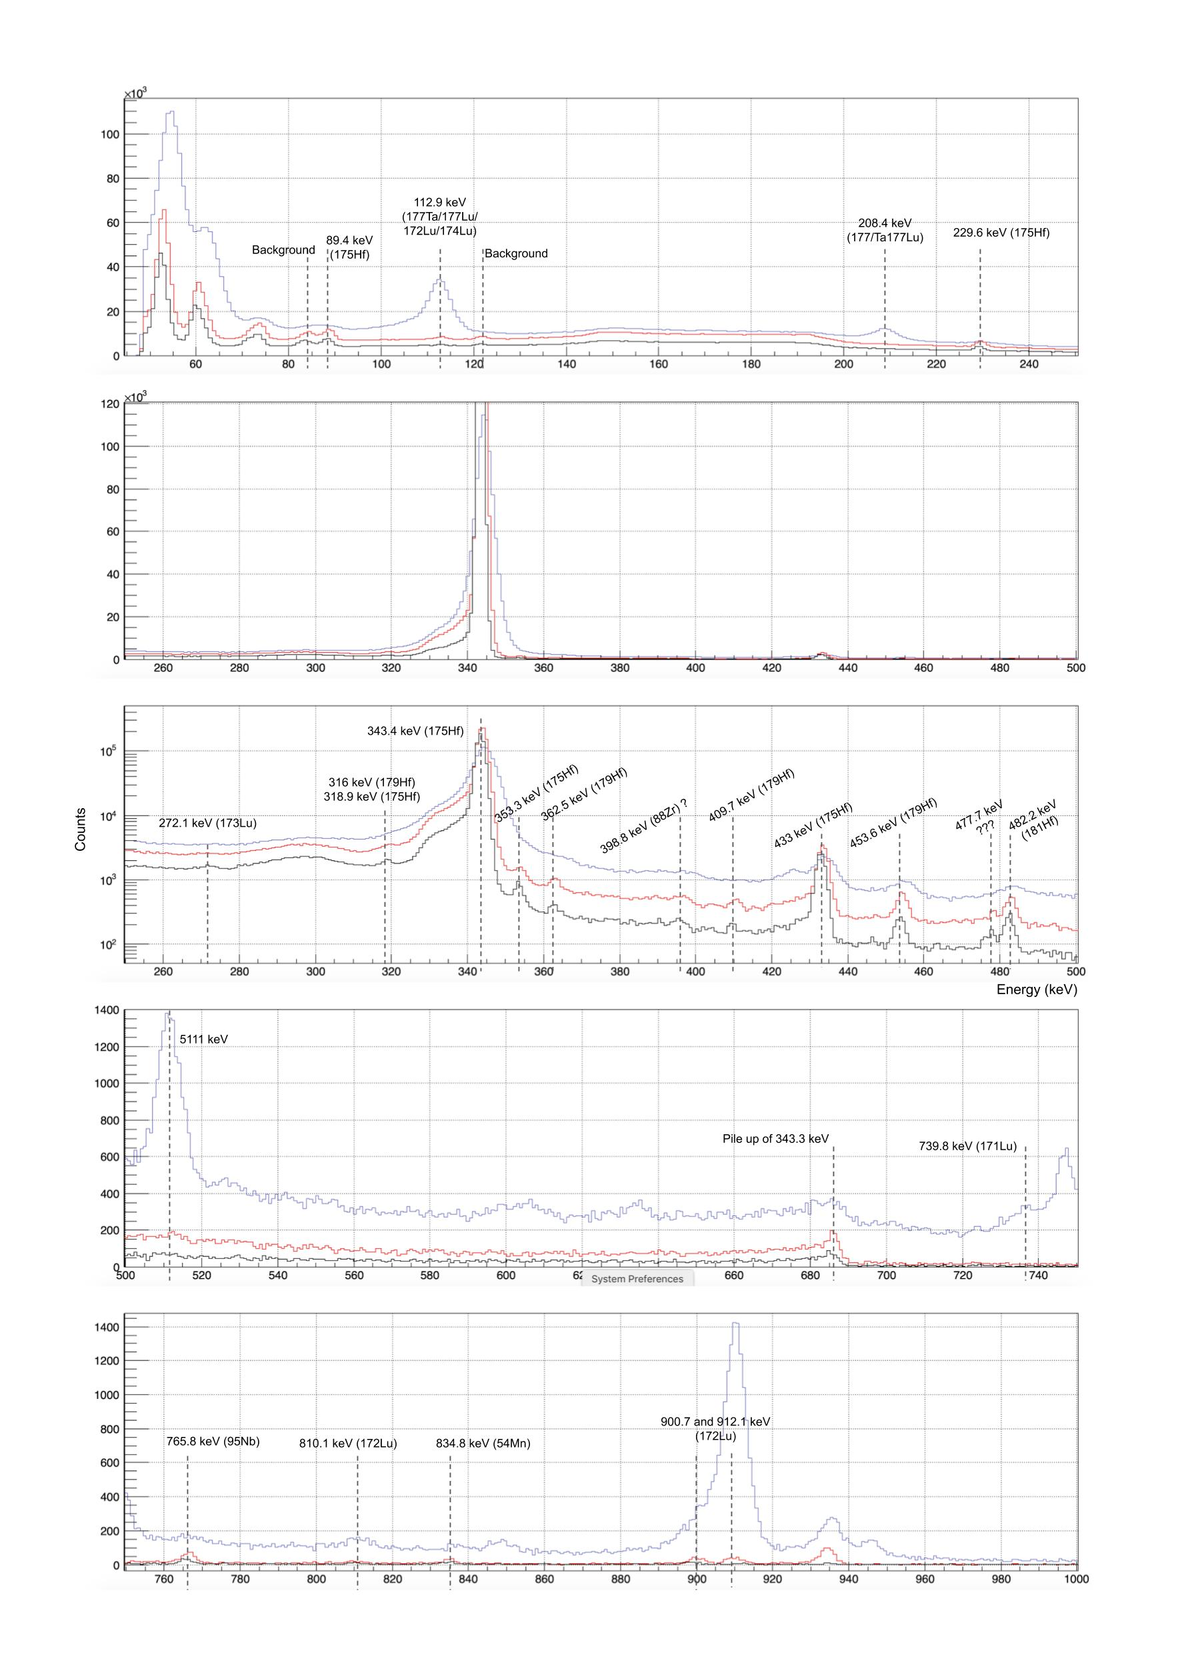
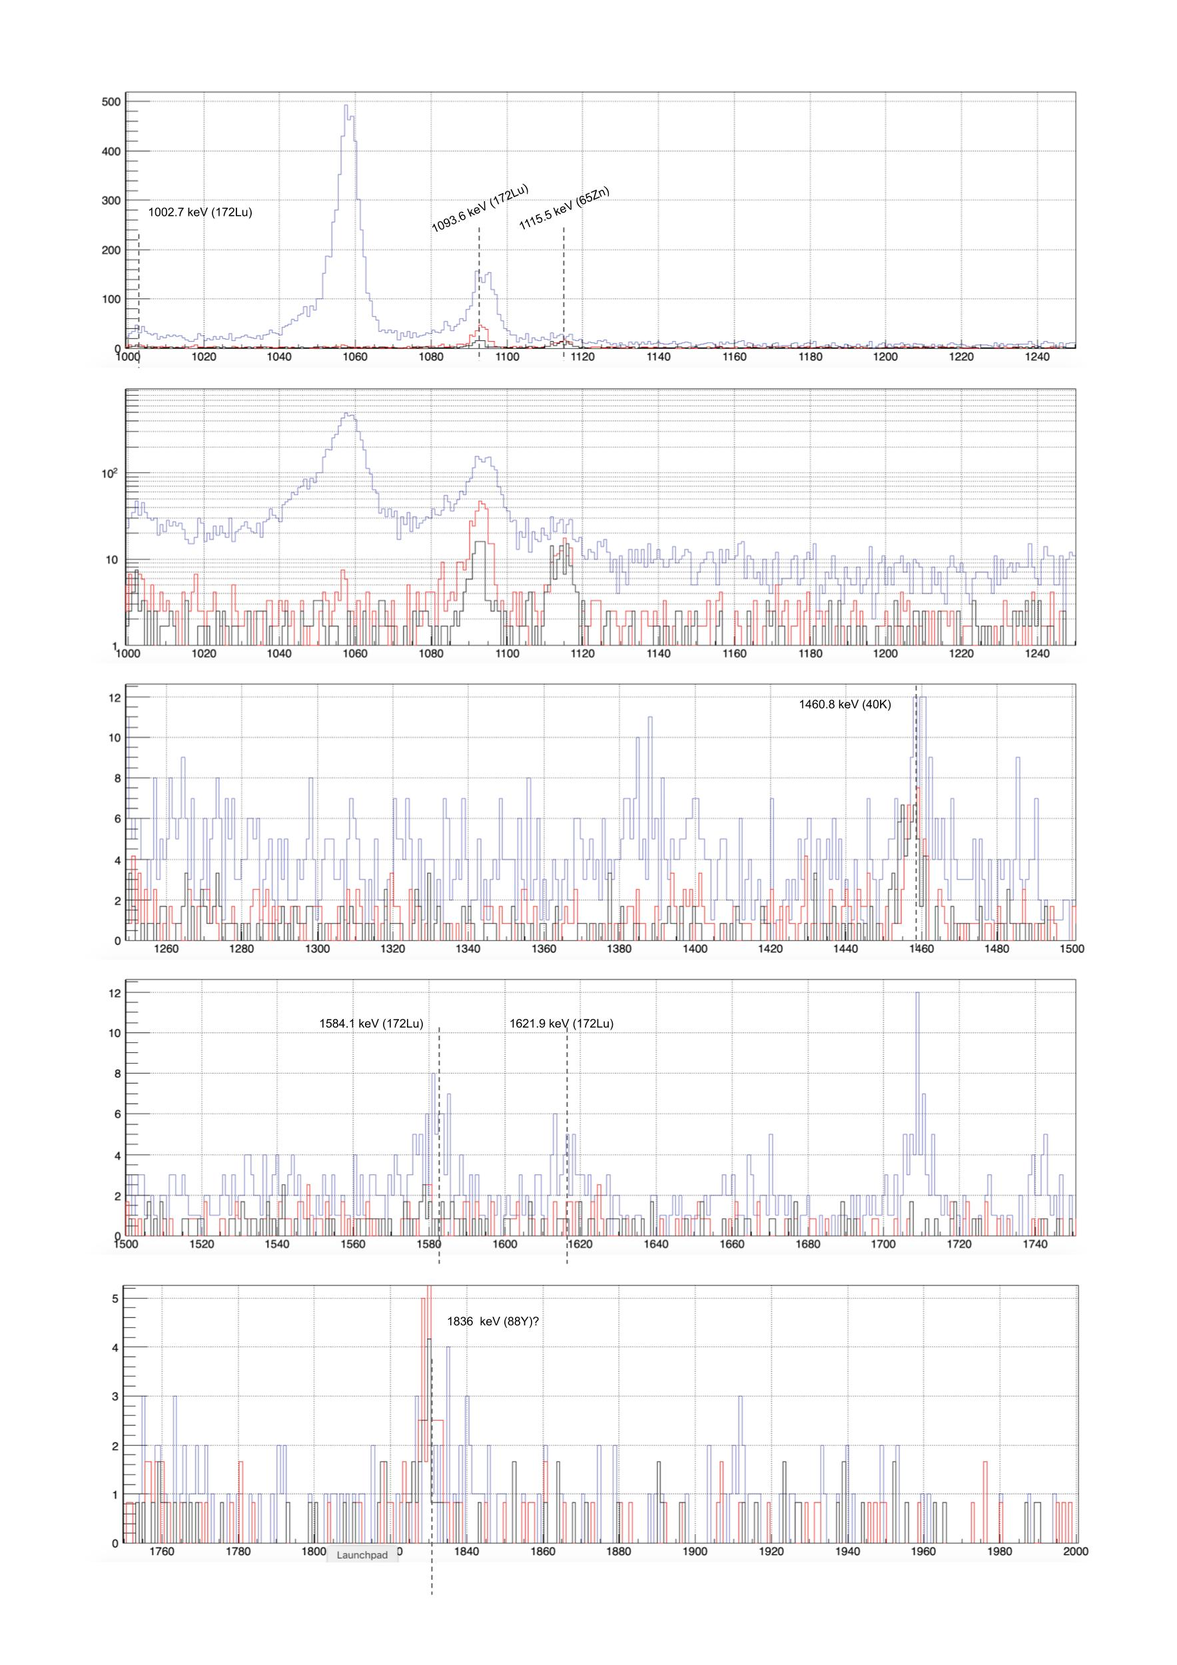
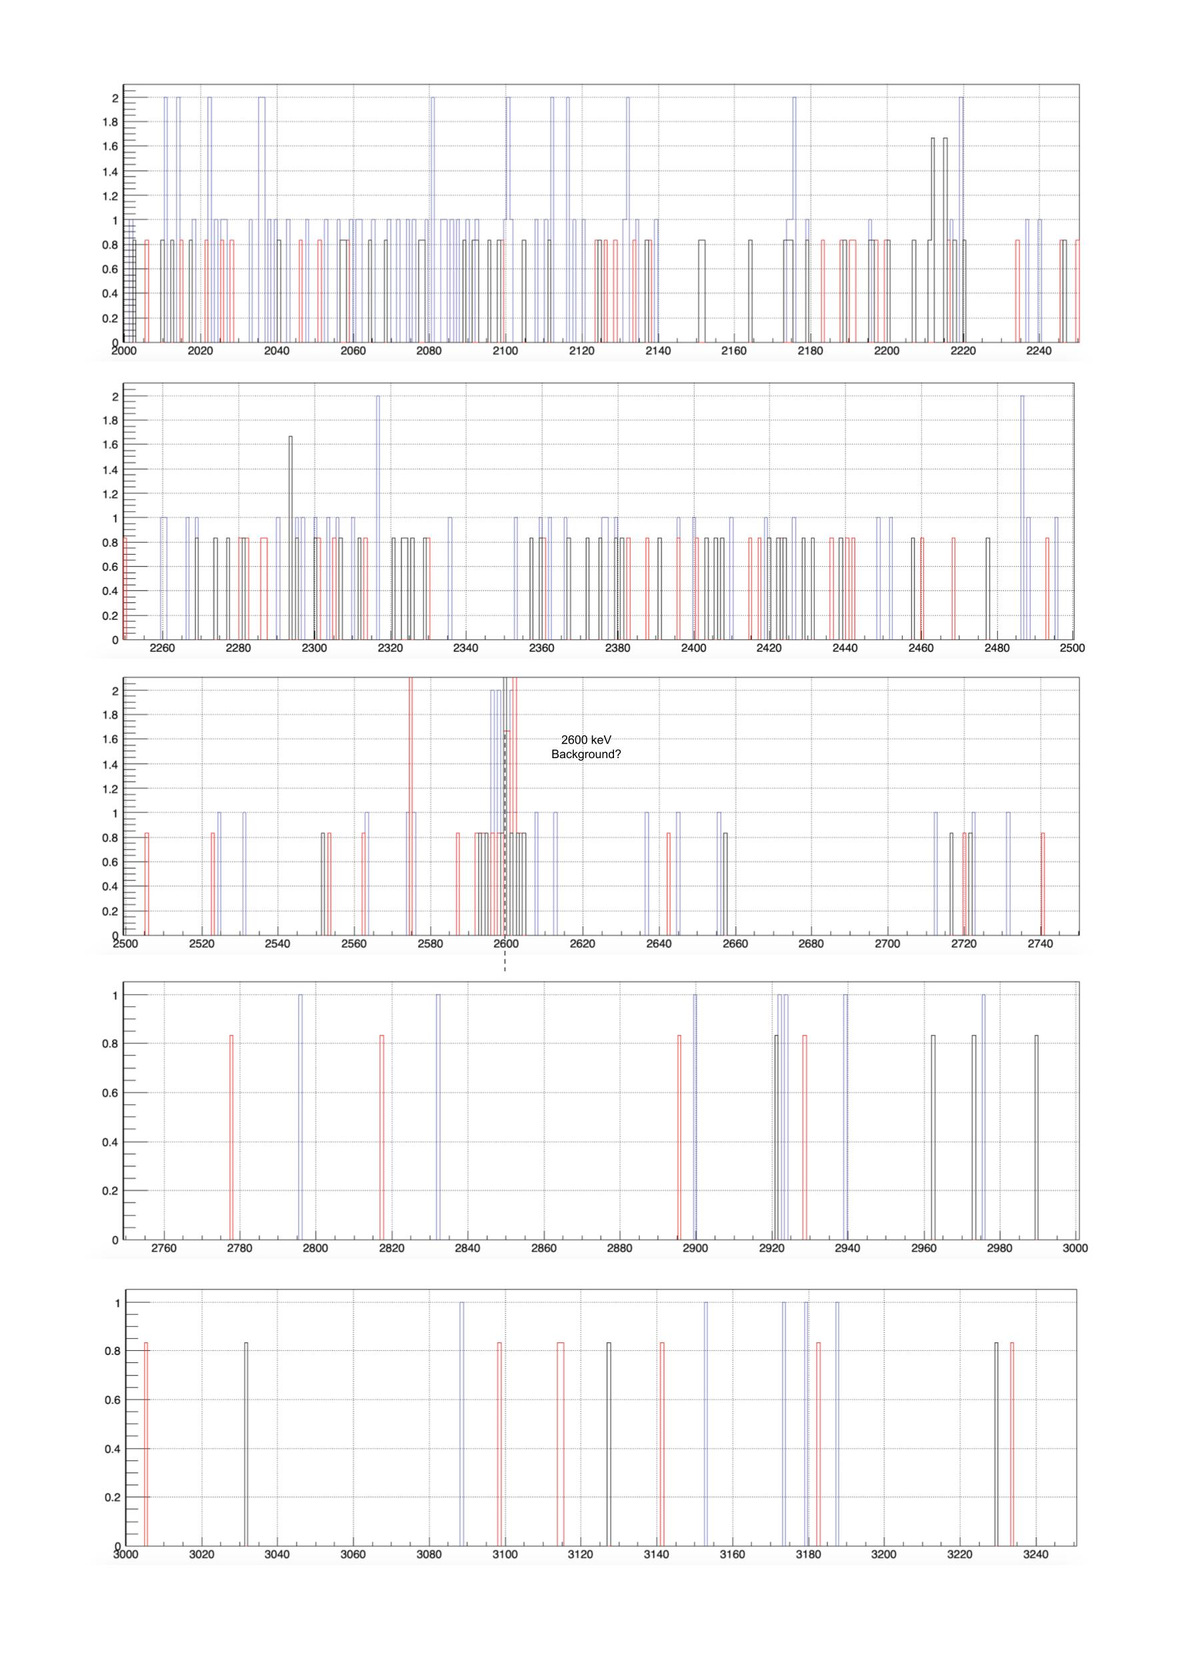
Gamma-spectra recorded on 03/06/2019, 24/06/2019, and 05/08/2019 analysed for identifyiing isotopes produced and estimating their activities. The spectra are shown in attached pictures with the identified peaks labelled.
Ta179 activity given here was calculated by analysing the 61 keV peak assuming that this peak would be dominated by X-rays from Hf175 and and Ta179 (as these isotopes have at least 3 orders of magnitude larger activity than any other isotope). With that assumption, and by using the value for Hf175 activity (1.12E+04 on 5 Aug) that was calculated using its gamma peaks, the value of Ta179 activity on 5 Aug was estimated to be 1.81E+04 kBq.
A summary of most active isotopes at the time of shipment (around 24 Dec 2019) is shown in table below:
| |
|
73 d since irr |
|
7 mnths since irr |
| Isotope |
halflife (d) |
Activity on 05 Aug (kBq) |
error (kBq) |
Activity on 24Dec (kBq) |
| 179Ta |
664.3 |
1.81E+04 |
>200 |
1.55E+04 |
| 177Ta |
56.56 |
undetermined |
|
|
| 175Hf |
70 |
1.12E+04 |
14.16 |
2.80E+03 |
| 179Hf |
25.05 |
1.45E+01 |
0.91 |
3.01E-01 |
| 181Hf |
42.39 |
1.68E+01 |
0.97 |
1.71E+00 |
| 172Lu |
6.7 |
4.61E+00 |
0.50 |
2.36E-06 |
| 173Lu |
485.45 |
3.55E+01 |
6.06 |
2.90E+01 |
| 174Lu |
142 |
undetermined |
|
|
| 177Lu |
6.65 |
undetermined |
|
|
| 88Zr |
83.4 |
5.04E+00 |
1.04 |
1.57E+00 |
| 88Y |
106.63 |
6.90E-01 |
0.18 |
2.78E-01 |
| 95Nb |
34.99 |
5.11E+00 |
0.40 |
3.19E-01 |
| 57Co |
271.74 |
1.23E+01 |
1.78 |
8.57E+00 |
| 58Co |
70.86 |
7.32E-01 |
0.25 |
1.86E-01 |
| 65Zn |
243.93 |
5.71E+00 |
0.69 |
3.84E+00 |
| 54Mn |
312.2 |
2.63E+00 |
0.30 |
1.93E+00 |
| Total |
|
2.94E+04 |
|
1.83E+04 |
|
| Attachment 1: CalSpectra1.jpg
|
|
| Attachment 2: CalSpectra2.jpg
|
|
| Attachment 3: CalSpectra3.jpg
|
|
|
1
|
Tue Jul 28 14:29:53 2020 |
RG | Proton irradiation summary |
Proton beam - 27 MeV, 32 uA current, ~7 hrs. Total protons = 5.04E+18.
Sample - 15 mm diameter, 1mm thick natural Hf foil. Hf+Zr>99.93% and Zr content <0.5%. Impurities in the sample listed in the attached document.
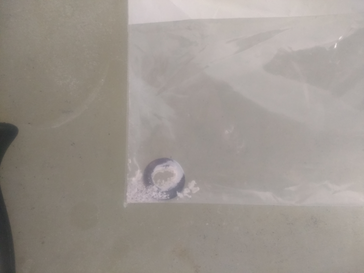
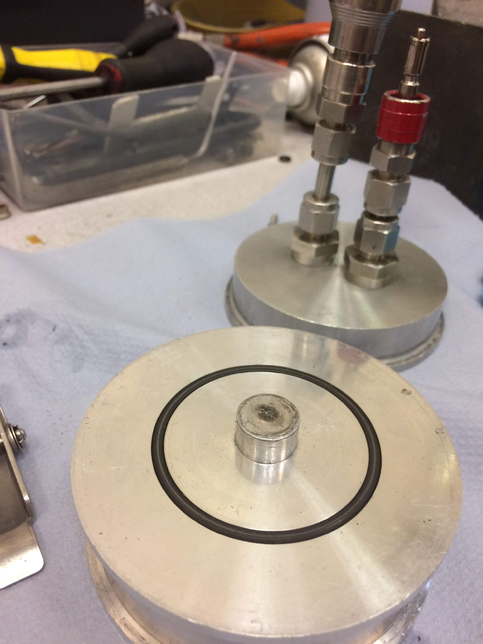
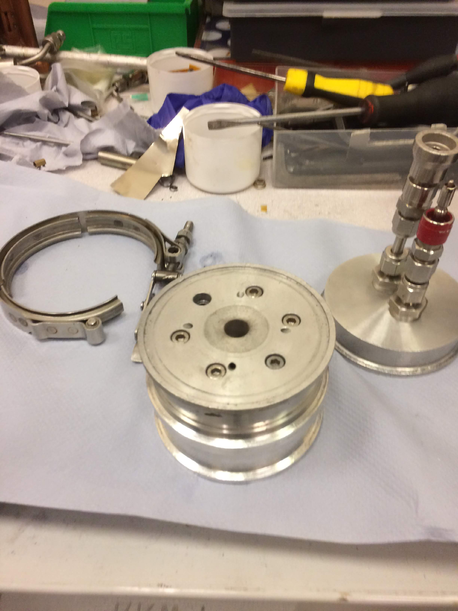
Sample holder: Simple foil holder which sandwiches the foil between two sheets. The front sheet has a hole for the incident beam. The back is water cooled and the front is compressed air cooled. We used it on helium cooled beam line as Hf (in podwer form) can catch fire on coming in contact with air. We had tested that the foil should not catch fire by placing a small sample of hafnium foil in the kiln at 1000 deg C at atmospheric pressure. But just to be cautious we used the helium cooling at the front of the foil during irradiation. Pictures of sample holder attached.
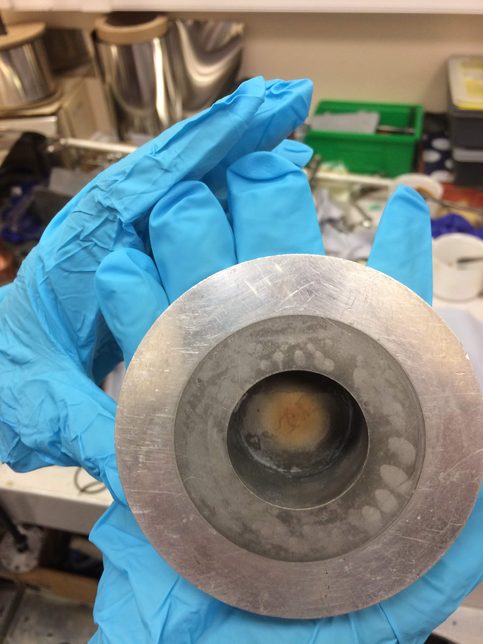
Sample oxidation: The foil got turned into white power during irradiation. We assume it underwent oxidation due to possible leaks in the target holder. In the last hour of irradiation, the vacuum window had failed. The picture of sample after irradiation is attached.
Contact dose rate on 03 Jun 2019 was >4mSv/hr. |
| Attachment 1: IMG_20190603_130915466.jpg
|
|
| Attachment 2: IMG_2008.jpg
|
|
| Attachment 3: IMG_2009.jpg
|
|
| Attachment 4: IMG_2010.jpg
|
|
| Attachment 5: Hf_foil_impurities.pdf
|

|