|
|
|
AIDA
GELINA
BRIKEN
nToF
CRIB
ISOLDE
CIRCE
nTOFCapture
DESPEC
DTAS
EDI_PSA
179Ta
CARME
StellarModelling
DCF
K40
MONNET
|
| AIDA |
 |
|
|
|
Message ID: 457
Entry time: Wed Nov 16 06:47:02 2016
|
| Author: |
TD |
| Subject: |
Analysis of data files R25_11 to _13 |
|
|
Offline analysis of R25_11 to _13 see http://ribf-exp.riken.jp/elog/RIBF123/141

"F5 C target F7 no F11 C 6mm

Date 2016/11/10
Start time: 08:20
DLT File: 161110_0820_767778Ni_035.dlt
RUN: 035
Aida RUN: R25_11

Comment: F11 Degraders taken out after few minutes
Degrader: no

Rates:
F11R:   450 Hz
BRIKEN:  200 Hz

Stop time: 09:18
AIDA run: R25_23
ROOT file: 161110_0918_767778Ni_035.root"

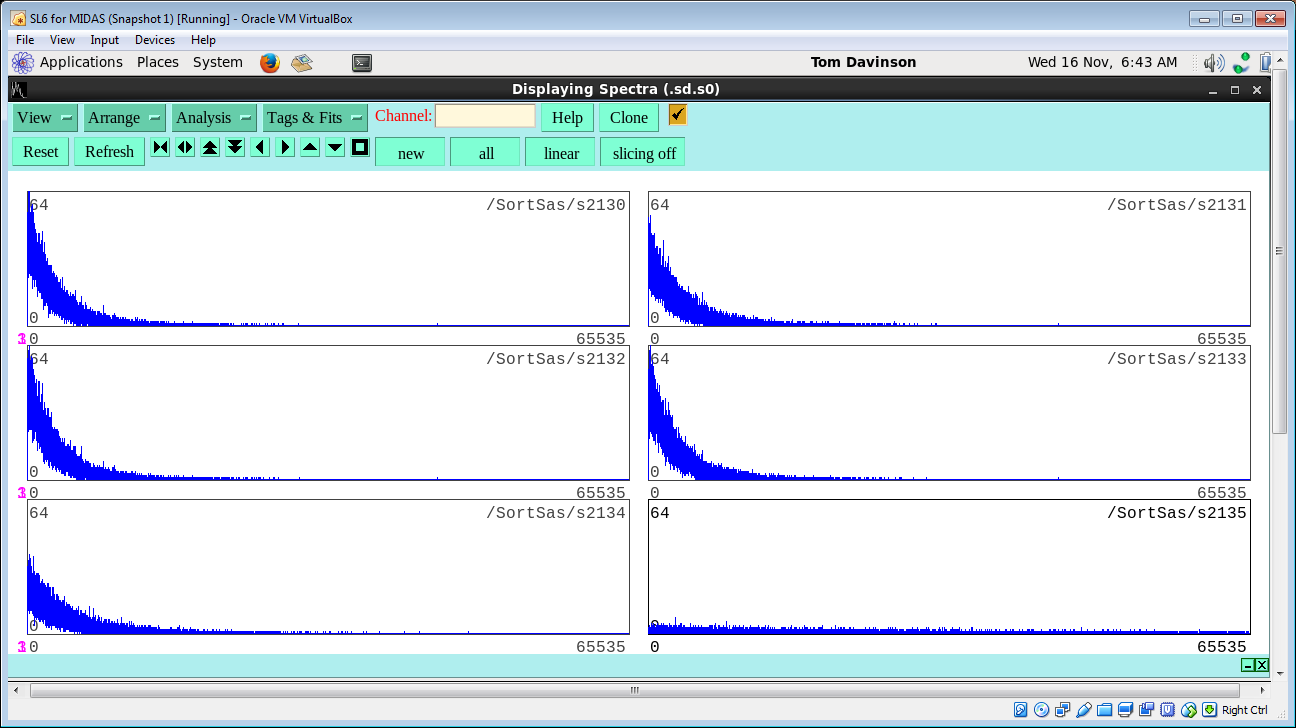
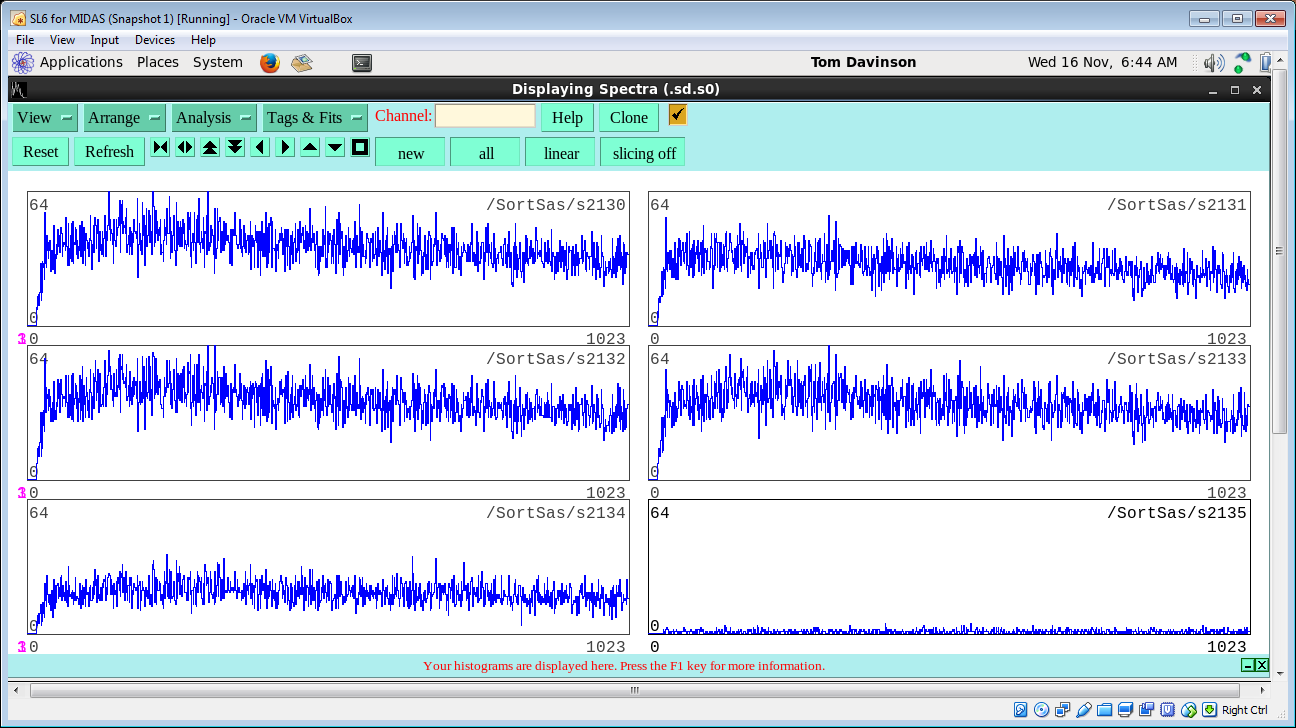
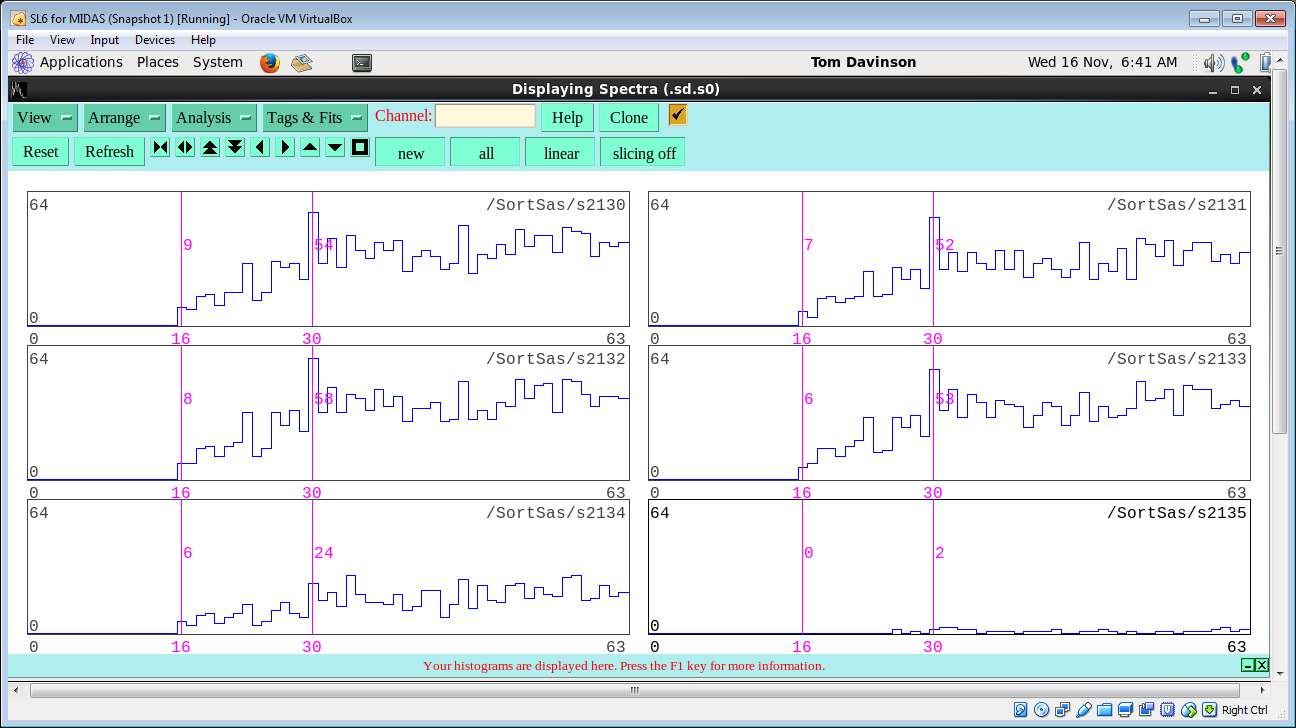
Attachments 1-3 show spectra s2130-s2135 over different ranges

s2130 DSSSD #1 time between successive HEC events (2.56us/channel)
 :
 :
s2135 DSSSD #6 time between successive HEC events (2.56us/channel)

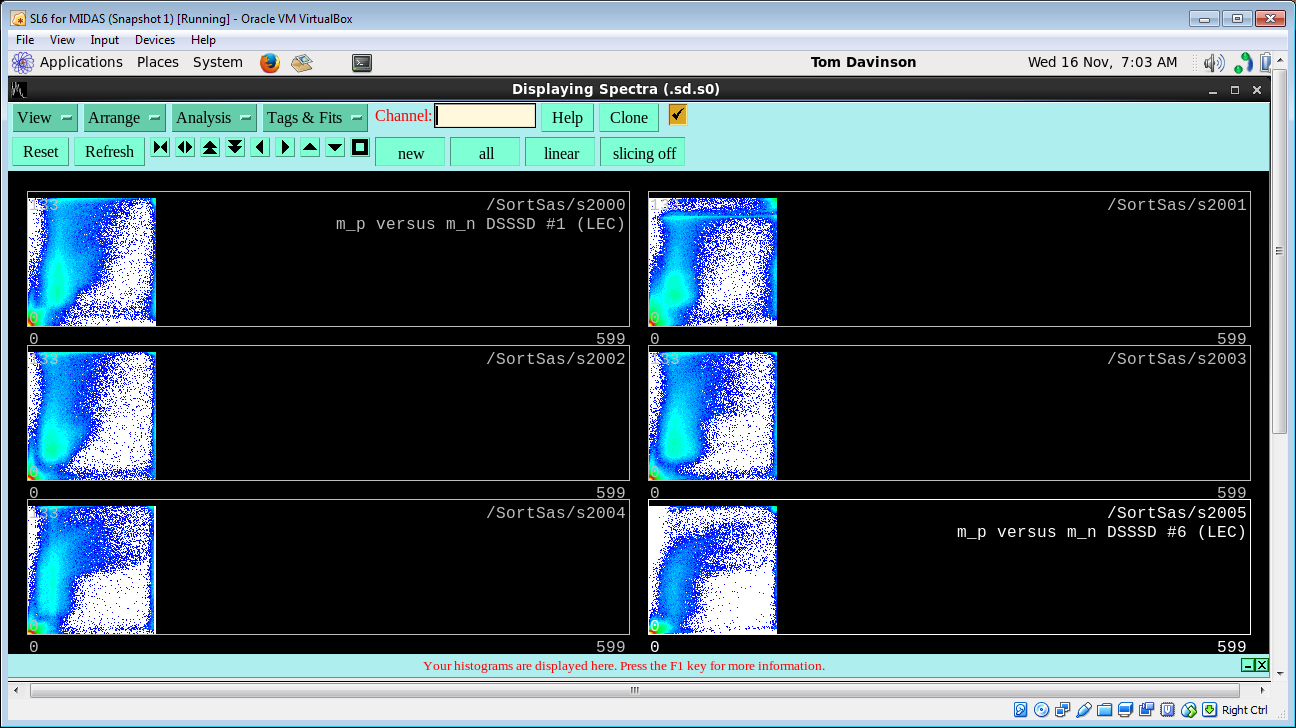
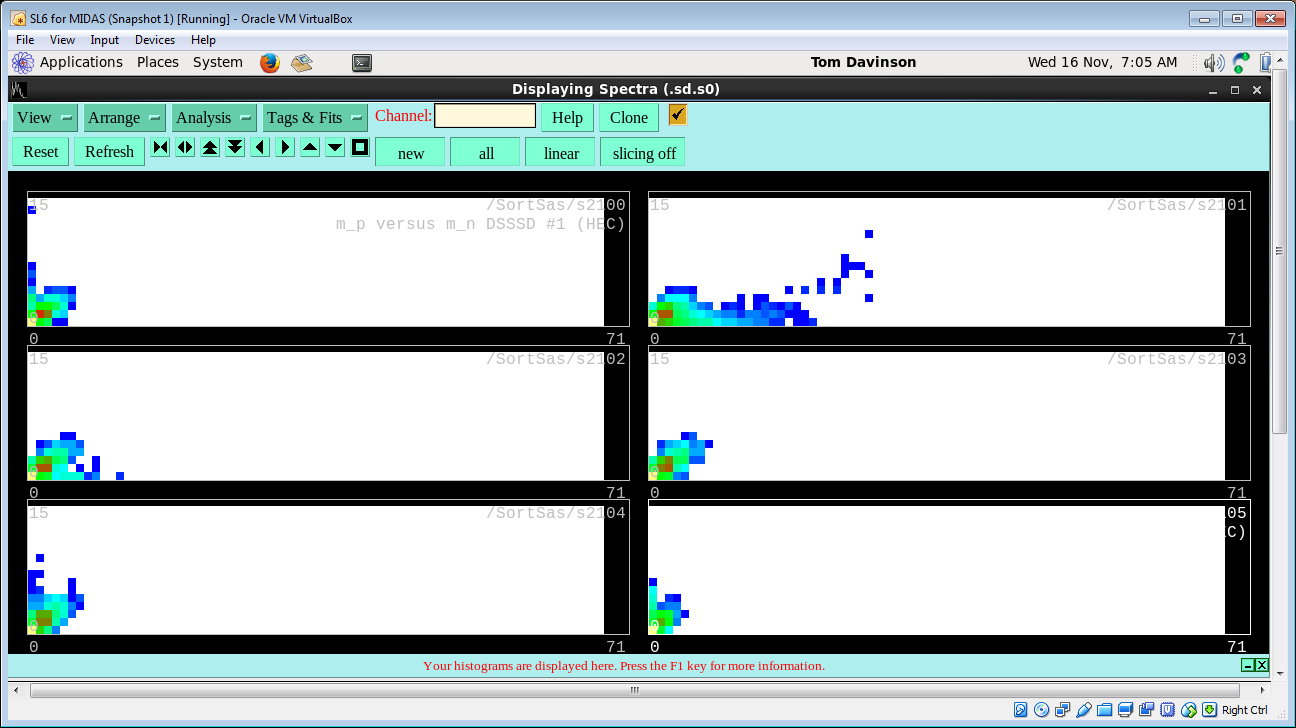
Attachment 4

s2000-s2005 DSSSD #1-6 LEC m_p versus m_n

Attachment 5

s2100-s2105 DSSSD #1-6 HEC m_p versus m_n


HEC events for each DSSSD are defined as m_p_hec > 0 and m_n_hec > 0

Minimum time between HEC events = 16 channels = 40.96us

Centroid channels 0-65525 of spectrum s2130 = ch 2566.44 => 0.00657s -> 152Hz
which agrees well with the typical DSSSD #1 rate for these data files

Is there structure at channel 30 => 76.8us ? More likely it shows variations
in readout time from HEC event to HEC event. |
|
|
|
|
|
|
|
|
|
|