|
|
|
AIDA
GELINA
BRIKEN
nToF
CRIB
ISOLDE
CIRCE
nTOFCapture
DESPEC
DTAS
EDI_PSA
179Ta
CARME
StellarModelling
DCF
K40
|
| AIDA |
 |
|
|
|
Message ID: 463
Entry time: Tue Nov 22 12:24:48 2016
|
| Author: |
TD |
| Subject: |
Analysis of R25_11 to R25_23 |
|
|
Offline analysis of AIDA data files R25_11 to R25_23 using MIDASsort

Note

- no calibration (raw ADC data only)
- no thresholds
- no clustering
- events delimited by > 2us time difference between successive ADC data words
  AIDA data files R25_11 to R25_23 inclusive contain 410.3M events
- HEC = high energy channel = 20GeV FSR range for high energy implants
- LEC = low energy channel = 20MeV FSR range for decays (and pulser)
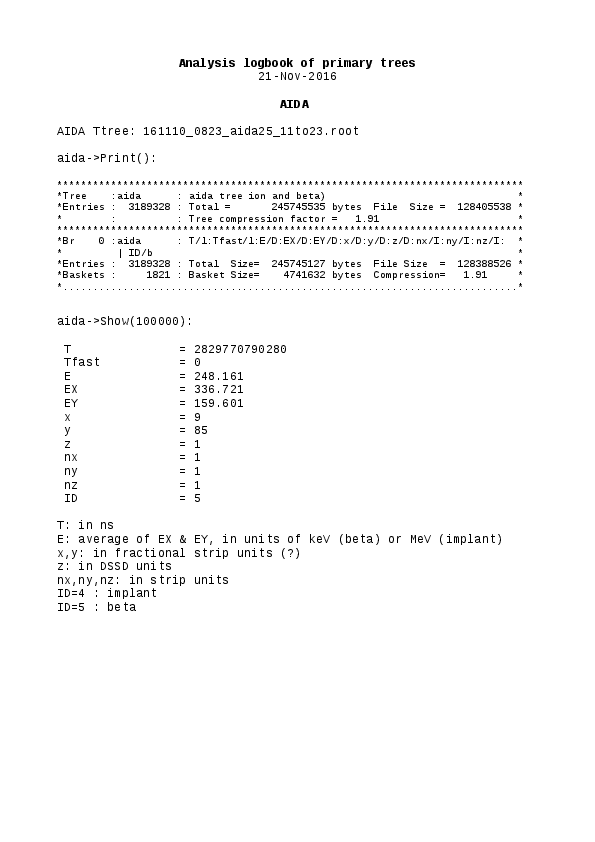
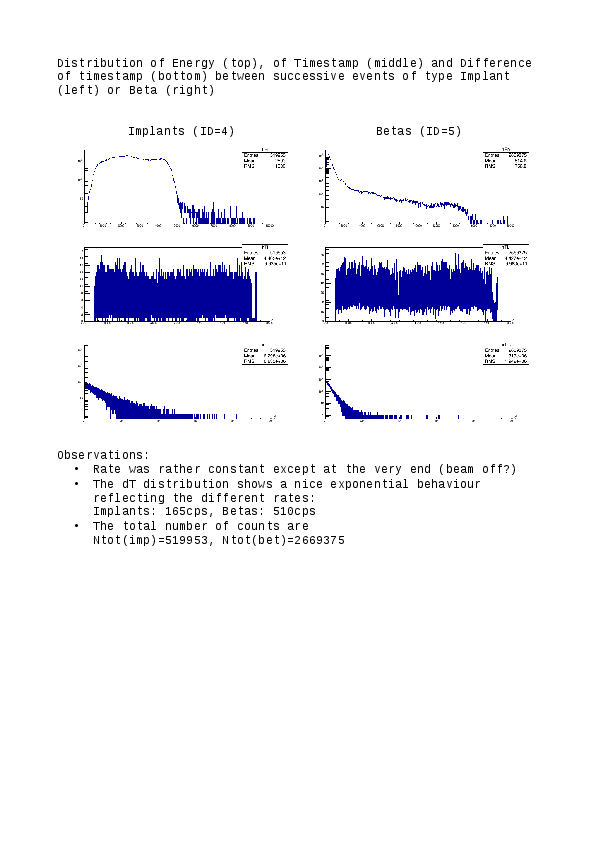
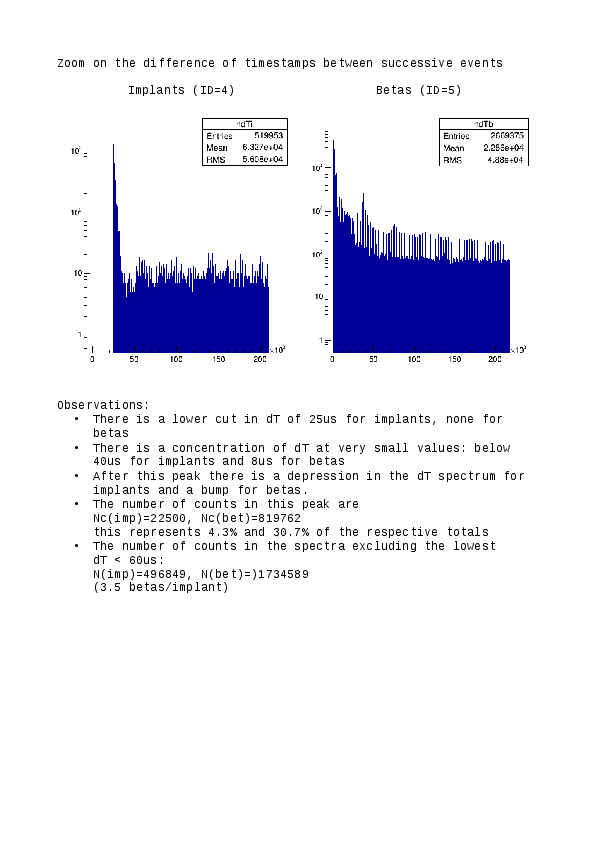
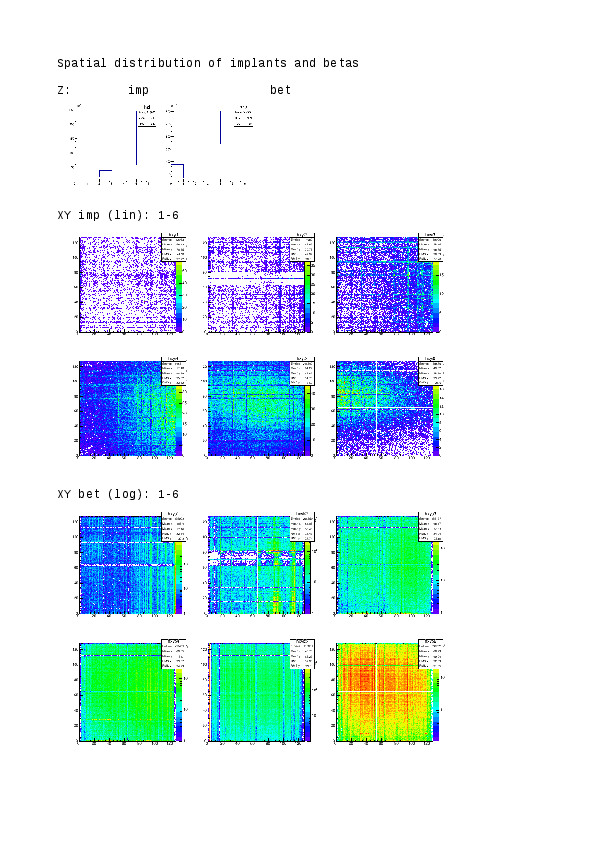
- see attachment 20 *prelimnary* analysis of R25_11 to R25_23 by Tain et al. of 21.11.16


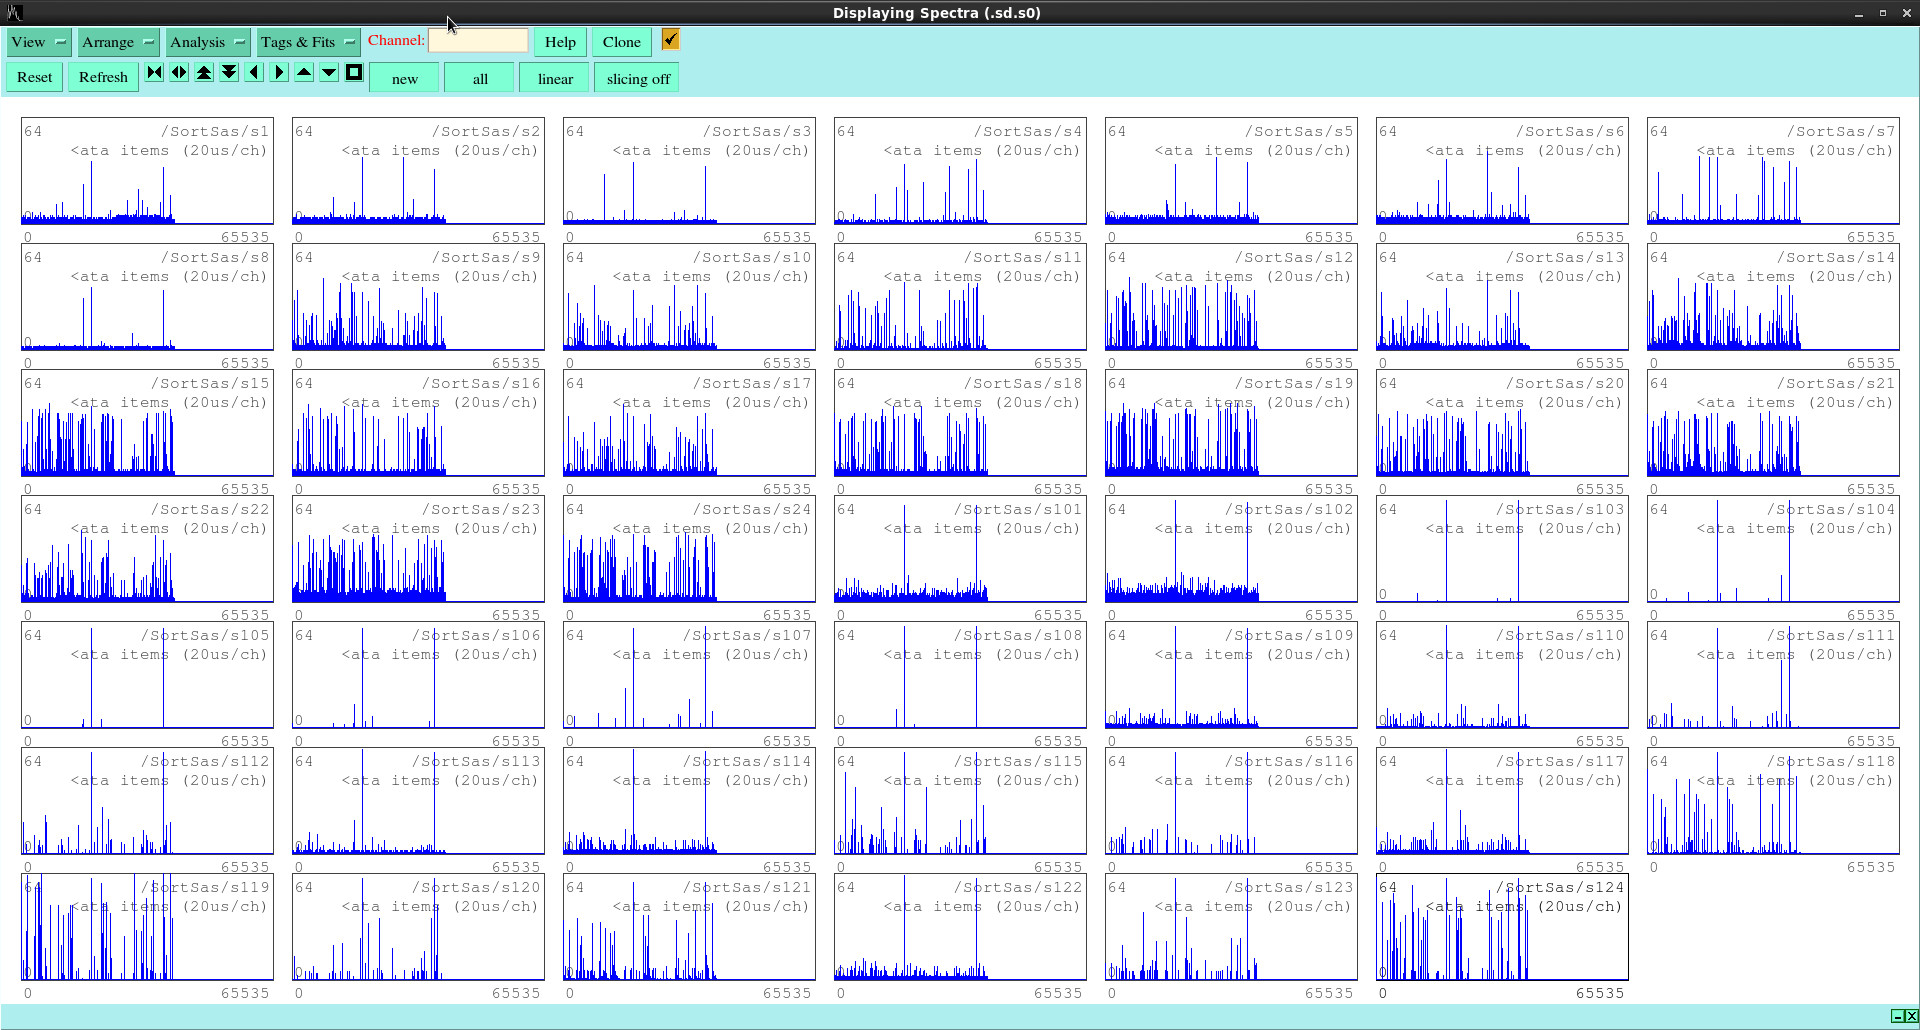
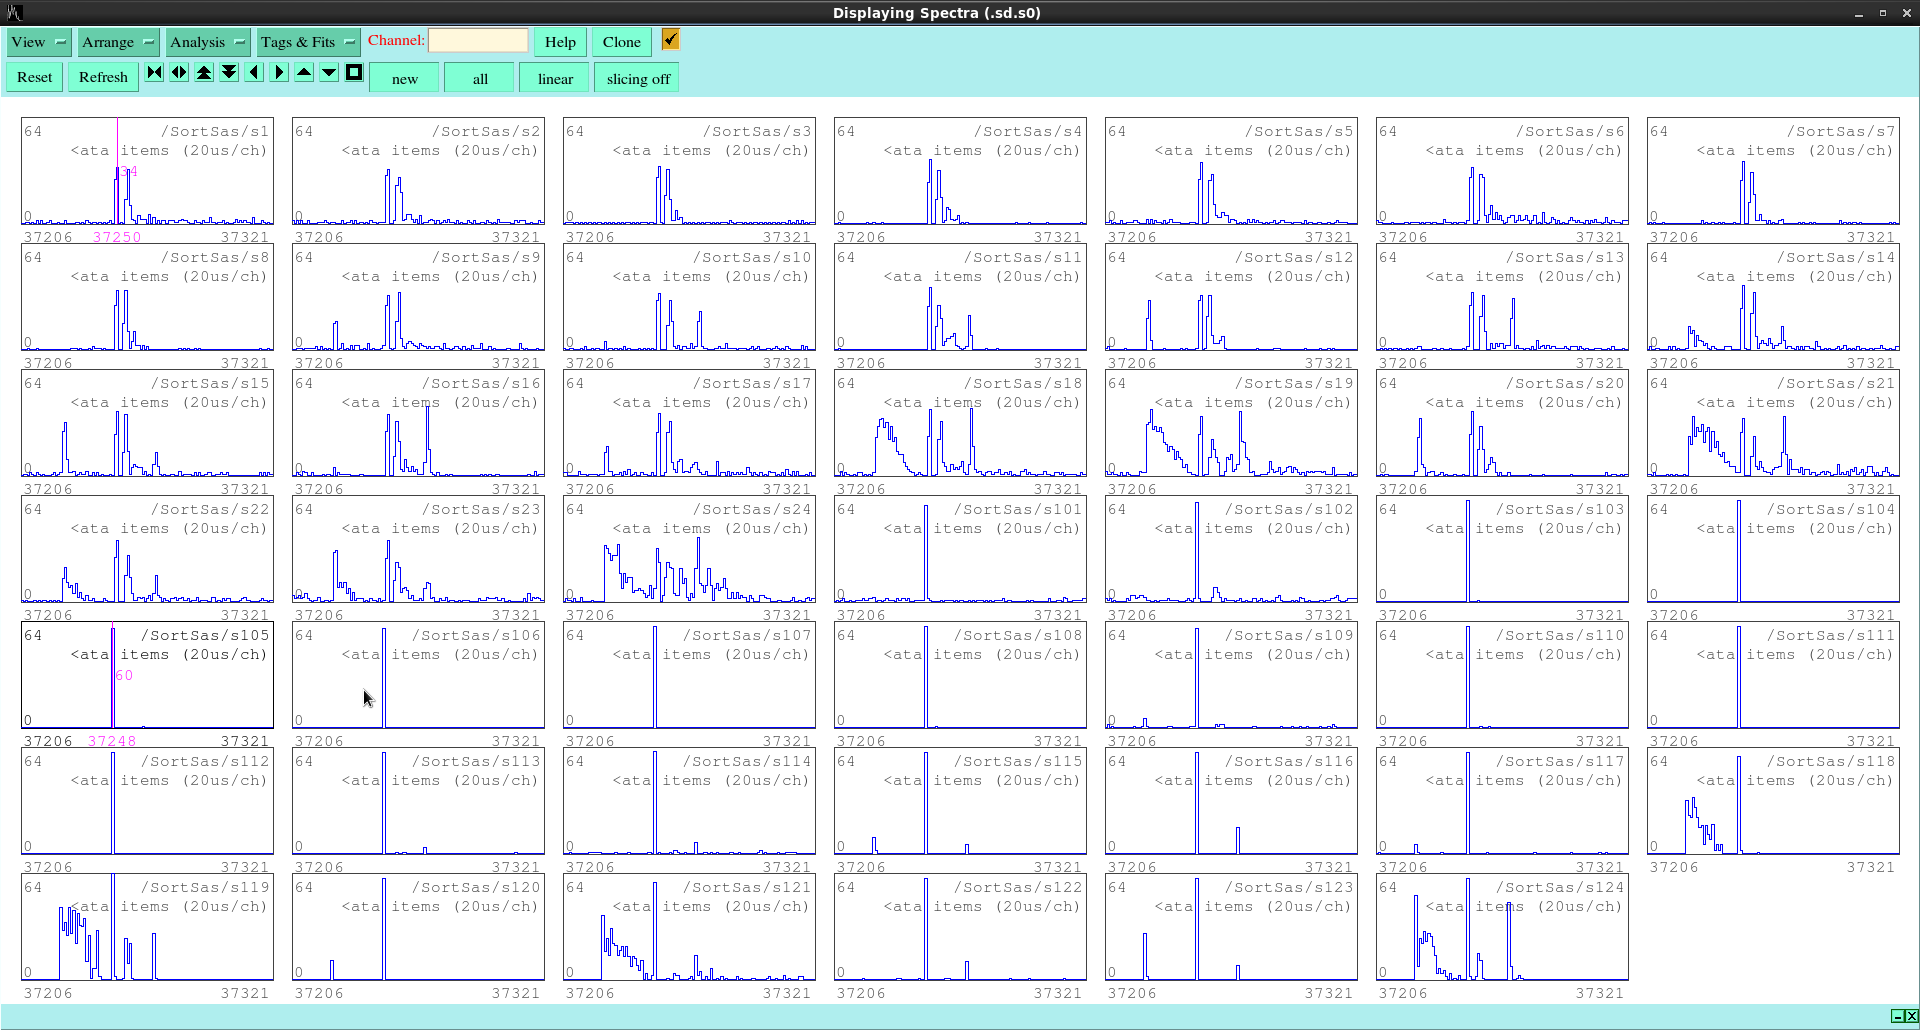
Attachments 1 & 2
-----------------
s1-s24     per FEE64 # ADC data per 20.48us
s101-s124  per FEE64 # disc hits per 20.48us

Pulser event demonstrates that all FEE64s timestamps are synchronised


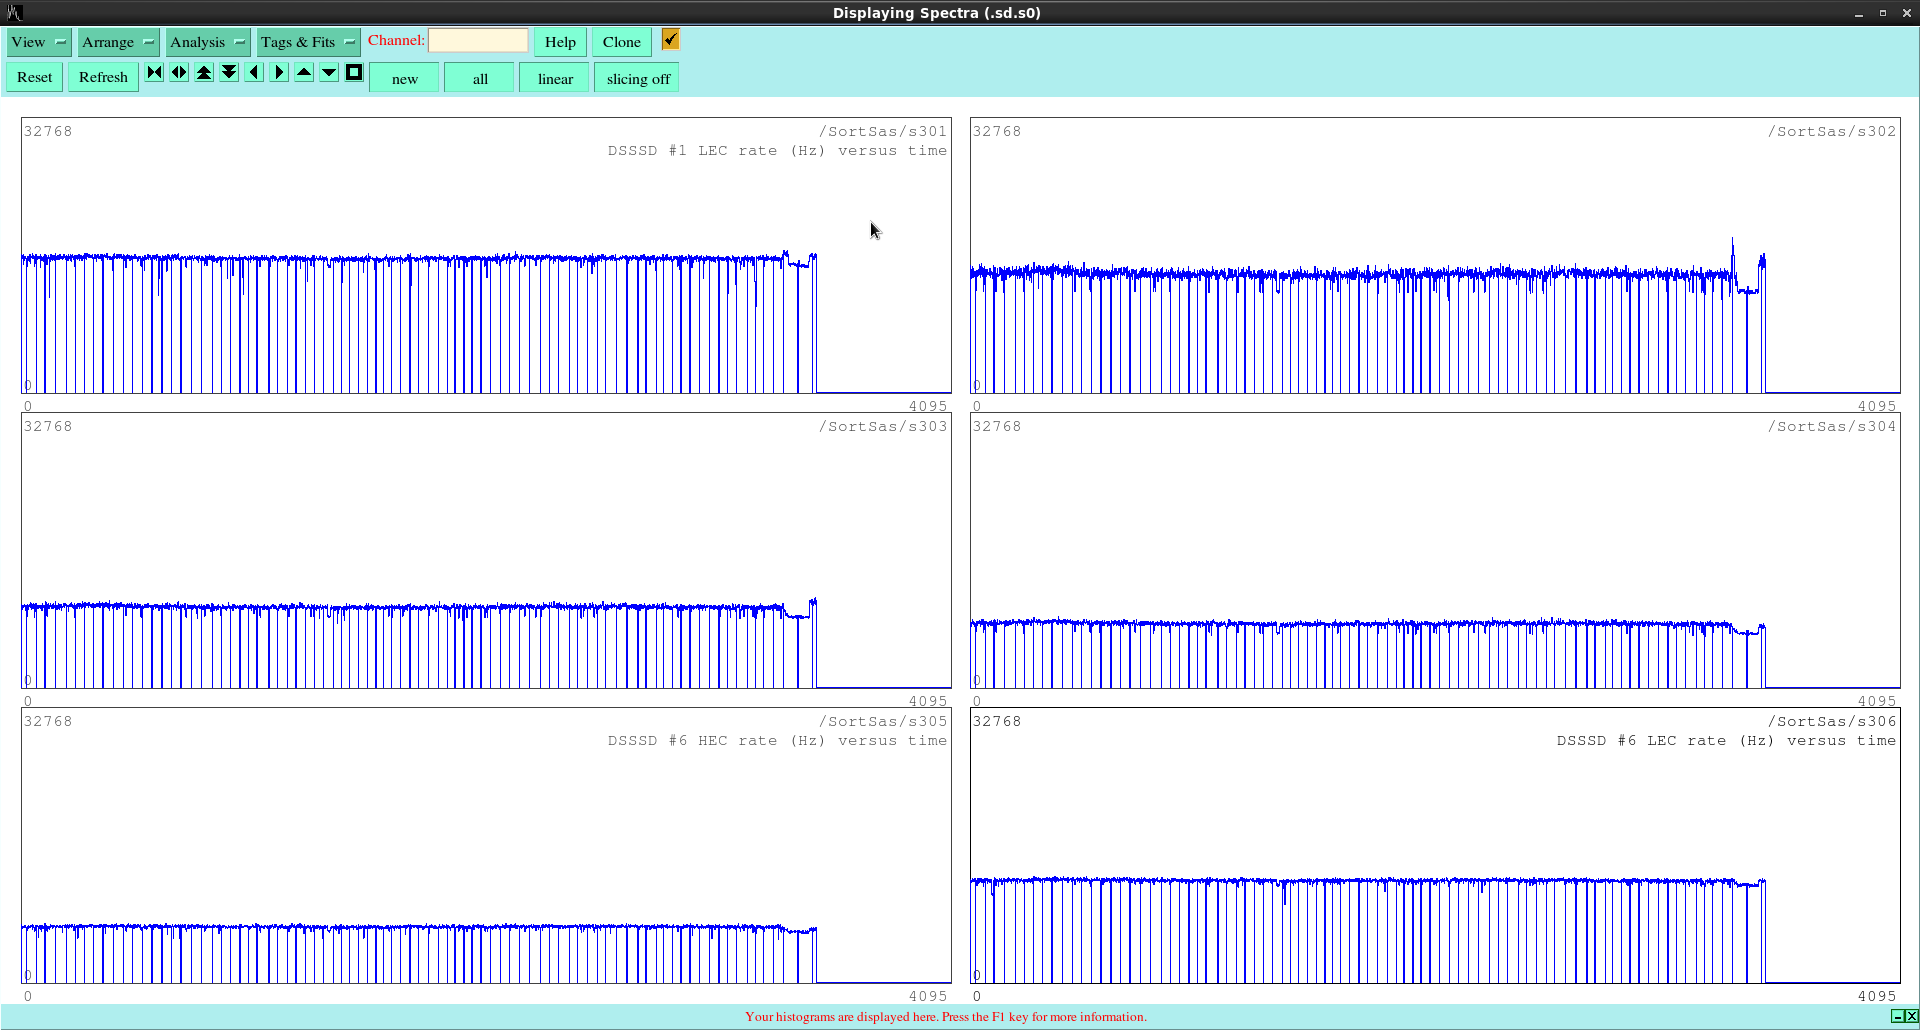
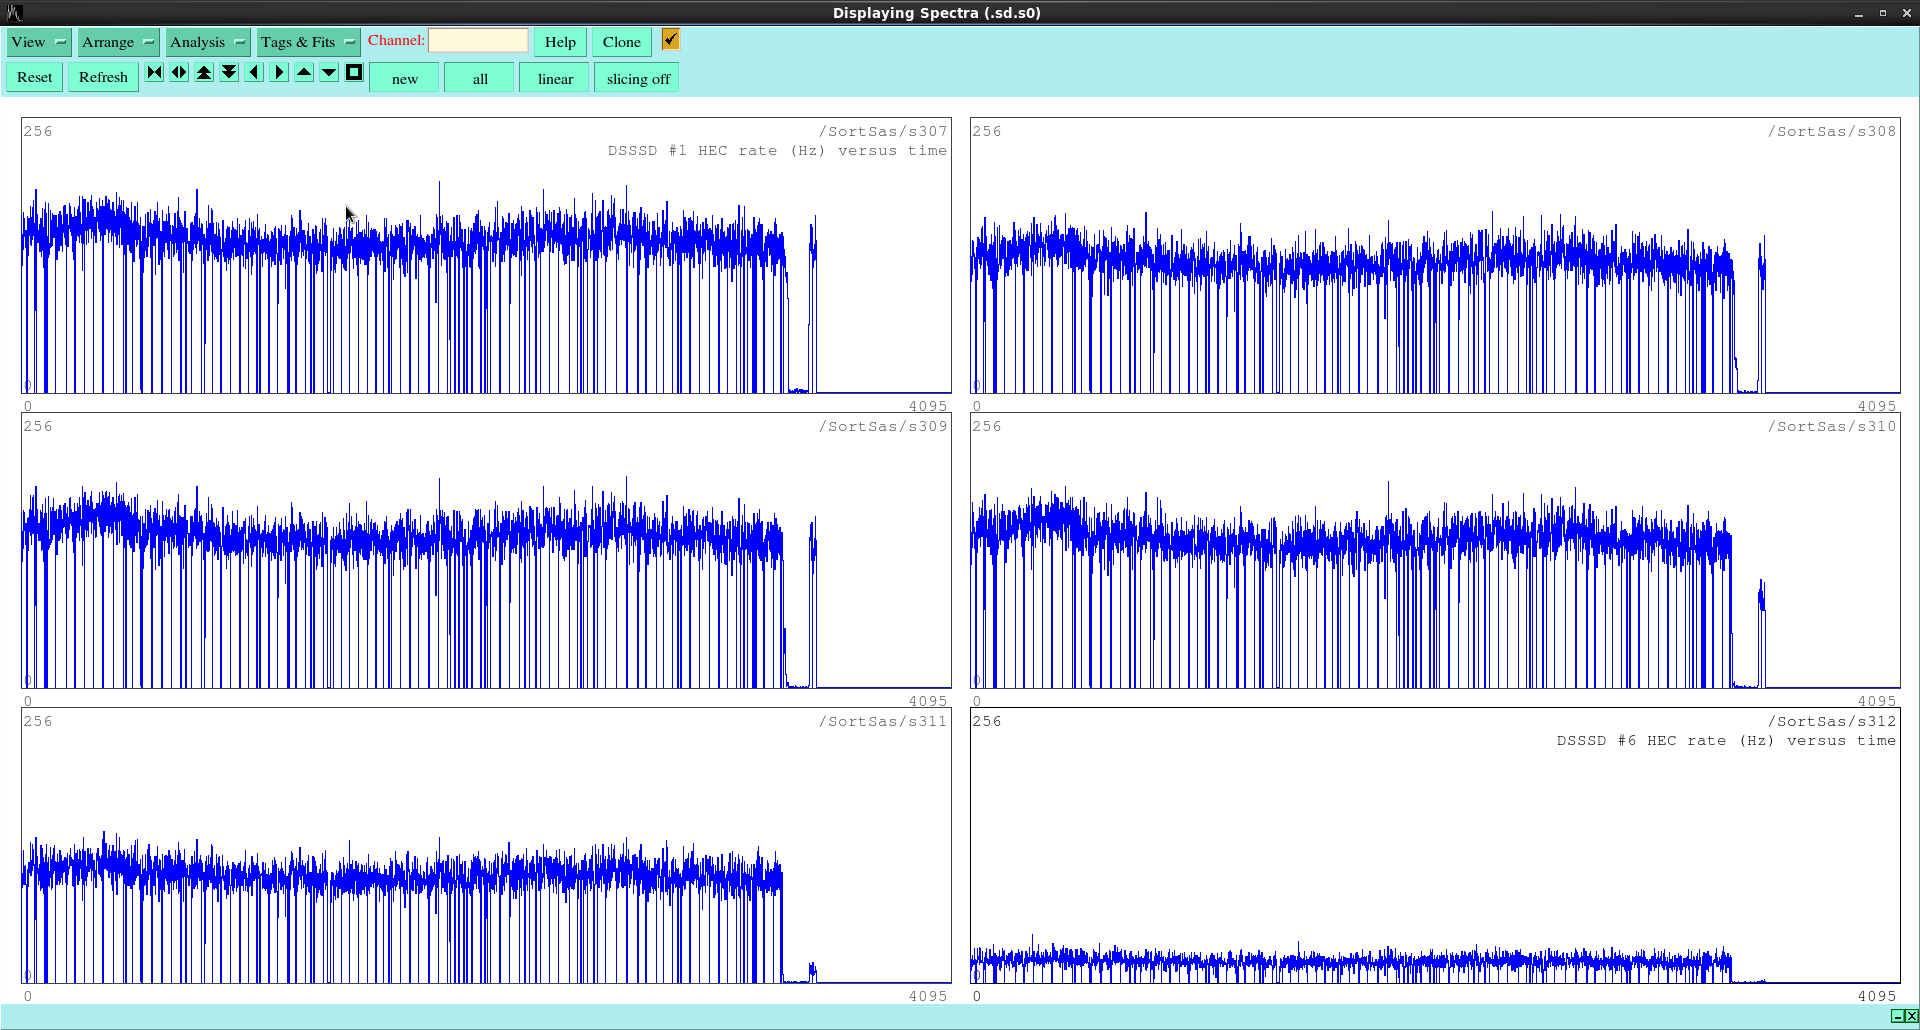
Attachments 3 & 4
-----------------
s301-s306  per DSSSD LEC rate (Hz) updated every 1s
s307-3312  per DSSSD HEC rate (Hz) updated every 1s

Demonstrates implant and decay rates were reasonably constant.
Note that there is an integerisation issue in the rate calculation which
means rate is shown as zero periodically.


Attachment 5-8
--------------
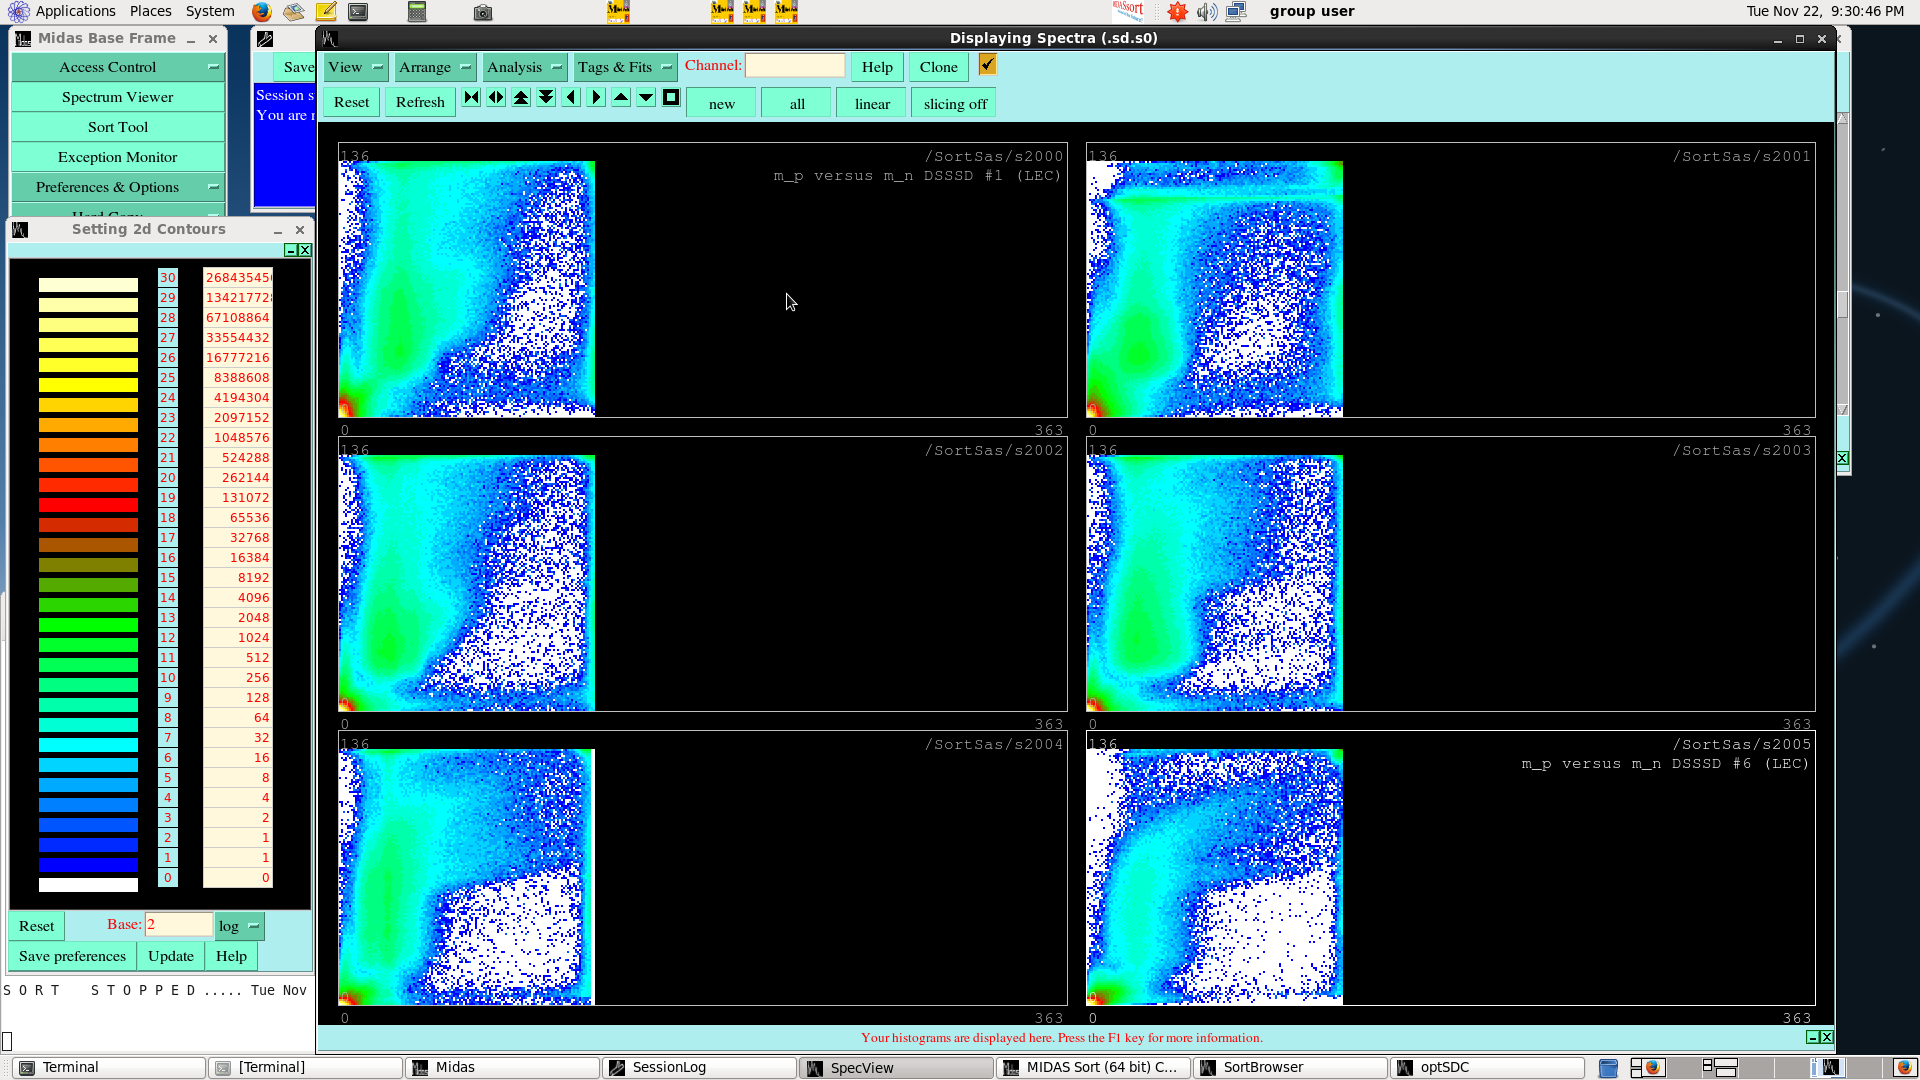
s2000-s2005 per DSSSD LEC m_lec_p versus m_lec_n

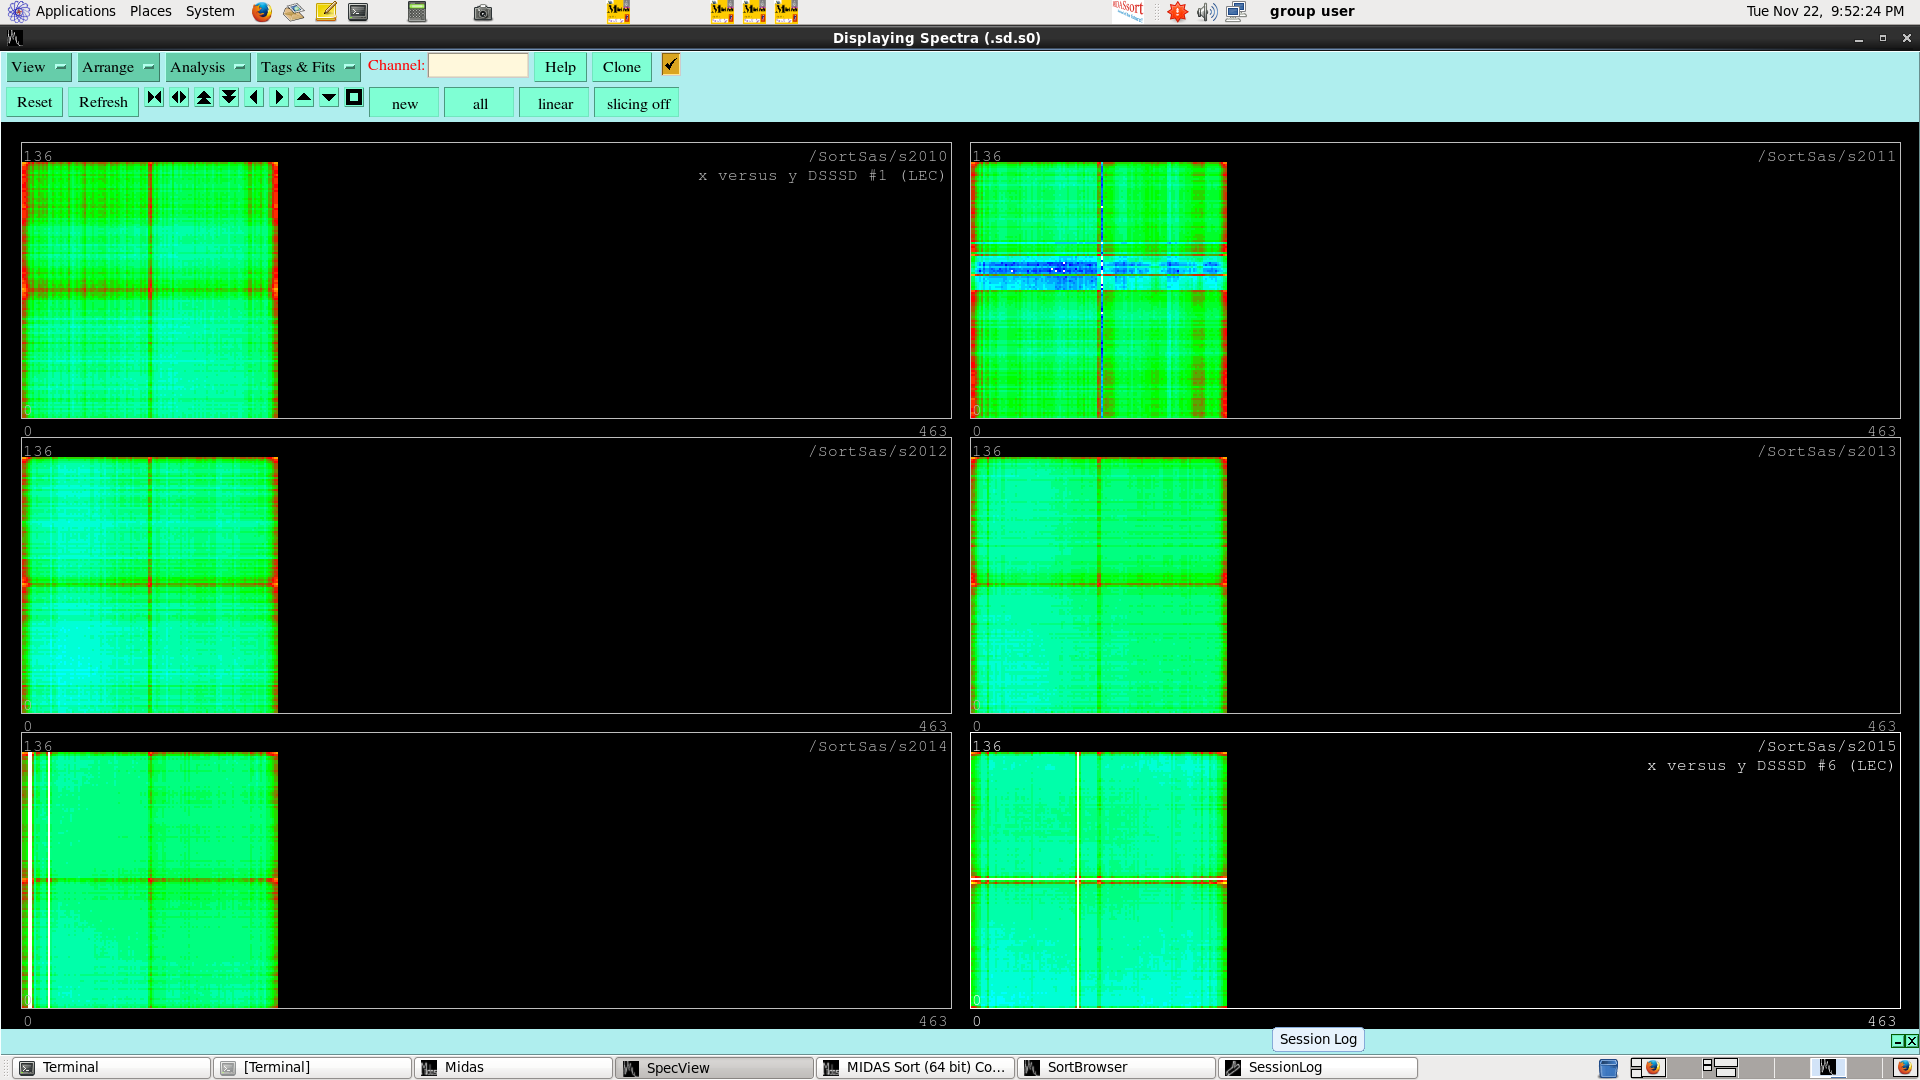
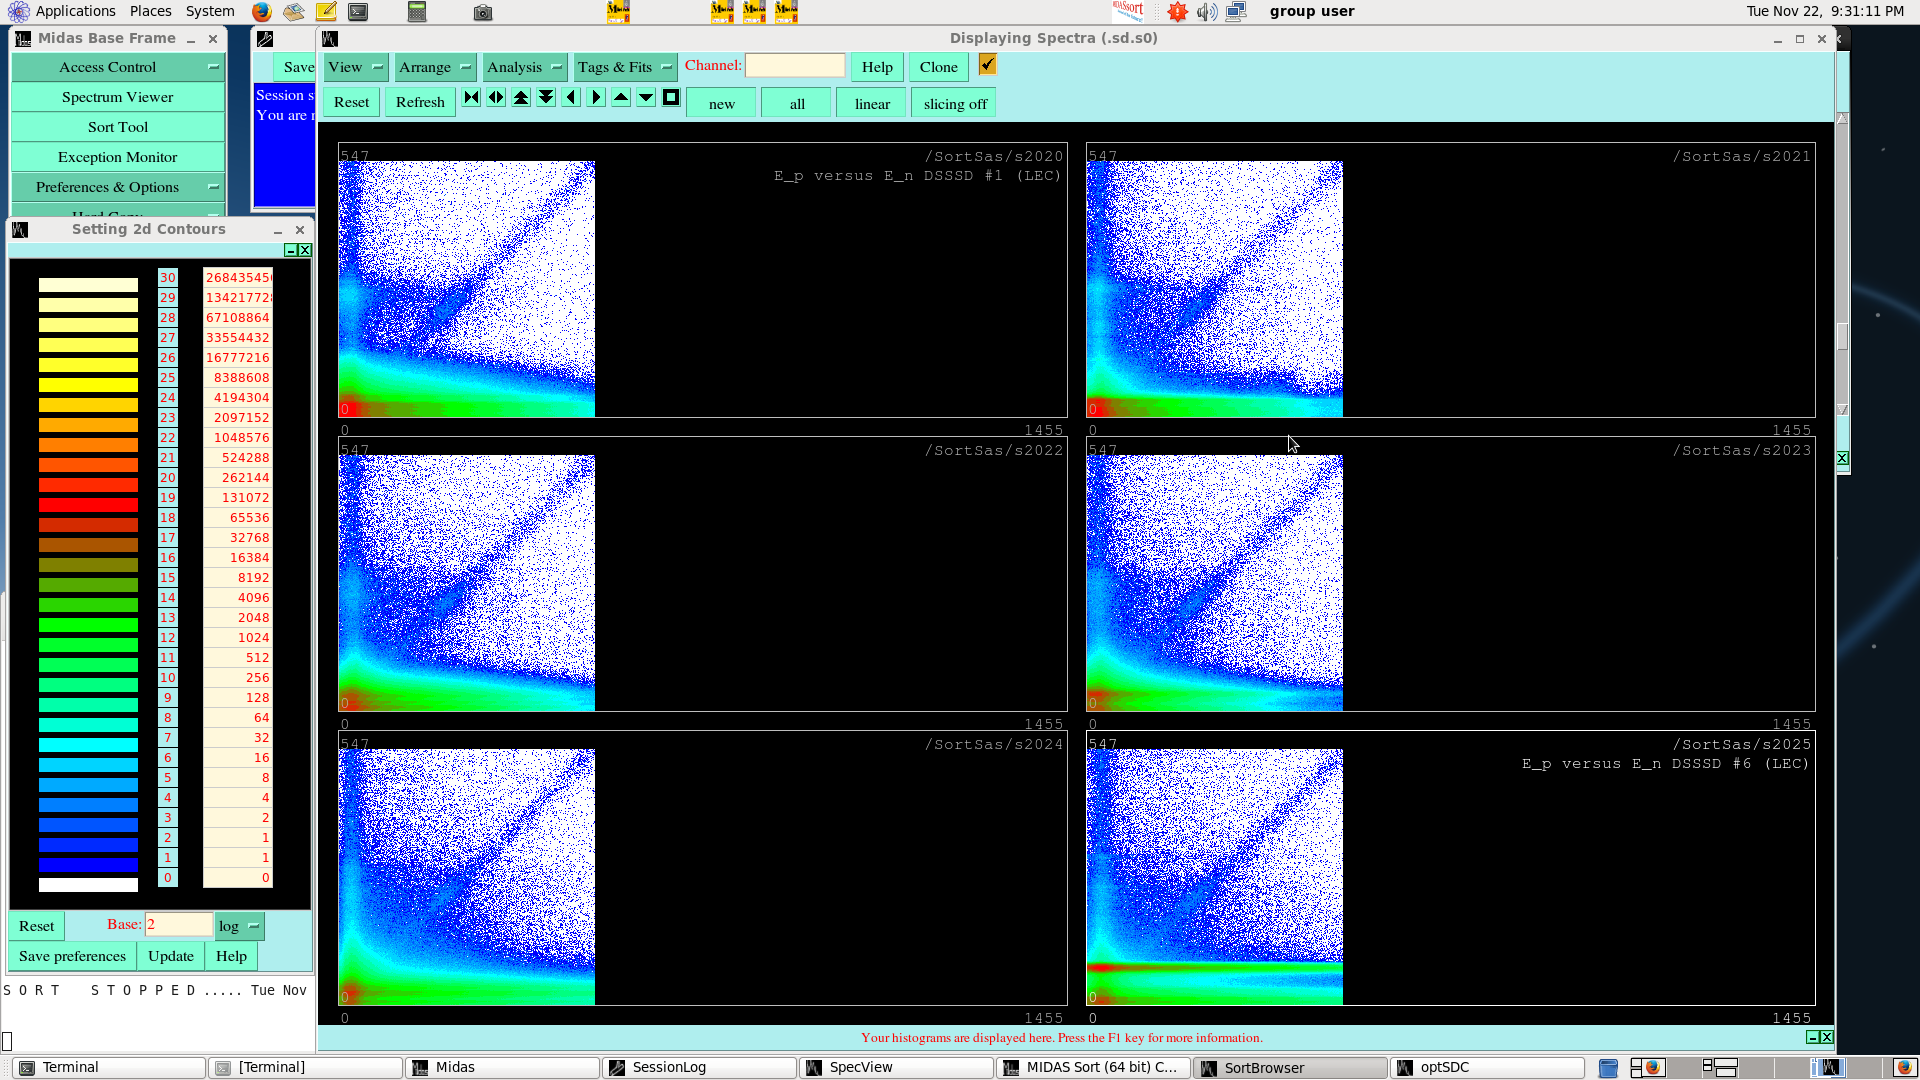
            following spectra require 0 < m_lec_p < 8 and 0 < m_lec_n < 8
            all combinations of x & y plotted

s2010-s2015 per DSSSD LEC x versus y
s2020-s2025 per DSSSD LEC E_p versus E_n        (10keV/ch nominal)
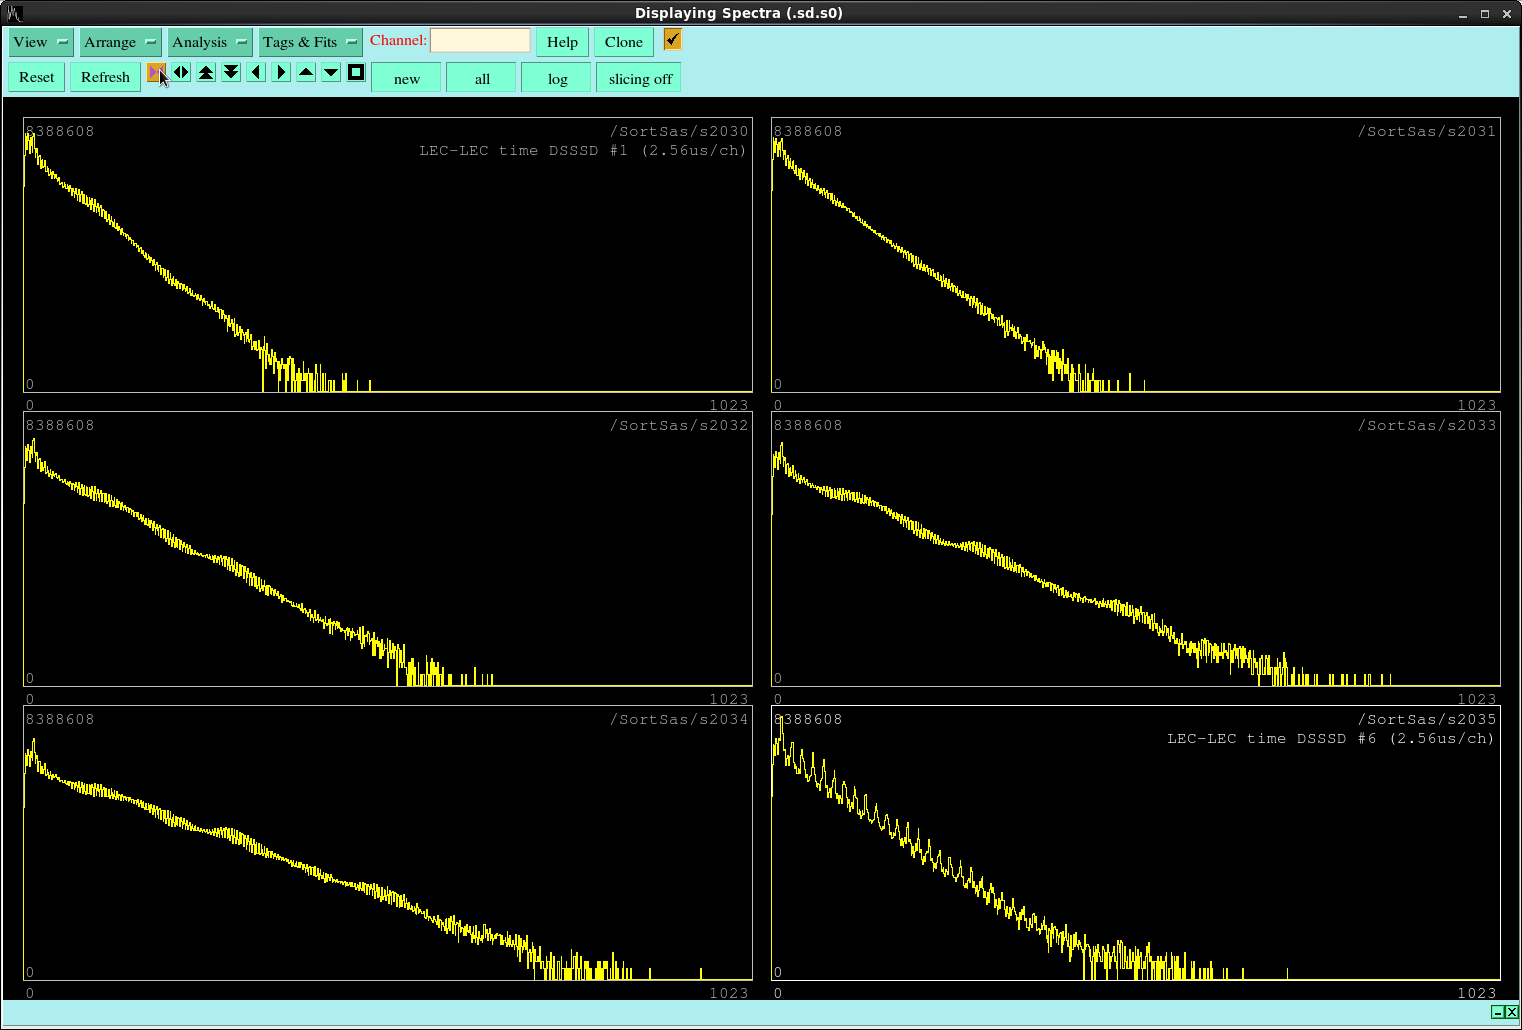
s2030-s2035 per DSSSD LEC-LEC time              (2.56us/channel)

Demonstrates large LEC multiplicities associated with HEC events but relatively
low multiplicities associated with LEC-only events .

Minimum LEC-LEC time difference c. 1 x 2.56us = 2.56us which suggests events
with low LEC-LEC time difference are non-stochastic and suggests EMI/RFI noise
causing 'multiple' event bursts. This will likely be dominated by channels
0-1 (say) and 60-63 (say) of each FEE64 - disabling these channels may a quick
and dirty way to inspect a subset of data with significantly less EMI/RFI noise

Time difference between successive LEC events

DSSSD centroid =>rate (kHz)
1     21.16    18.5
2     17.45    22.4
3     40.27     9.70
4     50.86     7.68
5     58.11     6.72
6     29.33    13.3

Which somewhat over-estimates observed rates (see below)

Periodic fine structure observed with period ~4-16 channel (~10-40us)

Attachment 9-13
---------------
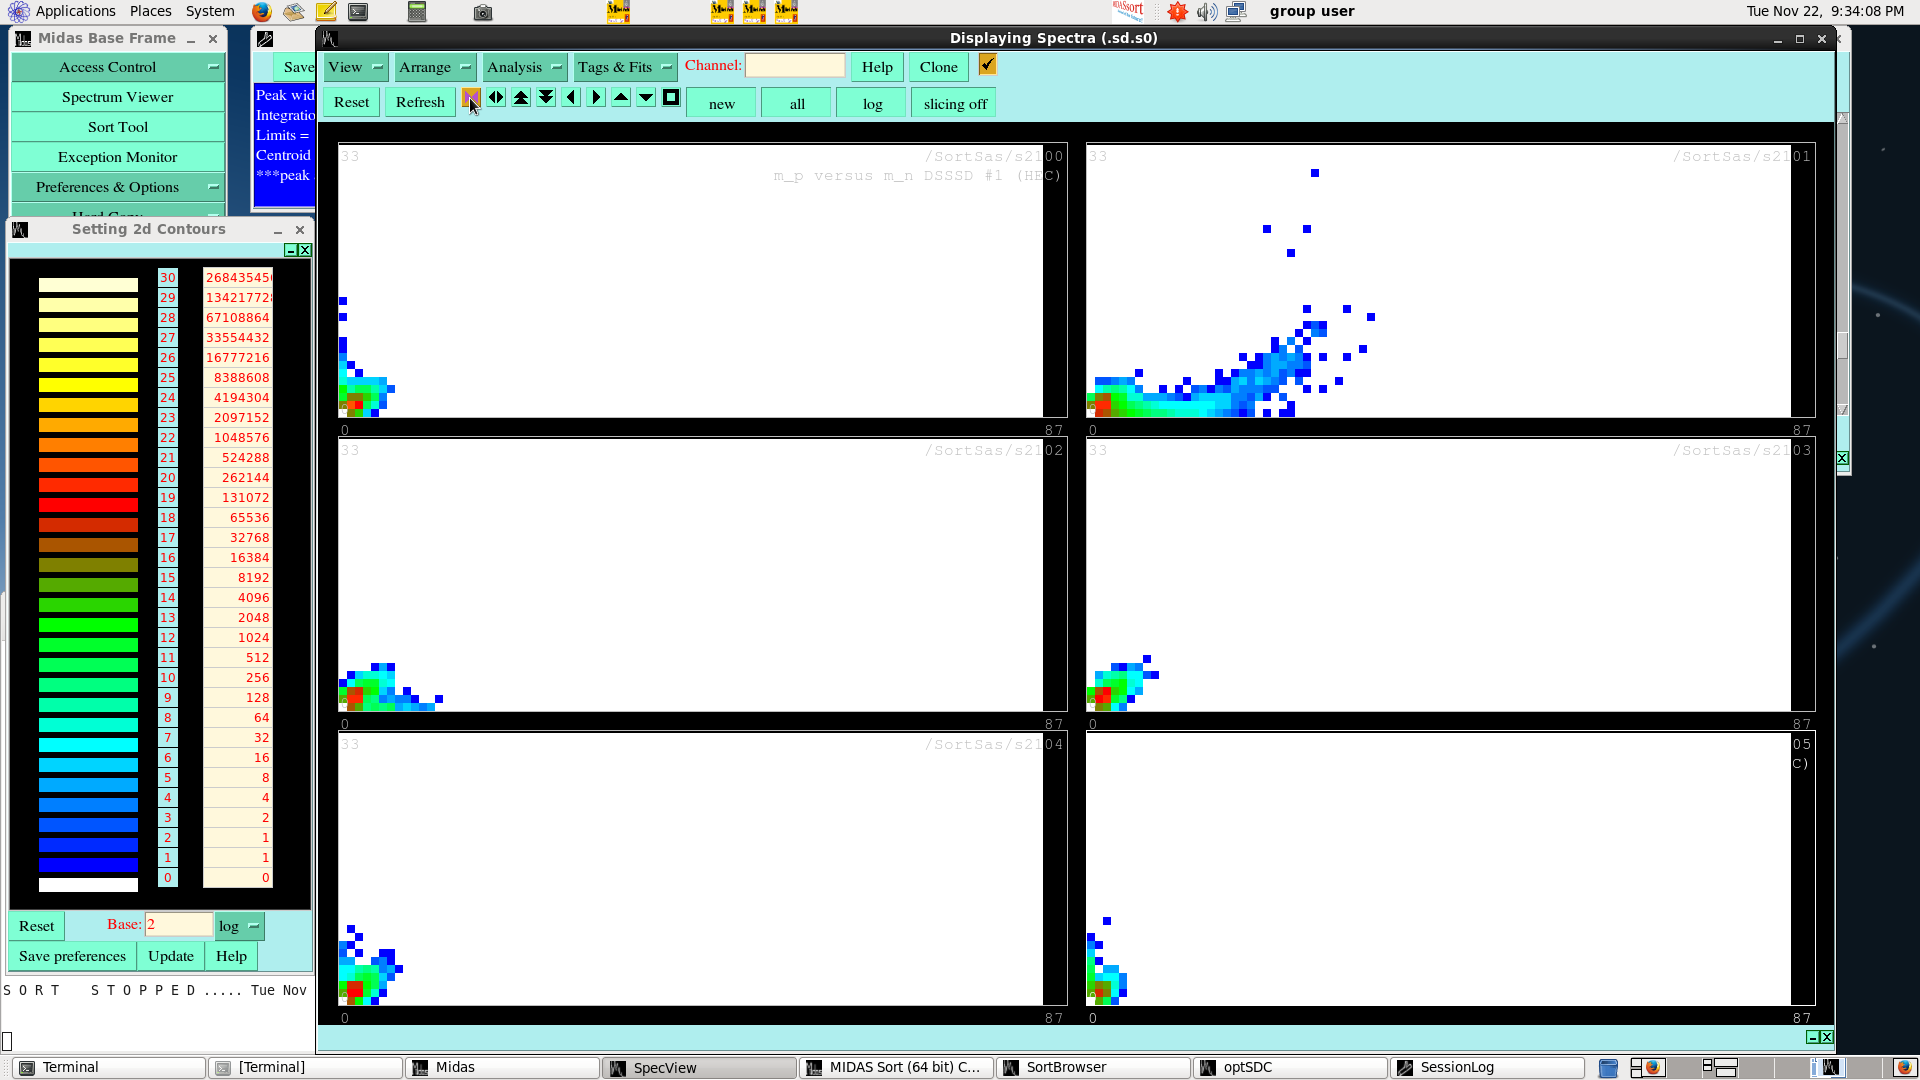
s2000-s2005 per DSSSD LEC m_hec_p versus m_hec_n

            following spectra require 0 < m_hec_p < 8 and 0 < m_hec_n < 8
            all combinations of x & y plotted

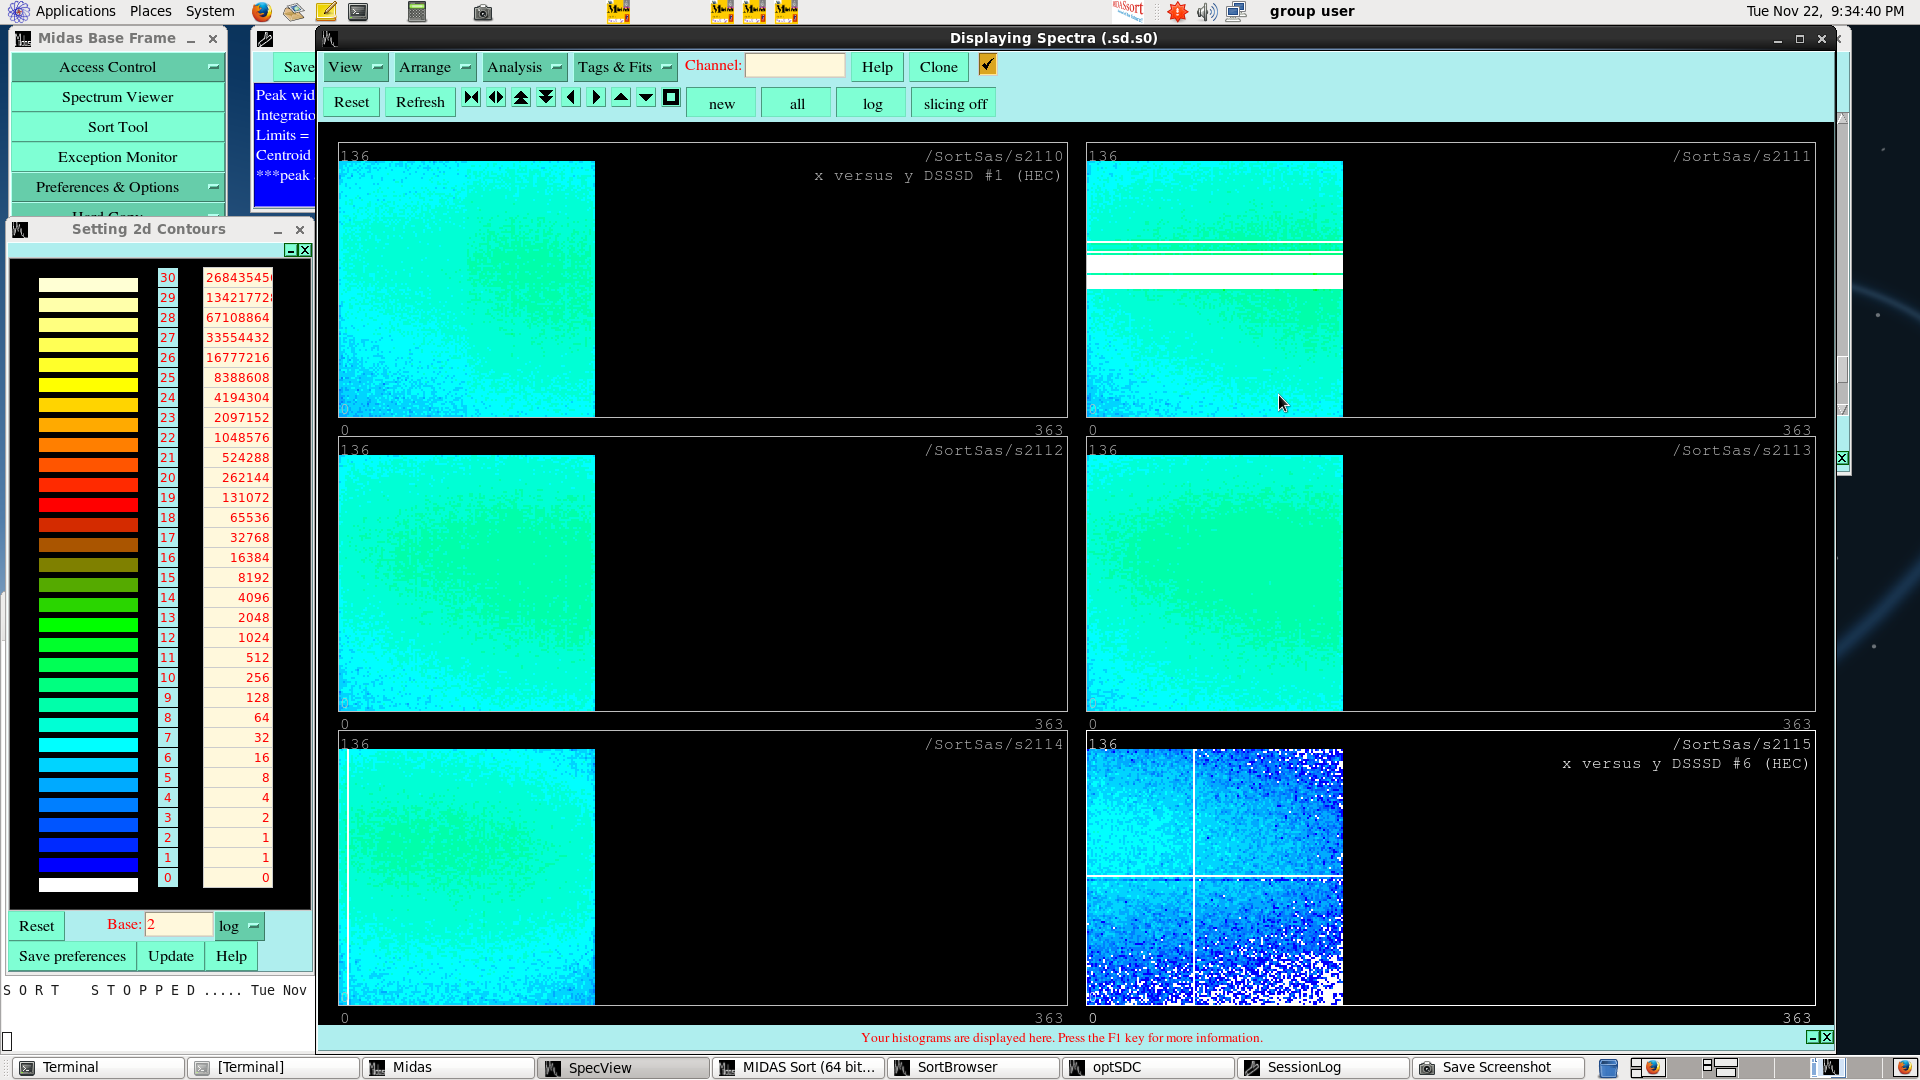
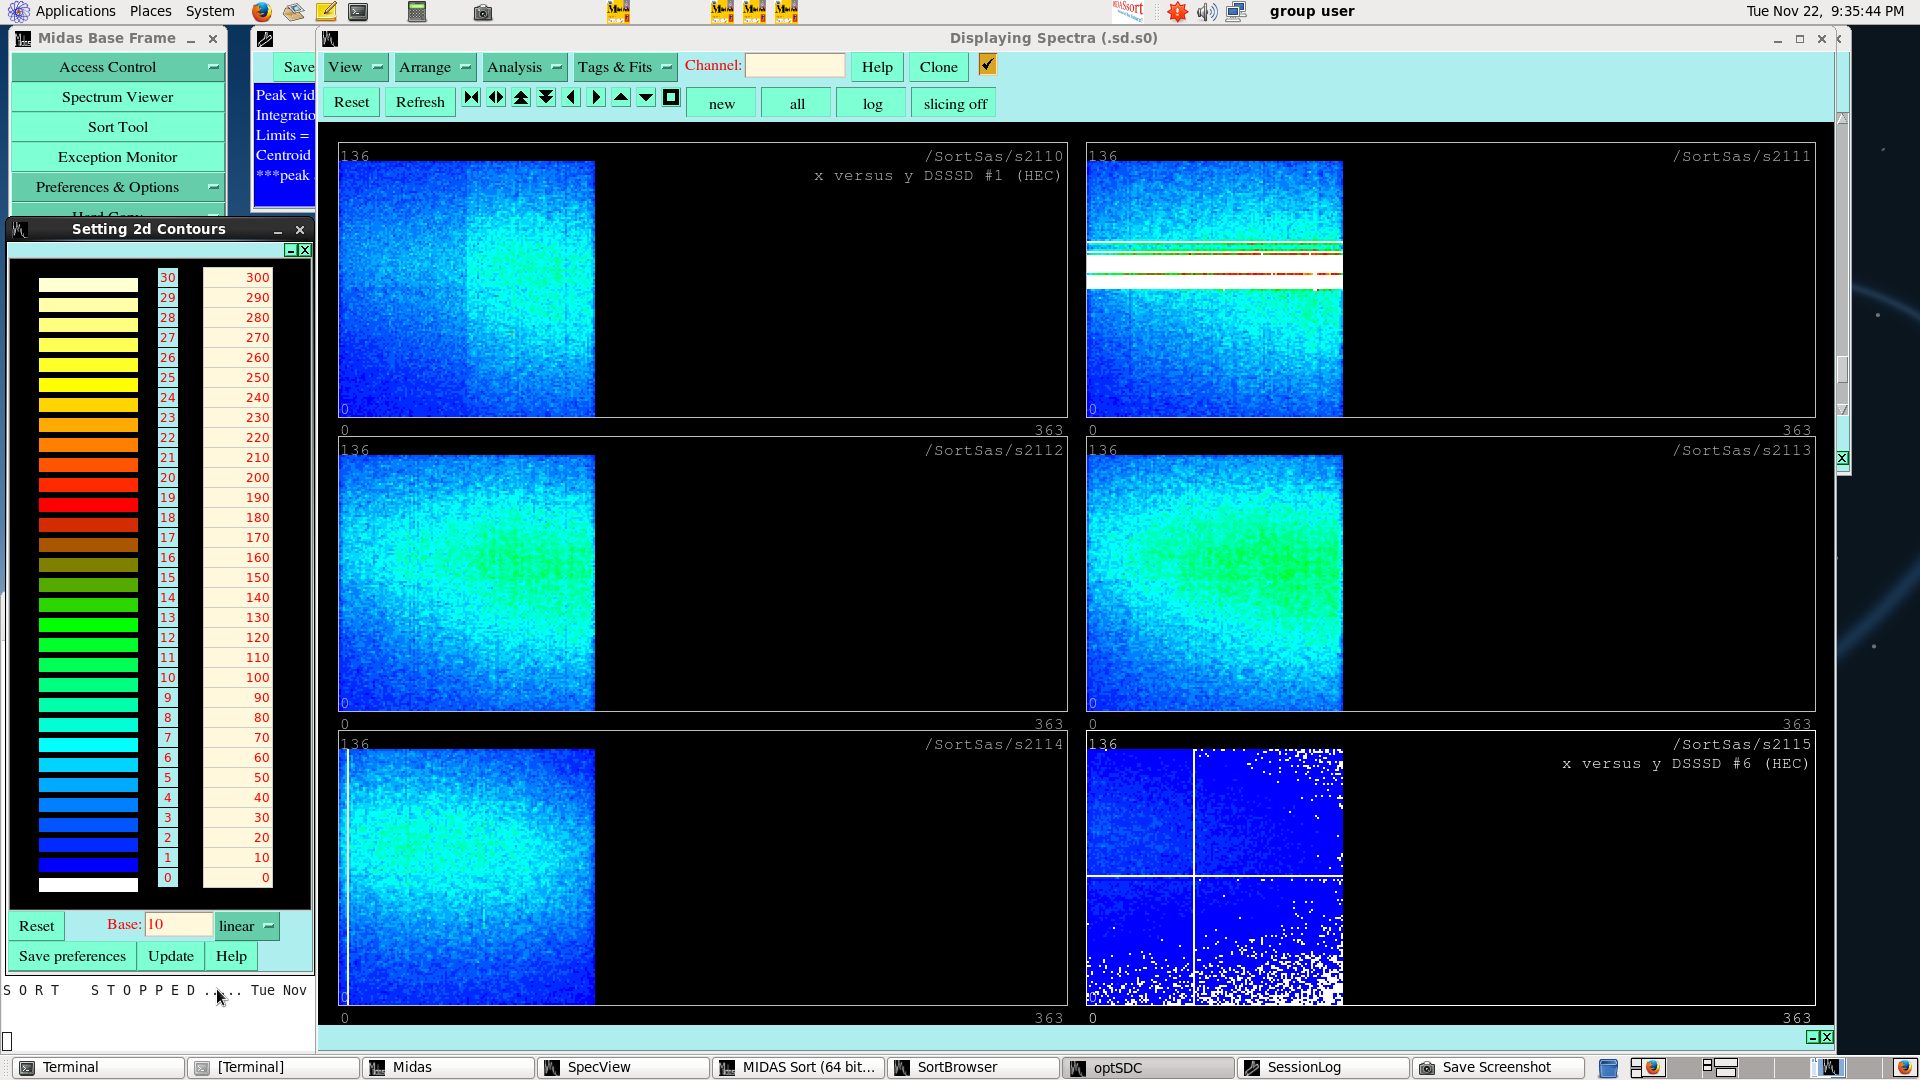
s2010-s2015 per DSSSD HEC x versus y           (semi-log and linear z normalisation)
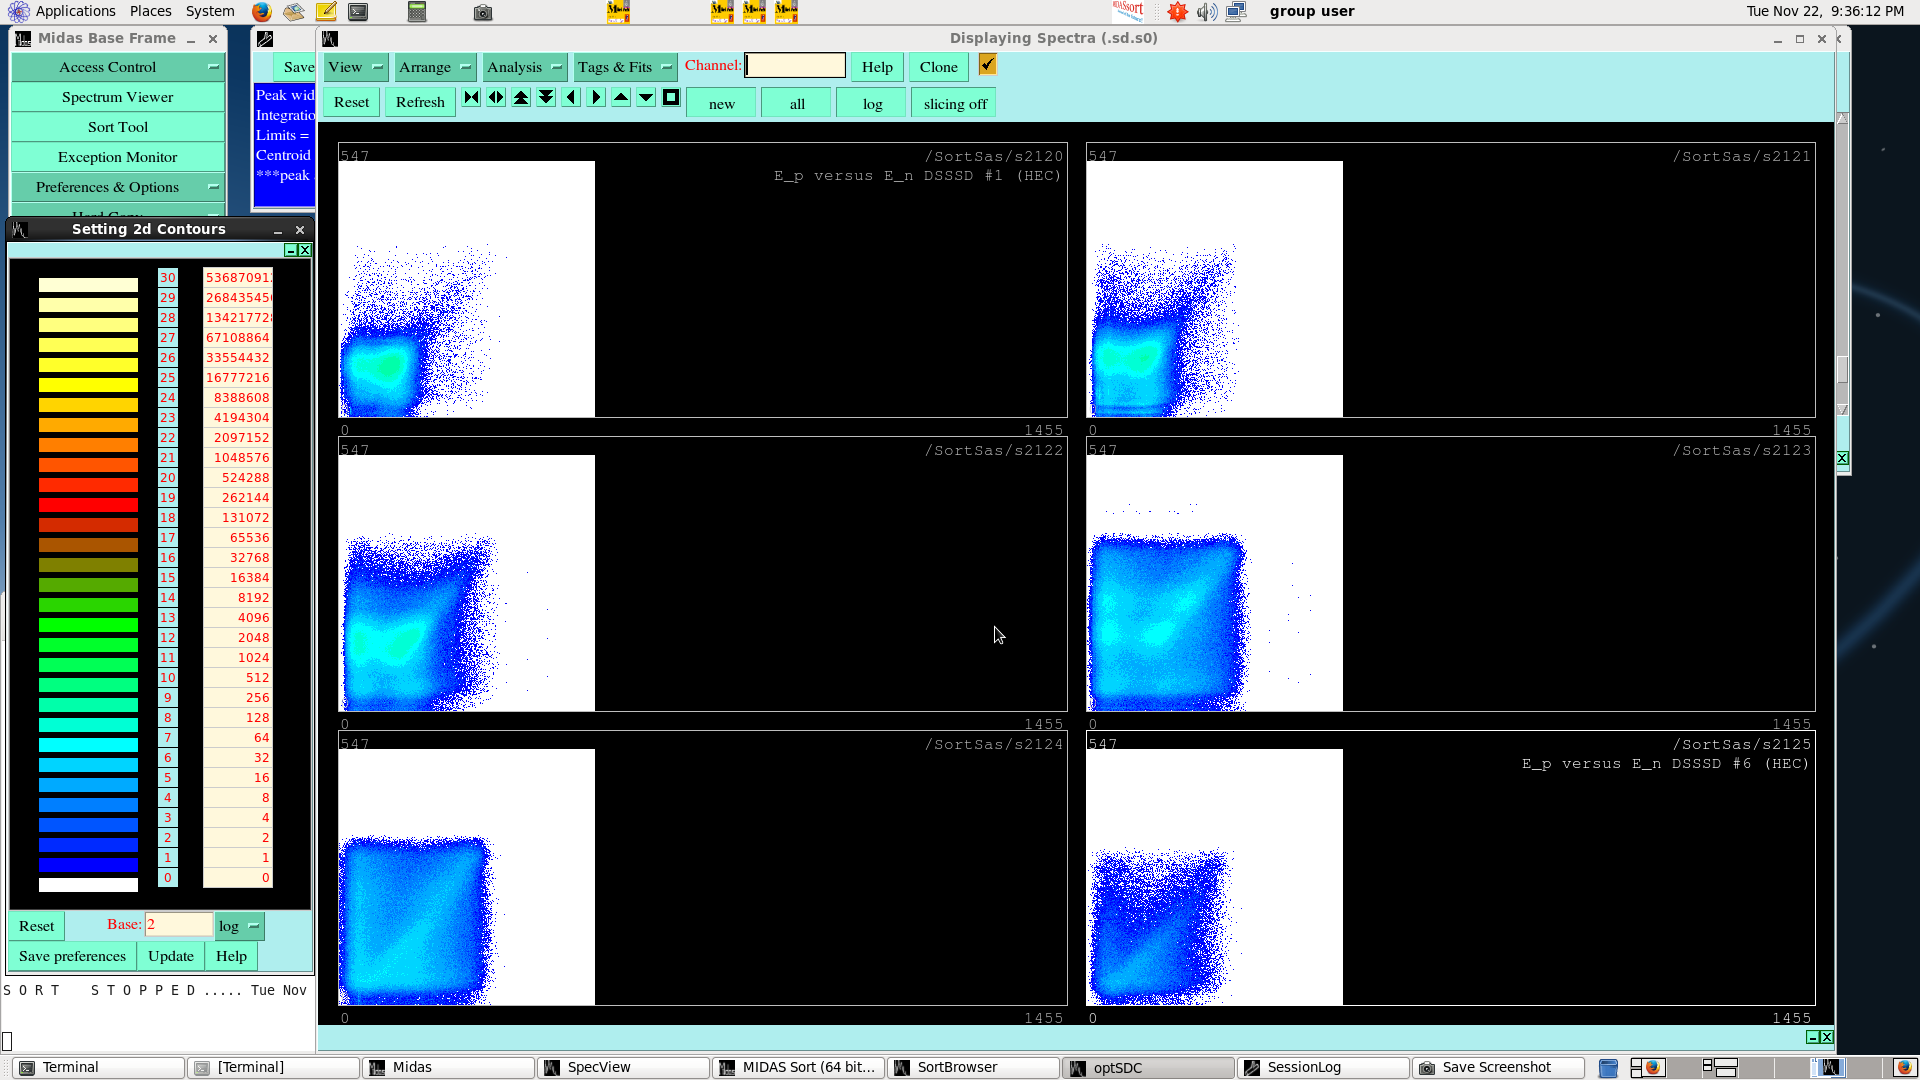
s2020-s2025 per DSSSD HEC E_p versus E_n       (10MeV/channel nominal)
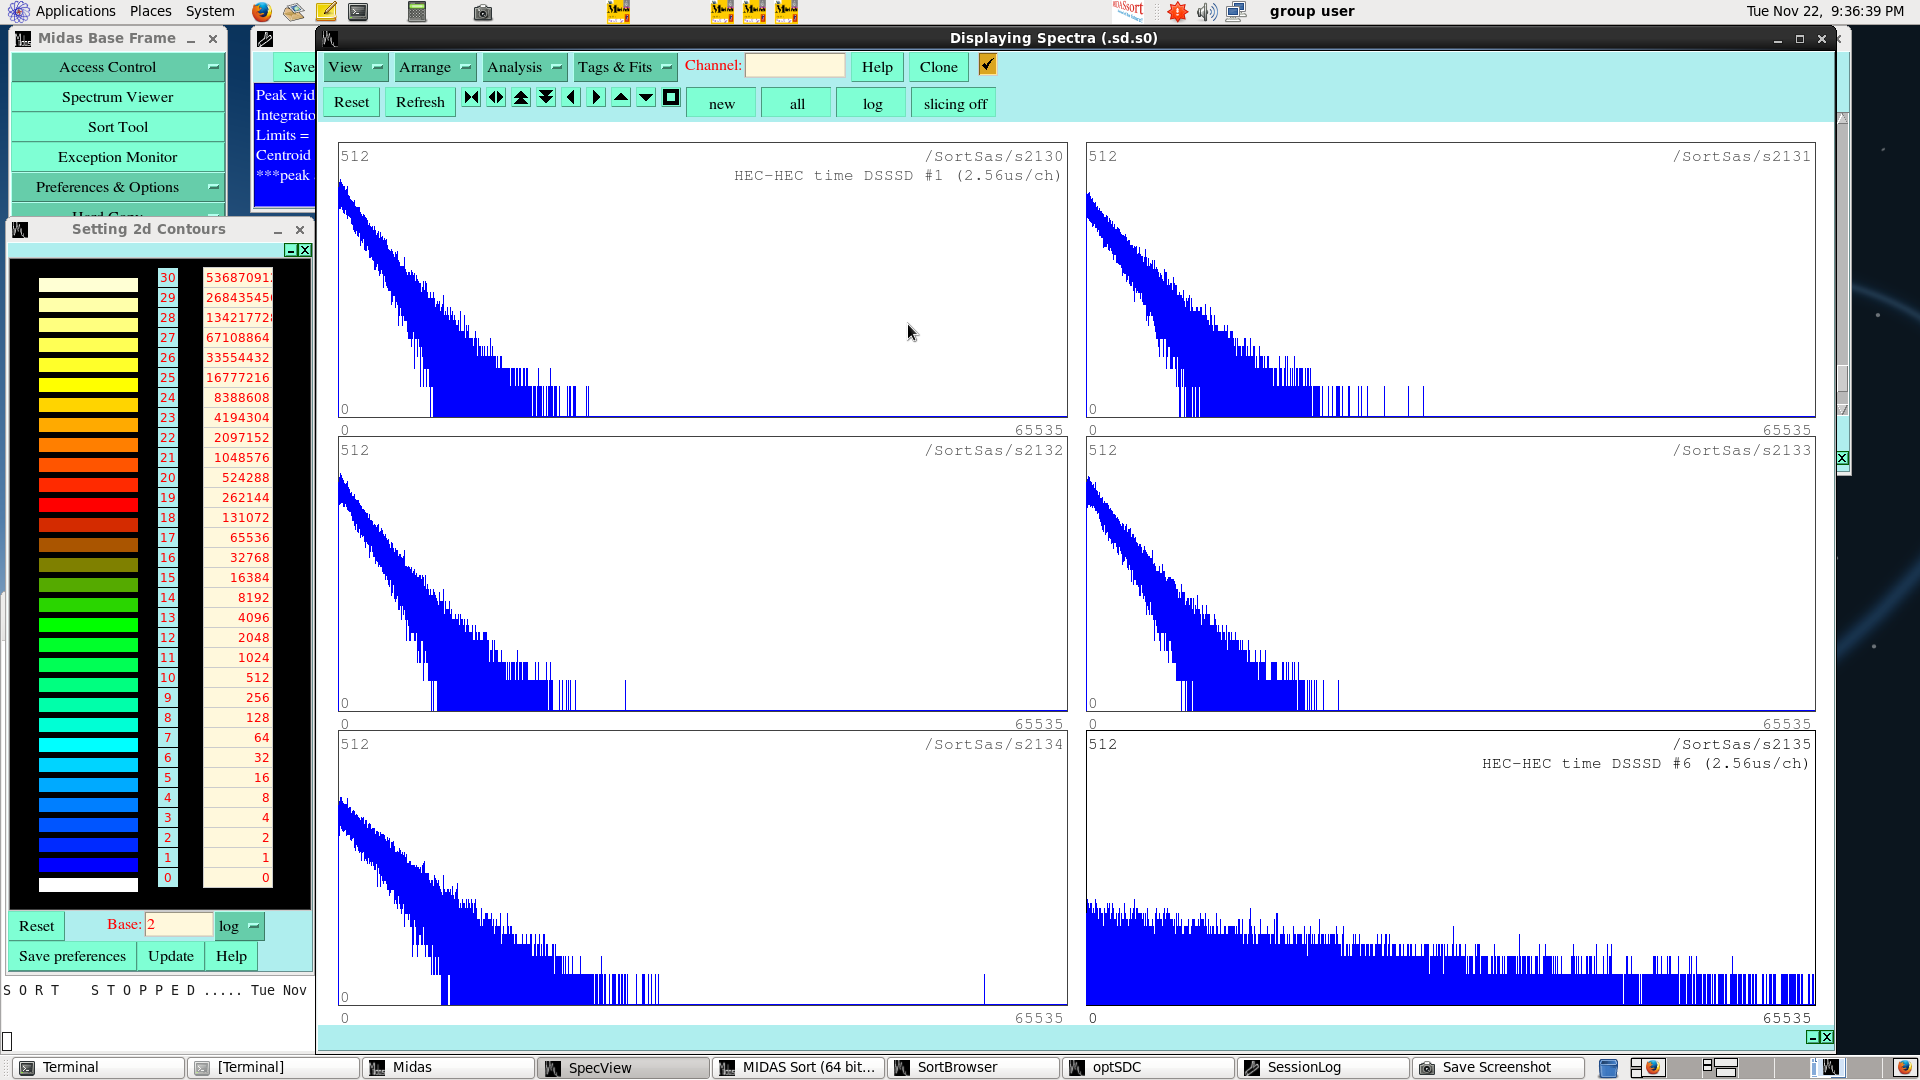
s2030-s2035 per DSSSD HEC-HEC time             (2.56us/channel)

Demonstrates relatively low multiplicities associated with HEC events

HEC x versus y spectra are different to those shown by Tain et al. (p.4)
  => BigRIPS PID gate used?
  what is the origin of the fine structure observed by Tain et al. (p.4)?

No obvious structure in the time between successive HEC events
    - see also https://elog.ph.ed.ac.uk/AIDA/457
    - minimum time between successive HEC events c. 16 x 2.56us = 41us which is
      consistent with HEC (+LEC) multiplicity per ASIC and ASIC shaping time (8us)

Note Tain et al. (p.3) plot time between successive events with no restriction on type
(LEC or HEC). The time structure(s) observed may therefore be related to LEC events

Time difference between successive HEC events

DSSSD centroid =>rate (Hz)
1     2566.44    152.0
2     2970.33    131.5
3     2557.81    152.7
4     2622.38    149.0
5     3656.82    106.8
6     15706.73    24.9

Which somewhat over-estimates observed rates (see below)


Attachment 14-16
----------------
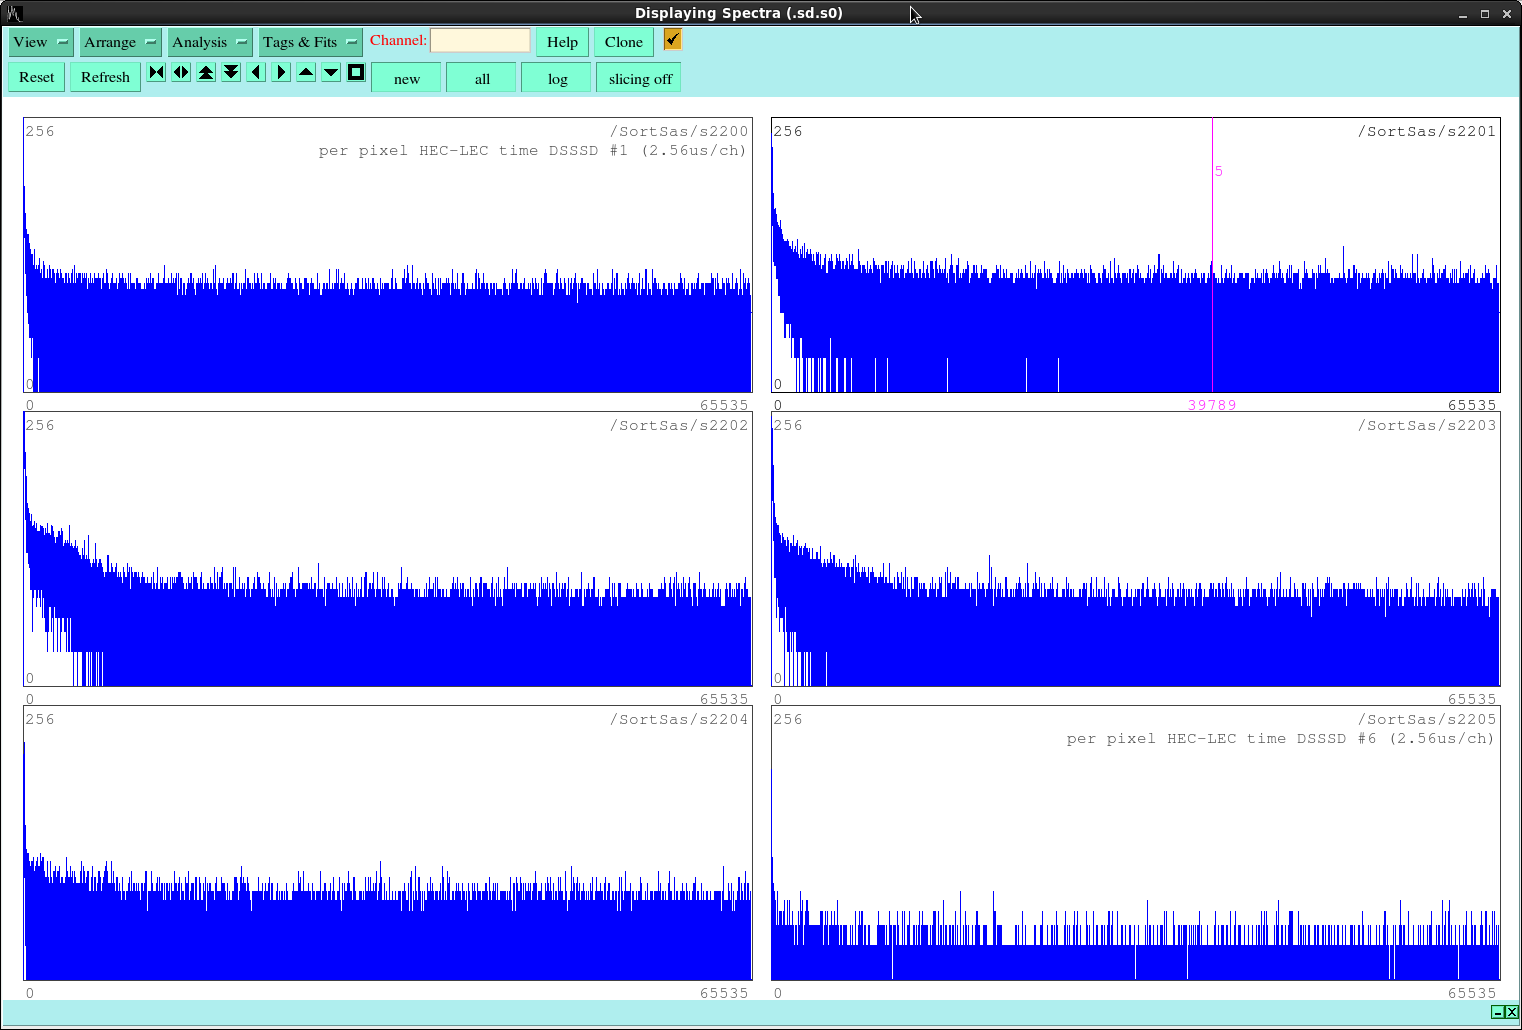
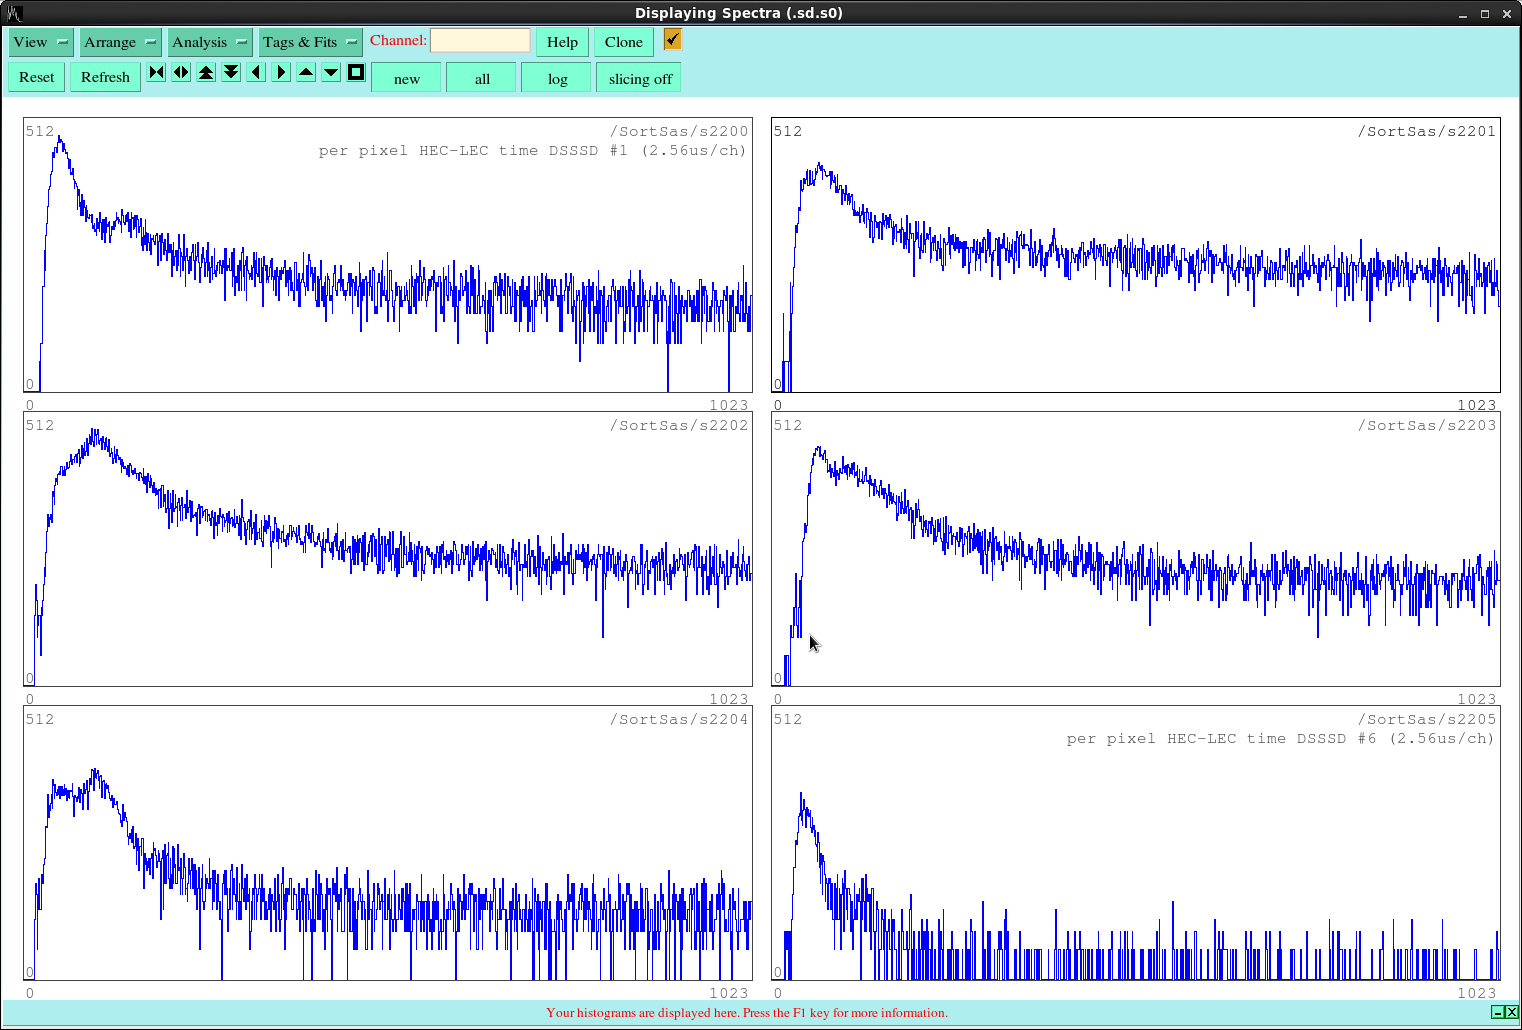
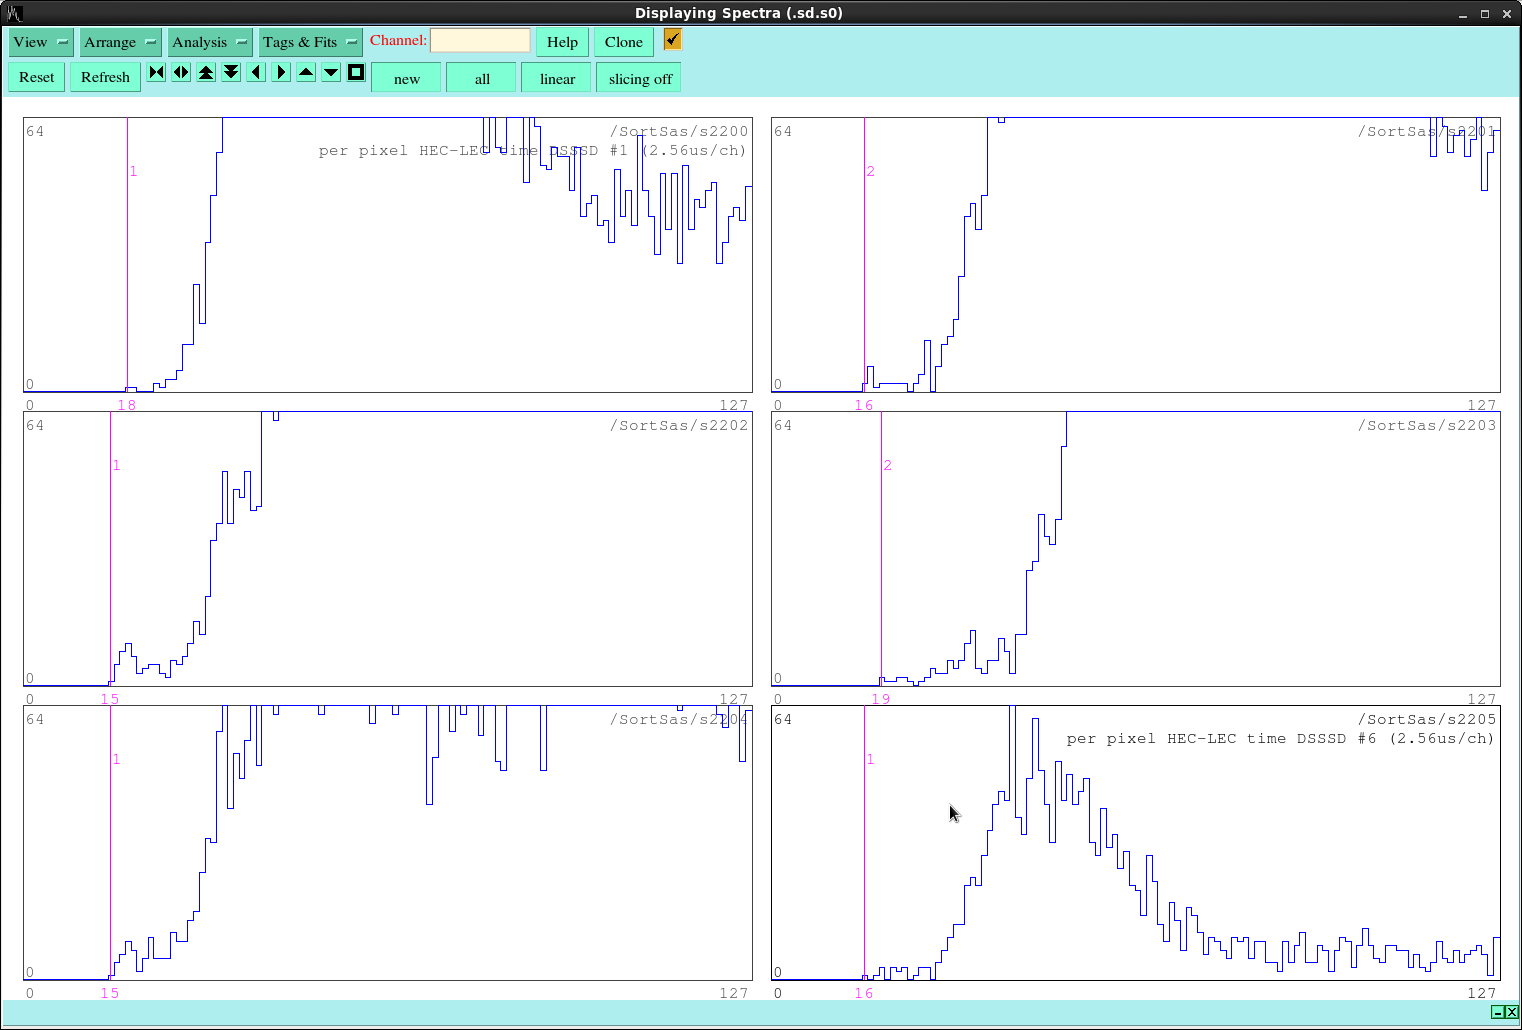
s2200-s2205 per pixel, per DSSSD HEC-LEC time  (2.56us/channel)

Minimum HEC-LEC time difference c. 15 x 2.56us = 38.4us which is consistent
with ASIC shaping and readout times.

In comparison to Tain et al. (p.9) no obvious structures at large
HEC-LEC time differences. Significant number of excess events observed
at HEC-LEC time differences ~ few hundred us. This is likely due to
the 100kHz EMI/RFI noise observed.

Attachments 17-19
-----------------

MIDASsort Fortran source, spectrum titles, and namelist I/O variables (in this
case principally FEE64 mapping and default ADC gain/offset values).

S O R T    C O M P L E T E ..... Tue Nov 22 20:20:10 2016


 *** ENTRY finish

 *** data items: -900823296 ( -37356.59 Hz)
 *** ADC events:  410276049 (  17013.89 Hz)
 *** time warps:          0 (      0.00 Hz)
 *** DSSSD # 1 count:  56031017 old count:  56019099 dt:   3505.73 s  LEC rate:  15982.71 Hz
 *** DSSSD # 2 count:  49362481 old count:  49350664 dt:   3505.73 s  LEC rate:  14080.52 Hz
 *** DSSSD # 3 count:  33599202 old count:  33591614 dt:   3505.73 s  LEC rate:   9584.09 Hz
 *** DSSSD # 4 count:  26666285 old count:  26660843 dt:   3505.73 s  LEC rate:   7606.49 Hz
 *** DSSSD # 5 count:  23365594 old count:  23360881 dt:   3505.73 s  LEC rate:   6664.98 Hz
 *** DSSSD # 6 count:  42705054 old count:  42696091 dt:   3505.73 s  LEC rate:  12181.51 Hz
 *** DSSSD # 1 count:    469505 old count:    469407 dt:   3505.73 s  HEC rate:    133.93 Hz
 *** DSSSD # 2 count:    404352 old count:    404269 dt:   3505.73 s  HEC rate:    115.34 Hz
 *** DSSSD # 3 count:    468569 old count:    468472 dt:   3505.73 s  HEC rate:    133.66 Hz
 *** DSSSD # 4 count:    455030 old count:    454982 dt:   3505.73 s  HEC rate:    129.80 Hz
 *** DSSSD # 5 count:    326872 old count:    326863 dt:   3505.73 s  HEC rate:     93.24 Hz
 *** DSSSD # 6 count:     65691 old count:     65690 dt:   3505.73 s  HEC rate:     18.74 Hz

 *** ENTRY finish ends

S O R T S T O P P E D ..... Tue Nov 22 20:21:09 2016 |
|
|
|
|
|
|
|
|
|
|
|
|
|
|
|
|
|
|
|
|
|
|
|
|
|
|
|
|
|
|
|
|
|
|
|
  $variables
  dsssd_a( 1 ) = 17
  dsssd_a( 2 ) = 18
  dsssd_a( 3 ) = 9
  dsssd_a( 4 ) = 10
  dsssd_a( 5 ) = 1
  dsssd_a( 6 ) = 2
  dsssd_b( 1 ) = 20
  dsssd_b( 2 ) = 19
  dsssd_b( 3 ) = 12
  dsssd_b( 4 ) = 11
  dsssd_b( 5 ) = 4
  dsssd_b( 6 ) = 3
  dsssd_c( 1 ) = 22
  dsssd_c( 2 ) = 21
  dsssd_c( 3 ) = 14
  dsssd_c( 4 ) = 13
  dsssd_c( 5 ) = 6
  dsssd_c( 6 ) = 5
  dsssd_d( 1 ) = 23
  dsssd_d( 2 ) = 24
  dsssd_d( 3 ) = 15
  dsssd_d( 4 ) = 16
  dsssd_d( 5 ) = 7
  dsssd_d( 6 ) = 8
  offset = 4096*0.0
  gain = 4096*1.0
  c = 8*1.0
  w = 32*0
  $[end]
|
|
|