| ID |
Date |
Author |
Subject |
|
18
|
Fri Jun 11 10:56:45 2021 |
CB | R13 |
Fit: line + power law + line
Free parameters: 2x boundary points between lines
Algorithm: Nelder-Mead, 20 iterations.

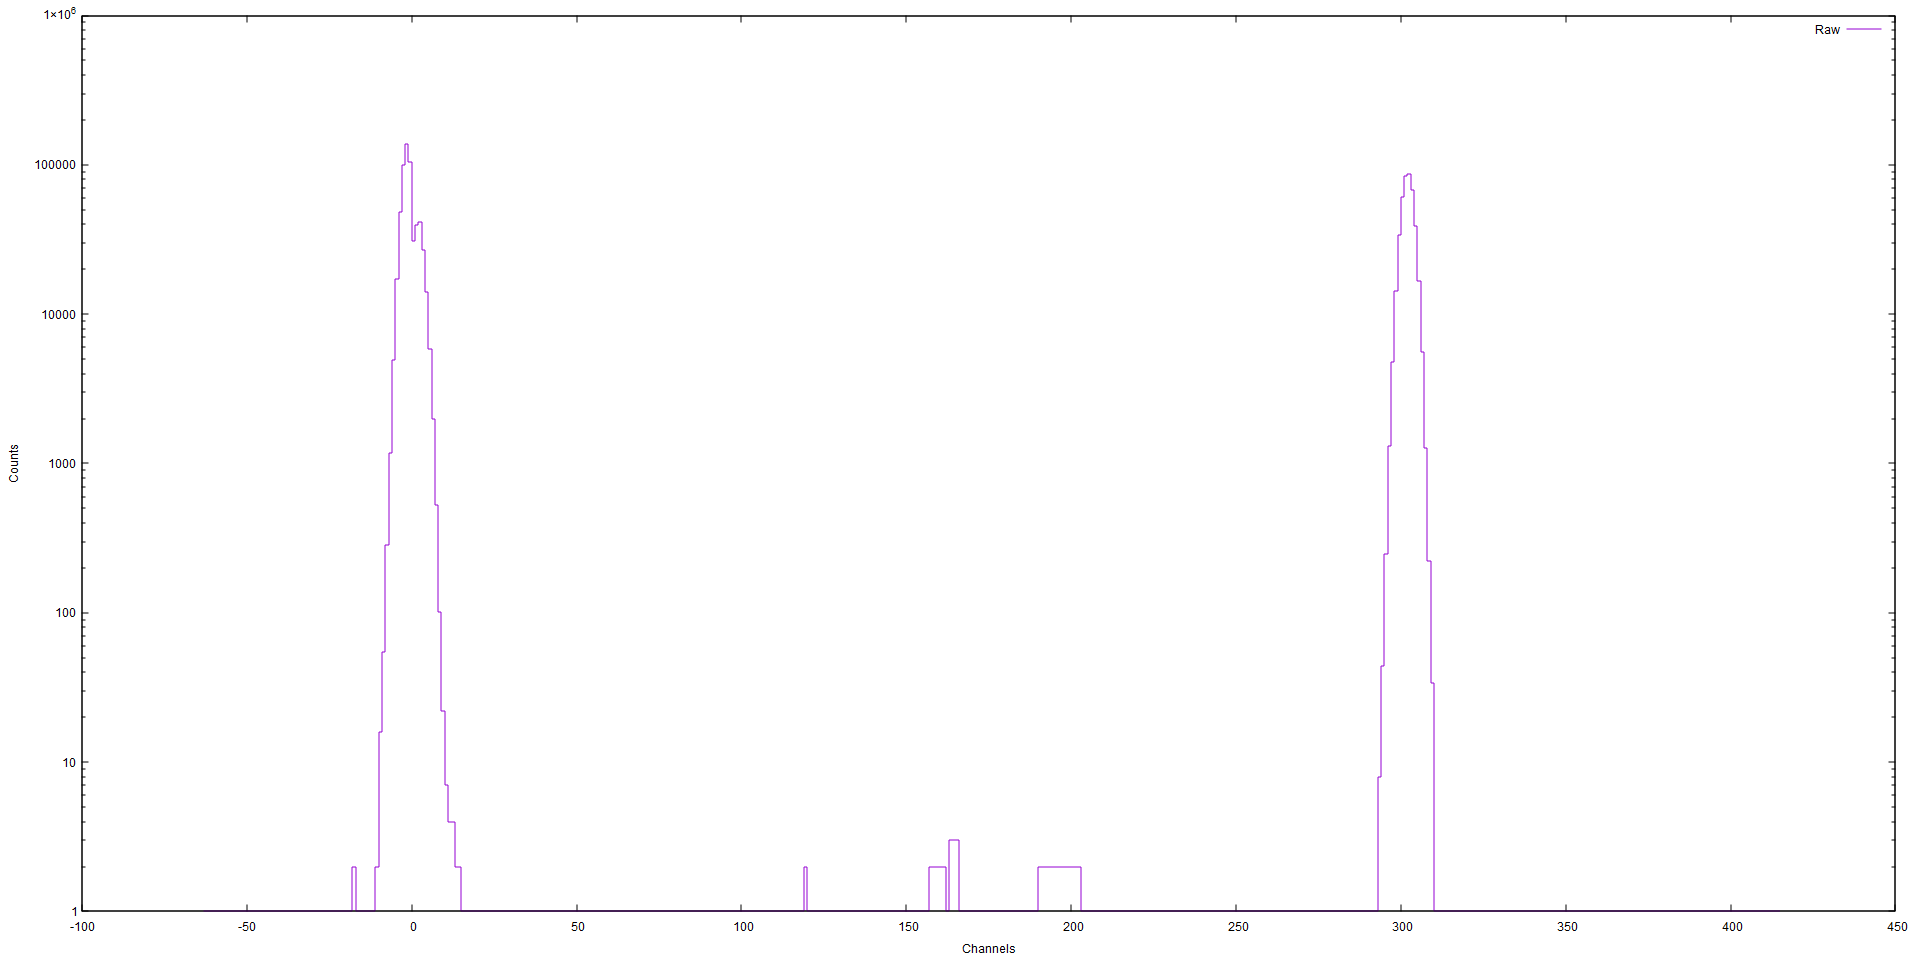
Attach 1: Wave amplitudes.
Peak at 300 is pulser.
Some physics events in between obvious noise and pulser.
No obvious signal from Bismuth source

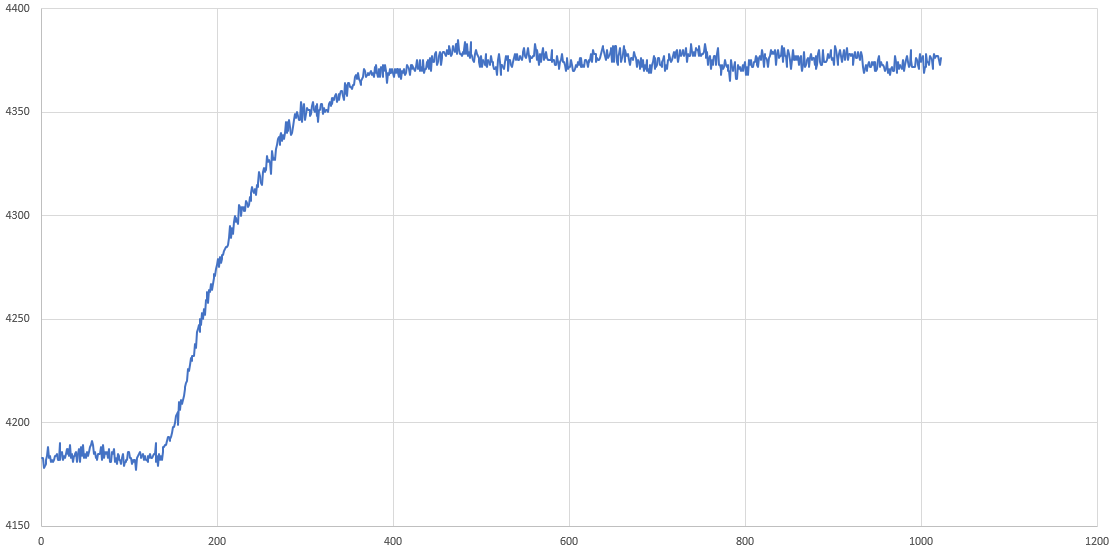
Attach 2: Alpha (?) wave sample. Rise time ~ 200 samples.
In spite of no signal from source, some alphas are visible. |
| Attachment 1: H.png
|
|
| Attachment 2: Alpha_candidate.png
|
|
|
20
|
Tue Jun 15 13:15:48 2021 |
CB | R14 analysis |
Fit: line + power law + line
Free parameters: 2x boundary points between lines
Algorithm: Nelder-Mead, 20 iterations.

Attach 1: Wave amplitudes.
Pulse not shown at 1000 channels.
Obvious signal from Bismuth source with visible peaks. Not all peak origins clear.

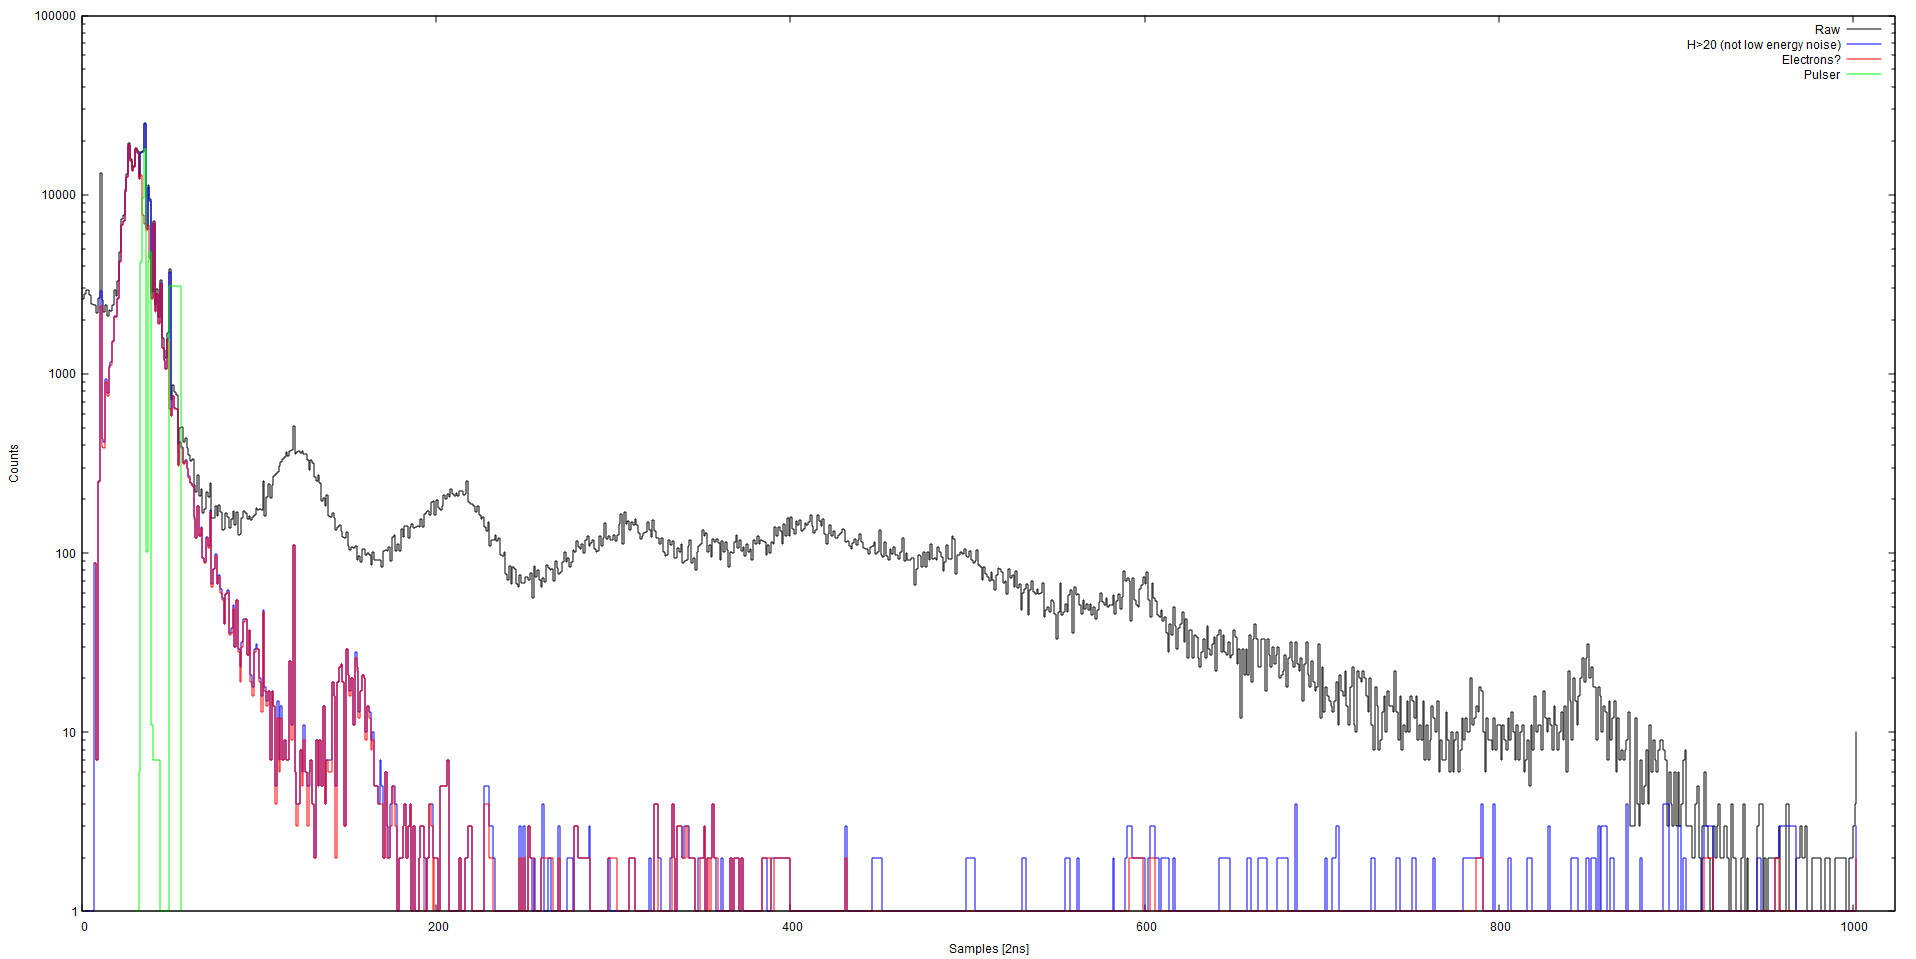
Attach 2: Risetimes.
Pick-up / microphonic noise quite evident (compare with background run with B-grade silicon)
Pulser relatively well-defined in risetimes
Electrons not well defined

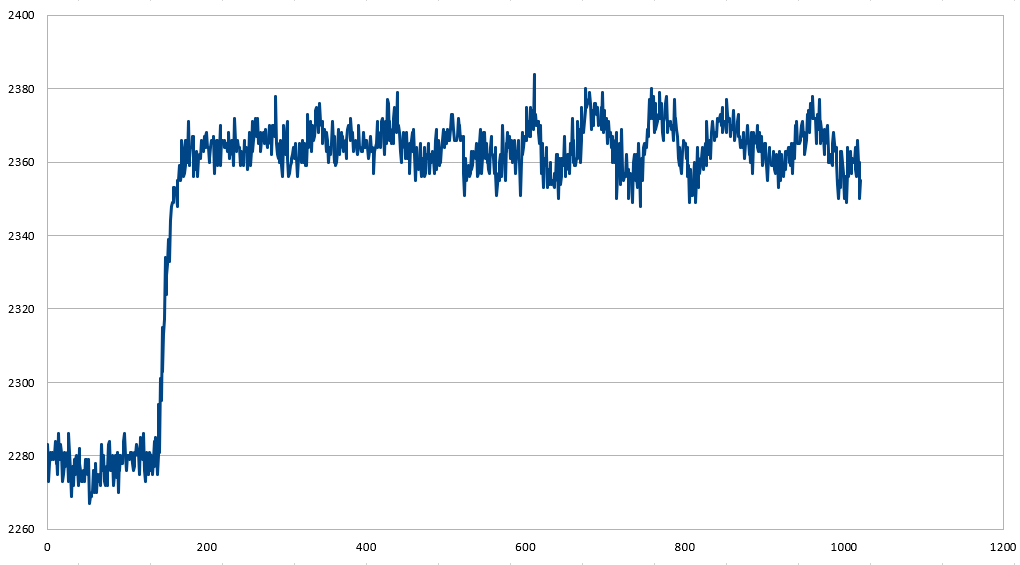
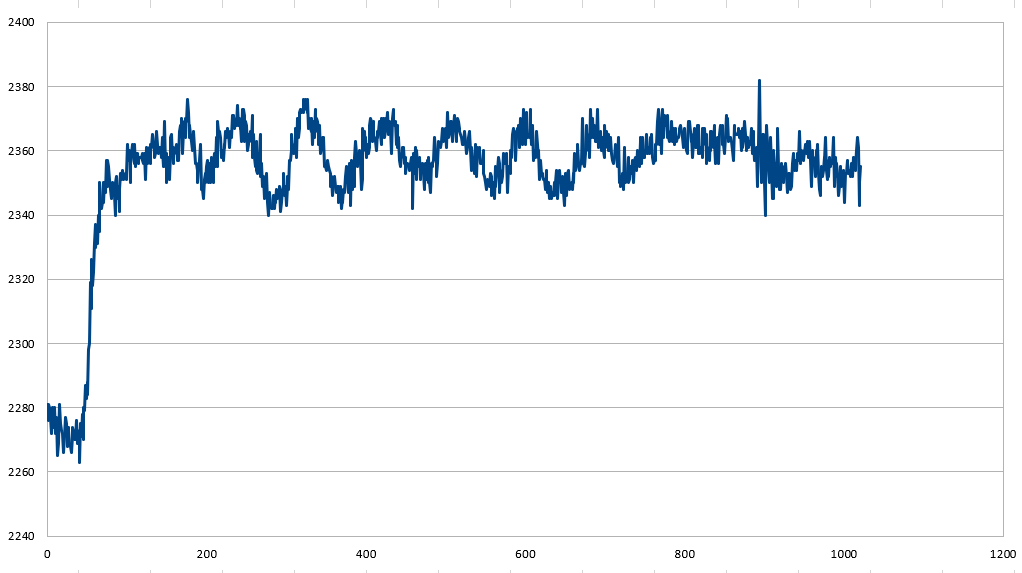
Attach 3: Waveform for electron candidate fitted as risetime = 26 samples
Attach 4: Waveform for electron candidate fitted as risetime = 153 samples

Visual difference between the two unclear, aside from noise.
Looks like fitting function is failing. Will have to change algorithm to draw any conclusions. |
| Attachment 1: H.png
|

|
| Attachment 2: t.png
|
|
| Attachment 3: Electron_t26.png
|
|
| Attachment 4: Electron_t153.png
|
|
|
21
|
Wed Jun 23 08:23:07 2021 |
CB | R14 analysis 2 |
Given very poor fit using line + power law + line, changes were made to the fitting algorithm.
- Starting paramters optimised for new typical wave shape
- Reverted to 3 lines, since signals are faster
- Subtracted wave minimum from all wave points to have a more realistic chi2 estimate
- Discarded all waves where 2nd half of signal > 1st half of signal. Should correspond to pick-up / noise

Fit: 3 lines
Free parameters: 2x boundary points between lines
Algorithm: Nelder-Mead, 20 iterations.

Attach 1: Wave amplitudes
Attach 2: Rise times
No major differences vs. power law method, but note candidate electron peak in rise time spectrum is now sharper.

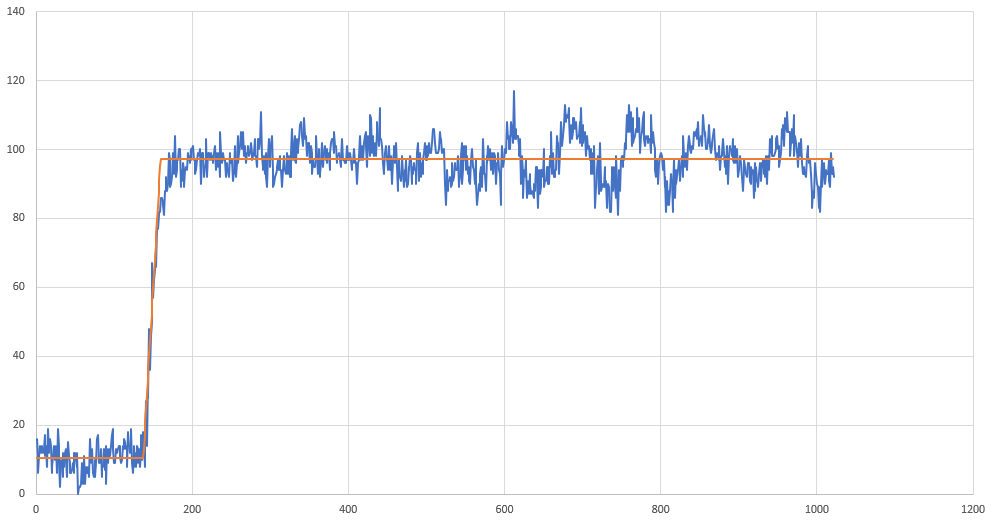
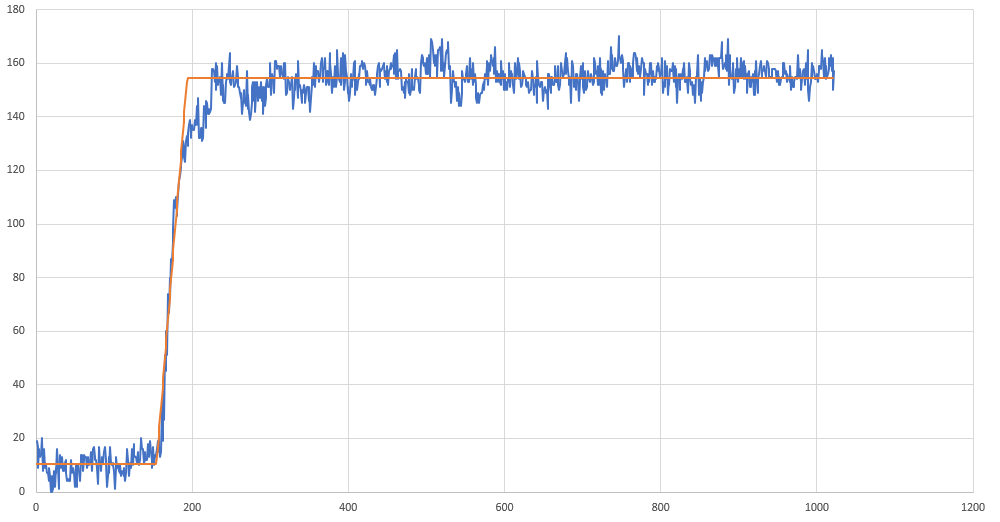
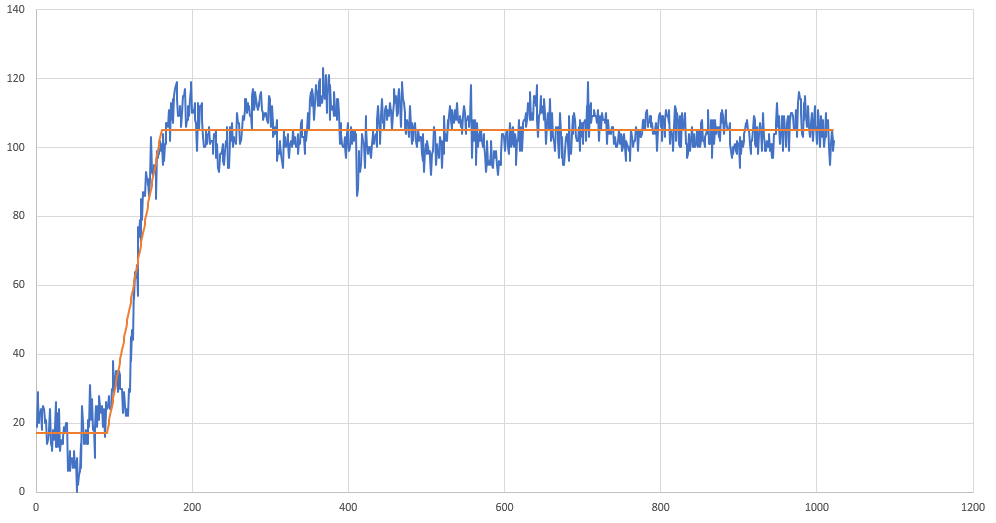
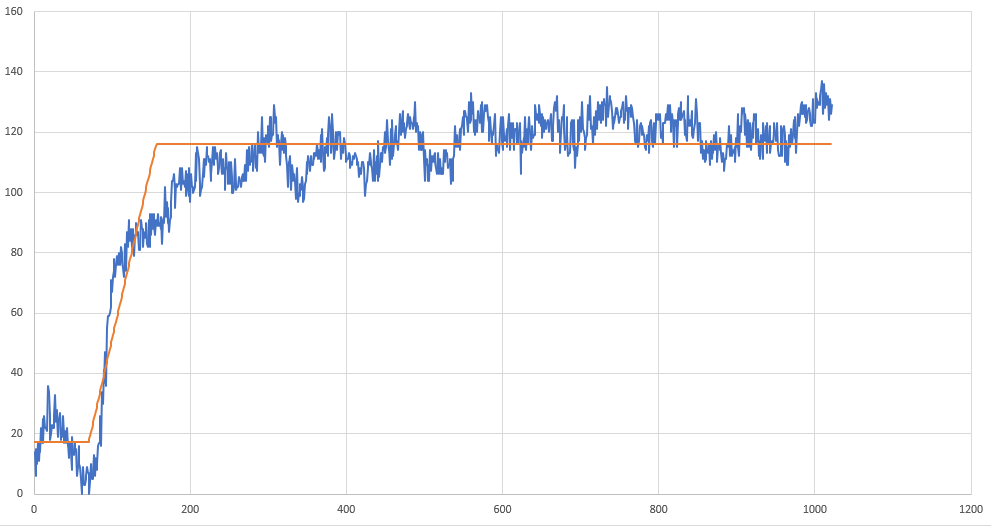
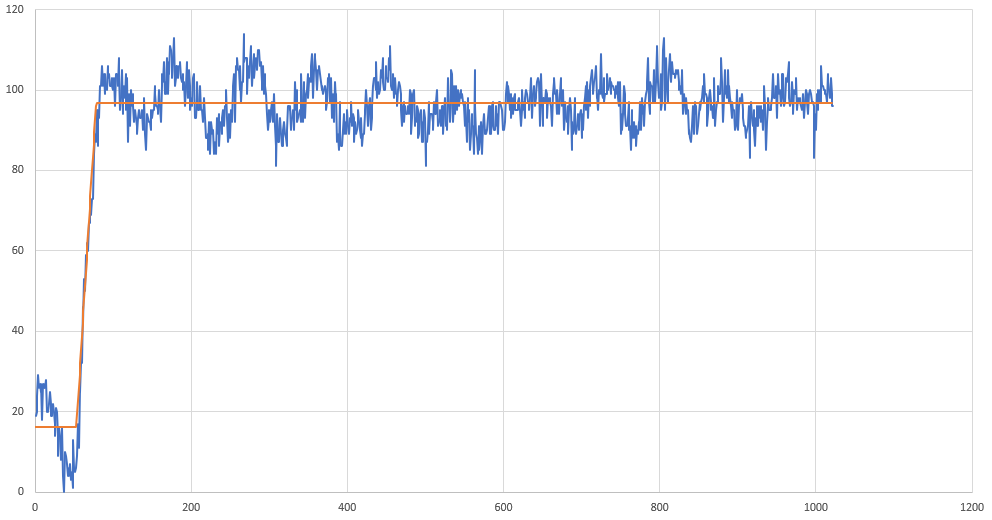
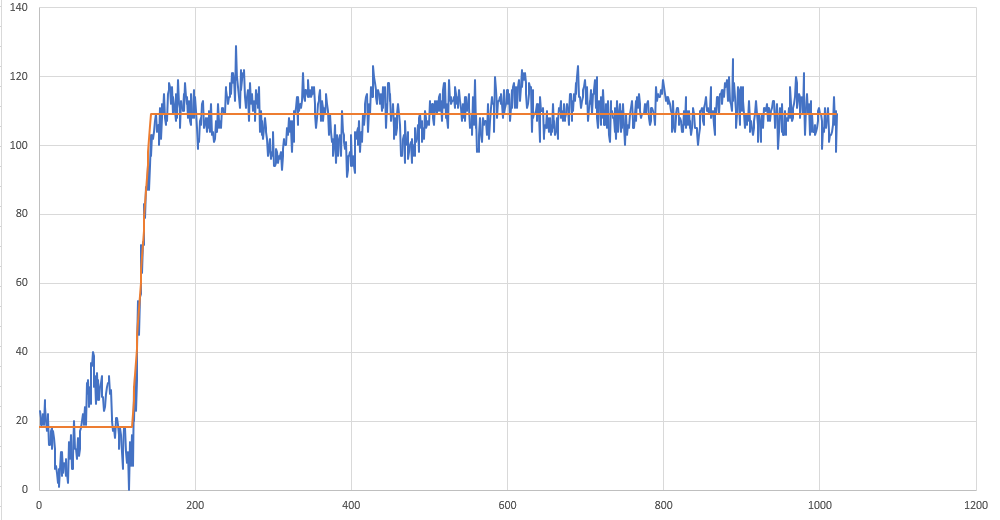
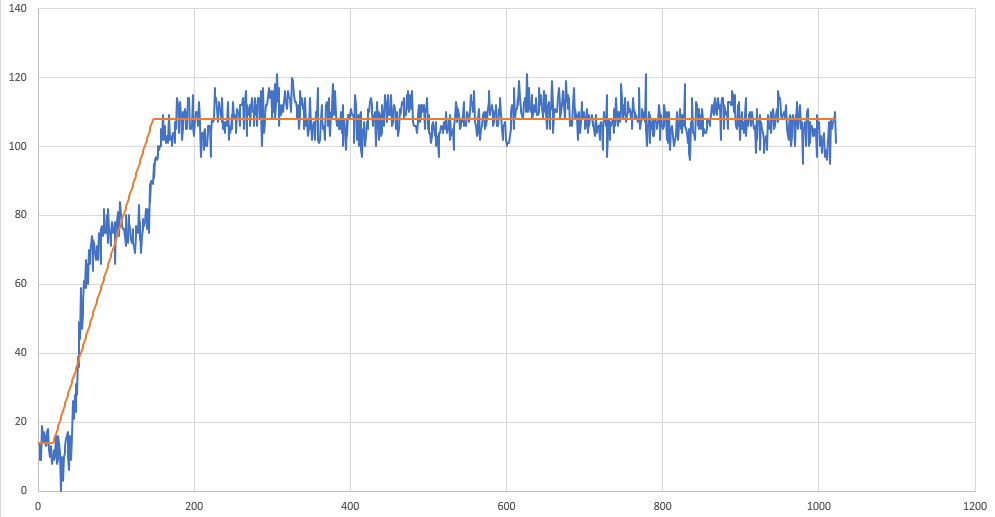
Attach 3-9: Waveforms with H~90 and increasing rise times.
Note fit shown are via Solver's GRG, not NM.
Fits in waves 1-4 give same result for GRG and NM.

Fit in wave 5: NM-> H72 t102 vs. GRG-> H80 t25
Fit in wave 6: NM-> H96 t128  vs. GRG-> H90 t23
GRG risetimes are more realistic. This appears to be due to very short baseline pre-rise.
Will increase in next run.

Fit in wave 7 is rare pile-up event. Code cannot yet cope. Bad fit. |
| Attachment 1: H.png
|

|
| Attachment 2: t.png
|

|
| Attachment 3: H86t21.png
|
|
| Attachment 4: H143t44.png
|
|
| Attachment 5: H86t65.png
|
|
| Attachment 6: H99t84.png
|
|
| Attachment 7: H72t102.png
|
|
| Attachment 8: H96t128.png
|
|
| Attachment 9: H94t148.png
|
|
|
2
|
Mon Jun 10 06:09:59 2019 |
CB, OH | Sorting program |
Sort program written by Oscar, adapted from the RIKEN AIDA sort.
EDIT 26 Jun 2019 by CB - C++11 dependencies removed for SL6 compatibility
EDIT 28 Jun 2019 by CB - added histogram program mode

1. Untar/unzip
2. Compile with  g++ dataReaderMain.cpp -o dataReader
3. Usage       ./dataReader MODE pathToFile/File

where MODE is wave to output the waveforms, and histo to output a basic wave amplitude histogram with
semi-gaussian filtering applied on the waves
The output will be printed on standard output.
Use ./dataReader MODE path/ToFile/File > pathToOutput/Output.dat
to save to file.

In wave mode the first few lines are the header. Waveforms are printed bin-by-bin with a newline after every
bin. A blank
line is placed between waveforms. |
| Attachment 1: dataReader.tar.gz
|
|
24
|
Thu Jun 8 10:36:26 2023 |
Lucia B, Carlo B | Start of the measurements |
We have started the pumping system and reached ~10^-6 mbar vacuum. We have then filled the cold trap reaching ~10^-7 mbar.
We have started the chiller and the measurement on the Ta backing on 7/6/23. We made a quick run on top of the 19F(p,gamma) resonance at e_p=340 keV, and an overnight run on top of the 11B(p,gamma) resonance at E_p=163 keV.
On 08/06/23 we focused the beam at E_p=309 keV (23Na(p,gamma) resonance) and left a run on the Ta overlunch.
More details in the attached Excel sheet. |
| Attachment 1: 23NaTarget_tests.xlsx
|
|
4
|
Tue Jun 25 11:51:00 2019 |
CB | Test run 4 |
P9 3-alpha source
Hamamatsu Photodiode - bias = 15V
Cooknell preamplifier
Analogue triggering chain

2048 total samples
256 samples pre-trigger window

Start 11:50 am
Lost contact with VME modules at ~ 18:00 - no more data written to file

Attempted to stop DAQ - failed.
Had to power cycle VME crate to restore contact. |
|
10
|
Tue Jul 9 13:31:20 2019 |
CB | Tests with positive pulses |
According to Carl U. the DPP-PSA software is not meant to be used with negative pulses, and some of the
functions that are currently not working may be recovered fixing this issue.

Changed Pulse Polarity in V1730PSD control panel Positive -> Negative
No changes. Note trigger is currently supplied by external CFD
QLong histograms are still not counting

Set DC offset to 64000. The negative part of the pulse is cut off. Wave histogram shows nothing below zero.
Inversion doe snot appear to be working.


Changed BNC-4 Pulser polarity Negative -> Positive and changed polarity of time signal going to CFD. CFD
triggers OK.
No changes. QLong histograms not counting.

Enabled self-triggering on Ch0 and removed CFD input. DAQ no longer triggers. Put CFD back in.

Changed DC offset of Ch0 to 64010 to remove DC offset. Pulse now looks as attach 1.
Disconnected CFD output -> DAQ does not trigger. Reconnected CFD.
QLong histograms still not counting.

Attempted to change options in V1730PSD control panel one by one to see difference
Enabled Charge Pedestal -> No difference. Disabled
Changed Charge Sensitivity 5 fC -> 5.12 pC. No difference. Back to 5 fC
Changed Discrimination Mode CFD -> LED & removed CFD input. No triggers. Reverted

Changed Baseline Mean 16 -> 1024. Wave changes as per attach 1. QLong histogram starts counting at low channel.
See attach 2.
Changed DC offset 64010 -> 60000. Peak in QLong histogram moves to ~1050 channels. See attach 2.
Changed DC offset back to 64010.
Changed Baseline Mean 1024 -> 64. No changes in either wave shape or QLong peak position.
Changed Baseline Mean 64 -> 256. No changes as above.
Changed Baseline Mean 256->16. Wave is back as per attach 1, QLong no longer counting. |
| Attachment 1: 190709_PositivePulse.png
|

|
| Attachment 2: 190709_BaselineMean.png
|

|
|
5
|
Wed Jun 26 14:15:43 2019 |
CB | Waves to histogram program |
Wrote simple program to convert from waves to amplitude/energy histogram.
Program uses semi-gaussian filtering with RC=RC, simple pole zero correction and baseline restoration.

Compile with g++ WavesToHisto.cpp -o WavesToHisto.x
Usage: ./WavesToHisto.x Sorted_run_file > histogram.dat |
| Attachment 1: WavesToHisto.cpp
|
#include <iostream>
#include <fstream>
#include <string>
#include <vector>

#include <math.h> // exp

#define TOT_SAMPLES 8192
#define B_SAMPLES 400


#define GAIN 6.22575 //1/(POW(POLES,POLES)*EXP(-POLES)/POLES!)
#define T_C 100.0 			// Time constant (RC=CR)
#define PZ 500.0 			// Pole zero correction

void Filter(std::vector<double>* wave) // Semi-gaussian filter
{

	//std::vector<double> old_wave = *wave;
	double b1,a0,a1,a0_1;
	b1=exp(-1./T_C);
	a0=(1.+b1)/2;
	a0_1=1.-b1;

	int i,j;

	// 1 differentiator (high-pass filter)
	double my_value, baseline;

	baseline= (*wave)[0];
	(*wave)[0]=0;
	for(i=1;i<wave->size();++i)
	{
		my_value=(*wave)[i]-baseline; // Baseline
		(*wave)[i]=b1*(*wave)[i-1] + a0*(my_value-(*wave)[i-1]) + (*wave)[i-1]/PZ;
	}

	//  6 integrators (low-pass filter)
 	for(j=0;j<6;++j)
	{
		for(i=1;i<wave->size();++i)
		{
			my_value=b1*(*wave)[i-1]+a0_1*(*wave)[i];
			(*wave)[i]=my_value;
		}
	}

	//for(i=0;i<wave->size();++i) std::cout<<old_wave[i]-old_wave[0]<<" "<<(*wave)[i]<<std::endl;
};

unsigned int GetAmplitude(std::vector<double> wave)
{
	double minimum=wave[0];
	double baseline=0;
	int i;

	for(i=0;i<B_SAMPLES && i<wave.size();++i) baseline+=wave[i];
	baseline*=1./B_SAMPLES;

	for(;i<wave.size();++i) if(wave[i]<minimum) minimum=wave[i];

	return baseline-minimum;

};

int main (int argc, char* argv[])
{
	std::fstream f_in;
	std::string str;
	if(argc<2)
	{
		std::cerr<<"USAGE: ./WavesToHisto input_file"<<std::endl;
		return 1;
	}
	str=argv[1];
	f_in.open(str.c_str(),std::fstream::in);
	if(!f_in)
	{
		std::cerr<<"No such file: "<<str<<std::endl;
	}

	// Header
	std::getline(f_in,str);
	while(str!="")
	{
		std::getline(f_in,str);
	}

	// Waveforms
	int read;
	int i=0;
	double baseline, minimum;

	int histo[500]={0};
	unsigned int channel;
	std::vector<double> wave;

	while(f_in)
	{
		i=0;
		baseline=0;
		f_in>>read;
		while( f_in && i<(TOT_SAMPLES-3) )
		{
			wave.push_back(read);
			f_in>>read;
			++i;
		}
		f_in>>read>>read;
		if(wave.size()>0)
		{
			Filter(&wave);
			channel=GetAmplitude(wave);
			if(channel<500) histo[channel]++;
		}

		wave.clear();


		/*
		minimum=read;
		while(i<(TOT_SAMPLES-3))
		{
			//std::cout<<i<<" "<<read<<std::endl;
			if(i<B_SAMPLES) baseline+=read;
			else if (read<minimum) minimum=read;

			f_in>>read;
			i++;
		}
		f_in>>read>>read; // Waveform tail
		baseline*=1./B_SAMPLES;
		channel=baseline-minimum;
		if(channel<500) histo[channel]++;
		//std::cout<<baseline<<" "<<minimum<<" "<<baseline-minimum<<std::endl;
		*/
	}

	for(i=0;i<500;++i) std::cout<<i<<" "<<histo[i]<<std::endl;

	return 0;
}
|
|
22
|
Mon Jun 5 15:48:47 2023 |
Lucia B,David R | Work on DAQ for 23Na target test |
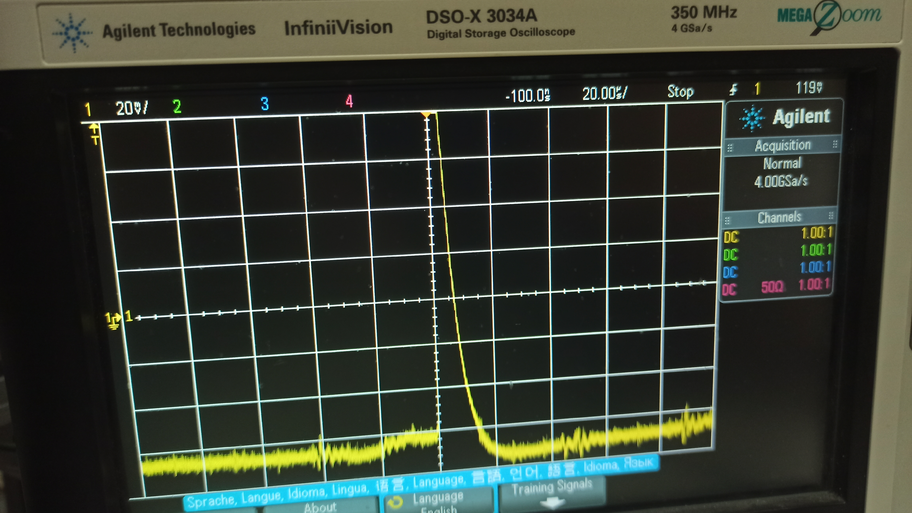
We started the acquisition via CoMPASS with one CeBr (90) and the HPGe. The germanium was already cooled at 80K with a power of 90W. The CeBr HV was already applied from NHQ 202M bias supply, channel A, HV = +650V.
We applied the HV to the germanium on 5/6/23, from Ortec 660 dual bias supply borrowed from gas target, channel B, HV = +4900V, Bias shutdown connected.
Attached a picture of the baseline in the evening, before leaving the lab.
-----------------------
The DAQ from solid target is connected to the new Intel NUC mini-PC, located below the VME crate. It is possible to connect remotely to such PC using the RDP protocol (IP address -> 172.17.5.149). To connect from lunaserver, lauch Remmina and select lap2-depalo. Here, the CoMPASS project is located in /home/Compass/projects/23Na_target_tests.
We have also created the folder on lunaserver in /home/luna/Shared/Data/23Na_target_tests, where we copied from /home/luna/Shared/Data/16O_prompt the scripts required for possible binary conversions.
We are using three channels for the acquisition:
- Ch. 1: scintillator CeBr 90
- Ch. 2 : GeBo + pulser
- Ch. 3: Pulser
Pulser module BNC Model 9010 with following parameters:
- Amplitude 50 mV
- Frequency 24 Hz
- Delay 1 us
- Width 1 us
- Rise Time 0.05 us
- Fall Time 5 us
- Polarity: positive
- No attenuation
We left an overnight background run (run_1).
|
| Attachment 1: GeBo_baseline-5-6-23.jpg
|
|
|
23
|
Tue Jun 6 11:15:31 2023 |
Lucia B,David R | Work on DAQ for 23Na target test |
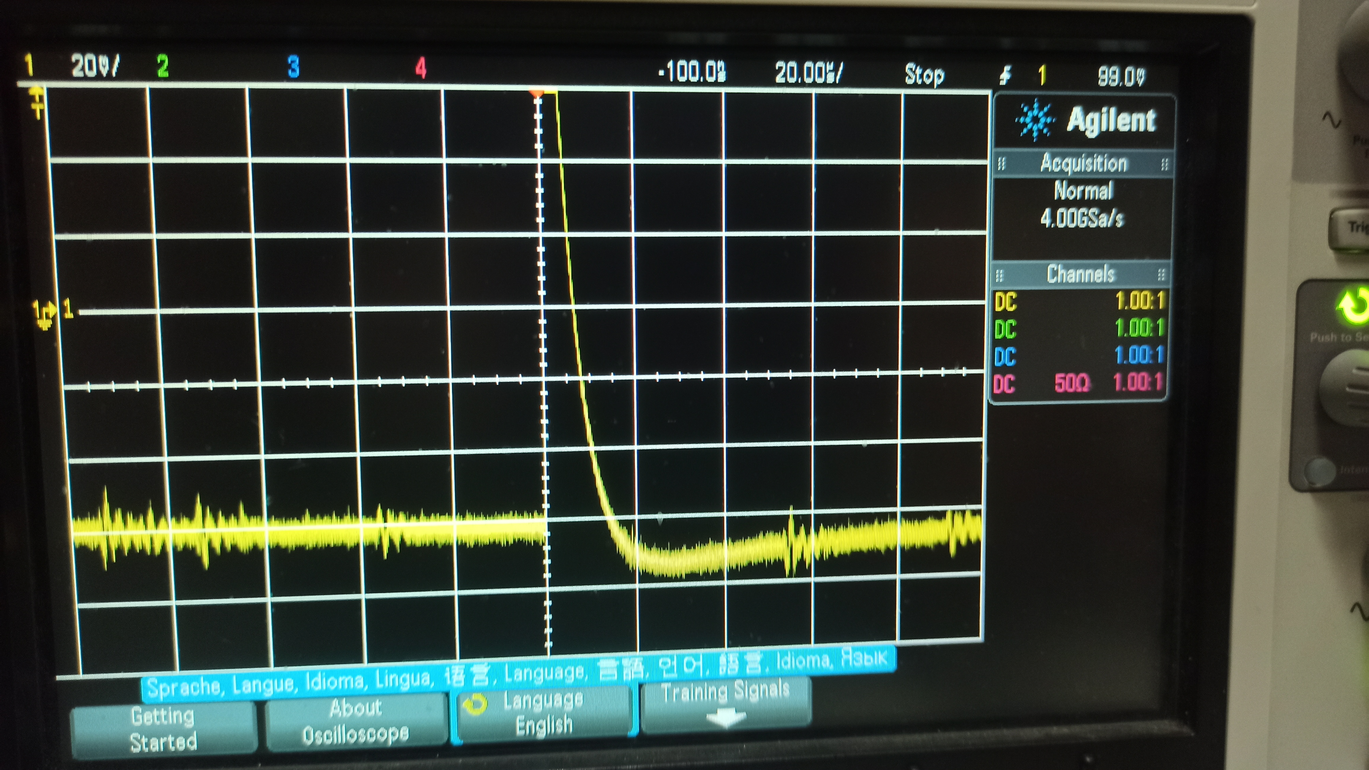
Attached a picture of the germanium baseline in the morning 6/6/23.
-----------------------
We change the pulser amplitude to have it in the spectrum at what seemed a good position (A=150 mV).
We put 133Ba, 60Co and 137Cs sources in the shielding and started run_2 at Mon 6 June 2023, 12:15.
The run was stopped at 16:01. (Note there will be two ROOT files in the folder: one (2_1 for DataR_run_xx.root) is the automatic backup at 15:01, when the 'tentative' calibration on CeBr90 was enabled).
GeBo FWHM at 1.33 MeV is quite bad: 6.4 keV.
-------------------------------
We searched again in 16O log for optimal DAQ parameters and found them. We thave hen used them to see any possible resolution improvement. Spectrum is saved as run_3.
CeBr90 FWHM at 1.33 MeV is 46.10 keV.
GeBo FWHM at 1.33 MeV is 5.37 keV------------>with same parameters, 16O elog reports 3.42058 keV (Feb2023): note that Ge baseline thickness now is approximately 5mV, while in 16O elog I have found 2mV as reference, or slightly more from picture attached to same entry 110 Nov22).
Note that lowering the threshold at the 'optimal' values, we are cutting Ge spectrum at roughly 300 keV (which should not be a problem for 23Na+p resonance scan).
-----------------------------
We have mounted the Tantalum backing from Edinburgh (last spare, cleaned on 20/03/23 at LNGS) on the target holder and closed the beam line. We have left run_4 overnight as background run.
------------
Ge cryocooler is at 80K and 92 W.
|
| Attachment 1: GeBo_baseline-06-06-23.jpg
|
|