| ID |
Date |
Author |
Subject |
|
38
|
Fri Jul 21 10:45:22 2023 |
Michael Donnachie | Consistency Checks BCT PKUP comparrisons |
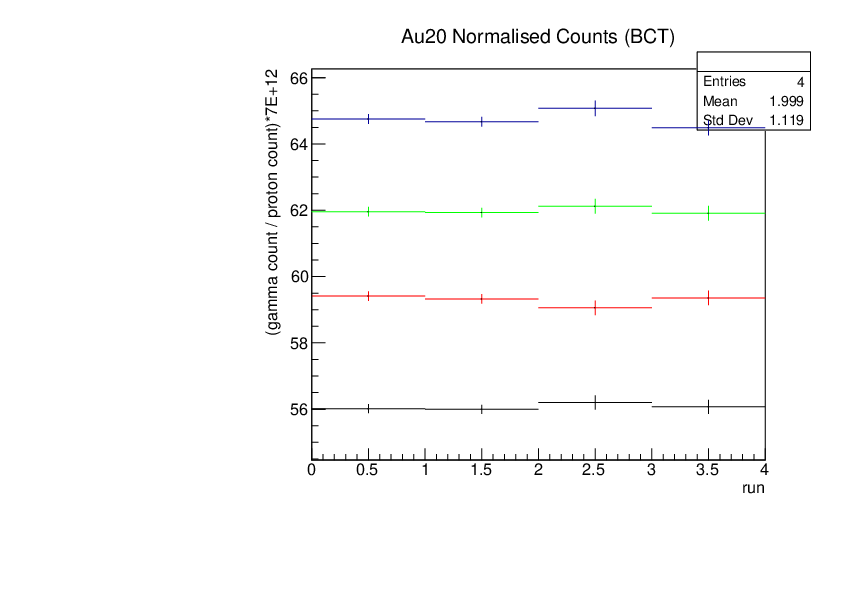
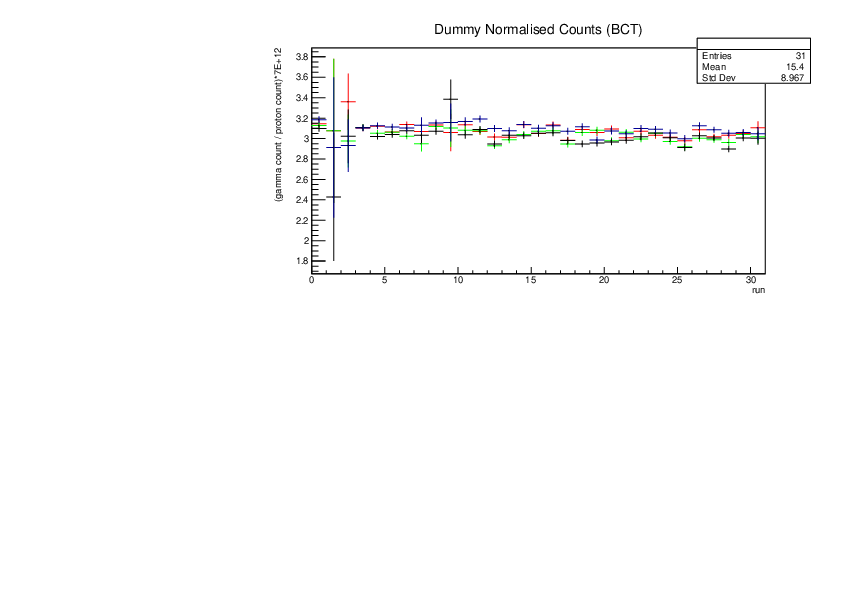
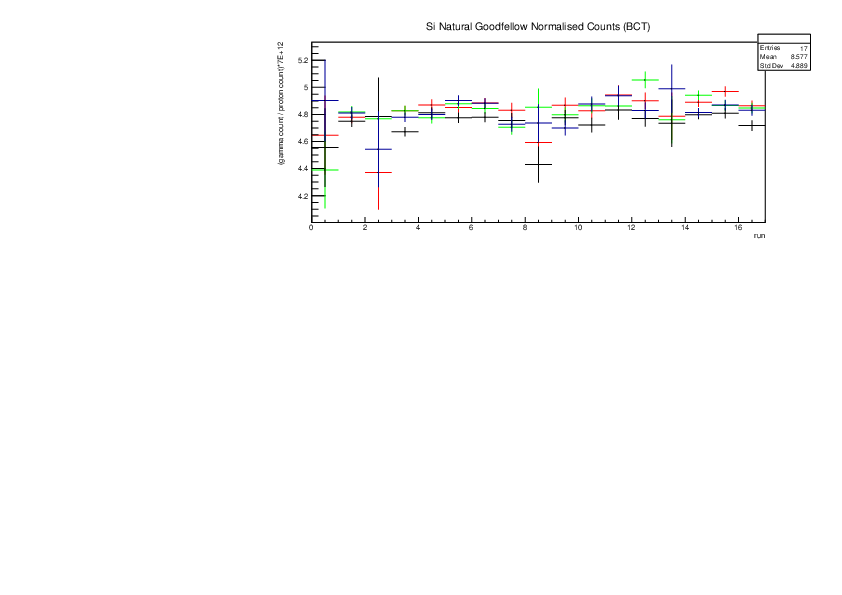
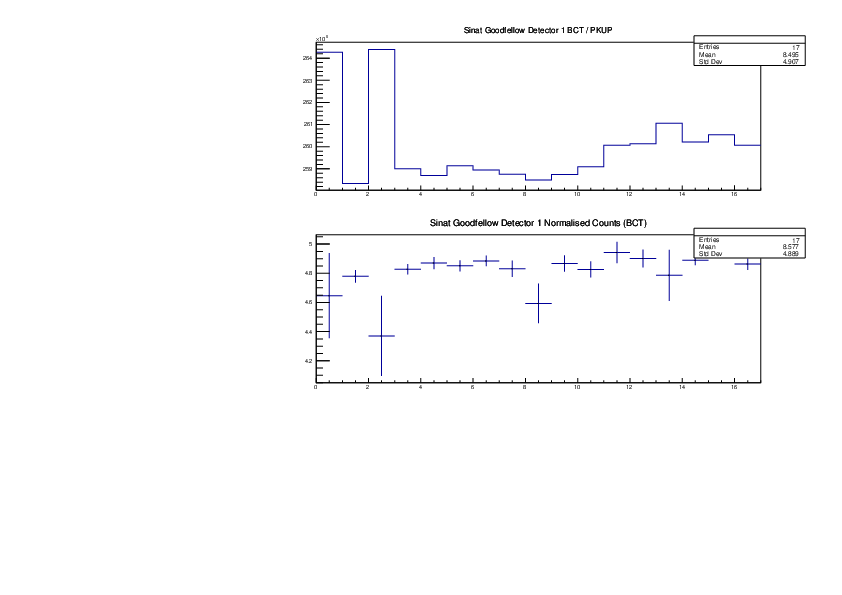
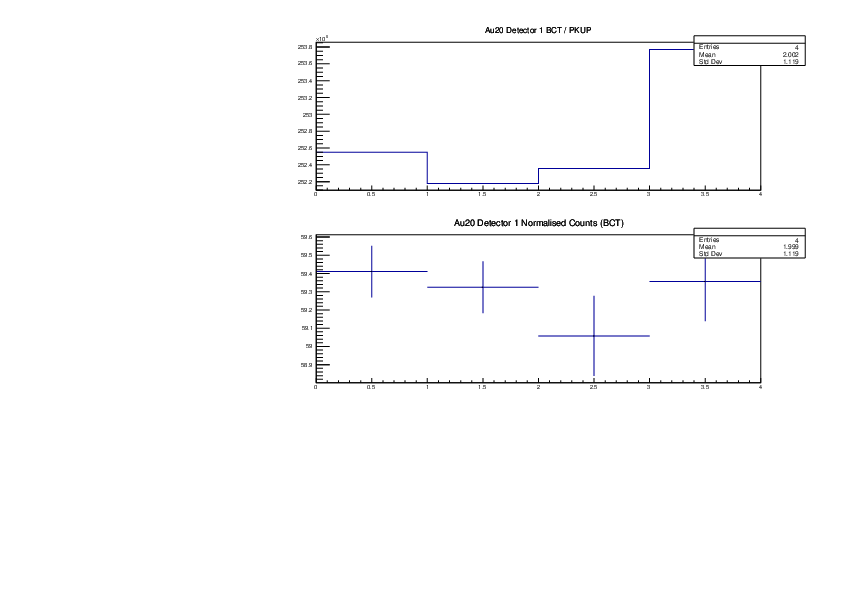
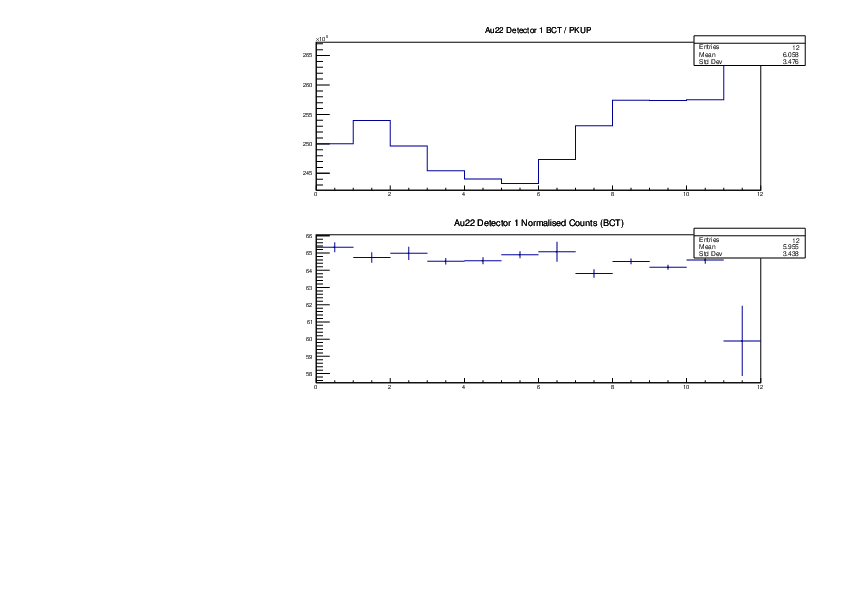
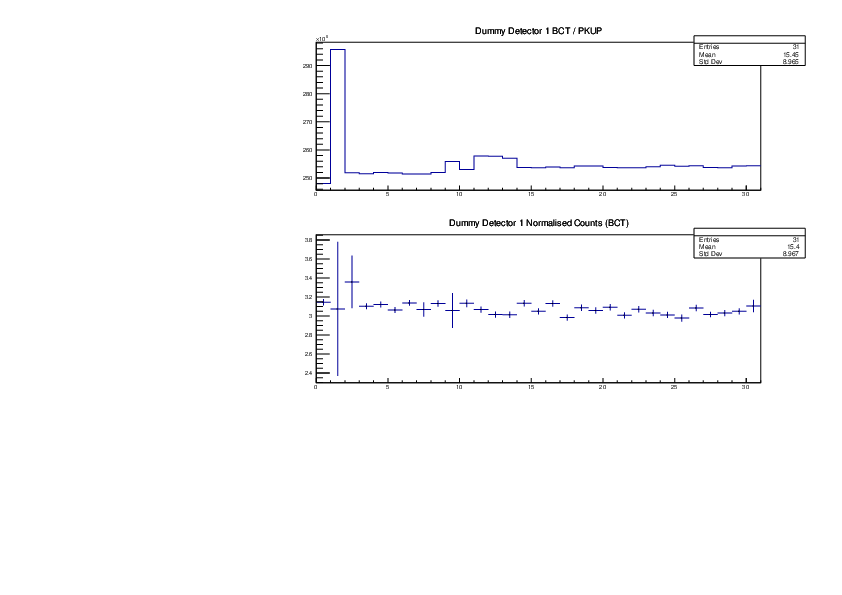
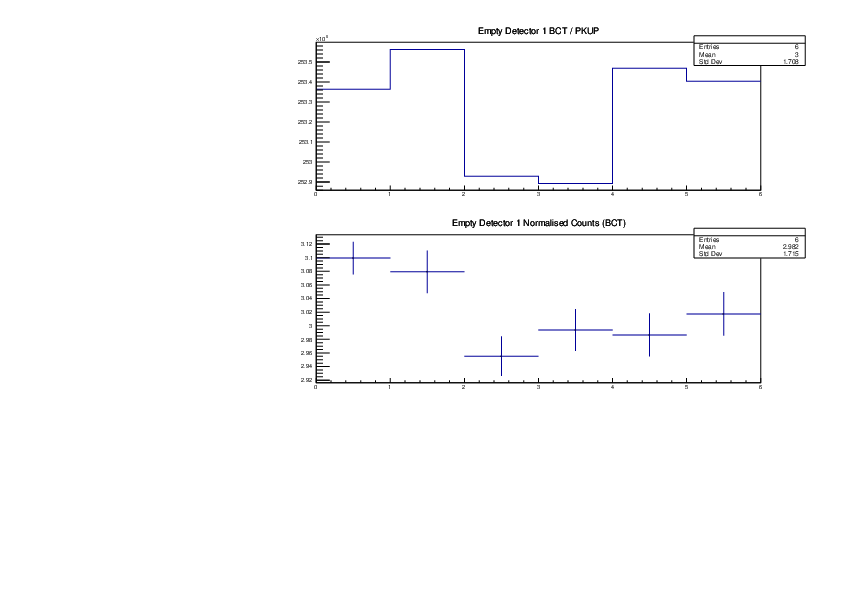
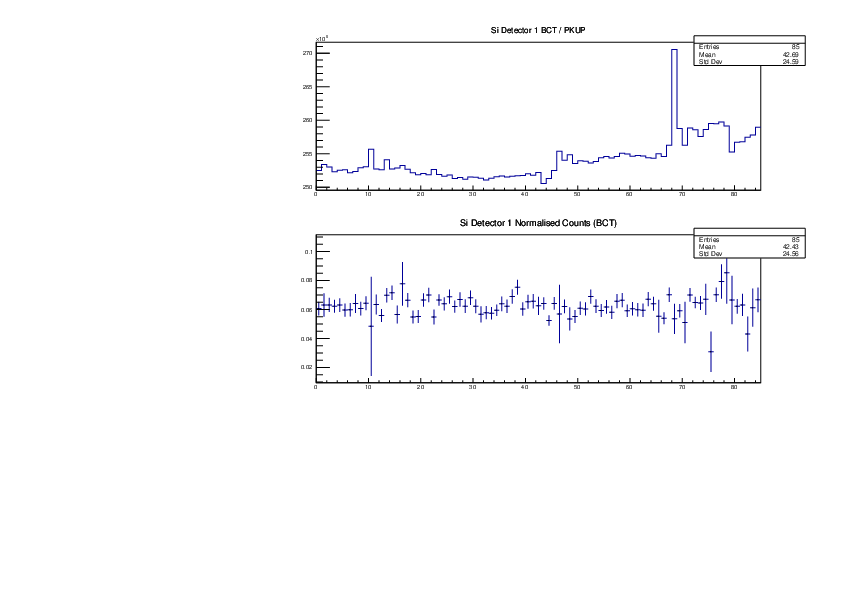
The ratios for BCT/PKUP for Si, Au20, Au22, Dummy, Empty and Sinat goodfellow have been plotted. Also included is the normalised counts (counts/BCT) with all 4 detectors on one plot. Apologies there is not a legend, however det1 is red, det2 is green, det3 black and det4 blue. 'counts' for Si was integreated over the Si resonance, for Au it was integrated over the largest resonance. For Dummy, Empty and Sinat the counts were integrated over a large range of 1e+5 to 1e+7ns. The Sinat resonance was too small for adequate statistics to only integrate over the resonance hence why a large range was used.
|
| Attachment 1: Au20NormalisedCounts.pdf
|
|
| Attachment 2: Au22NormalisedCounts.pdf
|

|
| Attachment 3: DummyNormalisedCounts.pdf
|
|
| Attachment 4: EmptyNormalisedCounts.pdf
|

|
| Attachment 5: SinatgoodNormalisedCounts.pdf
|
|
| Attachment 6: SiNormalisedCounts.pdf
|

|
| Attachment 7: Sinat_Goodfellow_det1_Detector_Ratios.pdf
|
|
| Attachment 8: Au20_det1_Detector_Ratios.pdf
|
|
| Attachment 9: Au22_det1_Detector_Ratios.pdf
|
|
| Attachment 10: Dummy_det1_Detector_Ratios.pdf
|
|
| Attachment 11: Empty_det1_Detector_Ratios.pdf
|
|
| Attachment 12: Si_det1_Detector_Ratios.pdf
|
|
|
39
|
Mon Jul 24 10:32:39 2023 |
Michael Donnachie | Consistency Checks BCT PKUP SILI |
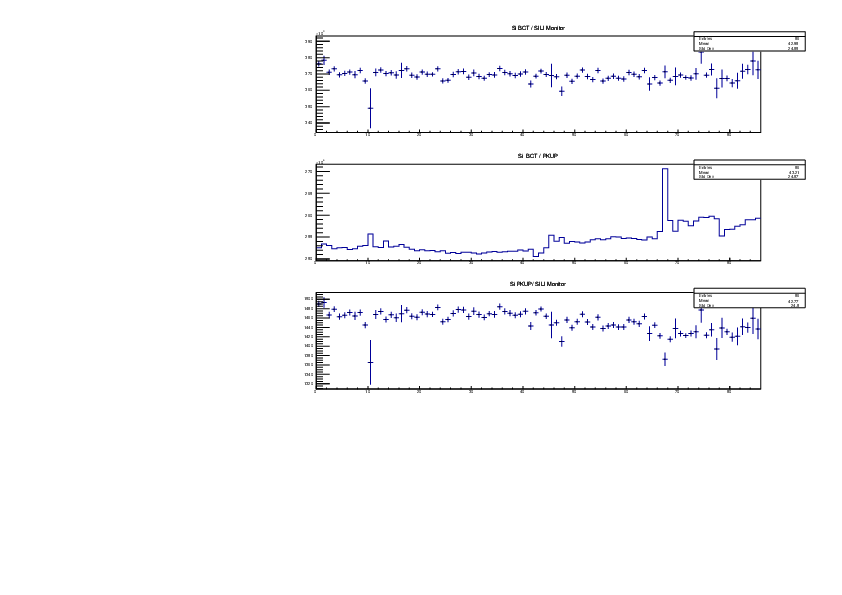
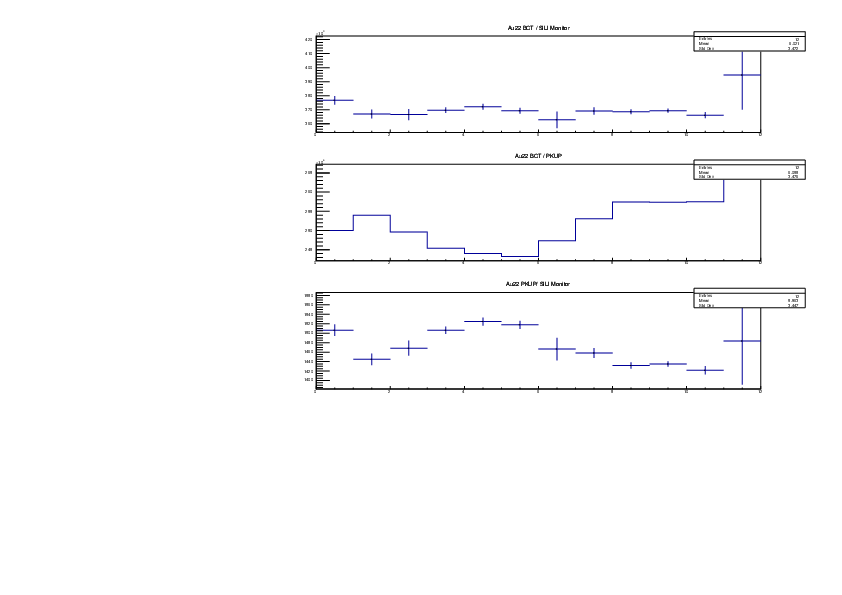
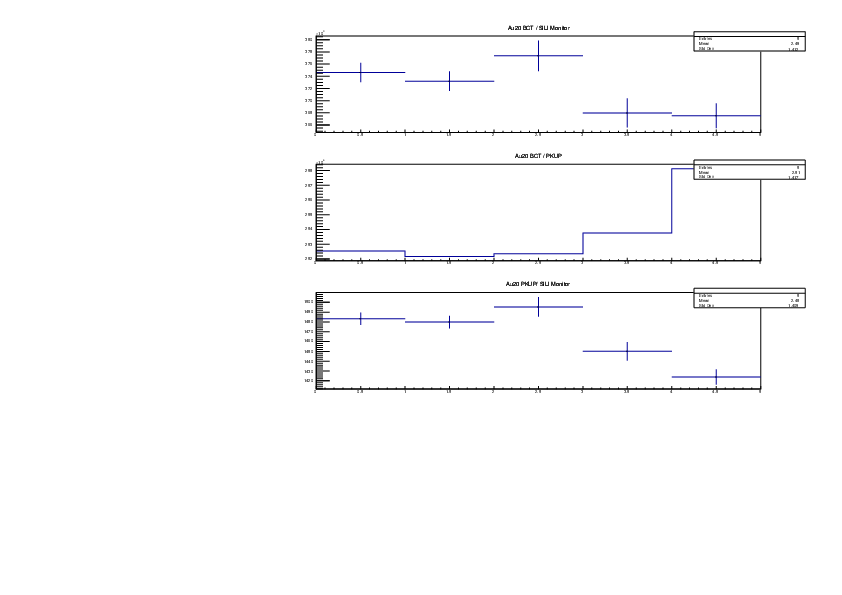
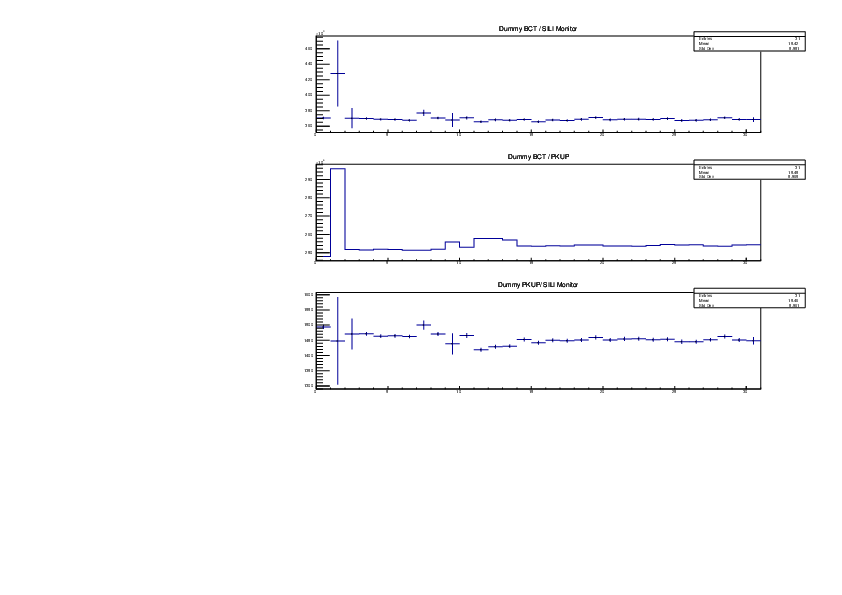
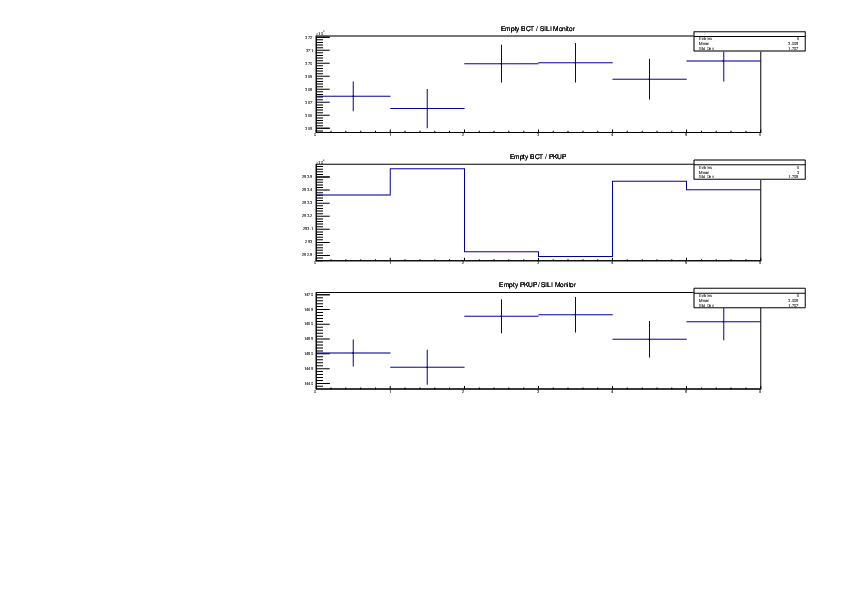
The EAR1 ratios of BCT/PKUP, BCT/SILI and PKUP/SILI plotted for each run for samples Si, Sinat goodfellow, Au20, Au22, Empty and Dummy. |
| Attachment 1: Si_Ratios.pdf
|
|
| Attachment 2: Au22_Ratios.pdf
|
|
| Attachment 3: Au20_Ratios.pdf
|
|
| Attachment 4: Dummy_Ratios.pdf
|
|
| Attachment 5: Sinat_Goodfellow_Ratios.pdf
|

|
| Attachment 6: Empty_Ratios.pdf
|
|
|
53
|
Mon Nov 6 11:13:11 2023 |
Emma Walker | Comparison of empty, ambient and sample- Si-30 |
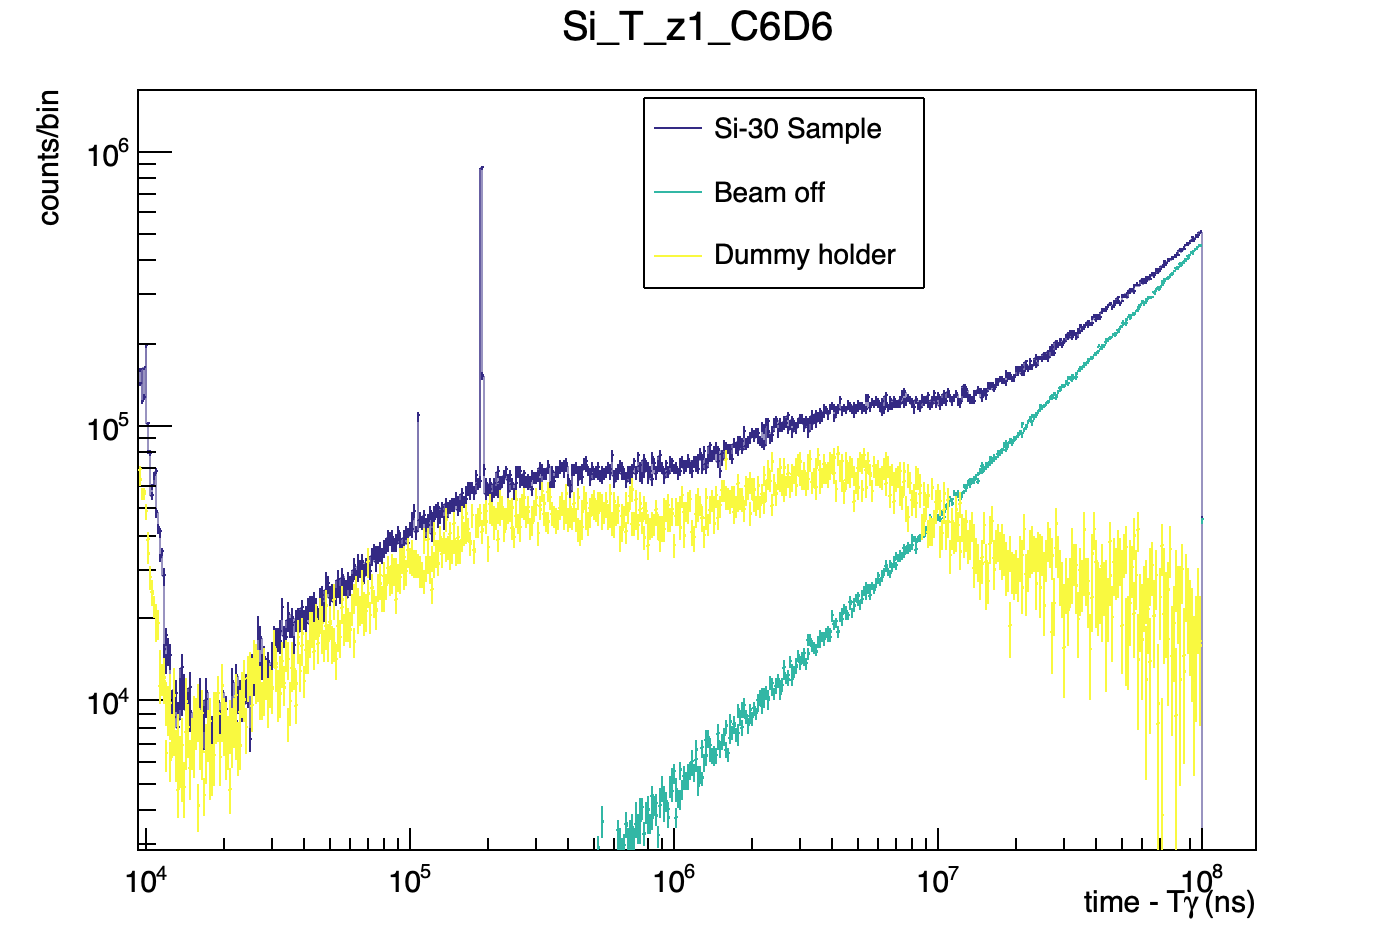
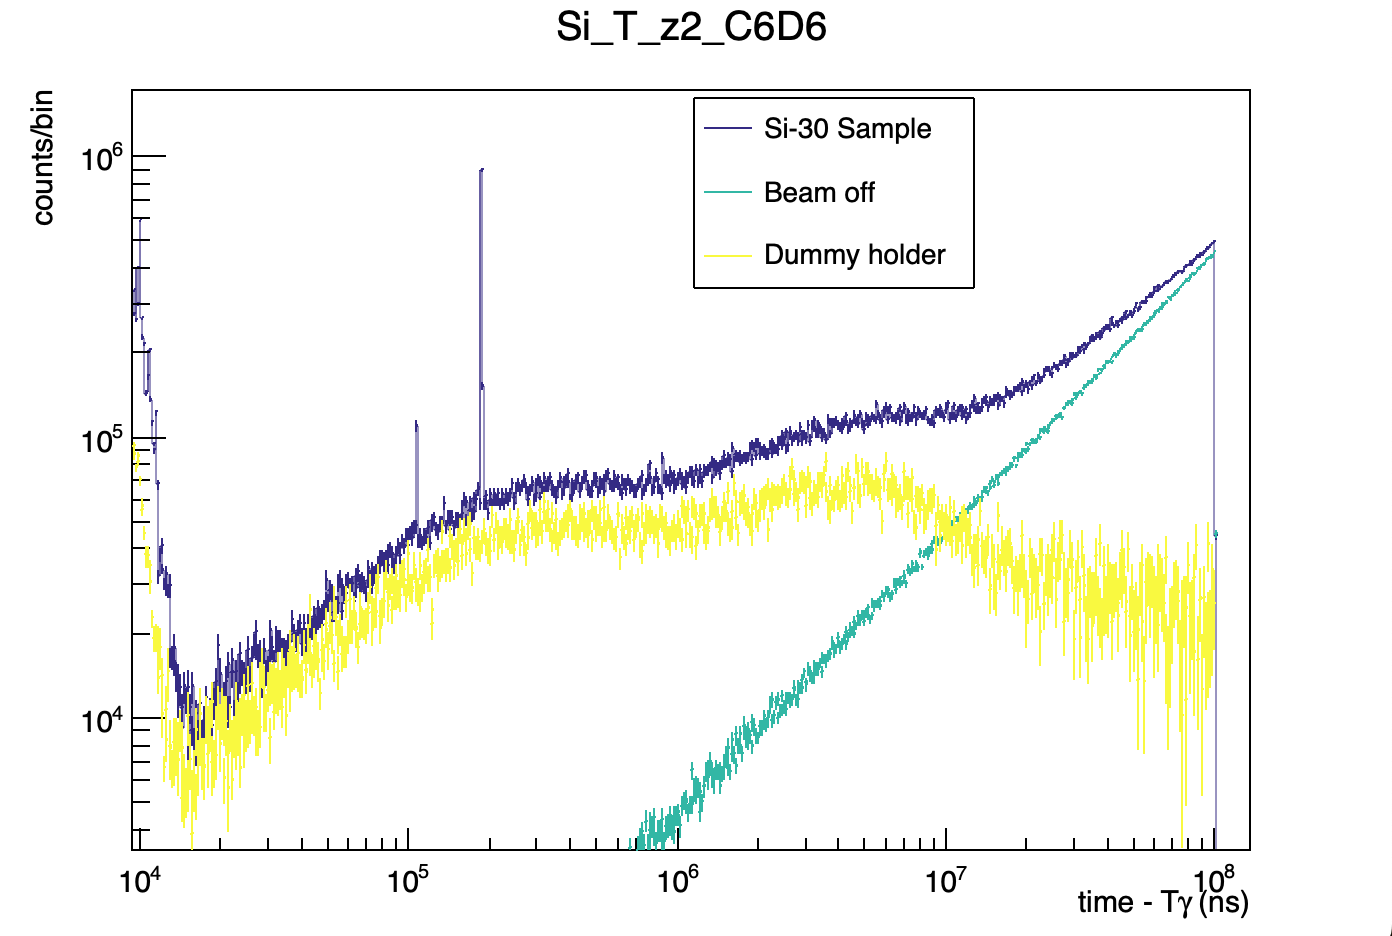
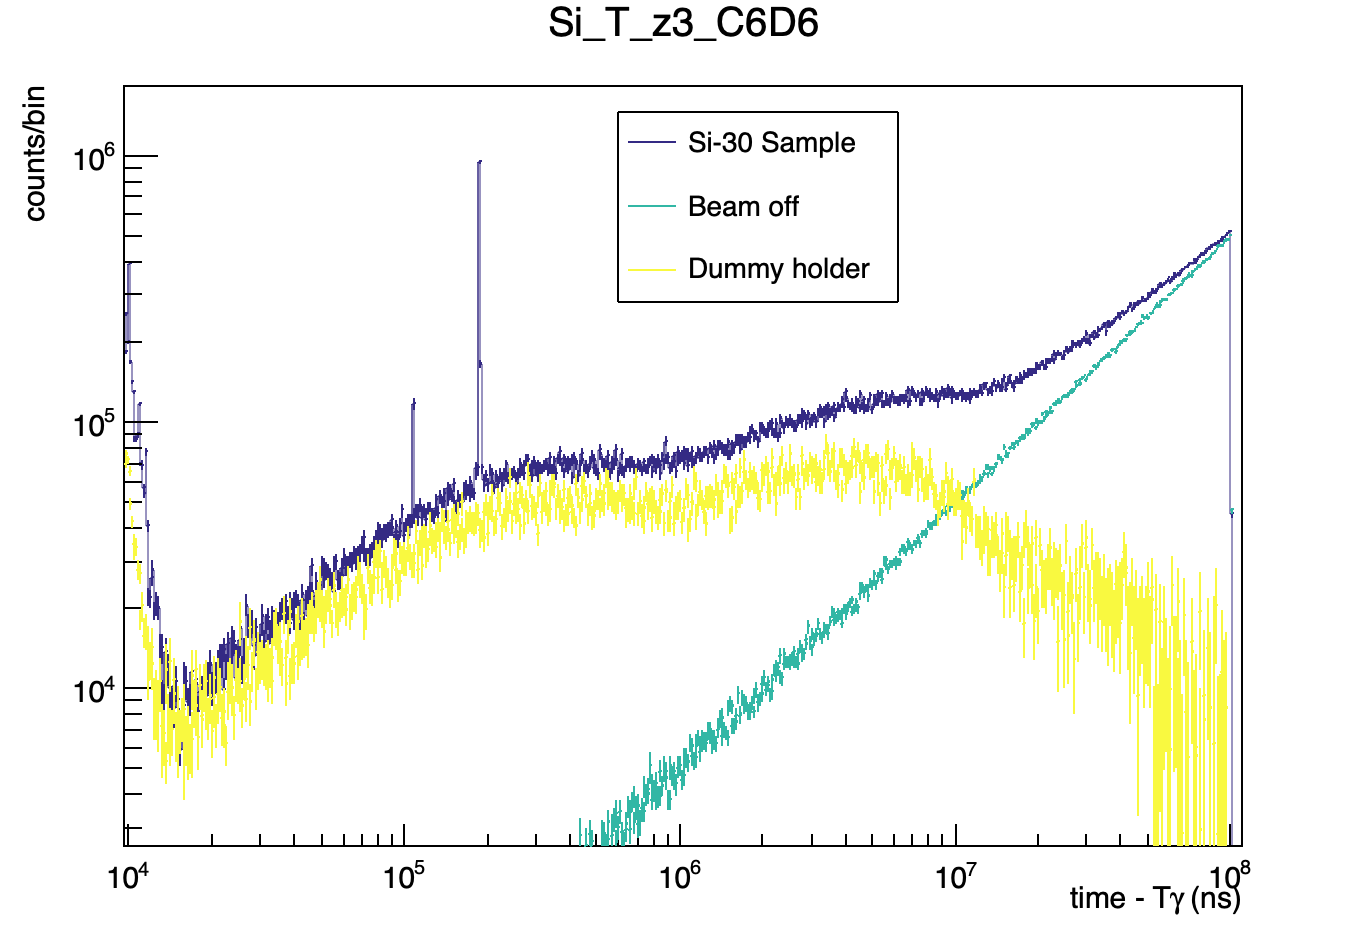
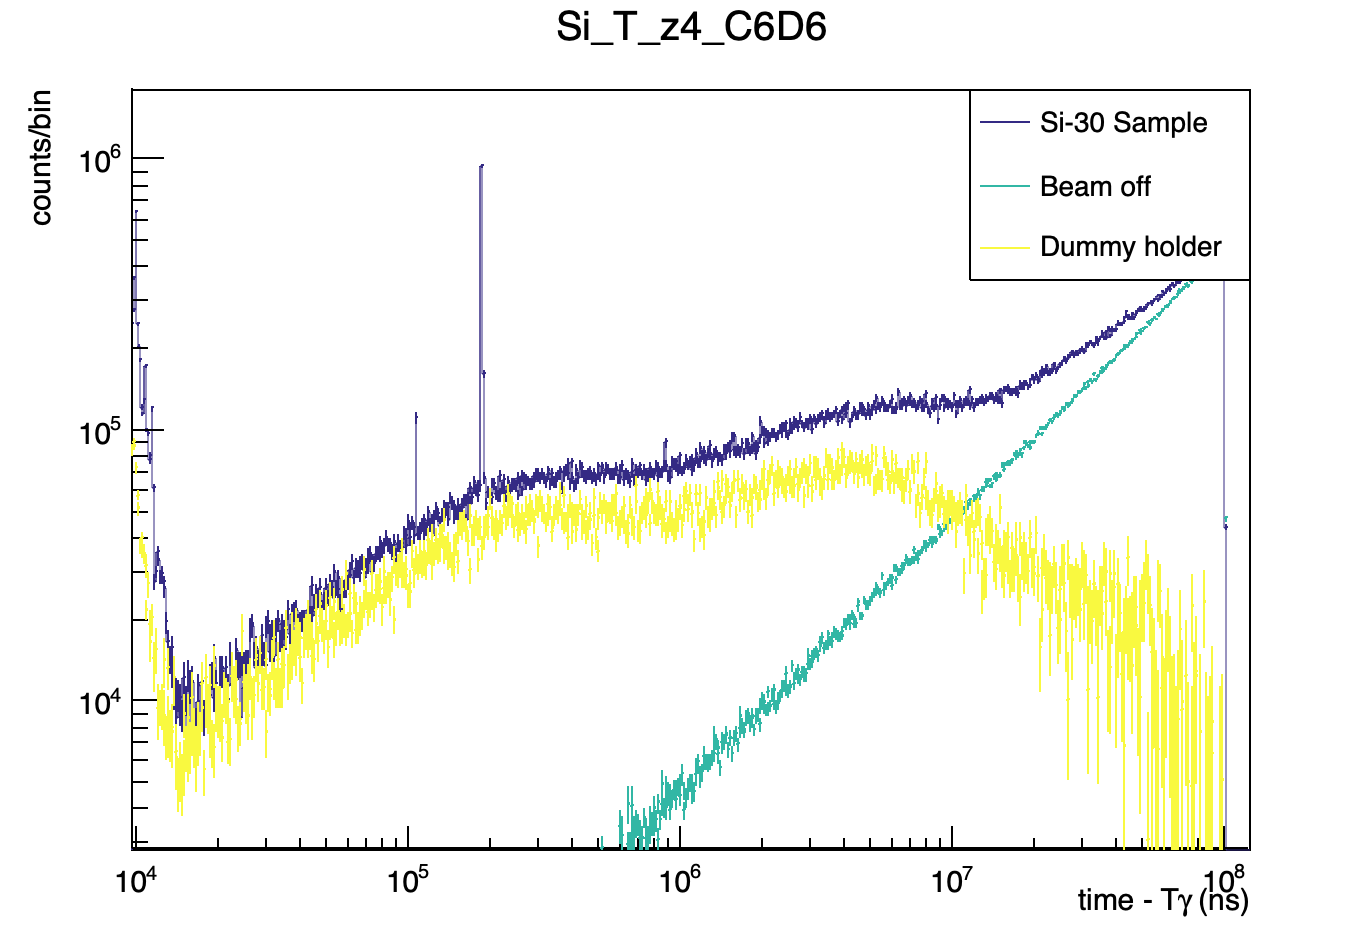
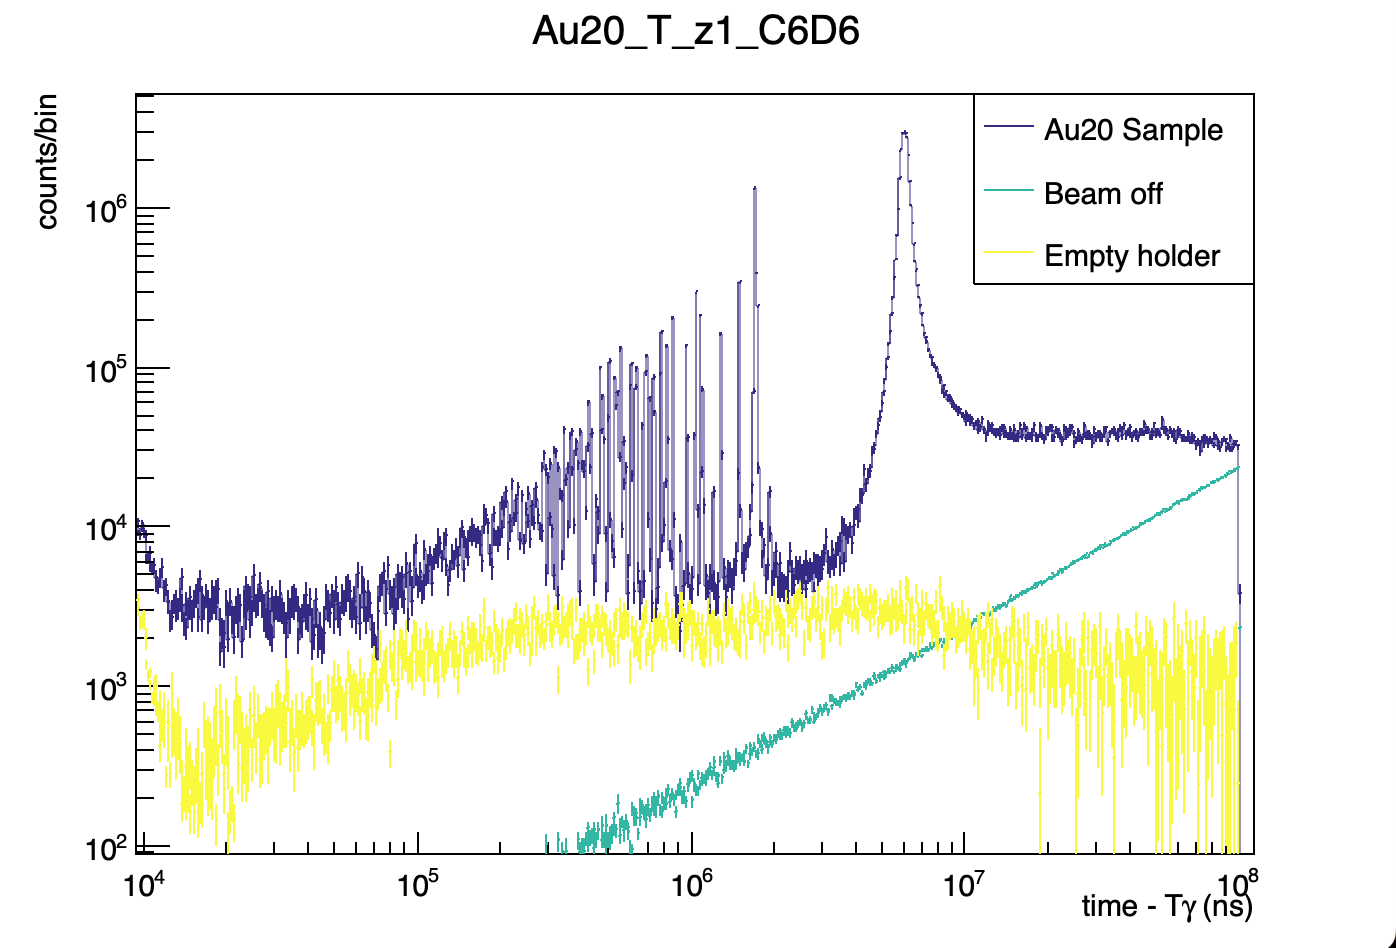
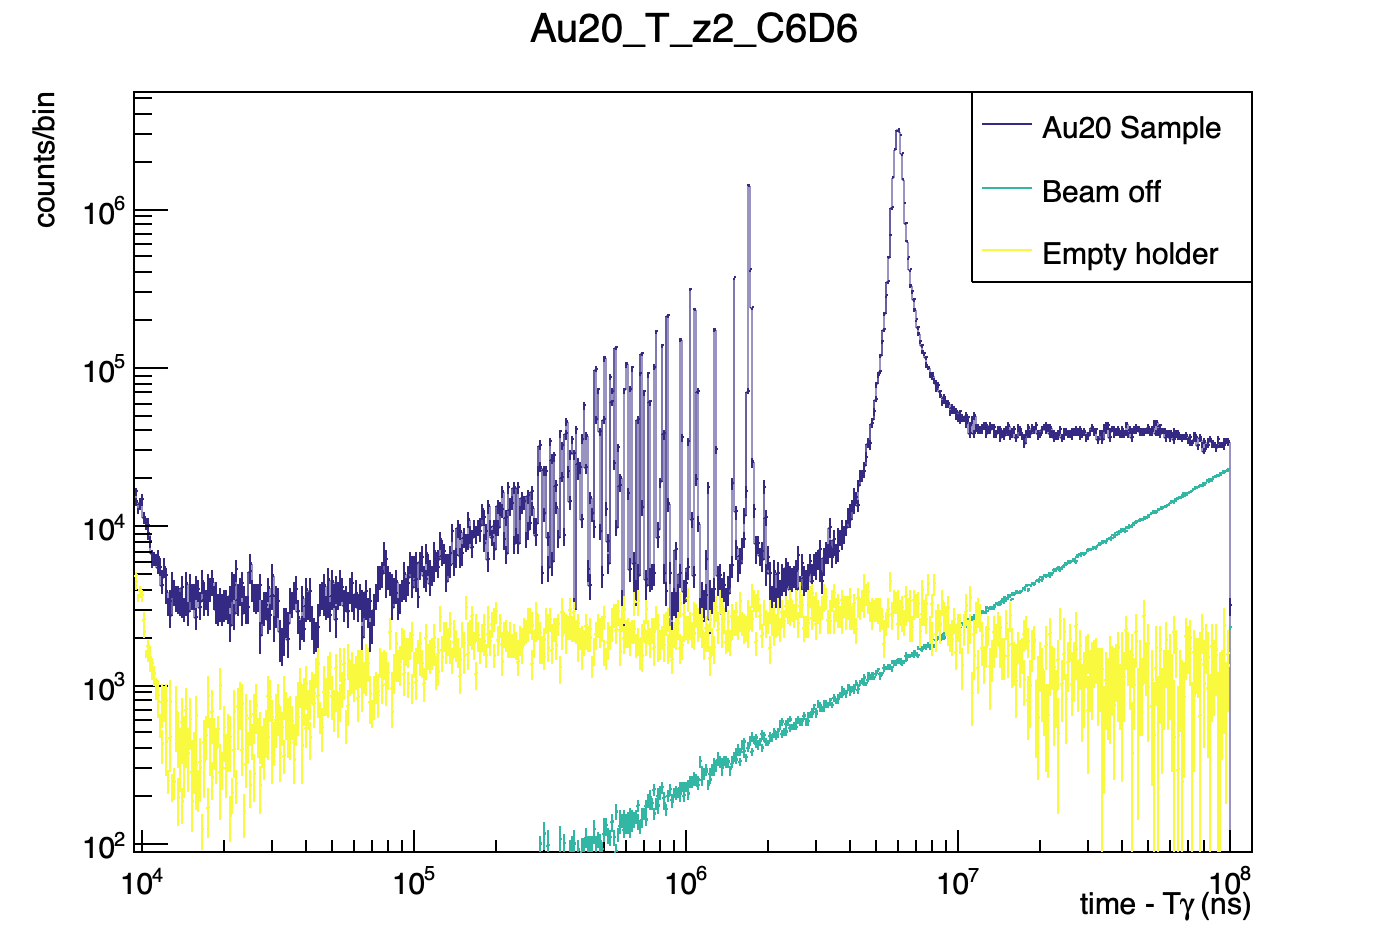
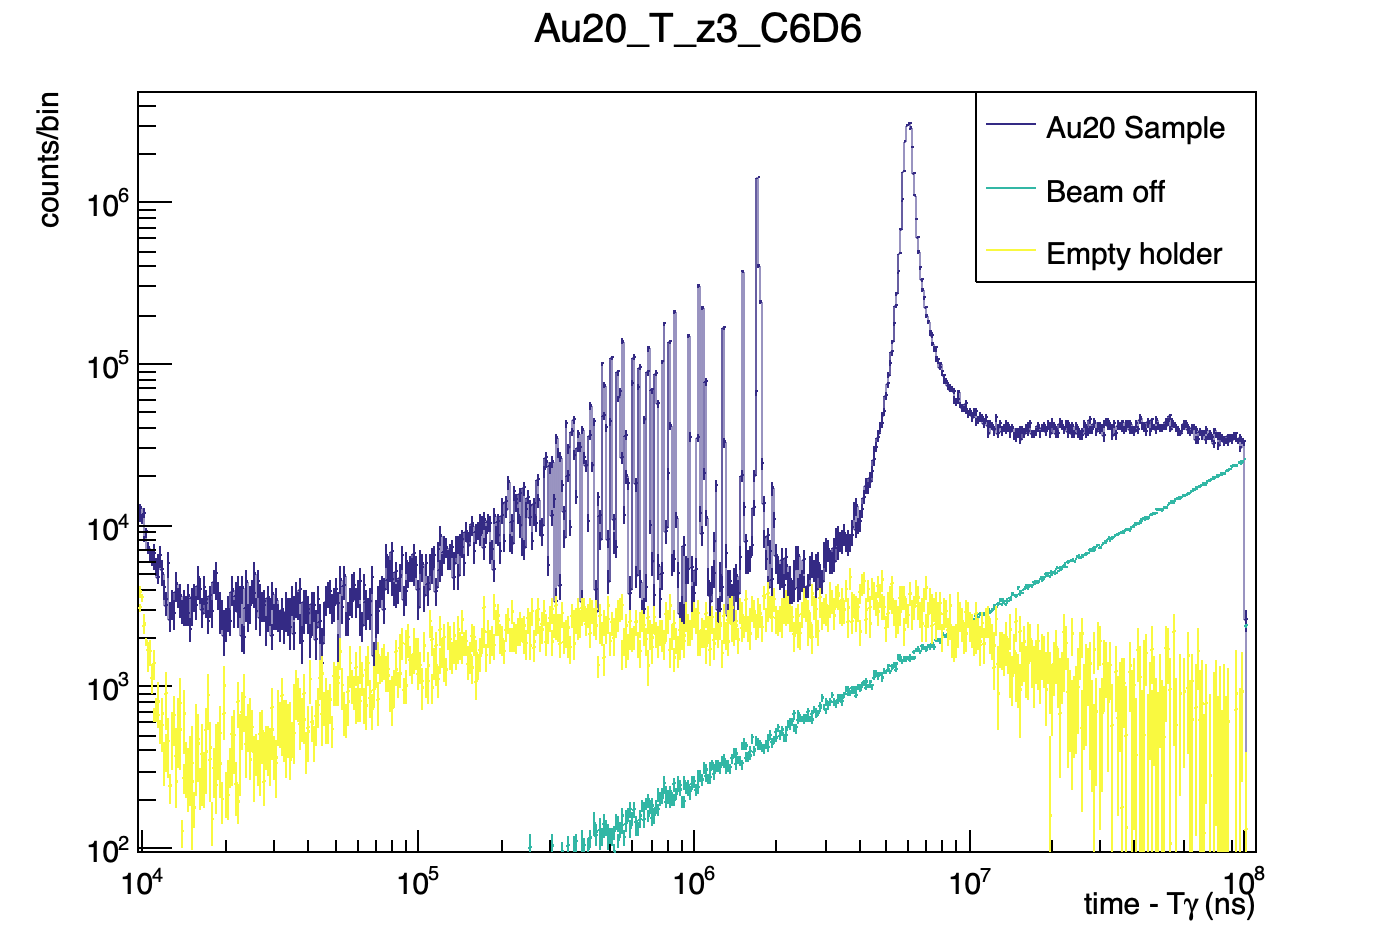
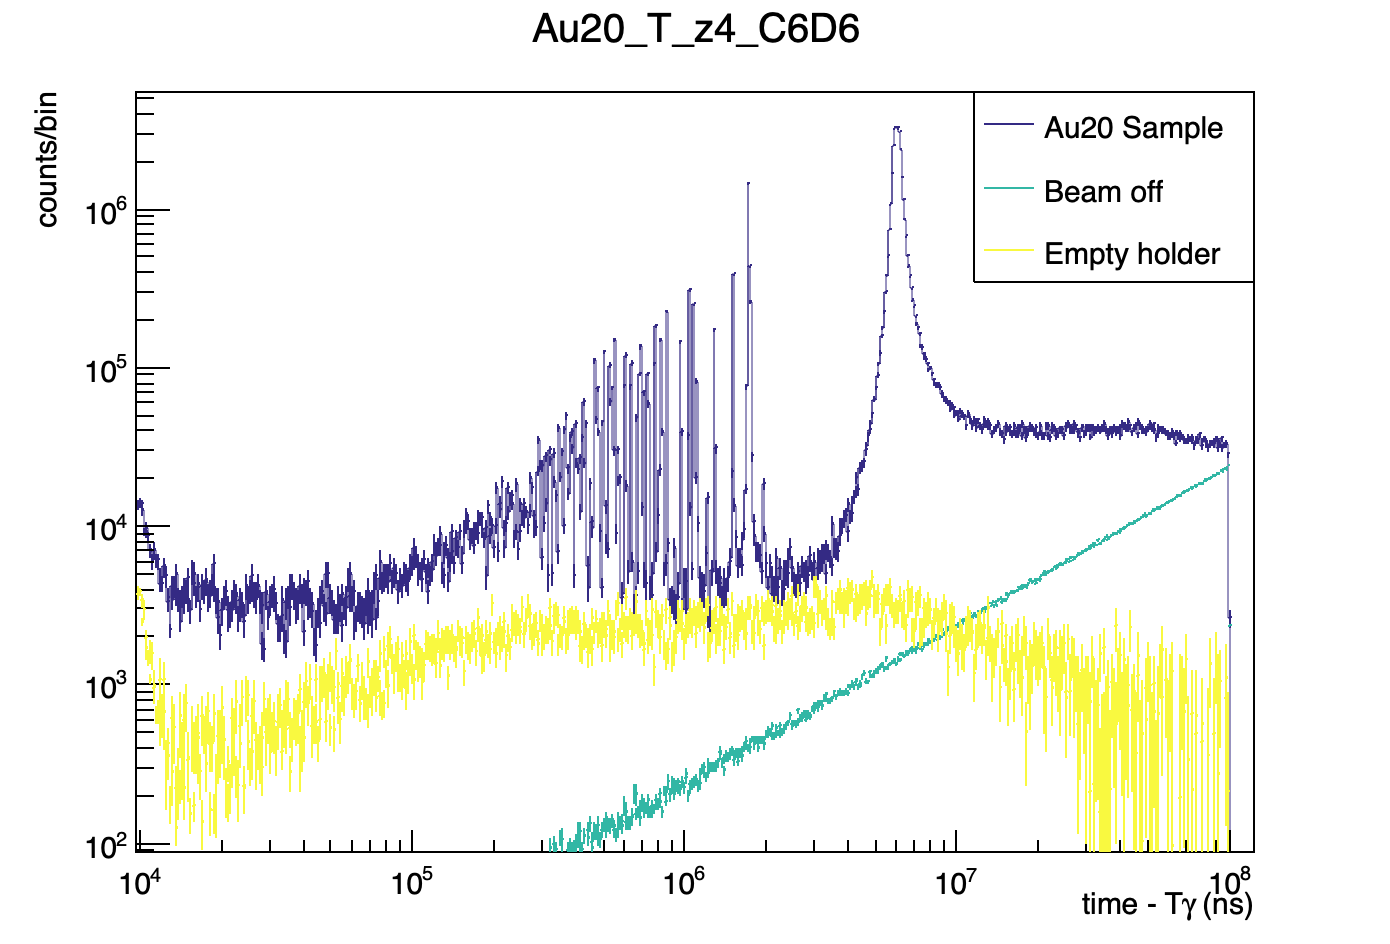
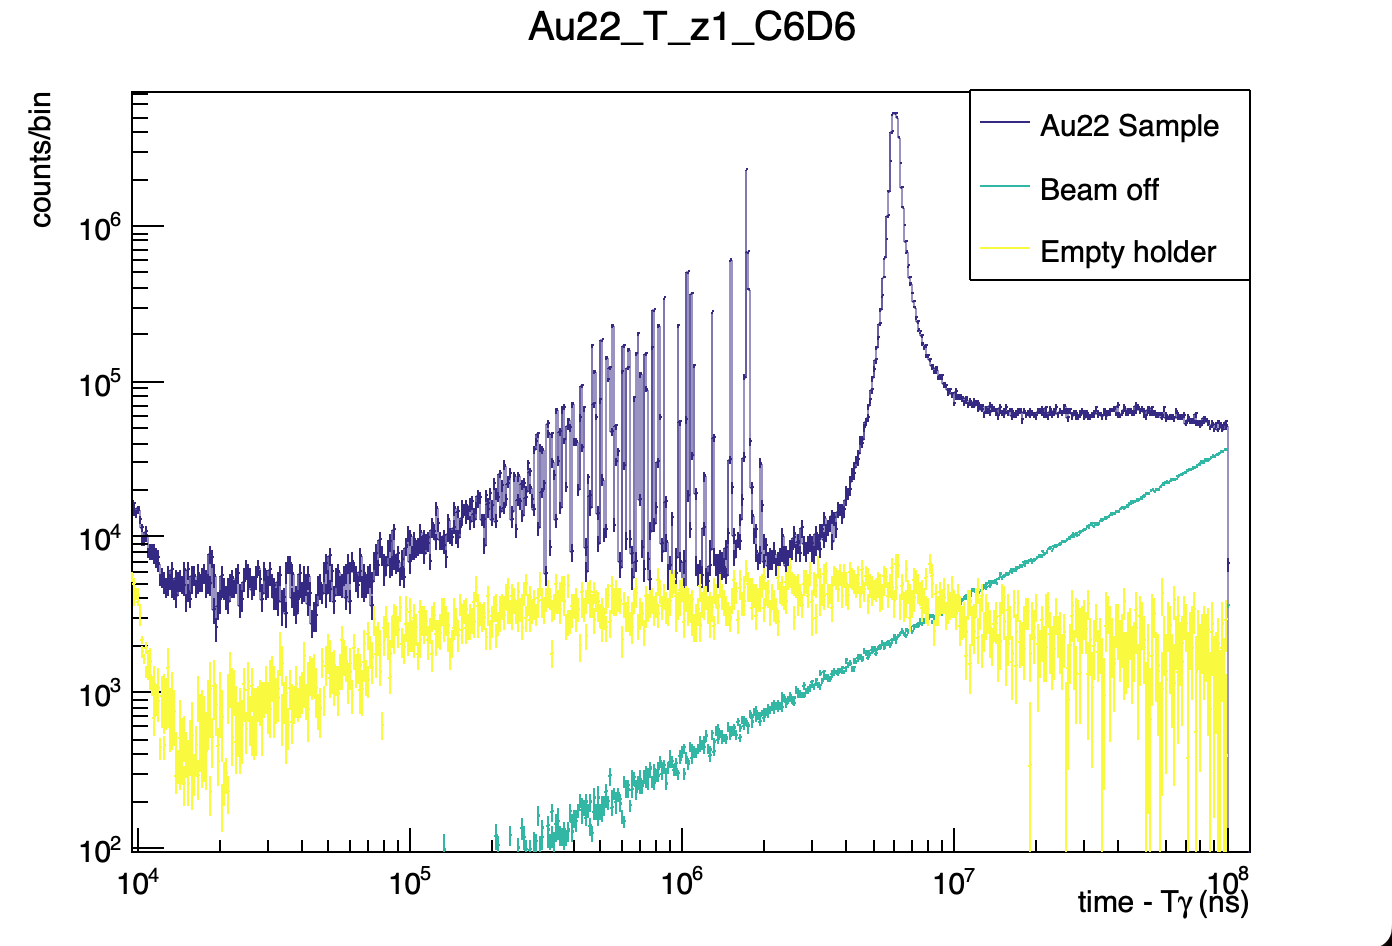
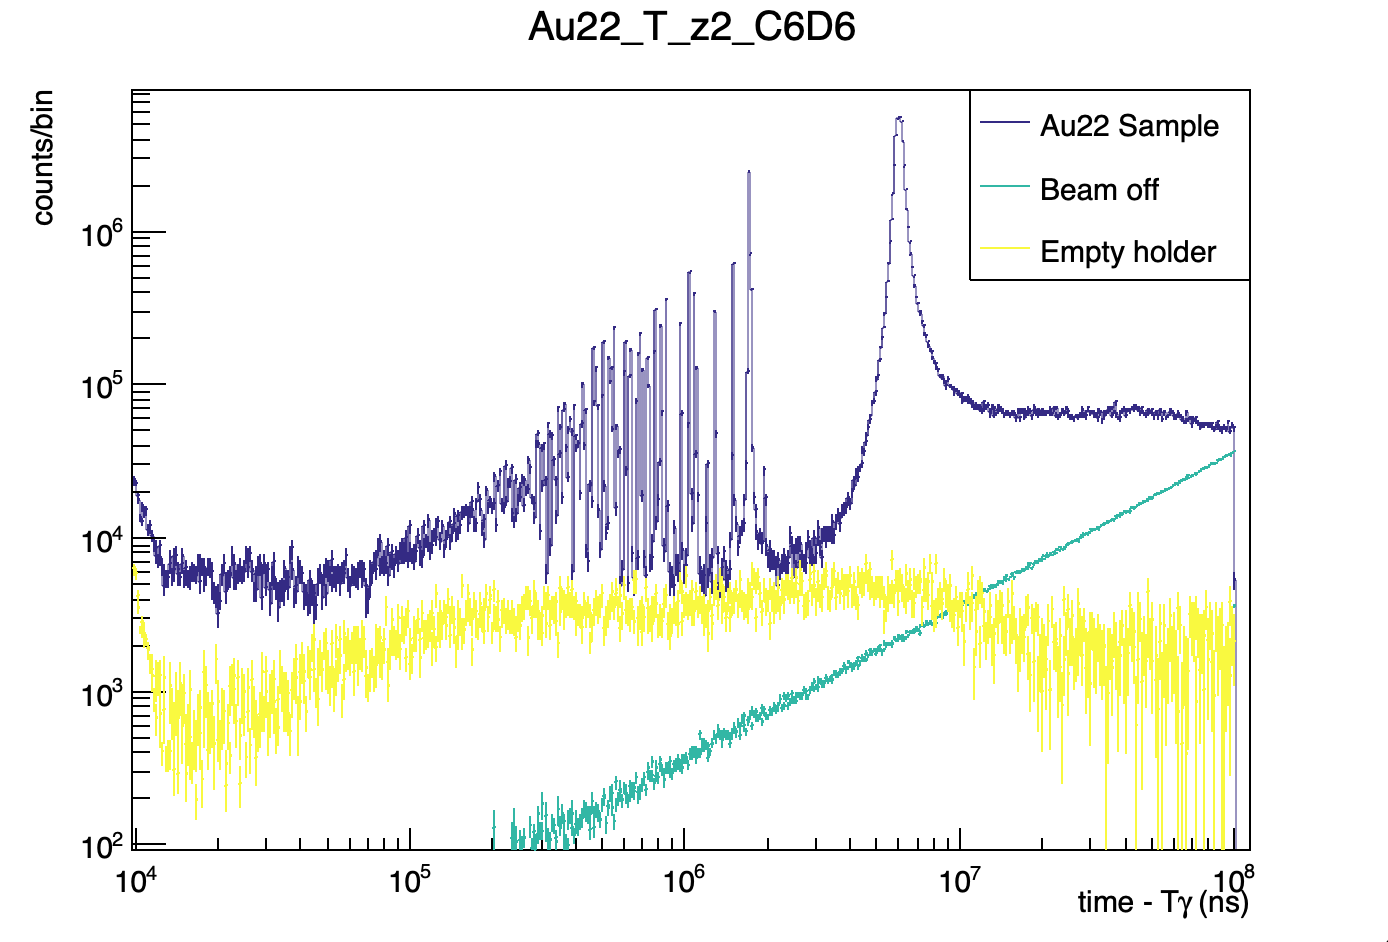
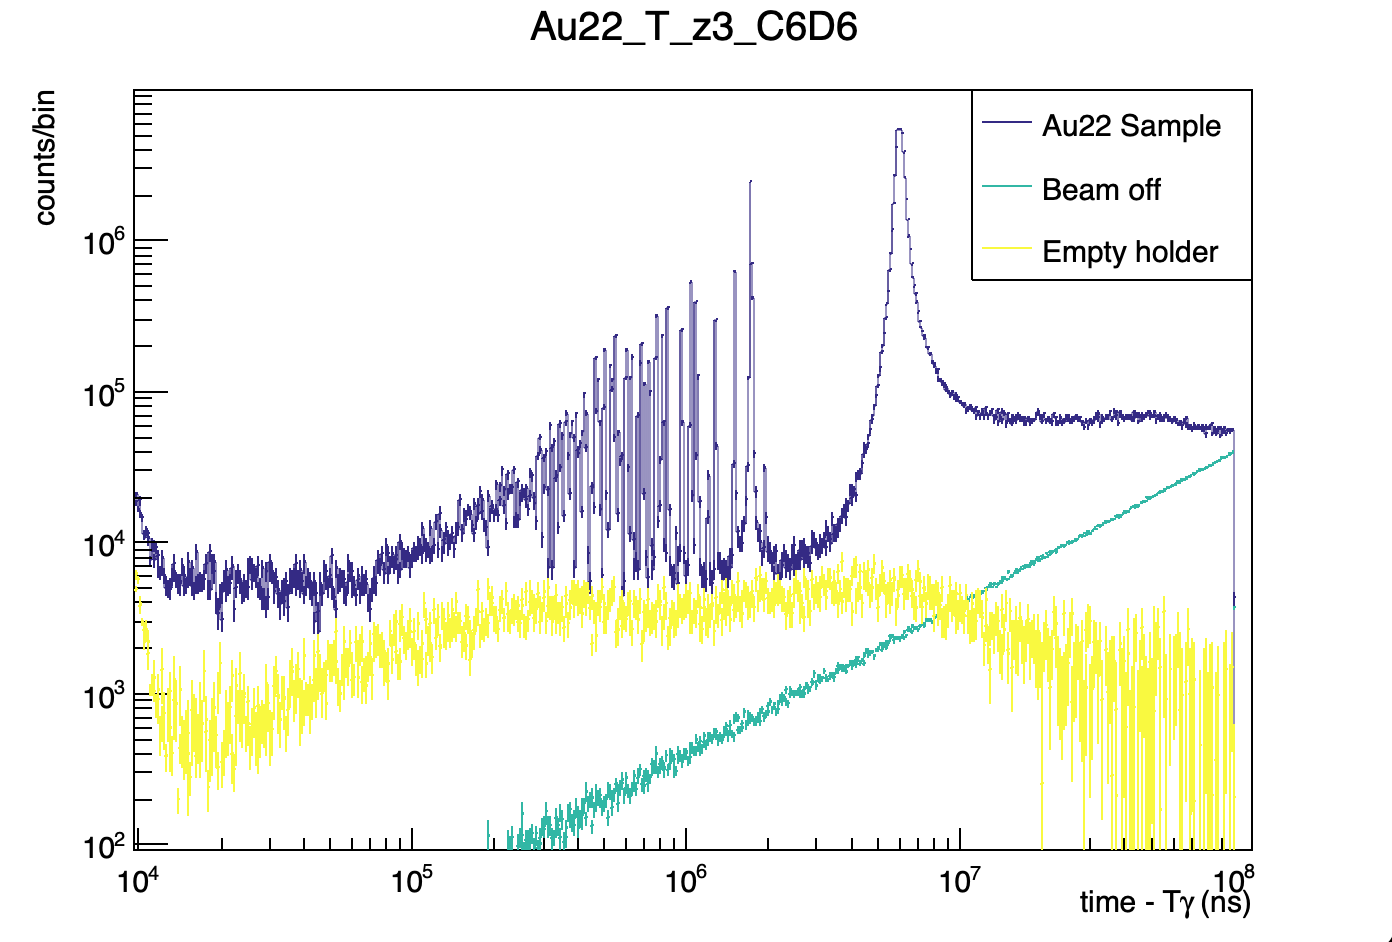
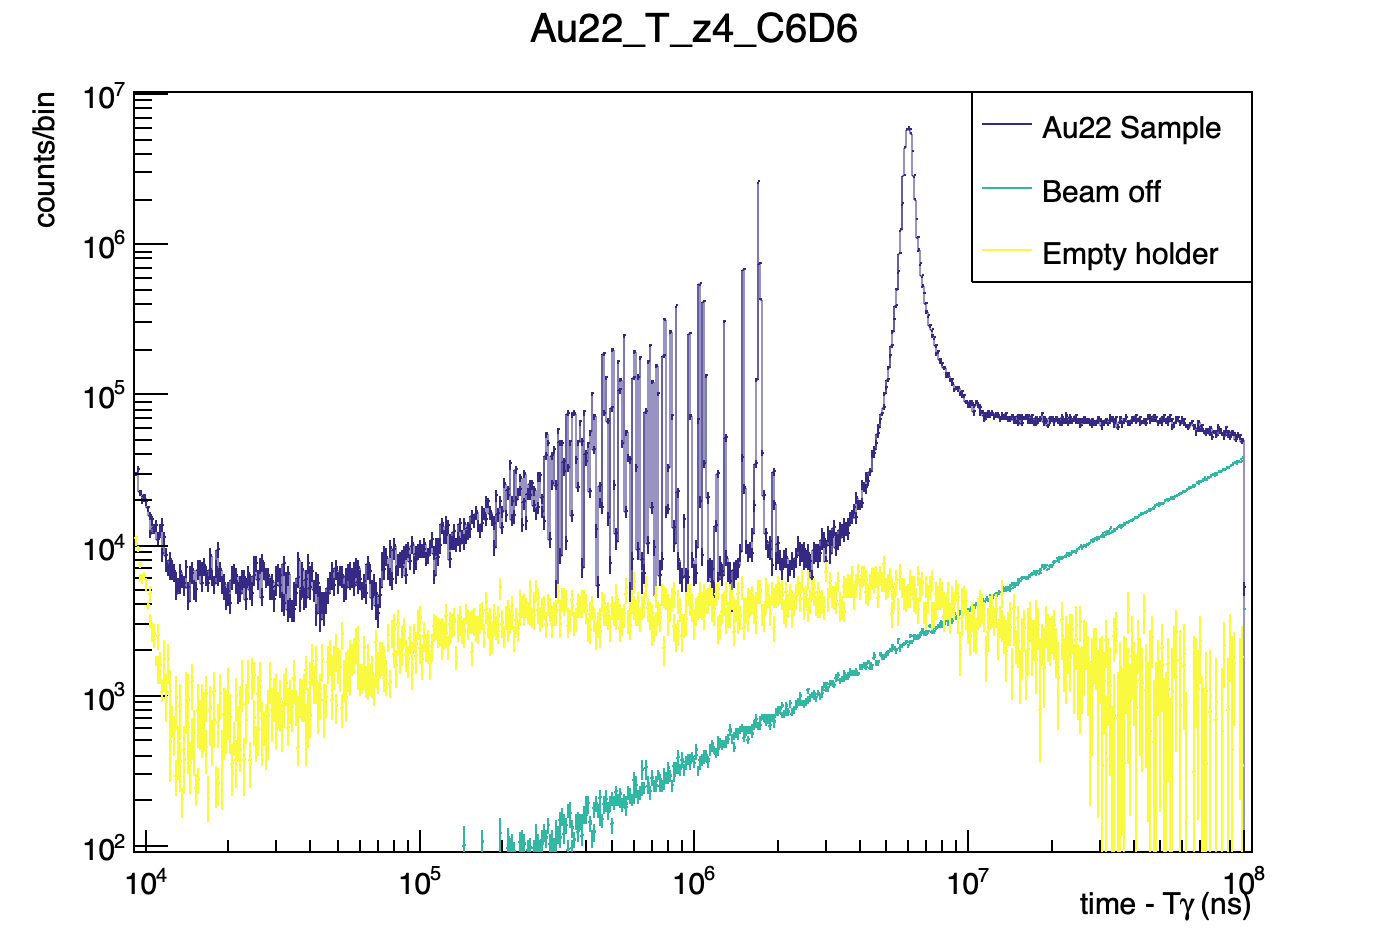
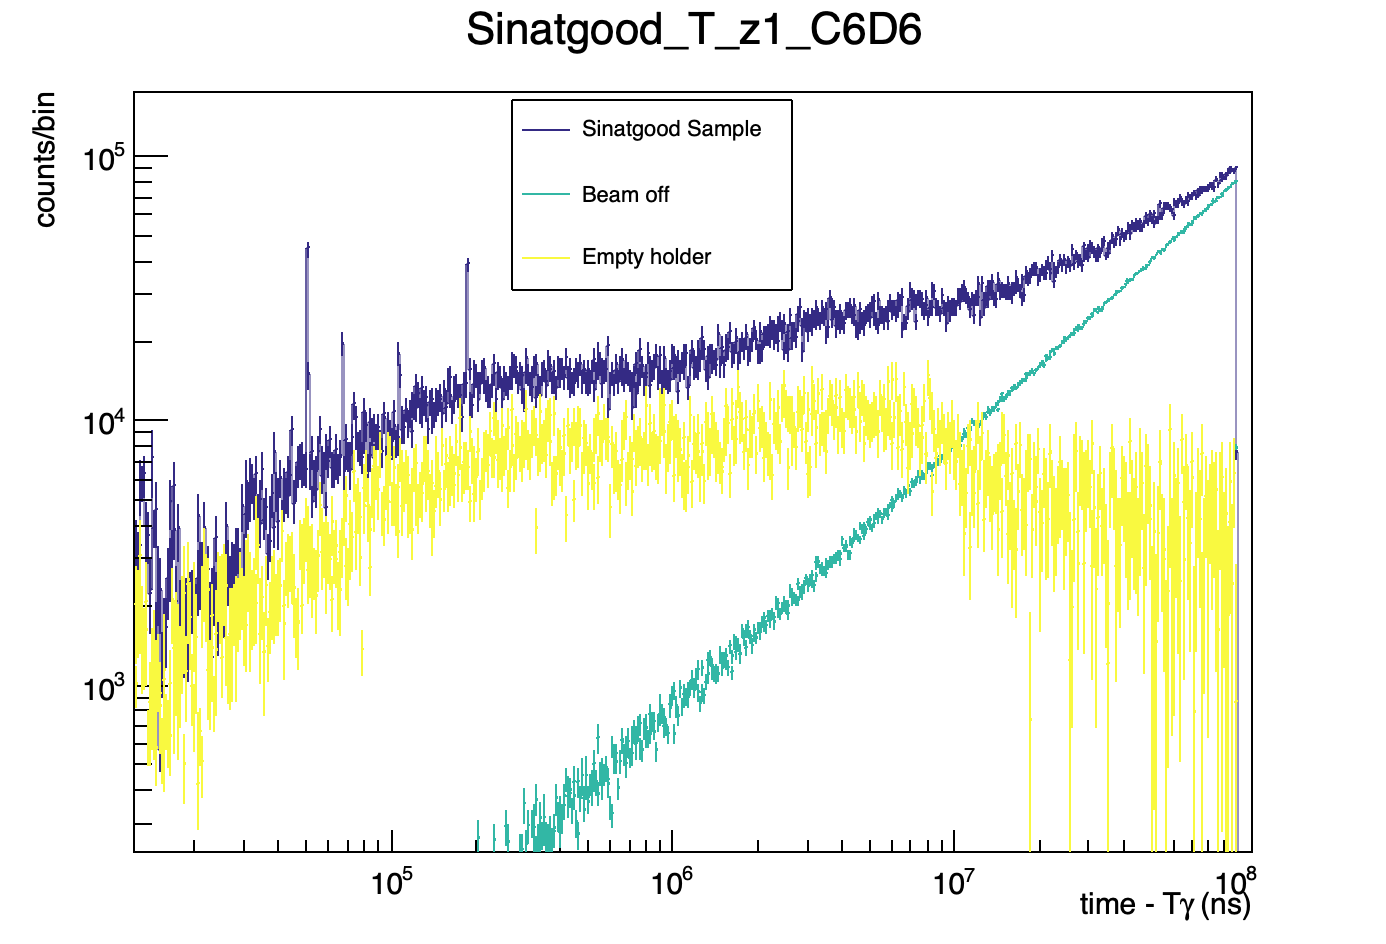
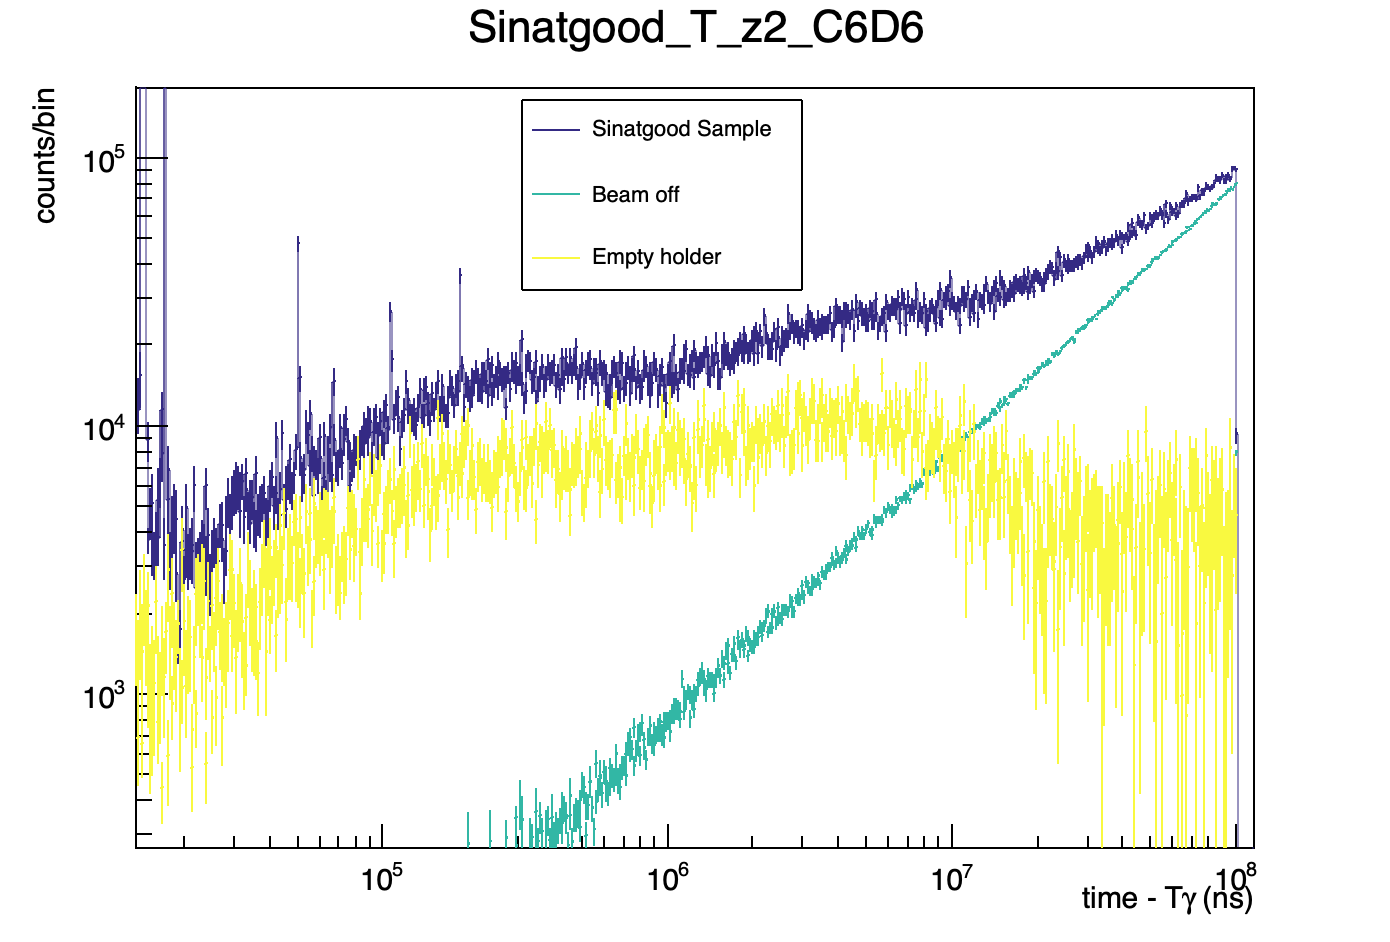
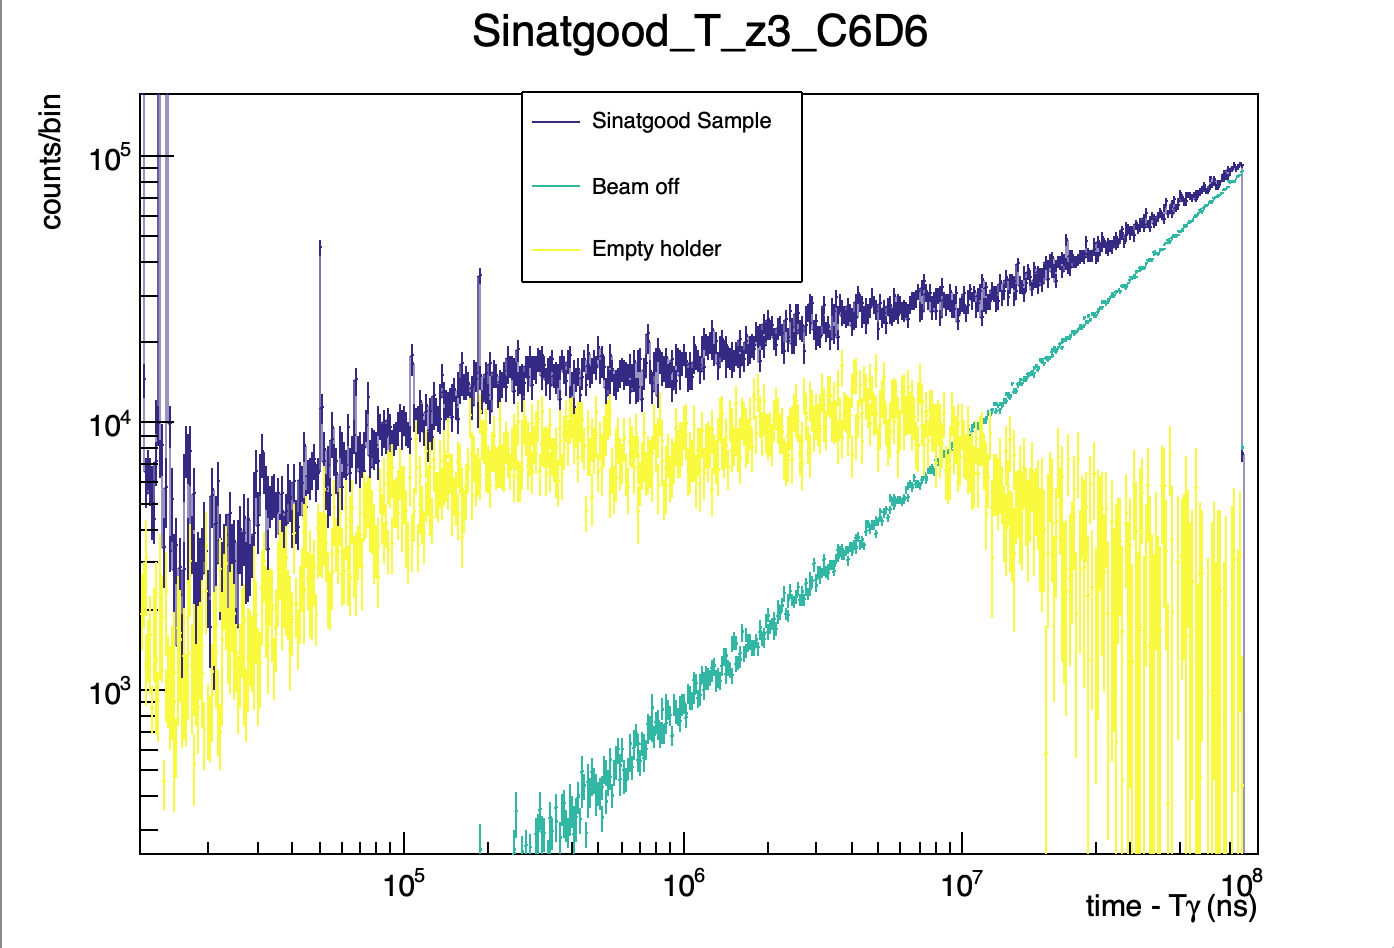
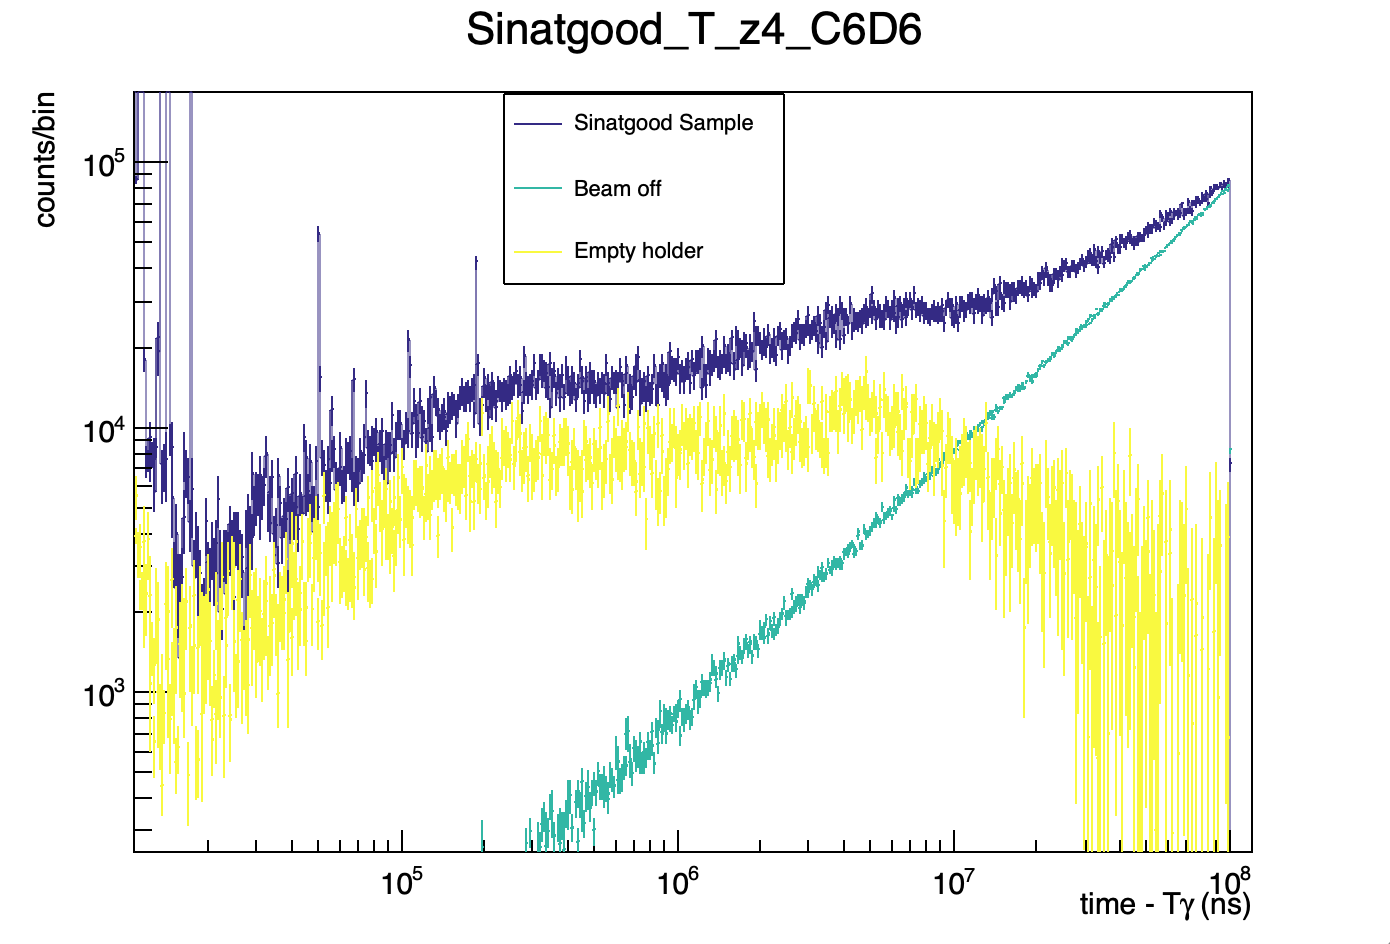
Below are graphs for each sample (weighted) showing the comparison between ambient spectra, empty/dummy holder and sample spectra.
All four detectors are shown for each sample (Si-30, Au20, Au22, Sinatgood).
All histograms have been rebinned by 50. |
| Attachment 1: Si-30_Background_comp_1.png
|
|
| Attachment 2: Si-30_Background_comp_2.png
|
|
| Attachment 3: Si-30_Background_comp_3.png
|
|
| Attachment 4: Si-30_Background_comp_4.png
|
|
| Attachment 5: Au20_Background_comp_1.png
|
|
| Attachment 6: Au20_Background_comp_2.png
|
|
| Attachment 7: Au20_Background_comp_3.png
|
|
| Attachment 8: Au20_Background_comp_4.png
|
|
| Attachment 9: Au22_Background_comp_1.png
|
|
| Attachment 10: Au22_Background_comp_2.png
|
|
| Attachment 11: Au22_Background_comp_3.png
|
|
| Attachment 12: Au22_Background_comp_4.png
|
|
| Attachment 13: Sinatgood_Background_comp_1.png
|
|
| Attachment 14: Sinatgood_Background_comp_2.png
|
|
| Attachment 15: Sinatgood_Background_comp_3.png
|
|
| Attachment 16: Sinatgood_Background_comp_4.png
|
|
|
31
|
Thu Jul 13 12:27:44 2023 |
Michael Donnachie, CLW | Calibration Parameters |
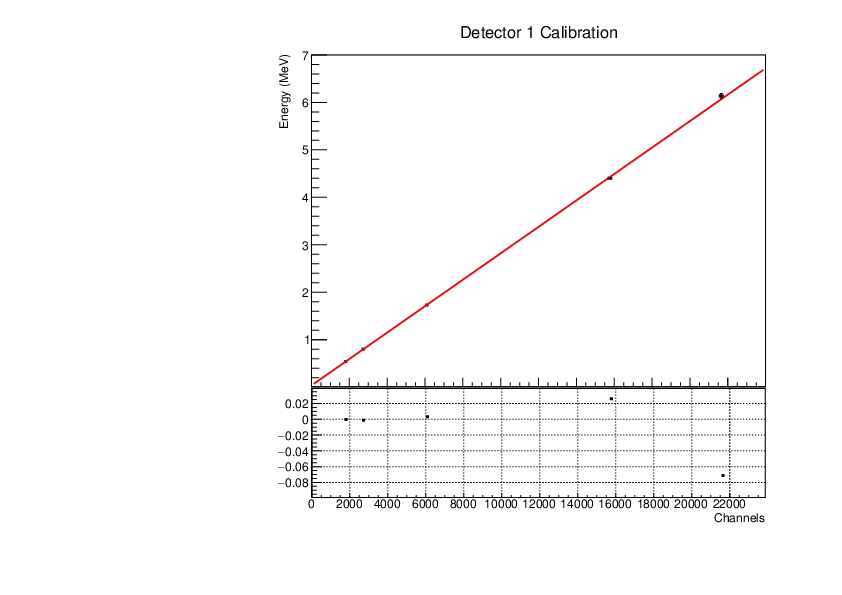
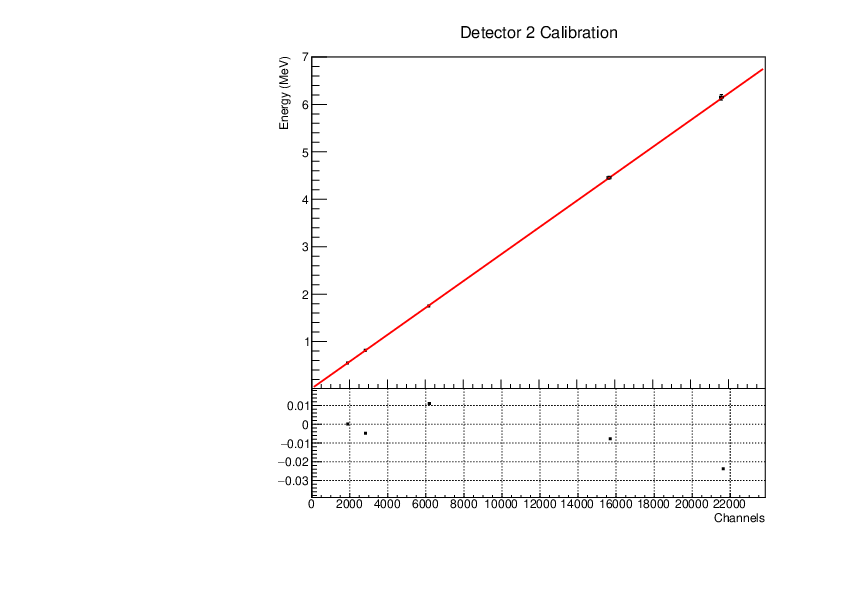
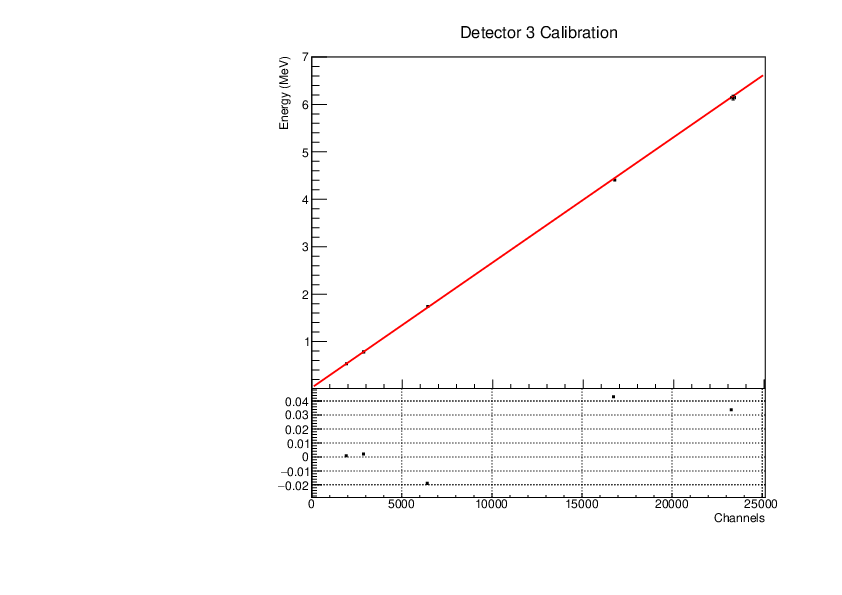
Calibration parameters for each detector:
| detector |
y-intercept (value) |
y-intercept (error) |
gradient (value) |
gradient (error) |
| 1 |
|
|
|
1.56343E-06 |
| 2 |
|
|
|
1.96751E-06 |
| 3 |
|
|
|
1.33883E-06 |
| 4 |
|
|
|
1.22941E-06 |
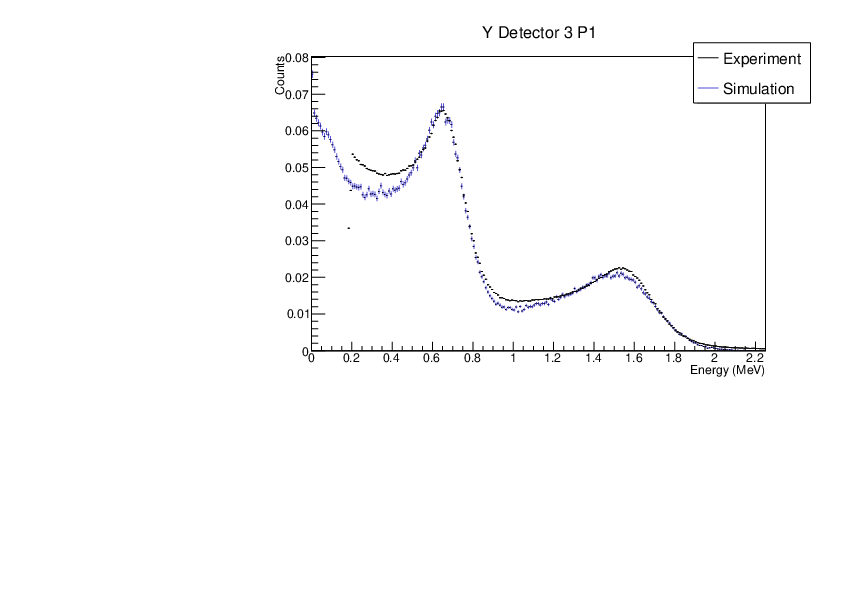
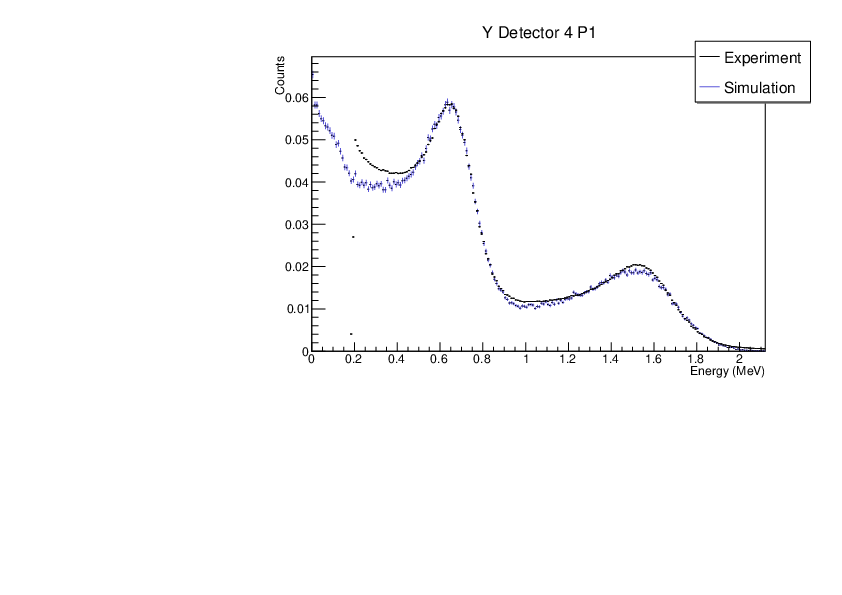
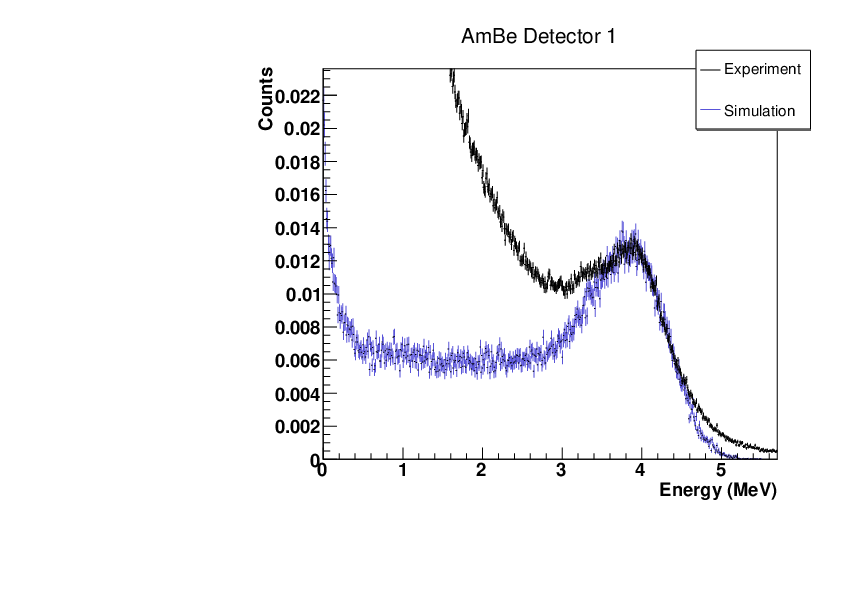
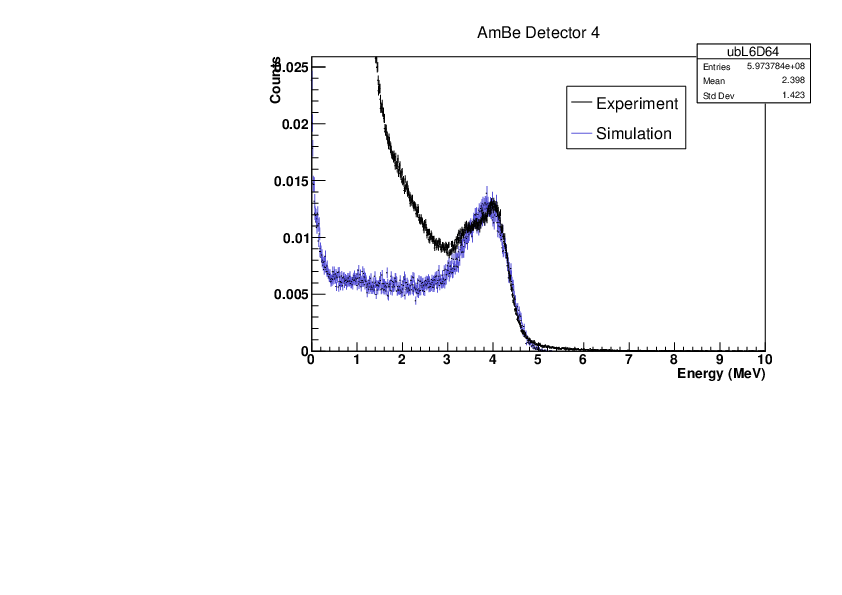
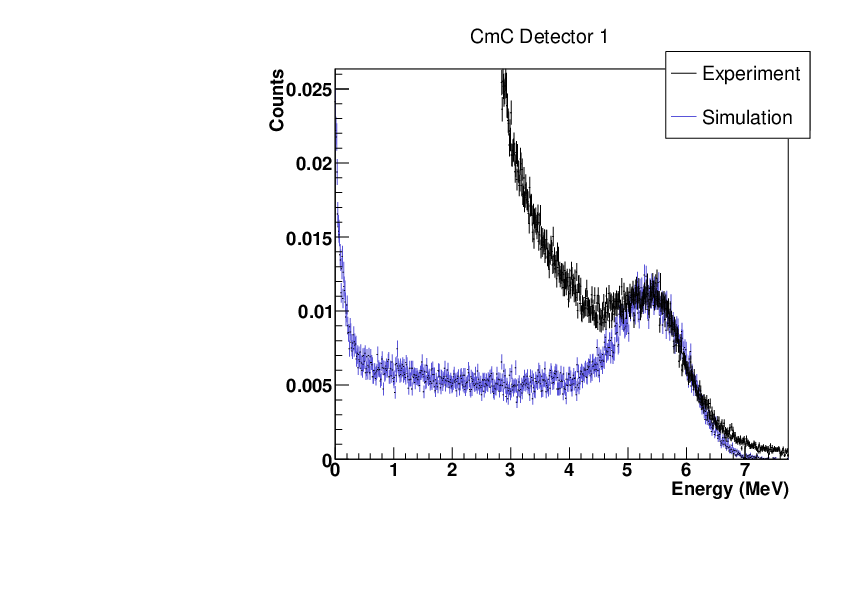
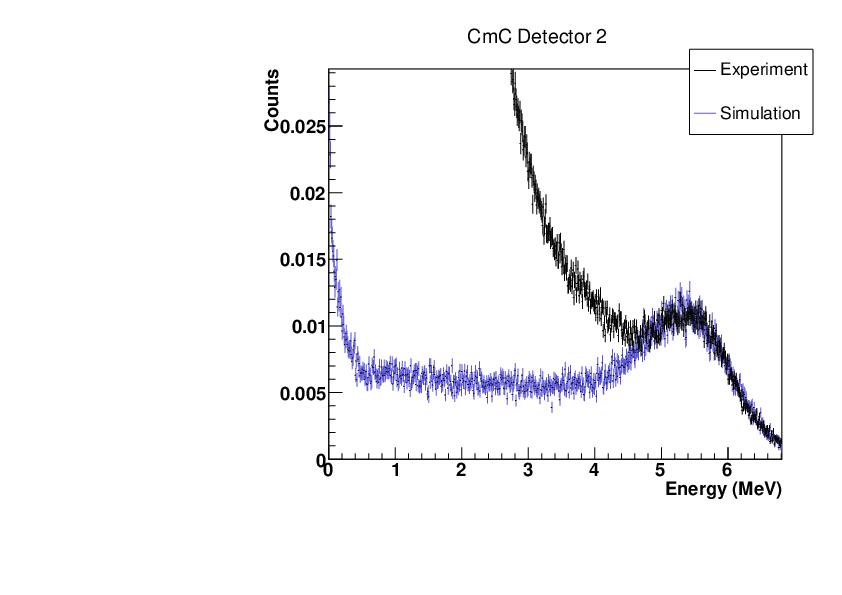
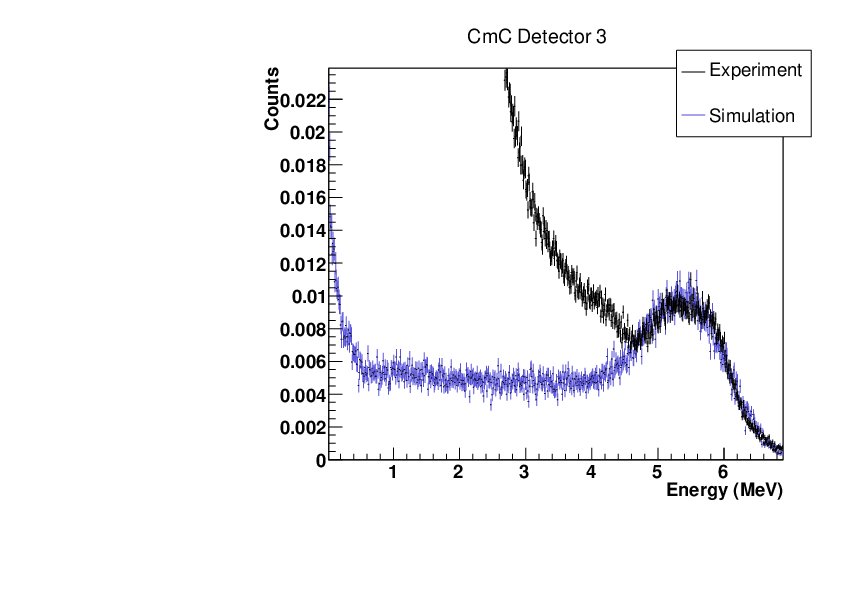
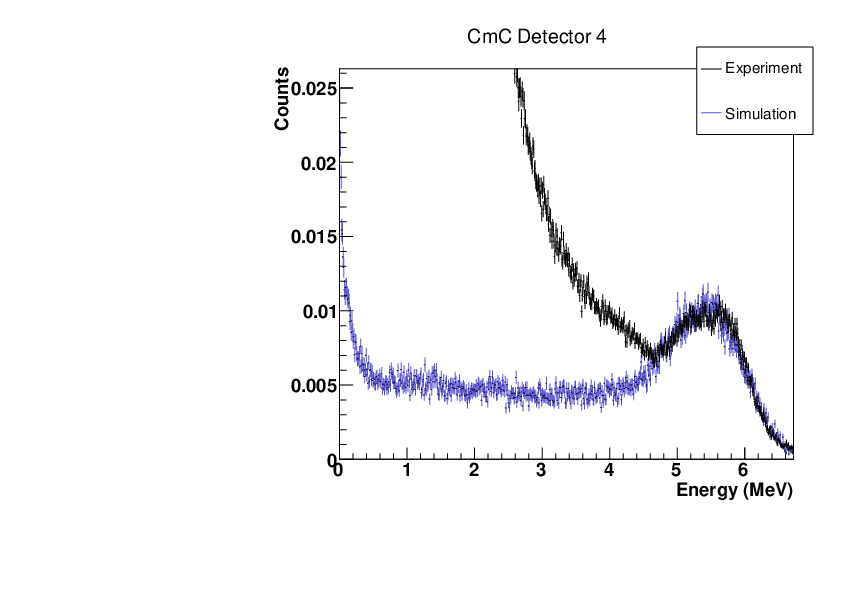
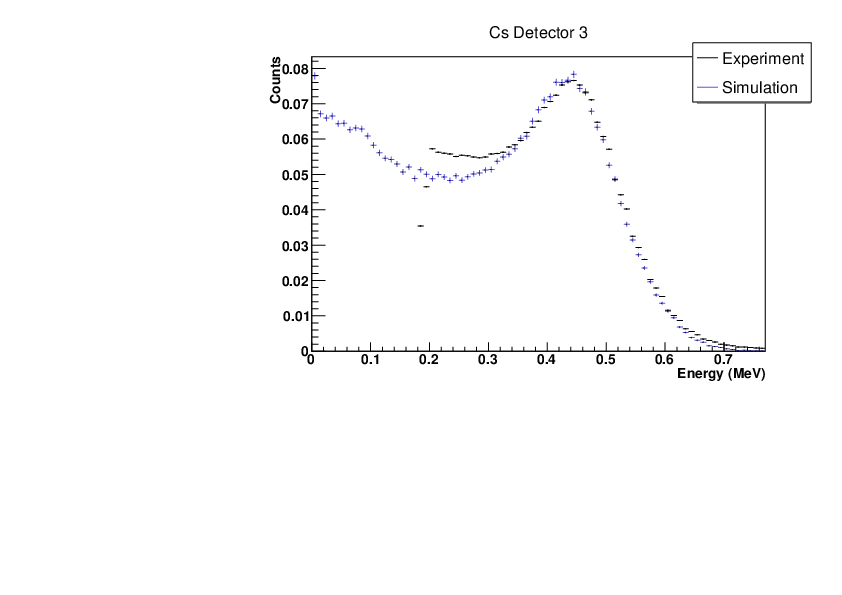
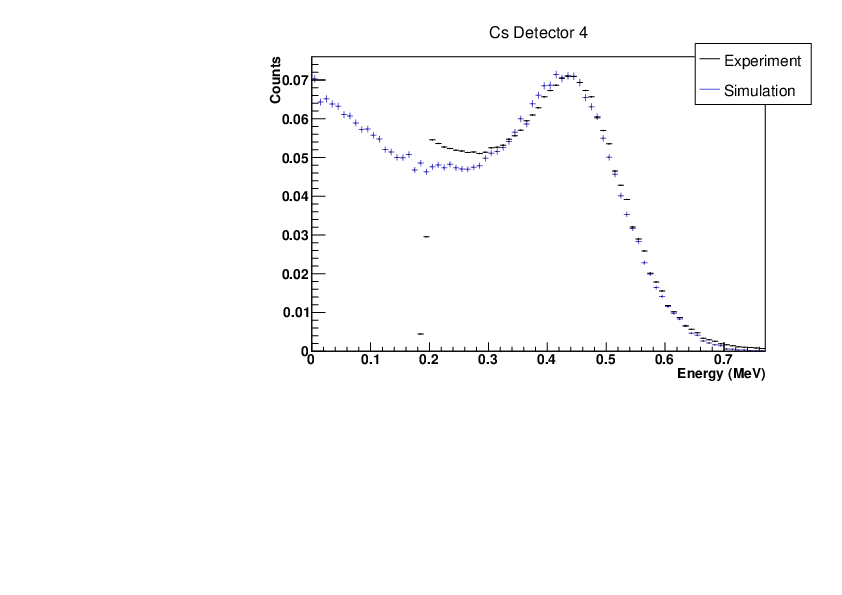
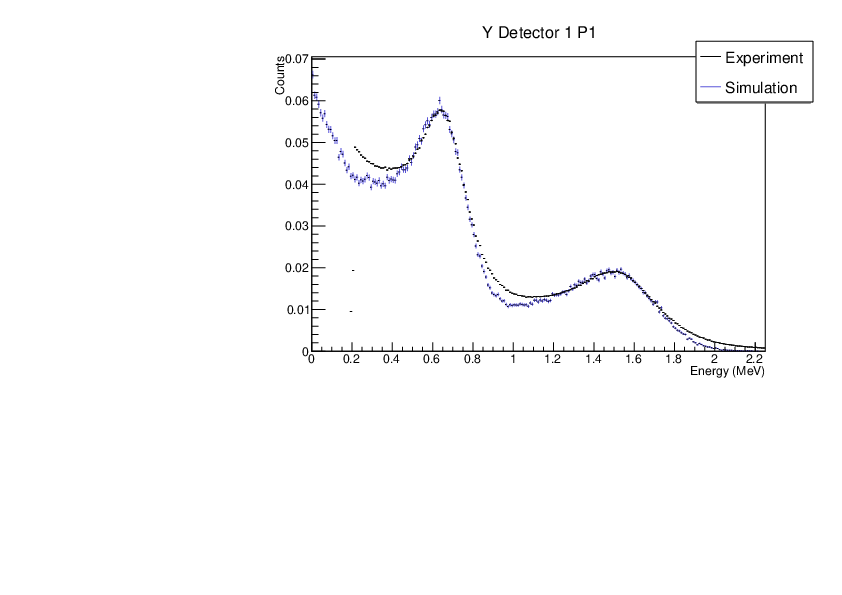
A linear function was fitted to the reference point channel (from experimental histogram) and reference point energy (from simulation histogram). The reference point 'r' was r=mean+(FWHM/2) for a gaussian fitted to each compton edge.
The comparrisons between the calibrated experimental and simulation histograms has been attached. P1 (left) and P2 (right) on the Y88 hisograms indicate whether the histograms were scaled with respect to the leftmost or rightmost compton edge (only to allow easier comparrison).
Broadening parameters applied to the simulations
float a1 = 0.004947965;
float b1 = 0.005227974;
float a2 = 0.007163802;
float b2 = 0.007549987;
float a3 = 0.001256462;
float b3 = 0.006410511;
float a4 = 0.003907402;
float b4 = 0.004033837;
sigma= sqrt(axE+bxE^2) |
| Attachment 1: det1.pdf
|
|
| Attachment 2: det2.pdf
|
|
| Attachment 3: det3.pdf
|
|
| Attachment 4: det4.pdf
|

|
| Attachment 5: Ydet2p1.pdf
|

|
| Attachment 6: Ydet2p2.pdf
|

|
| Attachment 7: Ydet3p1.pdf
|
|
| Attachment 8: Ydet3p2.pdf
|

|
| Attachment 9: Ydet4p1.pdf
|
|
| Attachment 10: Ydet4p2.pdf
|

|
| Attachment 11: AmBedet1.pdf
|
|
| Attachment 12: AmBedet2.pdf
|

|
| Attachment 13: AmBedet3.pdf
|

|
| Attachment 14: AmBedet4.pdf
|
|
| Attachment 15: CmCdet1.pdf
|
|
| Attachment 16: CmCdet2.pdf
|
|
| Attachment 17: CmCdet3.pdf
|
|
| Attachment 18: CmCdet4.pdf
|
|
| Attachment 19: Csdet1.pdf
|

|
| Attachment 20: Csdet2.pdf
|

|
| Attachment 21: Csdet3.pdf
|
|
| Attachment 22: Csdet4.pdf
|
|
| Attachment 23: Ydet1p1.pdf
|
|
| Attachment 24: Ydet1p2.pdf
|

|
|
25
|
Sat Mar 19 17:29:43 2022 |
Nikolay Sosnin | Al26 Experimental Inventory at n_TOF |
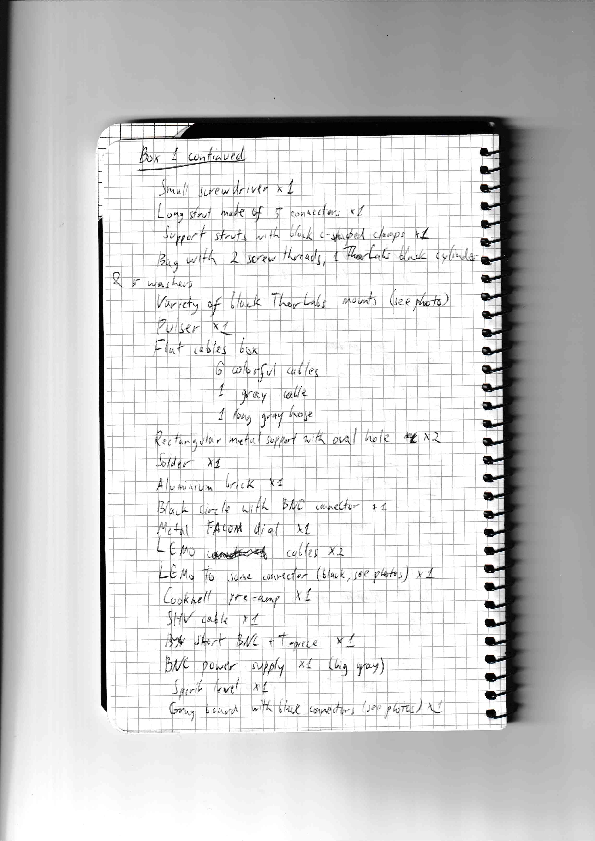
Three aluminium crates contain 26Al(n, alpha) kit from EAR2, and was in the barracks (building 6547) near detector lab by EAR1 entrance. A list is attached and photos can be found on Dropbox:
https://www.dropbox.com/sh/68k1xove2zr1bmj/AADKvN8wR_Ia2EwZMOXZqdMCa?dl=0 |
| Attachment 1: Al26_Inventory.pdf
|


|
|
33
|
Sat Jul 15 07:33:32 2023 |
Nikolay Sosnin | 30Si EAR2 |
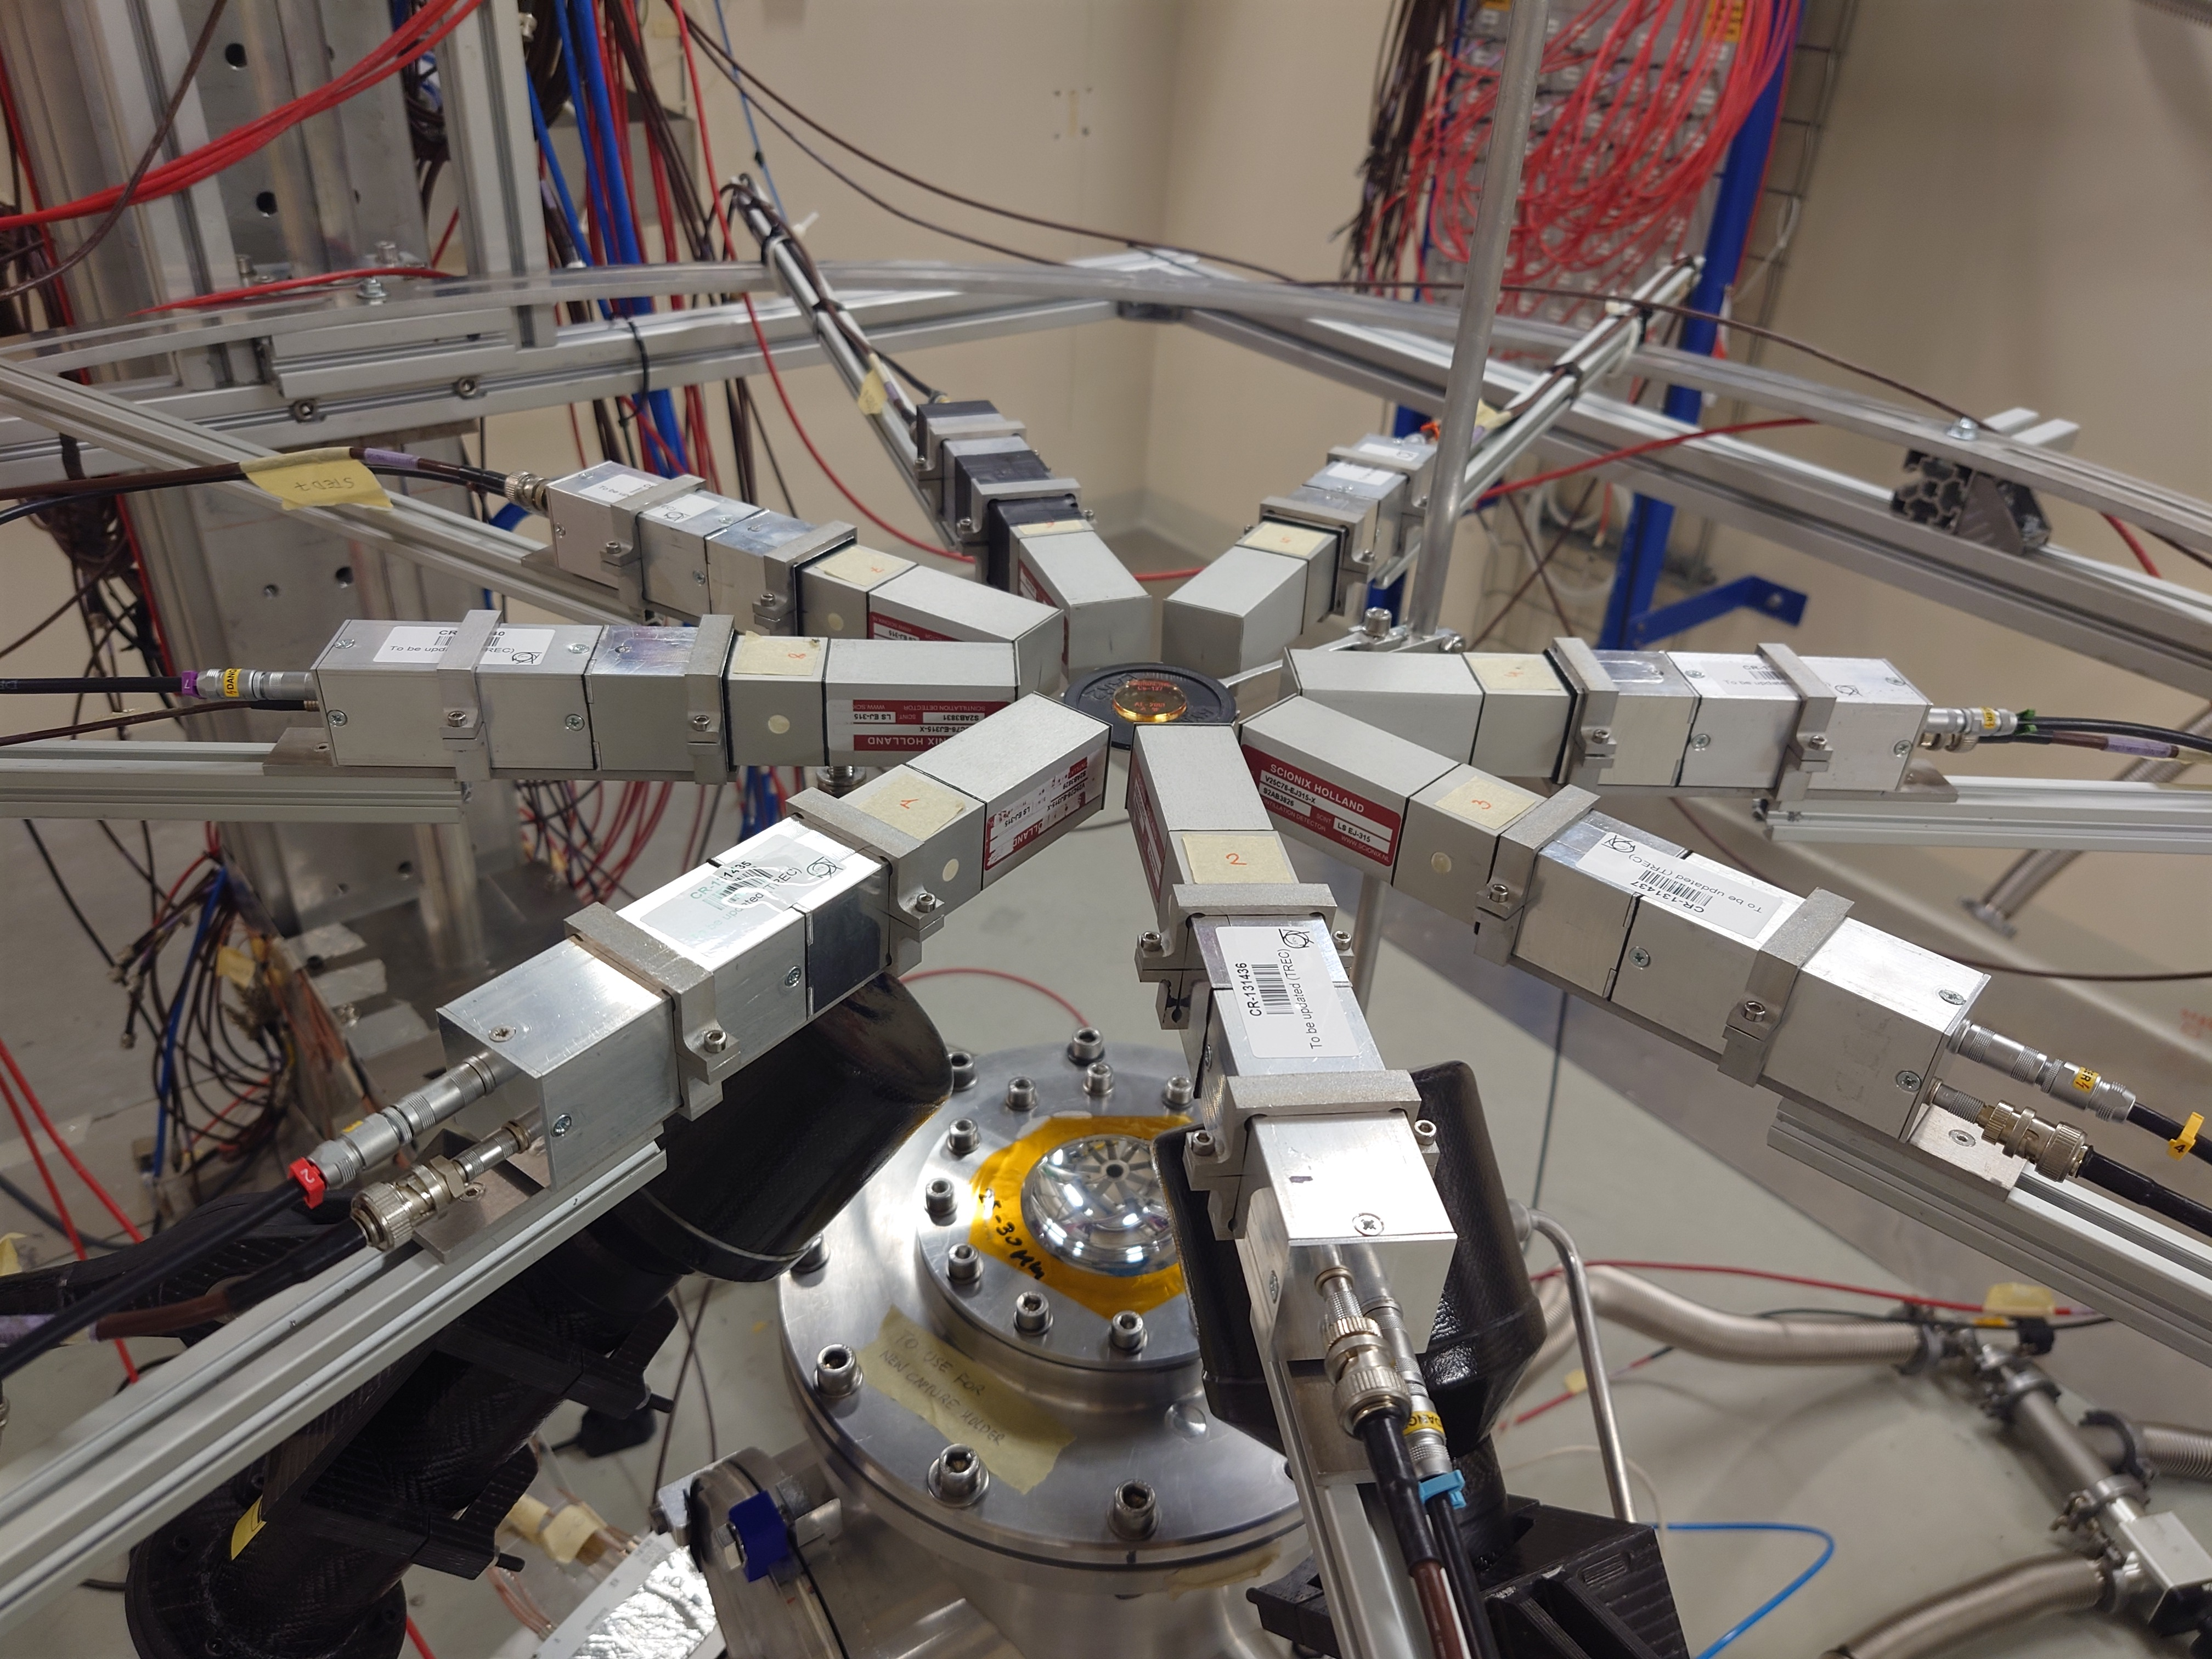
8 sTED + 2 C6D6
C6D6: distance = 14 cm, angle = 135 degrees
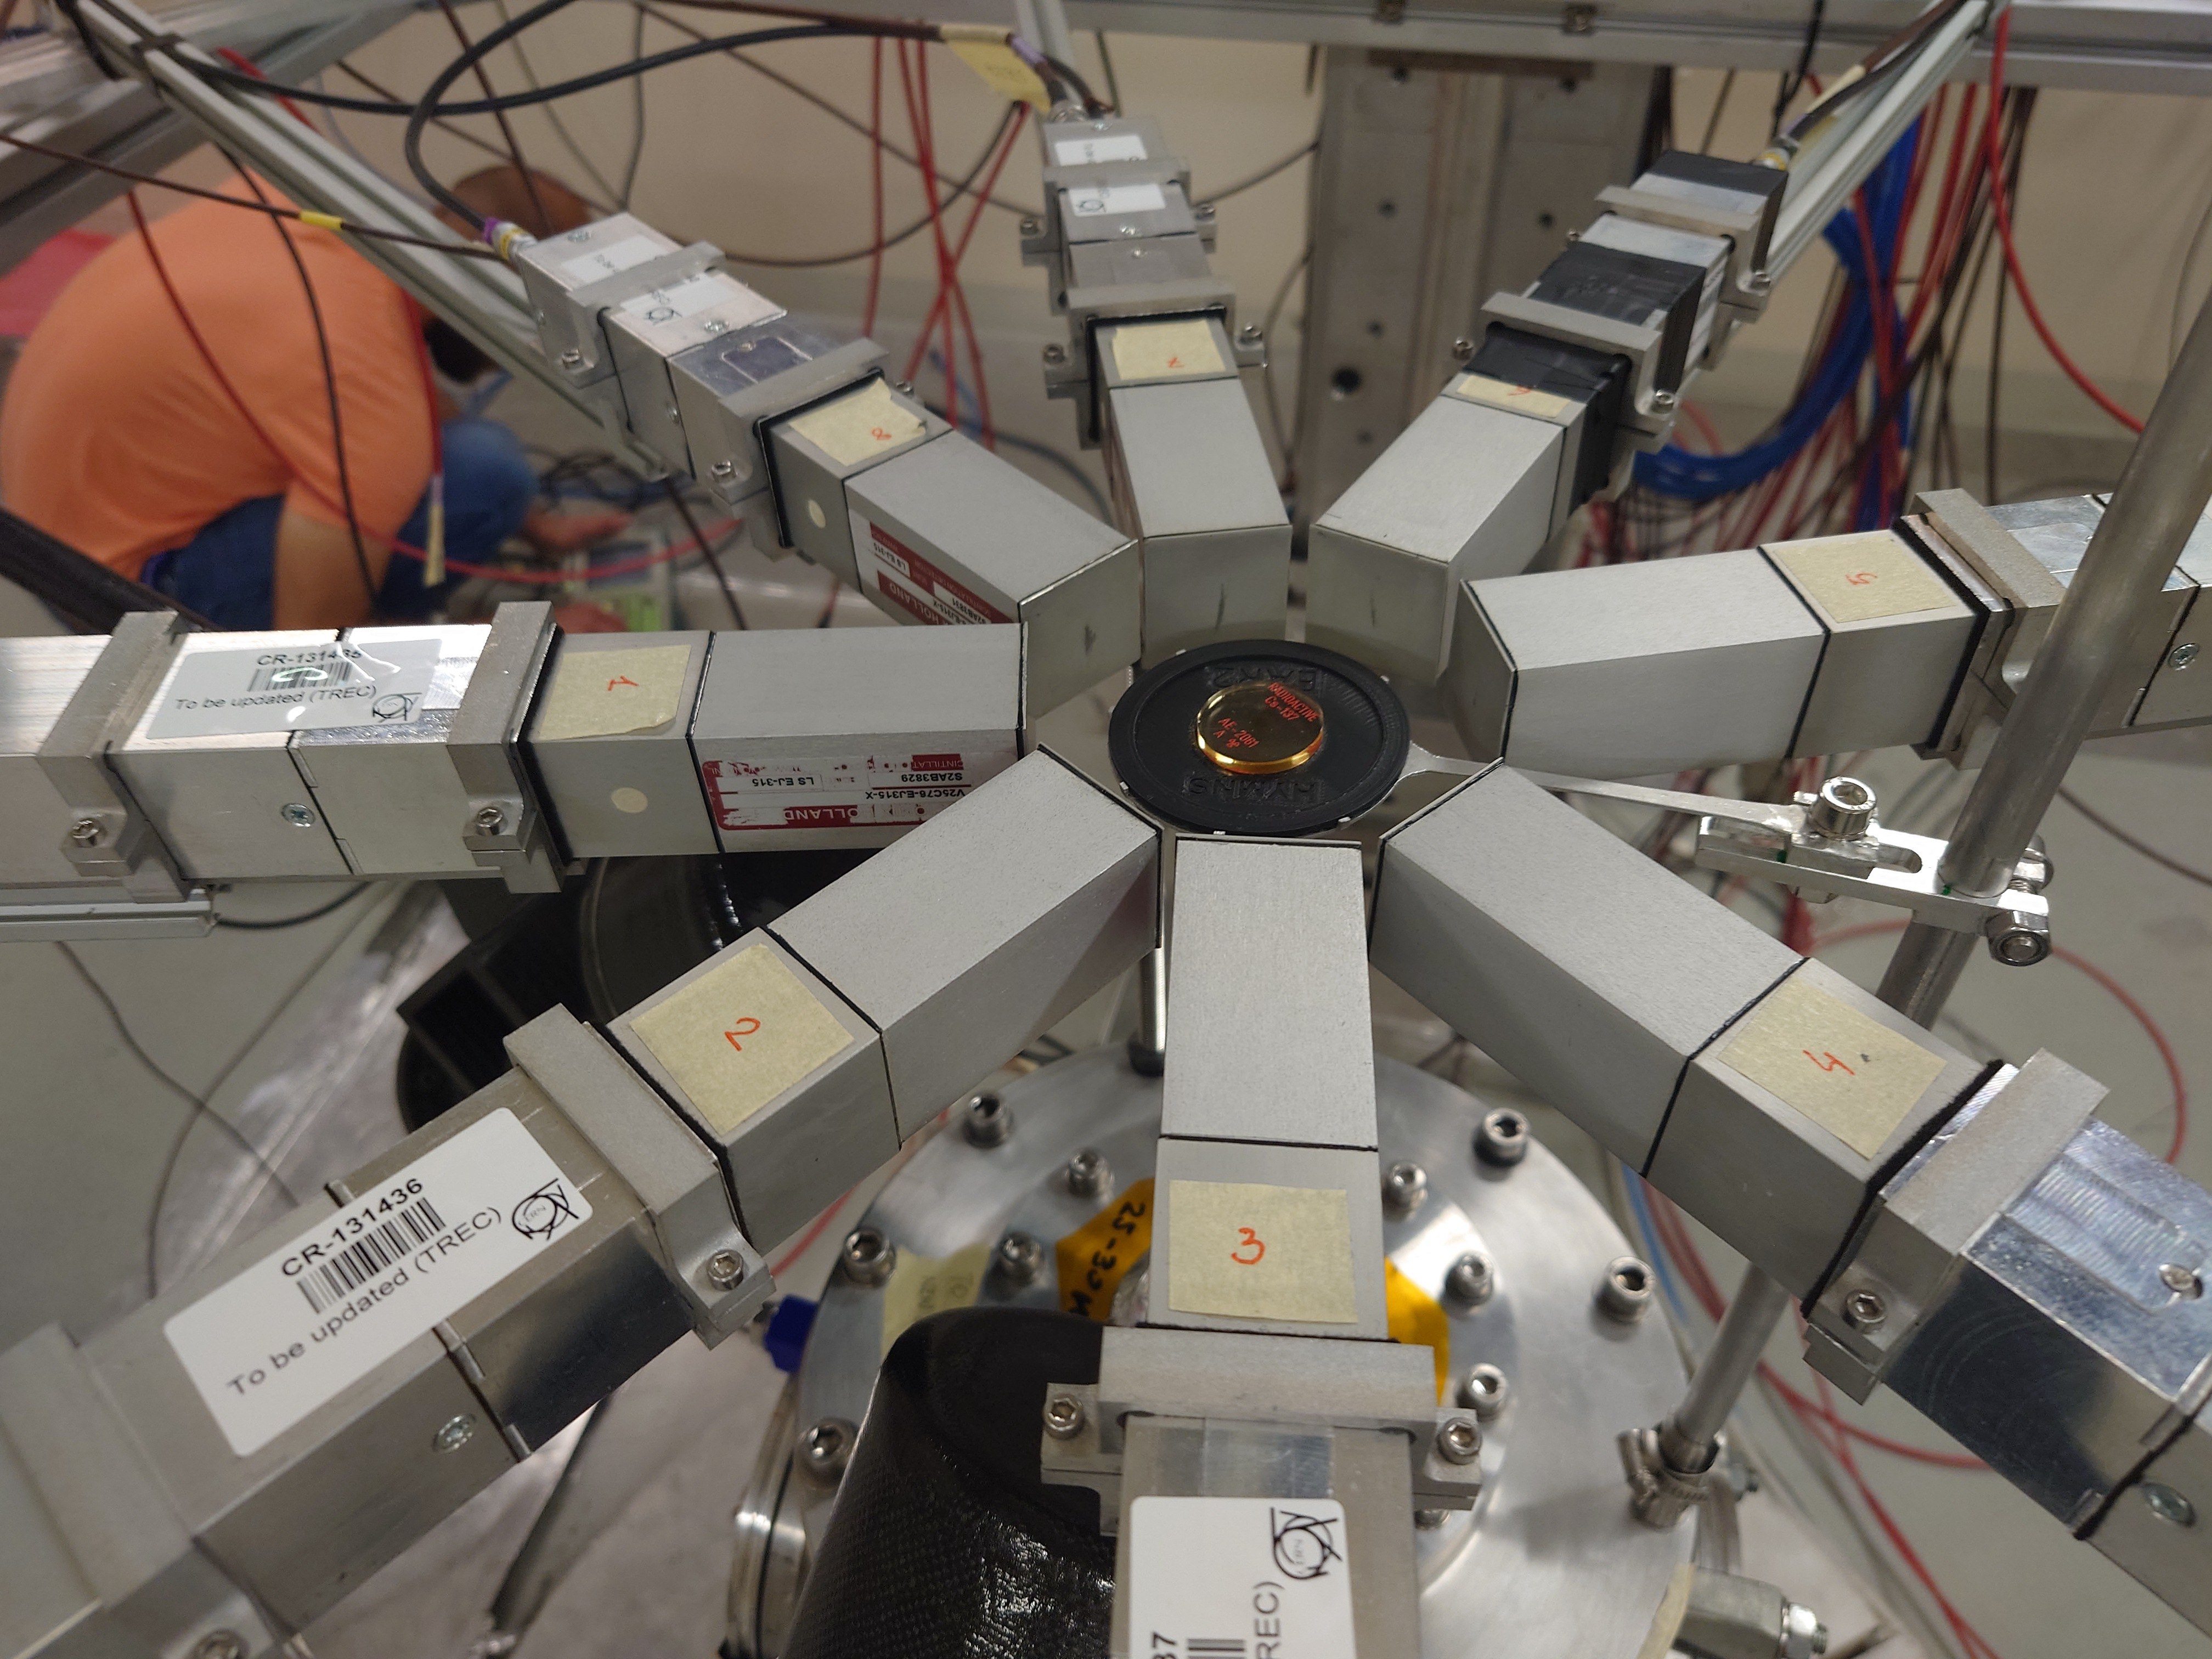
sTED horizontal ring, distance for each detector from target = 4.5 cm. sTED labeled 8 in the DAQ is actually sTED #9 at n_TOF (actual sTED #8 showed no signal)
sTED1 809V, sTED2 793V, sTED3 813V, sTED4 779V, sTED5 785V, sTED6 800V, sTED7 791V, sTED8 837V
C6D61 (labeled C6D6_M in HV log) 854V, C6D62 (labeled C6D6_N in HV log) 871V |
| Attachment 1: C6D6_sTED.JPG
|

|
| Attachment 2: sTED_Ring_Cs137.JPG
|
|
| Attachment 3: C6D6_sTED_Side.JPG
|

|
| Attachment 4: Beam_Kapton_Setup.JPG
|

|
| Attachment 5: EAR2_Setup2.JPG
|
|
| Attachment 6: EAR2_Setup.JPG
|

|
|
23
|
Mon Jan 25 16:11:54 2021 |
Nikolay Sosnin | 25.01.2021: Cross-section Calculation Update |
|
| Attachment 1: Unresolved_Normalization_1.pptx
|