| ID |
Date |
Author |
Subject |
|
595
|
Wed May 24 13:39:12 2017 |
Patrick Coleman-Smith | Examination of Console Logs -- and a couple of reminders |
I have tarred and zipped all 24 logs and shipped them back to the UK. Now I can browse through them.
Studying the "panics" :=
nnaida17 has one which is an NFS mount failure.
nnaida20 and 22 have one each which are "Starting midas: Page fault in user mode with in_atomic() = 1 mm = c61bf200" but with different values for the mm=.
I am studying the web to understand why this may occur in a particular program. Both occur at similar places after "Starting midas".
There are reports of "Clock not locked. status = 0xc" during Setup Electronics which is a bit unusual. These occur in nnaida4, 17 and 22.
Also "Clock not locked. status = 0xd" in nnaida23,17,3,19,6,5,14,7,9. Further investigation to understand all these.
The bit allocation of the Clock Status word is:-
Bit 0 : Lock Detect bit from LMK03200 #1
Bit 1 : Lock Detect bit from LMK03200 #2
Bit 2 : Lock detect from the internal DCM for the mux clock.
Bit 3: iDelay ready signal
The LMK03200 are the two PLLs which are connected to the 50MHz input clock. The clock setup in the log directly before the error report for nnaiad17 had reported correctly setup and the ADCs had calibrated, these rely on a stable 50MHz from the LMK03200s.
I have also spotted some diagnostic information about the waveform readout that is useful.
Just a reminder..... when power cycling the equipment please leave the power off for at least 10 seconds to allow all the capacitors in the supply chain to discharge.
Also note that the console monitor window in the Pi can be used to check that all FEE64s have "finished" the power-on sequence by using the "parse" button.
Since it doesn't use the DAQ software it won't lock-up and it will give an indication of progress. |
|
597
|
Wed May 24 14:51:06 2017 |
Patrick Coleman-Smith | Examination of Console Logs -- and a couple of reminders |
| Quote: |
|
I have tarred and zipped all 24 logs and shipped them back to the UK. Now I can browse through them.
Studying the "panics" :=
nnaida17 has one which is an NFS mount failure.
Do we understand why? Are there different/additional NFS mount options to be considered?
nnaida20 and 22 have one each which are "Starting midas: Page fault in user mode with in_atomic() = 1 mm = c61bf200" but with different values for the mm=.
I am studying the web to understand why this may occur in a particular program. Both occur at similar places after "Starting midas".
There are reports of "Clock not locked. status = 0xc" during Setup Electronics which is a bit unusual. These occur in nnaida4, 17 and 22.
Also "Clock not locked. status = 0xd" in nnaida23,17,3,19,6,5,14,7,9. Further investigation to understand all these.
The bit allocation of the Clock Status word is:-
Bit 0 : Lock Detect bit from LMK03200 #1
Bit 1 : Lock Detect bit from LMK03200 #2
Bit 2 : Lock detect from the internal DCM for the mux clock.
Bit 3: iDelay ready signal
The LMK03200 are the two PLLs which are connected to the 50MHz input clock. The clock setup in the log directly before the error report for nnaiad17 had reported correctly setup and the ADCs had calibrated, these rely on a stable 50MHz from the LMK03200s.
I have also spotted some diagnostic information about the waveform readout that is useful.
Just a reminder..... when power cycling the equipment please leave the power off for at least 10 seconds to allow all the capacitors in the supply chain to discharge.
We do - standard procedure is to wait 20s.
Also note that the console monitor window in the Pi can be used to check that all FEE64s have "finished" the power-on sequence by using the "parse" button.
Since it doesn't use the DAQ software it won't lock-up and it will give an indication of progress.
We do check for further panics. I assume we would have to read each system log to check that the boot sequence and app load had completed?
|
|
|
598
|
Wed May 24 15:58:53 2017 |
Patrick Coleman-Smith | Examination of Console Logs -- and a couple of reminders |
| Quote: |
|
| Quote: |
|
I have tarred and zipped all 24 logs and shipped them back to the UK. Now I can browse through them.
Studying the "panics" :=
nnaida17 has one which is an NFS mount failure.
Do we understand why? Are there different/additional NFS mount options to be considered? Investigations ongoing :-)
nnaida20 and 22 have one each which are "Starting midas: Page fault in user mode with in_atomic() = 1 mm = c61bf200" but with different values for the mm=.
I am studying the web to understand why this may occur in a particular program. Both occur at similar places after "Starting midas".
There are reports of "Clock not locked. status = 0xc" during Setup Electronics which is a bit unusual. These occur in nnaida4, 17 and 22.
Also "Clock not locked. status = 0xd" in nnaida23,17,3,19,6,5,14,7,9. Further investigation to understand all these.
The bit allocation of the Clock Status word is:-
Bit 0 : Lock Detect bit from LMK03200 #1
Bit 1 : Lock Detect bit from LMK03200 #2
Bit 2 : Lock detect from the internal DCM for the mux clock.
Bit 3: iDelay ready signal
The LMK03200 are the two PLLs which are connected to the 50MHz input clock. The clock setup in the log directly before the error report for nnaiad17 had reported correctly setup and the ADCs had calibrated, these rely on a stable 50MHz from the LMK03200s.
I have also spotted some diagnostic information about the waveform readout that is useful.
Just a reminder..... when power cycling the equipment please leave the power off for at least 10 seconds to allow all the capacitors in the supply chain to discharge.
We do - standard procedure is to wait 20s.
Also note that the console monitor window in the Pi can be used to check that all FEE64s have "finished" the power-on sequence by using the "parse" button.
Since it doesn't use the DAQ software it won't lock-up and it will give an indication of progress.
We do check for further panics. I assume we would have to read each system log to check that the boot sequence and app load had completed?
If you do the parse before any action like RESET or SETUP the parse looks for the last line being the expected one which is :-
"Completed custom startup from /MIDAS/TclHttpd/Html/AIDA/RunControl/stats.defn.tcl"
When found the report from the parse will end with Finished OK for each FEE
|
|
|
|
484
|
Sun Nov 27 12:30:41 2016 |
AE, PV | Energy loss in Degraders and Implantation for runs 1028 and 1033 |
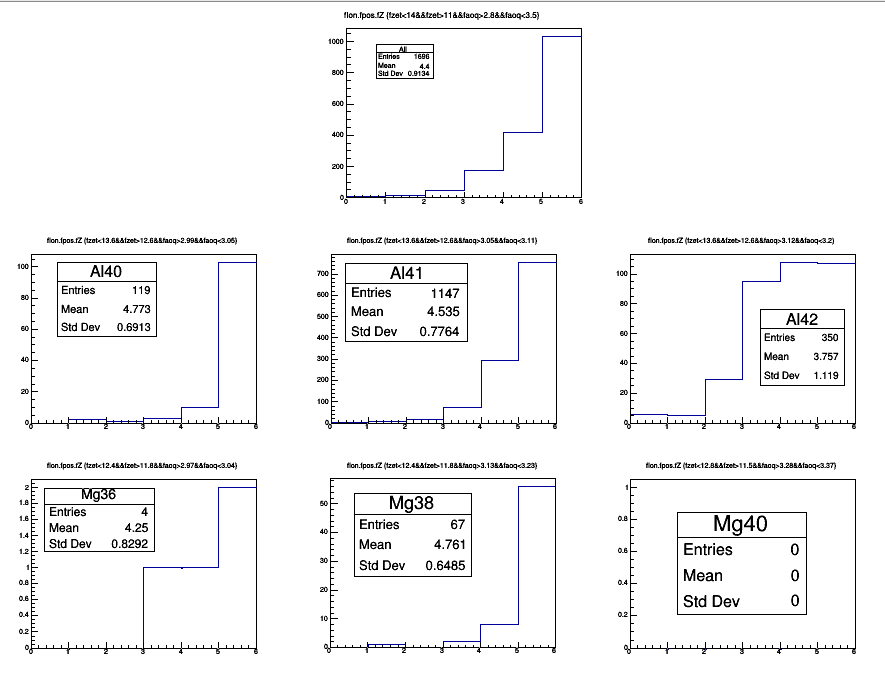
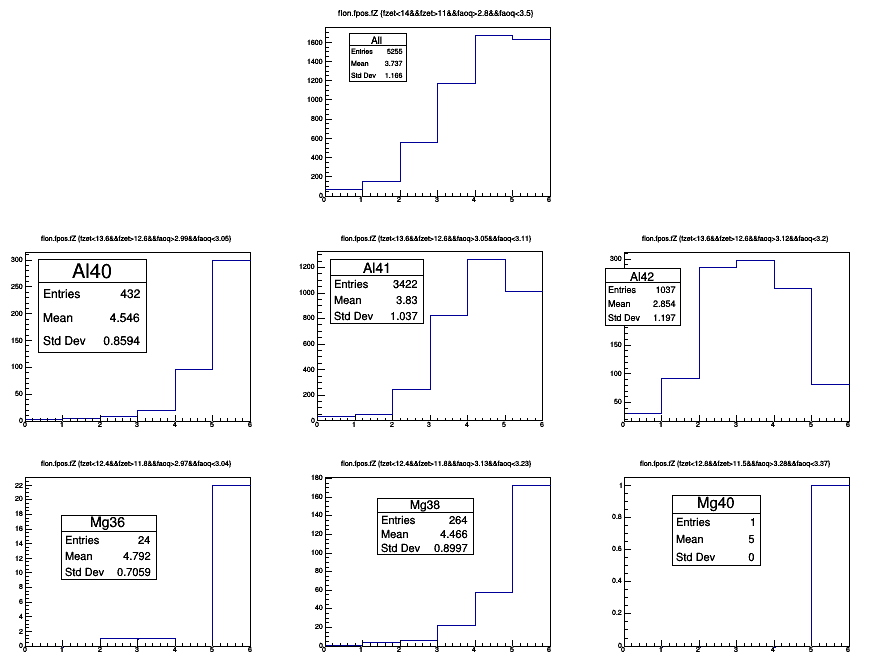
Implantation profile in AIDA
BigRIPS file 1028 (Attachment run1028.png): Degrader setting: 3 mm Pb(fix) + 0.8 mm W(variable) + 2 mm Al(variable)
BigRIPS file 1033 (Attachment run1033.png): Degrader setting: 3 mm Pb(fix) + 0.8 mm W(variable) + 2 mm Al(variable) + 1 mm Al(fix)
BigRIPS file 1012 is in https://elog.ph.ed.ac.uk/AIDA/478 Degrader setting: 3 mm Pb(fix) + 1.3 mm W(variable) + 2 mm Al(variable)
Observation: Some Mg isotopes (38, 40) is implanted in last DSSD or out the DSSD stacks. We may need to add more degrader!
Equivalent thickness of W, Pb and Al degraders
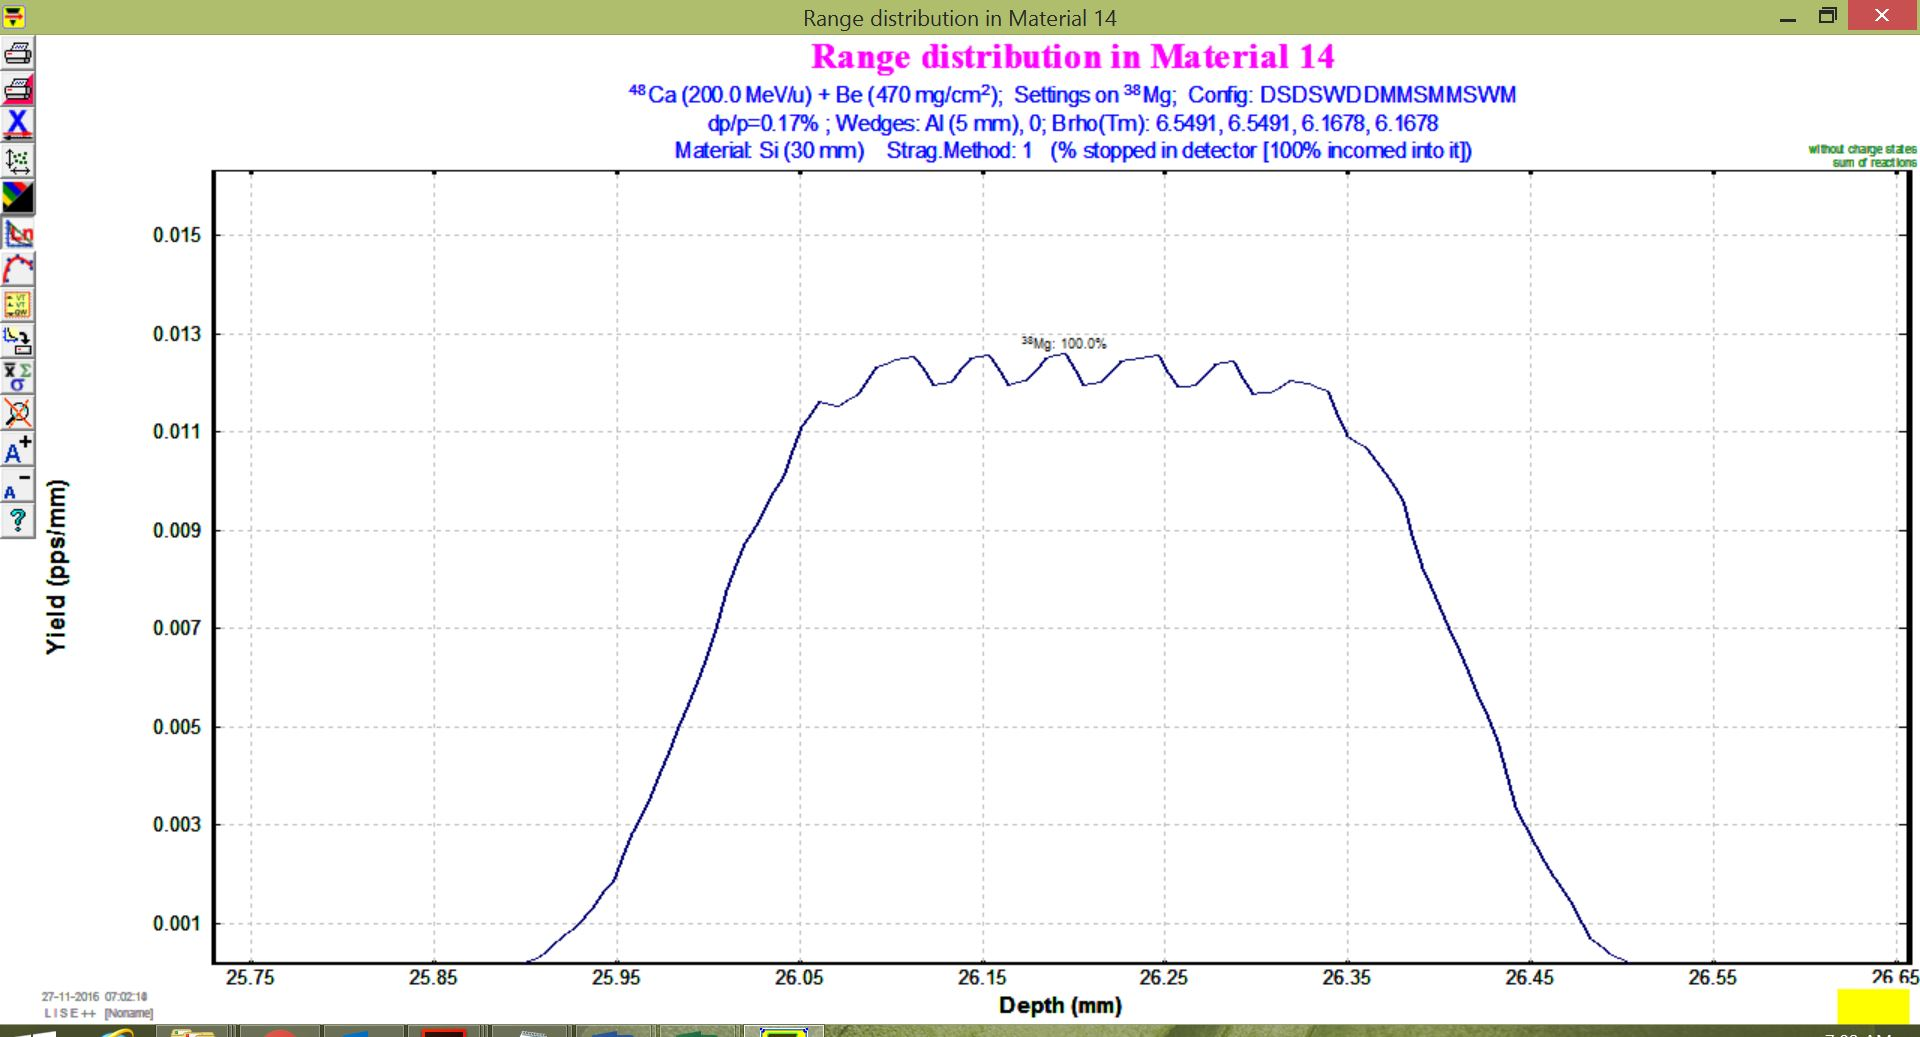
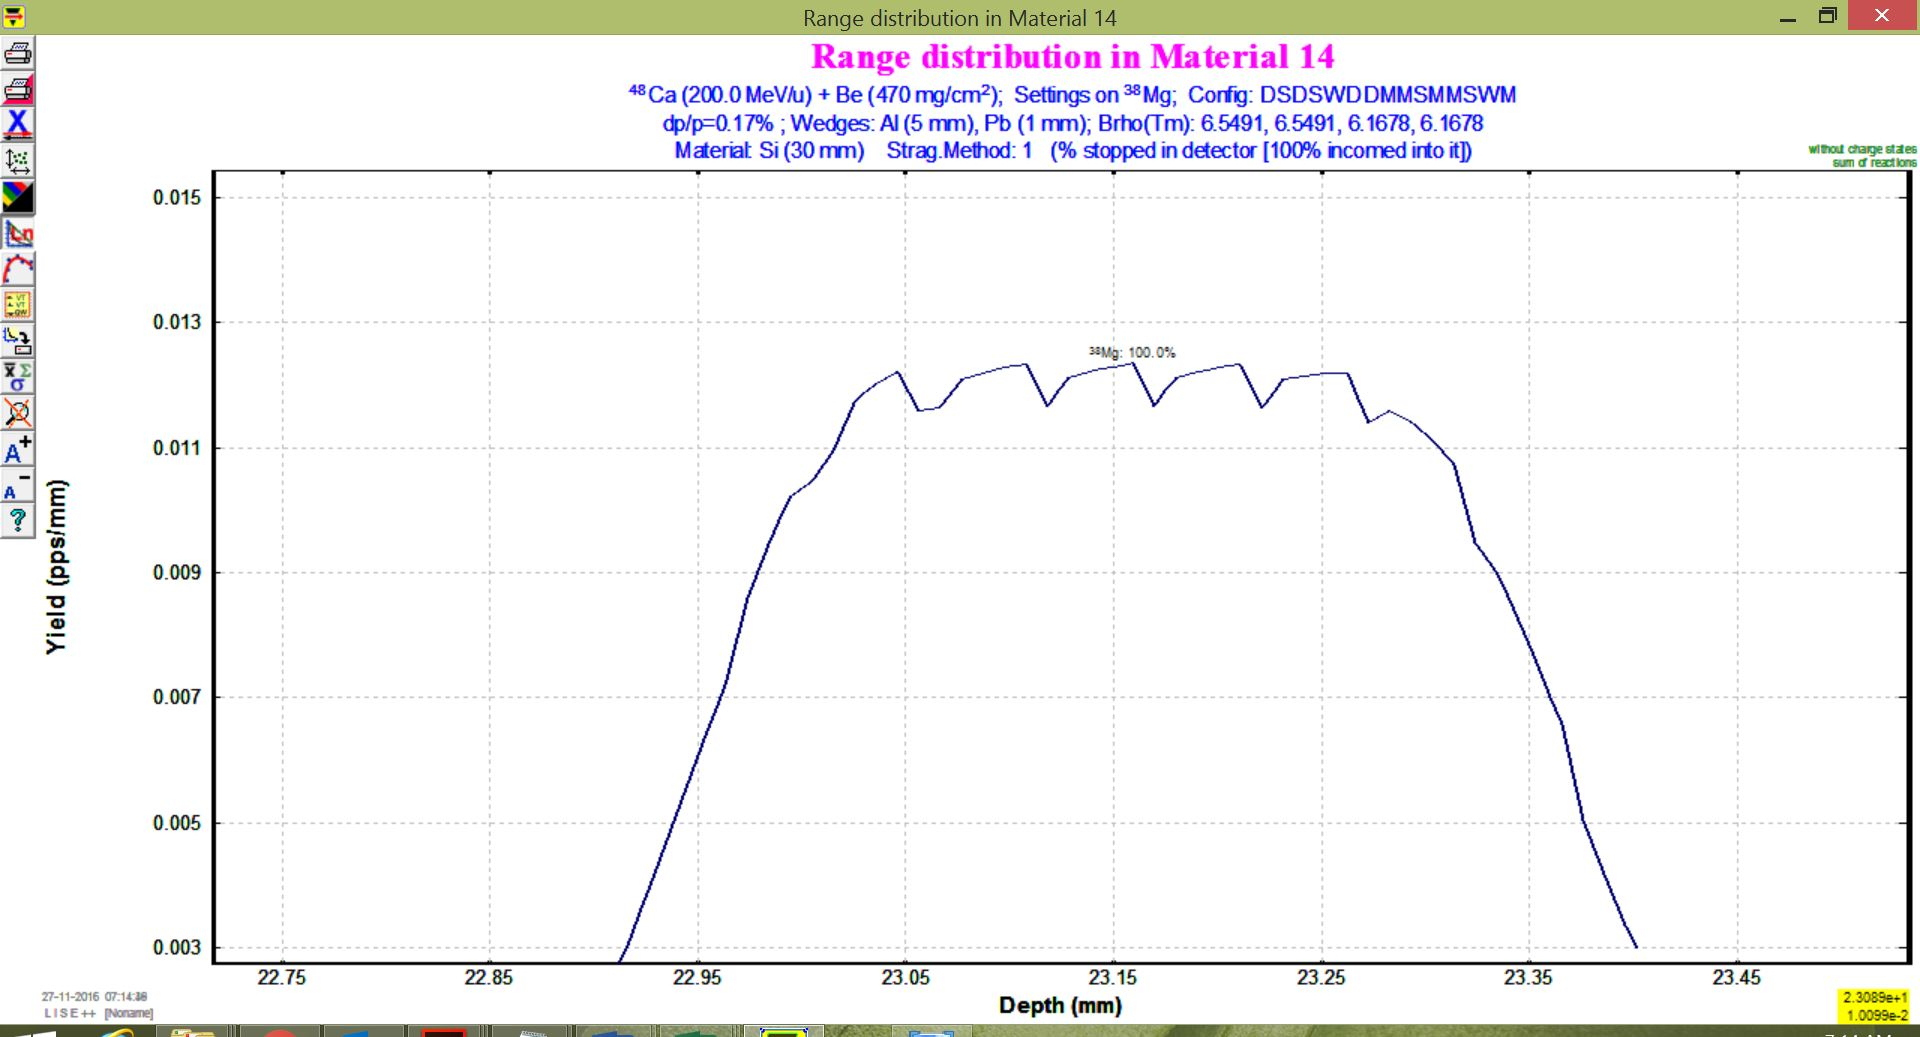
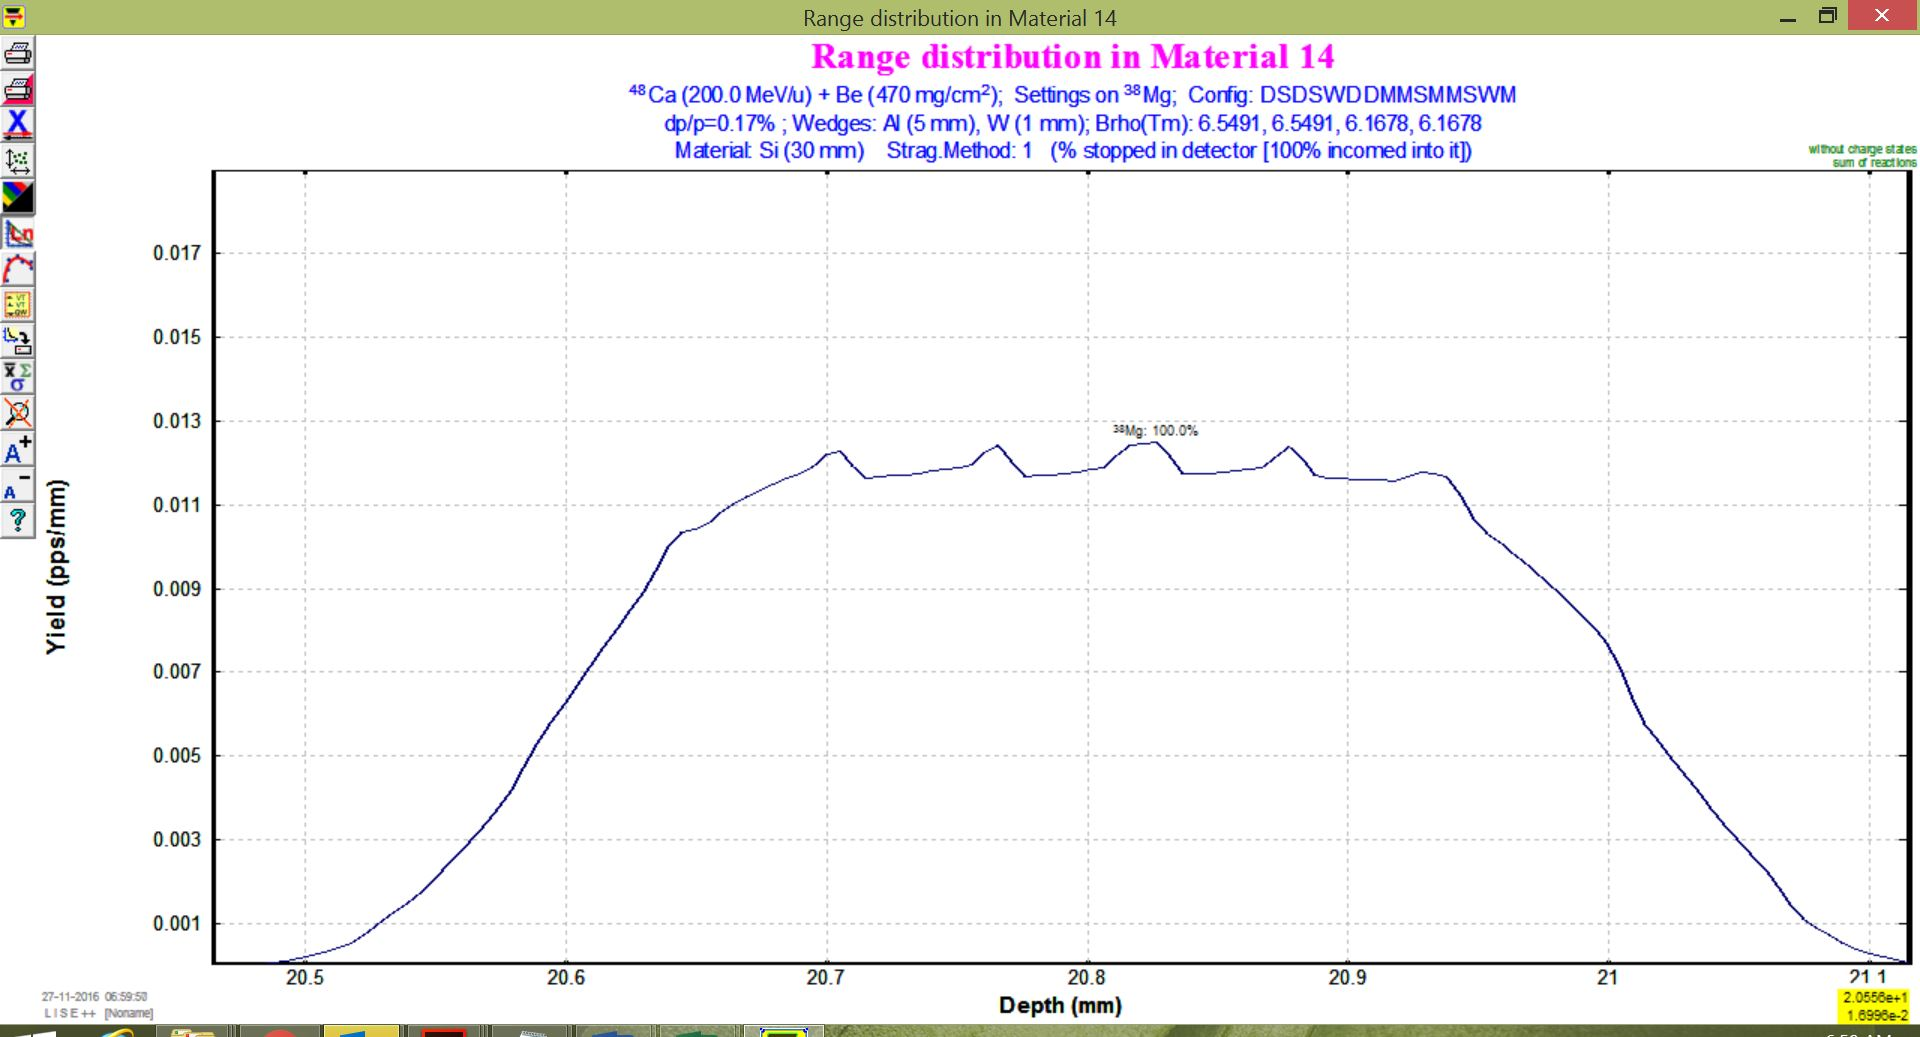
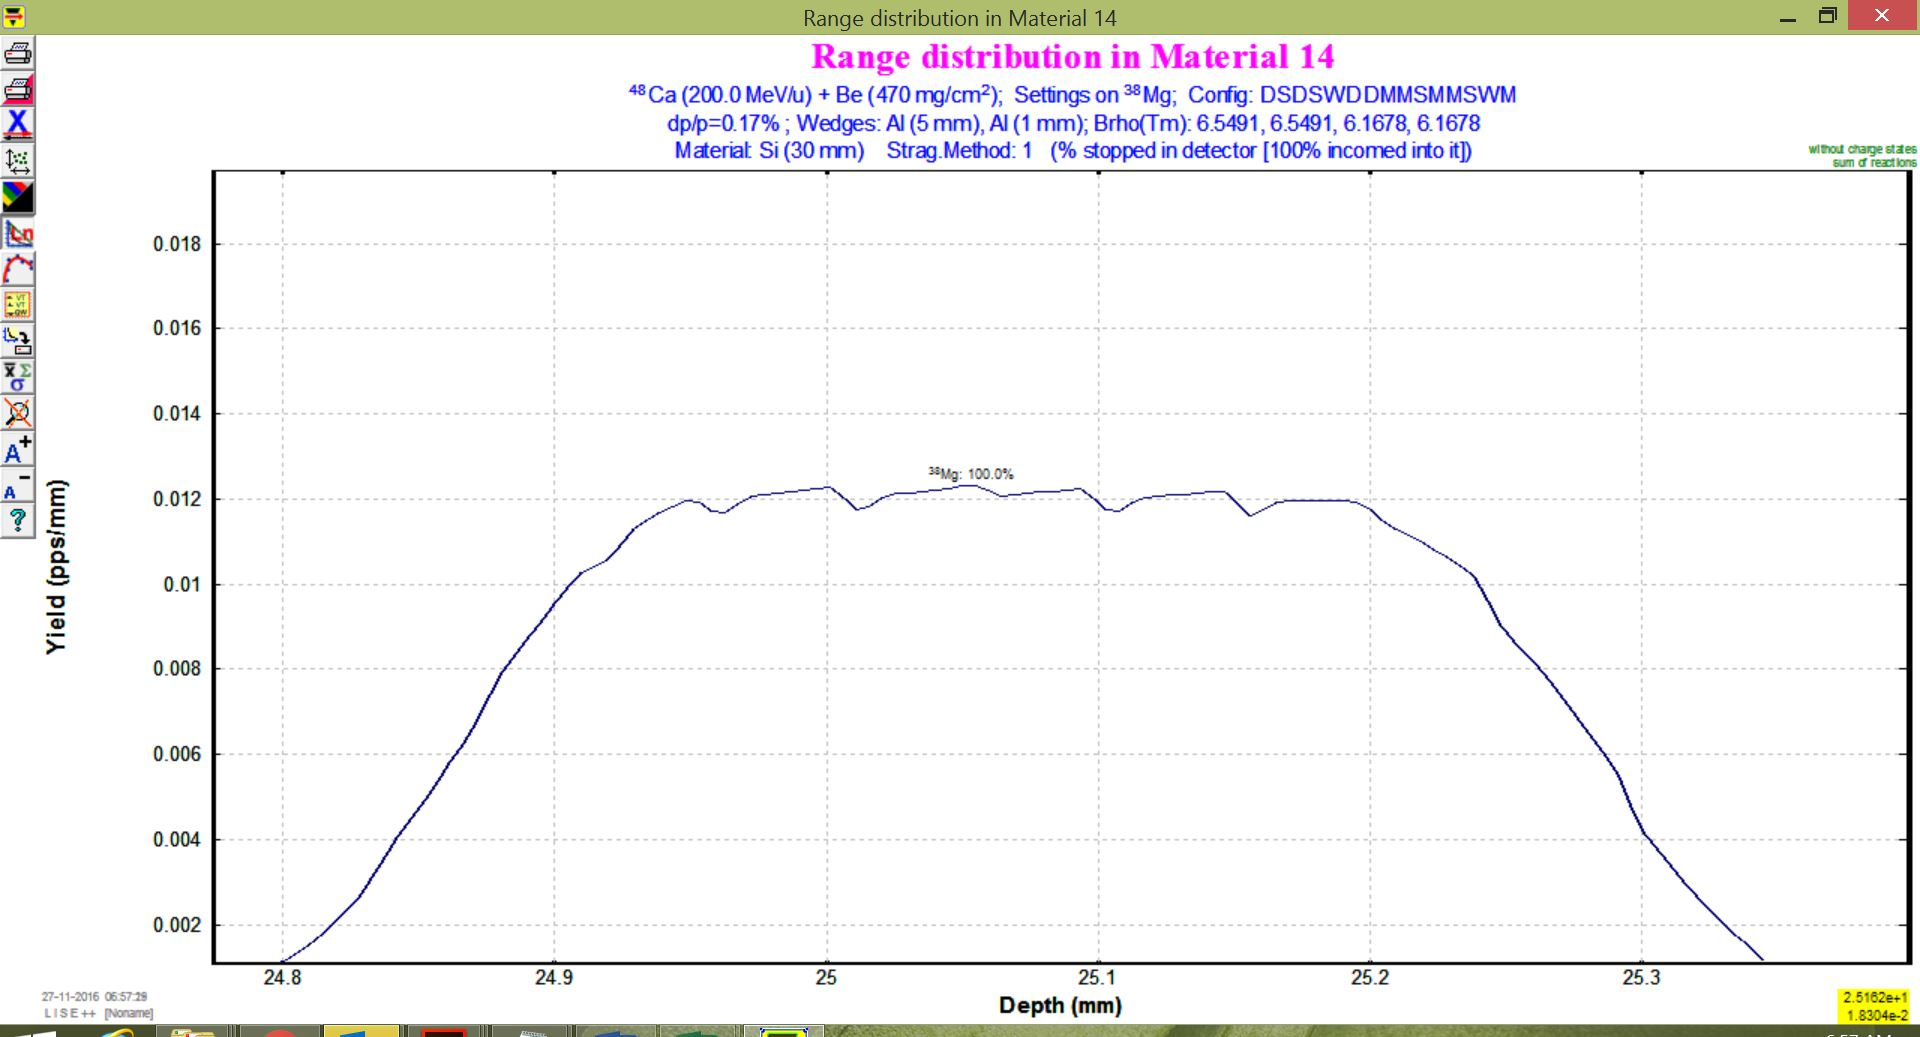
The measured implantation profiles agree with LISE estiamtes for the equivalent change in implantation depth for W, Pb and Al. These were estimated with LISE by comparing change of range in Si for 1mm degrader of each material (see attachments). Note that W produces a larger change in range than Pb (higher density; according to LISE database).
1 mm Al: 1.15 mm in Si
1 mm W: 5.40 mm in Si
1 mm Pb: 3.05 mm in Si
The current configuration (run Mg401033) gives:
3 mm Pb + 0.8 mm W + 3 mm Al = 16.9 mm Si
Probably our best alternative (unless we can go in and rearrange fixed degraders) is:
3 mm Pb + 1.3 mm W + 3 mm Al = 19.6 mm Si: move implantation depth 2.7 mm upstream
Here is a spreadsheet where you can play with the numbers and create test your own solution to the puzzle: https://docs.google.com/spreadsheets/d/1QJp8t98sT3pExAQb3xtHtAvk4TUDVO6alhbLIaNtx8A/edit?usp=sharing
!!! We did change degrader for the 3mmPb+1.3mmW+3mmAl setting at 22.16 (from AIDA run 26_0); see elog entry https://elog.ph.ed.ac.uk/AIDA/483 |
| Attachment 1: run1028.png
|
|
| Attachment 2: run1033.png
|
|
| Attachment 3: 0mm.JPG
|
|
| Attachment 4: 1mmPb.JPG
|
|
| Attachment 5: 1mmW.JPG
|
|
| Attachment 6: 1mmAl.JPG
|
|
|
2
|
Wed Sep 10 09:27:43 2014 |
Patrick | Elog appreciation |
This is very interesting. Look forward to many happy interactions. |
|
266
|
Wed Jun 1 07:49:45 2016 |
TD | Detector noise - state of play |
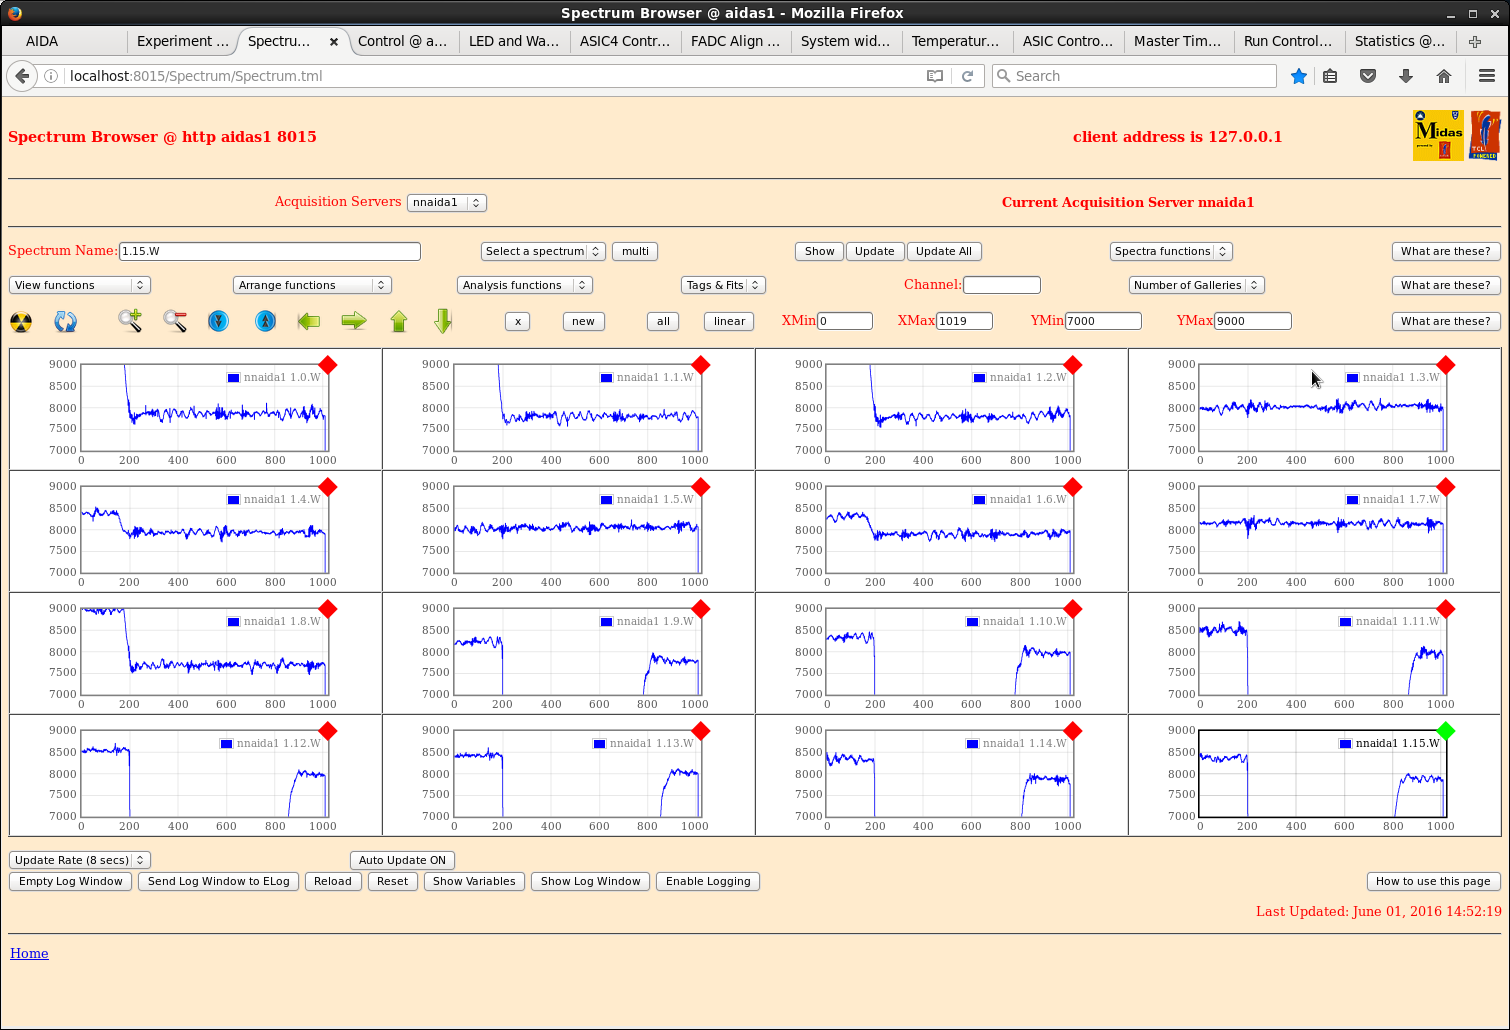
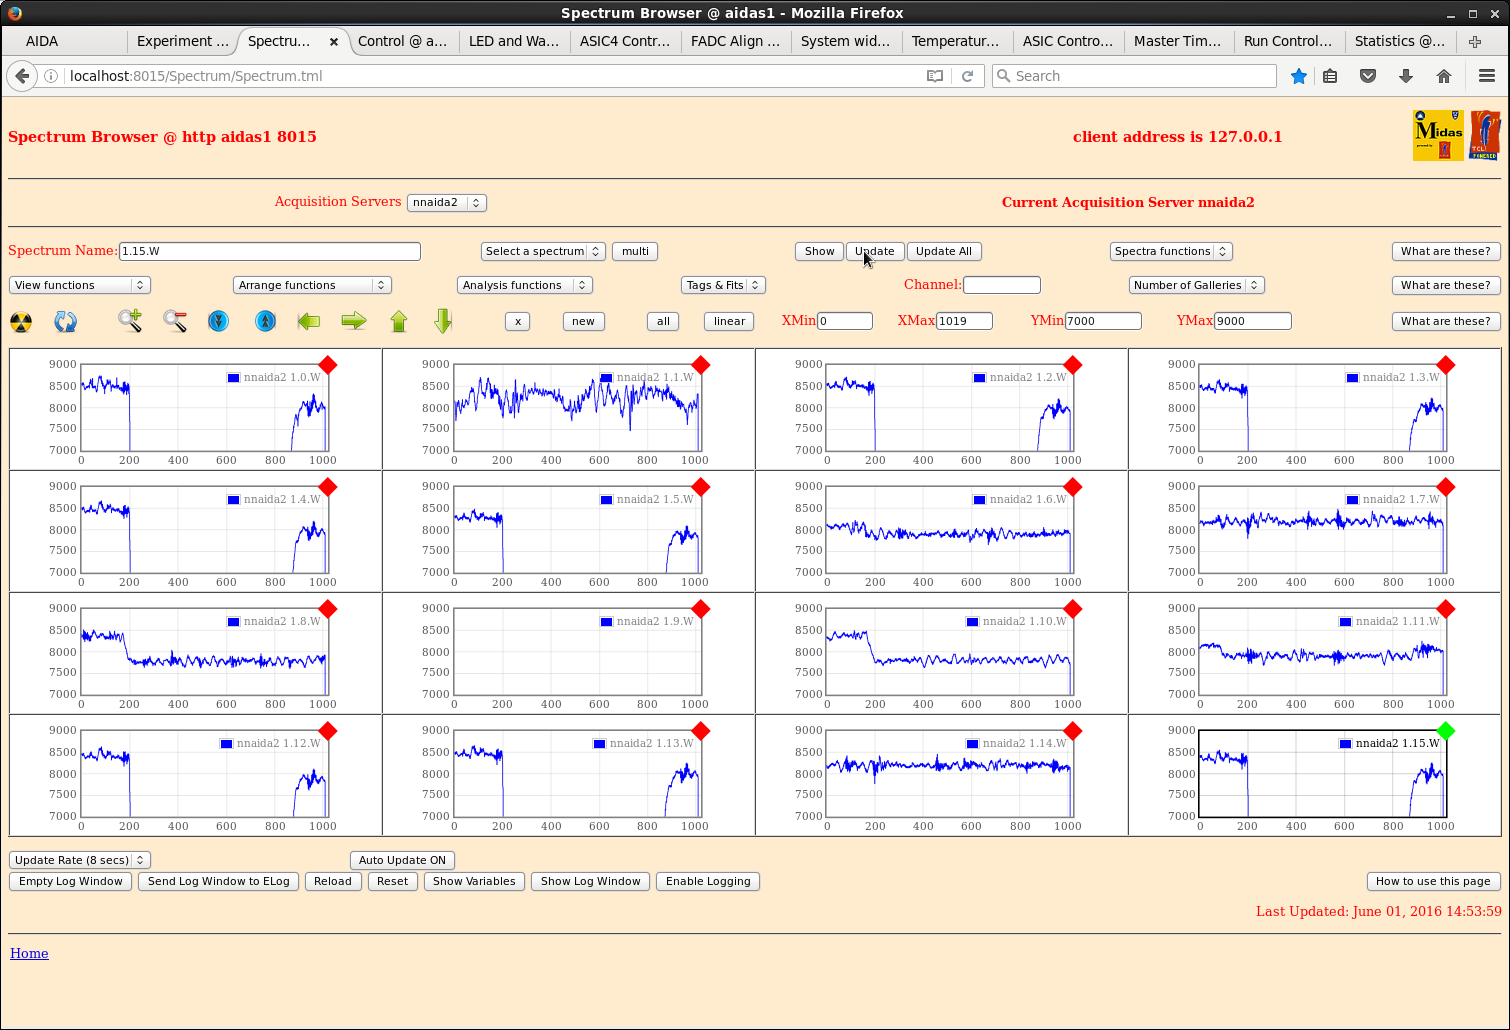
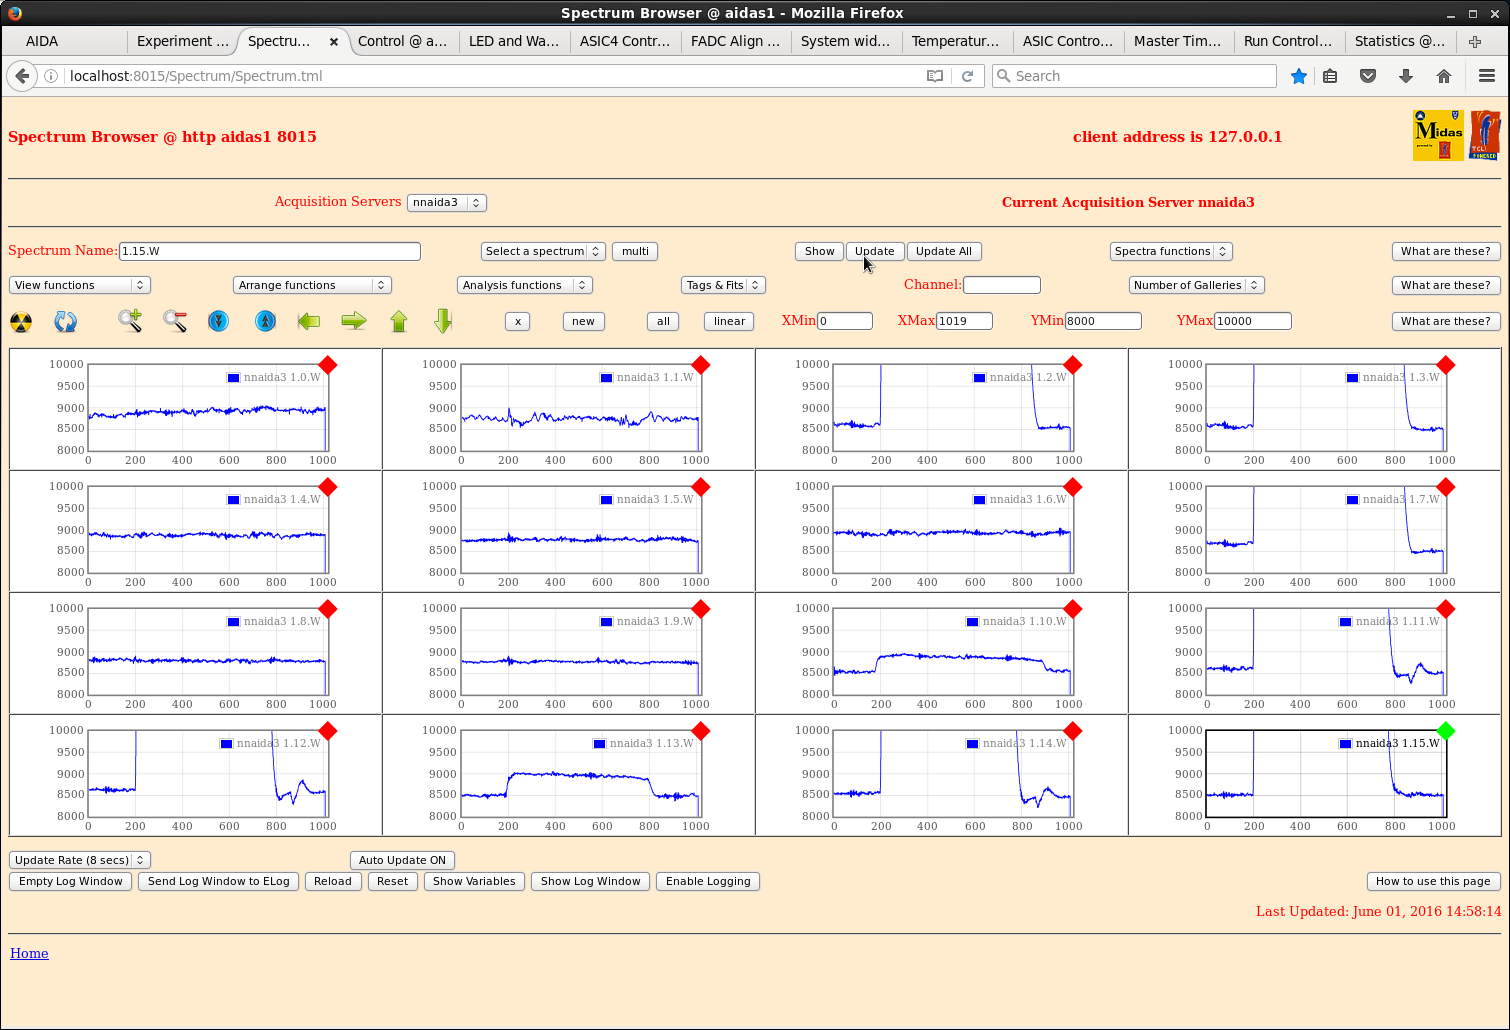
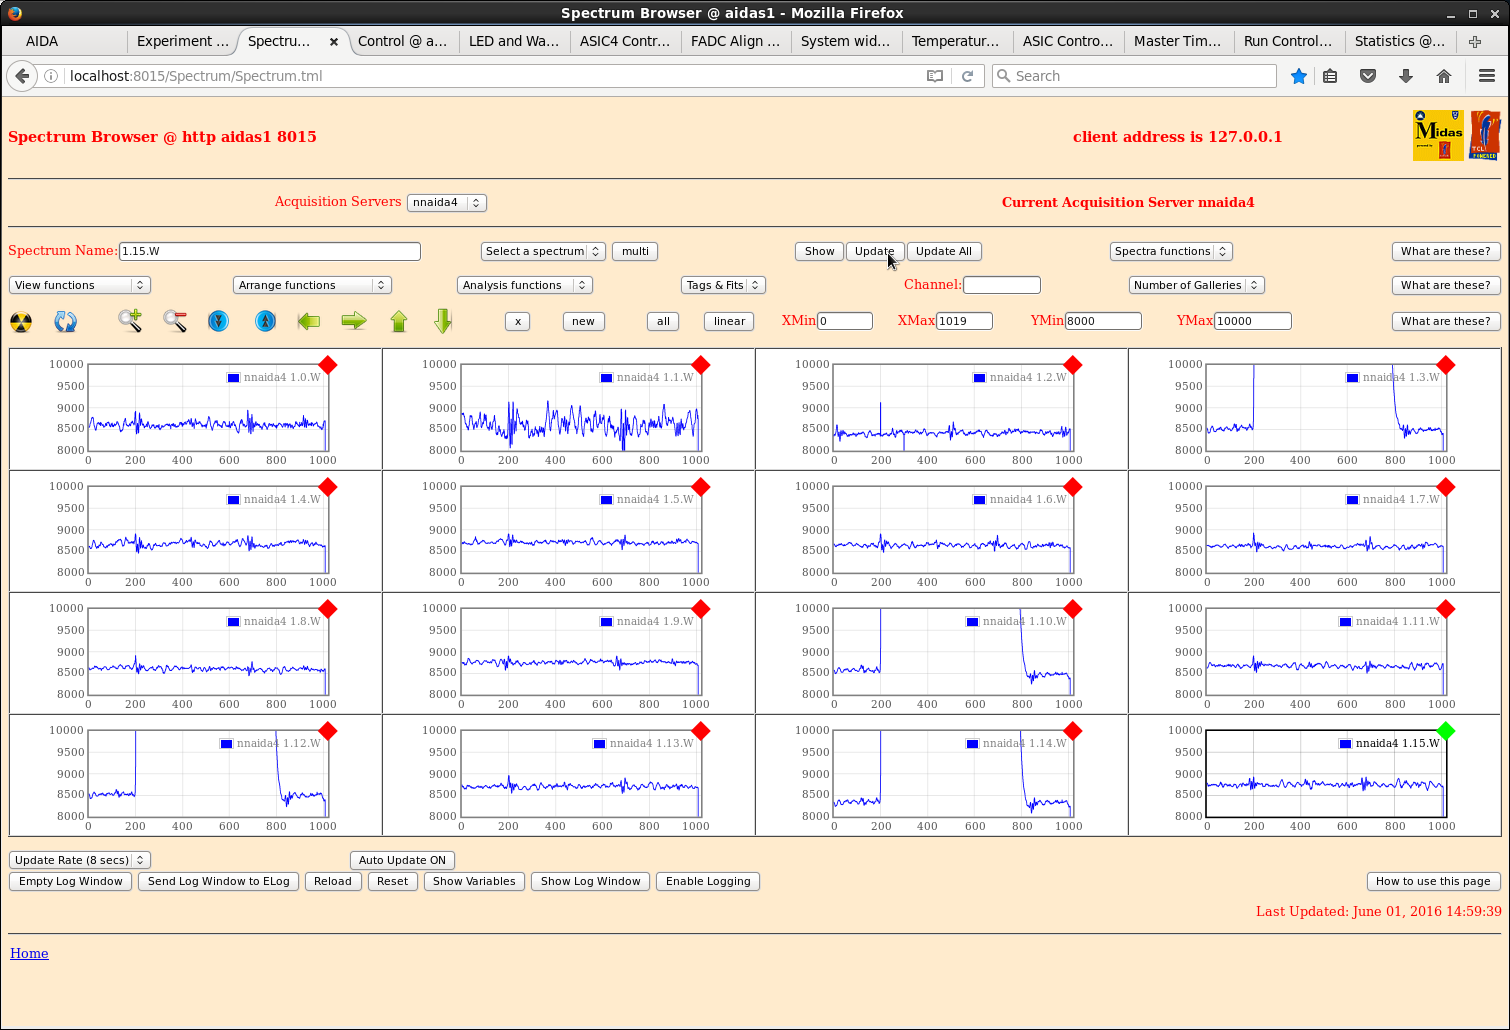
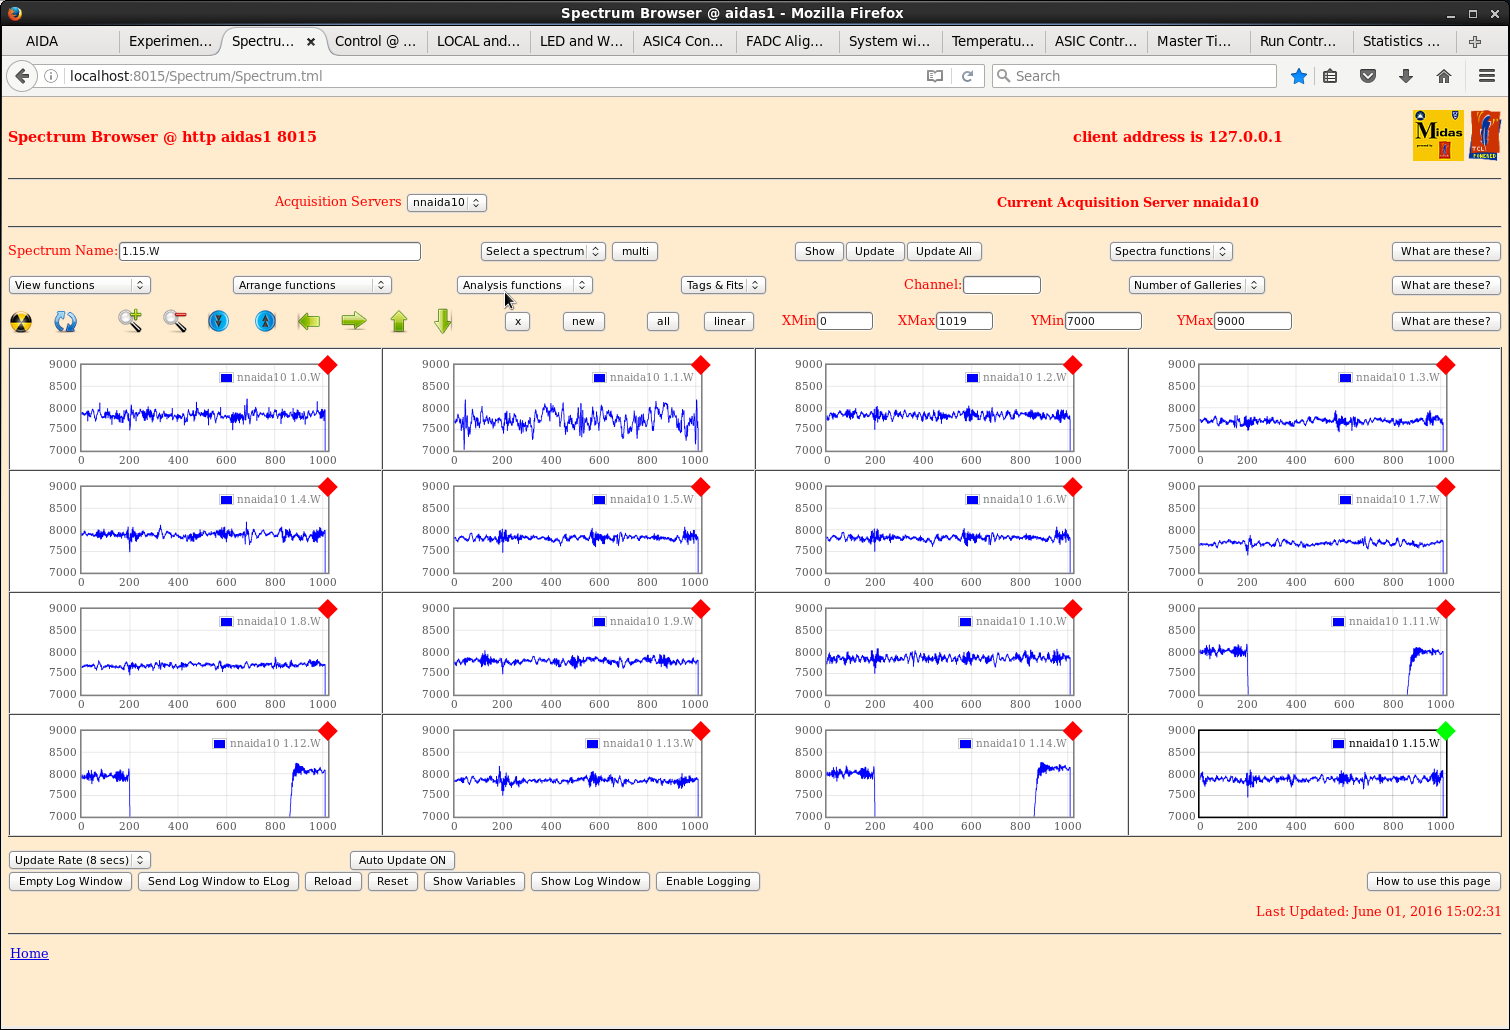
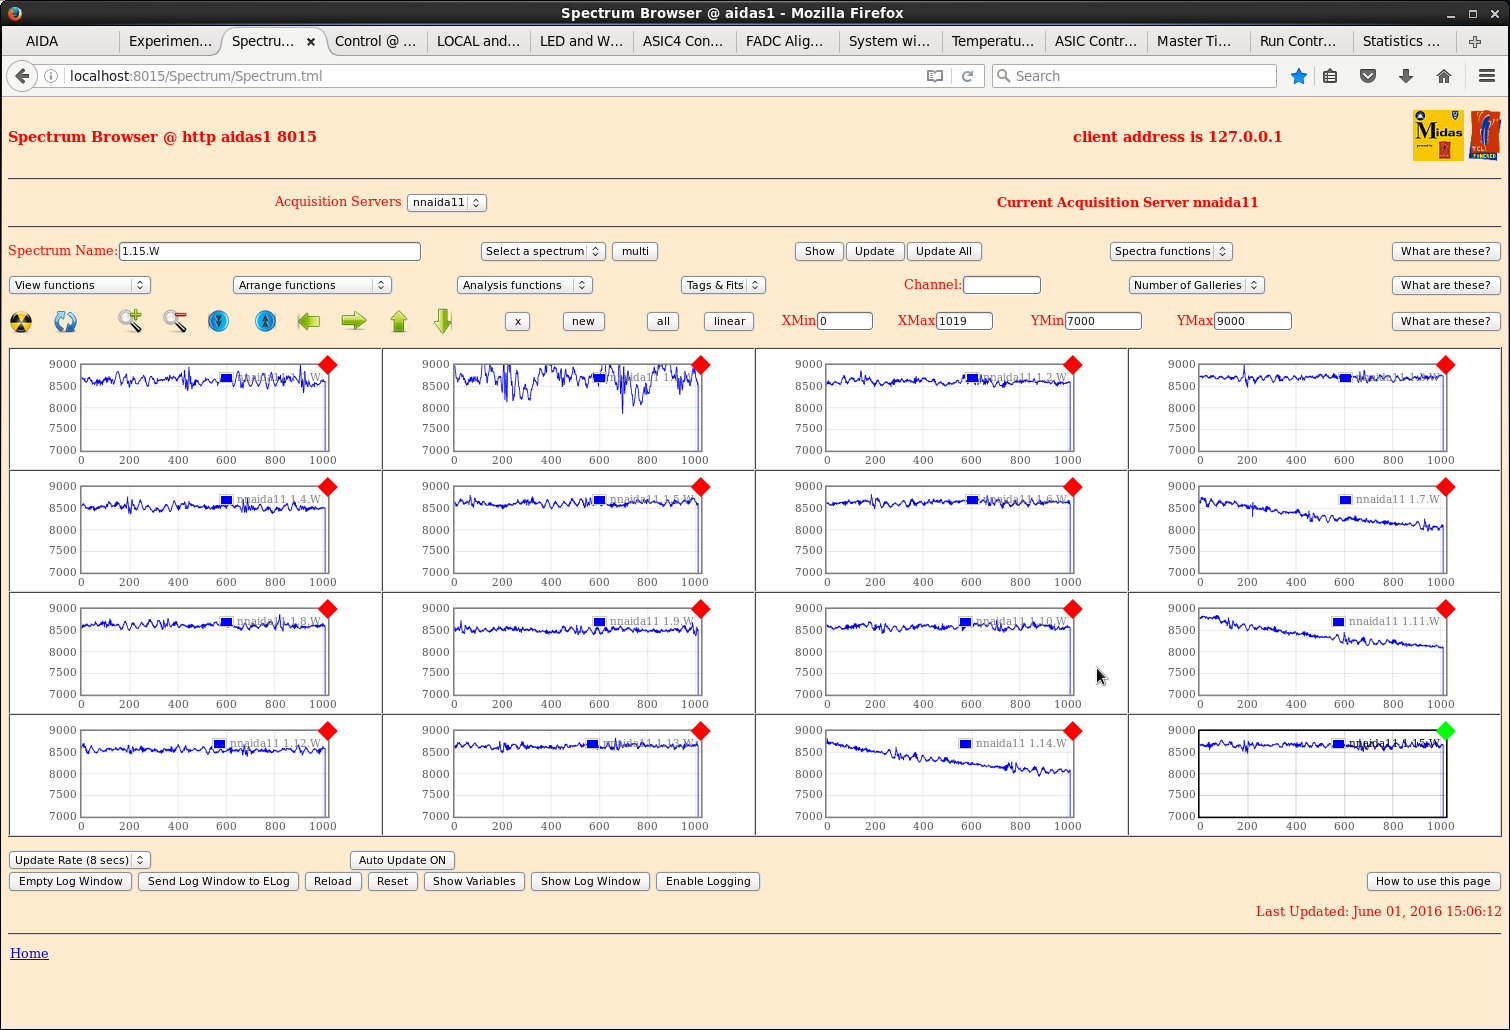
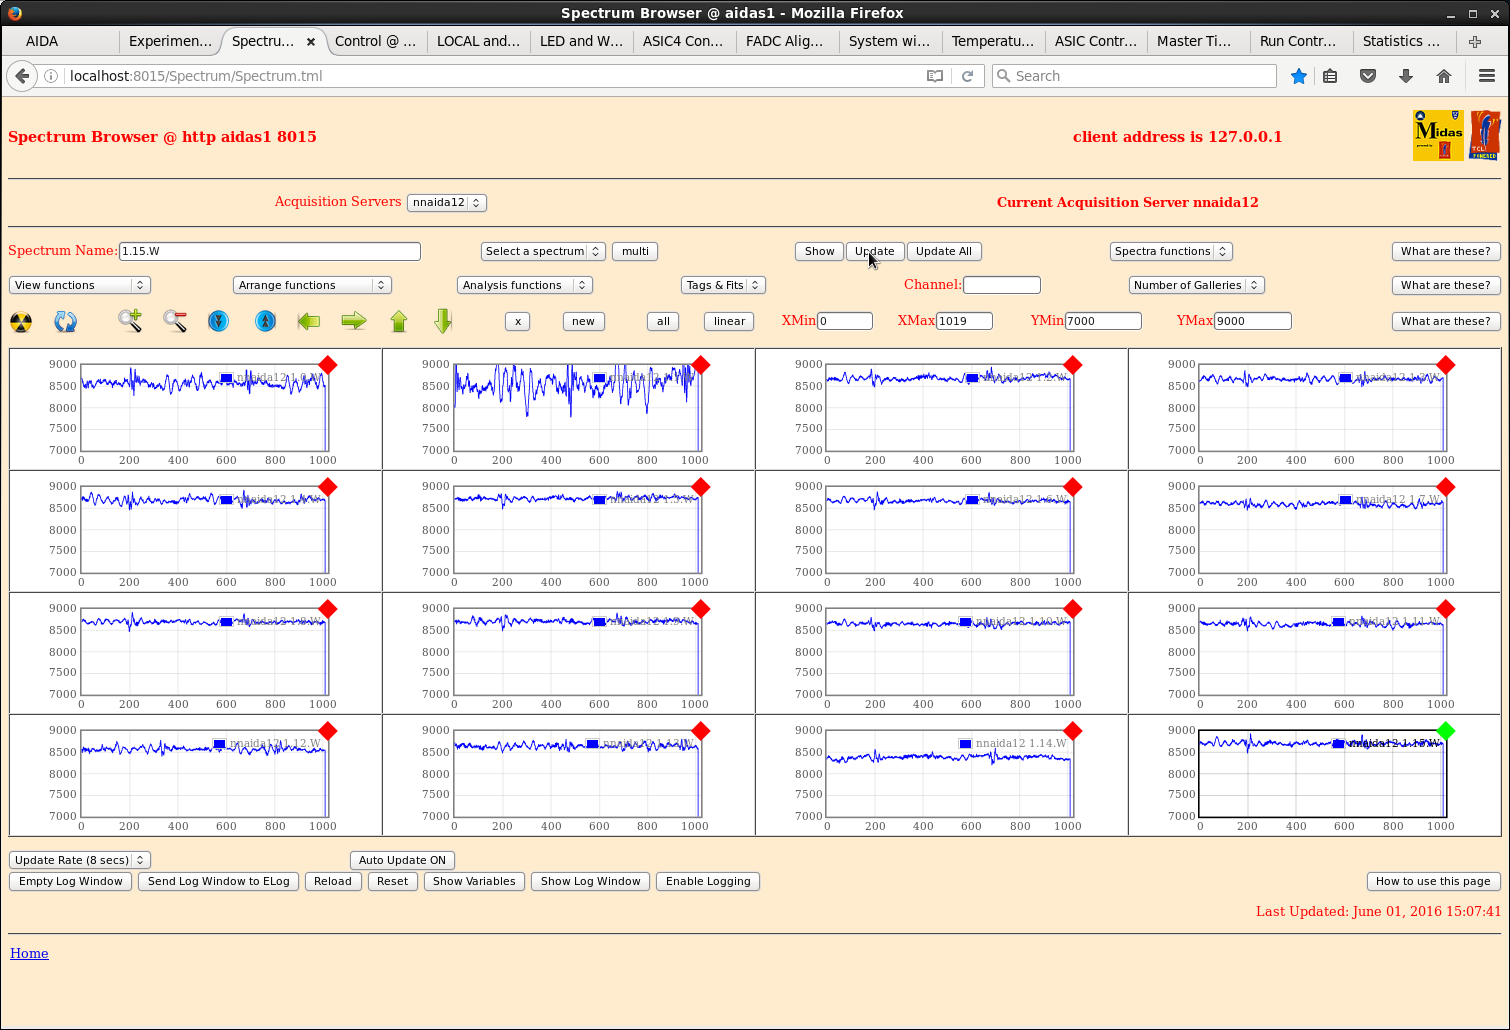
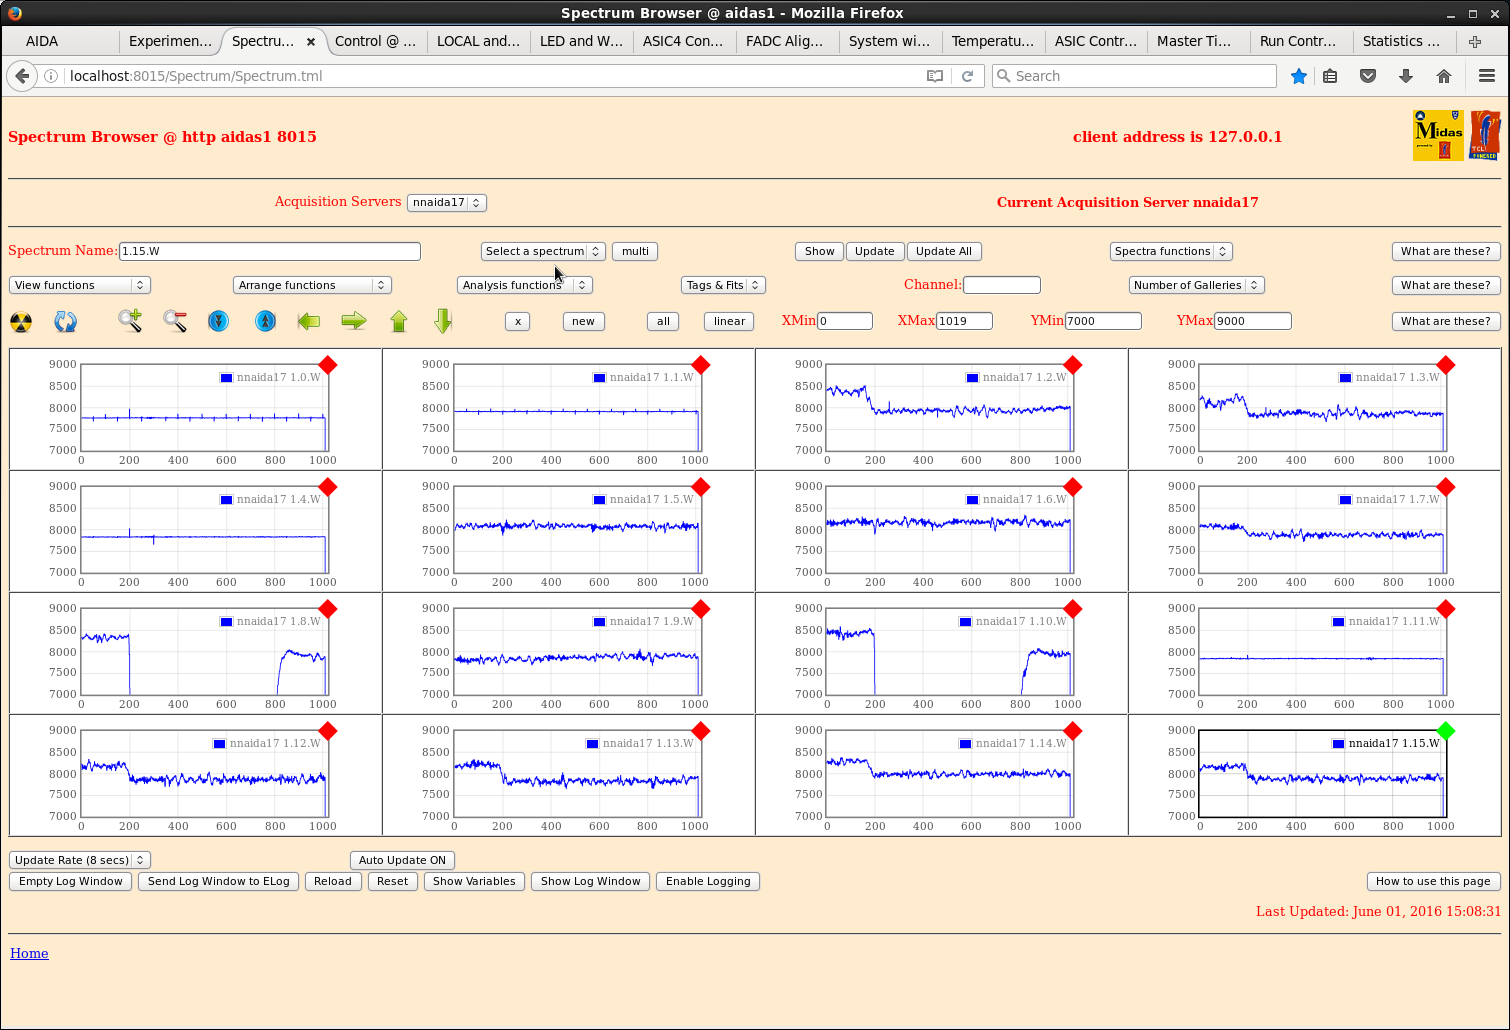
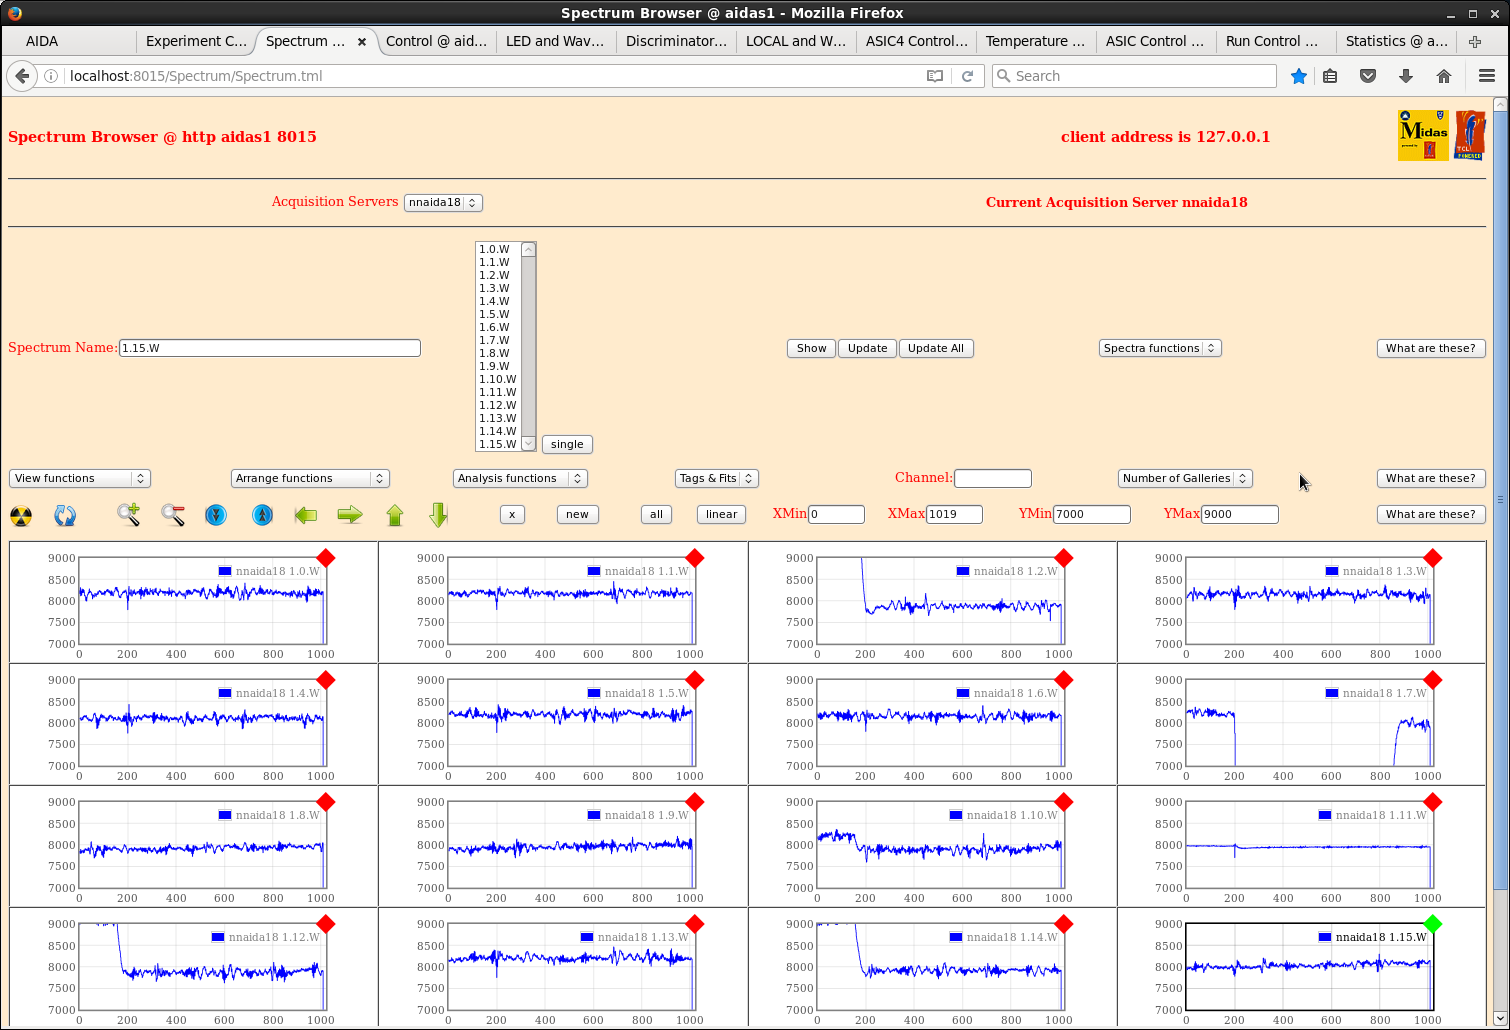
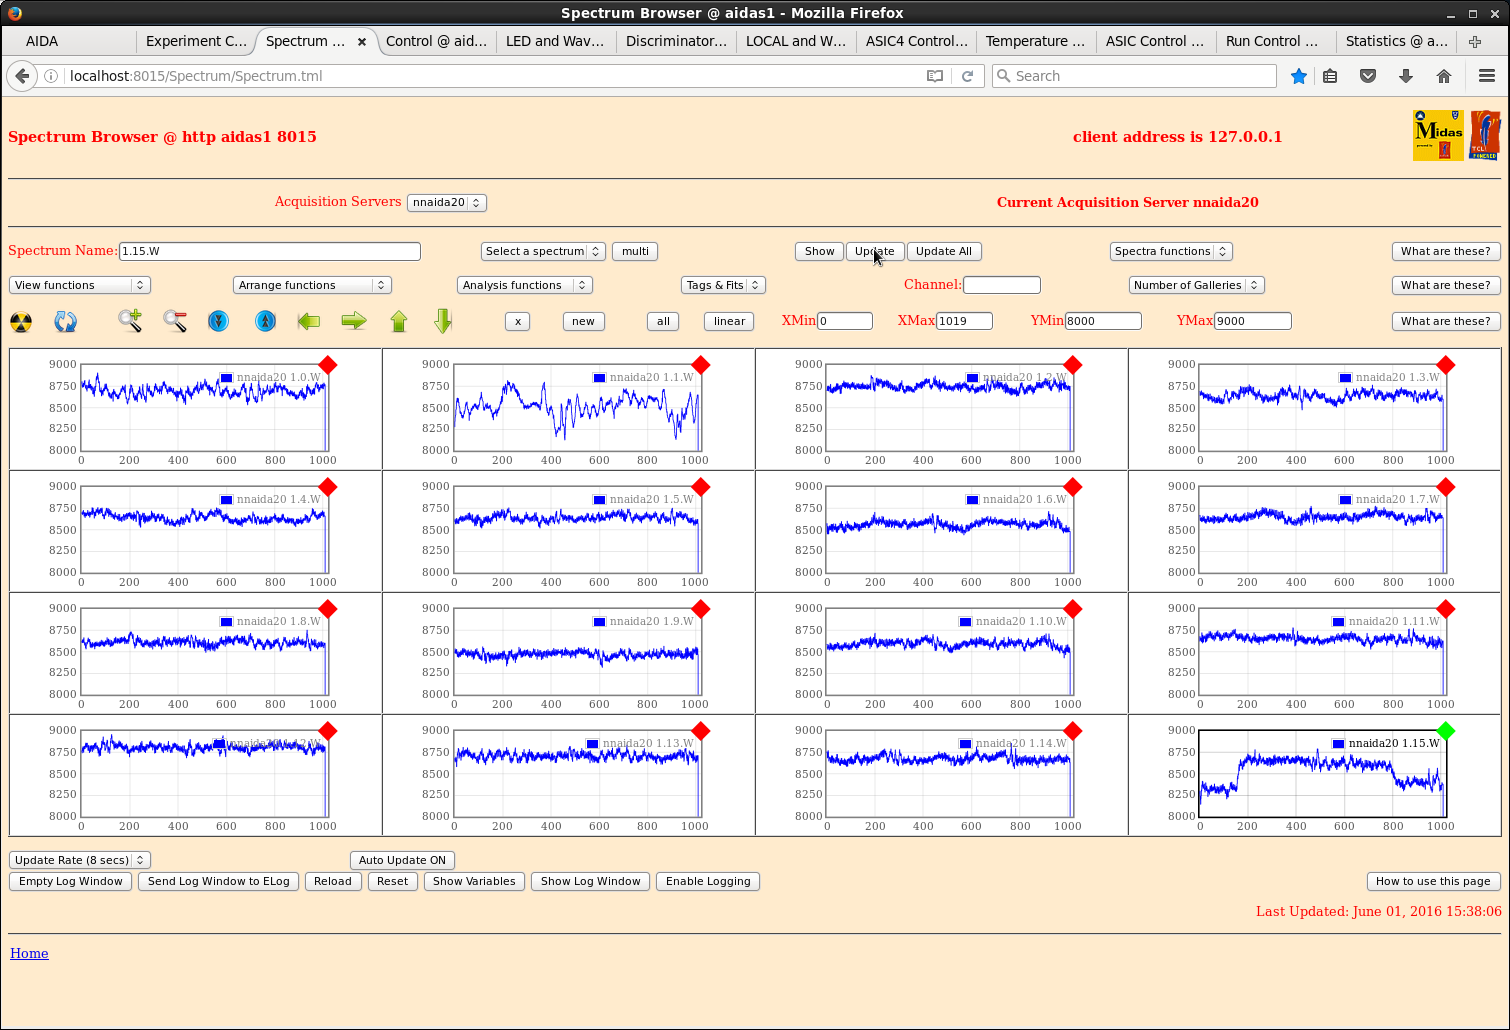
Screenshots of ASIC#1 waveforms for each side of each of the DSSSD #1 - #6 are attached.

Standard ASIC settings - tau = 8us

Typical threshold values are ~8500 (positive signals) and ~7800 (negative signals)

Large (off-scale) signals are the pulser, lower amplitude signals are betas

Currently, the noise looks OK.

Note that EURICA is currently open (in preparation for IMPACT run) and (just possibly) SAMURAI
dipole in adjacent experimental area  is now off (to be checked).

We (AIDA) have made no further changes since yesterday's addition of Field Plate grounding jumpers
to all four adaptor PCBs of DSSSD #1 and #6. |
| Attachment 1: 301.png
|
|
| Attachment 2: 302.png
|
|
| Attachment 3: 303.png
|
|
| Attachment 4: 304.png
|
|
| Attachment 5: 310.png
|
|
| Attachment 6: 311.png
|
|
| Attachment 7: 312.png
|
|
| Attachment 8: 317.png
|
|
| Attachment 9: 318.png
|
|
| Attachment 10: 320.png
|
|
|
710
|
Thu Nov 23 01:10:43 2017 |
TD, CB | Detector bias & leakage currents - October & November 2017 |
https://docs.google.com/spreadsheets/d/12hgbrywB10hGsKt5uc2HnLfZymh8_uvM6cEASbbqnBE/edit#gid=282765719 |
| Attachment 1: AIDA_leakage_current(16).xlsx
|
|
542
|
Wed Mar 29 08:13:34 2017 |
DK, PV, JL, CG | Degrader, Pb wall opening |
16:21

Chris noticed that when the degraders that are at the beam right position when they are "out" may not be fully removed from the beamline.  It's difficult to make a good
measurement, but it looks like several cm (~3 cm?).

The degrader that moves out to the beam left side has its inner-most edge roughly flush with the square opening of the polyethylene wall.

It does not seem that the issue is about the slider's center position.  This we checked yesterday and within the judgement of our eyes and limited viewing angle, several people
independently confirmed that the center of the degrader slider is near the true center of BRIKEN and AIDA with respect to the beam axis.  It appears to be an issue of the
slider's total track length.  Also it should be noted that the degraders are installed in a somewhat asymmetric way, so the consideration of one opening side of the degraders
when fully open and another isn't fully out may not be germane.

16:44

We shifted the center of the degrader slider to be about less 1 cm to the beam right.  So now the degraders a bit more symmetric as far as their inner edges are related to the
opening in the polyethylene wall.

As for the Pb wall, its opening is ~10.5 cm.  The "window" in the Pb wall is slightly shifted to the beam left side.  The left side is ~5.5 cm from the center, where as the right
side is <5.5 cm from the center. |
|
85
|
Thu Apr 30 03:00:48 2015 |
TD | Degrader changes |
From 20.00 29.4.15

Added
 3mm Al plate in front of MACI + Veto plastic detectors
(offset in front of AIDA)

From 09.00 30.4.15

Added
 2mm Al plate following MUSIC
 +
1.0 + 0.6 + 0.3 + 0.4 = 2.3mm Al plate (variable degrader) |
|
450
|
Thu Nov 10 11:57:35 2016 |
TD | Data directory NP1412 renamed as RIBF123R1 |
Data directory NP1412 renamed as RIBF123R1

... there are several NP1412 'experiments' in the current schedule ... 1412 may be a date |
|
669
|
Sun Jun 18 06:35:22 2017 |
TD | DSSSD bias & leakage current spreadsheet |
https://docs.google.com/spreadsheets/d/12hgbrywB10hGsKt5uc2HnLfZymh8_uvM6cEASbbqnBE/edit#gid=808110721 |
| Attachment 1: AIDA_leakage_current(15).xlsx
|
|
718
|
Thu Jun 21 06:48:22 2018 |
TD, OH | DSSSD HV cabling |
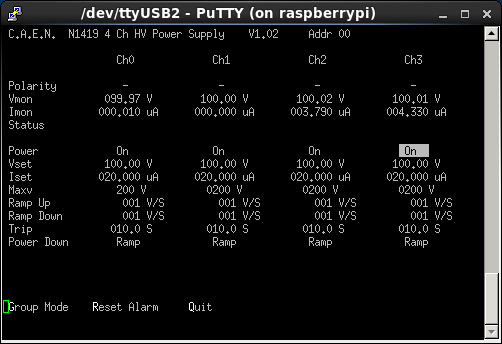
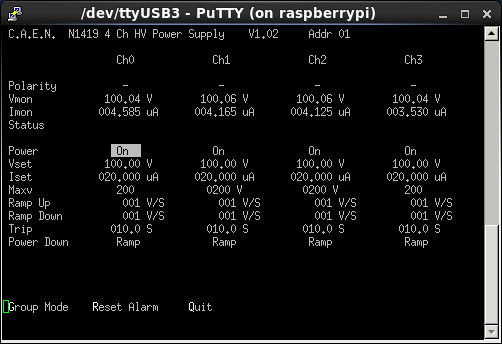
The DSSSD HV cabling has been changed in preparation for configuration change
from 6x DSSSDs to 8x DSSSDs as follows:

FROM                 TO

DSSSD  N1419  HV     DSSSD  N1419  HV
#      Addr   #      #      Addr   #

                     1      0      1
                     2      0      2
1      0      1      3      0      3
2      0      7      4      0      4
3      0      3      5      1      5
4      0      4      6      1      6
5      1      5      7      1      7
6      1      6      8      1      8

See attachments 1 & 2 - DSSSDs # 1-2 not installed yet |
| Attachment 1: 50.png
|
|
| Attachment 2: 51.png
|
|
|
16
|
Sun Oct 5 22:42:56 2014 |
Chris Griffin | DL tests on 02/10/14 |
A late entry for the work I carried out on Thursday.
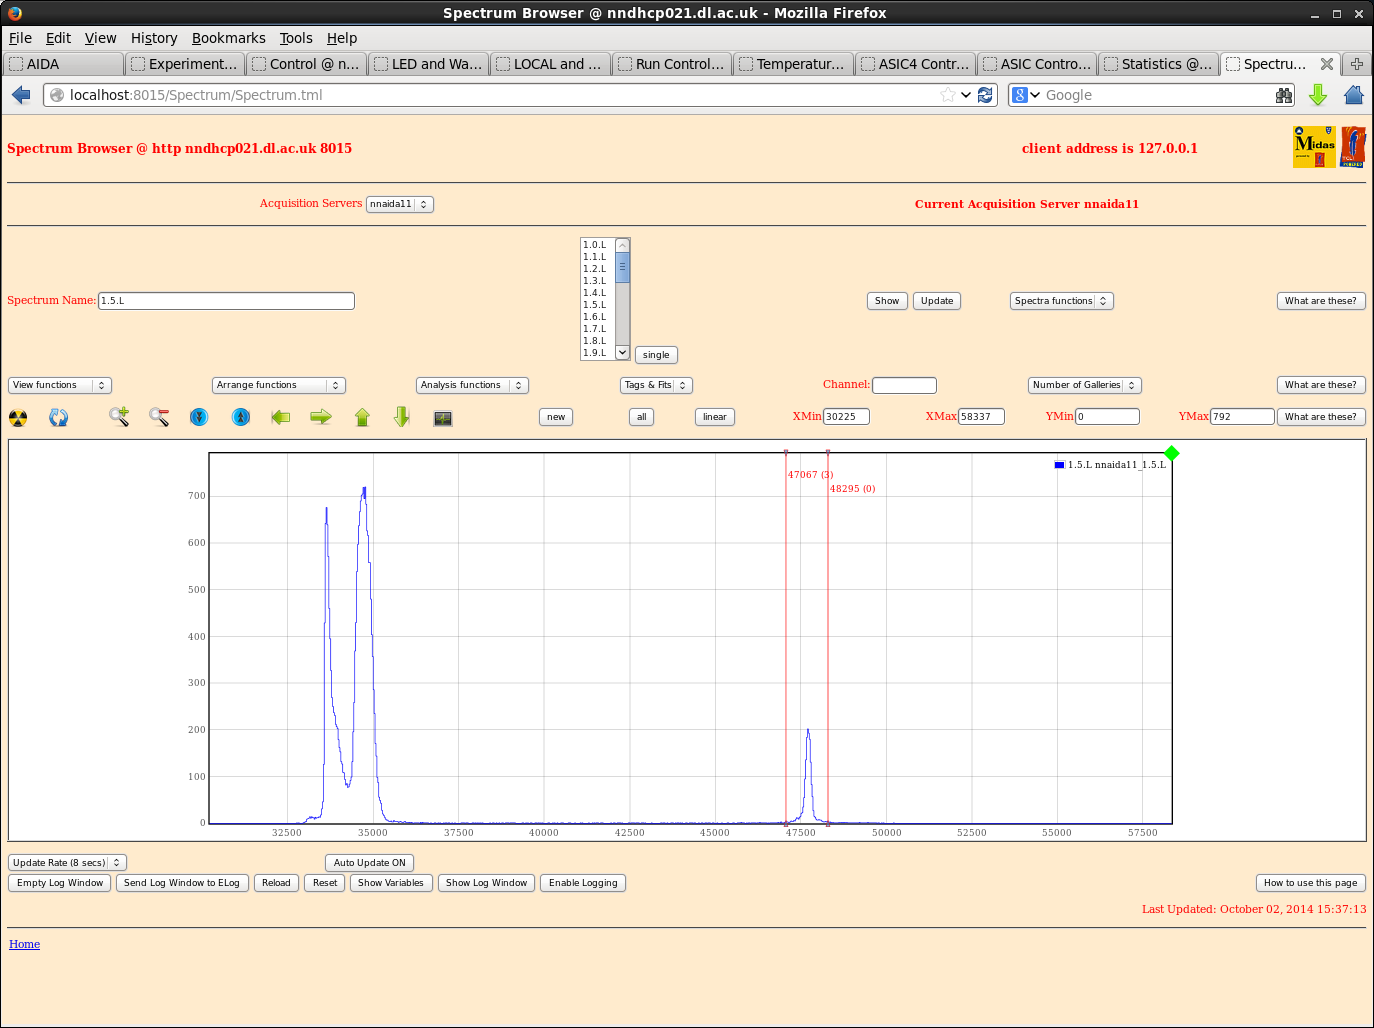
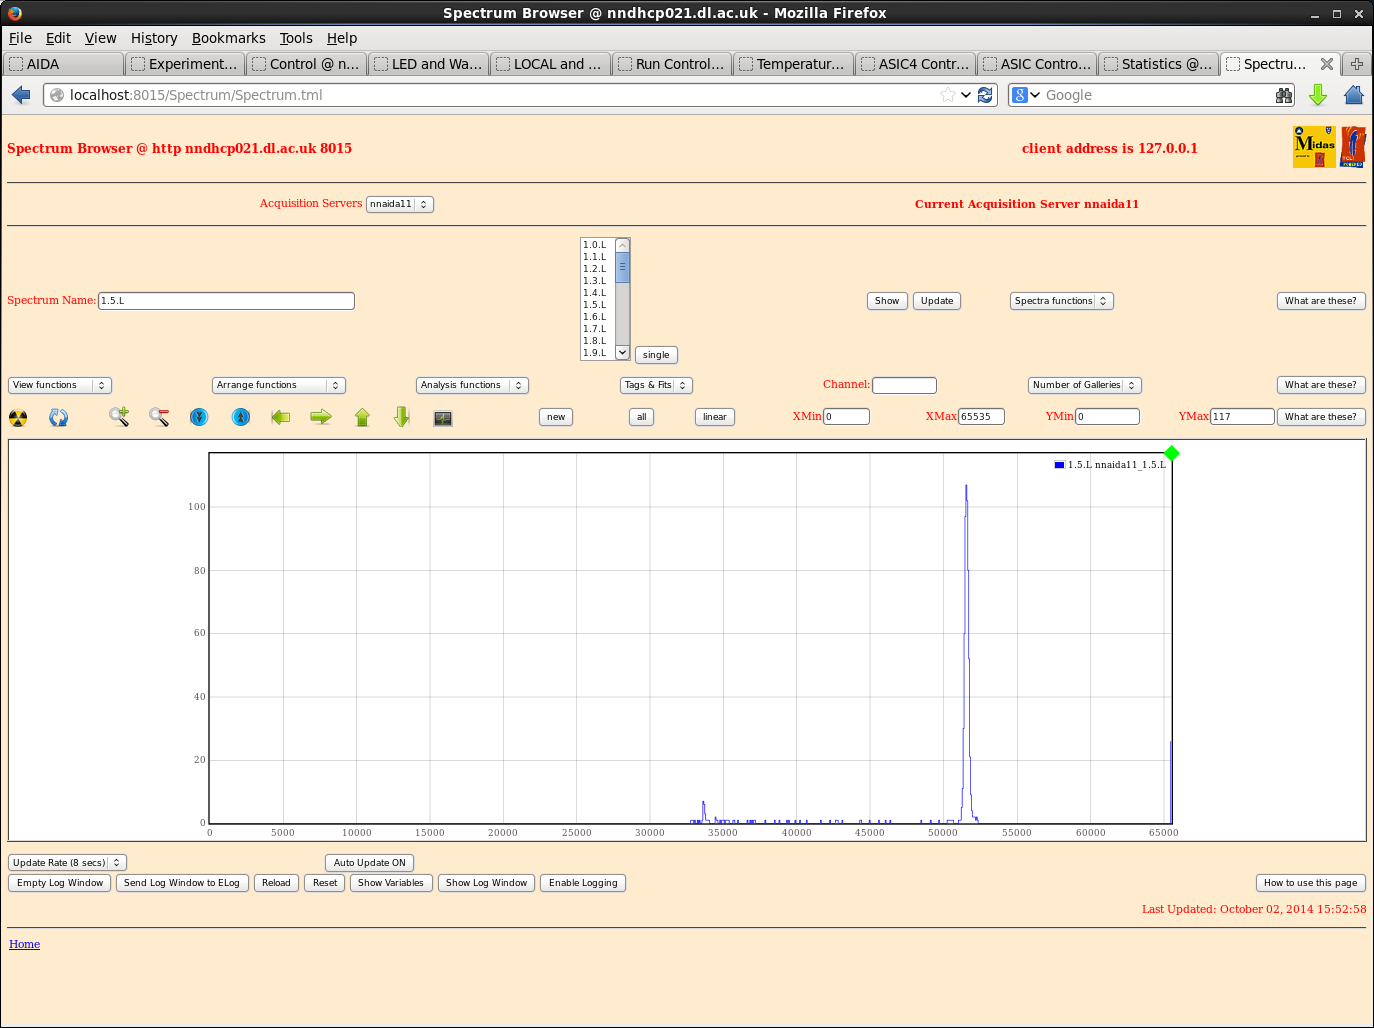
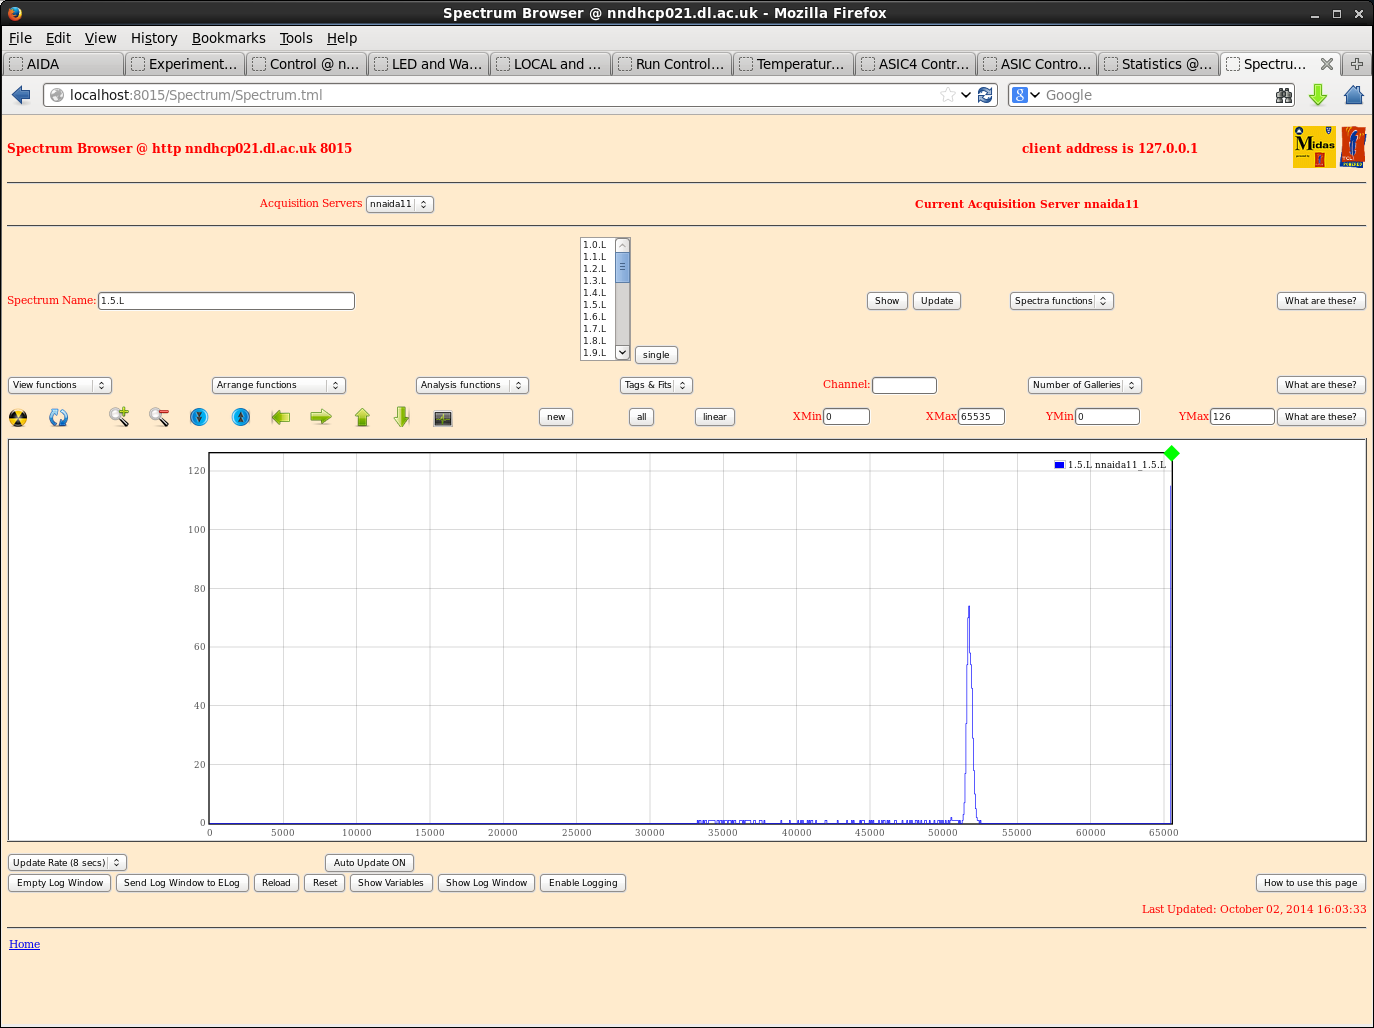
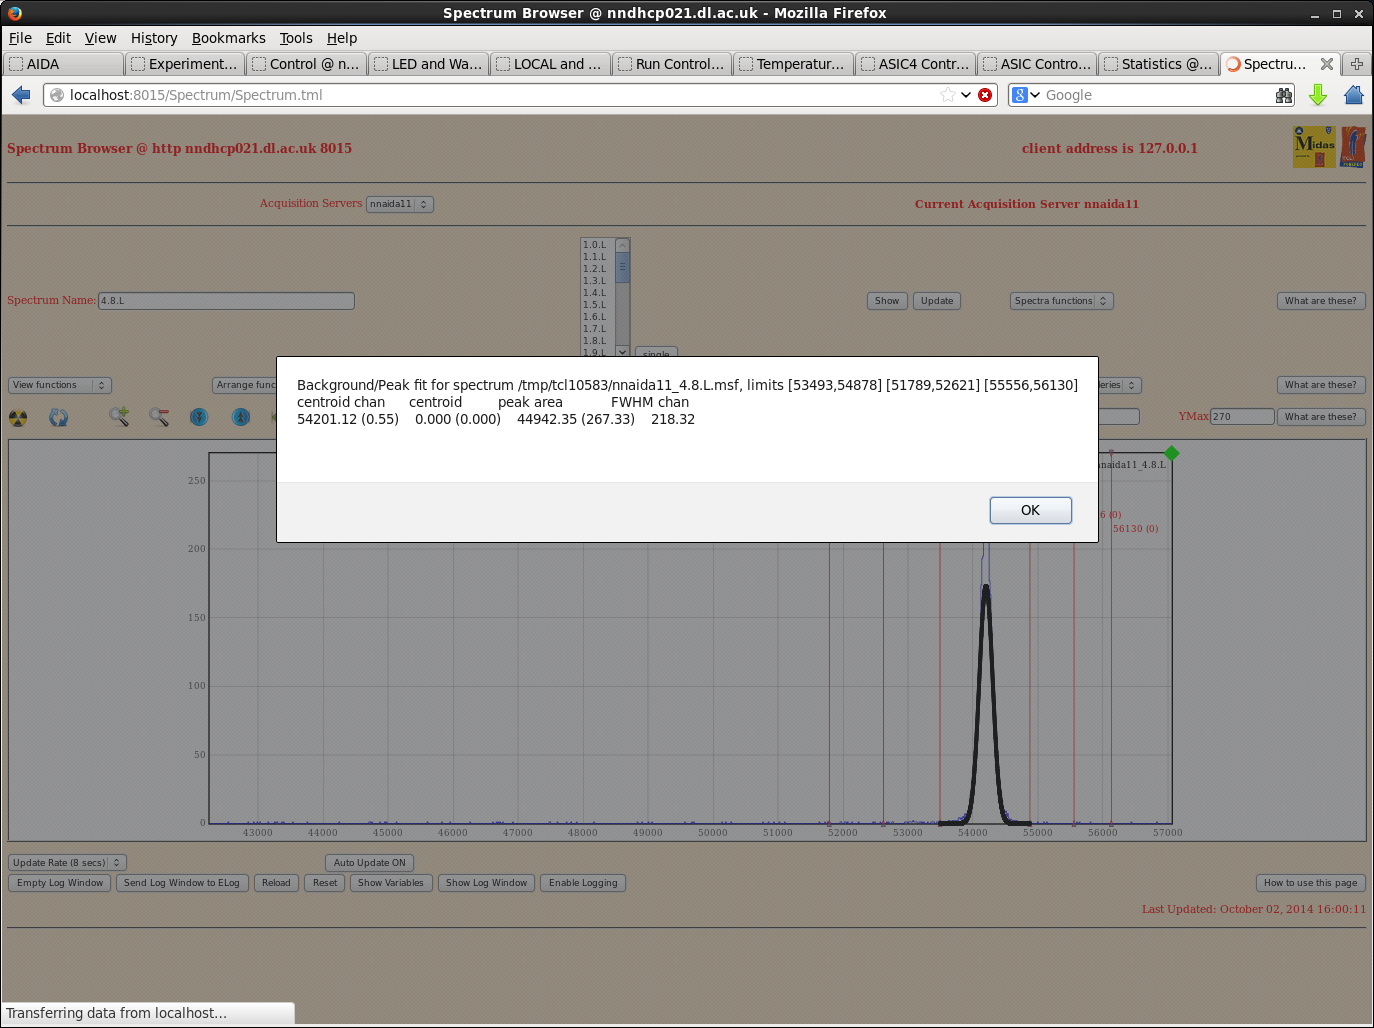
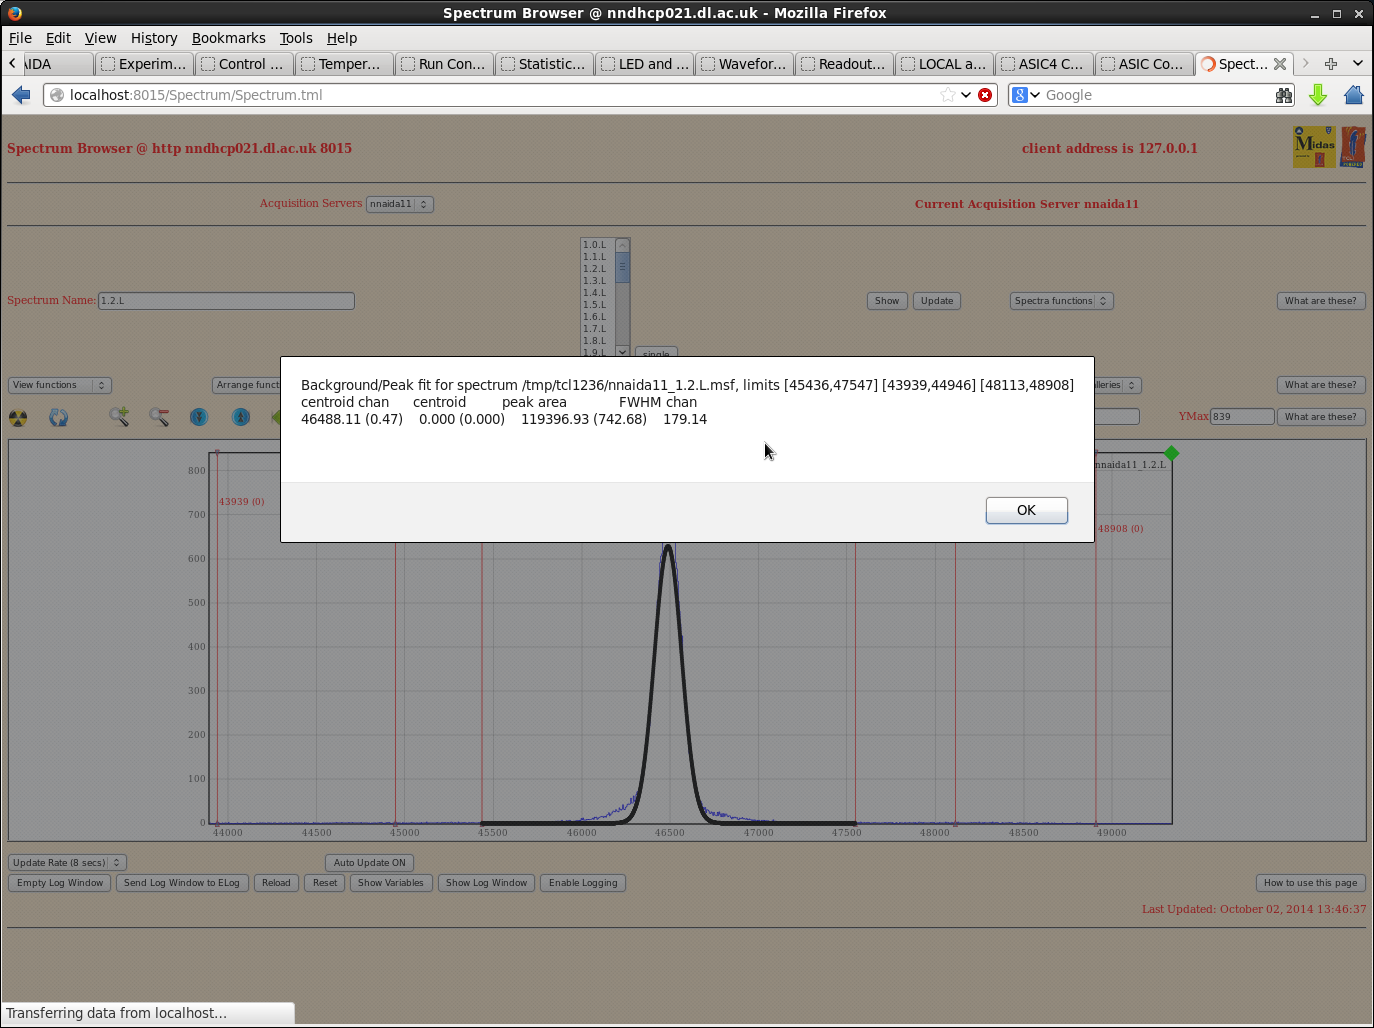
With the Emco box providing the HV, the pulser peak showed double (or triple) peaks. This was not seen with the SY1527 so I thought this would be better for looking at peak widths.
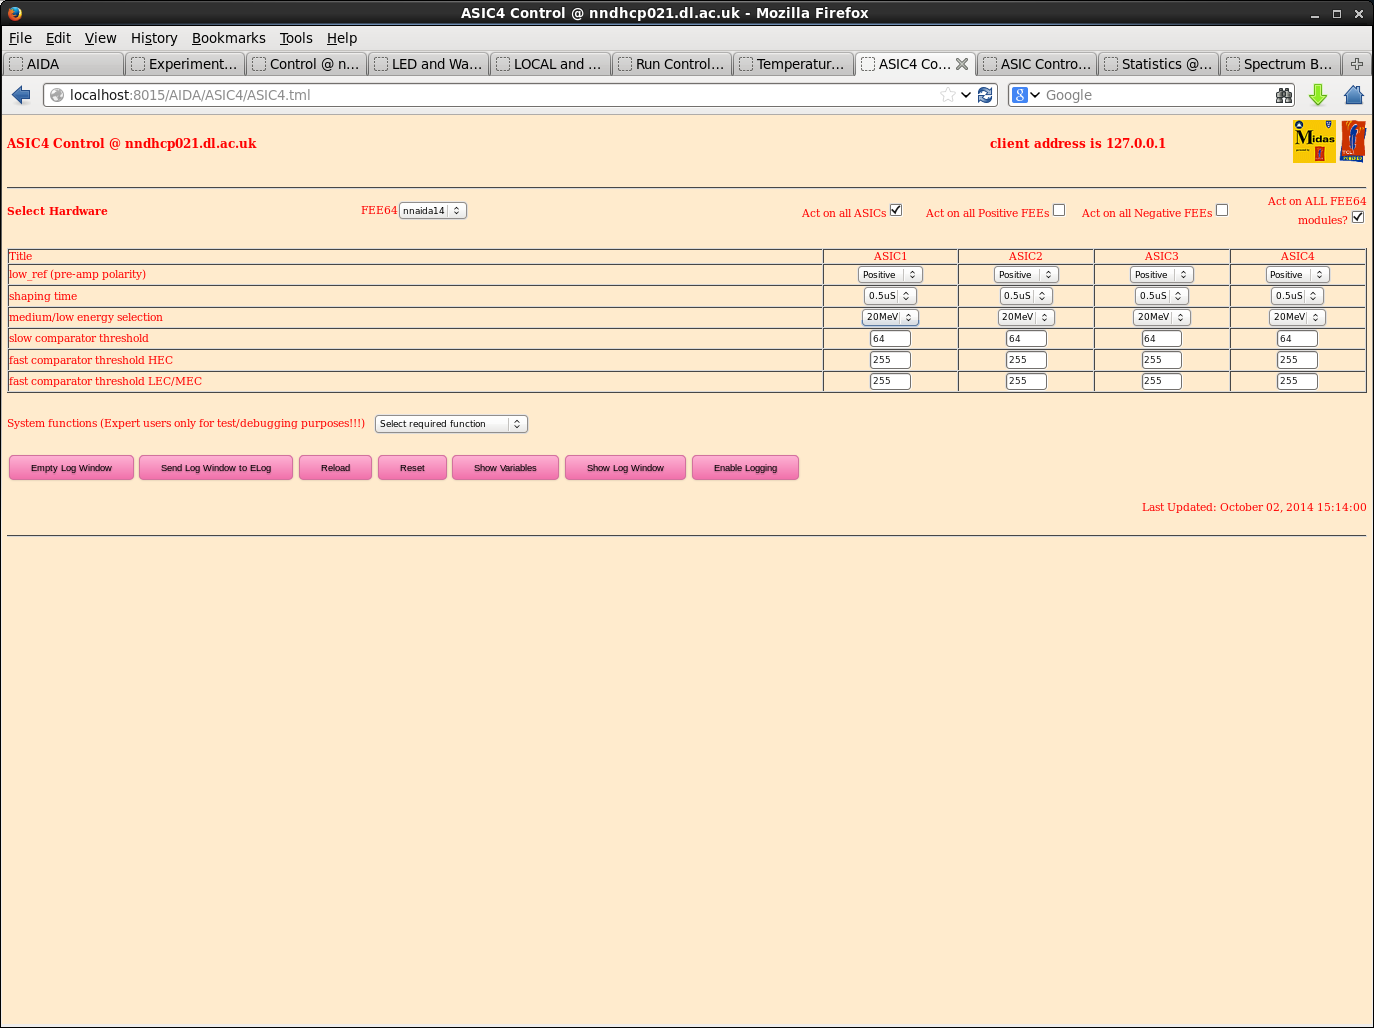
Same ASIC settings my previous entry, and a HV of 200V with leakage current 3.8uA.
I varied the shaping time in each module using the ASIC4 control page as this also changes the hold time automatically. Slow comparitor threshold of 64.
Checked each module and took sample channels from a couple of ASICs in each but made qualitative comparisons with random channels in all ASICs to make sure the chosen ones were representative of the ASIC/module as a whole.
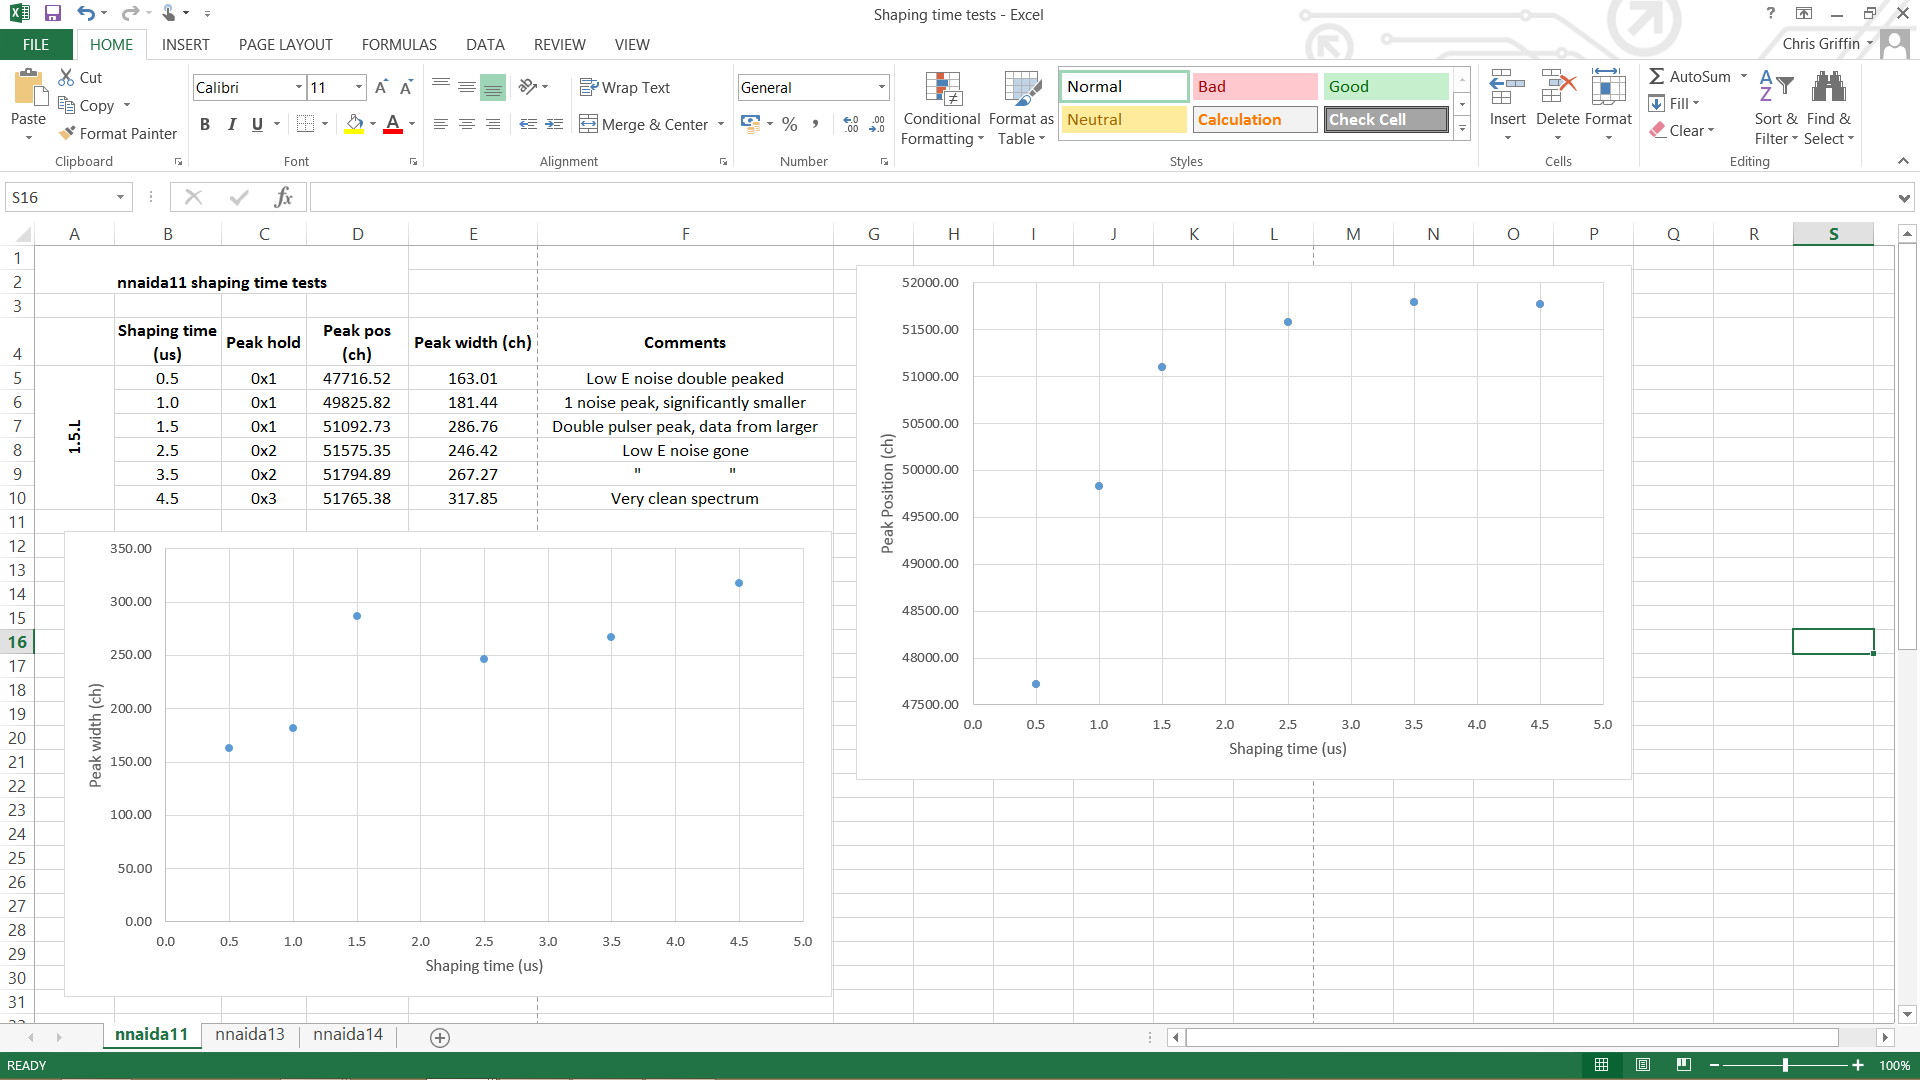
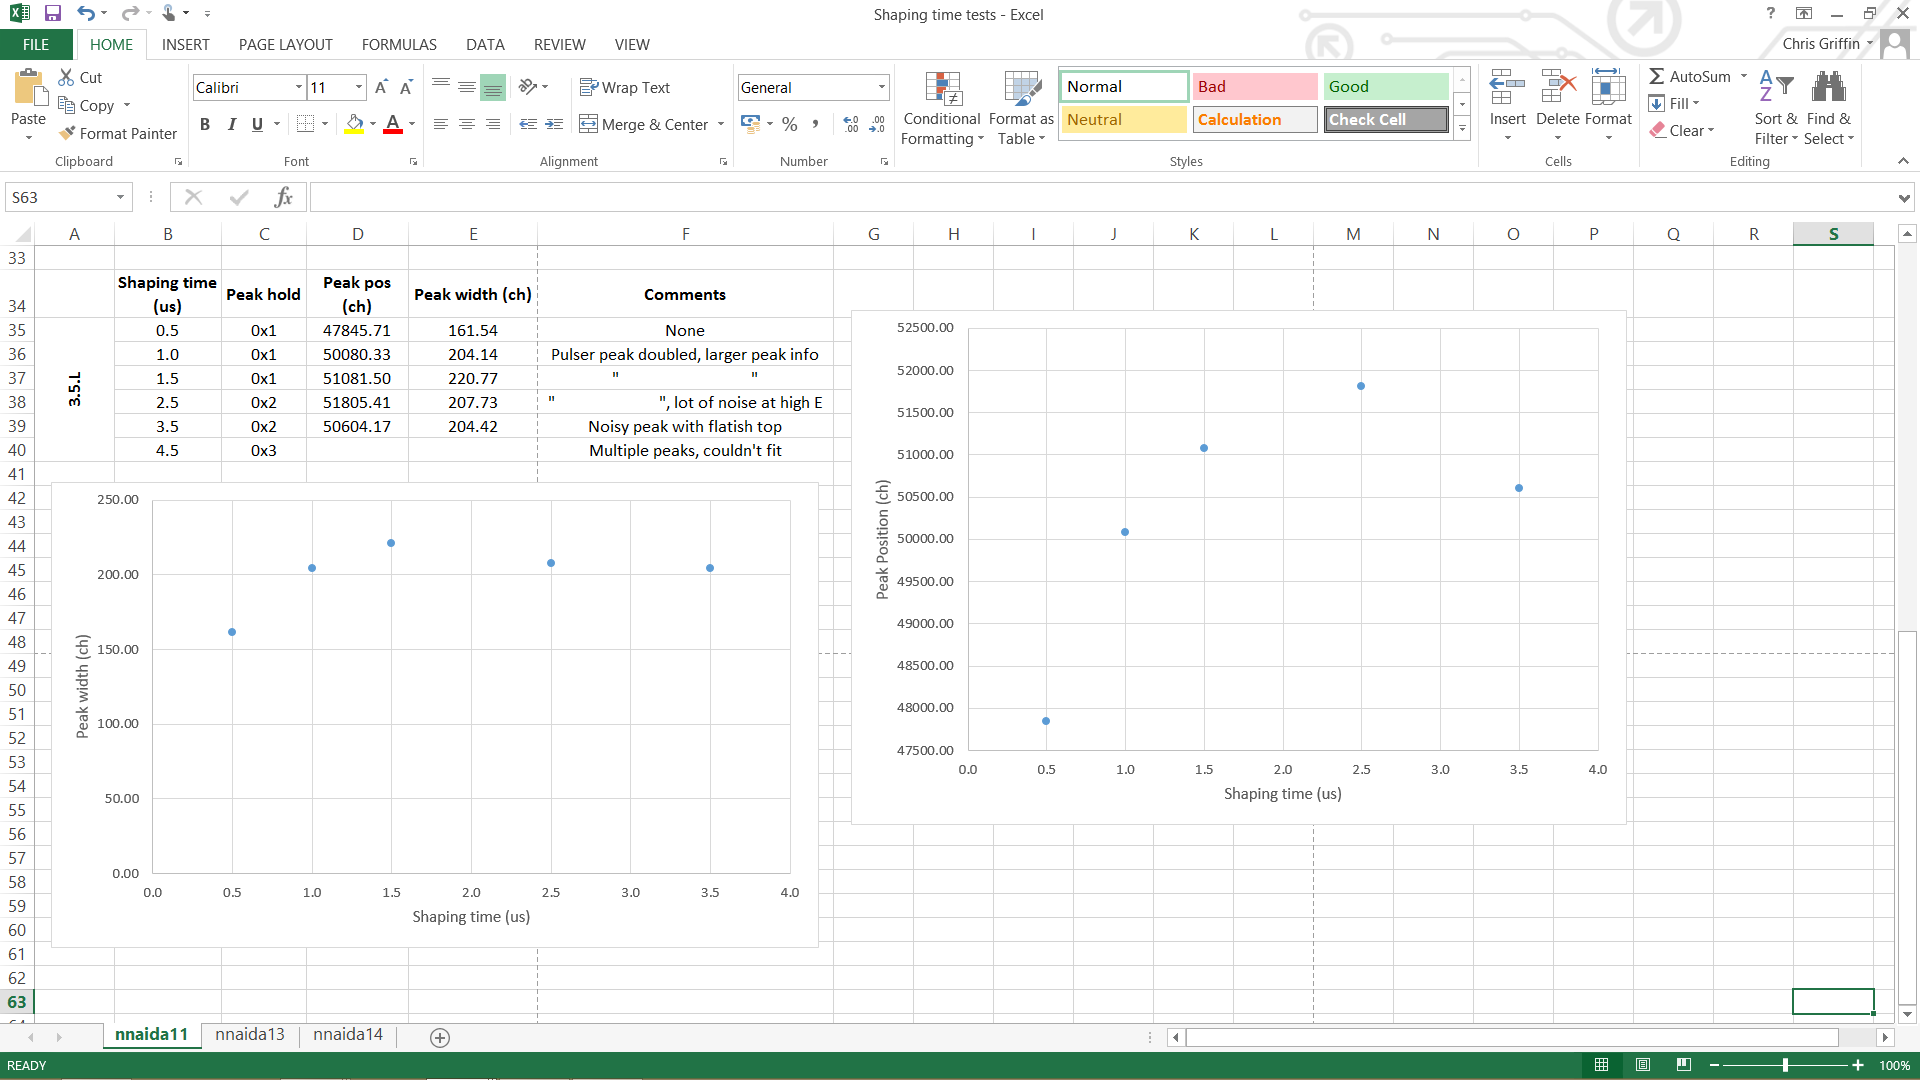
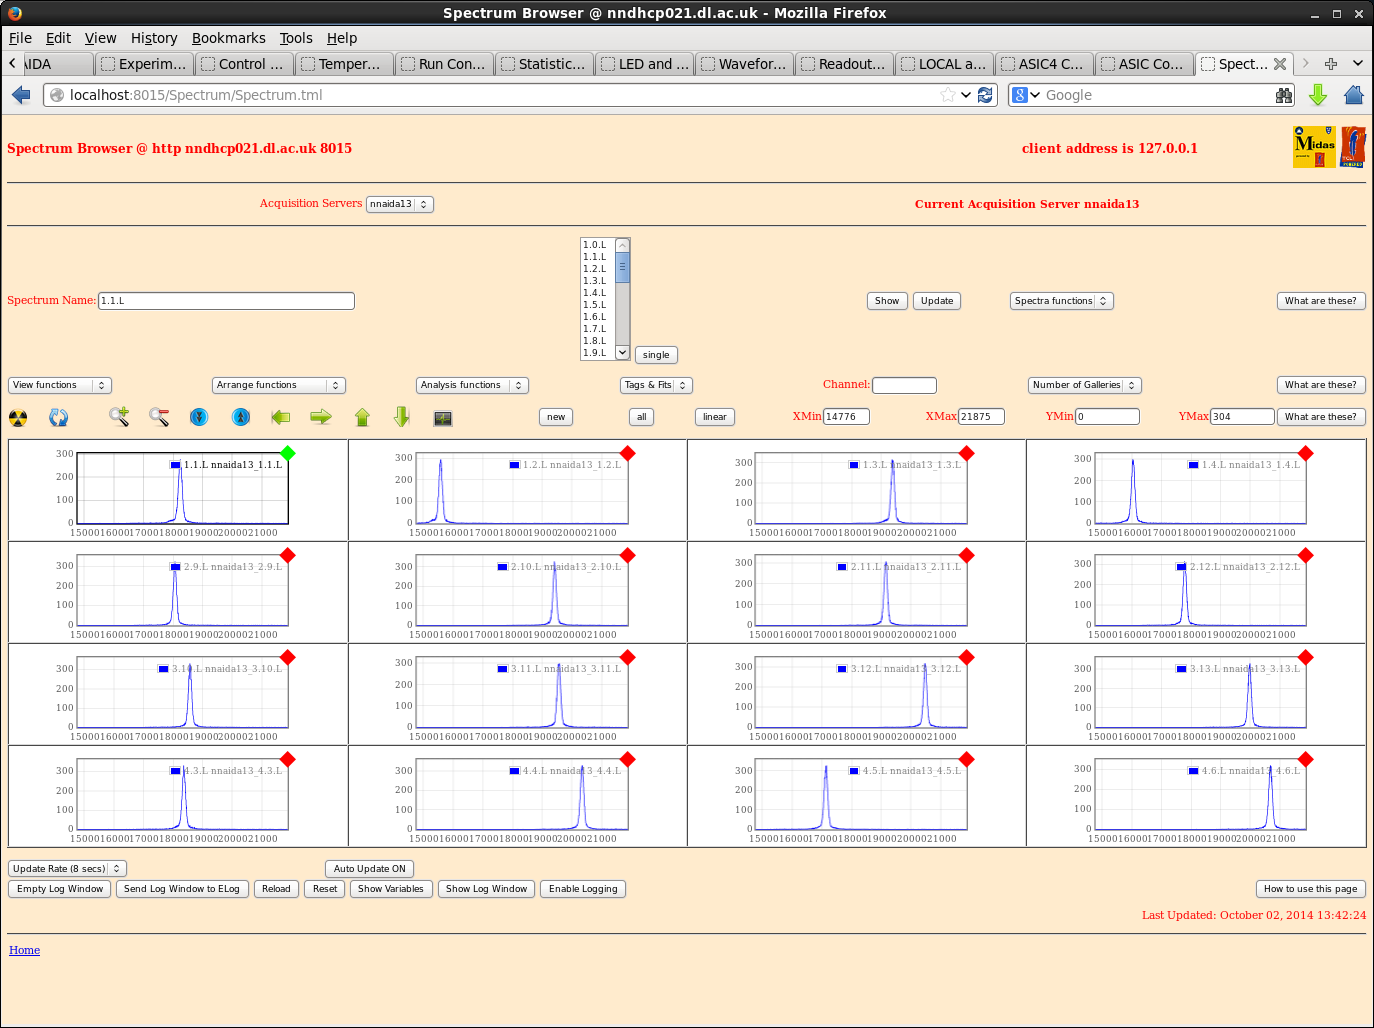
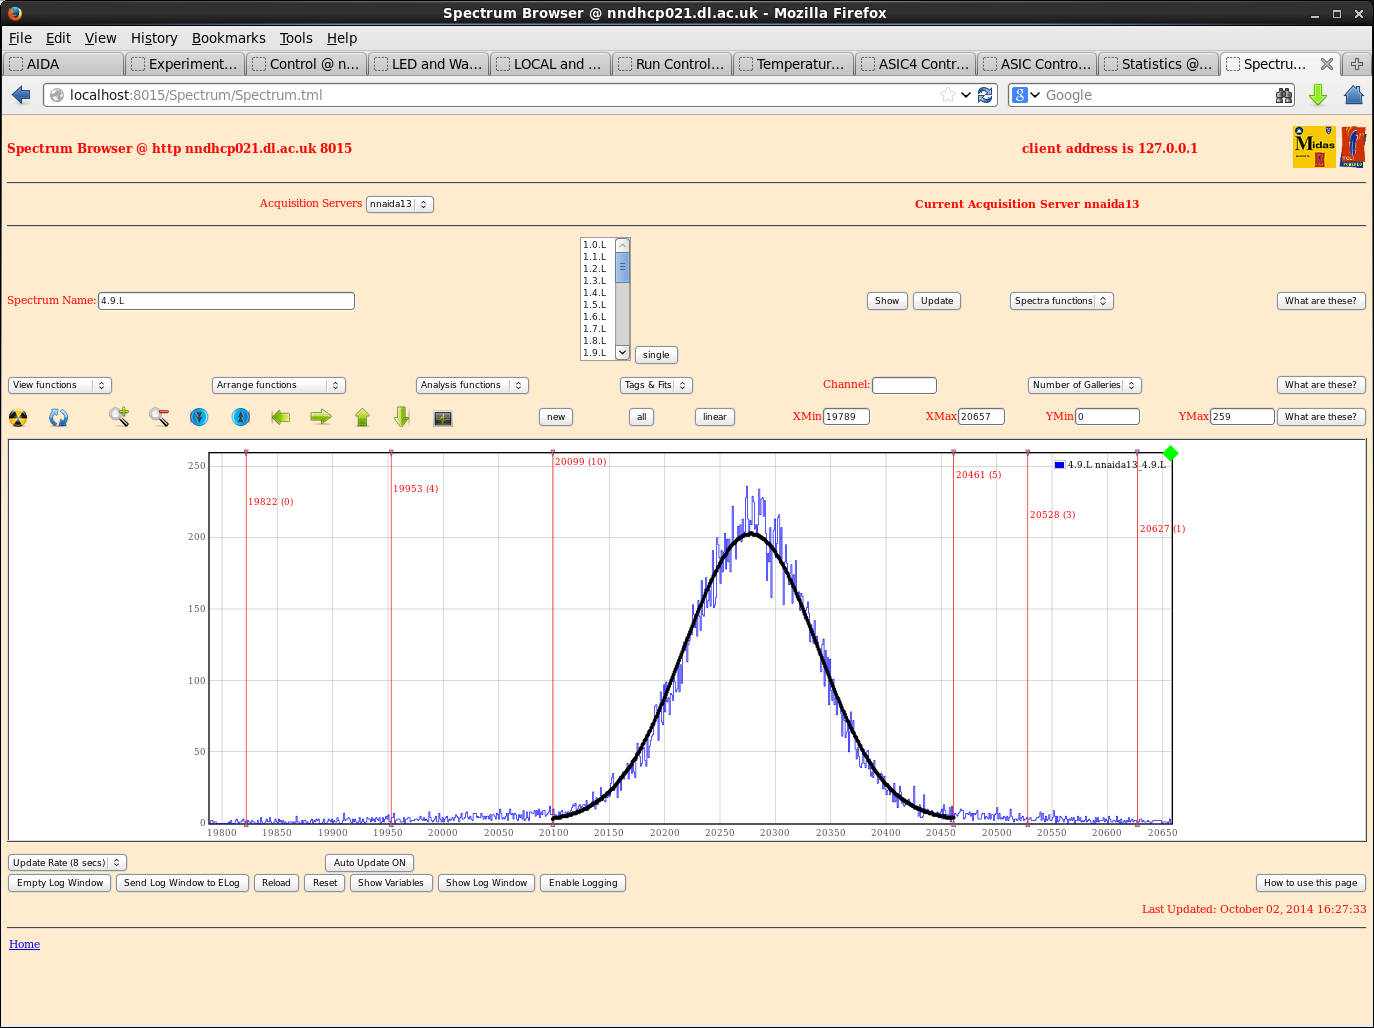
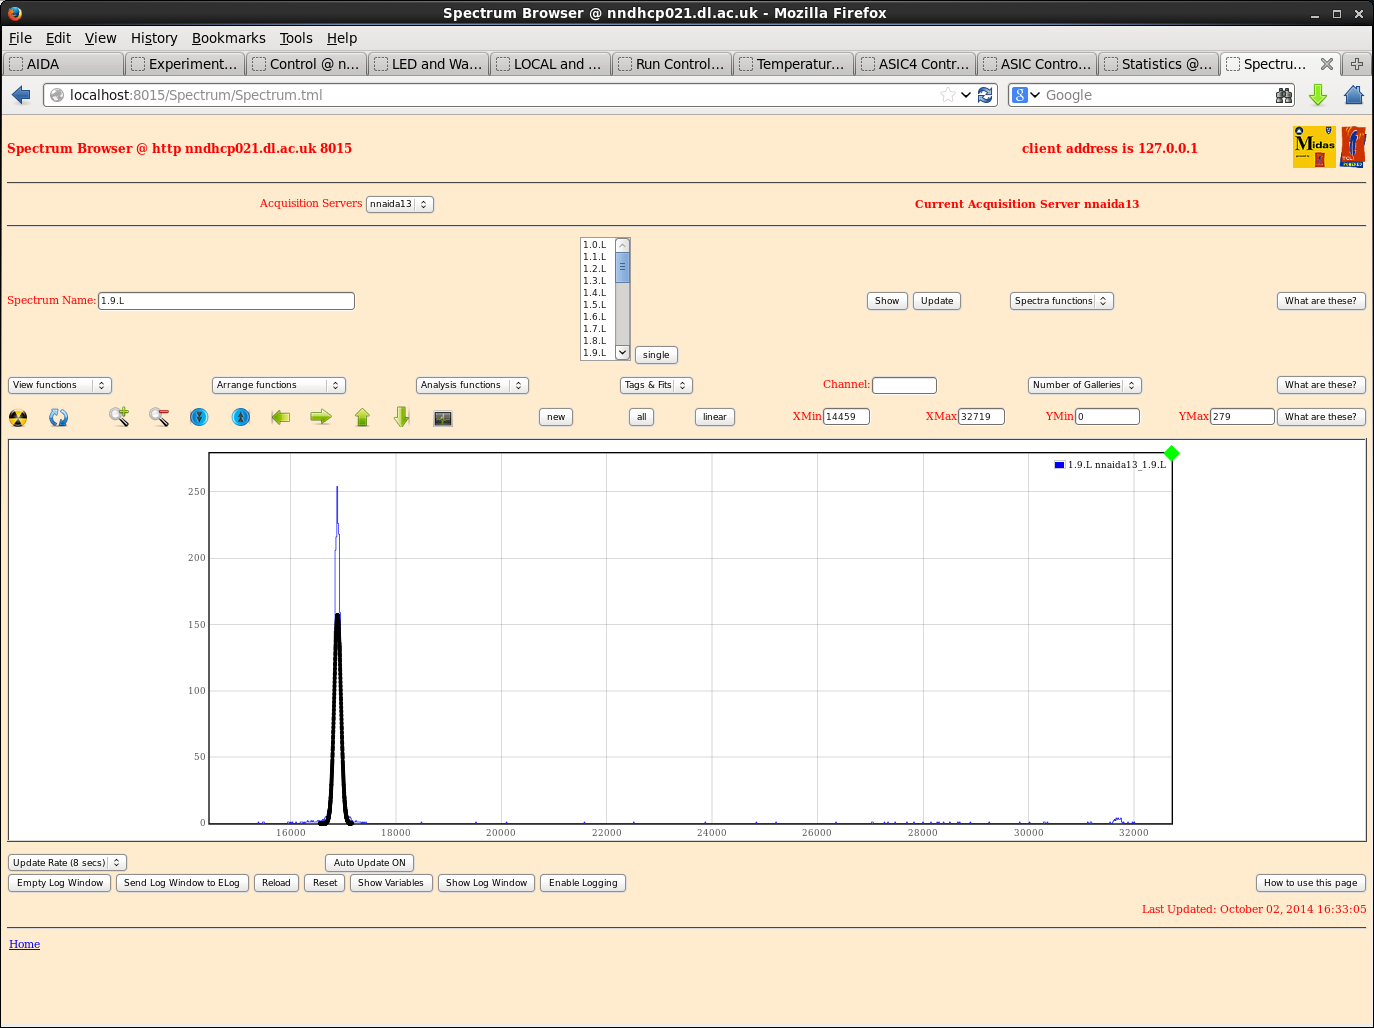
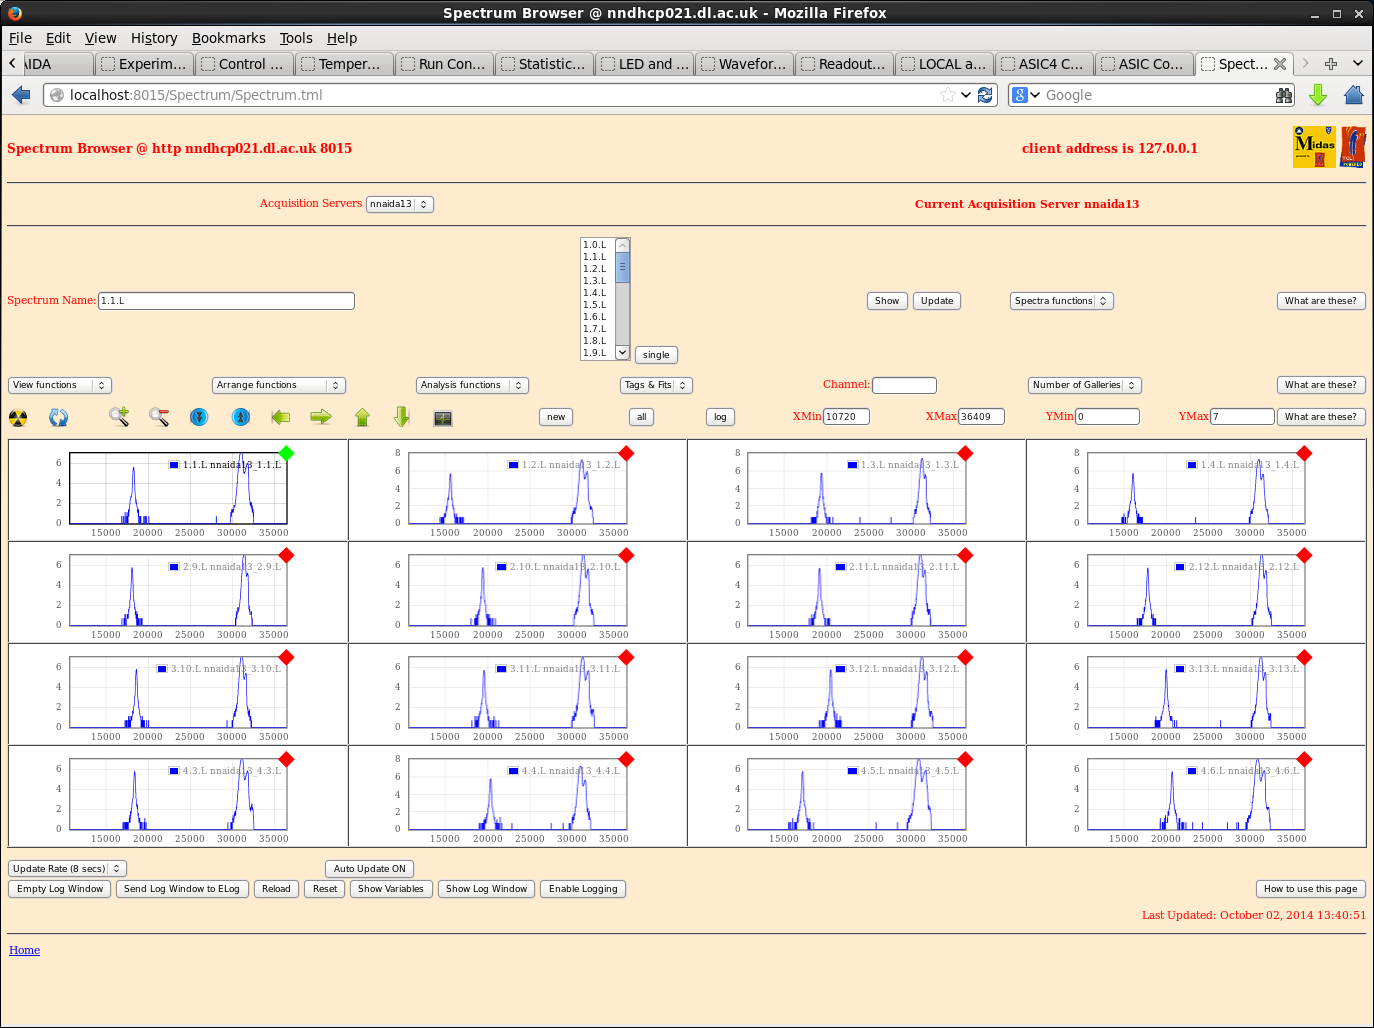
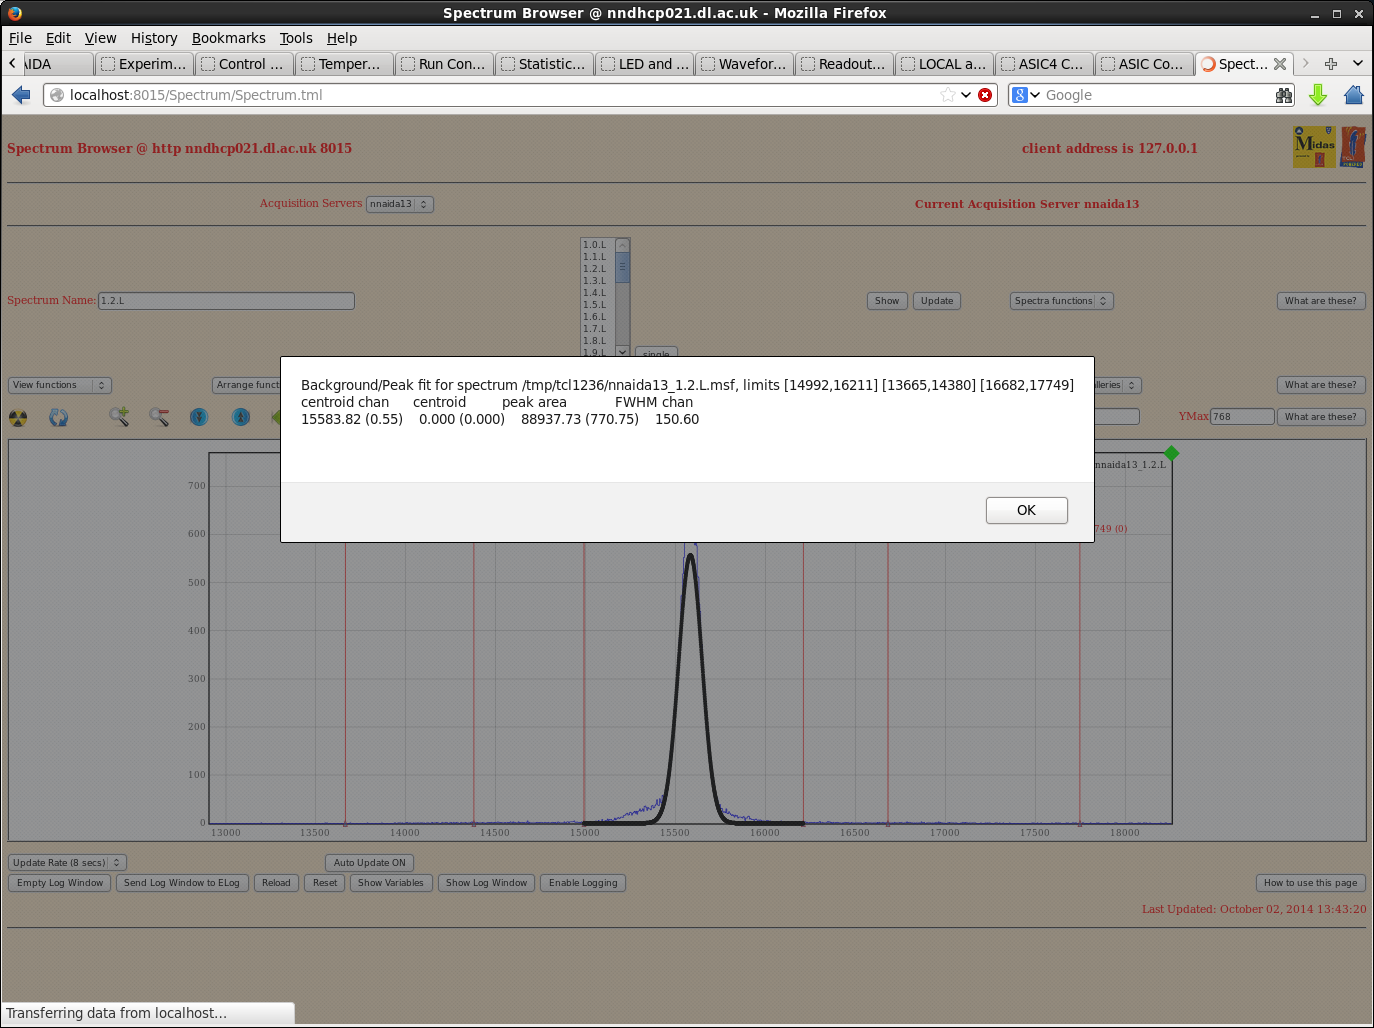
Tables and graphs are included below for nnaida11 and 13. nnaida13 showed a high level of low E noise on some spectra, but the pulser peaks were always well defined single peaks.
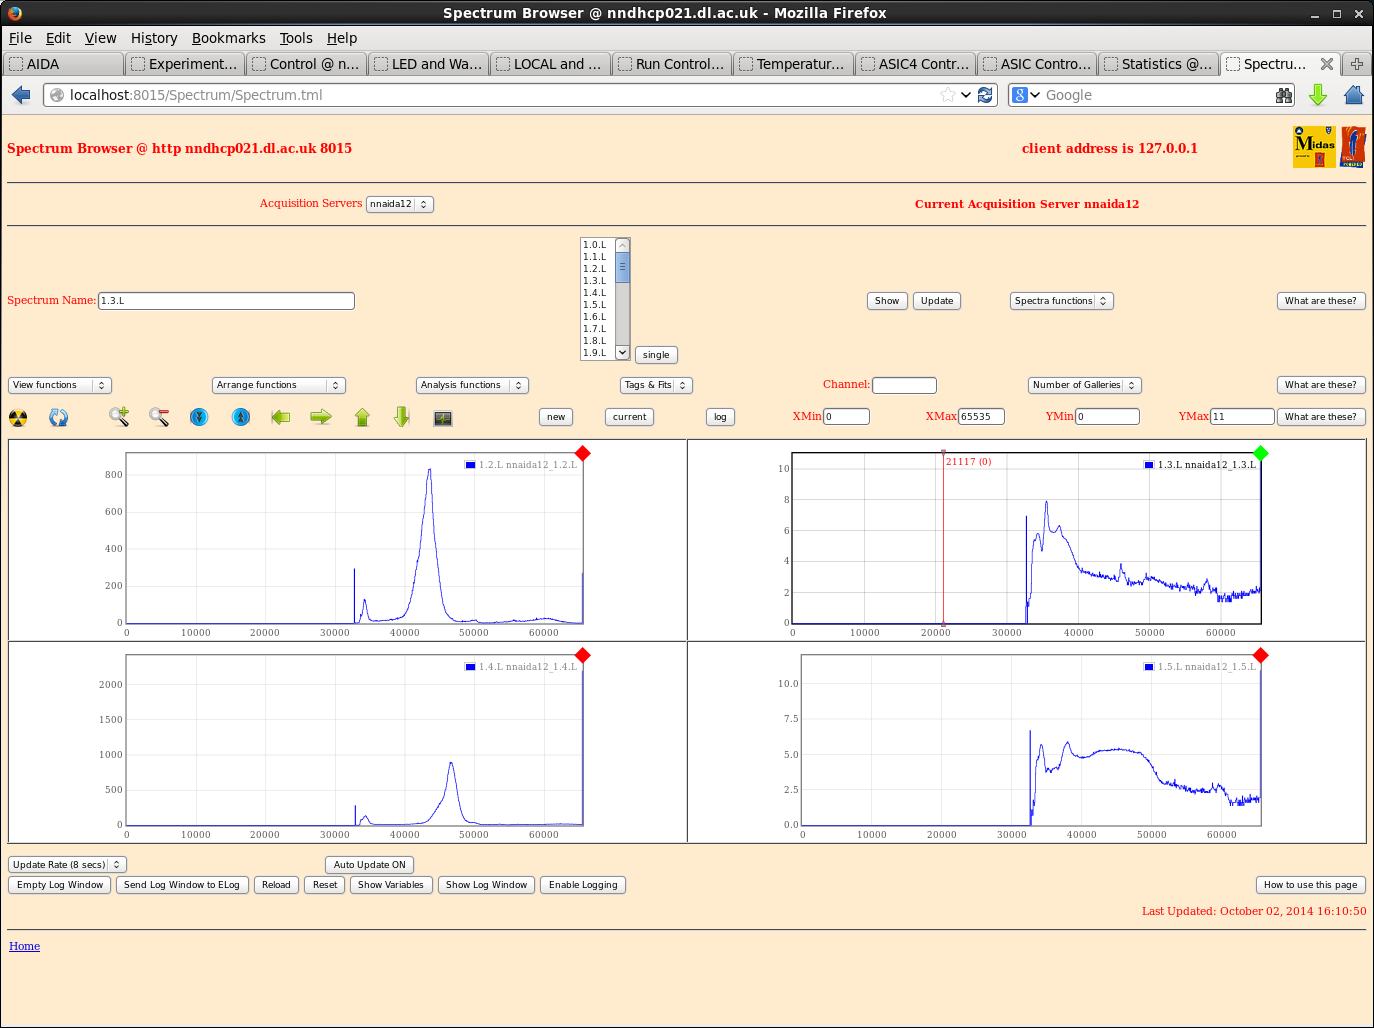
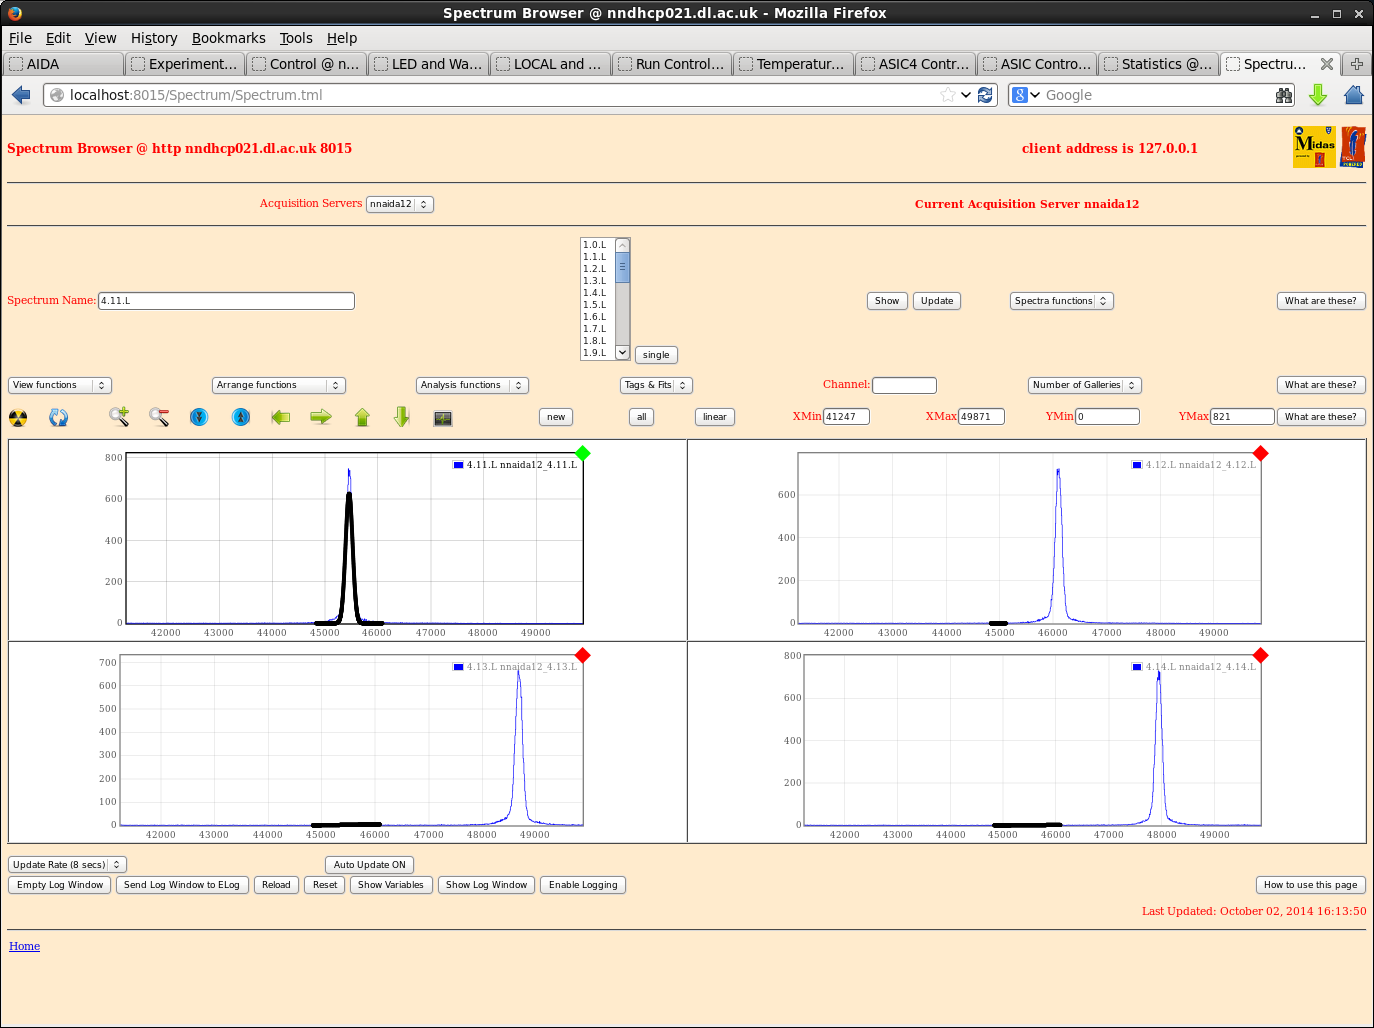
nnaida12 showed noises across the full range of many spectra in all ASICs apart from ASIC4. Patrick suggested this module may possibly be suffering and need replacing. A quick scan through some channels showed:
- average peak width @ shaoing time of 0.5us of ~150-180 ch
- same at shaping times of 2.5 and 4.5us. Noise present over full range throughout
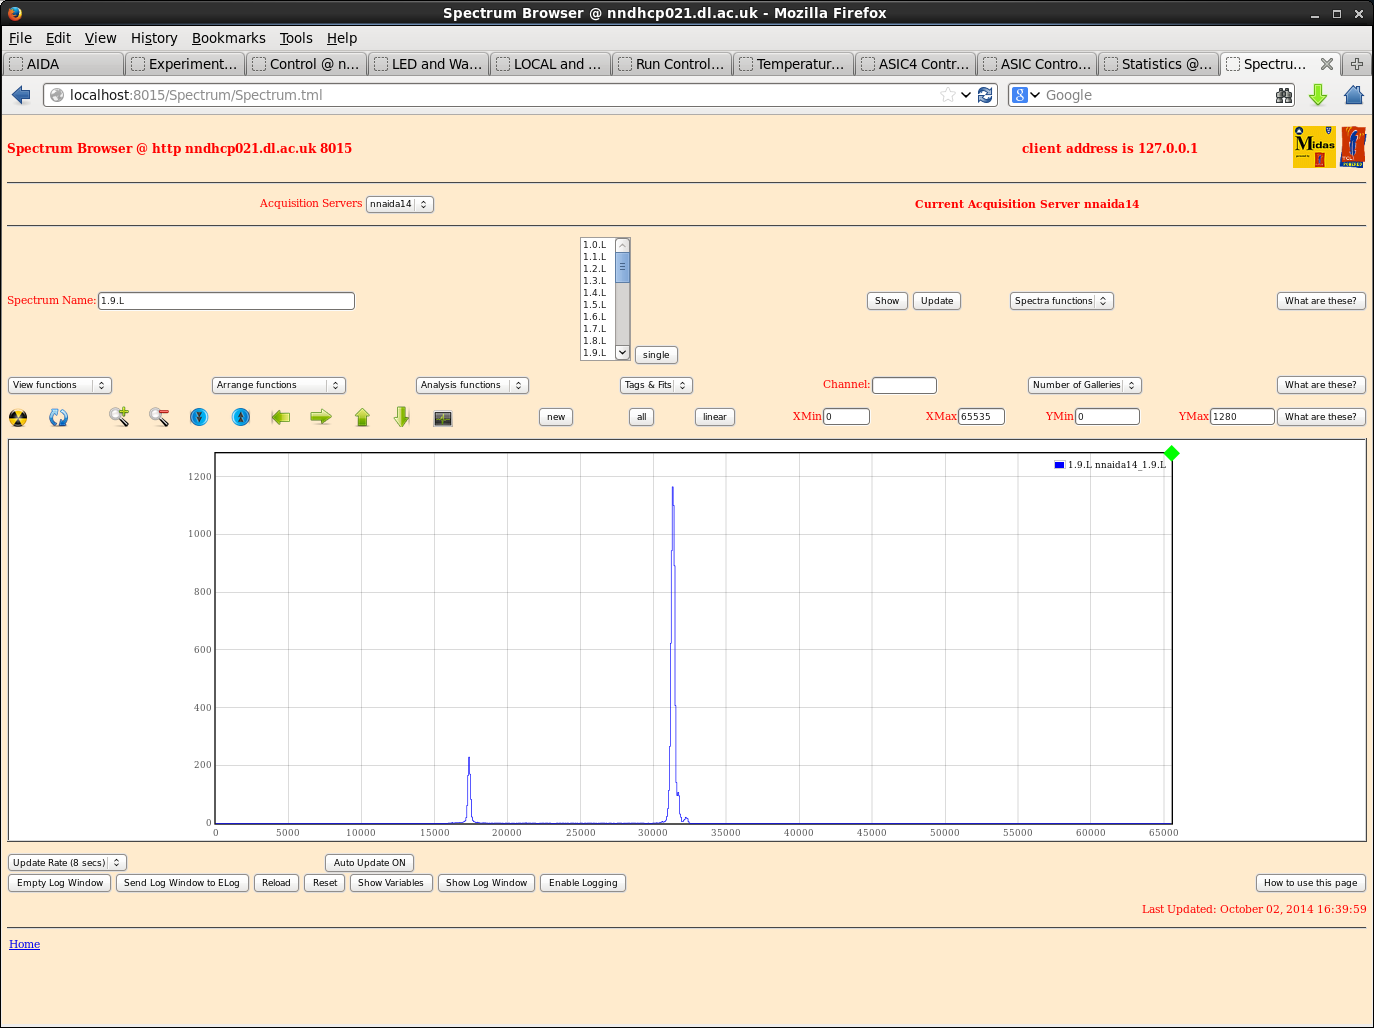
My taxi was arriving so I didn't have chance to go through nnaida14 in depth, but a quick scan showed peak widths within ~10-15ch of those seen in nnaida13. |
| Attachment 1: ASIC4control-orig.png
|
|
| Attachment 2: nnaida11-SY1527spec.png
|
|
| Attachment 3: nnaida11-SY1527_2.5stWide.png
|
|
| Attachment 4: nnaida11-SY1527_4.5st.png
|
|
| Attachment 5: nnaida11-SY1527_4.8.Lpeak3.5st.png
|
|
| Attachment 6: nnaida11-Sy1527peakEx.png
|
|
| Attachment 7: nnaida11-1.5.L-excel.png
|
|
| Attachment 8: nnaida11-3.5.L-excel.png
|
|
| Attachment 9: nnaida12-SY1527_FSnoise.png
|
|
| Attachment 10: nnaida12-SY1527good.png
|
|
| Attachment 11: nnaida13-SY1527peaks.png
|
|
| Attachment 12: nnaida13-SY1527_0.5st.png
|
|
| Attachment 13: nnaida13-SY1527_1.5st.png
|
|
| Attachment 14: nnaida13-SY1527noise.png
|
|
| Attachment 15: nnaida13-SY1527peakEx.png
|
|
| Attachment 16: nnaida13-SY1527peakEx2.png
|

|
| Attachment 17: nnaida14-SY1527_1st.png
|
|
|
493
|
Mon Nov 28 15:53:39 2016 |
AE, AT, RG, CG | DAQ synchronization |
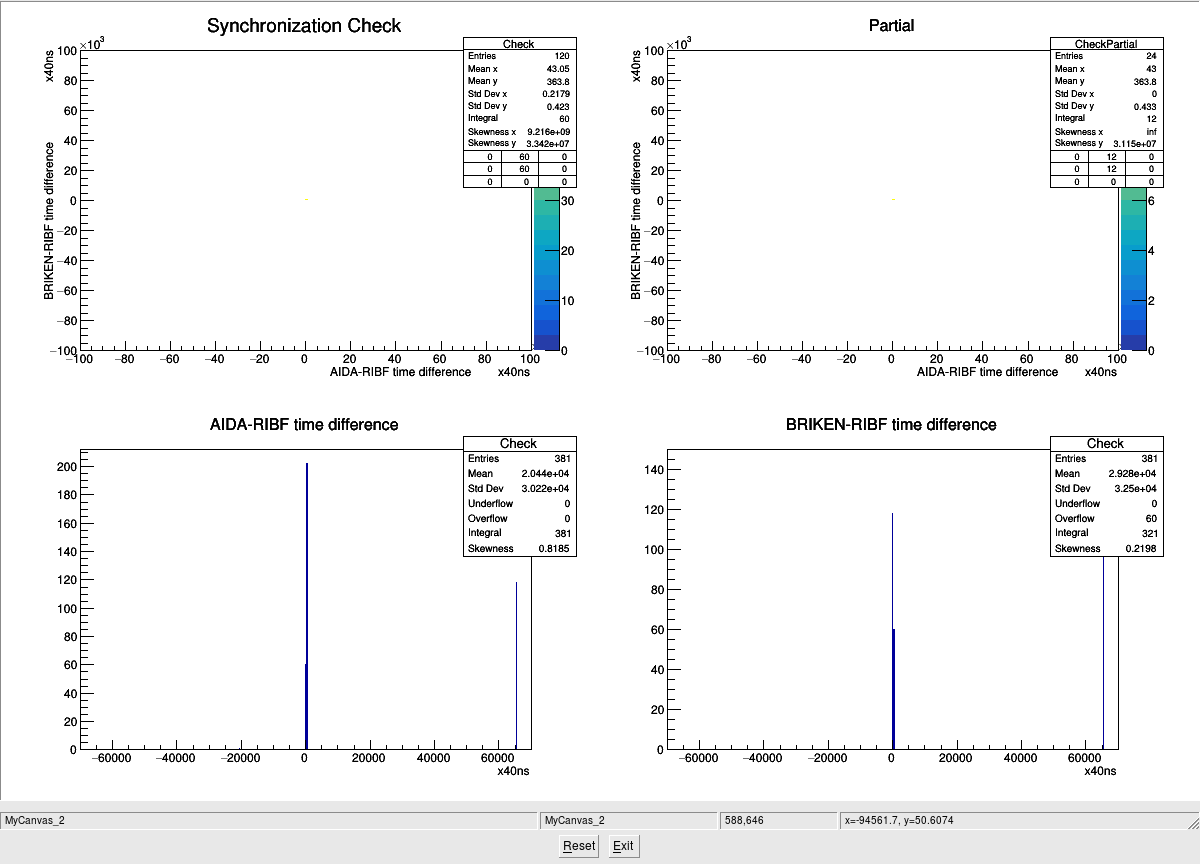
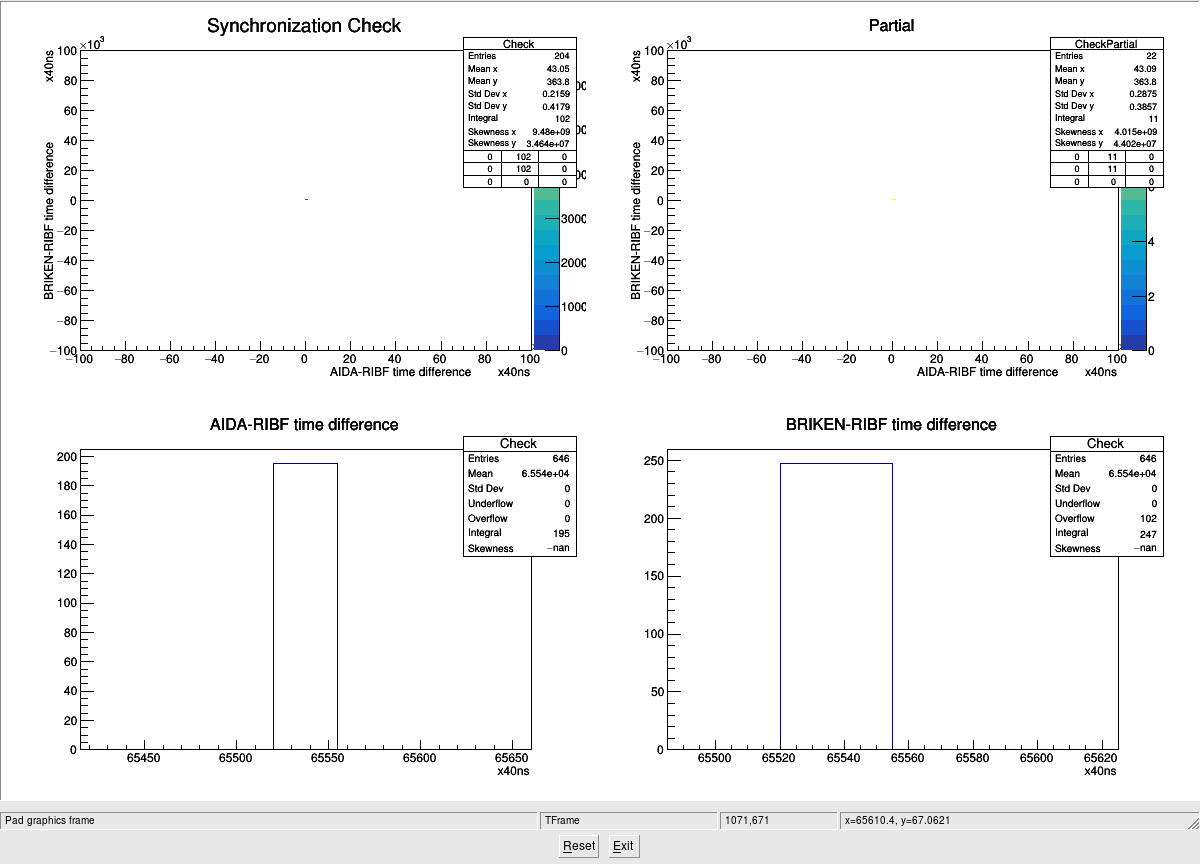
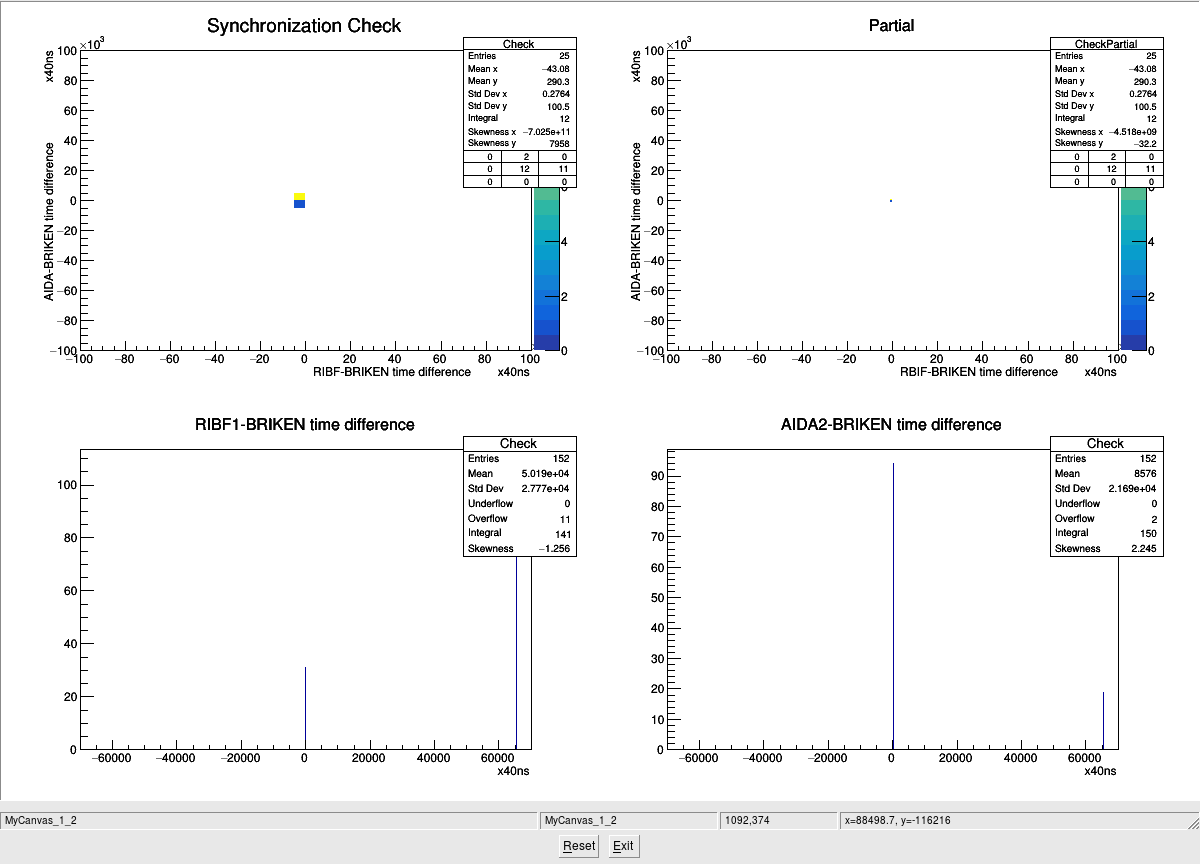
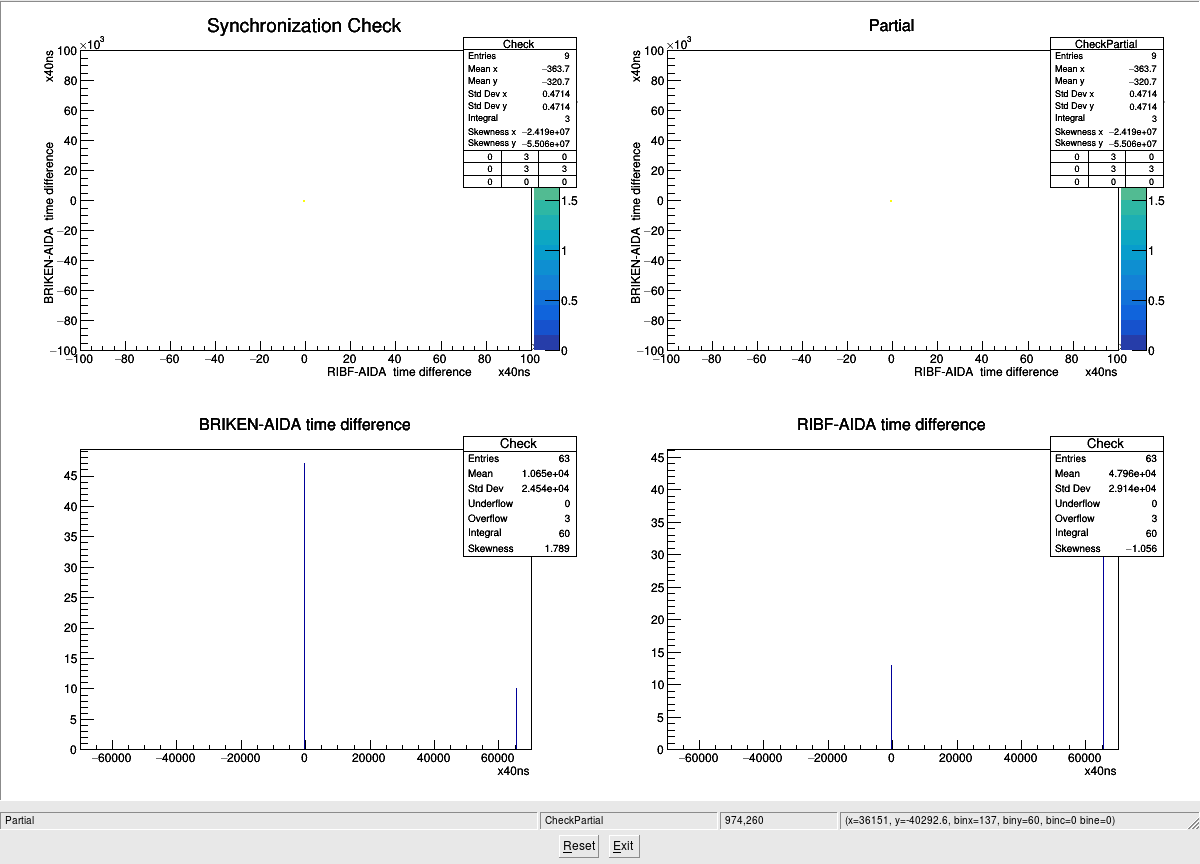
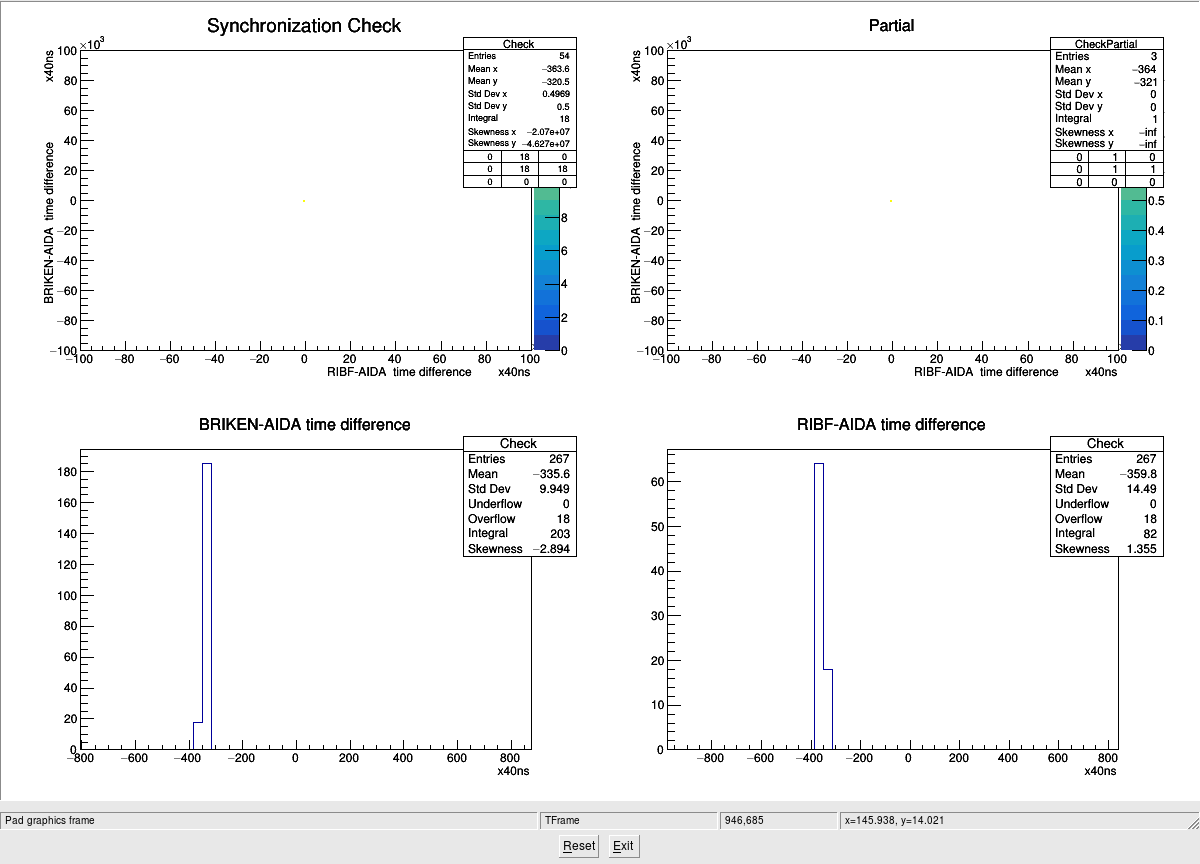
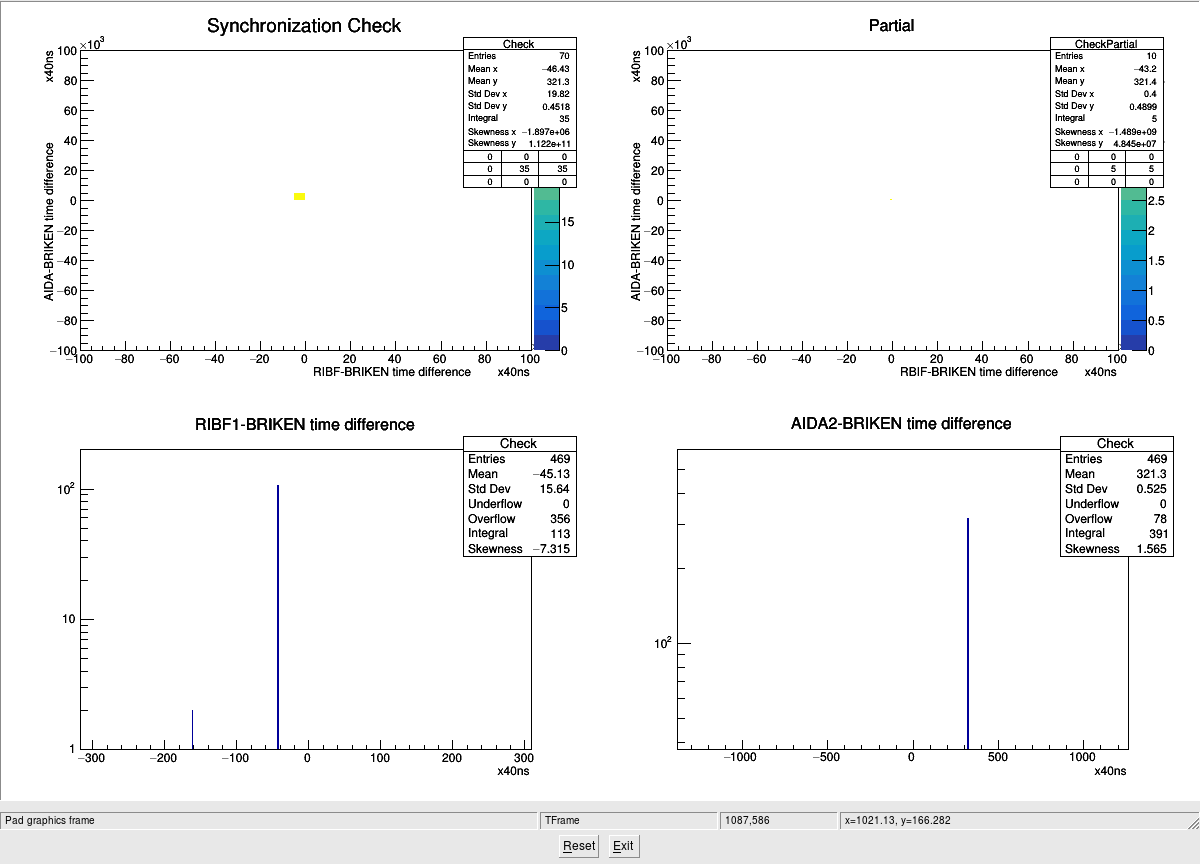
We noticed a peculiar feature in the time-stamp synchronization monitor. The spectra of timestamp difference between pairs of DAQ systems show, for all possible pair combinations, a peak at Delta(ts)= 65535 = 2**15
This corresponds to a difference of 2.6 ms (for 25MHz correlation clock). See the attachments taken ~23:00 of Nov 28th.
We performed the AIDA system-wide checks (no errors) and a timestamp reset, but the second peak at 65K is still there (we also checked that there is no peak at 2*65K, at least in a short run period).
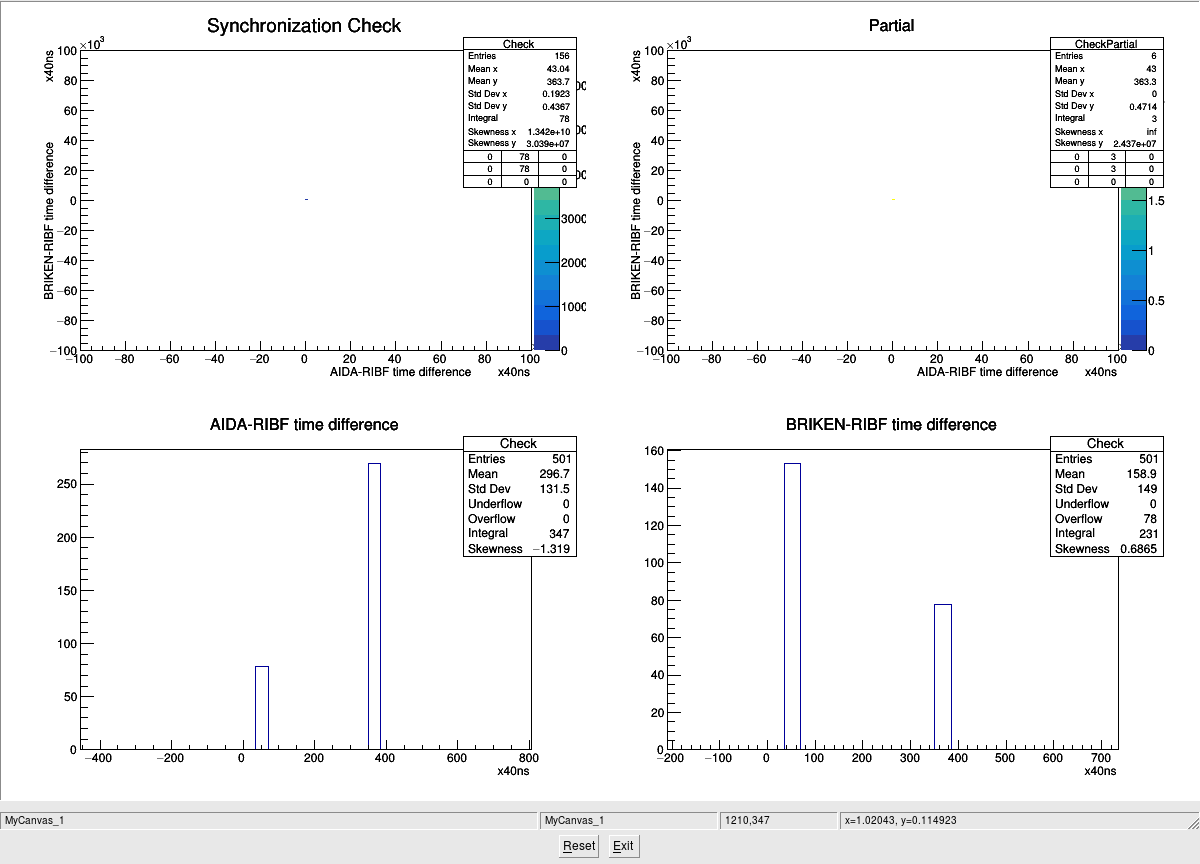
We also observed a double peak for timestam-differences close to zero, which we interpret as good correlations (attachment 2). Note, however, that this double peak became much supprese around midnight (see attachment 6 and 7).
From analysis of ion (BigRIPS) and implant (AIDA) correlations we have some confidence that these two DAQs are synchronized; see entry https://elog.ph.ed.ac.uk/AIDA/492 where we identify an implant for 20% ofions at F11 (and with an implantatin profile that, for example, is consistent with changes to the degrader configuration)
|
| Attachment 1: sync_vs_ribf.png
|
|
| Attachment 2: sync_vs_ribf_zoom_0.png
|
|
| Attachment 3: sync_vs_ribf_zoom_65k.png
|
|
| Attachment 4: sync_vs_briken.png
|
|
| Attachment 5: sync_vs_aida.png
|
|
| Attachment 6: sync_vs_aida_zoom_0.png
|
|
| Attachment 7: sync_vs_briken_zoom_0b.png
|
|
|
393
|
Tue Oct 18 06:56:52 2016 |
TD | DAQ status |
From the installation of the RG58 cable for the 50MHz TTL clock from BRIKEN DAQ
to AIDA Master MACB external clock input we observe DAQ stalls at c. 06.30 and
18.30 daily. This coincides with the nominal start times of the ORNL Clover detector
LN2 fill cycles.

run          start stop  files   recovery

AIDA Master MACB internal clock

R1   28.9.16 15.02 11.20 R1_304  OK

RG174 cable from BRIKEN DAQ 50MHz clock (TTL) to AIDA Master MACB external clock input

     9.10.16 16.55 17.30         no data transfer, TS_SYNC phase = 0, OK
     9.10.16 17.40 19.15 est     no data transfer, TS_SYNC phase = 0, ReSYNC
     9.10.16 22.20 01.40         no data transfer, TS_SYNC phase = 1, ?

    10.10.16 14.20 16.50         no data transfer, TS_SYNC phase = 2, ?
    10.10.16 18.35 18.40/19.40   no data transfer, TS_SYNC phase = 3, some FEE64s stopped later than others, ReSYNC
    10.10.16 20.36 06.35         no data transfer, TS_SYNC phase = 0, power cycle


RG174 cable from BRIKEN DAQ 50MHz clock (TTL) to AIDA Master MACB external clock input
replaced by RG58 cable

run          start stop  files   recovery

R17 11.10.16 15.46 08.22 R17_440 soft reset

R21 12.10.16 14.05 15.30         power dip - power cycle
R22 12.10.16 16.20 19.05         OK

R24 13.10.16                     OK
R25 13.10.16                     OK
R26 13.10.16                     OK
R27 13.10.16                     OK
R28 13.10.16                     OK
R29 13.10.16                     OK

R32 13.10.16 21.20 22.34 R32_26  soft reset
R33 14.10.16 00.01 00.25 ?       power cycle

R40 14.10.16 01.49 06.26 R40_91  soft reset
R41 14.10.16                     OK
R42 15.10.16 22.45 07.18 R42_164 System-wide tests - SYNC errors fail *but* SYNC pulses OK - ReSYNC only
R43 15.10.16 11.39 12.43         disk housekeeping caused merger/tapeserver problem

R46 15.10.16 12.43 18.26 R46_109 soft reset
R47 16.10.16 11.12 18.26 R47_120 power cycle

R49 16.10.16 21.05 06.26 R49_226 soft reset

R51 17.10.16 12.21 18.30 R51_145 soft reset
R52 17.10.16 20.41 06.30 R52_211 soft reset
R53 18.10.16 10.02 18.30 R53_193 soft reset

R55 18.10.16 18.52 19.17 R55_10  soft reset

R60 19.10.16 09.35 16.28 R60_169 OK
R61 19.10.16 16.30 18.26 R61_69  power cycle

R63 19.10.16 20.05 06.46 R63_291 soft reset
R64 20.10.16 09.45 18.25 R64_240 OK - System-wide tests - SYNC errors fail & SYNC pulses fail - other checks OK
R65 20.10.16 18.49 19.17 R65_12  power cycle
R66 20.10.16 20.02 10.55 R66_396 soft reset  auto LN2 fill may have failed, manually selected c. 11.00
R67 21.10.16 14.02 18.26 R67_121 soft reset
R68 21.10.16 18.40 18.44 R68_1   soft reset

R70 21.10.16 18.53 06.46 R70_315 soft reset
R71 22.10.16 10.42 18.25         OK

R73 22.10.16 19.07 19.17 R73_4   soft reset
R74 22.10.16 19.38 06.31 R74_296 soft reset

R76 23.10.16 10.46 11.52 R76_29  merger crashed, soft reset
R77 23.10.16 18.50 19.17         disk housekeeping caused merger/tapeserver problem
R78 23.10.16 19.47 06.46 R78_291 soft reset
R79 24.10.16 11.07 18.46 R79_182 soft reset
R80 24.10.16 18.56 19.17 R80_5   DAQ stall, soft reset
R81 24.10.16 19.29 06.26 R81_169 soft reset
R82 25.10.16 10.22 18.30 R82_125 -> safe state

R83 27.10.16 14.35 18.30 R83_125 soft reset
R86 27.10.16 20.48 06.26 R86_245 soft reset
R87 28.10.16 14.34 18.47 R87_274 soft reset

R89 29.10.16 19.10 07.17 R89_102 power cycle

soft reset => no FEE64 power cycle
      Restart merger
      DAQ STOP
      System wide checks
      DAQ RESET & SETUP
      System-wide checks
      Disable H & data transfer #1
      Restart merger & tapeserver
Enable H & data transfer #1 |
|
297
|
Wed Jun 8 09:29:55 2016 |
TD | DAQ state of play |
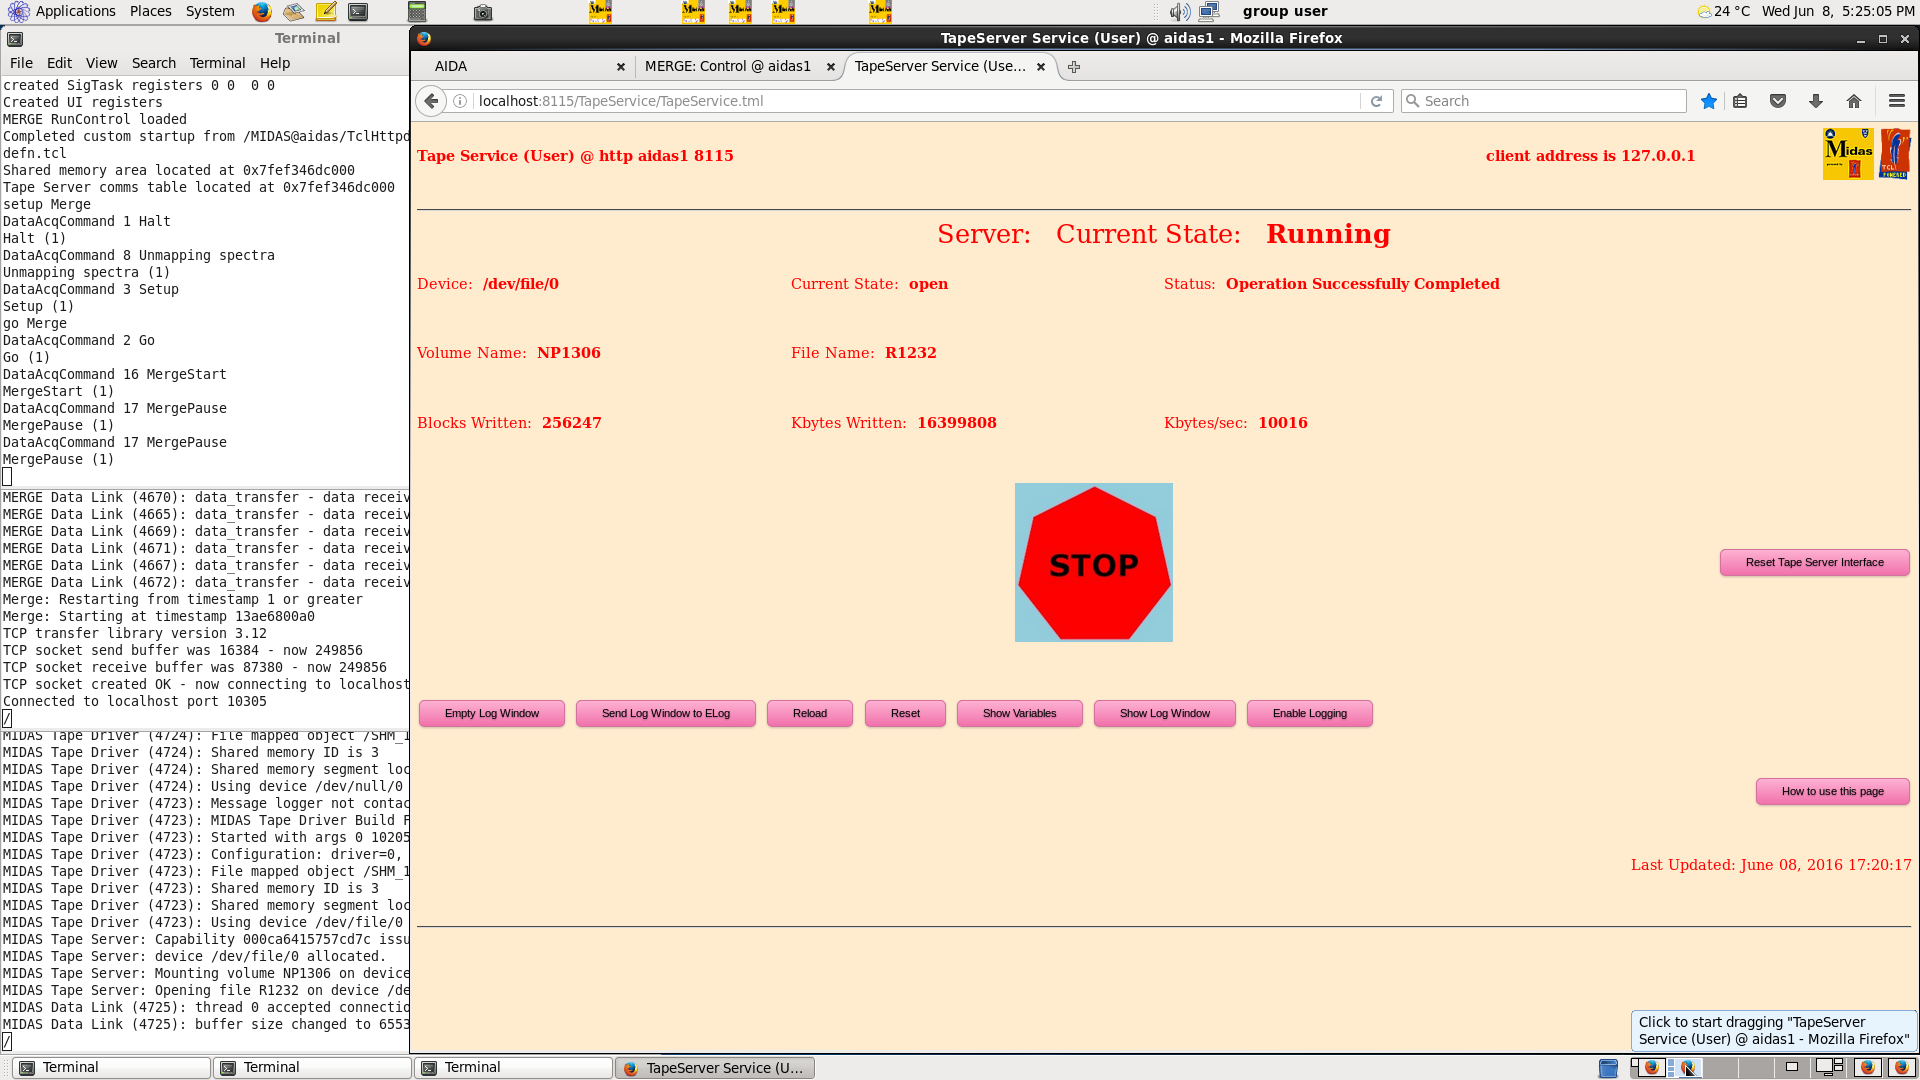
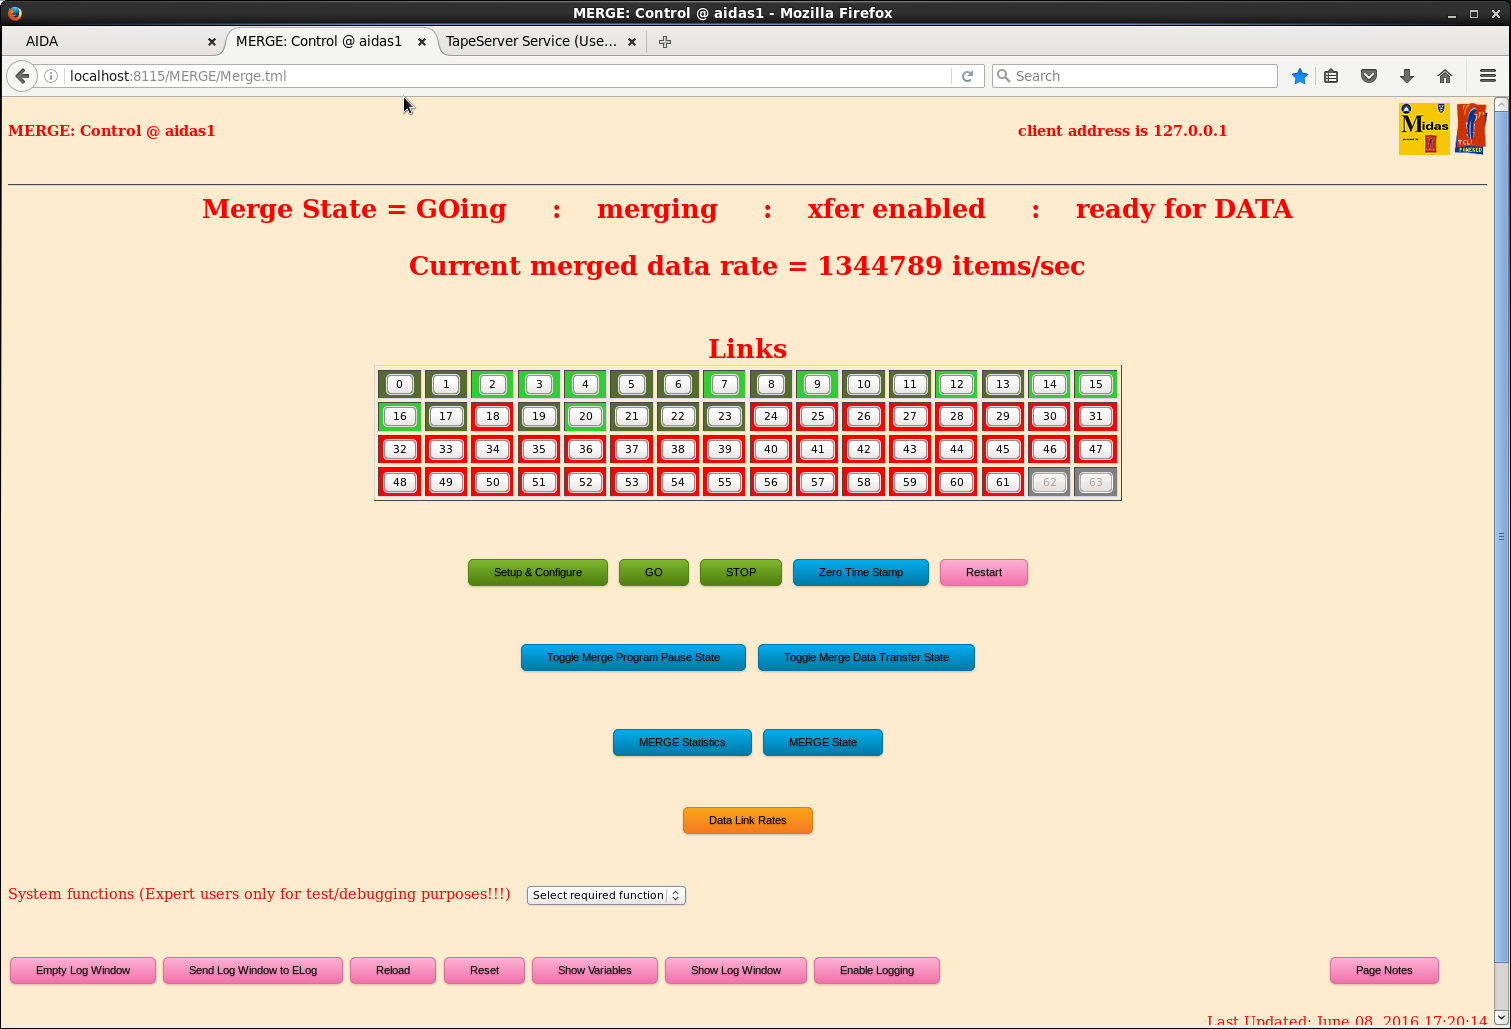
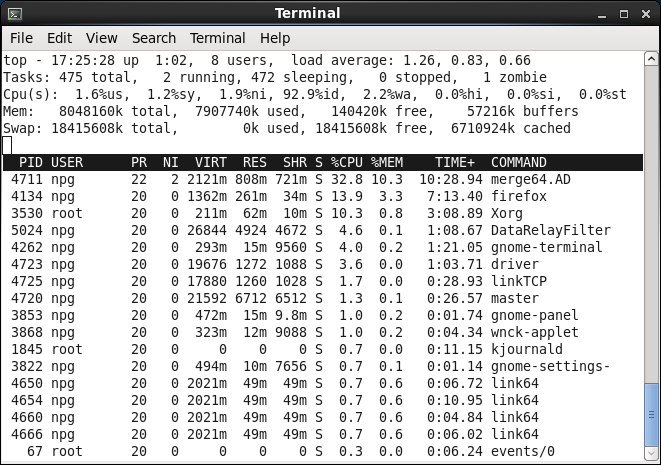
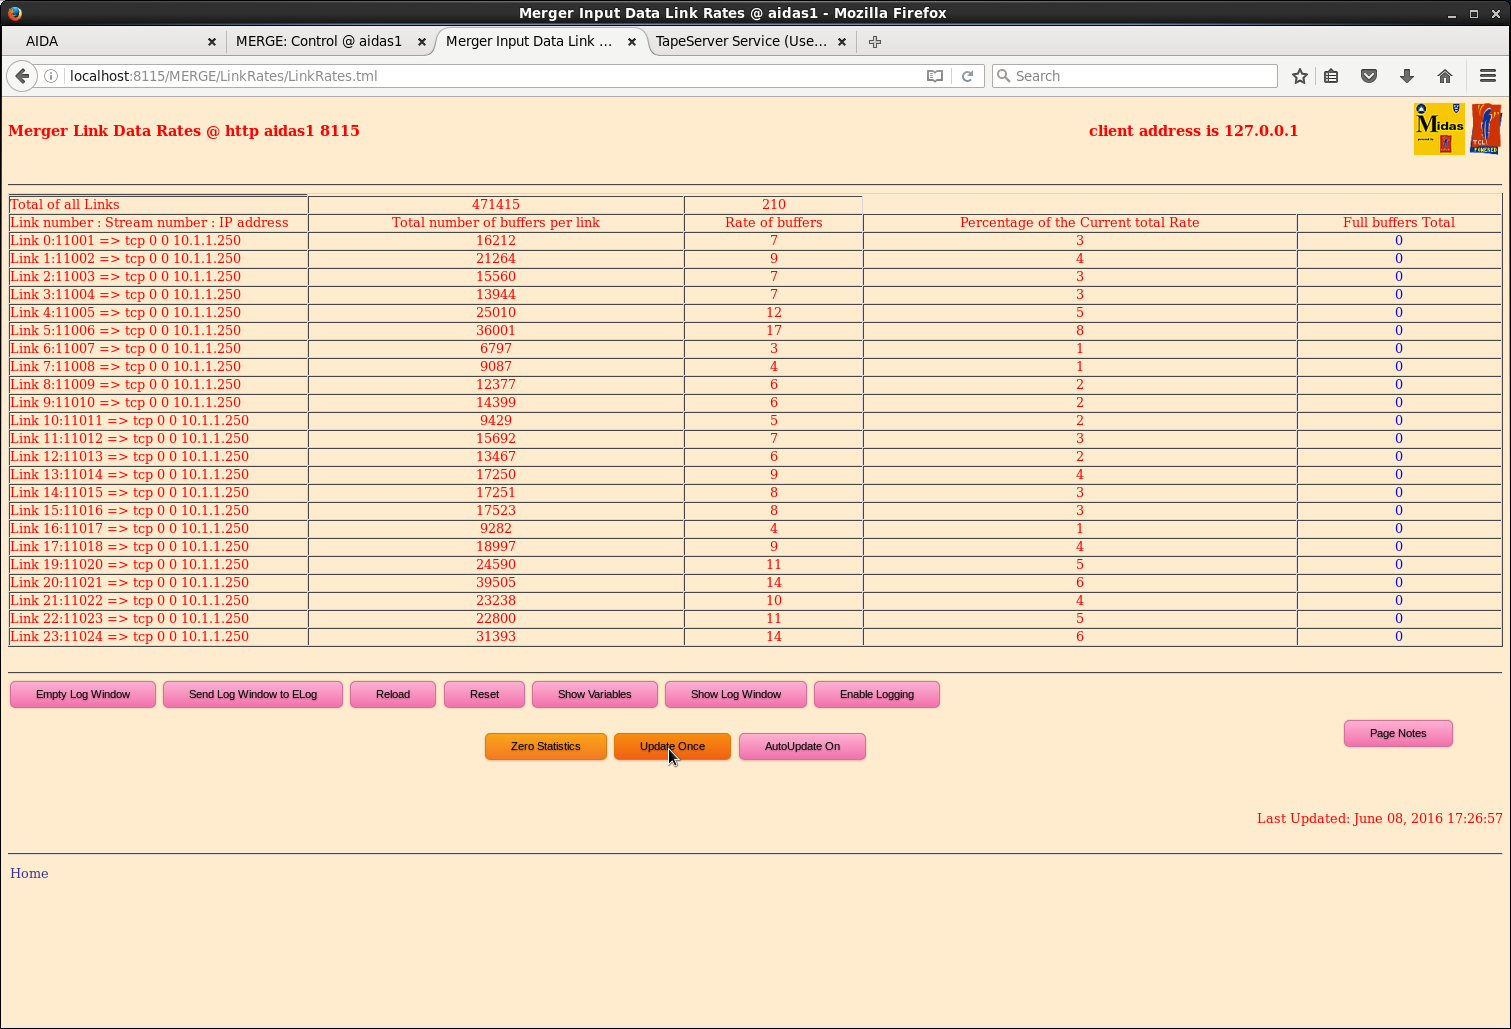
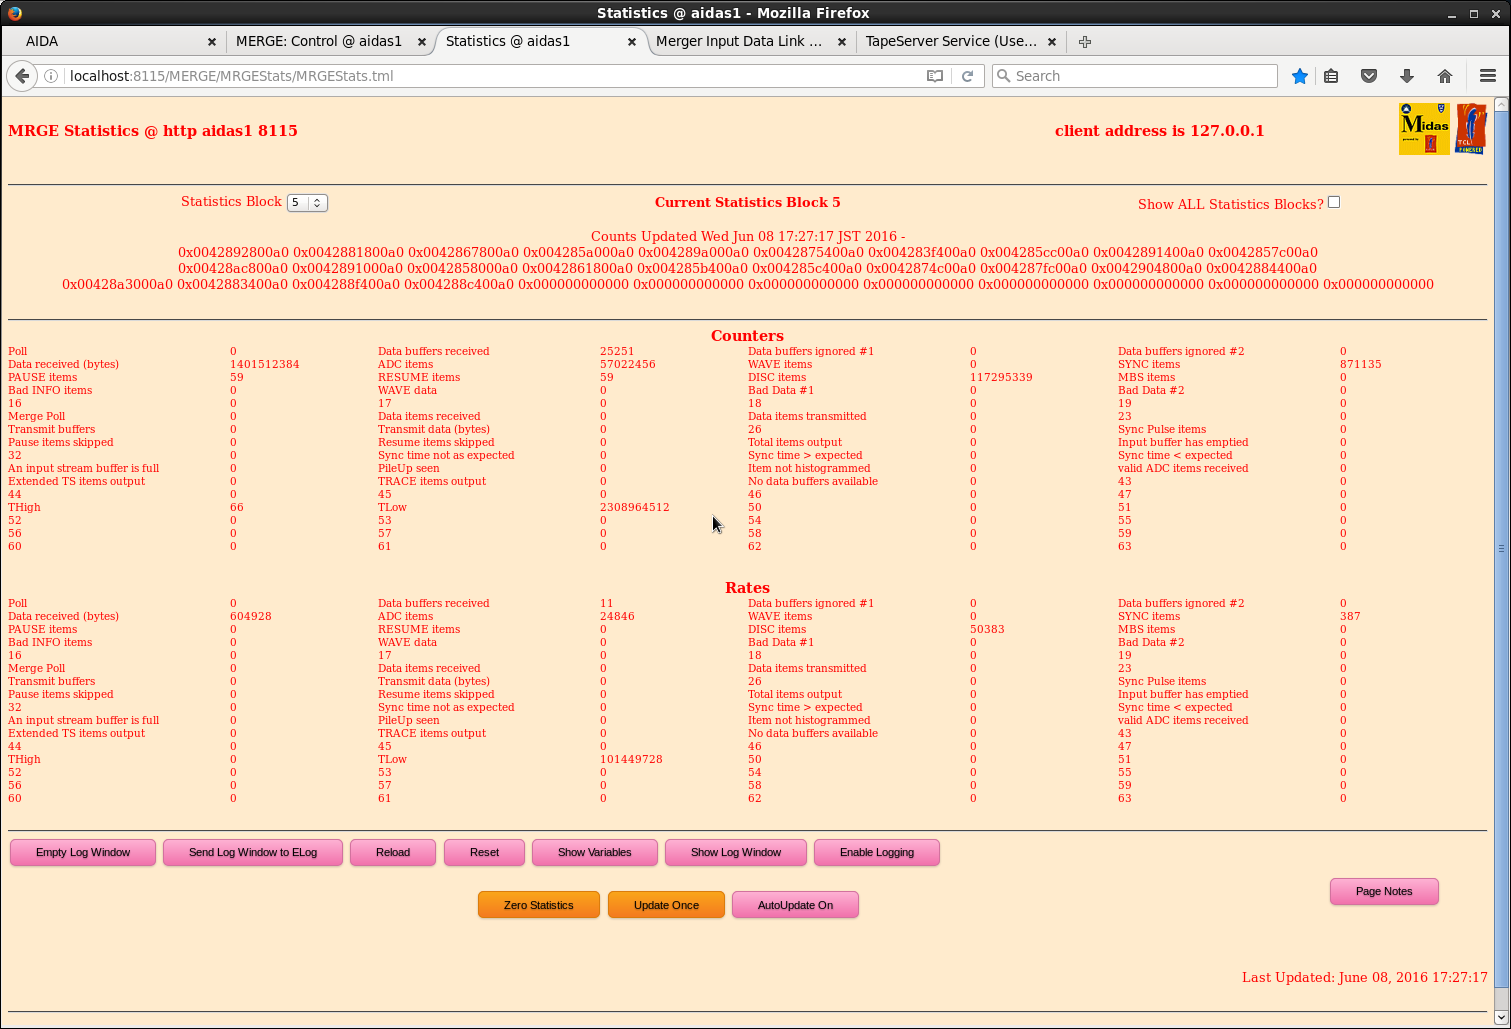
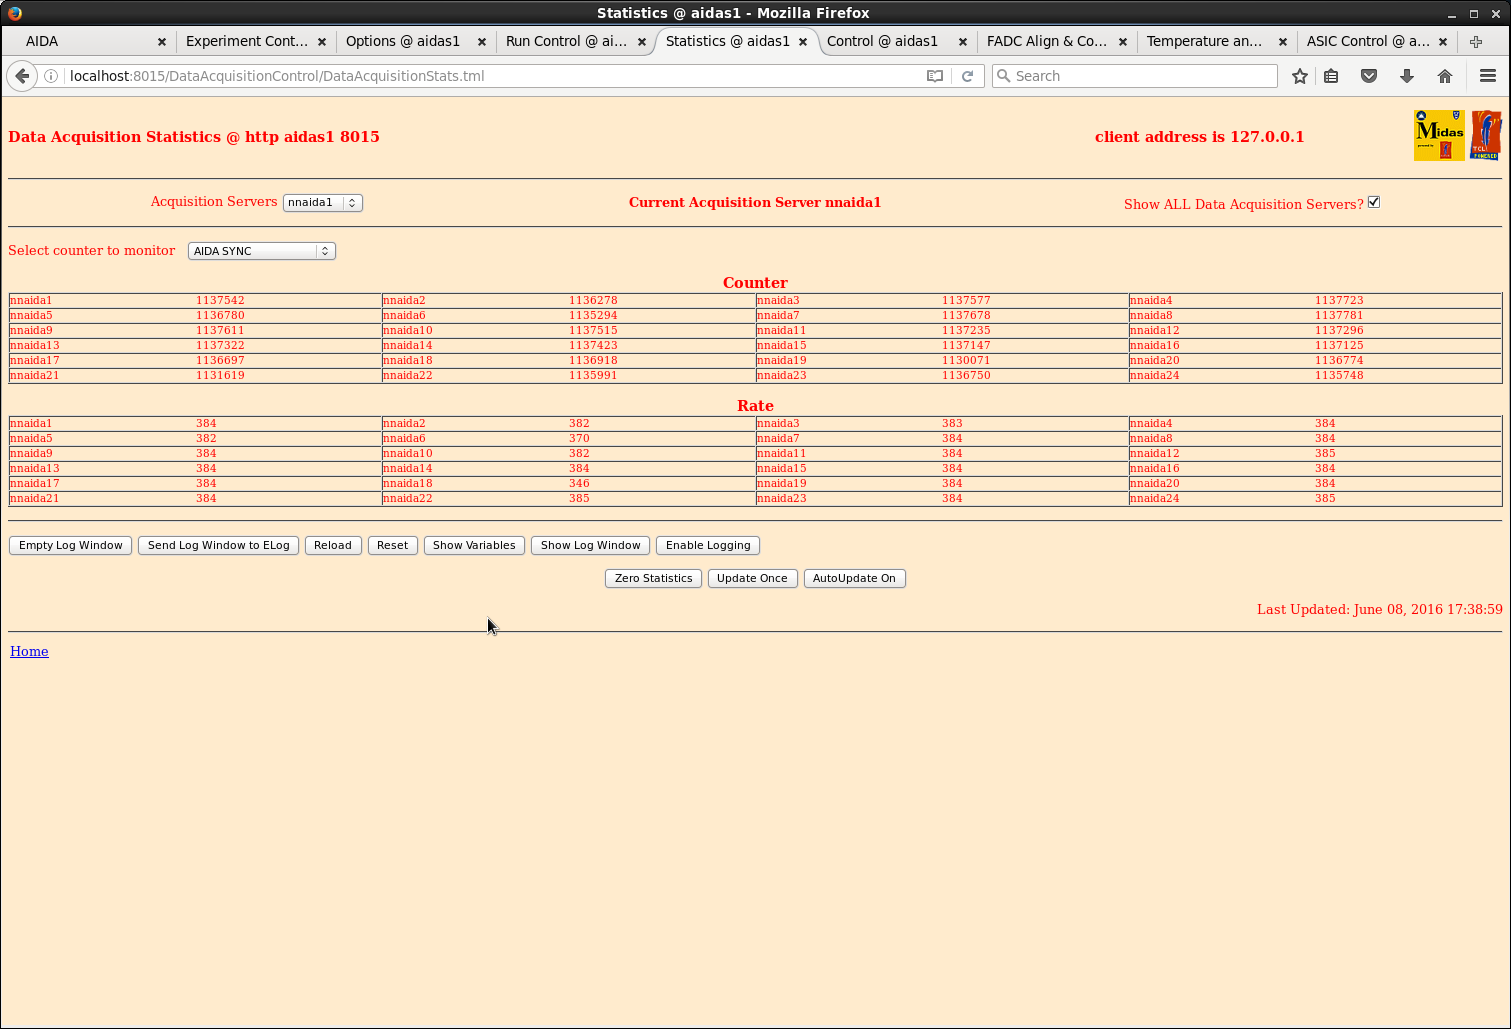
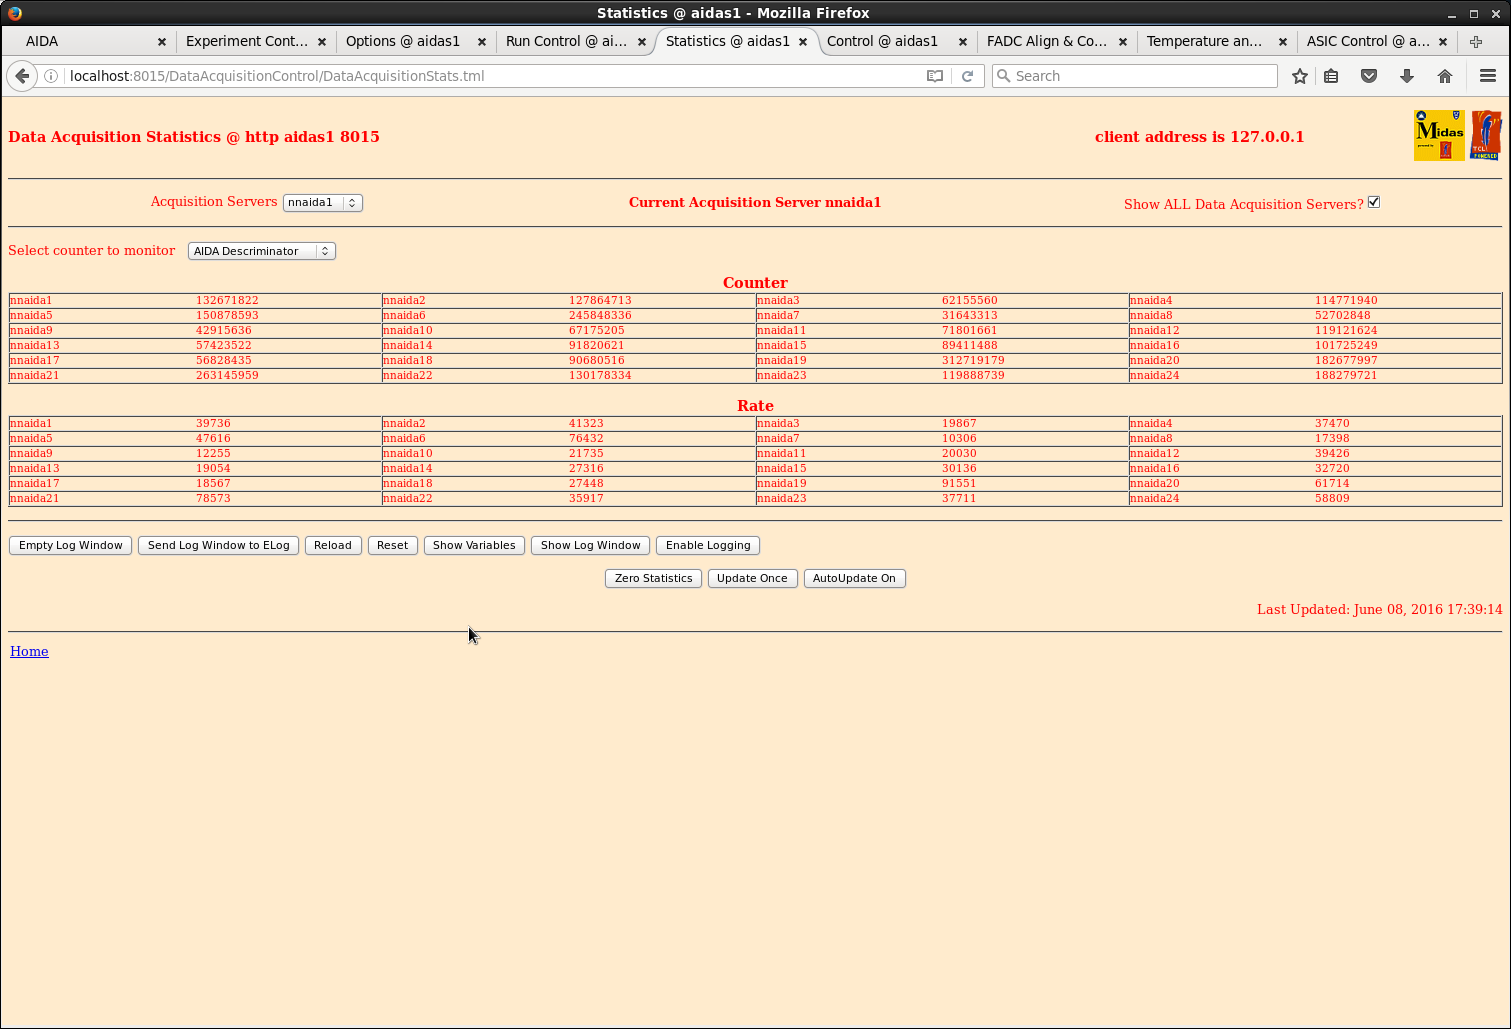
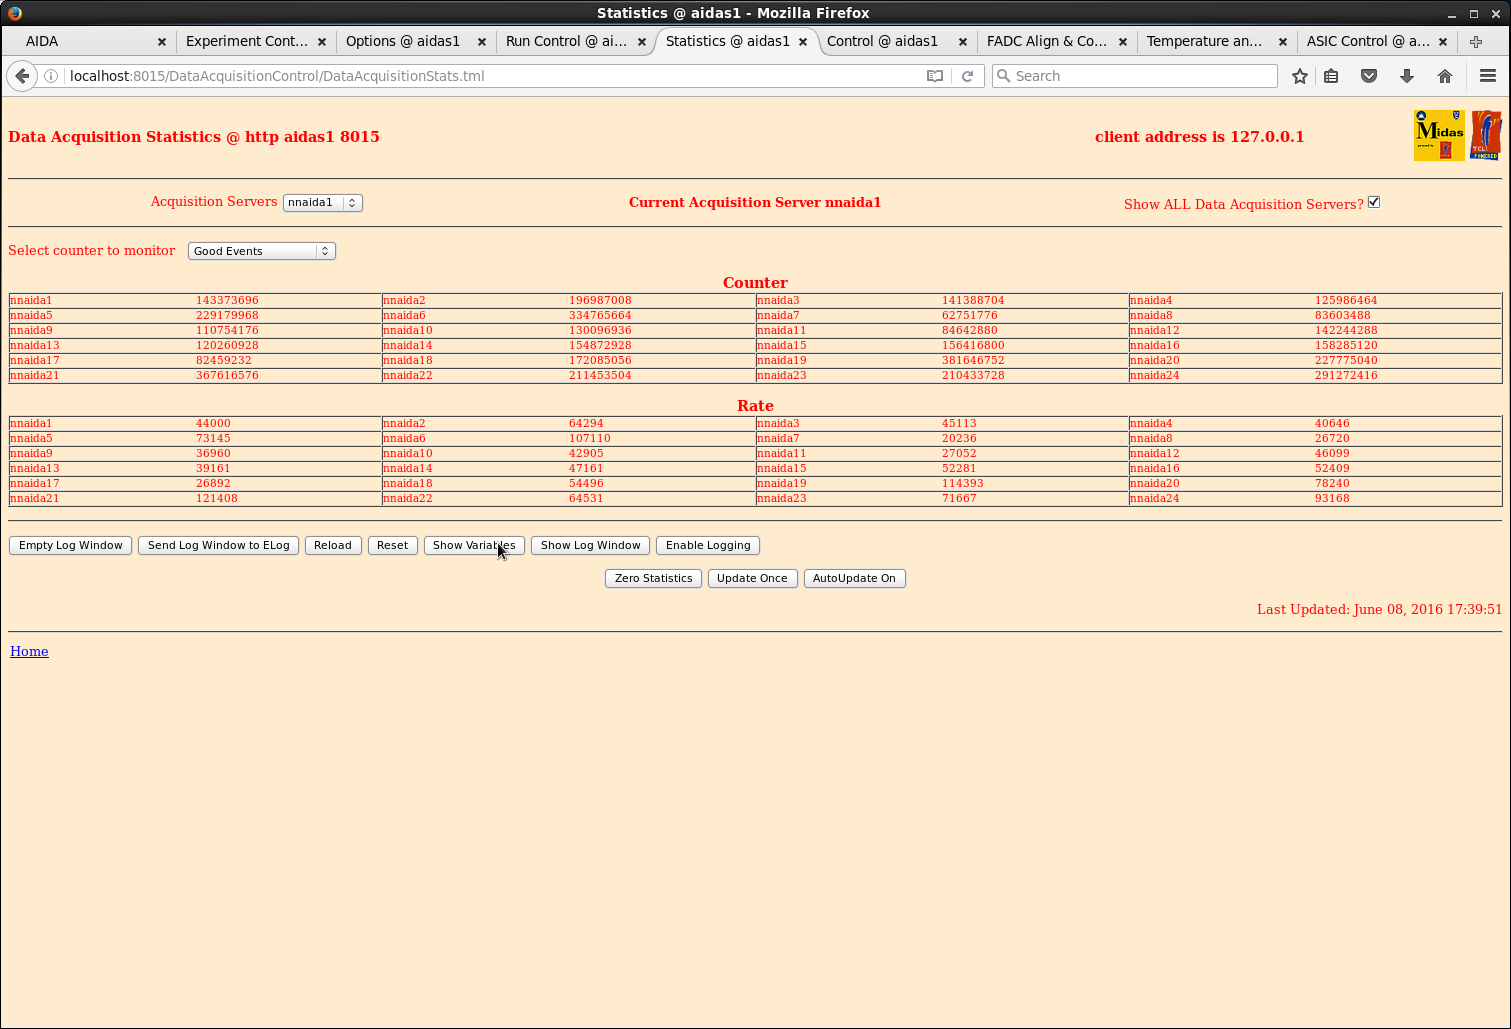
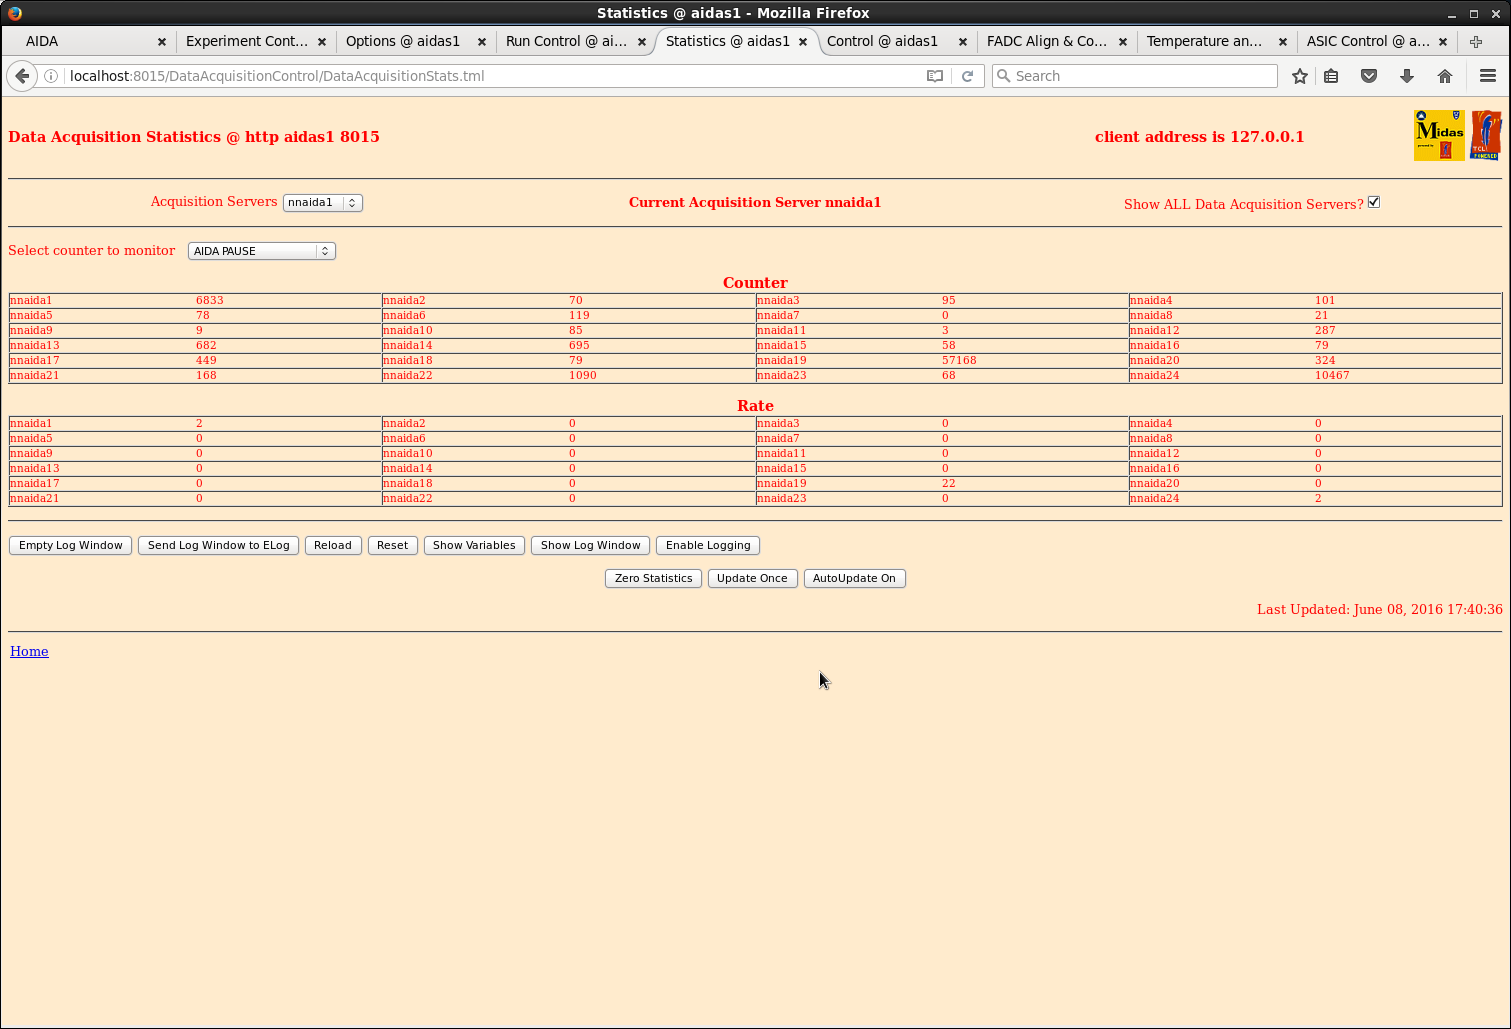
17.25 State of play

      Running data to disk (uncompressed)

      link #18 (nnaida19 disabled)

      ~1.3m data items/s
      ~10.5Mb/s

      merge64.AD ~30% CPU
      driver ~4% CPU
      link64 <1% CPU

nnaida19 ~20Hz PAUSE, increase LEC/MEC fast comparator from 0x5 to 0x20 -> PAUSE ~0Hz |
| Attachment 1: 20.png
|
|
| Attachment 2: 21.png
|
|
| Attachment 3: 22.png
|
|
| Attachment 4: 23.png
|
|
| Attachment 5: 24.png
|
|
| Attachment 6: 30.png
|
|
| Attachment 7: 31.png
|
|
| Attachment 8: 32.png
|
|
| Attachment 9: 34.png
|
|
|
578
|
Fri May 19 10:16:27 2017 |
CB, TD, OH | DAQ sever rebooted |
18:16 Finished rebooting DAQ server and acquisition. All OK, except ADC calibration on #7.
      Started run May2017/R16
      ASIC settings 2017Mar27-16.12.39 *except*
      slow comparator 0x0a
      LEC/MEC fast comparator 0xff

      Detector biases; leakage currents OK
      FEE64 Temperatures OK
      good events; statistics OK
No warnings/errors reported by merger since DAQ GO |
|
46
|
Mon Feb 23 07:23:08 2015 |
J. Agramunt, H. Baba, A. Estrade | DAQ correlation test |
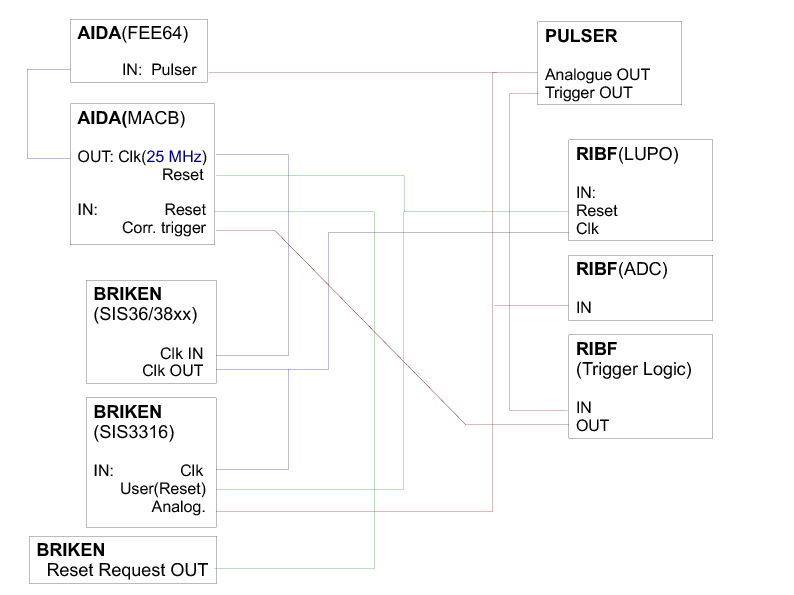
The attached figure shows the configuration used to test the synchronization of the DAQ systems using a
correlation scalar counted from a common clock signal (DAQcorrelation_diagram.pdf).

The chosen solution was to use a 25 MHz clock generated by the MACB modules of AIDA, which was distributed to
the other two systems by a SIS36/38xx module in the BRIKEN VME crate.

The correlation can be monitored online using the MIDAS DataXfer and DataSpy libraries
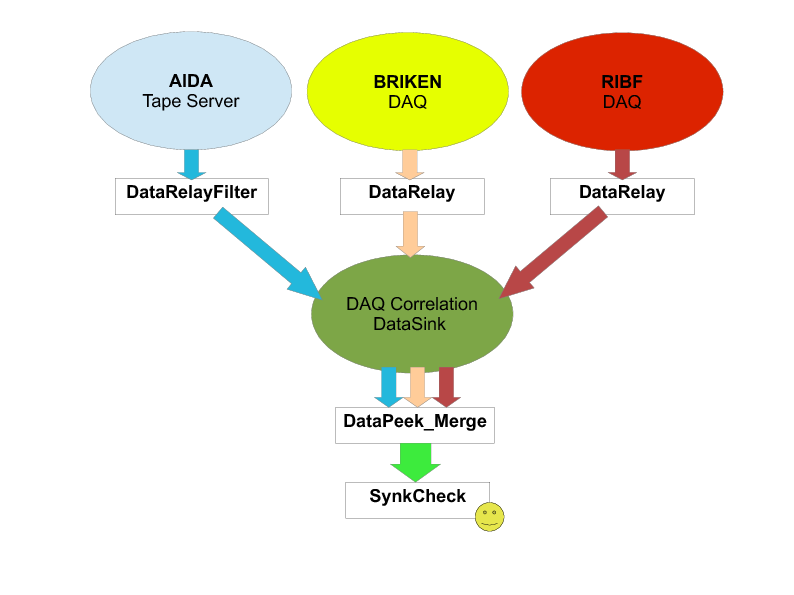
(http://npg.dl.ac.uk/MIDAS/DataAcq/Data.html). Each system operates a
DataRelay program that sends a data stream consisting only of IDs and time-stamps to a common DataSink (this
requires a DataRelay code that does some filtering of the raw data for each system). The scheme is shown in
attached diagram (DAQsoftware.pdf).

The DataPeek_Merge and SyncCheck codes use C++11 for parallelization of tasks, which is a helpful feature to
improve the efficiency of finding coincidences between the correlation pulses. Thus, the code will not run in
PCs with any Linux version. For example, it requires version 7 of ScientificLinux, which installed in the PC
being used for BRIKEN DAQ control that will stay at RIBF for the time being.


++ SYNCHRONIZATION RESULTS ++

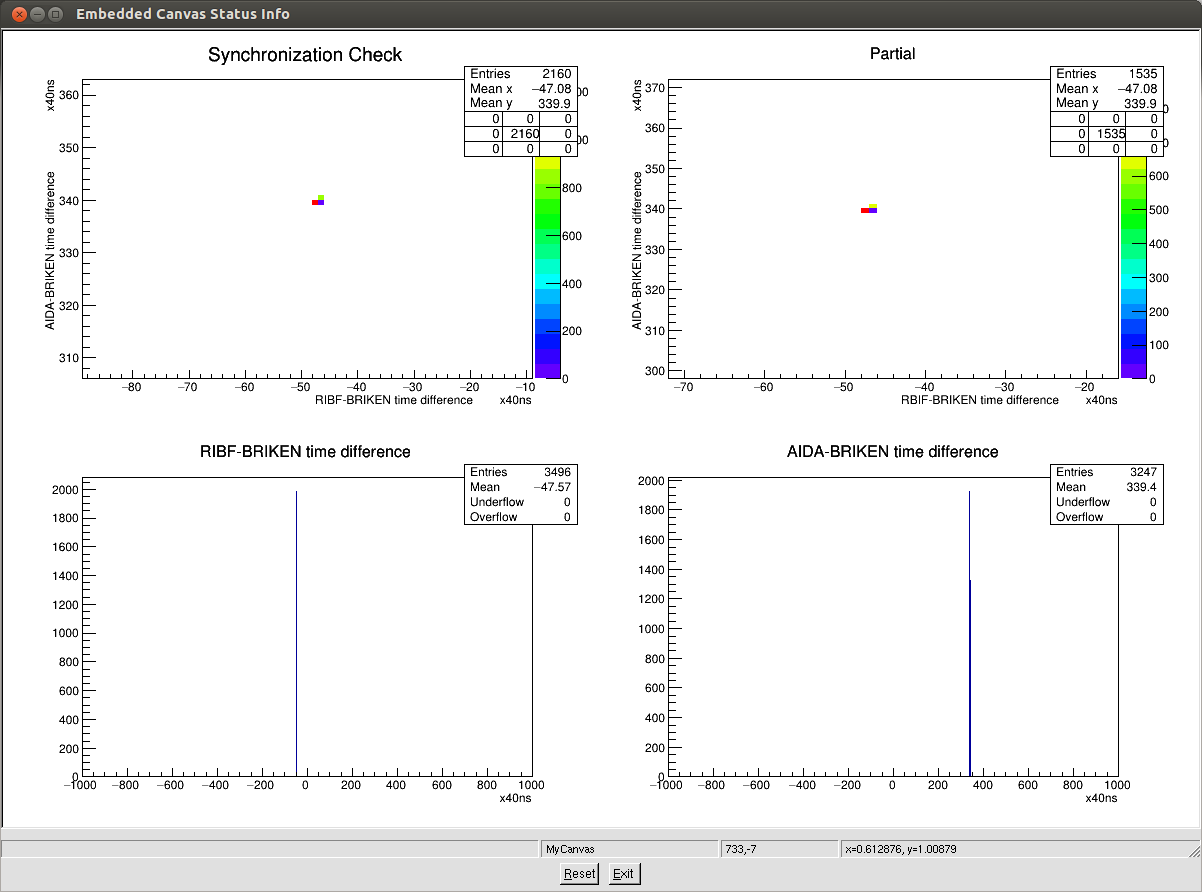
The figure correlation_25Hz.png shows a correlation plot for the BRIKEN+RIBF+AIDA running with correlations done
by a pulser at 25 Hz. A large fraction of the pulsers appear in the double-coincidence plots (top row; same plots,
except the 'Partial' one is automatically cleared every ~10seconds).

The bottom plots show the pair-wise correlations between BRIKEN and RIBF or AIDA. BRIKEN was defined as the
'master' in this test, but current version of the program is flexible to select any stream as the master one.

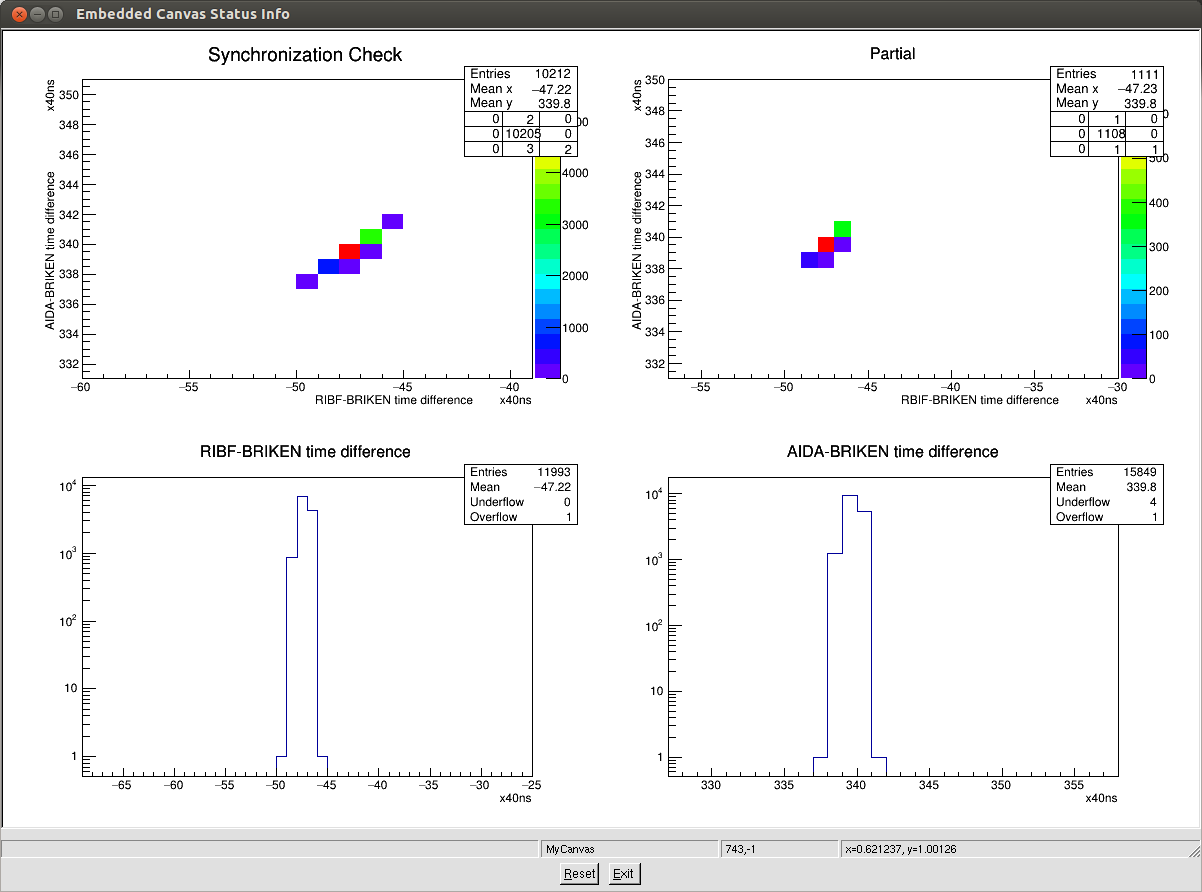
The second figure (correlation_random.png) shows the same test, but using a non-periodic pulser to trigger the
correlation scalar. We observed the same level of synchronization (peaks look brader just because of the zoom level). |
| Attachment 1: DAQcorrelation_diagram.pdf
|
|
| Attachment 2: DAQsoftware.pdf
|
|
| Attachment 3: correlation_25Hz.png
|
|
| Attachment 4: correlation_random.png
|
|
|
299
|
Fri Jun 10 02:25:45 2016 |
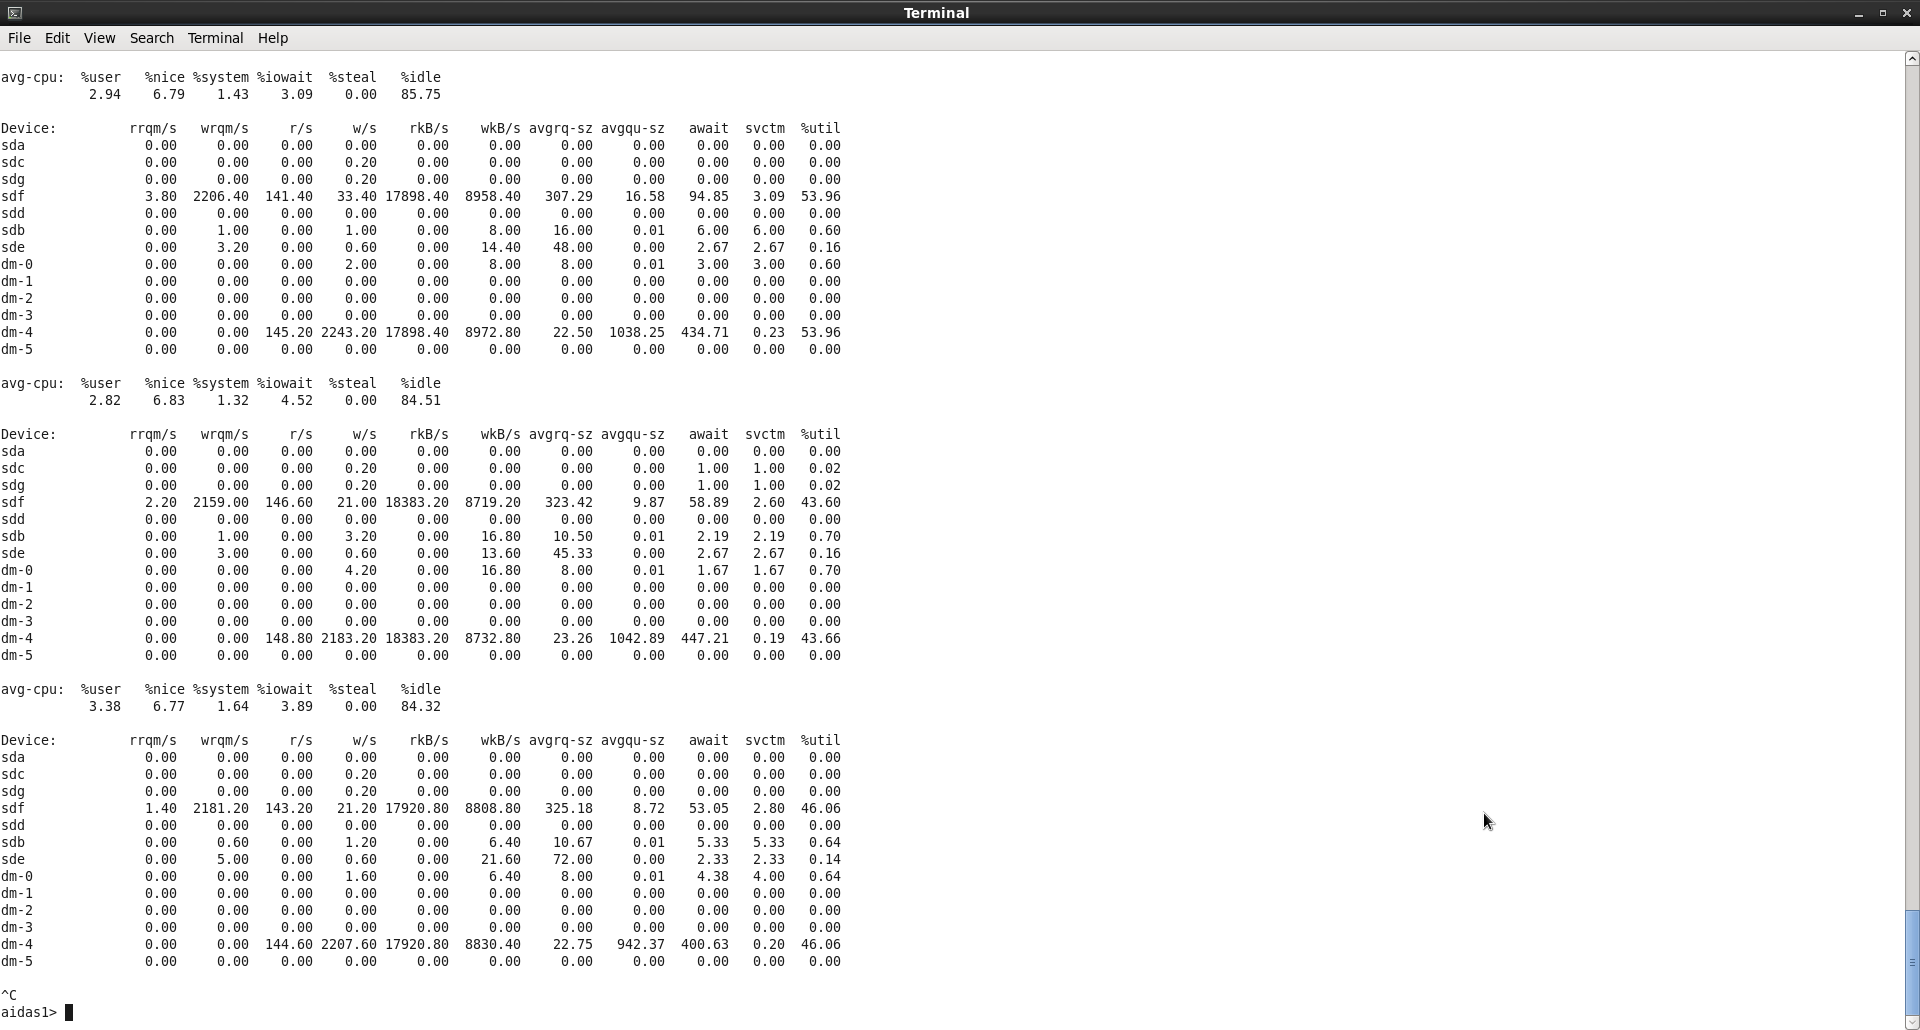
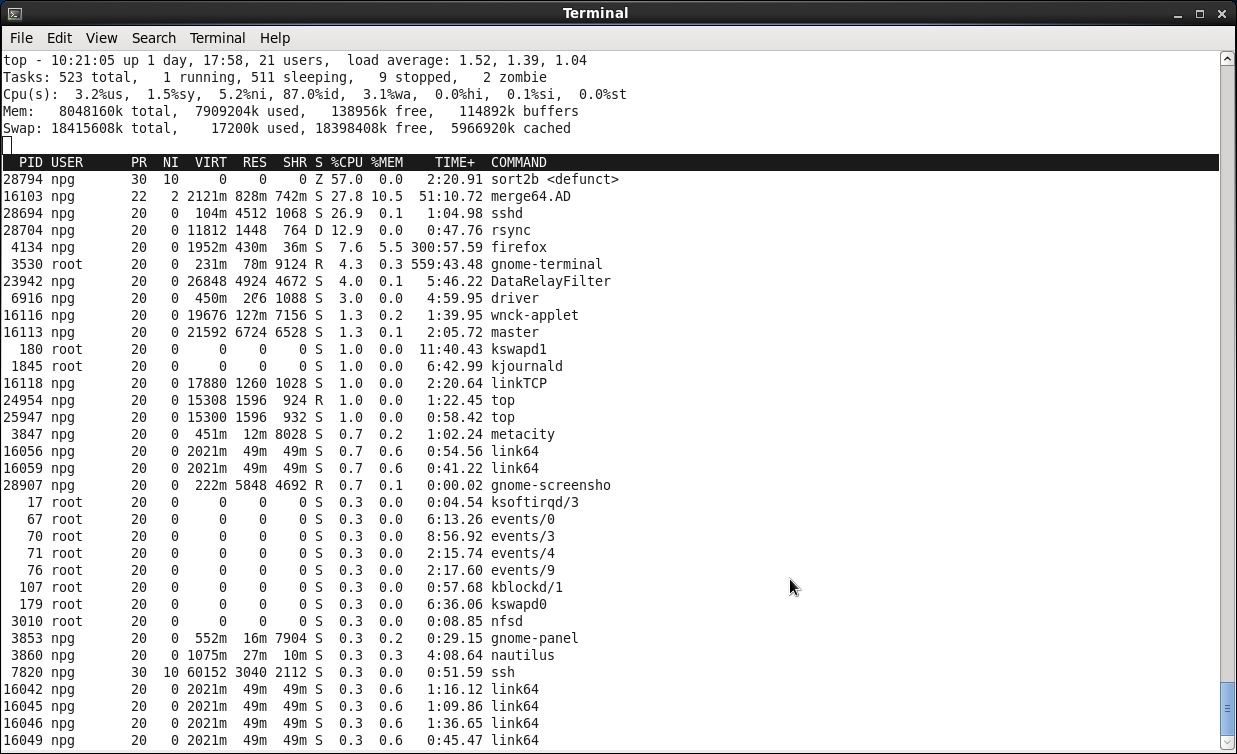
TD, ML & YS | DAQ State of Play - Friday 10 June 2016 |
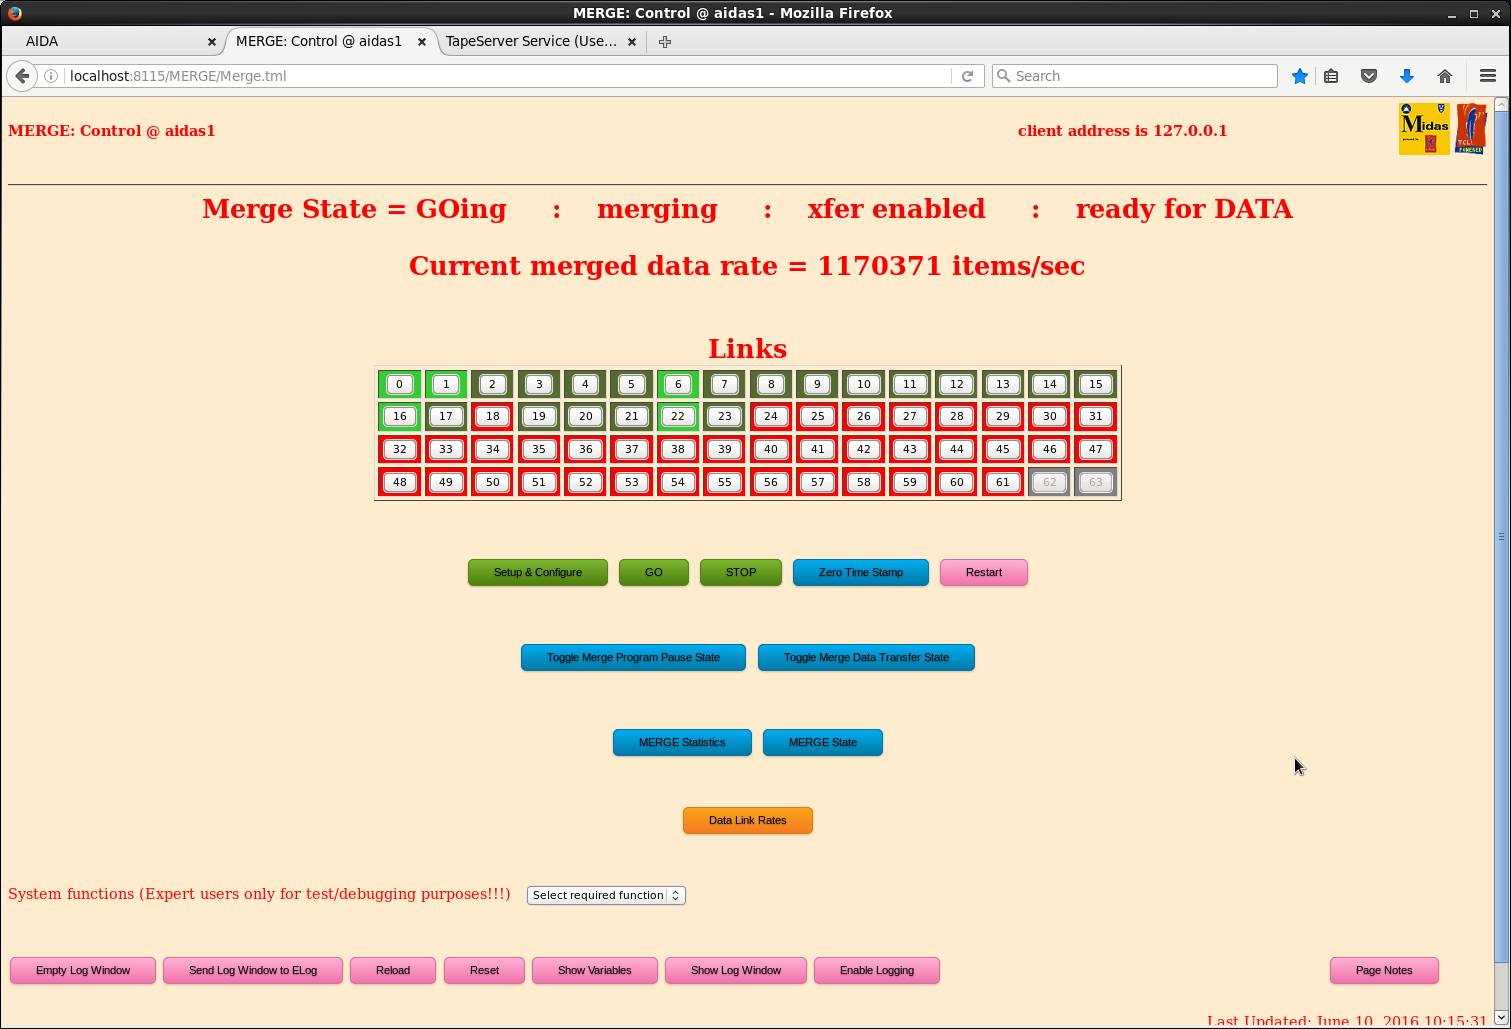
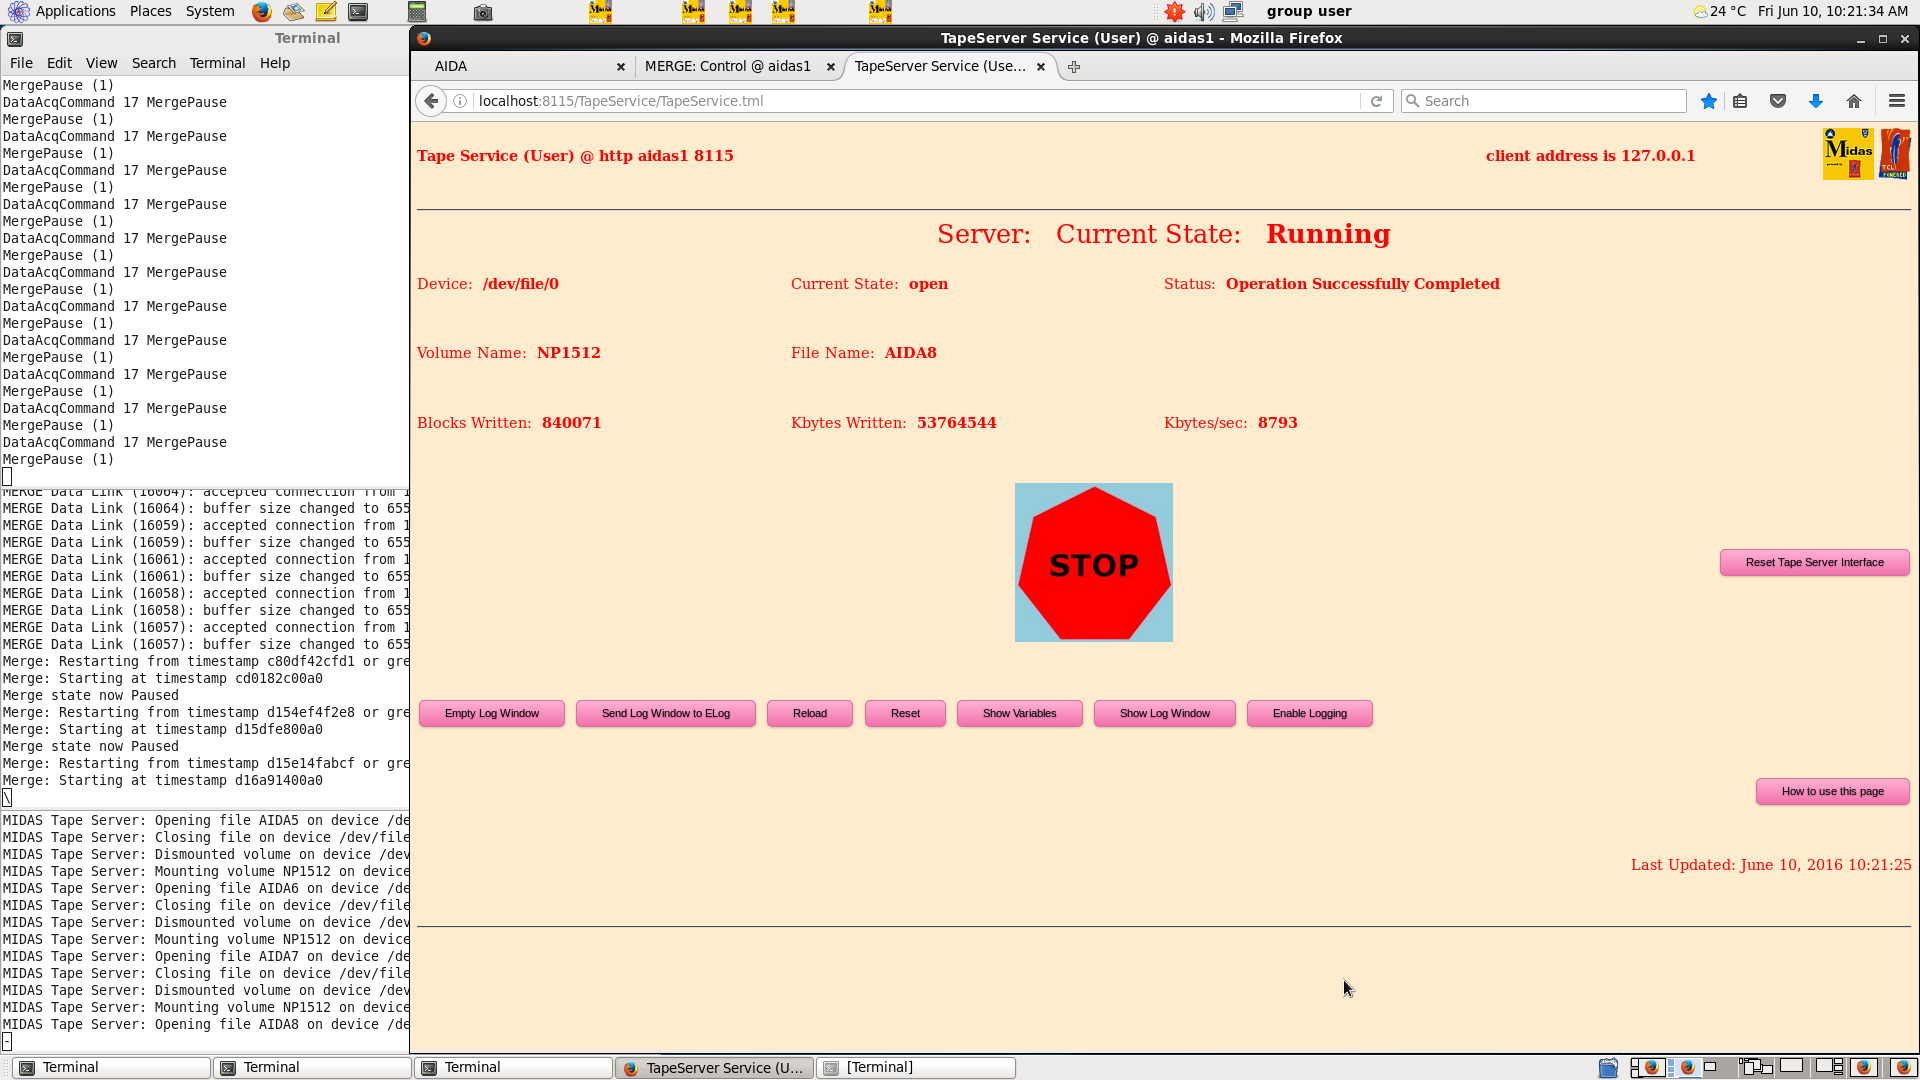
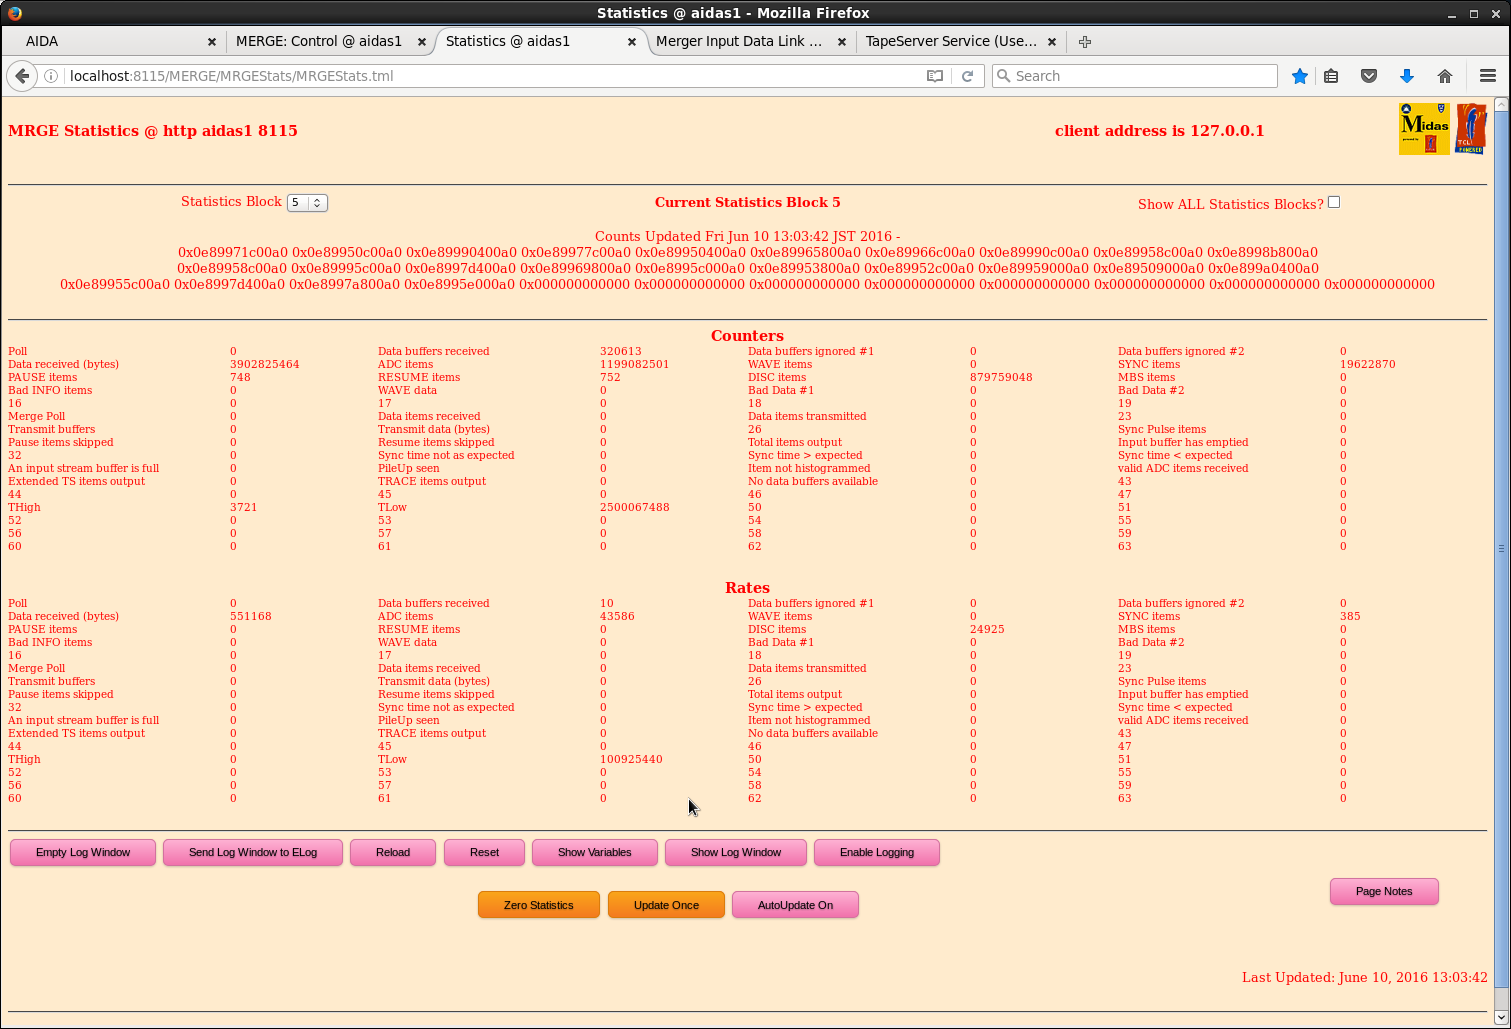
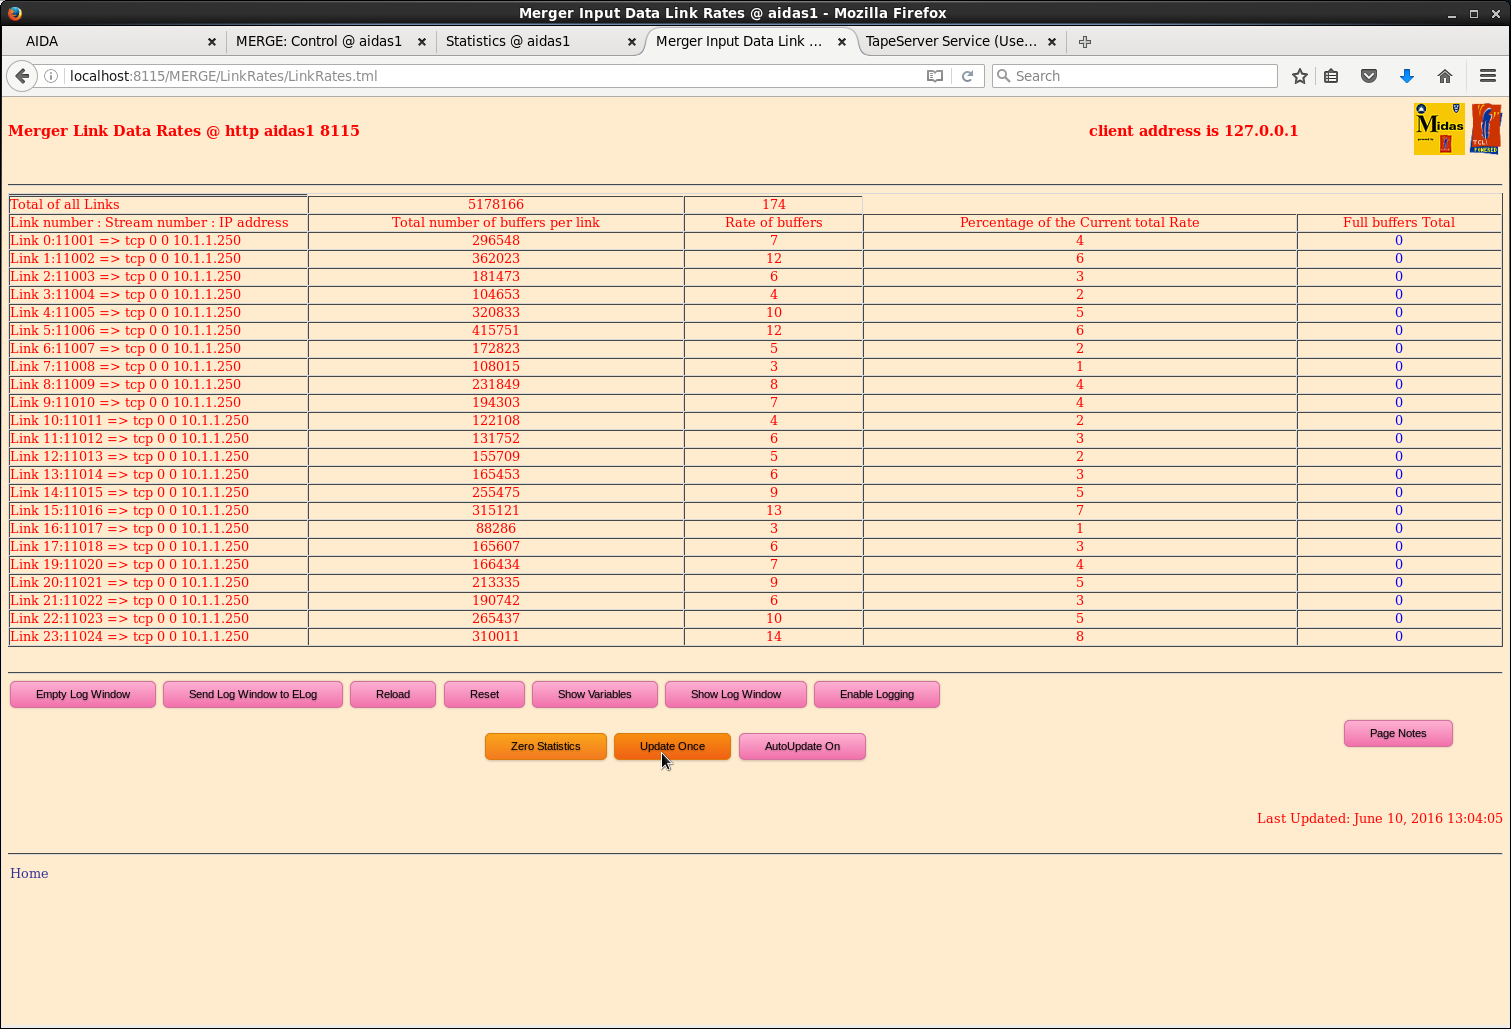
10.25 Screenshots showing DAQ state of play during NP1512 |
| Attachment 1: 30.png
|
|
| Attachment 2: 41.png
|
|
| Attachment 3: 42.png
|
|
| Attachment 4: 44.png
|
|
| Attachment 5: 91.png
|
|
| Attachment 6: 92.png
|
|
|
744
|
Sun Sep 30 01:48:27 2018 |
OH, TD | Current link to Google sheets leakage current log |
https://docs.google.com/spreadsheets/d/12hgbrywB10hGsKt5uc2HnLfZymh8_uvM6cEASbbqnBE/edit?pli=1#gid=282765719 |