| |
ID |
Date |
Author |
Subject |
|
|
31
|
Sat Jul 9 21:00:54 2016 |
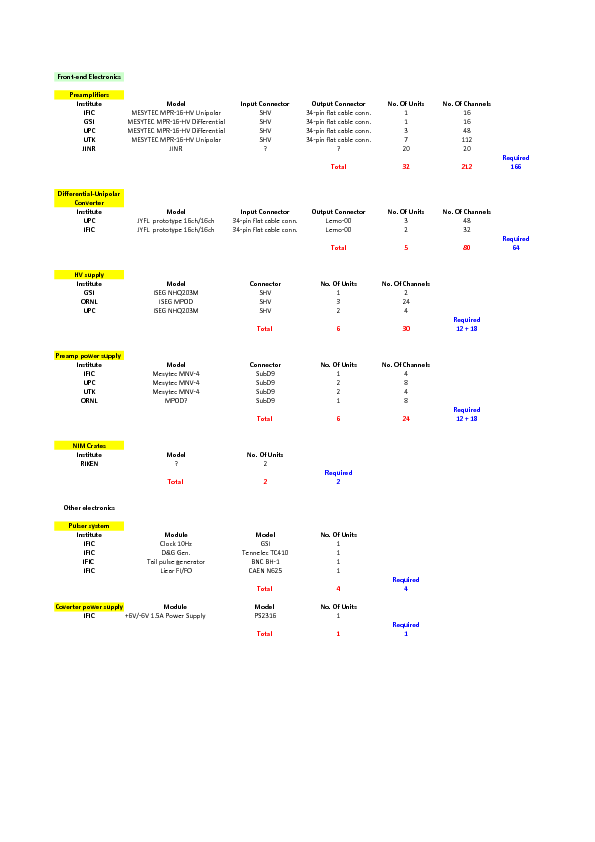
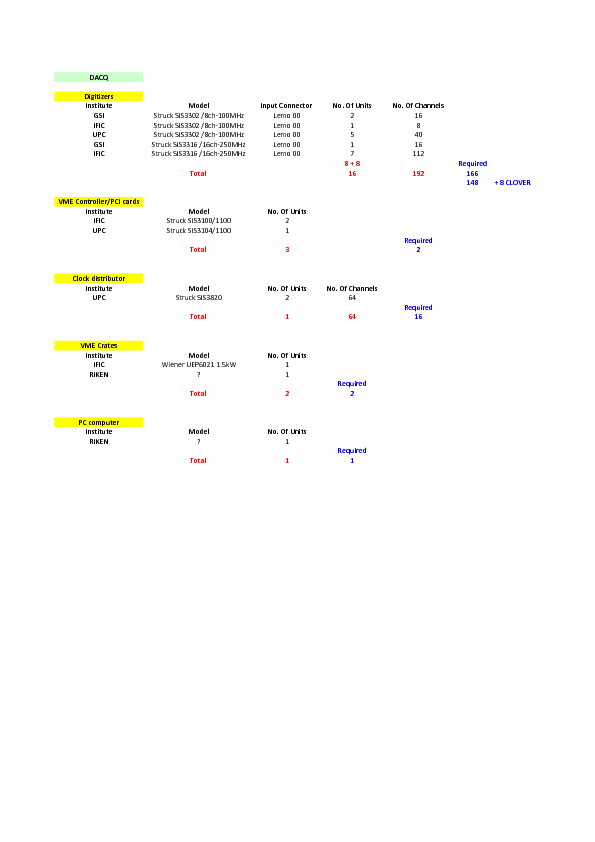
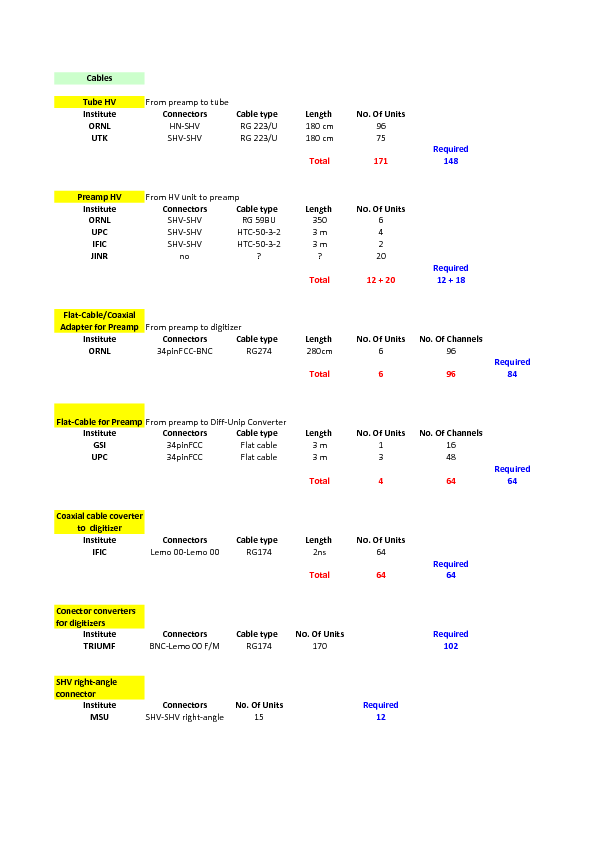
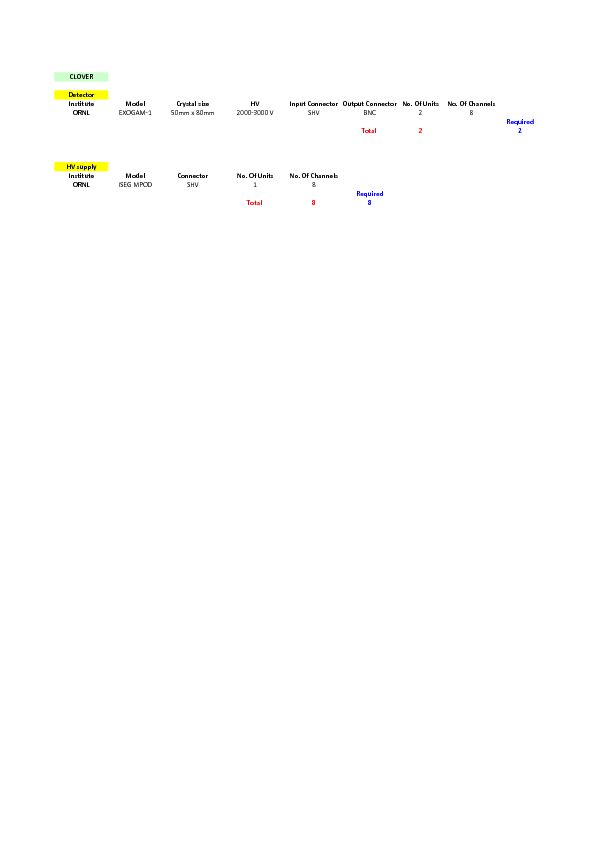
J.L. Tain | Hardware |
A list of the available hardware |
| Attachment 1: Hardware.xlsx
|
| Attachment 2: Hardware.pdf
|


|
|
|
30
|
Sat Jul 9 20:44:31 2016 |
J.L. Tain | BRIKEN neutron detector |
START
Assembly and commissioning of BRIKEN neutron detector

The hybrid configuration of the BRIKEN neutron detector will be assembled at BF2 for the first time with 140 3He
tubes and 2 CLOVER detectors, connected to the Gasific digital data acquisition system and tested with 252Cf
sources. |
|
|
29
|
Mon May 11 09:14:54 2015 |
G. Kiss | 252Cf_data_sheet |
The activity of the 252Cf source, used for the calibration was 3.7 MBq at 15.05.2006. Unfortunately, uncertainty is missing from the data sheet :-( |
|
|
28
|
Fri May 8 03:20:48 2015 |
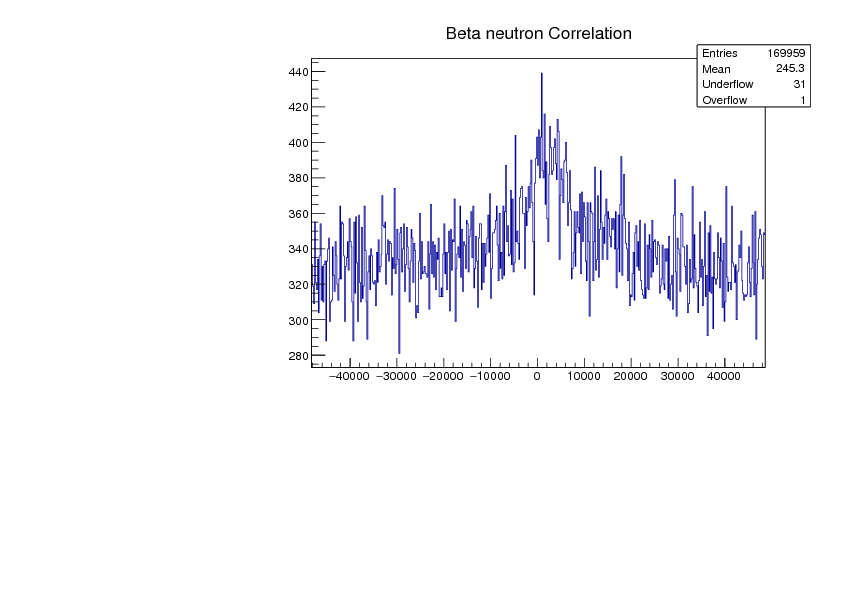
J.Agramunt J.L.Tain K.Gabor | BnCorrelation |
We run all the night until the end of beam time, and the Bn correlations are more clear now. |
| Attachment 1: BnCorr.pdf
|
|
|
|
27
|
Thu May 7 08:36:56 2015 |
J.L. Tain, J. Agramunt, A. Estrade, G.Kiss, T. Davinson, C.Griffin | First BRIKEN_v.0 beta-delayed neutron correlations? |
During the 98,100Kr setting run we observe
in the time correlation plot (middle right panel)
of beta signals (marked by AIDA, with amplitude larger than ch=600)
with Riken 3He tube signals (noise and pulser cleaned)
a small peak around t=0 which might be indication
of beta-delayed neutrons.
The spectrum was measured for about 2h. |
| Attachment 1: Screenshot_from_2015-05-07_16_01_27.png
|

|
|
|
26
|
Wed May 6 11:41:24 2015 |
J. Agramunt, A. Estrade | First online combined analysis |
Screen shot of the rudimentary on-line
analysis of the combined data:
BRIKEN-AIDA-BigRIPS


Top Left: dE (from MUSIC) vs. ToF (F11-F7)
Top Right: X-position (at F9) vs ToF

Middle Left: Amplitude spectrum of RIKEN tubes

Bottom Left: Energy spectrum from AIDA marked as beta-decays

Middle Right: Time correlations between betas (AIDA) and neutrons (BRIKEN)

Bottom Right: Time correlations between implants (AIDA) and neutrons (BRIKEN)

(the range of time correlated data [-1ms,+1ms]) |
| Attachment 1: Screenshot_from_2015-05-06_19_12_29.png
|

|
|
|
25
|
Wed May 6 05:10:14 2015 |
J.L. Tain, J. Agramunt, G. Kiss | 94Se setting measurement |
After the long shutdown the beam is back at 00:30 (06/05)
Intensity is slightly lower 26pnA and somewhat unstable (short time)
Measurement in the morning:
File: 150506_0846_0915_94Se.root
Average rate per tube (n/s): U=3.39 D=0.93B=0.40
Notes:
-The rate has increased by 3.5 in the detectors close to EURICA (!?)
-The rate at the detector below the MUSIC is substantial.
From the different magnitudes it is clear that neutrons are originated
both outside and inside EURICA. |
|
|
24
|
Wed May 6 04:57:24 2015 |
J.L. Tain, J. Agramunt, G. Kiss | New degrader thickness |
The Al degrader thickness was reduced to 4.8mm |
|
|
23
|
Tue May 5 05:29:26 2015 |
J.L. Tain, J. Agramunt, G. Kiss | Ambient background measurement |
Beam still down. New background measurement
with new RIKEN tube below the MUSIC chamber
(call it B)

File: 150505_0040_1130_aprox_bckg.root
Average rate per tube (n/s): U=0.0073, D=0.0065, B=0.0070 |
|
|
22
|
Tue May 5 05:17:36 2015 |
J.L. Tain, J. Agramunt, G. Kiss | Ambient background measurement |
Failure of a quadrupole triplet at BigRIPS (some time after earthquake)

We take the chance of measuring background:

File: 150504_1500_2047_bckg.root
Rate per tube (n/s): U=0.098, D=0.0062, US=0.0200
Ratio to 1st 110Zr: U=1.38,  D=1.99,  US=0.90
Notes:
-Compared to the 1st background measurement there are changes
larger than expected statistical fluctuations:
perhaps due to slight changes in noise
|
|
|
21
|
Tue May 5 05:04:00 2015 |
J.L. Tain, J. Agramunt, G. Kiss | Change of degrader thickness |
For EURICA measurements degrader thickness were increased
trying to decrease MACI and AIDA trigger rate
Before we had 5.7 mm of Al
Now we have:
Degrader: 4.0 + 1.0 + 0.6 + 0.4 +0.3 = 6.3 mm of Al
also 2x 0.8mm Al plates were added before
the MACI start detector (thus covering partially AIDA)
Trigger from AIDA will be taken from 3rd DSSSD |
|
|
20
|
Tue May 5 02:19:58 2015 |
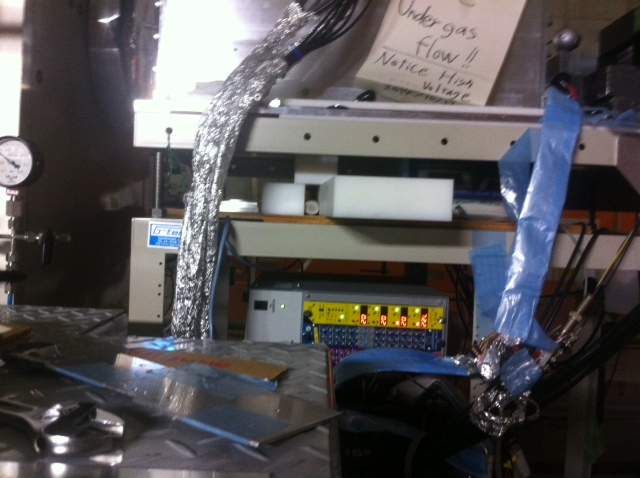
j.Agramunt J.L.Tain K.Gabor | The Lower polyethylene pieces was swamped |
The Lower polyethylene pieces was swamped.
In the photo beam comes from the left.
|
| Attachment 1: photo-4.JPG
|
|
|
|
19
|
Mon May 4 15:03:47 2015 |
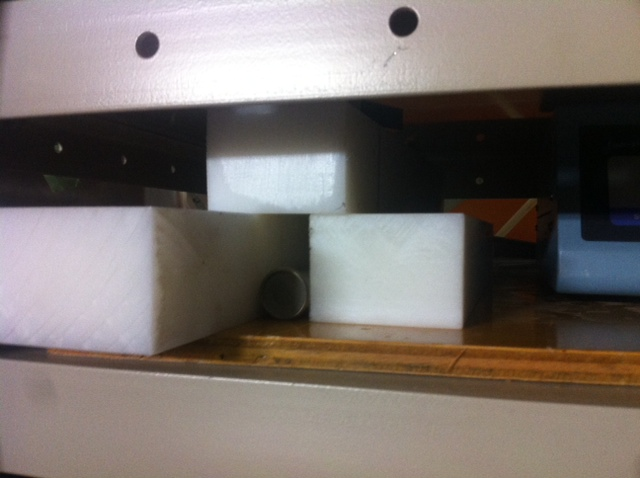
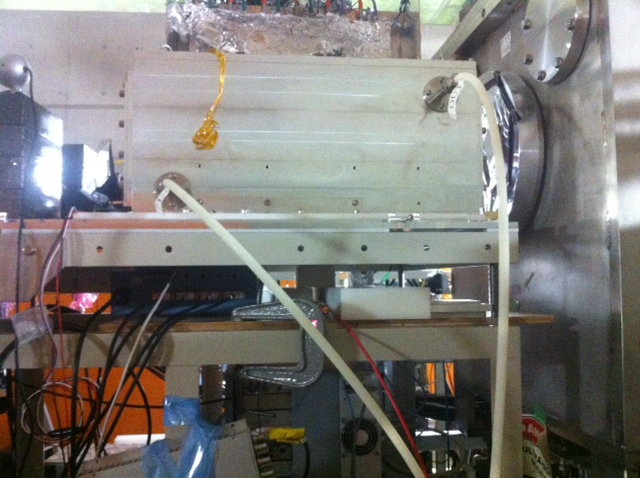
J.Agramunt J.L.Tain K.Gabor | New detector placed under the beam line |
New detector placed under the beam line, below MUSIC chamber
This detector replace the USA tubes in the DACQ because we need the preamp to plug it.
|
| Attachment 1: photo_2-2.JPG
|

|
| Attachment 2: photo_1-2.JPG
|
|
| Attachment 3: photo_3-2.JPG
|
|
|
|
18
|
Mon May 4 04:14:18 2015 |
J.Agramunt J.L.Tain K.Gabor | AIDA trigger plugged in Mod2 Ch12 |
AIDA trigger plugged in Mod2 Ch12 |
|
|
17
|
Mon May 4 03:20:00 2015 |
Shunji Nishimura | RNC New Rule |
We have some new rule about the data taken at RNC from this year.
Shunji
|
| Attachment 1: kanri_e.pdf
|


|
|
|
16
|
Mon May 4 02:36:16 2015 |
J.Agramunt J.L.Tain K.Gabor | Maki trigger plugged in Mod2 Ch9 |
|
|
|
15
|
Mon May 4 02:26:14 2015 |
J.Agramunt J.L.Tain K.Gabor | F11 trigger plugged in Mod2 Ch16 of Briken daq |
|
|
|
14
|
Sun May 3 10:10:13 2015 |
J.L. Tain, J. Agramunt, G. Kiss | 94Se setting measurement |
94Se setting:
File: 150503_1500_1554_94Se.root
Rate per tube (n/s): U=0.966, D=0.263, US=0.538
Ratio to 1st 110Zr: U=2.00,  D=1.89,  US=1.84
Notes:
-Compared to the 1st 94Se setting measurement (12:19-13:19)
there is a drop of 25% in the rate without apparent reason |
|
|
13
|
Sun May 3 10:07:25 2015 |
J.L. Tain, J. Agramunt, G. Kiss | Photos of new PE shielding |
Photos of the general arrangement and details of the new PE blocks |
| Attachment 1: 20150502_195020.jpg
|

|
| Attachment 2: 20150502_194340.jpg
|

|
| Attachment 3: 20150502_192253.jpg
|

|
|
|
12
|
Sun May 3 09:04:07 2015 |
J.L. Tain, J. Agramunt, G. Kiss | Summary of neutron measurements |
U: (Up: 2 RIKEN tubes at 40cm from AIDA)
D: (Down: 12 RIKEN tubes at 80cm from AIDA)
US: (2 ORNL 2" tubes close to the floor at 1.8m from AIDA)

Natural background:
File: 150426_Bckg_1425_1805.root
Rate per tube (n/s): U=0.0071, D=0.0045, US=0.0222
Notes:
-This rate seems quite small but we should remember
that we are underground.
-The fact that U is larger than D could be explained as
related that the amount of PE around tubes is larger.
-For comparison:
BELEN-20@JYFL=0.6n/s (no beam), 0.9n/s (beam)
BELEN-30@GSI=1.2n/s (beam)
BELEN-48@JYFL=1.5n/s

110Zr setting:
File:150501_16111810_110Zr.root
Rate per tube (n/s): U=0.483, D=0.139, US=0.292
Ratio to background: U=68.3,  D=31.1,  US=13.2

Individual tube distribution:
U1	0.280	D1	0.087	D7	0.084	US1	0.132
U2	0.249	D2	0.092	D8	0.084	US2	0.188
		D3	0.083	D9	0.077
		D4	0.075	D10	0.070
		D5	0.073	D11	0.069
		D6	0.065	D12	0.054

Notes:
-There is huge increase of with beam
-The drop of increase with distance is consistent
with either beam induced or decay of implants

110Zr setting:
File: 150501_1733_1900_110Zr.root (actually 02/05)
Rate per tube (n/s): U=0.869, D=0.242, US=0.516
Ratio to 1st 110Zr: U=1.80,  D=1.74,  US=1.77
Notes:
-We don't quite understand the reason for the near factor two
difference since apparently the settings are the same and beam was
rather stable

In order to investigate the point of origin of the neutrons
we add extra PE covering D5,D6,D11,D12 from the top and
D1,D2,D7,D8 from the front

88Ge setting:
File: 150502_21502333_88Ge.root
Rate per tube (n/s): U=1.271, D=0.349, US=0.706
Ratio to 1st 110Zr: U=2.63,  D=2.51,  US=2.42

Individual rates:
U1	1.340	D1	0.424	D7	0.402	US1	0.576
U2	1.202	D2	0.446	D8	0.381	US2	0.835
		D3	0.408	D9	0.342
		D4	0.393	D10	0.315
		D5	0.359	D11	0.250
		D6	0.275	D12	0.193

Notes:
-One notices a relative drop of rate for D6, D11 and D12
pointing to a source located in the vicinity of AIDA

94Se setting:
File: 150503_1219_1319_94Se.root
Rate per tube (n/s): U=1.267, D=0.349, US=0.717
Ratio to 1st 110Zr: U=2.62,  D=2.51,  US=2.46
Notes:
-Very similar to 88Ge measurement |