| |
ID |
Date |
Author |
Subject |
|
|
27
|
Thu May 7 08:36:56 2015 |
J.L. Tain, J. Agramunt, A. Estrade, G.Kiss, T. Davinson, C.Griffin | First BRIKEN_v.0 beta-delayed neutron correlations? |
During the 98,100Kr setting run we observe
in the time correlation plot (middle right panel)
of beta signals (marked by AIDA, with amplitude larger than ch=600)
with Riken 3He tube signals (noise and pulser cleaned)
a small peak around t=0 which might be indication
of beta-delayed neutrons.
The spectrum was measured for about 2h. |
| Attachment 1: Screenshot_from_2015-05-07_16_01_27.png
|

|
|
|
95
|
Mon Oct 31 23:56:37 2016 |
J. Agramunt | First AIDA BRIKEN correlation plot |
From the 252Cf data. |
| Attachment 1: FirstAIDA_BRIKENPlot.pdf
|

|
|
|
168
|
Fri Nov 25 23:18:04 2016 |
BRIKEN collaboration | Fallon Parasitic experiments |
===== START OF PARASITIC EXPERIMENTS ====== |
|
|
15
|
Mon May 4 02:26:14 2015 |
J.Agramunt J.L.Tain K.Gabor | F11 trigger plugged in Mod2 Ch16 of Briken daq |
|
|
|
209
|
Wed Mar 29 11:02:40 2017 |
PV, Liu, JA, JLT | F11 plastic |
New calibration of F11 plastic

We decided to have both a low gain and a high gain
for F11 plastic dividing the signal from the TFA
with a "T" and using in one branch a 20db attenuator (reduction by 10)
and sending to two different DACQ channels.
The gain of the TFA was also reduced to x2

V1A7C3: F11_PL_R (Low gain: ~60MeV)
V1A7C4: F11_PL_L
V1A7C5: F11_PL_R_HG (High gain: ~600MeV)
V1A7C5: F11_PL_L_HG |
|
|
391
|
Thu Oct 25 09:18:24 2018 |
ATS & JLT | F11 plastic |
F11 plastic (long plastic after MUSIC chamber)
connected to DACQ.
The connections were re-cabled and verified.
F11 plastic has 0.2mm thickness (check!)
Current HV: 2000V |
|
|
204
|
Tue Mar 28 06:56:15 2017 |
PV, Liu, JA, JLT | F11 Plastic |
Calibration of new F11 plastic
(see photo)

The new plastic is 1mm thick instead of 0.2mm used last year.
Dimensions:120mm x 100mm x 1mm
HV applied: -1800V
Anode signal connected to Ortec 474 TFA
Gain: 20 x minimum; Int: 200ns; Diff: 100ns; Invert
60 Co source

THIS WAS WRONG! POLARITY OF SIGNALS WAS REVERSED.
***************************************************************
*File: 170328_1507_F11PL_60Co.root
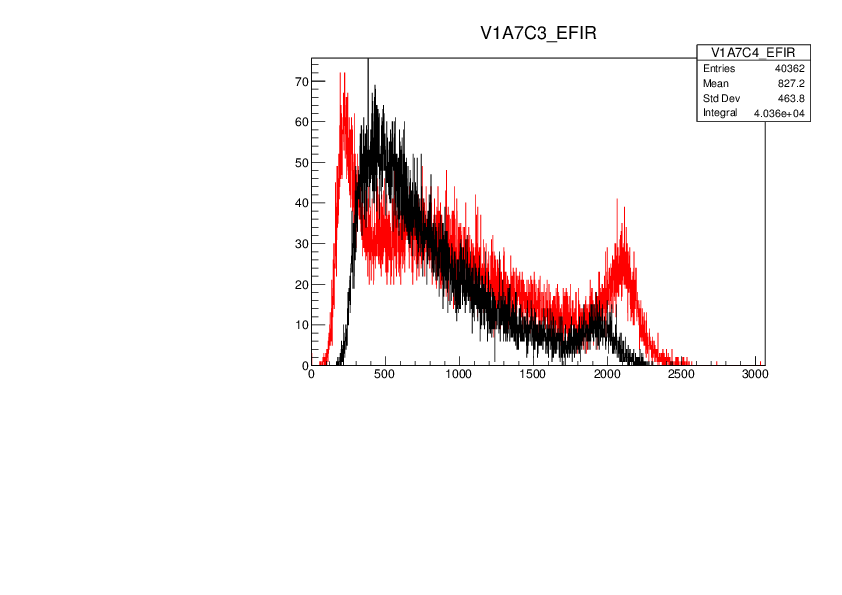
*See attached wrong picture 170328_1507_F11_PL_RandL.pdf (R:Red, L:Black)
*
*Calibration (Gain=20):
*V1C7C3_EFIR (R): Peak(<E>=1.25MeV):2077.1 -> a1=0.0006028 MeV/u
*V1C7C4_EFIR (R): Peak(<E>=1.25MeV):1924.0 -> a1=0.0006507 MeV/u
***************************************************************

CORRECT SPECTRUM:
File: 170328_1838_F11PLCal.root
Picture: 170328_1838_F11PLCal.pdf

*************************************************************

Stopping power calculation (SRIM):
50 MeV/A 40Mg: S=102*1.184=120.8 MeV/mm
100 MeV/A 40Mg: S=102*0.7129= 72.7 MeV/mm
(Later: according LISE simulations energy loss of 40Mg  is 88MeV)

What is the energy loss of the "light" particles? |
| Attachment 1: 170328_1507_F11_PL_RandL.pdf
|
|
| Attachment 2: 170328_1838_F11PLCal.pdf
|

|
| Attachment 3: NewF11Plastic.jpg
|

|
|
|
36
|
Fri Jul 15 08:29:14 2016 |
Nathan Brewer, Shintaro Go | Expected Performance and Voltage Setting for Germanium |
Expected Resolution:
------------------------------
G7 should be ~2.0 keV FWHM at 600 keV for all crystals.
D4 should be as low as 1.8 and as high as 3.3 keV FWHM at 600 keV.
Configuration File: (~/DAQ_1/include/hvmon.conf)
-----------------------------------------------------------------
Type IP address channel slot name voltage Current RampUp RampDn Switch On/Off
V uA V/s V/s 1/0
------ --------------- --------- ----- ---- ------- ------- ------ ------ -------------
0 192.168.13.239 0 3 D40 3000 0.5 2 5 1
0 192.168.13.239 1 3 D41 3000 0.5 2 5 1
0 192.168.13.239 2 3 D42 3000 0.5 2 5 1
0 192.168.13.239 3 3 D43 3000 0.5 2 5 1
0 192.168.13.239 4 3 G70 2500 0.5 2 5 1
0 192.168.13.239 5 3 G71 3000 0.5 2 5 1
0 192.168.13.239 6 3 G72 2500 0.5 2 5 1
0 192.168.13.239 7 3 G73 2500 0.5 2 5 1
In all cases (Temperature Monitor, ACQ, etc.) D4 comes before G7 and in the same order.
|
|
|
3
|
Fri Oct 31 12:58:49 2014 |
Robert Grzywacz | Entry test - preamps |
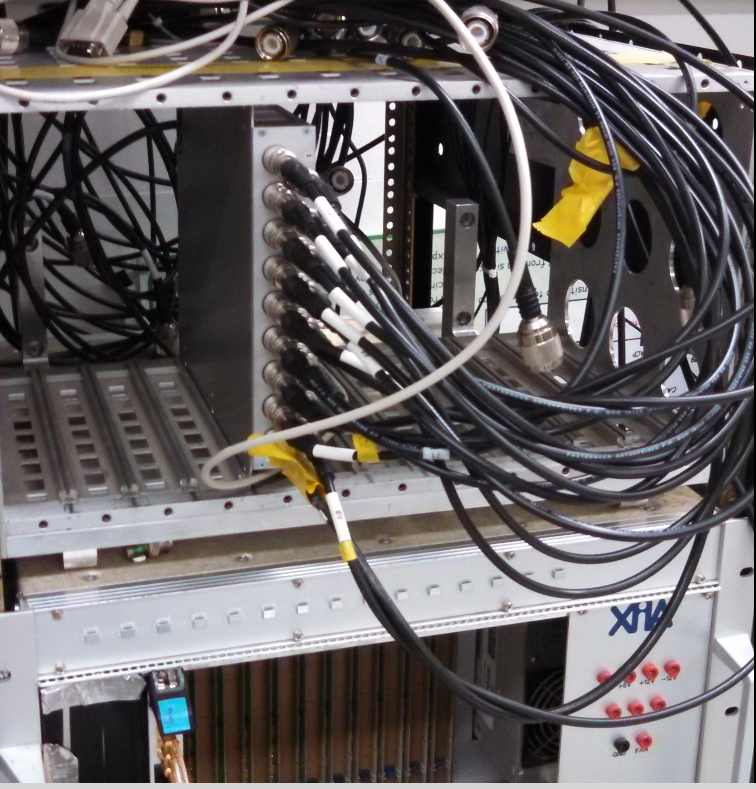
Here is a picture of one of our Mesytec preamplifiers. We have located all seven of them.
They have 16 input channels and a common SHV per board.
<p> <a href="141031_125516/24.png?lb=BRIKEN"><img border="0" alt="24.png" src="141031_125516/24.png?
lb=BRIKEN&thumb=1" name="att0" id="att0" /></a></p> |
| Attachment 1: 24.png
|
|
|
|
Draft
|
Mon May 29 07:06:56 2017 |
K. Matsui | Energy loss in Long Plastic Scintillator |
After Al degrader with the optimized width of 13 mm, the energy loss in Long Plastic Scintillator is 546(2) MeV at F11.
This value depends on |
|
|
108
|
Fri Nov 4 03:37:27 2016 |
Roger Caballero | Energy calibration for Ge clovers |
Energy Calibration: See attached pdf

Detector Slope Offset
V2A7C1 0.00155643 0.0842245
V2A7C2 0.000658962 0.78685
V2A7C3 0.00153391 1.198
V2A7C4 0.00157933 0.483094
V2A7C5 0.000704268 0.31553
V2A7C6 NOT THERE
V2A7C7 0.00066837 0.465225
V2A7C8 0.000695872 0.678058


> Energy calibration for clovers, 152Eu
>
>
>
> The Eu source positioned in the center roughly.
> File name: 161103_1426_152Eu.root |
| Attachment 1: 20161104-HpGe-EnergyCal.pdf
|

|
|
|
110
|
Sat Nov 5 01:25:24 2016 |
Tain et al | End of Beam Line Setup |
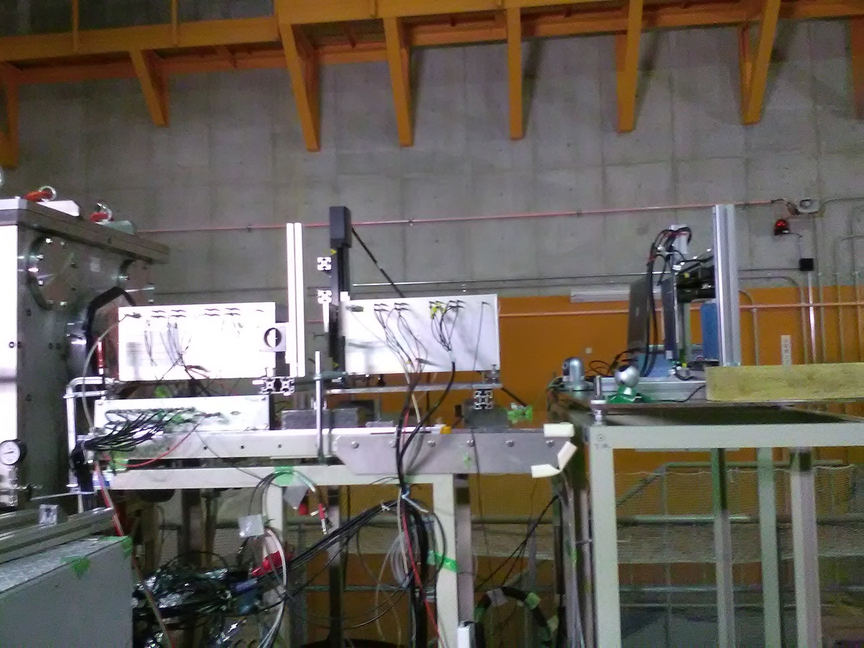
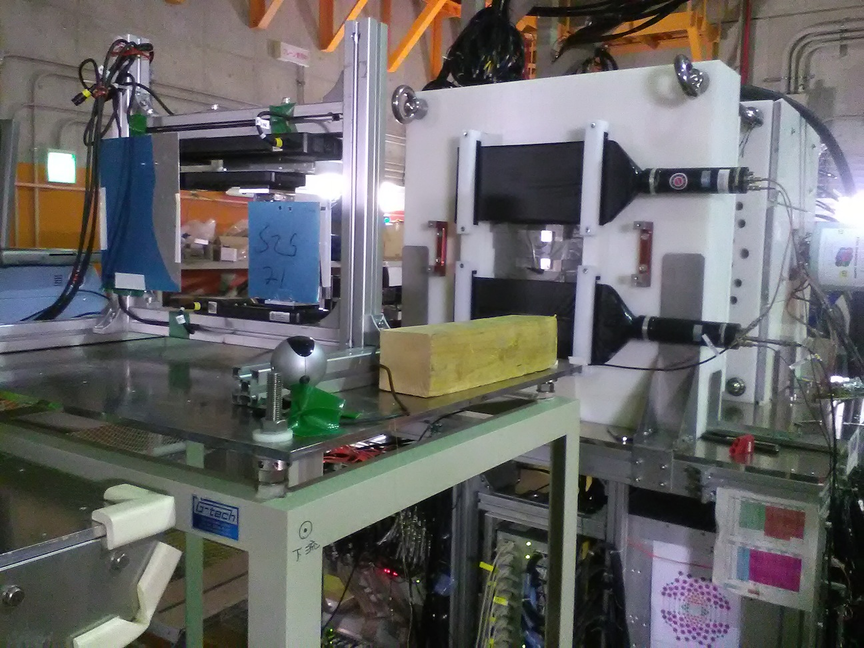
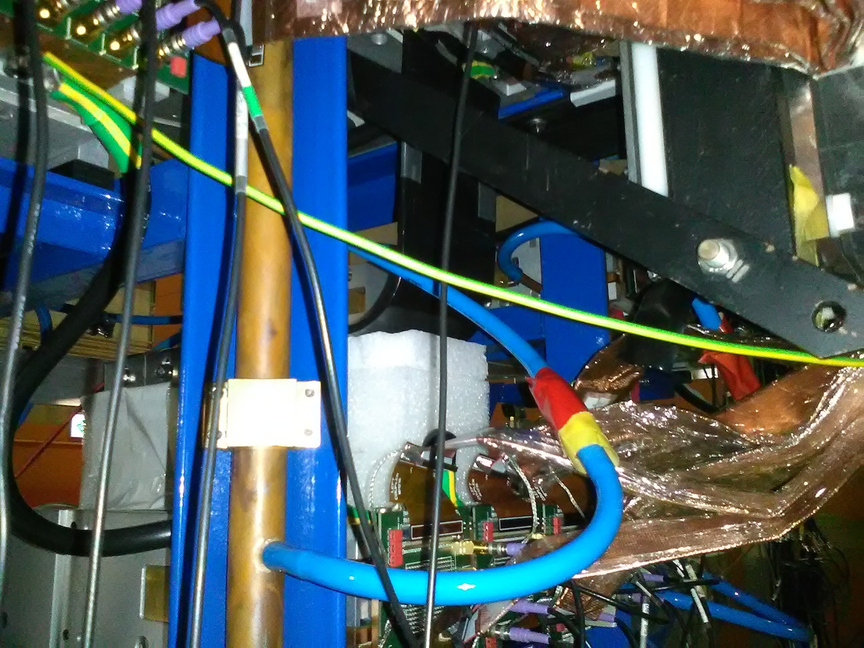
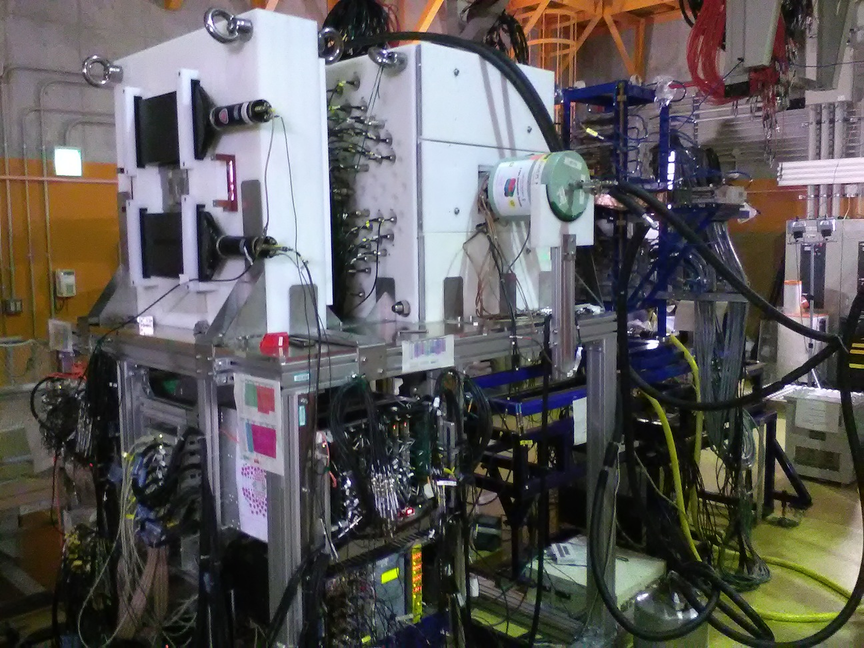
Some photos of the elements in the last part of the beam line
during Takechi run.

After the chamber that includes the F11 plastic detector
there are 2 GSI-MUSIC chambers.

In between the MUSIC chambers there is a sample changer
with 2 Carbon targets of 6mm and 3mm thickness and also
an empty position.

After the 2nd MUSIC there is a plastic detector for testing
(could be removed at any time)

Afterwards there is the degrader mounted on a separate table.
In the same table there is a 10cm thick lead wall
to protect AIDA during Takechi run.

Mounted on the shielding are from the beam side the top and bottom
plastic veto detectors.

On the back side the Si detector is mounted.

The hole in the shielding is covered with
a 2cm thick Al plate to protect AIDA during Takechi run.

Behind AIDA there is a thin plastic detector
to veto the passing through particles. |
| Attachment 1: MUSIC-Ctarget-degrader.jpg
|
|
| Attachment 2: Ctarget.jpg
|

|
| Attachment 3: Degrader-PlasticVeto.jpg
|
|
| Attachment 4: VetoPlastic.jpg
|

|
| Attachment 5: SiDetector.jpg
|

|
| Attachment 6: PlasticBehindAIDA.jpg
|
|
| Attachment 7: BRIKEN-AIDA.jpg
|
|
| Attachment 8: PlasticBehindMUSIC.jpg
|

|
| Attachment 9: LeadBricks.jpg
|

|
|
|
186
|
Mon Nov 28 01:22:50 2016 |
BRIKEN collaboration | Elog RIBF123 & BigRIPS |
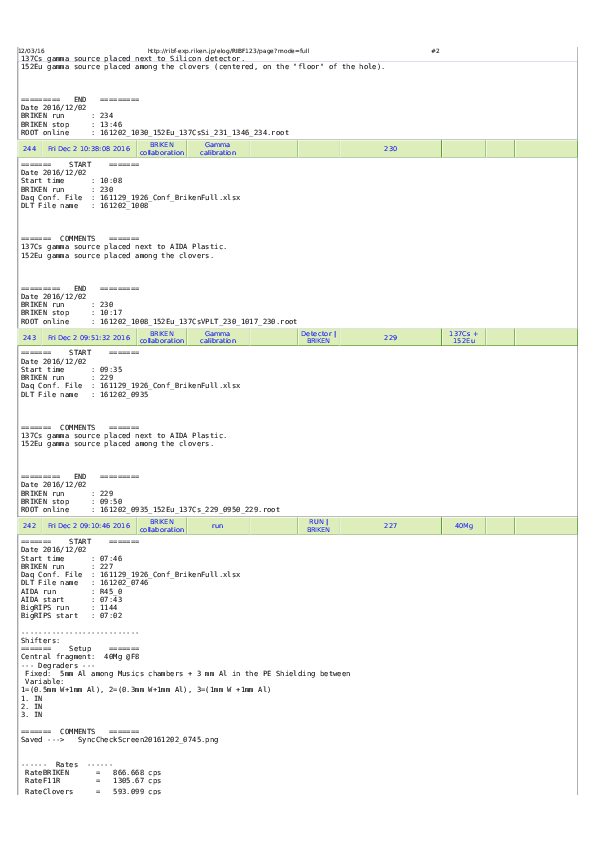
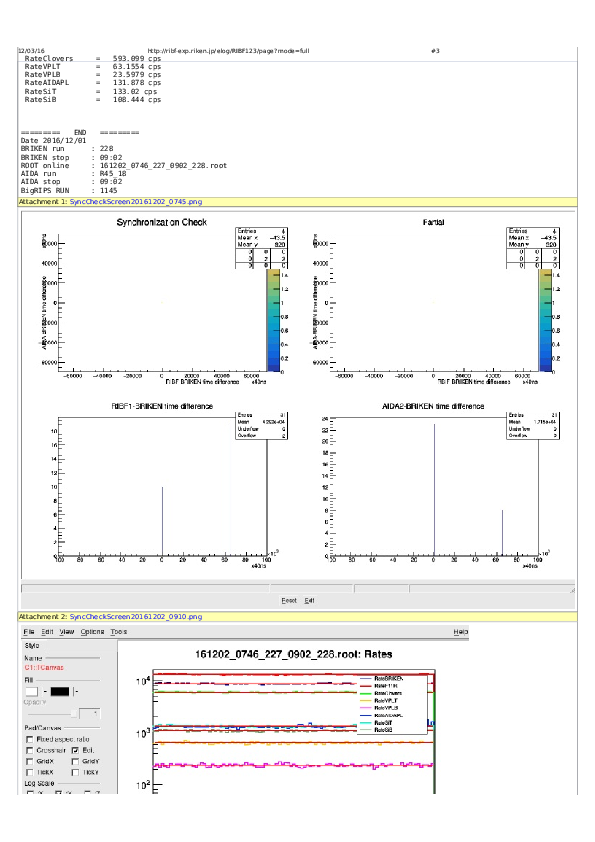
Full RIB123 Elog entries for Takechi && Fallon parasitic experiments
Update:03Dec16
Instructions:
1) Download RIBF123FullEntries.tar.gz-part-aa and RIBF123FullEntries.tar.gz-part-ab

2) Join and uncompress the file on the terminal:
    # cat RIBF123FullEntries.tar.gz-part-*| tar xz
3) cd RIBF123FullEntries

4) Open with a Browser ELOGRIBF123_161203_2030_fullWeb.html
-----------------------------------------------------------
HTML elogs for BigRIPS are found by unziping BigRIPSRunSummary.zip and EXPDBRunSummary.zip

-----------------------------------------------------------
The full elog is also included in pdf file. See:

ElogRIBF123_161203_2030_Full_part1.pdf

ElogRIBF123_161203_2030_Full_part2.pdf |
| Attachment 1: BigRIPSRunSummary.zip
|
| Attachment 2: EXPDBRunSummary.zip
|
| Attachment 3: RIBF123FullEntries.tar.gz-part-aa
|
| Attachment 4: RIBF123FullEntries.tar.gz-part-ab
|
| Attachment 5: ElogRIBF123_161203_2030_Full_part1.pdf
|


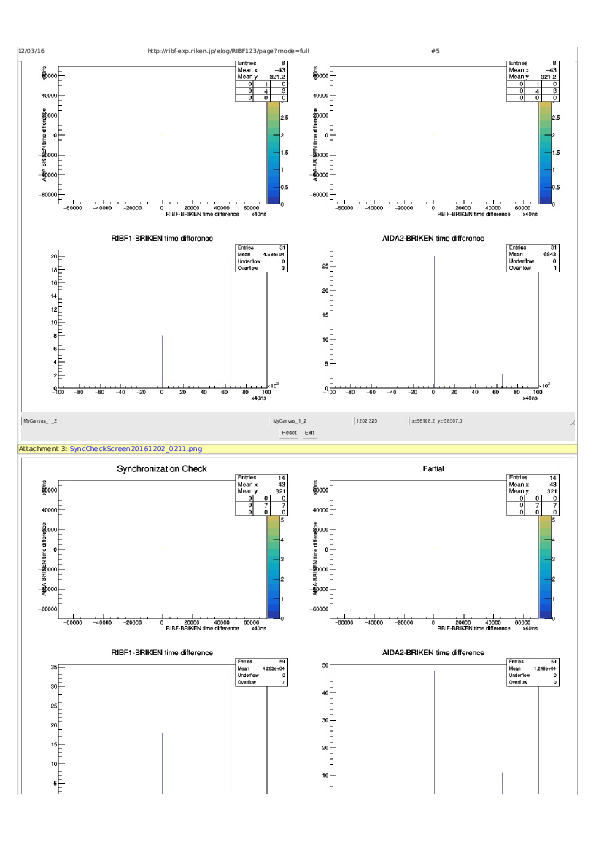


|
| Attachment 6: ElogRIBF123_161203_2030_Full_part2.pdf
|
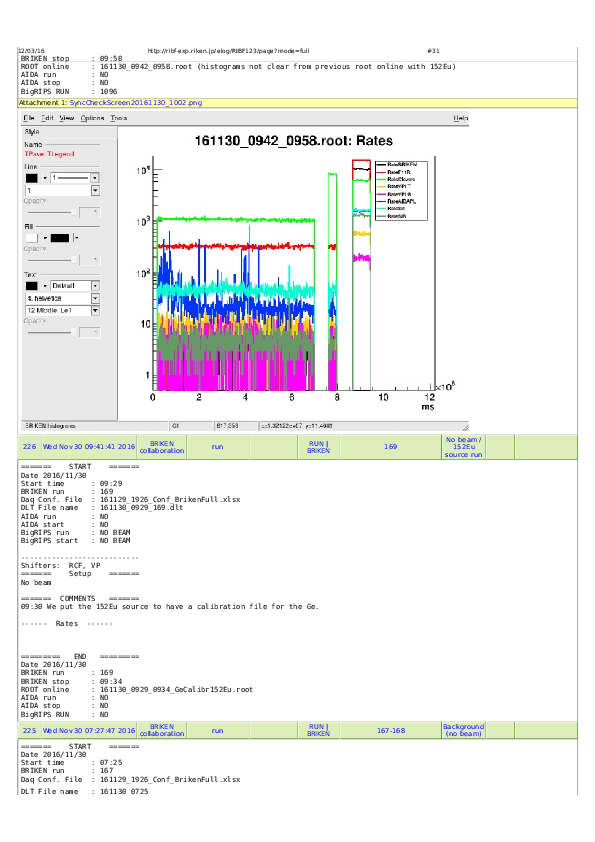
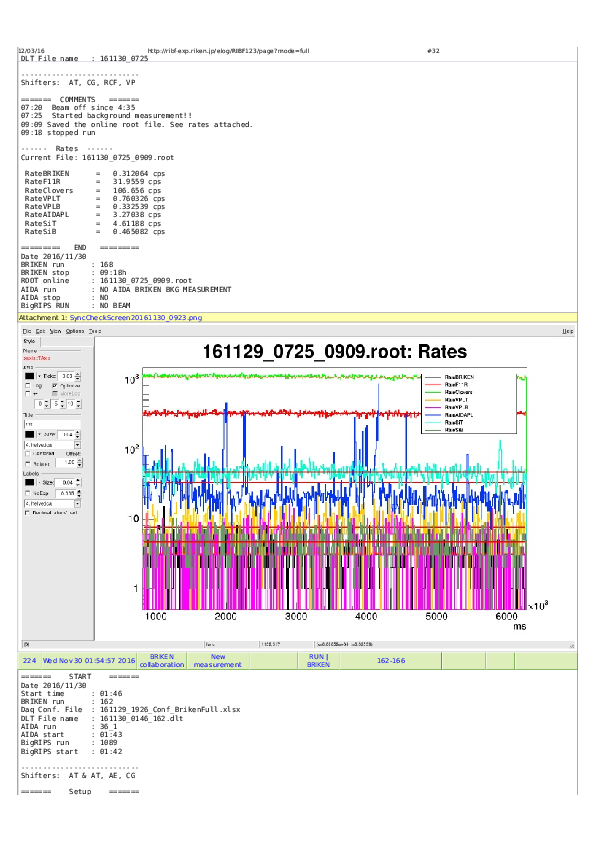

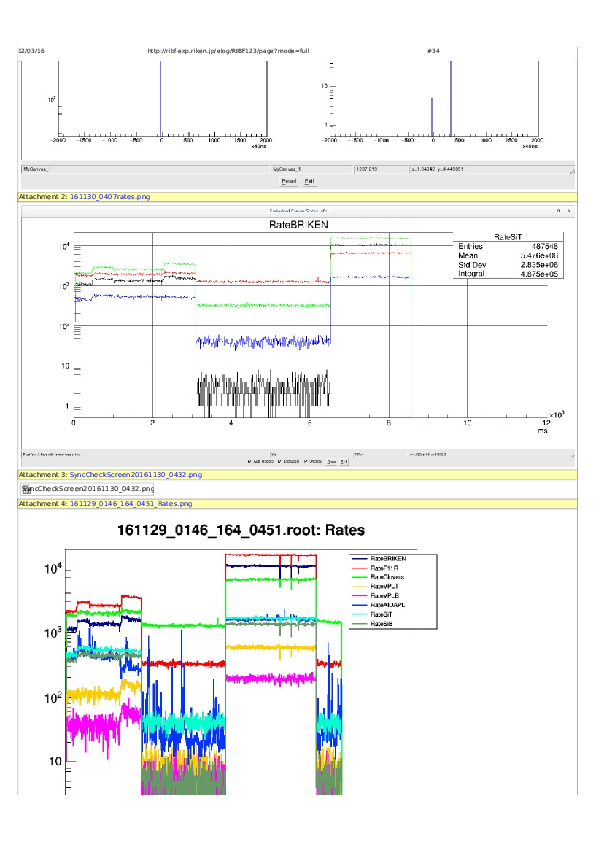
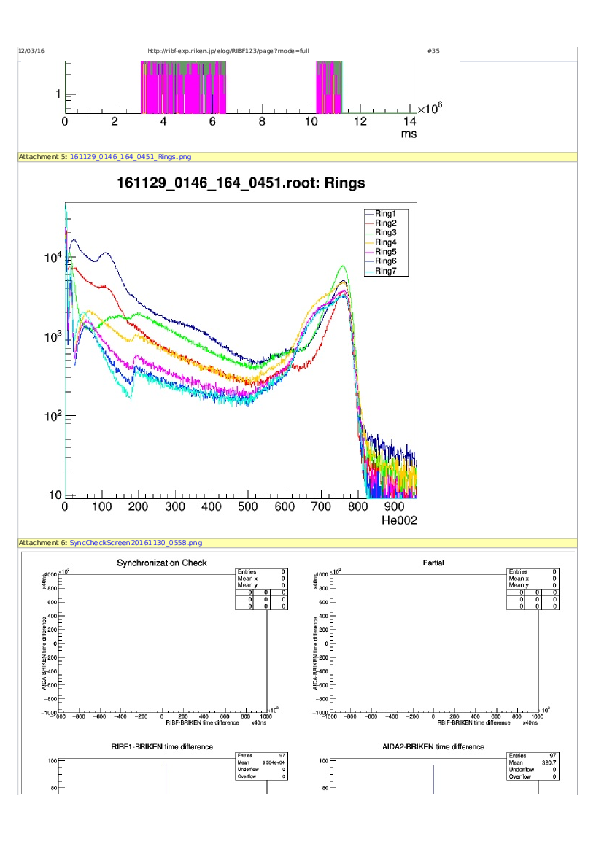

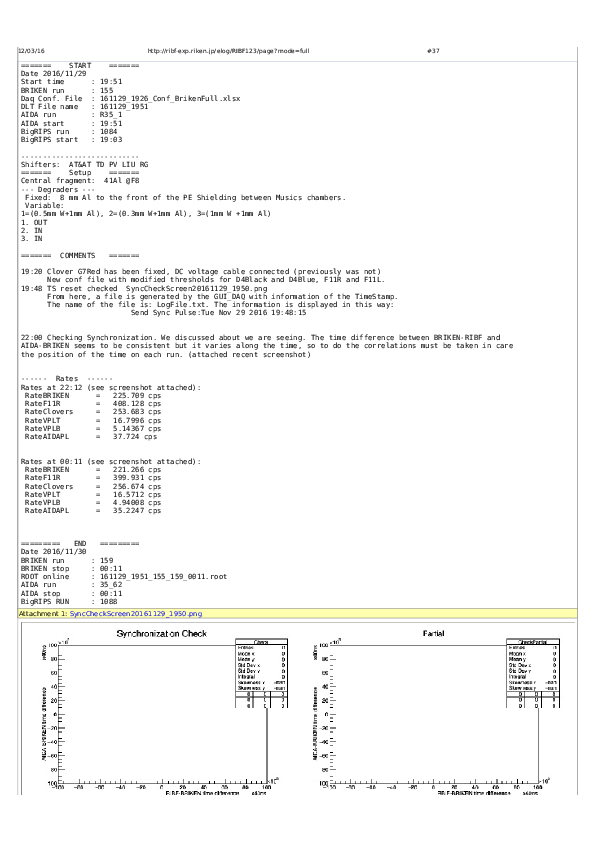

|
|
|
146
|
Wed Nov 9 01:02:53 2016 |
Iris | Elog |
From Nov. 9th on we use the Takechi ELOG for the run information:
http://ribf-exp.riken.jp/elog/RIBF123/ |
|
|
169
|
Sat Nov 26 00:04:15 2016 |
AT | Elog |
RIKEN Elog during Fallon Parasitic experiments

Fallon Group:
Elog is found in http://ribf-exp.riken.jp/elog/DALI2+Fall+2016/

BRIKEN collaboration:
We keep elog from Takeshi experiments (Nishimura-san desicion!). This elog is found in

http://ribf-exp.riken.jp/elog/RIBF123/ |
|
|
41
|
Tue Jul 19 03:19:34 2016 |
A. Tarifeņo, I. Dillman, J. Agramunt, A. Tolosa, J.L. Tain... | Electronics |
Preamplifier and signal cable testing

We check all signal cables,the flat cable connector to BNC
from ORNL/UTK and they are OK.

While checking the preamplifiers (PA) we realized that on the oscilloscope
some of the channels shown pulses without a load when HV is on.
After some checks, we come to the conclusion that is a kind of discharge
on the HV part of the preamp (which appears as positive pulse or negative pulses)
and induce pulses of opposite sign in one or mos neighbouring channels.
After systematically investigating them in the scope, we plug them in the DACQ
to record the spectra. For this we include an additional digitizer SIS3316
to connect al1 channel preamps
PA1(D):UPC:SN-0808223 -> V1A1
PA2(D):GSI:SN-1112572 -> V1A2
PA3(D):UPC:SN-0310315 -> V1A3
PA4(D):UPC:SN-0808220 -> V1A4
PA5(U):UTK: ? -> V1A5
PA6(U):UTK:SN-0808218 -> V1A6
PA7(U):UTK:SN-0713586 -> V1A7
PA8(U):UTK:SN-0808221 -> V2A1, V2A2
PA9(U):UTK:SN-0808215 -> V2A3, V2A4
PA10(U):UTK:SN-0808217 -> V2A5, V2A6

We measure first with a tube of each type connected to Ch#1 of each PA
to adjust parameters of digitizers and range
List-mode: 160717_preampCheck_000.dlt
On-line: 160717_preampCheck.root

Then we remove the tube from Ch#1 to see the effect in this channel:
List-mode: 160717_preampCheck_noTubes_001.dlt
On-line: 160717_preampCheck_noTubes.root

We attach screenshots for both as compressed files (.zip)
and the root files |
| Attachment 1: preampCheck.zip
|
| Attachment 2: noTubeCh1.zip
|
| Attachment 3: 160717_preampCheck.root
|
| Attachment 4: 160717_preampCheck_noTubes.root
|
|
|
46
|
Wed Jul 20 08:58:13 2016 |
J.L. Tain, I.Dillman, R. Caballero, J. Agramunt, A. Tarifeņo, A. Tolosa, ... | Electronics |
Distribution of connections of tubes in preamplifiers and digitizers


Because of the need to use 10 PAs instead of 9 PAs we had to redistribute
the signal connections. Now:
PA1(RIKEN), PA2(RIKEN), PA3(UPC), PA4(UPC), PA5(UPC) -> V1A1-V1A4
PA6(ORNL1) -> V1A5
PA7(ORNL2) -> V1A6
PA8(ORNL2) -> V2A1,V2A2
PA9(ORNL2) -> V2A3,V2A4
PA10(ORNL2) -> V2A5,V2A6

So V1A1 to V1A4 contain now signals from 2 PAs.
We also redistributed the tubes within the PAs
We also changed the numbering or RIKEN Tubes. Tube 1 to 12 are now
those on the AIDA side (PA1 attached to the PE block)

A figure showing the distribution of tubes an numbering is included.
Tube 1 is behind tube 19 and so forth.

Attached also is an excel file with tube-channel distribution |
| Attachment 1: TubeDistribution-new.xlsx
|
| Attachment 2: TubeDistribution-new.pdf
|

|
|
|
47
|
Wed Jul 20 11:16:18 2016 |
J.L. Tain | Electronics |
Pulser settings

We use two pulsers, Pulser1 for RIKEN, ORNL1 and ORNL2 tubes (7 PA)
and Pulser2 for UPC tubes due to the different gains (3 PA)

10HzClock->G&DG->Pulser->LinearFI/FO

Pulser1: BNC BH-1: trise=1us, tfall=1ms, amp=670mV(scope), NEG
Pulser2: BNC PB-5: tfall=1ms, amp=0.180mV(setting), 90mV(scope), NEG

Later on we found out that Pulser1 is compatible also for
the CLOVER detectors (8PA). This will require an additional LinearFI/FO |
|
|
57
|
Wed Jul 20 17:18:59 2016 |
J.L. Tain, J. Agramunt, A. Tarifeņo, A. Tolosa, K. Gabor, S. Go, K. Matsui... | Electronics |
Measurement with preamplifiers after drying.

Amplifiers are brought back after ~12h and connected.
Measurement of background for 1hour
Online: 160720_1350_1452_Bkg.root
Listmode: No

There might have been a slight improvement on the PA behaviour
but is not clear.

Attached a screen shot of the spectrum

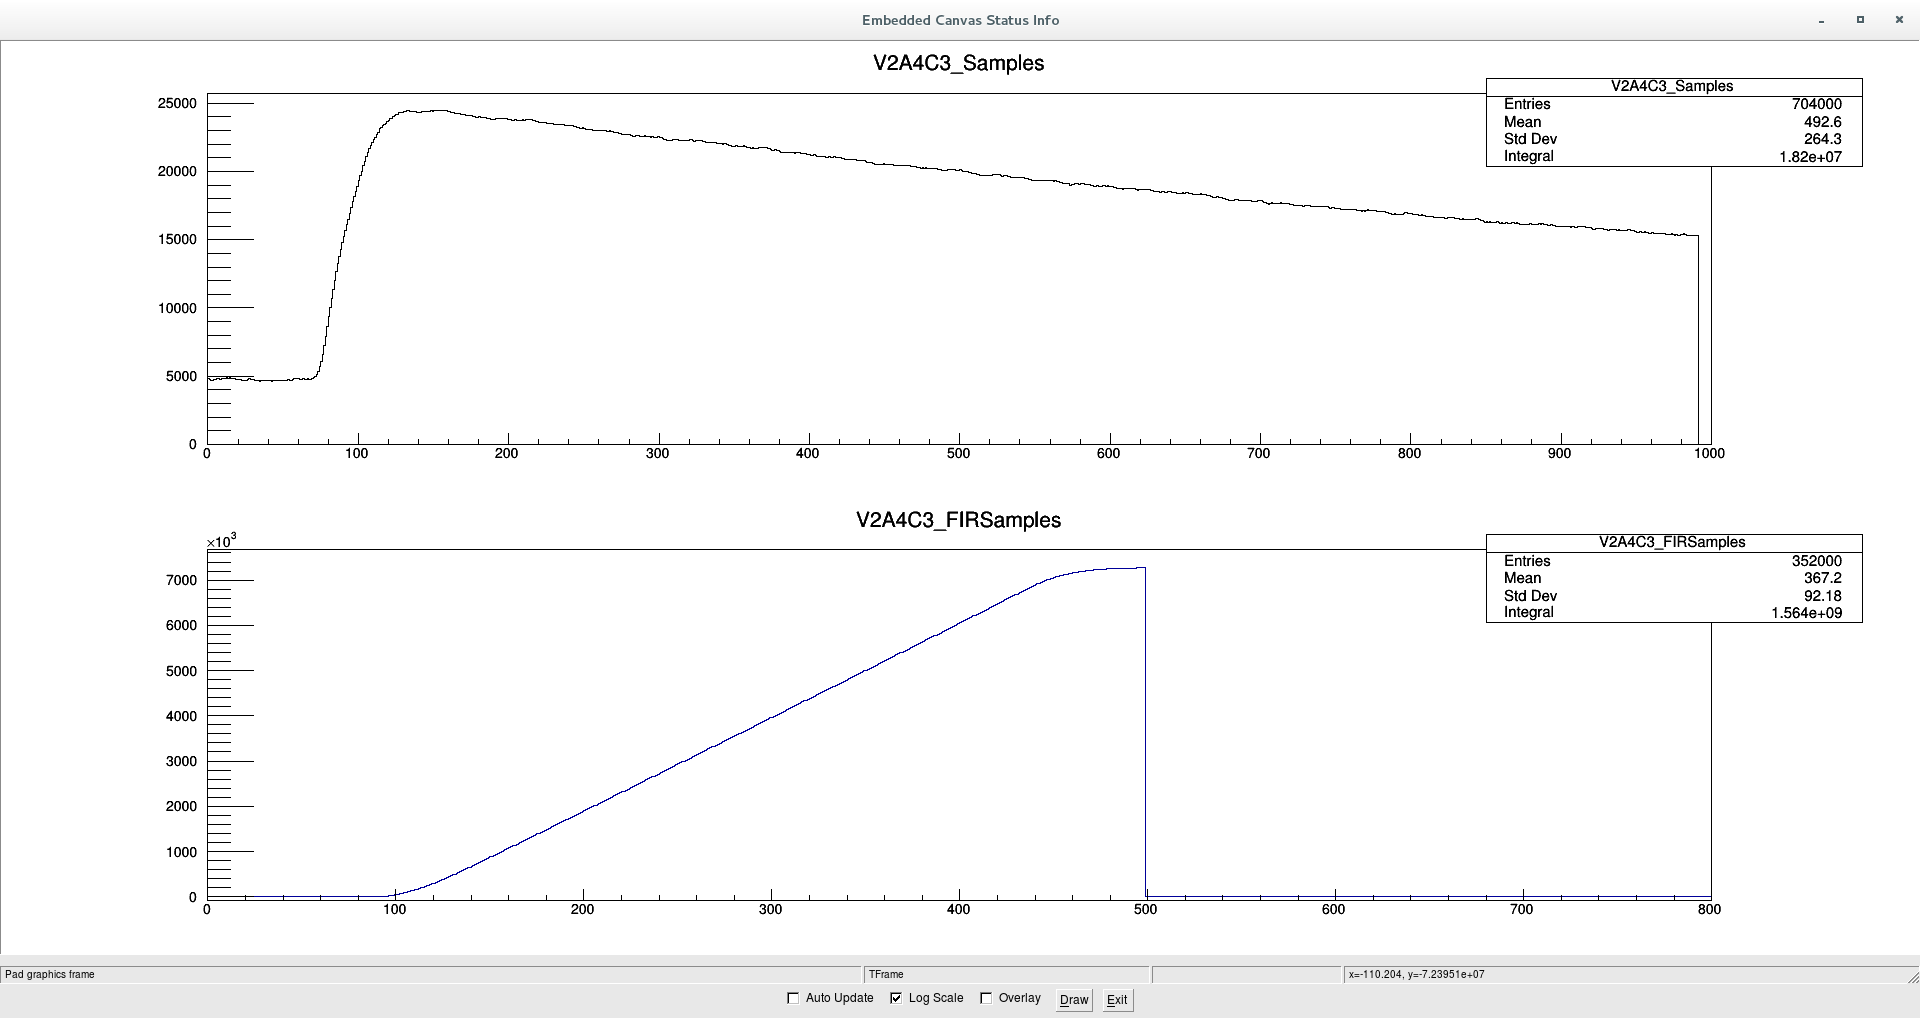
The spurious signals show very little noise superimposed
as can be seen in the attached capture of the sample by the DACQ
but is not so obvious how this can help to veto them. |
| Attachment 1: Bkg-afterPAdrying.png
|

|
| Attachment 2: V2A4C3-SpuriousSignal.png
|
|
|
|
64
|
Thu Oct 6 14:43:47 2016 |
JL Tain, A Tarifeno, A Tolosa, J Agramunt, N Brewer, S Go, ... | Electronics |
We mount back all preamplifiers
Initially we used all the PA coming from US, the repaired and the new ones.
There was an issue with the new ones (strong noise and cross talk)
until we realized that the new ones were of differential type
instead of unipolar. We decided to mount all unipolar so we use
the repaired ones plus the ones which were left here and
had some minor problems with discharges.

We decided to change slightly the gain of the pulser signals
because for PA6 to PA10 the amplitude after the preamp was 2.2-2.4V
so it was saturating the ADC.
So we decreased Pulser 1 (RIKEN, ORNL1, ORNL2, CLOVER)
from 690mV to 540mV (NEG) on the scope (50ohm)
and increased Pulser 2 (UPC) from 90mV to 100mV |