| ID |
Date |
Author |
Subject |
|
17
|
Mon Sep 21 09:51:57 2020 |
JM | CARME Status |
Cooling of baking volume finished over the weekend, attached are some plots of the bakeout test. Bakeout2.png is the thermocouple profile for the entire period over the week. The heating in the first seven hours followed a nice linear rise of ~5C/hour, in the 7-40 hour period the heating rate slowed due to an issue with our octagon average limiting the increase in the temperature. The period from 40-65 hours was due to the picologger heating up to unacceptbly high temperatures which paused the heating. The octagon average and picologger problems were solved after this, with hours 65-75 showing the linear increase seen previously of ~5C/hour until the maximum temperature of the was reached. The maximum of the RE-72 controllers was 135C with the chamber average ~140C. The next 48 hours the bakeout was left to maintain its temperature, with slight day/night variations observed. During this period both heaters were on in order to maintain the temperature as can be seen in RE72_test2.png, where 1 represents the heater on and 0 the heater off (note for RE72 1 I have shifted these values to 1.5 and 0.5 respectively to better show on the same plot). The rest of the bakeout time shows the cooling of the volume in a serious of 10C and 5C steps.
Graphs for the cooling profiles of each step (5C and 10C) are attached. Keeping the chamber temperature gradient below 10C is most dependent upon the top and bottom temperatures of the chamber. The bottom of the chamber cools much faster than the top of the chamber, down to a minimum value before the heaters kick back in once the RE72 temperatures arrive at the set point. An equillibrium time is then required for the top of the chamber to cool before the next step can be implemented. The 5C steps are recommened for future cooling due to chamber gradients not exceeding the 10C limit and the shorter 'equillibrium time'. Top/Bottom_test2.png shows the difference in chamber and air temperatures between the top and bottom of the baking volume, with a large difference in the air temperature between top and bottom potentially having a significant effect on the cooling of the chamber. I hope improved insulation on the main chamber will result in less heat losses from the bottom of the baking volume and a smaller cooling gradient for the bottom of the chamber during the step down.
I have deconstructed the baking jacket on the chamber and am ready to begin moving the jacket over to the other chamber.
Pressure on the leak cart is 7.1e-7 mbar as of 09:44. |
| Attachment 1: Graphs.zip
|
|
18
|
Wed Sep 23 13:34:04 2020 |
JM | Tuesday 22 September |
Turbo-pump Issue approximately 13:00 22/9/20.
While moving the baking octagon into position, the power connector became disconnected from the turbo pump. The pump controller provided the warnings of connector failure and high pump load (probably due to it reading the frequency of the pump as 0 Hz when disconnected and thinking this was due to a high pump load). I believe the valve then was slightly knocked causing a vibration in the turbo, which couldn't be corrected for by the controller as it had become disconnected. The result of this was the turbo noise growing louder (similar to the turbo in the edinburgh lab when venting). At the time I didn't know the connector had become disconnected, as it was still attached to the turbo, and due to the warning messages on the controller, noise of the turbo and lack of information on what had happend, I decided to close the valve connecting the chamber to the turbo and vent the backing line up to the turbo and in order to remove and replace the turbo.
The chamber was in the high -6 mbar range when the valve was closed. The turbo was replaced with the second turbo which began pumping again (with the power connector properly secured this time) on 23/9/20. The turbo doesn't show any obvious sign of damage, the blades in it are free to spin with no hindrance, but we will have to get it tested by the vac lab to be sure. |
|
21
|
Fri Sep 25 12:58:33 2020 |
JM | Friday 25/09/20 |
10:00 Vessel P = 3.99e-8 mbar, RGA P = 1.4e-6 mbar
10:54 Vessel P = 3.89e-8 mbar, RGA P = 1.4e-6 mbar
Vessel continues to pump down. Baking Jacket fully installed and testing of baking begins before leaving on automatic mode for the week. Some baking jacket pieces may need to be re-jigged a little for use in GSI with the interaction chamber but will be fine for this bakeout. Note that due to the valves 'being in the way' the front of the baking volume holds the majority of the heaters
During this testing phase I have noticed the vessel pressure increase slightly even with vessel temperatures of approx 30C. Pvessel = 5.66e-8 mbar currently.
Automatic mode started 14:06. I will monitor to check everything is okay before letting it run over the weekend
16:00 I have noticed that two of the thermocouples floating(back) and floating(top) may be damaged as they were giving sharp spikes in temperature. I have just removed these thermocouples so they should just read the picologger temp. The jacket looks like it is holding temperature quite well. I have set the temperature to 35C and am currently waiting for temperatures to equillibriate before putting back into automatic mode. Pvessel = 1.68e-7 mbar
19:00 Temperatures look good, I will begin bakeout tomorrow morning now, so if anything goes wrong its not in the middle of the night. Have a good weekend all!
|
| Attachment 1: Photos.zip
|
|
23
|
Mon Sep 28 13:04:27 2020 |
JM | Baking |
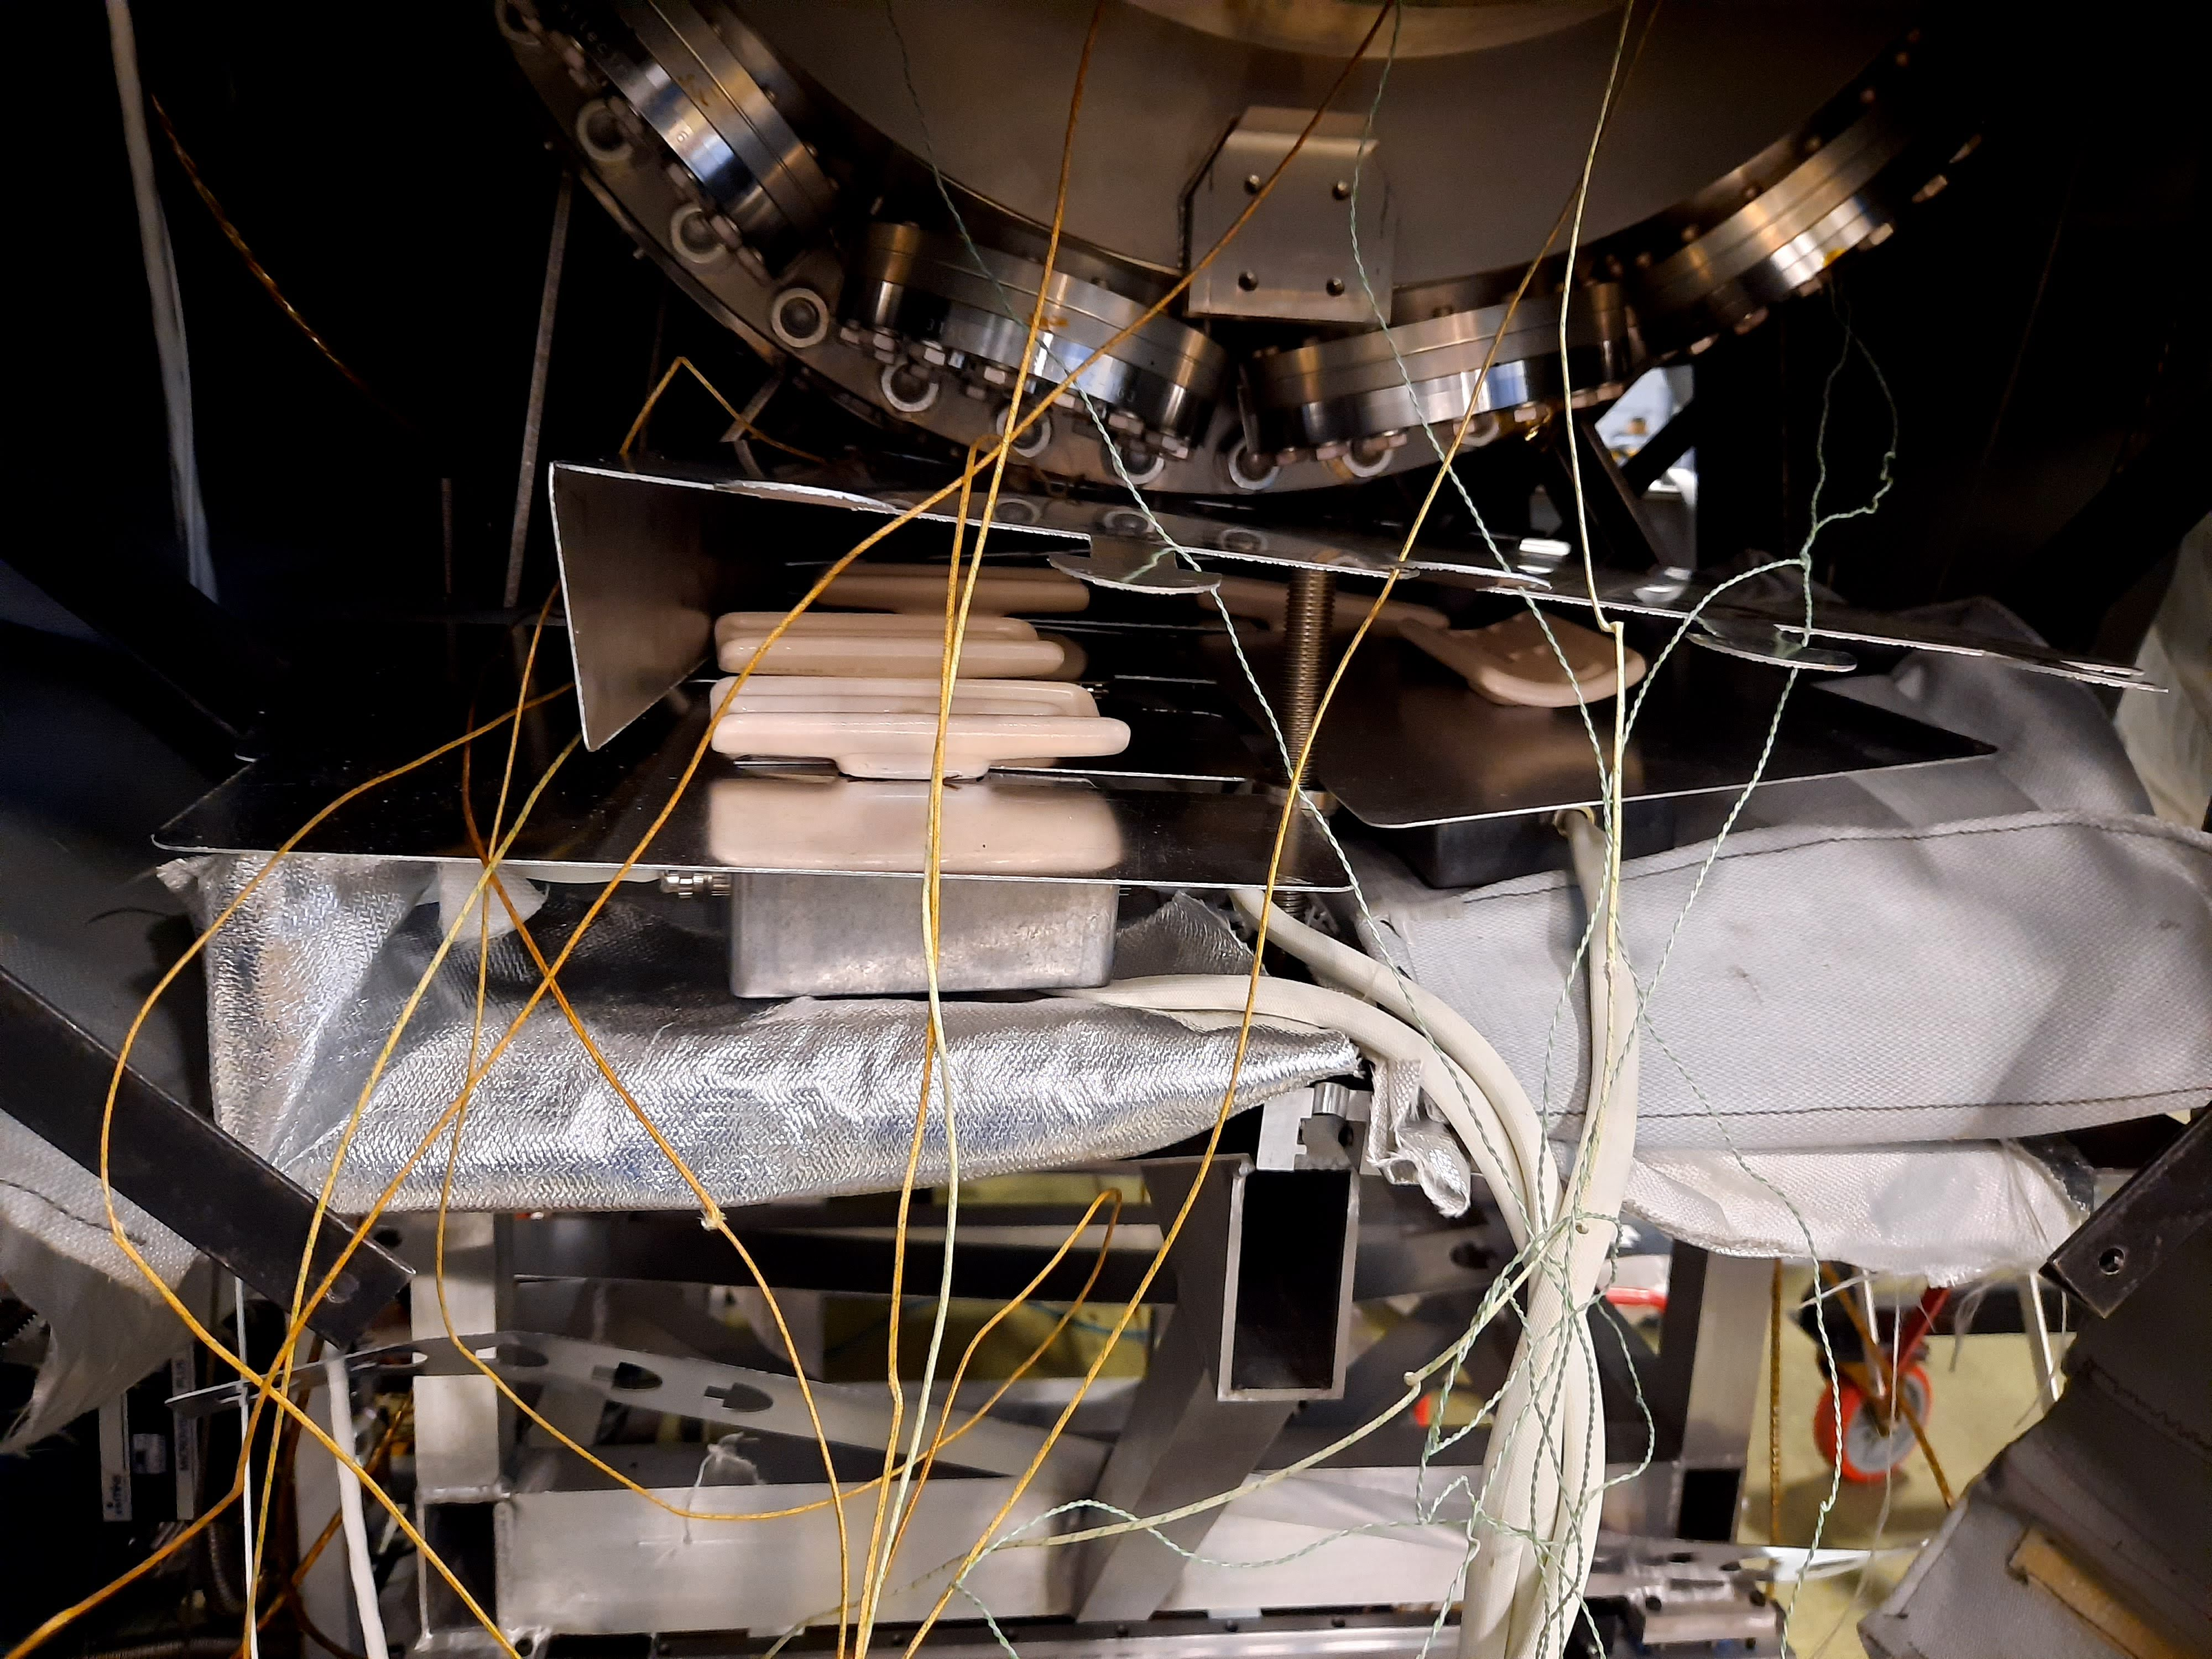
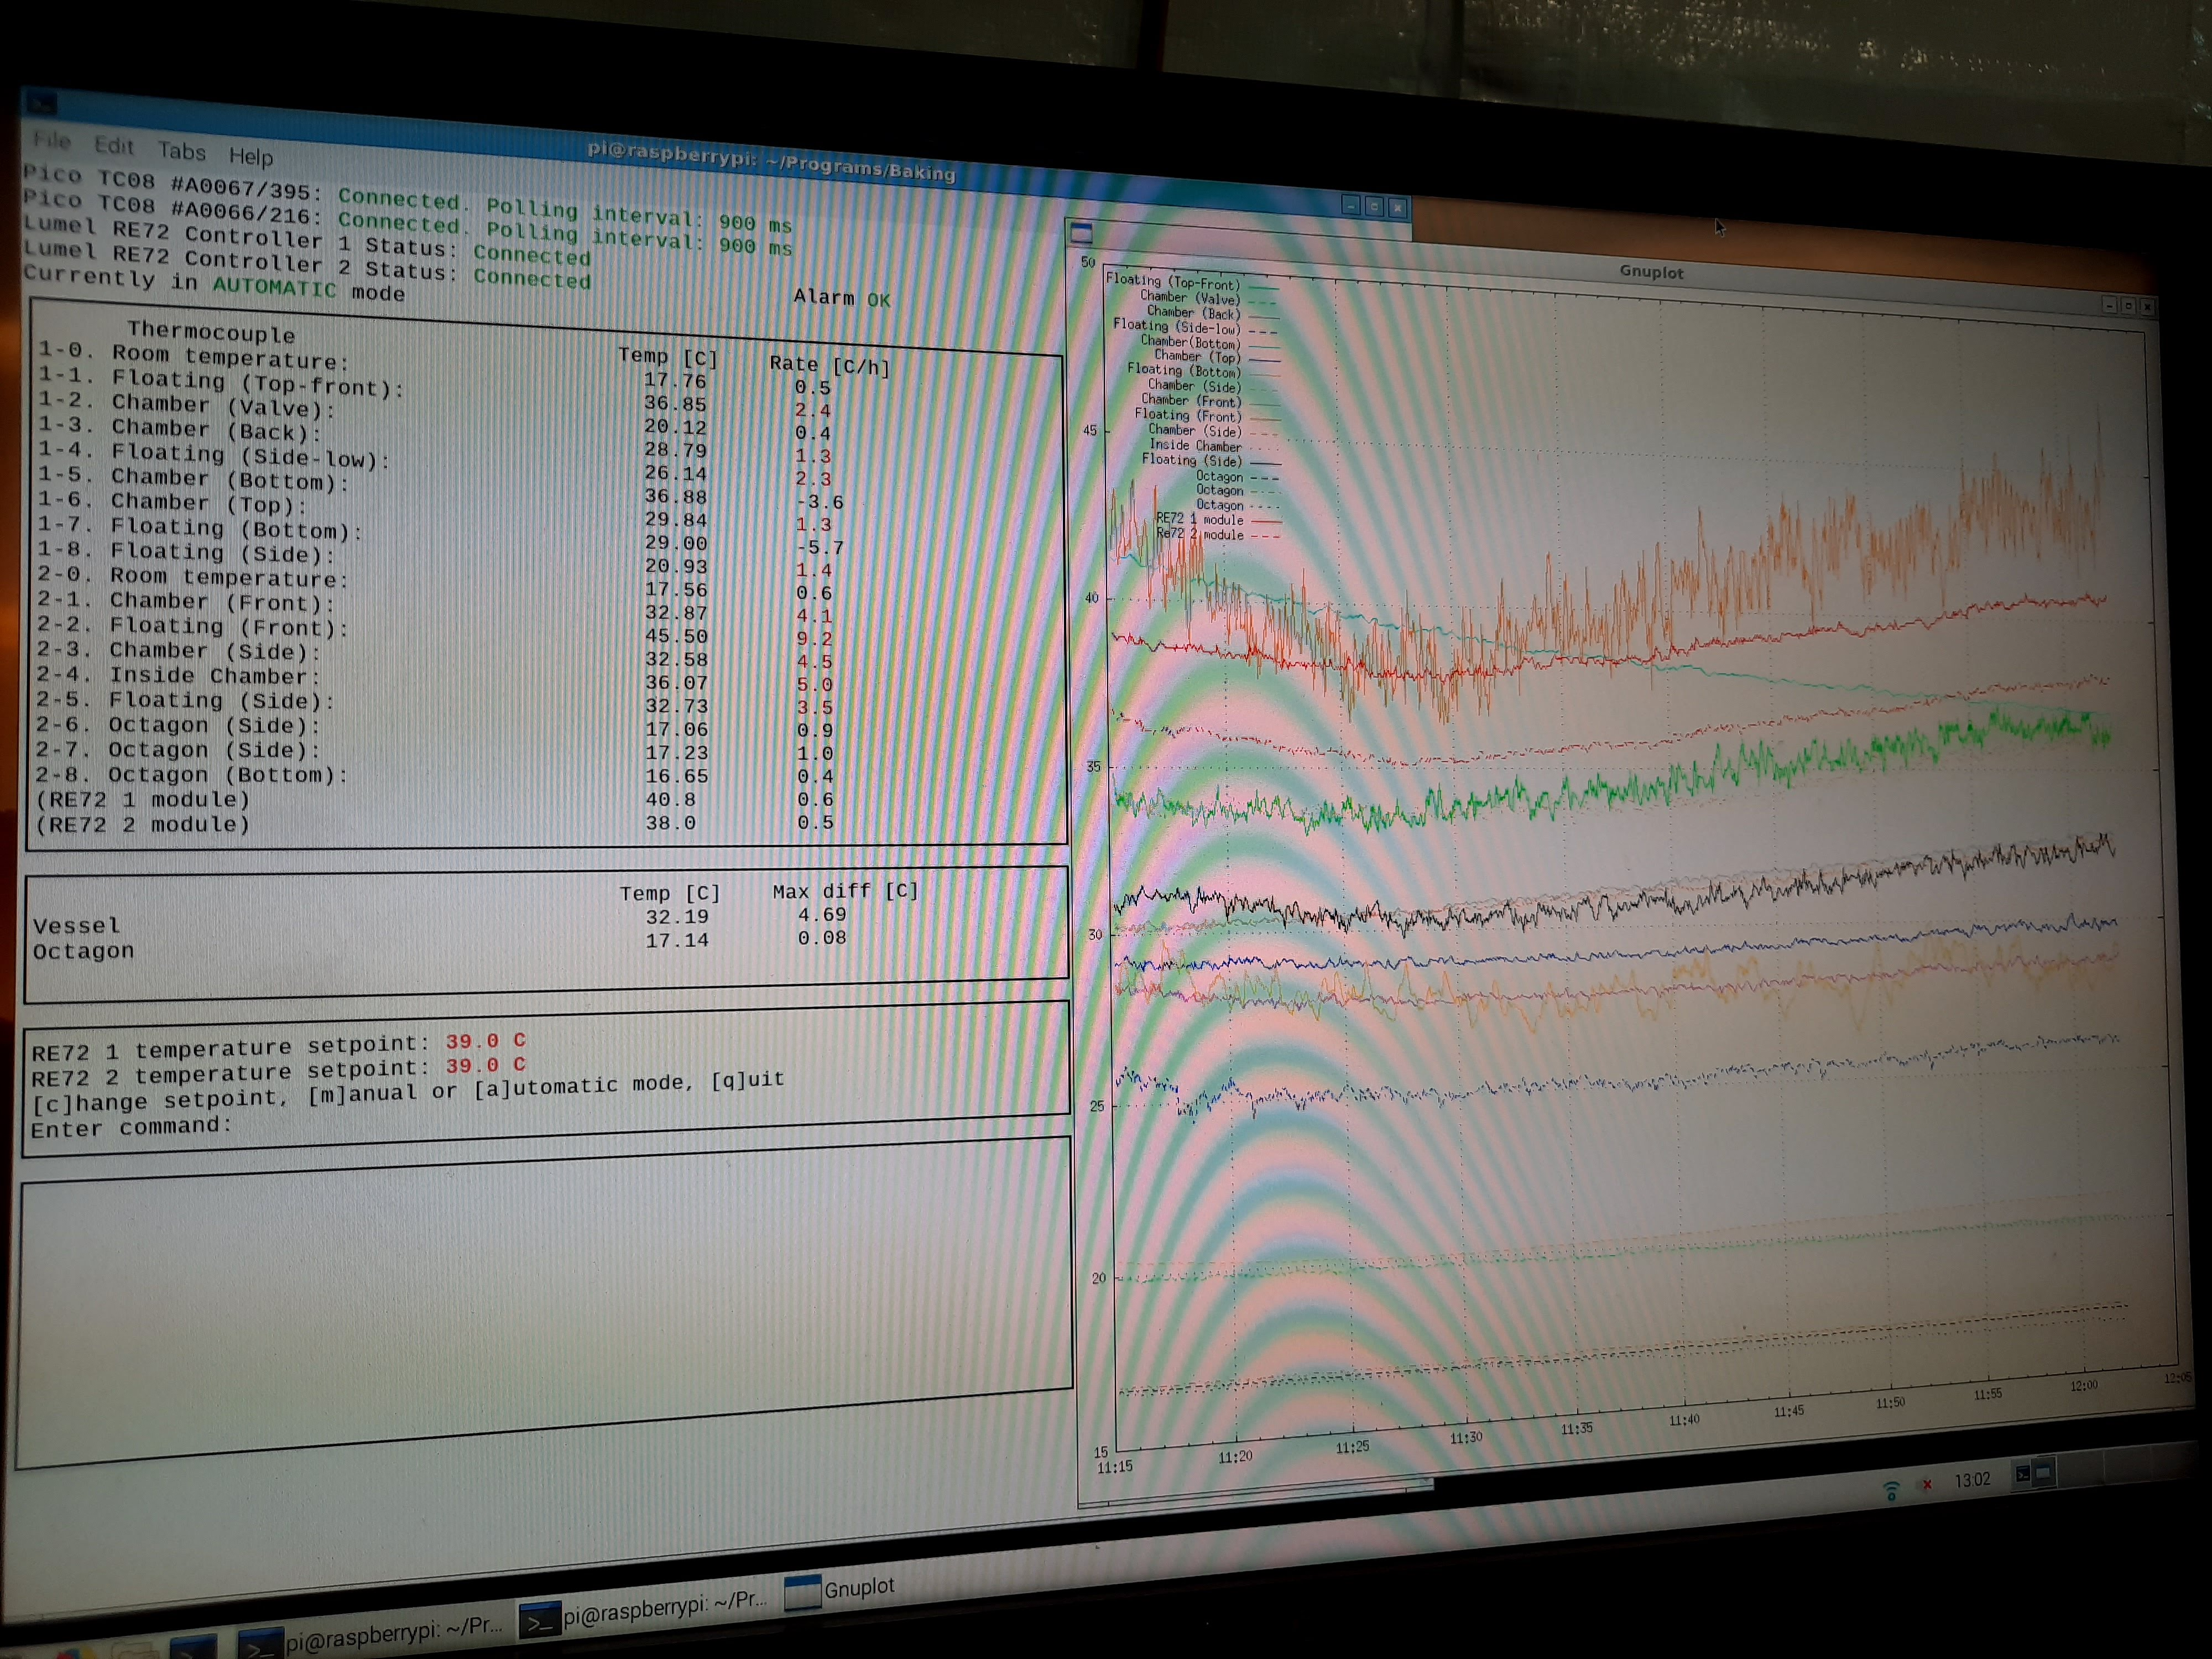
I have (fingers crossed) got the baking stepping up nicely now. I have used some of the outer shell to act as a shield and to direct airflow towards the front and back of the baking volume. I also moved the RE-72 thermocouples to a higher temperature region and replaced the broken thermocouples. The program is on automatic mode and has currently stepped up to 40C with the max diff reduced to ~4C.
I will continue monitoring for a bit but all looks good at the moment.
Additionally, our baking exploits over the weekend got us down to 9e-9 mbar when I came in this morning. |
| Attachment 1: 20200928_081831.jpg
|
|
| Attachment 2: 20200928_130239.jpg
|
|
|
26
|
Mon Oct 12 10:49:36 2020 |
JM | First Bakeout of CARME with pumps (cont) |
12 October
10:00 Bakeout temperatures stable. Pressure on the backing line is 3e-7mbar which is the lowest we have achieved on the backing line so far. Vessel pressure can't be measured at the moment as temperature exceeds the max operational temperature of 80C.
14 October
11:30 Bakeout temperatures stable. Slight day/night cycle can be seen and a ~2-3C dip over the weekend, probably due to heating in ETC turning off at night and over the weekend. Vessel average remains ~130C. Pressure in the backing line dropped to 2.5e-7mbar. EU plug Adapters have been delivered, waiting on leads to begin activation of NEG pumps. |
| Attachment 1: temp6.png
|

|
|
27
|
Mon Oct 19 13:57:52 2020 |
JM | Neg Activation |
Neg and Neg-Ion pumps have been connected up to the control modules. Controller on the right is connected to the D-2000s. Middle controller is connected to the wall section negs (1x2negs in series and 1x3negs in series) and the moving detector negs (2x2 negs in series). Left controller is connected to the intermediate section negs (2x2 negs in series). Must connect IN/OUT interface on the back of the controller or the alarm for an open circuit is triggered. When no thermocouple is connected Tmax must be set to zero otherwise the thermocouple alarm is triggered.
13:00 Pressure on chamber= 6e-9mbar
13:55 I have begun ramping up the middle controller. Ramp time is 45 minutes, slightly longer than the recommended 15-30 mins in the manual to see how well vaccum reacts. Controller will hold maximum power for one hour for activation. Controller has 4 outputs, one for each neg cable. Outputs 1-3 are the 2 negs in series, output 4 is the 3 negs in series. Parameters for outputs 1-3 are; Vmax=100V, Imax=5A, Pmax= 400W. Parameters for output 4 are; Vmax=110V, Imax=5A, Pmax=600W.
14:05 Pressure chamber = 1.92e-6mbar. Power per output is 60, 78, 79, 87 W.
14:15 Pressure chamber = 2.4e-6mbar. Power per output is 114, 148, 150, 168 W.
14:25 Pressure chamber = 1.44e-6mbar. Power per output is 201, 261, 264, 300W.
14:35 Pressure chamber = 1.12e-6mbar. Power per output is 305, 398, 397, 466W
14:56 Pressure chamber = 1.52e-6mbar. Negs are on max power and are holding for an hour.
15:45 Intial activation completed. Negs have been set to half power to maintain temperature at ~200-250C. Parameters set for outputs 1-3; Vmax= 50V, Imax=5A, Pmax=200W. Parameters set for output 4; Vmax=70V, Imax=5A, Pmax=300W. Pressure on the chamber is now 4.4e-8mbar. The pressure tomorrow morning should tell us if the activation has been successful, afterwhich I will activate the next lot of negs. Average vessel temperature is now 146C. I believe our 'internal thermocouple' isn't reading the internal temp after all and is just the temperature of the bottom feedthrough flange, as its temp maxed out at 175C and followed a similar gradient to the other vessel thermocouples. See attached temperature plot.
20 October
08:30 Pressure on the vessel = 2e-8mbar. Pressure hasn't dropped significantly probably due to negs maintaining a temperature of 200-250C causing significant outgassing. Chamber temperature has maintained at 145C so outgassing from chamber will also have increased also.
08:45 2nd set of negs activated. Intermediate chamber negs activated (2x 2 negs in series) which are connected to outputs 3+4 on the left controller. Parameters for outputs; Vmax=100V, Imax=5A, Pmax=400W, Rise time= 30mins, Hold = 60mins.
First set of negs remains at half power.
Pressure on the vessel =8e-8mbar
08:55 Pressure on vessel = 1e-6mbar. Outputs; V=74, 74W I=2.2, 2.2A P=79, 79W
09:05 Pressure on vessel = 2.2e-7mbar. Outputs; V=58,58V I=3,3A P=175,175W
09:10 Pressure on vessel = 3e-7mbar. Outputs are; V=79,79V I=3.7A P=300,300W.
09:20 Pressure on vessel = 1.2e-6mbar. Outputs are; V=100V, I=4A, P=400W. Negs are now on hold for the hour activation. Chamber temperatures are stable at ~145C still
10:45 Negs are being held at half power to maintain temperature. All that is left is the D2000's on Thursday. Pressure in the vessel is staying constant at ~8e-8mbar. Chamber temperatures ae stable at ~145C.
|
| Attachment 1: Photos.zip
|
| Attachment 2: 20201019_154921.jpg
|

|
|
33
|
Tue Nov 10 12:25:29 2020 |
JM | Cable harnesses |
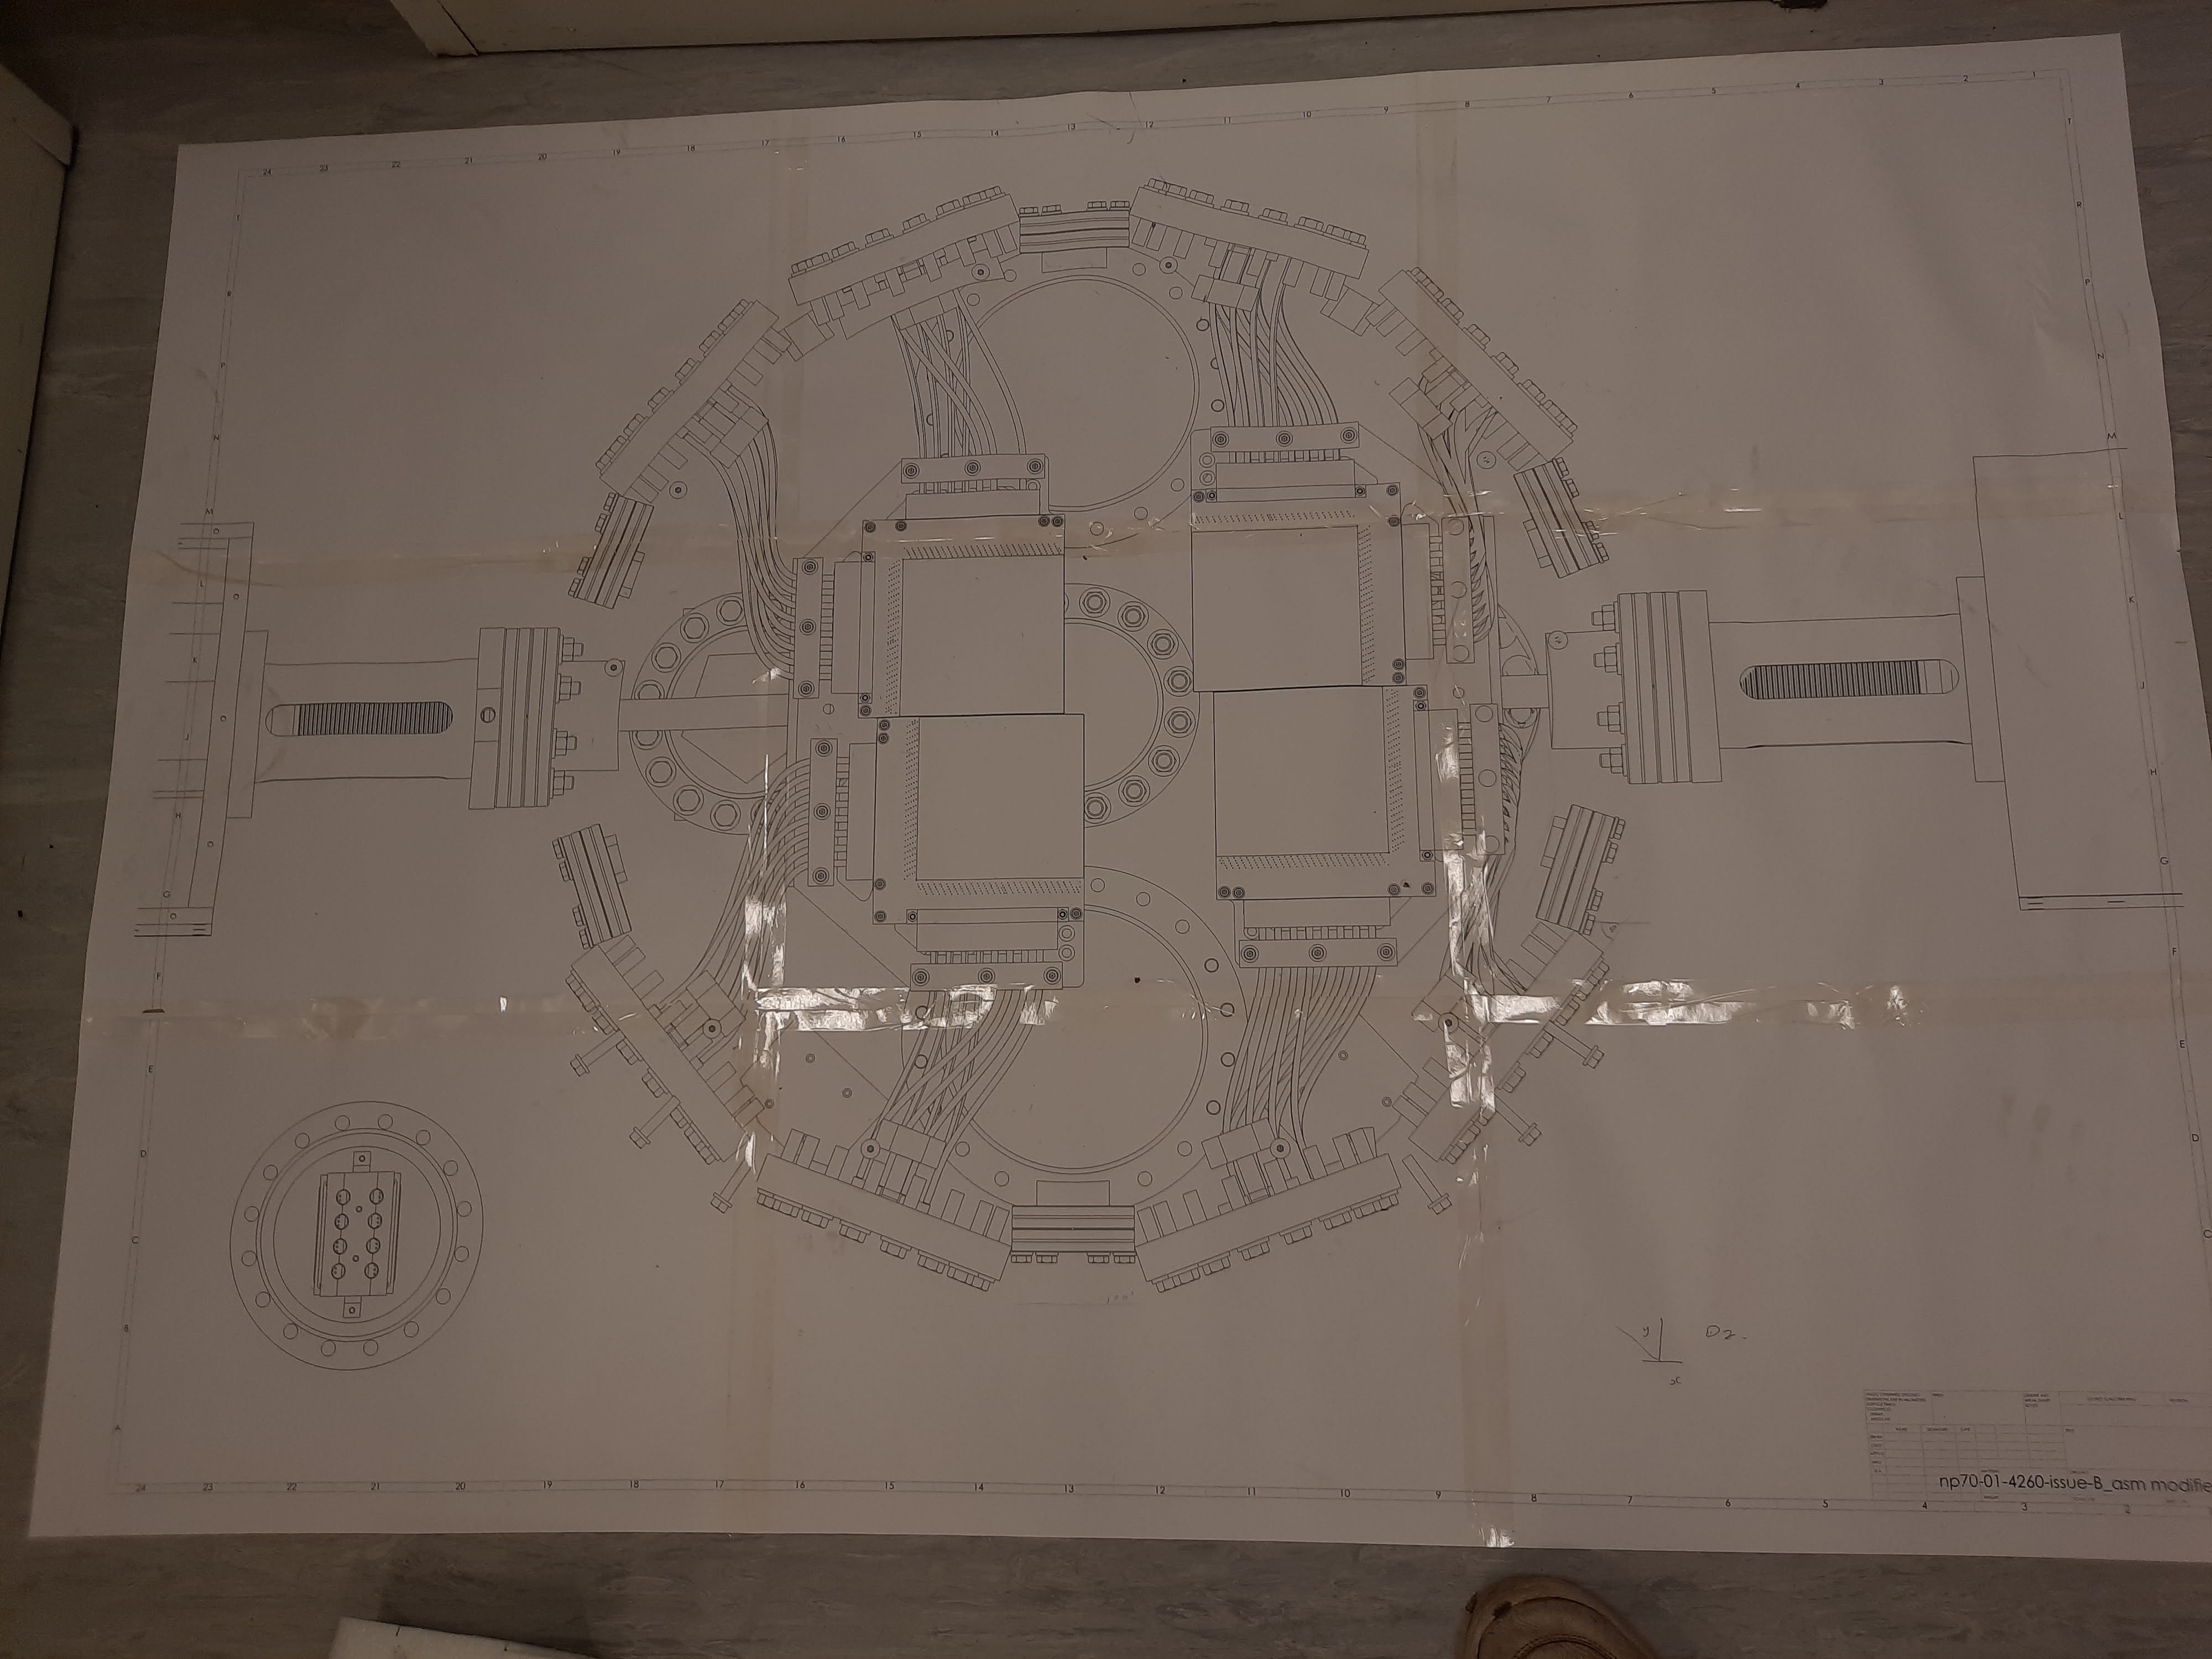
The length of the wire needed was estimated with the aid of a scale image of the detectors in the CARME chamber and foam model pieces. Wire length estimated by simply cutting wire so that it 'fits' the scale model and by taking coordinates of the end points of the longest sections of wire needed on the model and calculating a bezier curve to estimate wire length. Bezier curve calculated by inputting the endpoints of the wire and control points such that the wire comes out of the connector at the specified angle in the scale diagram. Figure 1 shows the bezier curve (orange), distance between the endpoints (green) and the control point plot. The length of wire required by the bezier curve is approximately that of cutting wire to fit the scale model.
Two groups of harnesses are needed to be built, a short section which correspond to the top and bottom of the detectors, and longer sections needed for the sides of the detectors. Lengths of these wires is;
Short: 225 mm
Long: 285 mm
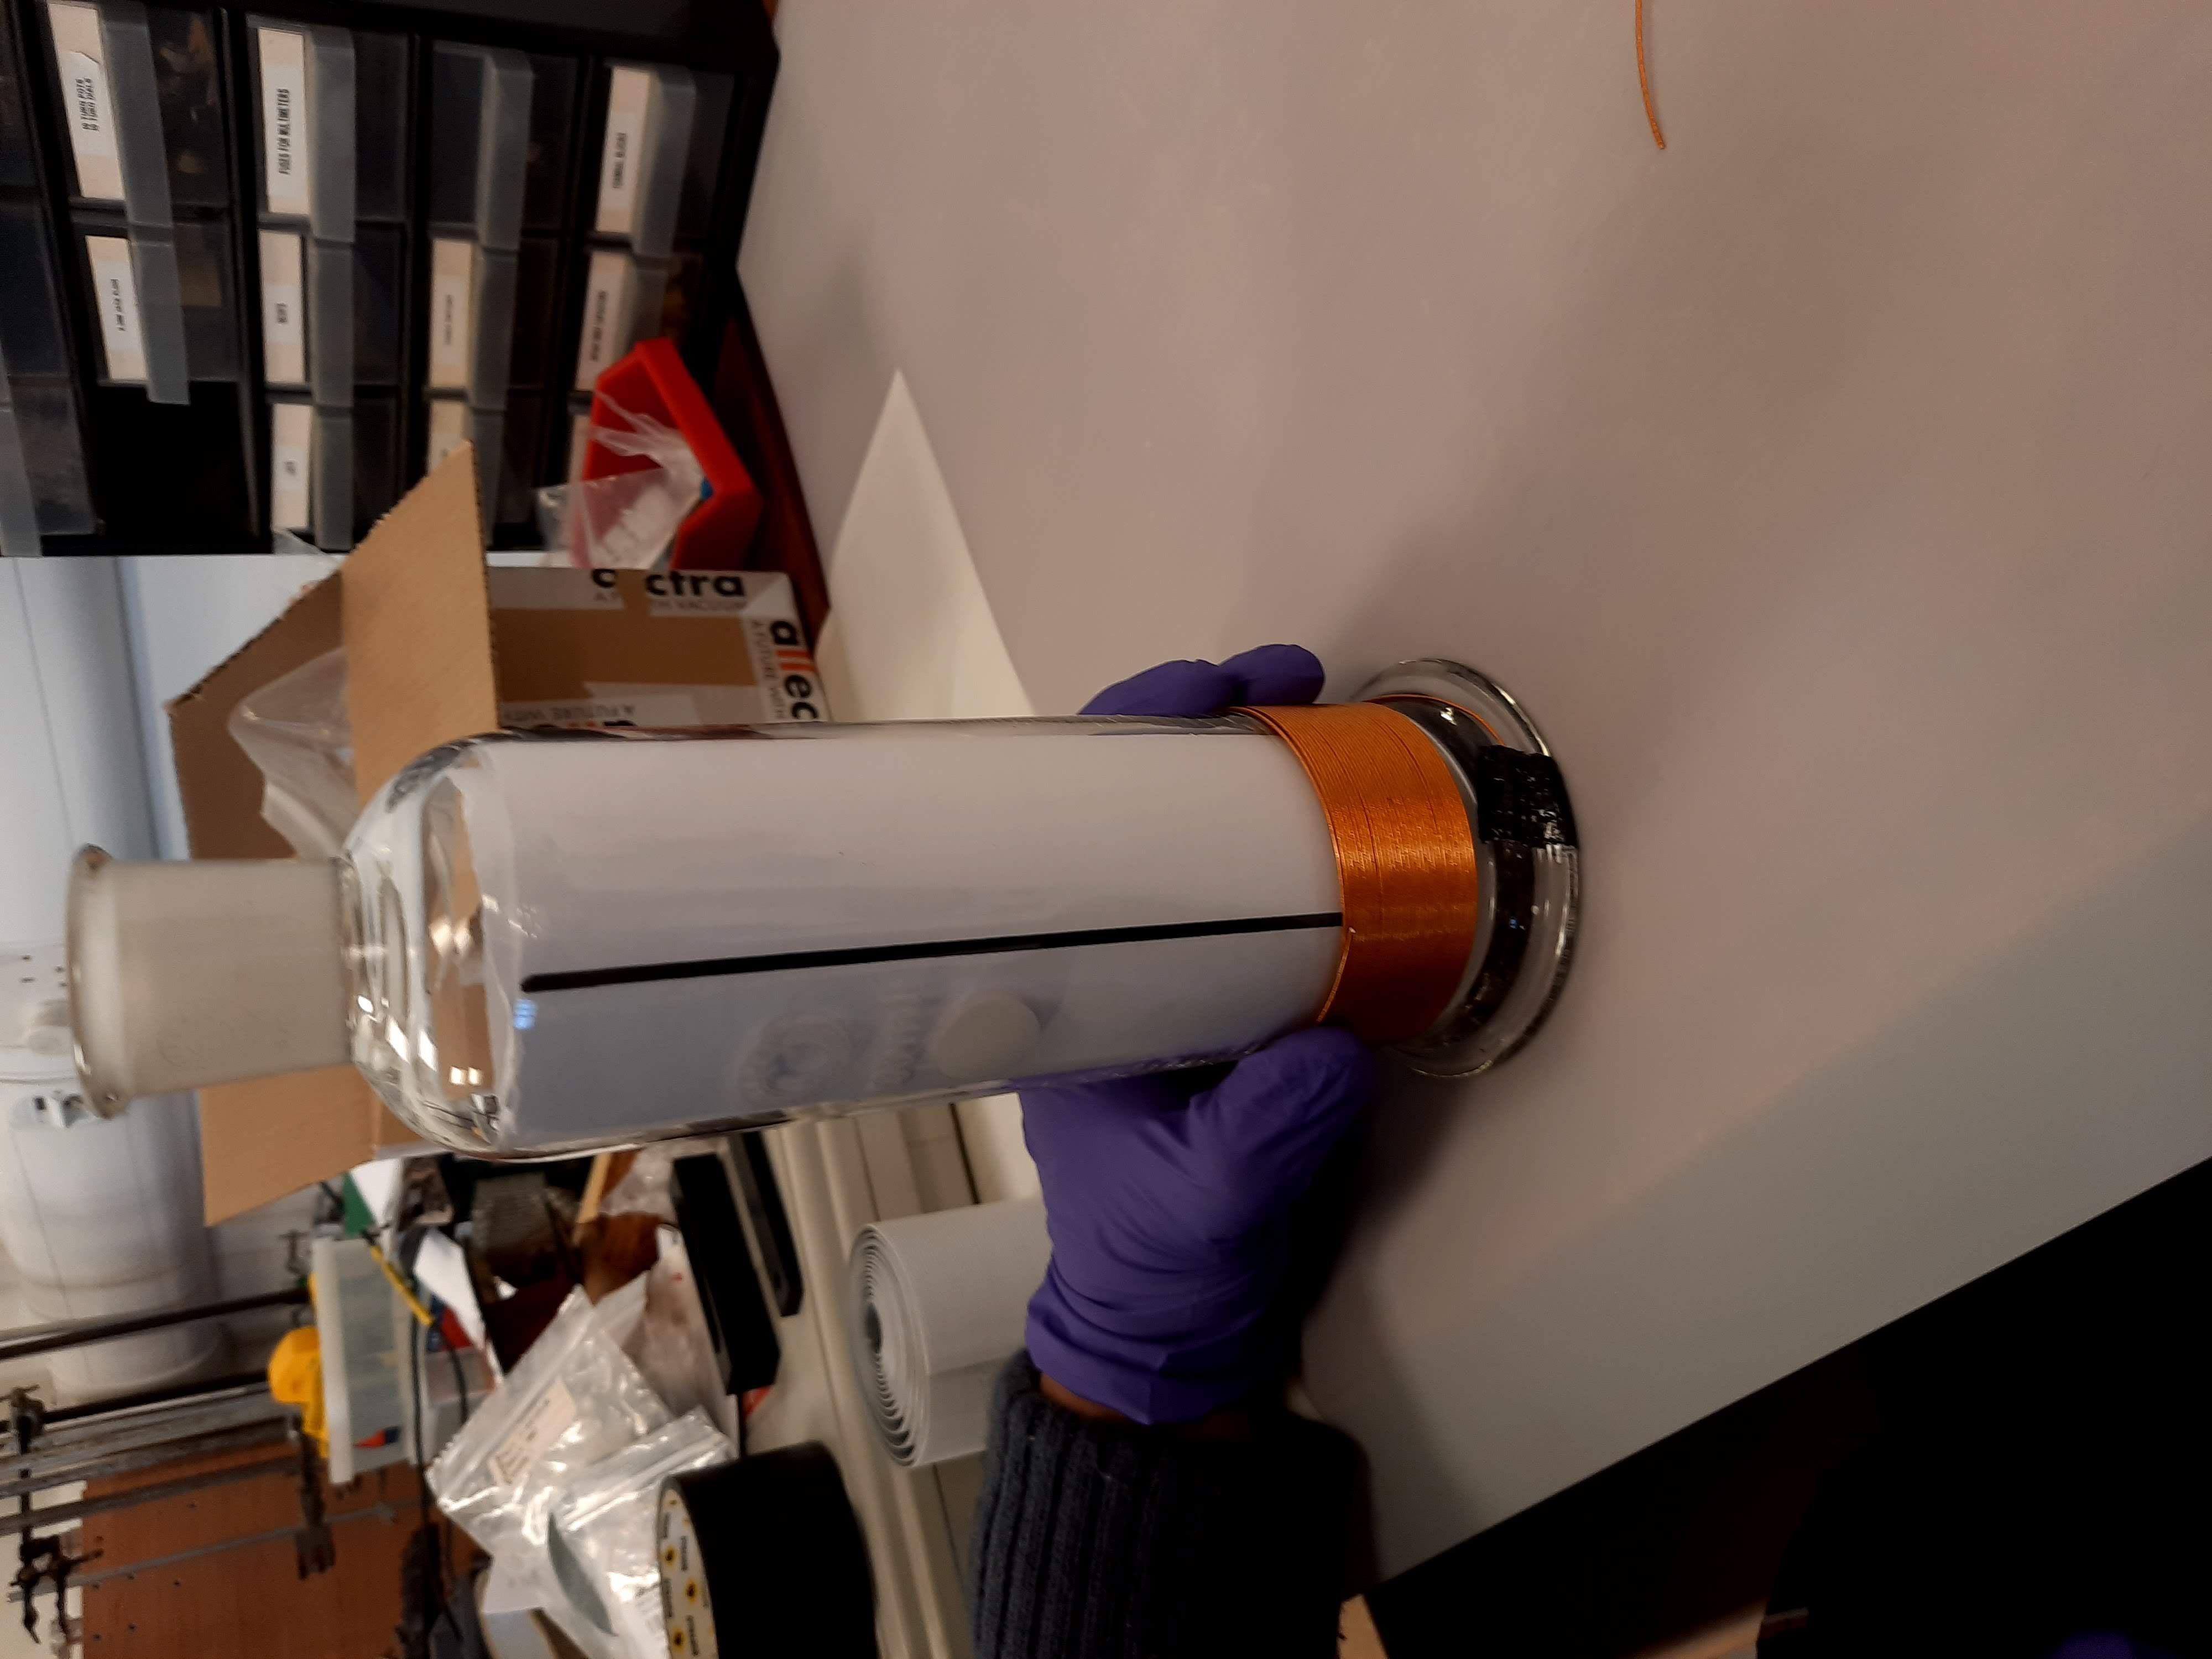
Wire is cut to length using a circular object with the required circumference. Wire is wrapped round the object and cut to give required length. Wire is then stripped, crimped and inserted into the connectors with the correct pin assignment. Inserting wire into connectors acts as a good quality check, as incorrectly crimped wires will not fit into connectors. Crimp is set to setting 12 for the male crimps and 10 for the female crimps. Wire stripper has to be cleaned of stripped ends often as it is liable to jam and wire must be inserted into stripper straight, else strip will clip some of the conductors in the wire.
As of 9/11/20 two harnesses (1 long, 1 short) have been constructed.
8 harnesses constructed and sent to DAresbury for cleaning 20/11/20 |
| Attachment 1: 20201102_155336.jpg
|
|
| Attachment 2: Figure_1.png
|

|
| Attachment 3: 20201102_154648.jpg
|
|
| Attachment 4: Photos.zip
|
|
34
|
Tue Nov 24 12:24:01 2020 |
JM | RGA scans |
RGA laptop passcode: tw%11&STA-
RGA scans set up and plotting data as of 11:44
RGA is set to the multiplier mode (4.44e-8mbar) with an accuracy setting of 8, these are for the most sensitive scans. RGA is set to scan masses 2, 12, 16, 18, 28, 32, 40 and 44 in the range 1e-9 to 1e-14mbar. Mass2=7.85e-11mbar, Mass12=1.45e-12mbar, Mass16=1.41e-11mbar, Mass18=4.78e-10mbar, Mass28=1.53e-11mbar, Mass32=3.46e-12mbar, Mass40 = 1e-14mbar, Mass44= 3e-13mbar. Slight variability in each measurement is ver small for higher pressures and larger for lower pressures (see image attached).
Plan is to switch each ion pump off individually and observe the effect on the RGA scans. Once off I will leave for 30 mins to see if any difference can be seen. Afterwards I will switch of 2 pumps then 4 pumps at a time.
12:06 Ion pump 1 (furthest left pump=1, furthest right=4) turned off, no immediate change in RGA.
12:38 No change in RGA, turning pump 1 on again and switching off pump 2. Pump 1 took ~15s to stabilise back to a pressure of <8.9e-12mbar once turned on again.
13:08 No change in RGA, turning pump 2 on again and switching off pump 3. Pump 2 took ~15s to stabilise back to a pressure of <8.9e-12mbar.
13:38 No change in RGA, turning pump 3 on again and switching off pump 4. Pump 2 took ~15s to stabilise back to a pressure of <8.9e-12mbar.
14:08 No change in RGA, all pumps back ON. RGA has not changed since pumps wer switched off and on, pressure on the hot cathode gauge has risen slightly however I think this is due to the day/night cycle of the pressure.
14:12 All 4 ion pumps turned off
15:12 No observable change in the RGA
15:33 Ion pumps all back ON. No change in RGA |
| Attachment 1: 20201124_124107.jpg
|

|
|
37
|
Mon Dec 7 14:29:12 2020 |
JM | CARME packing up |
|
| Attachment 1: 20201207_122353.jpg
|
|
| Attachment 2: 20201207_113905.jpg
|

|
| Attachment 3: 20201207_110714.jpg
|

|
|
131
|
Sat Oct 23 12:58:11 2021 |
JM | GSI vacuum and bakeout testing summary |
Attachment 1 shows the pump-down of the CARME chamber at GSI before installation of kapton cabling inside the chamber and mounting of the chamber on the ring. Discontinuity in the plot is from switching between the pirani gauge and IE514 gauge. The pumping of the chamber in the turbo regime follows the power law where P ~ 1/(nt) due to outgassing from the chamber being dominated by water outgassing which has an n ~1 dependence (for first order desorption). This is seen in the pumping of the chamber in the turbo regime (Attachment 2) where pressure falls with an n of 1.03. In red the power law is extended to 10^5 minutes, demonstrating the limitations of pumping the chamber without baking.
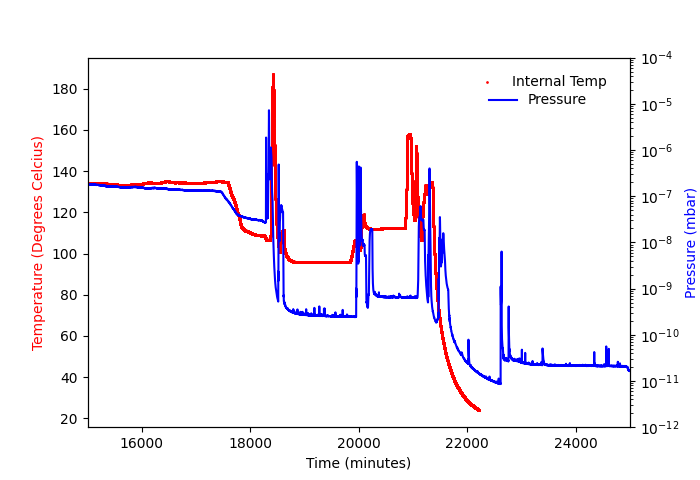
Attachment 3 shows the pumpdown pressure and baking temperature (chamber average) of the chamber once mounted on the ring, with all kapton installed in the chamber. Temperature data was lost in the middle of the plot due to the power cut to CRYRING causing temperature data to not be saved to the pi. Some of this data was plotted in elog 87 before beong lost from the pi. Points on the graph correspond to:
Point 1 - Baking started 2pm 23/9/21
Point 2 - Temperature limited to 40C due to high thermal gradients from uneven baking of the volume. Baking stopped 7am 24/9/21 so that heating elements could be repositioned. Baking restarted 10am.
Point 3 - Baking limited to 90C due to tent construction. Negative gradient detected due limitation causing baking to stop around 5pm 25/9/21. Manual mode to 60C. Full power mode restarted 10pm
Point 4 - Temperature of the volume reached 100C. 11am 27/9/21 baking stopped to install new turbo sections. Baking restarted at 3:25 pm Temperature peaks at 130C next morning.
Point 5 - 29/9/21 10am Unexpected power cut at CRYRING, temperature fell to 120C power restored shortly after.
Point 6 - 4/10/21 9am Temperature reduced to 100C and ion pumps outgassed. Activation of NEG pumps
Point 7/8 - Subsequent activation of other NEG pumps.
Point 9 - 7/10/21 CARME reached 9E-12 mbar. Gate valve closed, pressure rises with apparent floor at 1.5E-11 mbar
Some variations in the pressure are seen after reaching the floor, most likely due to sputtering of ion pumps.
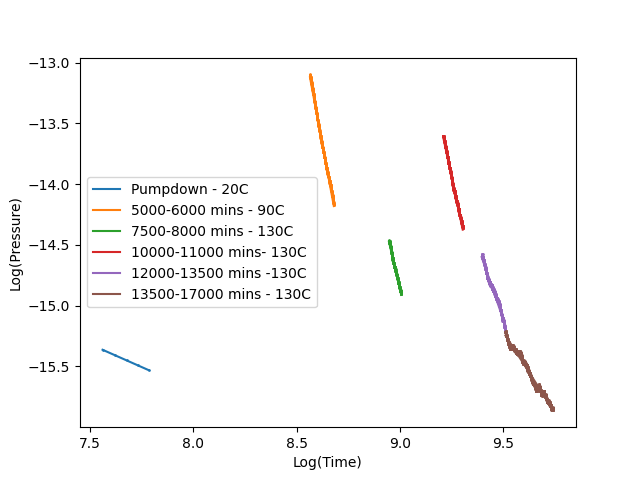
Teething problems with the bakeout such as heater placement and new jacket sections in addition to the power cut prevented continous bakeout for entire period, these issues should not affect the next baking run. As a result of the slightly fractured bakeout the pumpdown power laws have been plotted (logP) against log(T) in sections where temperature was roughly constant with the associated timestamps to gauge the decrease in pressure over time using this power law (Attachment 4).
Room temp n ~ 0.75
90C n ~ 9.15
130C (1) n ~ 8.05
130C (2) n ~ 7.37
130C (3) n ~ 4.89
130C (4) n ~ 2.65
Introduction of kapton cabling likely causes change to scaling as the diffusion of gas from kapton not the desorption from the surface dominates the outgassing rate. Diffusion has an n ~ 0.5, likely contributing to the change between the blank chamber and mounted chamber. As the temperature is increased the outgassing is significantly increased causing an initial increase in the temperature followed by a more rapid decrease in the gradient of the pressure decrease over time than at lower temperatures. As time increases, outgassing from water in the chamber dominates less and less with the kapton cabling representing a more significant portion of the total outgassing load likely causing the decrease in n as time increases despite baking at 130C. After ~12000 minutes n decreases significantly and more variations from the linear decrease in pressure are observed. After 17000 seconds the pressure begins to plateu and reached a floor of ~1E-7 mbar over the weekend at which it was assumed outgassing from water in the chamber was no longer significant. Variations could be due to temperature fluctuations which had a greater impact on the pressure as the pressure began to reach the floor.
Activation of NEG pumps was conducted after reaching the floor. The average chamber temperature and air temperature inside the tent was unaffected by the activation of NEG pumps, however the internal thermocouples significantly increased during activation (attachment 5). The internal thermocuples were largely unaffected by the NEG activation until the NEG temperatures were themselves above ~300C after the internal temperatures rose rapidly (more detail in elog 105,108,109,110) . Activating so many NEG elements at once is thus not feasible as temperatures would damage the detectors once mounted. Activating one group at a time (typically 2 NEGs) and D2000's which are away from the detectors to start with and then maintaining at low power before slowly activating NEG's close to the detectors perhaps at a lower temperature will be done to keep temperatures below 130C. A full activation procedure will be posted to the elog before activating again. |
| Attachment 1: GSI_fullpumpdown.png
|

|
| Attachment 2: GSI_pumping.png
|

|
| Attachment 3: Bakeout-elog.png
|

|
| Attachment 4: fit-elog.png
|
|
| Attachment 5: Activation-elog.png
|
|
|
173
|
Sat Jan 15 11:28:10 2022 |
JM | Inventory |
Vaccum
DN250CF 1x gaskets
DN200CF 5x gaskets
DN160CF 1x gaskets, 2x blank flanges
DN100CF 69x gaskets, 19x blank flanges, 14 double feedthroughs (1 damaged)
DN63CF 3x gaskets, 2x blank flanges
DN300CF 5x gaskets
DN350CF 0x gaskets
1X WIRE SEAL
DN35CF 3x gaskets, 13 blank flanges
DN16CF 22x silver gaskets, 27x copper gaskets

Swagelock
SS-QTM2-D-8M0 Male quick disconnect X18
SS-QTM2A-B-8M0 Female quick disconnect X21
SS-8M0-1-6RS Manifold adaptor X39
NY-8M3-1 Front ferrule X118
NY-8M4-1 Back ferrule X120
Stainless ferrules XMANY

FEE/FEE HOLDER PARTS
FEES x1
Fully assembled FEE holder (MINUS ADAPTOR BOARDS) x1
Cylindrical supports x32
Feedthrough mounts x12
Black adaptor board mounts x11
Spring loaded FEE lock x26
FEE holder side panels x5 pairs
Adaptor boards x2 (1 slightly bent pins)
FEE rail bolts x4
M3X16 281-013 x91
M3 locknuts 260-5815 x34
Springs 821-273 x40
M4x25 (2mm too long) 281-057 x32
M6x20 281-120 x69
M3x6 280-981 x34
Assembled Hose 1.5M (Red) x8
Assembled Hose 1.5M (Blue) x8
Blue Hose ~16M
Red Hose ~10M
We require additional gaskets for those we are low on (<5) DN35,63,160,250,350 and more wire seals
We should have enough swagelock and FEE holder parts to construct another 4 FEE holders for the remaining required for mounting all moving detector FEEs.
We also need fuses for the USB mains relay and power supply -> 2x 250v 10A, 16x 250v 1.6A. Dimensions for both are the same, length=20mm, Diameter=5mm (images attached)
Additional fittings provided by GSI for the manifold are in the swagelock box. |
| Attachment 1: 20220115_162649.jpg
|

|
| Attachment 2: 20220115_162712.jpg
|

|
|
197
|
Tue Feb 15 21:28:14 2022 |
JM | Noisy Channels |
All fees and asics checked to find noisy channels. Channels are listed along with the noise peak height for the low energy plot at 22:00. Run started ~17:45.
Attachment 1 shows 3*L for aida01 with x axis zoomed in on noise peak. Attachment 2 shows stat for aida01-04 in log scale.
Aida01
- 1.0L ~3000
- 1.2L ~3500
- 1.7L ~3000
- 1.8L ~2000
- 2.11L ~2000
- 2.12L ~400
- 3.7L ~1000
- 3.10 ~60000
- 3.11L ~2000
- 3.12L ~15000
- 4.12L ~400
- 4.14L ~750
Aida02
- 1.0L ~1000
- 1.3L ~750
- 1.7L ~600
- 1.15L ~600
- 4.15 ~125
Aida03
nothing noisy of note on aida04 |
| Attachment 1: 2022-02-15_22-17-51-aida1-3*L.png
|

|
| Attachment 2: 2022-02-15_22-23-12-aida1-4-stat-log.png
|

|
|
201
|
Wed Feb 16 21:27:31 2022 |
JM | Cryring signals, Pulser tests, Waveforms |
On 15/2/22 it was noted that the leakage current increases when the motors are moved IN. This is contary to tests conducted on 12/2/22 (elog 192) where no increase was observed.
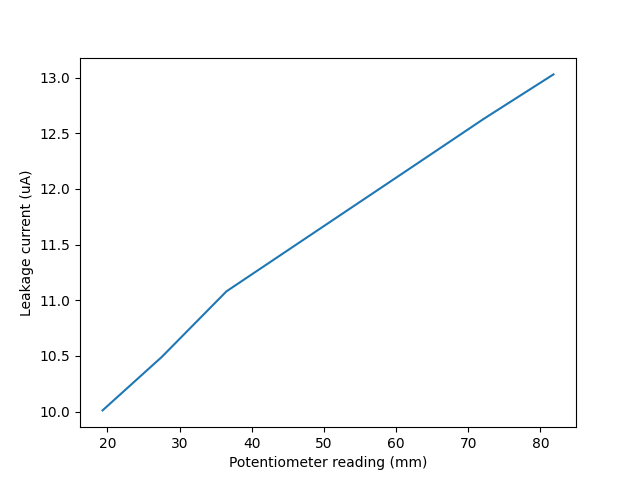
16/2/22: Servo motor and pneumatic used to move in by different differences with leakage current observed to increase linearly with distance moved in, measured using the potentiometer. (attachment 10)
After each movement the pulser width was measured for each of aida1,2,3,4. No change observed for aida3,4 with pulser width ~220 channels. Pulser width decreased for aida1,2 when moved IN. (attachment 11)
Noise on aida 2,3,4 appeared low throughout tests. Aida1 has a large noise peak when in fully out position. When moved fully in, the noise peak disappears (attachments 1,2)
Cryring signals for ring RF, electron cooler voltage and schottky added to the motors signal and fed into mac b to be read in daq as aida correlation info #8 signal.
cryring bnc 13 - ring rf - aida5 ~ 500,000 rate
cryring bnc 14 - e cooler voltage - aida3 ~ 80 rate
cryring bnc 15 - shottky -aida2 ~2000 rate
cryring bnc 16 motors - aida1 ~3 rate
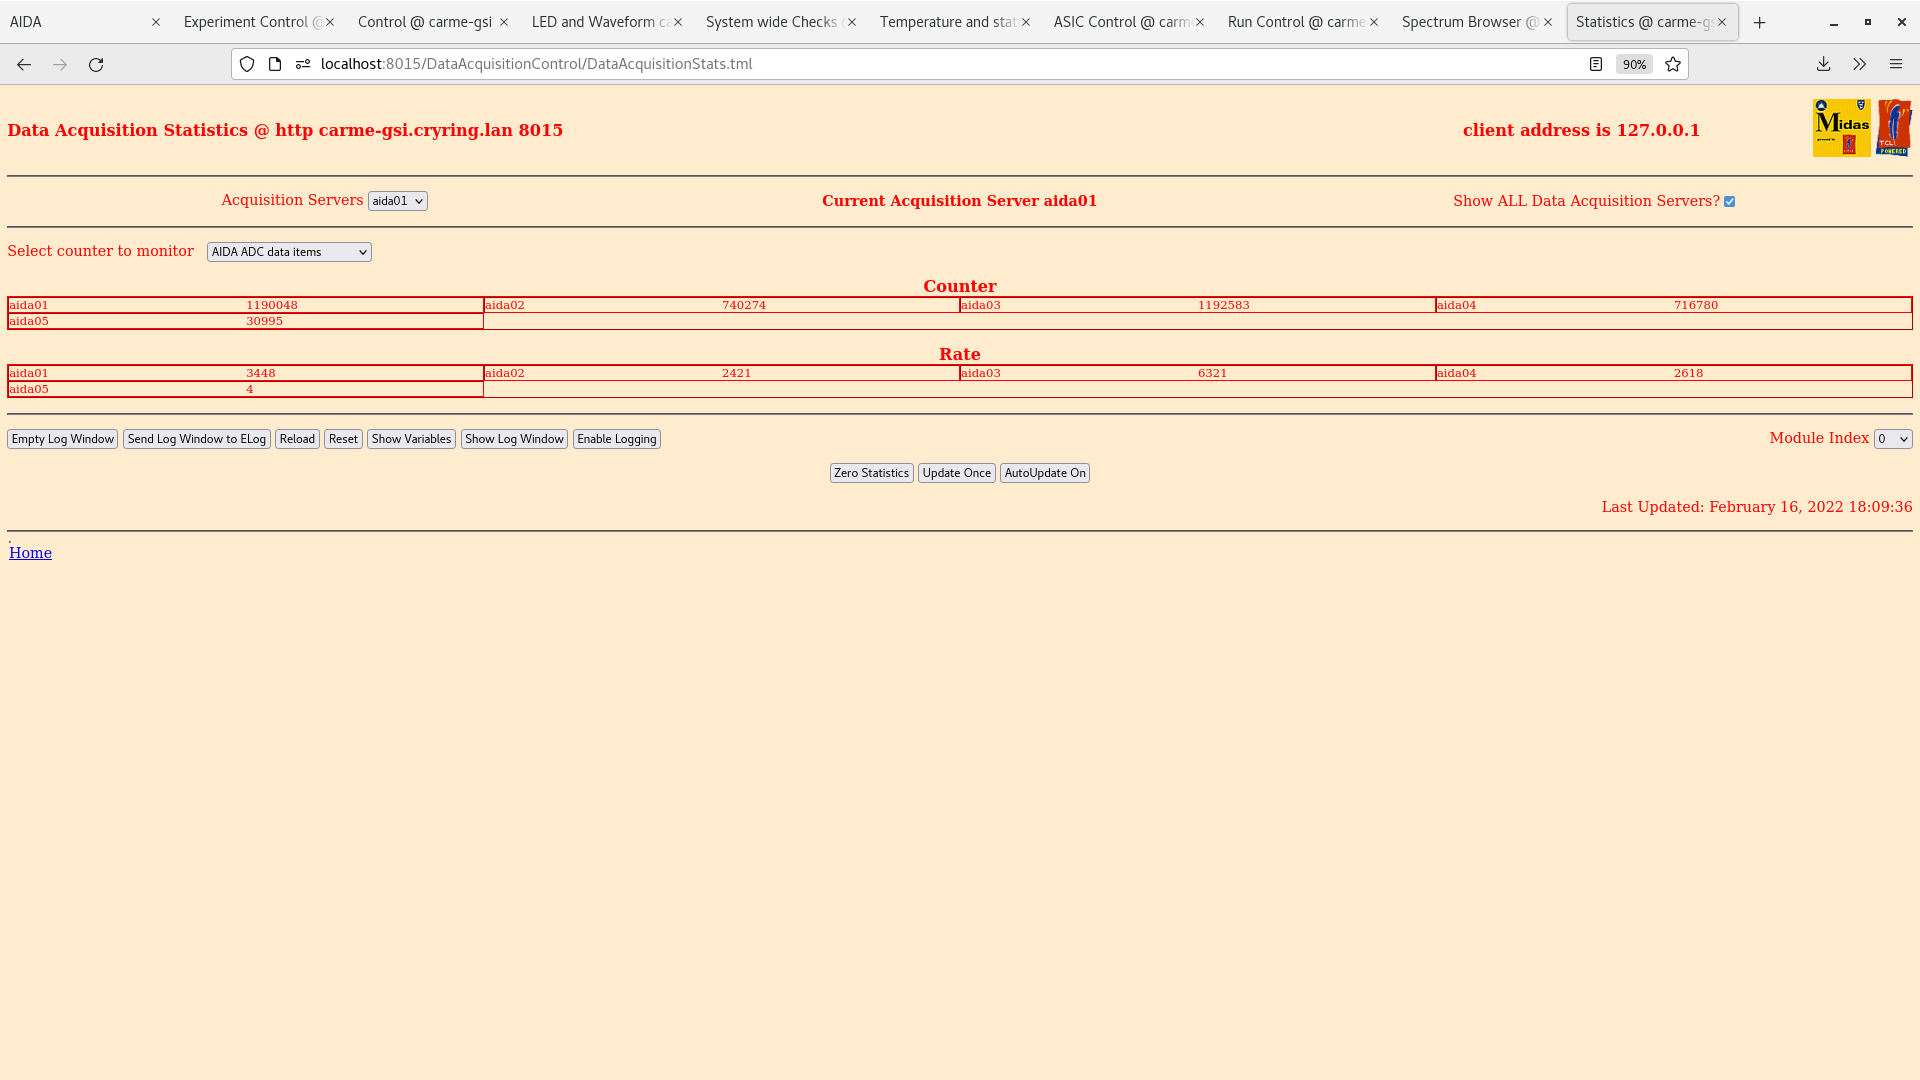
correlation info #8 appears to be added to the good events rate (attachments 4,5) ADC items (attachment 3)
Waveforms 1.8*W attached for 20us, 200us, 2ms, 20ms |
| Attachment 1: 2022-02-16_16-01-32aida1-2-1.8*L-fullyout.png
|

|
| Attachment 2: 2022-02-16_15-58-02aida1-2-1.8*L-fullyin.png
|

|
| Attachment 3: 2022-02-16_18-10-14-ADCdataItems.png
|
|
| Attachment 4: 2022-02-16_18-13-03-aidaCorrelation.png
|

|
| Attachment 5: 2022-02-16_18-10-53-goodEvents.png
|

|
| Attachment 6: 2022-02-16_18-28-35aida125-1.8*W-20us.png
|

|
| Attachment 7: 2022-02-16_18-27-30aida125-1.8*W-200us.png
|

|
| Attachment 8: 2022-02-16_18-25-11aida125-1.8*W-2ms.png
|

|
| Attachment 9: 2022-02-16_18-23-50aida125-1.8*W-20ms.png
|

|
| Attachment 10: leakage-potentiometer.png
|
|
| Attachment 11: pulserWidth_potentiometer.png
|

|
|
202
|
Wed Feb 16 21:41:11 2022 |
JM | Run 43 Alpha Background |
22:41
Check Leakage current: (see attachment 1) = 10.01 uA and falling
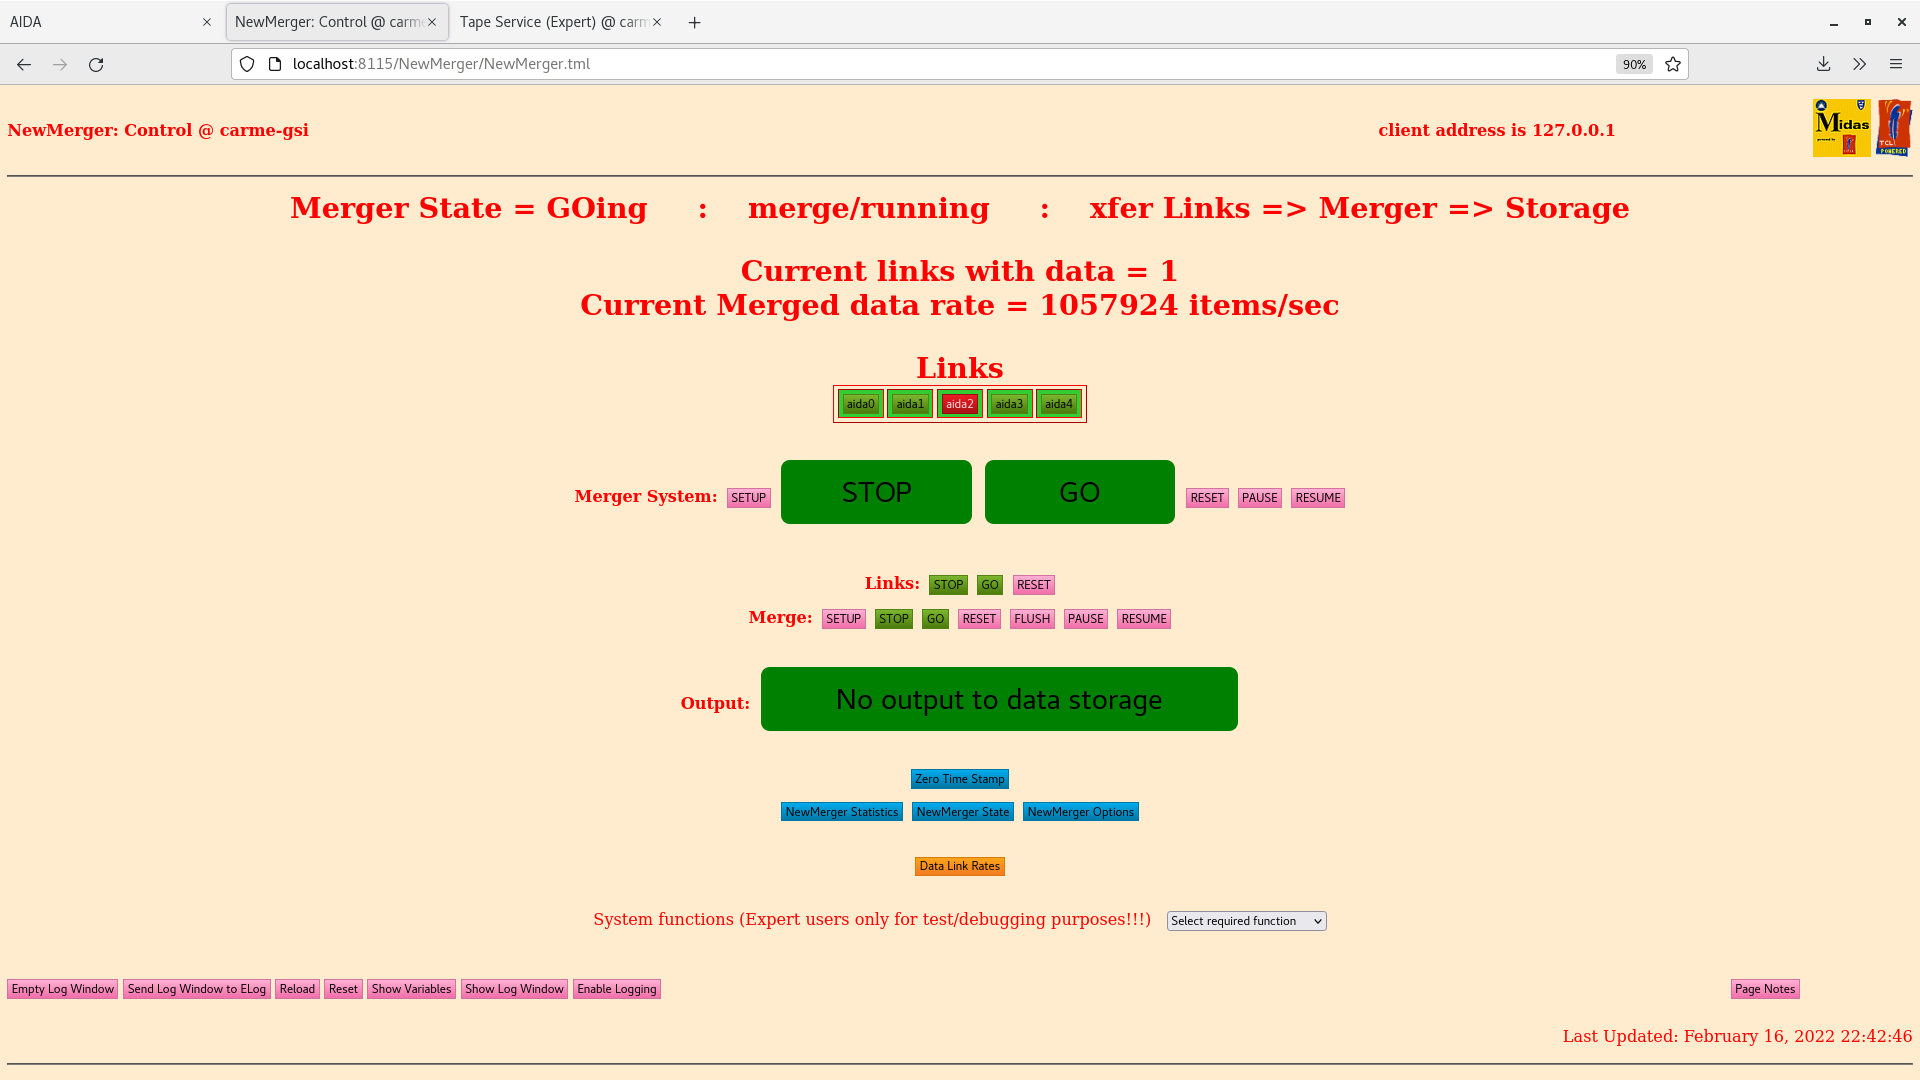
Check NewMerger tab: (see attachment 2)
Check Tape Server: (see attachment 3) Writing ~2500 kb/s
Check Fee temperatures: all green
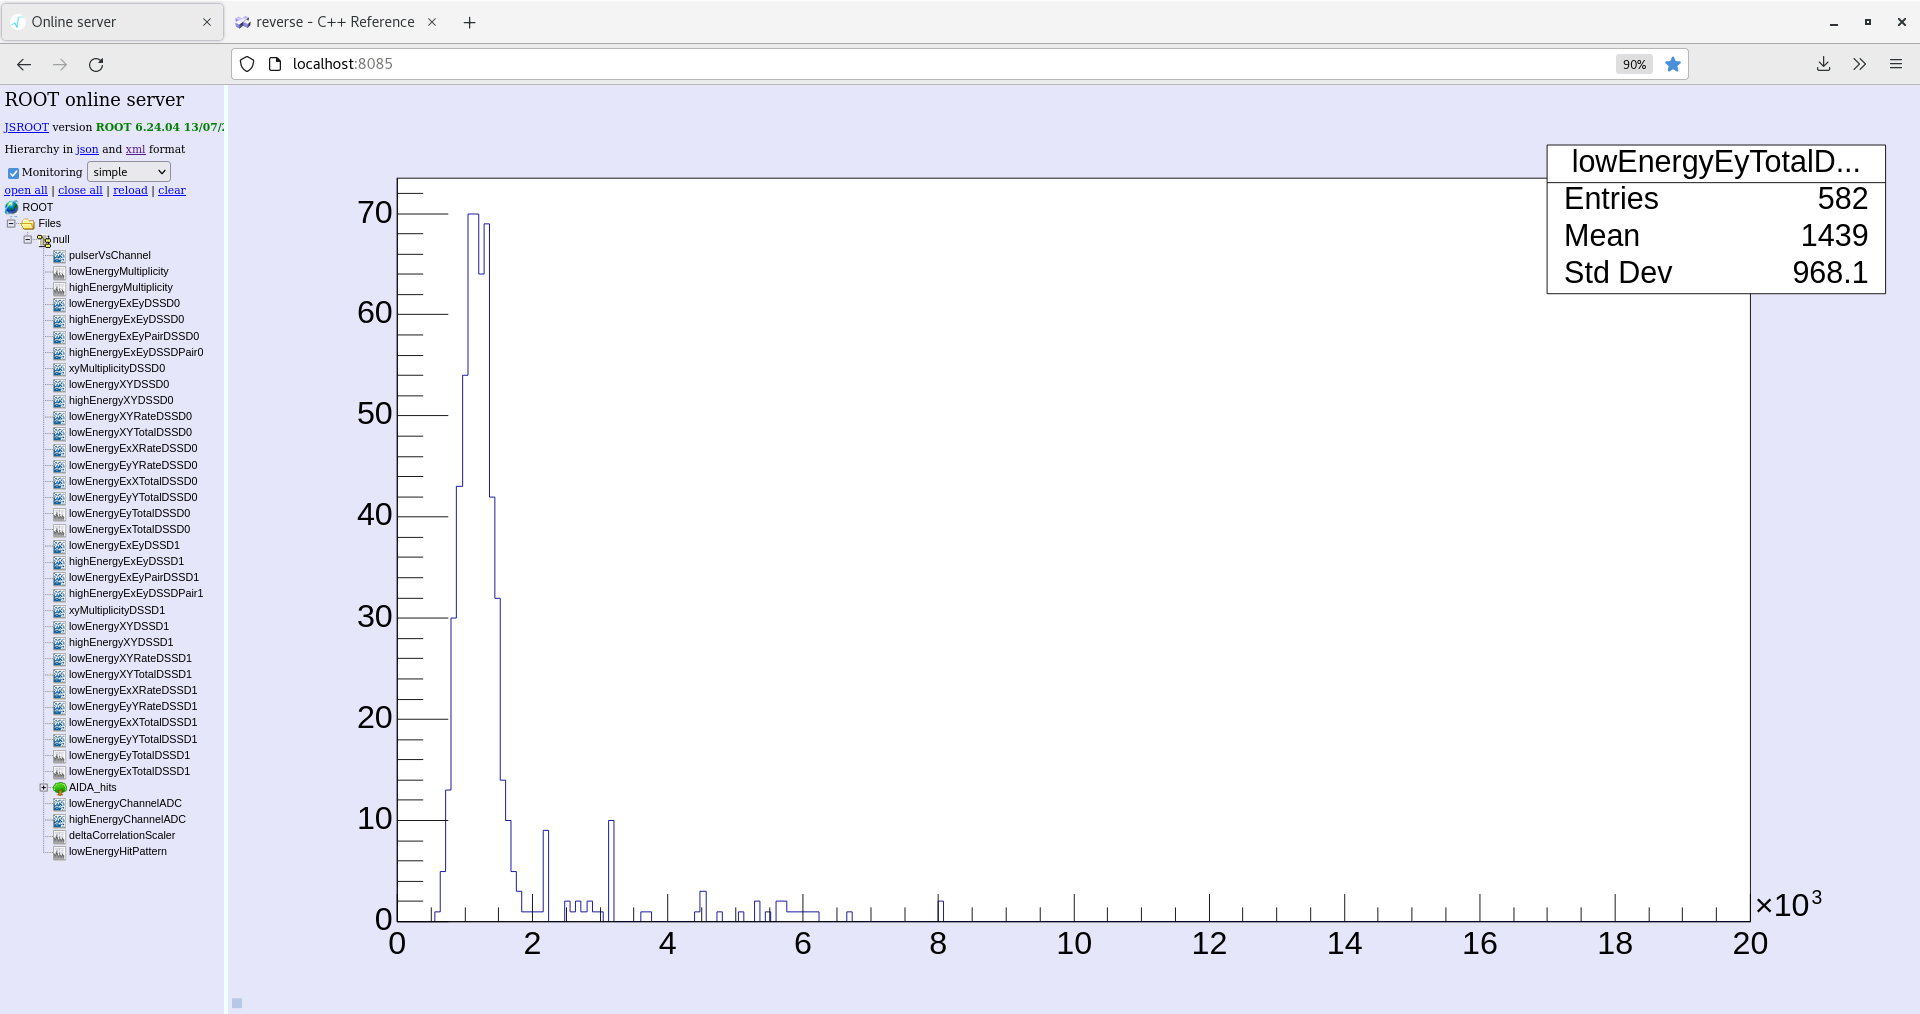
Check statistics tab: ADC data items (see attachment 4) -aida3 and aida4 reading zero. Appears to be low noise as stat histogram shows counts as does Ey and Ex low energy histograms
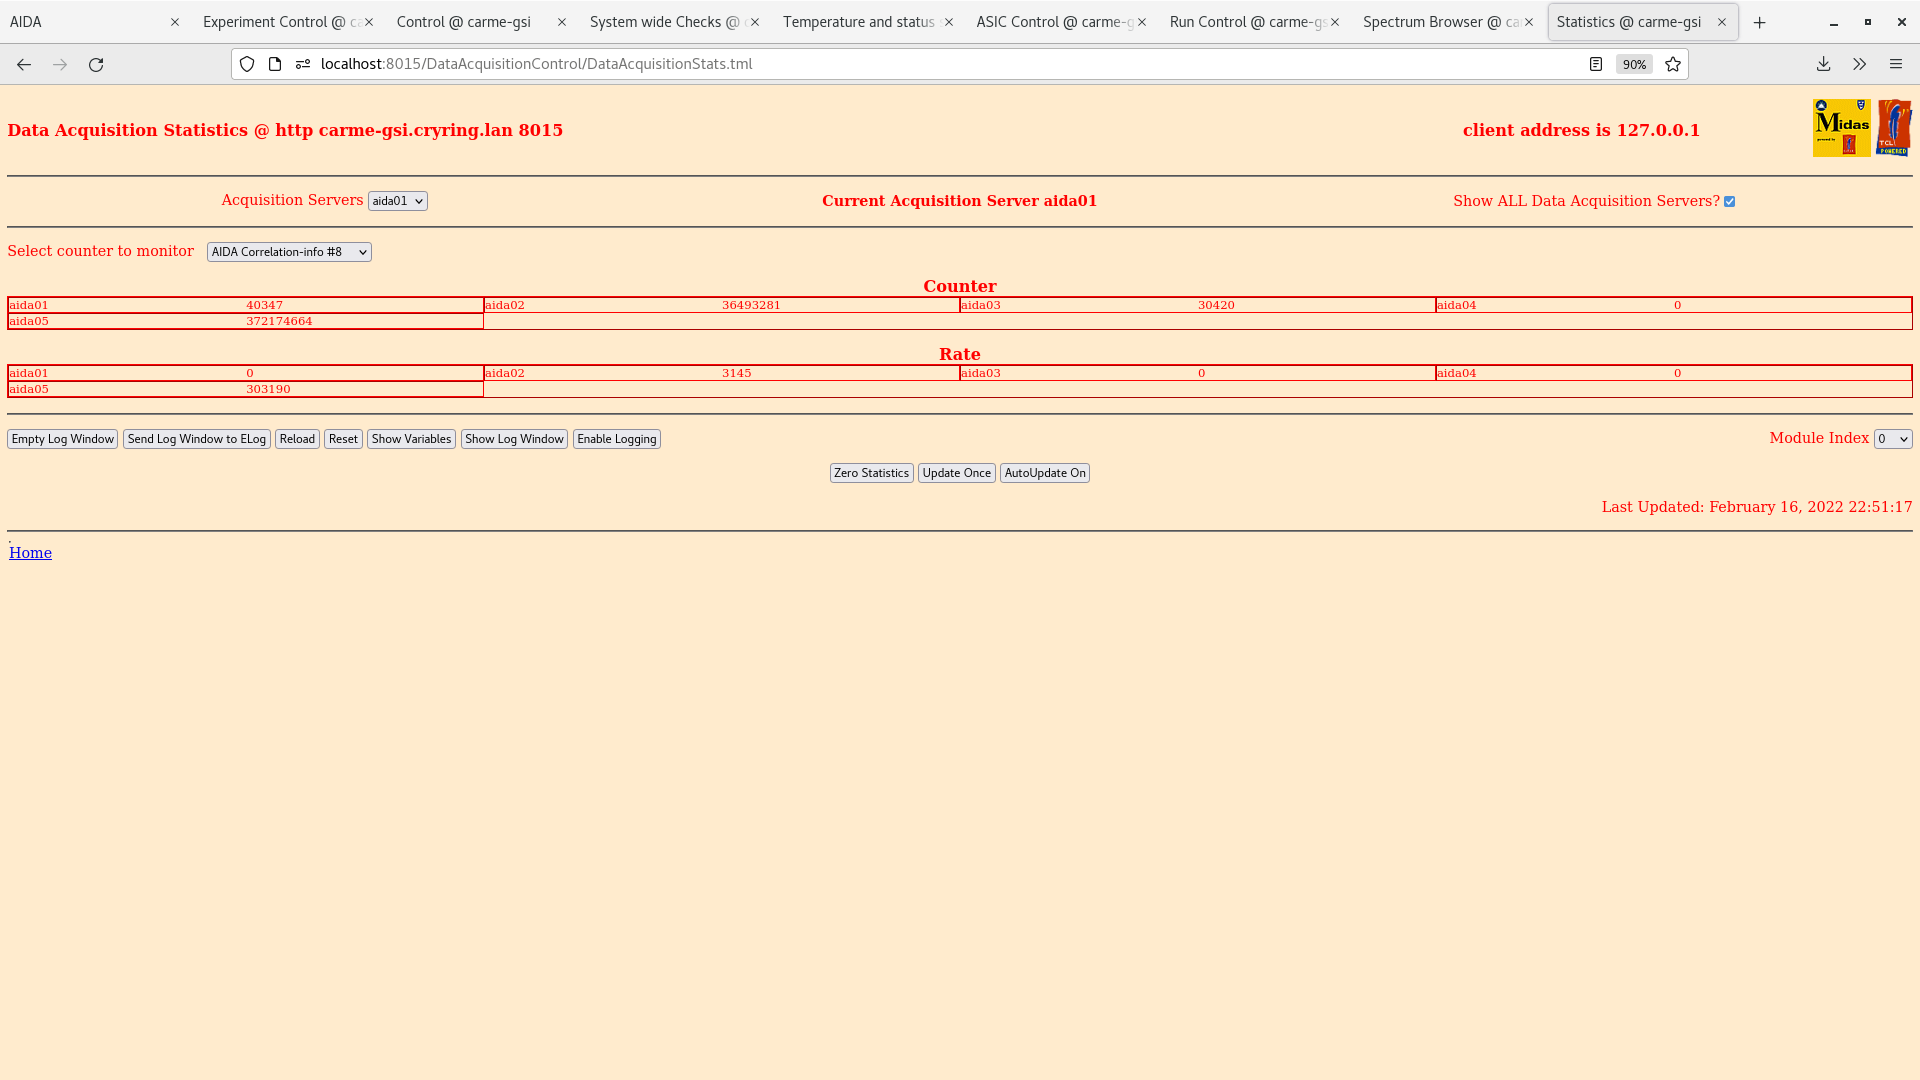
ADC coincidence-info #8 (see attachment 5) aida1,2,5 correlation #8 signals counted. Do not see aida3 correlation 8 signals. was 70-90 previously (elog201)
Good events (see attachment 6) see 10-20k on aida1-4.
Low energy histograms Ex, Ey (attachemnts 7,8)
Noise appears lower across all fees. Aida1 channels for asic 1 and 3 (noisiest) checked against elog 197, same channels are hot but at lower rate to elog 197.
|
| Attachment 1: 2022-02-16_22-45-51-Leakage-Current.png
|

|
| Attachment 2: 2022-02-16_22-43-15-NewMerger.png
|
|
| Attachment 3: 2022-02-16_22-43-50-TapeServer.png
|

|
| Attachment 4: 2022-02-16_22-49-51-ADC-data-items.png
|

|
| Attachment 5: 2022-02-16_22-51-40-AIDA-correlation8.png
|
|
| Attachment 6: 2022-02-16_22-48-47-GoodEvents.png
|

|
| Attachment 7: 2022-02-16_22-52-51-lowenergyEx.png
|

|
| Attachment 8: 2022-02-16_22-57-35-lowenergyEy.png
|
|
|
387
|
Mon Apr 24 21:24:26 2023 |
JM | Preparation for CARME dismount |
CARME currently in vacuum, pressure ~3E-10 mbar. Chamber to be vented tomorrow afternoon by vacuum division. We have active both pirani and hot cathode gauge to aid.
Equipment removed from the chamber in preparation for dismount of CARME from the ring this week. Equipment removed includes:
- Neg pump cabling
- Heating wire
- FEE electronic units and associated cabling (power, hdmi etc)
- Stainless steel FEE holders
- Red and blue cooling hoses
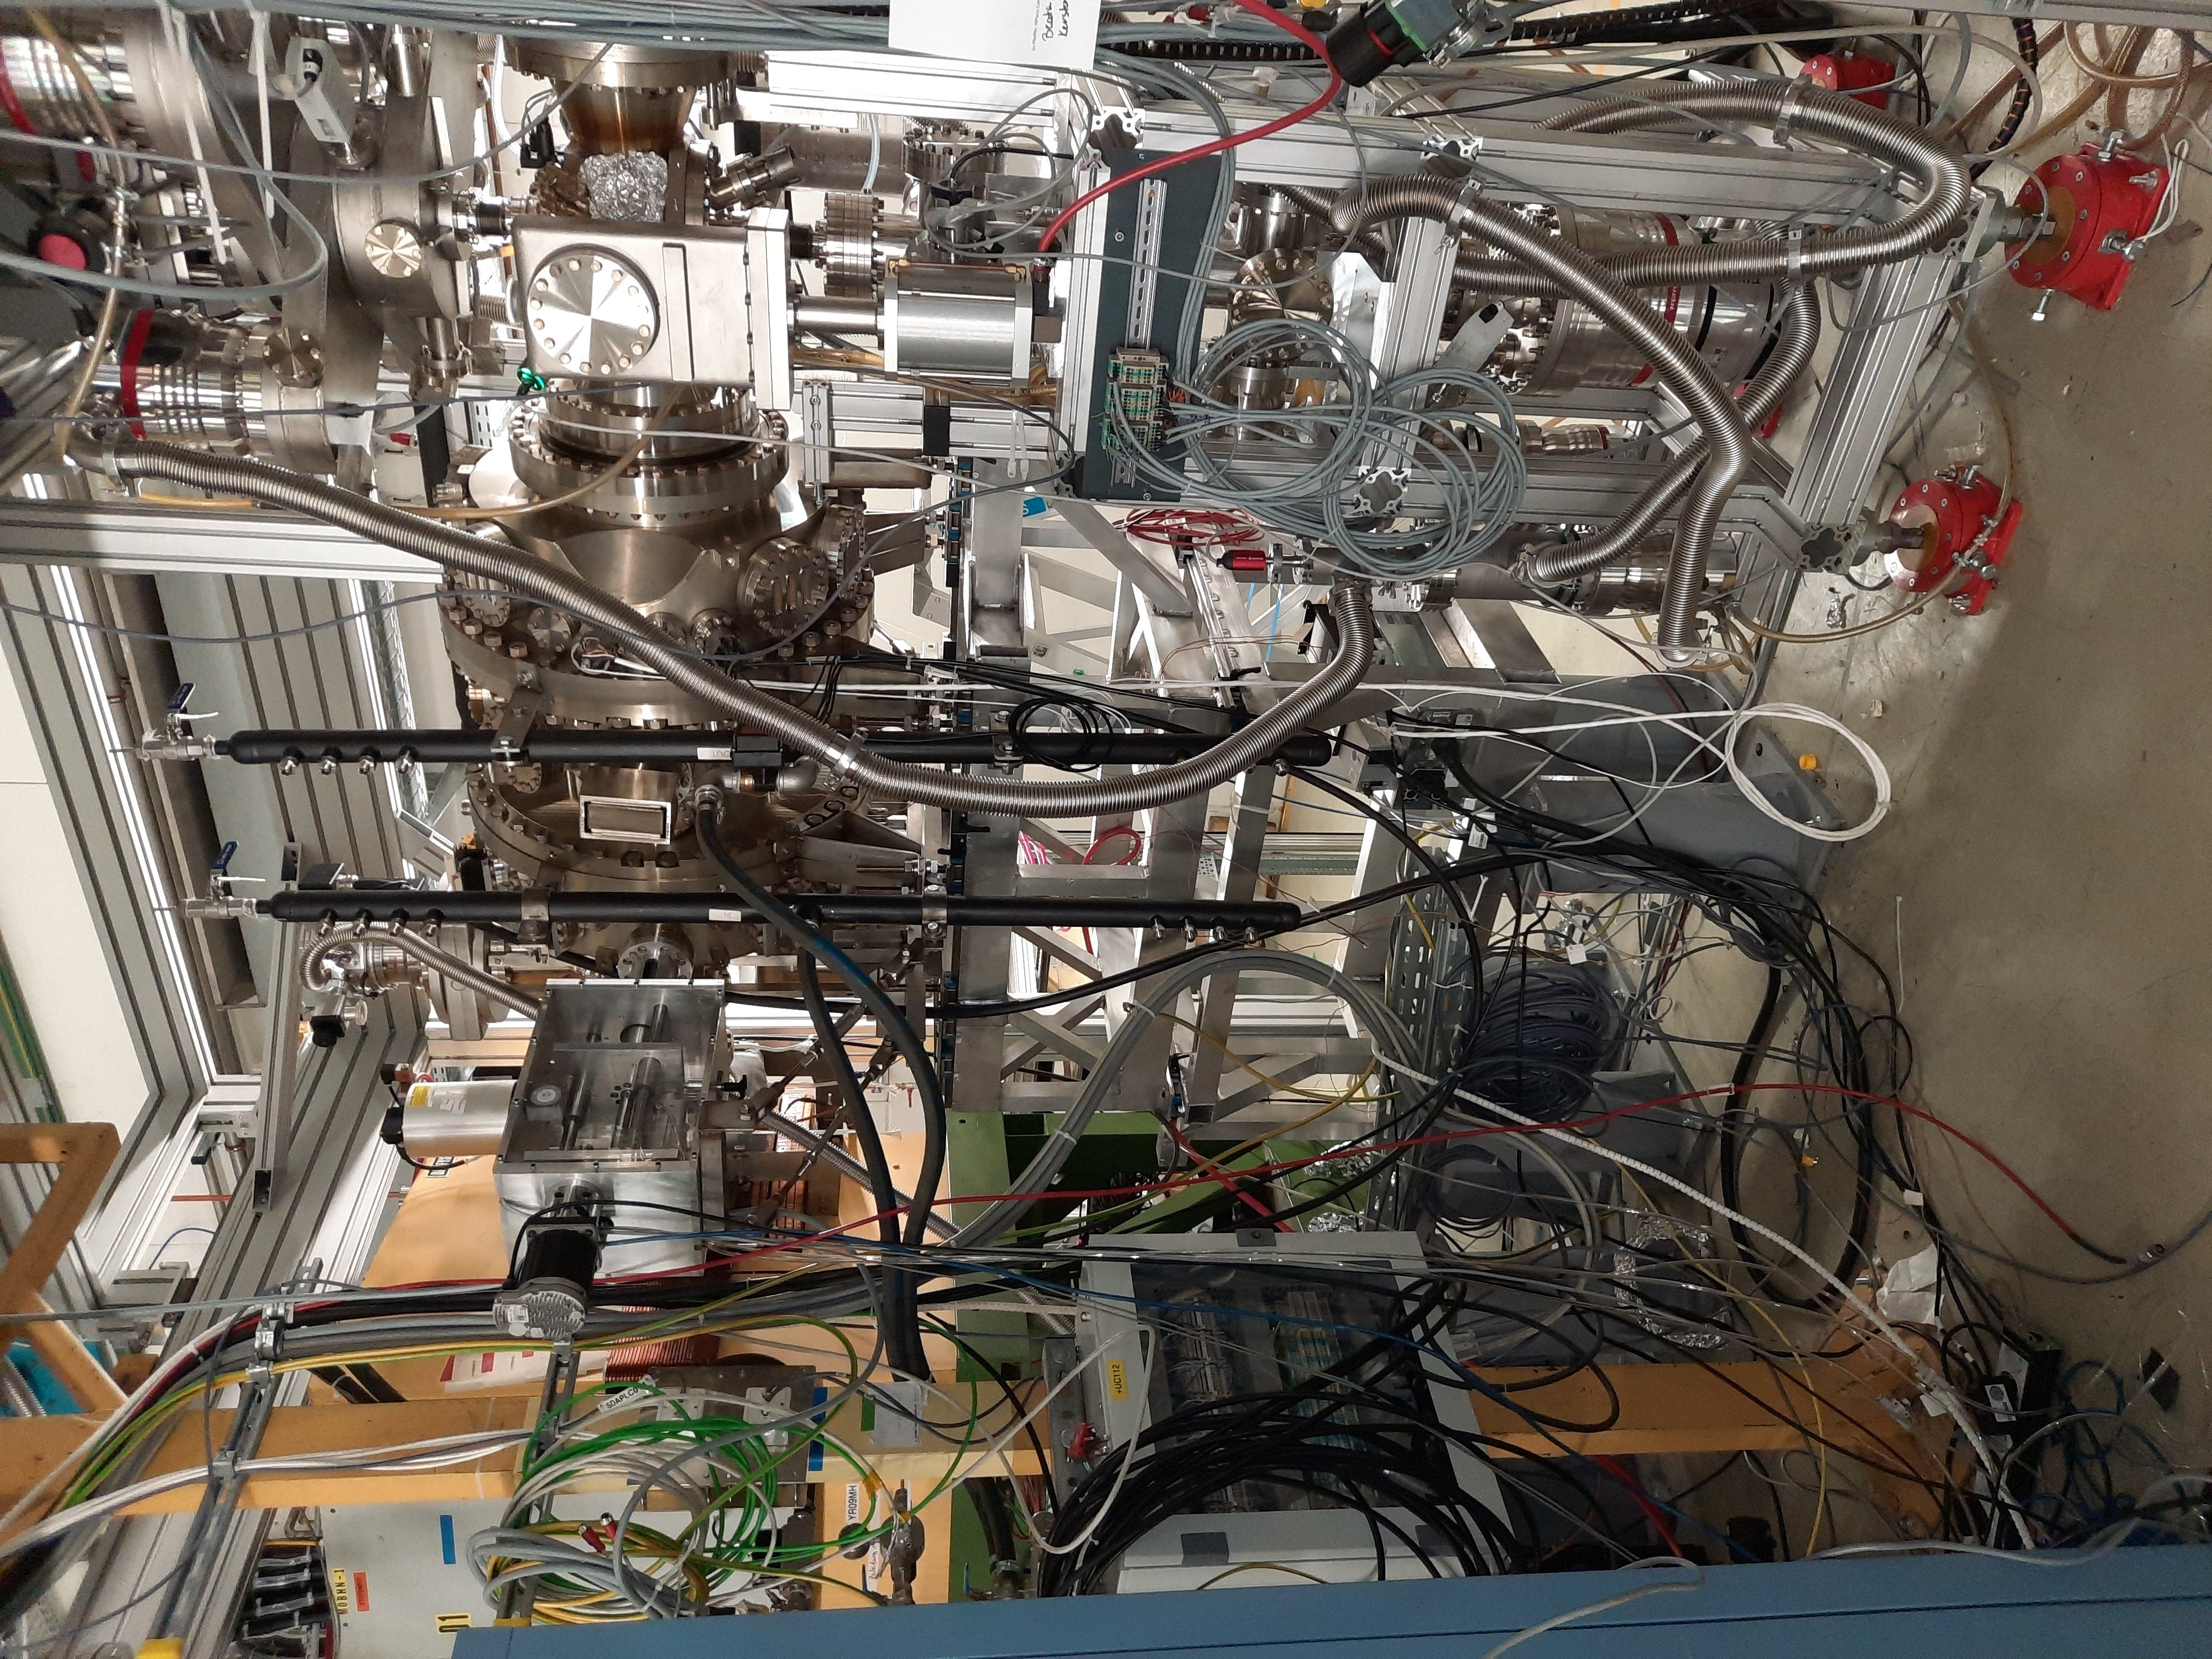
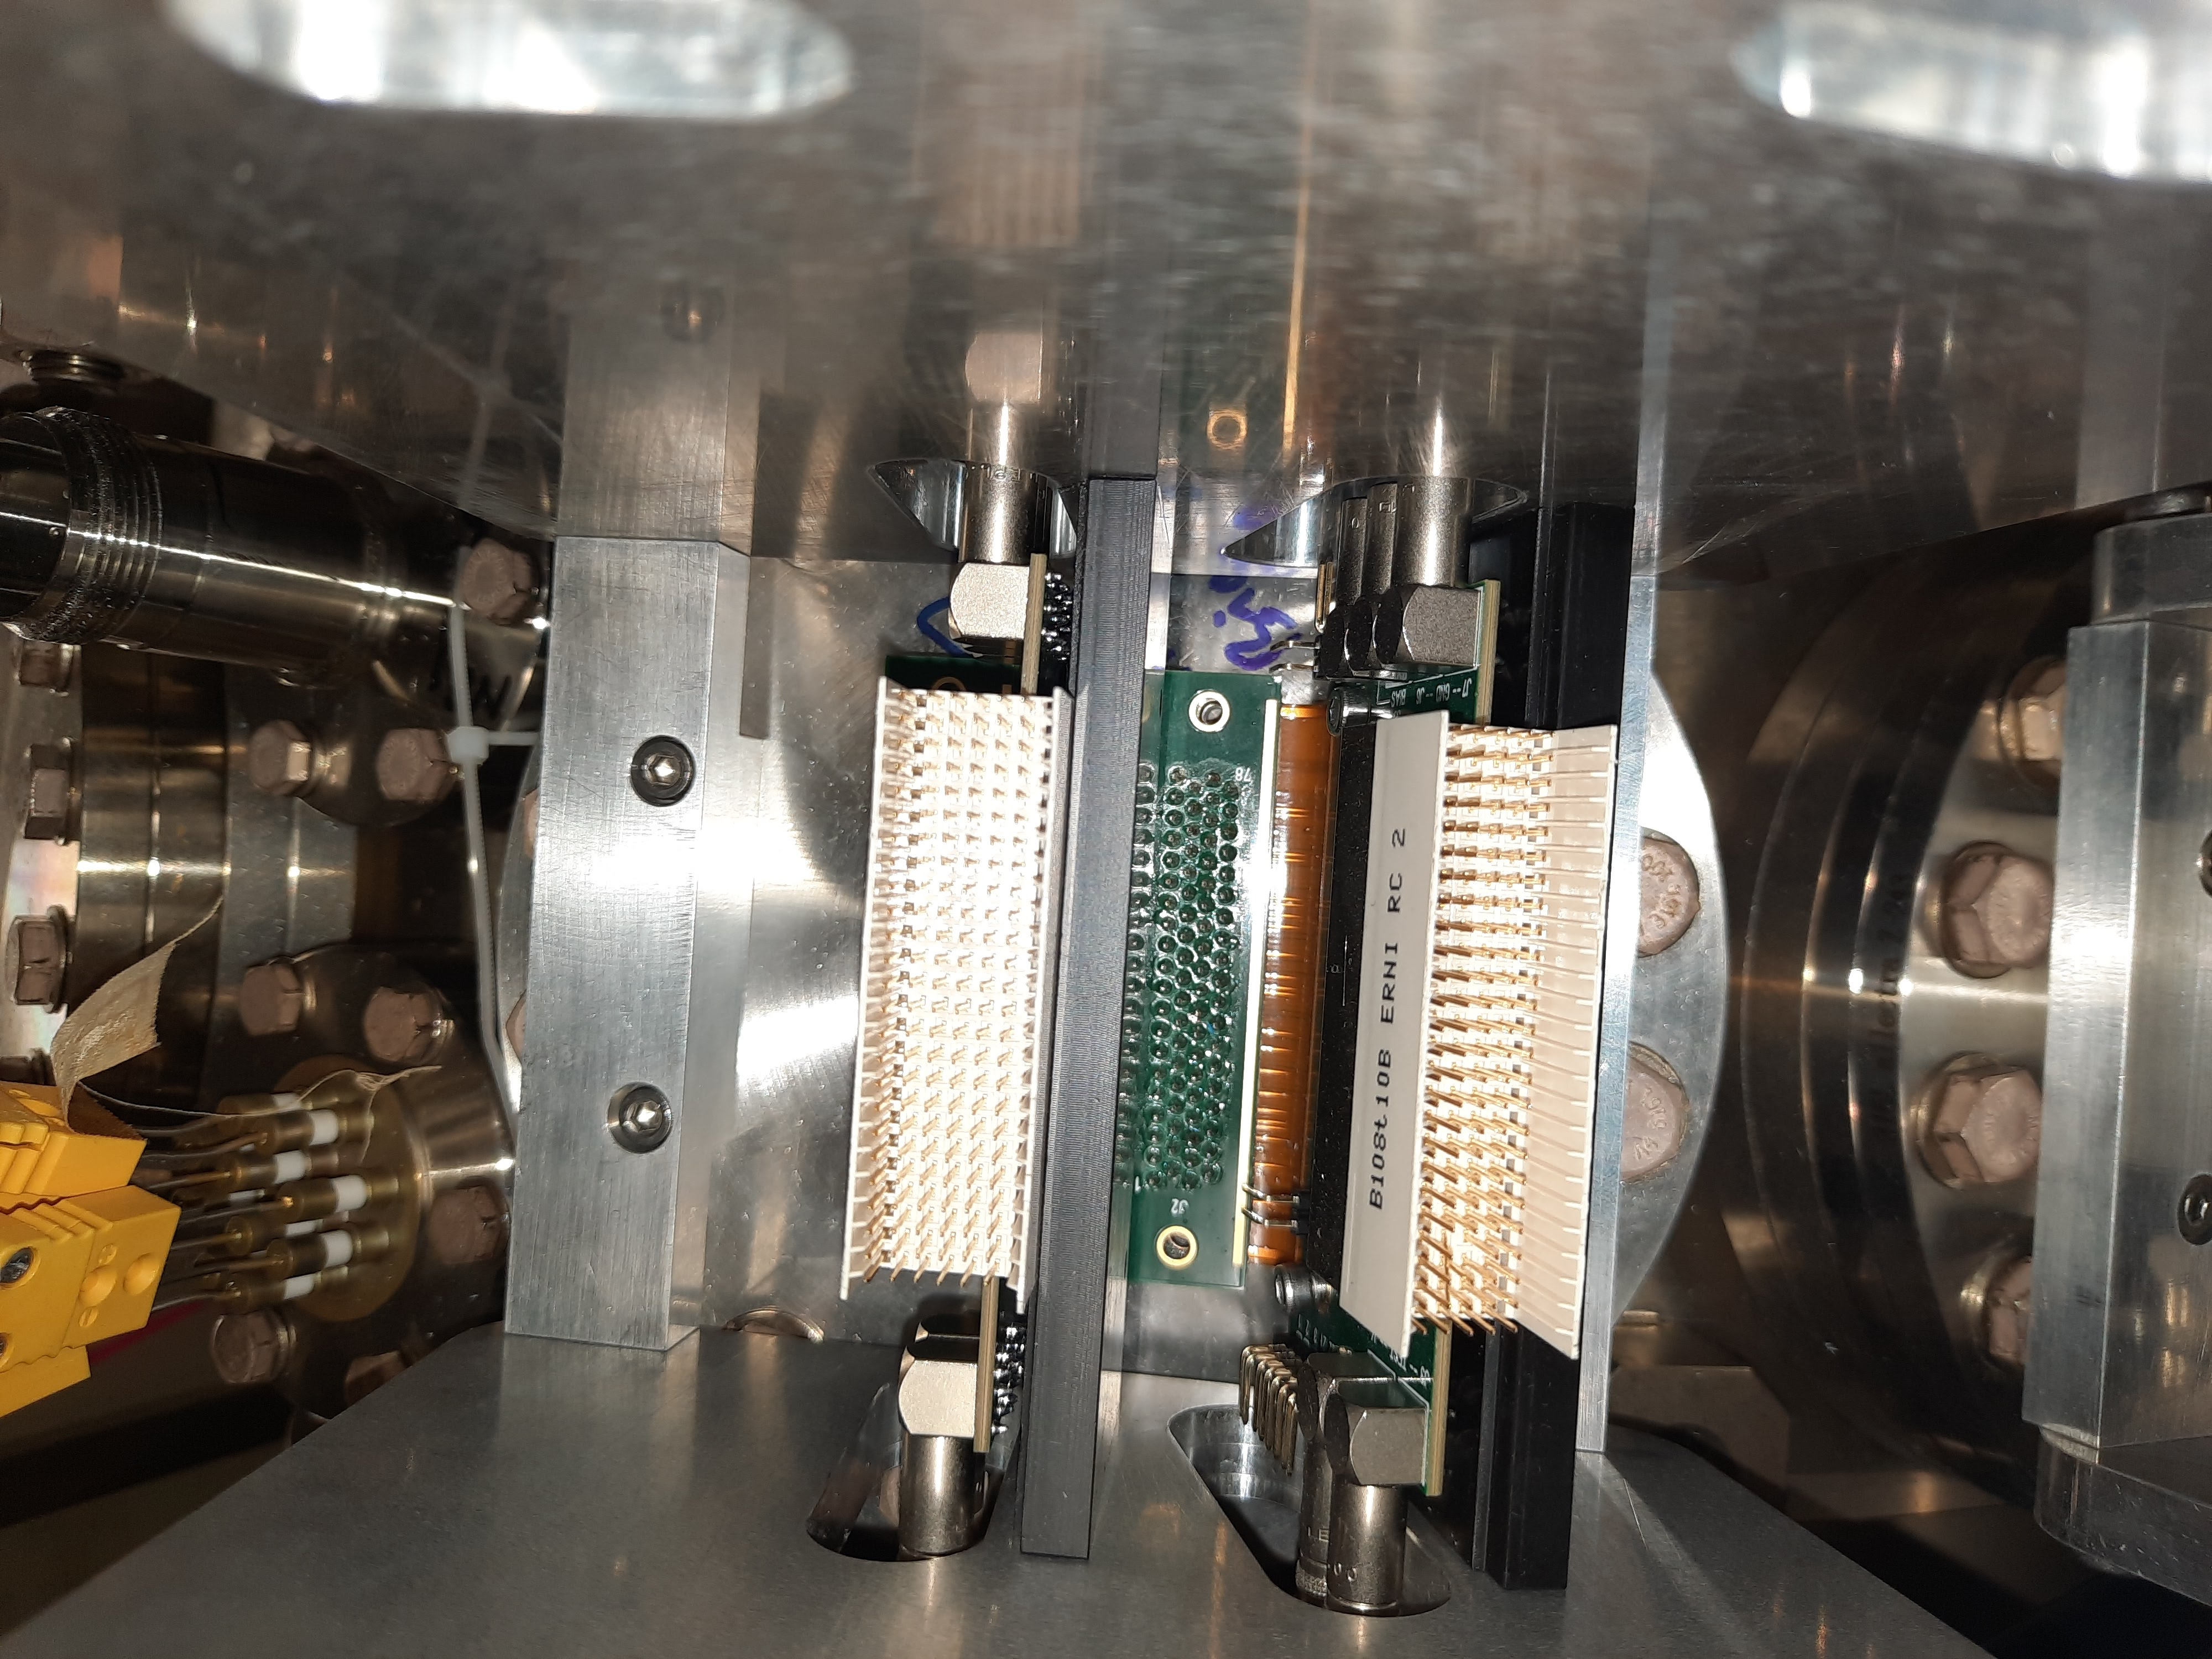
Attached image shows chamber following equipment removal. Adaptor cards still attached to feed-through flanges. ERNI connnectors examined, all fine except for FEE aida03 which has a bent pin (see attached image). Will dismount adaptor cards to examine further tomorrow. Feed-through flanges will also be examined to check for bent pins following adaptor card removal.
New CARME frame is part constructed and is in the CRYRING area. Requires rails and castors which should arrive this week. The height of the frame will require shortening, to be level with the current frame. This will be looked into further tomorrow. |
| Attachment 1: 20230424_155635.jpg
|

|
| Attachment 2: 20230424_155607.jpg
|
|
| Attachment 3: 20230424_150526.jpg
|
|
|
388
|
Tue Apr 25 13:22:19 2023 |
JM | CARME venting |
CARME venting using nitrogen gas bottle.
Coolant pipes dismounted from the chamber
Feed-through flange for n+n bias flange for bottom detector has a bent pin image attached. Clearer image of bent pin for ERNI connector used for aida03 also attached. All other feed-throughs and adaptor cards appear undamaged. |
| Attachment 1: 20230425_134119.jpg
|

|
| Attachment 2: 20230425_132944.jpg
|

|
|
413
|
Tue Jul 4 17:08:08 2023 |
JM | Leak test and venting |
This morning the pressure achieved was 1.44E-7 mbar. Leak testing showed an overall leak rate of 1.5E-10 mbar l/s, this is below the previous leak rate but still significantly above the leak rate from elog 141 of the CARME chamber on its own. Spraying helium, a leak is visible on the VAT gate valve on the interaction chamber (inside of the ring). The leak rate increases to ~2.3E-10 mbar l/s. No increase in the leak rate was observed elsewhere on CARME or the interaction chamber. It was decided to vent again and replace the gasket and inspect the knife edges for the valve.
The valve was removed and the gasket was replaced. Several scratches are visible on the gasket which may be the cause of the leak (or damage may have been done during dismounting). While vented, the backing line was re-organised. The scroll pump is now on the outside of the ring for easier access (see attached image), the turbo pump was rotated to move all power cables and the backing line to the outside of the ring.
CARME and the interaction chamber were pumped down again and the ion gauge was activated. Vacuum can be followed via the vac plot or by grafana on the carme-gsi computer (anydesk required). |
| Attachment 1: 20230704_135455.jpg
|

|
| Attachment 2: 20230704_174524.jpg
|

|
|
414
|
Wed Jul 5 19:27:13 2023 |
JM | Pump down and leak test |
CARME and the interaction chamber have been pumping for ~26 hours, P=4.15e-7 mbar, attached figures show the current pump down plot in comparison to the two previous pumpdowns in the last 2 weeks and the pump down with the bare chamber in 2020. The gradient of the pressure reduction appears to be improving for each pump down, either due to conditioning of the chamber or the reduction in leaks.
CARME and the interaction chamber were leaked tested again today. The base leak rate has reduced significantly from 1.5e-10 mbar l/s to <1e-12 mbar l/s. All flanges on the interaction chamber were tested. A leak is still visible on the gate valve, however the magnitude of the leak has decreased significantly from 2.2e-10 to 2e-11. No other leaks observed on the interaction chamber.
All flanges on CARME checked again, no leaks observed on flanges or wire seal. Leak was observed on the bellows of the left hand side (inner ring) actuator arm. Leak is not on either the small flange box side or the large flange on the chamber, but on the bellows itself. Image attached. Leak rate is 2e-10 mbar l/s. The actuator was moved with the pneumatic motor once to observed any effects, no effect on leak rate or the chamber pressure.
Replacing the bellows is very challenging and will likely require removing the detectors installed on the rod. Current plan is to continue with the baking and re-evaluate post bakeout. The bellows will be baked but should not experience the same temperatures as the flanges on the chamber. Future experiments do not require extremely forward angles so that the actuator arm can remain fixed in place to not cause a n increase in the leak, the leak rate can be compensated by the large neg pumping power.
|
| Attachment 1: pumping_1.png
|

|
| Attachment 2: pumping-zoom.png
|

|
| Attachment 3: signal-2023-07-05-15-13-30-512.jpg
|

|
|
415
|
Thu Jul 6 15:26:39 2023 |
JM | Leak update |
The leak on the actuator arm bellows has been attempted to be sealed using UHV vacuum seal spray. The spray had the opposite to the desired effect and the leak rate increased. When spraying with helium the leak rate had increased to 1e-9 mbar l/s. After lunch a second application of the vacuum seal spray was attempted, however the leak was not sealed. The base leak rate had also increased to the 1e-10 level up from in the morning and yesterday. With the leak increasing in size and risk of a full failure, we are no longer able to move forward with the bakeout.
The chamber has been vented and we will move forward with plans for replacing the bellow tomorrow.
Attached plot shows the most current pumpdown. |
| Attachment 1: pumping.png
|

|
|
431
|
Thu Aug 10 07:51:43 2023 |
JM | Baking tent and heater testing |
09/08/23
Attached is the current pumpdown plot taken from grafana.
I have started to re-work the baking tent in order to close gaps from its initial installation. The heaters work and were tested to a temperature of 50C. Testing is required to gauge the heater temperature required to heat the baking volume, we suspect the heaters will be several hundred degrees.
11/08/23
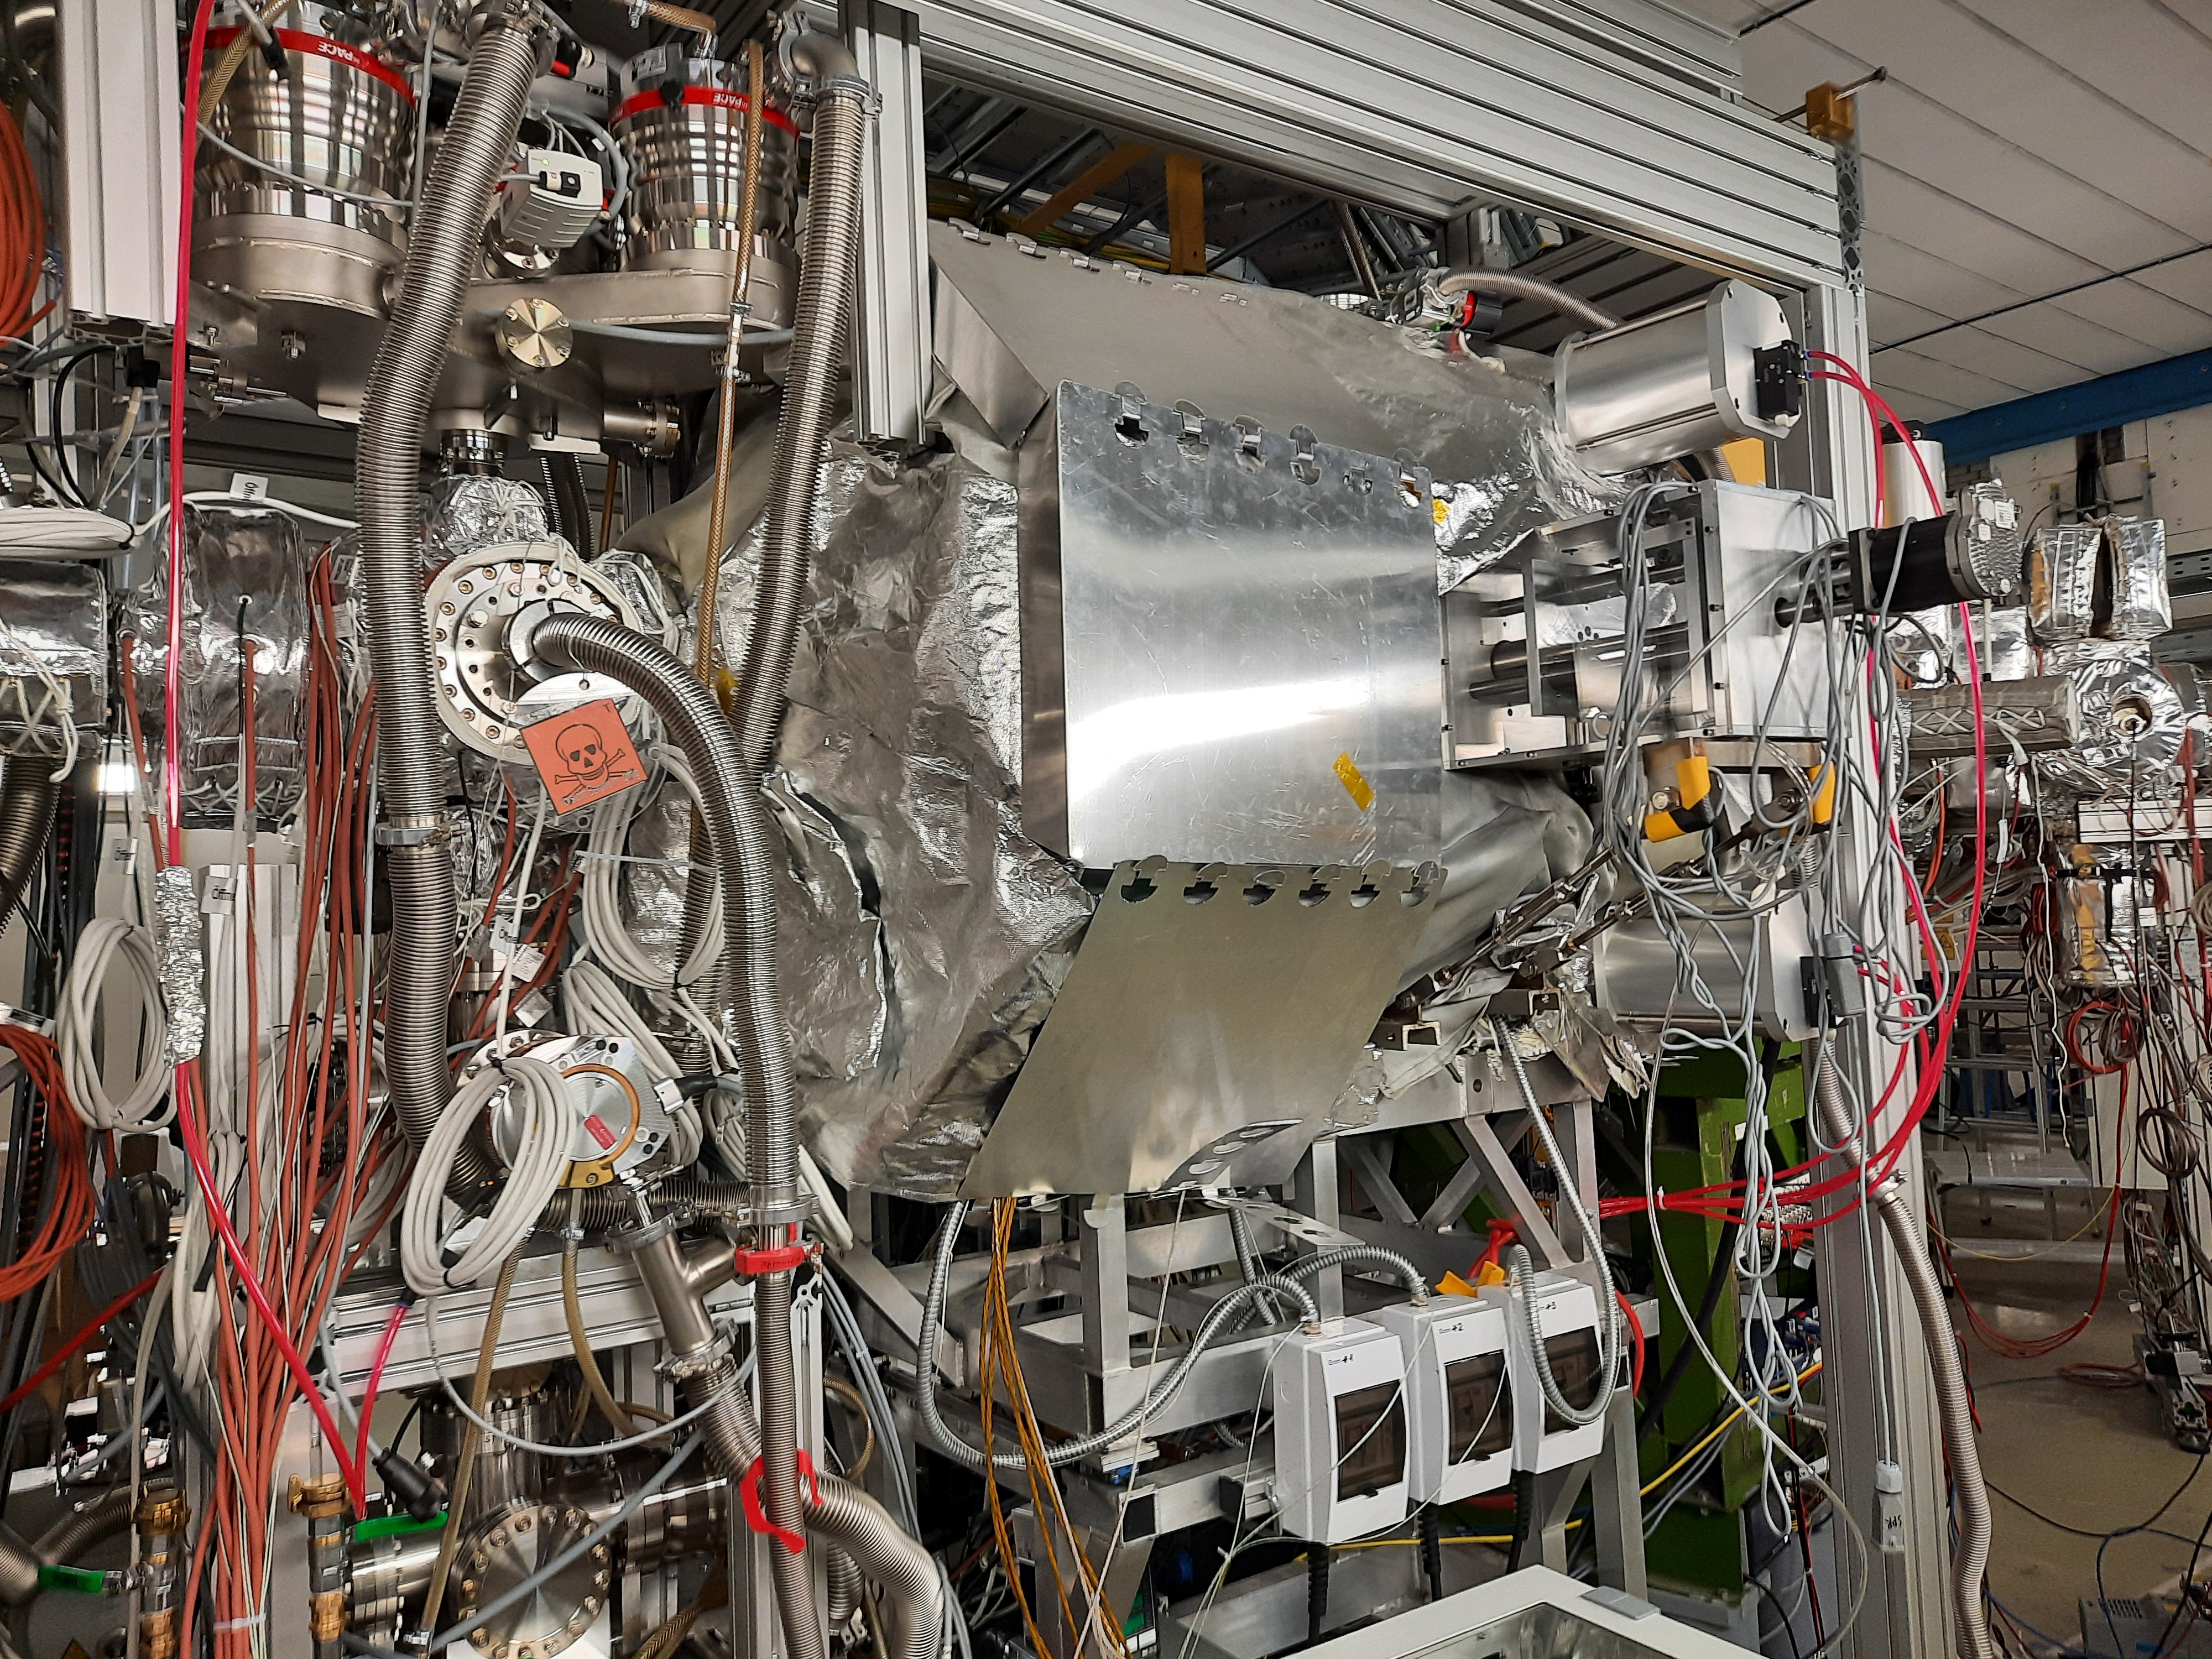
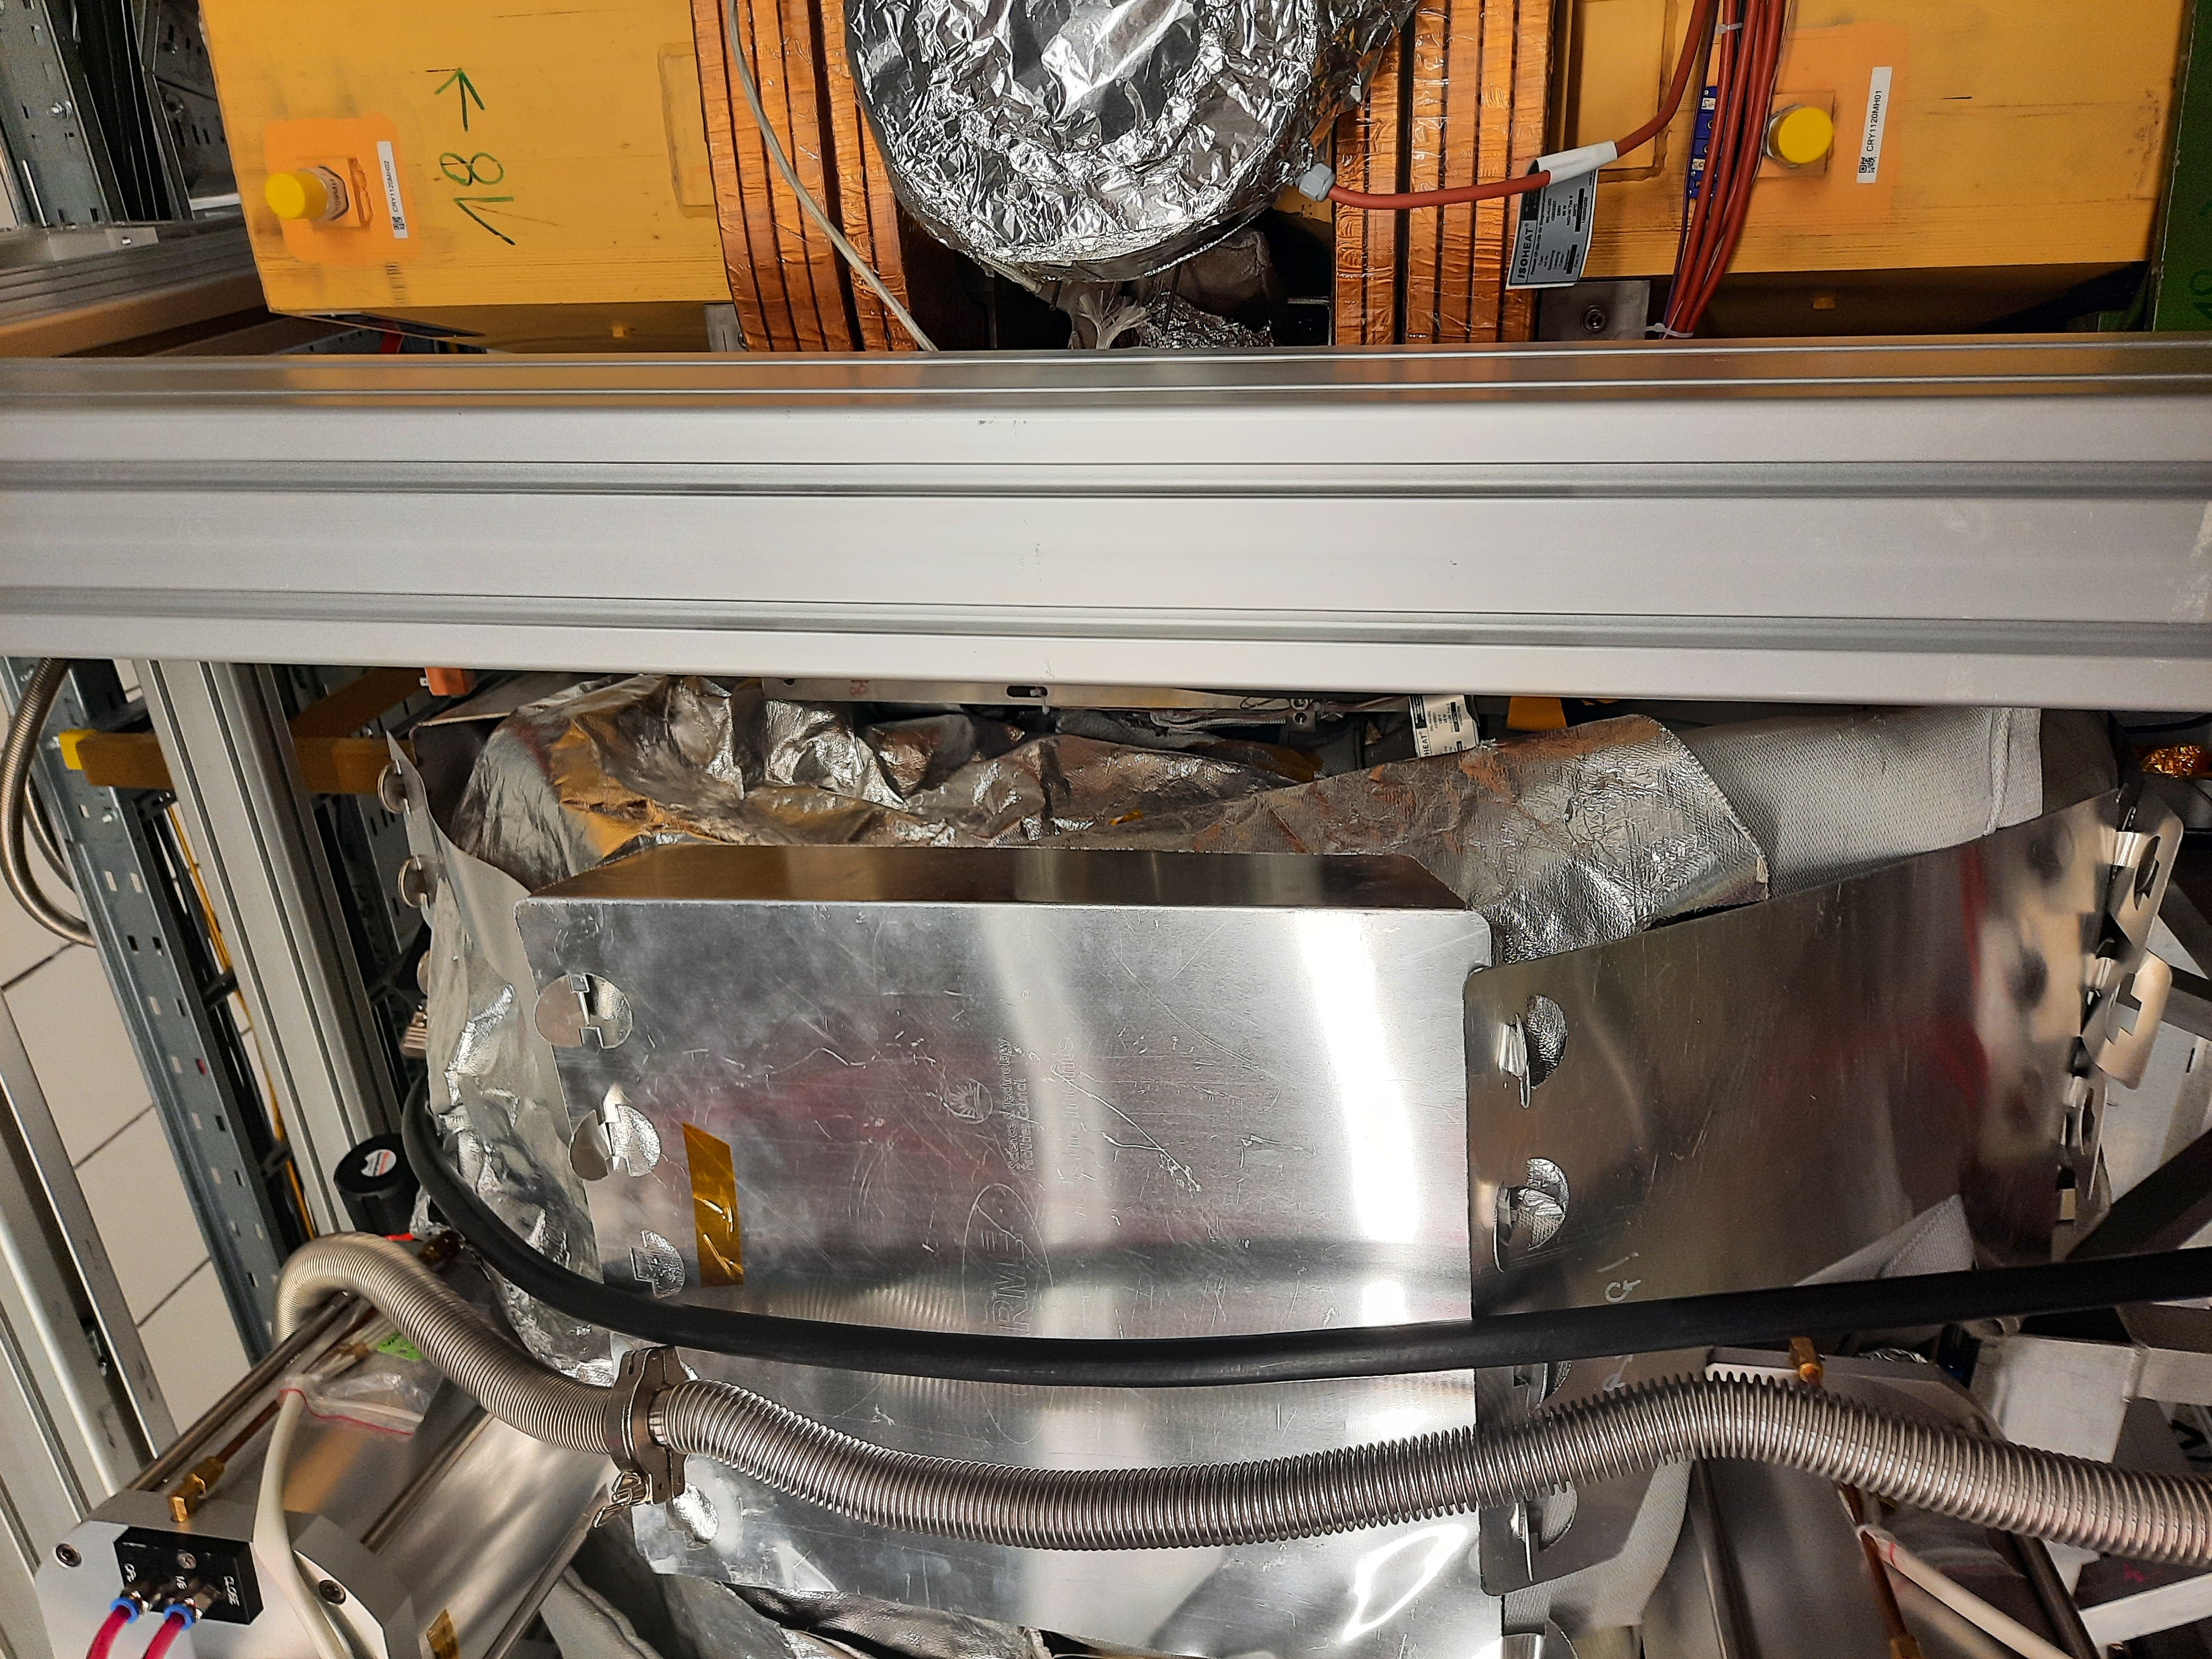
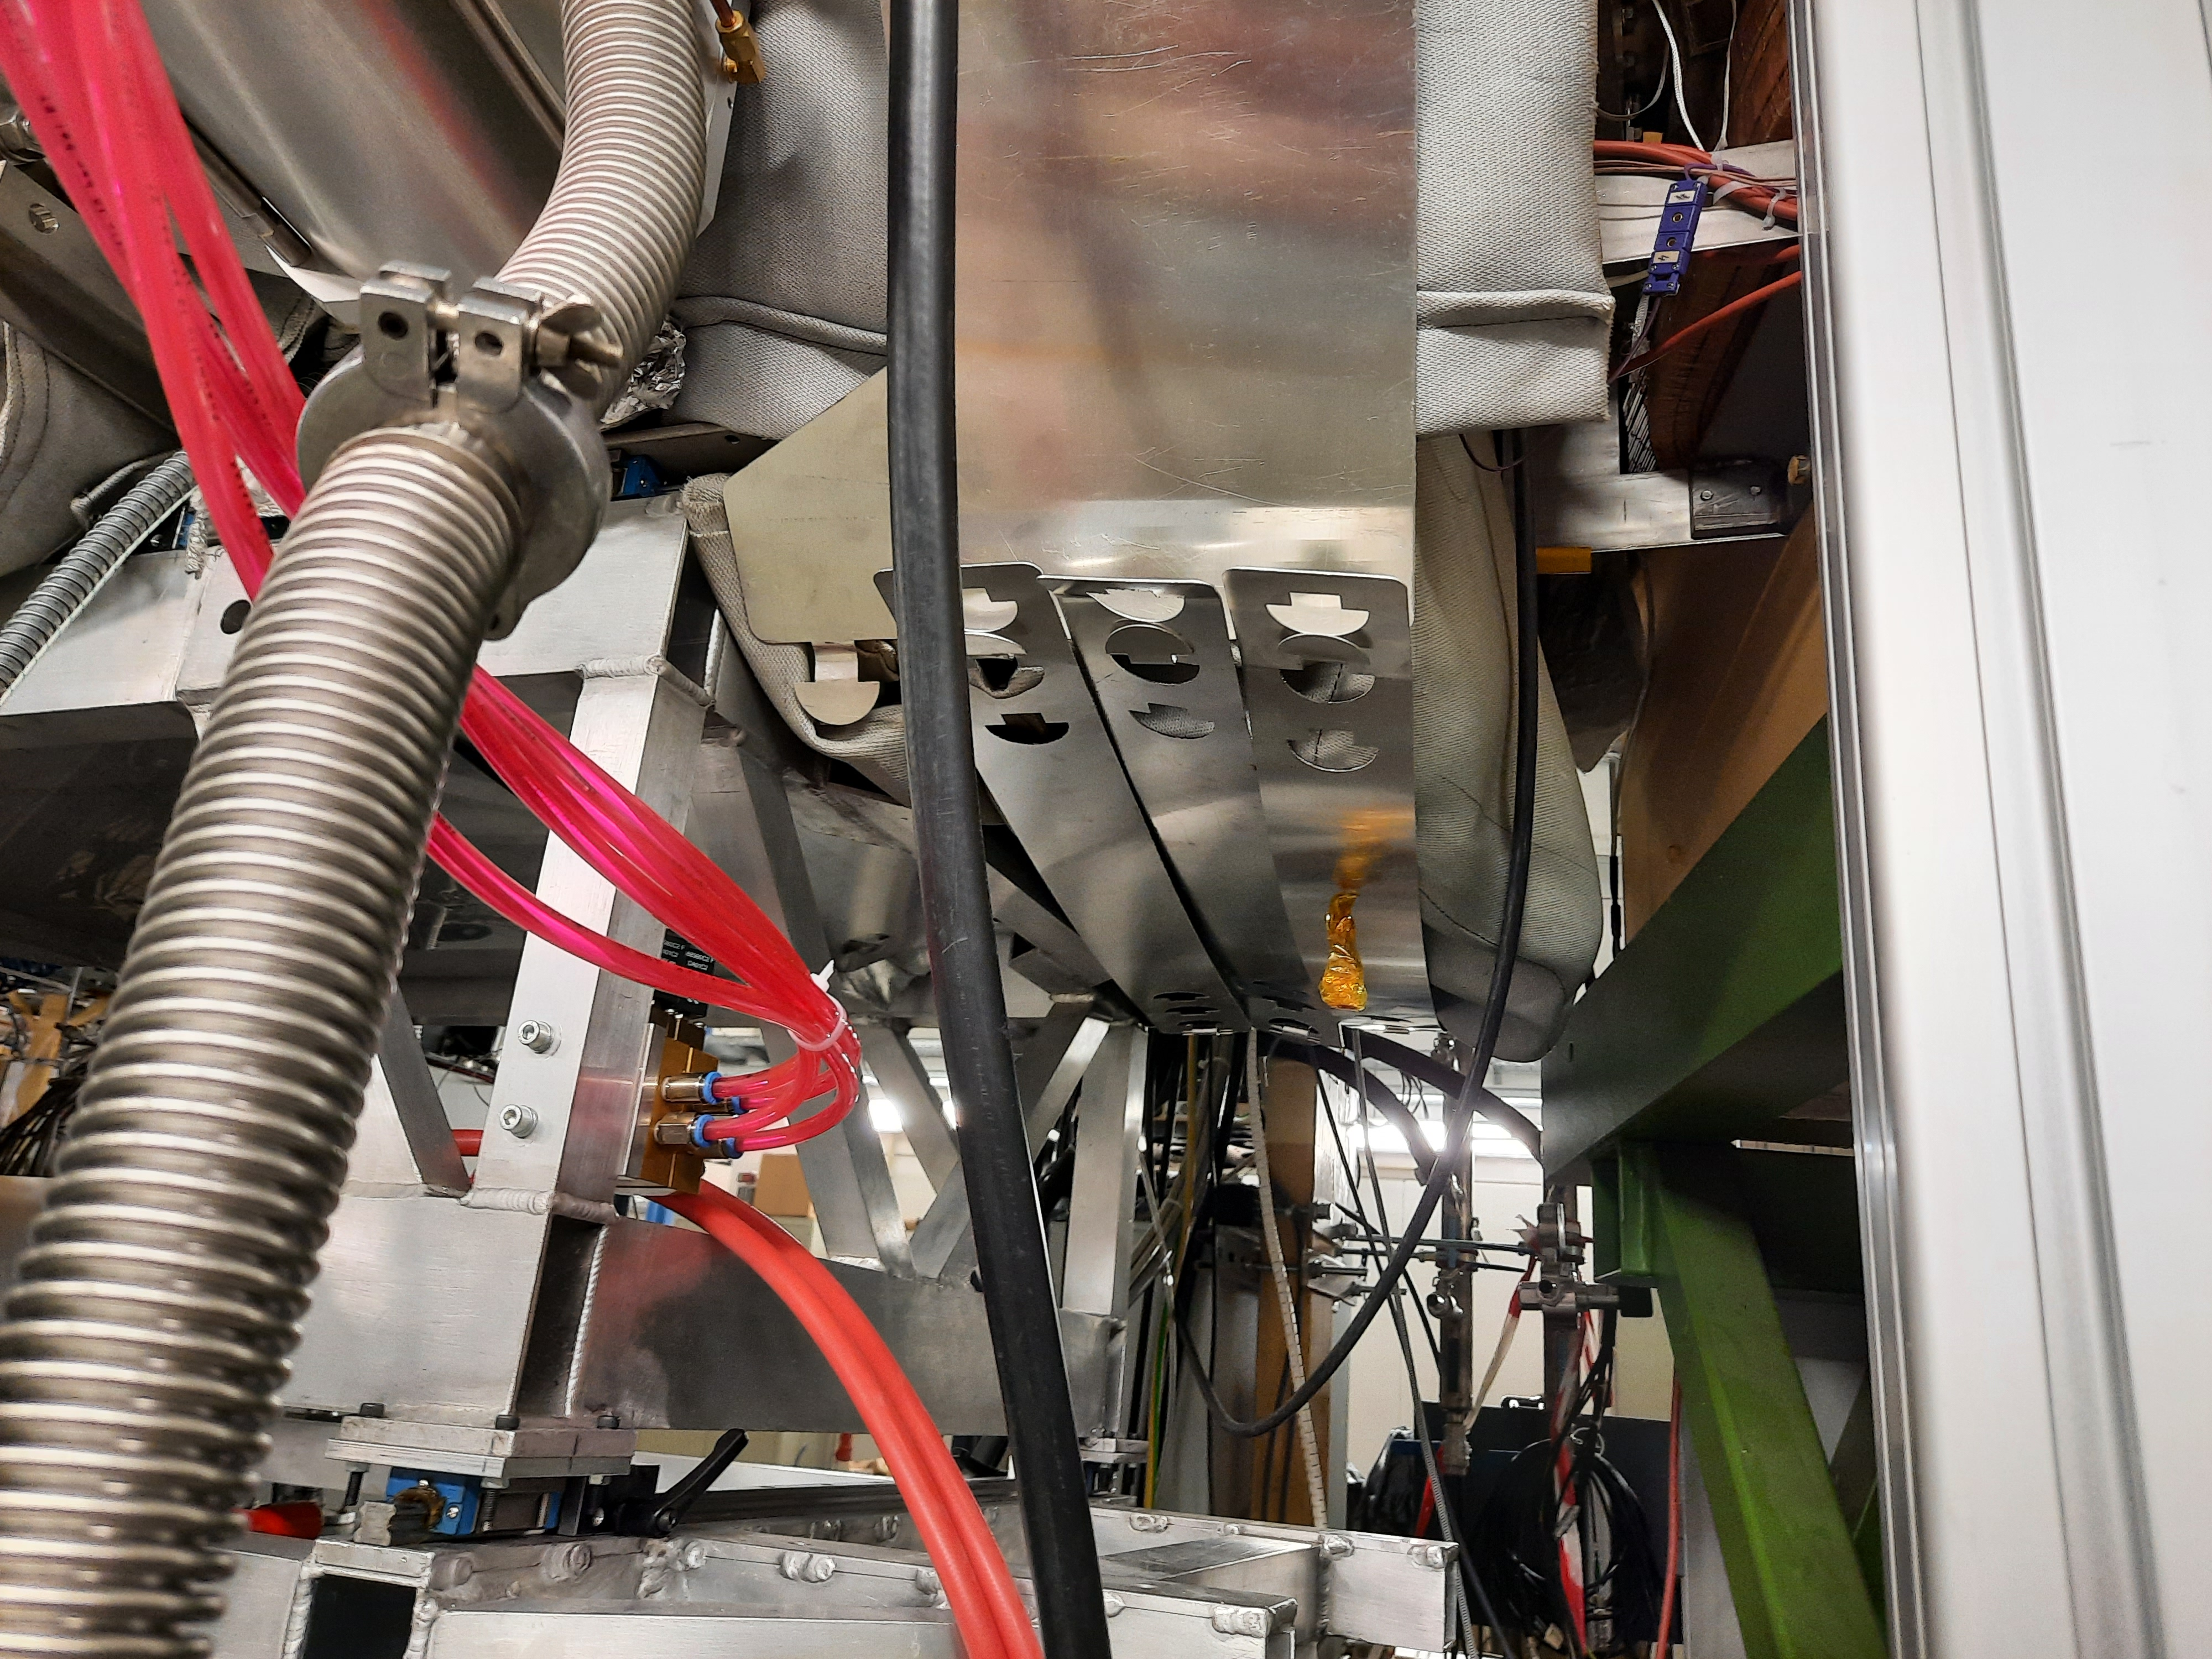
Baking tent has been fully constructed again, see photos attached. Some thermocouples have been re-positioned, new thermocouples positions are given in elog 433. GSI ion pump cable has been connected. Roughing pump on the outside of the berylium window has been connected and berylium window is at < 10 mbar. |
| Attachment 1: current-pump-down.png
|

|
| Attachment 2: 20230812_120951.jpg
|

|
| Attachment 3: 20230812_120925.jpg
|
|
| Attachment 4: 20230811_152942.jpg
|

|
| Attachment 5: 20230811_152926.jpg
|
|
| Attachment 6: 20230811_152923.jpg
|
|
| Attachment 7: 20230811_152918.jpg
|

|
| Attachment 8: 20230811_152913.jpg
|

|