| |
ID |
Date |
Author |
Subject |
|
|
684
|
Sat May 17 11:19:06 2025 |
JM | Shifter intructions 2025 |
EMERGENCY SHUTDOWNS
1. CARME motors: Q key on keyboard while on workspace 1 of appc218 (right of this double-monitor setup)
2. Internal target:
ELOG
The shift should put all information relating to the current run in ONE elog entry. If a significant change occurs during the shift i.e beam off, target off, run change, detectors out etc, start a new run and add a new elog entry.
Elog entry should be named by the current run number.
At the start of each new elog entry please state current detector positions, beam energy and run type (e.g. beam on target, background etc).
TO DO FOR THE SHIFTERS - CHECK EVERY HOUR AND POST TO ELOG WITH SCREENSHOTS. ELOG should be updated with current beam energy, injection beam intensity, system checks OK/not, FEE temperature OK/not, Statistics OK/not, Merger OK/not, tape server data rate, Motors OK/not and min/max motors potentiometer value. The time of each update should be noted in the elog. Screenshots of important screens (detailed below) should also be uploaded to the elog regularly (not required every hour).
CARME DAQ
CARME computer has 6 workspaces (WS), two monitors for each WS.
WS1 : left monitor - fee power
right monitor - Detector Bias control, fee power server (just a terminal, do not close). Check detector bias is stable. If any detector current levels become unstable contact Jordan or Carlo and note time in the elog.
WS2 : left monitor - DAQ controls
right monitor - DAQ server (just a terminal, do not close)
Most important tabs (DAQ controls)
- Run control : shows daq status, stopped / going
- Fee temperatures : temperatures of fees labelled aida01, aida02, aida03, aida04, aida05, aida06, aida07, aida08, aida09, aida10, aida11, aida12, aida13, aida14, aida15, aida16. Hit reload, temperatures will update and should all be green. 1-2 C above safe limit (top) is OK. More than that - warn expert shifter immediately.
- Statistics : shows the statistics for each fee. Make sure ADC Data Items is selected in the left hand menu. Hit update all (SCREENSHOT once, if no changes record OK in elog)
- System wide checks : checks for the setup. Click on 'Check Clock Status', 'Check ADC Calibration' and 'Check the White rabbit decoder status' to run checks. (SCREENSHOT once, if no changes record OK in elog)
- Spectrum browser : loads histograms for fees and fee channels from preset layouts. select layout from 'layout ID' then restore layout from 'Arrange functions' drop down menu. Check layout 1, Select log scale and change xmax as 128 . This displays the data rate per strip. If any strips are a lot higher than the others, or very different from previous entry, make a note in the ELOG. (SCREENSHOT once, if no changes record OK in elog)
- Asic control : sets asic parameters
WS3 : left monitor - Merge control, Tape server
right monitor - servers (just terminals, do not close) , data being written to file
- Check NewMerger tab. Hit reload button and see if 'current links with data' and 'current merged data rate' are updating. All links should go green, but not necessarily at the same time. Keep hitting refresh until you see all of them going green at least once.
- Data rate, hit reload should be around 100,000. Record data rate in elog
- Check tapeService tab. Hit reload button. Check data rate in Kbytes/sec box. Record data rate to elog. This is where the current run number is displayed
- On the right-hand monitor, bottom right terminal, check the current run fragment (sub-run) is being written and is slowly increasing in size. It refreshed automatically every 5 seconds.
WS4 : Leakage current plot
- Check leakage current plot is stable. Transients will occur during motors movement but baseline current should remain consistent. Make sure it is updating and time is correct. (SCREENSHOT once, record OK in elog if no changes) Check present values on WS2, CAEN window
WS5 : Online data monitoring
- Check the following plots are updating for each DSSD
- LowEnergyXY (right click - col - colz). This shows the total number of events, per pixel, since the code was started / re-started.
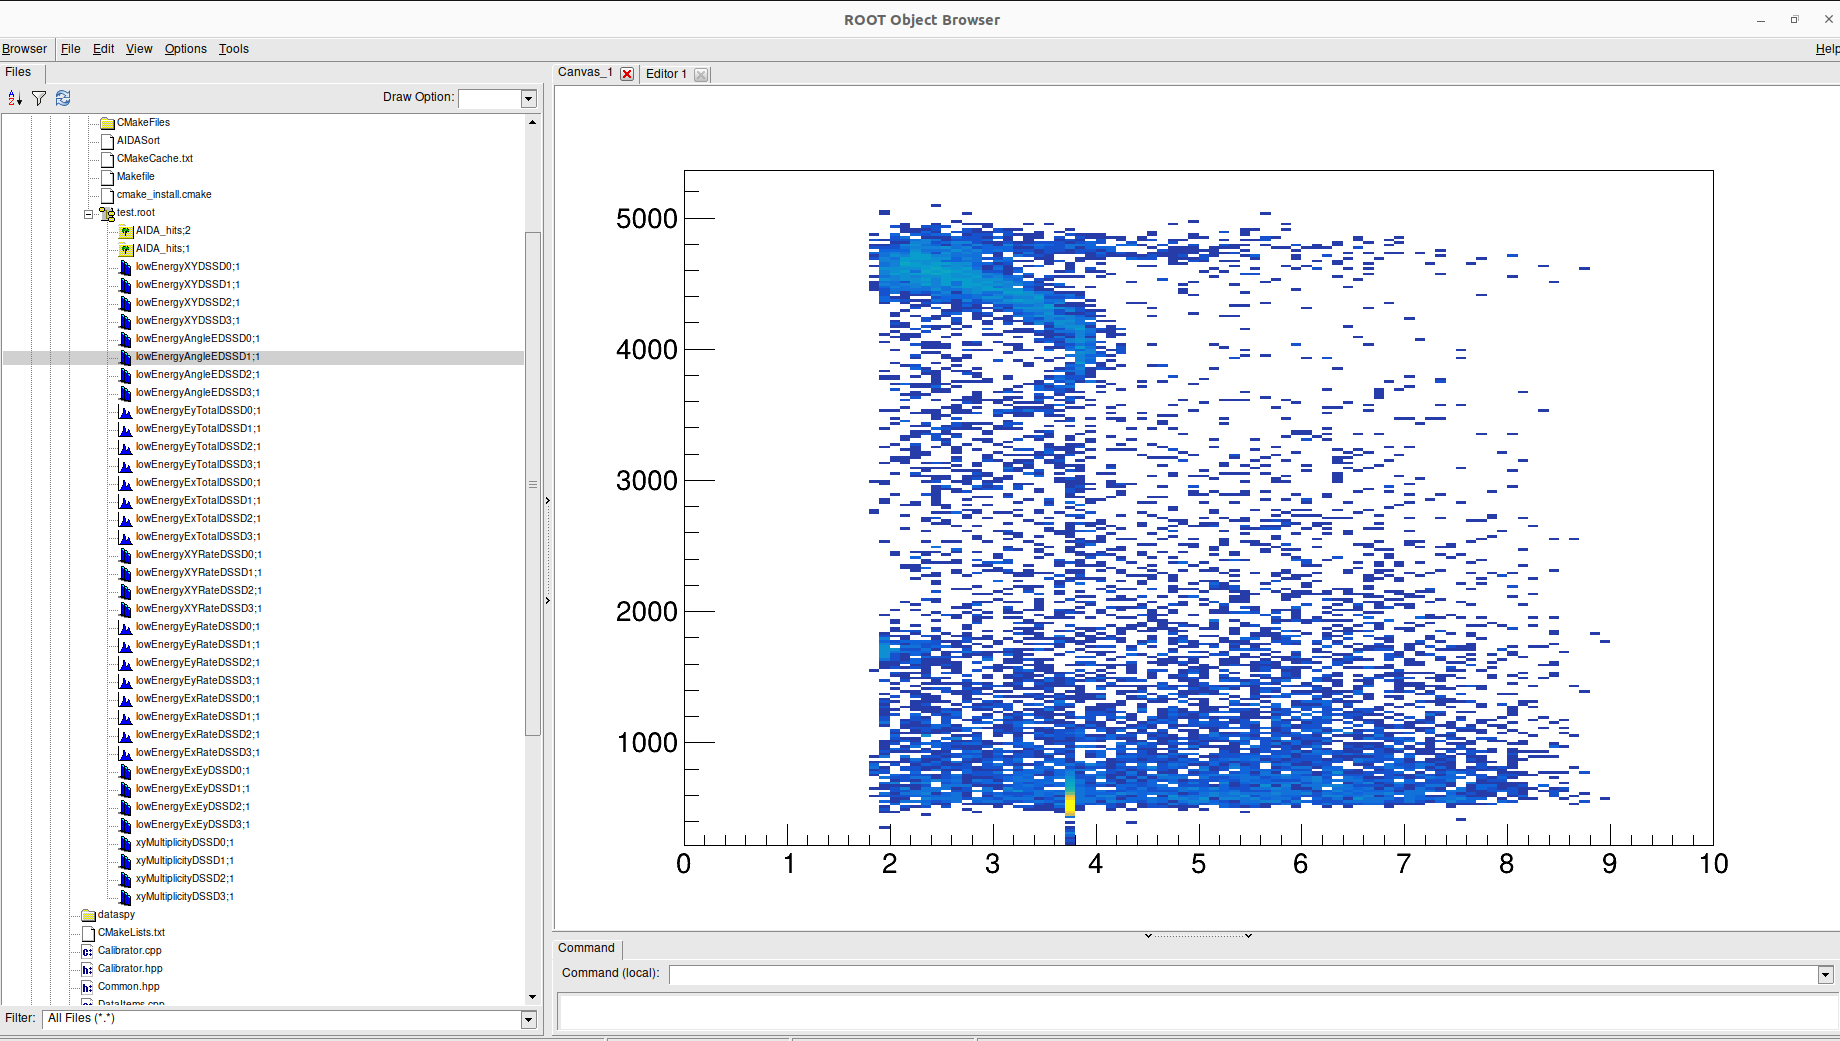
- LowEnergyAngleE. This shows the angle vs energy plot of all detected events. Can be used to observed elastic scattering / 7Be from lithium measurement
- LowEnergyXYRate (right click - col - colz). This shows the rate over the last 20 seconds.
- LowEnergyExRate (double left click. Right click on y axis - Log scale on y). Rate over the last 20 seconds
- LowEnergyExTotal (double left click. Right click on y axis - Log scale on y). This shows the total energy deposited on all X strips since code restart.
- LowEnergyEyTotall (as above). as above, Y strips. (SCREENSHOT of each per DSSD per shift. If significant changes are observed screenshot again)
- During the shift, shifters should try to integrate peaks of interest. Area to integrate will be given in spreadsheet in same workspace as monitoring code. This is particularly important for D+D where peaks from each detectors for reaction products should be integrated every hour to determine how much time before moving to the next datapoint. For lithium beamtime this should also be done in the angle vs energy plot. Note the number of counts in the spreadsheet in the same workspace.
WS6 : Browser, ELOG
-->IMPORTANT NOTE: MIDAS DAQ can respond slowly. DO NOT try to change tab or give new command while the previous one is being executed. Check activity in right-hand part of tab currently in use. Do not double click on buttons.
Motors computer (Computer to the right)
- Check motors cycle is running. The code will cycle through the loaded motors instructions. When an instruction is being done it is highlighted in bold. Check the bold highlighting cycles through entire set of instructions.
- Check potentiometer is reproducing same max/min values for each cycle of instructions.
- Detectors are on LEFT and RIGHT arm.
- No need for screenshots, but record in the ELOG you checked this.
|
|
|
683
|
Tue May 13 15:07:42 2025 |
JM | Online monitoring code |
CARME_Sort histogramming has been updated to aid our understanding online.
> XY plots have been updated to reflect the true position of the beam relative to each detector. Online we will be able to layout in a grid to reflect looking downstream in YR09 (see attachment 1)
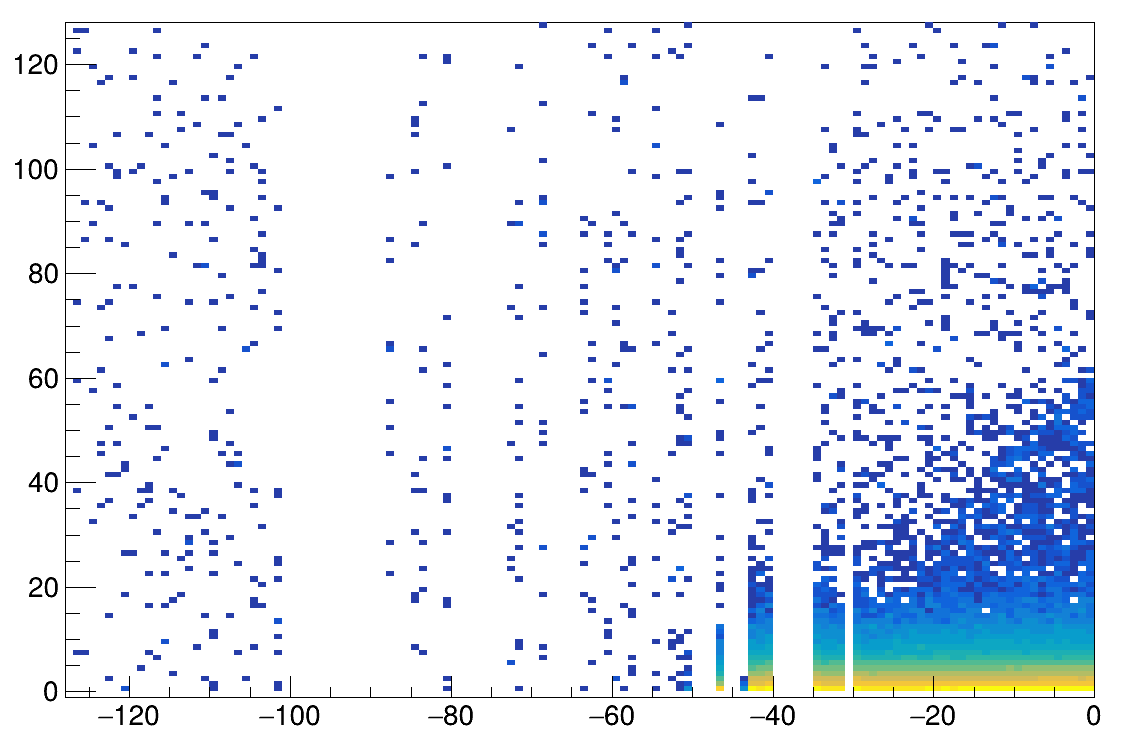
> Angle vs Energy plots have been created (see attachment 2). For this the position of the detectors has to hardcoded in the EventClustering header file of the code. This has been done using the detector positions from the 426 keV/u 15N measurement in 2024 which is the reference position. To reflect the true state during the beamtime a correction to these positions is required in the EventClustering regular file (e.g x_position + 30 mm). Correction can be applied using difference between potentiometer value and reference potentiometer values.
Ref potentiometer value LEFT = 36.54 mm
Ref potentiometer value RIGHT = 64.60 mm
> An additional condition based on the cluster y position has been added for an event to be added to the histograms. This can be used to remove edge strips affected by the beam stripe (if beam stripe can't be removed via scrapers). This allows angle vs energy and regular energy histograms to be of use online. Currently this option is set to zero, can be enabled if beam stripe persists.
> Histograms not immediately useful (such as high energy XY etc) have been commented out. This makes the histogram browser cleaner and should ease use for online shifters. (see attachment 3)
> Corrections to CARME_Sort found during analysis of 15N data have been added to the code. These include Event timing cutoffs in the EventBuilder and a corrreciton to the BuildTimestamp function in DataItems file which was causing timewarps.
> Previous CARME_Sort versions have been saved and will be uploaded to github in due time.
|
| Attachment 1: Screenshot_from_2025-05-13_15-14-12.png
|
|
| Attachment 2: Screenshot_from_2025-05-13_15-14-38.png
|

|
| Attachment 3: Screenshot_from_2025-05-13_15-28-48.png
|
|
|
|
682
|
Mon May 12 13:25:09 2025 |
JG | MBS DAQ - overview |
An MBS DAQ is running to collect two types of data:
1. WR timestamps for machine events (injection, target ON/OFF, ...)
These are triggering the MBS individually.
2. Scaler rates for machine parameters (target pressures, ring RF, ...)
These are being readout each second by a 1Hz trigger.
DAQ quick manual
MBS node: cry_exp@r4l-70.gsi.de
directory: /esr/usr/cry_exp/2025_JET_CARME/mbs
DAQ running on: cry_exp@atppc028.gsi.de
in a screen session named "jetDAQ"
RFIO server: cry_exp@atppc028.gsi.de
in a screen session named "RFIO"
directory: /u/cry_exp/Beamtimes/202505_Li/lmd
RESTART DAQ on cry_exp@atppc028:
1. cd /u/cry_exp/Beamtimes/202505_Li
2. ./daqstart.sh
ENTER jetDAQ or RFIO screen on cry_exp@atppc028:
- screen -x jetDAQ
- screen -x RFIO
cabling documentation
MBS trigger inputs
|
trig. type | event
| |
1 (PENDING) | ring injection
| |
2 (PENDING) | detectors IN
| |
3 (PENDING) | detectors OUT
| |
4 (PENDING) | target ON (shutter)*
| |
5 (PENDING) | target OFF (shutter)*
| |
6 (PENDING) | beam dumped
| |
| |
11 (PENDING) | 1Hz scaler readout
|
*The GENESYS signal logic for the target shutter was changed several times, this means trigger 4 and 5 could be swapped. The motor signals (trigger 2 and 3), however, have not been touched and should be stable.
scaler inputs
|
scaler ch. | rate/signal
| |
1 | gas jet E1 (inlet pressure zone 1)
| |
2 | gas jet E2 (inlet pressure zone 2)
| |
3 | gas jet E3 (inlet pressure zone 3)
| |
4 | gas jet E4 (inlet pressure zone 4)
| |
5 | gas jet S1 (outlet pressure zone 1)
| |
6 | gas jet S2 (outlet pressure zone 2)
| |
7 | gas jet S3 (outlet pressure zone 3)
| |
8 | gas jet S4 (outlet pressure zone 4)
| |
9 | gas jet T1
| |
10 | gas jet T2
| |
11 | gas jet VV1
| |
12 | gas jet ??
| |
13 | Scintillator rate (0 deg. det. YR09) [ONLY AFTER 12-06-2025 16:30]
| |
14 | -
| |
15 | -
| |
16 | -
| |
17 | cryring IMP horizontal
| |
18 | cryring IMP vertical
| |
19 | cryring PCT
| |
20 | cryring ICT int
| |
21 | cryring BPM int
| |
22 | cryring Schottky span 0
| |
23 | cry-radio
| |
24 | cryring RF
| |
25 | -
| |
26 | -
| |
27 | -
| |
28 | -
| |
29 | -
| |
30 | -
| |
31 | -
| |
32 | -
|
|
|
|
681
|
Sat Apr 26 22:01:37 2025 |
CB | Proxy bridge |
Proxy bridge enabling anydesk and generic Internet access dropped due to atppc025 being rebooted. Found it dropped again late today.
Restarted bridge inside a screen session. |
|
|
680
|
Wed Apr 23 11:08:34 2025 |
TD, JM | Background Run |
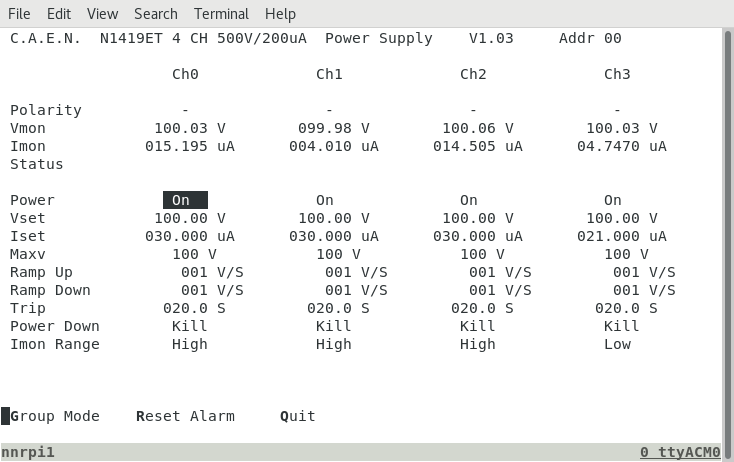
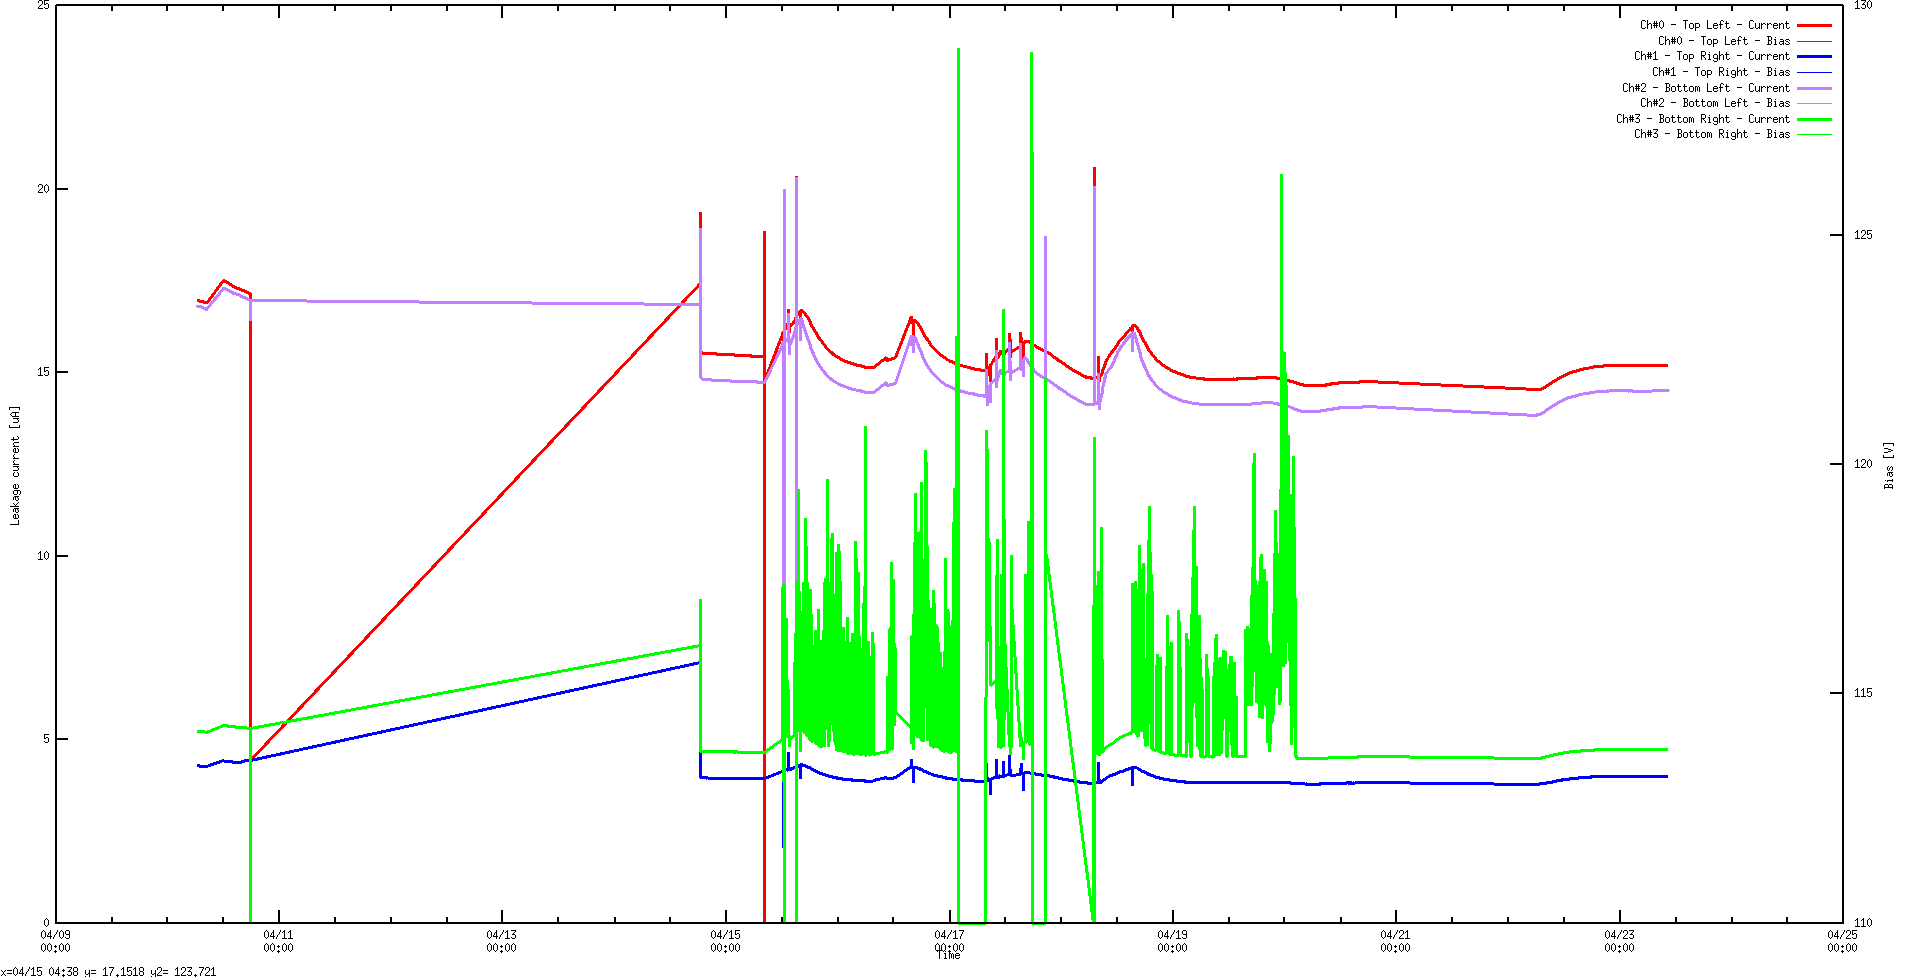
12.08 DSSSD bias & leakage current - attachments 1-2
       CAEN logger program crashed sometime this am - now restarted
       DSSSD #2 and DSSSD #4 OK - DSSSD #4 stable since c. 03:00 20.4.25
       DSSSD #1 and DSSSD #3 remain high
       All DSSSDS show effect of ambient temperature transient in CRYRING hall

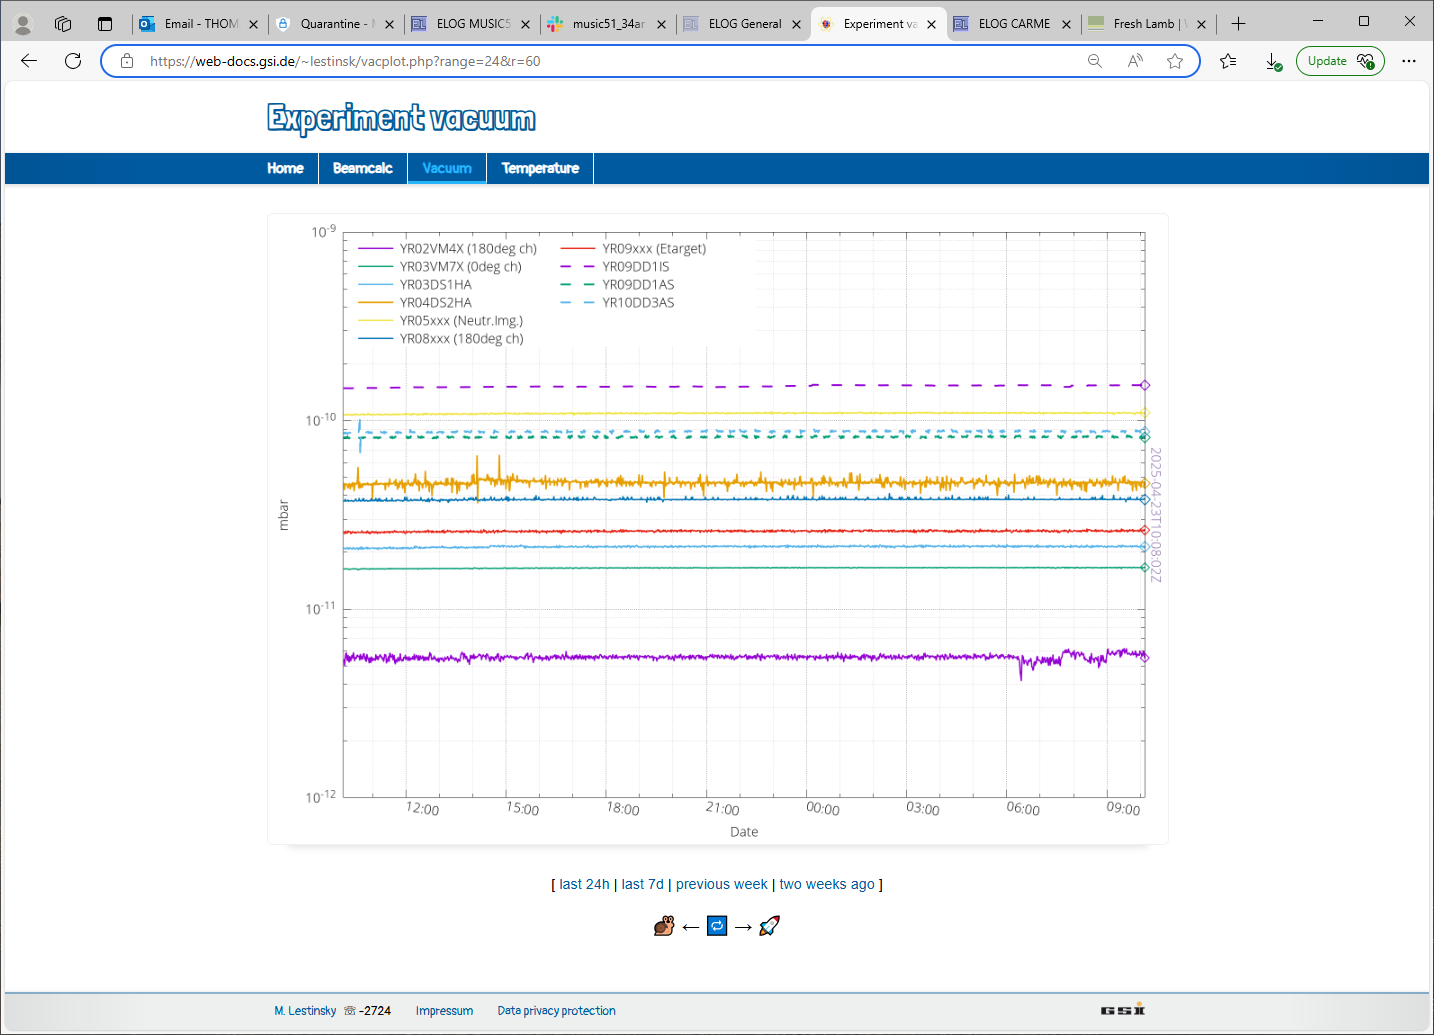
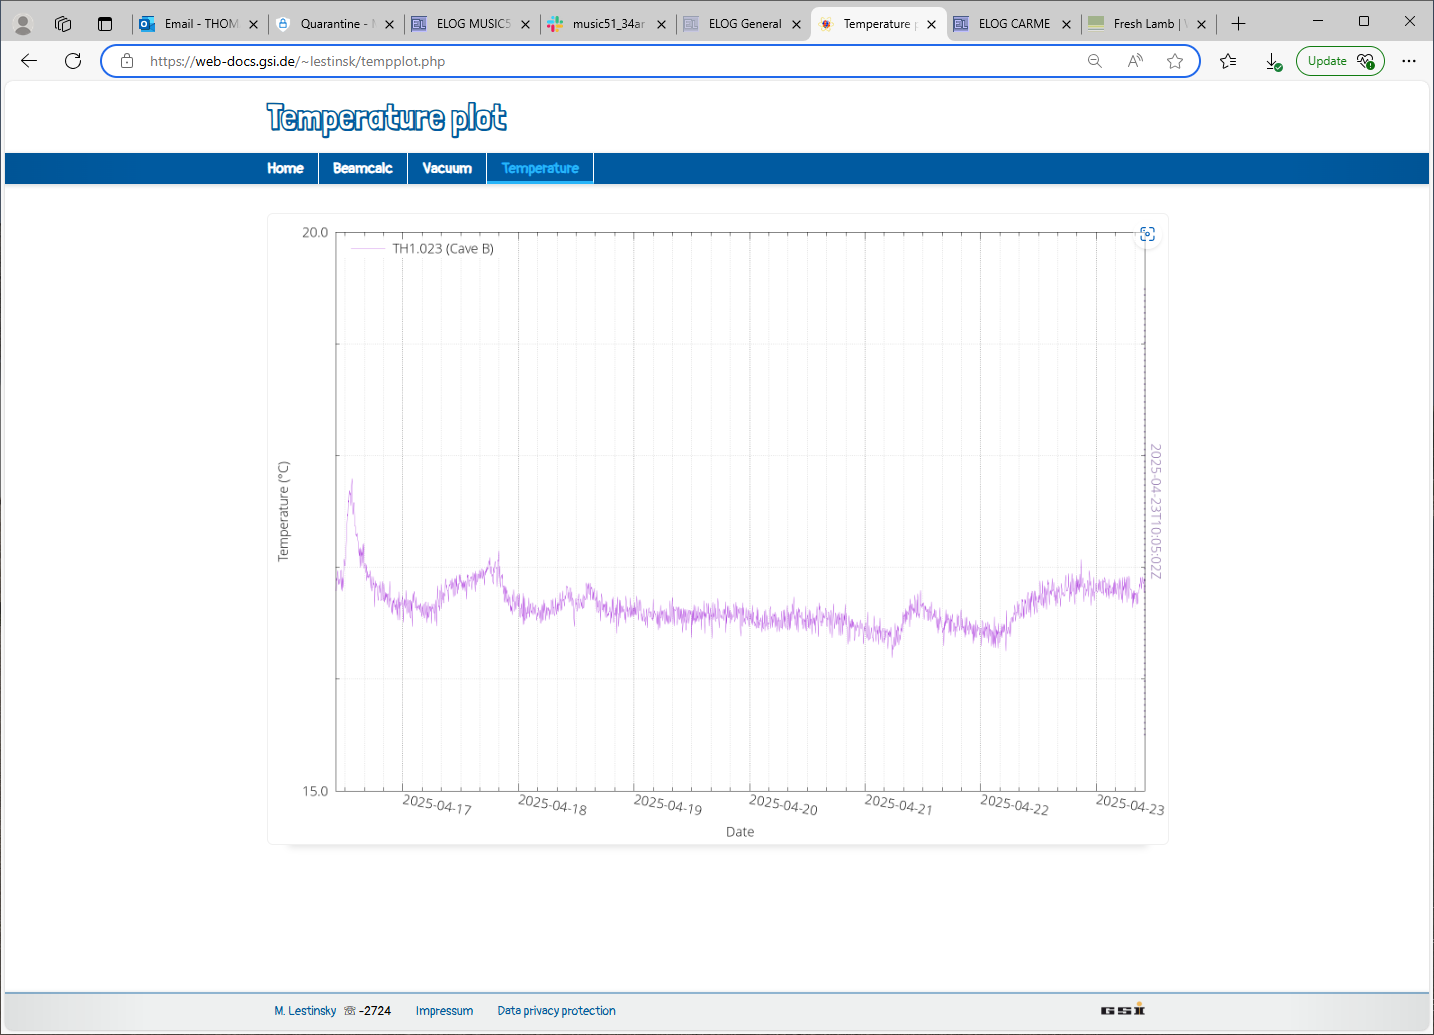
       CRYRING vacuum and temperature - attachments 3-4

14:40

FEEs started up. Background run started. Pulser running in the at 1HZ, amplitude is 9000.
Note aida03 and aida04 set to MEC due to high rate >100k. This resulted in data rates ~3MB/s. Slow comparator thresholds set to 0x64 (1 MeV)
System checks OK. AIDA16 and ADC calibration check clock status fails.
Run 10 started.
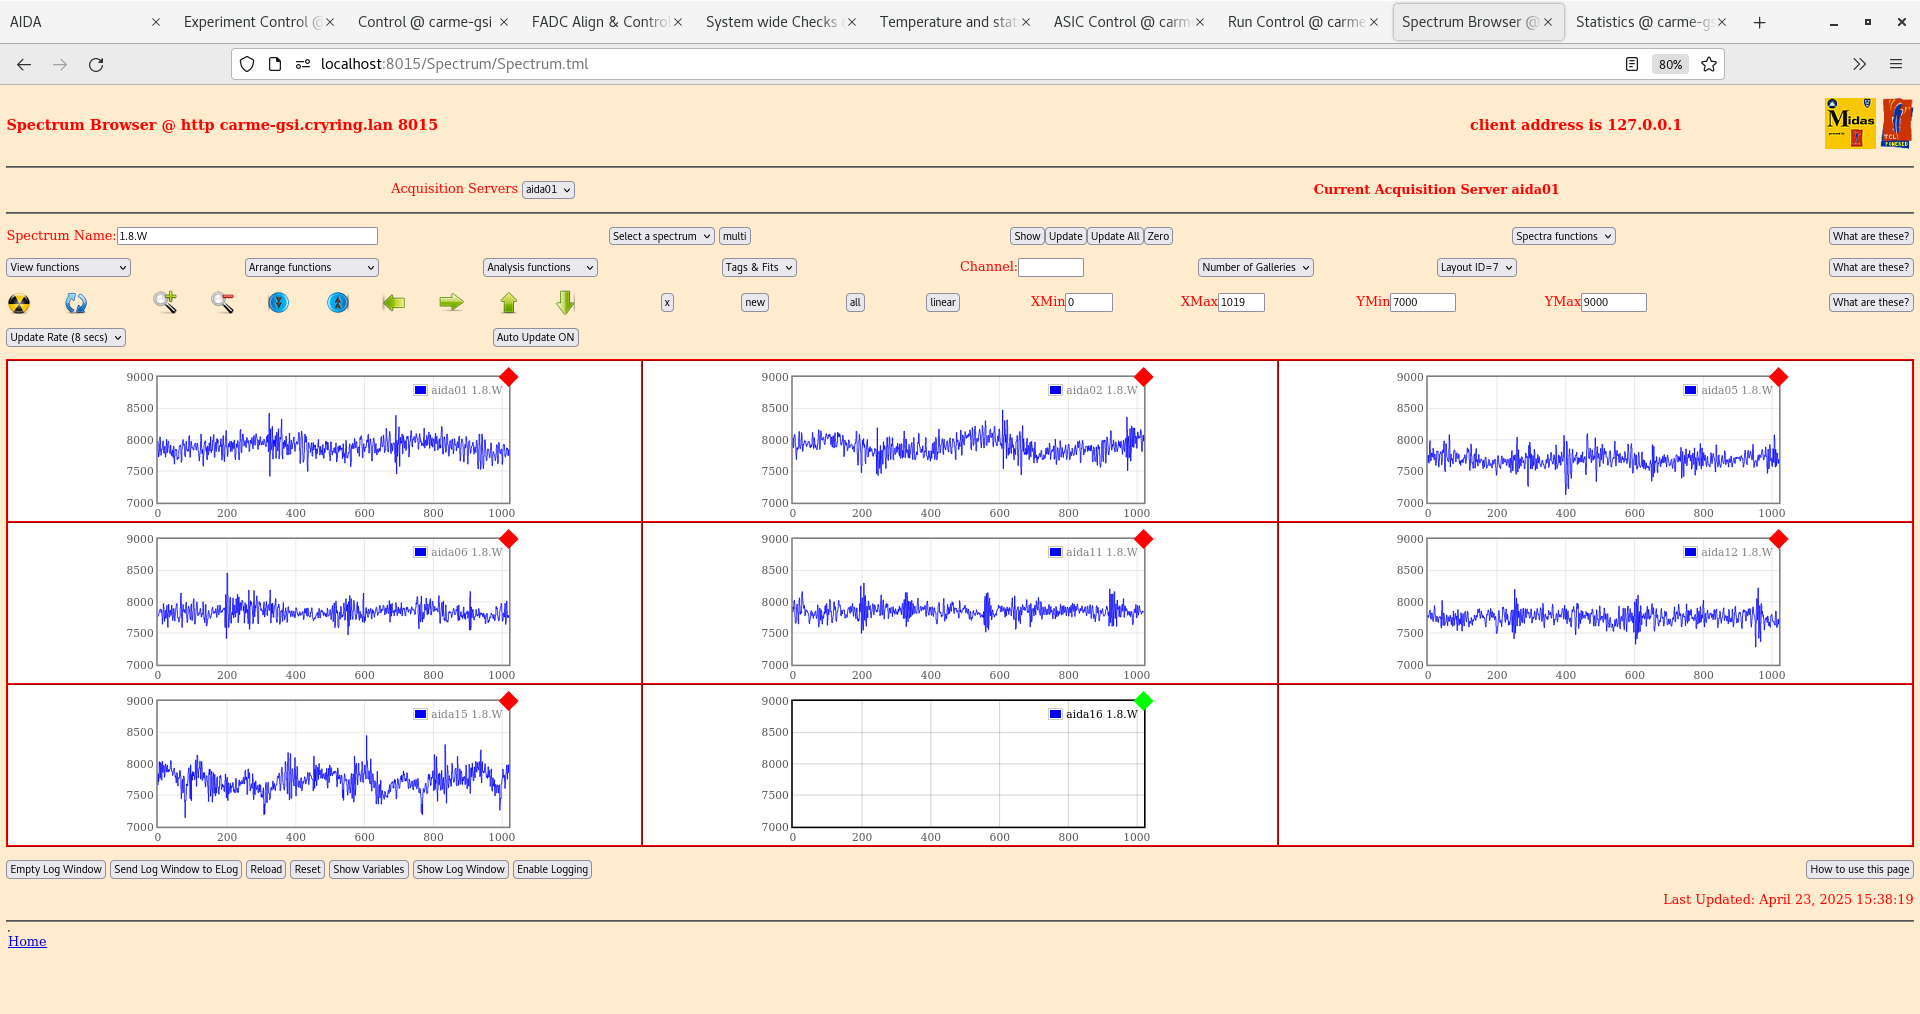
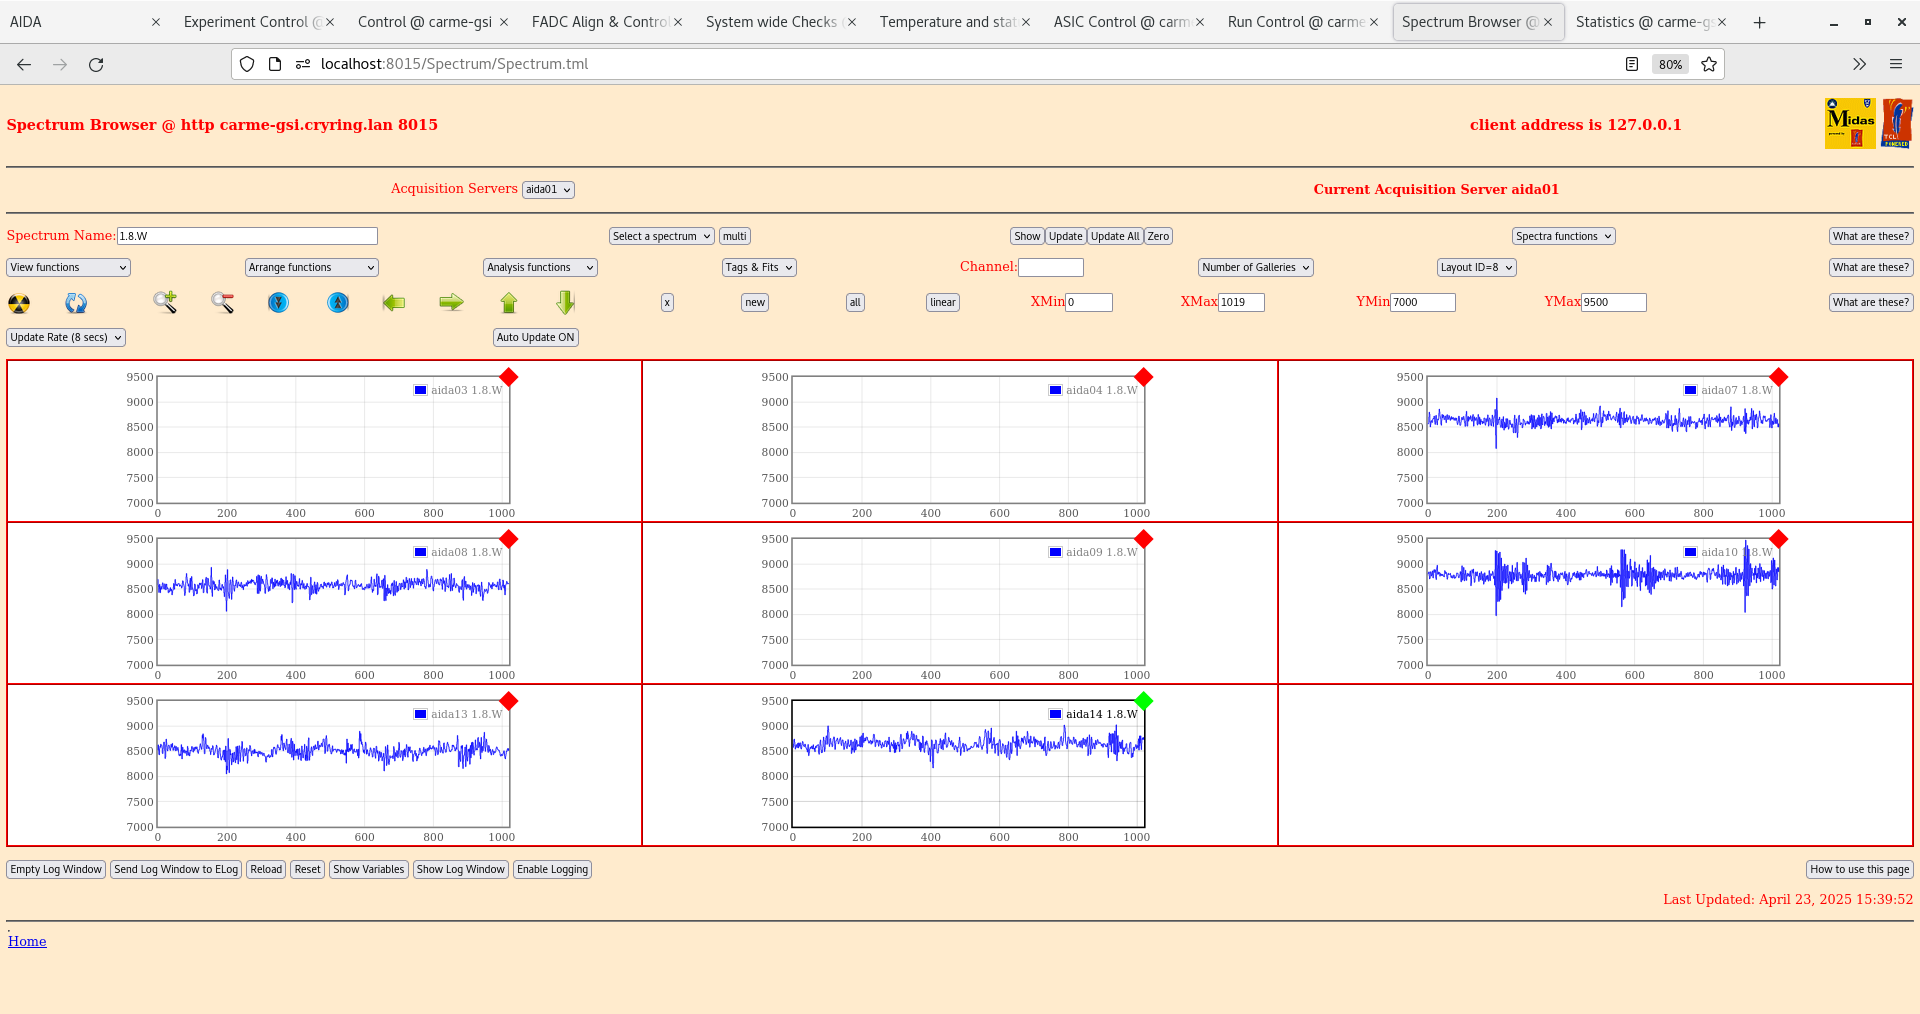
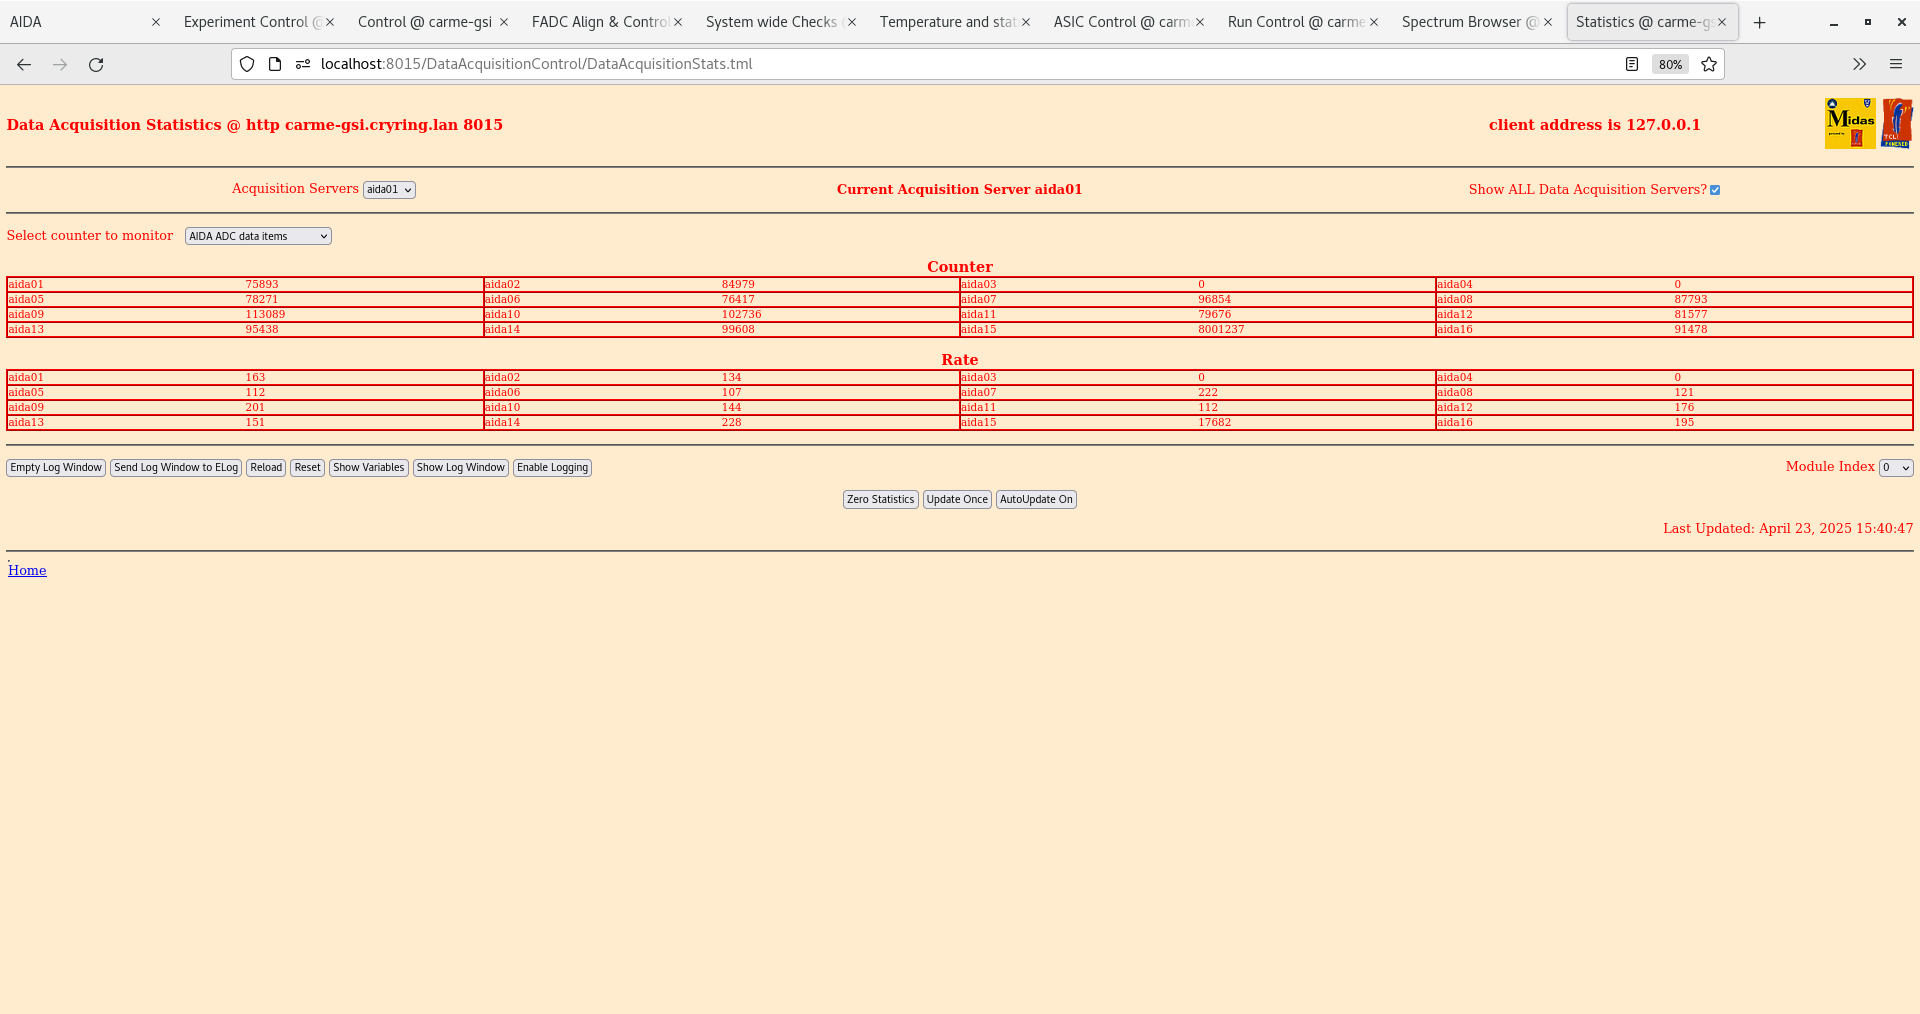
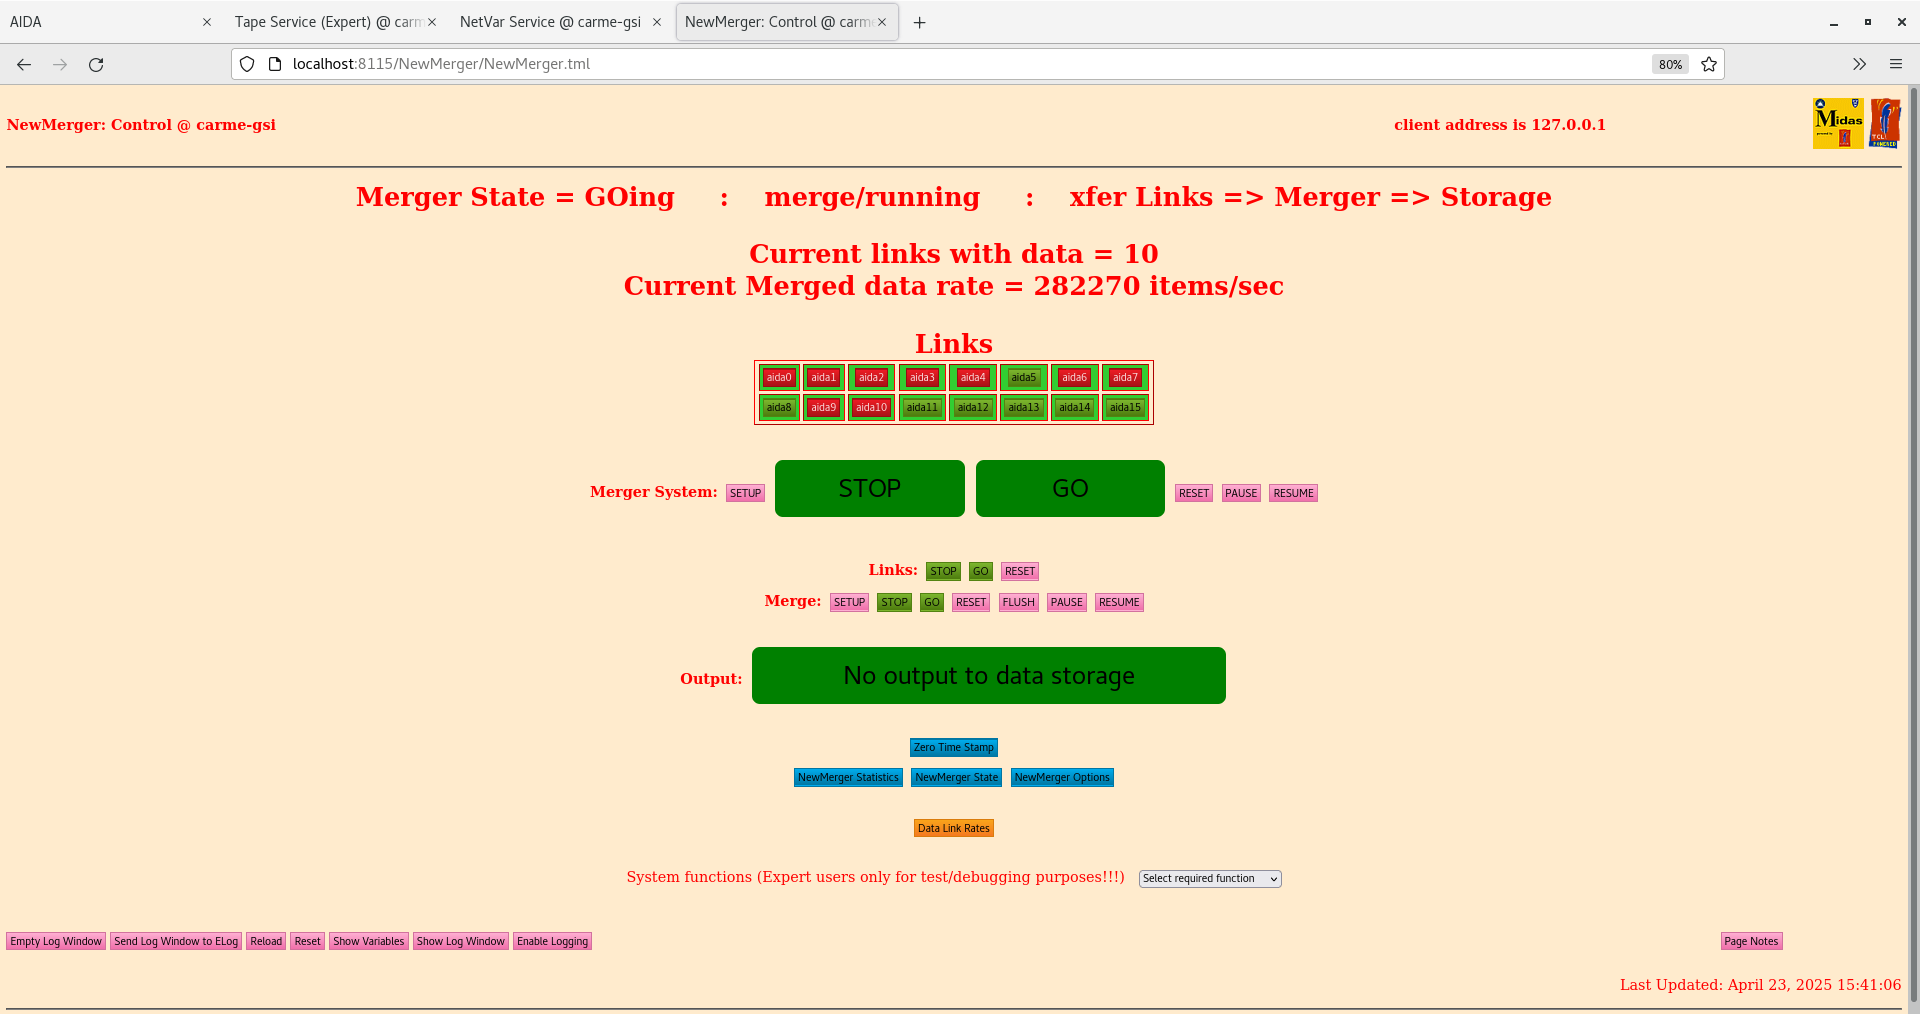
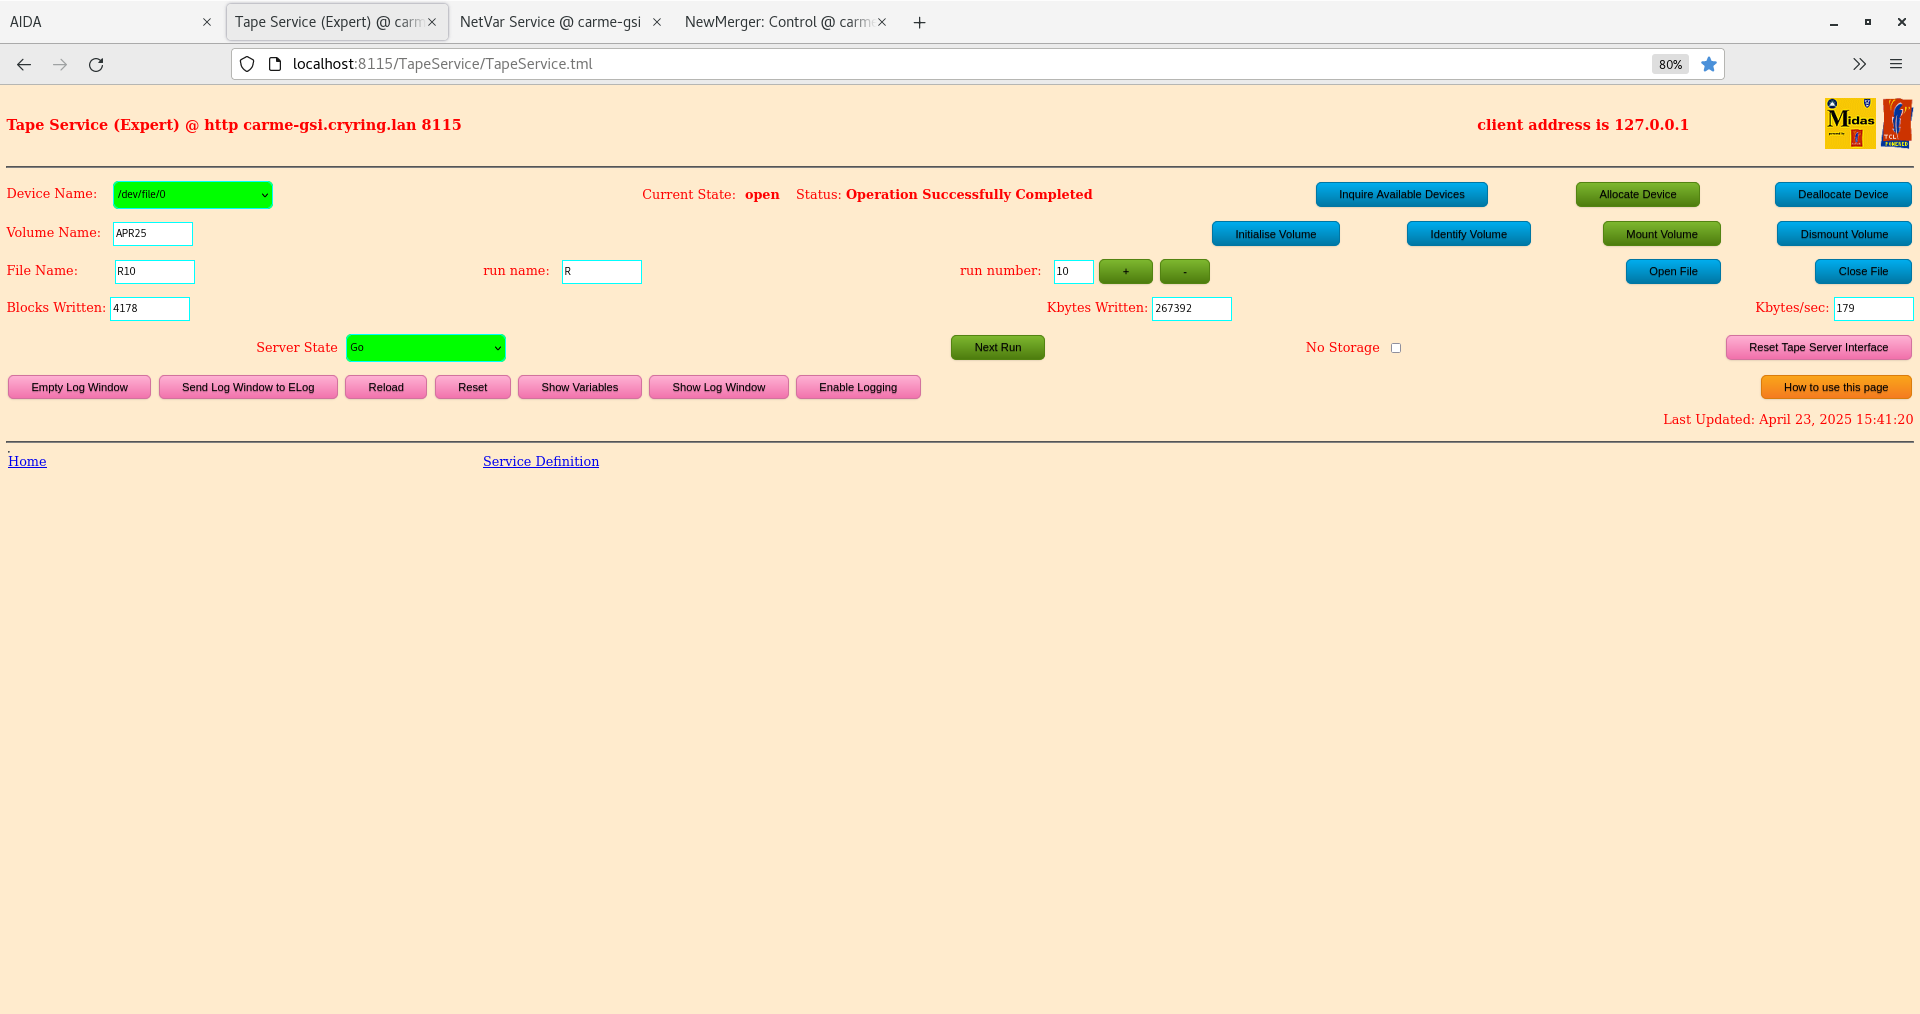
Attachments 5,6,7,8,9 from start of run. Waveforms, ADC data items statistics, New merger, Tape server respectively.
Will continue to monitor during the day until tonight when I will turn off the FEEs again.

Run stopped.
Noticed spike in leakage current for all detectors.
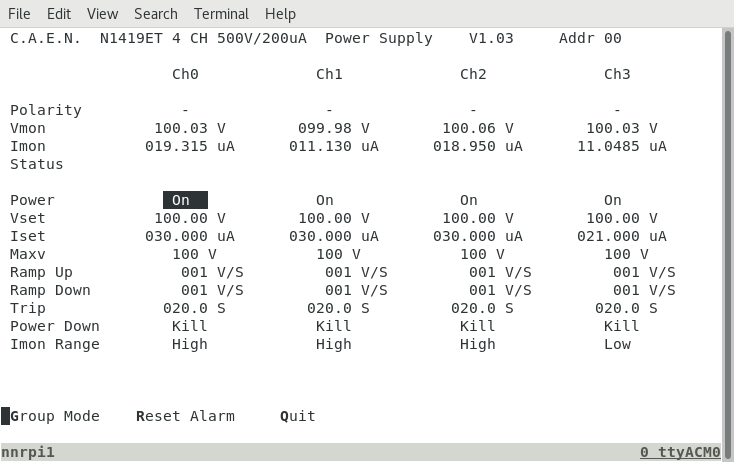
This coincides with change in vacuum around the ring. Some operation is ongoing, all FEEs off, detectors off.
See attachment 10 for leakage currents.

Vacuum gauge in section 9 is back on to allow for ring interlocks.

29/04/25

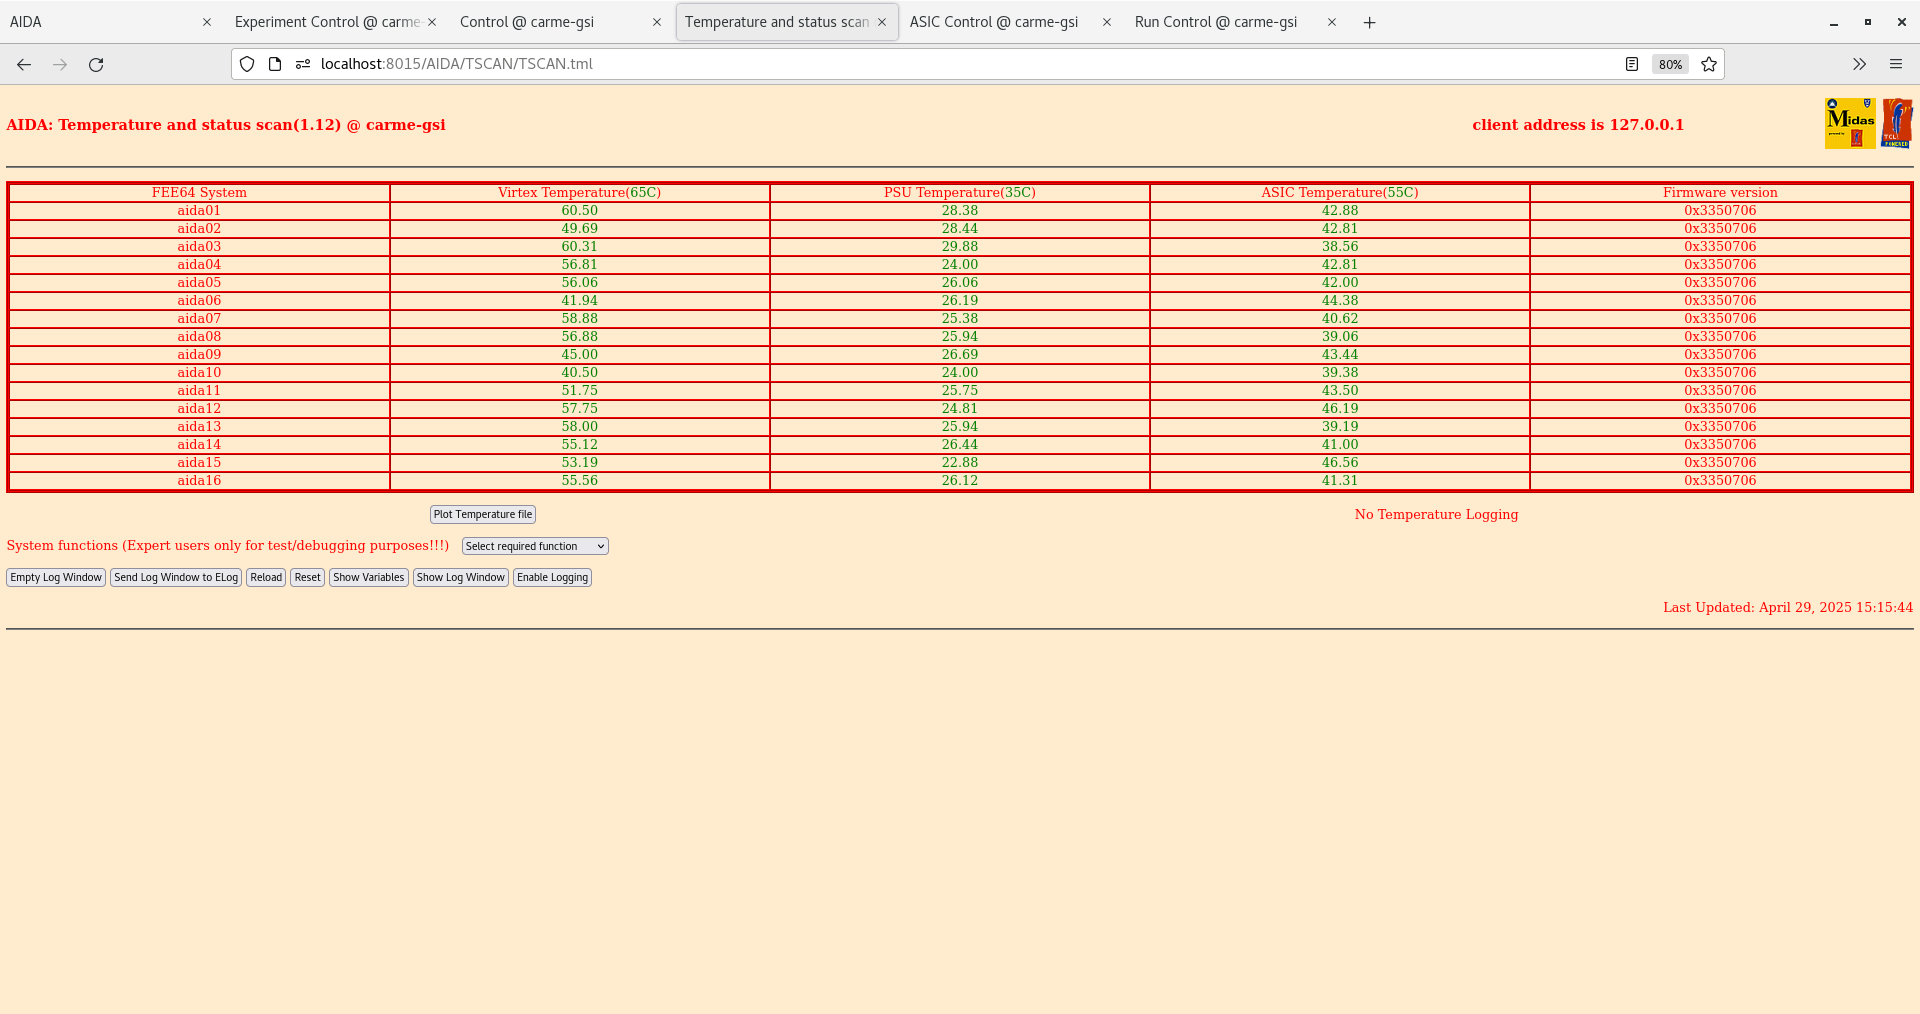
Turned the FEEs on to check if aida08 is still connected to the coolant loop. Temperatures in normal range after startup. FEEs turned back off for now. |
| Attachment 1: Screenshot_from_2025-04-23_12-07-52.png
|
|
| Attachment 2: Screenshot_from_2025-04-23_12-08-10.png
|
|
| Attachment 3: 1.png
|
|
| Attachment 4: 0.PNG
|
|
| Attachment 5: Screenshot_from_2025-04-23_15-38-33.png
|
|
| Attachment 6: Screenshot_from_2025-04-23_15-40-30.png
|
|
| Attachment 7: Screenshot_from_2025-04-23_15-40-54.png
|
|
| Attachment 8: Screenshot_from_2025-04-23_15-41-13.png
|
|
| Attachment 9: Screenshot_from_2025-04-23_15-41-26.png
|
|
| Attachment 10: Screenshot_from_2025-04-23_16-07-43.png
|
|
| Attachment 11: Screenshot_from_2025-04-29_15-15-52.png
|
|
|
|
679
|
Tue Apr 22 06:44:02 2025 |
TD | Tuesday 22 April |
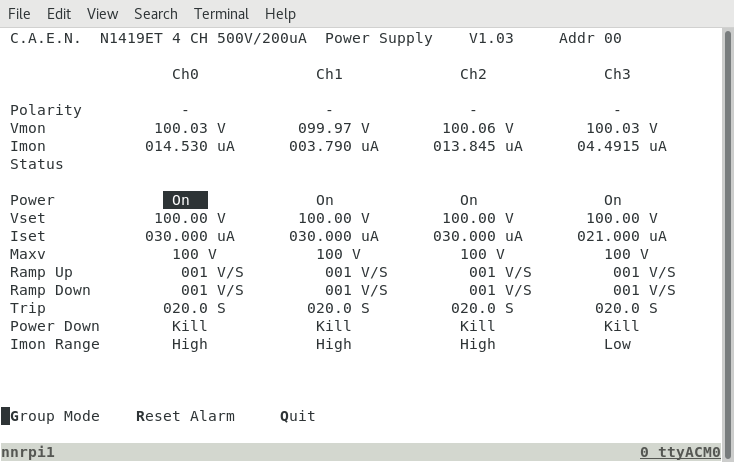
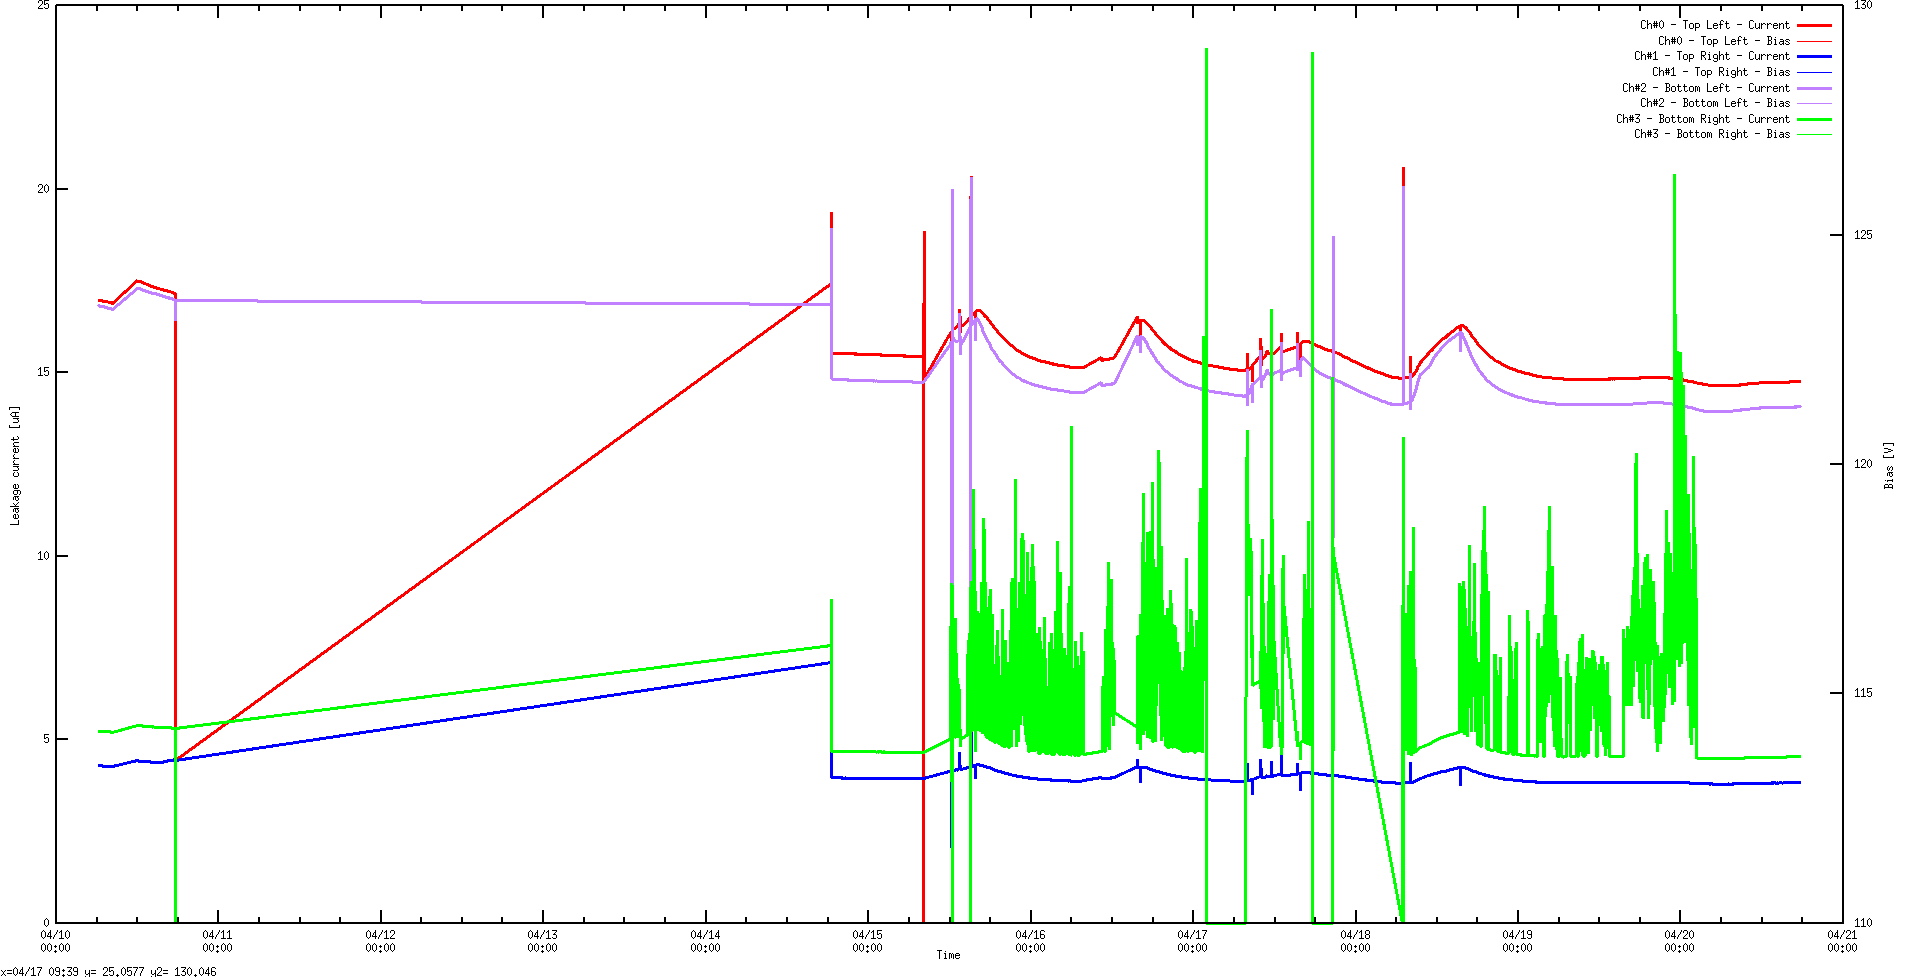
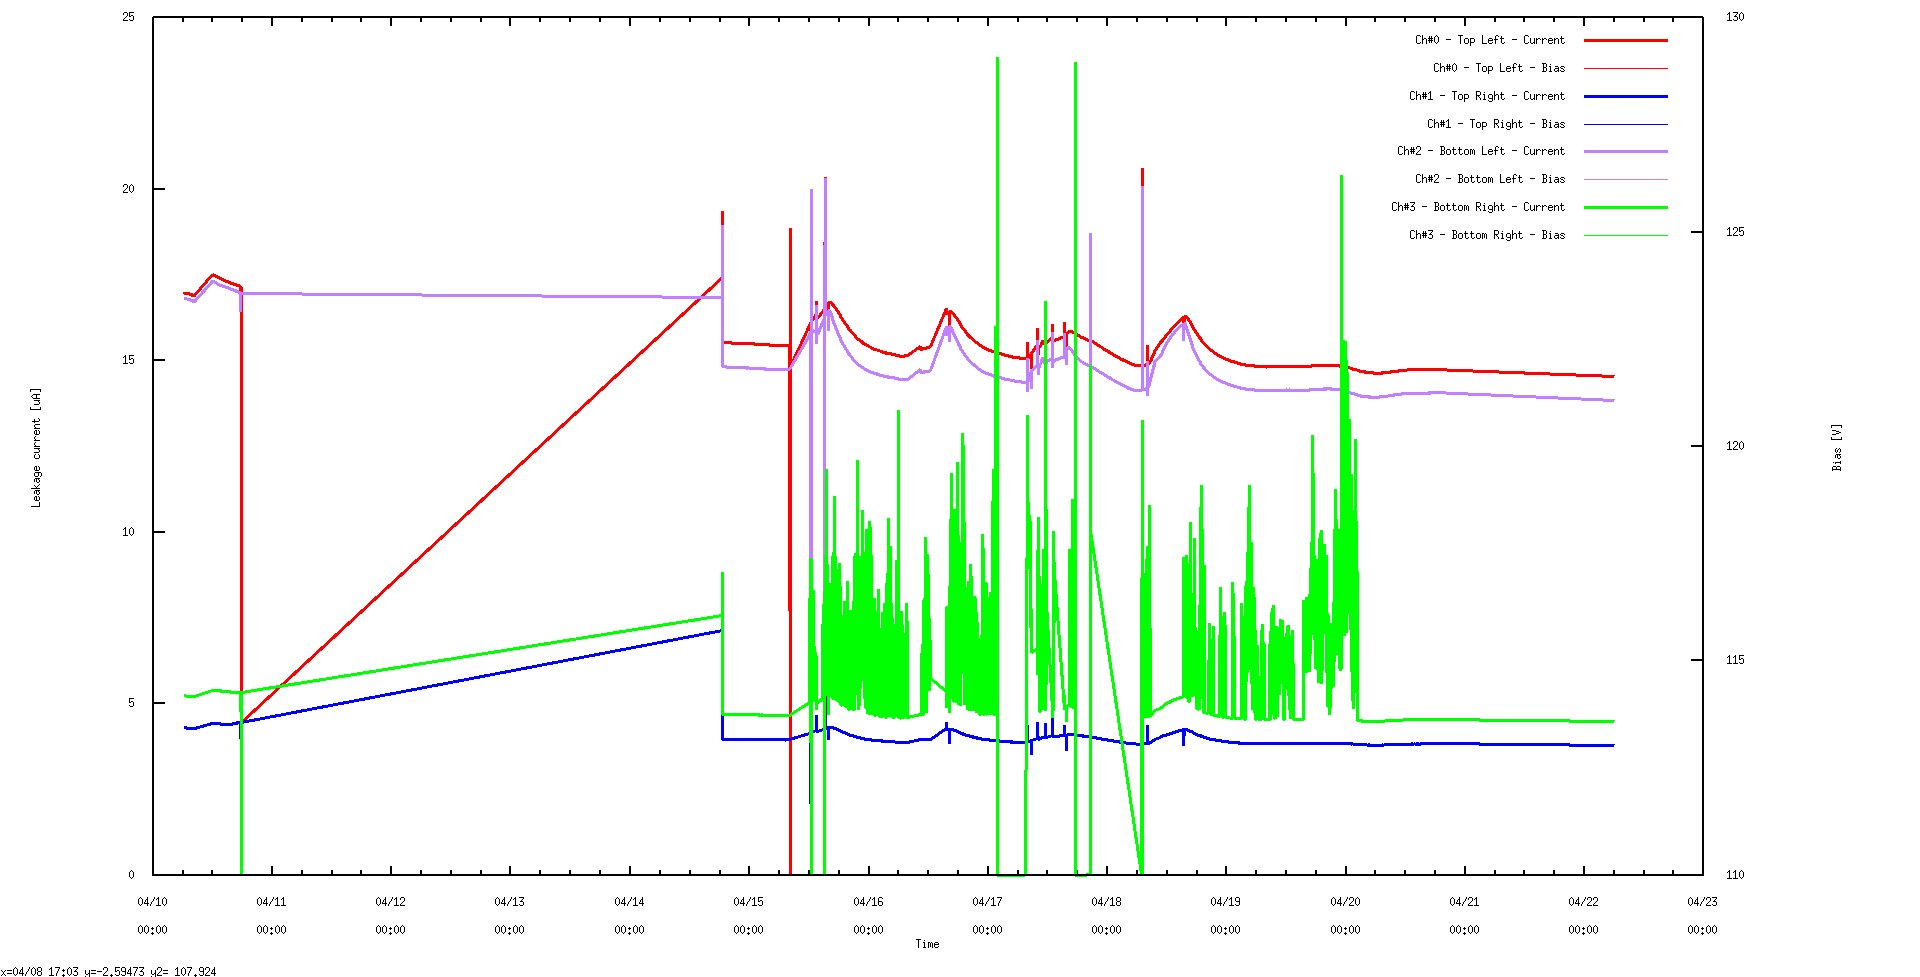
07.40 DSSSD bias & leakage current - attachments 1-3
       CAEN logger program crashed c. 18.00 April 20 - now restarted
       DSSSD #2 and DSSSD #4 OK - DSSSD #4 stable since c. 03:00 20.4.25
       DSSSD #1 and DSSSD #3 remain high with slow decrease (ambient temperature approx stable c. 16.5 deg C)

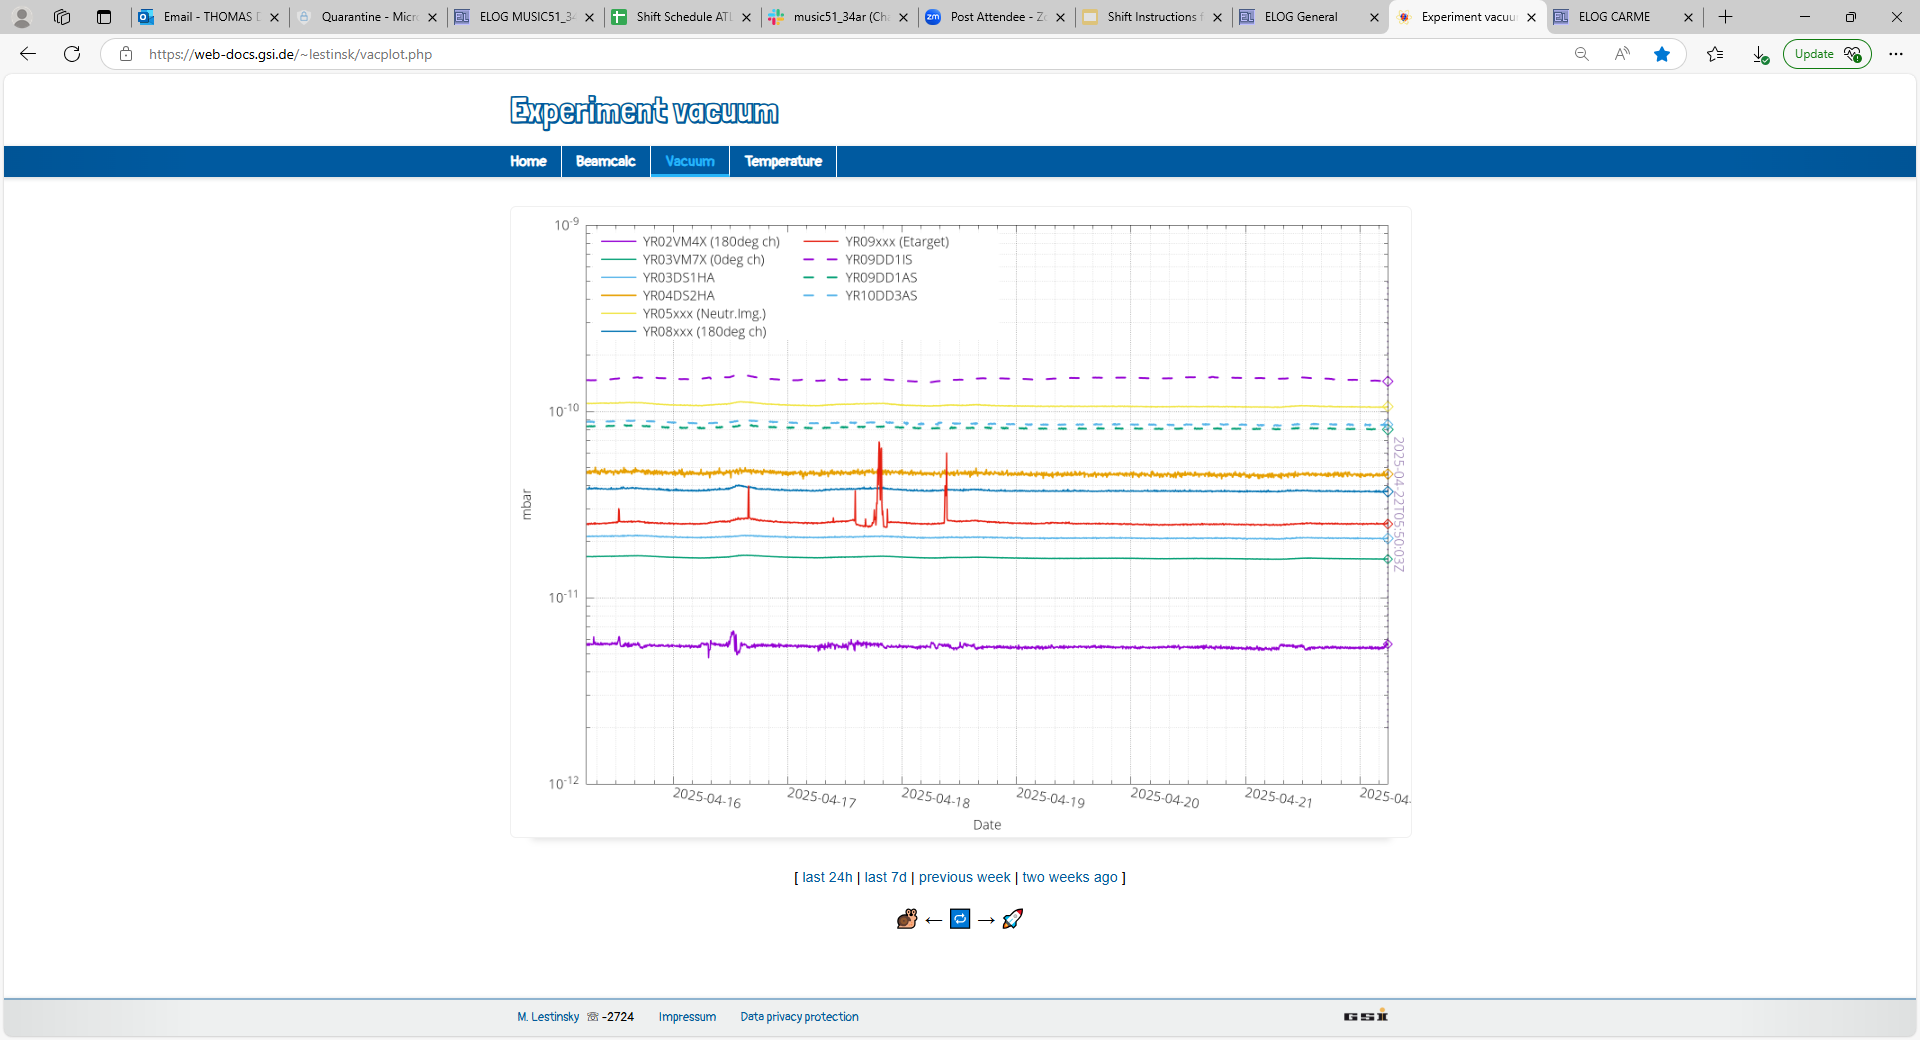
CRYRING vacuum and temperature - attachments 4-5 |
| Attachment 1: Screenshot_from_2025-04-22_07-40-45.png
|
|
| Attachment 2: Screenshot_from_2025-04-22_07-41-10.png
|
|
| Attachment 3: Screenshot_from_2025-04-22_07-47-25.png
|
|
| Attachment 4: 1.png
|

|
| Attachment 5: 2.png
|
|
|
|
678
|
Sun Apr 20 07:30:29 2025 |
CB | DSSD leakage currents over Easter |
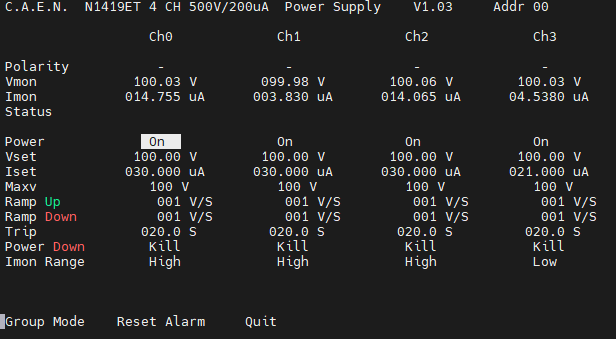
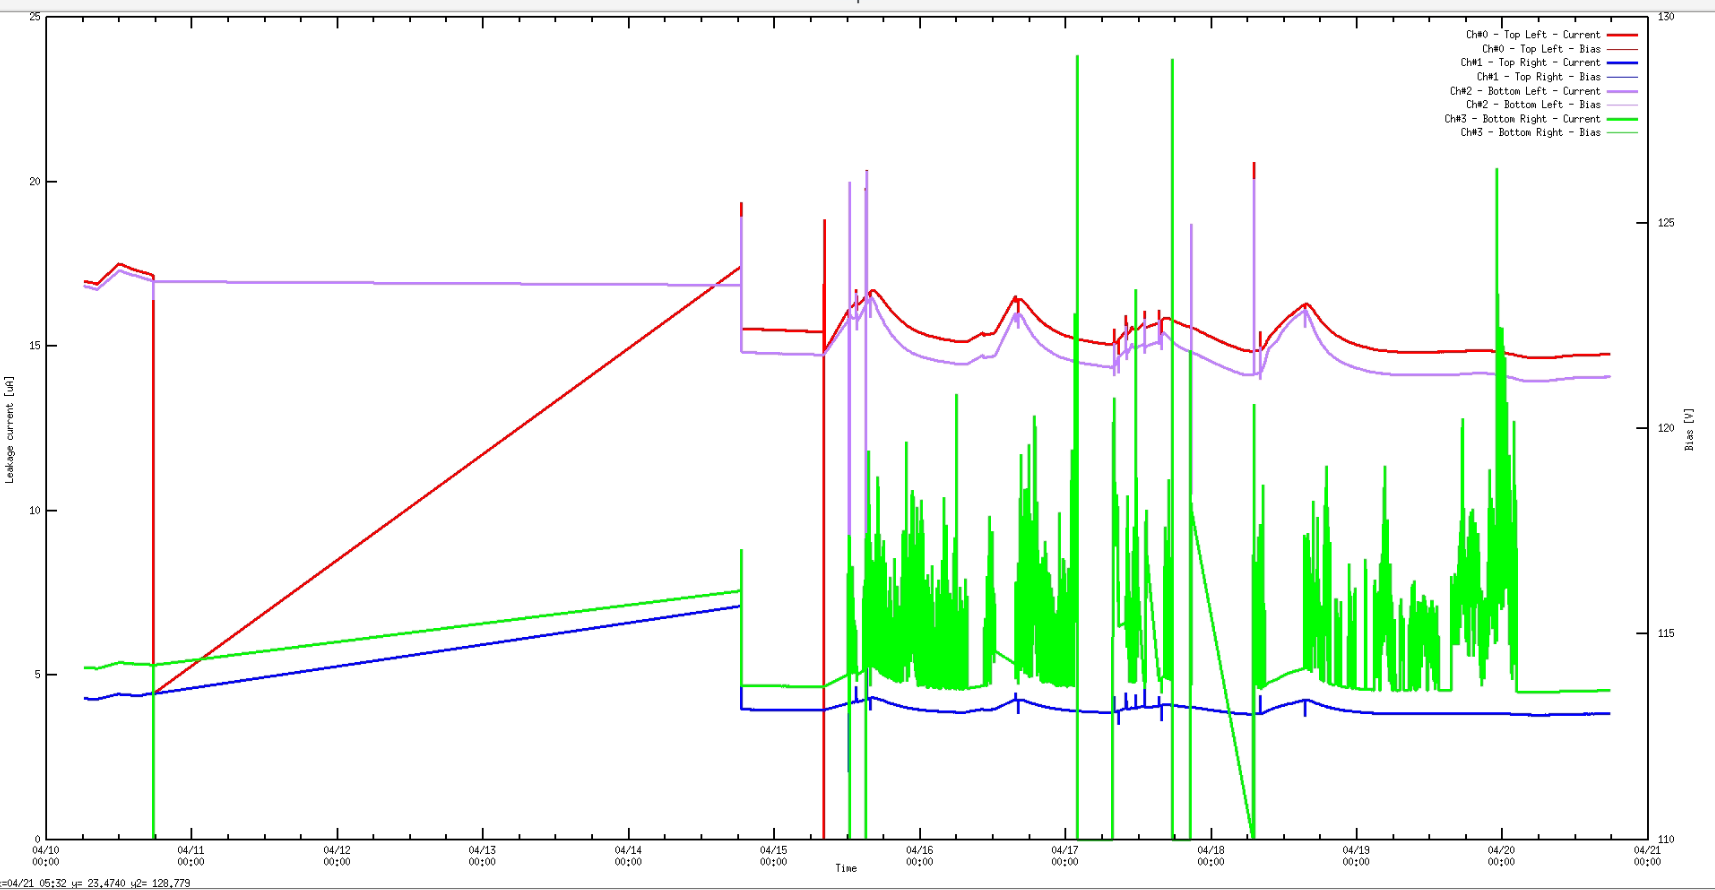
Just after midnight on 20/04 it appears DSSD #4 leakage current has perfectly stabilised. See attached.
DSSDs remain biased.
20 April
19:30 - leakage current still stable but anydesk connection not working.
Machine is connected, but connection fails.
21 April
Anydesk connection works again. Leakage current remains stable. What changed? |
| Attachment 1: Screenshot_2025-04-20_083007.png
|

|
| Attachment 2: Screenshot_2025-04-20_193226.png
|
|
| Attachment 3: Screenshot_2025-04-21_085130.png
|
|
|
|
677
|
Fri Apr 18 16:18:33 2025 |
JM | D+D BBN energies test |
D+D minimum energy Ecm = 150 keV which corresponds to Ed=150 keV/u or Ed=300 keV. Therefore we need a threshold below this.
Test 1 - Current status
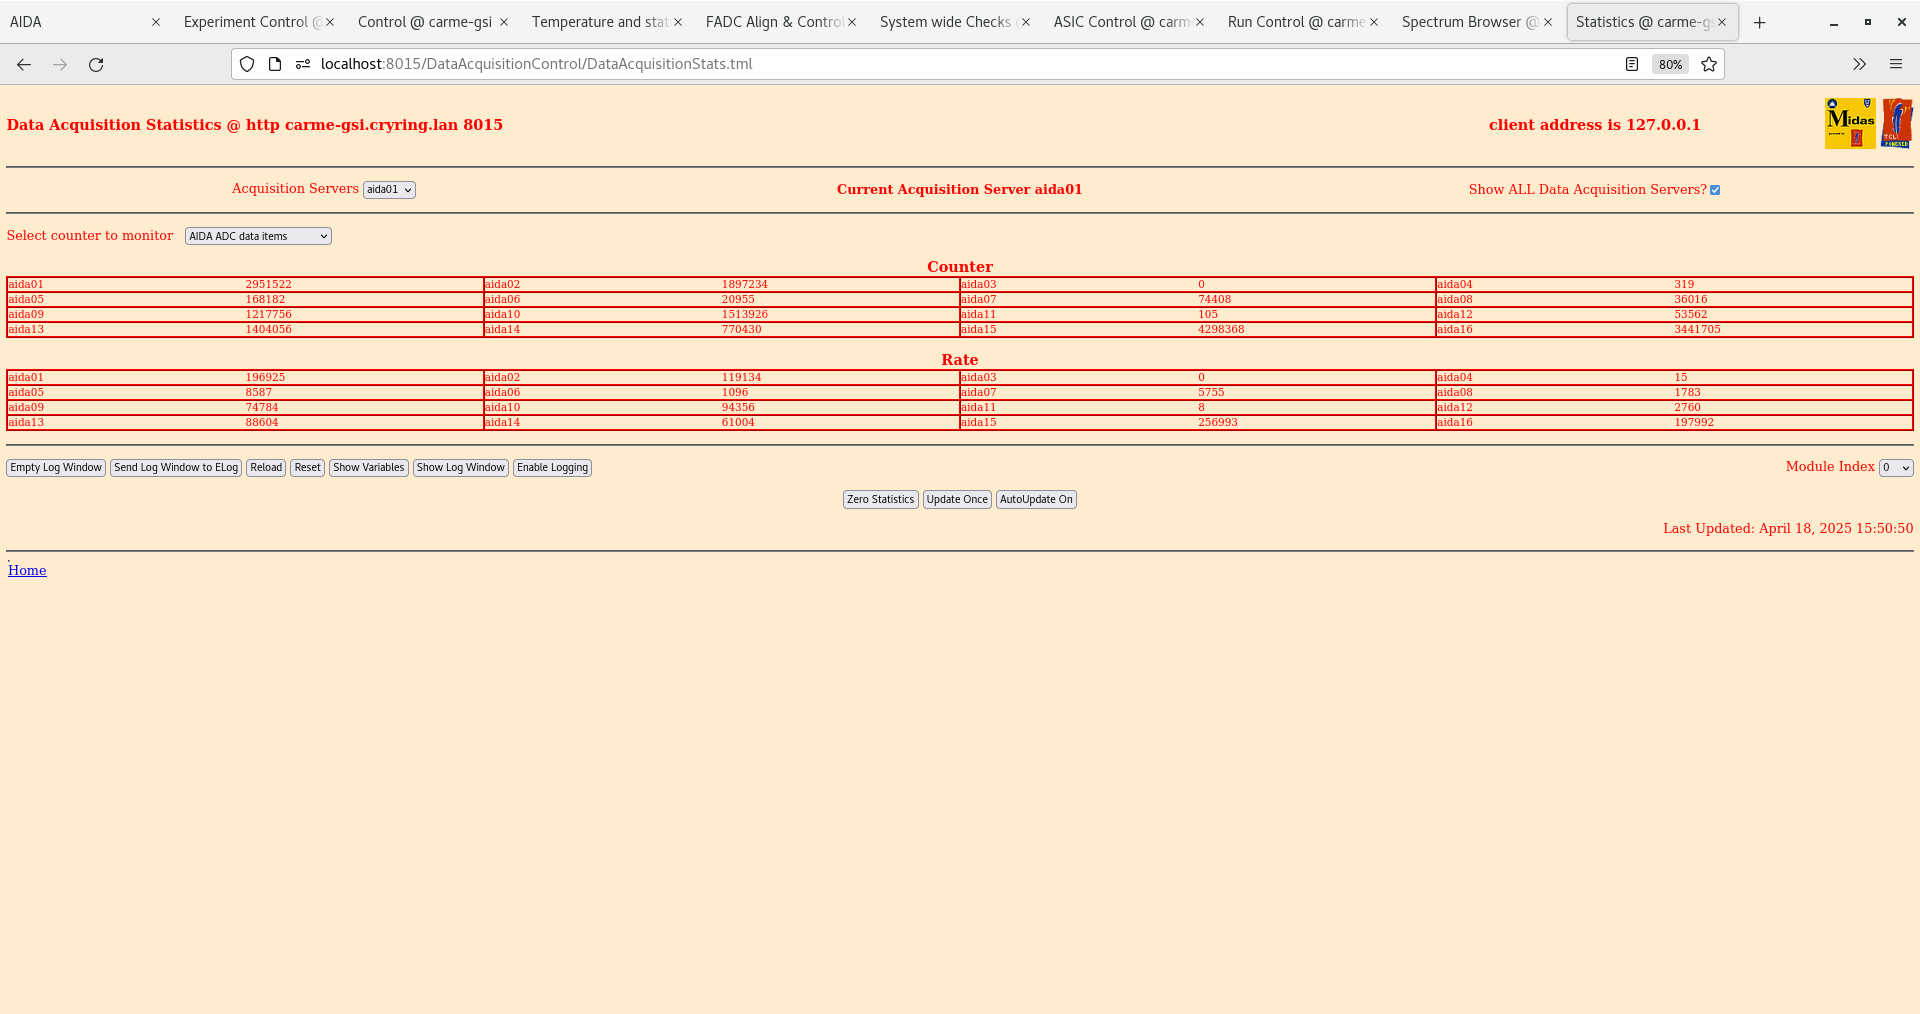
Current slow comparator threshold is 0x64 (1 MeV). ADC data items rate in all FEEs is essentially zero with this threshold. (except aida03 and aida04). Aida15 and 16 also show ~1k rates when DSSD4 current is fluctuating.
Pulser was set to find point it is cut off by the threshold. Attachments 1,2,3 show 1.8L for nn channels with the pulser set to 570,550 and 530. Over this range pulser disappears. Estimate 550 is equal to ~1 MeV.
Test 2 - Noise level at lower threshold 200 keV
Threshold set to 0x14 (200 keV). Pulser kept at 550 for the time being to gauge location of noise compared to pulser. Attachments 4,5 show 1.8L for nn and pn channels respectively. Some noise observable at low energy.
Note zero energy is around 32500 channels. In nn channels (attachment 4) pulser is to the right of the noise peak, wheras in pn channels (attachment 5) pulser is to the left of noise peak.
Attachment 6 shows data rates with pulser off. Rates okay, only aida15 has very high rate (80k), rest of channels <5k.
Test 3 - Noise level at lower threshold 100 keV
Threshold set to 0xa (100 keV). Pulser kept at 550 for the time being. Attachment 7 shows data rates with pulser off. Rates significantly higher all round. Half of channels >50k, some >100k.
Attachments 8,9 show 1.8L for pn and nn channels respectively. A lot more noise observable at low energy. Pulser peaks generally overshadowed by noise. 100 keV probably too low to set threshold.
Test 4 - Noise level at lower threshold 150 keV
Threshold set to 0xf (150 keV). Pulser kept at 550 for the time being. Attachment 10 shows data rates with pulser off. In general rates are pretty low. Most channels <1k. Aida15 and 16 pretty high.
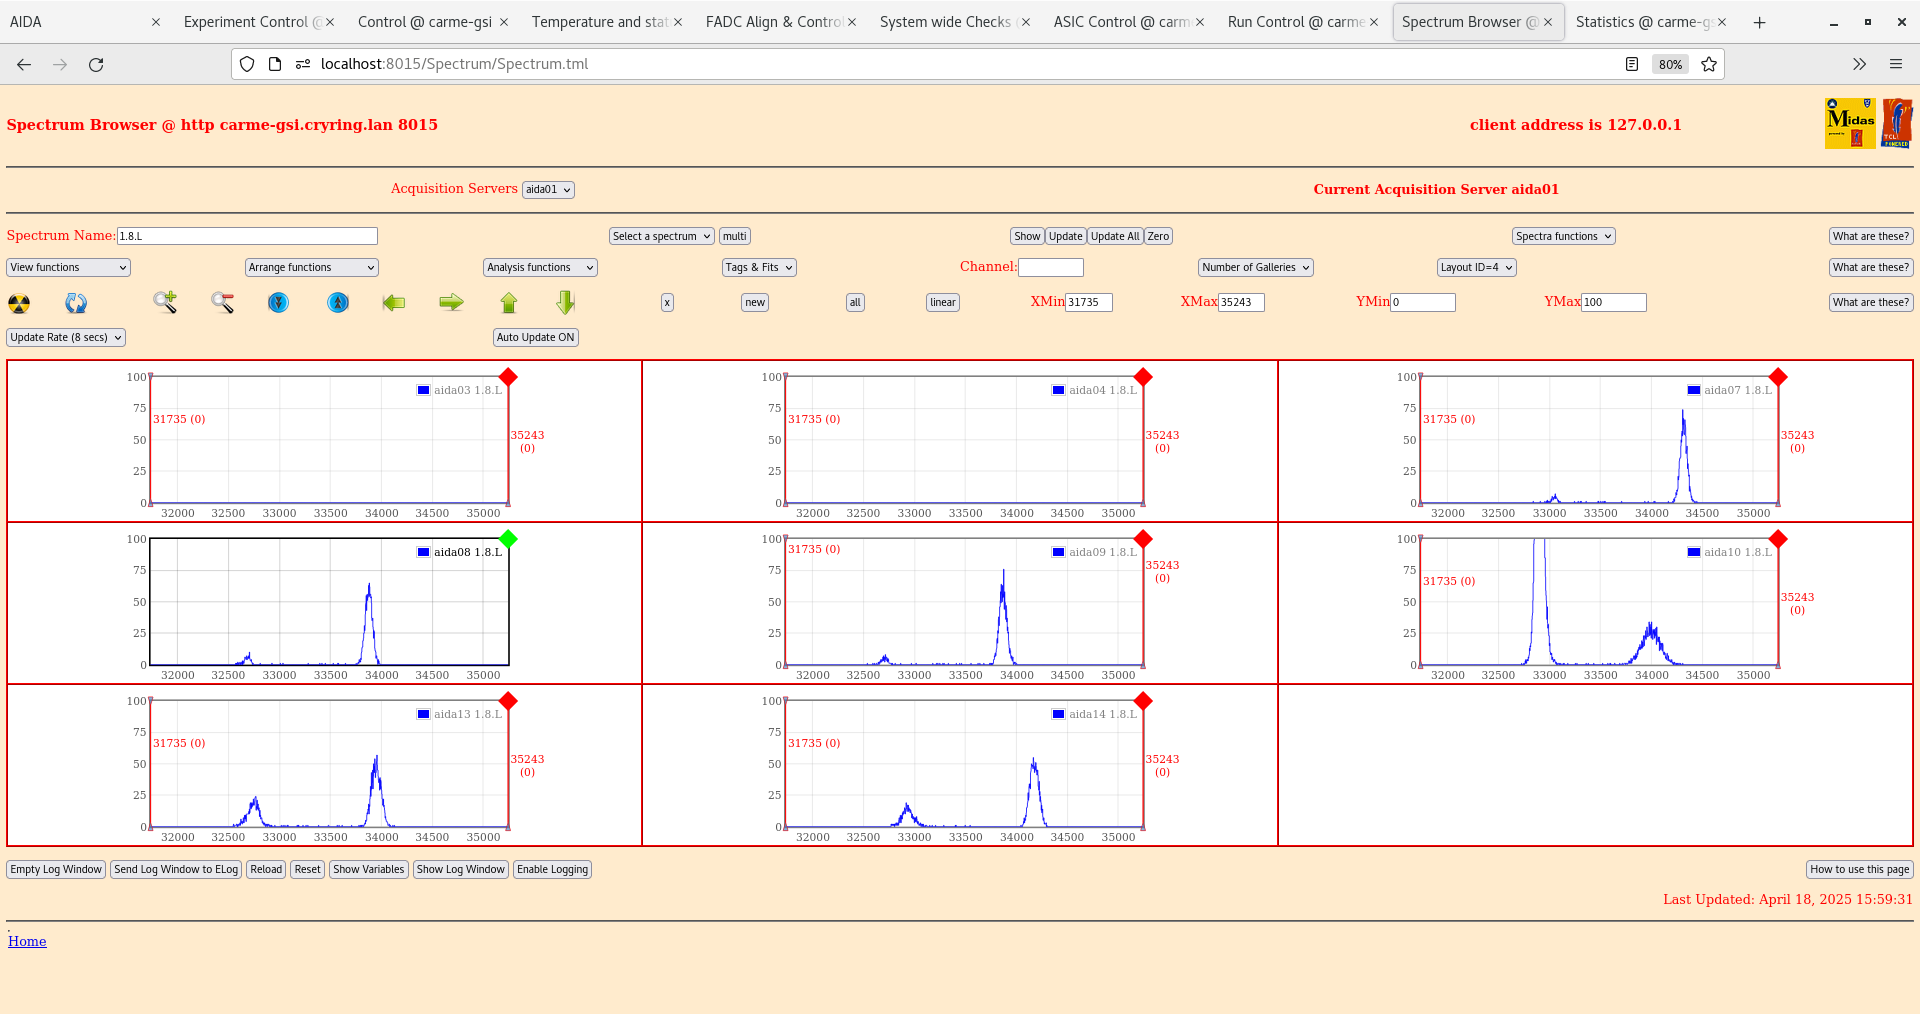
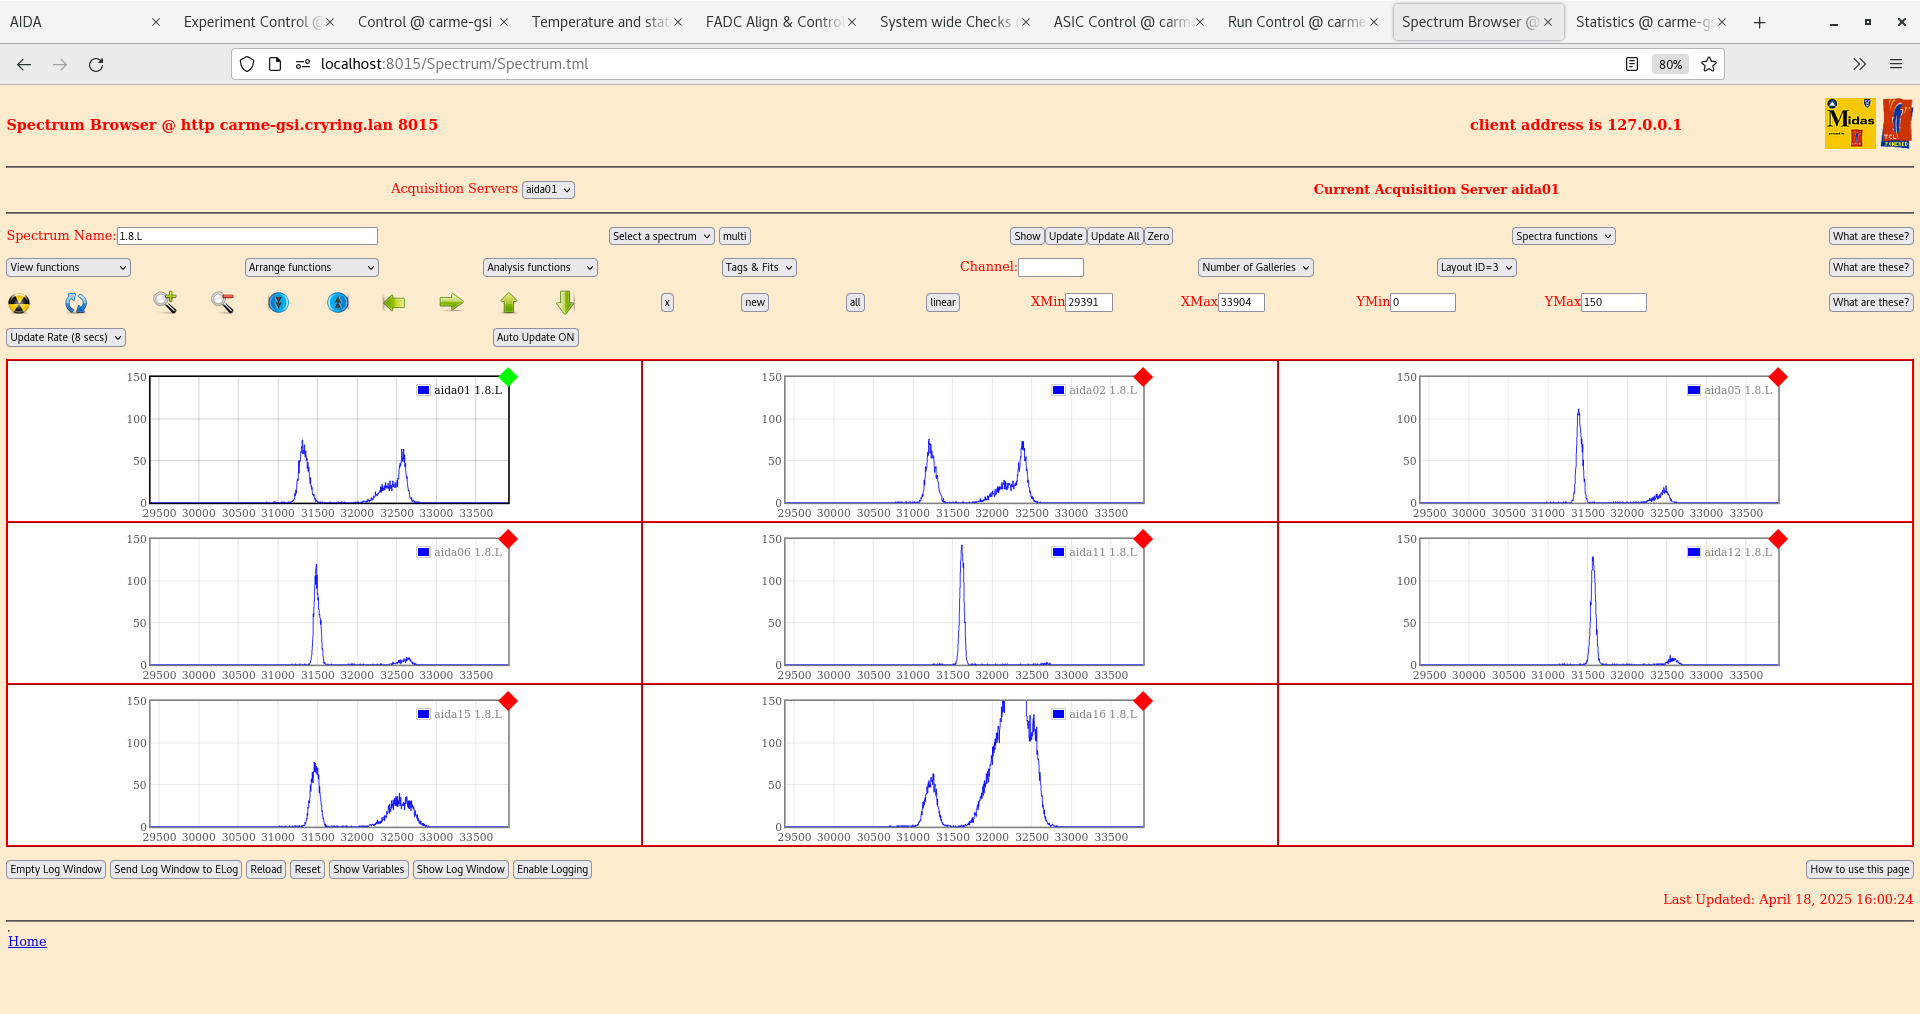
Attachments 11,12 show 1.8L for nn and pn channels respectively. Noise observable at low energy but in general less than that of the pulser peaks.
Test 5 - D+D pulser peak at lower threshold 150 keV
Theshold kept at 0xf (150 keV). Pulser set to 180 (should be about 300 keV based on Test 1). This should be the level of d+d at our lowest beam energy.
Attachments 13,14 show 1.8L for pn and nn channels respectively.
Test 6 - D+D pulser peak at lower threshold 200 keV
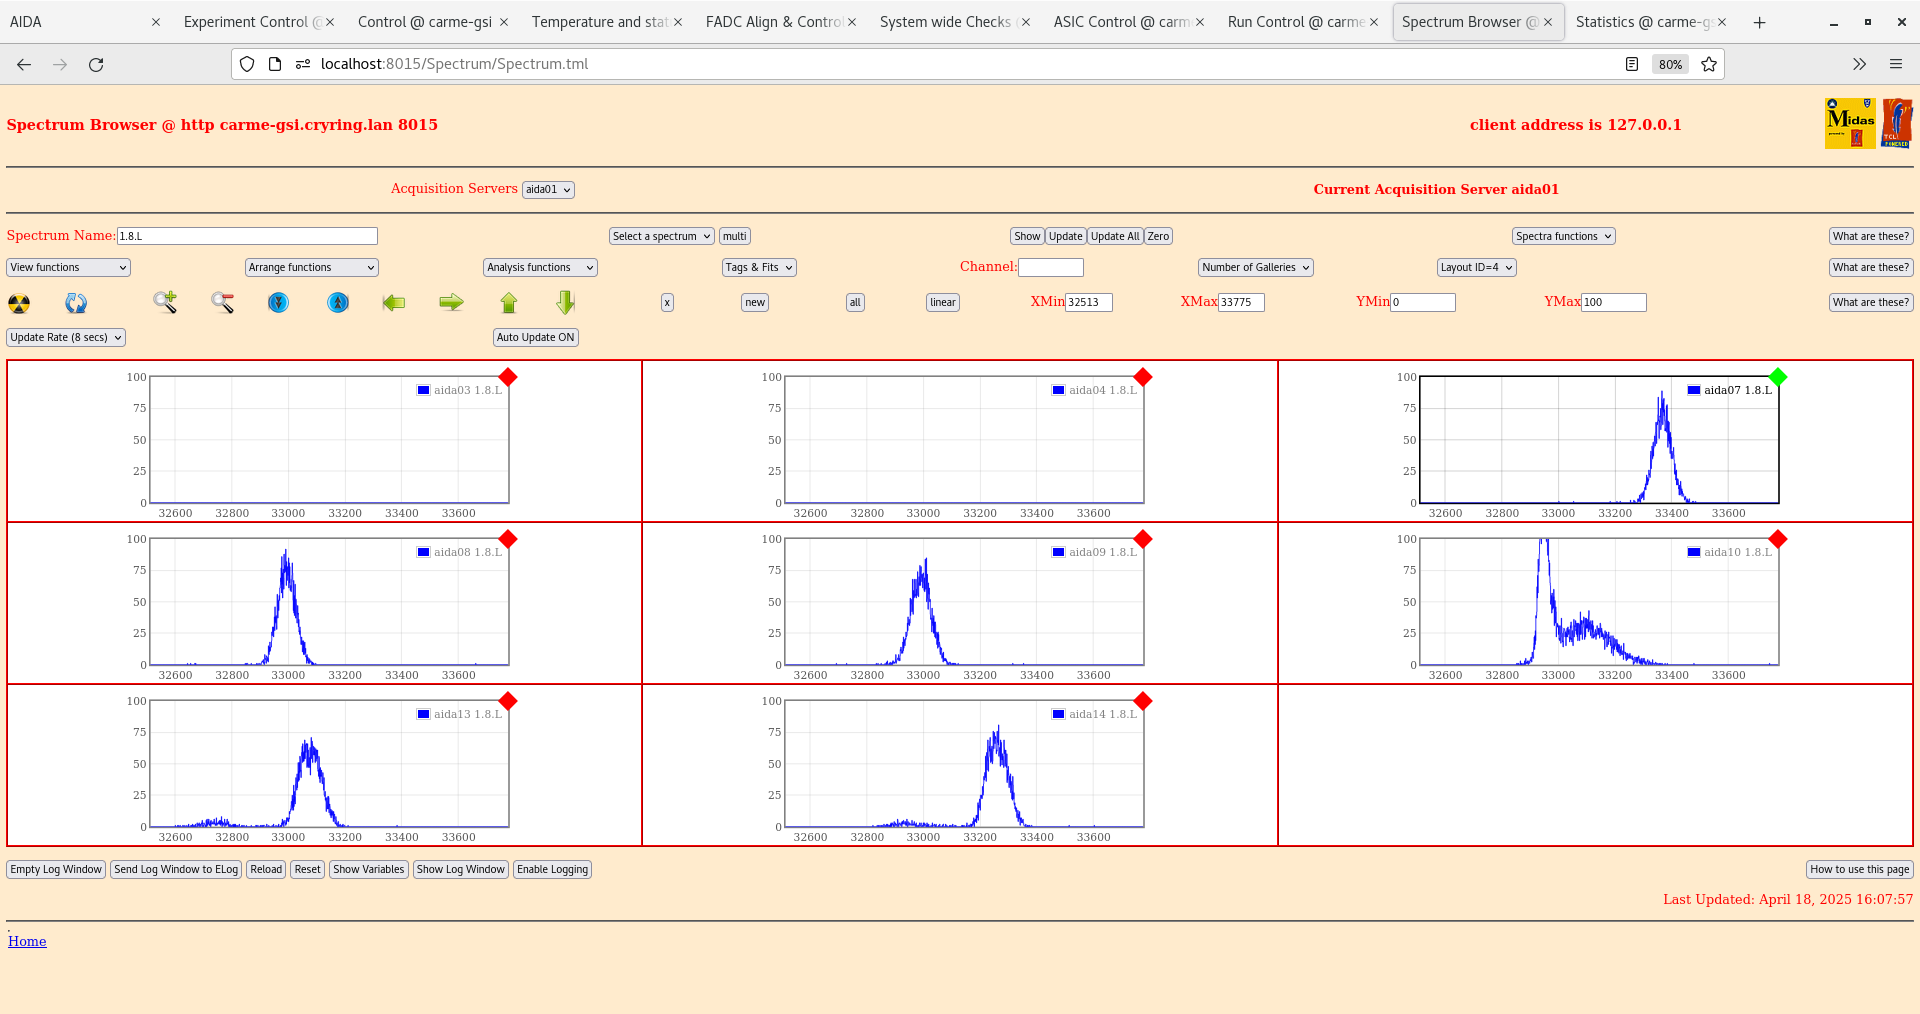
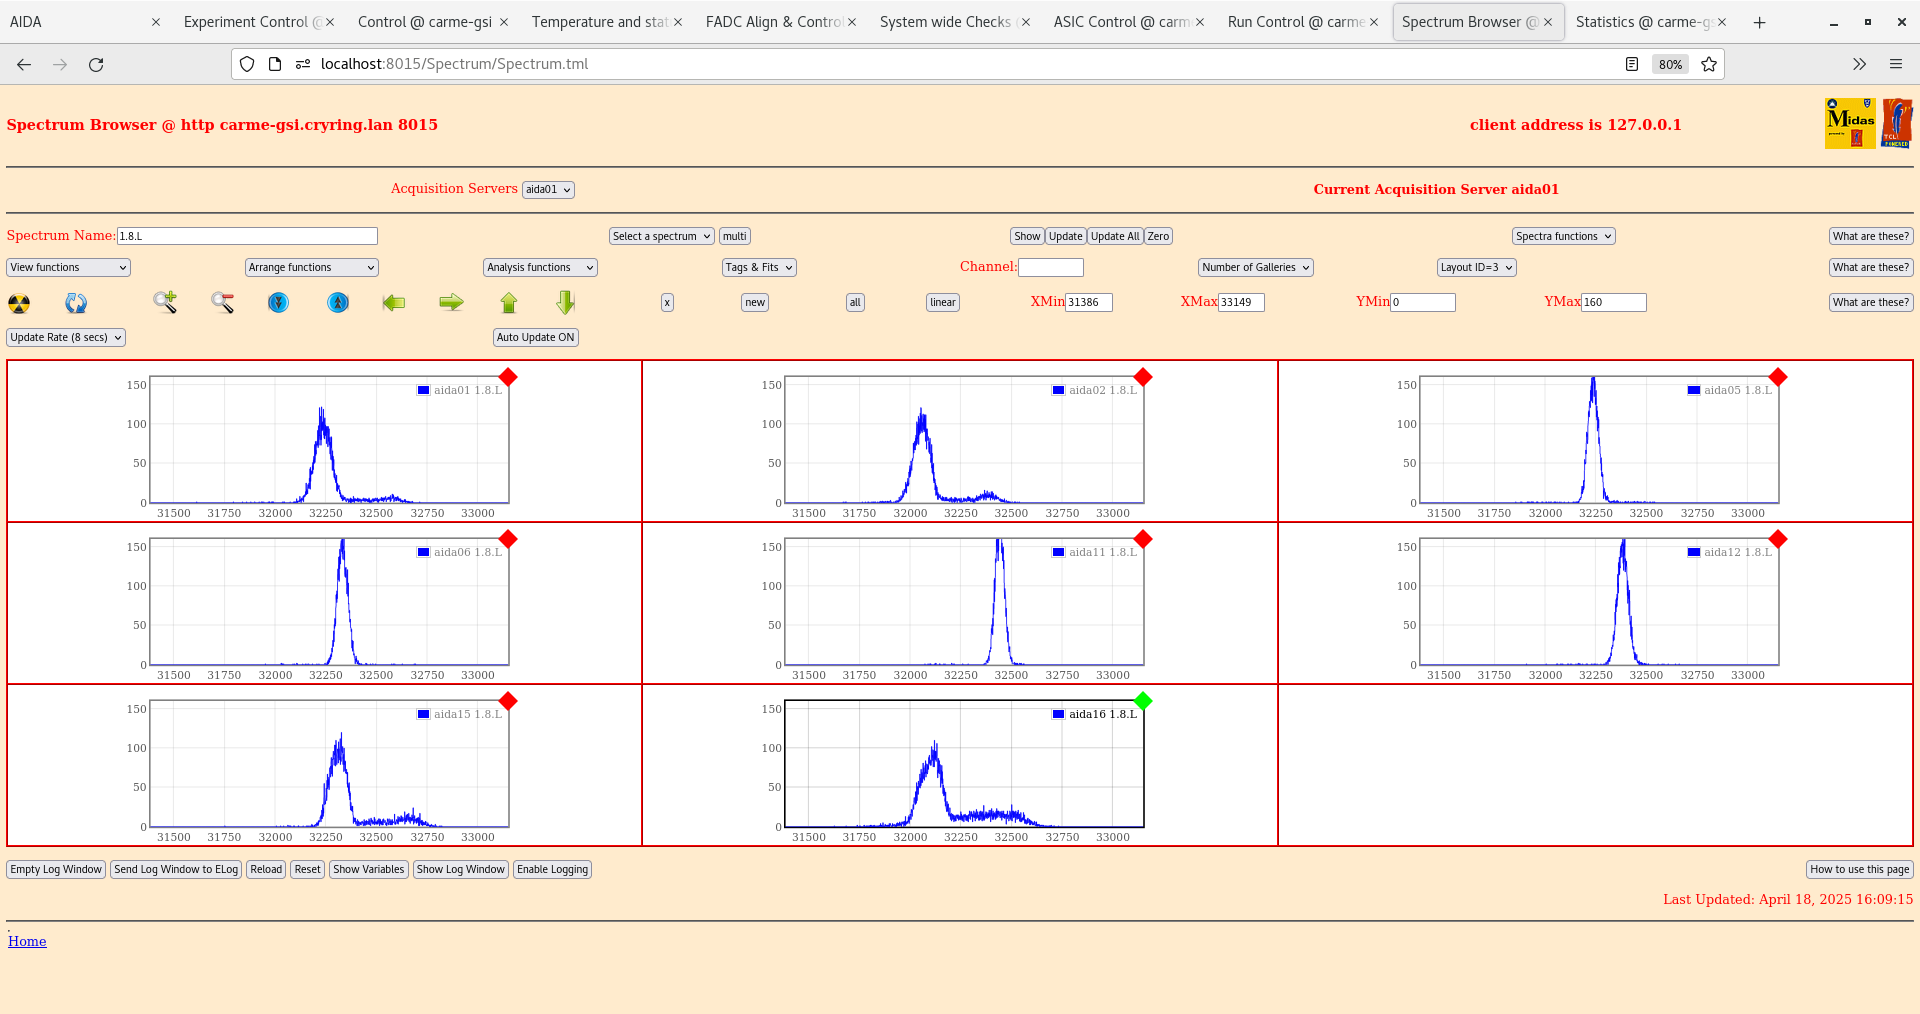
Theshold increased to 0x14 (200 keV). Pulser kept at 180 (should be about 300 keV based on Test 1). This should be the level of d+d at our lowest beam energy.
Attachments 15,16 show 1.8L for nn and pn channels respectively.
|
| Attachment 1: Screenshot_from_2025-04-18_15-38-00.png
|

|
| Attachment 2: Screenshot_from_2025-04-18_15-39-21.png
|

|
| Attachment 3: Screenshot_from_2025-04-18_15-40-29.png
|

|
| Attachment 4: Screenshot_from_2025-04-18_15-45-09.png
|

|
| Attachment 5: Screenshot_from_2025-04-18_15-47-36.png
|

|
| Attachment 6: Screenshot_from_2025-04-18_15-48-20.png
|

|
| Attachment 7: Screenshot_from_2025-04-18_15-50-58.png
|
|
| Attachment 8: Screenshot_from_2025-04-18_15-52-24.png
|

|
| Attachment 9: Screenshot_from_2025-04-18_15-54-06.png
|

|
| Attachment 10: Screenshot_from_2025-04-18_15-57-50.png
|

|
| Attachment 11: Screenshot_from_2025-04-18_15-59-38.png
|
|
| Attachment 12: Screenshot_from_2025-04-18_16-00-31.png
|
|
| Attachment 13: Screenshot_from_2025-04-18_16-04-04.png
|

|
| Attachment 14: Screenshot_from_2025-04-18_16-05-24.png
|

|
| Attachment 15: Screenshot_from_2025-04-18_16-08-05.png
|
|
| Attachment 16: Screenshot_from_2025-04-18_16-09-22.png
|
|
|
|
676
|
Fri Apr 18 08:17:38 2025 |
JM | More testing |
09:10
Arrived at GSI. Leakage currents status same as before, DSSD4 is still fluctuating. DSSD1 and DSSD3 currents are definitely lower again compared to previous days. I am convinced they are decreasing over time, whether this will be enough for our measurement....
While in the cave I again removed the motors pins so that the detectors can can be shook in an attempt to perform magic. While in the cave I also connected the CRYRING ground cable to the coolant pipe (ground config 11). Will see effect on rates / pulser.
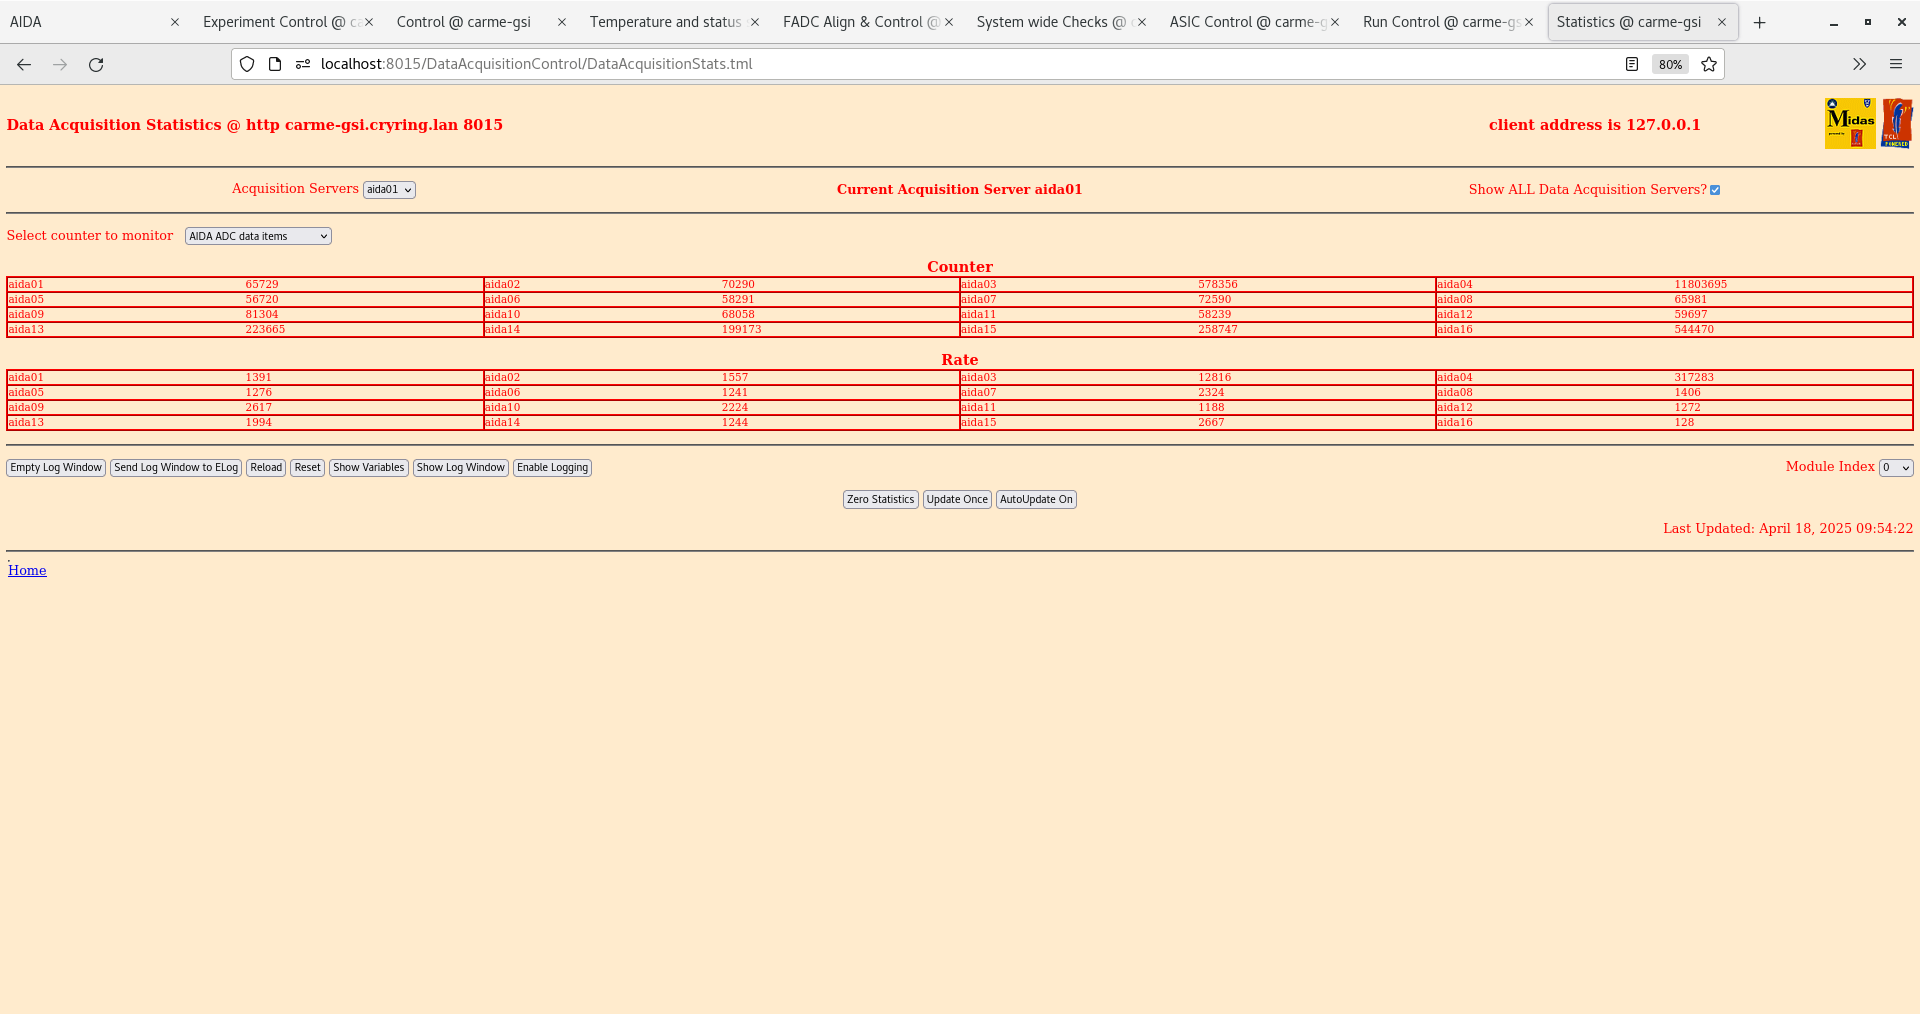
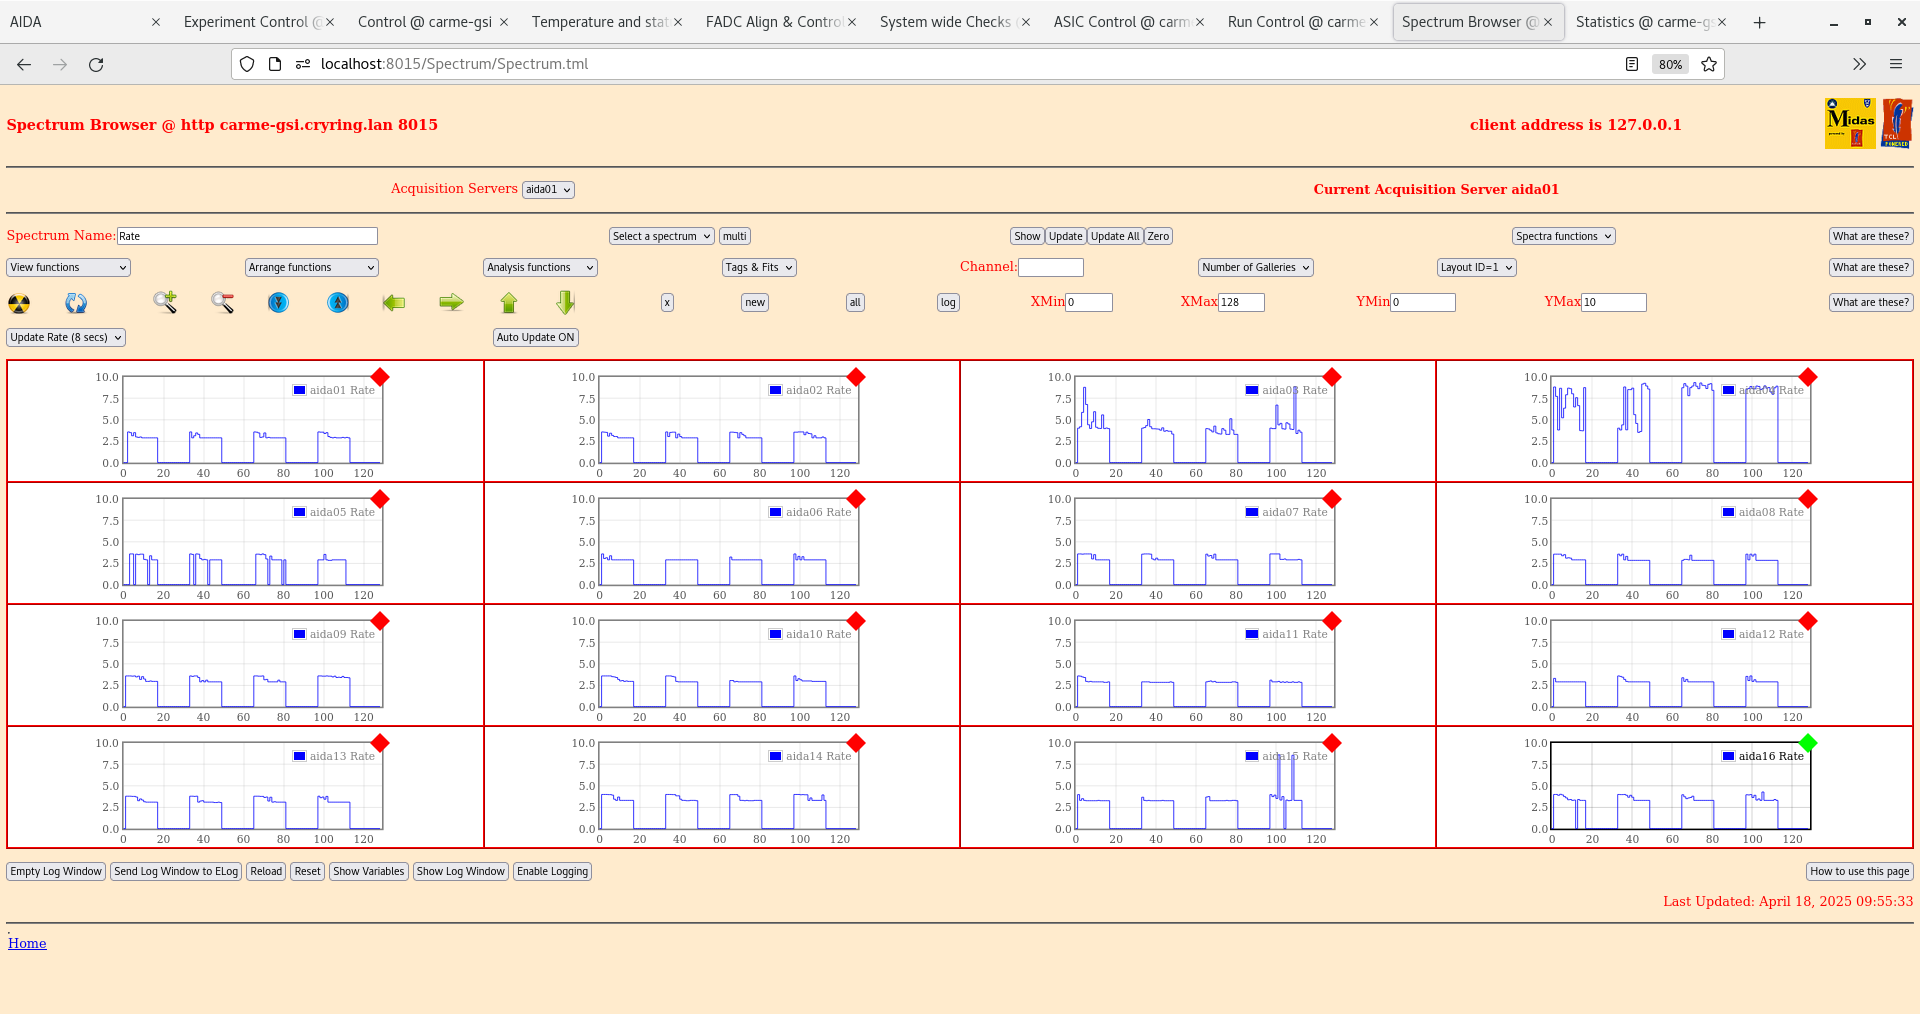
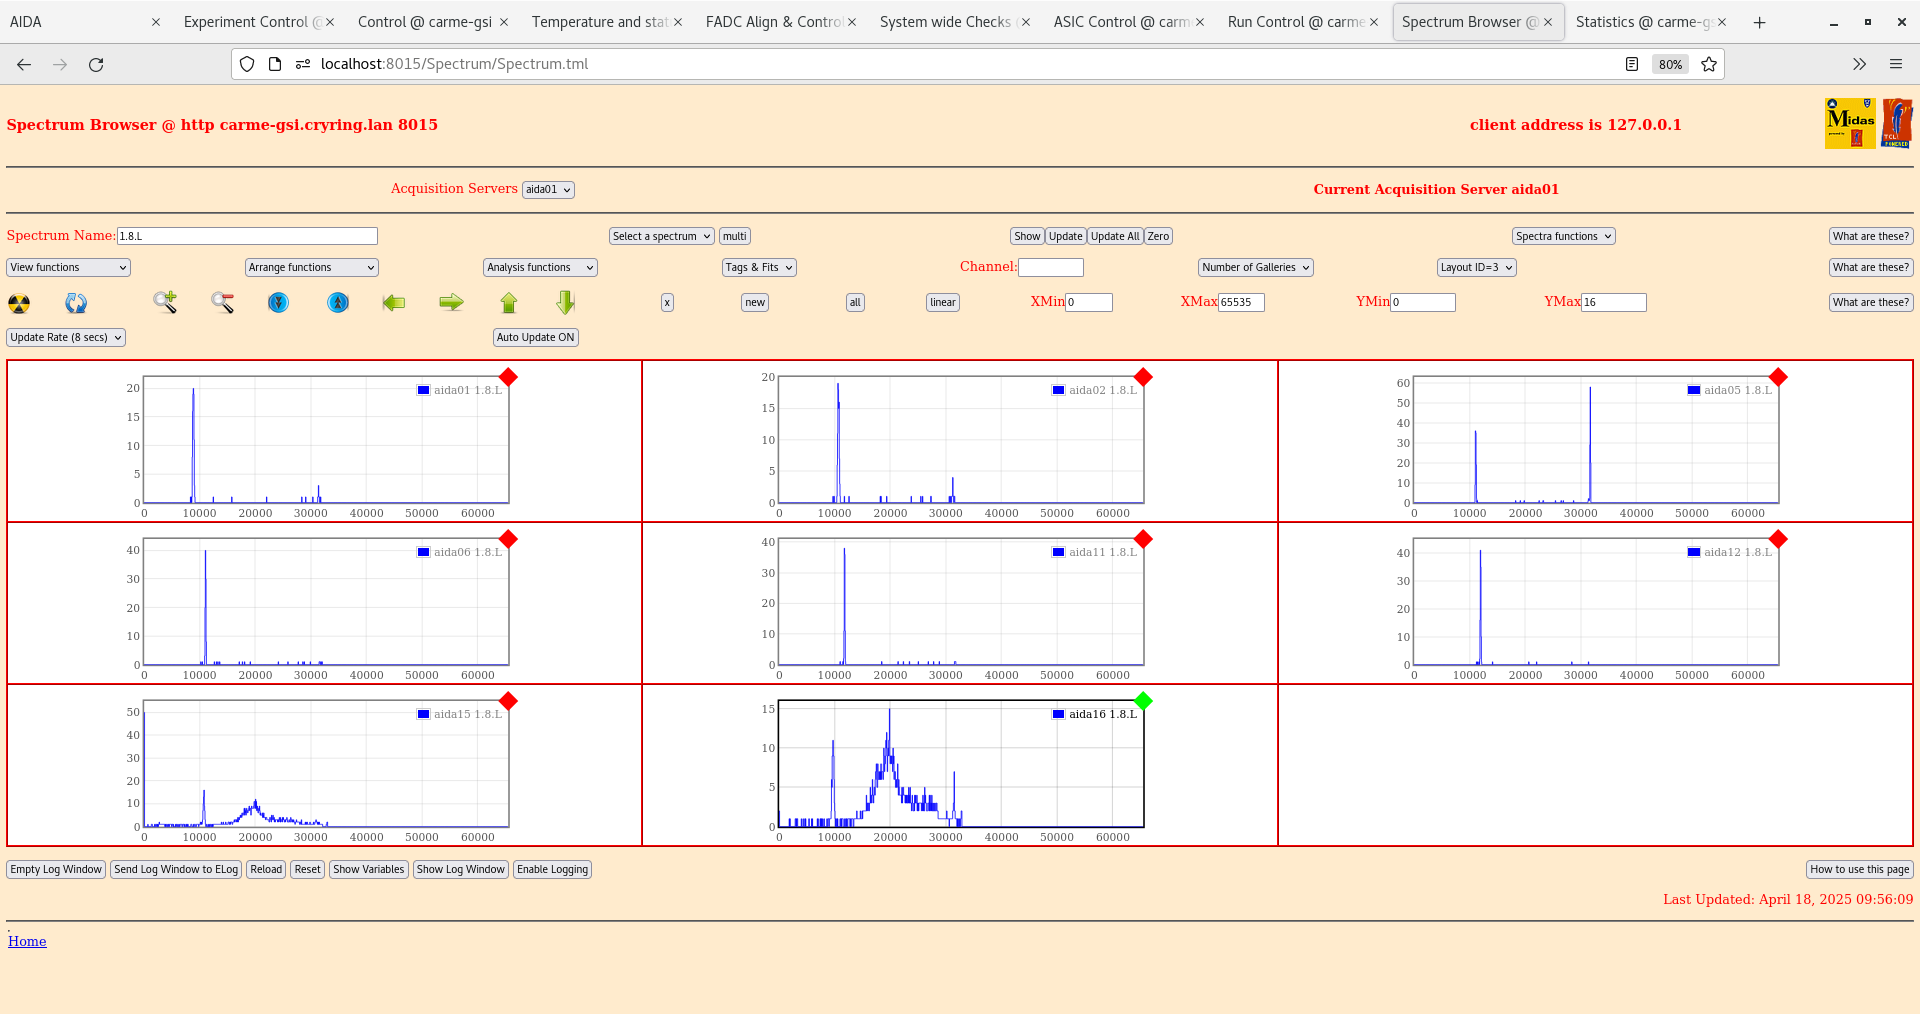
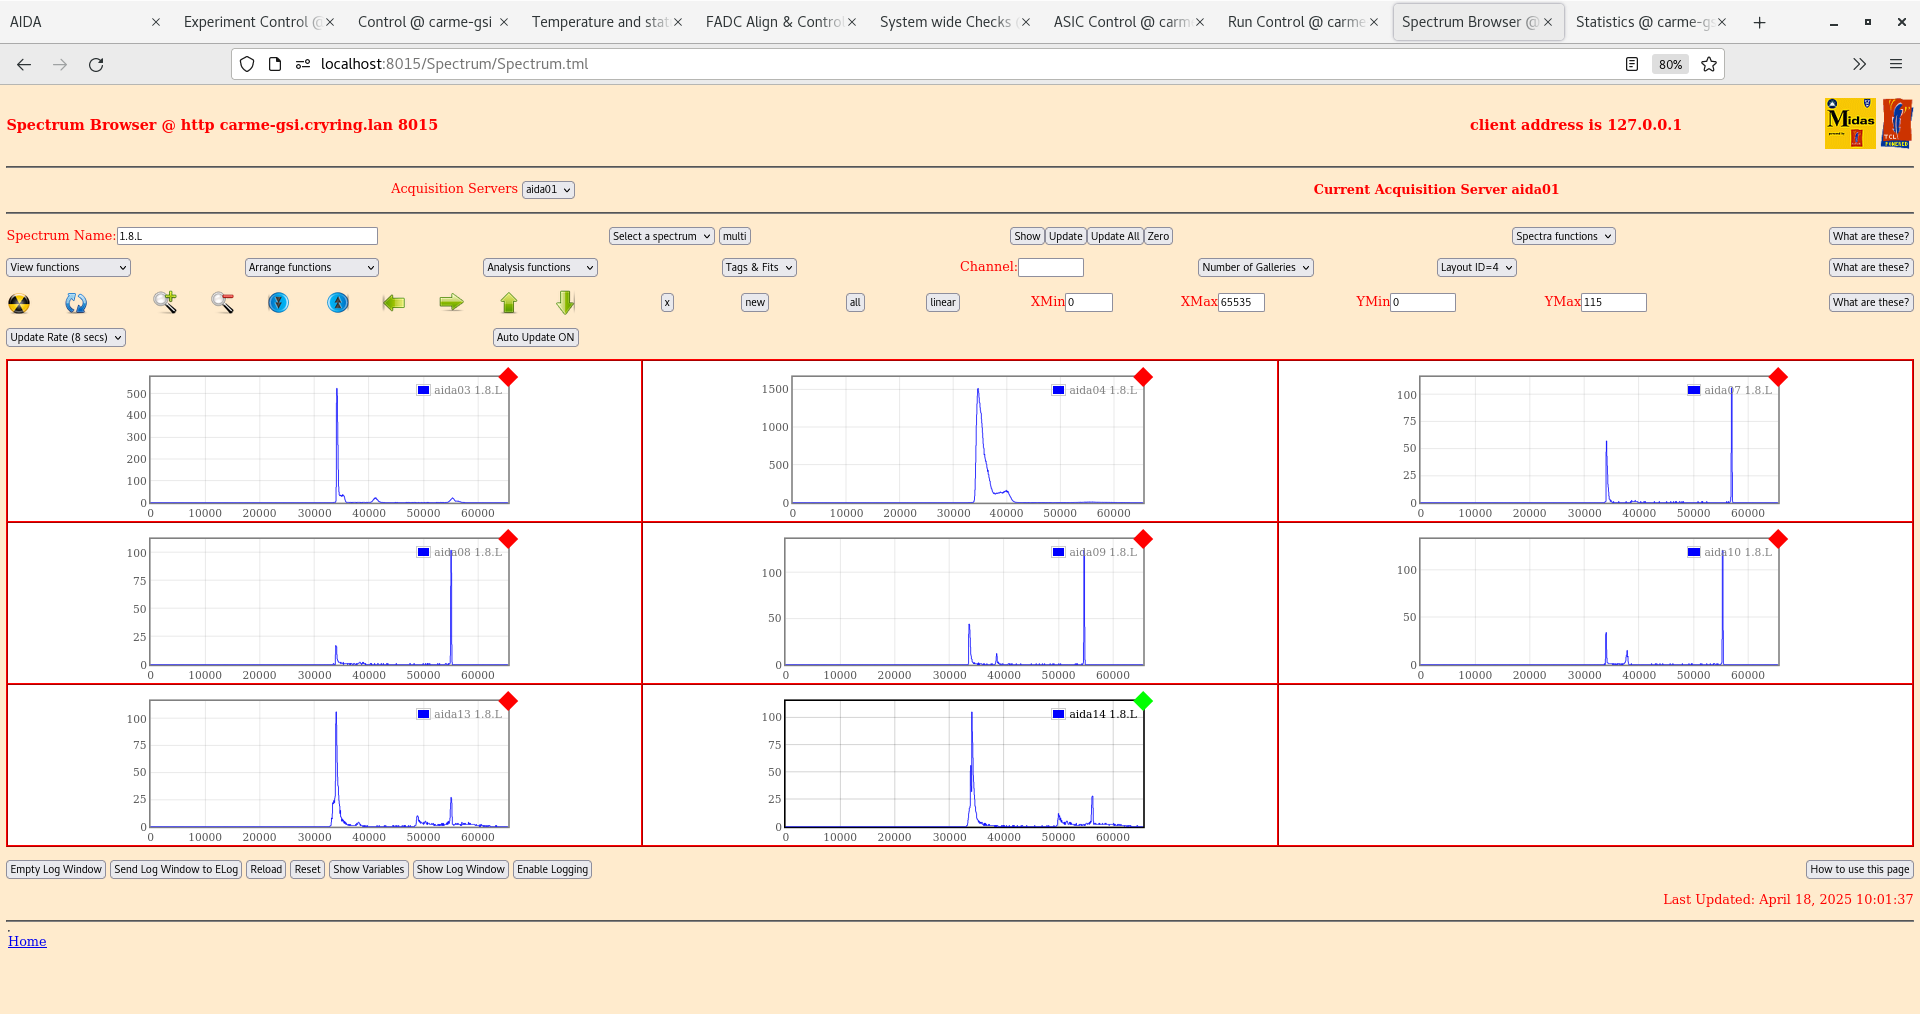
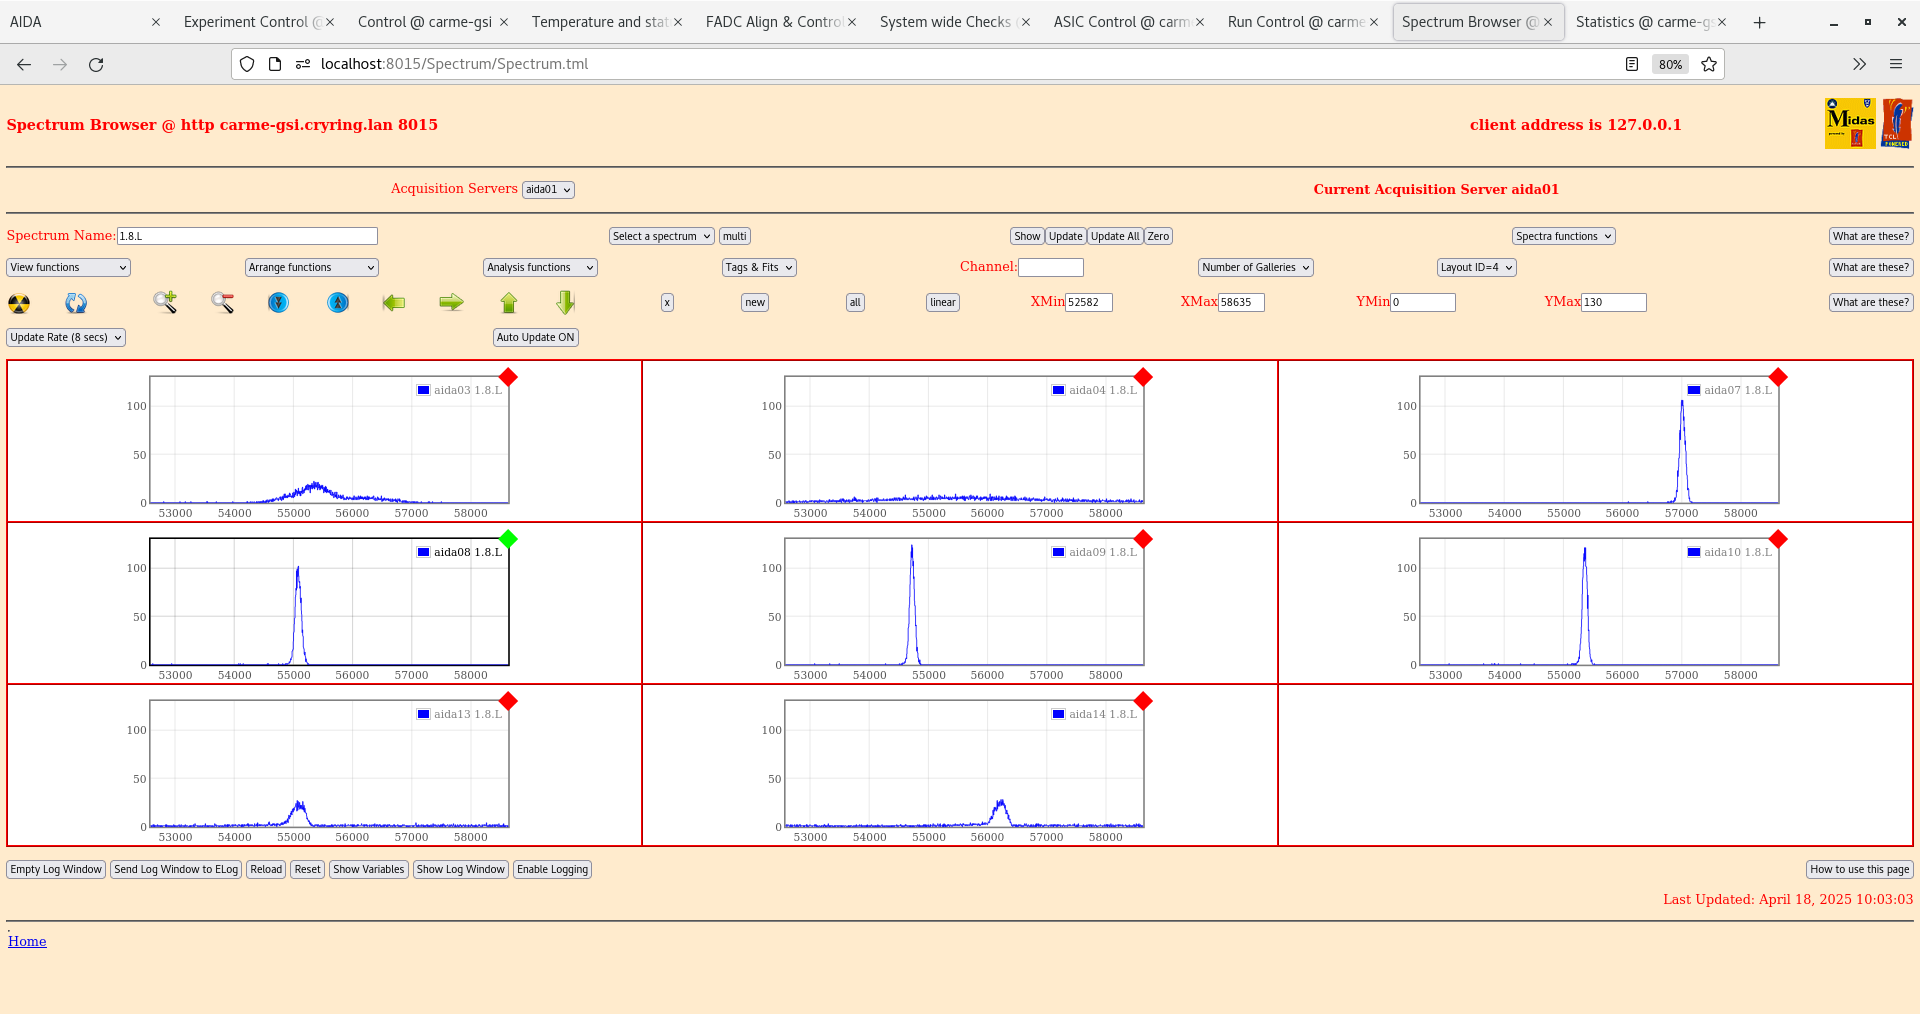
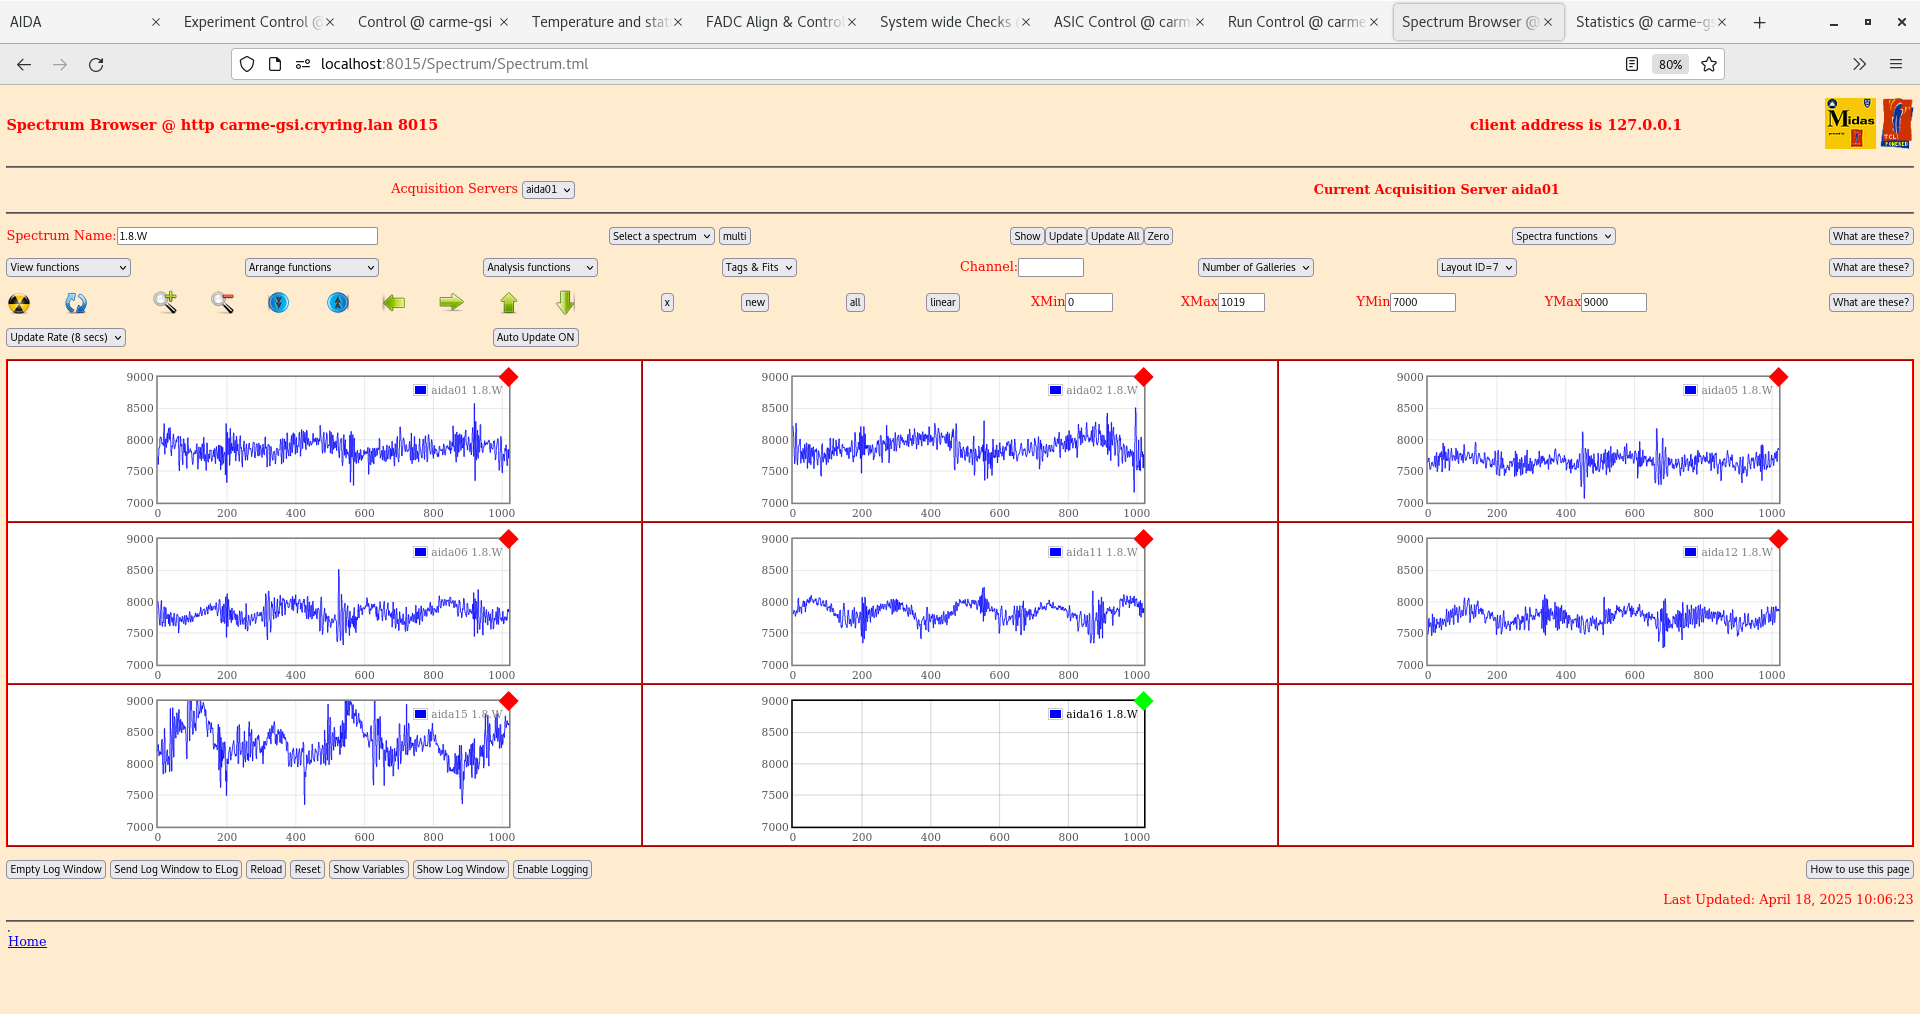
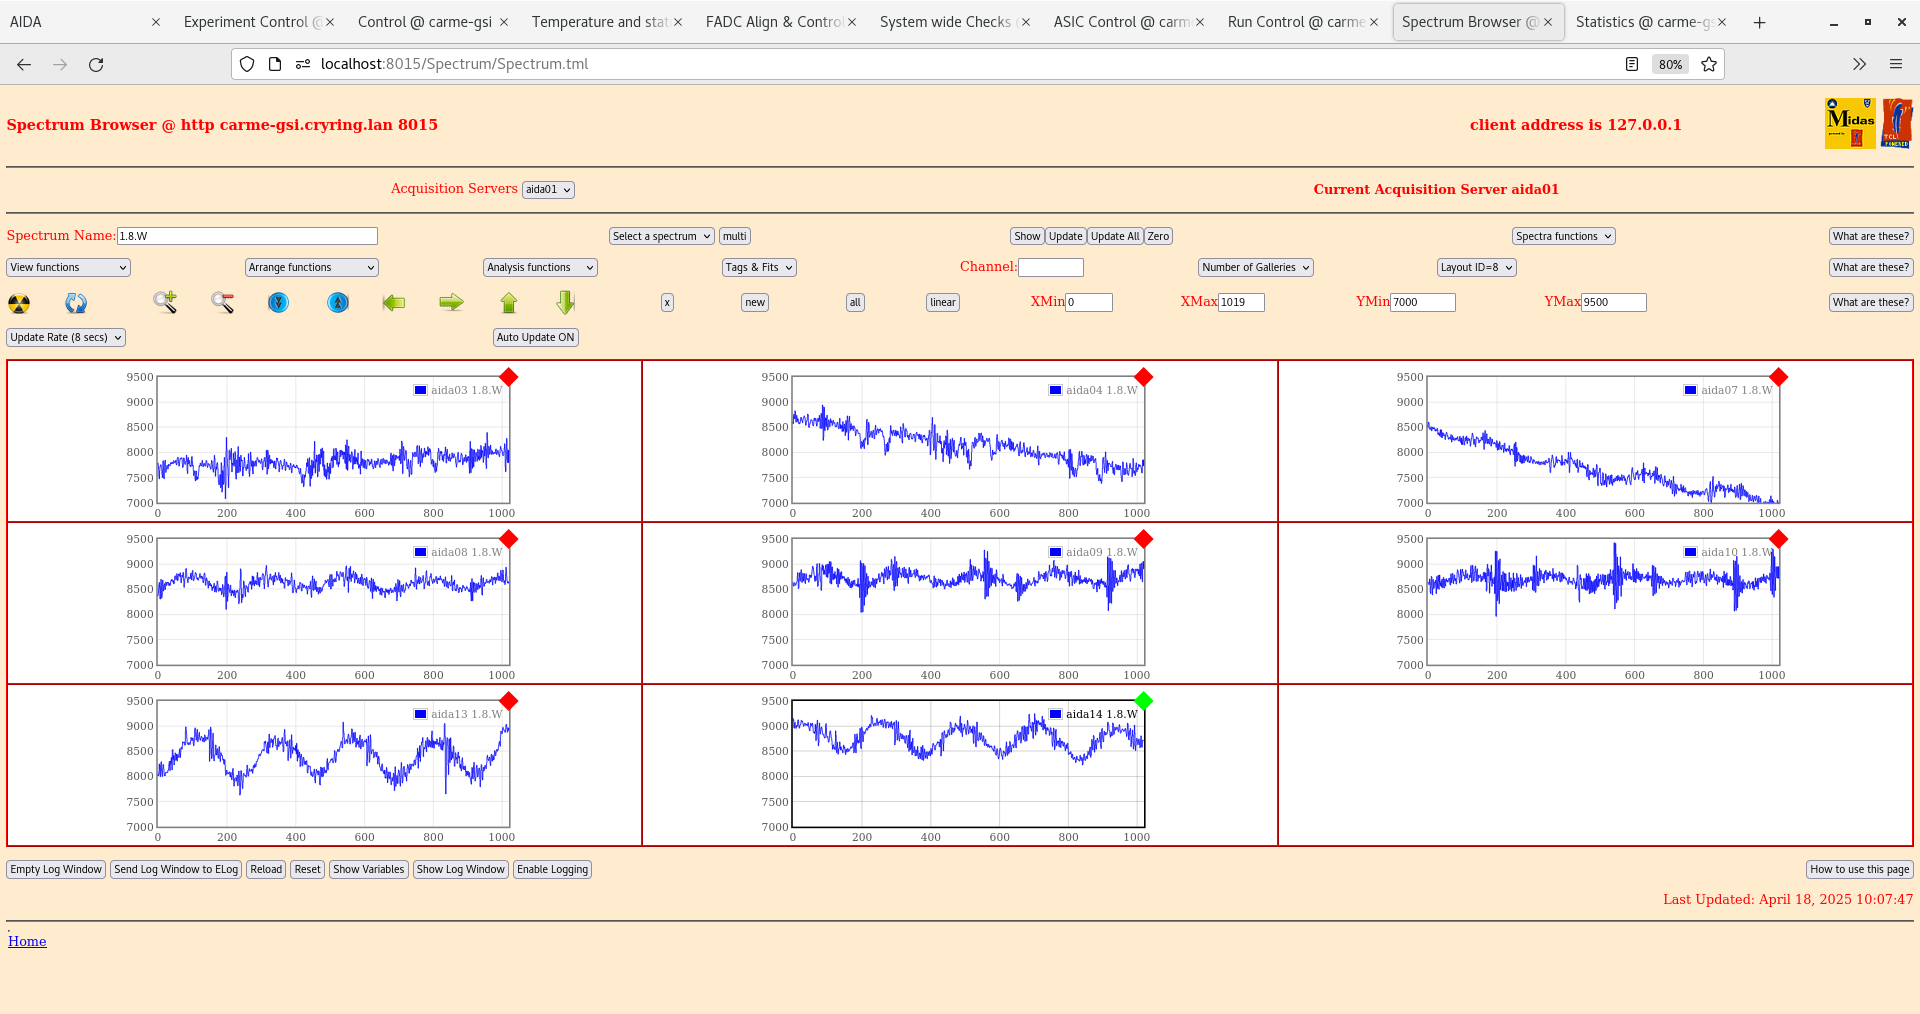
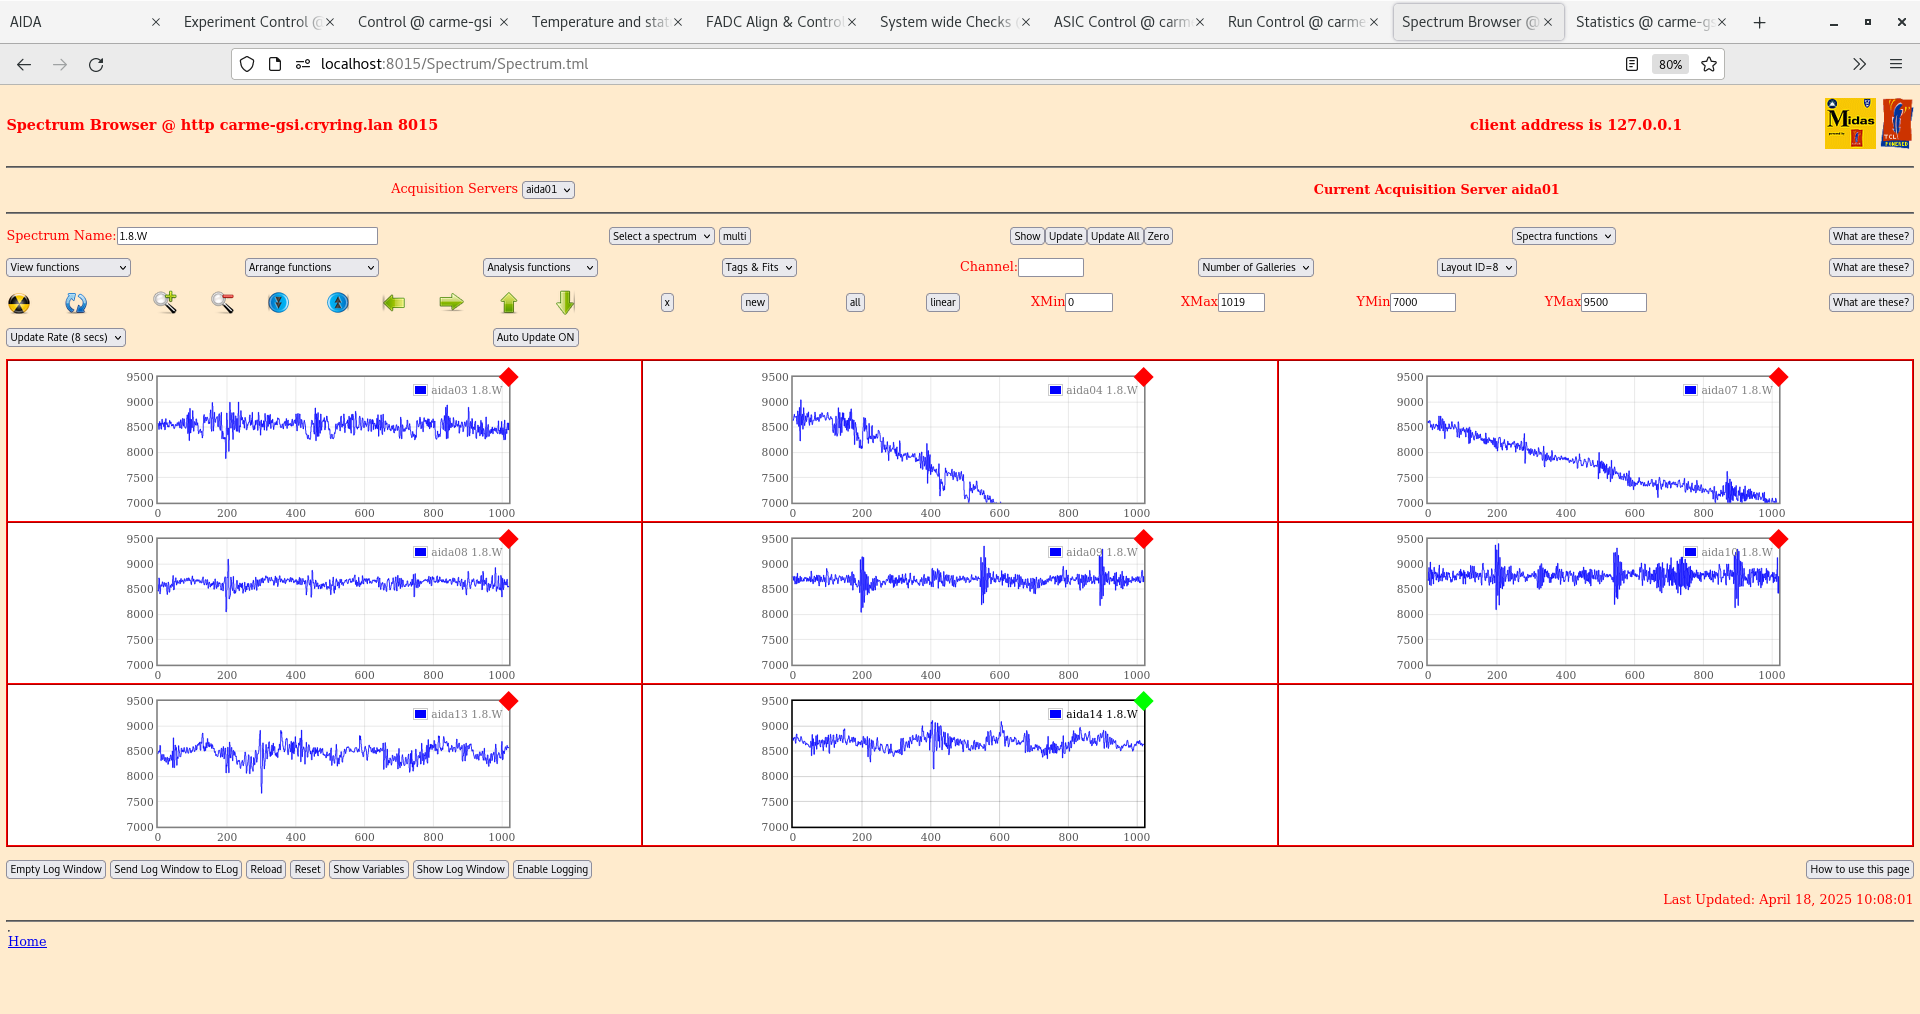
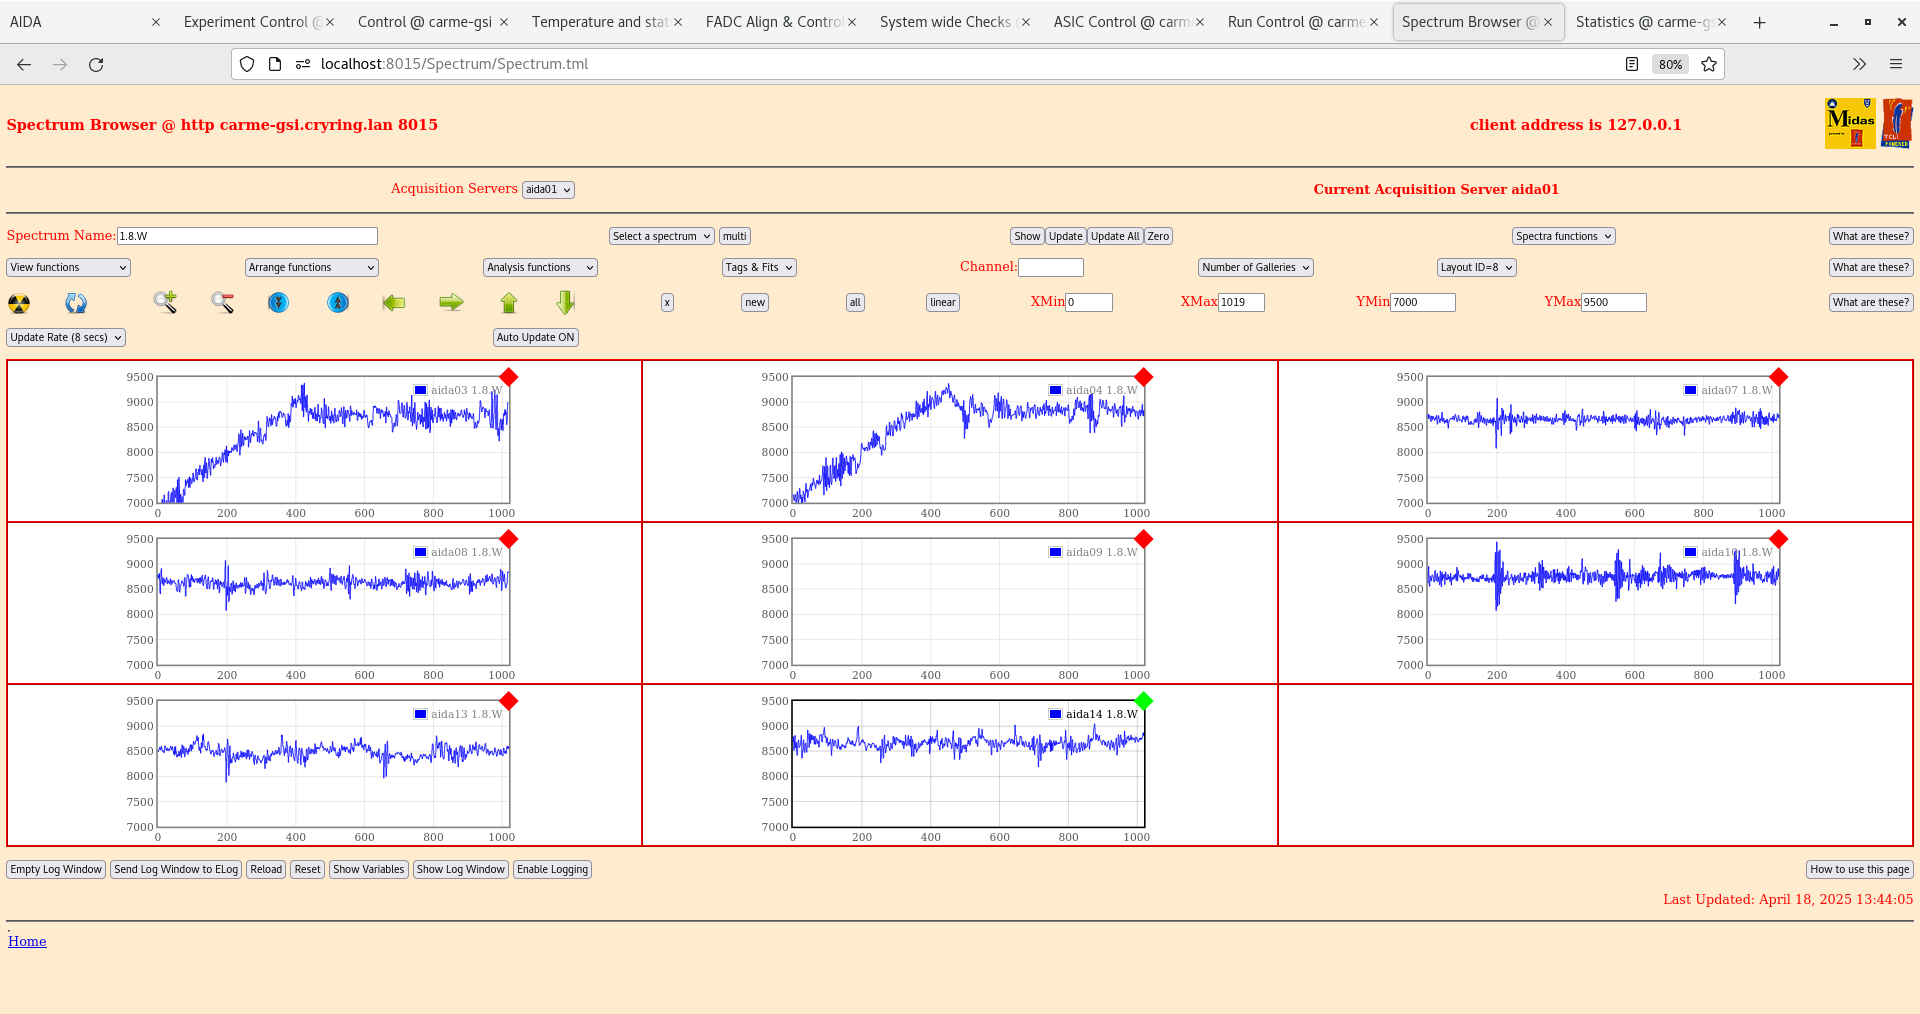
Ground config 11 - see attachments 1-8. Rates in aida03 are massively down by a factor 10! Rates now ~20k. Aida04 still around 300k. On attachment 4 we can see the noise from zero energy on aida03 is massively down and we can now see the pulser, although the peak is double. Similar low energy noise is now appearing on aida15 and aida16 of DSSD4. Is this the early phase of what happended to DSSD1 and DSSD3?
Note the waveforms shown in attachments 7 and 8 change quite alot when updating the spectrum browser. Wave structure very visible in 7 but after updating a few times this disappears before coming back again a bit later.
20 minutes later ...
DAQ continued for about 20 minutes, noticed the leakage current in DSSD4 was no longer fluctuating. Zero'd stats and histograms to look again.
Stats in aida03 have increased back to ~100k, still less than before but back up from ~20k. Check of the pulser widths shows they have decreased across the board from the previous test 20 mins ago.
Leaving DAQ to run for a bit longer, the rates in aida03 continue to increase and are now back ~200k (back where it was).
I am currently trying to cycle motors. No effect on leakage current when cycling pneumatic motor. Note when using single commands such as 'l p in' I have no problems. But when trying a longer command where I ask the code to wait before pulling the pneumatic out again the code crashes. ??? Crash not repeated by Carlo remotely, Perhaps it is my laptop, or a bug relating to windows. Will investigate back in Edinburgh.
Have performed the same bias test for DDSD4 as #1 and #2 in previous elogs. Same behaviour observed. No (0.01uA) leakage current with only nn and current ramps up and falls to zero with only pn. I did notice that the ion pumps were arcing, I have not noticed this in prevous days. They have now been turned off, I think we can leave them off as they do little for the vacuum anyway unless using heavy gas taget gas. VI bias curve looks identical to one performed at the start of the week.
I have moved the PC power to the 19 inch rack. Power cycled the FEEs. I noticed the leakage current on DSSD4 was fine during VI test but after starting the FEEs power cycle they started to fluctuate again. After about 5 minutes after the startup, DSSD4 leakage current returned to a normal stable level. I have seen spikes in leakage current for all detectors during power cycle but perhaps it could also cause the fluctuations in #4. Overnight I have left FEEs off due to uncertainty over the swagelock on aida08 and the fact I was changing ground a lot so a background didn't make sense. Perhaps leaving FEE power on will stabilise DSSD4? I will leave system to stabilise a bit now (after seeing rates and pulser widths change in previosu test) and check pulser widths. Going for an awful GSI coffee.
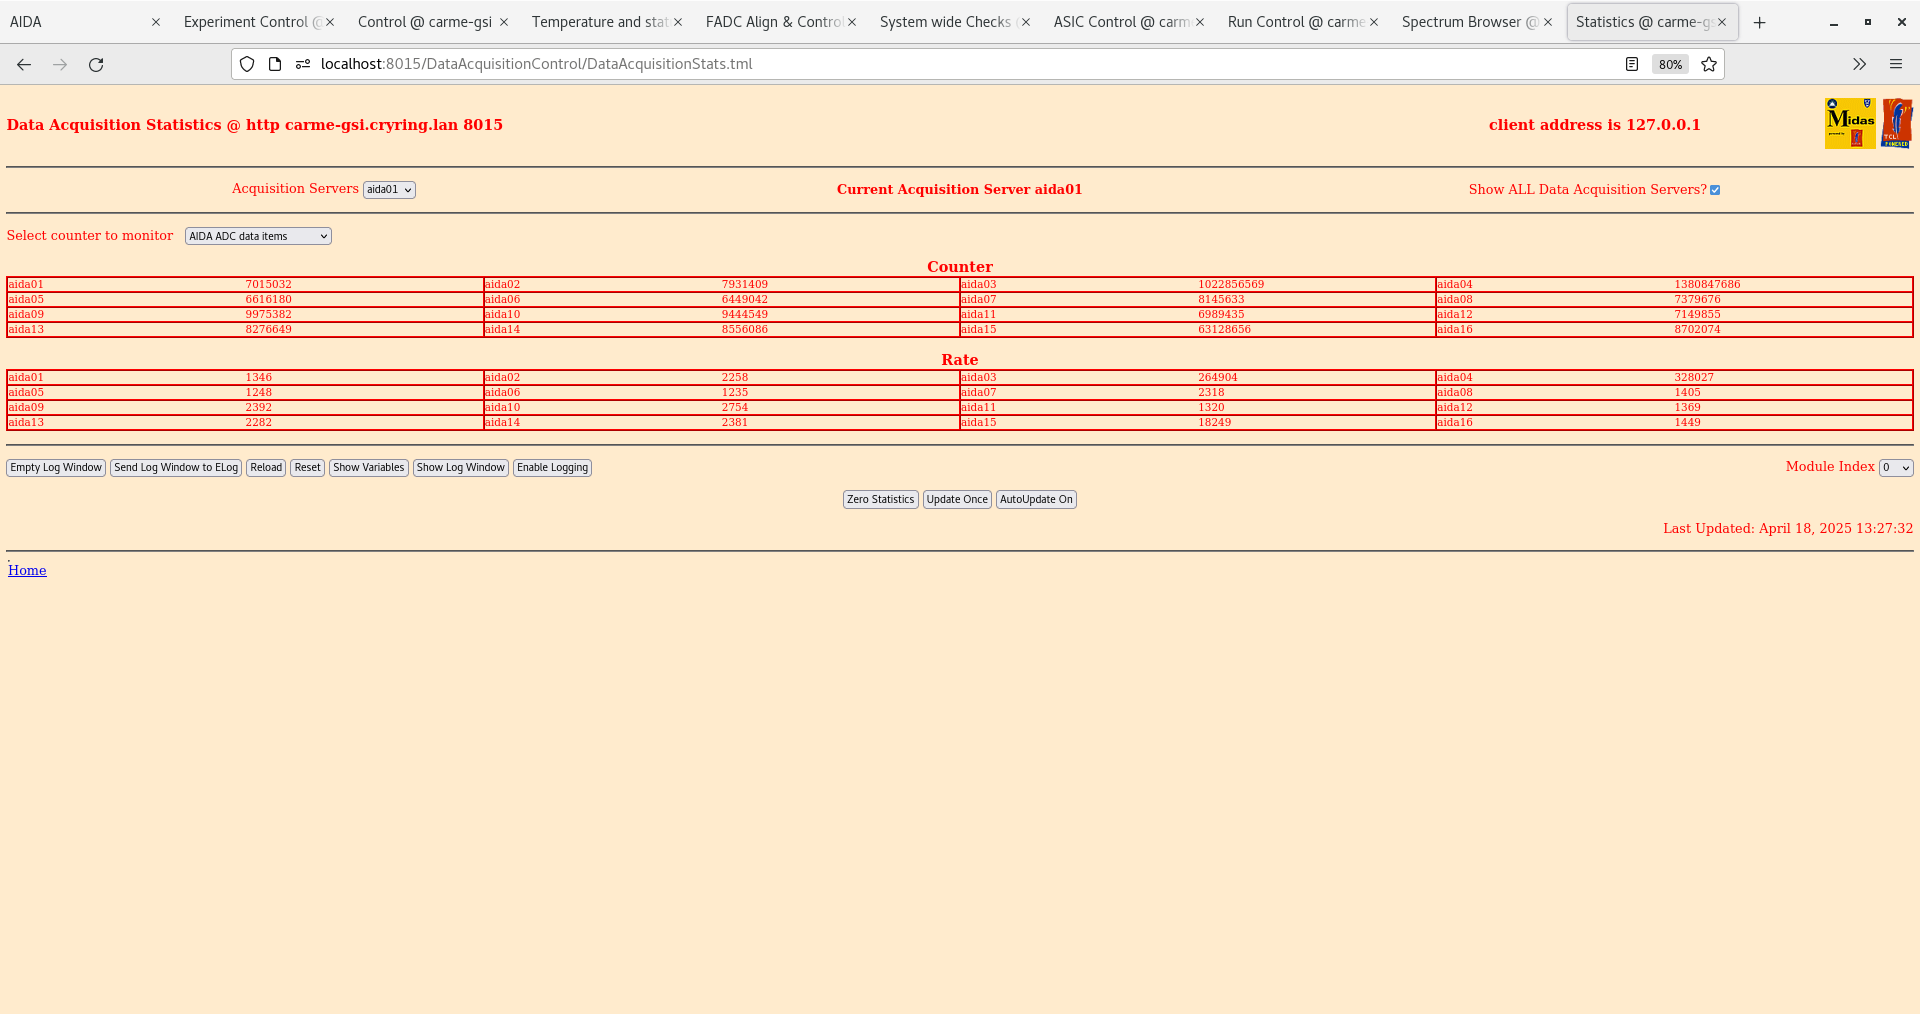
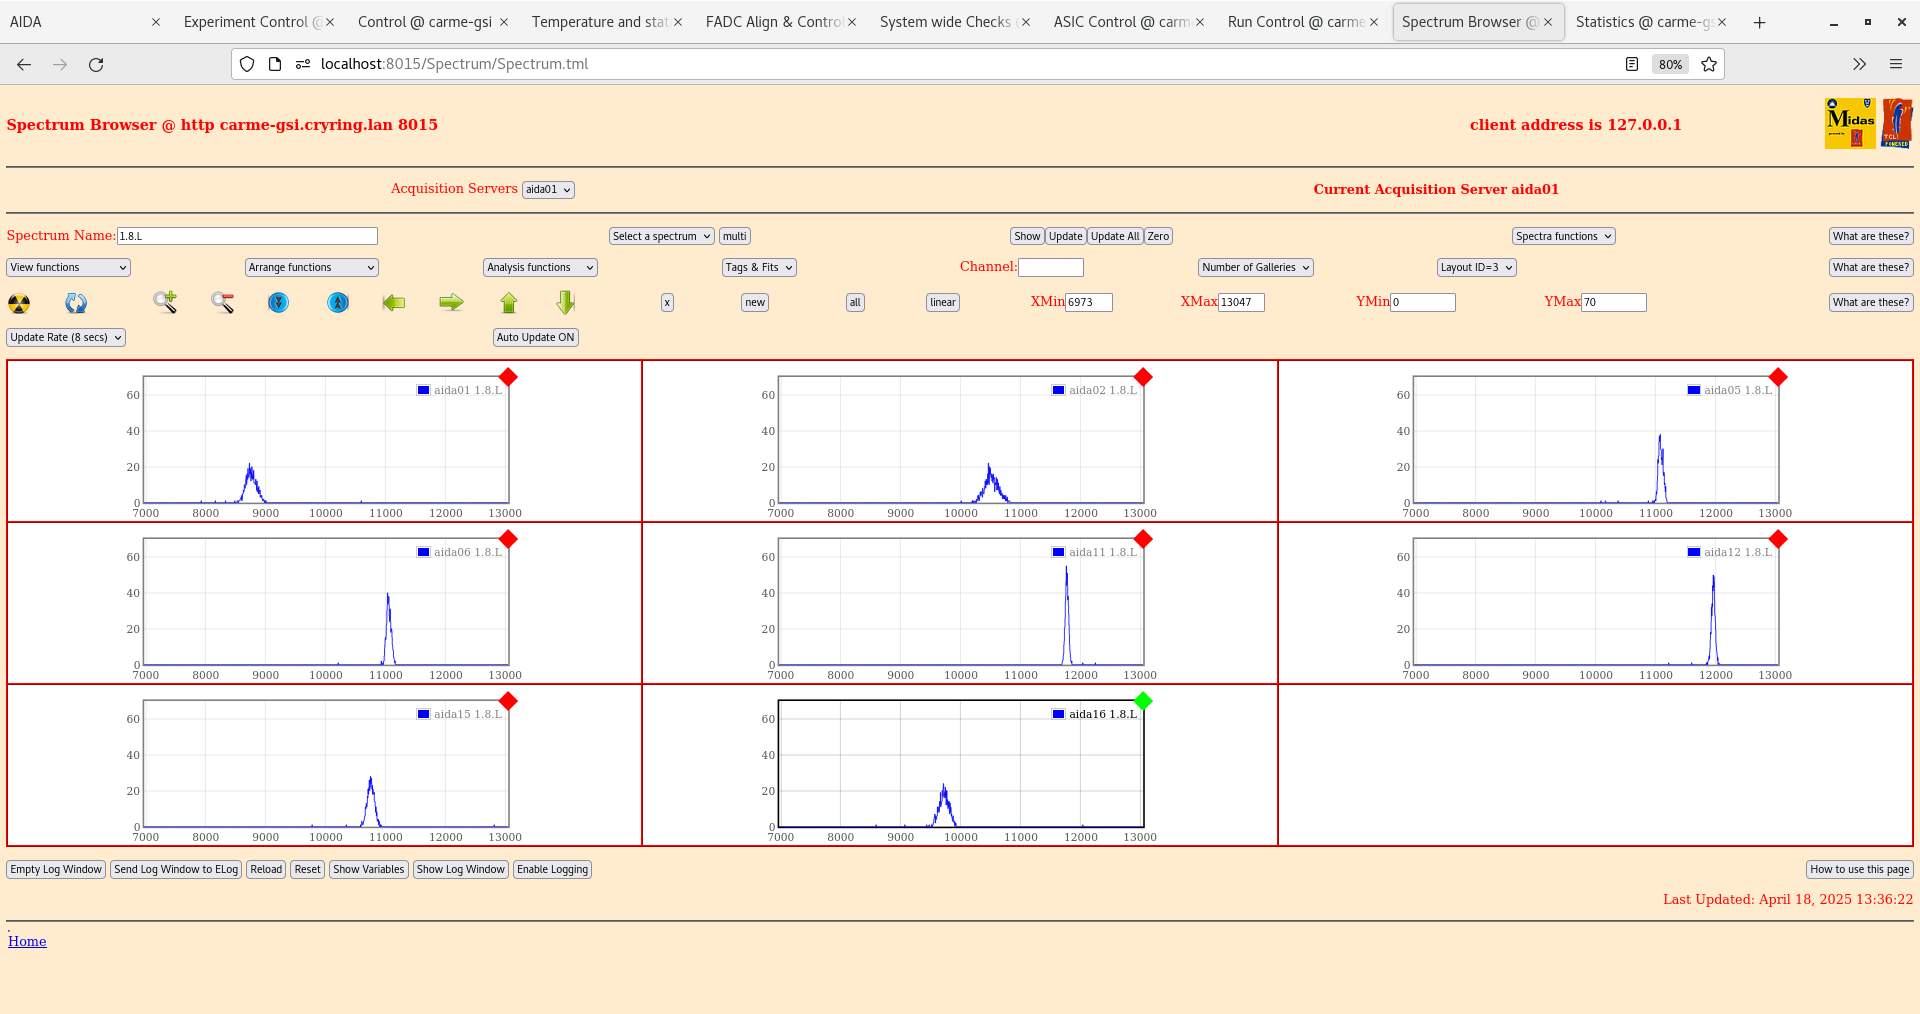
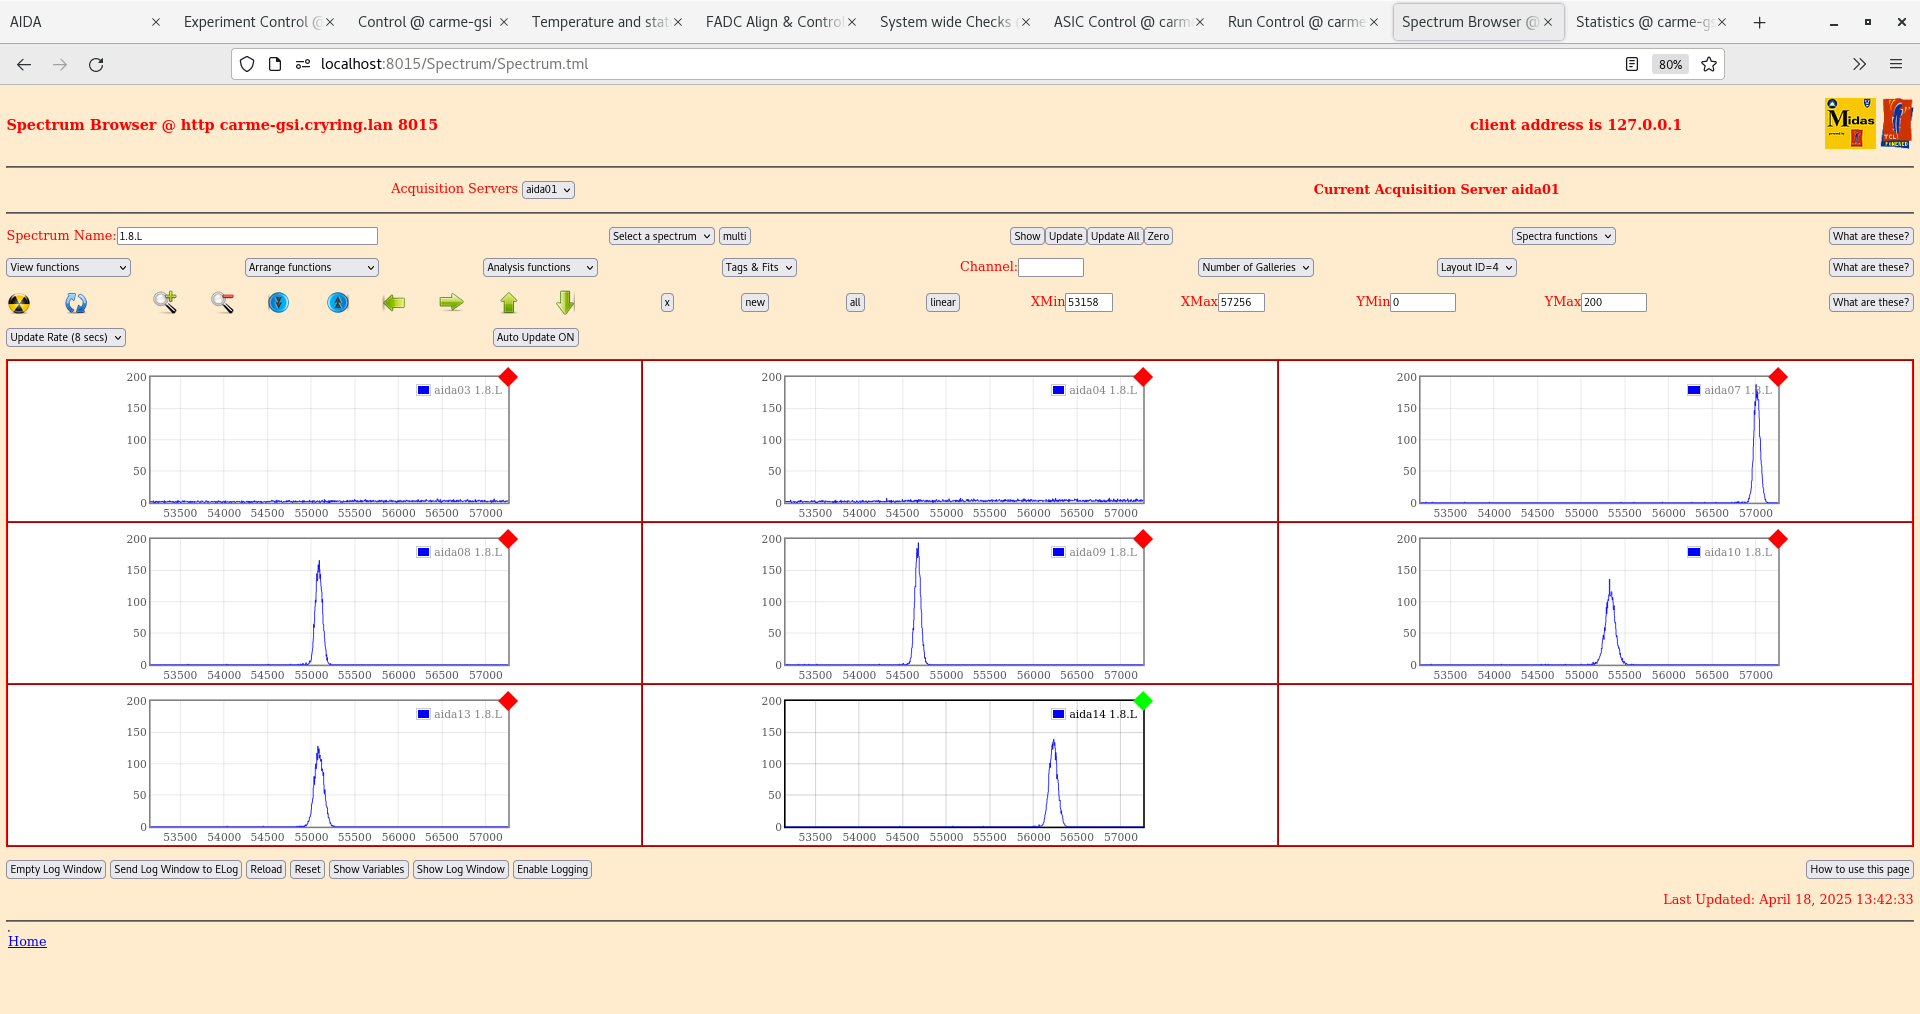
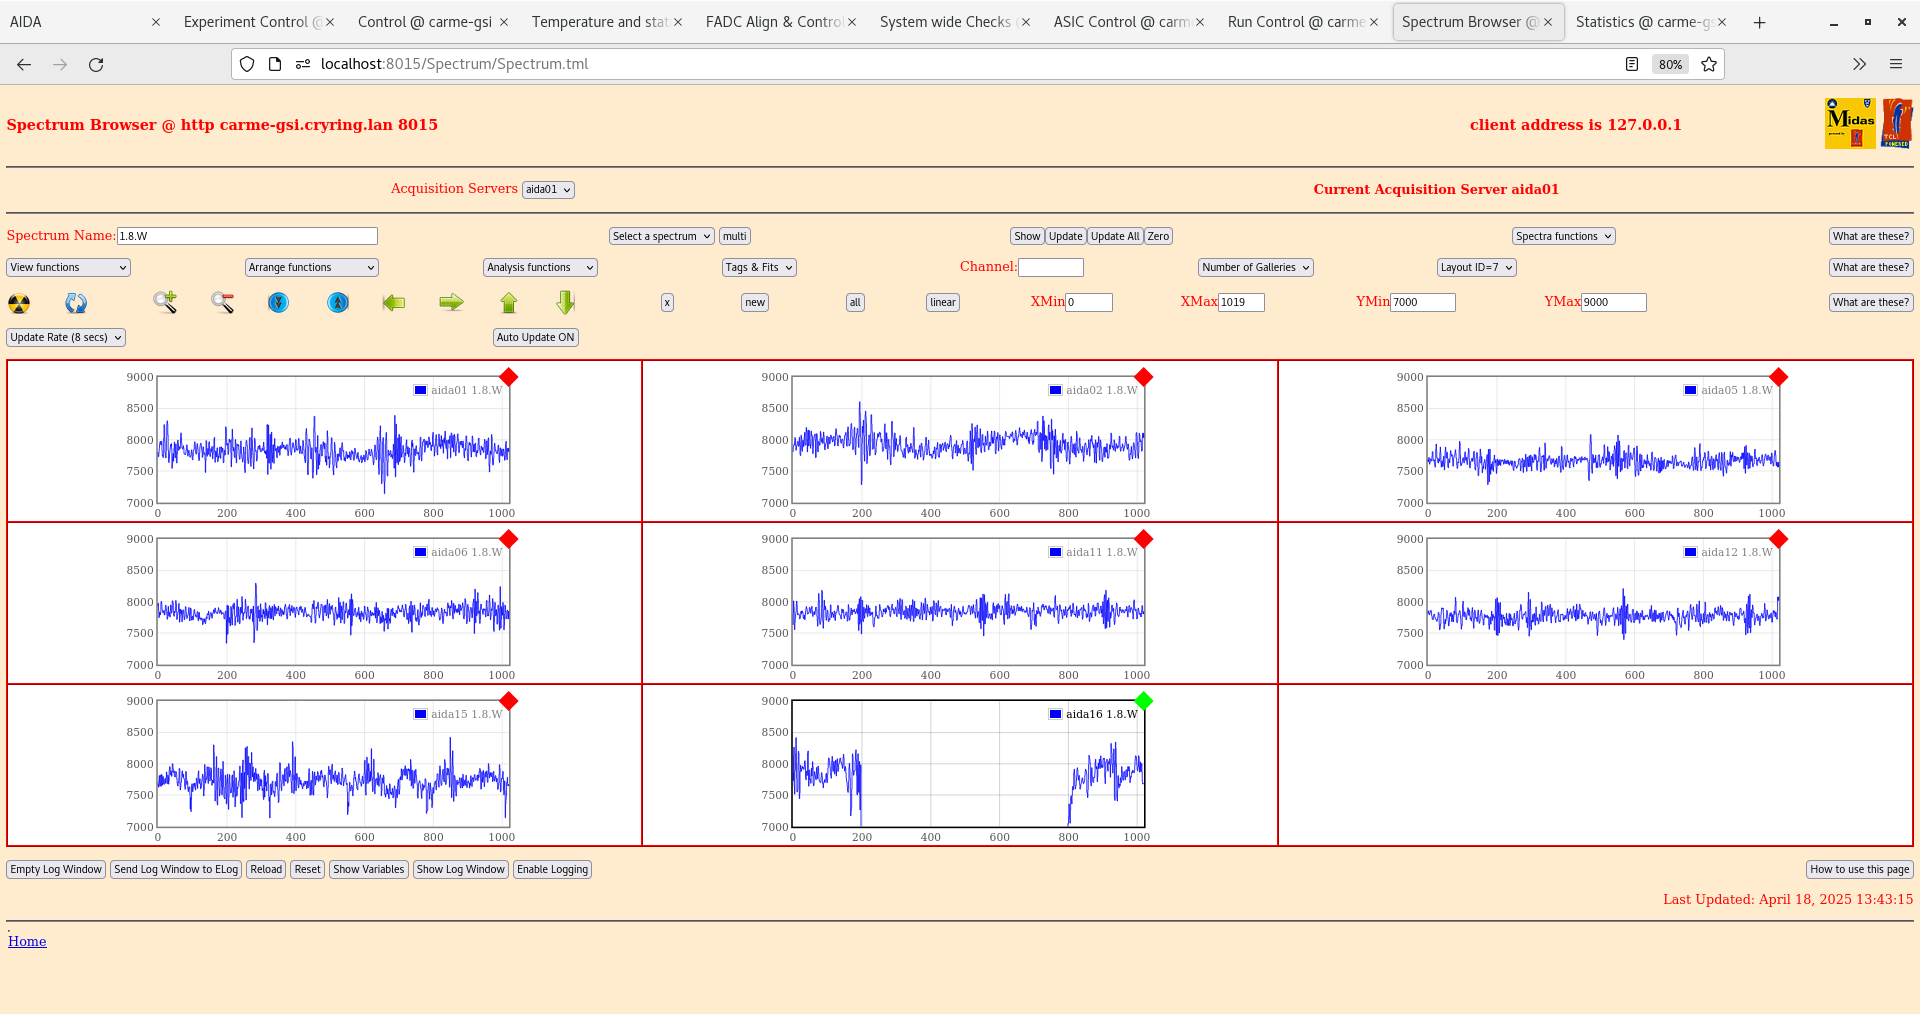
New configuration: See attachments 9-13. Rates on aida03 and aida04 still remain very high >200k. Pulser widths across the board look pretty good. All have reduced since moving the PC on same power supply as 19 inch rack. DSSD4 leakage current has been stable the last hour since FEE power on. Waveforms look improved too. No longer see such high amplitude oscillations. Updated several times, see no change in waveforms like previous test.
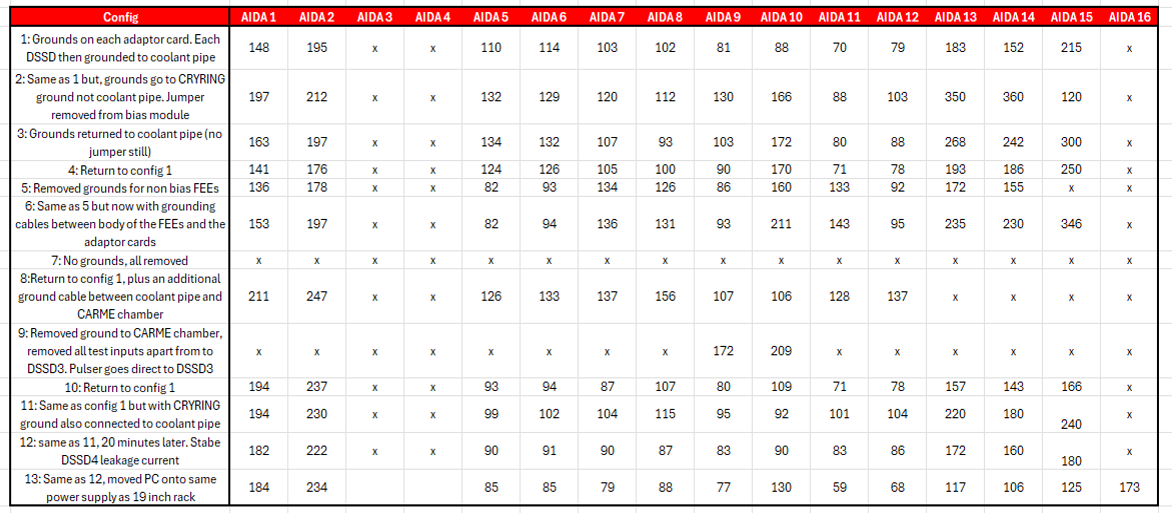
Attachment 14 for pulser widrths from tests this week. Note x means no value. This could be because the width was so very big, or the test input wasn't connected. These values aren't too bad. DSSD2 and 3 have avergae pulser width (1.8L only) of ~60 keV.
Tried ground cable to NIM bin, had no effect / maybe negative effect. Disconnected cable.
D+D tests in next elog
Finally a pulser walkthrough was completed. Run8 has pulser settings unchanged, slow comparator at 0x64, aida03 and aida04 set to MEC. Pulser amplitudes 9000,8000,7000,6000,5000,4000,3000,2000,1000
A second walkthrough (Run9) was done with slow comparator set to 0x14, aida03 and aida04 set to MEC. Pulser amplitudes 9000,8000,7000,6000,5000,4000,3000,2000,1000,700,400 (so that we can check ~BBN energies) - attachment 15
During second walkthrough, DSSD4 starting fluctuating in leakage current again. No-one was in the ring. No observable change. FEEs were ON and were currently acquiring. ?? See noise which in attachment 15 on aida15/16 that only started when current was fluctuating.
FEEs off. Bias on and monitoring. Pins re-inserted into motors. Compressed air off. |
| Attachment 1: Screenshot_from_2025-04-18_09-54-29.png
|
|
| Attachment 2: Screenshot_from_2025-04-18_09-55-40.png
|
|
| Attachment 3: Screenshot_from_2025-04-18_09-56-51.png
|
|
| Attachment 4: Screenshot_from_2025-04-18_10-02-05.png
|
|
| Attachment 5: Screenshot_from_2025-04-18_10-03-08.png
|
|
| Attachment 6: Screenshot_from_2025-04-18_10-06-45.png
|
|
| Attachment 7: Screenshot_from_2025-04-18_10-07-57.png
|
|
| Attachment 8: Screenshot_from_2025-04-18_10-08-10.png
|
|
| Attachment 9: Screenshot_from_2025-04-18_13-27-39.png
|
|
| Attachment 10: Screenshot_from_2025-04-18_13-36-29.png
|
|
| Attachment 11: Screenshot_from_2025-04-18_13-42-42.png
|
|
| Attachment 12: Screenshot_from_2025-04-18_13-43-22.png
|
|
| Attachment 13: Screenshot_from_2025-04-18_13-44-12.png
|
|
| Attachment 14: pulser-widths.png
|
|
| Attachment 15: Screenshot_from_2025-04-18_17-03-56.png
|

|
|
|
675
|
Thu Apr 17 08:51:29 2025 |
JM | Grounding cont. |
09:00
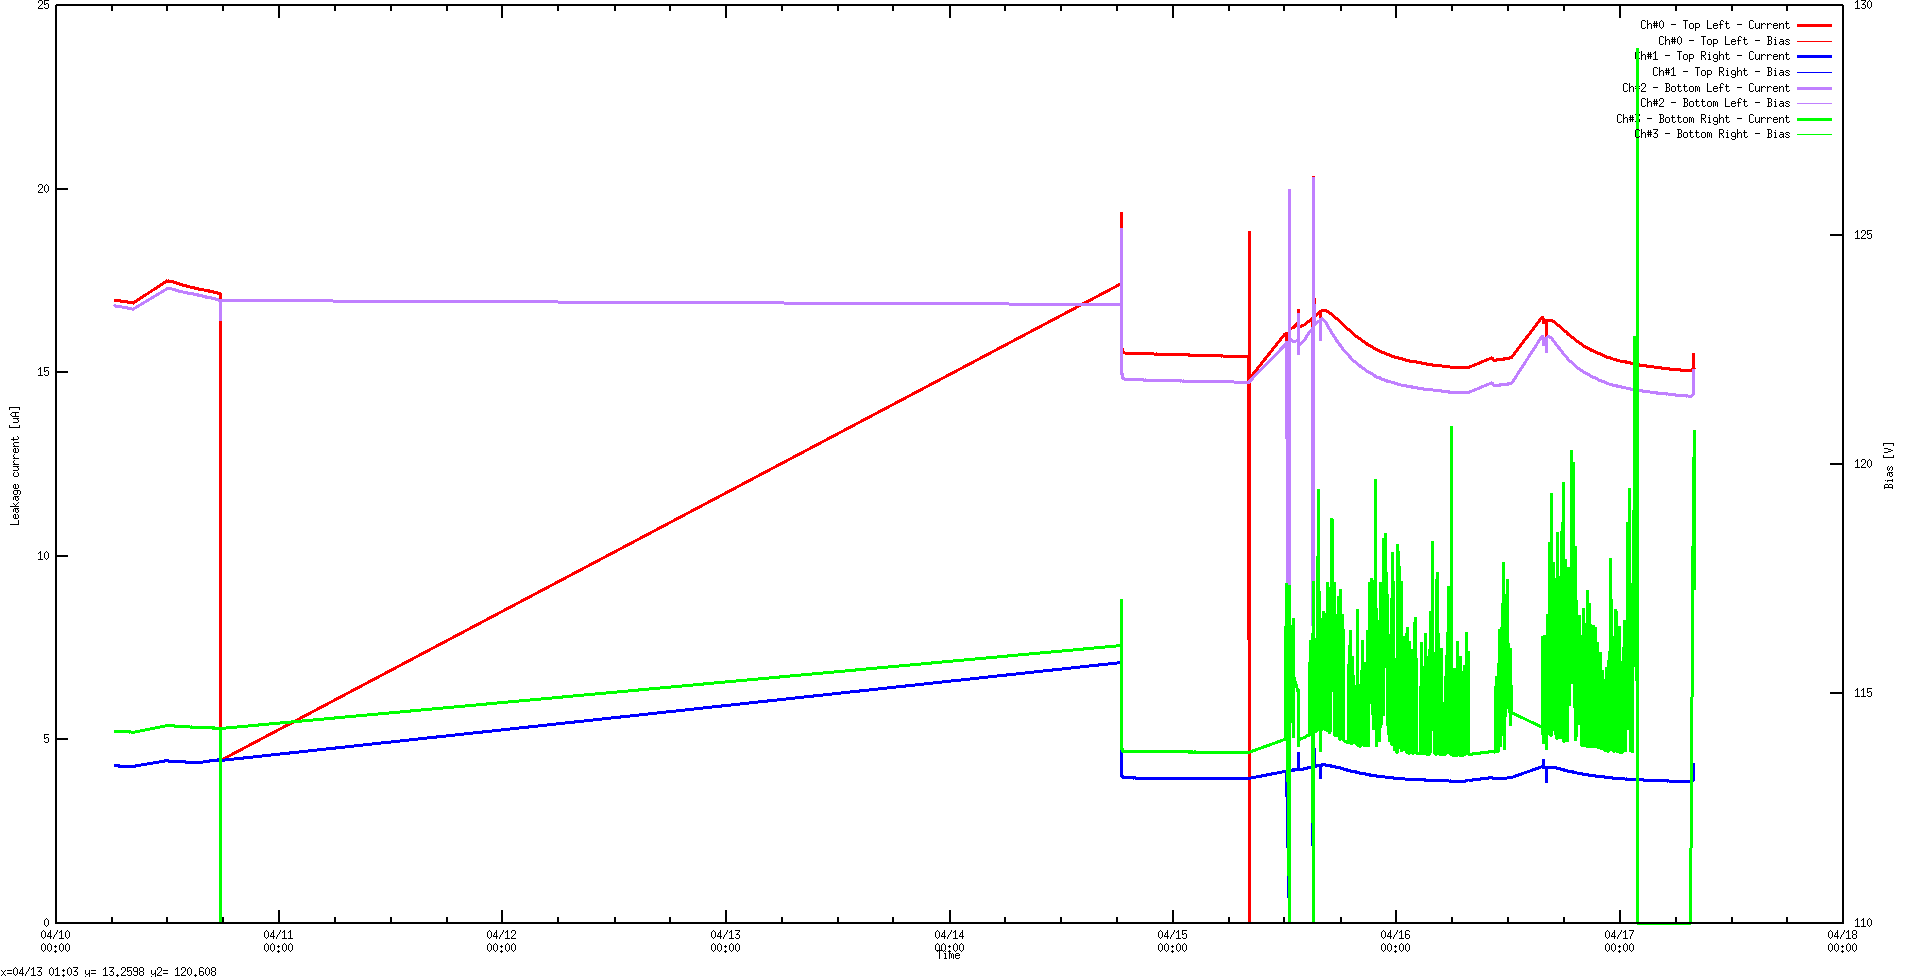
Came in to see the bias for DSSD4 which has been fluctuating for the past few days had tripped during the night. From the gnuplot it looks like it was fluctuating all night and just after midnight it went above 20uA and tripped.
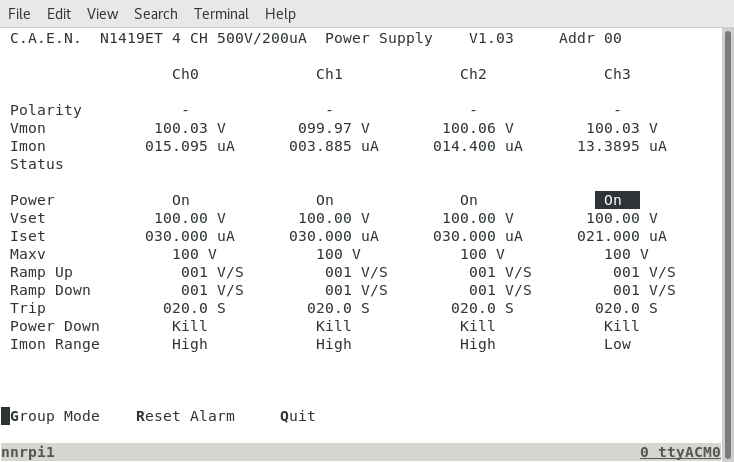
Other leakage currents are around the value they have been recently, day night cycle still observed. Again perhaps the leakage current of DSSD1 and DSSD3 is slowly decreasing and reaching a lower minimum value. Reset the module, DSSD4 does bias back up and is currently around 10uA. See attachments 1+2.
I have also noticed a small spike in current when starting up the FEE power, see the small spikes in attachment 2.
Continuing with different ground configurations from yesterday.
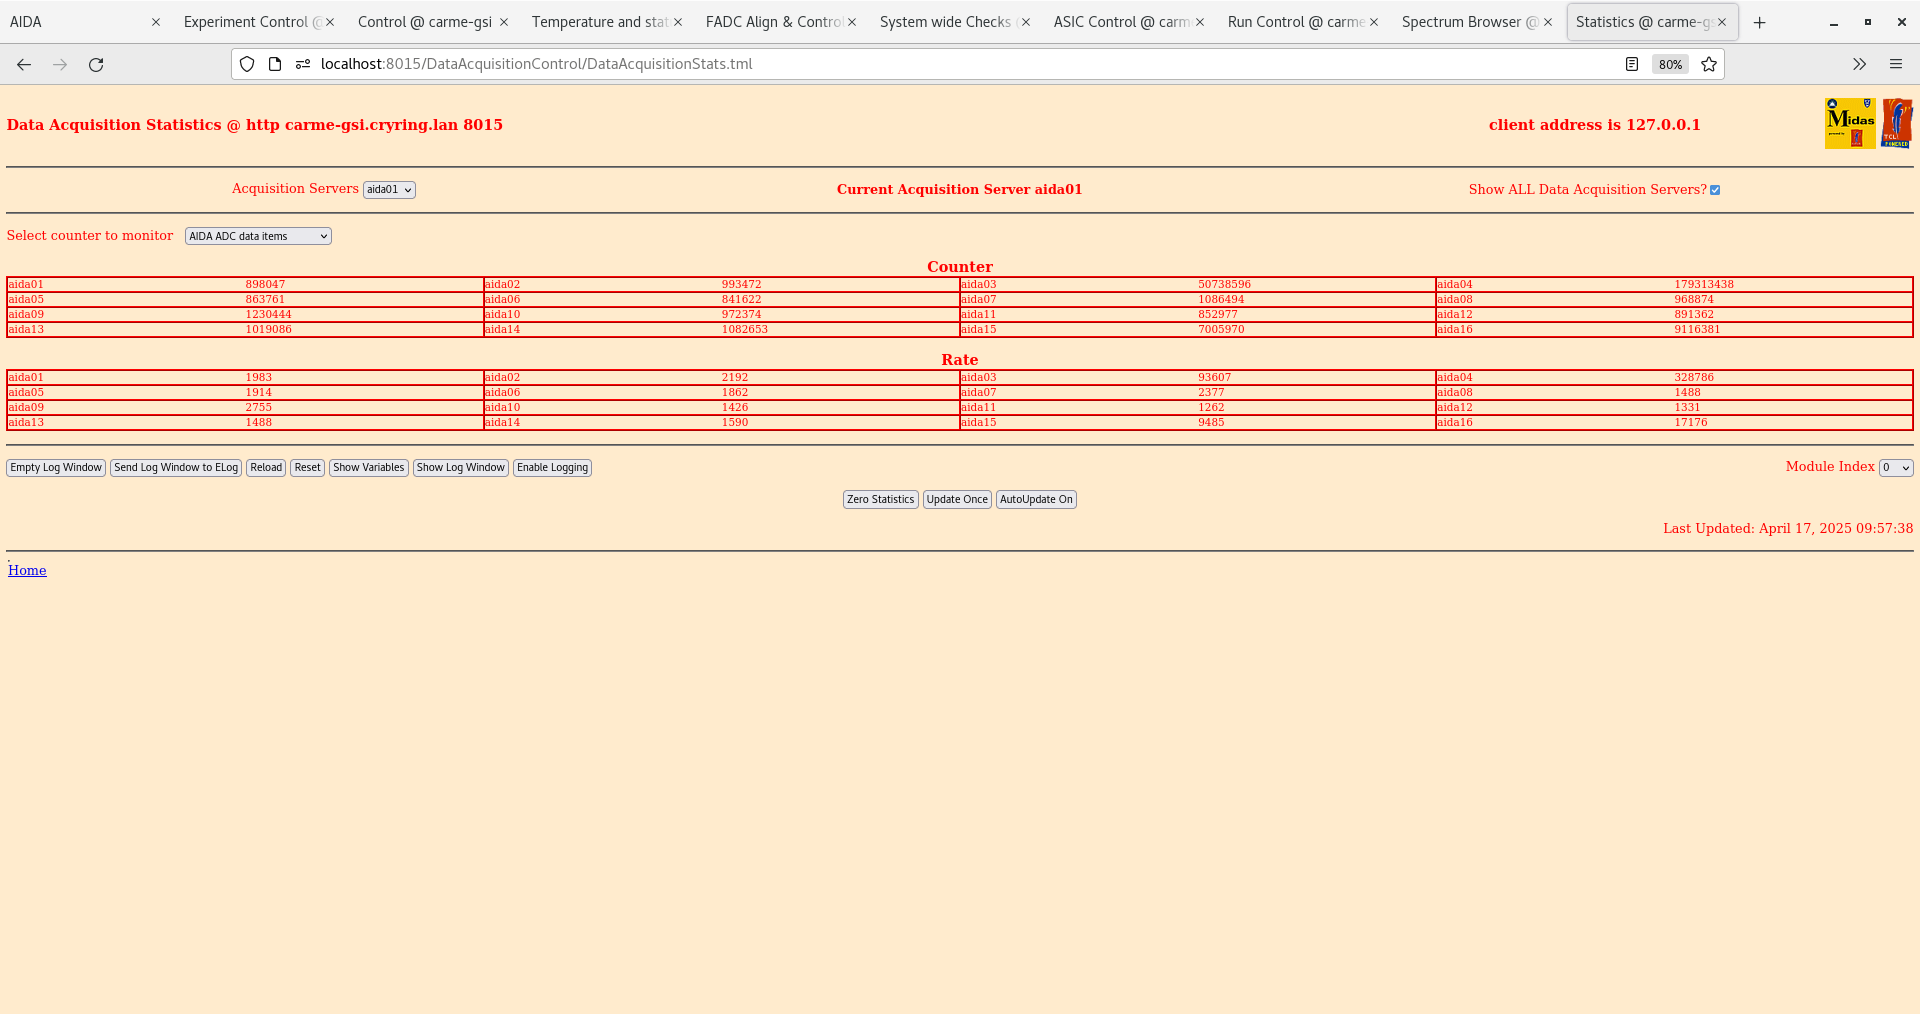
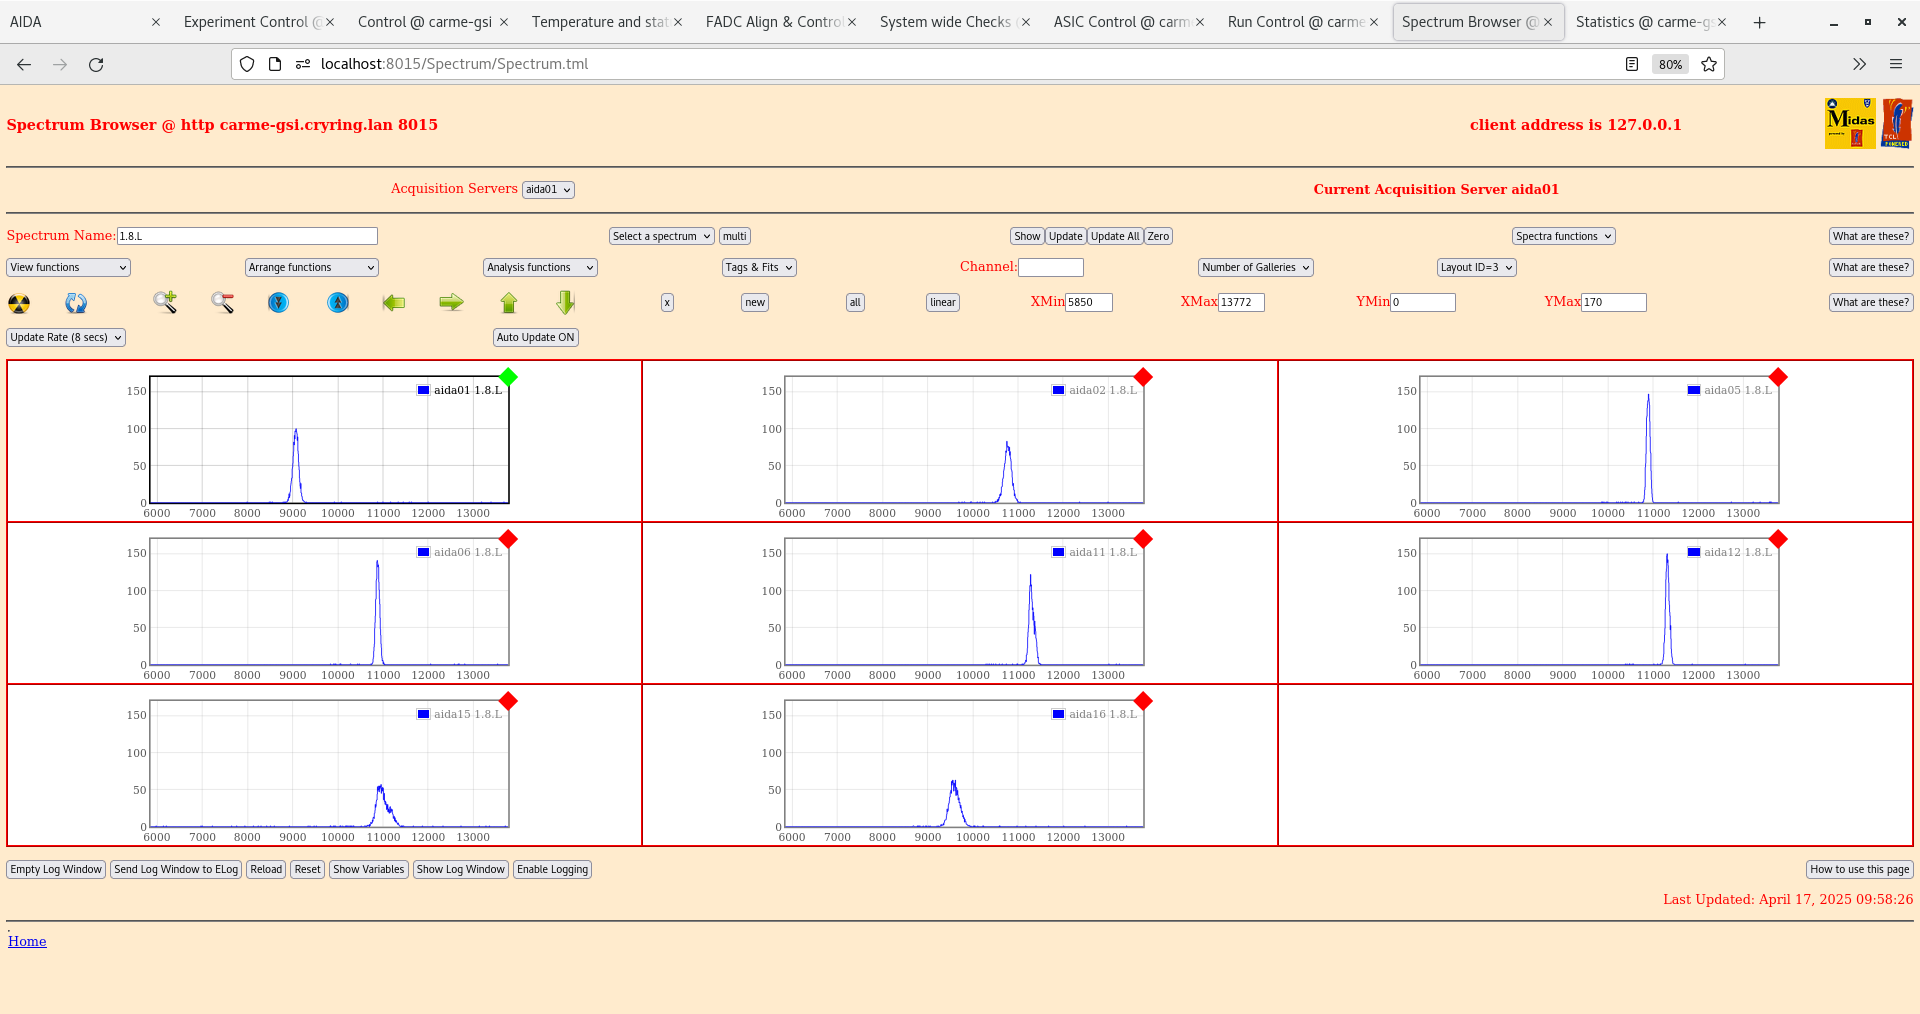
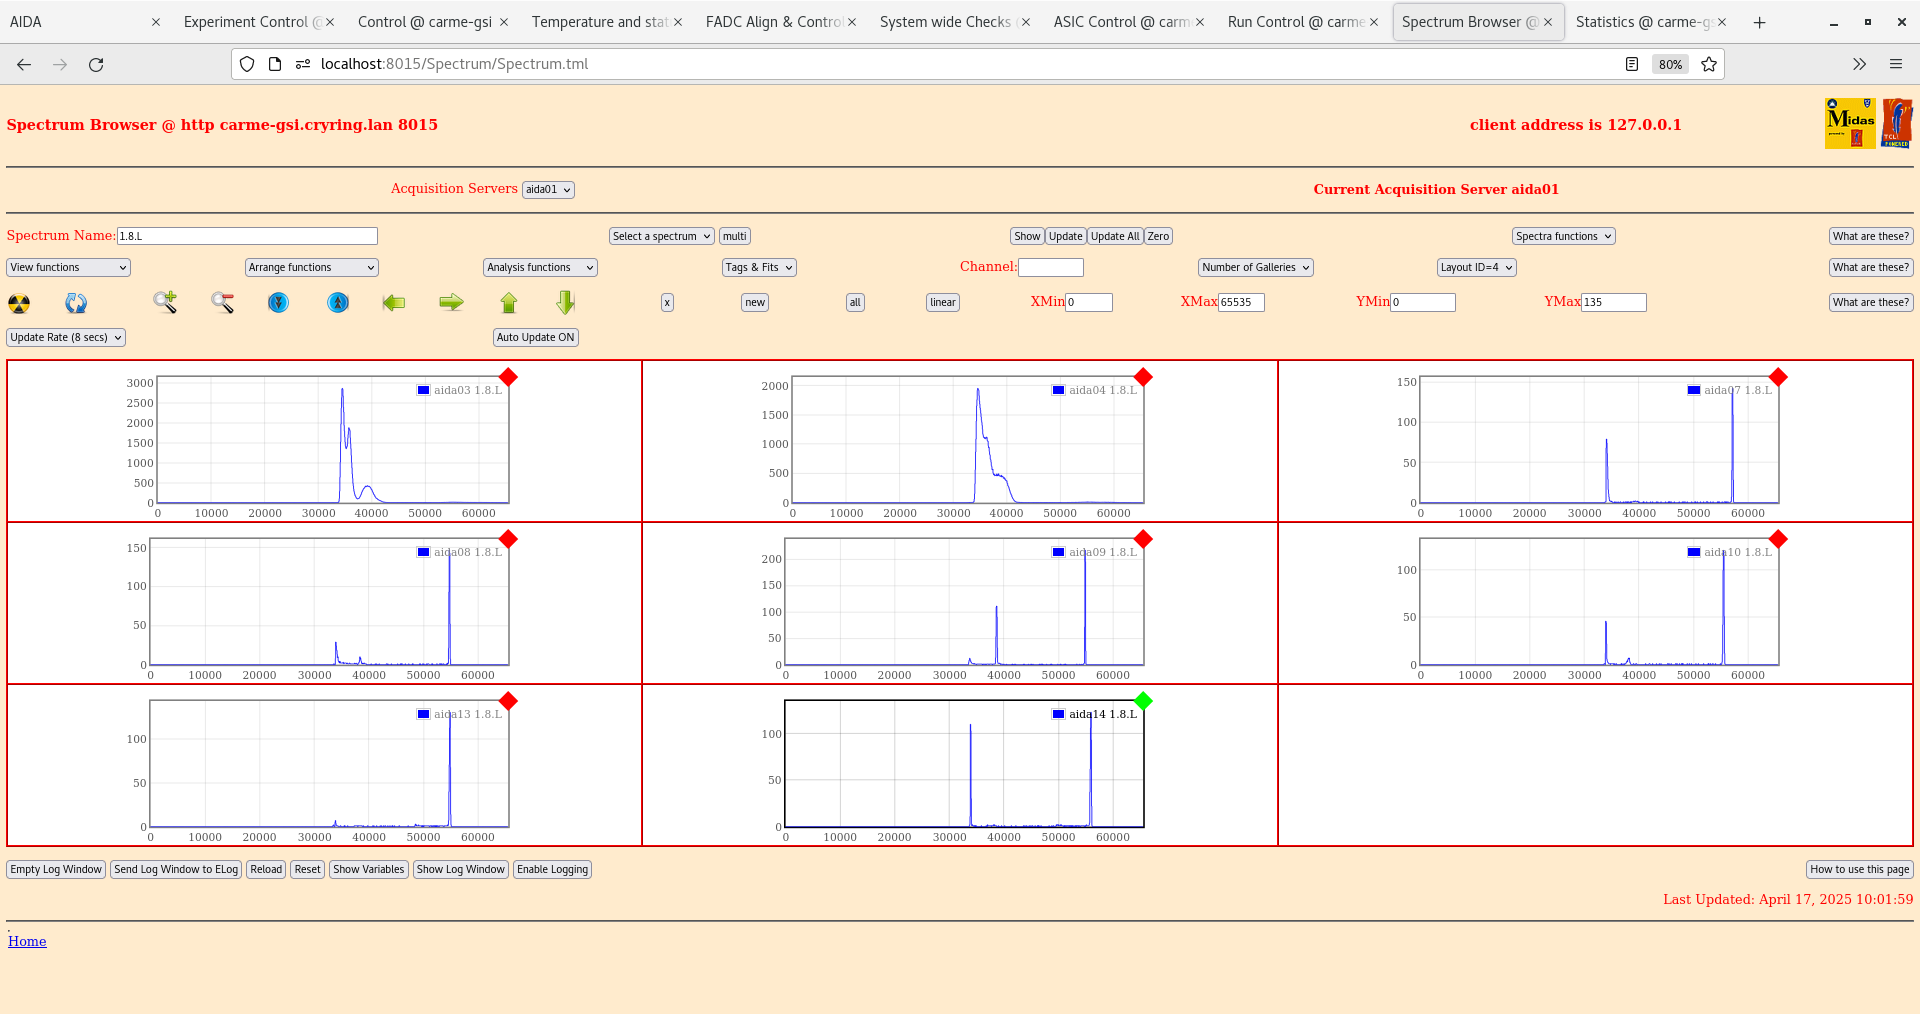
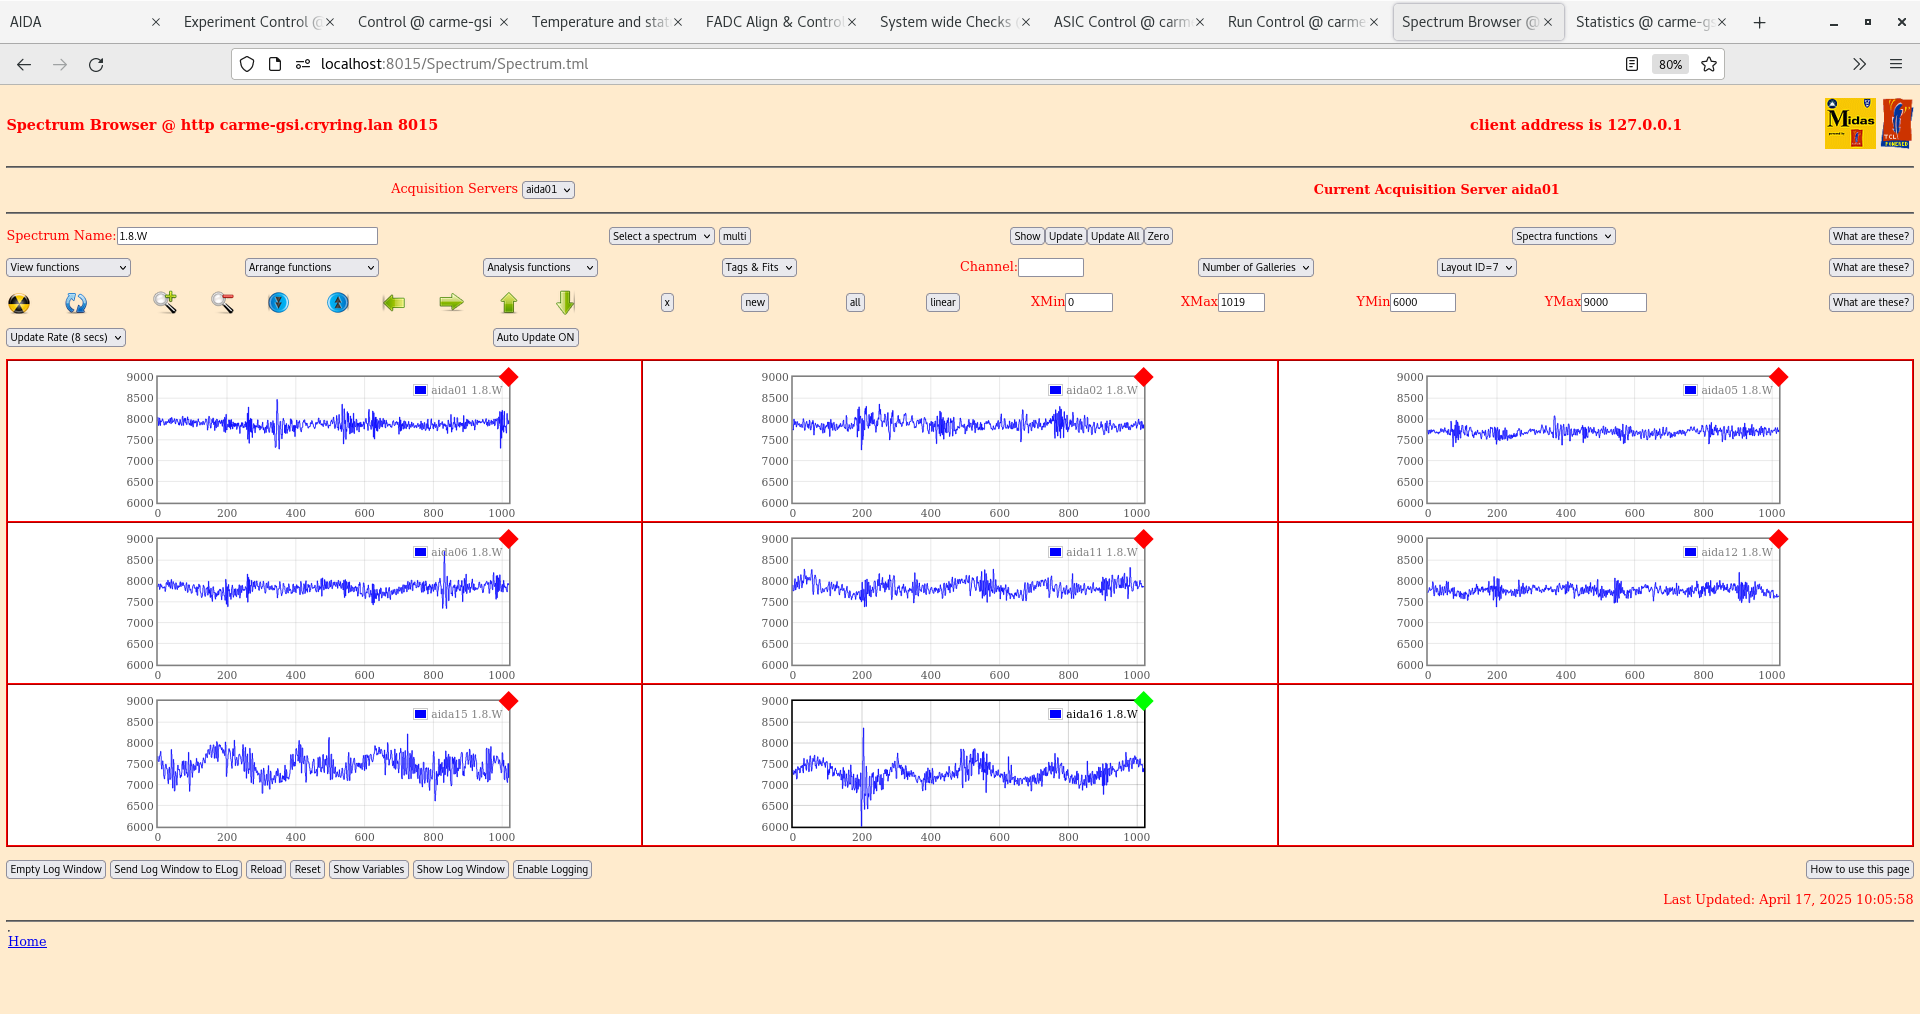
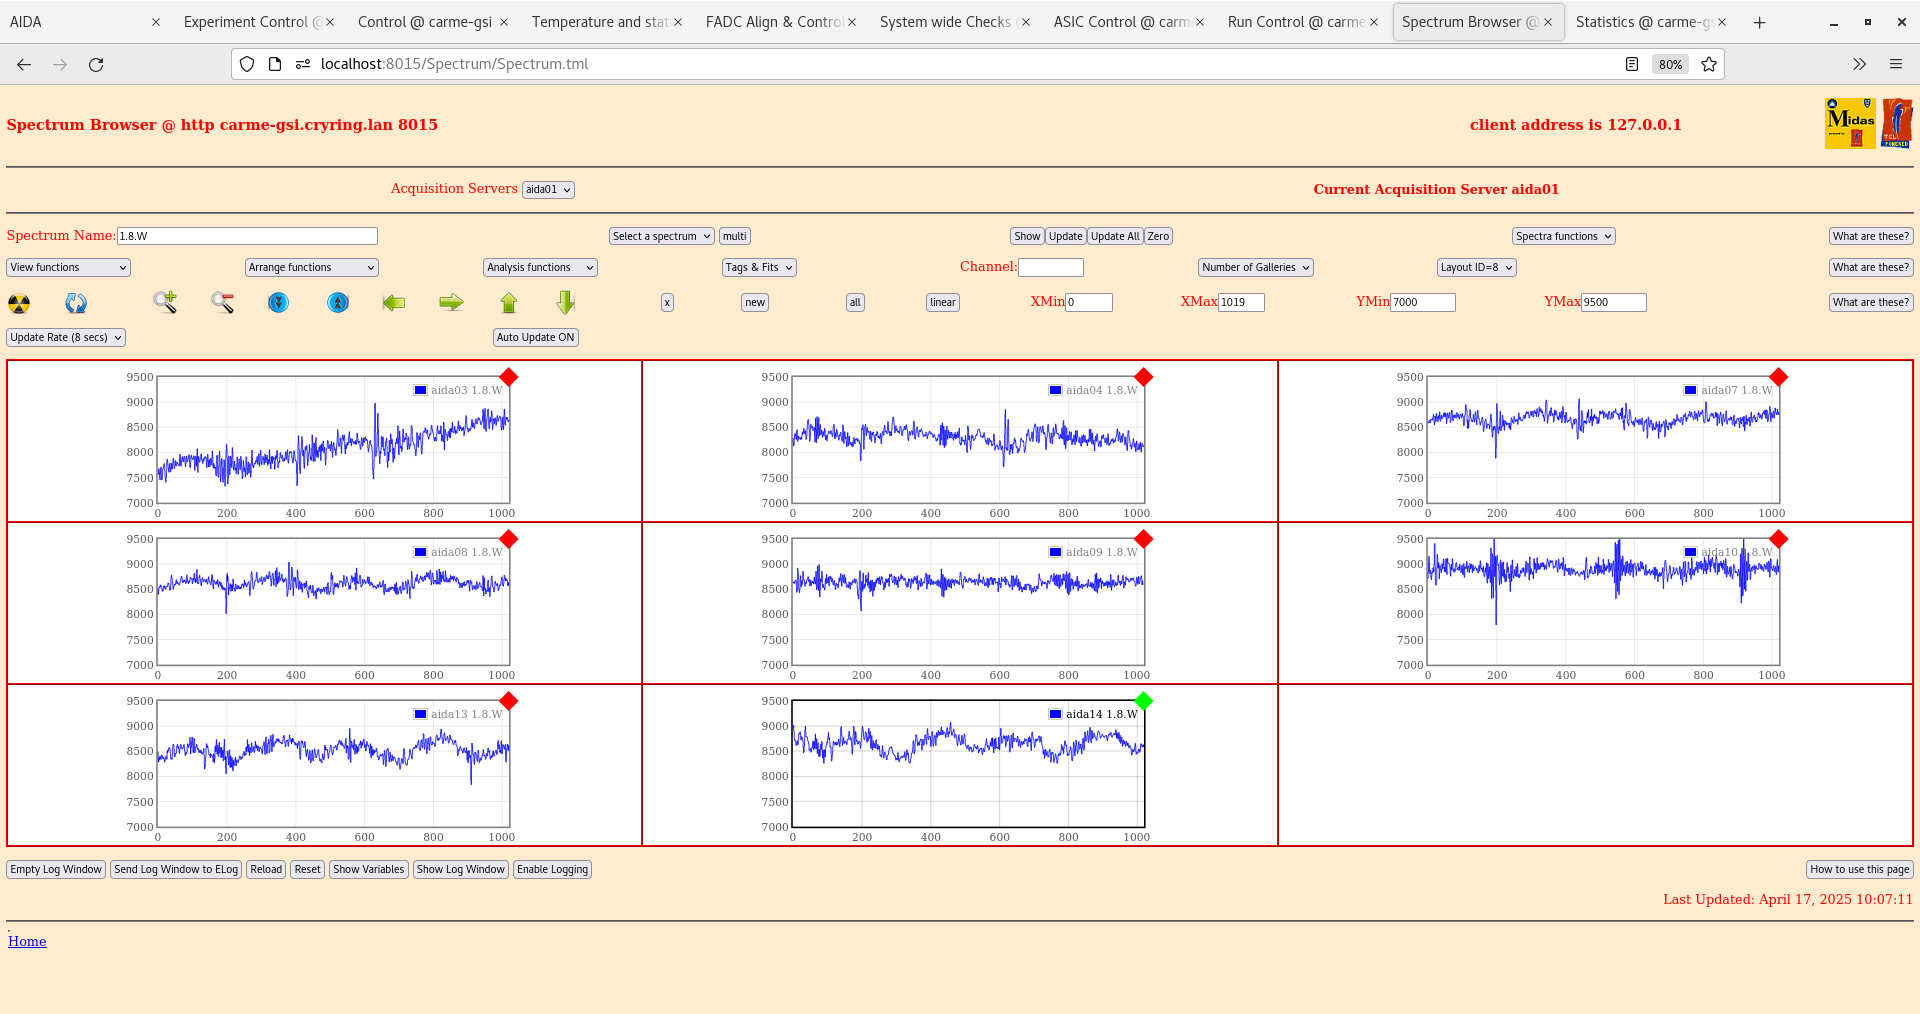
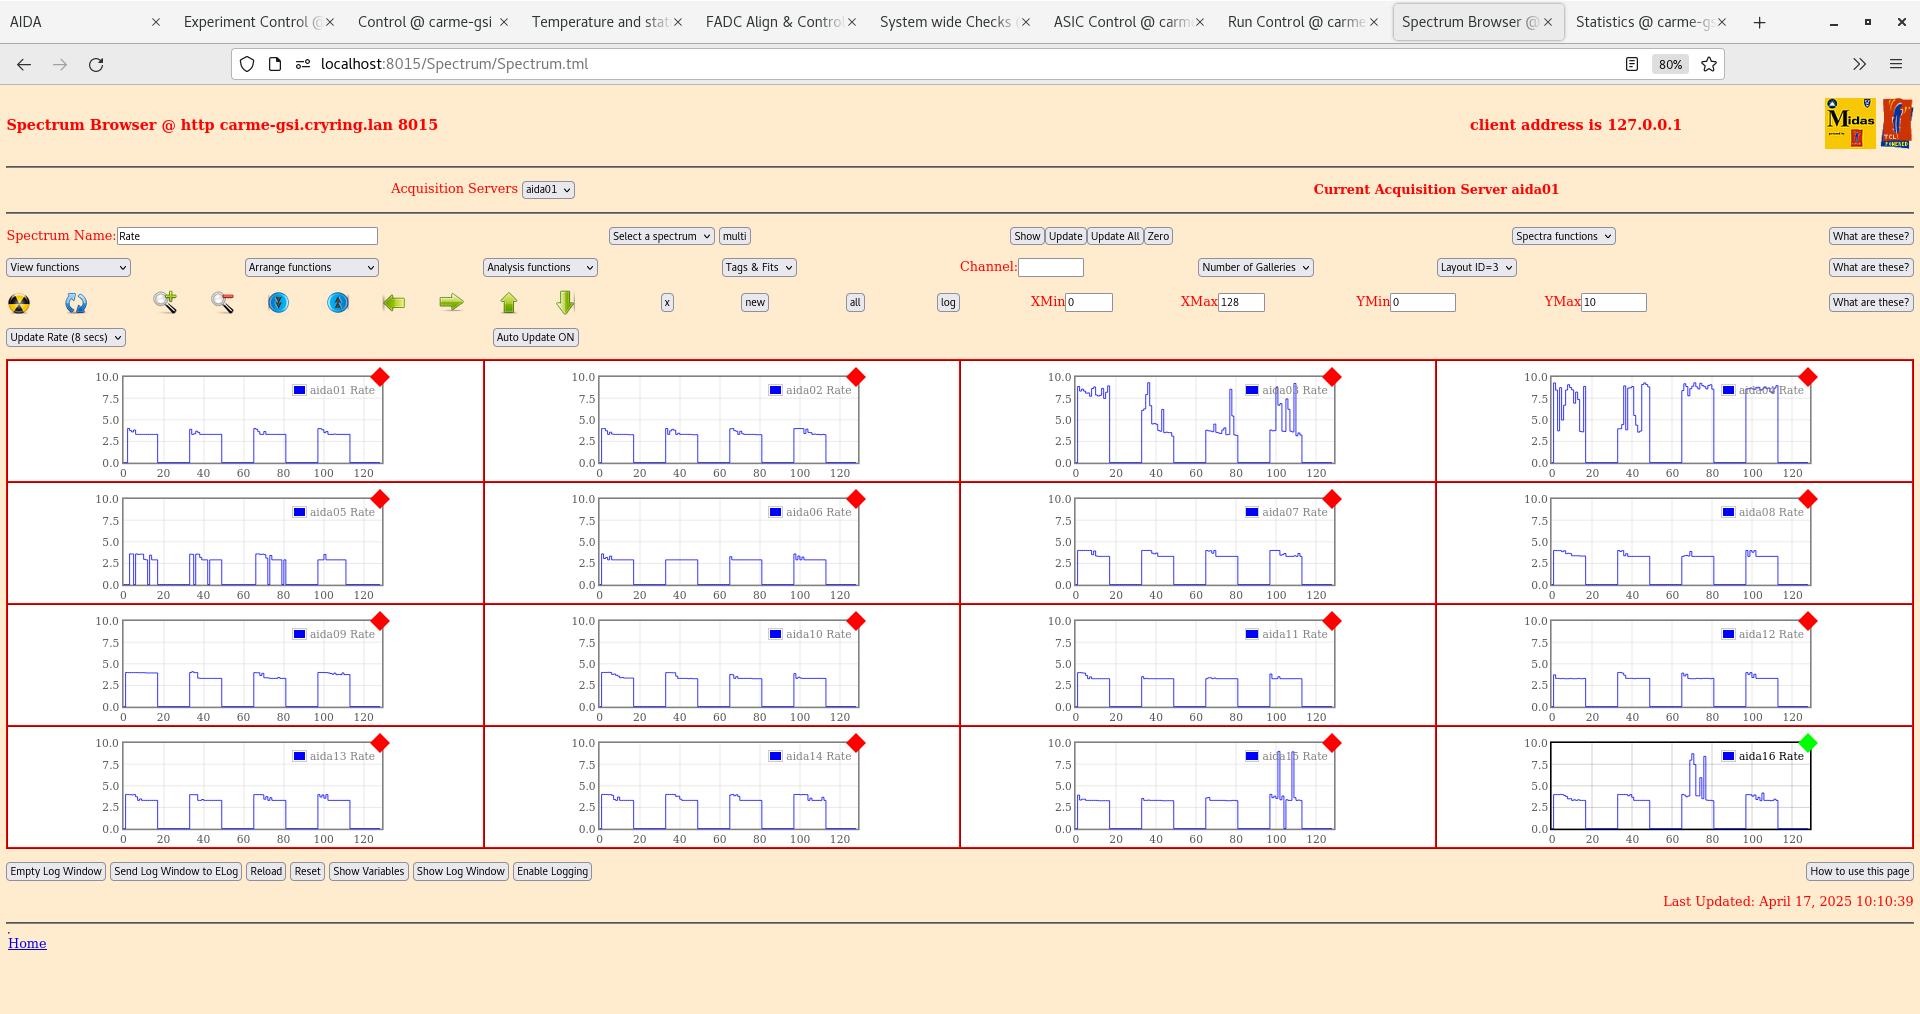
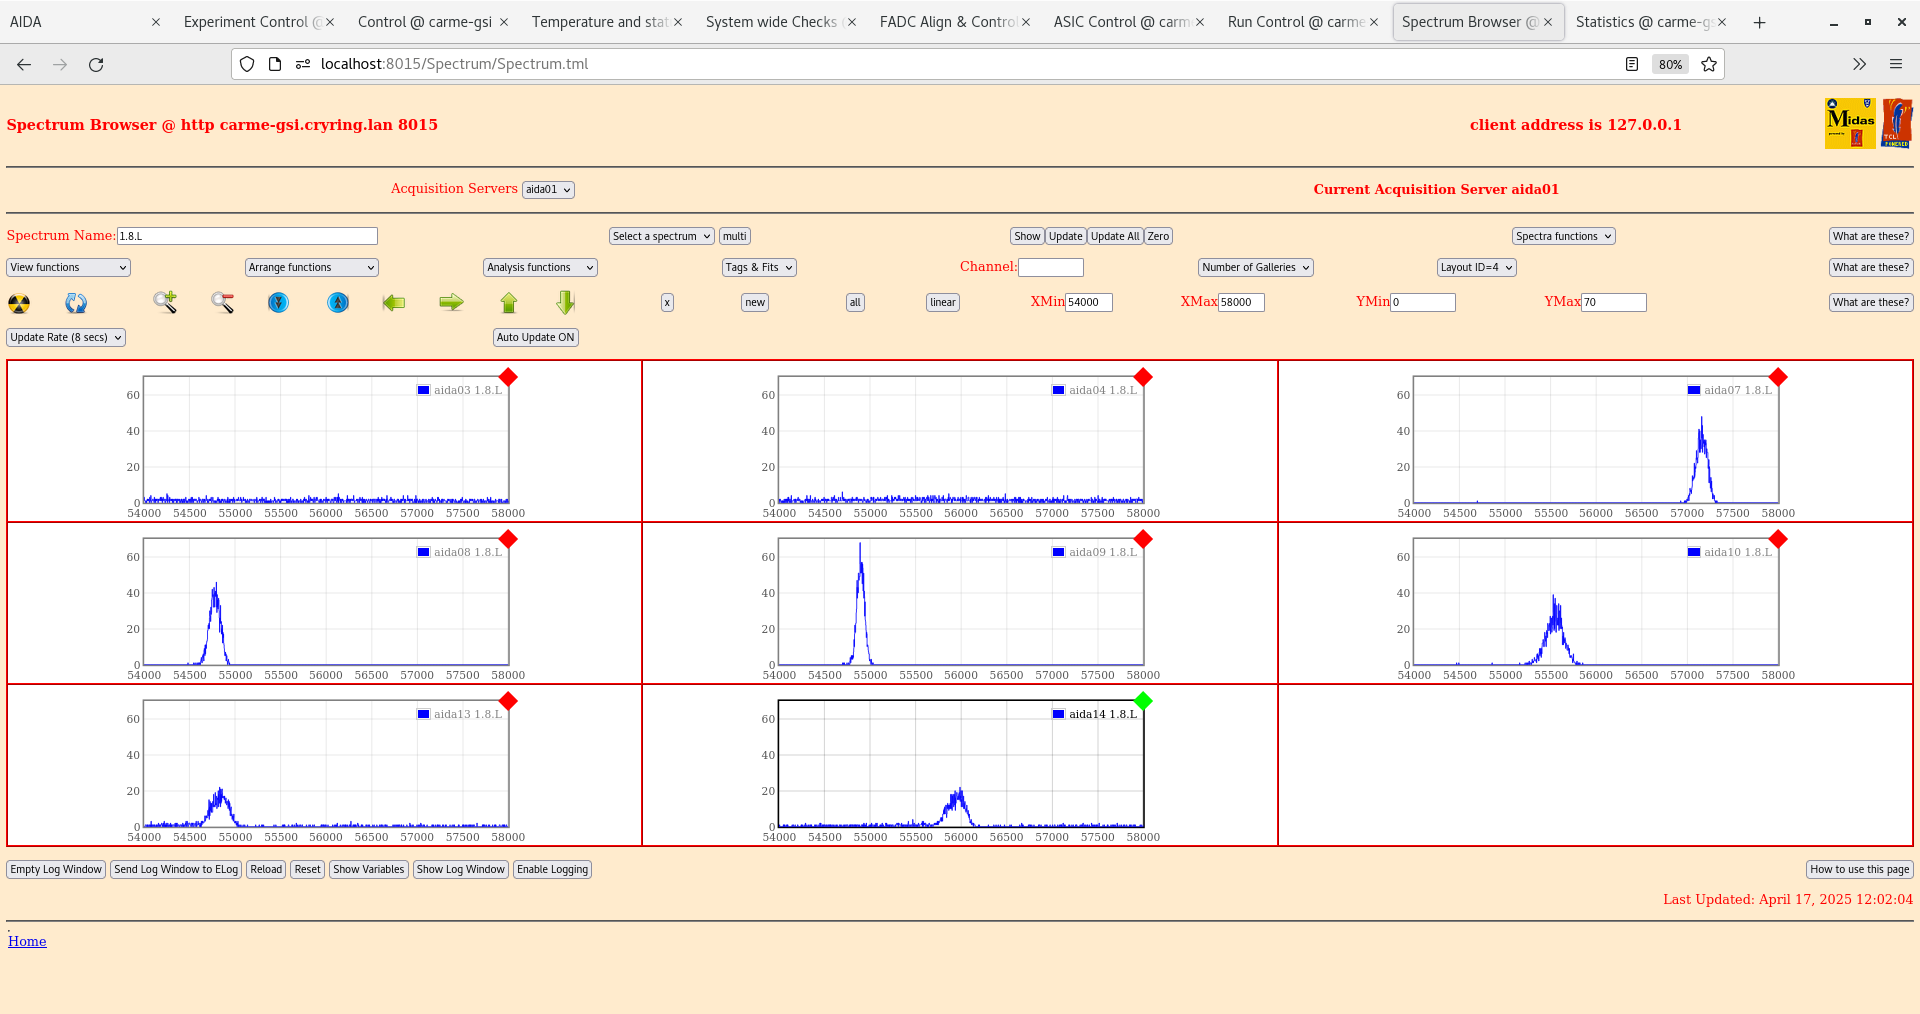
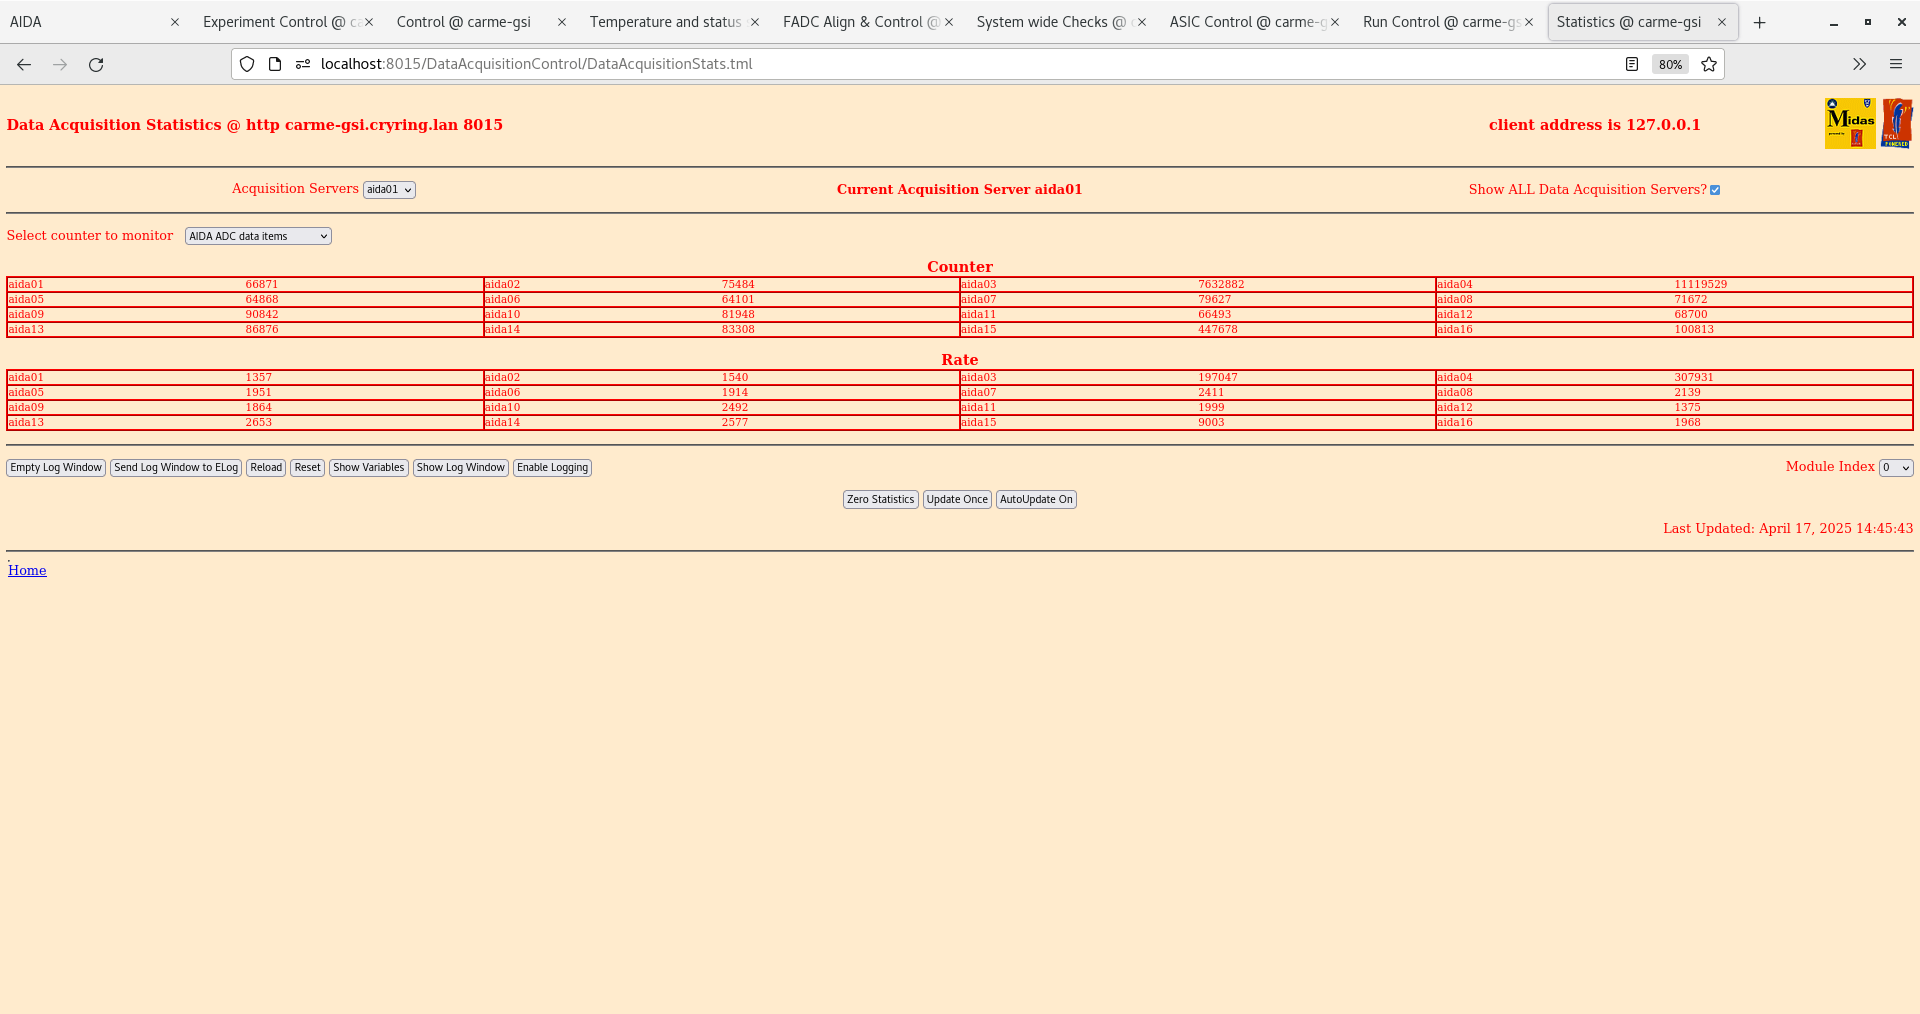
Ground config 5: I have now removed the grounding cables between non-bias FEE modules. So grounding cable goes between pn and nn bias FEEs and then one grounding cable to the coolant pipe. No grounding on any other FEEs. (attachments 3-8). Effect on pulser widths is hard to discern, some widths have decreased i.e 5 and 6 wheras others have increased such as 11. One interesting note is that the rates on aida03 have decreased by just over a factor 2 so now read ~100k. Whether this is the result of different grounding or maybe similar to what was seen for DSSD3 where rates decreased on there own over time? Attachment 8 shows the rates for each ASIC and most have now reached similar level to the other FEEs (note log scale).
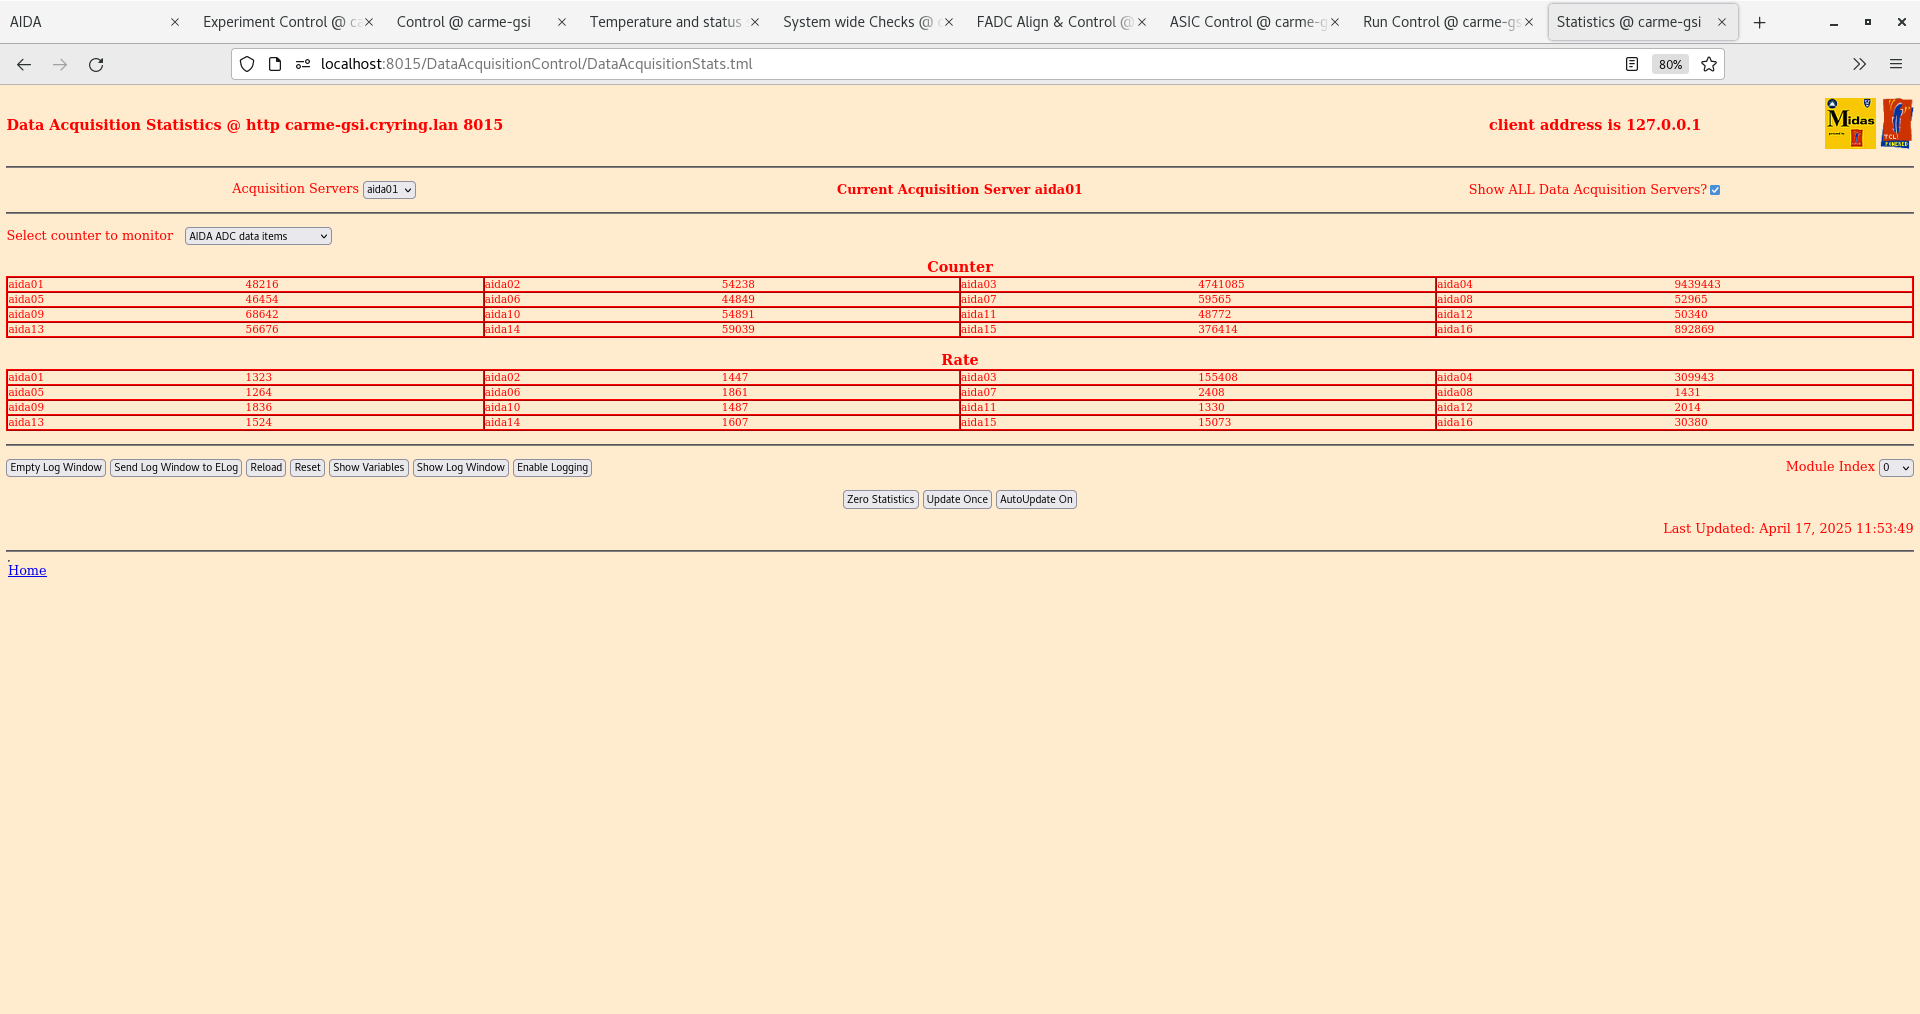
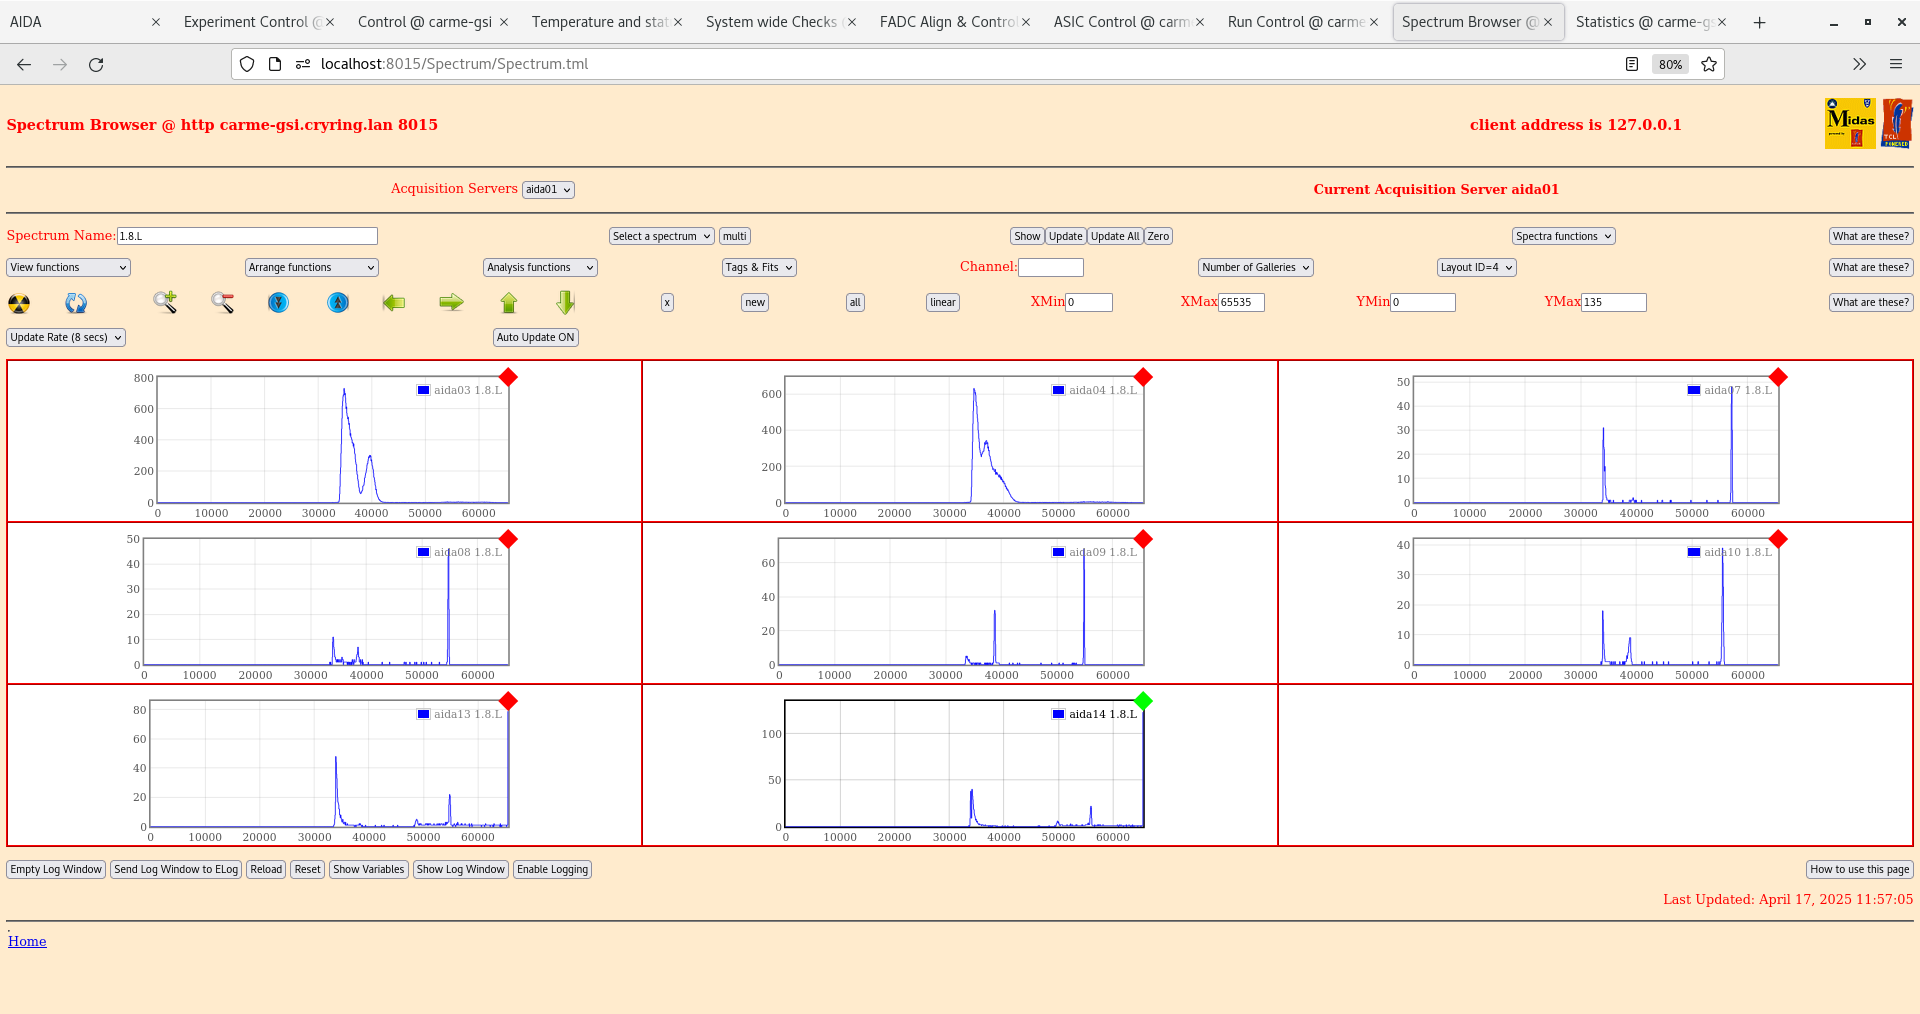
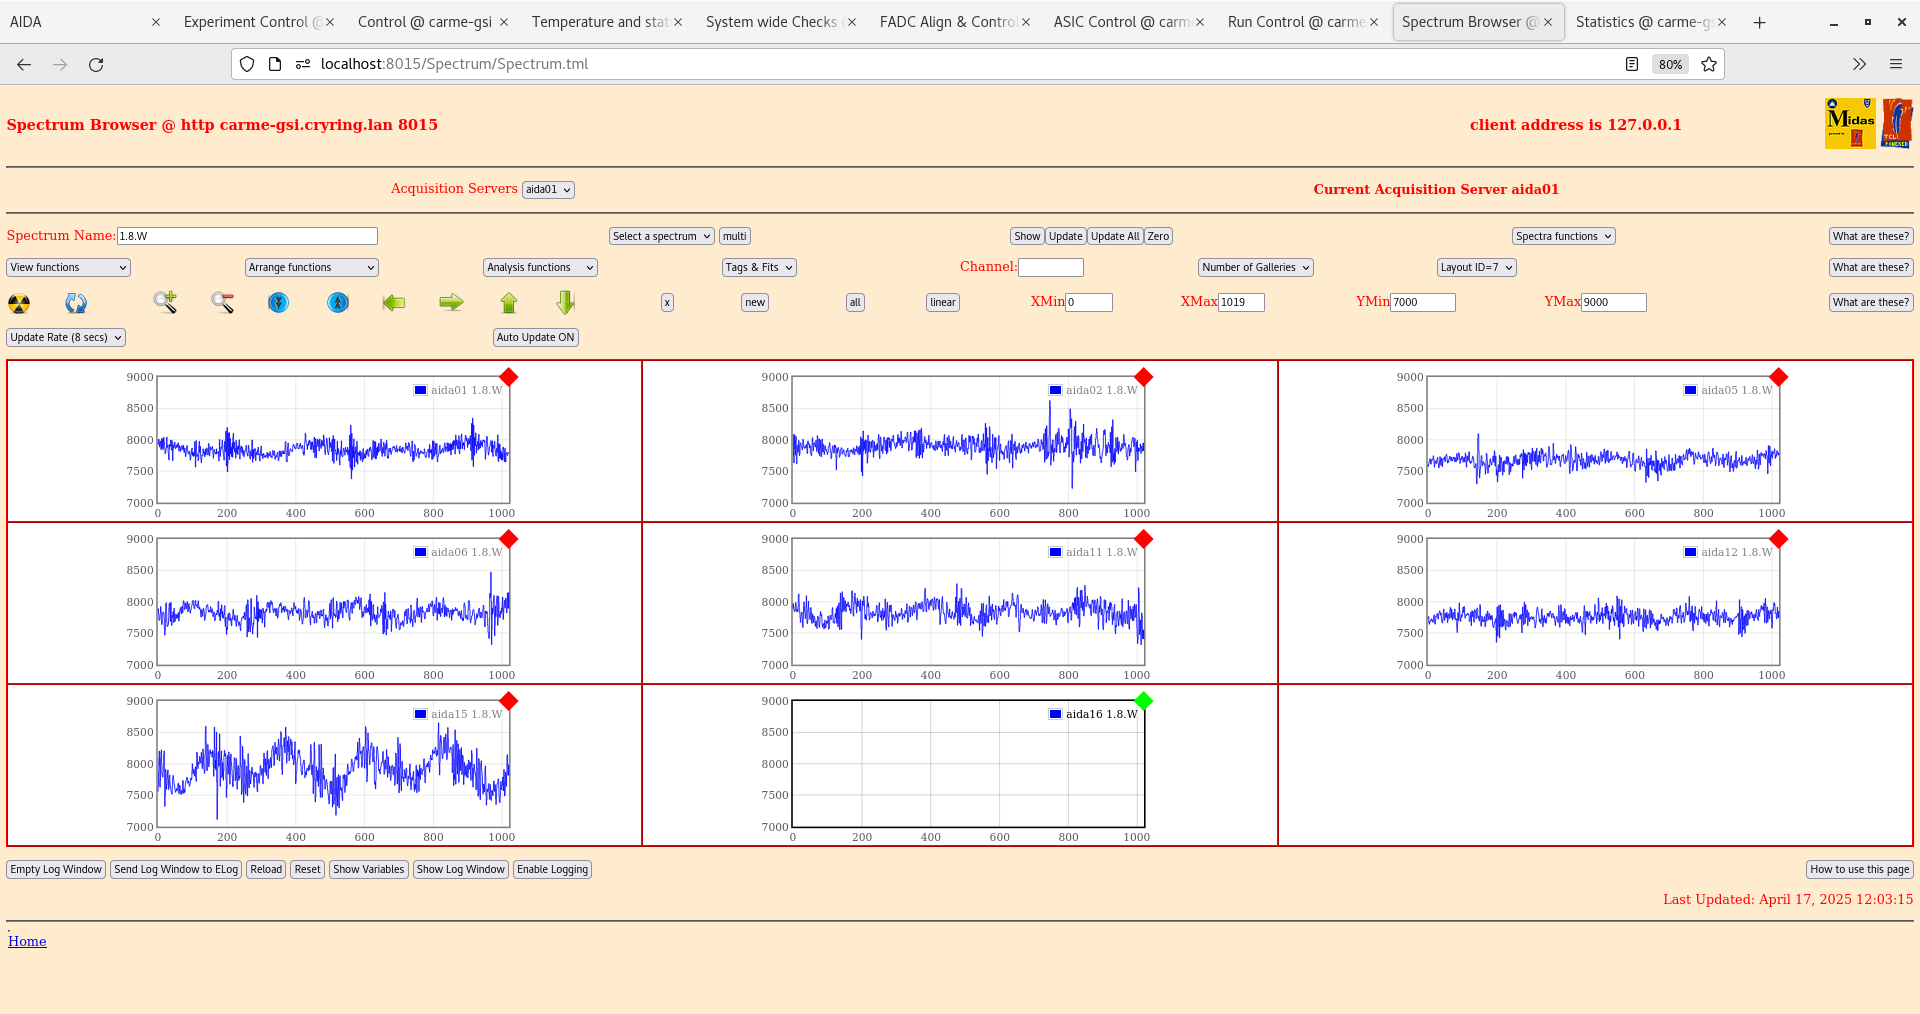
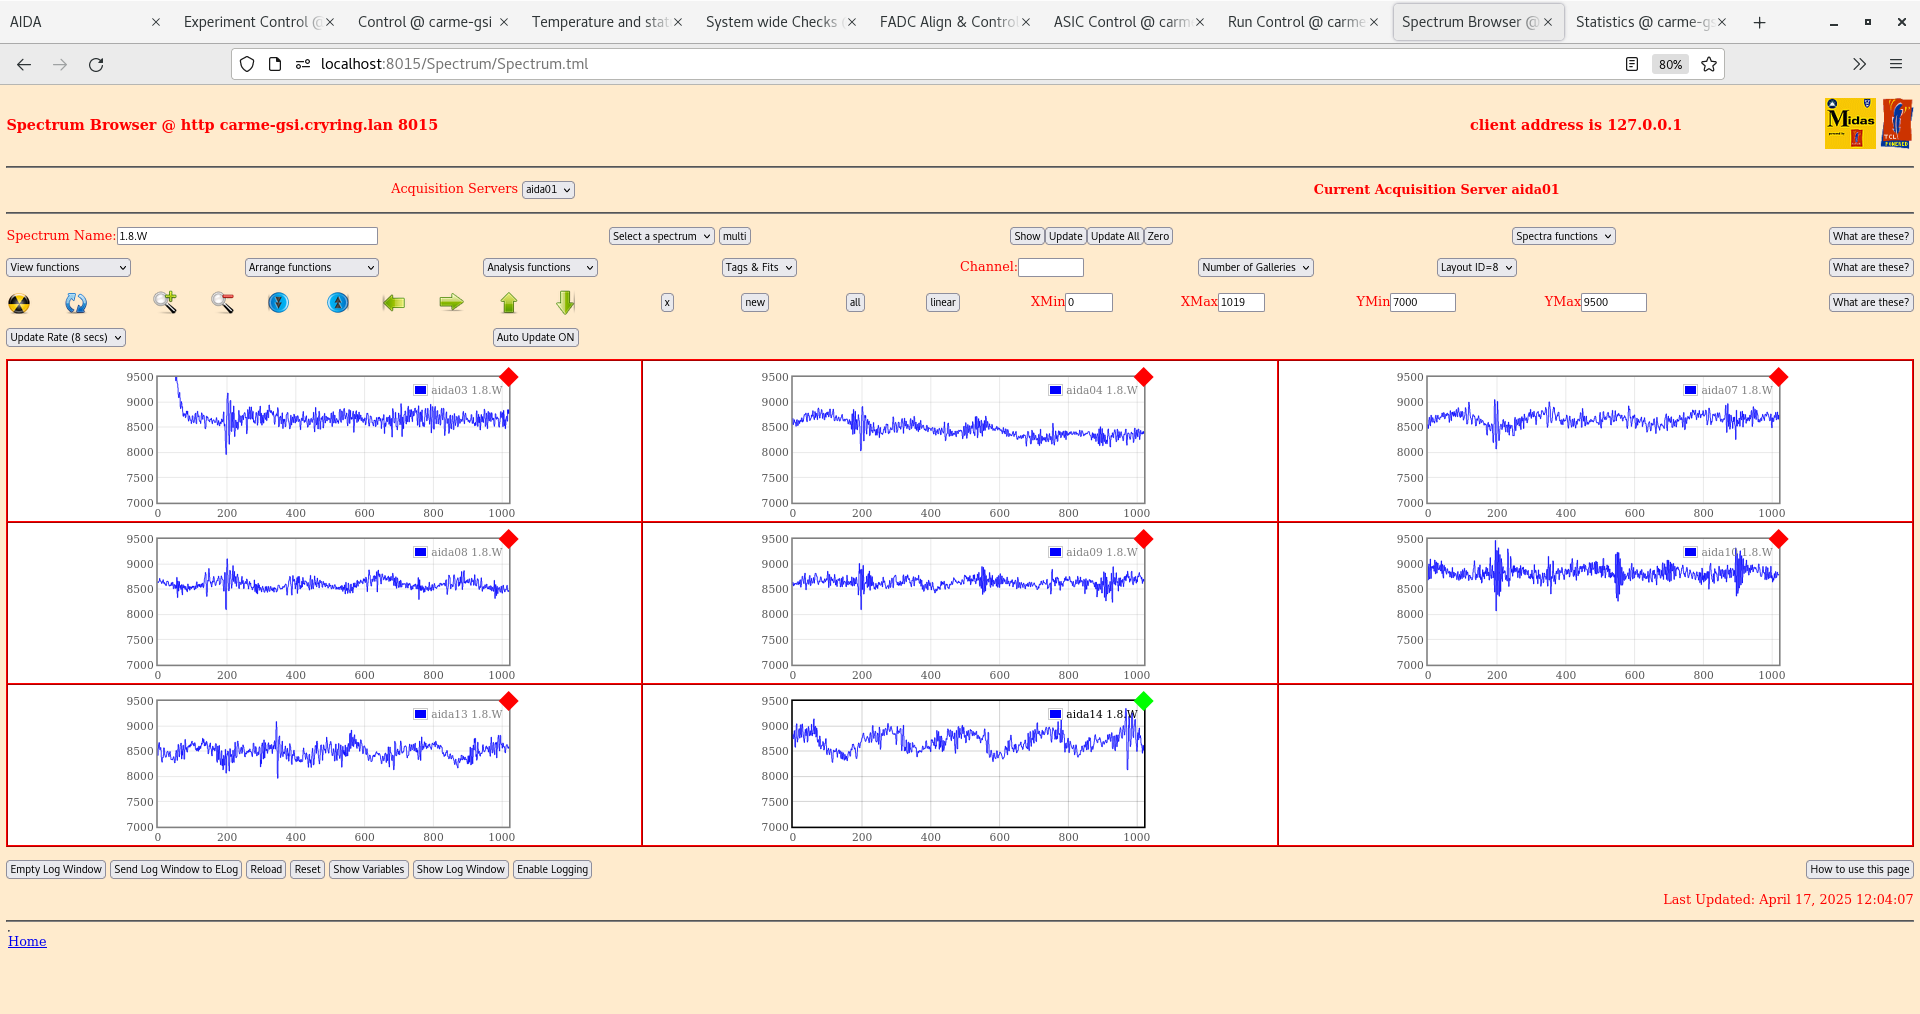
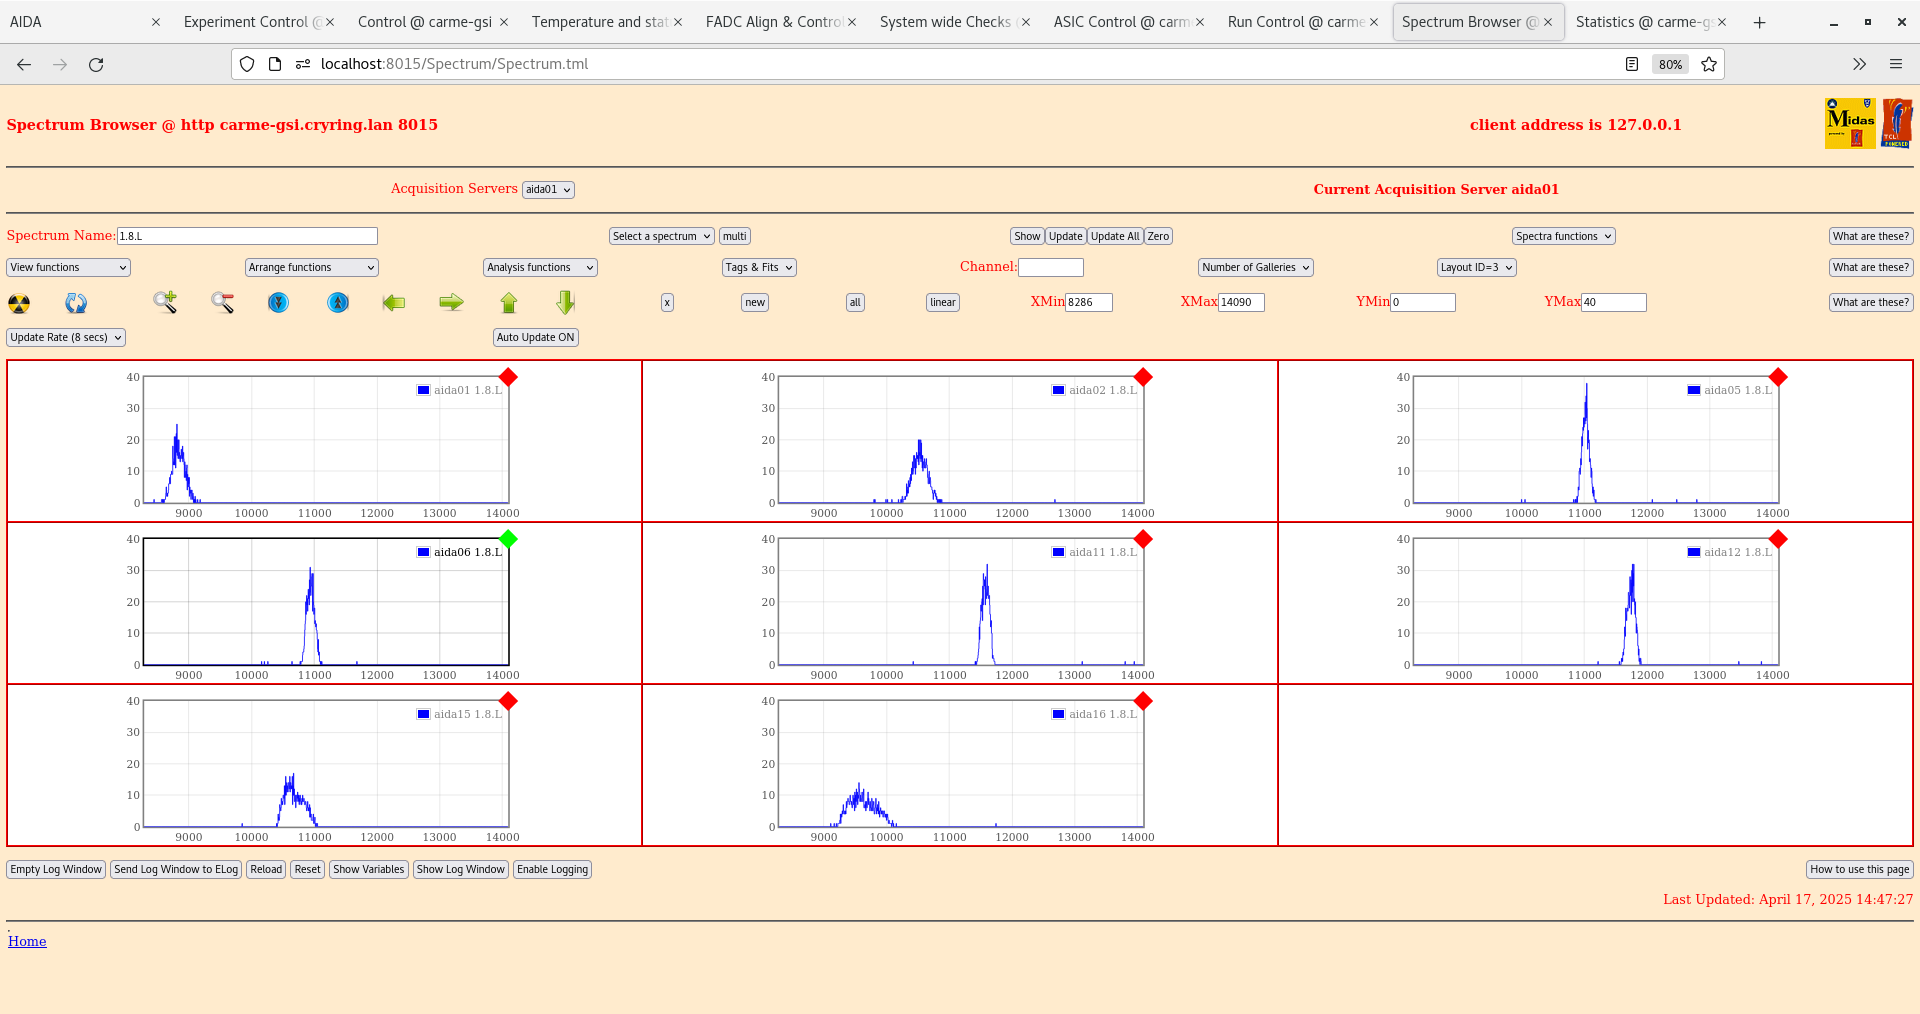
Ground config 6: Have kept grounds to only pn or nn bias FEEs. Have now also included a ground cable from the body of the FEE module into the grounding connection. The ADC data items rate increase from 100k to 150k in aida03, no other impact on rates. Pulser widths remain largely unchanged, although some widths saw increases in the pulser widths. (attachments 9-13)
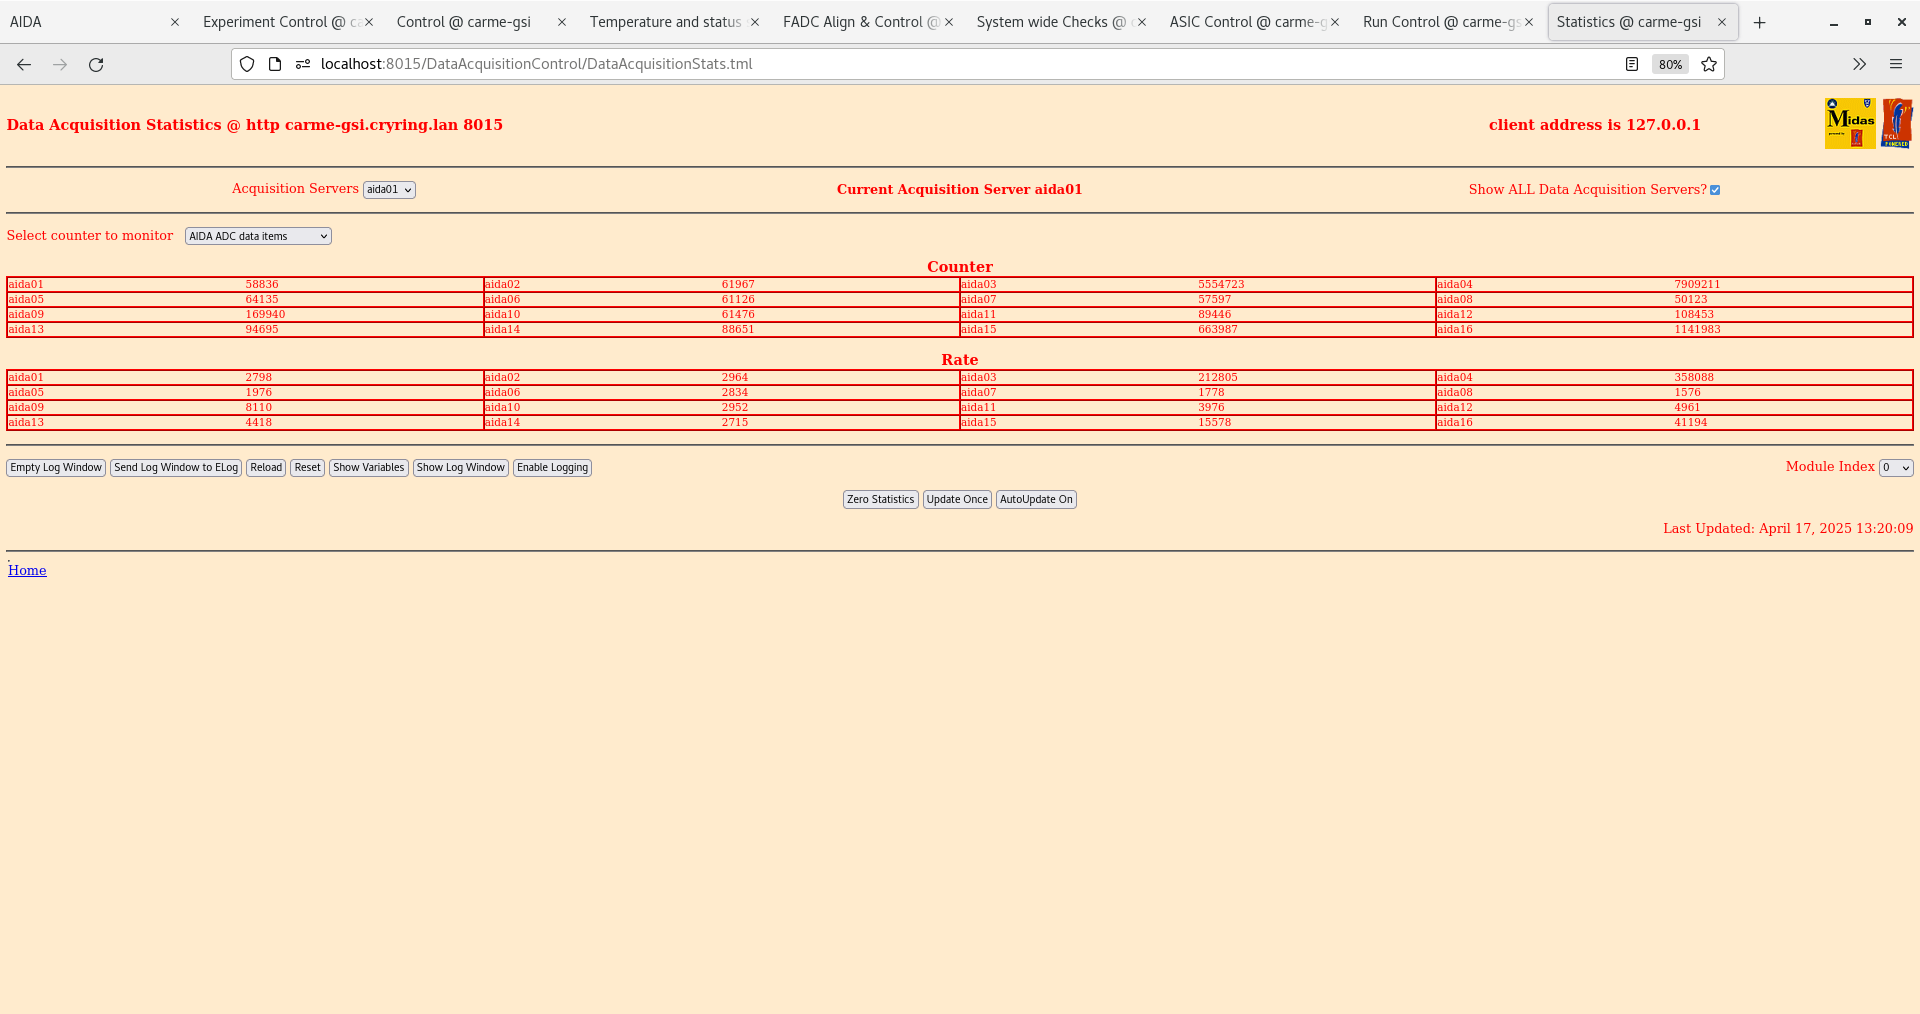
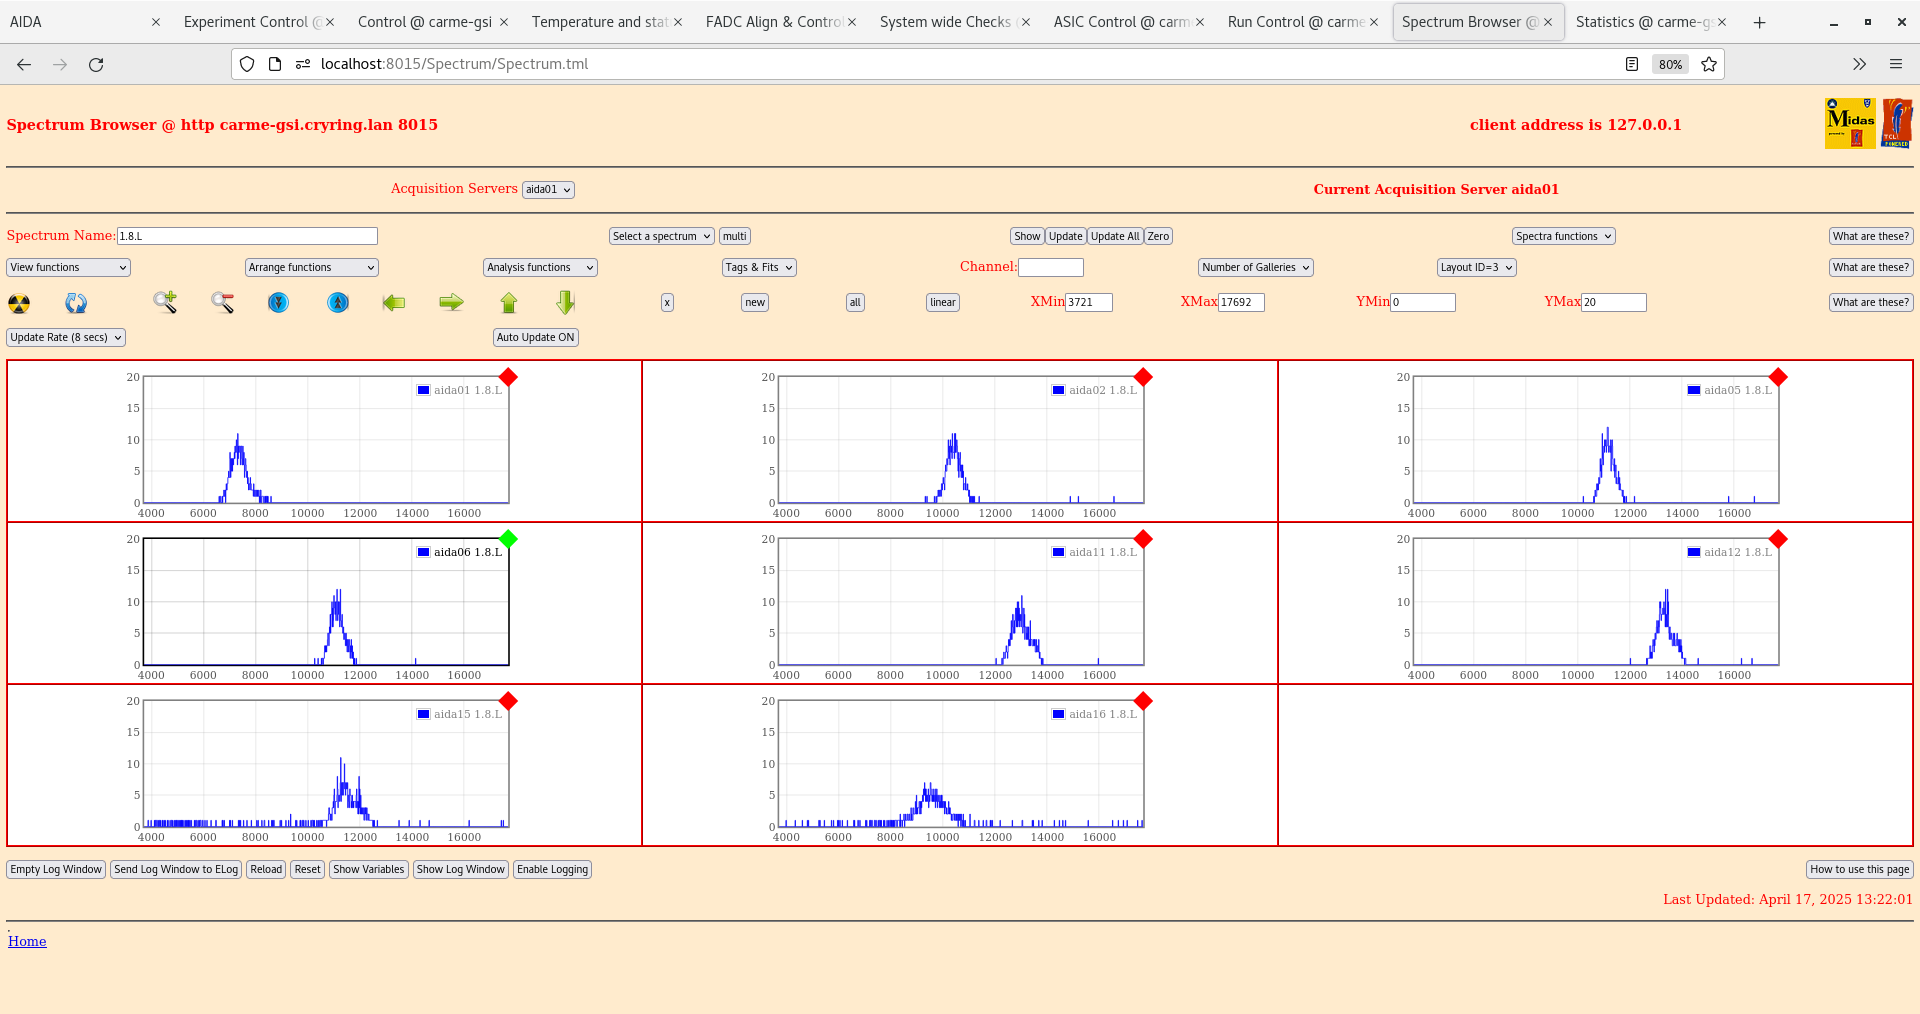
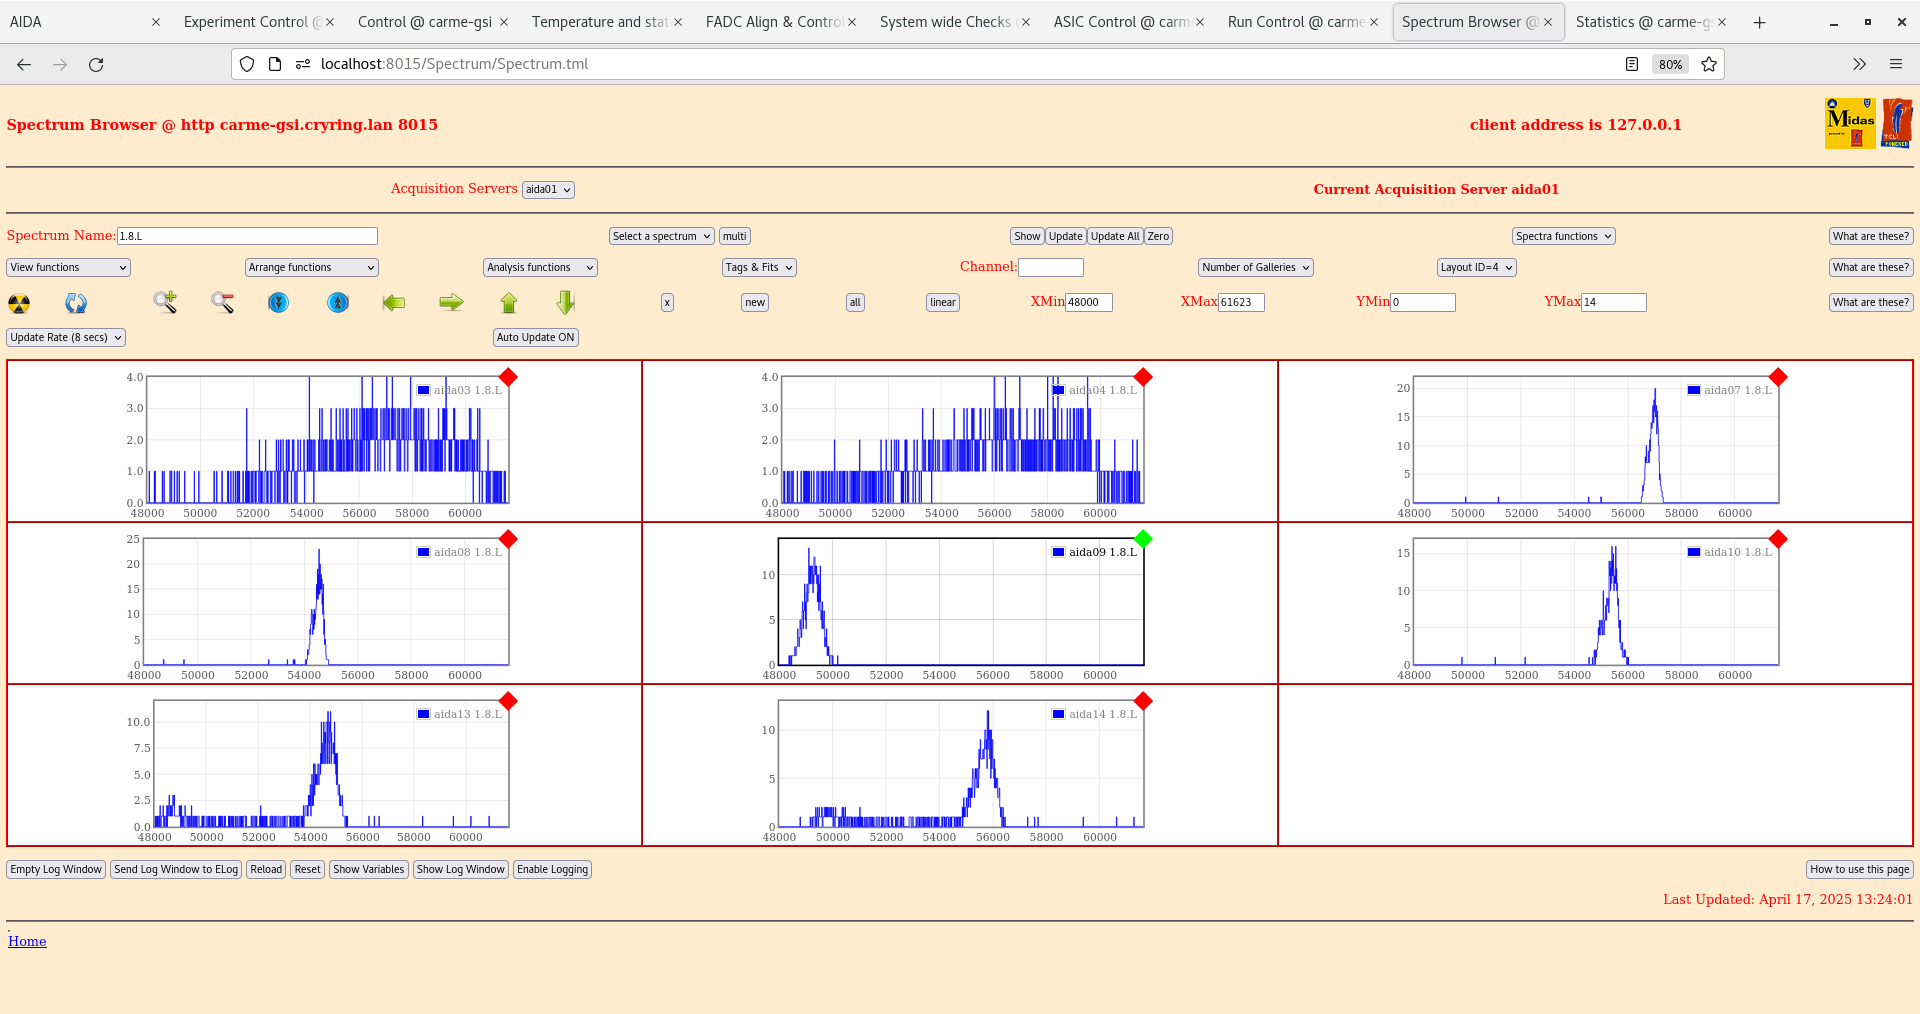
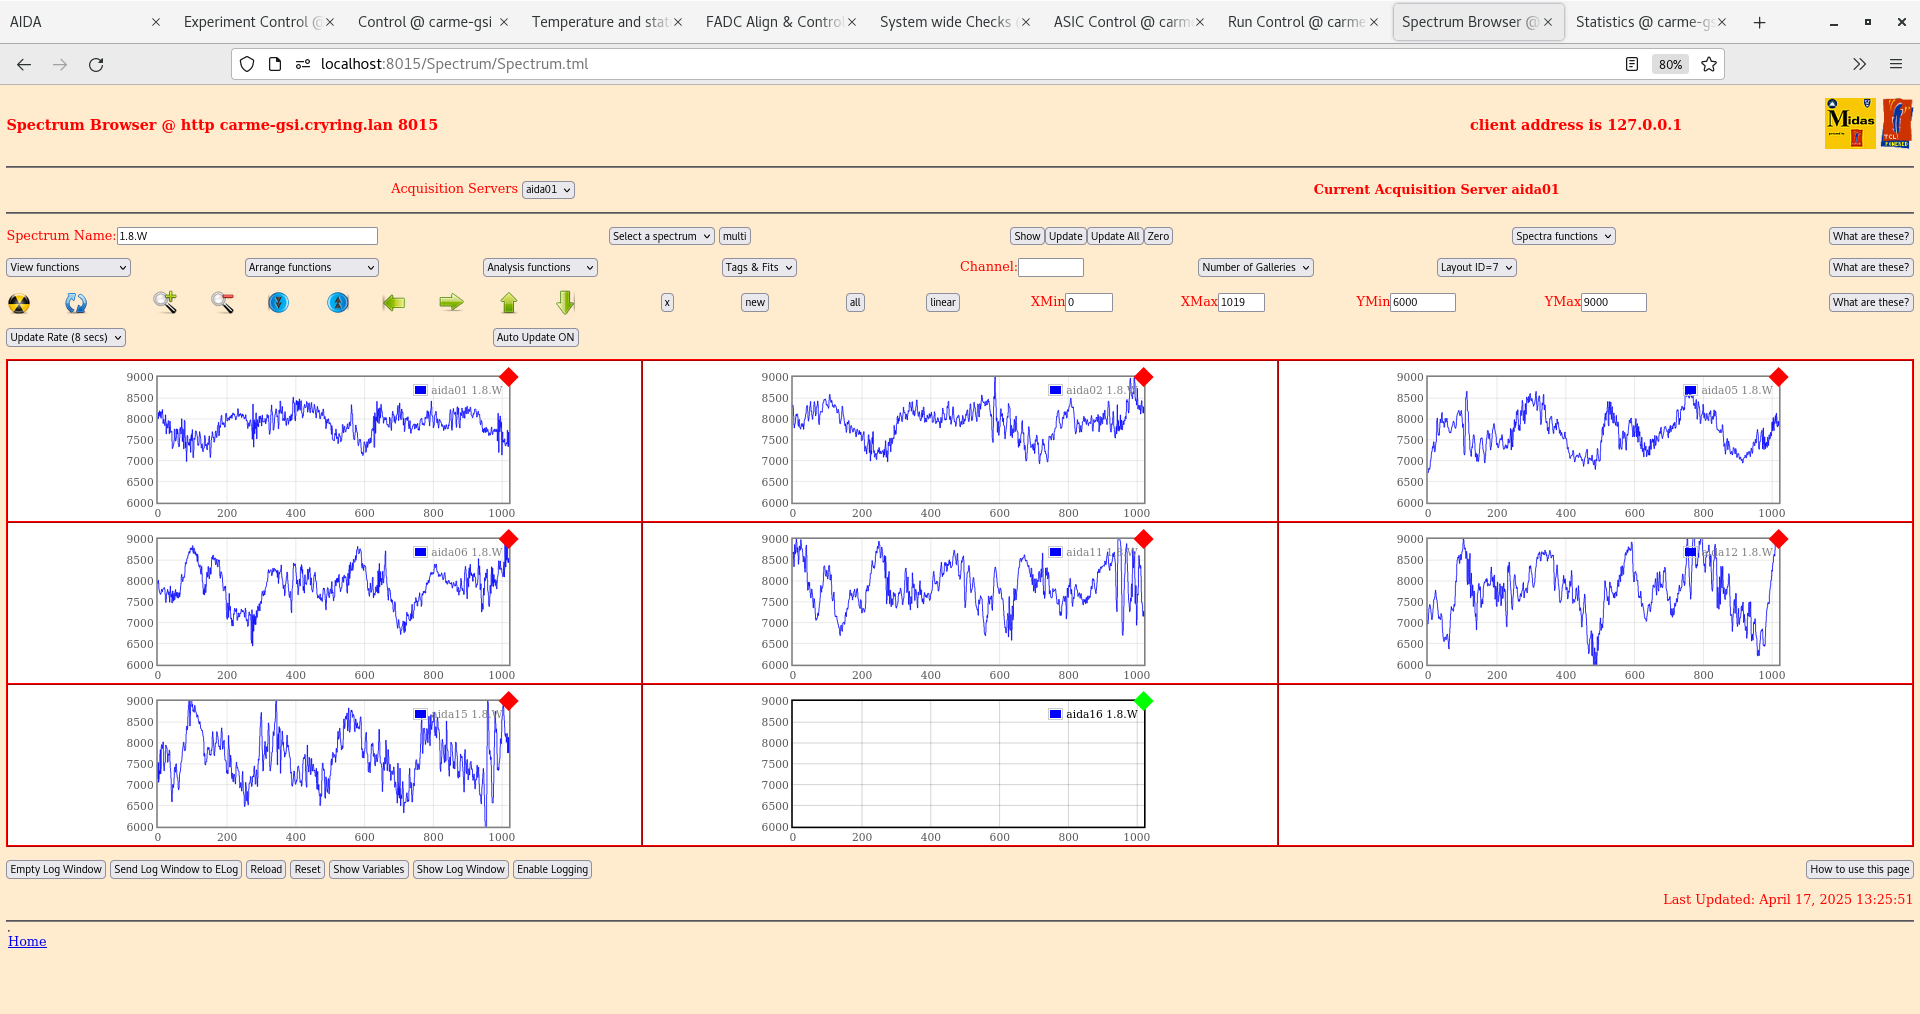
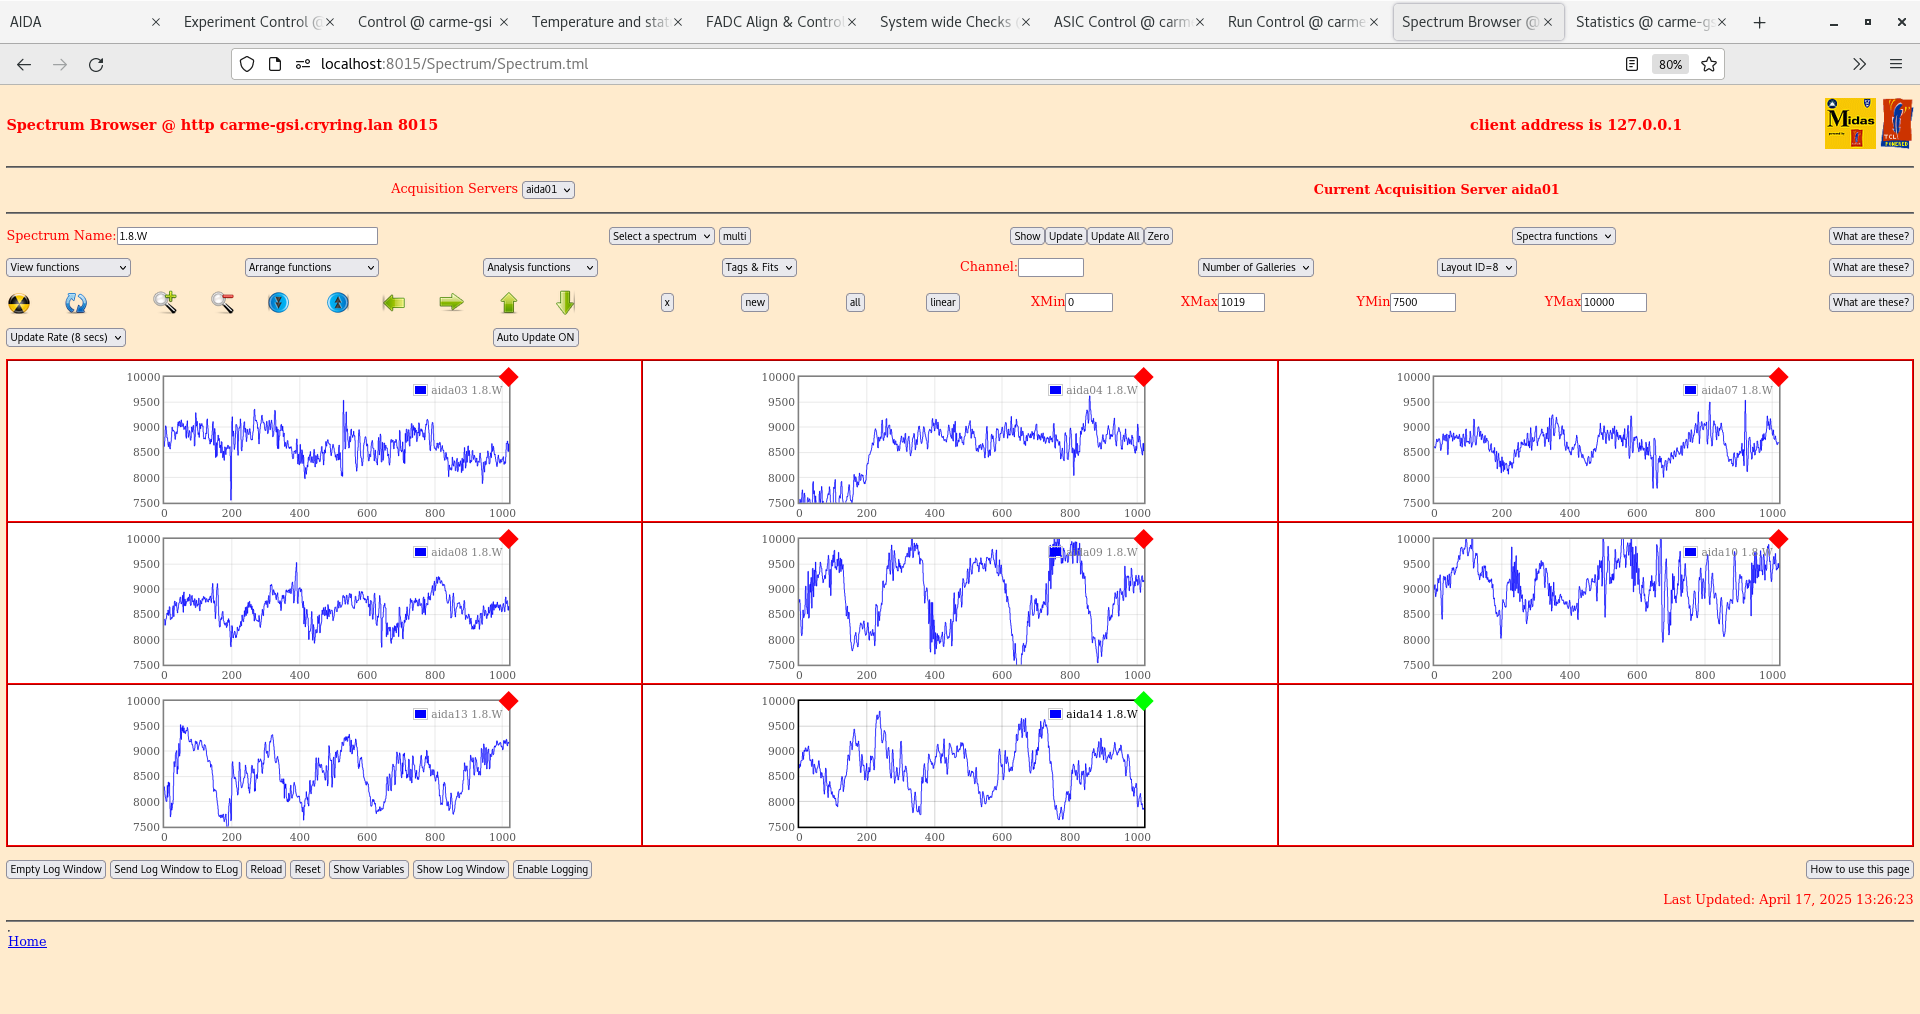
Ground config 7: Wanted to check impact of having no grounds at all. No impact on leakage currents. Rates look pretty similar for all FEEs, aida03 and aida04 200k and 350k respectively. Pulser widths and waveforms significantly worse than grounded case. See attachments 14-18
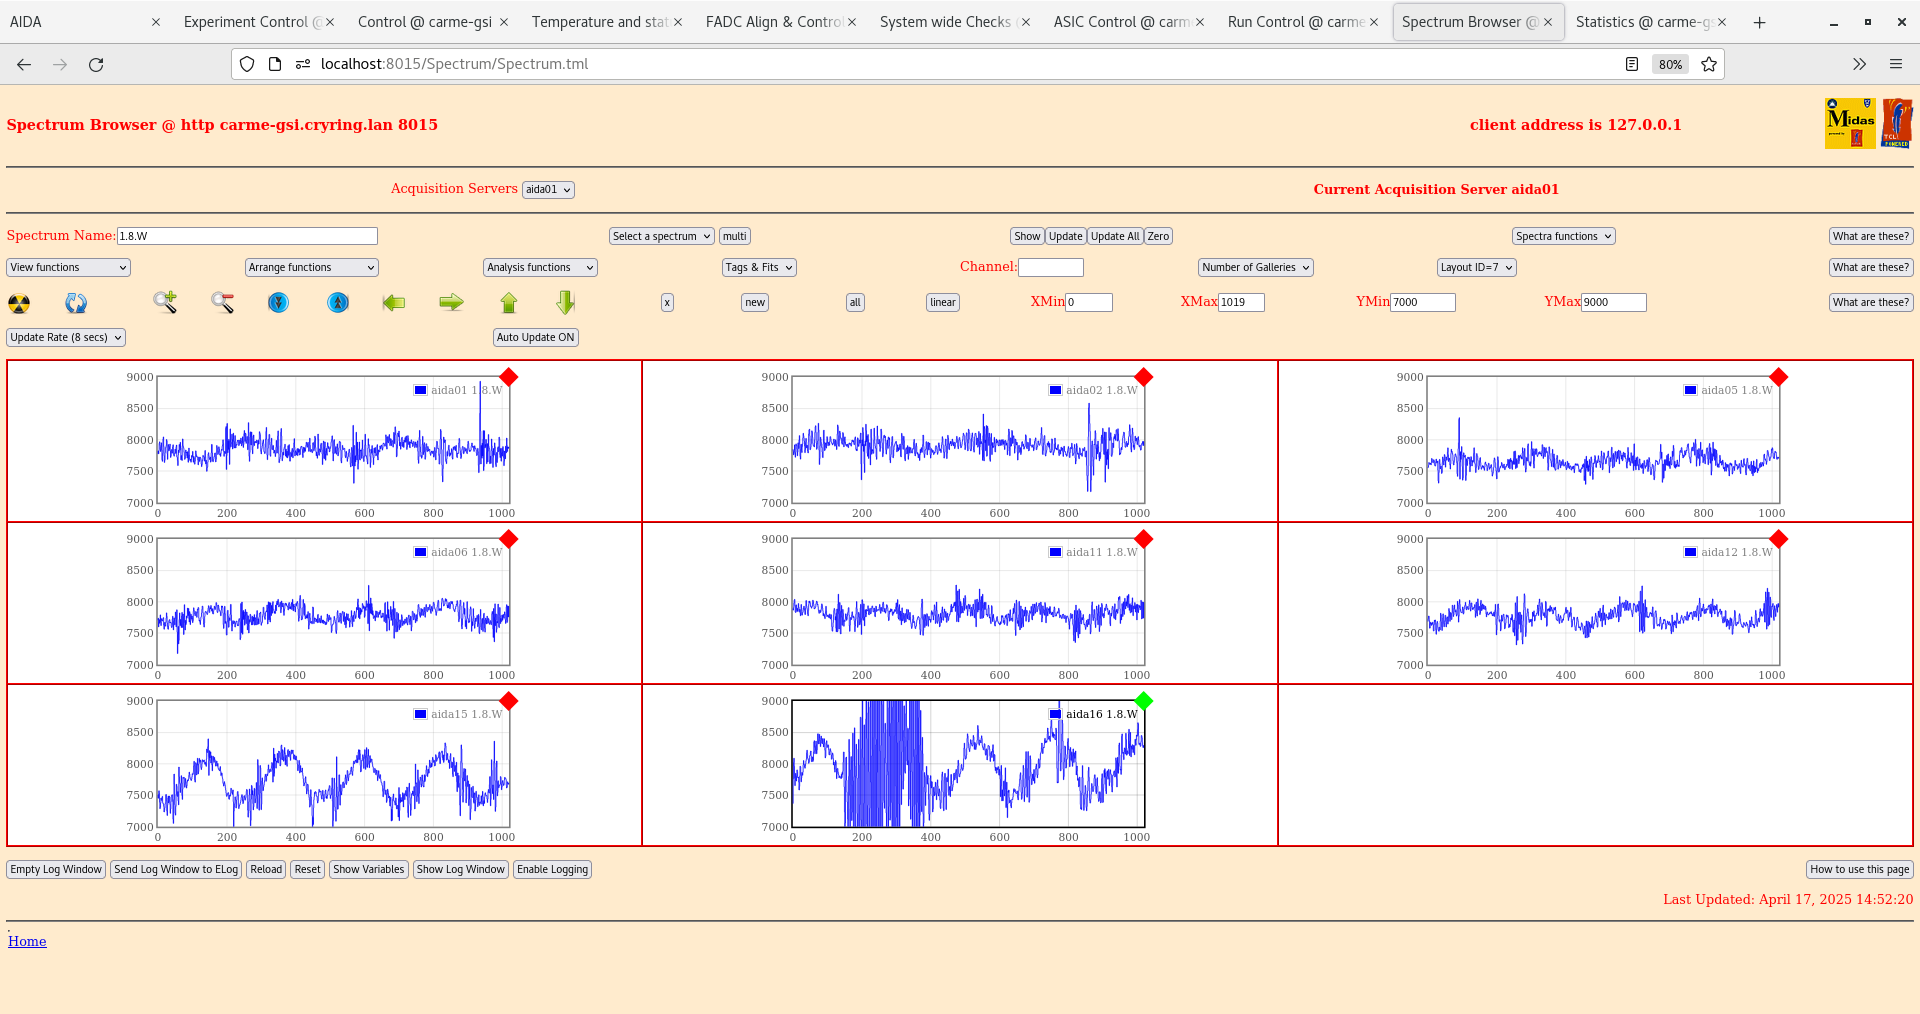
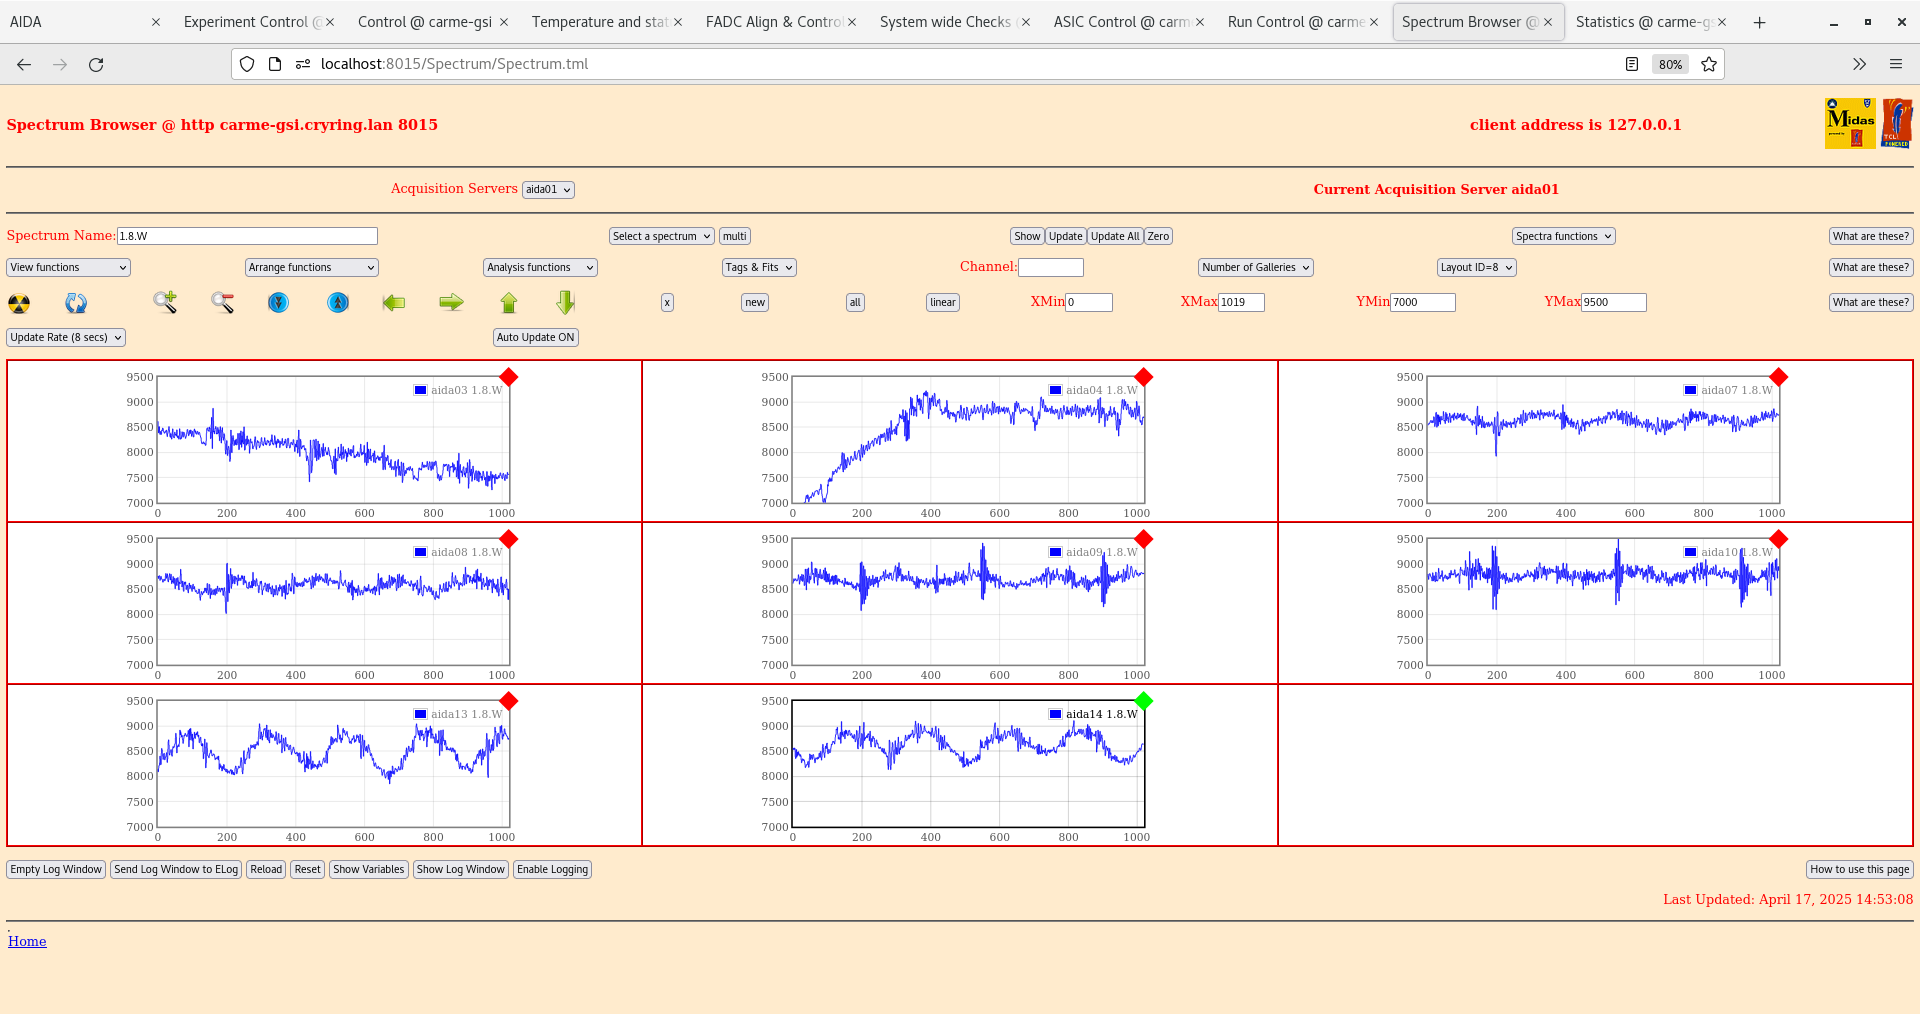
Ground config 8: Have reattached all ground cables (back to config1). In addition I have added a ground cable from the coolant pipe to effectively the CARME chamber. Rates appear pretty unchanged. Pulser widths better than no grounding but worse than original configuration. Attachments 19-23
Note since after lunch DSSD4 leakage current no longer fluctuating. Nothing has been changed. As I write that currents start fluctuating again. Maybe some ongoing work in the cave is affecting this?
Removed groud cable going to the chamber.
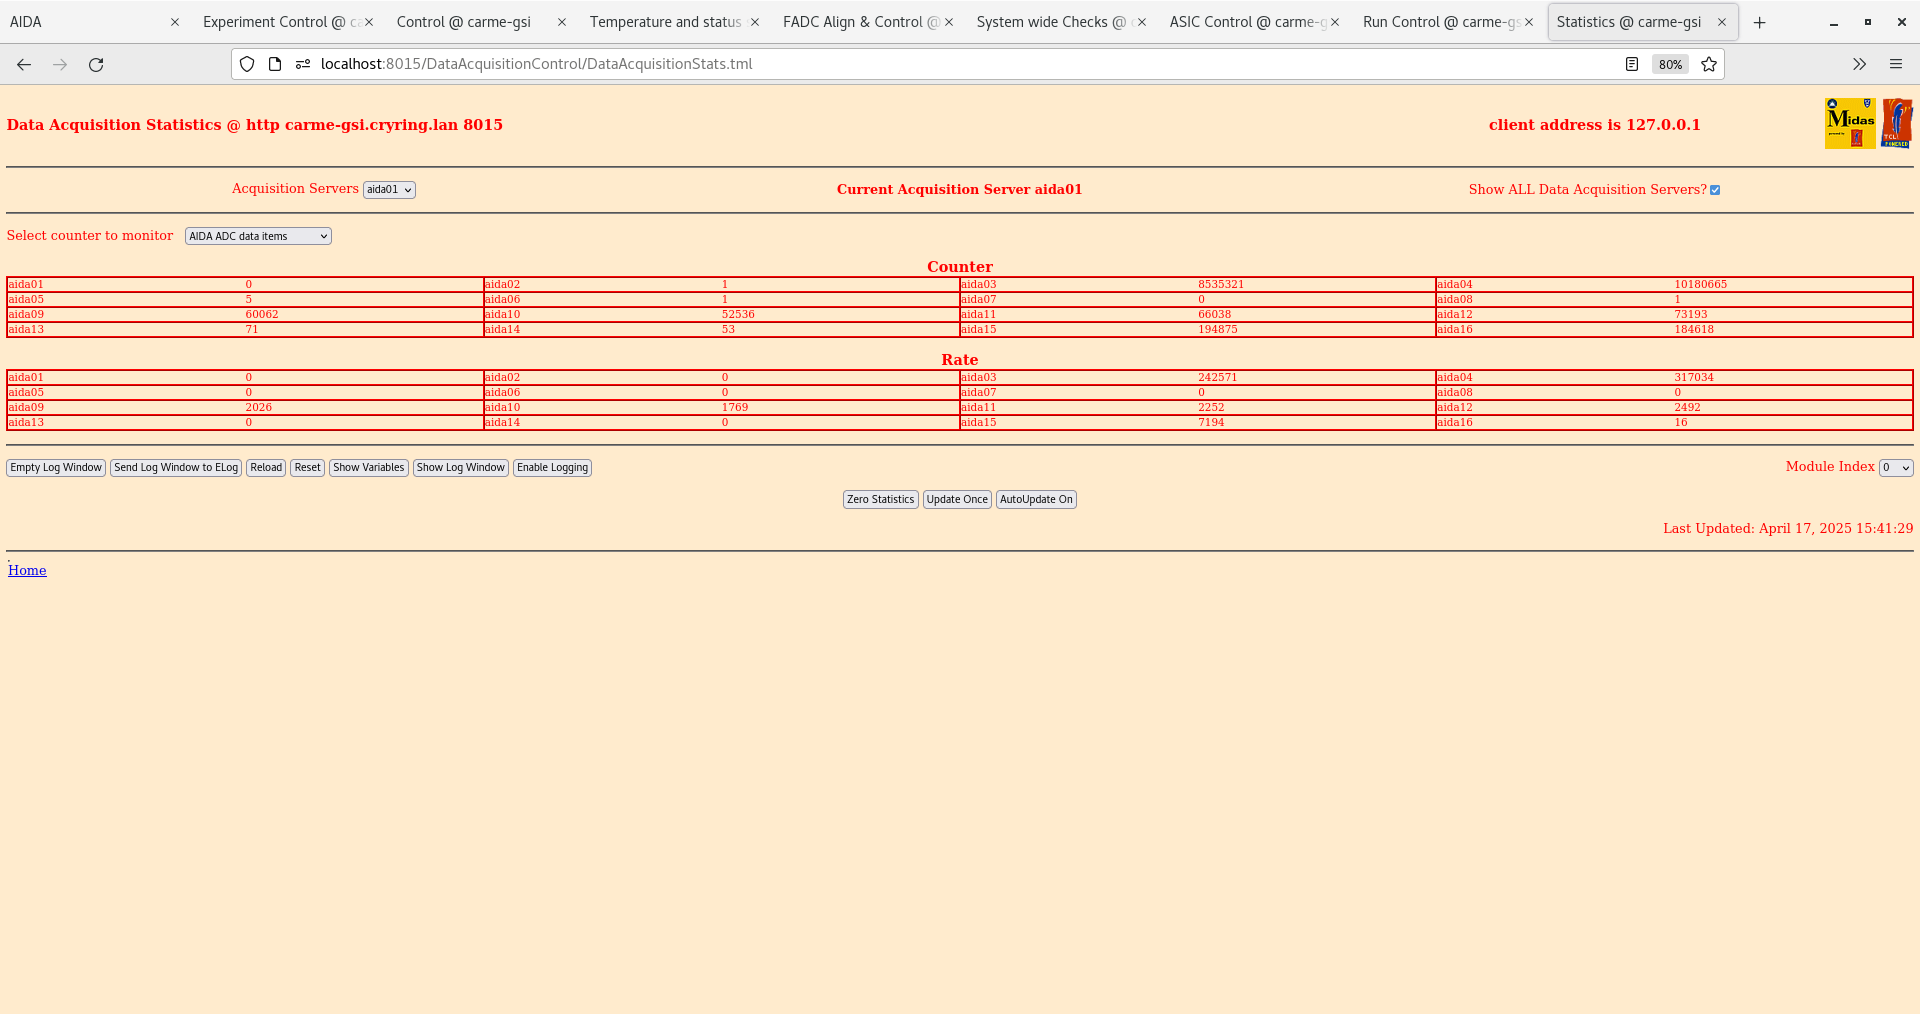
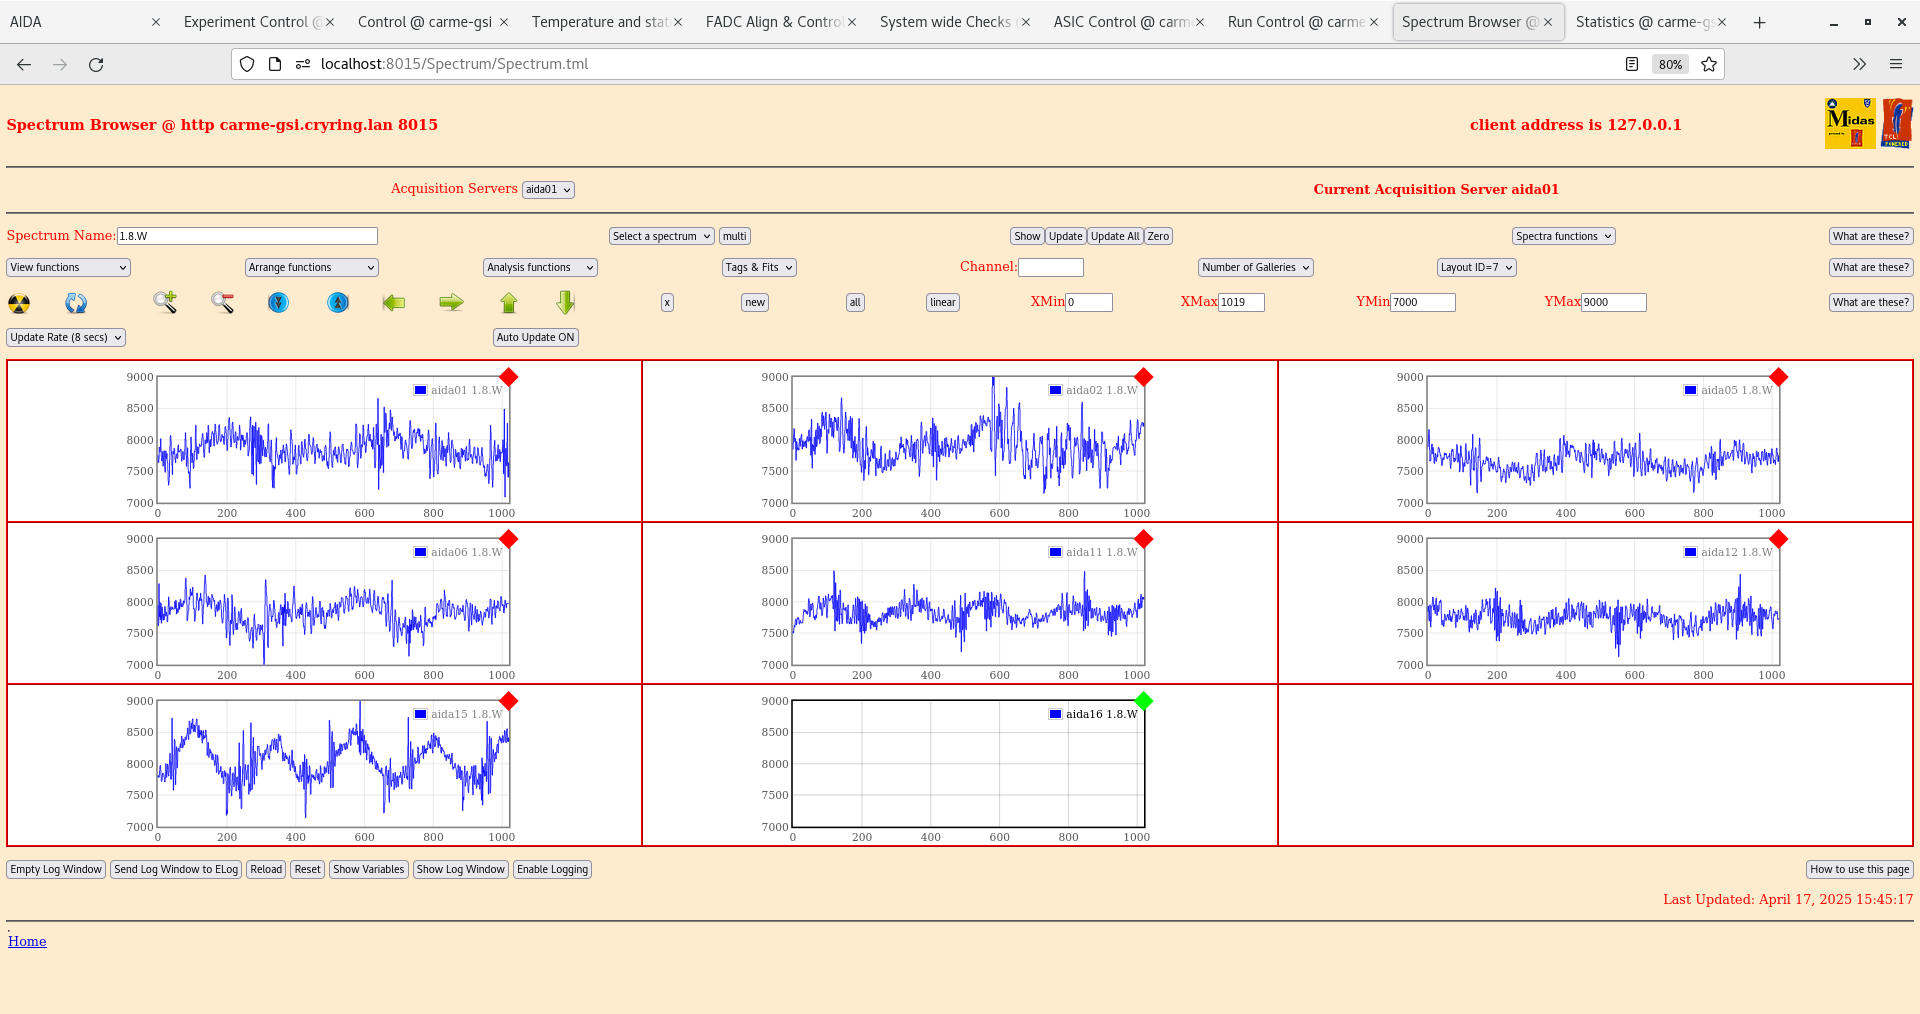
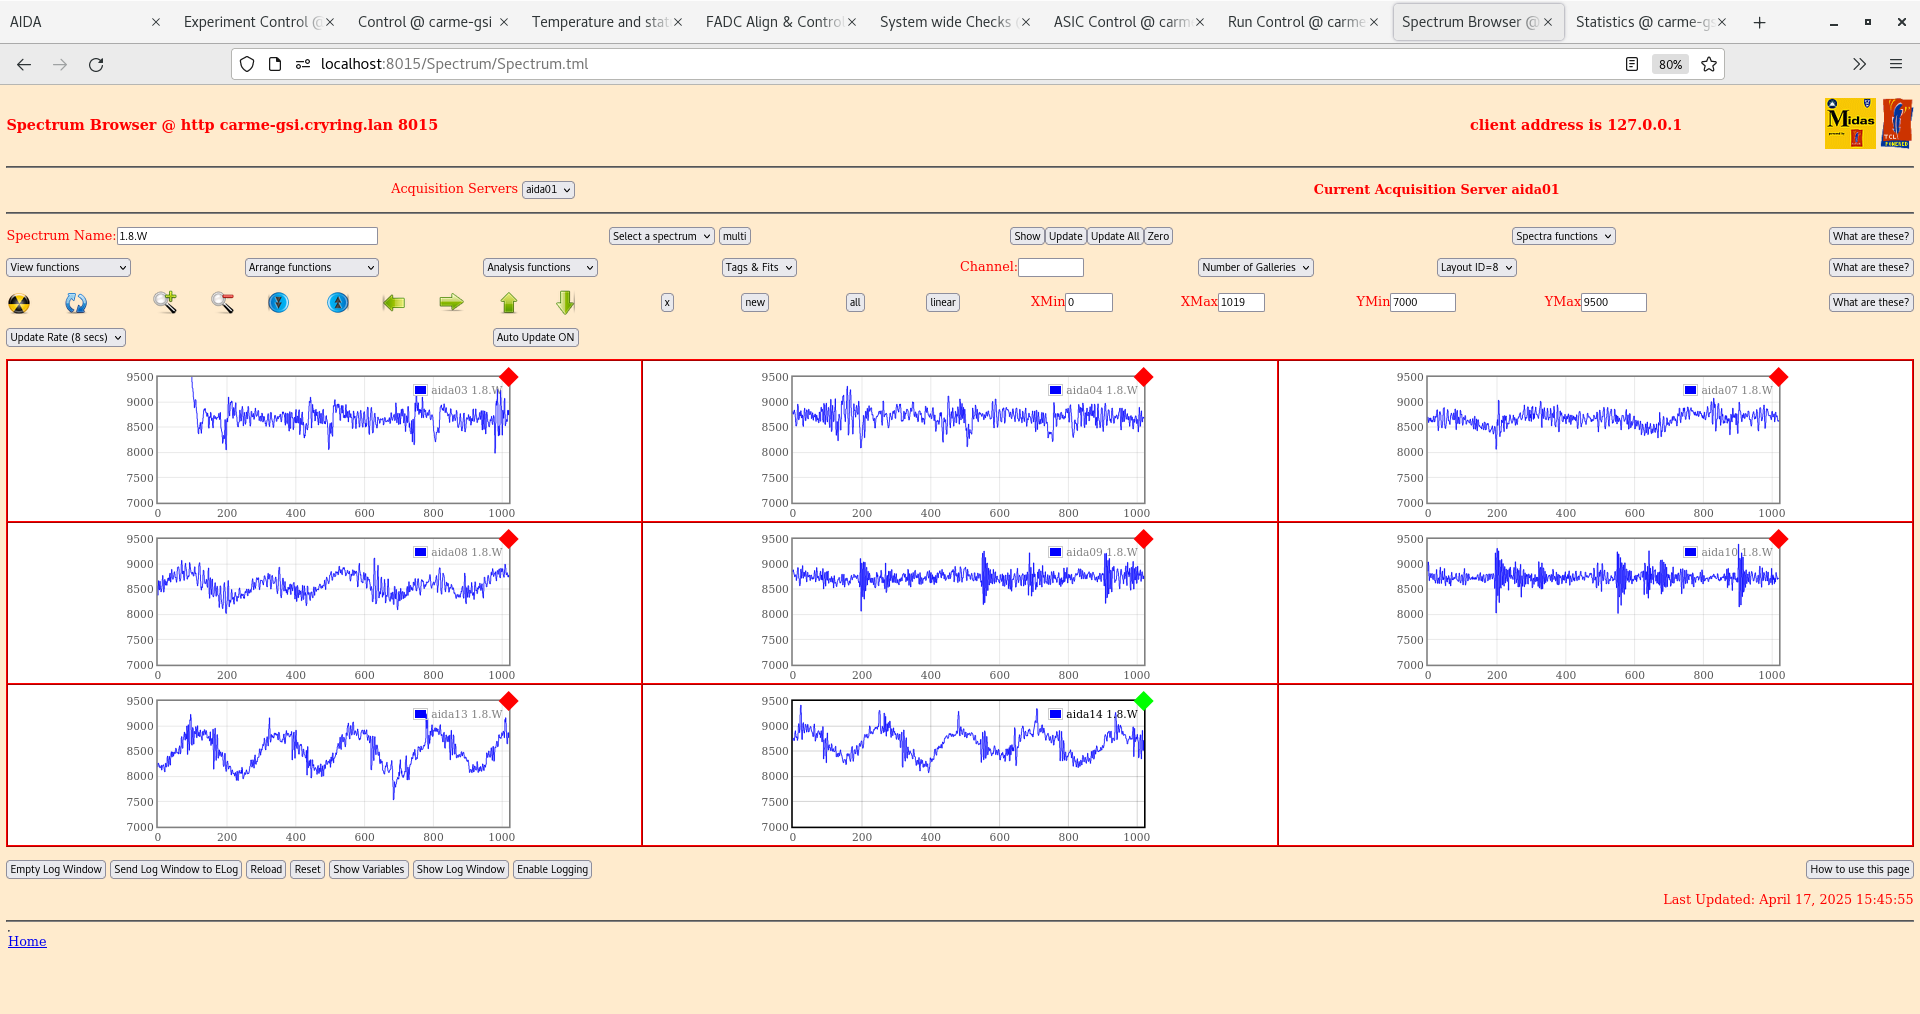
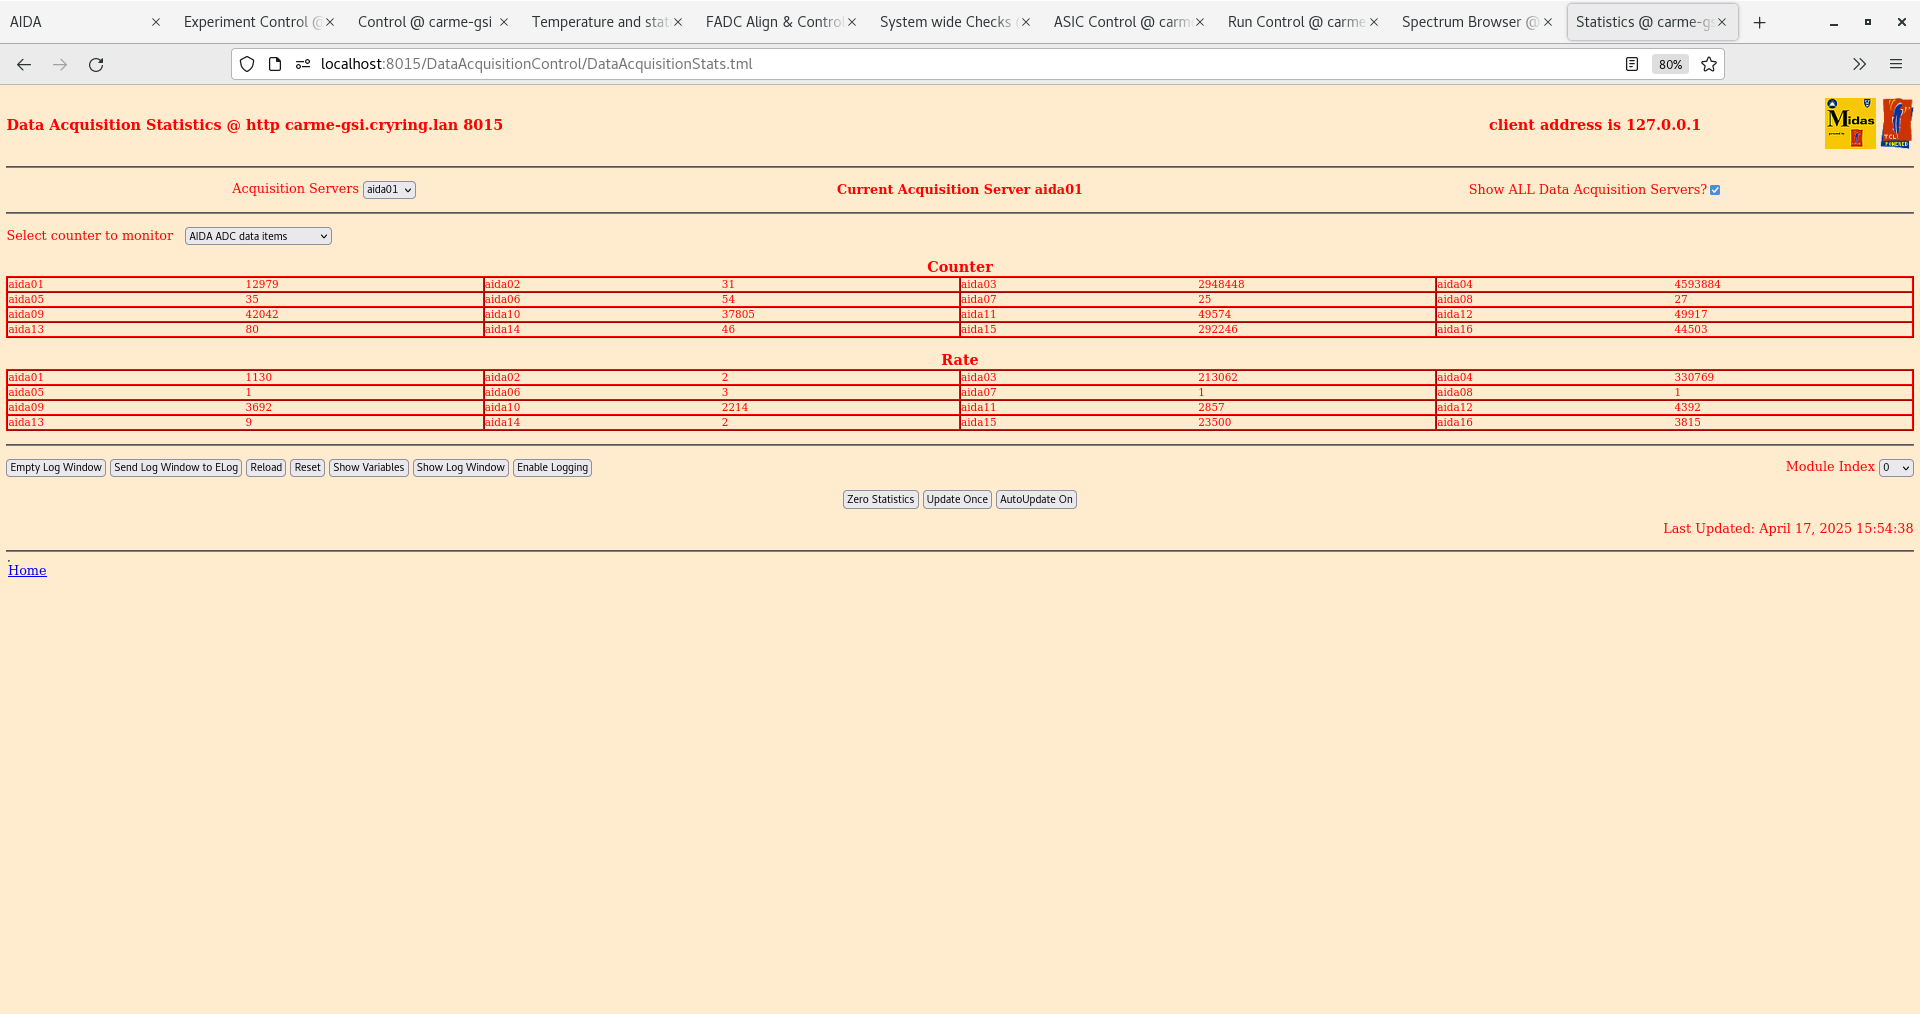
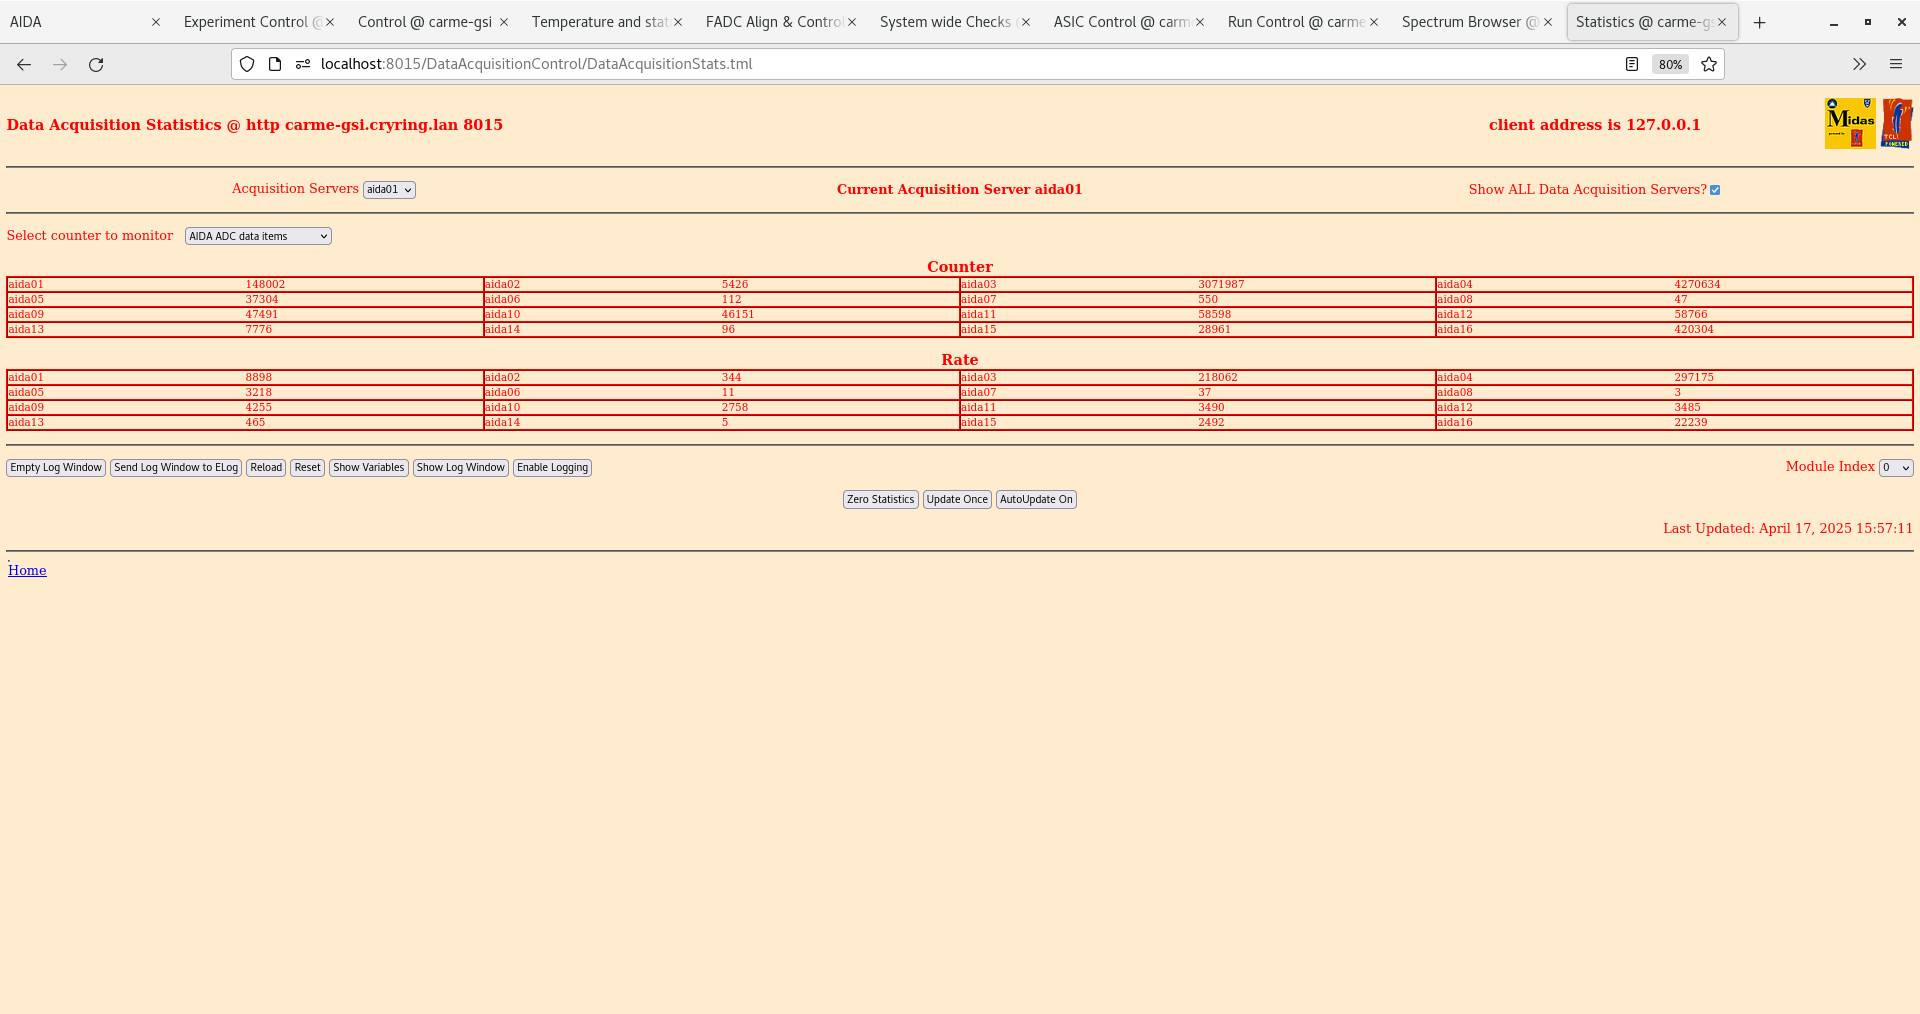
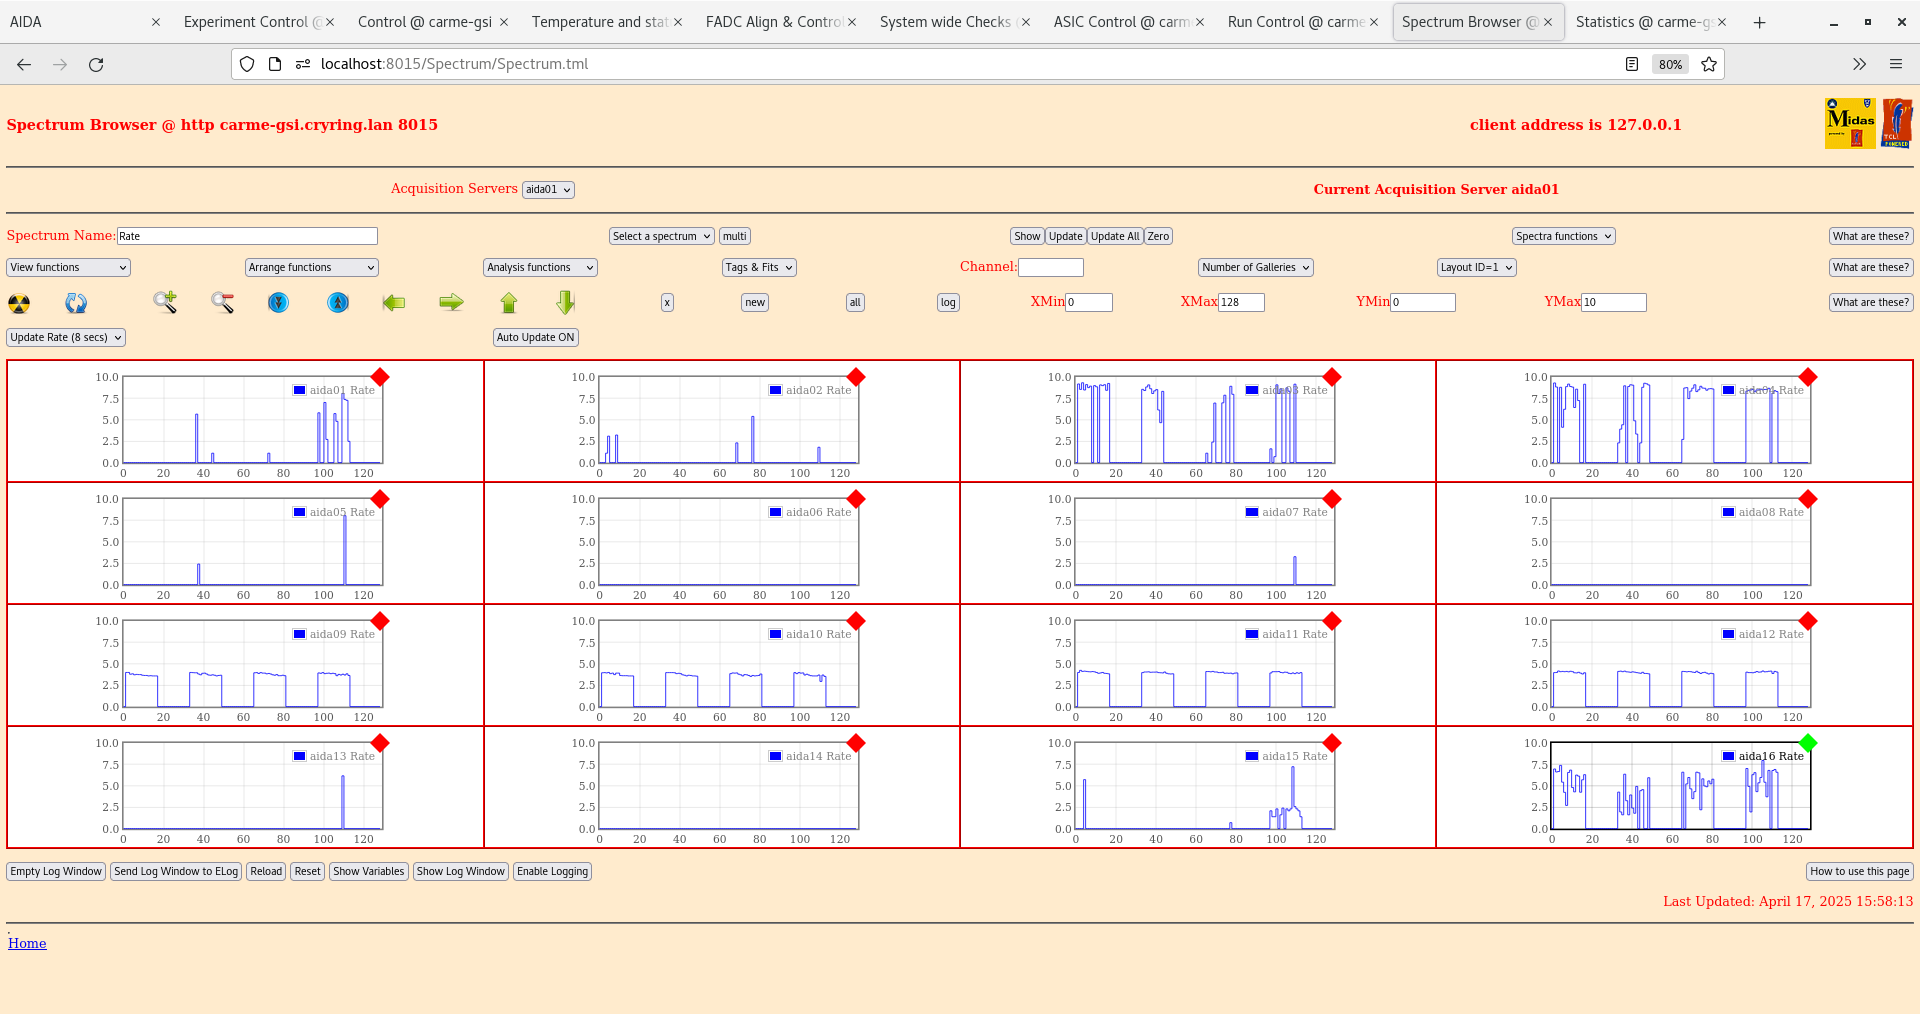
I wanted to rule out any affect from the test inputs. Have removed all test inputs. Only input is directly from pulser to DSSD3 as this previously had best pulser widths. All other cables removed. See attachments 24-26. Still see very high rates in aida03 and aida04 (250k and 350k). Pulser widths in DSSD3 seem worse now for some reason? While pulser detattched decided to lower slow comparator to 0x32 (500keV) and 0x24 (360 keV) to see rates in all FEEs. Rates still look pretty good, other than aida03 and 04. See attachments 27,29. Putting test inputs back.
Test inputs all back. Ground configuration back to configuration 1. Pulser tests, widths are best so far - will upload them later from all tests.Rates good in all except aida03 and aida04 still.
FEEs off, bias on and monitoring. Have put pins back in motors.
20:50
Bias has tripped again on DSSD4. It had remiained stable with noi fluctuations ~20 mins before leaving. |
| Attachment 1: Screenshot_from_2025-04-17_09-40-03.png
|
|
| Attachment 2: Screenshot_from_2025-04-17_09-40-23.png
|
|
| Attachment 3: Screenshot_from_2025-04-17_09-57-48.png
|
|
| Attachment 4: Screenshot_from_2025-04-17_09-58-31.png
|
|
| Attachment 5: Screenshot_from_2025-04-17_10-02-08.png
|
|
| Attachment 6: Screenshot_from_2025-04-17_10-06-07.png
|
|
| Attachment 7: Screenshot_from_2025-04-17_10-07-29.png
|
|
| Attachment 8: Screenshot_from_2025-04-17_10-11-12.png
|
|
| Attachment 9: Screenshot_from_2025-04-17_11-53-54.png
|
|
| Attachment 10: Screenshot_from_2025-04-17_11-57-21.png
|
|
| Attachment 11: Screenshot_from_2025-04-17_12-02-10.png
|
|
| Attachment 12: Screenshot_from_2025-04-17_12-03-28.png
|
|
| Attachment 13: Screenshot_from_2025-04-17_12-04-34.png
|
|
| Attachment 14: Screenshot_from_2025-04-17_13-20-17.png
|
|
| Attachment 15: Screenshot_from_2025-04-17_13-22-07.png
|
|
| Attachment 16: Screenshot_from_2025-04-17_13-24-07.png
|
|
| Attachment 17: Screenshot_from_2025-04-17_13-25-57.png
|
|
| Attachment 18: Screenshot_from_2025-04-17_13-26-32.png
|
|
| Attachment 19: Screenshot_from_2025-04-17_14-45-50.png
|
|
| Attachment 20: Screenshot_from_2025-04-17_14-47-34.png
|
|
| Attachment 21: Screenshot_from_2025-04-17_14-50-31.png
|

|
| Attachment 22: Screenshot_from_2025-04-17_14-52-29.png
|
|
| Attachment 23: Screenshot_from_2025-04-17_14-53-18.png
|
|
| Attachment 24: Screenshot_from_2025-04-17_15-41-38.png
|
|
| Attachment 25: Screenshot_from_2025-04-17_15-45-34.png
|
|
| Attachment 26: Screenshot_from_2025-04-17_15-46-19.png
|
|
| Attachment 27: Screenshot_from_2025-04-17_15-54-46.png
|
|
| Attachment 28: Screenshot_from_2025-04-17_15-57-26.png
|
|
| Attachment 29: Screenshot_from_2025-04-17_15-58-47.png
|
|
|
|
674
|
Wed Apr 16 08:20:05 2025 |
JM | Grounding |
09:00
Leakage currents this morning again appear to have lowered during the night. Current plot shows a day/night variation but I think the minimum is decreasing ever so slightly.
This morning DSSD1=15.1uA and DSSD3=14.4uA, this is ~0.3-0.4 uA lower than yesterday. DSSD4 is still fluctuating in its leakage current and looks to have been all night. See attachment 1.
Will now proceed to systematically check all grounds before restarting AIDA.
Several cables have been re-routed this morning to clean up the area, allow us to see clear what cable goes where, and are avoid any unwanted interference. E.g. ion pump cables have been re-routed to not be near the bias cables, one ion pump cable was running between the power and hdmi on one of the FEEs, this was been sorted.
All grounds have been checked, some loose cables have been tightend up. Current ground configuration has all the adaptor cards (nn and pn) on a single detector connected together. One grounding cable then goes from each detector to the right coolant pipe which all the other detectors are also grounded to. This was the configuration for the previous beamtime. Will start pulser tests after lunch. Bias back on, leakage current slowly increasing again, DSSD3 current no longer fluctuating.
13:00
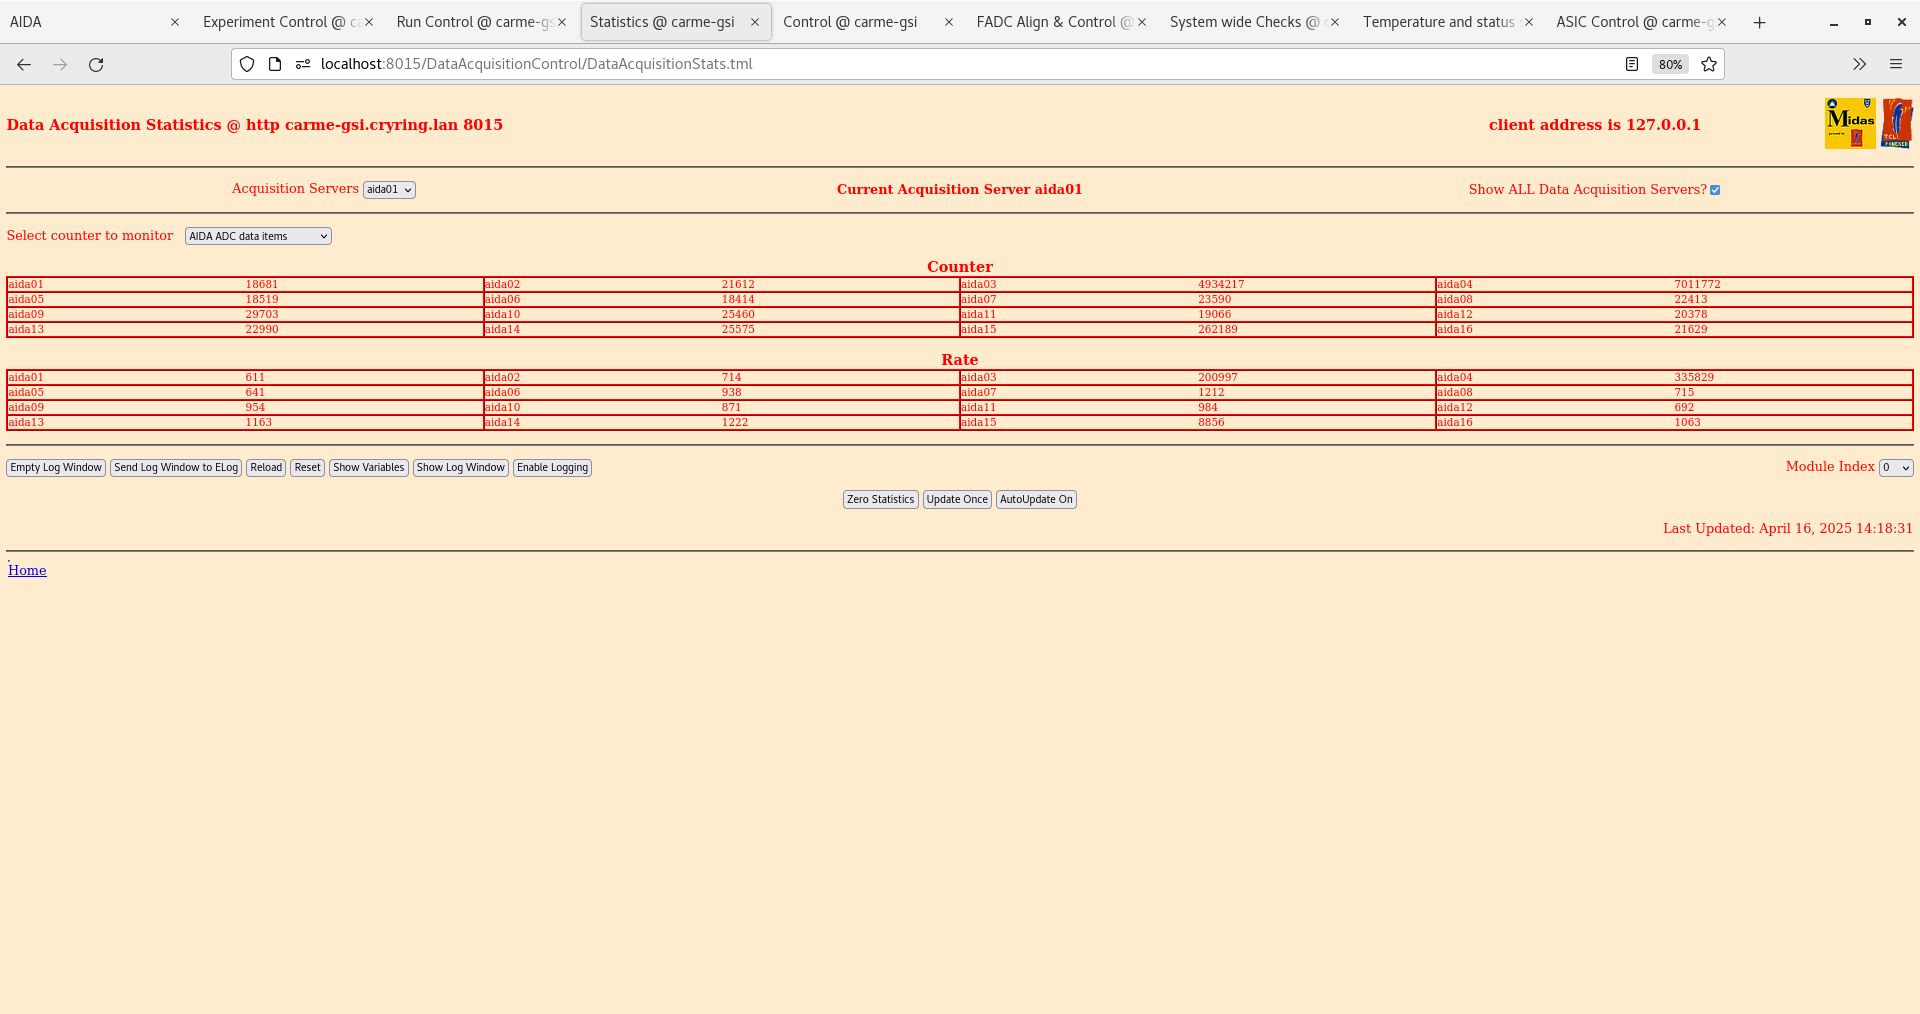
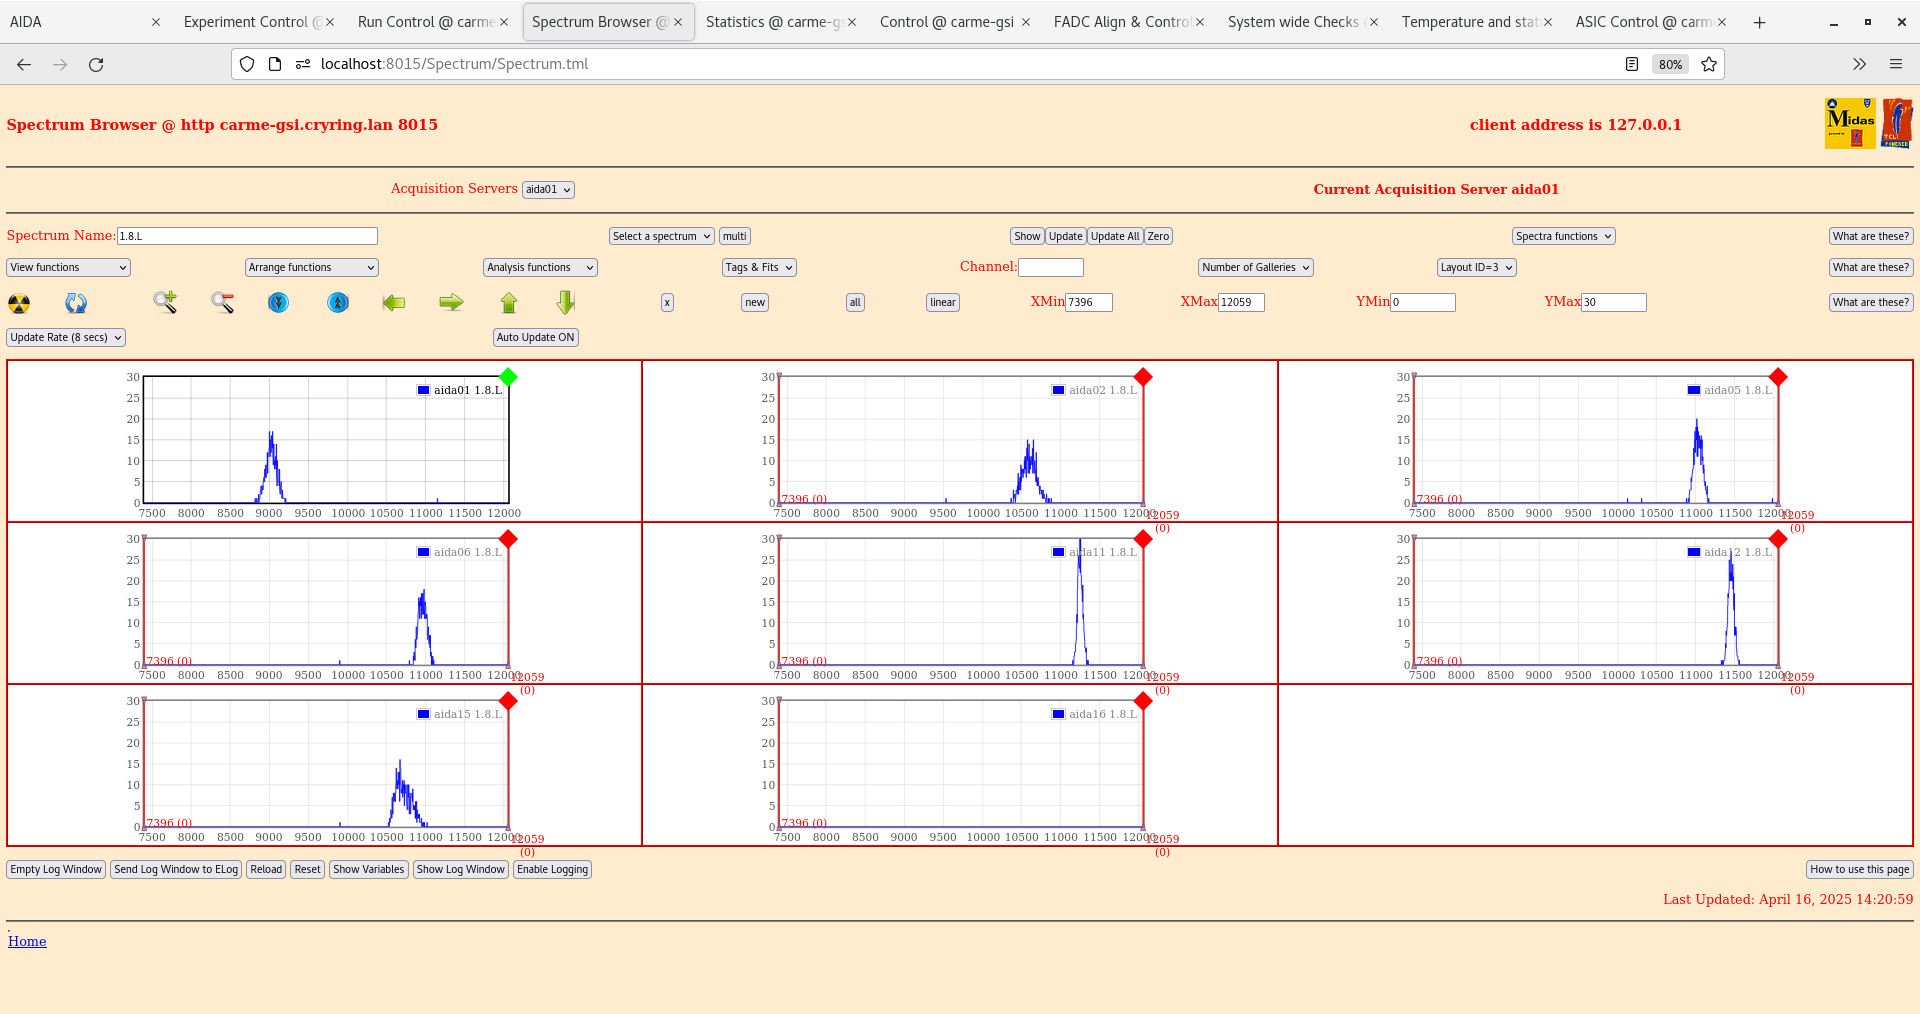
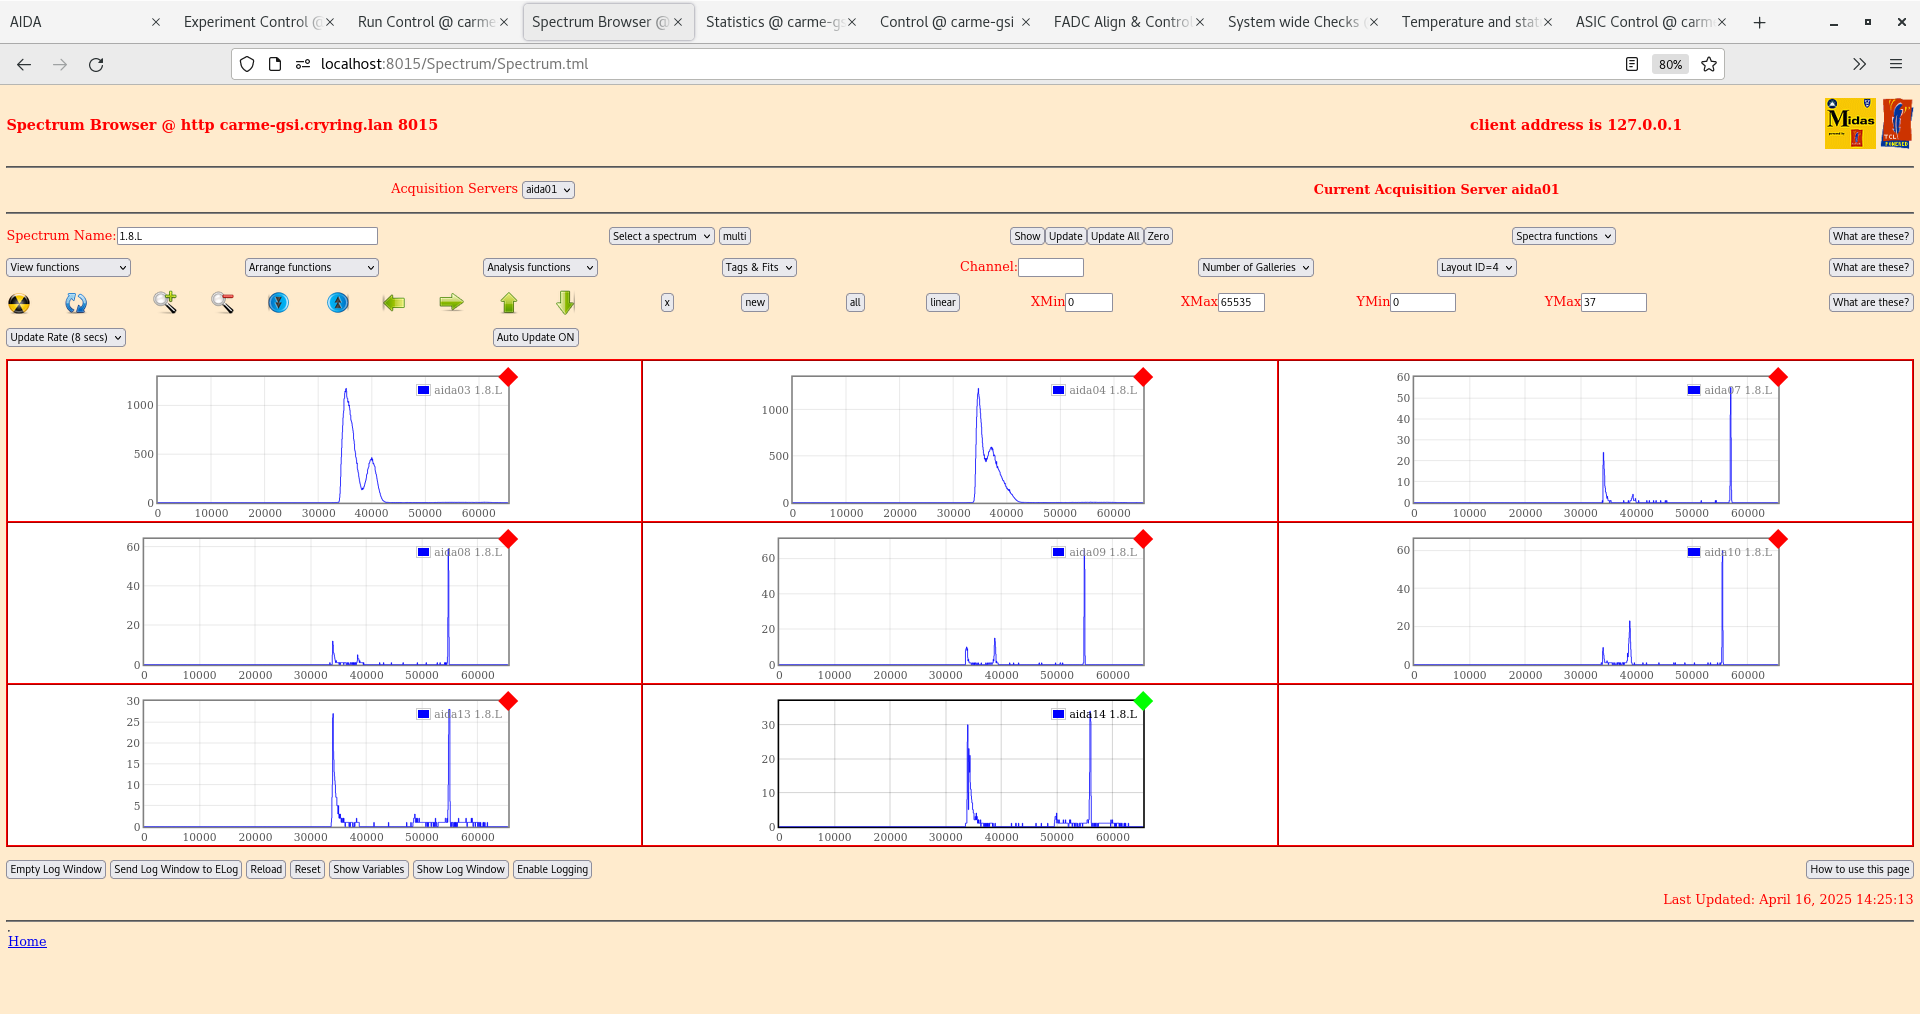
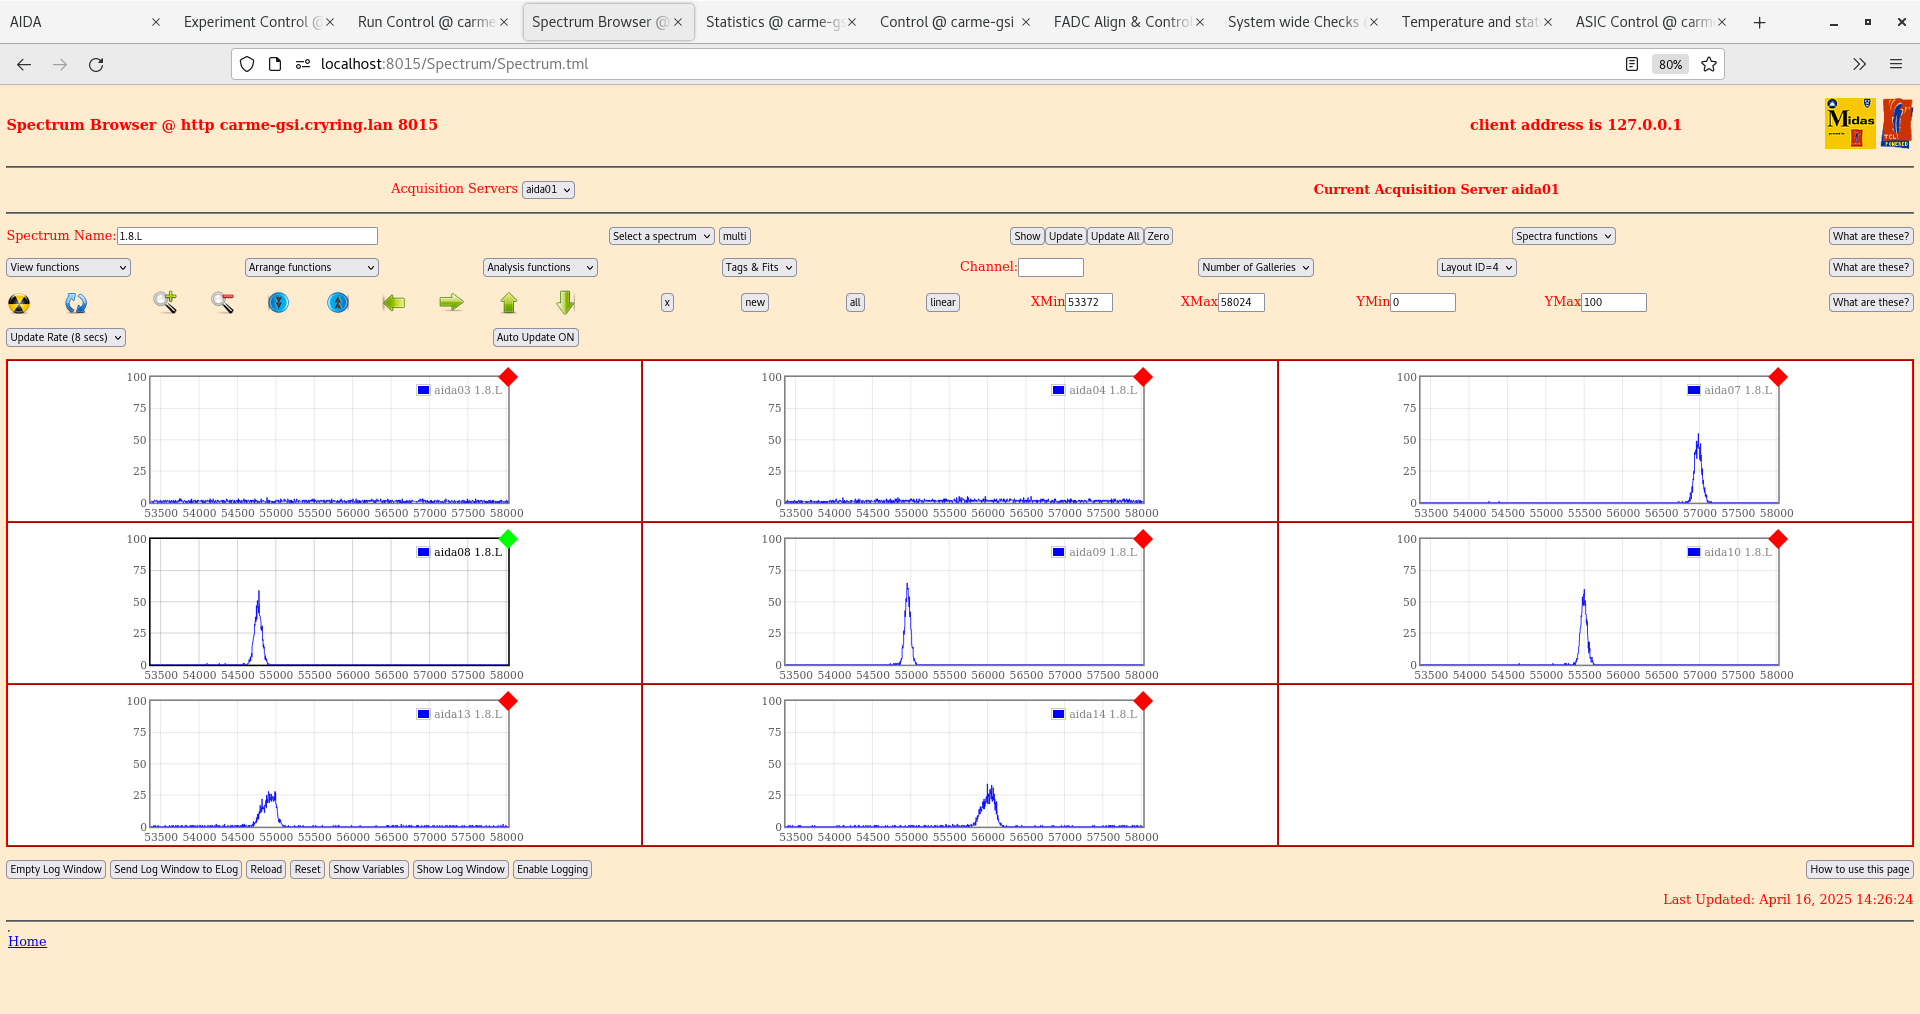
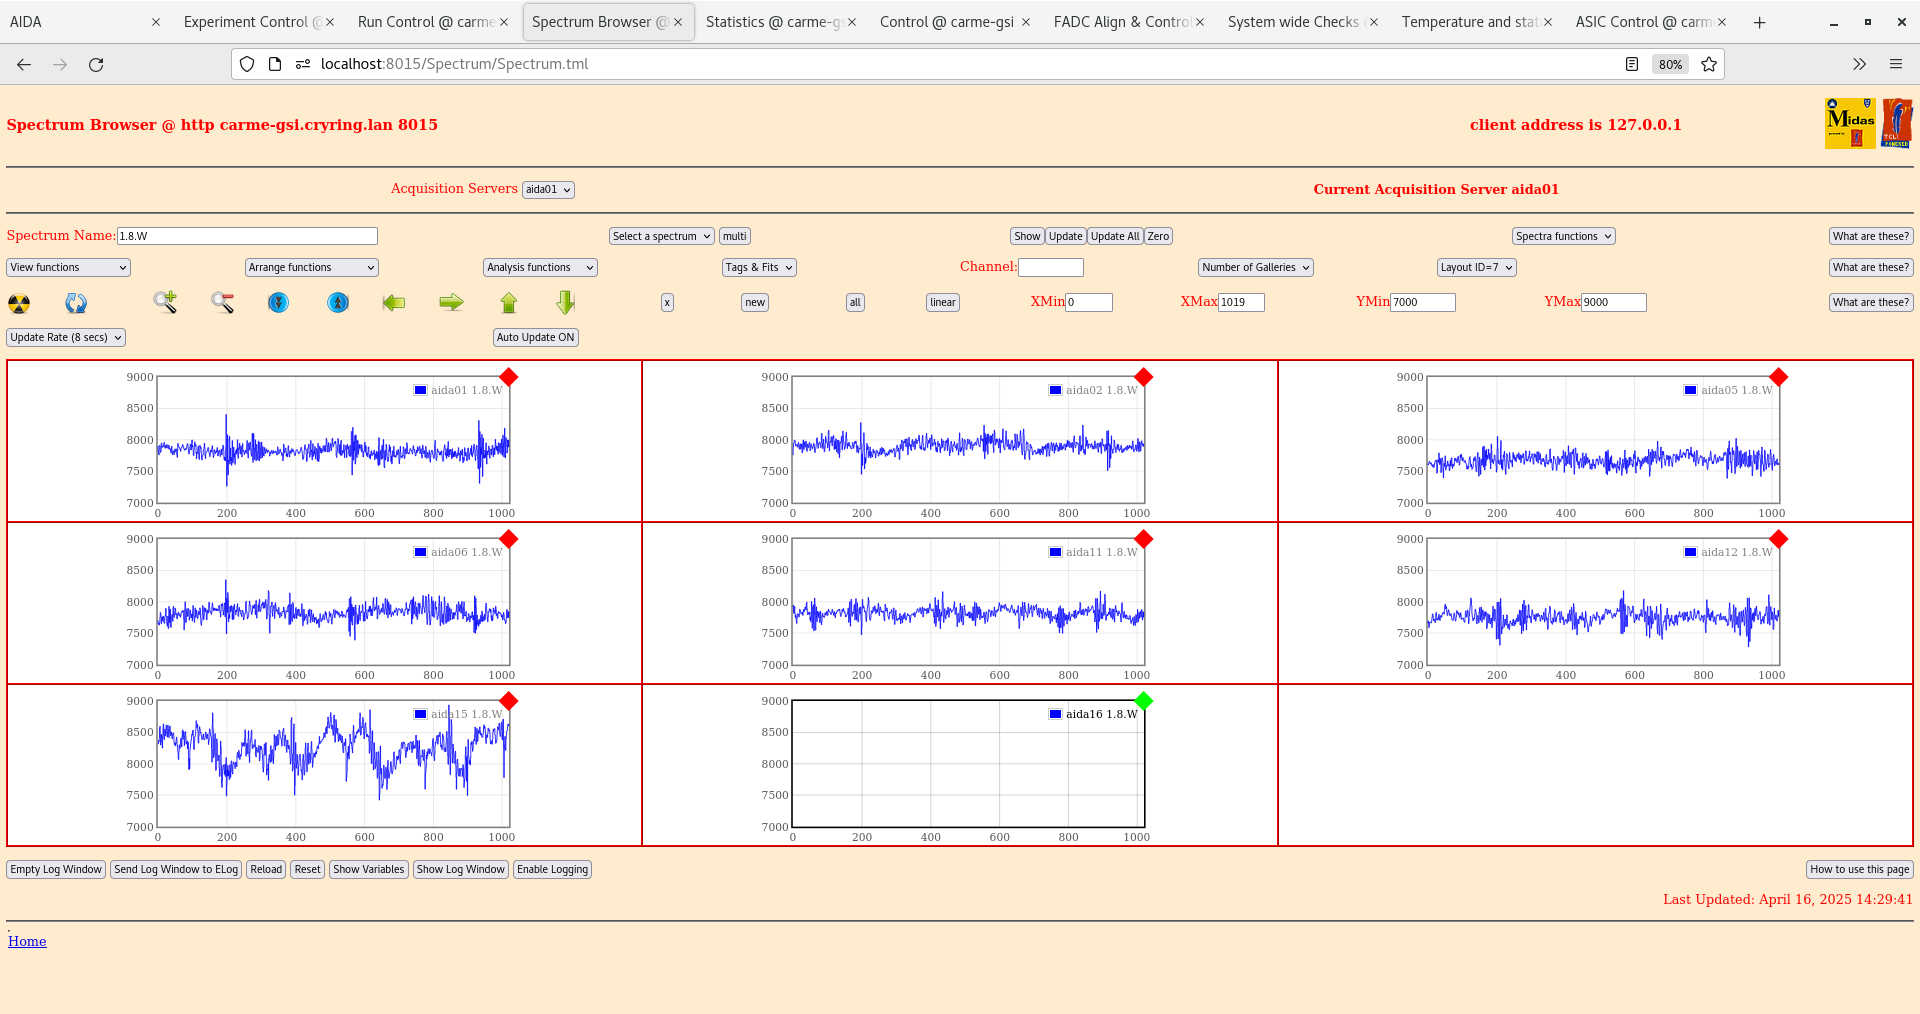
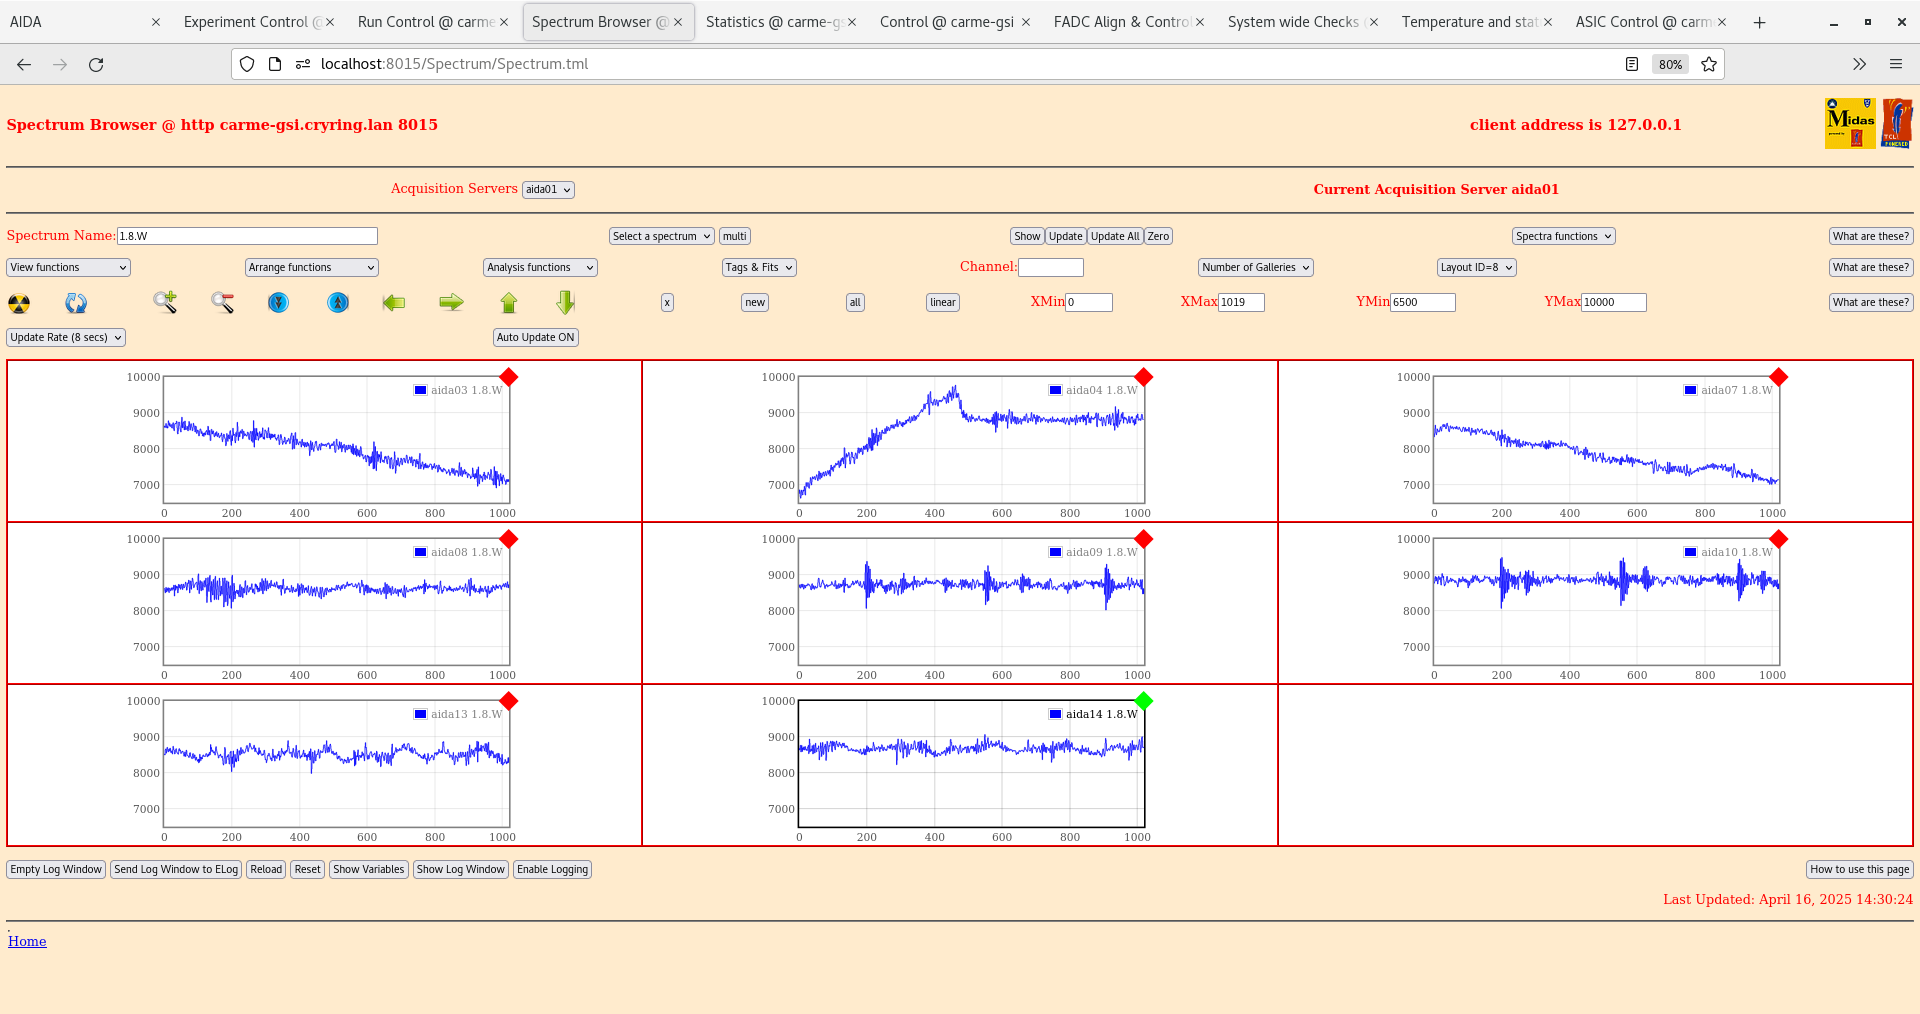
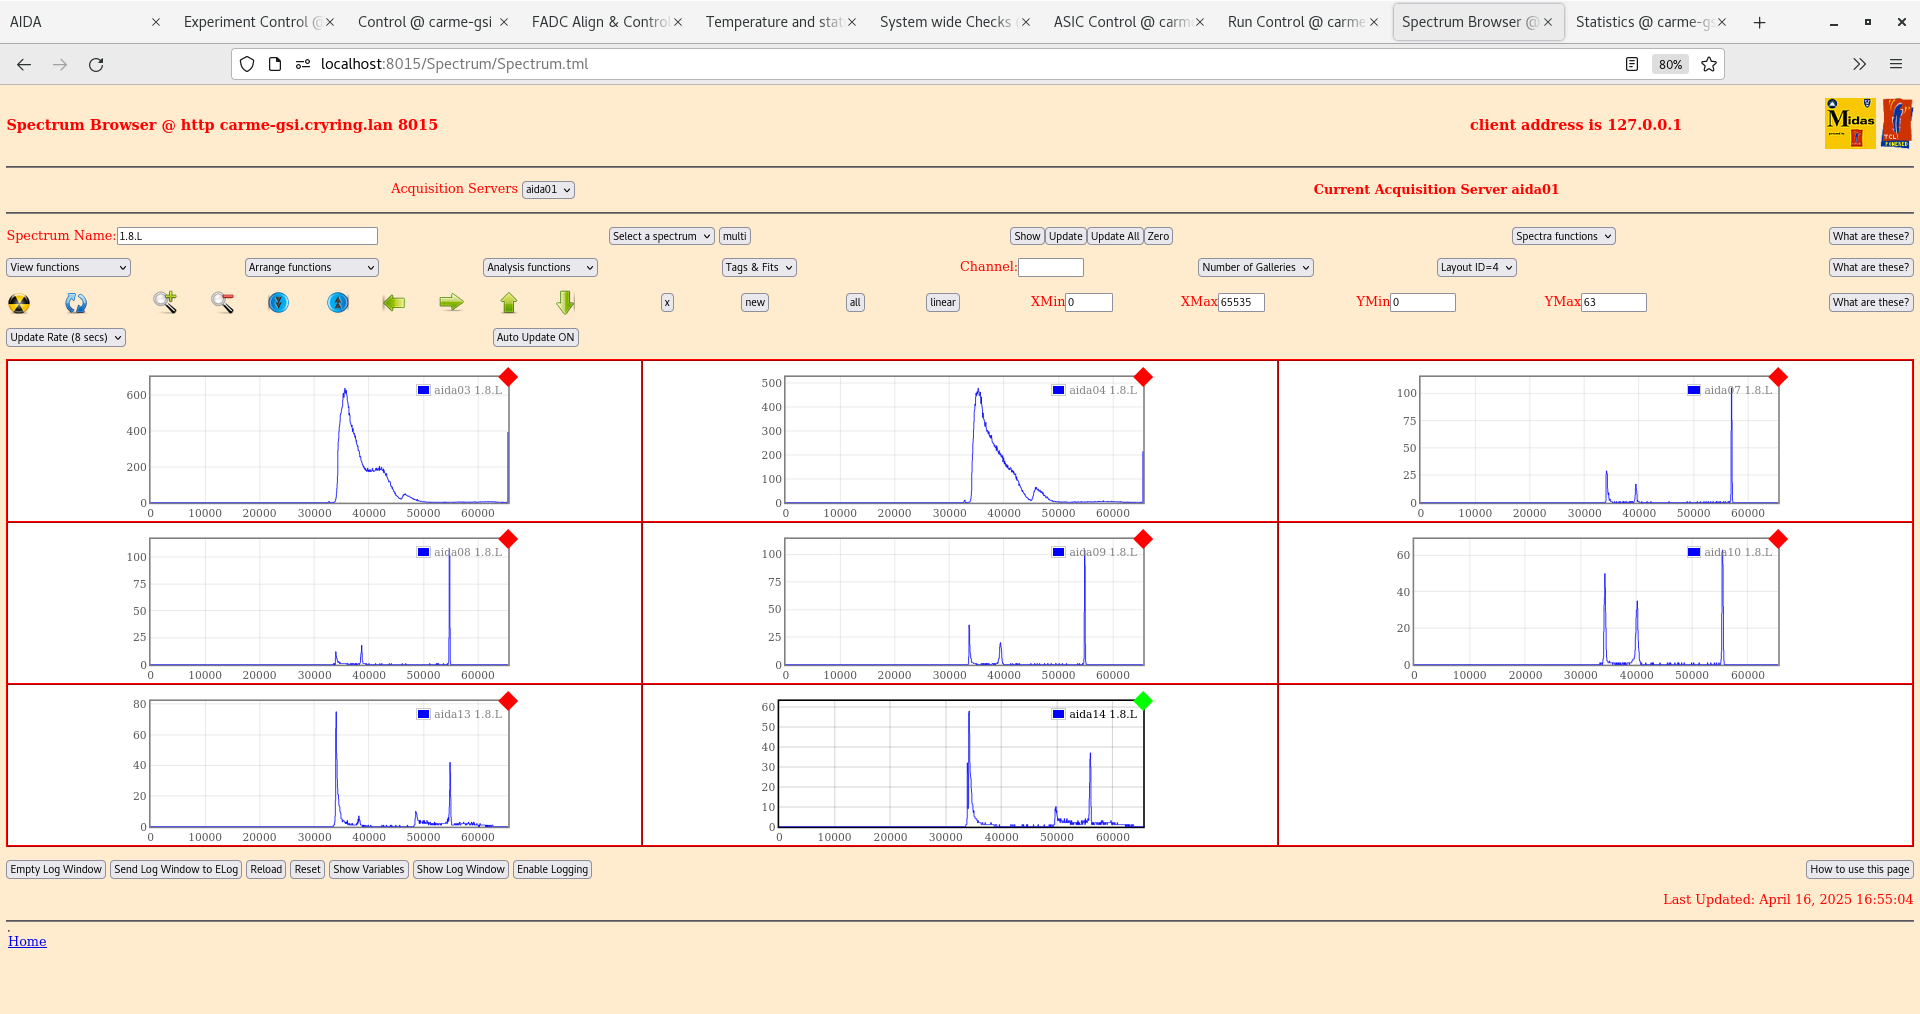
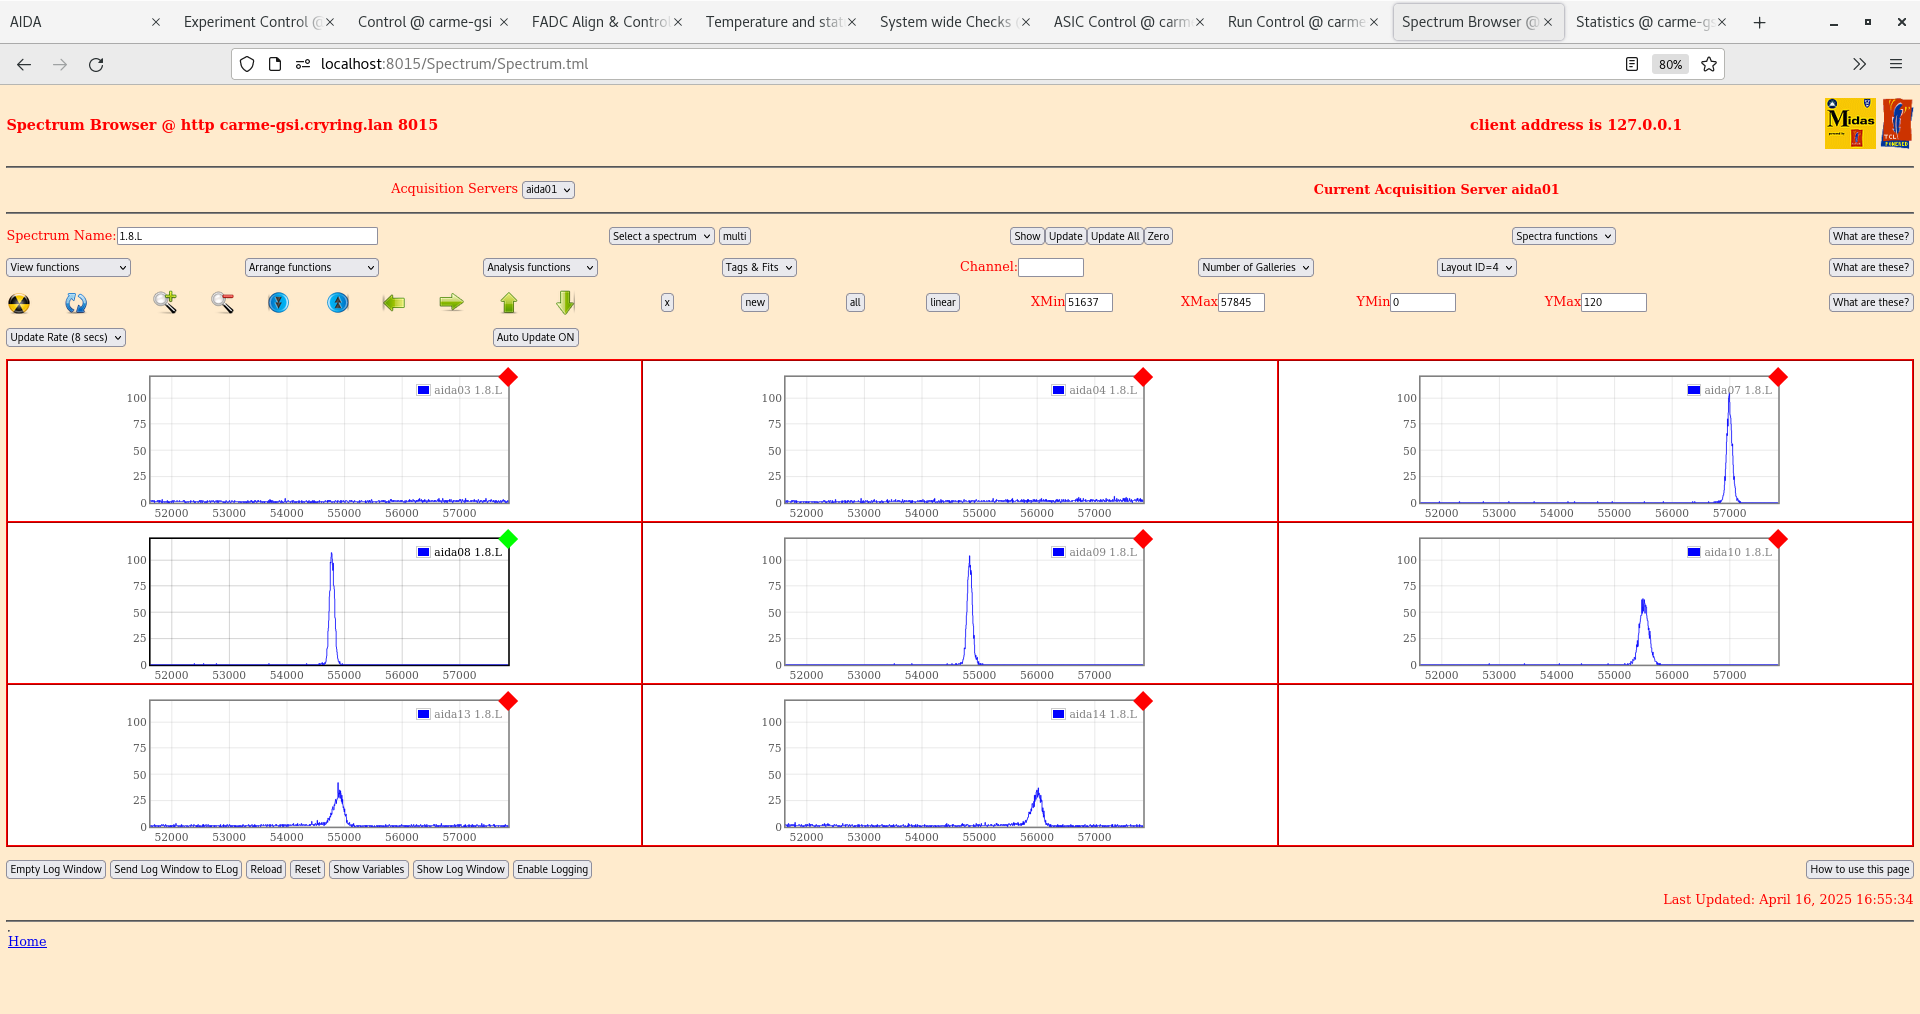
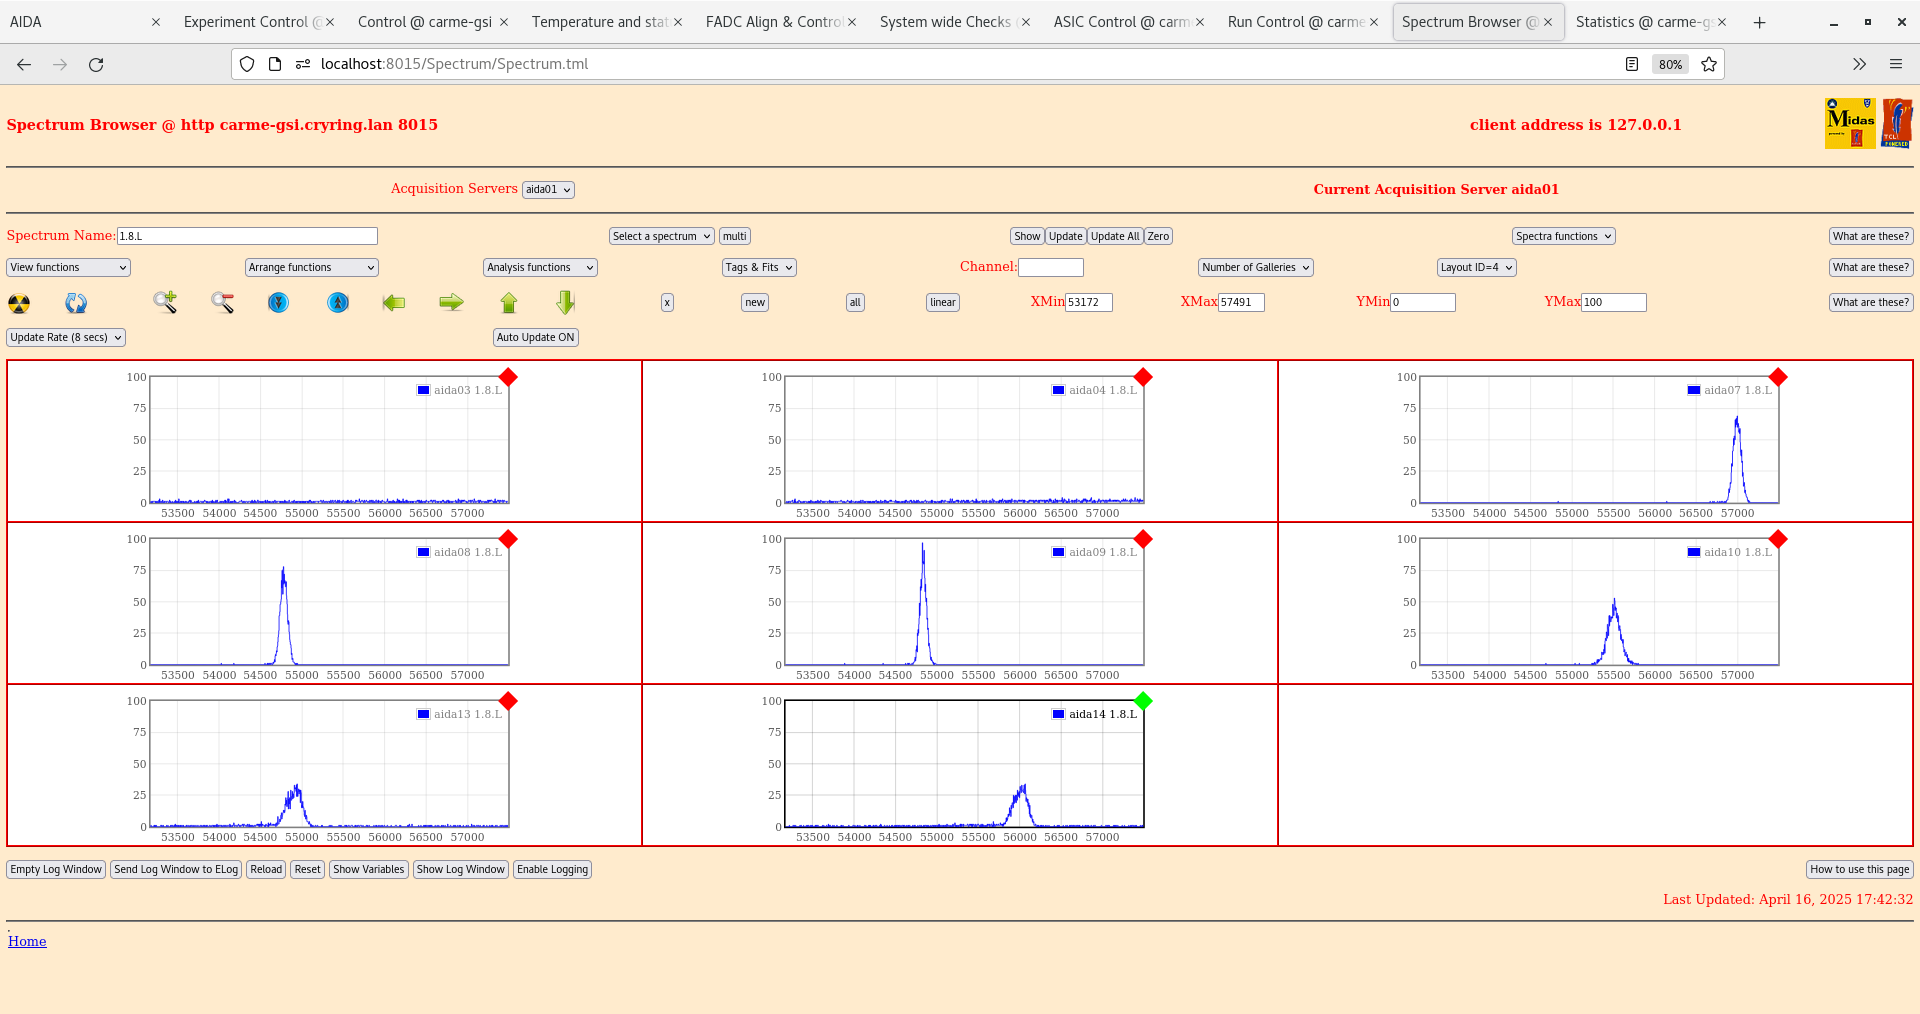
Ground config 1 - attachments 2-7 (described above)
Ground config 2 - attachments 8-10 (grounds now go to the CRYRING ground cable not the coolant pipe and jumper removed form bias module)
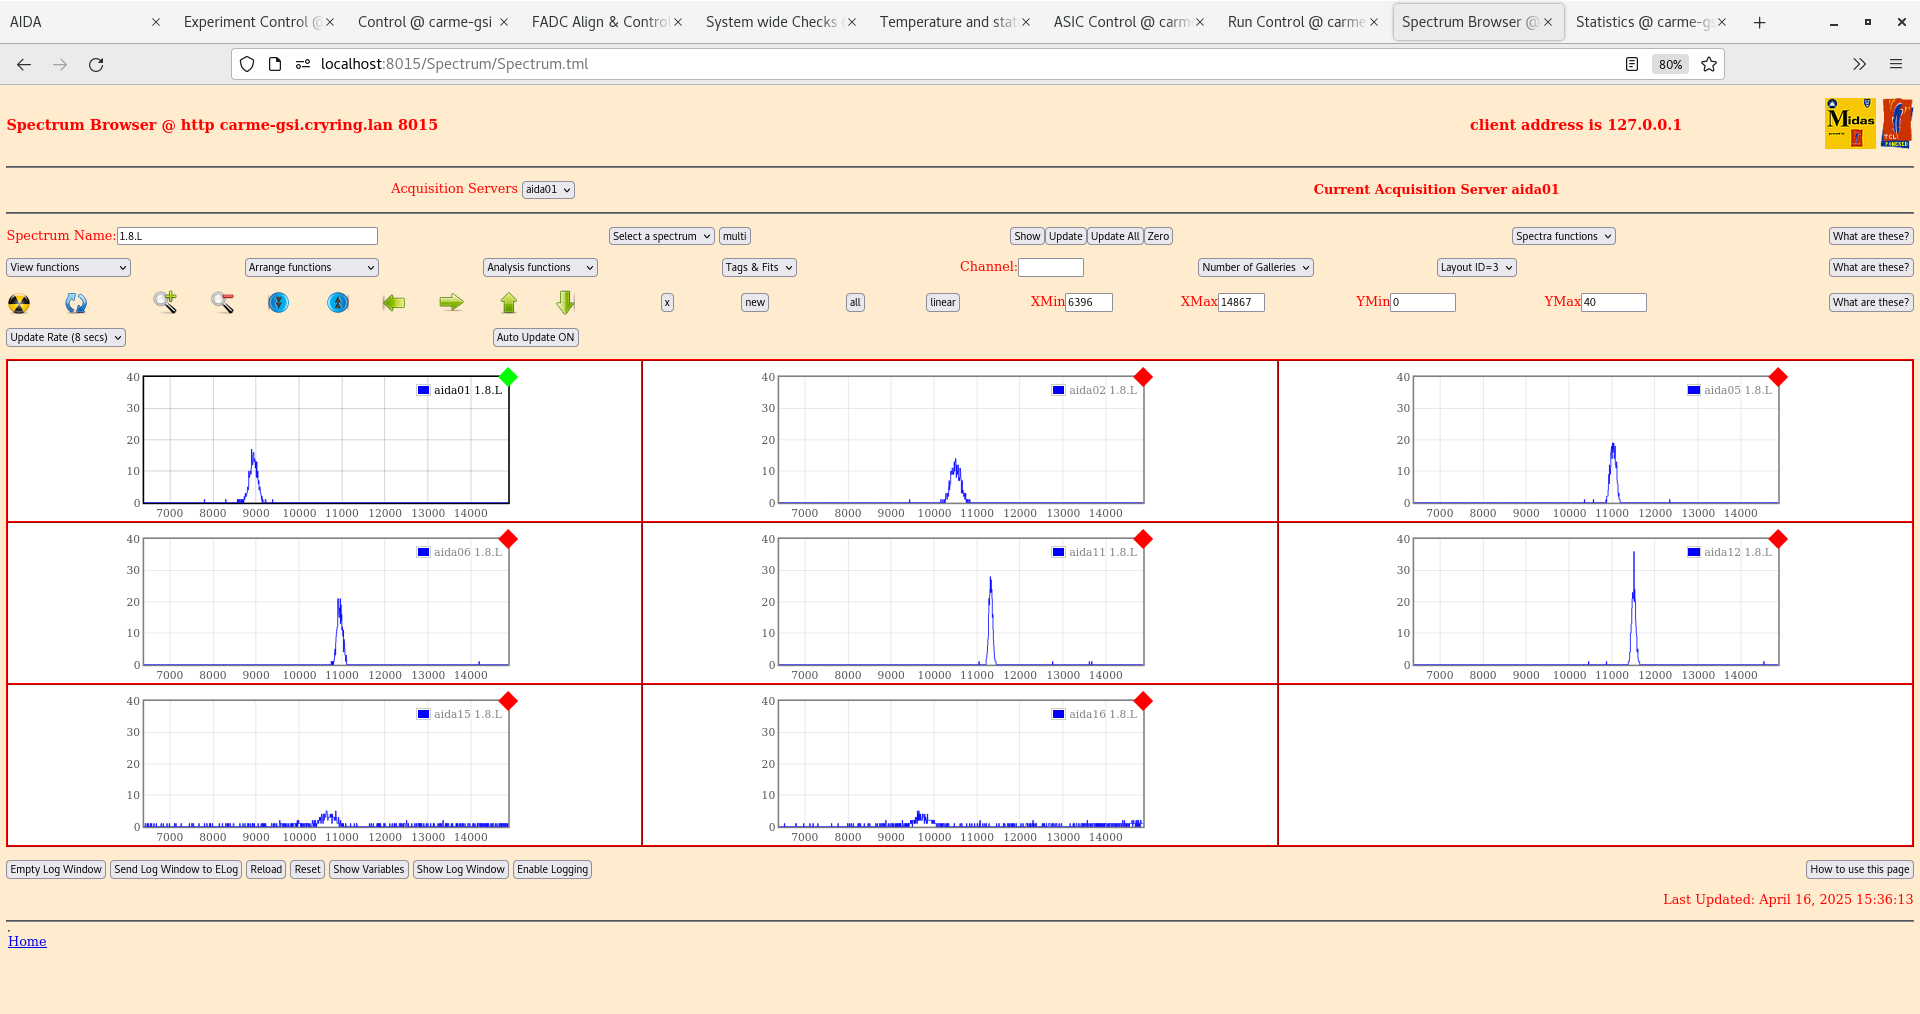
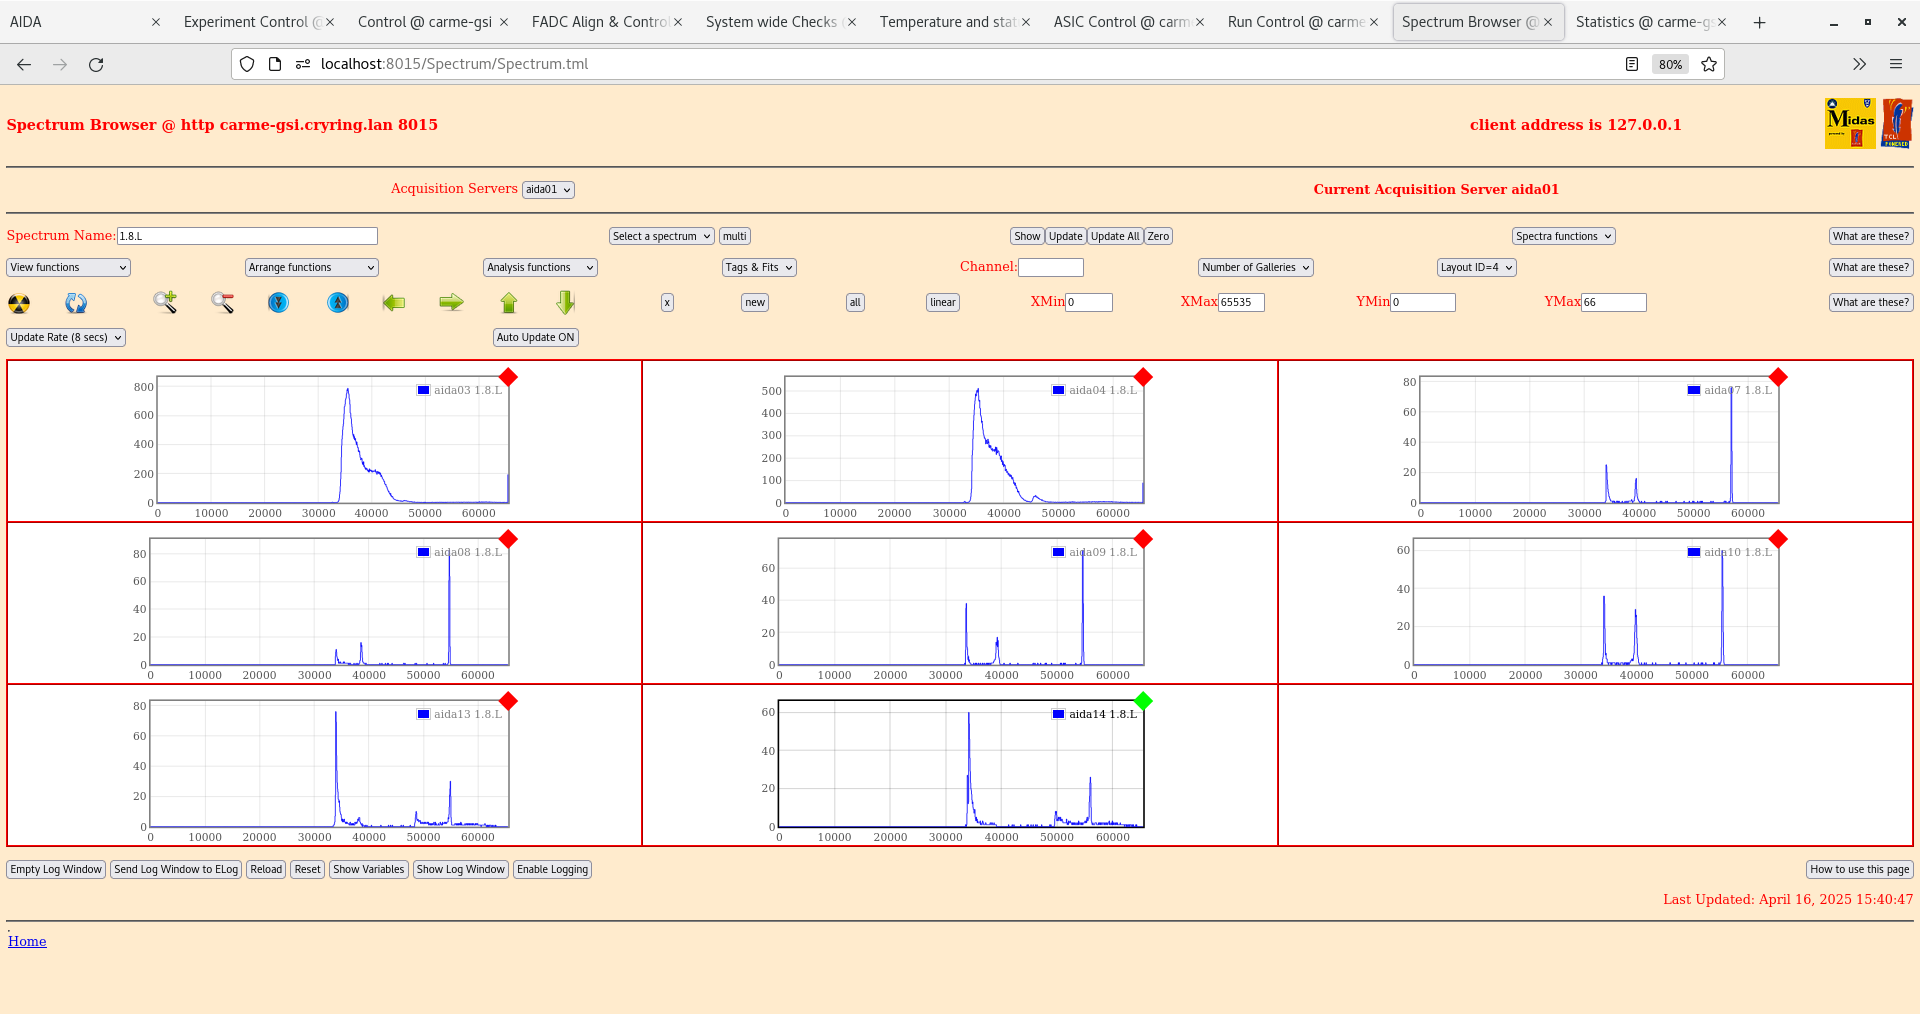
pulser widths 1.8L worse pretty much across the board. No sig impact on rates
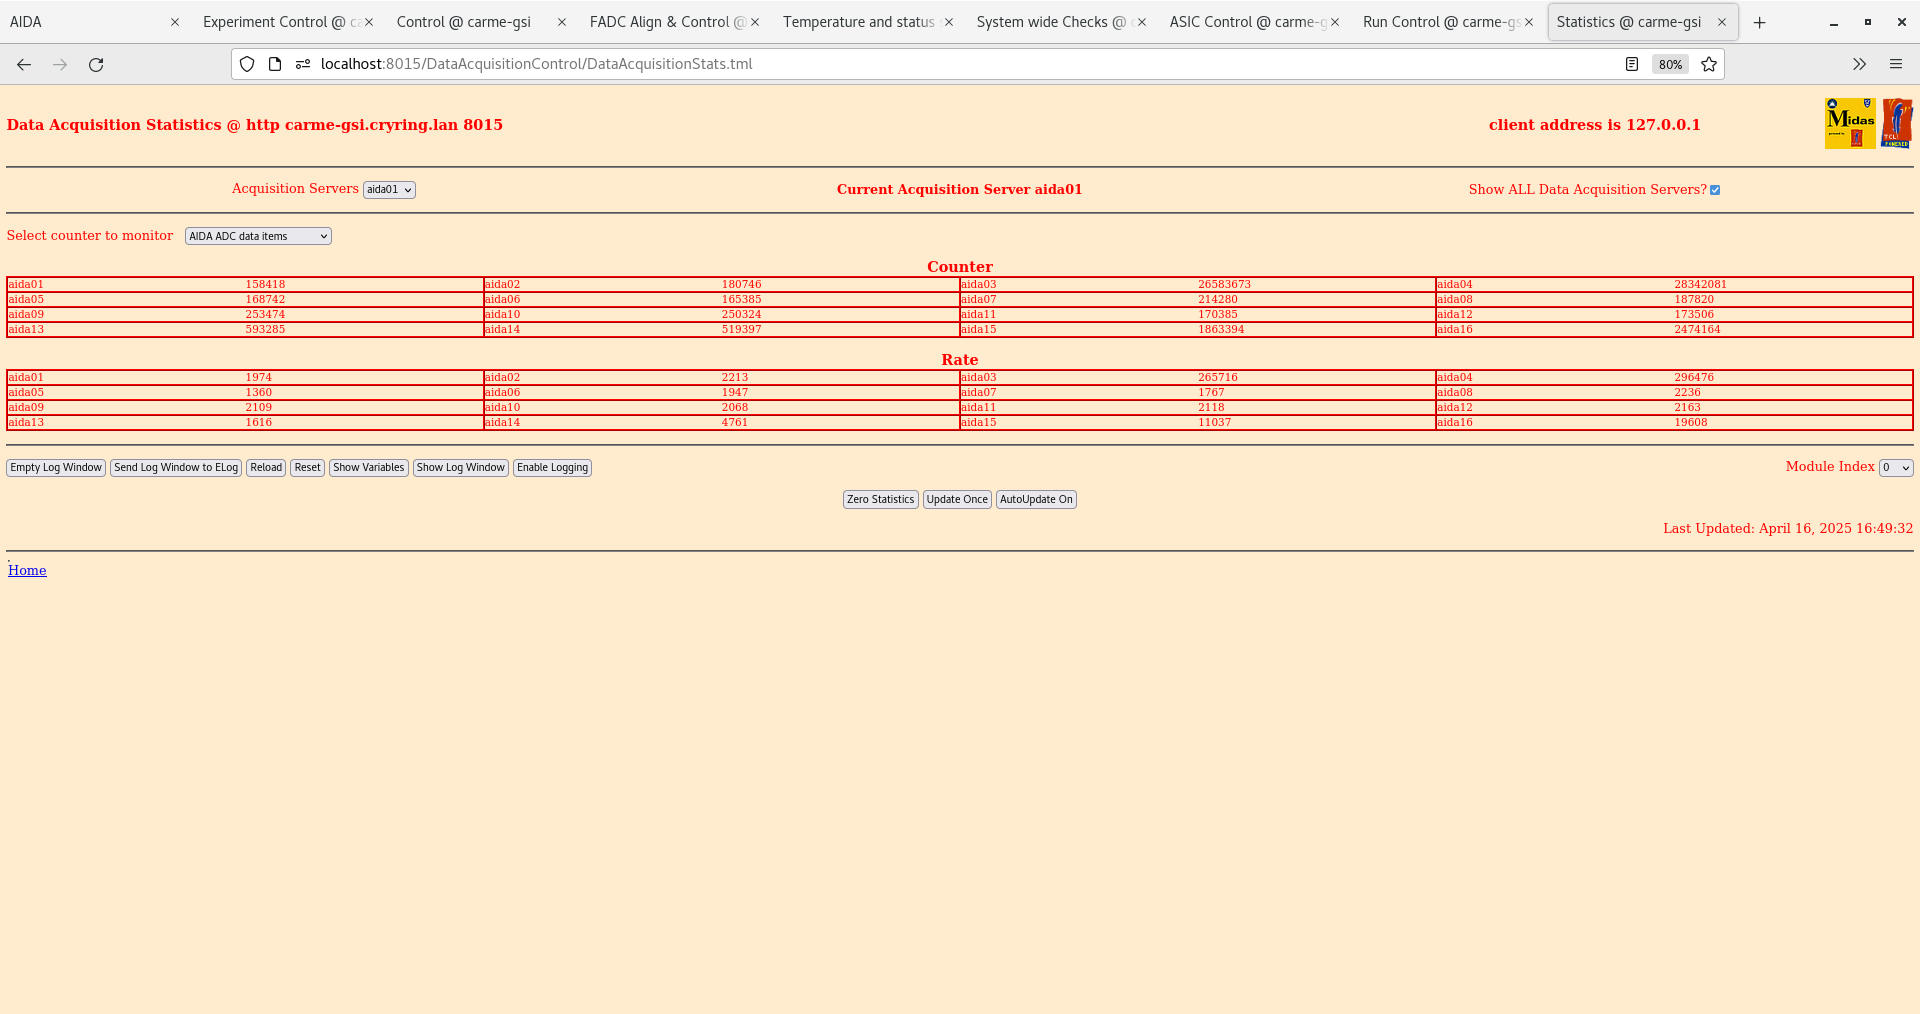
Ground config 3 - attachments 11-14 (grounds returned to coolant pipe)
pulser widths 1.8L better than config 2 but still worse than config1
Ground configuration returned to first configuration. Pulser widths consistent with that seen before.
Additional bias tests.
Disconnected the pn bias cable (core) from DSSD1 but left nn bias cable connected. Biased. Observed bias ramp up but no leakage current was seen.
Reconnected pn bias cable but now disconnected nn bias cable. Biased. Observed bias ramp up, leakage current was seen to increase during ramp to ~8uA. Once fully ramped, leakage current started to slowly decrease and eventually went to zero.
Repeated same tests with DSSD2. Same behaviour observed as with DSSD1.
Have removed motors pins and tried some movement again. No effect on leakage current. Checked pulser widths before movement and after movement (with pnuematic IN). No change in pulser widths.
End of day status FEEs off, bias on and monitoring. Motor pins out to allow for last movement check, motors code running in screen session. |
| Attachment 1: Screenshot_from_2025-04-16_09-19-34_1.png
|

|
| Attachment 2: Screenshot_from_2025-04-16_14-18-39.png
|
|
| Attachment 3: Screenshot_from_2025-04-16_14-21-10.png
|
|
| Attachment 4: Screenshot_from_2025-04-16_14-25-23.png
|
|
| Attachment 5: Screenshot_from_2025-04-16_14-26-33.png
|
|
| Attachment 6: Screenshot_from_2025-04-16_14-29-51.png
|
|
| Attachment 7: Screenshot_from_2025-04-16_14-30-37.png
|
|
| Attachment 8: Screenshot_from_2025-04-16_15-31-45.png
|
|
| Attachment 9: Screenshot_from_2025-04-16_15-36-24.png
|
|
| Attachment 10: Screenshot_from_2025-04-16_15-41-11.png
|
|
| Attachment 11: Screenshot_from_2025-04-16_16-49-43.png
|
|
| Attachment 12: Screenshot_from_2025-04-16_16-55-09.png
|
|
| Attachment 13: Screenshot_from_2025-04-16_16-55-44.png
|
|
| Attachment 14: Screenshot_from_2025-04-16_17-42-40.png
|
|
|
|
673
|
Tue Apr 15 12:23:10 2025 |
JM | Leakage current / CARME issues |
14/04/25
Arrived at GSI in the afternoon.
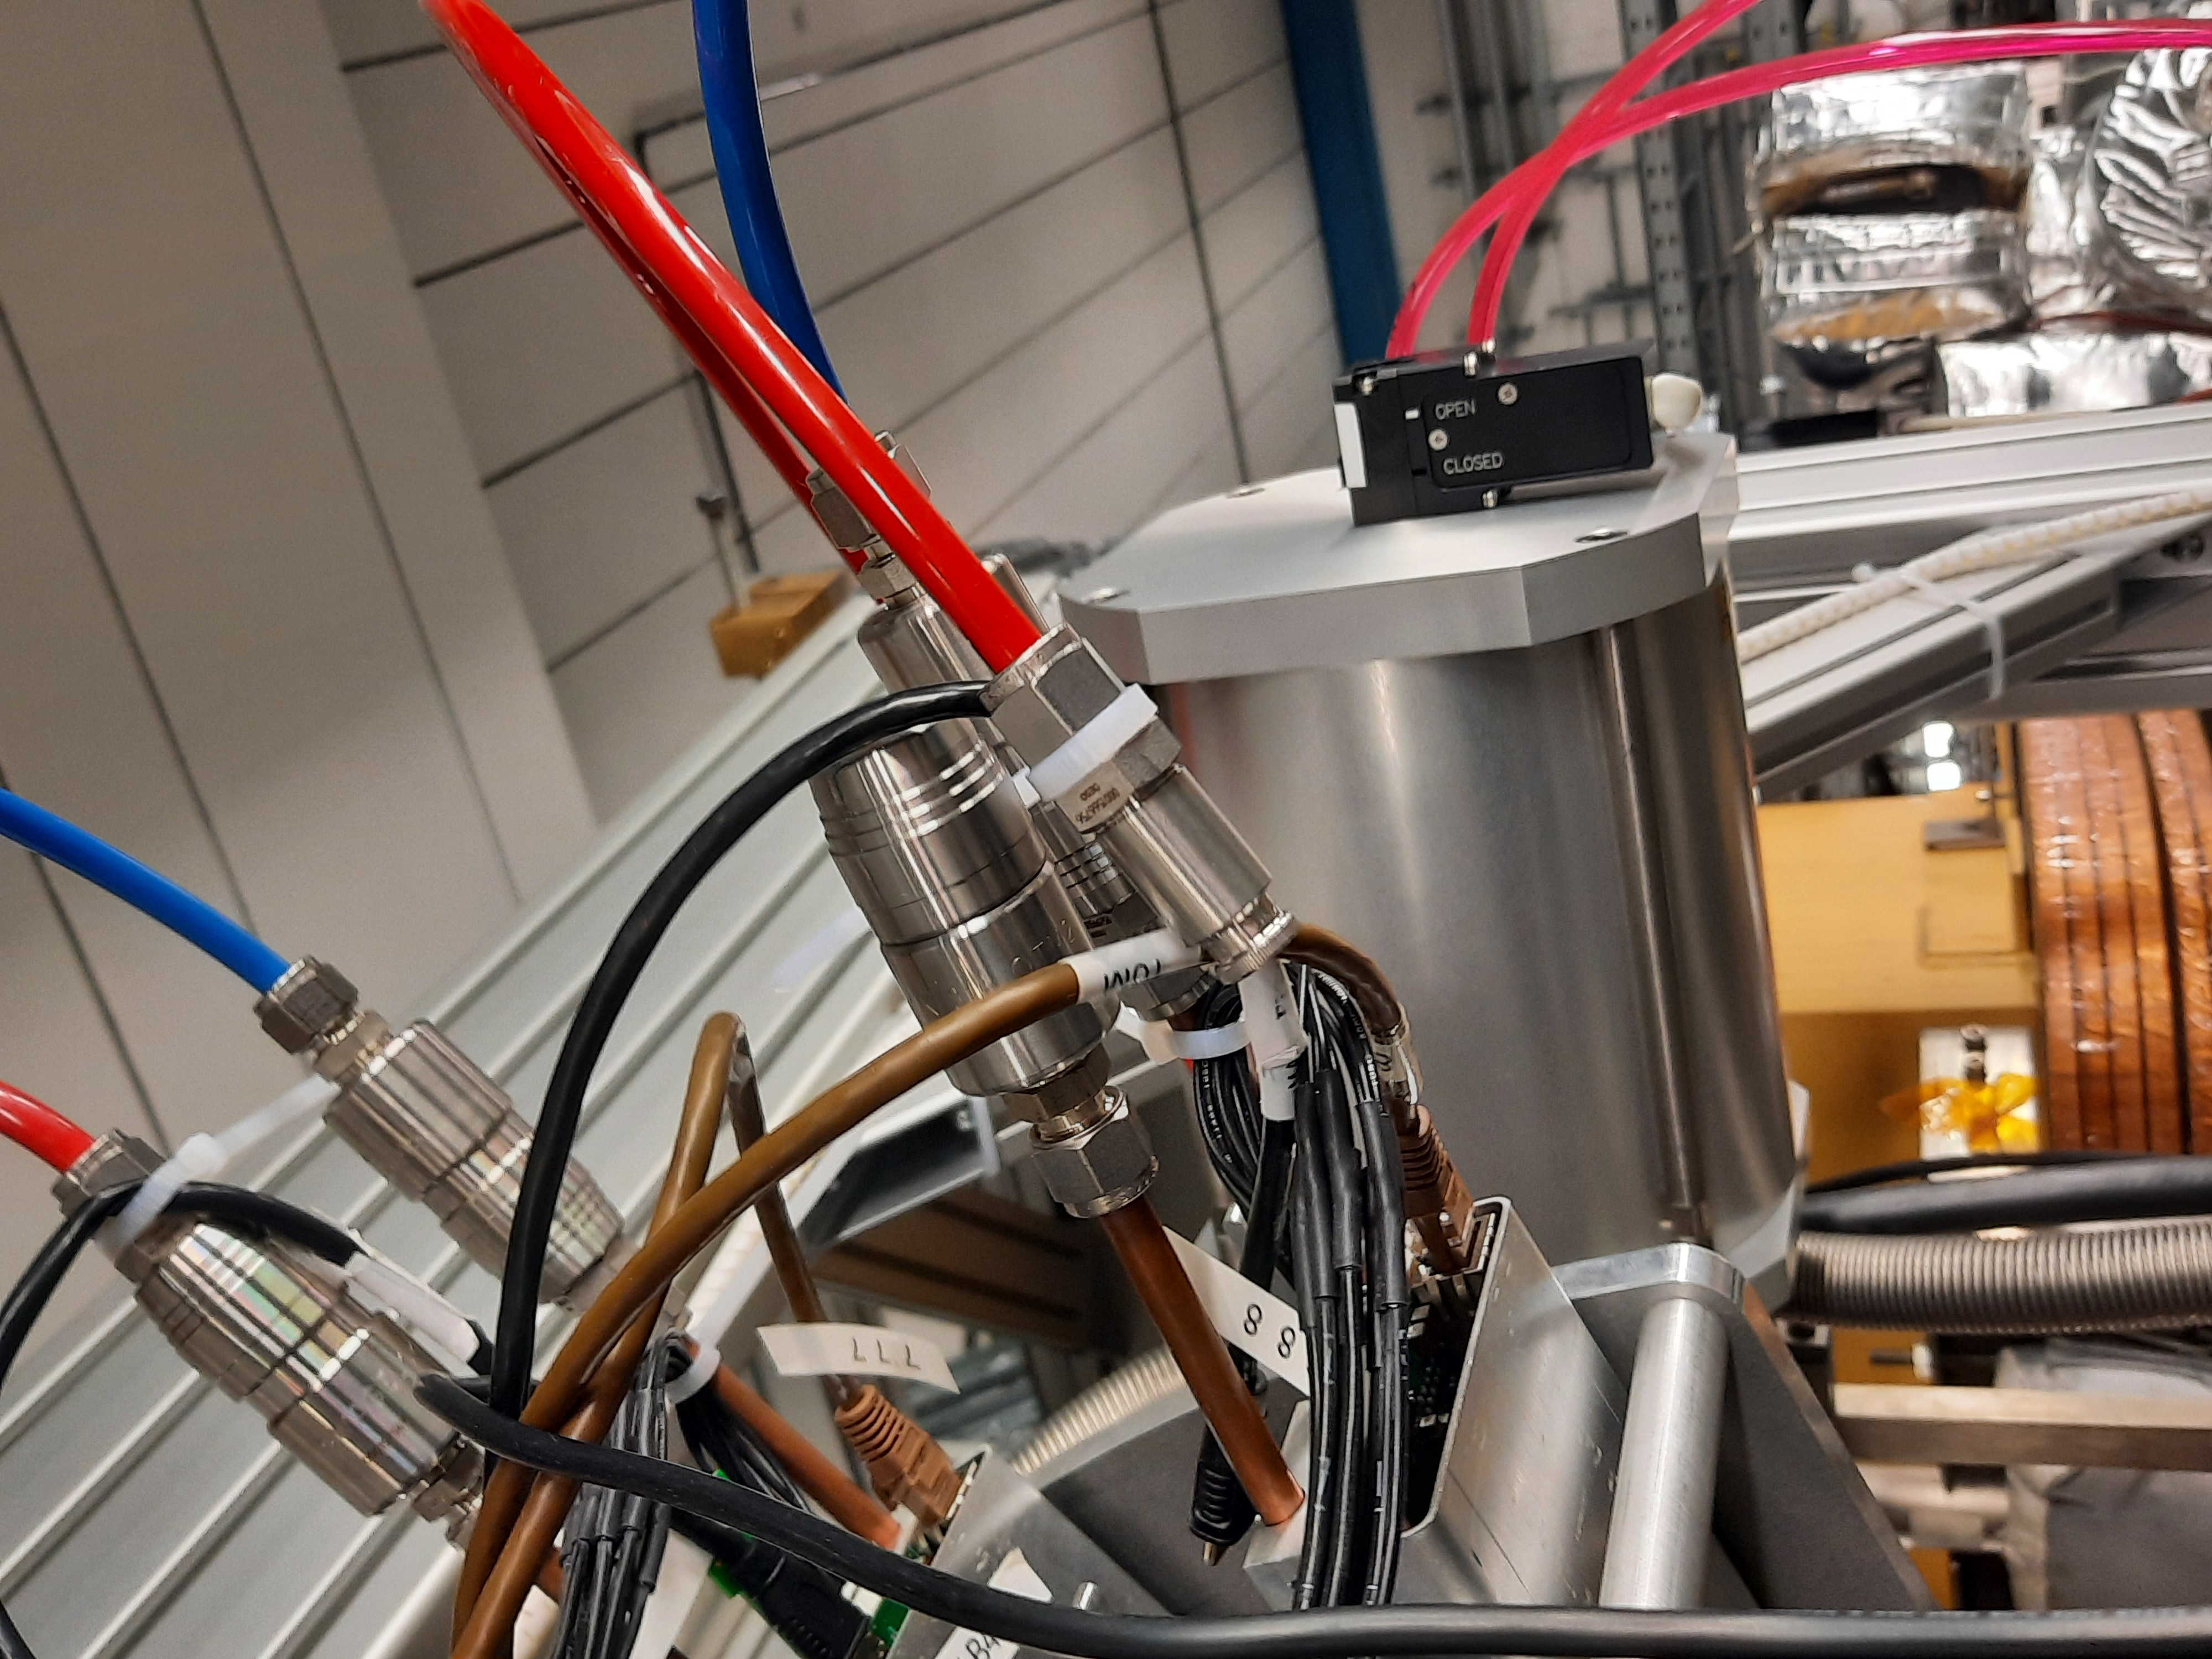
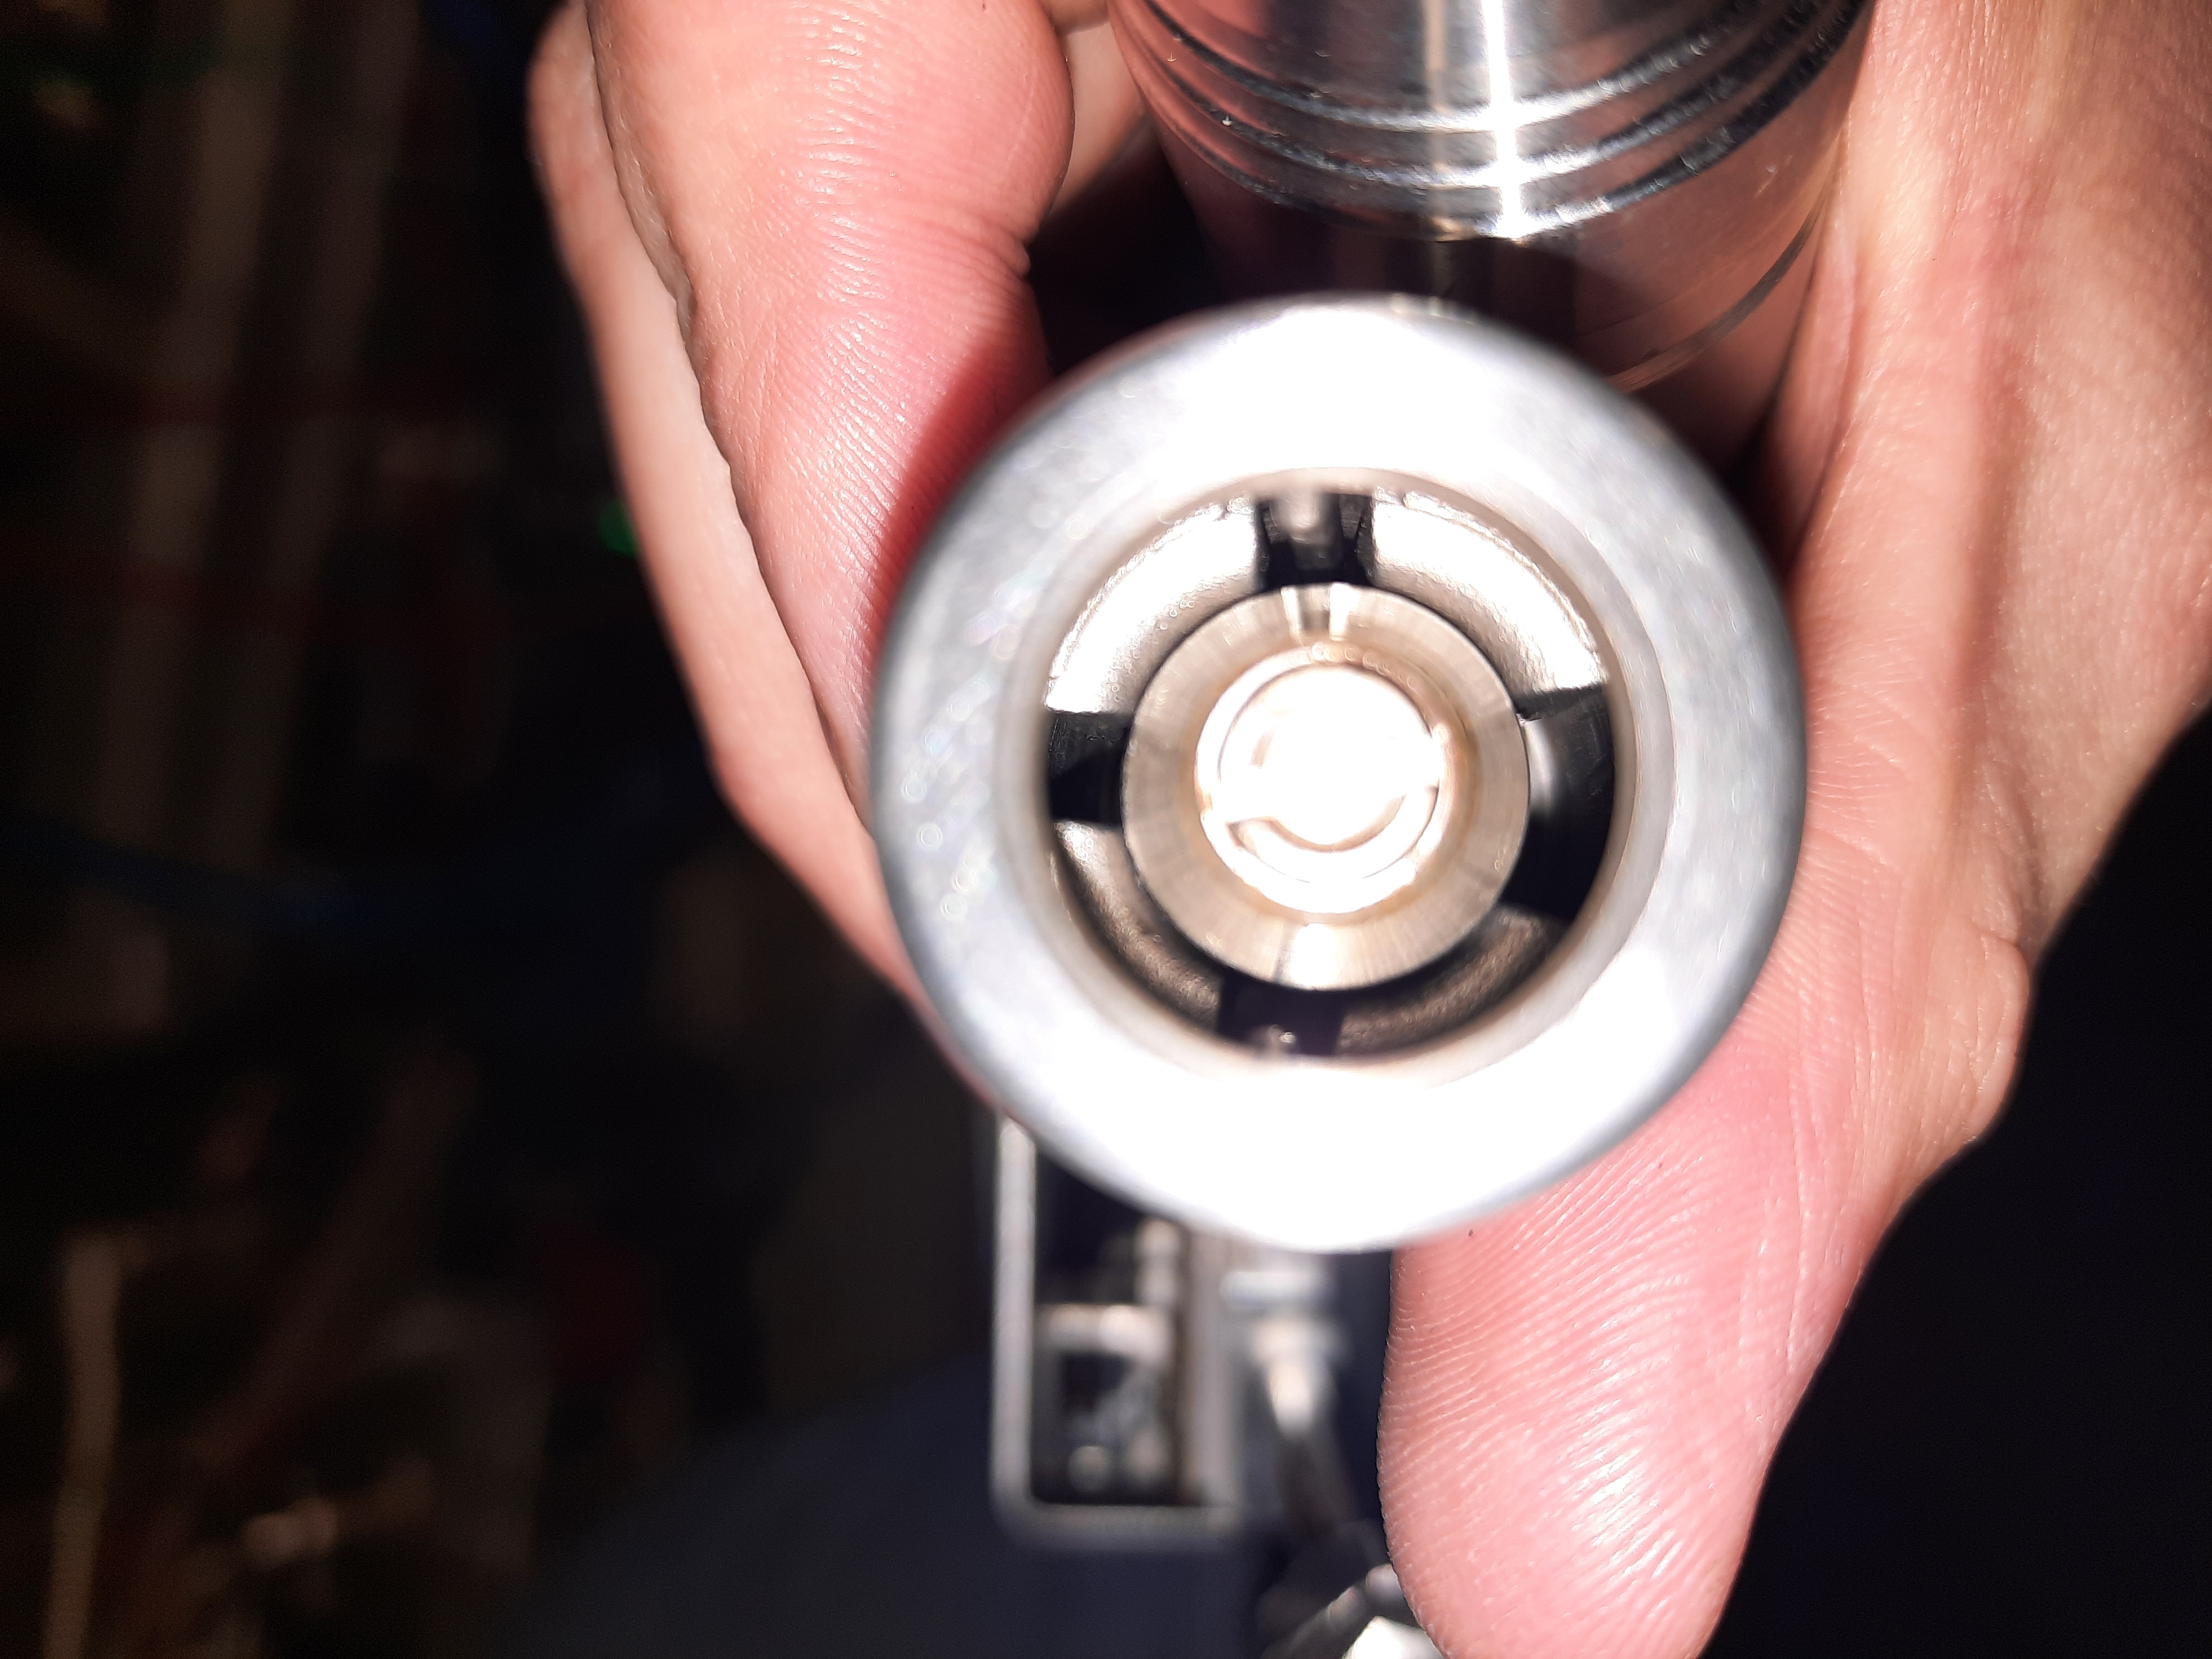
Found that the coolant loop on aida08 had popped out which resulted in the high FEE temperatures observed (see attachment 1). Female swagelock connector on FEE suggested to be the cause as this connector has the locking mechanism. FEE dismounted and female swagelock connector removed. No obvious defect in the connector (see attachment 2).
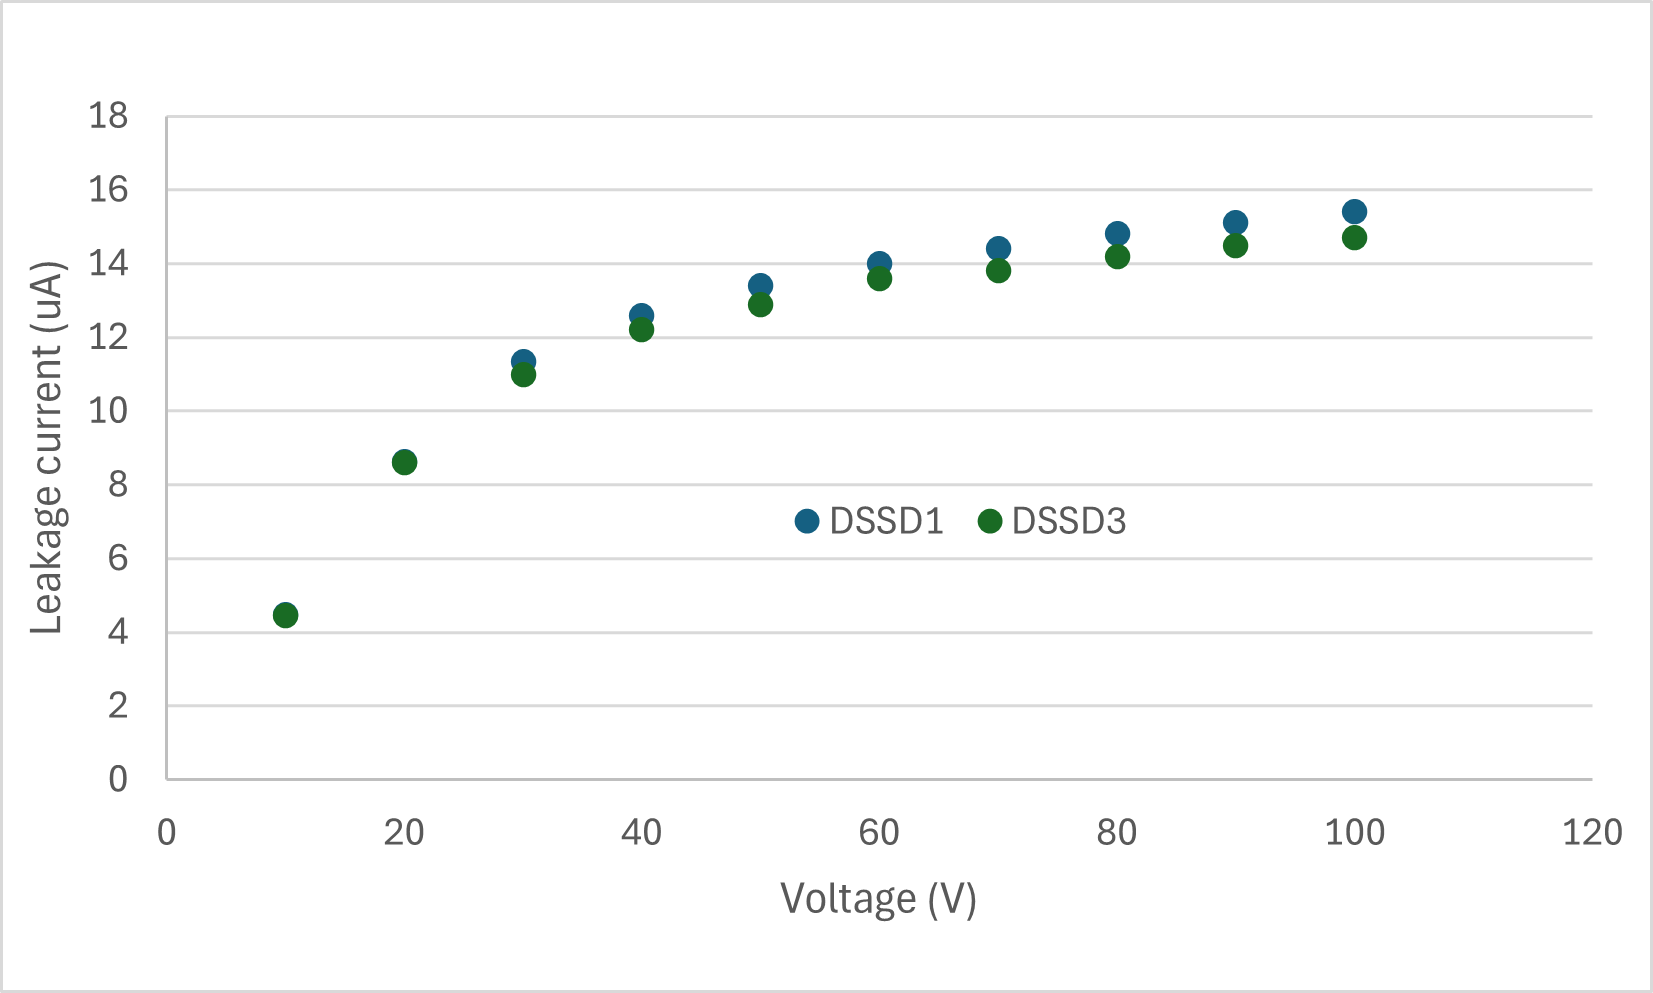
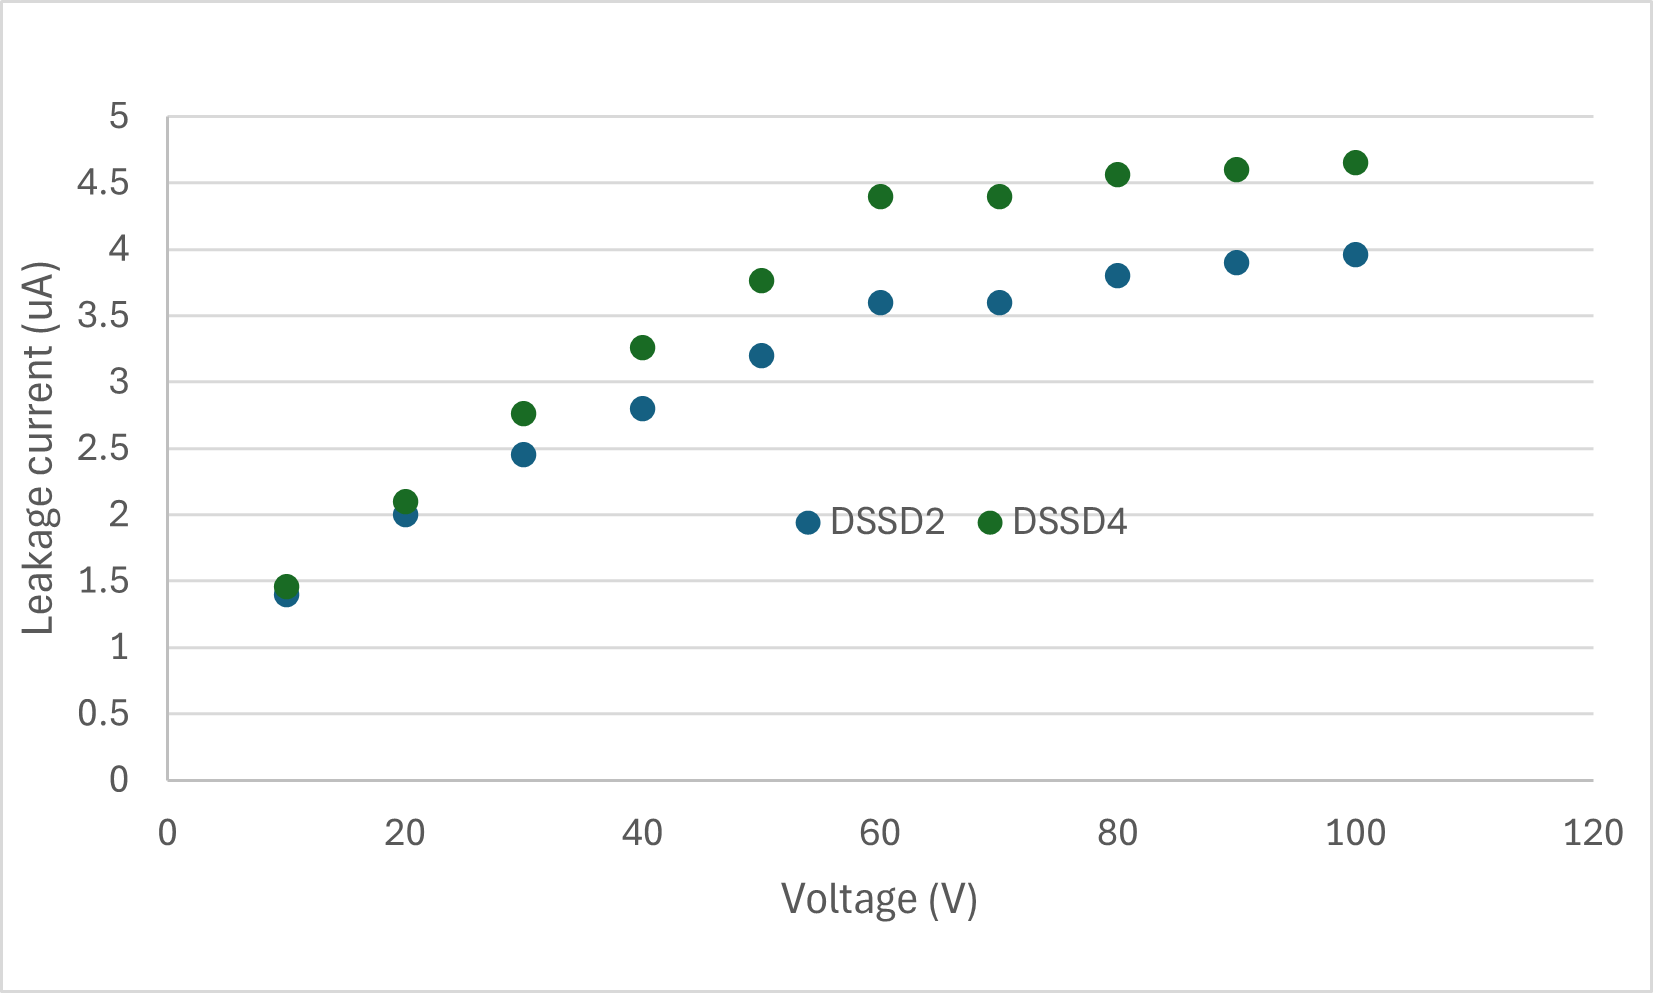
Turning on detectors we observe ~4uA in DSSD2 and DSSD4 (right hand side detectors) and ~15uA in DSSD1 and DSSD3 (left detectors). Leakage currents in left hand side detectors is down from ~17uA seen at the end of last week and ~19uA at start of last week. Temperatures in the cave do not appear to have changed sufficiently to explain this change. VI curve completed to test diode response (attachment 3+4).
Motors turned on to again see if it changes the leakage currents in any way. Both arms homed. Left arm moved in with pneumatic and servo (10mm). No change in leakage currents during movement or when fully in. Same procedure with the right arm. No change in leakage currents in either. I doubt this is a light affect. If some light was incident on the left hand detectors, moving the detectors should have changed the amount of light on them in some way, reducing the leakage current. Similarly if light can hit the detector when fully in for the left arm, some should be hitting the right arm when it is fully in too, but no change observed on the right arm either. No light sources found on interaction chamber, baking jackets covers all ports.
Movement for several repeptitions with the pneumatic tried to see if this had any affect -> no change
Bias lines for DSSD1 and DSSD2 swapped around on the caen bias module. No change in leakage current for DSSD1 or 2. Channel on bias module not to blame.
Tried turning ion pumps off, no change on leakage currents.
Tried reverse biasing the detectors. Polarity for channels 0 (DSSD1) and 2 (DSSD3) swapped from -ve to +ve on bias module. Core and braid swapped on adaptor card. Completed VI curve when reverse biased for these detectrors. Obtain the same curve as with -ve polarity. Left at 100V for 10-15 minutes. Put polarities back to -ve, no change in leakage currents observed.
Opended up one of the diamond windows with bias off. Shone my phone light through the window for ~30 seconds. Closed window off again, biased, no change observed. Left detectors biased overnight. CH0 - 15.4 uA, CH2-14.7uA.
15/04/25
No change in leakage currents overnight. From gnuplot they look pretty flat overnight. Perhaps slight decrease.
Checked attaching LK2 jumper to aida09 (nn DSSD3). Could not reach other nn adaptor card. No effect on leakage current. Dismounted jumper.
New female connector mounted on aida08 and FEE remounted.
Restarted AIDA system by closing all windows and servers. Error on starup, could not connect to relay16 for FEE power.
Issue related to dew point interlock. Dew point sensor is very sensitive and any movement can cause it to trip. Sensor was not well supported on the coolant pipe. Sensor remounted with plastic zip ties. Issue resolved. Investigate some noise issues in the afternoon
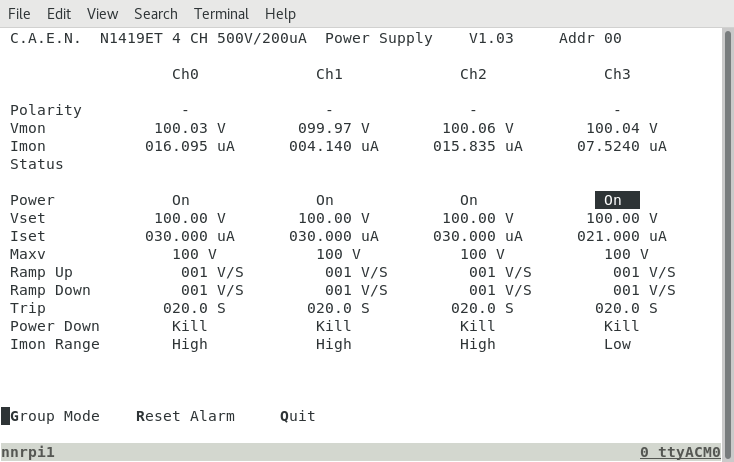
After lunch I have noticed the leakage current have increased slightly. See attachment 5. CH3 is higher and appears to be fluctuating by 1-2uA. Turning off bias and going to cave to investigate.
Bias still higher and fluctating on CH3. Konstantin is in the ring, but he has not started any works yet, some grossmontage are also in the ring and are working on the new source. Could this be affecting us? Either way, will startup daq to check rates/noise etc.
Previous settings applied (i.e all channels back to LEC). Have lost the dew point interlock again!
I have suspended the dew point sensor in the air for the time being -> need to put a dummy in.
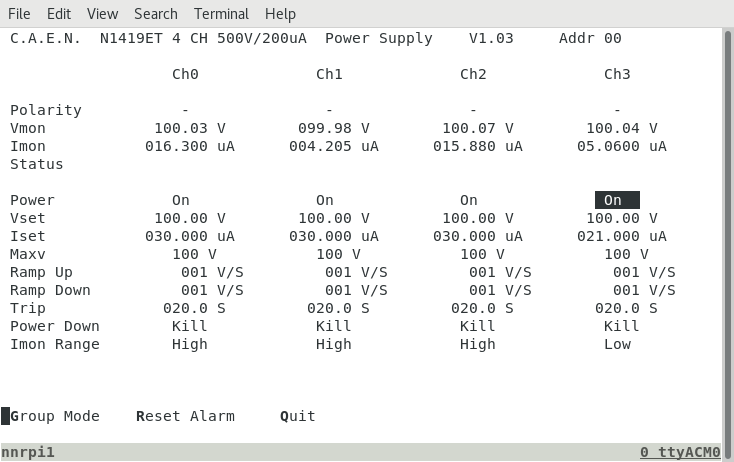
Grossmontage working on ion source have left and leakage current on DSSD3 is no longer fluctuating -> coincidence? (attachment 6)
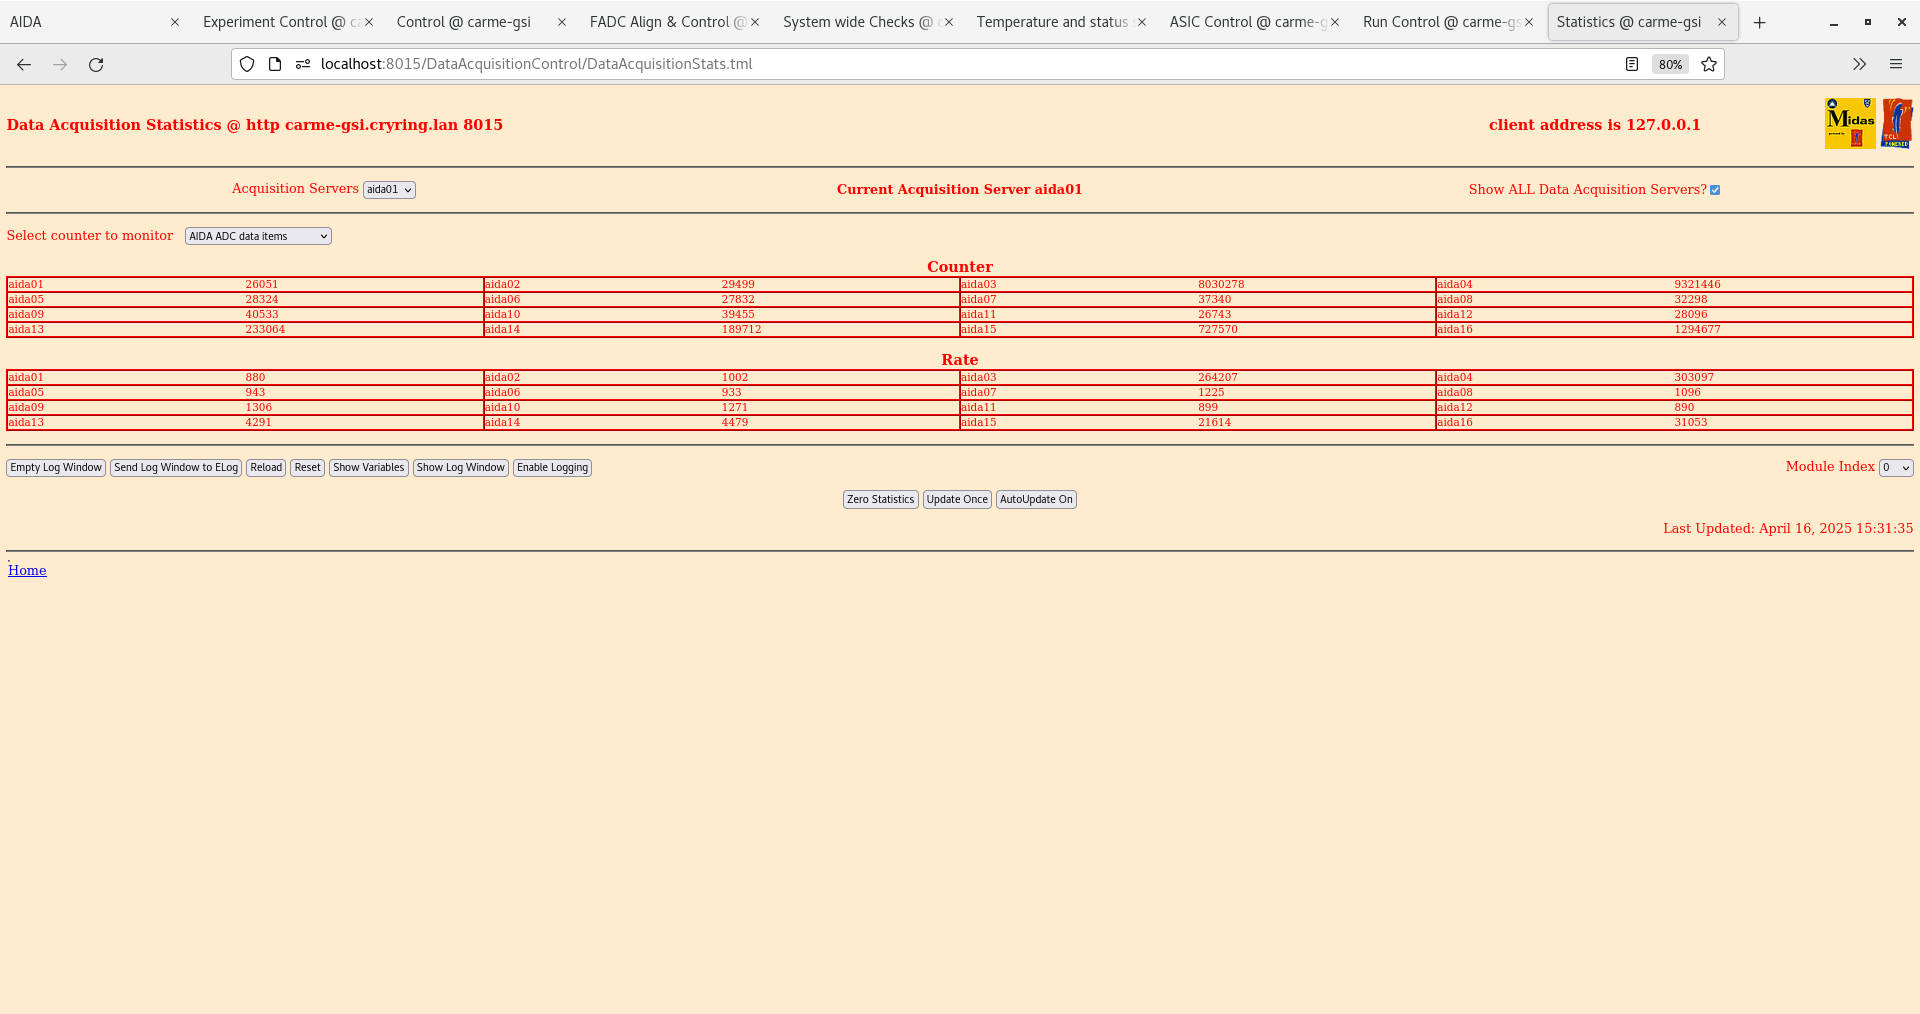
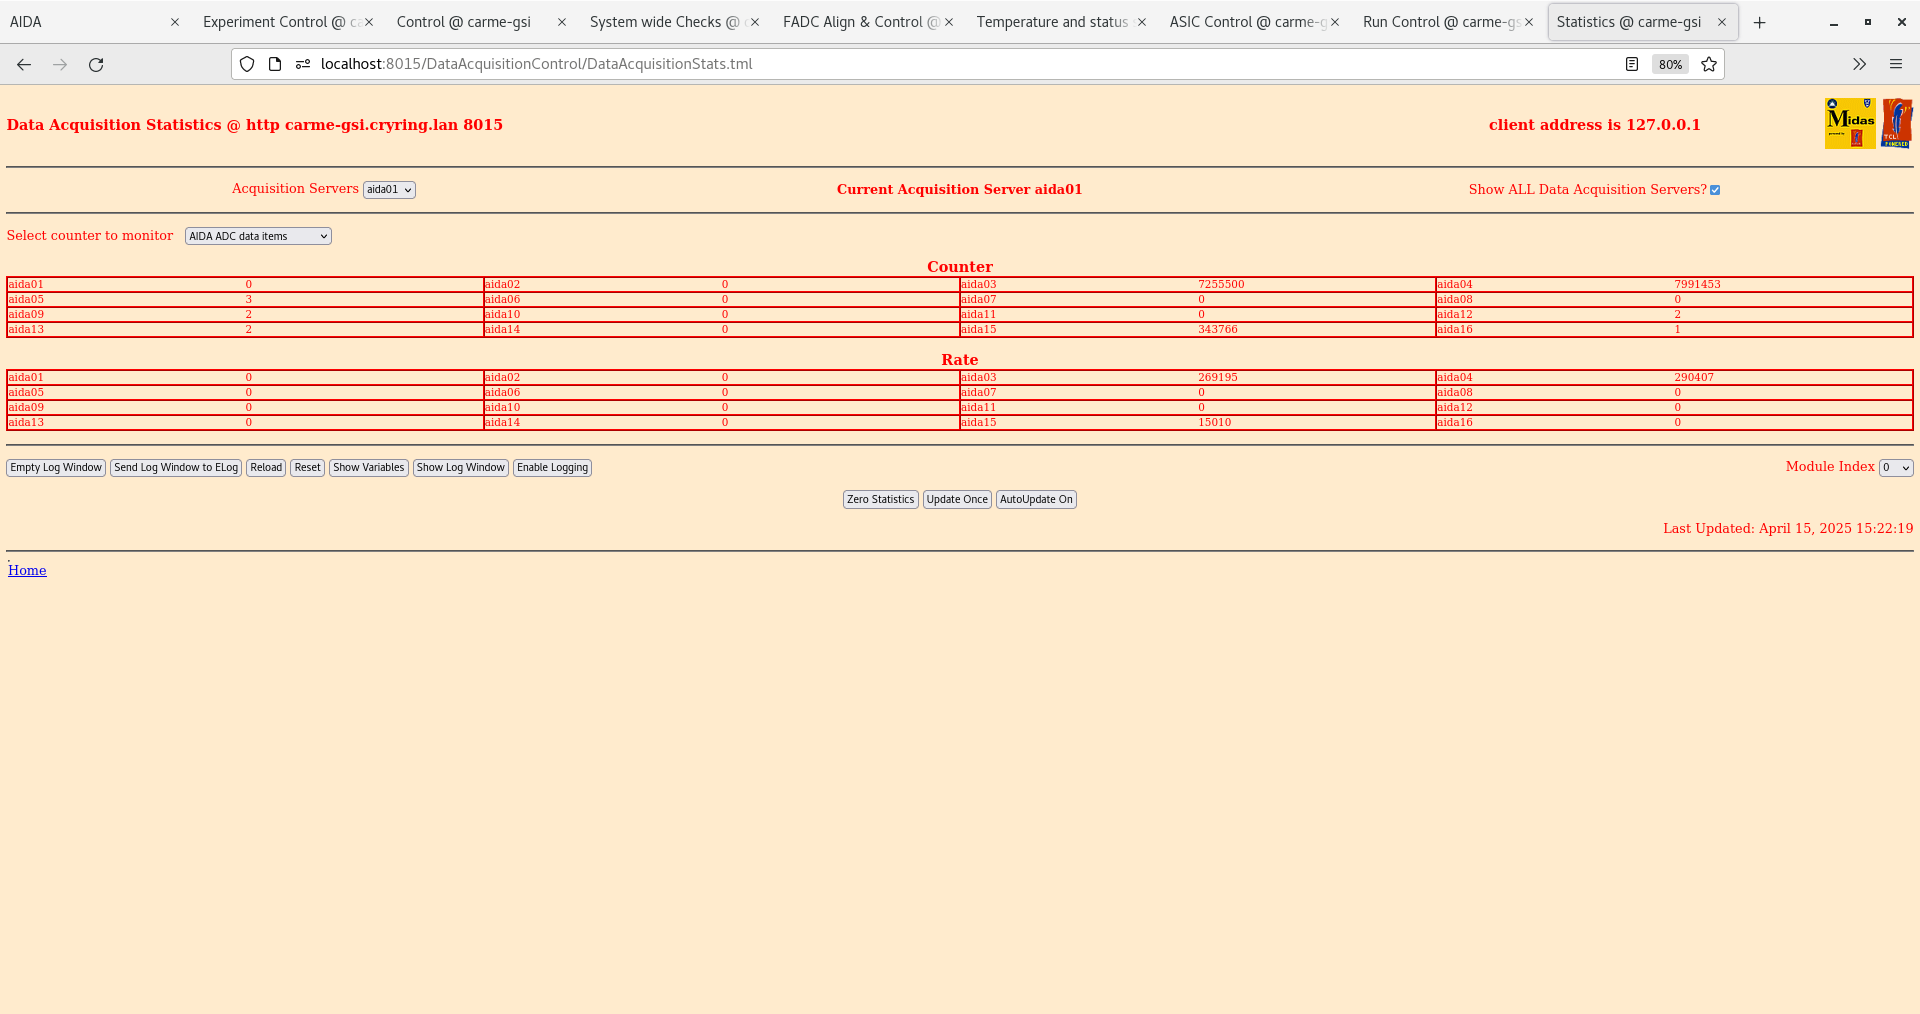
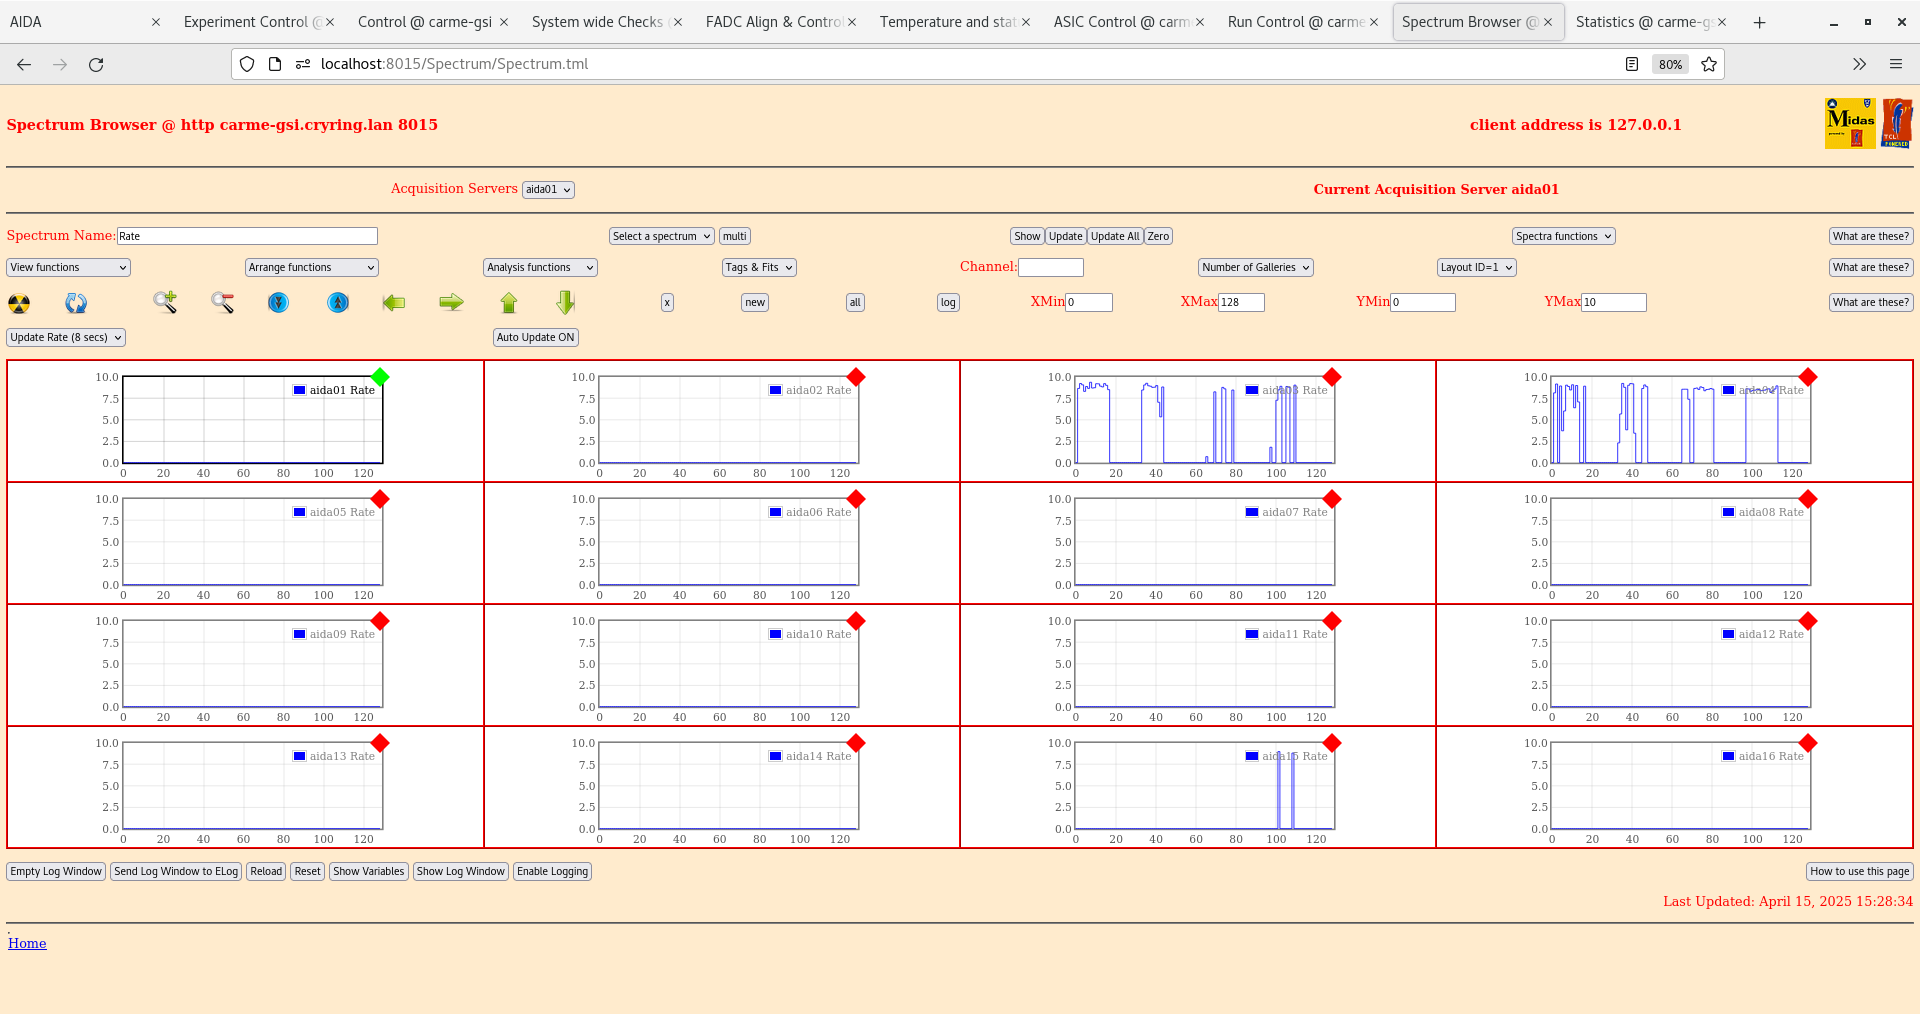
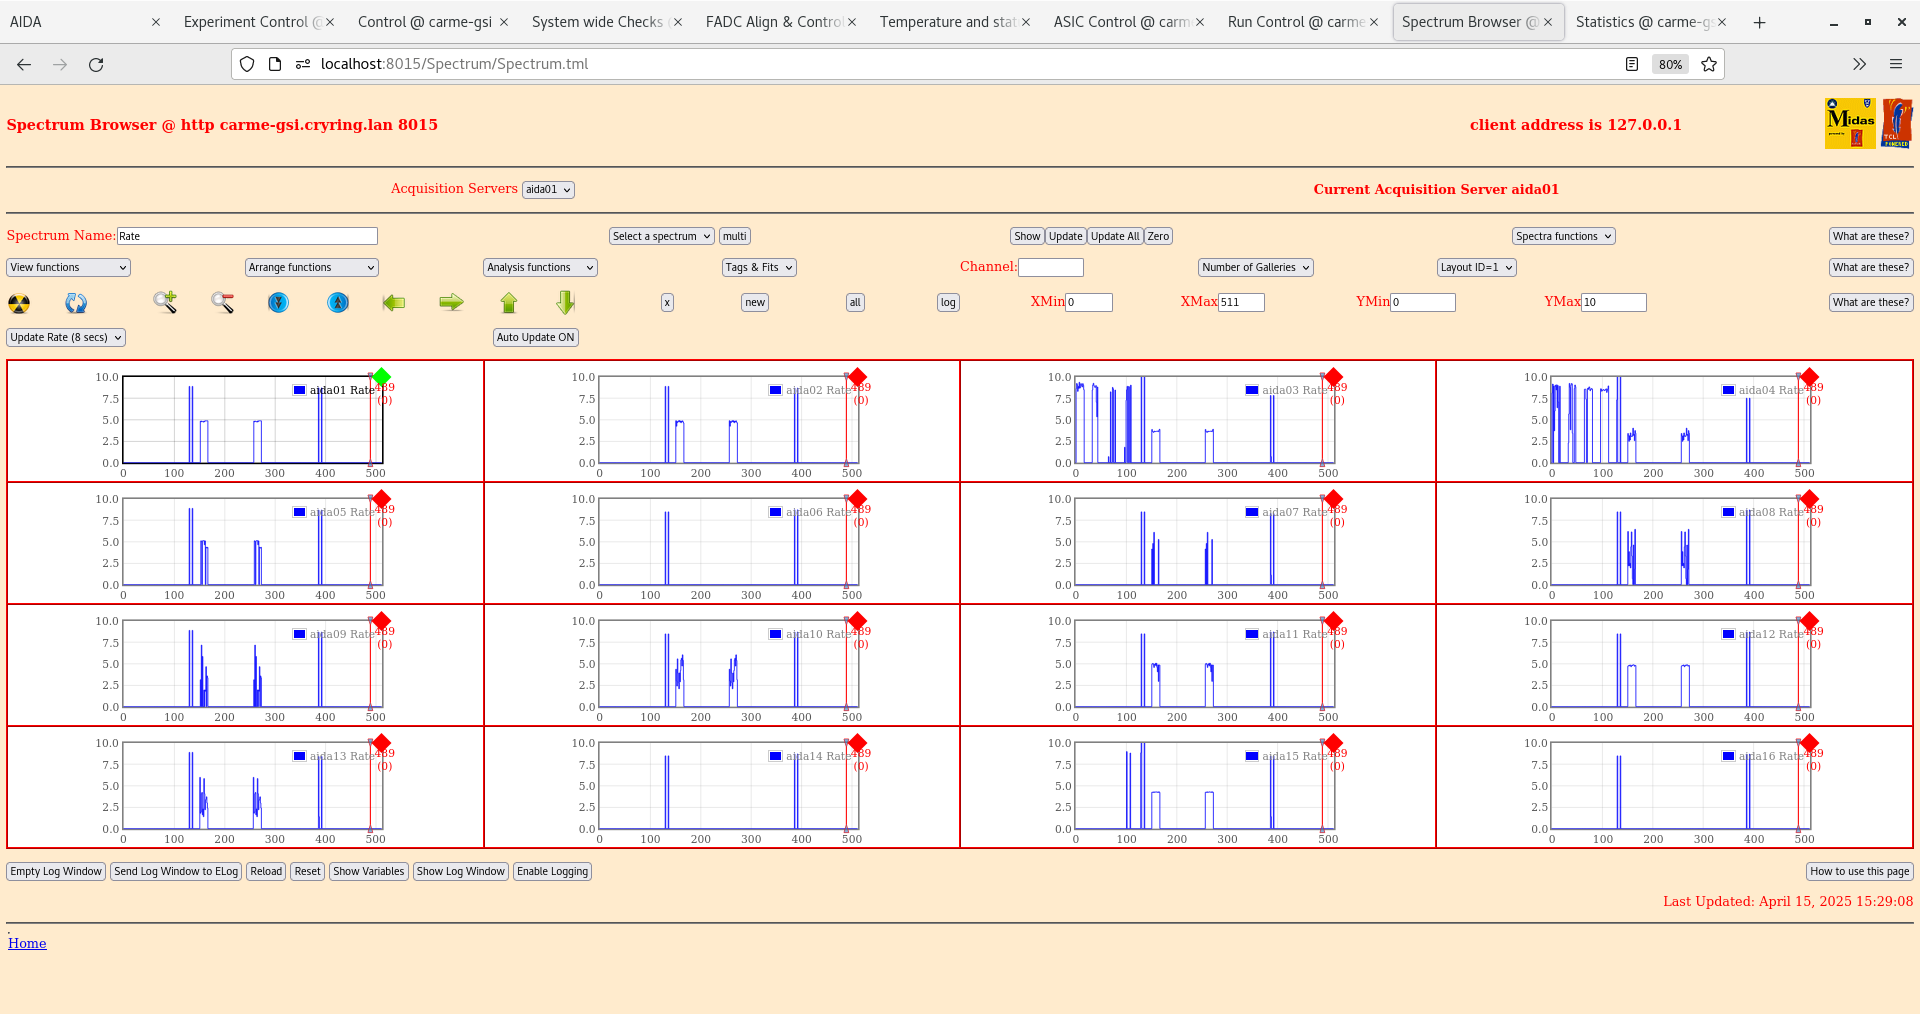
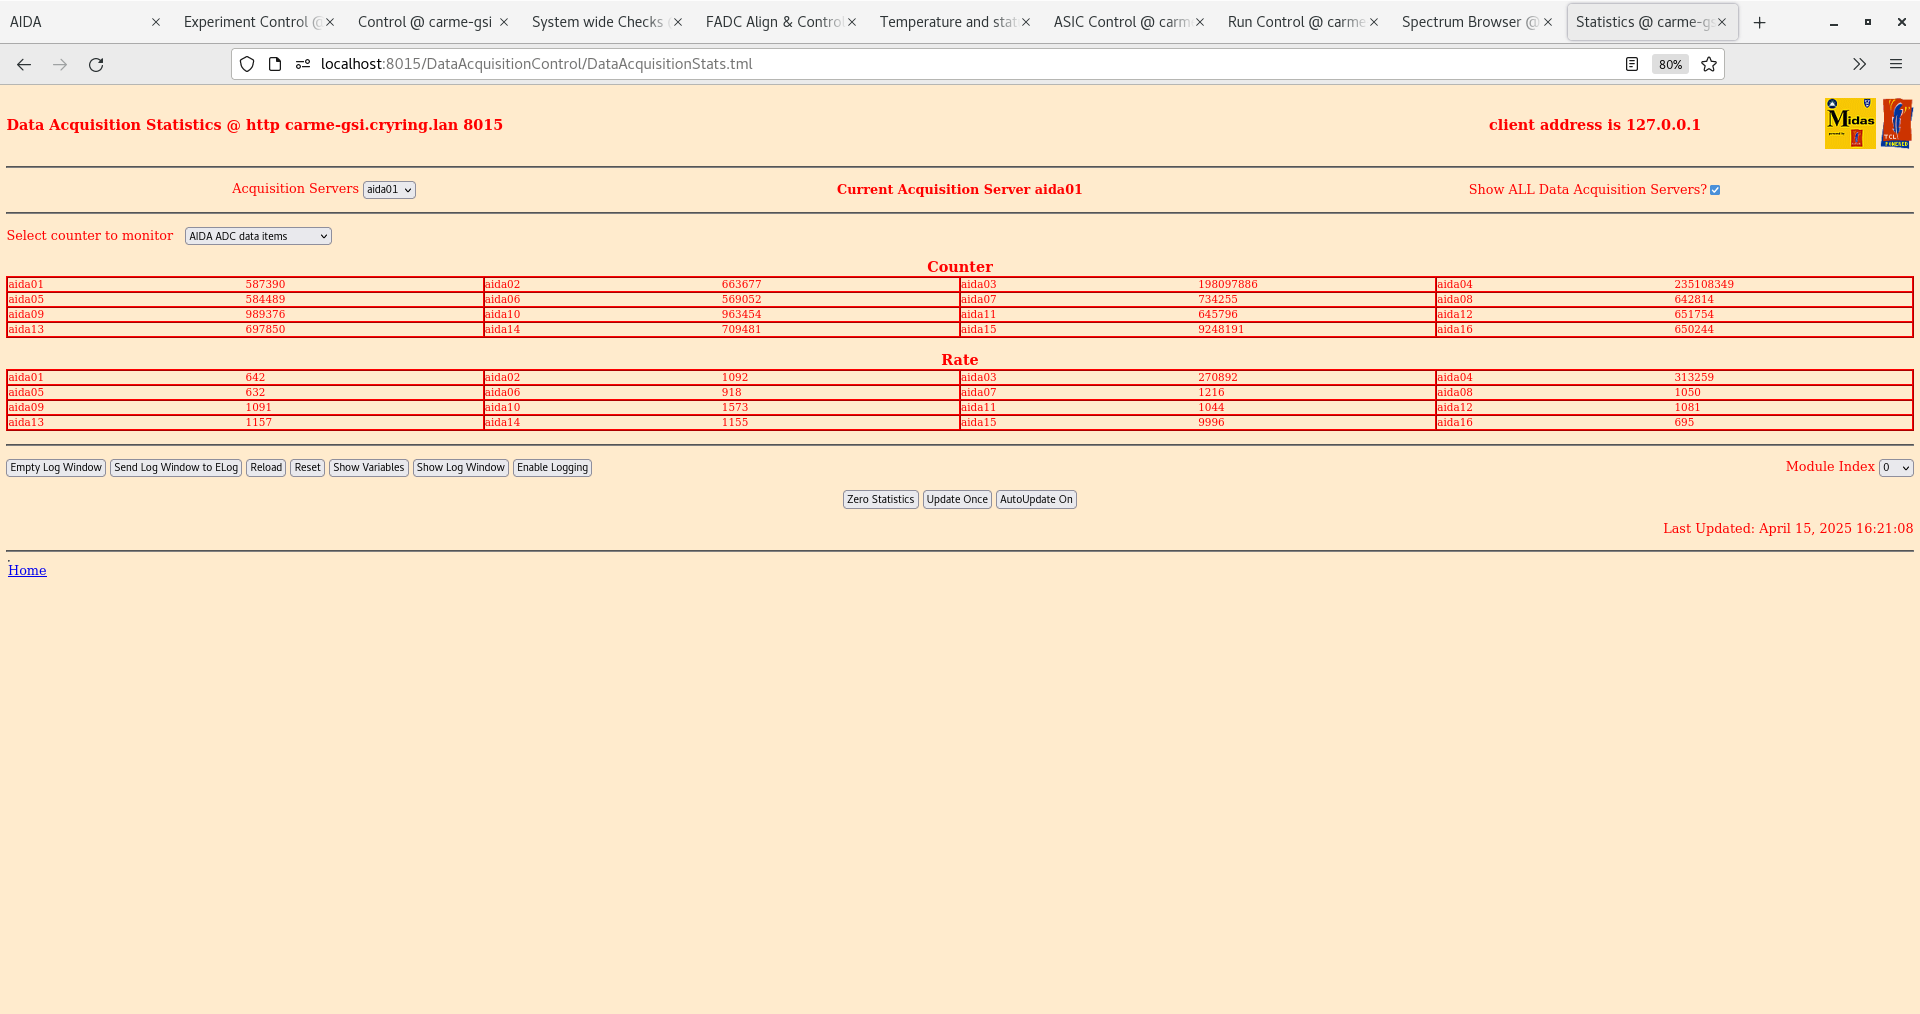
AIDA started again. Rates appear OK except for on 3,4 and 15. (see attachement 7,8,9) Note the rates on 9,10 are reduced compared to previous elog entry. Note pulser off. Note on aida startup aida16 clock status fail and ADC calibration fail for aida 6,14 and 16
16:00
We again see DSSD3 leakage current fluctuating. I will head back to the cave to check if anyone is working again? Nikos and davide working on the target but can't see how they would impact the leakage current (they were only installing a support for the new turbo)
DSSD3 remains fluctuating even now they have stopped working.
Pulser on. Same settings as elog 664 -> freq = 10 Hz
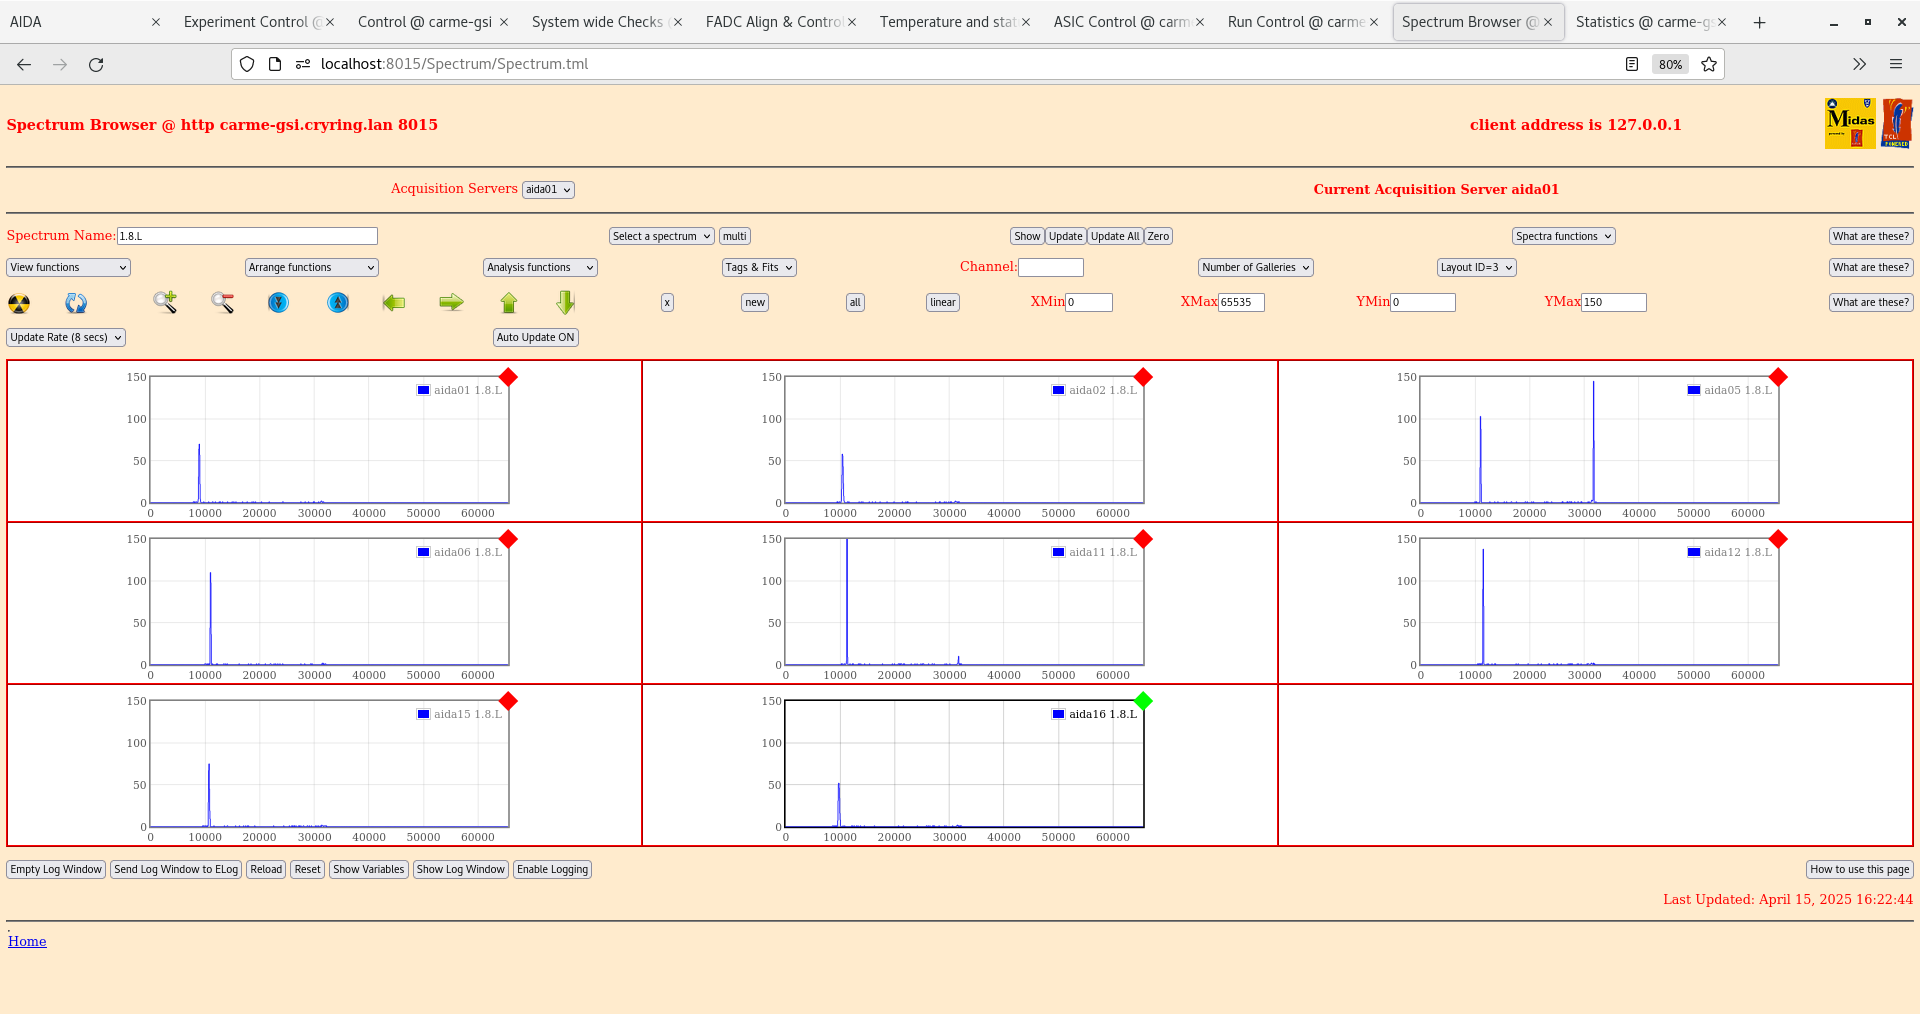
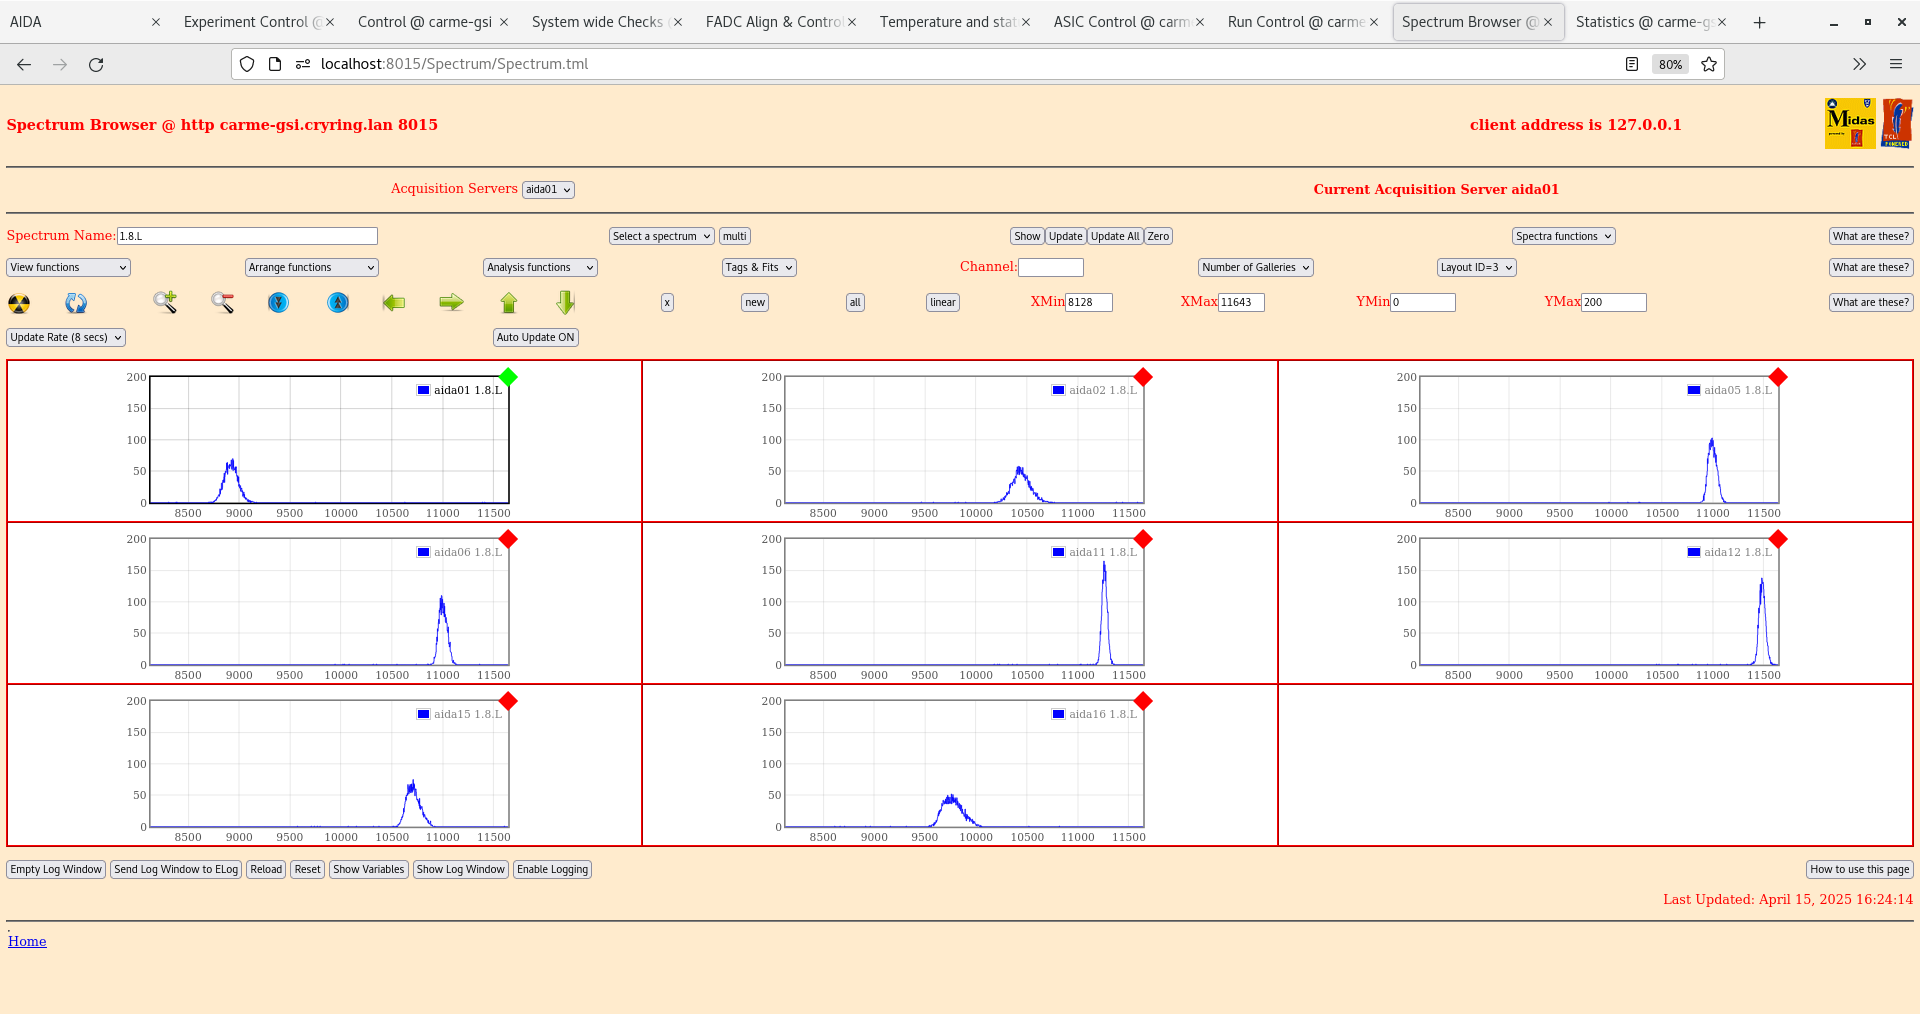
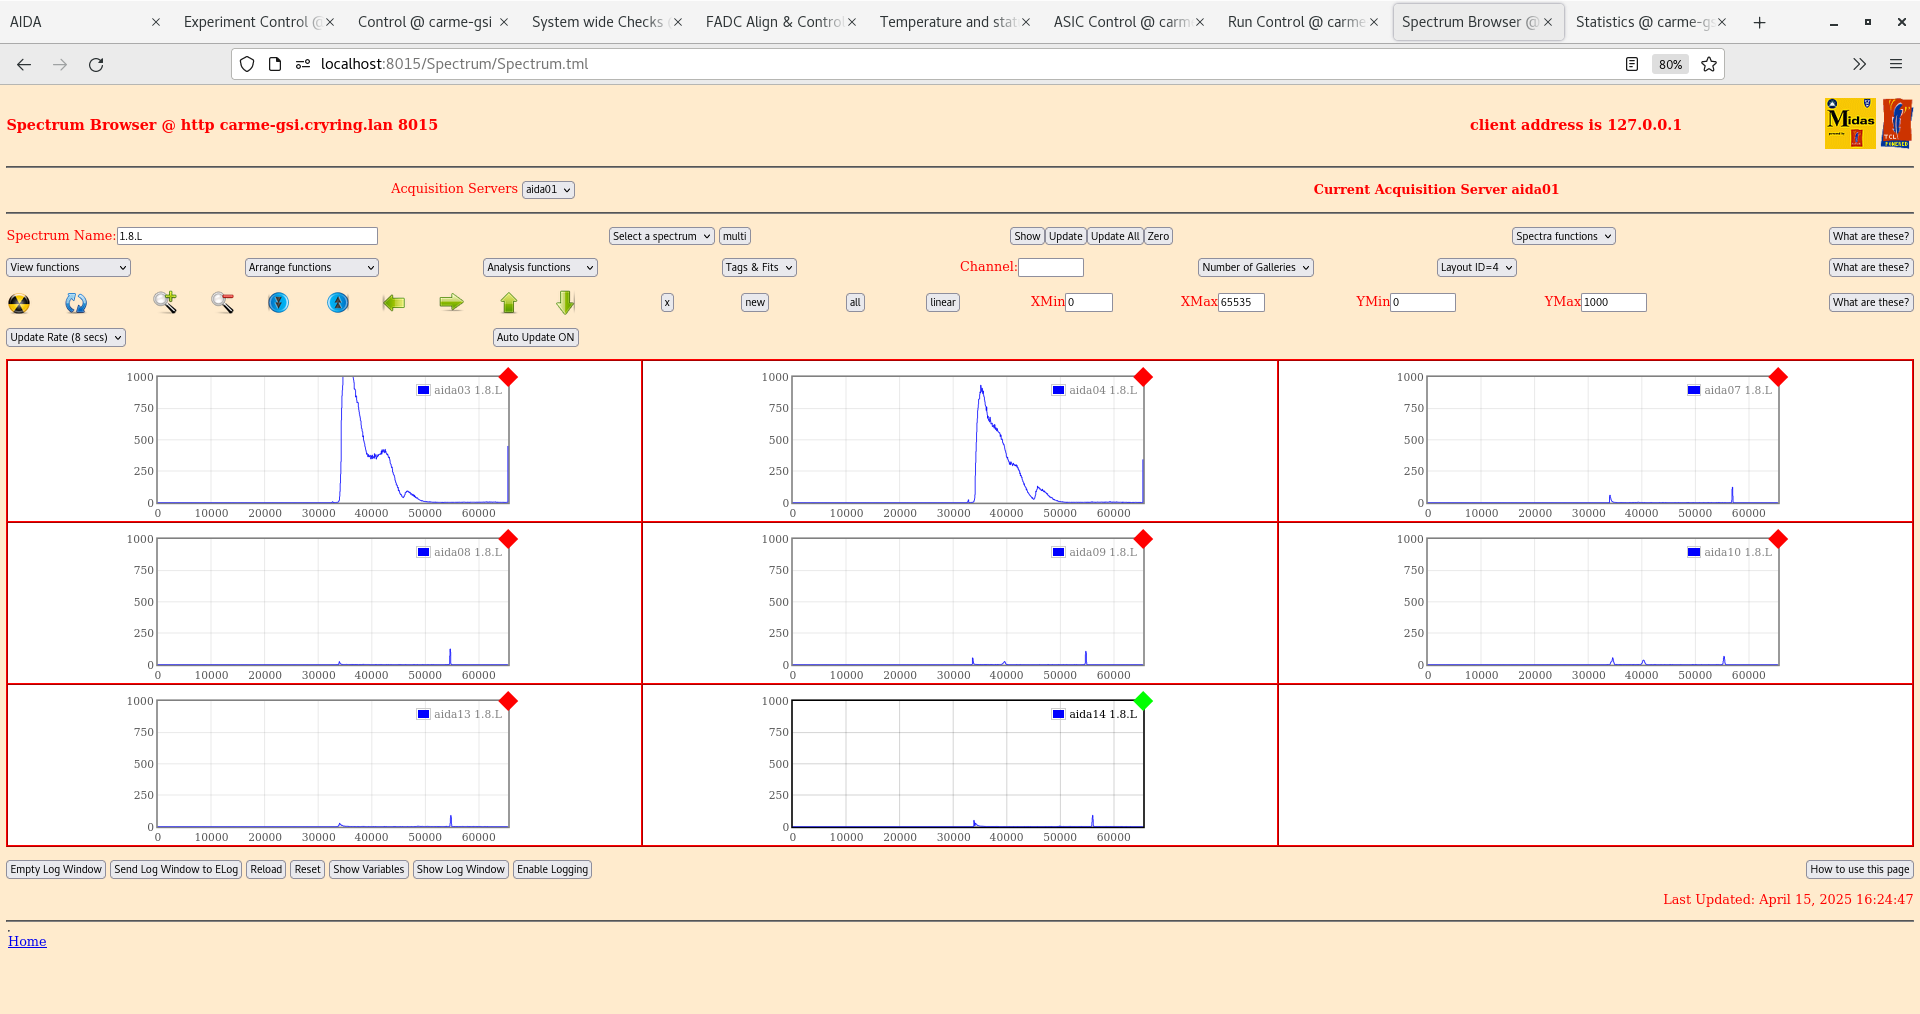
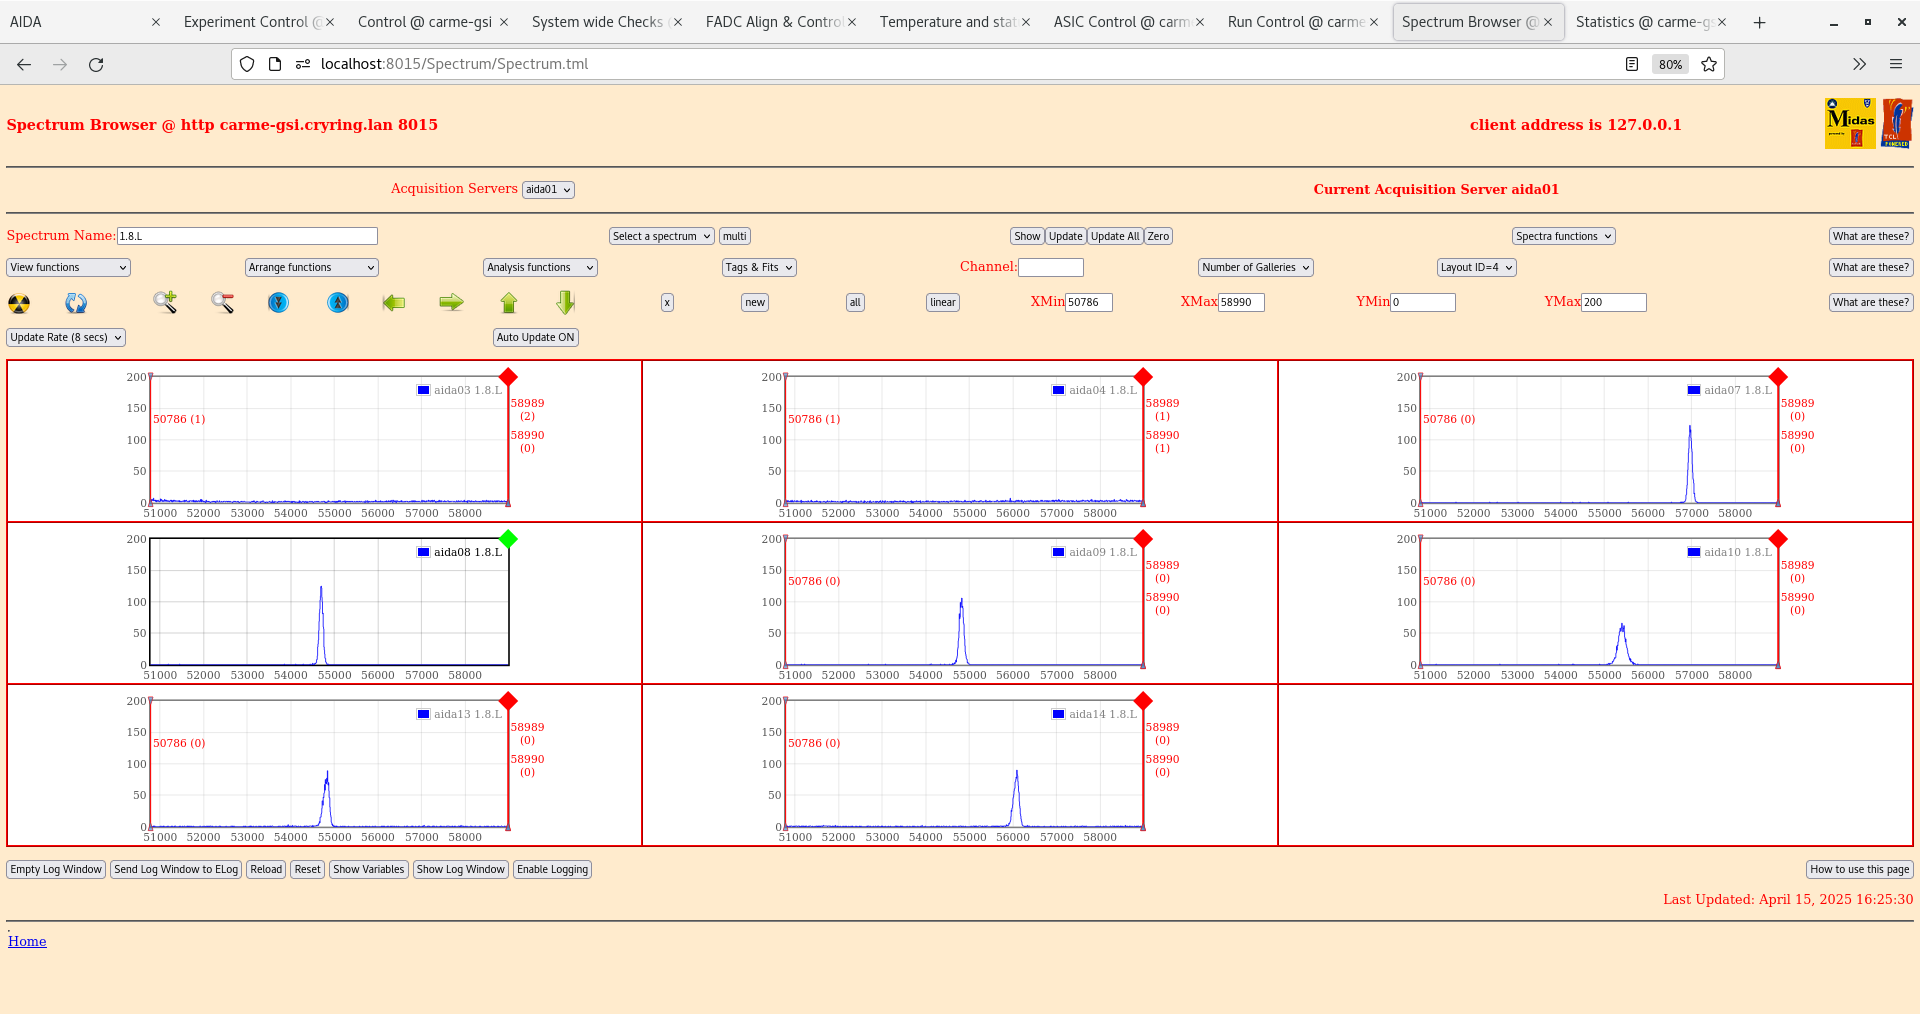
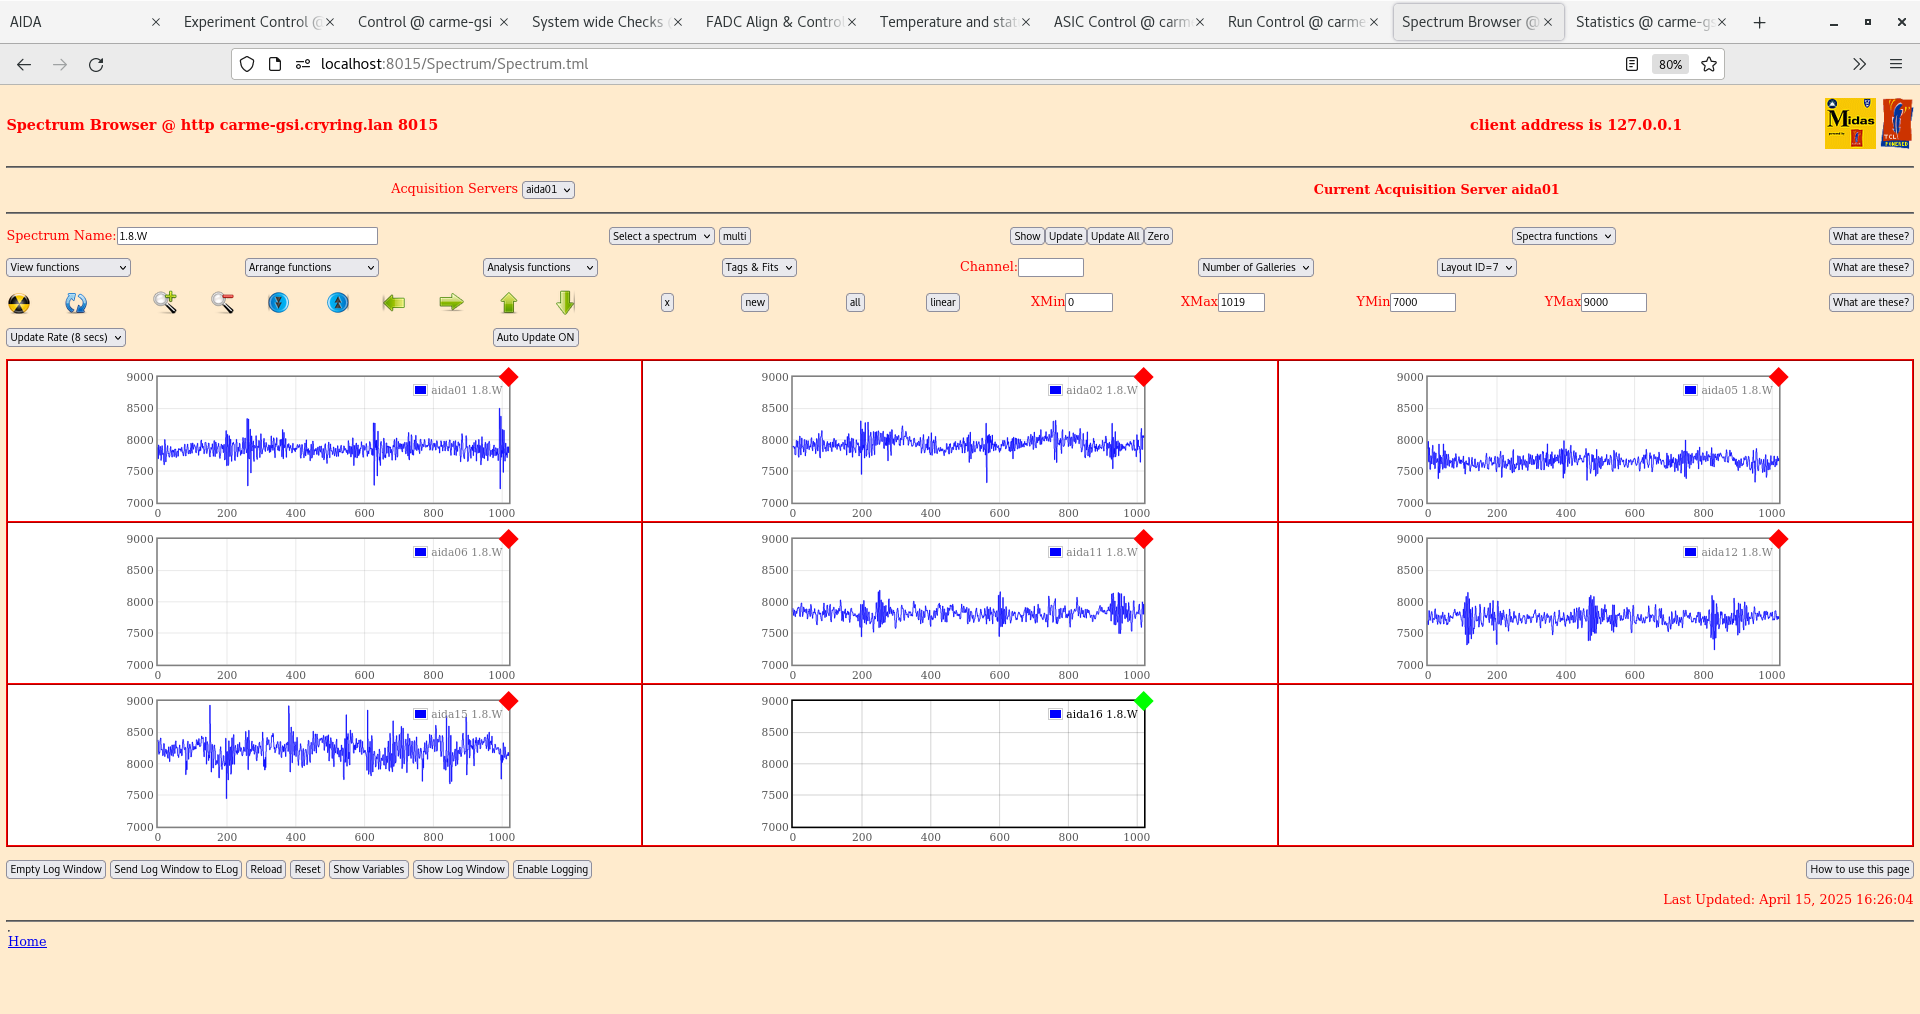
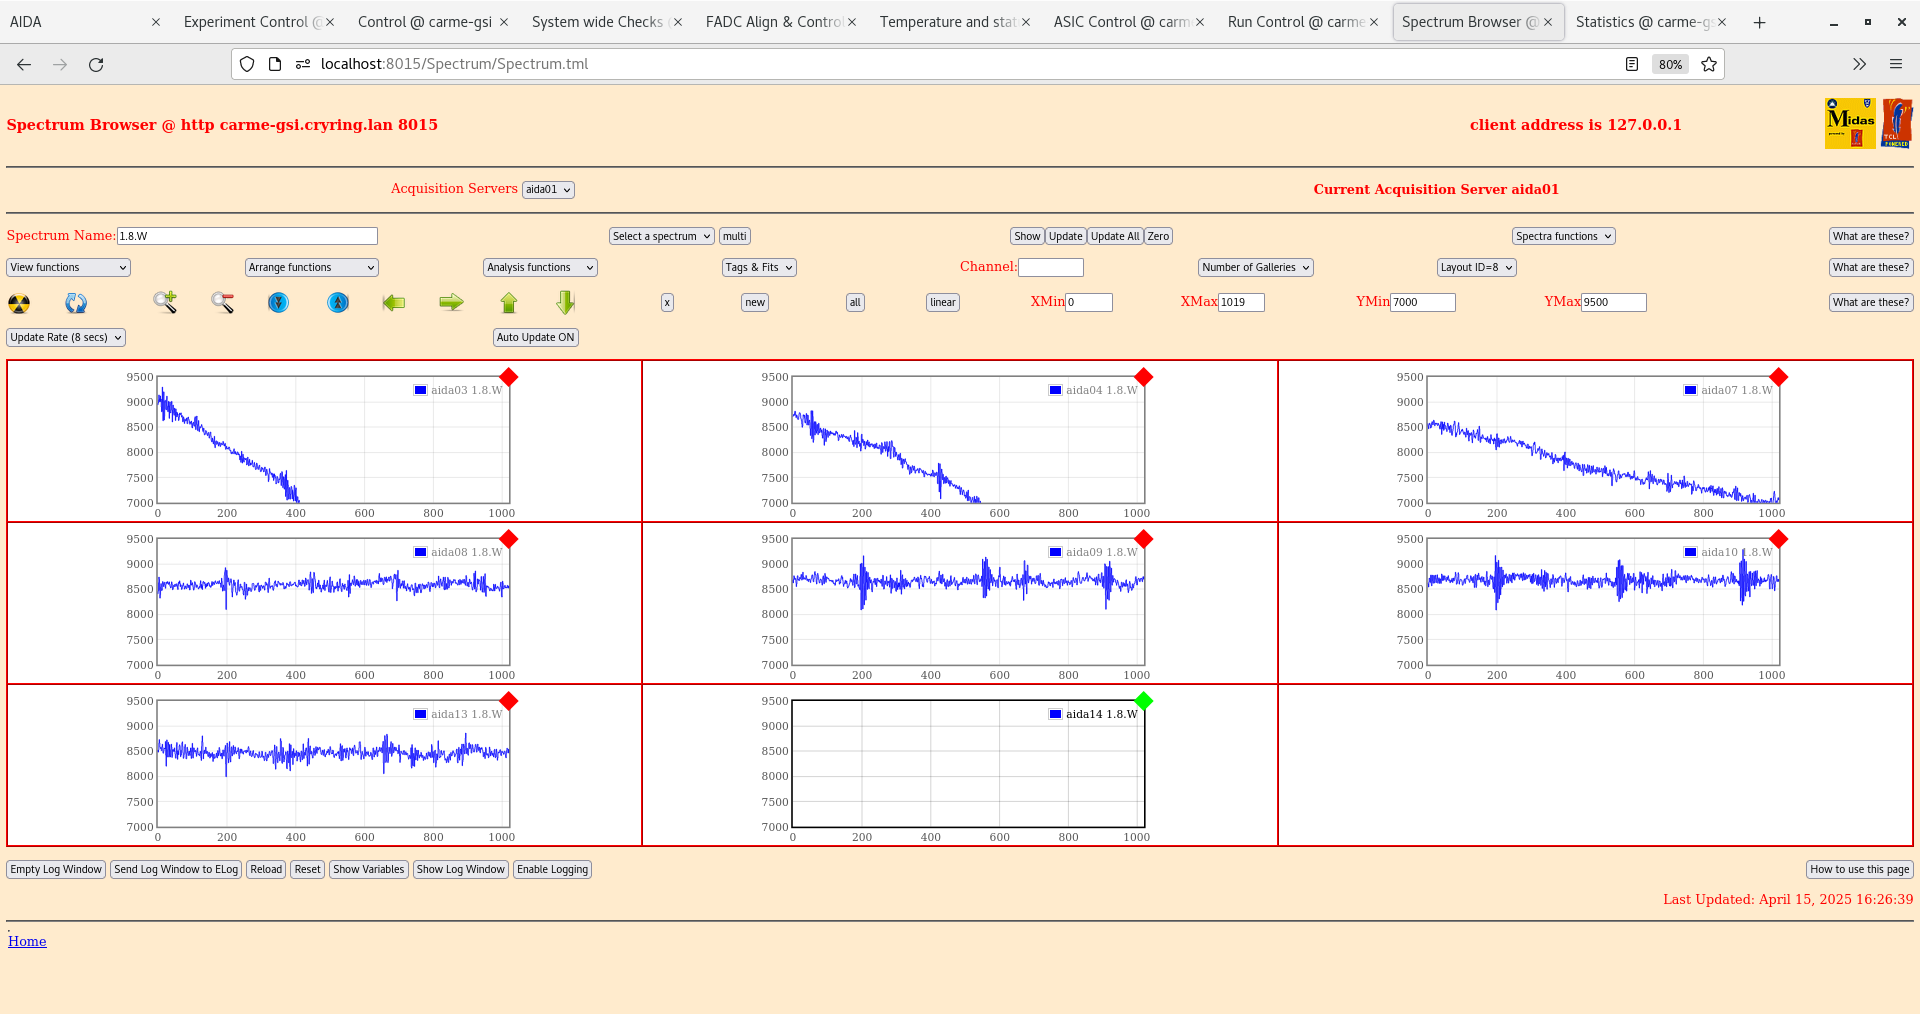
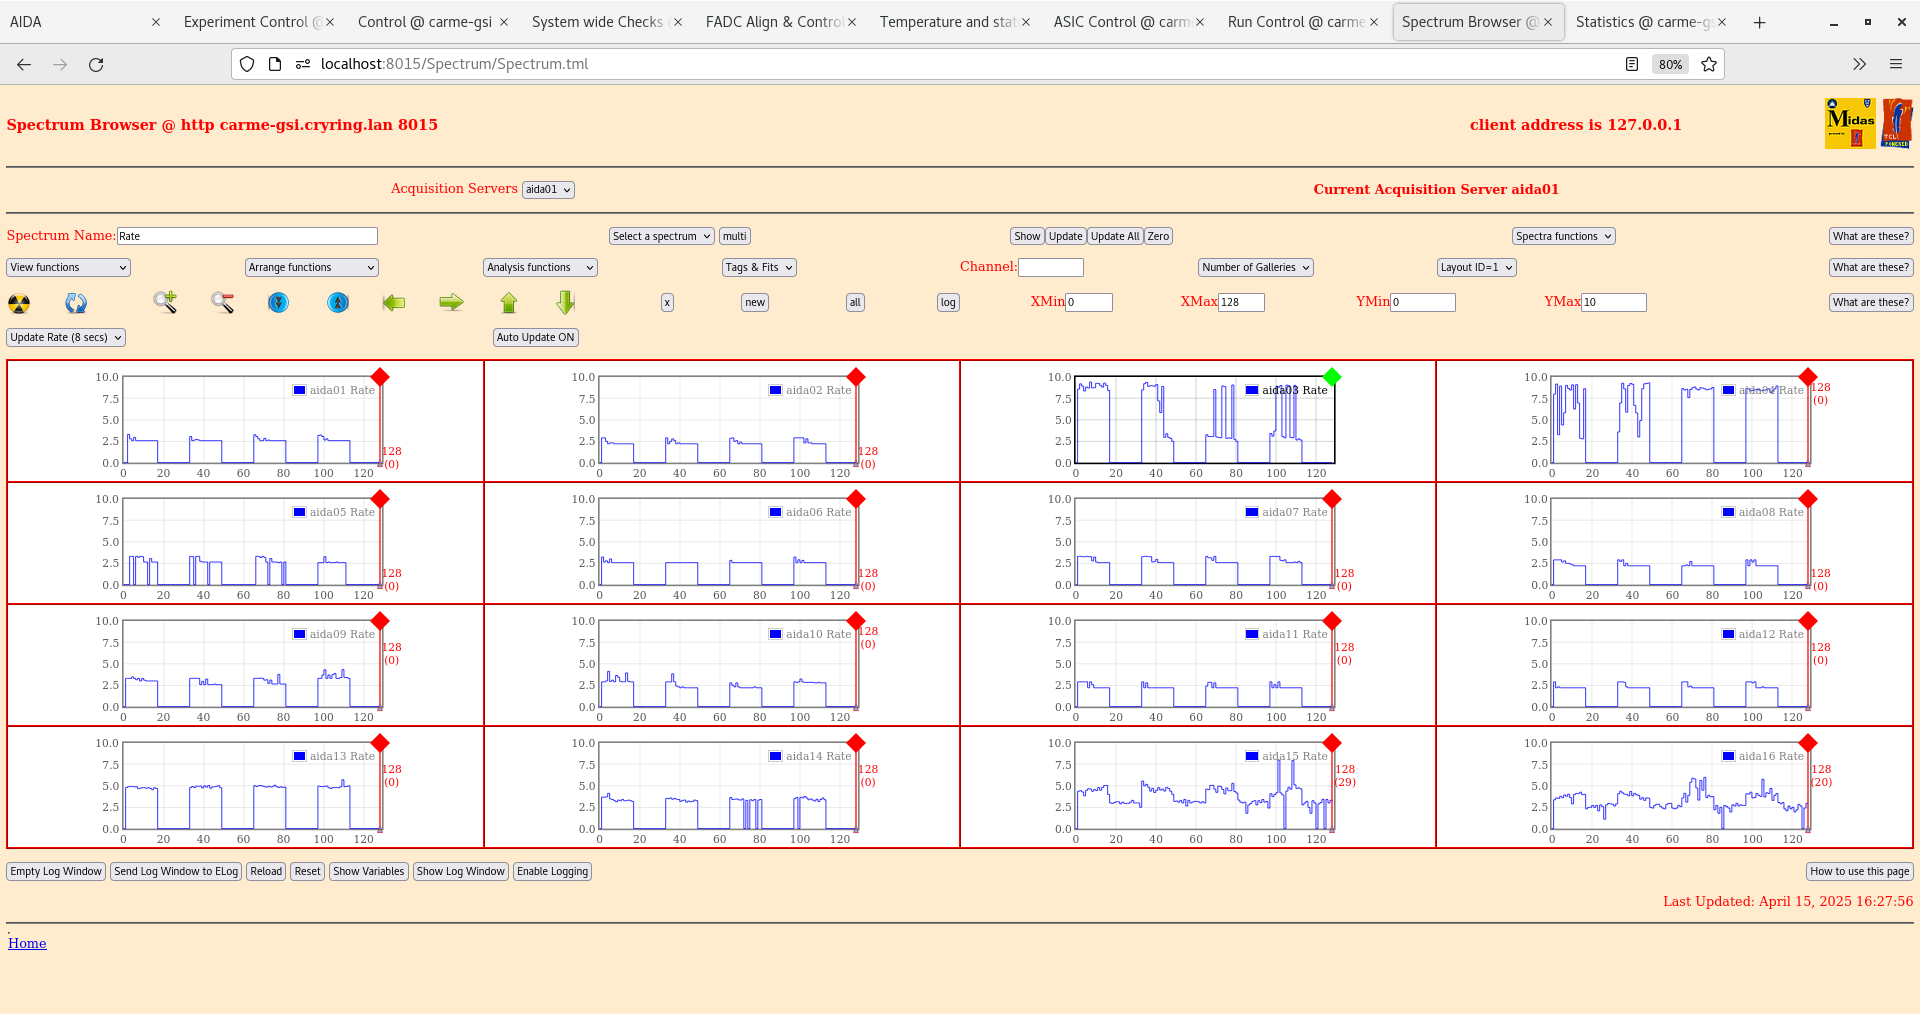
Overall pulser widths look bad, rates (ADC data items) look okay (~1000) for all except aida03 and aida04 (>250,000). Again rates on aida09 and aida10 are good although the widths are poor. One change I did make was to ground the FEEs to the CRYRING ground wheras previously they were grounded to the coolant pipe. I may try putting them back onto the coolant loop to see if there are any changes. Note grounds all around have not been examined yet. Attachments 10-17 with pulser on.
Moved grounds back onto the coolant pipe -> no effect on ADC rates.
Also tried lowing slow comparator theshold down to 150 keV (0xf) for most channels (except aida3 and 4). See rates attachment 18.
FEE power off, bias remains on
|
| Attachment 1: 20250414_120219.jpg
|
|
| Attachment 2: pic2.jpg
|
|
| Attachment 3: left-VI.png
|
|
| Attachment 4: right-VI.png
|
|
| Attachment 5: Screenshot_from_2025-04-15_13-53-33.png
|
|
| Attachment 6: Screenshot_from_2025-04-15_15-43-37.png
|
|
| Attachment 7: Screenshot_from_2025-04-15_15-22-44.png
|
|
| Attachment 8: Screenshot_from_2025-04-15_15-28-58.png
|
|
| Attachment 9: Screenshot_from_2025-04-15_15-29-29.png
|
|
| Attachment 10: Screenshot_from_2025-04-15_16-21-16.png
|
|
| Attachment 11: Screenshot_from_2025-04-15_16-23-21.png
|
|
| Attachment 12: Screenshot_from_2025-04-15_16-24-20.png
|
|
| Attachment 13: Screenshot_from_2025-04-15_16-24-54.png
|
|
| Attachment 14: Screenshot_from_2025-04-15_16-25-36.png
|
|
| Attachment 15: Screenshot_from_2025-04-15_16-26-13.png
|
|
| Attachment 16: Screenshot_from_2025-04-15_16-26-48.png
|
|
| Attachment 17: Screenshot_from_2025-04-15_16-28-02.png
|
|
| Attachment 18: Screenshot_from_2025-04-15_17-27-12.png
|
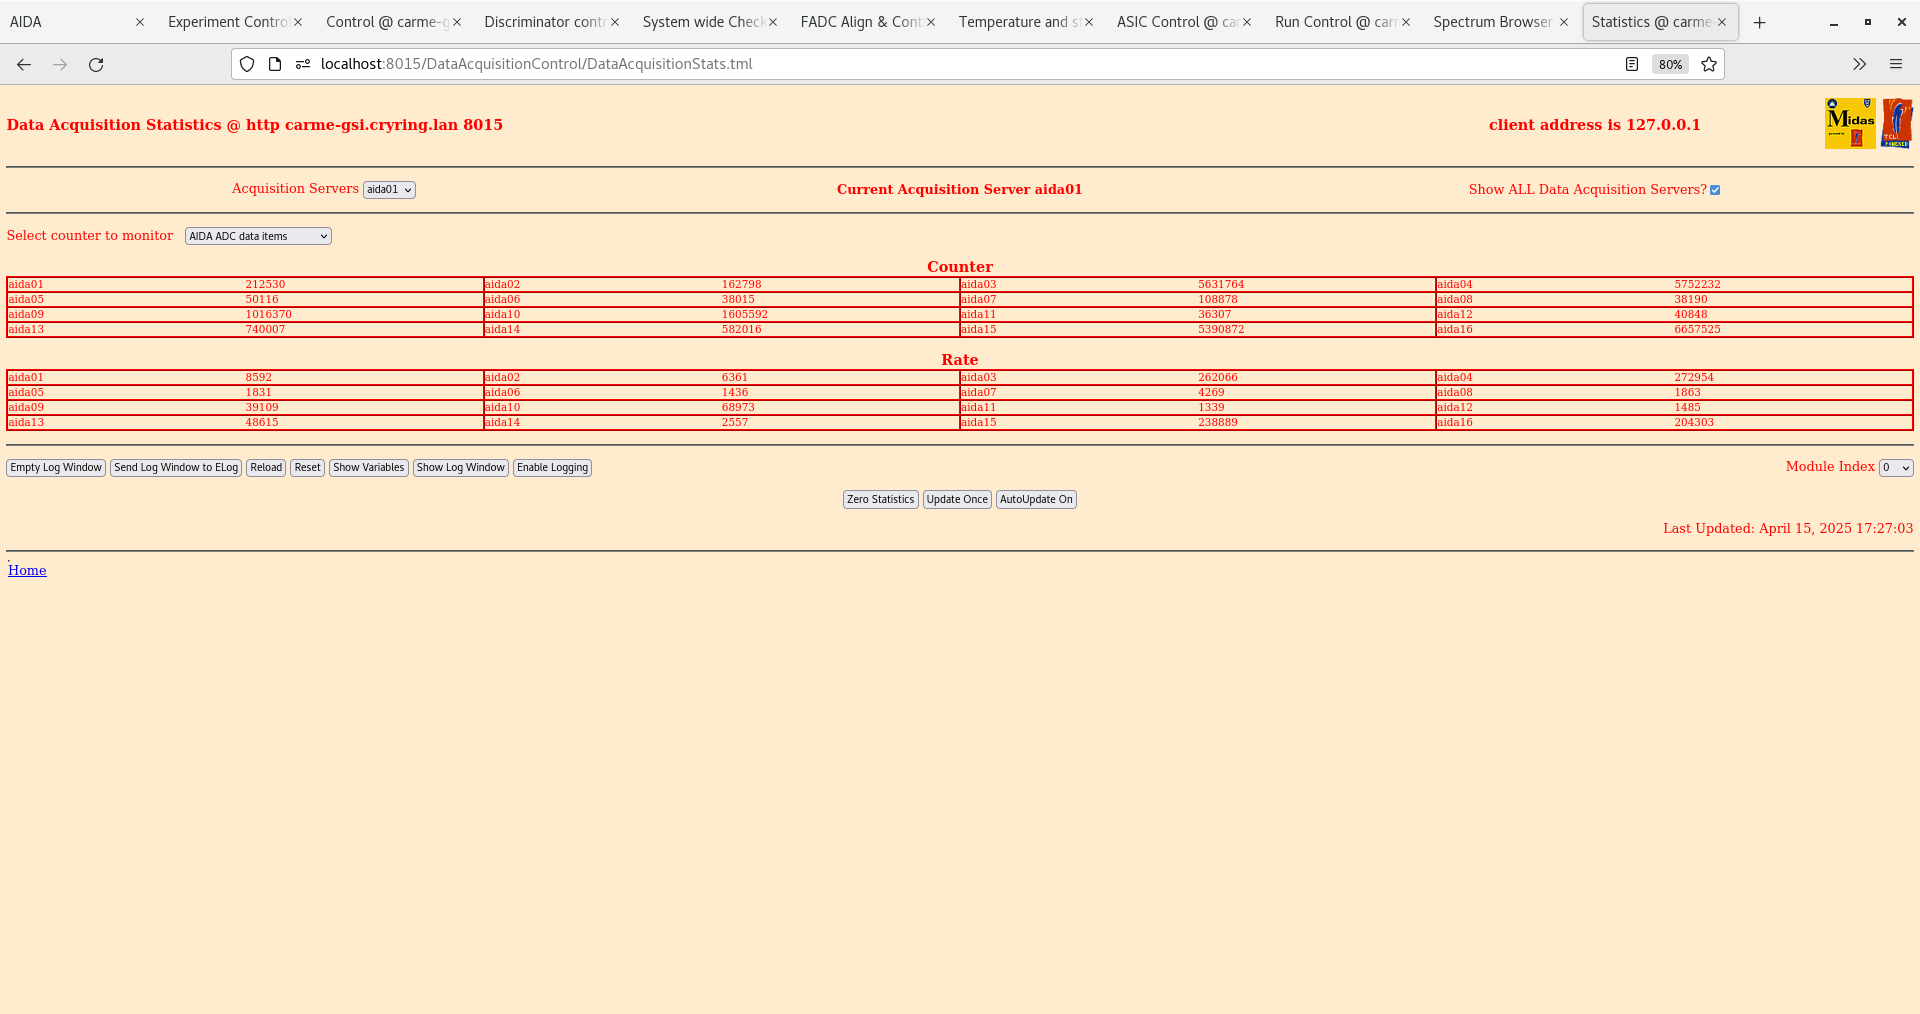
|
|
|
672
|
Thu Apr 10 10:53:14 2025 |
TD | Thursday 10 April |
11.50 DAQ continues
      Data file APR25/R6_13

      DSSSD bias & leakage current - attachment 1

      FEE64 temps OK - attachment 2

      ADC data item stats - attachment 3

      Merger & Tape Server - attachment 4-5

      Disk file log - attachment 6
       event rate increased significantly at some point this morning but is currently OK


19.21 FEE64 power OFF - aida08 high temperature

      DSSSD bias & leakage current - attachment 7

      FEE64 temps - attachment 8
aida08 high temperature - FEE64 power OFF, detector HV OFF |
| Attachment 1: Screenshot_from_2025-04-10_11-50-32.png
|

|
| Attachment 2: Screenshot_from_2025-04-10_11-51-02.png
|

|
| Attachment 3: Screenshot_from_2025-04-10_11-51-35.png
|

|
| Attachment 4: Screenshot_from_2025-04-10_11-51-48.png
|

|
| Attachment 5: Screenshot_from_2025-04-10_11-52-02.png
|
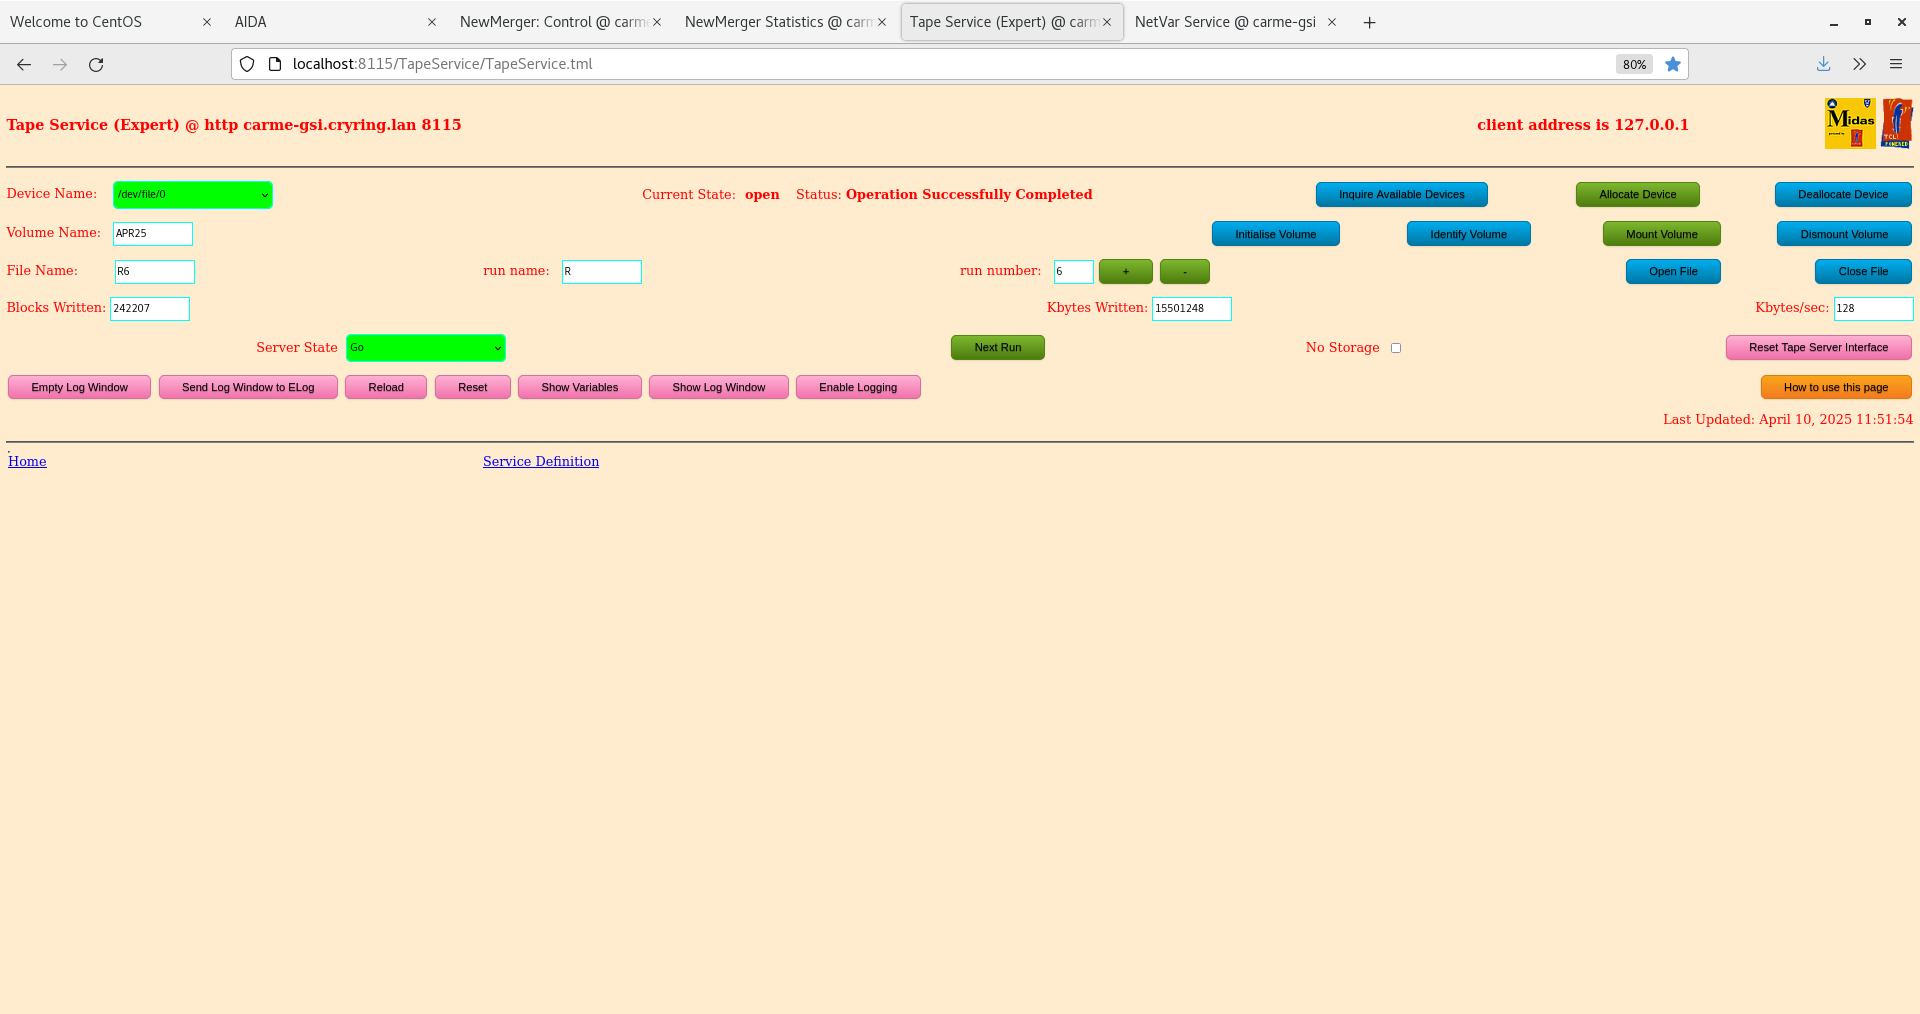
|
| Attachment 6: Screenshot_from_2025-04-10_11-53-45.png
|

|
| Attachment 7: Screenshot_from_2025-04-10_19-20-23.png
|

|
| Attachment 8: Screenshot_from_2025-04-10_19-20-51.png
|

|
|
|
671
|
Thu Apr 10 07:02:12 2025 |
CB (remotely) | Current logging enabled - sort of |
There appear to be issues with Shahab's caenlogging program. It crashes occasionally, with an error indicating the number of columns in the terminal is incorrect. We will have to ask Shahab.
For now
1. Start the caen_screen.sh script on nnrp1 (aka CARMEMotorsPi - why was it renamed? It should stay as CARMEMotorsPi to avoid duplicate names).
This starts connect to the caen power module via TTY inside a screen called caenhv. Currently on desktop 1
2. On nnrpi1, start the caenlogging program --settings caenlogger_settings_gsi.toml
3. On carme-gsi, in ~/Programs/caenlogger start the gnuplot script
If the caenlogger script crashes, restart it on the second terminal
More investigations required on the crash. |
|
|
670
|
Wed Apr 9 10:02:21 2025 |
TD | CARME equipment in CRYRING area moved |
There was some tidying up of the CRYRING hall in advance of this week's EC evaluation meeting at GSI.

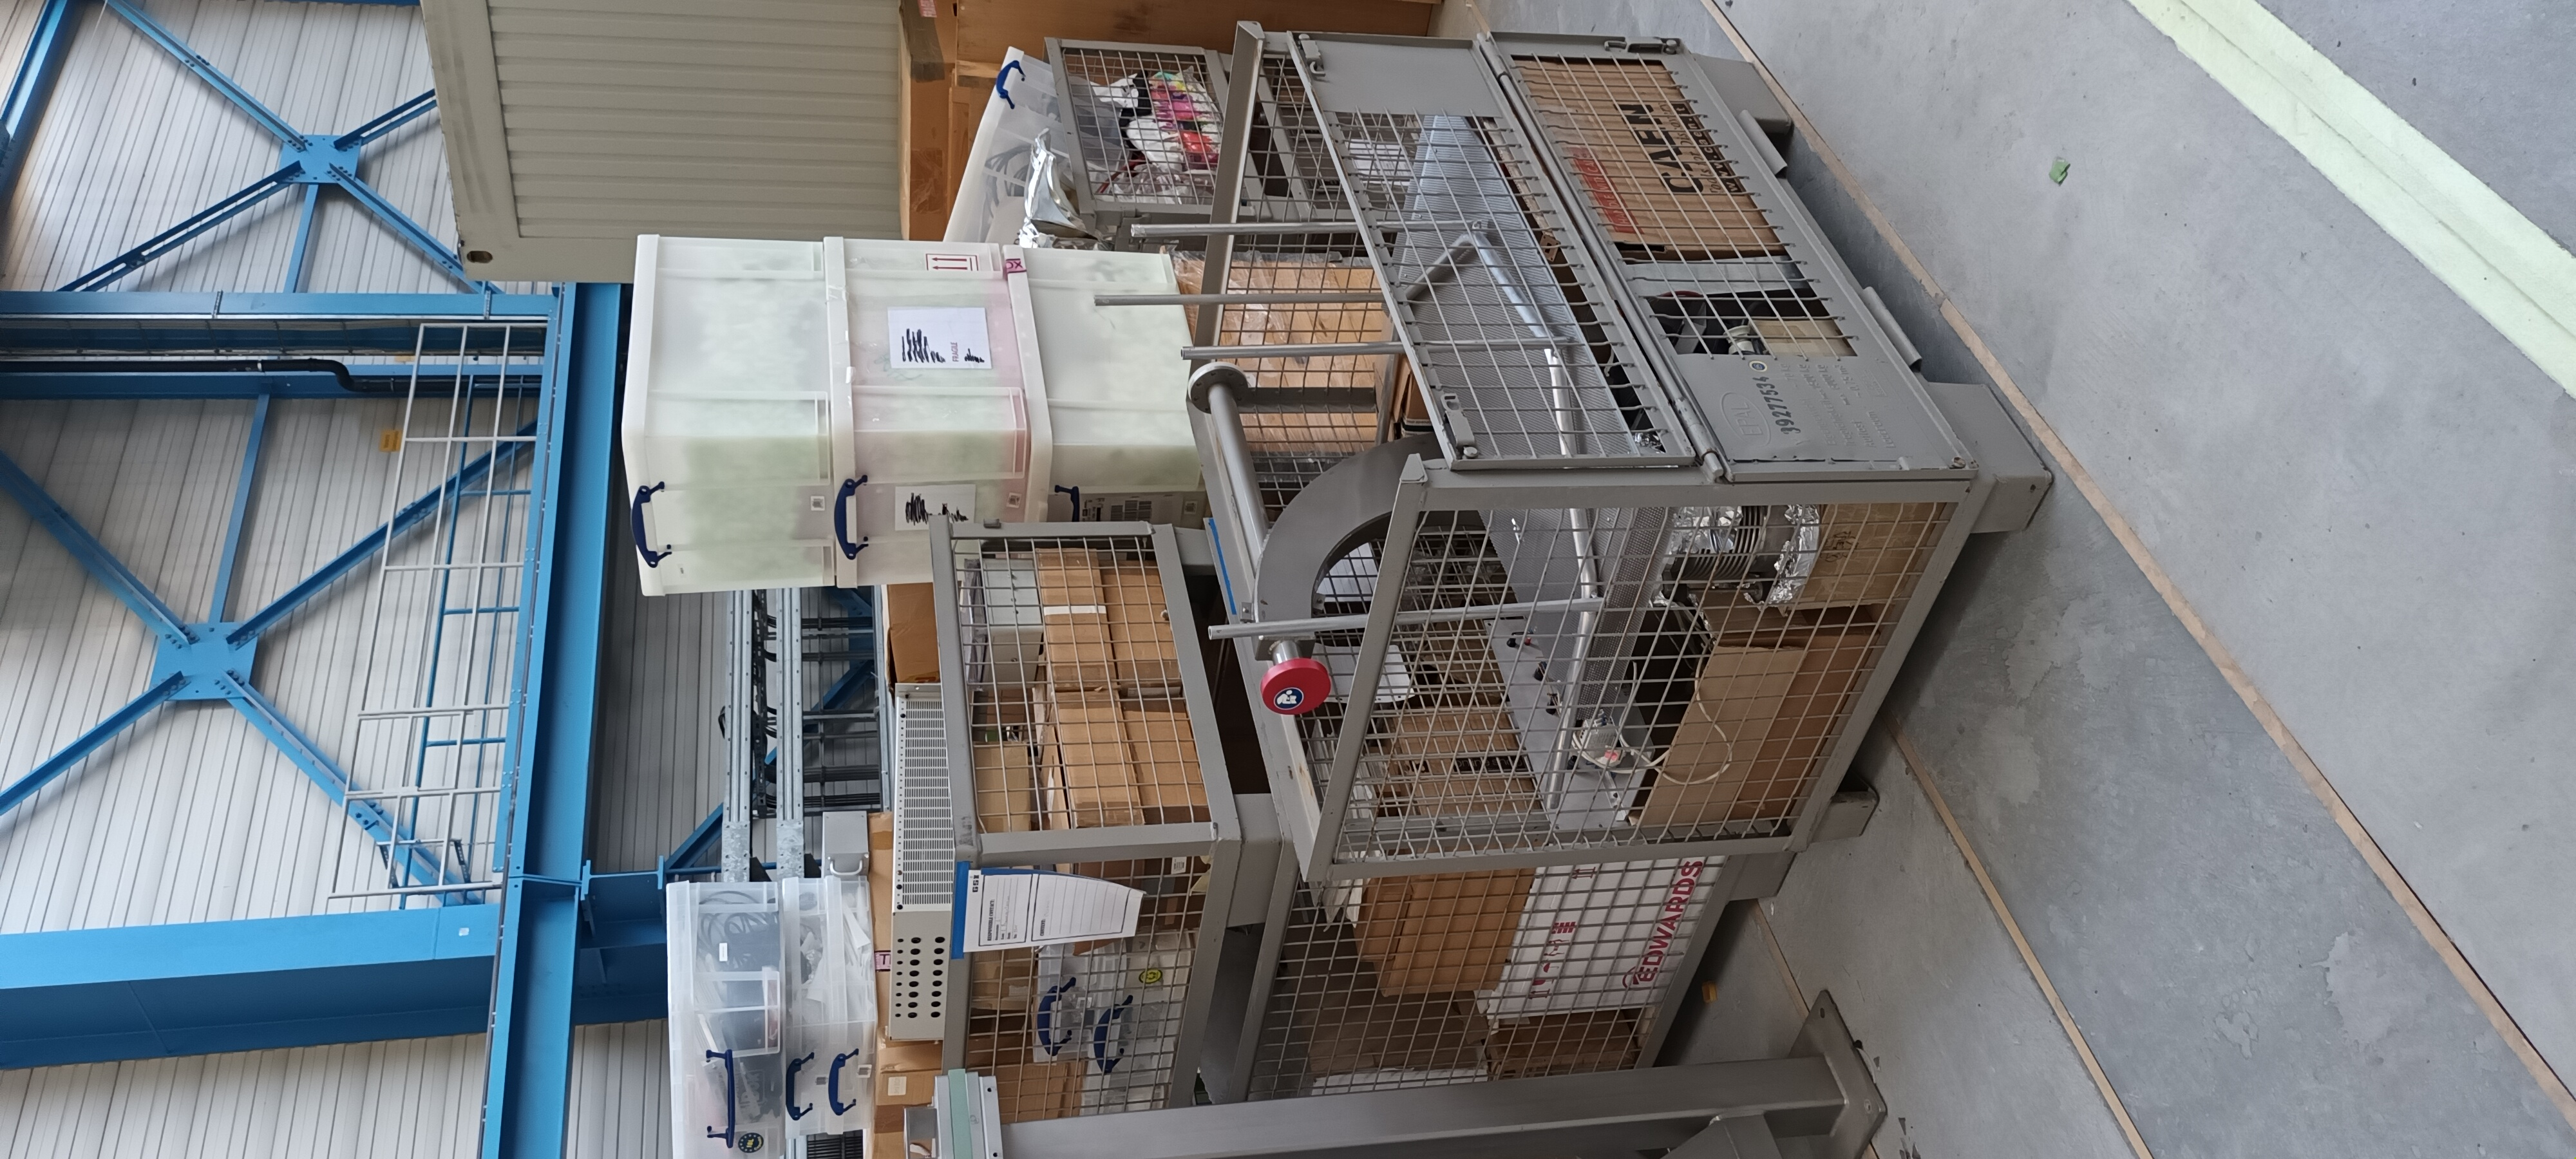
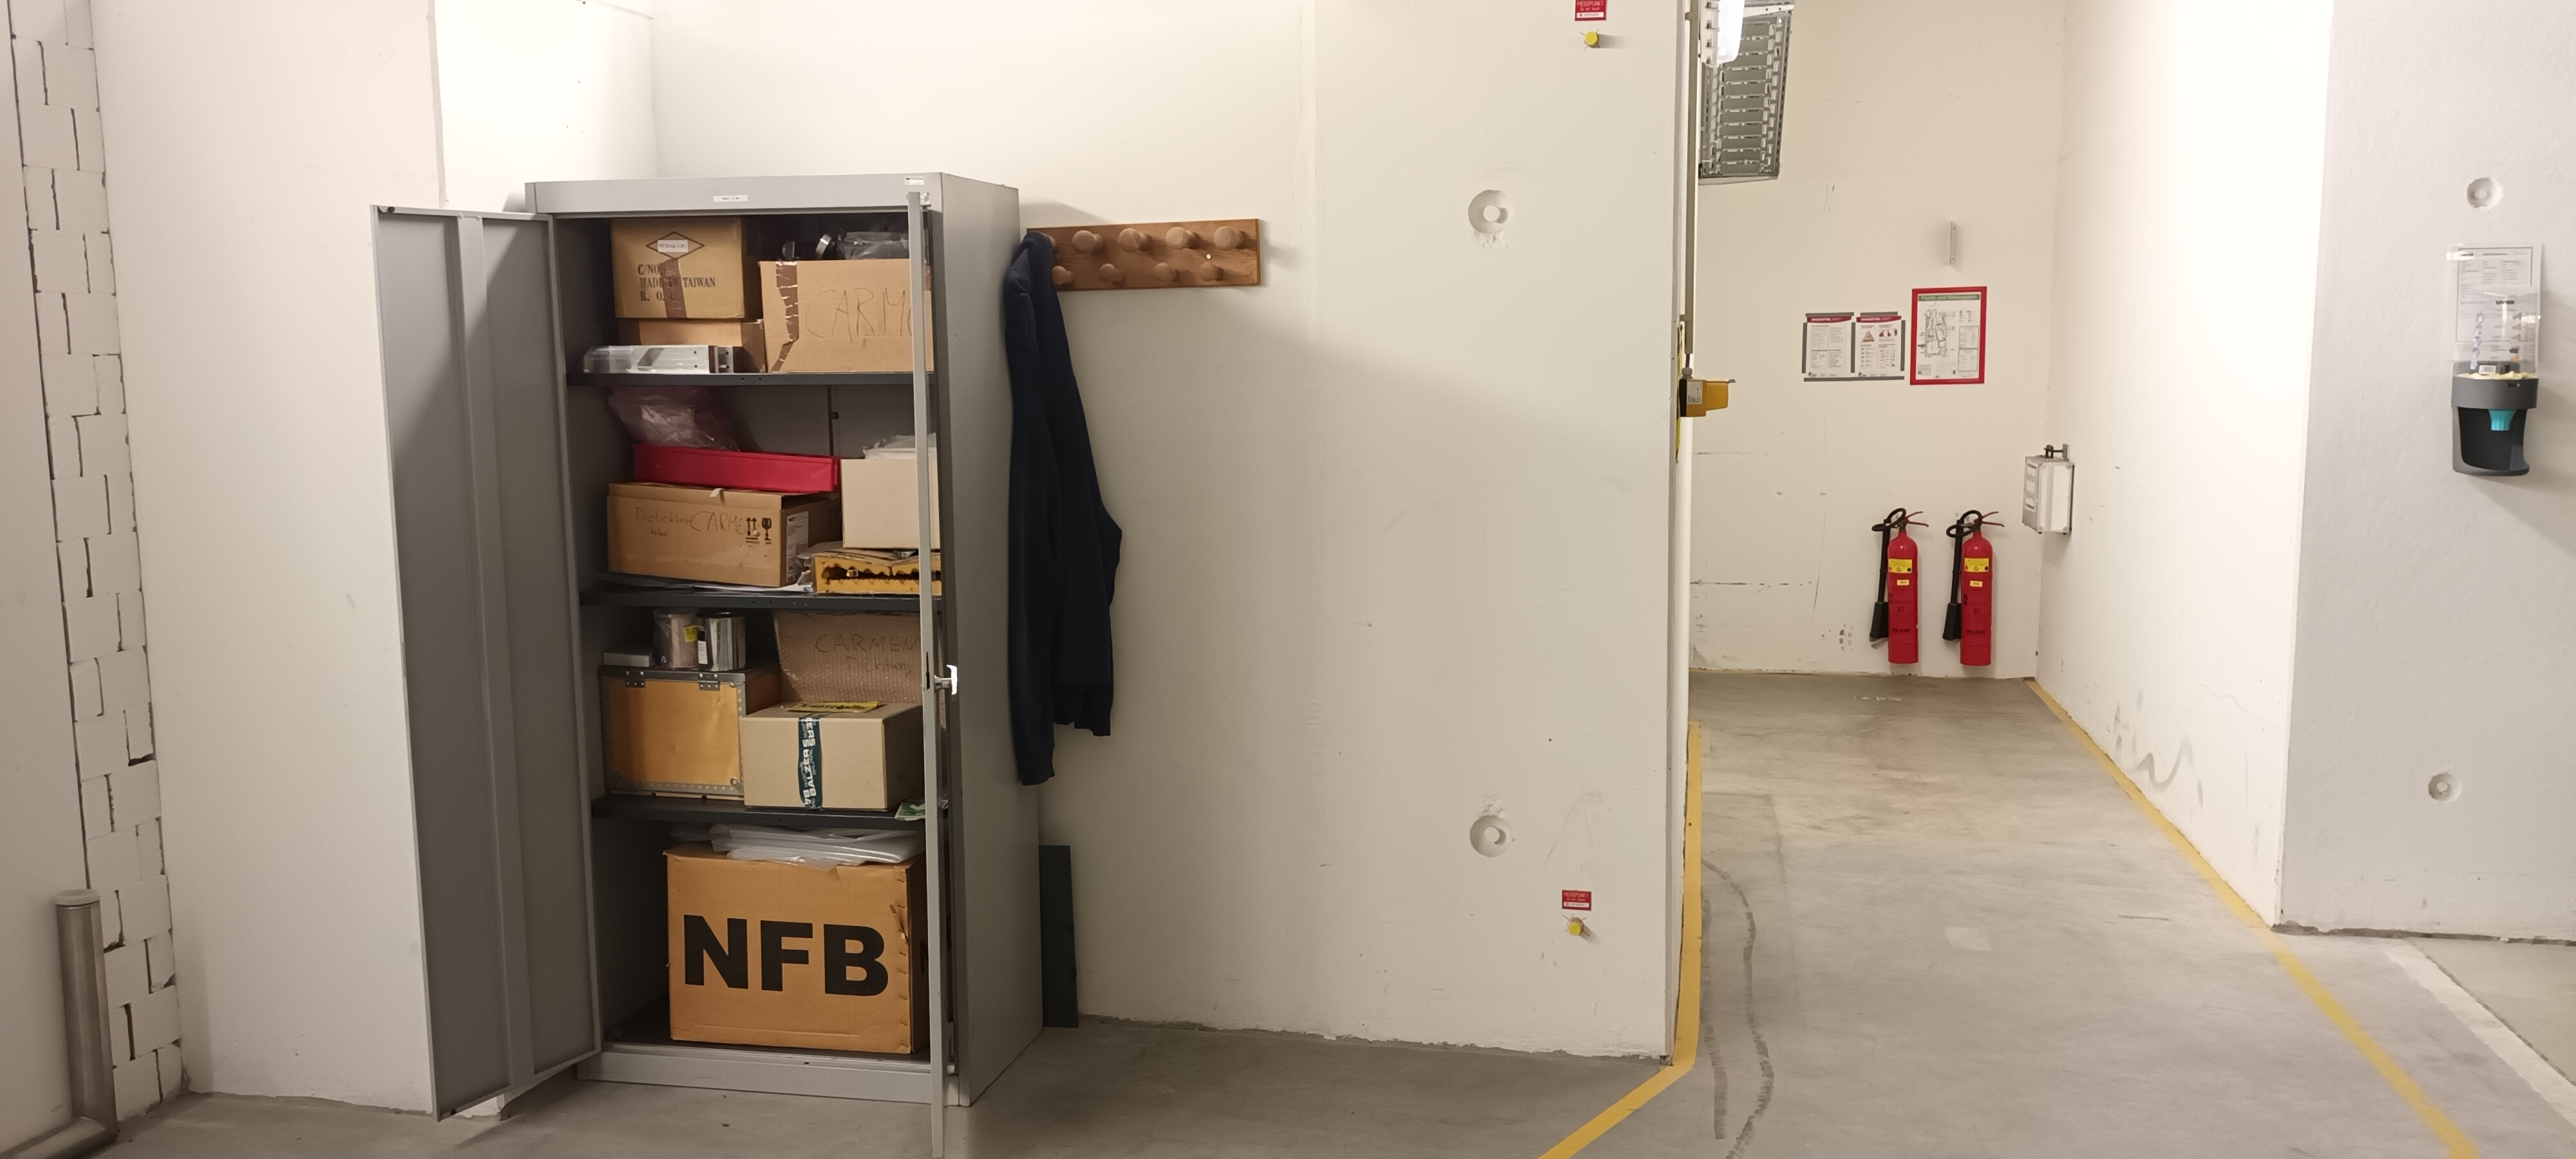
CARME equipment stored in central area of the CRYRING hall has been moved to the roof storage area near rooms 2.033/4 and a cupboard near the main entrance to the CRYRING
hall - attachments 1-2.

Please contact Davide Racano for further information. |
| Attachment 1: 20250409_102115.jpg
|
|
| Attachment 2: 20250409_101705.jpg
|
|
|
|
669
|
Wed Apr 9 02:40:04 2025 |
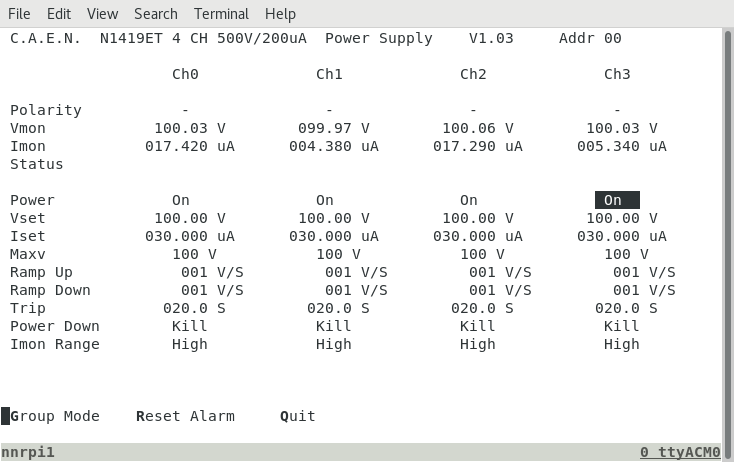
TD | Wednesday 9 April |
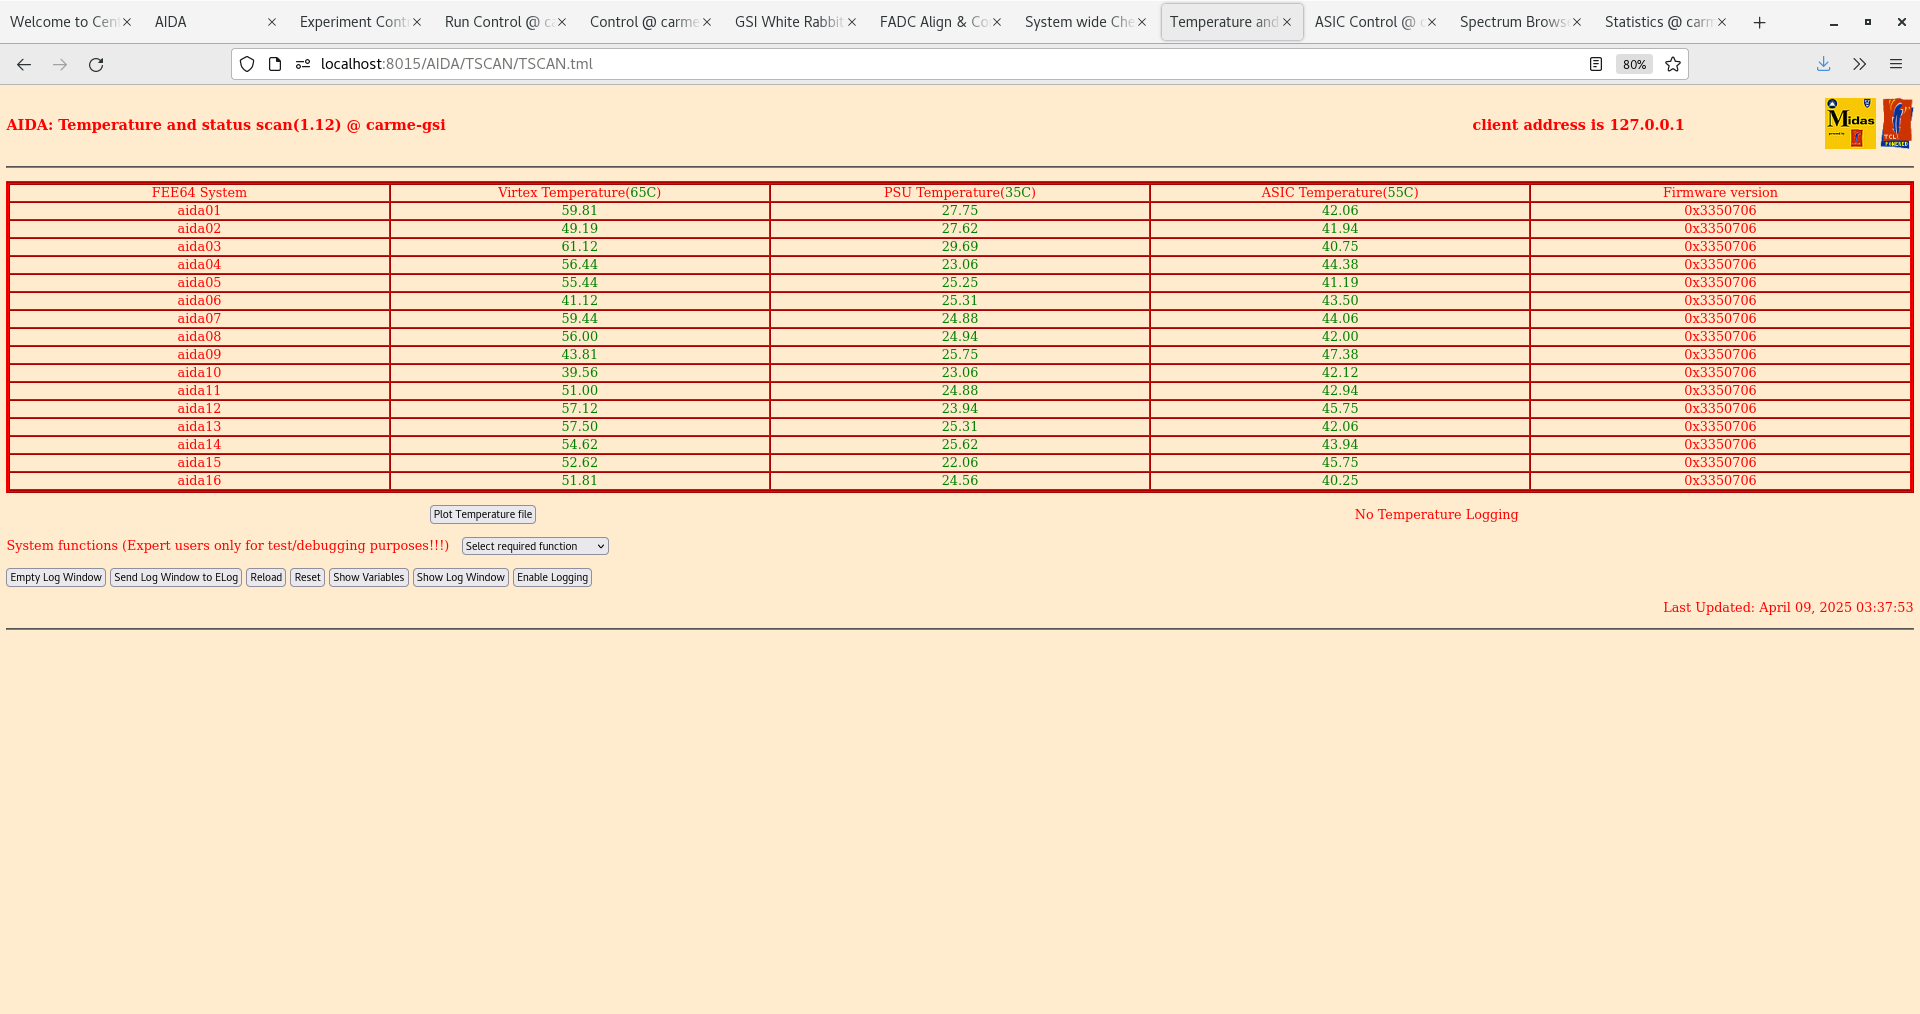
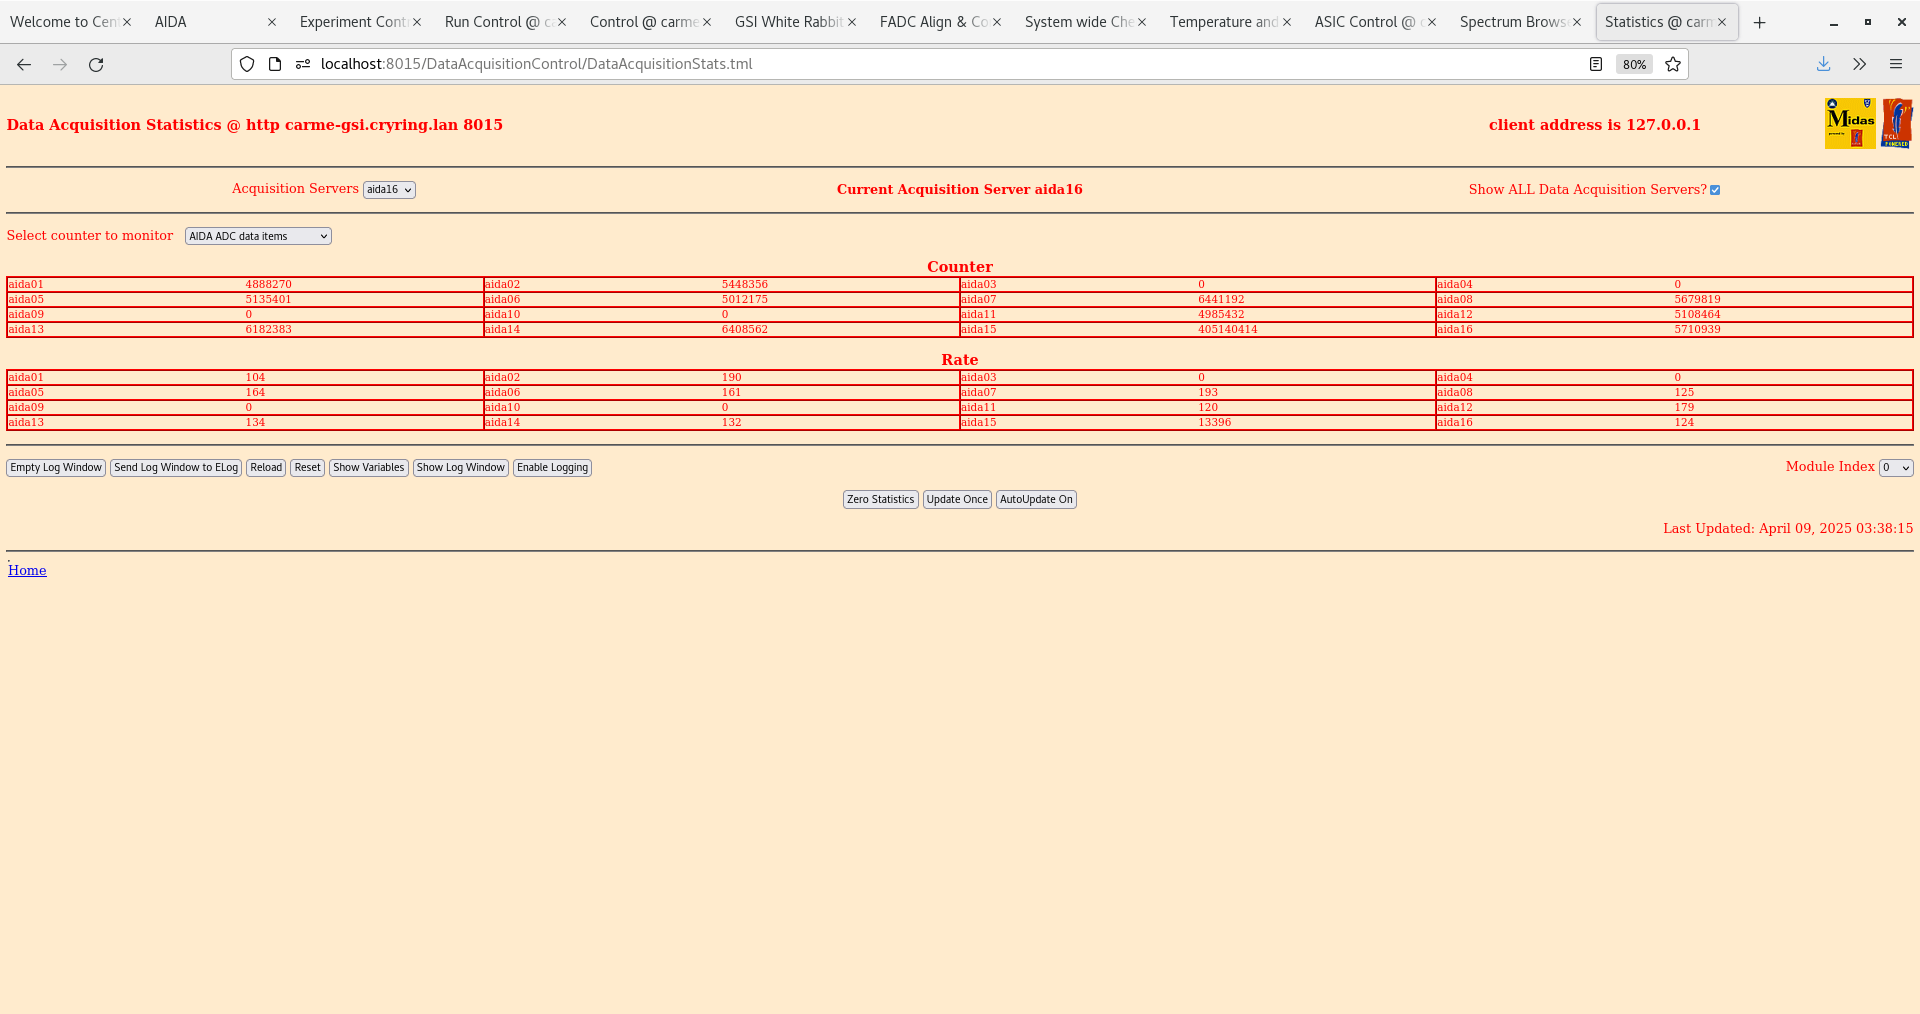
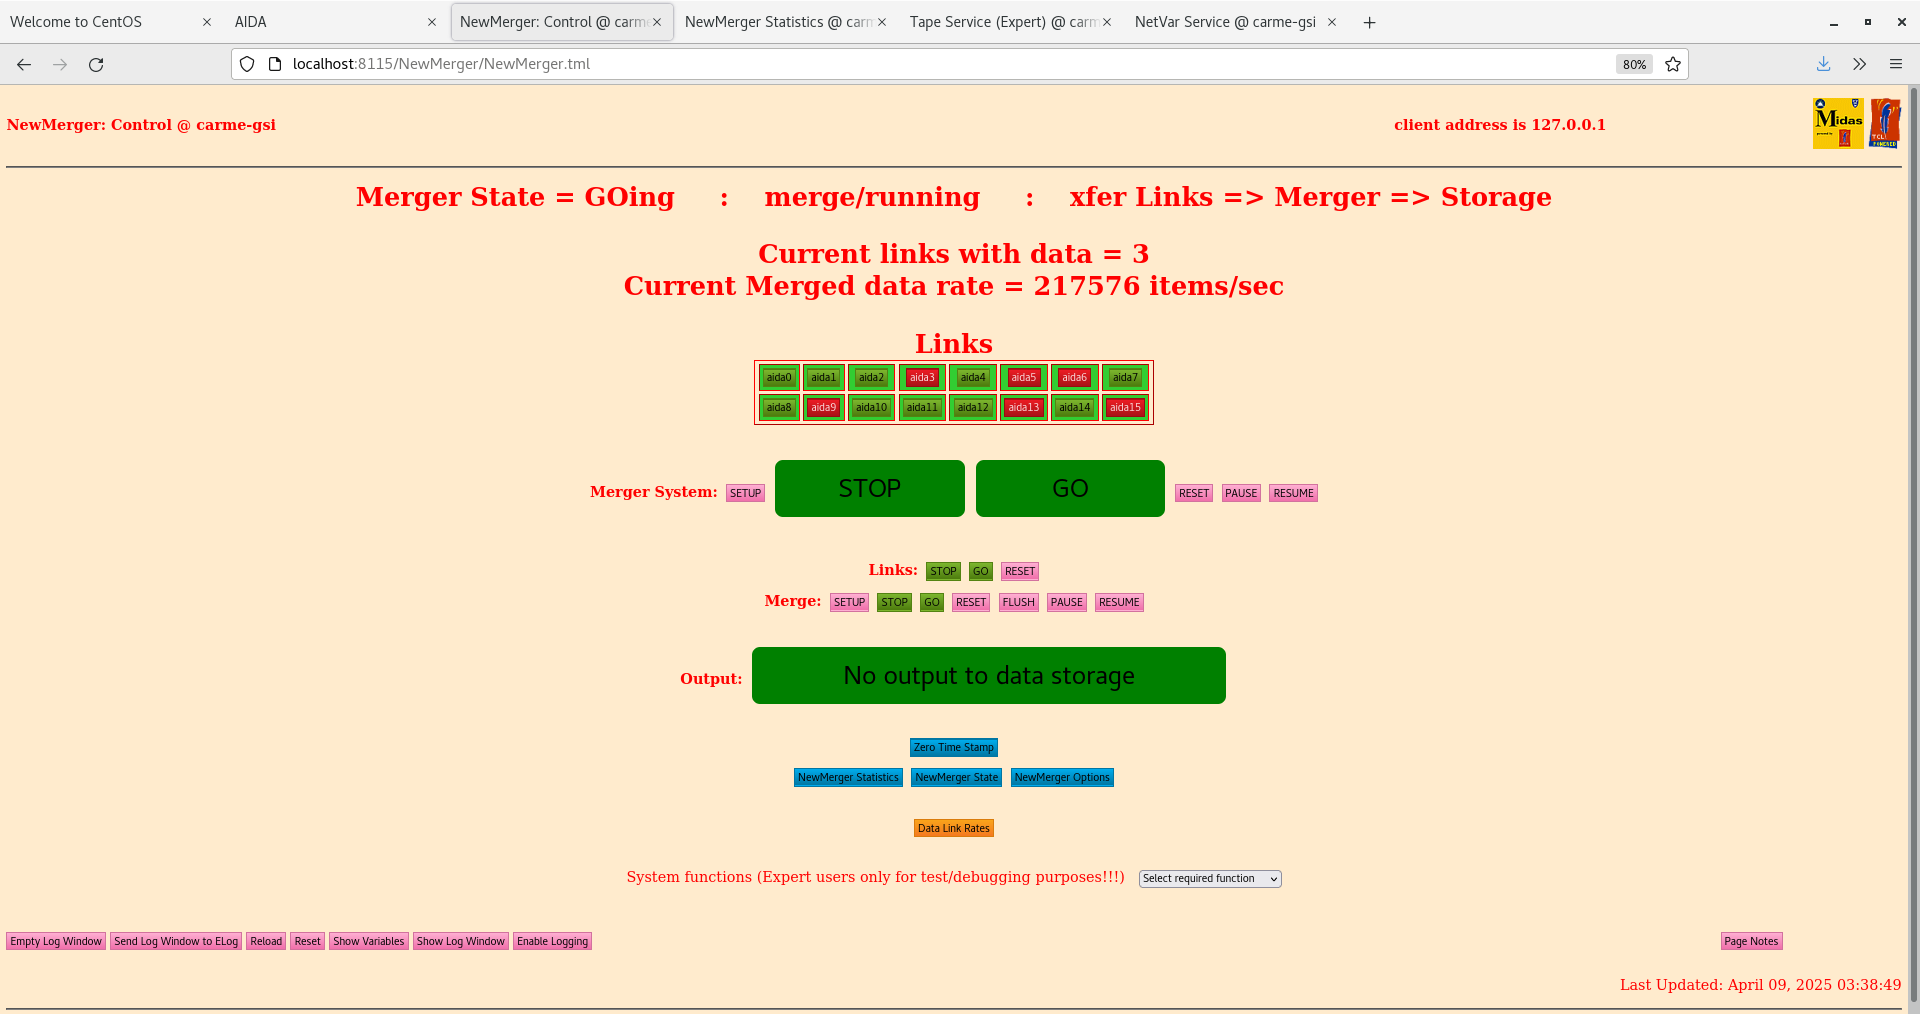
03.37 DAQ continues
      Data file APR25/R5_8

      DSSSD bias & leakage current - attachment 1

      FEE64 temps OK - attachment 2

      ADC data item stats - attachment 3

      Merger & Tape Server - attachment 4-5

10.23 New run
      Data file APR25/R6
      alpha background - pulser OFF
      all histograms & stats zero'd

      DSSSD bias & leakage current - attachment 6

      FEE64 temps OK - attachment 7

      ADC data item stats - attachment 8

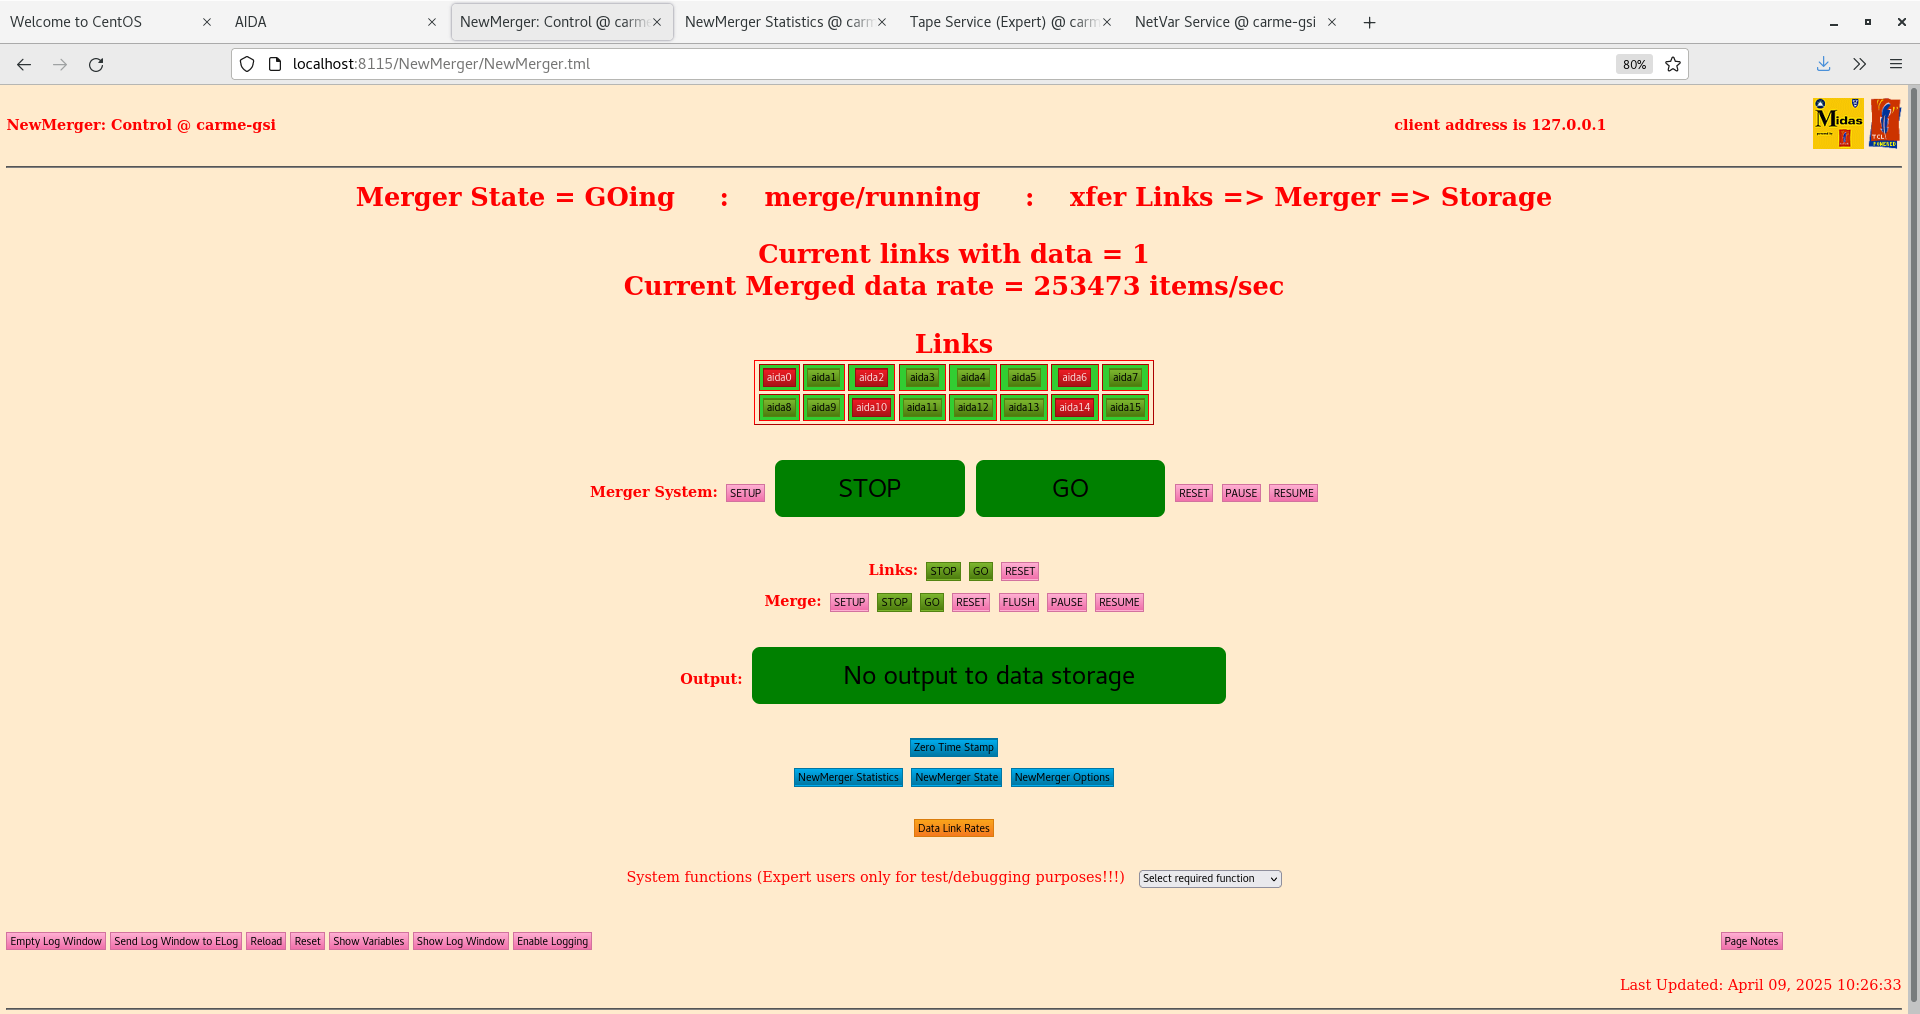
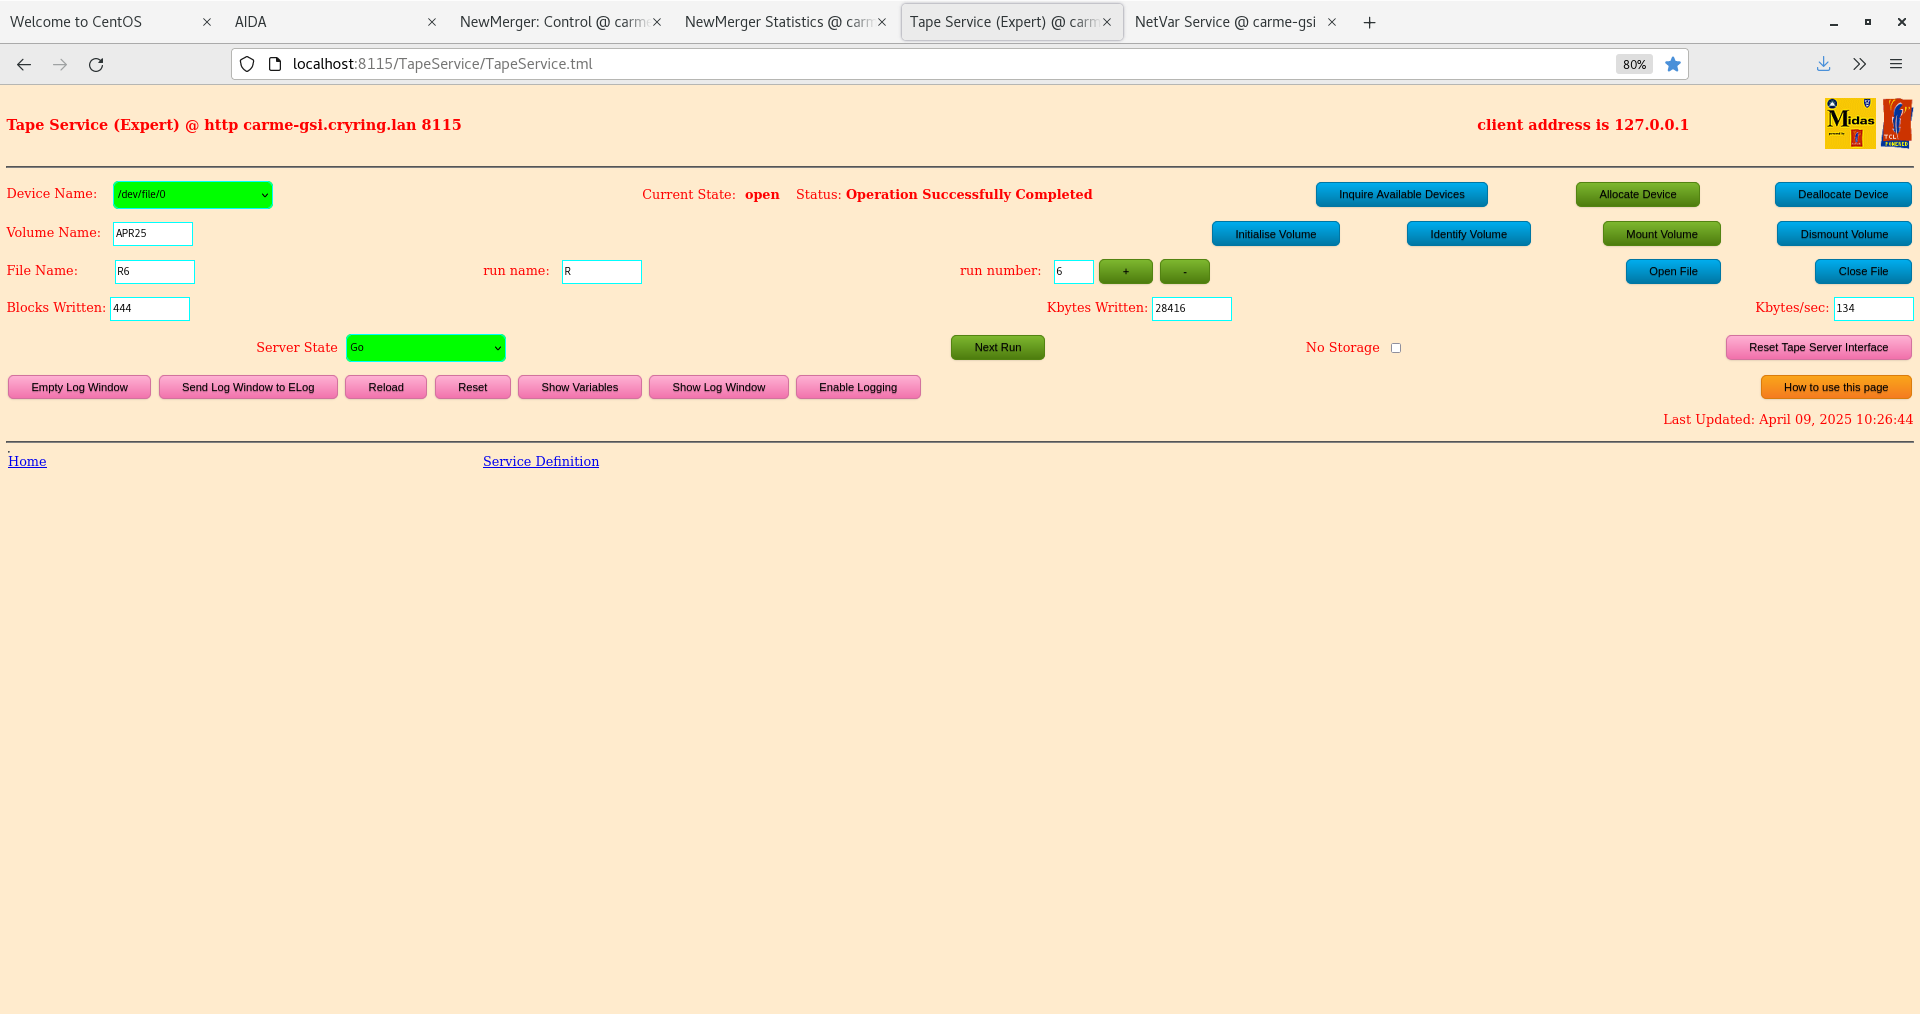
      Merger & Tape Server - attachment 9-10

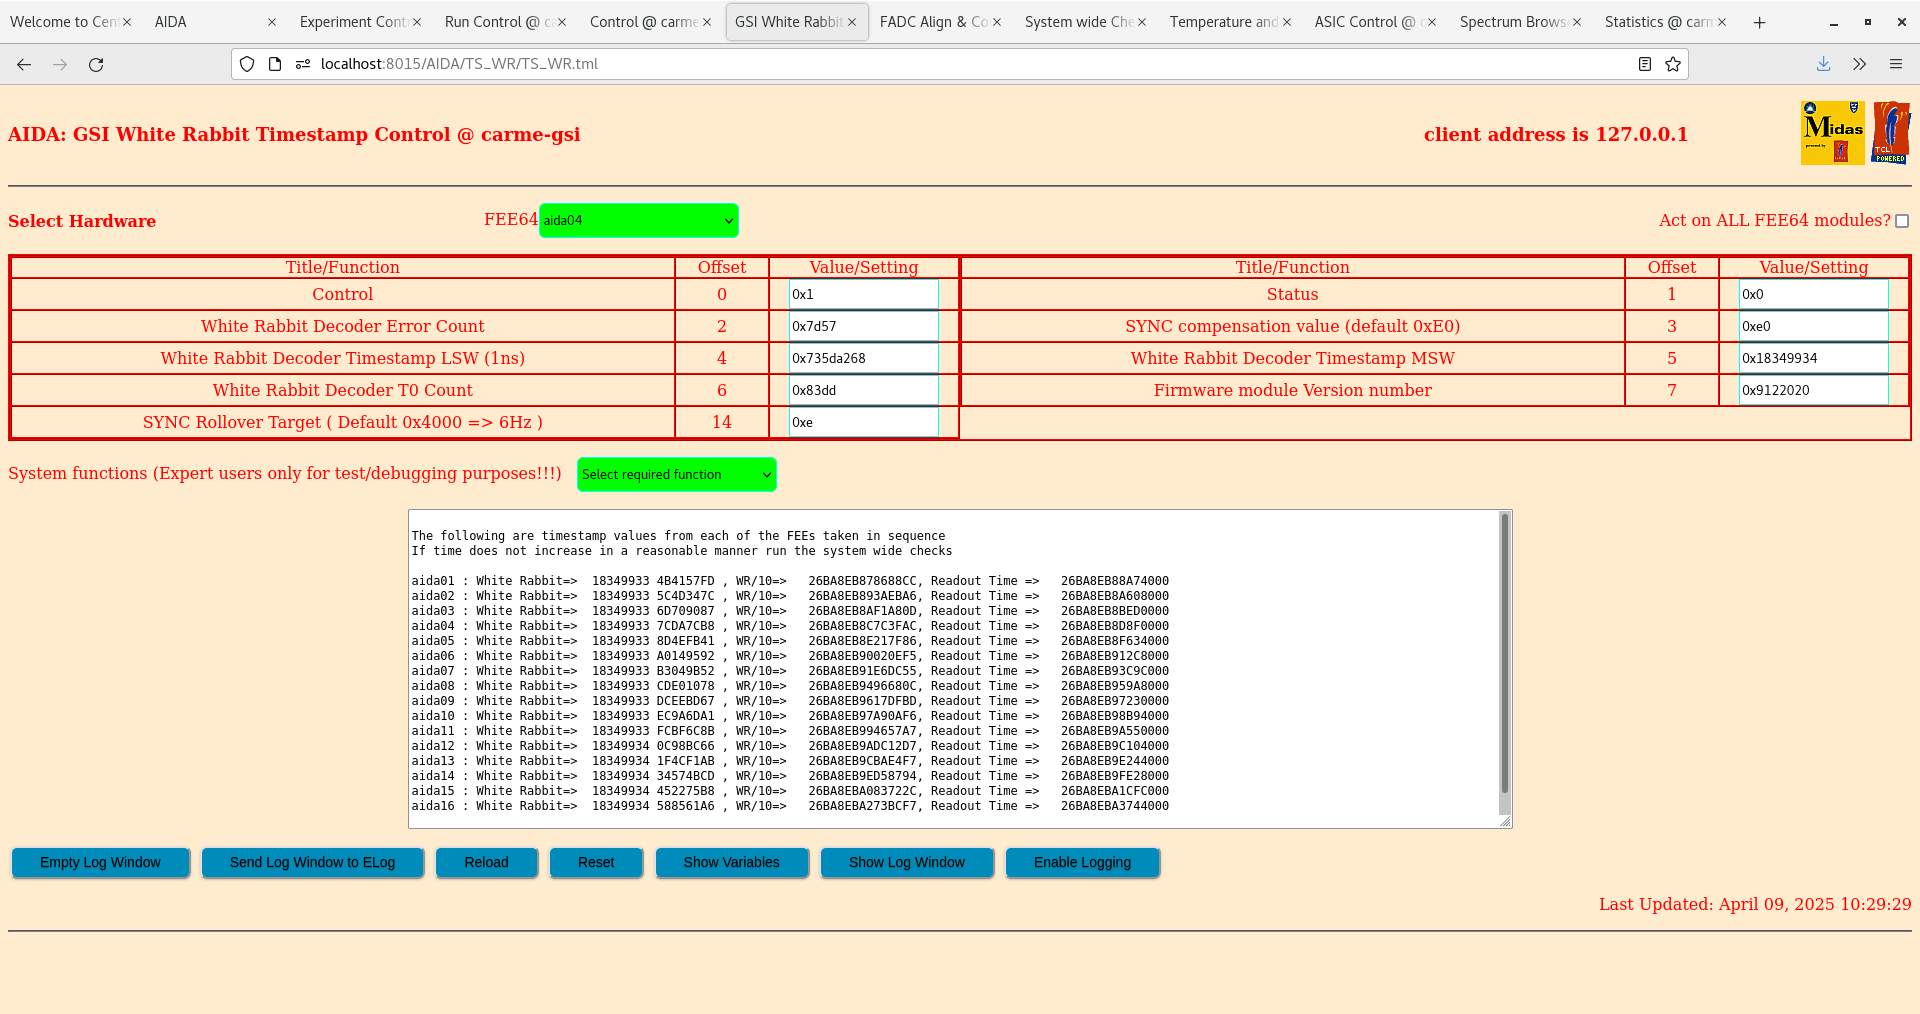
WR timestamps OK - attachment 11 |
| Attachment 1: Screenshot_from_2025-04-09_03-37-36.png
|
|
| Attachment 2: Screenshot_from_2025-04-09_03-38-05.png
|
|
| Attachment 3: Screenshot_from_2025-04-09_03-38-36.png
|
|
| Attachment 4: Screenshot_from_2025-04-09_03-38-59.png
|
|
| Attachment 5: Screenshot_from_2025-04-09_03-39-18.png
|
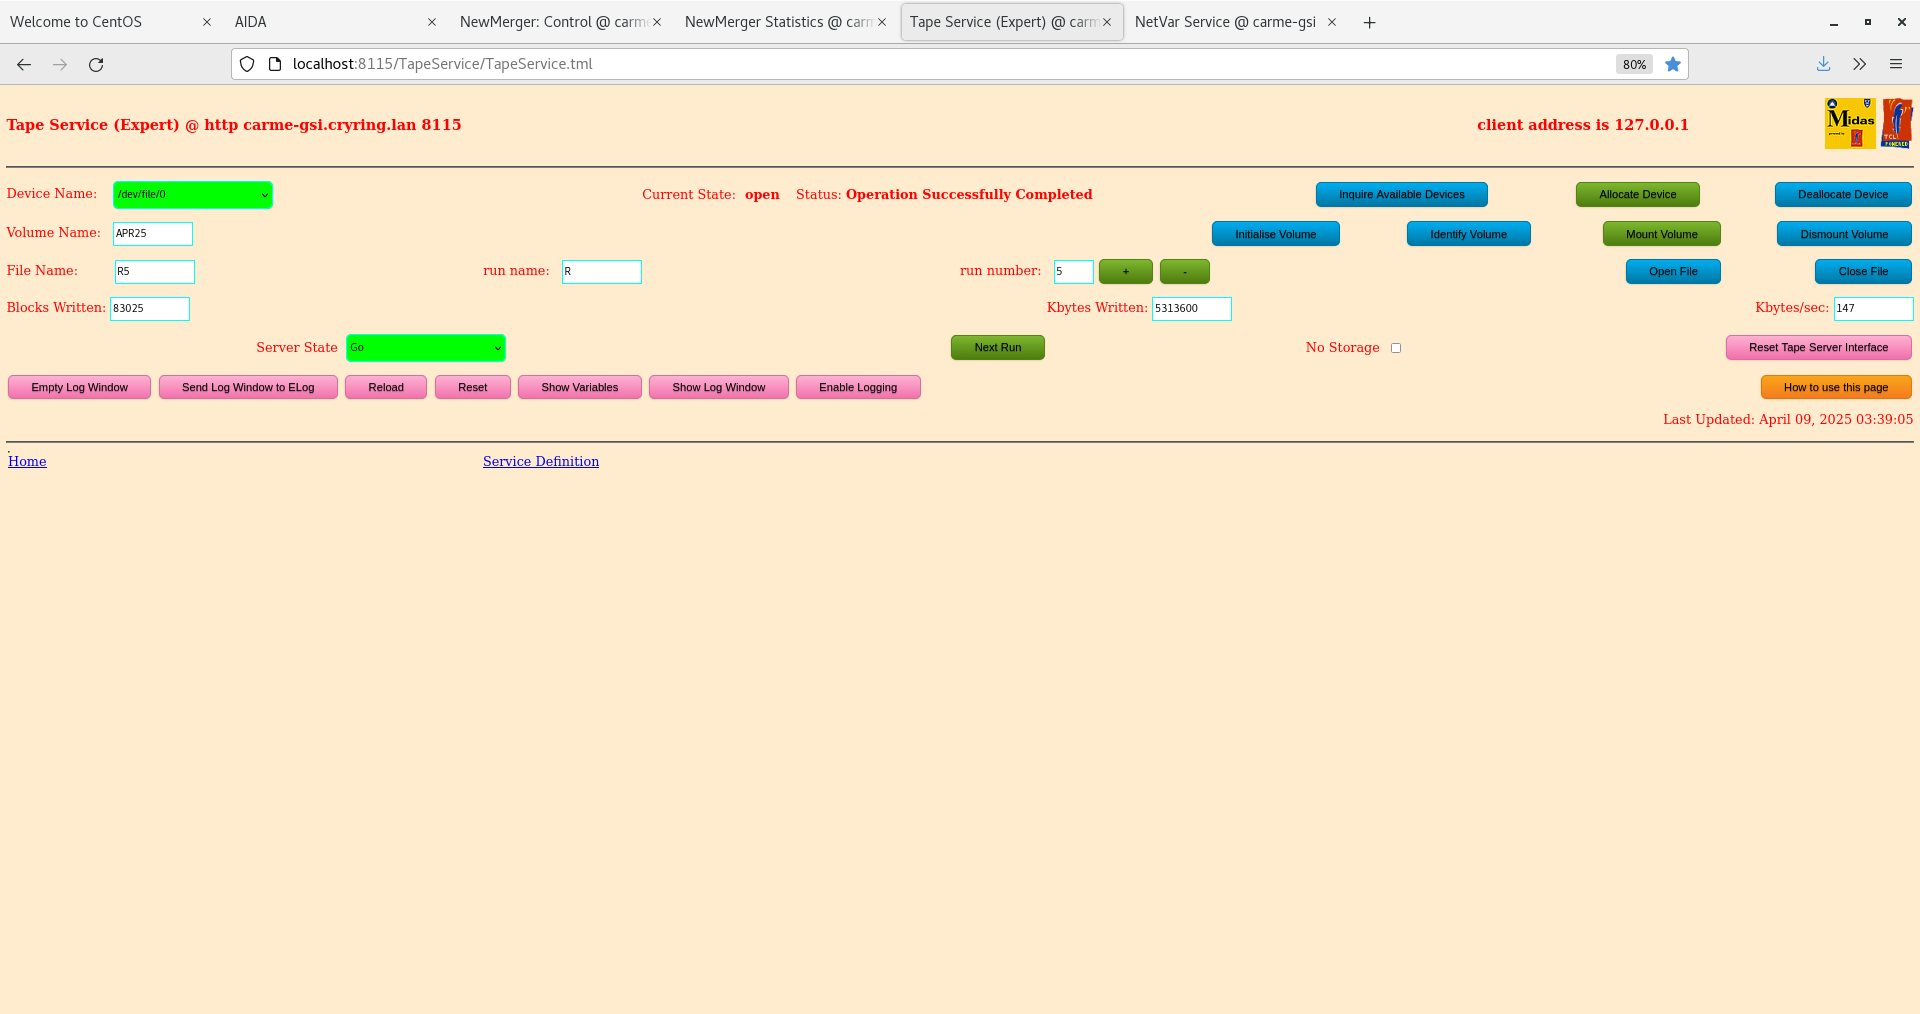
|
| Attachment 6: Screenshot_from_2025-04-09_10-24-34.png
|
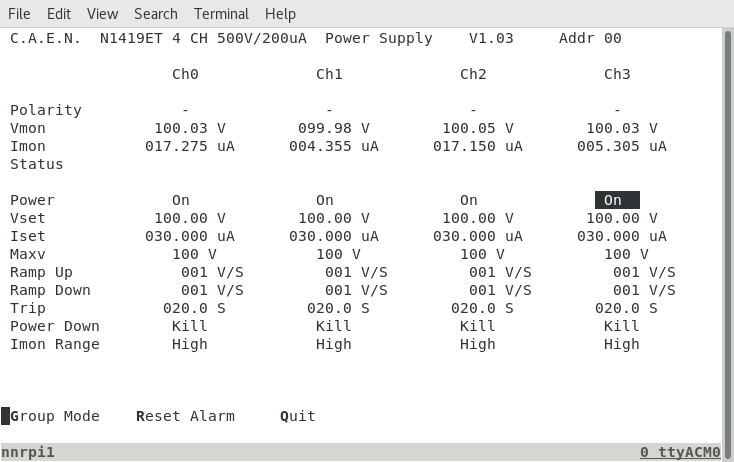
|
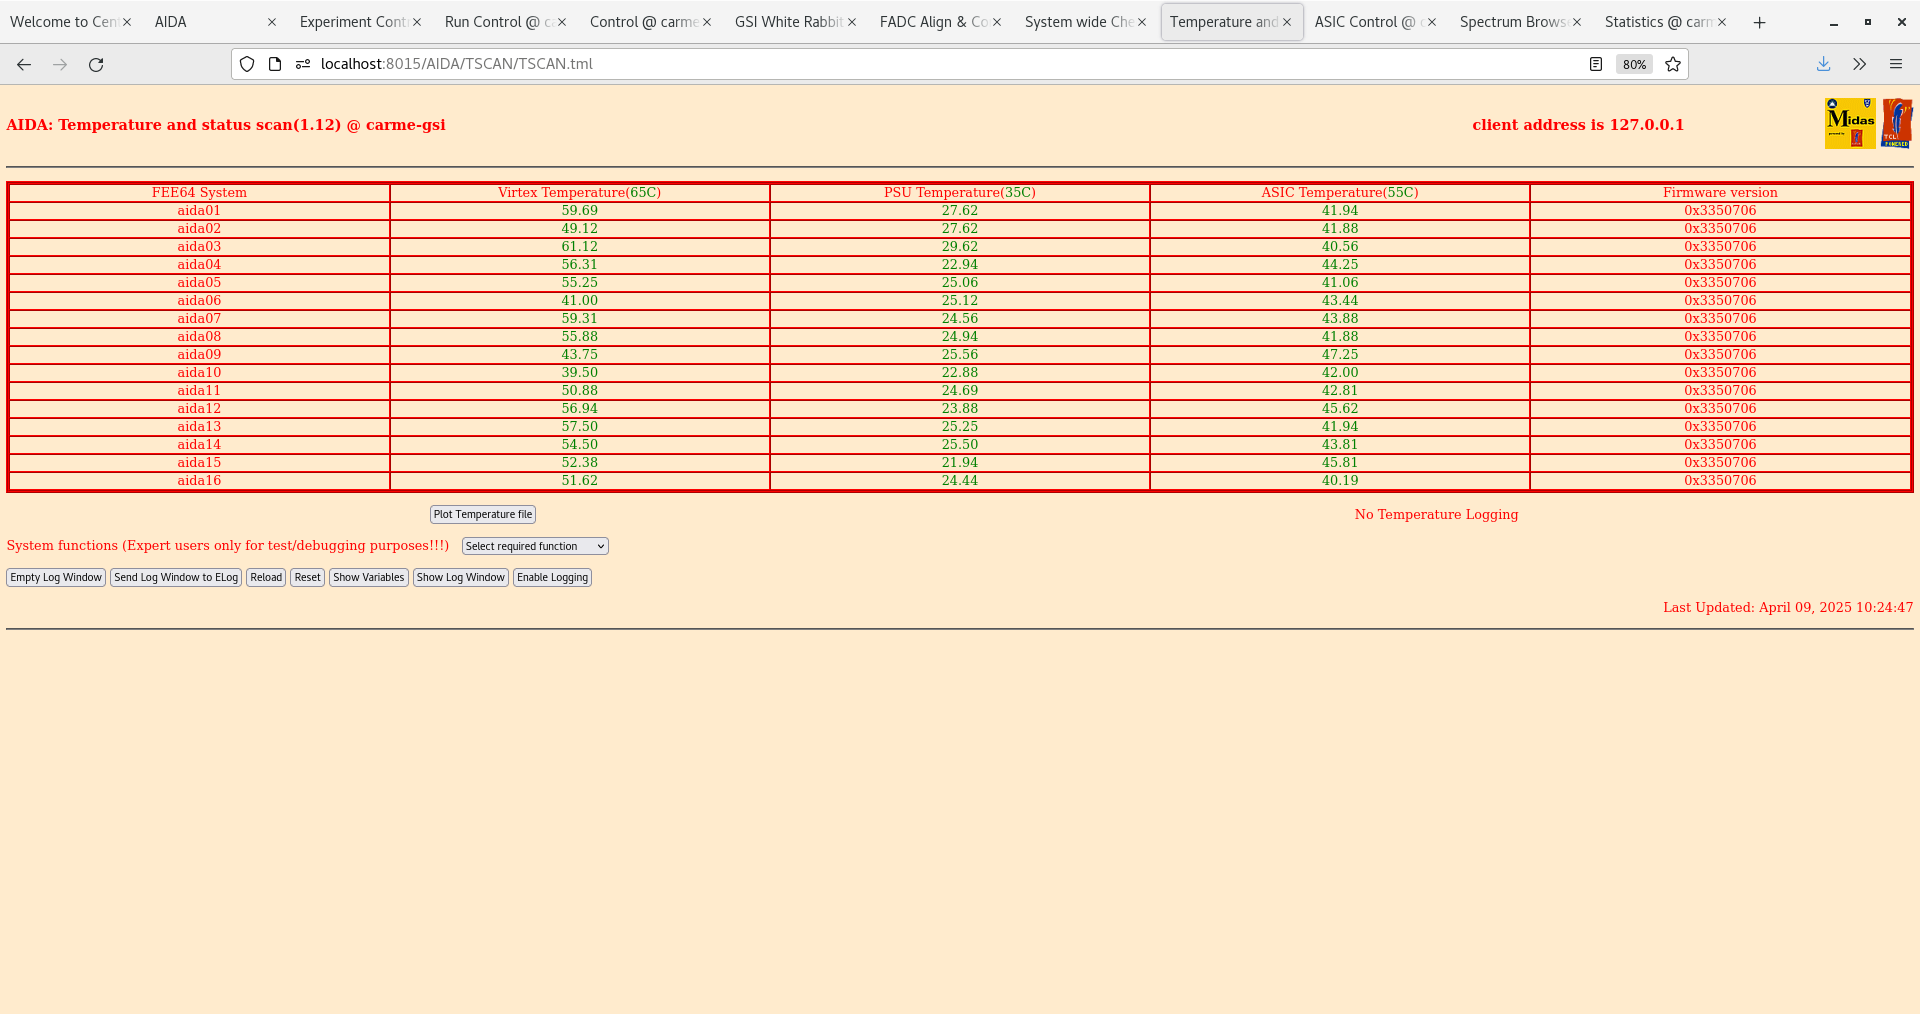
| Attachment 7: Screenshot_from_2025-04-09_10-24-56.png
|
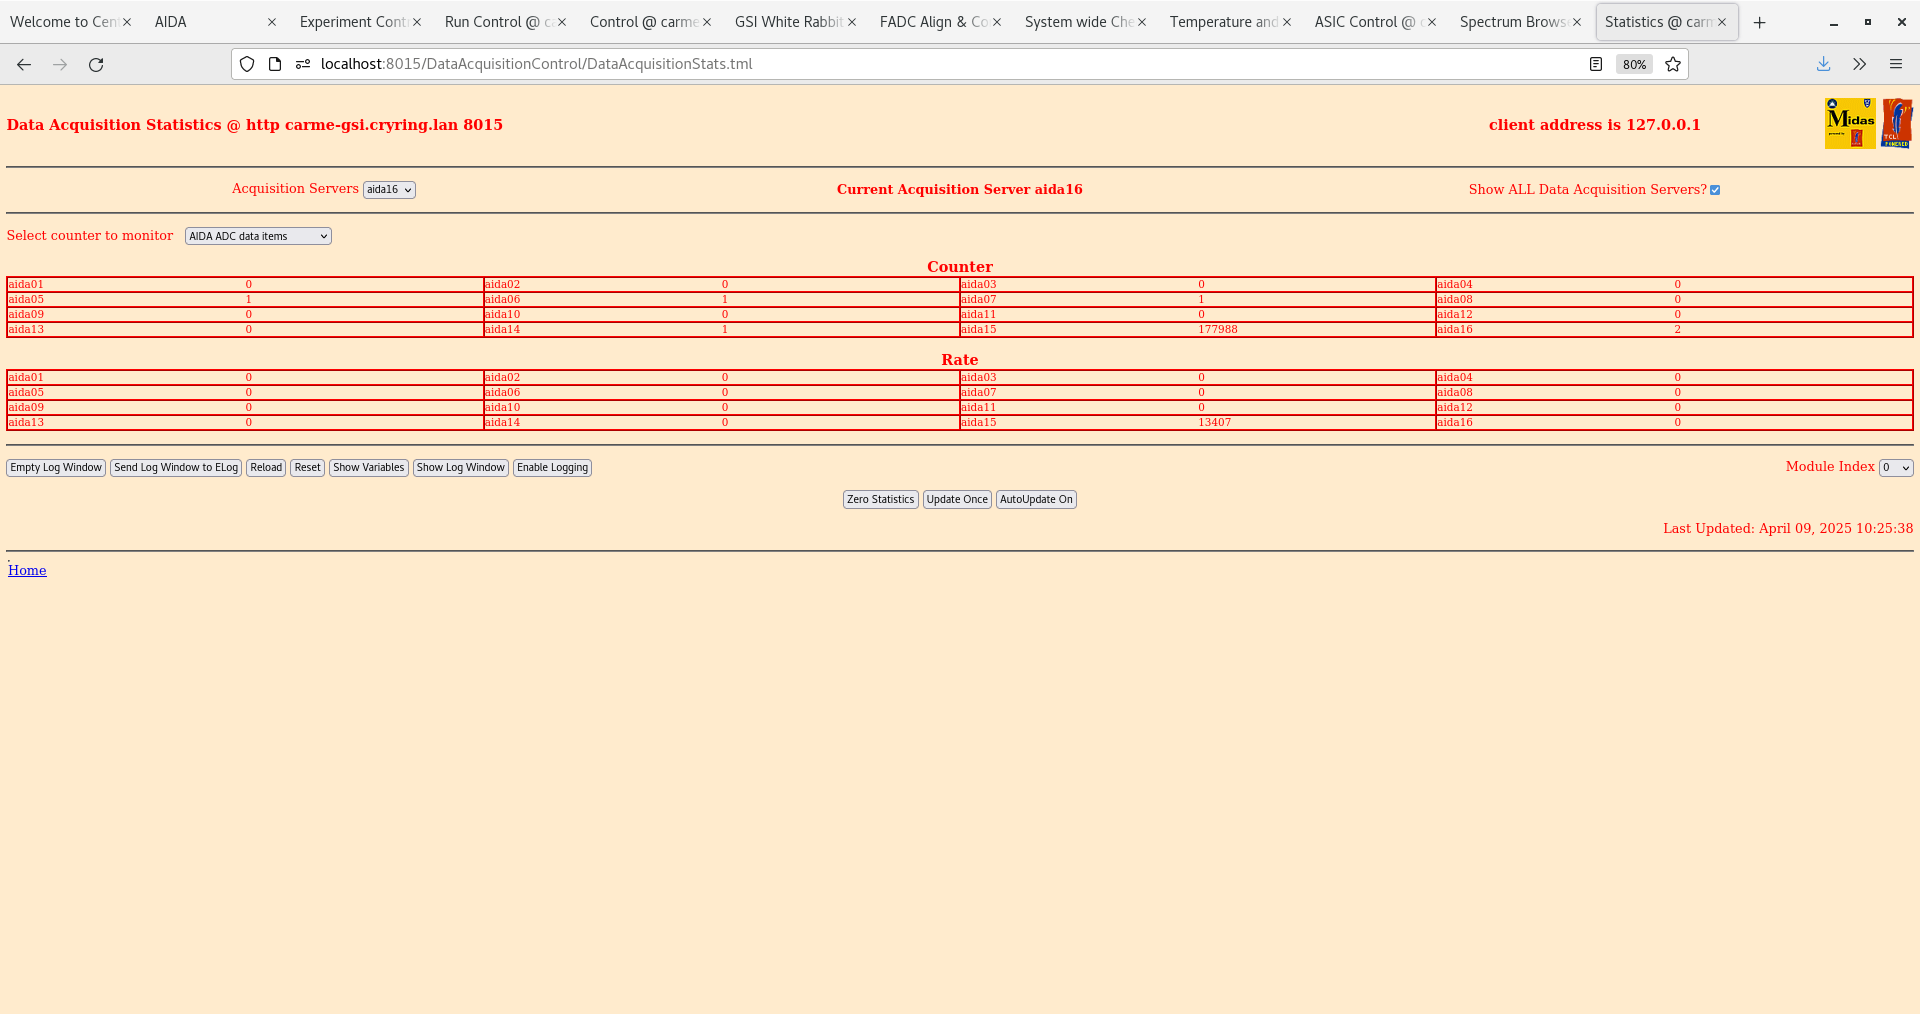
|
| Attachment 8: Screenshot_from_2025-04-09_10-25-49.png
|
|
| Attachment 9: Screenshot_from_2025-04-09_10-26-39.png
|
|
| Attachment 10: Screenshot_from_2025-04-09_10-26-53.png
|
|
| Attachment 11: Screenshot_from_2025-04-09_10-29-58.png
|
|
|
|
668
|
Tue Apr 8 10:46:13 2025 |
TD | Tuesday 8 April |
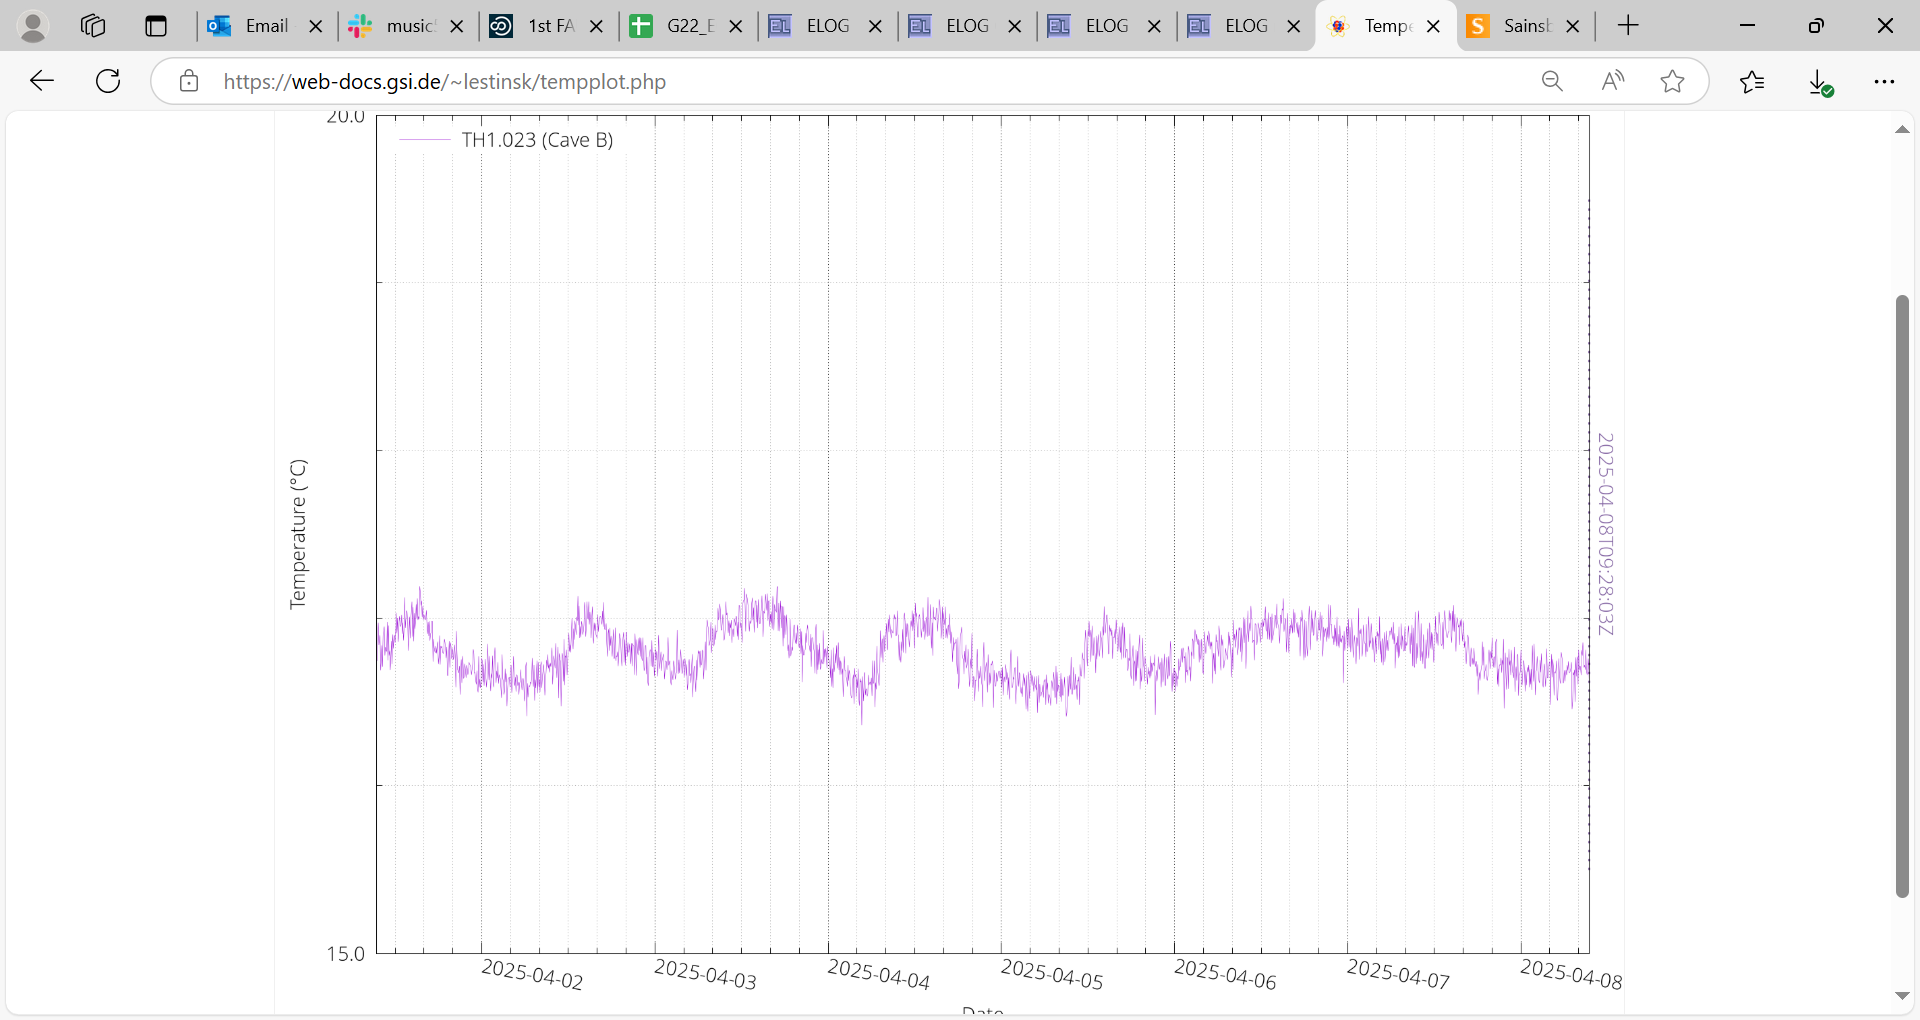
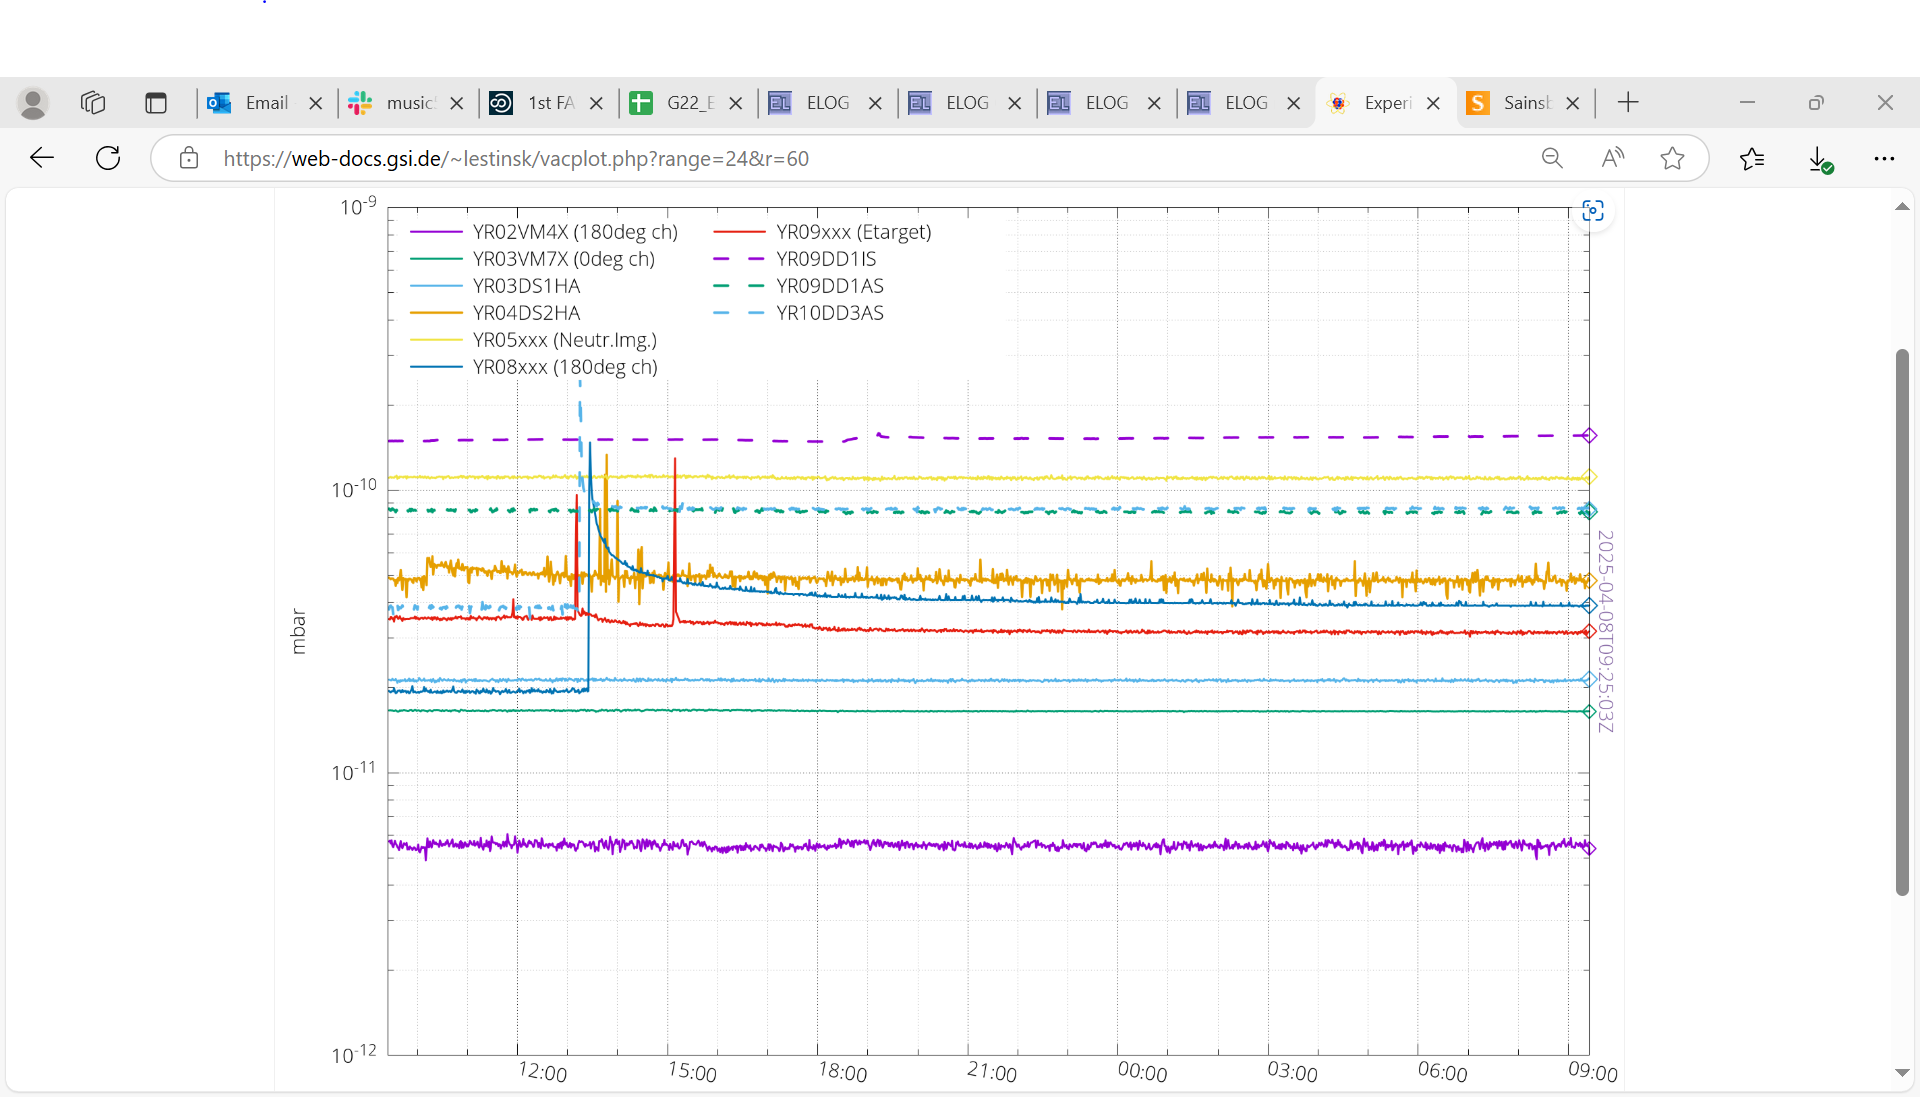
11.30 CRYRING vacuum and temperature - attachments 1-2

      DSSSD bias & leakage current - attachment 3
       c. 1uA reduction in DSSSD#1 and DSSSD#2 leakage currents cf. yesterday but remain high cf.June 2024

      FEE64 temps OK - attachment 4

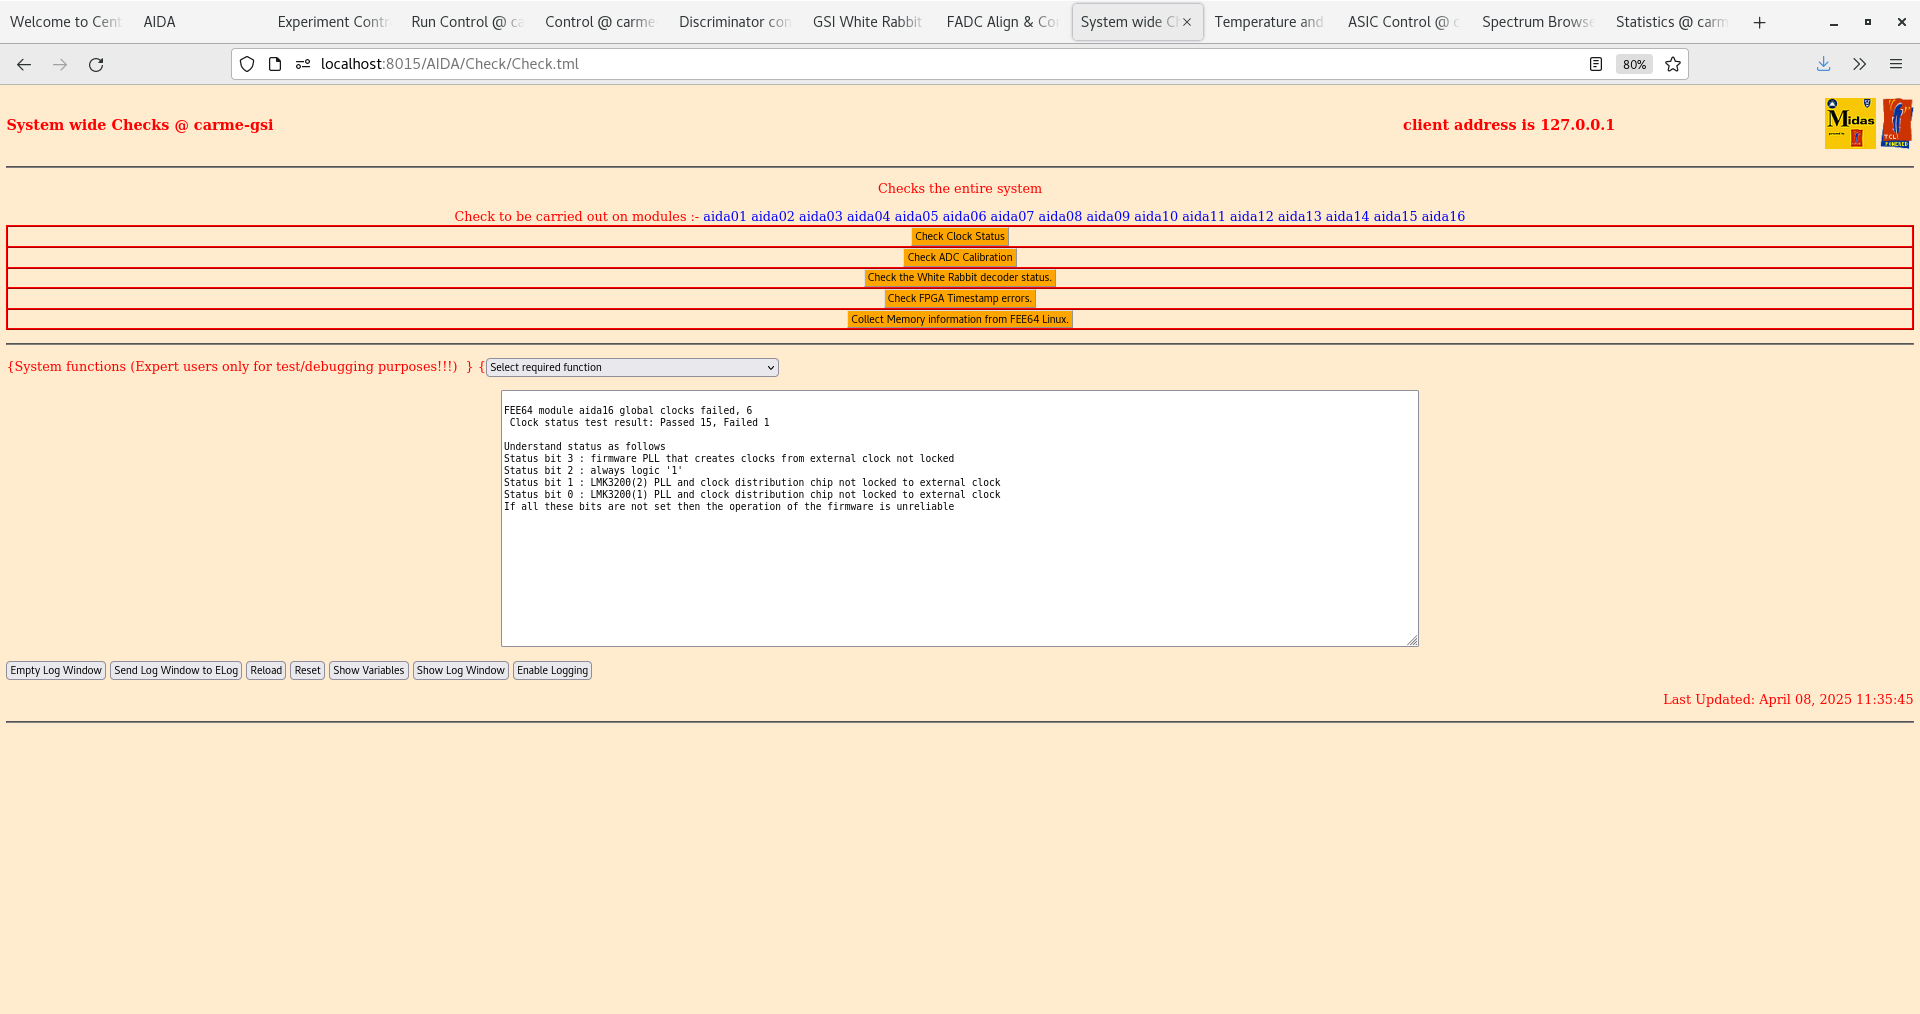
      System wide checks - clock fail aida16 - attachments 5-6
       aida16 global clock status 0x6 - non-critical failure, often resolved by a power cycle.

      ADC data item stats - attachment 7
       DSSSD #3 n+n Ohmic side FEE64 rates return to c. normal cf. yesterday


      per FEE64 Rate spectra - attachment 8

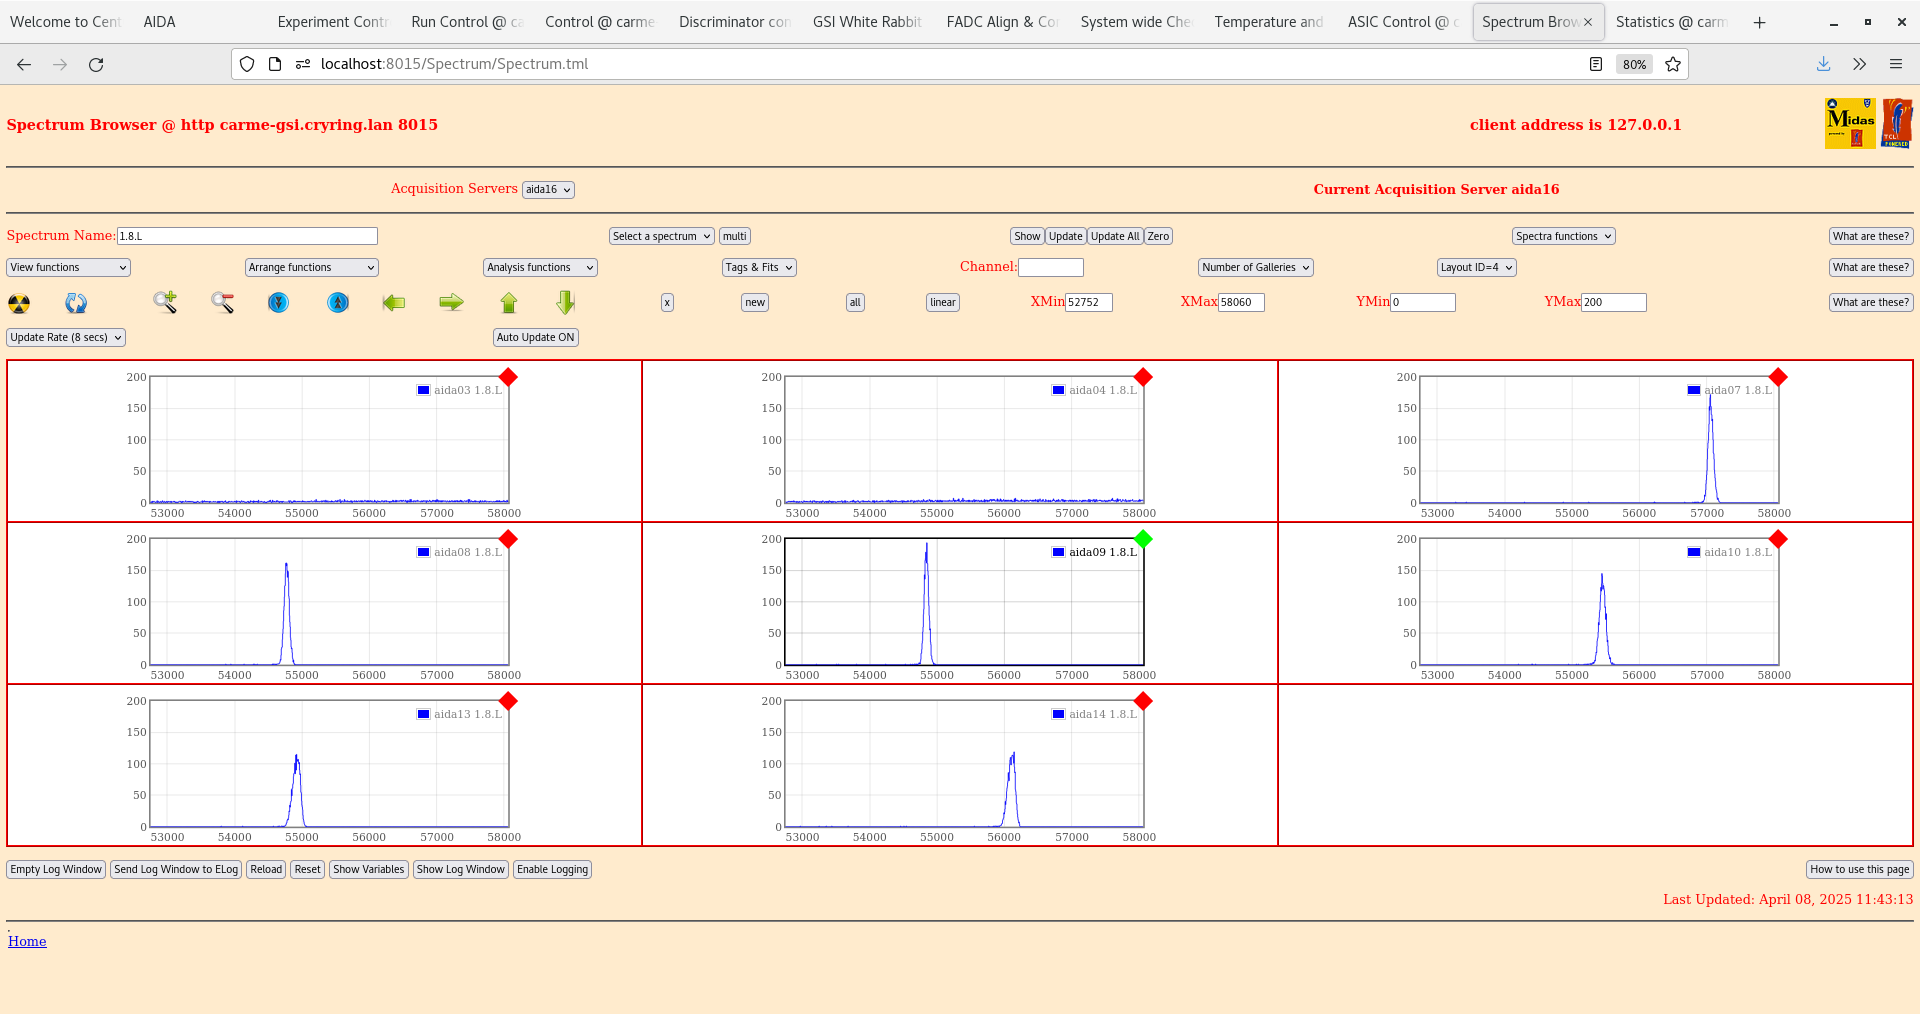
      per FEE64 1.8.L spectra - attachments 9-10
       pulser peak width aida11 55 ch FWHM, aida09 75 ch FWHM
       only DSSSD #3 aida11/aida12 have expected peak widths

      per FEE64 1.8.W spectra - 20us FSR - attachments 11-13

      WR timestamps OK - attachment 14

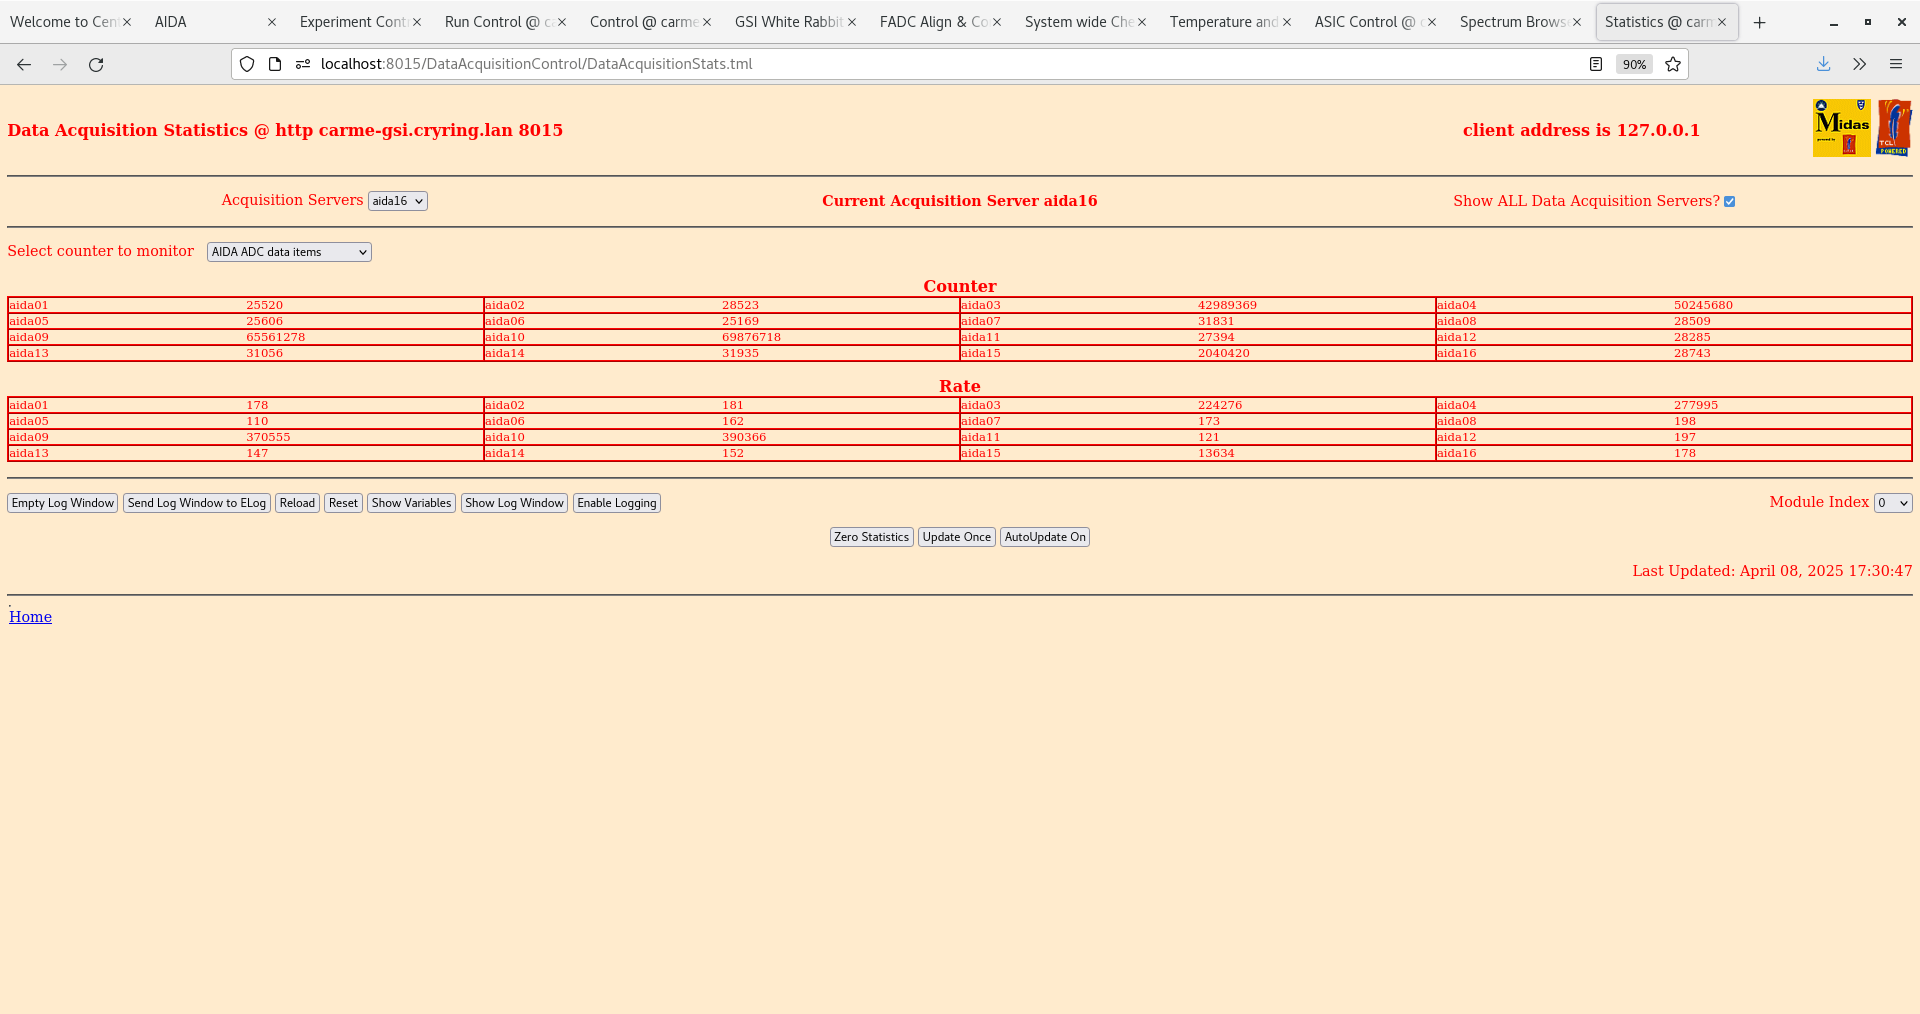
17.29 DSSSD bias & leakage current - attachment 15

      FEE64 temps OK - attachment 16

      WR timestamps OK - attachment 17

      ADC data item stats - attachment 18

      per FEE64 Rate spectra - attachment 19

17.35 All histograms & stats zero'd
      Start run
      Data file APR25/R5
      alpha background

      EG&G Ortec 448 Pulser
       amplituide 90,000
       normalise 5.00
       x5 attenuator IN
       INT OSC
       frequency 2Hz
       t_r 100ns
       tau_d 50us (1000us setting does not work)
       polarity +

       ASIC settings 2025Apr08-13.45.30
        slow comparator 0x64
        aida03, aida04, aida09, aida10 LEC/EC range setting -> MEC

      per FEE64 Rate spectra - attachment 20

      Merger & Tape Server - attachment 21-22

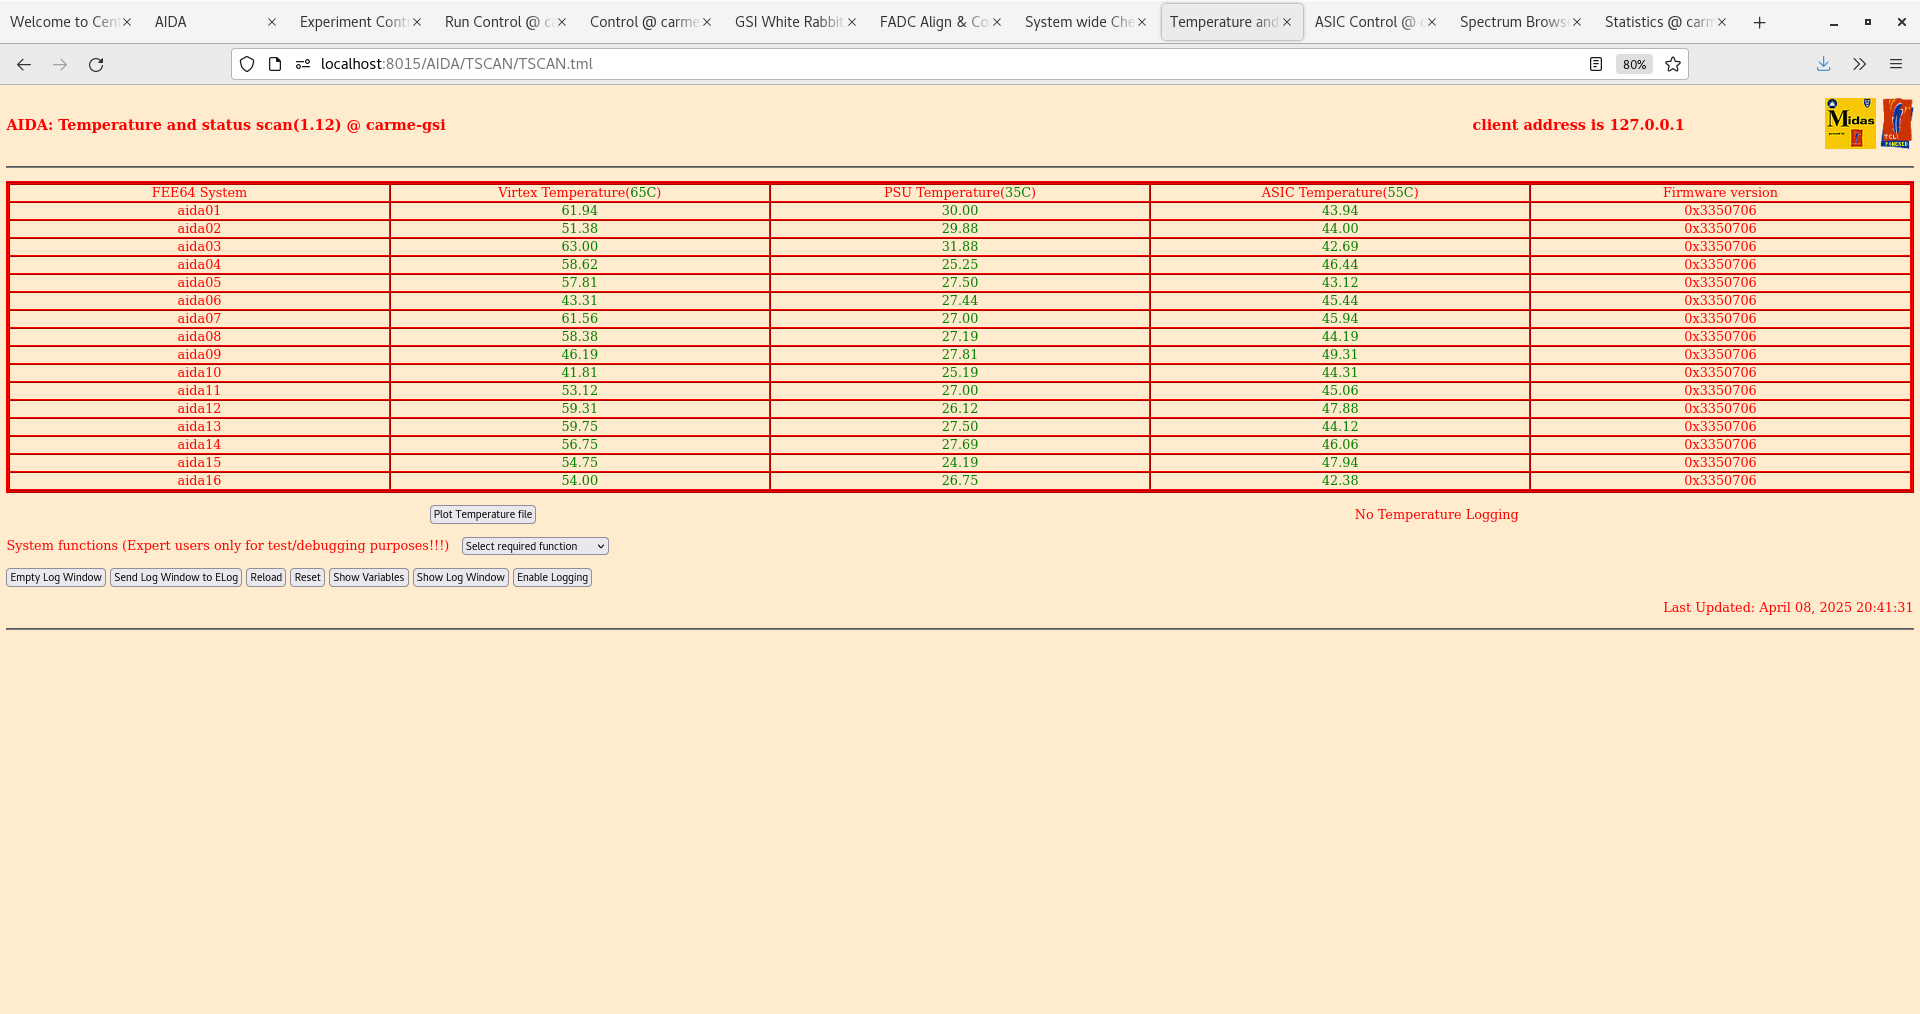
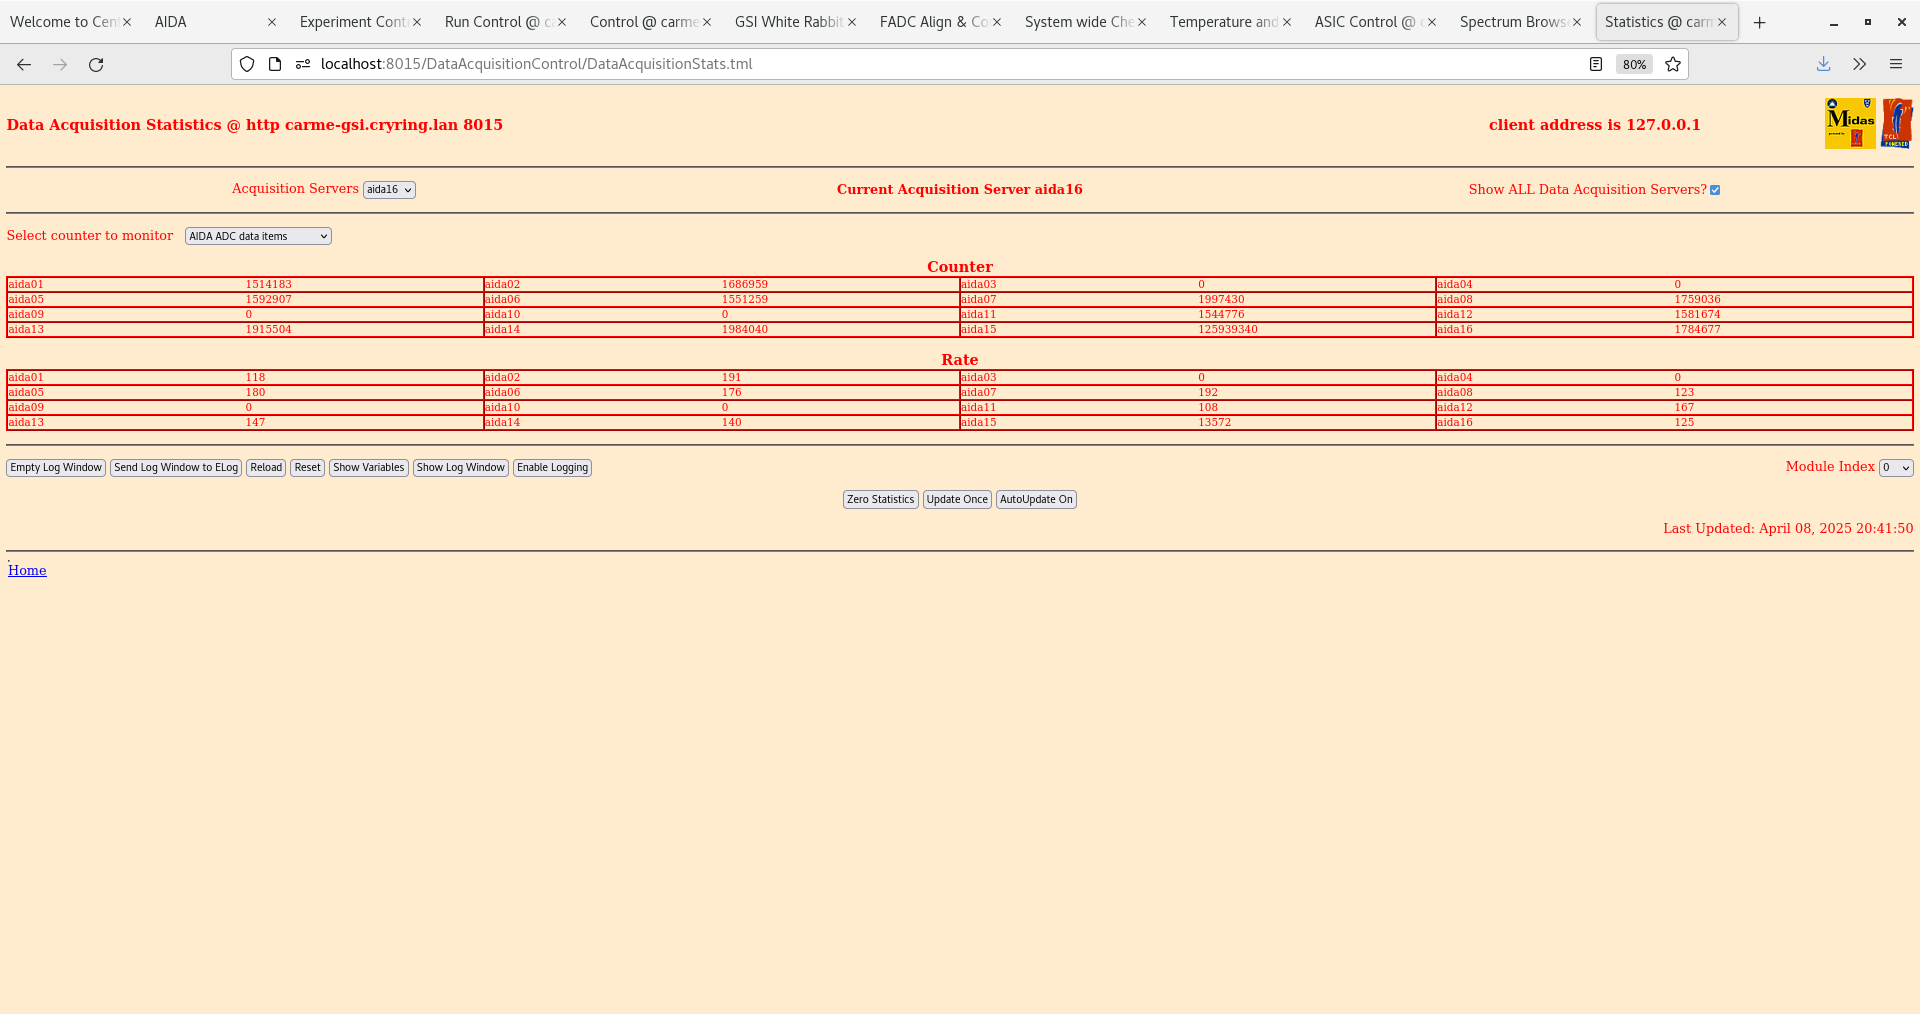
20.41 DAQ continues
      Data file APR25/R5_7

      DSSSD bias & leakage current - attachment 23

      FEE64 temps OK - attachment 24

      ADC data item stats - attachment 25

      Merger & Tape Server - attachment 26-27

      per FEE64 Rate spectra - attachment 19
|
| Attachment 1: Capture_2.PNG
|
|
| Attachment 2: Capture.PNG
|
|
| Attachment 3: Screenshot_from_2025-04-08_11-29-48.png
|

|
| Attachment 4: Screenshot_from_2025-04-08_11-30-14.png
|

|
| Attachment 5: Screenshot_from_2025-04-08_11-38-06.png
|
|
| Attachment 6: Screenshot_from_2025-04-08_11-38-29.png
|

|
| Attachment 7: Screenshot_from_2025-04-08_11-38-46.png
|

|
| Attachment 8: Screenshot_from_2025-04-08_11-39-39.png
|

|
| Attachment 9: Screenshot_from_2025-04-08_11-41-09.png
|

|
| Attachment 10: Screenshot_from_2025-04-08_11-43-20.png
|
|
| Attachment 11: Screenshot_from_2025-04-08_11-43-56.png
|

|
| Attachment 12: Screenshot_from_2025-04-08_11-44-24.png
|

|
| Attachment 13: Screenshot_from_2025-04-08_11-45-11.png
|

|
| Attachment 14: Screenshot_from_2025-04-08_13-36-00.png
|

|
| Attachment 15: Screenshot_from_2025-04-08_17-29-11.png
|

|
| Attachment 16: Screenshot_from_2025-04-08_17-29-35.png
|

|
| Attachment 17: Screenshot_from_2025-04-08_17-30-30.png
|

|
| Attachment 18: Screenshot_from_2025-04-08_17-30-56.png
|
|
| Attachment 19: Screenshot_from_2025-04-08_17-28-57.png
|

|
| Attachment 20: Screenshot_from_2025-04-08_17-37-47.png
|

|
| Attachment 21: Screenshot_from_2025-04-08_17-35-42.png
|

|
| Attachment 22: Screenshot_from_2025-04-08_17-35-54.png
|

|
| Attachment 23: Screenshot_from_2025-04-08_20-40-46.png
|

|
| Attachment 24: Screenshot_from_2025-04-08_20-41-39.png
|
|
| Attachment 25: Screenshot_from_2025-04-08_20-41-56.png
|
|
| Attachment 26: Screenshot_from_2025-04-08_20-42-29.png
|

|
| Attachment 27: Screenshot_from_2025-04-08_20-42-48.png
|

|
|
|
667
|
Mon Apr 7 08:59:41 2025 |
TD | Monday 7 April |
10.00 FEE64 power ON
      CARME IE514 OFF

      Confirm DAQ SETUP restores ASIC settings 2024Apr24-14.14.03 for *all* FEE64s

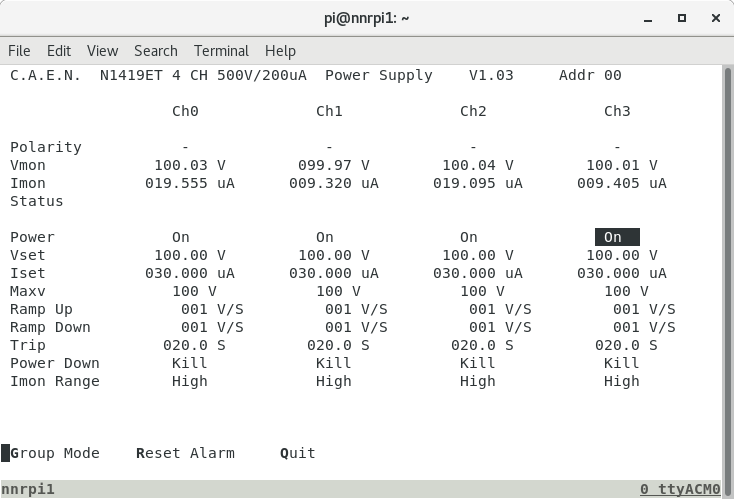
      DSSSD bias & leakage current - attachment 1
       leakage currents remain high cf. June 2024 - status of vacuum group controlled ion gauge unknown

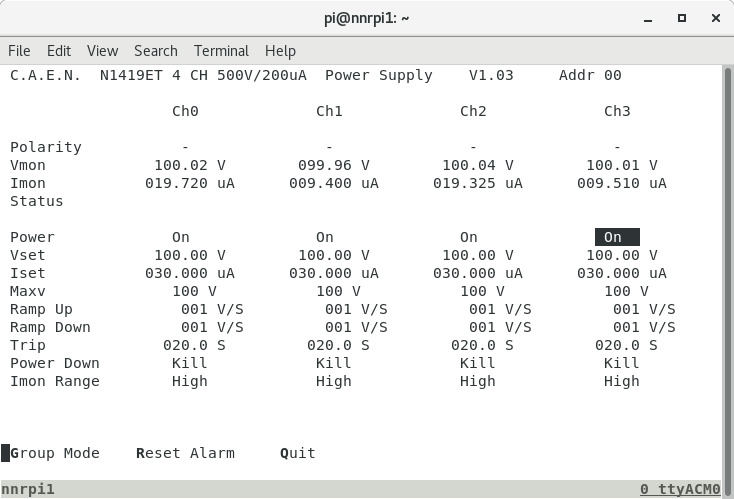
12.10 FEE64 power ON

      DSSSD bias & leakage current - attachment 2

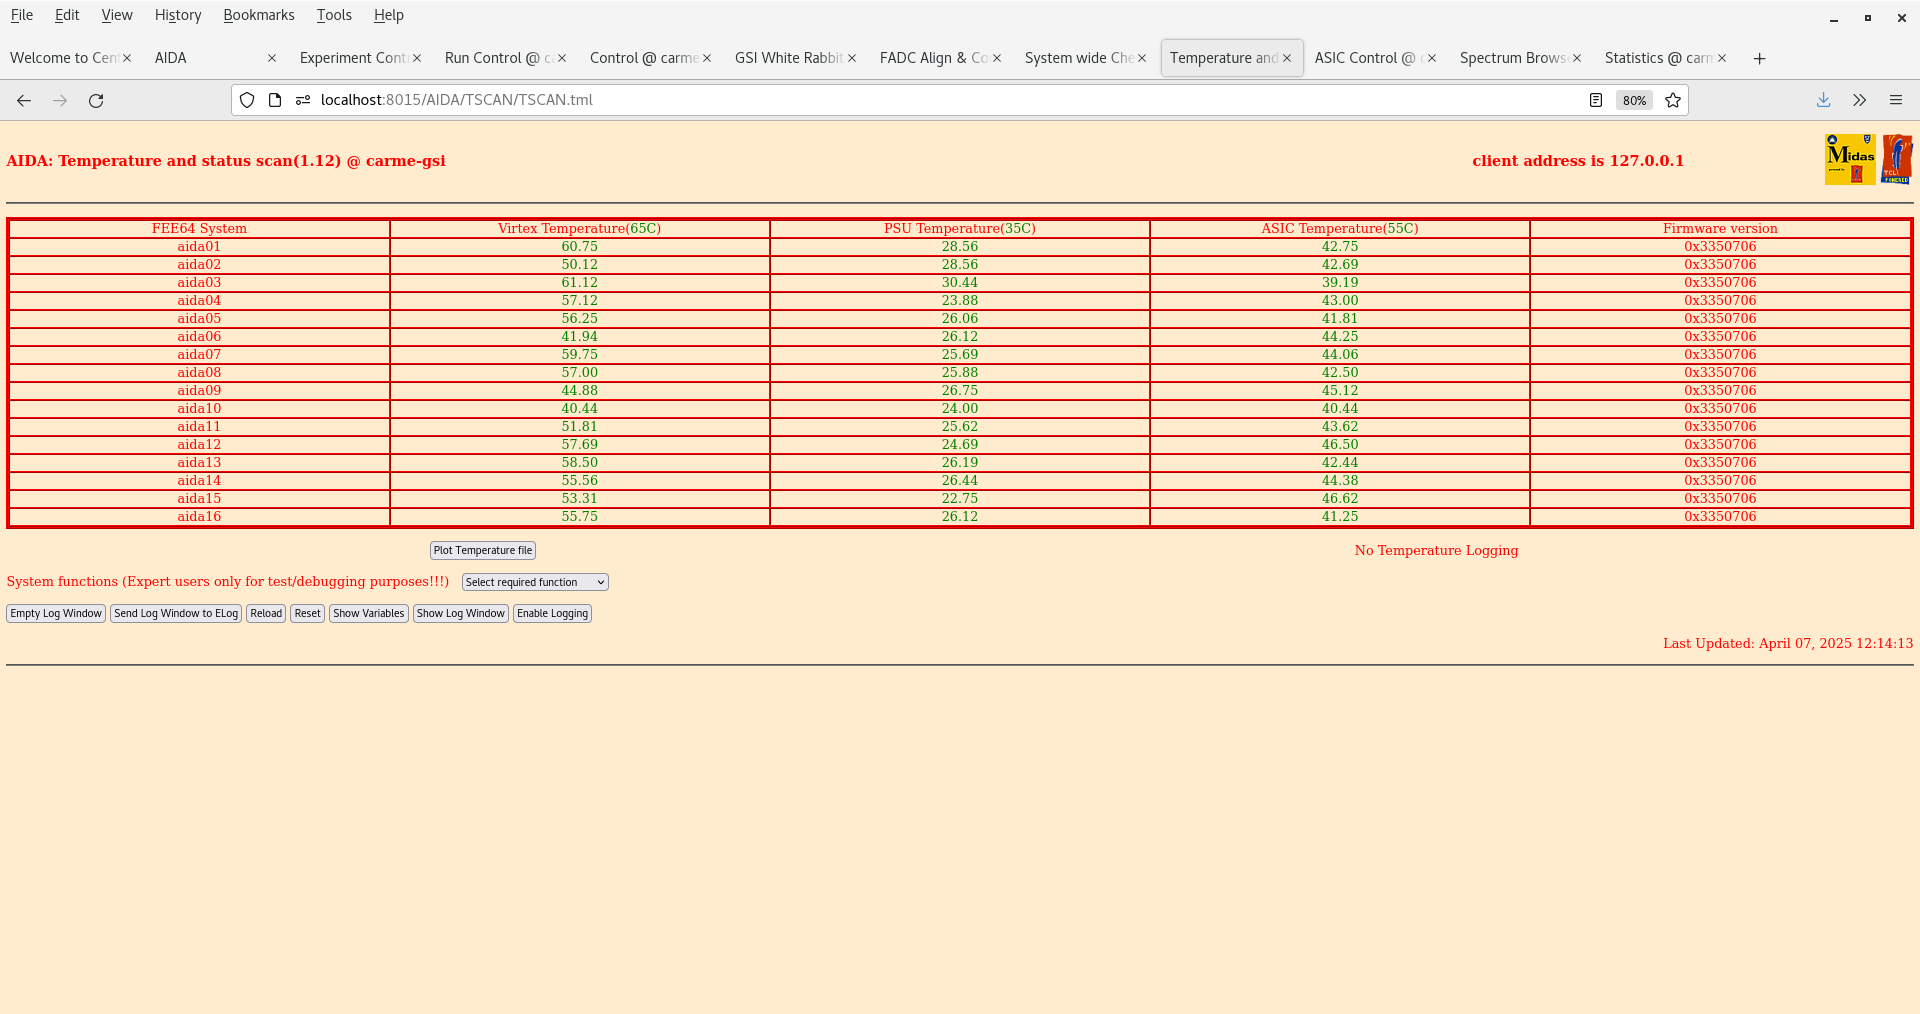
      FEE64 temps OK - attachment 3

      All system wide checks OK

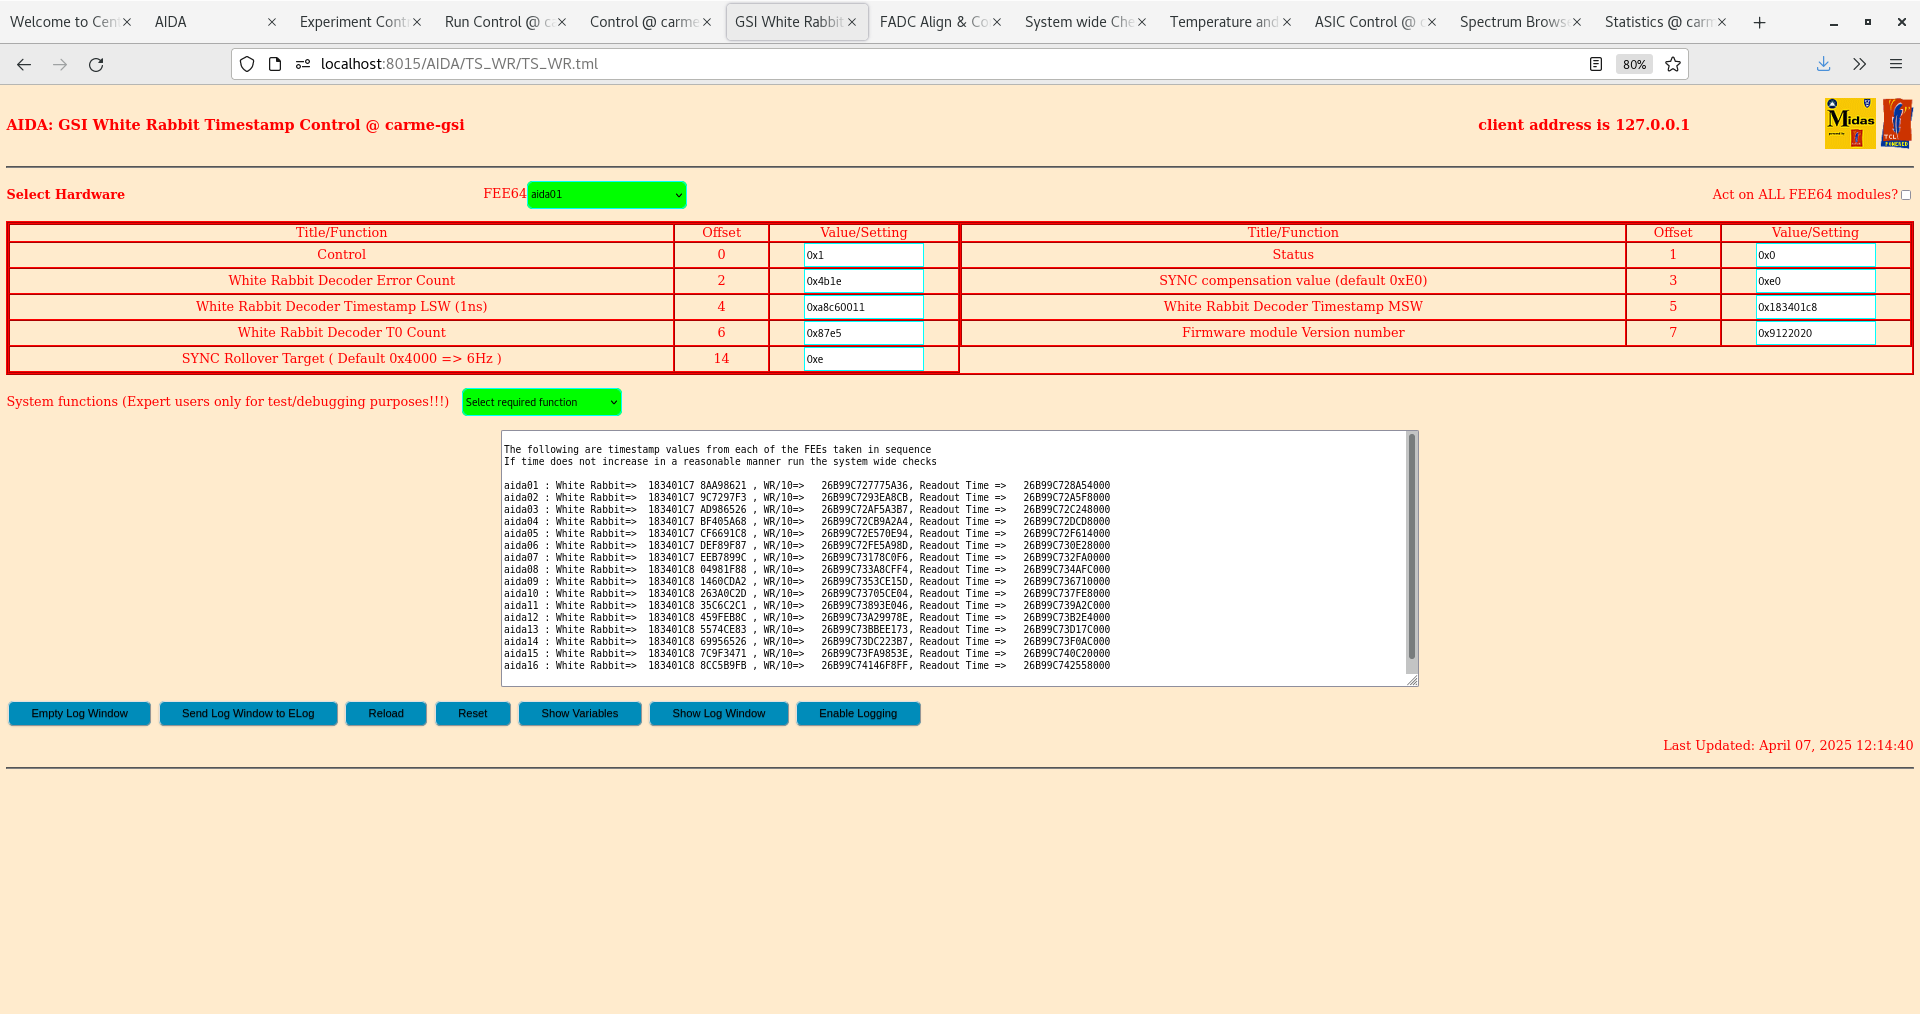
      WR timestamps OK - attachment 4

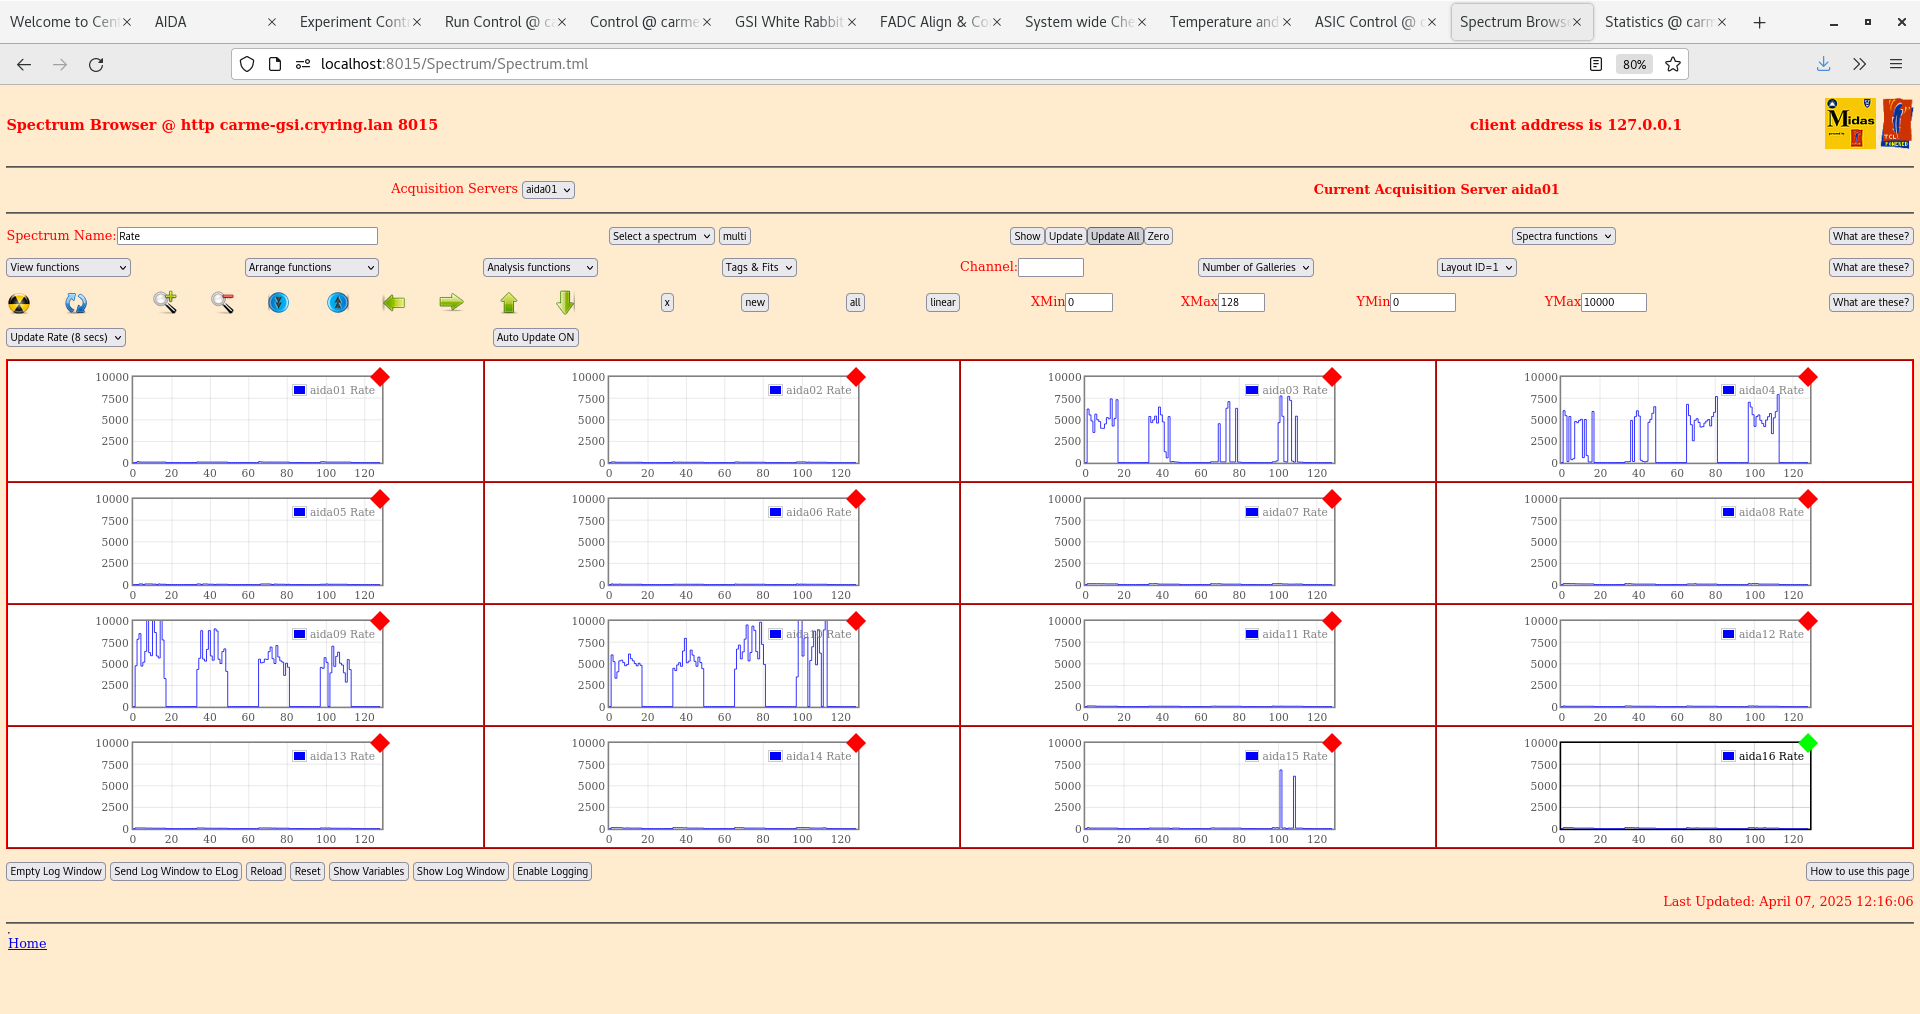
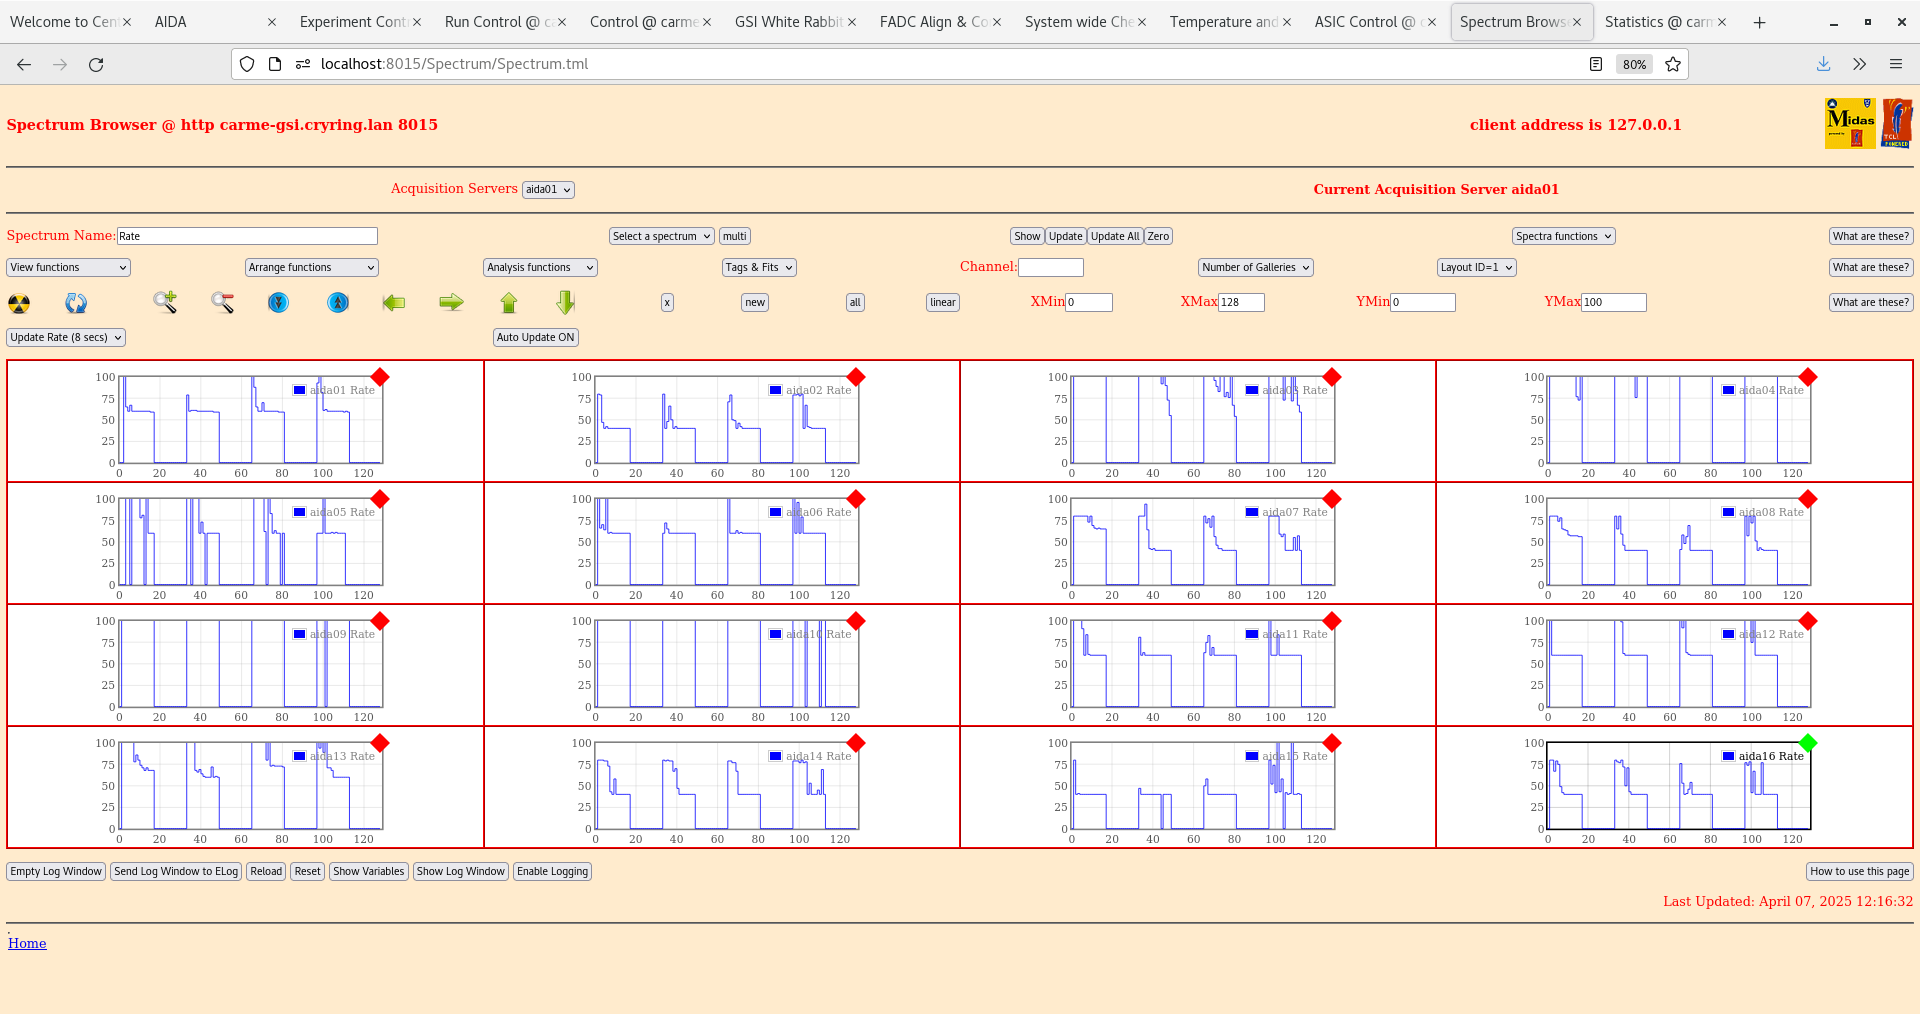
      per FEE64 Rate spectra - attachments 5-6

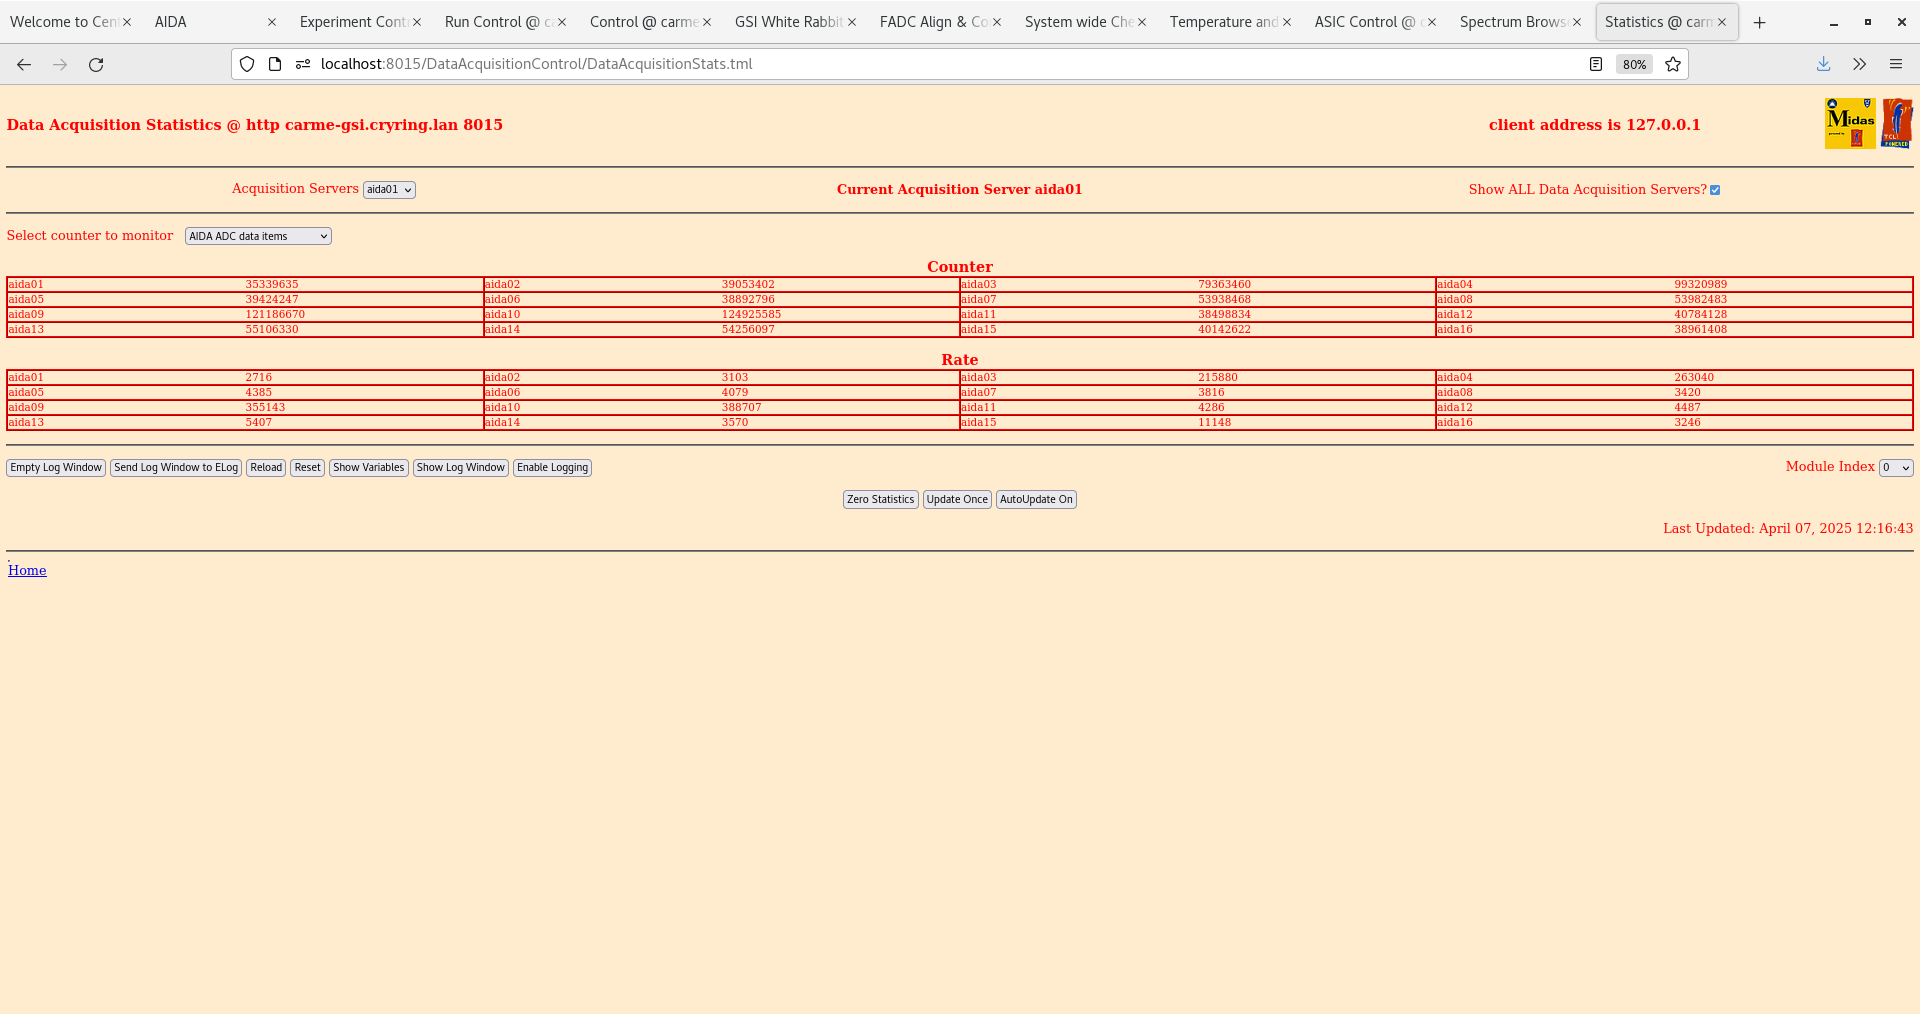
      ADC data item stats - attachment 7

13.45 ML says vacuum group have switched off YR09DD1AS
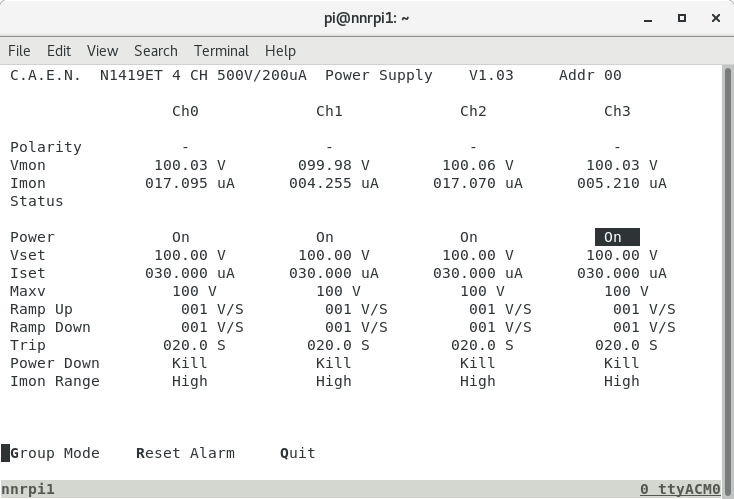
      DSSSD bias & leakage currents - attachment 8
       DSSSD #2 and DSSSD #4 leakage currents return to 'normal' values cf. June 2024
       DSSSD #1 and DSSSD #3 leakage currents reduce by c. 10-15% only and remain high cf. June 2024

17.47 DSSSD bias OFF
      FEE6 Power OFF
|
| Attachment 1: Screenshot_from_2025-04-07_10-01-15.png
|
|
| Attachment 2: Screenshot_from_2025-04-07_12-14-02.png
|
|
| Attachment 3: Screenshot_from_2025-04-07_12-14-16.png
|
|
| Attachment 4: Screenshot_from_2025-04-07_12-14-57.png
|
|
| Attachment 5: Screenshot_from_2025-04-07_12-16-12.png
|
|
| Attachment 6: Screenshot_from_2025-04-07_12-16-36.png
|
|
| Attachment 7: Screenshot_from_2025-04-07_12-16-45.png
|
|
| Attachment 8: Screenshot_from_2025-04-07_14-06-10.png
|
|
|
|
666
|
Sun Apr 6 14:21:53 2025 |
TD | [How To] Startup CARME |
- water flow/interlock checks
   check water flow to/from inflow/outflow manifolds
   check all coolant lines to all FEE64s are connected
   check USB-controlled ac mains relay 'water' LED illuminated                                 water flow and dew point sensor interlocks OK

- carme-gsi network cabling
   from patch panel YR10/2
    yellow network cable to carme-gsi operating in 19" rack room (2.033)
    green network cable to carme-gsi operating in counting room (2.034)

- boot carme-gsi
   systemctl start dhcpd                                                                       start DHCP dynamic network configuration
   ssh -L 8080:proxy.gsi.de:8080 carme@atppc025                                                establish proxy port for AnyDesk access
   ssh -X pi@nnrpi1
    /MIDAS/TclHttpd/linux-arm/TclHttpd-server &                                                start MIDAS server
   ssh -X pi@nnrpi1
    ./caen_screen.sh                                                                           start CAEN N1419ET control interface

- enable current logging
  open a new terminal
  ssh pi@nnrpi1
  cd Programs/caenlogger
  caenlogger --config caenlogger_config_gsi.toml

  open a new terminal
  cd Programs/caenlogger
  gnuplot plot_current.gp

- system log
   sudo tail -f /var/log/messages                                                              monitor system log e.g. filesystem mounts for FEE64 embedded processors
   (sudo does not work - use su instead. will have to fix)

- FEE64 power ON
   Start browser on nnrpi1:8015
   Power On

- Start MIDAS
   select server start icon (leftmost)                                                            1x terminal session will appear
   Start browser tab localhost:8015

   Data Acquisition Control Services
   Update (nothing should change)

   Act on all Data acquisition server TICKED
   RESET
   SETUP

   Enable histograms and waveforms

  Open ASIC control
  Act on all FEE64 modules
  Act on all ASICS
  System functions -> Check ASIC control

  Check FEE64 temperatures (Reload)

  System wide checks
     Clock
     ADC Calibration
     White Rabbit
     Drop down -> collect FPGA errors
     Check FPGA
     Synchronise ASIC clocks

  FADC Align & Check - all FEE64s
  Drop down -> calibrate ADCs
  System wide checks
    Clock
    ADC calibration
  If any FEE fails, FADC calibrate it again

  DAQ GO

  WR timestamp                                                                  check WR timestamp monotonically increases aida01->aida16


  To startup Merger and Tape Server

  DAQ STOP

  8115 server, tape server, merger -> from buttons on top
         3x terminal sessions will appear

  Start browser tab localhost:8115
  New Merge control
  Tape Service
  NetVar Service

  Merger tab
   (top) setup
   go (ignore error message)
   enable output to data storage                                                Merger State = GOing : merge/running : xfer Links => Merger => Storage

  tape server
   Inquire Available Devices
   Allocate Device

   Enter volume name (if already defined)
   Mount volume
   Reload
   Set run number
   Open file

   Open a new terminal
   Navigate to /TapeData/ and the volume name
   watch ls -lht

   Enable data transfer #1 (in Run Control)
   X should appear next to every FEE


  Check netvar variable NetVar.MERGE.RunOptions = 1

   DAQ GO
    check merger rate and activity of all FEE64s
    check tape server blocks written number is increasing
Server state -> Go |
|
|
665
|
Sun Apr 6 11:40:48 2025 |
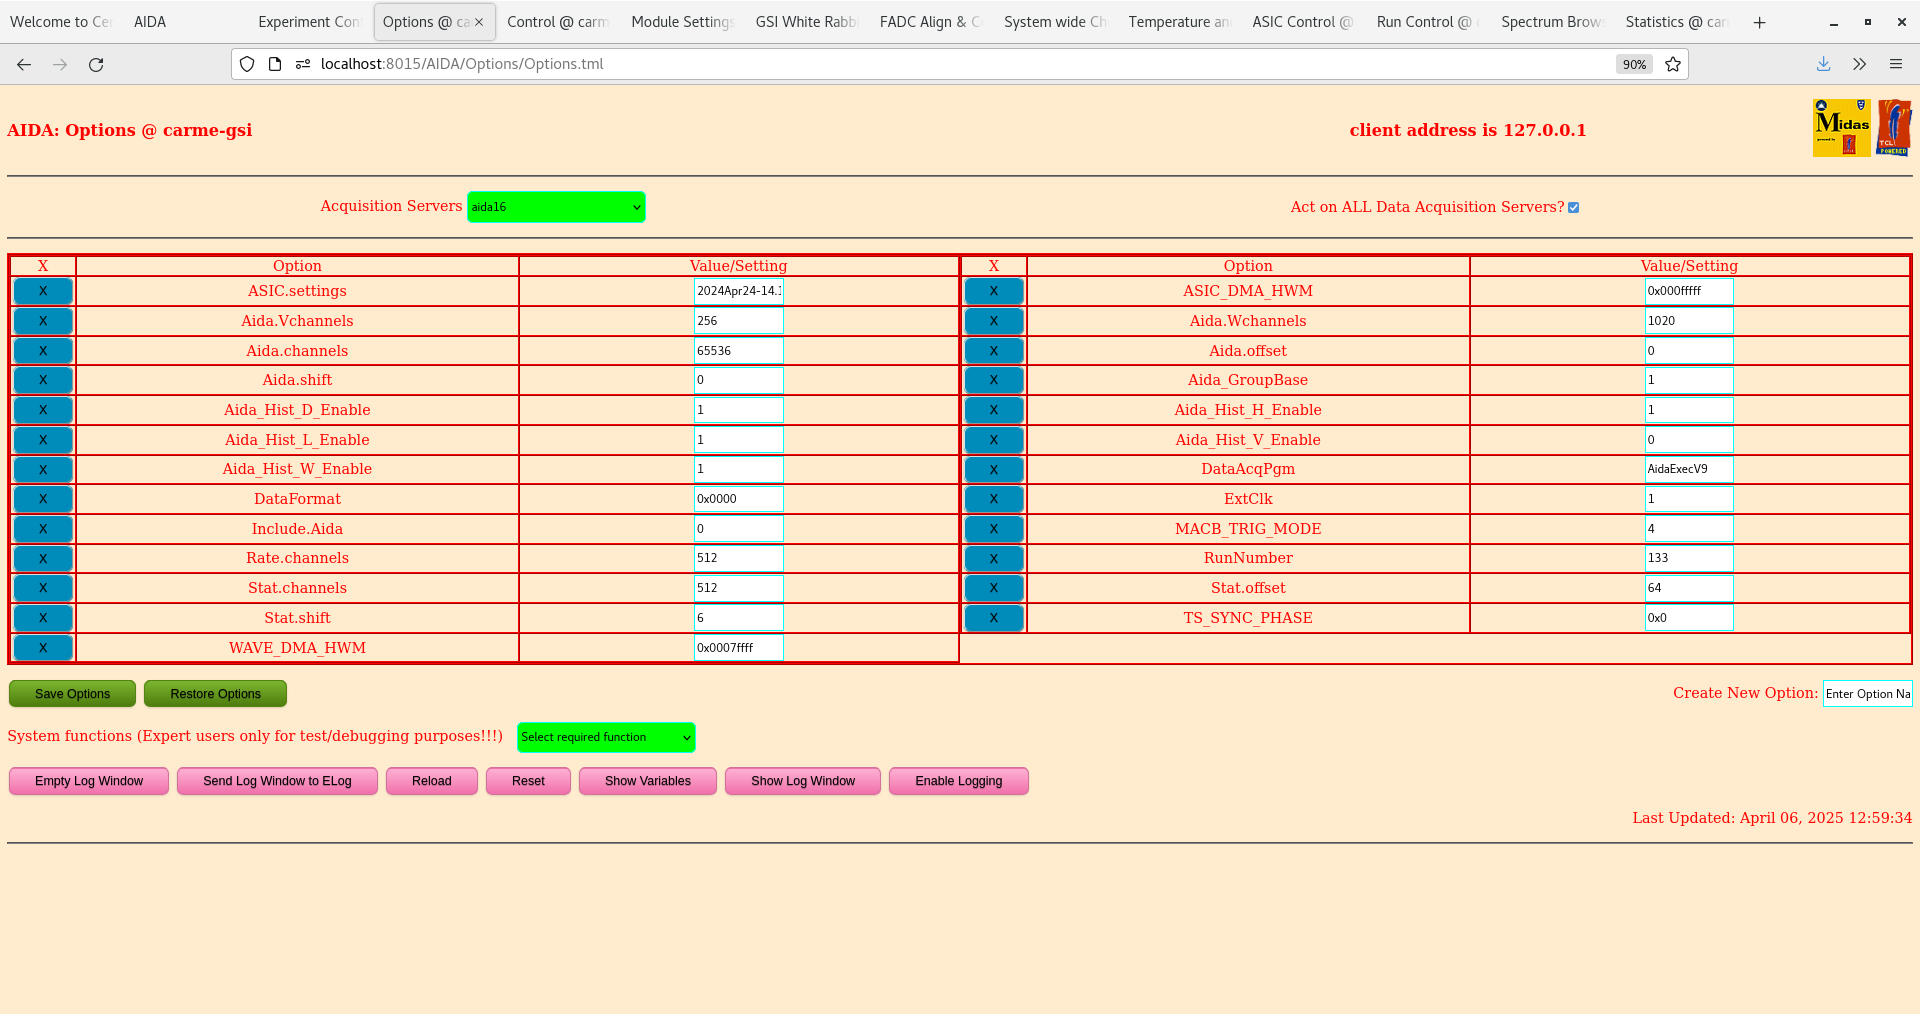
TD | Options DB reconstructed |
Options directory corrupted unable to change Options settings per https://elog.ph.ed.ac.uk/CARME/664

Move old Options directory to Options.BAK-060425

Created new Options directory (777), aida01-aida16 sub directories (777) and populated using CONTENTS file from the old aida01 options (777)
All FEE64s will now use ASIC.settings 2024Apr24-14.14.03

[npg@carme-gsi ~]$ cd /MIDAS/DB/EXPERIMENTS/AIDA
[npg@carme-gsi AIDA]$ ls
2017Nov15-15.21.56  2019Dec19-16.19.51  2021Apr29-13-16-00  2024Feb08-15.59.09  CONTENTS        Options.311019         Options.BAK-060425  Options.PRISTINE         README
2018Aug21-13.17.09  2019Mar31-16.15.57  2022Jan31-11-52-00  2024Jan20-12.02.08  Histograms      Options.BACKUP180920   Options.BAK-130421  Options.PRISTINE_TRIPLE
2018Jun22-11.28.18  2019Oct31-13.24.23  2024Apr24-14.14.03  aida_check_db.sh    Options         Options.BACKUP190425   Options.Current     Options.WORKING
2018Sep06-14.38.28  2020Apr15-20.29.26  2024Feb05-10.22.28  aida_check_db.sh~   Options.220131  Options.BACKUPCorrupt  Options.Dec19       Options.WORKING.Old
[npg@carme-gsi AIDA]$ ls -lR Options
Options:
total 0
drwxrwxrwx. 2 npg npg 22 Apr  6 12:33 aida01
drwxrwxrwx. 2 npg npg 22 Apr  6 12:35 aida02
drwxrwxrwx. 2 npg npg 22 Apr  6 12:35 aida03
drwxrwxrwx. 2 npg npg 22 Apr  6 12:35 aida04
drwxrwxrwx. 2 npg npg 22 Apr  6 12:35 aida05
drwxrwxrwx. 2 npg npg 22 Apr  6 12:35 aida06
drwxrwxrwx. 2 npg npg 22 Apr  6 12:35 aida07
drwxrwxrwx. 2 npg npg 22 Apr  6 12:35 aida08
drwxrwxrwx. 2 npg npg 22 Apr  6 12:35 aida09
drwxrwxrwx. 2 npg npg 22 Apr  6 12:35 aida10
drwxrwxrwx. 2 npg npg 22 Apr  6 12:35 aida11
drwxrwxrwx. 2 npg npg 22 Apr  6 12:35 aida12
drwxrwxrwx. 2 npg npg 22 Apr  6 12:35 aida13
drwxrwxrwx. 2 npg npg 22 Apr  6 12:35 aida14
drwxrwxrwx. 2 npg npg 22 Apr  6 12:35 aida15
drwxrwxrwx. 2 npg npg 22 Apr  6 12:35 aida16

Options/aida01:
total 4
-rwxrwxrwx. 1 npg npg 1027 Apr  6 12:33 CONTENTS

Options/aida02:
total 4
-rwxrwxr-x. 1 npg npg 1027 Apr  6 12:35 CONTENTS

Options/aida03:
total 4
-rwxrwxr-x. 1 npg npg 1027 Apr  6 12:35 CONTENTS

Options/aida04:
total 4
-rwxrwxr-x. 1 npg npg 1027 Apr  6 12:35 CONTENTS

Options/aida05:
total 4
-rwxrwxr-x. 1 npg npg 1027 Apr  6 12:35 CONTENTS

Options/aida06:
total 4
-rwxrwxr-x. 1 npg npg 1027 Apr  6 12:35 CONTENTS

Options/aida07:
total 4
-rwxrwxr-x. 1 npg npg 1027 Apr  6 12:35 CONTENTS

Options/aida08:
total 4
-rwxrwxr-x. 1 npg npg 1027 Apr  6 12:35 CONTENTS

Options/aida09:
total 4
-rwxrwxr-x. 1 npg npg 1027 Apr  6 12:35 CONTENTS

Options/aida10:
total 4
-rwxrwxr-x. 1 npg npg 1027 Apr  6 12:35 CONTENTS

Options/aida11:
total 4
-rwxrwxr-x. 1 npg npg 1027 Apr  6 12:35 CONTENTS

Options/aida12:
total 4
-rwxrwxr-x. 1 npg npg 1027 Apr  6 12:35 CONTENTS

Options/aida13:
total 4
-rwxrwxr-x. 1 npg npg 1027 Apr  6 12:35 CONTENTS

Options/aida14:
total 4
-rwxrwxr-x. 1 npg npg 1027 Apr  6 12:35 CONTENTS

Options/aida15:
total 4
-rwxrwxr-x. 1 npg npg 1027 Apr  6 12:35 CONTENTS

Options/aida16:
total 4
-rwxrwxr-x. 1 npg npg 1027 Apr  6 12:35 CONTENTS
[npg@carme-gsi AIDA]$ ls
2017Nov15-15.21.56  2019Dec19-16.19.51  2021Apr29-13-16-00  2024Feb08-15.59.09  CONTENTS        Options.311019         Options.BAK-060425  Options.PRISTINE         README
2018Aug21-13.17.09  2019Mar31-16.15.57  2022Jan31-11-52-00  2024Jan20-12.02.08  Histograms      Options.BACKUP180920   Options.BAK-130421  Options.PRISTINE_TRIPLE
2018Jun22-11.28.18  2019Oct31-13.24.23  2024Apr24-14.14.03  aida_check_db.sh    Options         Options.BACKUP190425   Options.Current     Options.WORKING
2018Sep06-14.38.28  2020Apr15-20.29.26  2024Feb05-10.22.28  aida_check_db.sh~   Options.220131  Options.BACKUPCorrupt  Options.Dec19       Options.WORKING.Old
[npg@carme-gsi AIDA]$ ls -lR Options.BAK-060425
Options.BAK-060425:
total 0
drwxrwxr-x. 2 npg npg 22 Jan 31  2022 aida01
drwxrwxr-x. 2 npg npg 22 Jan 31  2022 aida02
drwxrwxr-x. 2 npg npg 22 Jan 31  2022 aida03
drwxrwxr-x. 2 npg npg 22 Jan 31  2022 aida04
drwxrwxr-x. 2 npg npg 22 Jan 31  2022 aida05
drwxrwxr-x. 2 npg npg 22 Jan 31  2022 aida06
drwxrwxr-x. 2 npg npg 22 Jan 31  2022 aida07
drwxrwxr-x. 2 npg npg 22 Jan 31  2022 aida08
drwxrwxr-x. 2 npg npg 22 Jan 18  2024 aida09
drwxrwxr-x. 2 npg npg 22 Jan 18  2024 aida10
drwxrwxr-x. 2 npg npg 22 Jan 18  2024 aida11
drwxrwxr-x. 2 npg npg 22 Jan 18  2024 aida12
drwxrwxr-x. 2 npg npg 22 Jan 18  2024 aida13
drwxrwxr-x. 2 npg npg 22 Jan 18  2024 aida14
drwxrwxr-x. 2 npg npg 22 Jan 18  2024 aida15
drwxrwxr-x. 2 npg npg 22 Jan 18  2024 aida16

Options.BAK-060425/aida01:
total 4
-rwxrwxr-x. 1 npg npg 1027 Apr  5 18:05 CONTENTS

Options.BAK-060425/aida02:
total 4
-rwxrwxr-x. 1 npg npg 1026 Feb 19  2022 CONTENTS

Options.BAK-060425/aida03:
total 4
-rwxrwxr-x. 1 npg npg 1026 Jan 20  2024 CONTENTS

Options.BAK-060425/aida04:
total 4
-rwxrwxr-x. 1 npg npg 1026 Dec  1  2022 CONTENTS

Options.BAK-060425/aida05:
total 4
-rwxrwxr-x. 1 npg npg 1027 Nov 30  2022 CONTENTS

Options.BAK-060425/aida06:
total 4
-rwxrwxr-x. 1 npg npg 1026 Jan 20  2024 CONTENTS

Options.BAK-060425/aida07:
total 4
-rwxrwxr-x. 1 npg npg 1026 Jan 31  2022 CONTENTS

Options.BAK-060425/aida08:
total 4
-rwxrwxr-x. 1 npg npg 1026 Feb  4  2022 CONTENTS

Options.BAK-060425/aida09:
total 4
-rwxrwxr-x. 1 npg npg 1026 Jan 18  2024 CONTENTS

Options.BAK-060425/aida10:
total 4
-rwxrwxr-x. 1 npg npg 1026 Feb  1  2024 CONTENTS

Options.BAK-060425/aida11:
total 4
-rwxrwxr-x. 1 npg npg 1026 Feb  3  2024 CONTENTS

Options.BAK-060425/aida12:
total 4
-rwxrwxr-x. 1 npg npg 1026 Jan 18  2024 CONTENTS

Options.BAK-060425/aida13:
total 4
-rwxrwxr-x. 1 npg npg 1026 Jan 18  2024 CONTENTS

Options.BAK-060425/aida14:
total 4
-rwxrwxr-x. 1 npg npg 1026 Feb  8  2024 CONTENTS

Options.BAK-060425/aida15:
total 4
-rwxrwxr-x. 1 npg npg 1027 Feb  3  2024 CONTENTS

Options.BAK-060425/aida16:
total 4
-rwxrwxr-x. 1 npg npg 1027 Jun 19  2024 CONTENTS

[npg@carme-gsi AIDA]$ cat Options/aida01/CONTENTS
Index string Stat.offset&&Aida_Hist_W_Enable&&TS_SYNC_PHASE&&ExtClk&&Aida.shift&&MACB_TRIG_MODE&&Aida.offset&&RunNumber&&Aida_GroupBase&&Rate.channels&&Stat.channels&&Aida.Vchannels&&ASIC.settings&&Aida_Hist_D_Enable&&WAVE_DMA_HWM&&Stat.shift&&Aida.Wchannels&&Aida_Hist_V_Enable&&Include.Aida&&Aida.channels&&DataAcqPgm&&Aida_Hist_H_Enable&&DataFormat&&ASIC_DMA_HWM&&Aida_Hist_L_Enable
Stat.offset string 64
Aida_Hist_W_Enable string 1
Aida.shift string 0
TS_SYNC_PHASE string 0x0
ExtClk string 1
Aida.offset string 0
MACB_TRIG_MODE string 4
RunNumber string 133
Rate.channels string 512
Aida_GroupBase string 1
Stat.channels string 512
Aida_Hist_D_Enable string 1
ASIC.settings string 2024Apr24-14.14.03
Aida.Vchannels string 256
WAVE_DMA_HWM string 0x0007ffff
Aida.Wchannels string 1020
Stat.shift string 6
Include.Aida string 0
Aida_Hist_V_Enable string 0
Aida.channels string 65536
DataFormat string 0x0000
DataAcqPgm string AidaExecV9
Aida_Hist_H_Enable string 1
ASIC_DMA_HWM string 0x000fffff
Aida_Hist_L_Enable string 1 |
| Attachment 1: Screenshot_from_2025-04-06_12-59-39.png
|
|