AIDA GELINA BRIKEN nToF CRIB ISOLDE CIRCE nTOFCapture DESPEC DTAS EDI_PSA 179Ta CARME StellarModelling DCF K40
  EDI_PSA  ELOG logo
Message ID: 14     Entry time: Tue Jun 1 15:19:40 2021
Author: CB 
Subject: 2021/R3_0 Analysis - 2 lines + power law 
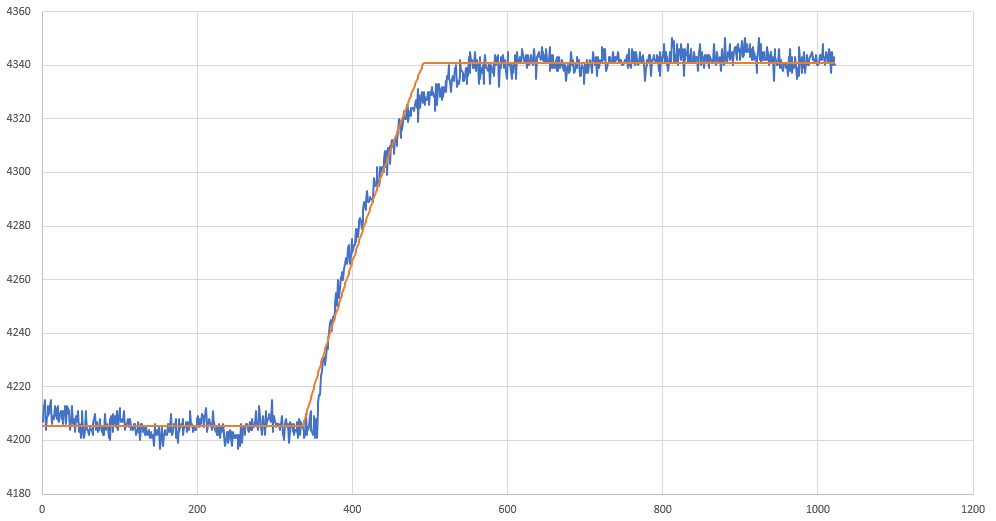
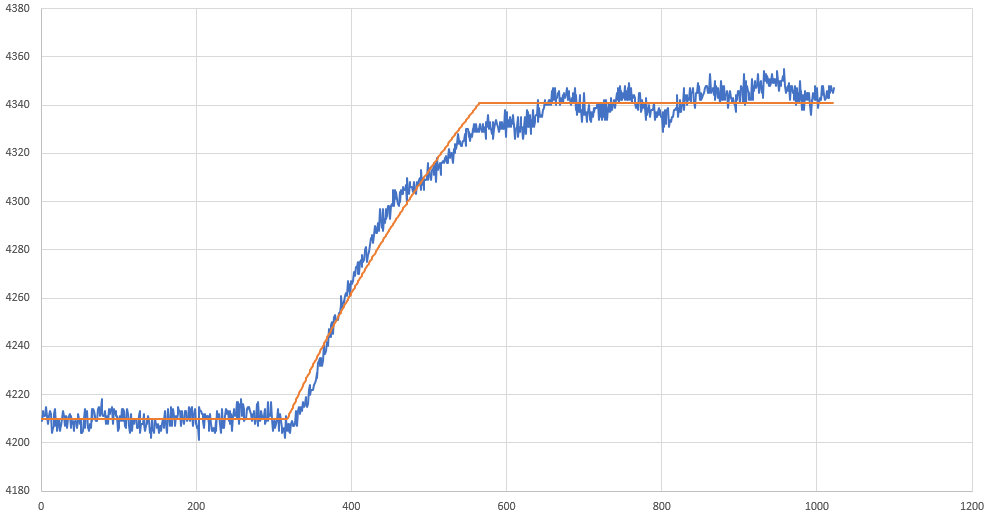
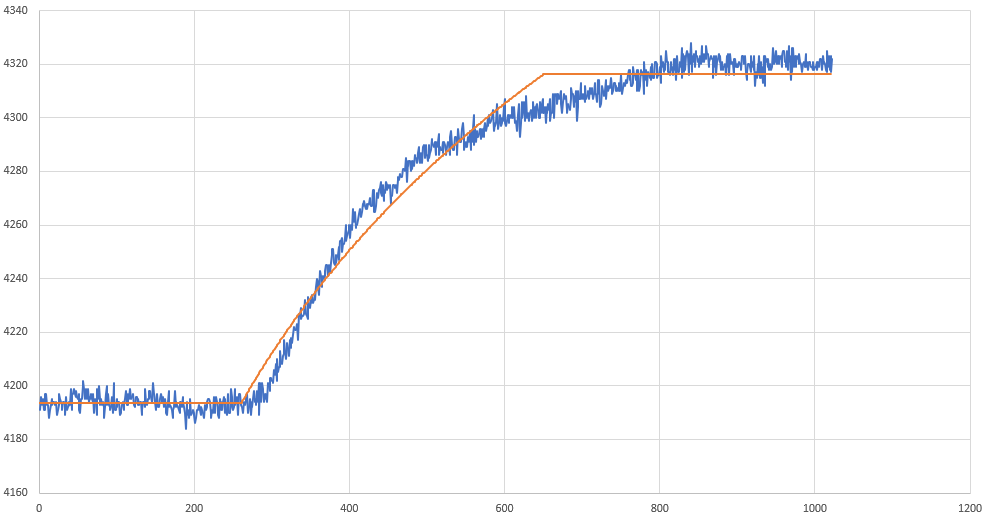
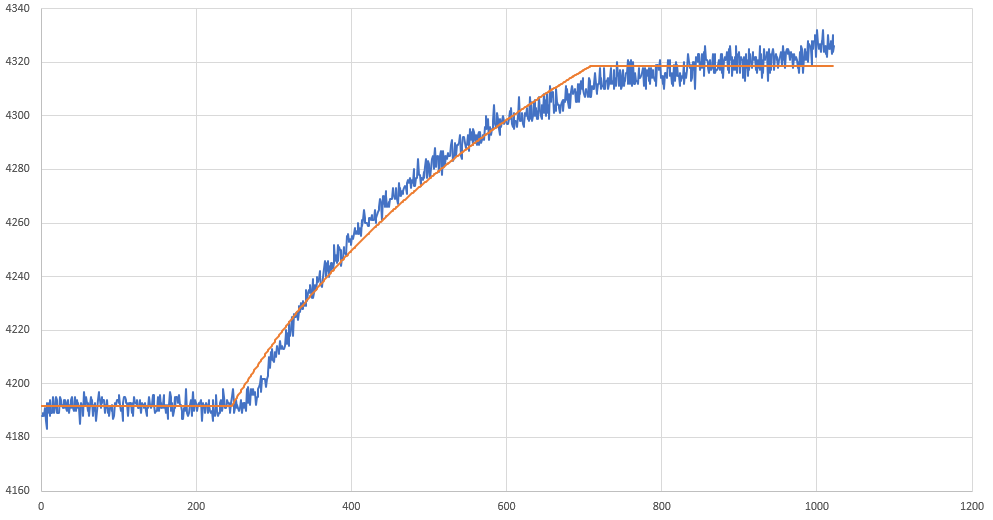
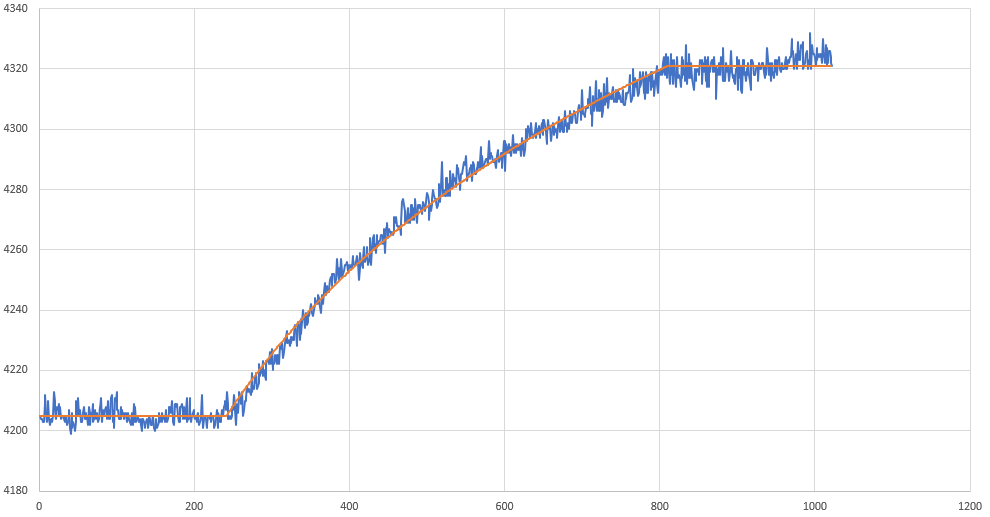
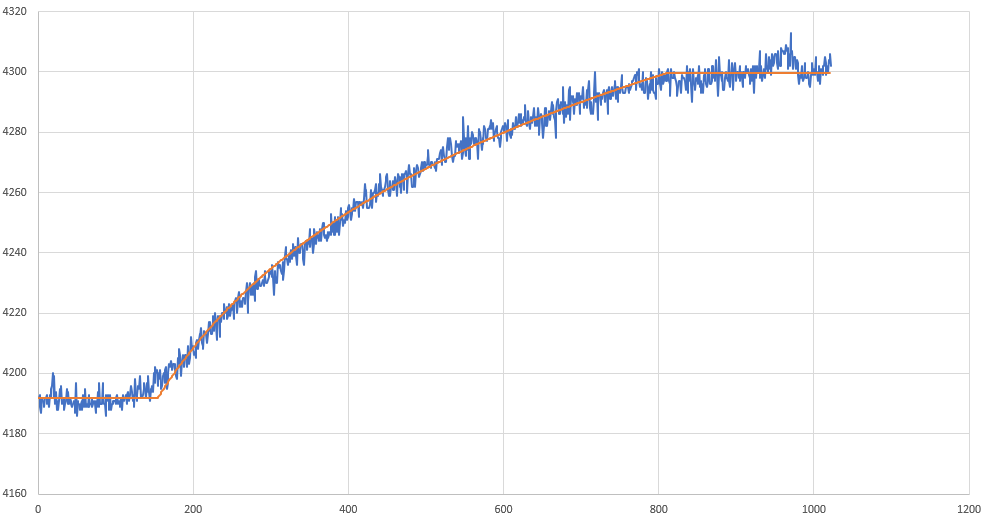
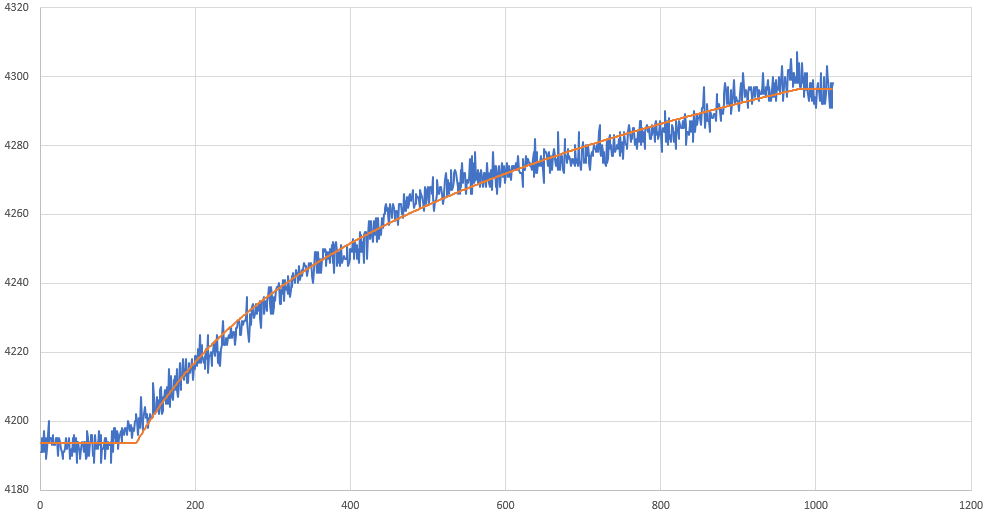
Fit: line + power law + line
Free parameters: 2x boundary points between lines
Algorithm: Nelder-Mead, 10 iterations. (centroid correct)

Attach 1 - height (difference between intercepts)

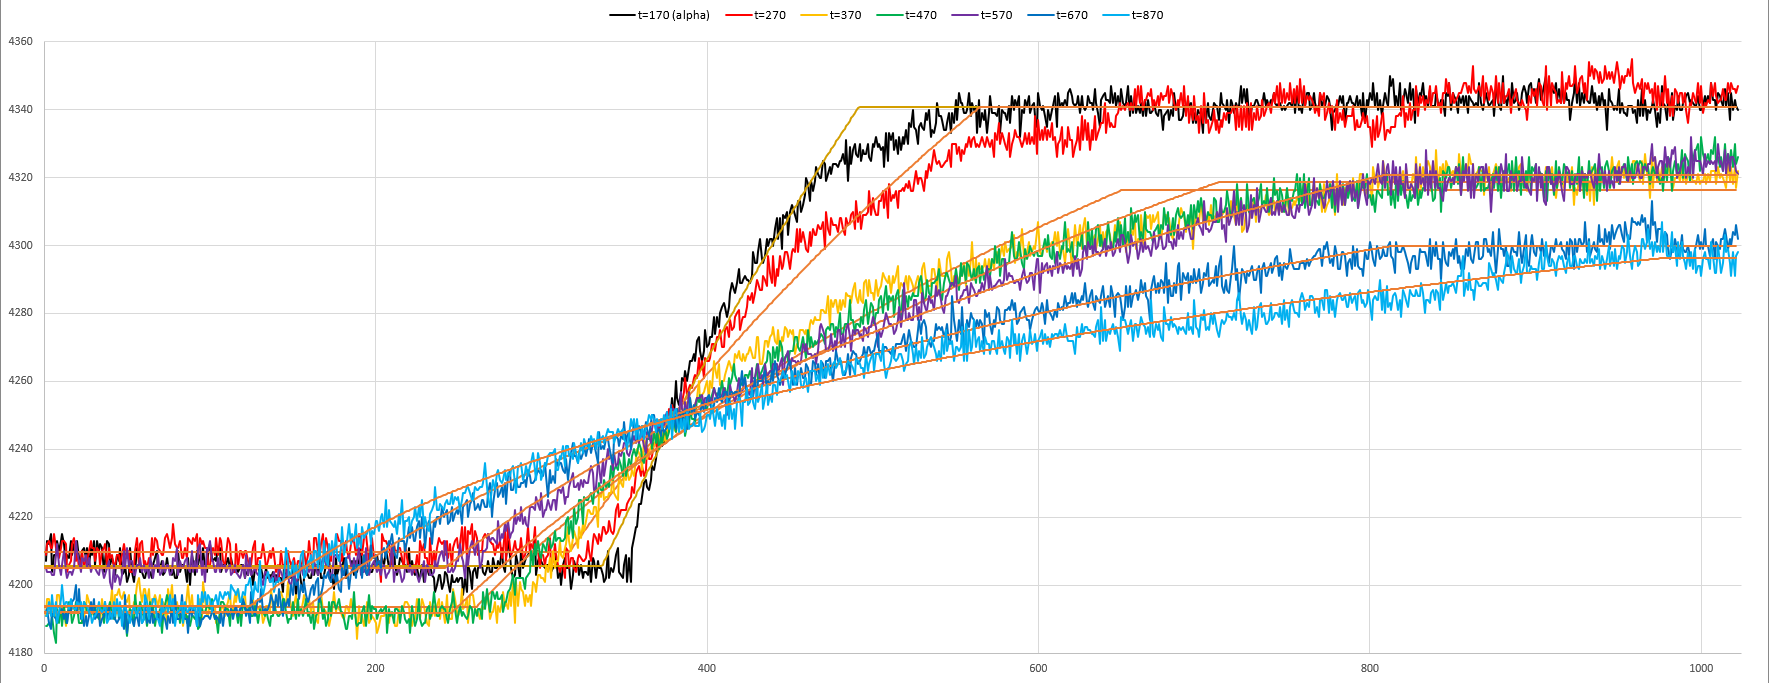
Attach 2-8 - Signals with H~110, different t values (see filenames). 
Note t=370 and t=870 show discontinuities in the middle of the rising front. Pick-up?

Attach 9 - Comparison of the above. Note t=370-570 look visually similar in spite of very different fit results. 
Pulser *not* shown

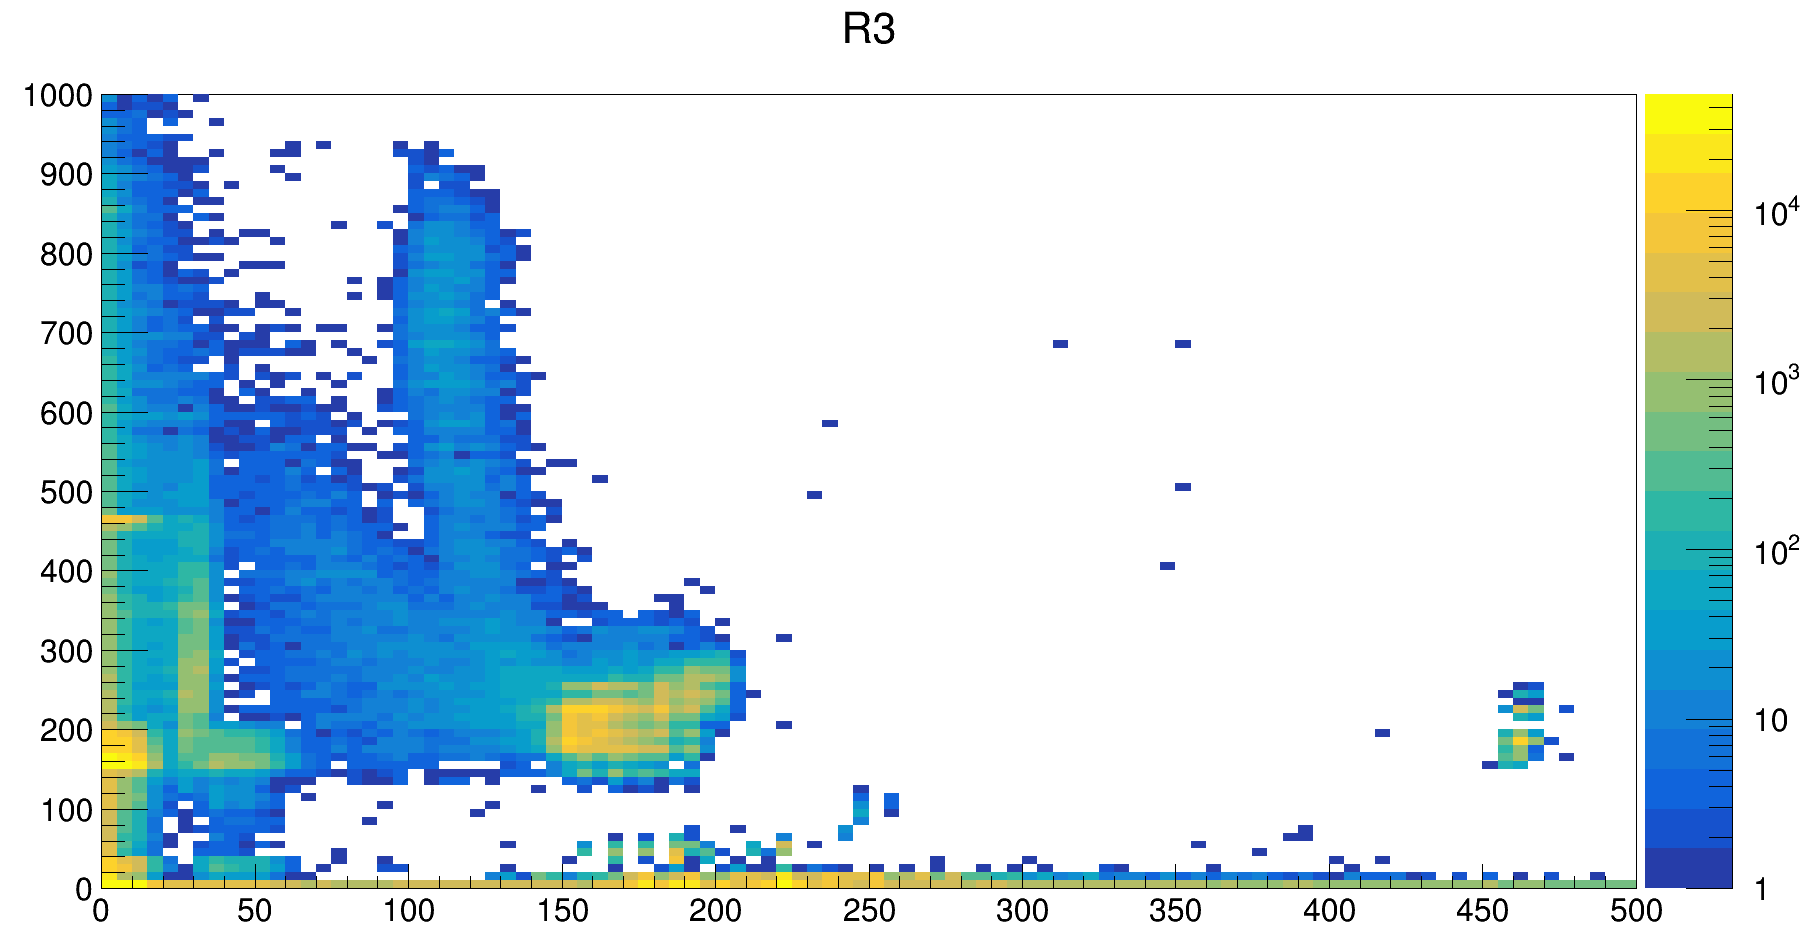
Attach 10 - Heat map

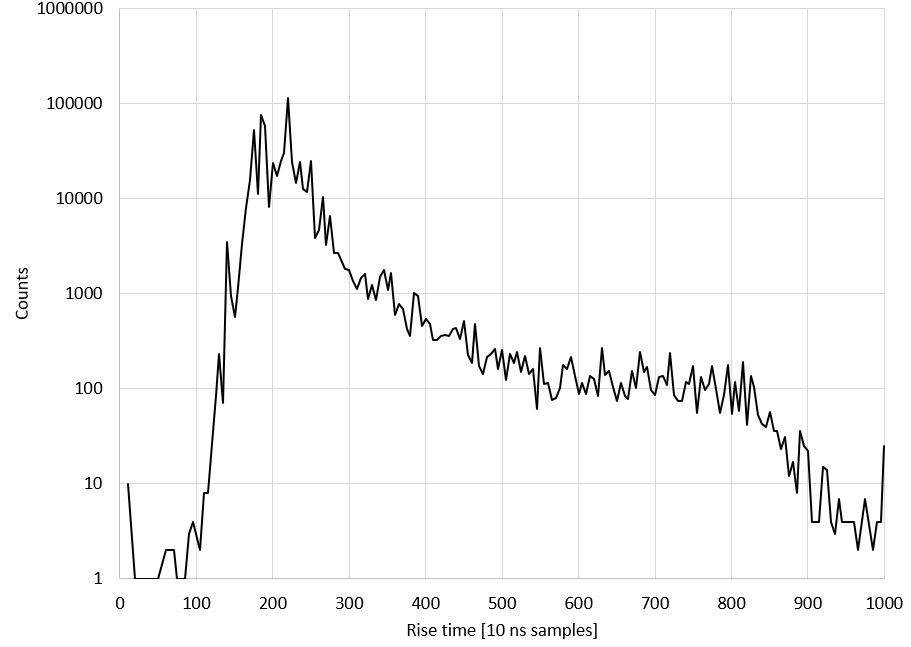
Attach 11 - rise times (x-diff between boundary points), for H>20 (no noise)
Attachment 1: R3pow_H.png  69 kB  Uploaded Tue Jun 1 16:23:25 2021  | Hide | Hide all
R3pow_H.png
Attachment 2: H135t170.png  37 kB  Uploaded Tue Jun 1 16:39:07 2021  | Hide | Hide all
H135t170.png
Attachment 3: H131t270.png  36 kB  Uploaded Tue Jun 1 16:39:10 2021  | Hide | Hide all
H131t270.png
Attachment 4: H122t370.png  38 kB  Uploaded Tue Jun 1 16:39:12 2021  | Hide | Hide all
H122t370.png
Attachment 5: H127t470.png  38 kB  Uploaded Tue Jun 1 16:39:14 2021  | Hide | Hide all
H127t470.png
Attachment 6: H115t570.png  39 kB  Uploaded Tue Jun 1 16:39:16 2021  | Hide | Hide all
H115t570.png
Attachment 7: H107t670.png  39 kB  Uploaded Tue Jun 1 16:39:19 2021  | Hide | Hide all
H107t670.png
Attachment 8: H102t870.png  43 kB  Uploaded Tue Jun 1 16:39:21 2021  | Hide | Hide all
H102t870.png
Attachment 9: Comparison.png  310 kB  Uploaded Tue Jun 1 16:39:26 2021  | Hide | Hide all
Comparison.png
Attachment 10: R3pow_heat.png  78 kB  Uploaded Tue Jun 1 16:48:21 2021  | Hide | Hide all
R3pow_heat.png
Attachment 11: R3pow_t.png  55 kB  Uploaded Tue Jun 1 16:51:55 2021  | Hide | Hide all
R3pow_t.png
ELOG V3.1.4-unknown