| |
ID |
Date |
Author |
Subject |
|
|
133
|
Mon Nov 7 14:17:23 2016 |
BRIKEN collaboration | Picture of shift schedule |
|
| Attachment 1: IMG_20161107_183105.jpg
|

|
|
|
43
|
Tue Jul 19 04:34:57 2016 |
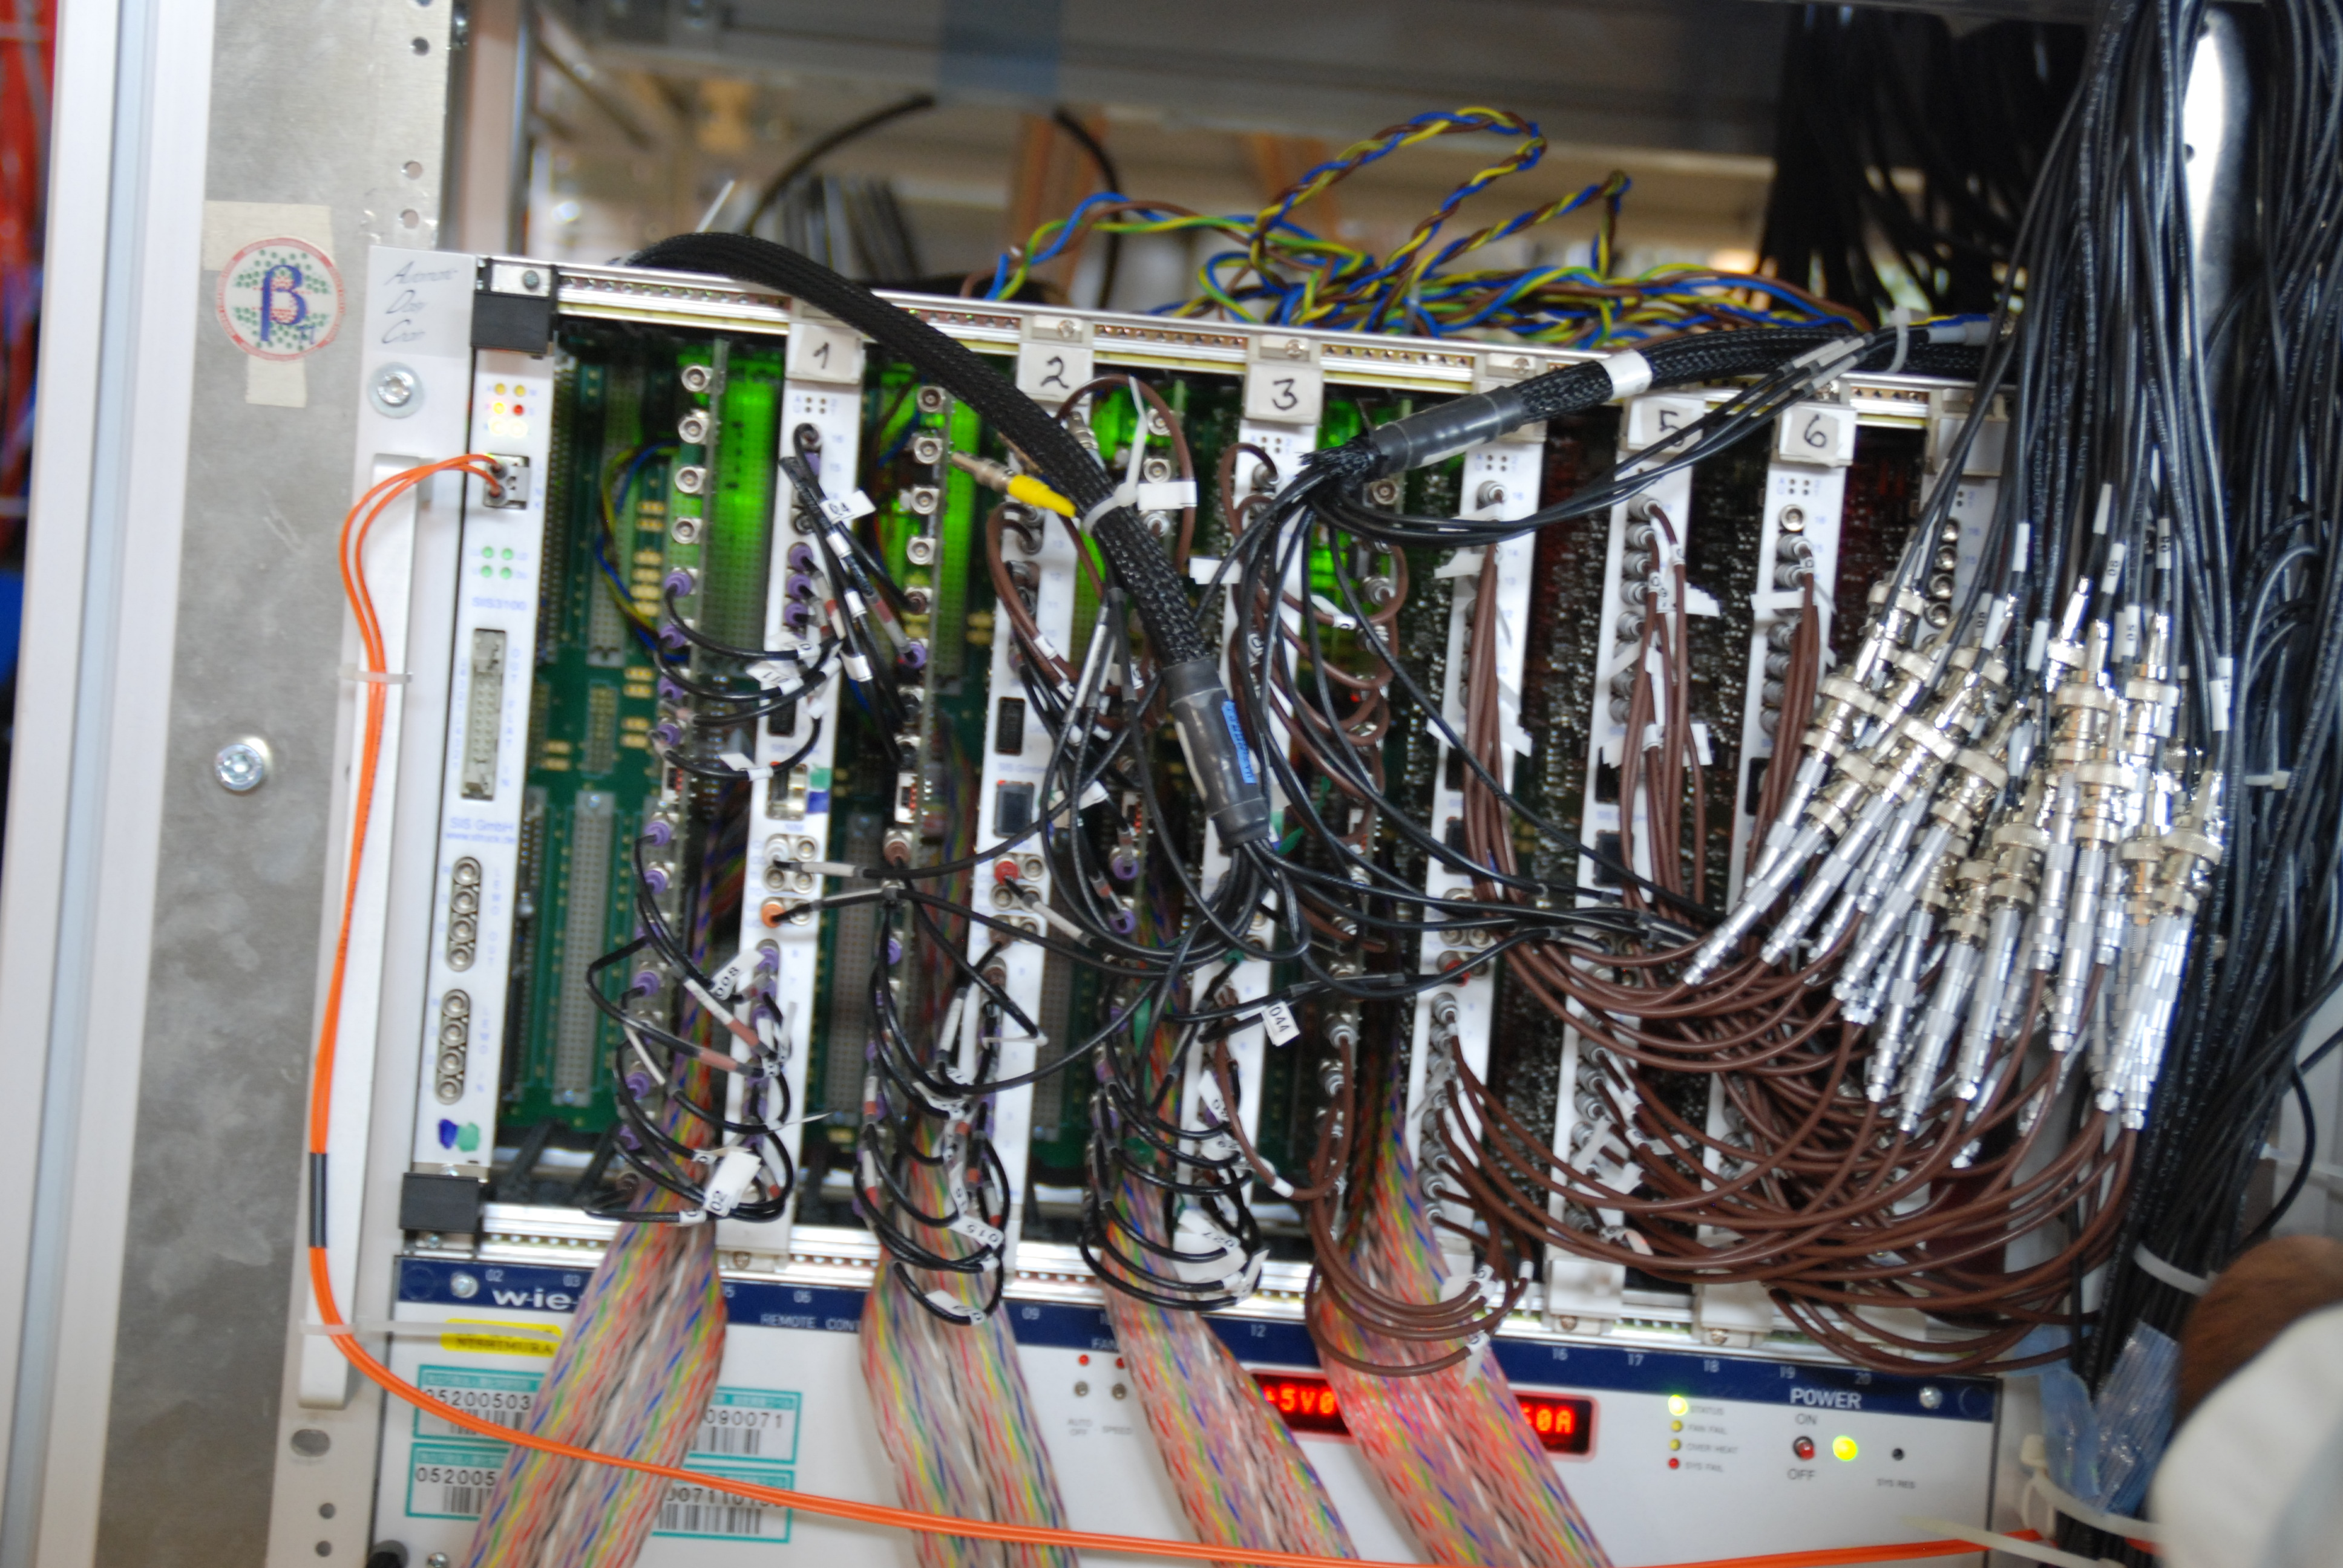
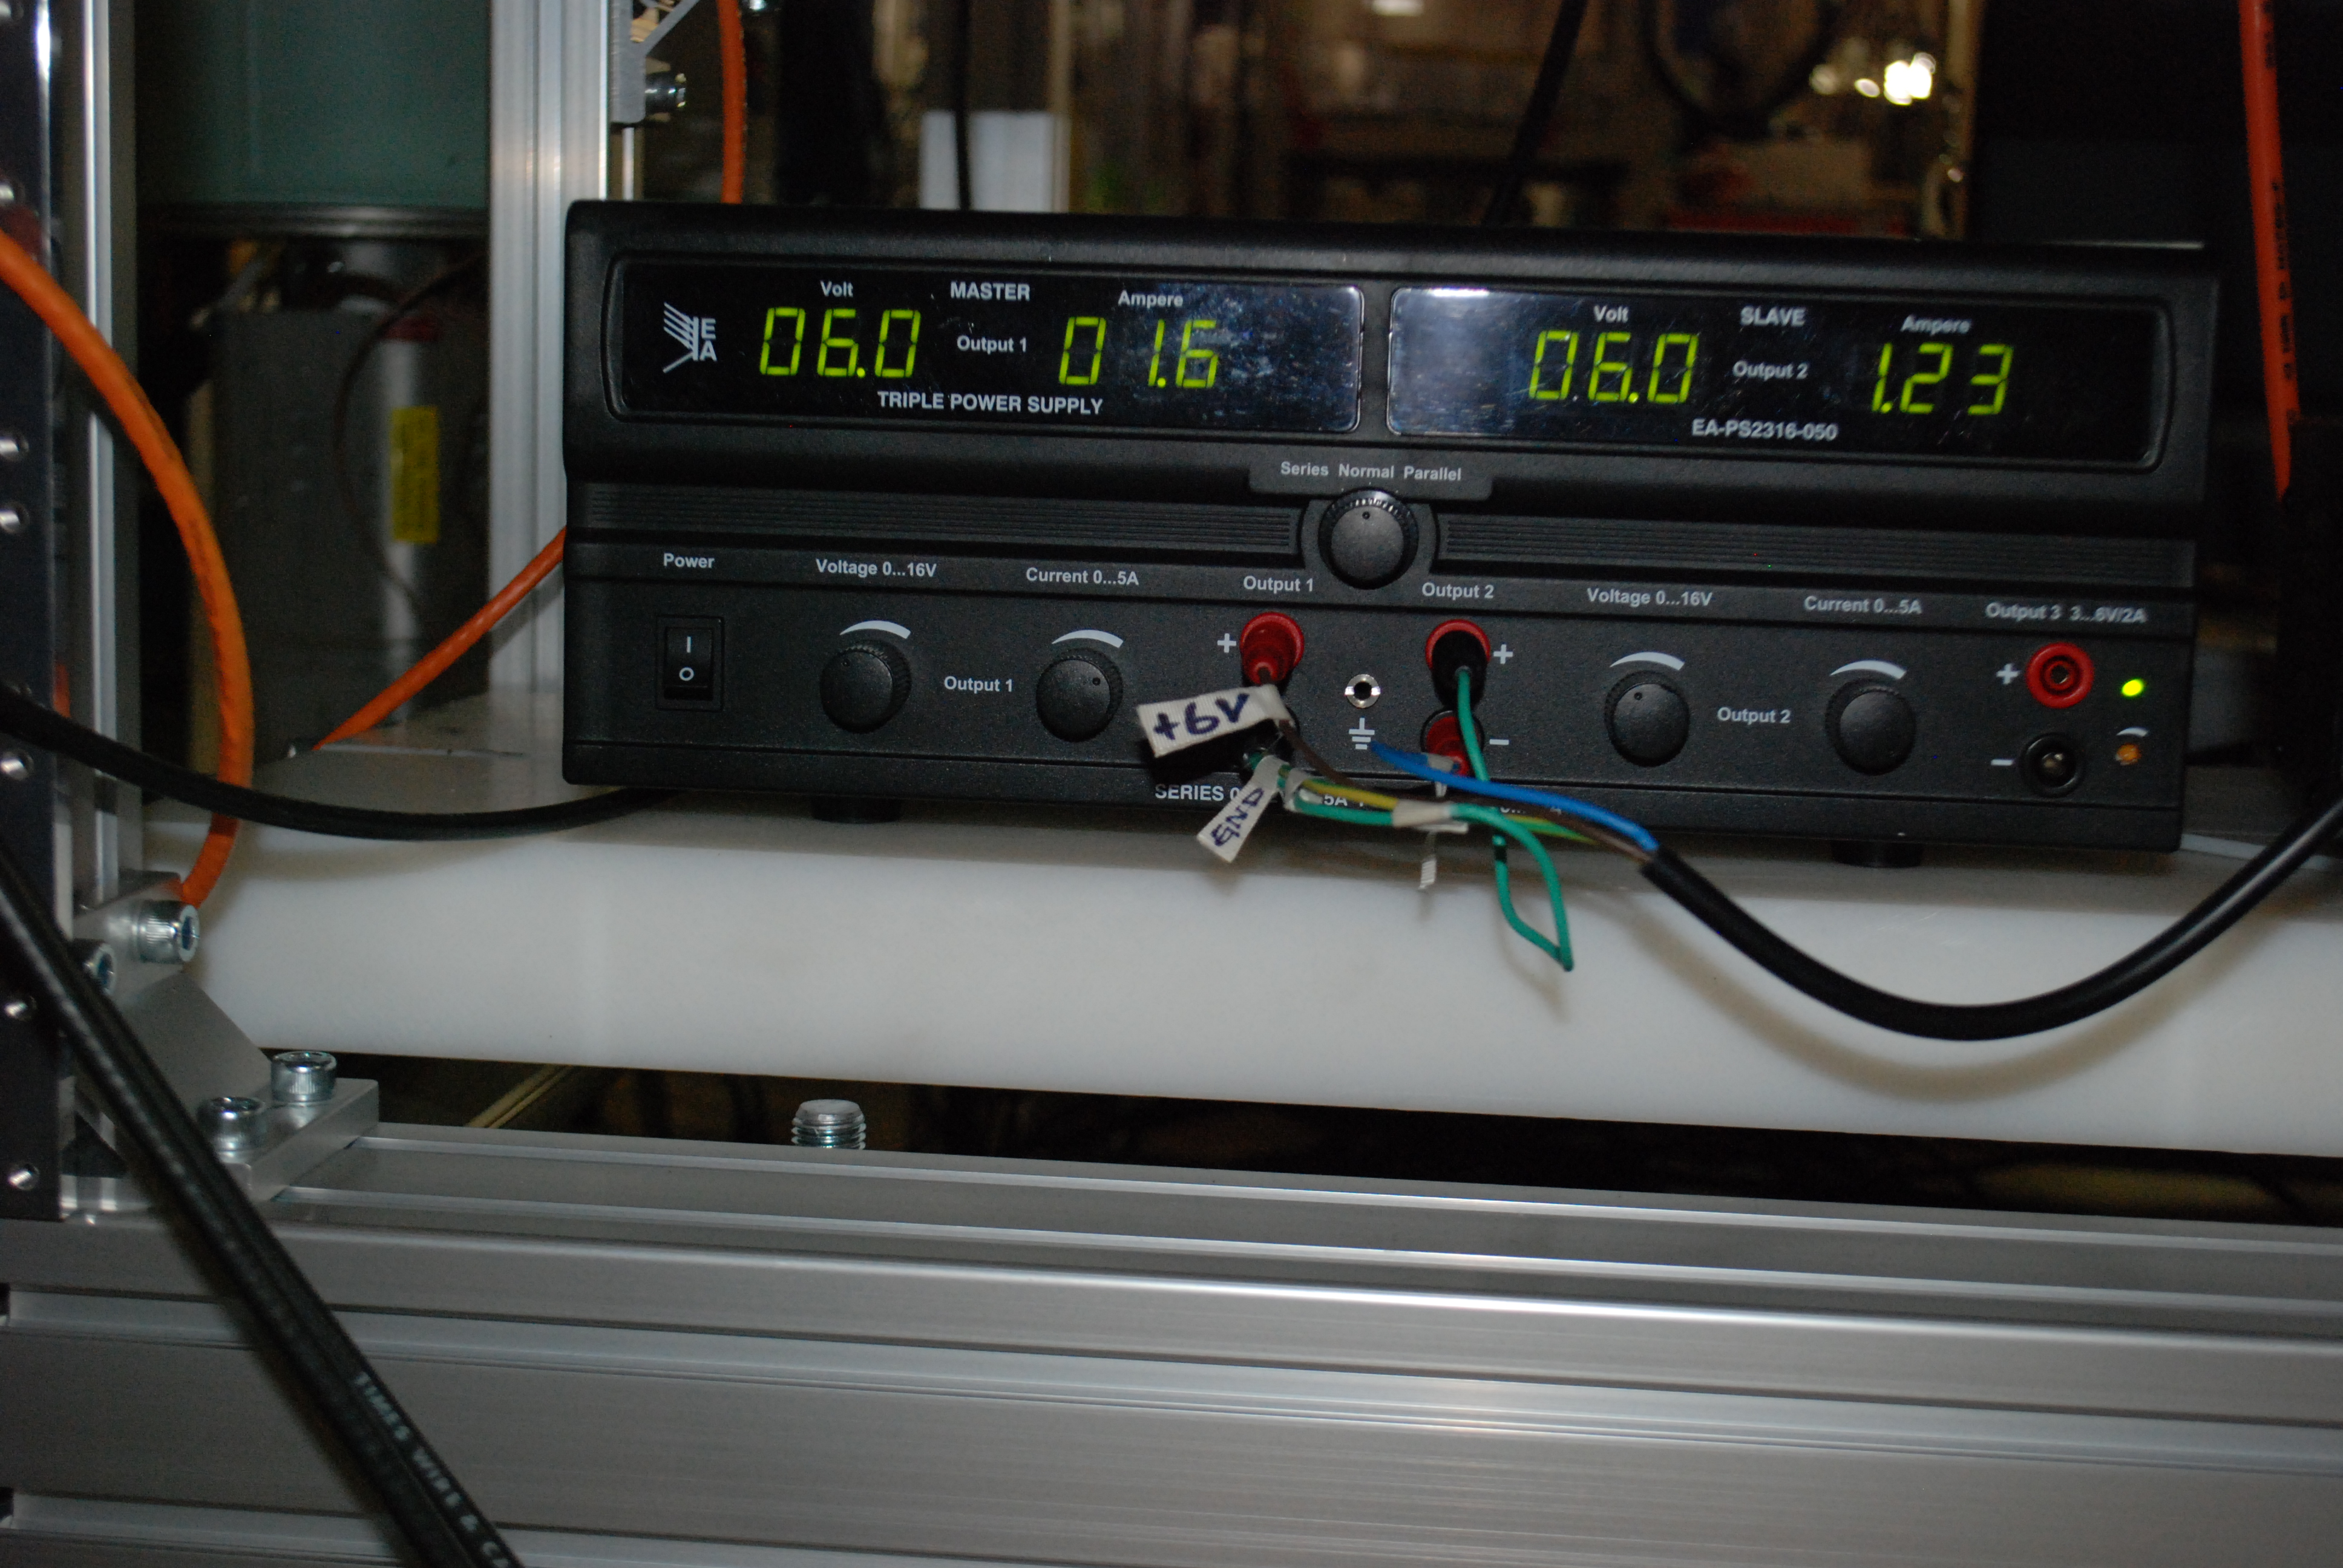
JL Tain A Tolosa R. Caballero A. Tarifeņo J. Agramunt | Photos of the electronics |
Racks, crates, rear part of the preamps and matrix with all tubes. |
| Attachment 1: DSC_0034.JPG
|

|
| Attachment 2: DSC_0022.JPG
|
|
| Attachment 3: DSC_0016.JPG
|

|
| Attachment 4: DSC_2483.JPG
|

|
| Attachment 5: DSC_2497.JPG
|

|
| Attachment 6: DSC_2511.JPG
|
|
| Attachment 7: DSC_2513.JPG
|

|
| Attachment 8: DSC_2514.JPG
|

|
| Attachment 9: DSC_2526.JPG
|

|
|
|
44
|
Tue Jul 19 11:54:03 2016 |
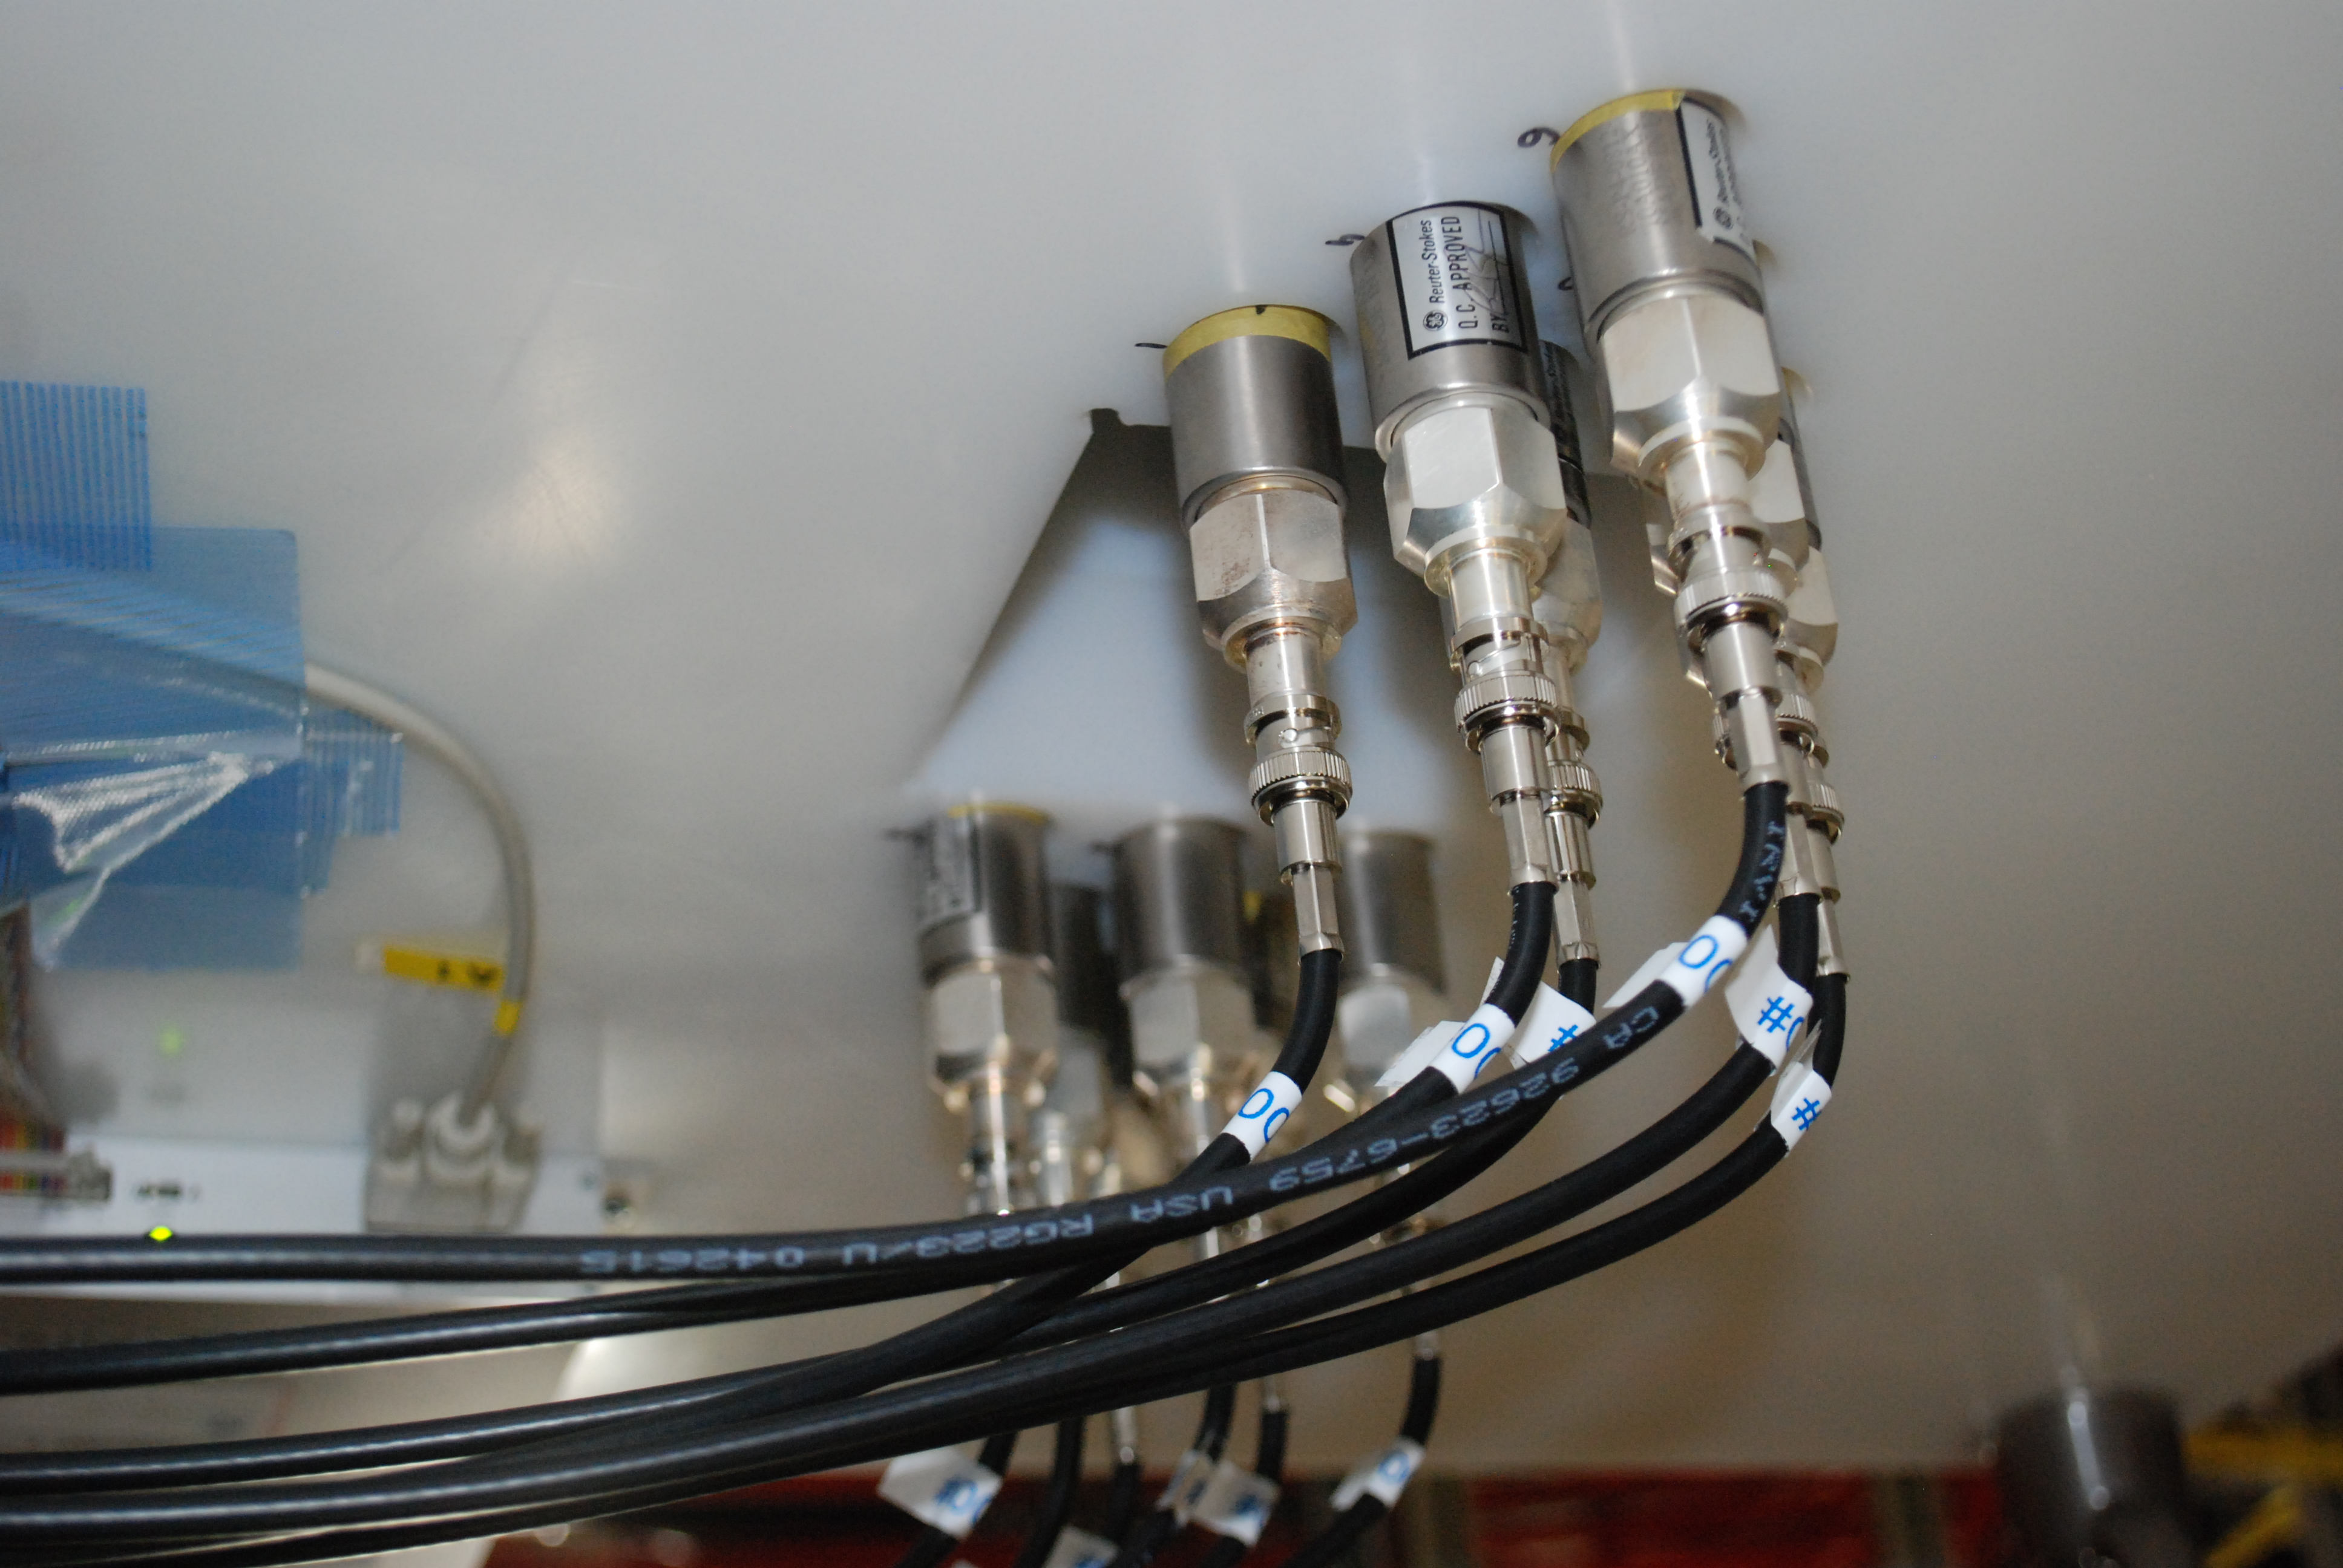
JL Tain A Tolosa R. Caballero A. Tarifeņo J. Agramunt | Photos of the AIDA insertion hole with the 3He tubes |
RIKEN tubes on the AIDA side with the SHV right angle connector will protrude
by ~95mm in the HYBRID configuration (with CLOVERS).
In the current AIDA DSSD configuration there are six detectors occupying 45-50mm
at a distance to center of the stack from the black plastic support of ~430mm.
The hole for the CLOVER is 110mm. The center of the hole is at 375mm from the
PE end.
This means that the center of the current stack is only ~15mm beyond the PE
in the CLOVER hole, so 1 or 2 of the DSSD will be partially shadowed
from the CLOVER detectors.
(This do not represent any problem from the neutron detector point of view) |
| Attachment 1: DSC_2520.JPG
|

|
| Attachment 2: DSC_2517.JPG
|
|
| Attachment 3: DSC_2515.JPG
|

|
|
|
13
|
Sun May 3 10:07:25 2015 |
J.L. Tain, J. Agramunt, G. Kiss | Photos of new PE shielding |
Photos of the general arrangement and details of the new PE blocks |
| Attachment 1: 20150502_195020.jpg
|

|
| Attachment 2: 20150502_194340.jpg
|

|
| Attachment 3: 20150502_192253.jpg
|

|
|
|
122
|
Mon Nov 7 02:39:55 2016 |
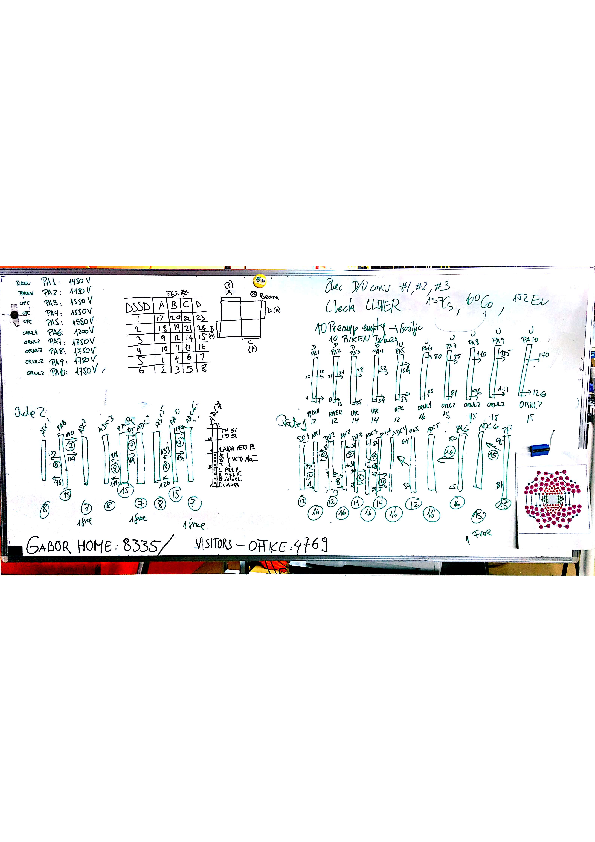
Ale | Photo of the white board with the details on the cards and preamps at B1F |
Photo of the white board with the details on the cards and preamps at B1F |
| Attachment 1: New_Doc_160_2.pdf
|
|
|
|
192
|
Fri Dec 9 05:25:26 2016 |
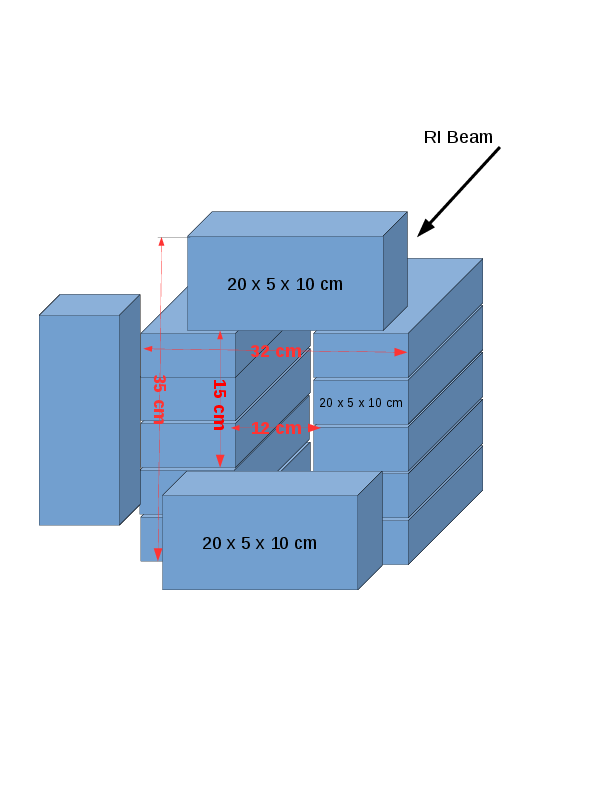
PV | Photo and schematic drawing of the Pb shielding in front of BRIKEN during Fallon experiment |
This Pb shielding structure is right behind the variable degrader |
| Attachment 1: Schematic_PbShielding_FallonRun.pdf
|
|
| Attachment 2: IMG_1414.JPG
|

|
|
|
419
|
Thu Nov 22 07:01:36 2018 |
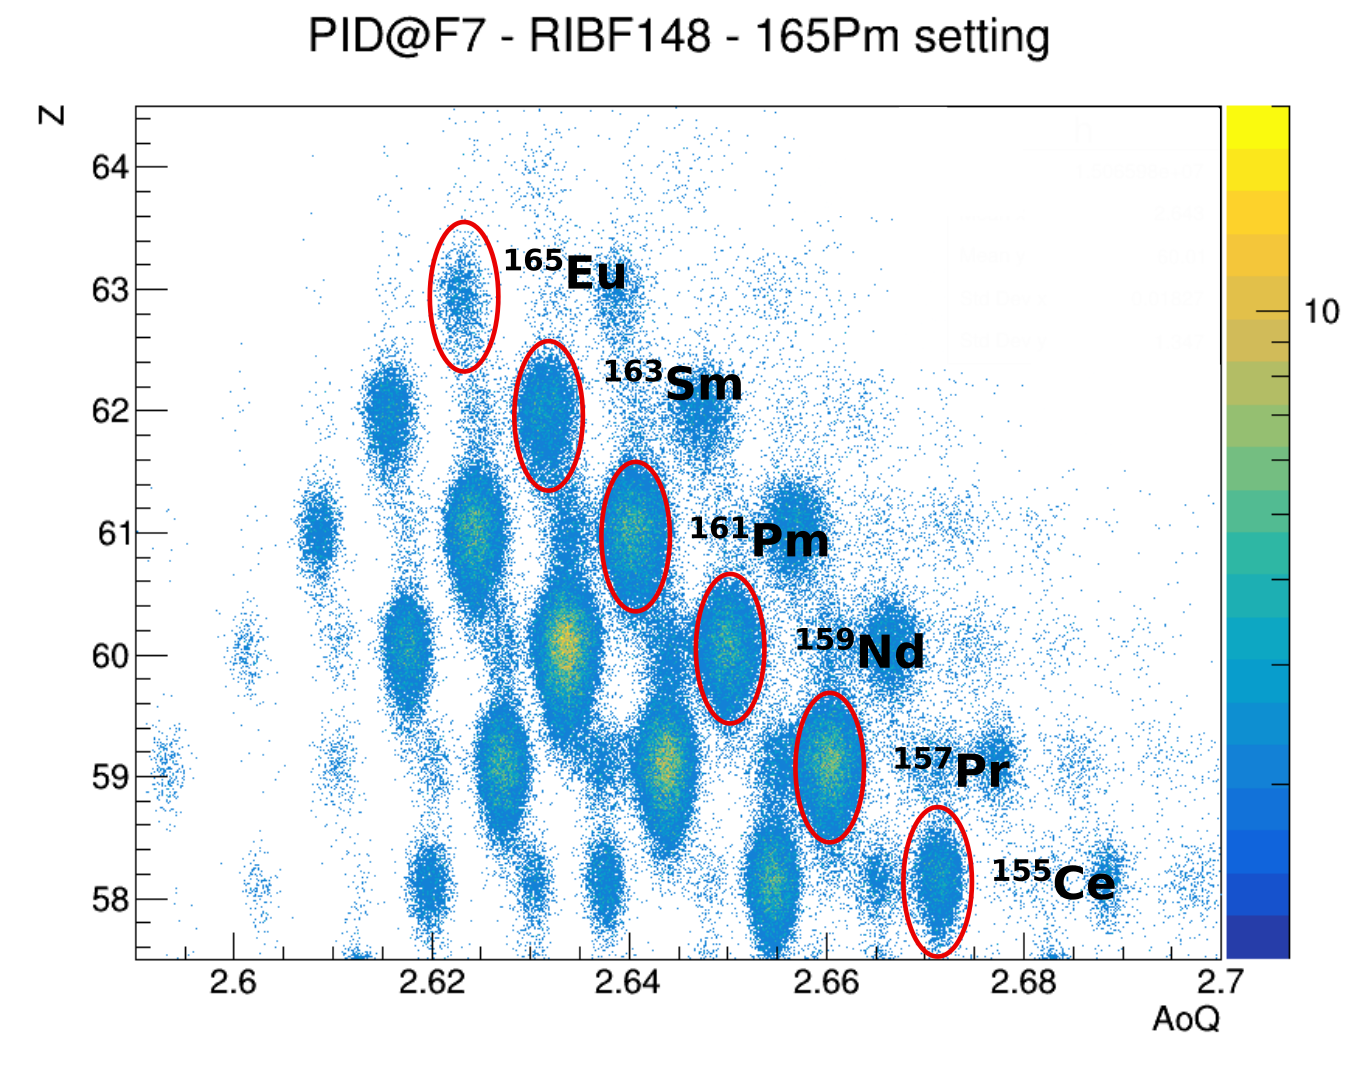
AT | PID high mass seting (165Pm) - RIBF148 |
PID plot for the high mass setting (165Pm), run 2018, rare earth peak experiment.
Partial statistics (~30h) from identification at F7.
Please use for internal reports about the BRIKEN activities. |
| Attachment 1: F7pid_RIBF148_165PmSetting_labels.png
|
|
|
|
121
|
Sun Nov 6 23:35:42 2016 |
Tain et al. | Overnight measurement: Ca isotopes |
First 50,49,48Ca beam and then 47,46,45Ca beam
C-6mm IN and OUT

New Configuration file: 161107Conf_BrikenFull.xlsx

Start: 00:43
Stop: 08:33
Tmeas:12883.1 s


ROOT file: 161107_0833_Overnight.root

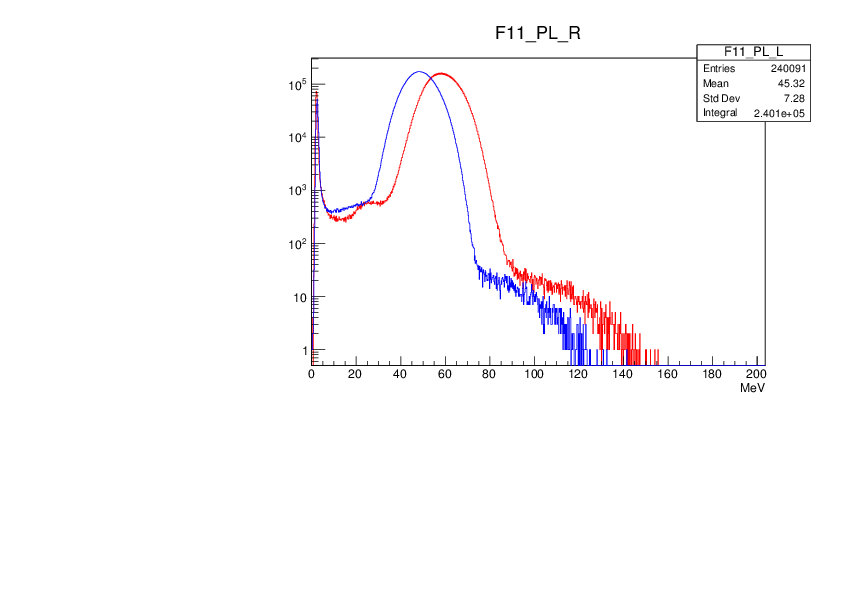
There is a change of gain for F11_PL_R and F11_PL_L

Rates:
F11R: 1150 cps / 950 cps
BRIKEN: 70->40 cps / 45->25 cps
VPLT: 34->12 cps / 34->12 cps
VPLB: 6->2 cps / 6->2 cps

Counts:
RateF11R: 1.41342e+07
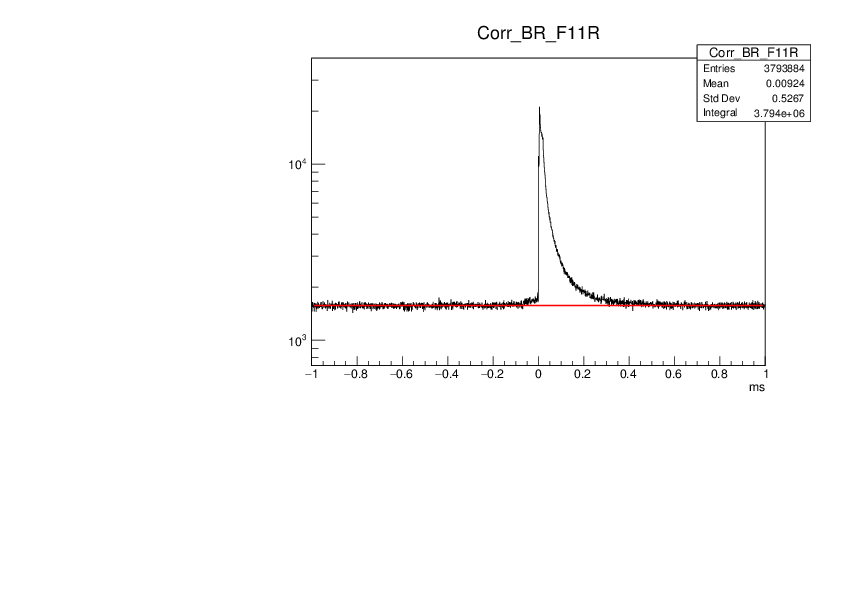
RateBRIKEN: 697082. (4.9 neutrons/100 particles)
Corr_BR_F11R: 632710 (91%)
Estimated background: 5153.24
RateVPLT: 376233.
Corr_BR_VPLT: 213977 (315) |
| Attachment 1: 161107_0833_Overnight_Rates.pdf
|

|
| Attachment 2: 161107_0833_Overnight_F11.pdf
|
|
| Attachment 3: 161107_0833_Overnight_CorrBRF11R.pdf
|
|
|
|
117
|
Sun Nov 6 03:12:55 2016 |
Alvaro,Jorge | Overnight measurement |
Measurement during beam production
and measurement with F7 CH2 out,
F11 C-tar in/out, F7 CH2 in C-target out/in

START: 02:45
STOP: 12:47

ROOT file: 161106_1247_Overnight.root |
|
|
173
|
Sat Nov 26 09:31:05 2016 |
Gabor Kiss, Ariel Tarifeno, Alvaro Tolosa | Output signals from G7Red |
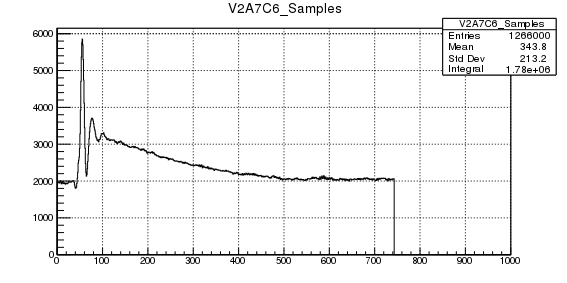
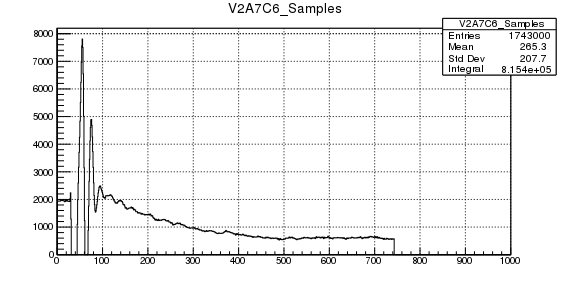
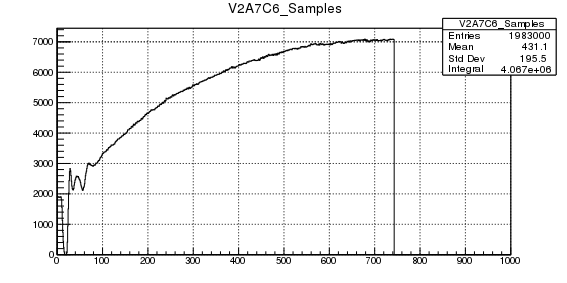
Preamplifier of crystal G7Red was replaced.
Output signals from G7Red are weird.

Several screen-shots of the signal are attached. The time calibration factor is 20ns/sample. |
| Attachment 1: G7red_01.svg
|
|
| Attachment 2: 02.svg
|

|
| Attachment 3: 03.svg
|
|
| Attachment 4: 06.svg
|
|
|
|
188
|
Mon Nov 28 10:48:21 2016 |
JLT | Online analysis |
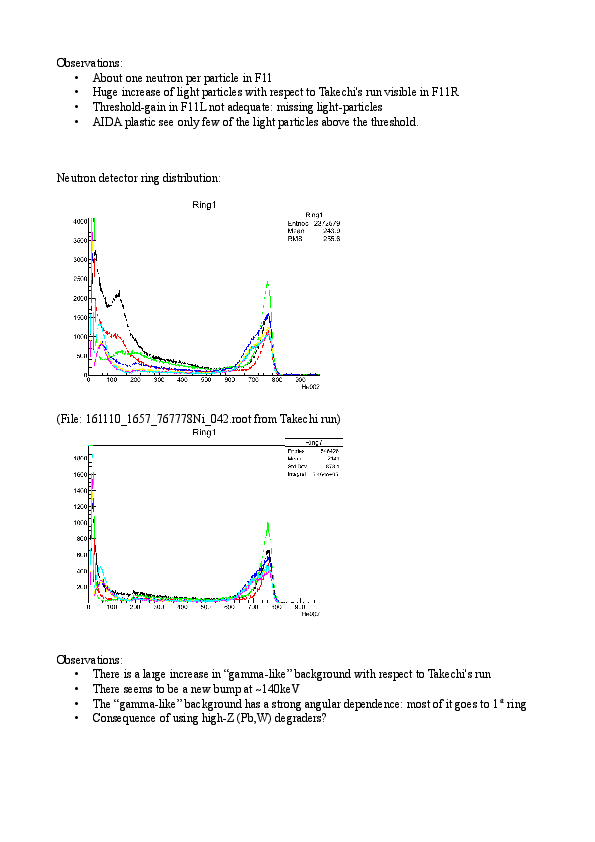
Comparison of current spectra with spectra from Takechi's run

(See attachment) |
| Attachment 1: analysis-271116.pdf
|


|
|
|
9
|
Mon Apr 27 10:18:21 2015 |
K.Gabor S.Nishimura J.Agramunt | ORNL 3He tube at RIKEN |
|
| Attachment 1: photo-3.JPG
|

|
|
|
352
|
Thu Oct 26 09:01:53 2017 |
BCR | Number of Counts vs Expected Efficiency for Proposals |
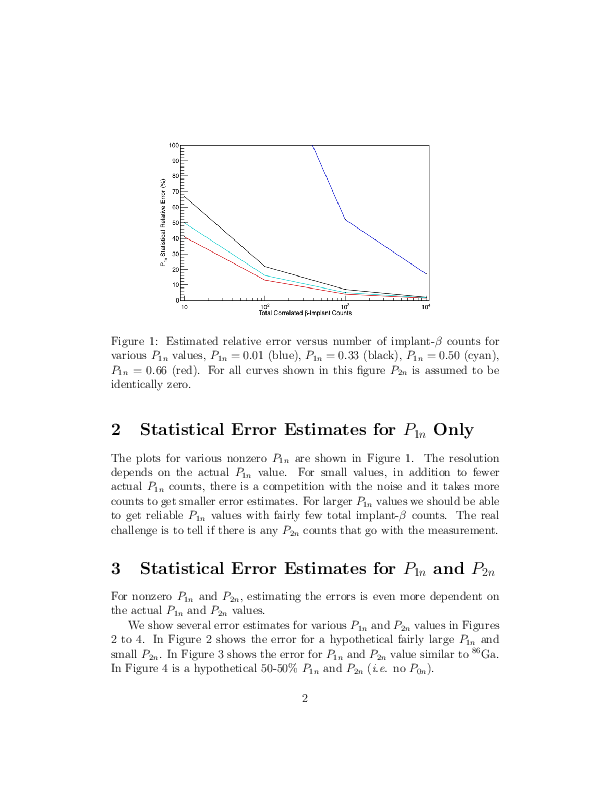
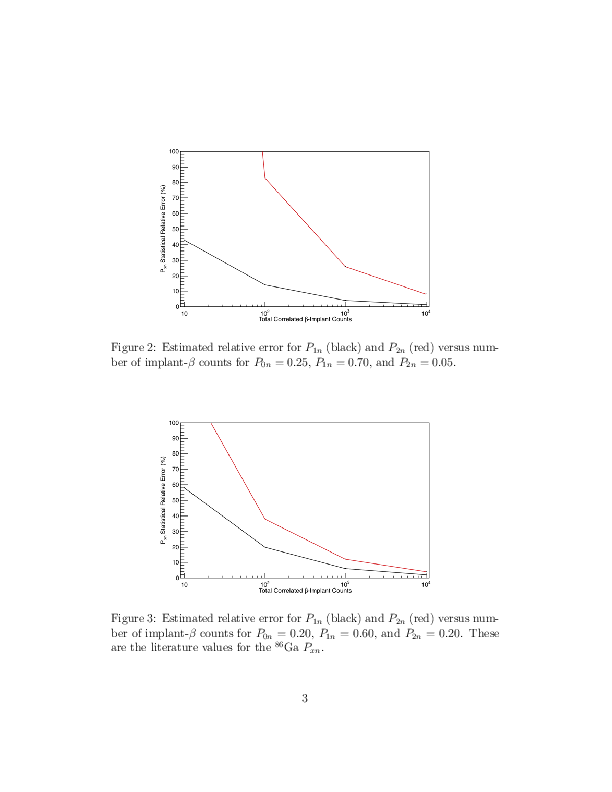
Here is a doc with an estimate of the statistical uncertainty P1n and P2n as a function of the number of implant-beta correlations for future experiments.
This will hopefully be useful for the new PAC proposals as an estimate for the time needed to measure a certain precision.
If there are any questions please feel free to email me (Charlie Rasco).
|
| Attachment 1: ExpectedBRIKEN_Precision.pdf
|


|
|
|
154
|
Tue Nov 22 09:26:04 2016 |
A. Tarifeno-Saldivia | Noise check |
Run for checking the noise just after turn on the crates, without high voltages on the PREAMPS.

Attached calibrated histogram for the full BRIKEN detector.

Files:
161122_1820_000.dlt
161122_1820_000.root

Pulser counts: 1.179e4 |
| Attachment 1: 161122_1820_000_BRIKEN.svg
|

|
|
|
67
|
Fri Oct 7 08:35:15 2016 |
JL Tain et al | Noise |
Low amplitude noise component.

The figure shows the composition of the low amplitude noise
which depends on the tube and type of preamplifier used.

Bkack: He020 (RIKEN-Diff)
Red: He044 (UPC-Diff)
Green: He057 (UPC-Unip)
Blue: He068 (ORNL1-Unip)
Pink: He132 (ORNL2-Unip)

(all the tubes of the same type and preamp type behave alike)

We can see up to three different structures.
The noise in the ORNL tubes extends to higher energies (200keV)
and are the cause for the overlap of noise with neutron signals,
but other wise the shape is similar to RIKEN tubes.
The noise for UPC above 50kev is quite small.
One can also see a small difference between differential and unipolar PA
in the case of UPC tubes (red and green) |
| Attachment 1: noiseDifferentTubes2.pdf
|

|
|
|
68
|
Fri Oct 7 10:42:52 2016 |
JL Tain et al | Noise |
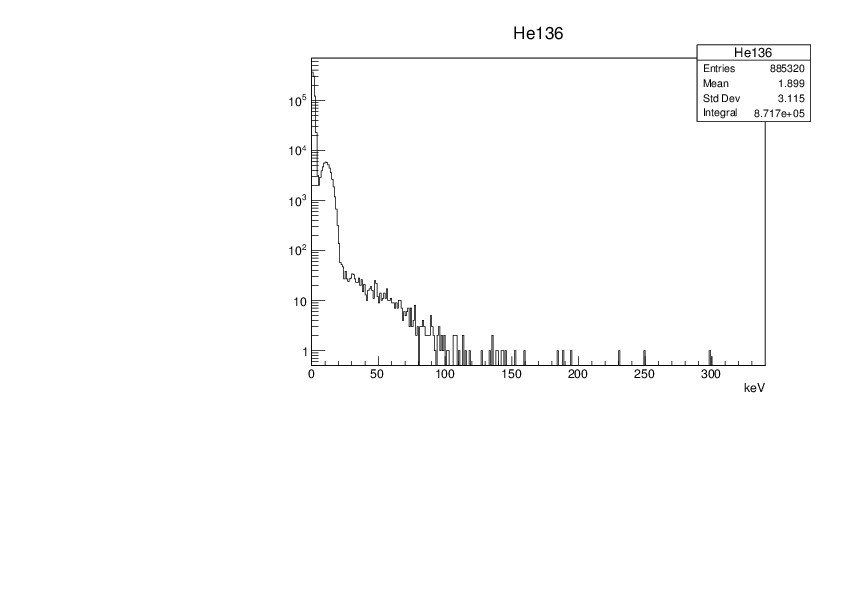
We investigate the effect on the noise in ORNL tubes of using a differential PA.

We connect the tubes in current PA10 (126-140) to one of the new diff PA
and connect the output to converter card #4 which is connected to ADC3 (and ADC4).

First a short run with 252Cf for setting the right parameters and the calibration
file: 161007_1743_252Cf_ORNL_diffPreamp.root

Then we make a background run
file: 161007_1743_bck_ORNL_diffPreamp.root

As can be seen in the figure the effect of the differential preamp is to
compress the noise down to 100keV, becoming more similar to
the situation of the RIKEN tubes.

Thus it will be beneficial to use Diff PA. However as we can only setup one
because we have only one spare Diff-Unip converter card, we decided not to
use it as the impact will be very low and implies a lot of changes.
However one must remember that since we are always going to require coincidence
with betas during the measurement this noise should have no effet. |
| Attachment 1: ORNL-DiffPreamp.pdf
|
|
|
|
71
|
Sun Oct 9 04:20:47 2016 |
JL Tain et al | Noise |
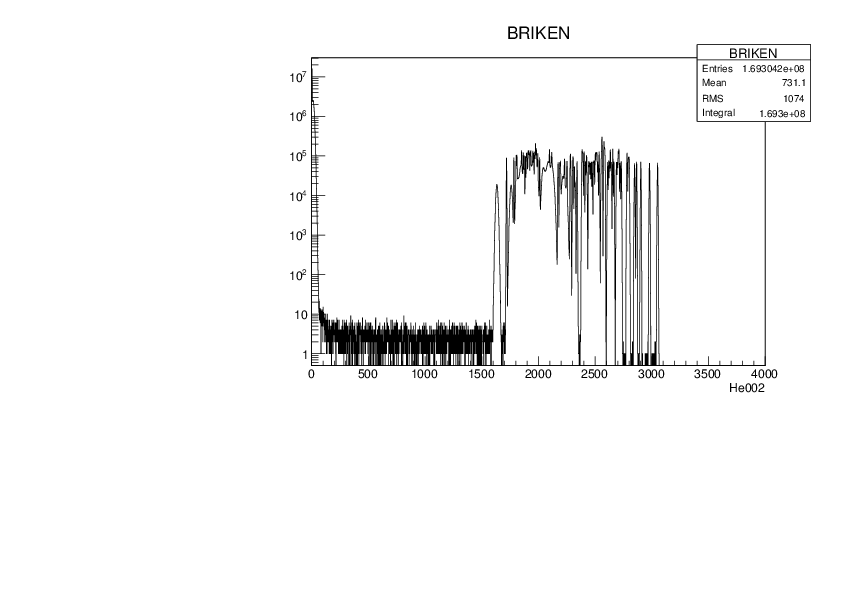
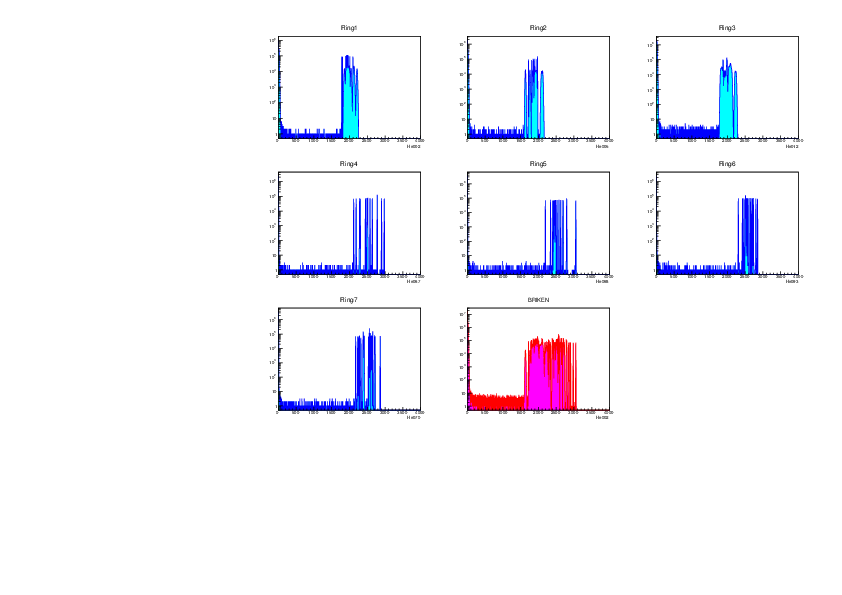
We check for the appearance of spurious signals in the preamplifiers.

We set all HV to zero and run a measurement for several hours.
Start: October 7, 20:00
Stop: October 8, 06:42
File: 161008_0642_noHV.root

De inspection of the different channels do not reveal any
particular problem.

See figure for channels grouped in rings |
| Attachment 1: noHV.pdf
|
|
| Attachment 2: 161008_0642_noHV.pdf
|
|
|
|
73
|
Sun Oct 9 18:19:01 2016 |
JL Tain et al | Noise |
Optimization of ADC thresholds

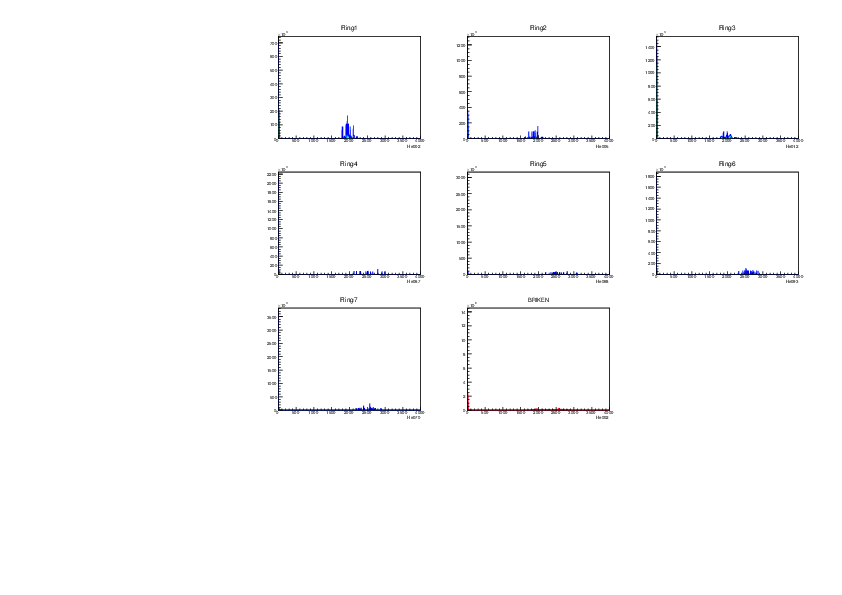
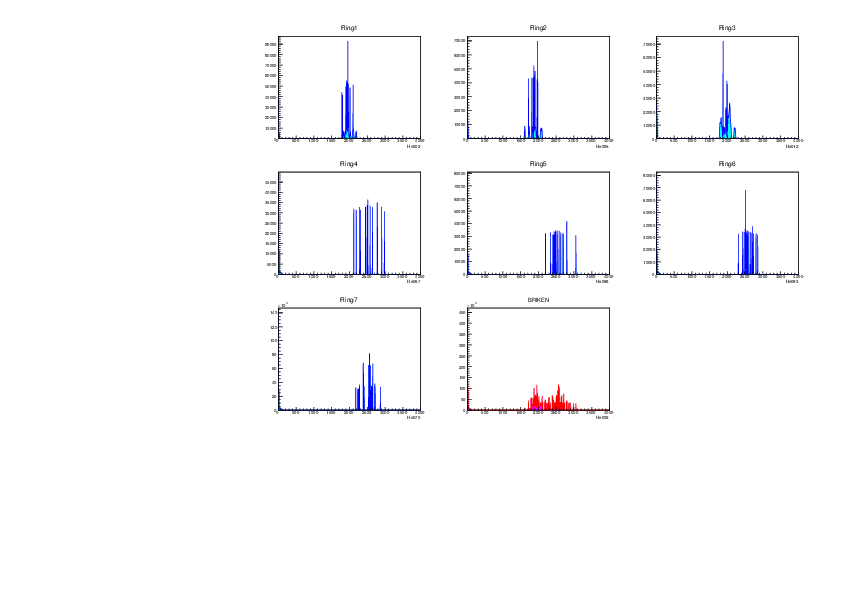
In order to try to reduce the grass-like background
we make a finer adjustment of individual ADC thresholds.
We make first a control measurement putting the 252Cf source
in the center of the detector (AIDA removed)
Start: -
Stop: 23:55
File: 161009_2355_252Cf_control.root

We then make an adjustment of thresholds one ADC at a time.
We adjusted the threshold so that the very low amplitude noise height
in the spectrum is only a small fraction of the pulser.

New configuration file: 160718Conf_BrikenFull_test02_thr.xlsx

A verification measurement with 252Cf
Start: 01:55
Stop: 02:09
File: 161010_0209_252Cf_newthr.root


And the leave a background measurement overnight:
Start: 02:12
Stop: 07:12
File: 161010_0712_bck_newthr.root

We compare the grass-noise rates now with the rates before threshold adjustment
For that we integrate the BRIKEN spectrum between 900keV and 1.5MeV
The rate before was 0.085 counts per second per MeV
The rate now is 0.039 counts per second per MeV
So the improvement was only a factor 2.

One can try to set the thresholds higher  however with this rate the probability
of having a noise signal in a 0.5ms window after a beta signal will be about 1E-5.

The plots below show the situation before and after. |
| Attachment 1: 161007_1045_bck_lin.pdf
|
|
| Attachment 2: 161010_0712_bck_newthr.pdf
|
|
|
|
78
|
Wed Oct 12 05:06:57 2016 |
JL Tain et al | Noise |
Gamma source close to ORNL2 tube

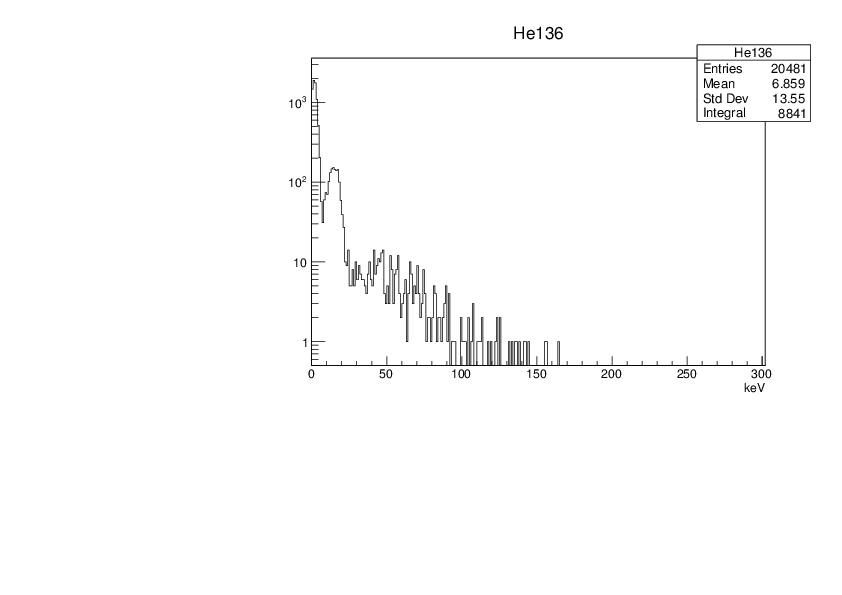
In order to investigate the origin of the background
component in ORNL tubes extending up to 200keV
we place a strong 137Cs source (D393) in the hole
of He136 close to the tube.

Control measurement (no source): 161012_1200_bck_control.root
With source: 161012_1229_137CsHe136.root

We observe that the induced signals are in the same energy region
as the 3rd noise component. The increase of the rate of signals
with the source is a factor 60.

See figures.

This hints to the origin of this component as due to an increased sensitivity
to gamma-rays (more  material?) or internal radioactivity (gamma,beta)
of ORNL tubes. |
| Attachment 1: He136-nosource.pdf
|
|
| Attachment 2: He136-137Cs.pdf
|

|
|
|
156
|
Tue Nov 22 10:22:07 2016 |
PV, Liu | No current observed when turning on the HV for the D4 Clover |
19:00
We've turned on the High Voltage for the D4 Clover up to ~ 1.5 kV.
There is no current (0.0 uA) observed in all the channels (crystals) of this clover while the High Voltage is
turning up.
We have turned down the HV after that.
We've checked that the NIM crate power supply for the preamp is On and the HV and peamplifier connections for
this Clover are Ok. |