| ID |
Date |
Author |
Subject |
|
42
|
Tue Apr 2 09:42:20 2019 |
NH | MBS Server setup |
MBS is currently configured and accepting data:
x86l-94 : AIDA Foreign data receiver
x86l-4 : DESPEC Time sorter
The time sorter is complaining about AIDA time warps (around 1 Hz) it is assumed this is related to other merger / timestamping issues being worked on by Vic |
|
46
|
Thu Apr 4 14:07:45 2019 |
NH | Pulser Configuration |
Pulser settings during April run:
Rate 2Hz
Delay 250 NS
Amplitude 1 V
Fall 1 ms
Polarity Pos
Pulse Top Tail
Attenuation 1X
PB5 Pulse On
Clamp Off
|
|
48
|
Wed Apr 10 14:53:50 2019 |
NH | Report - FEE stops sending data |
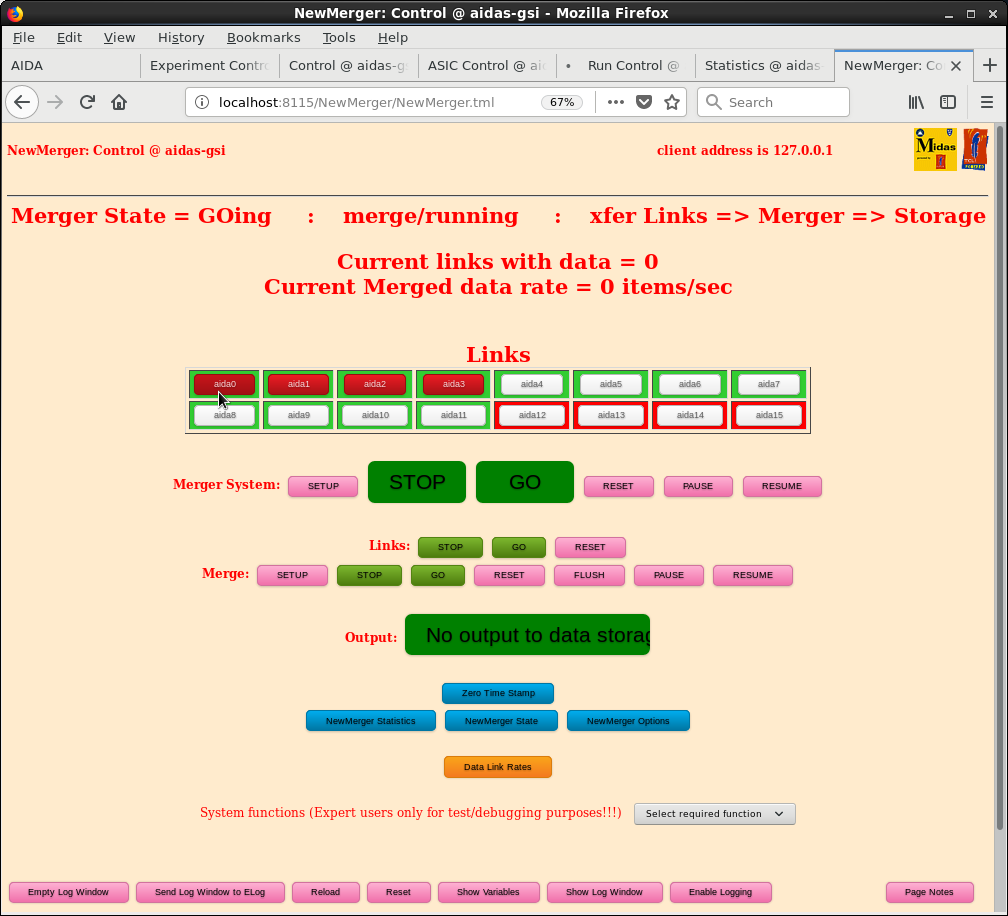
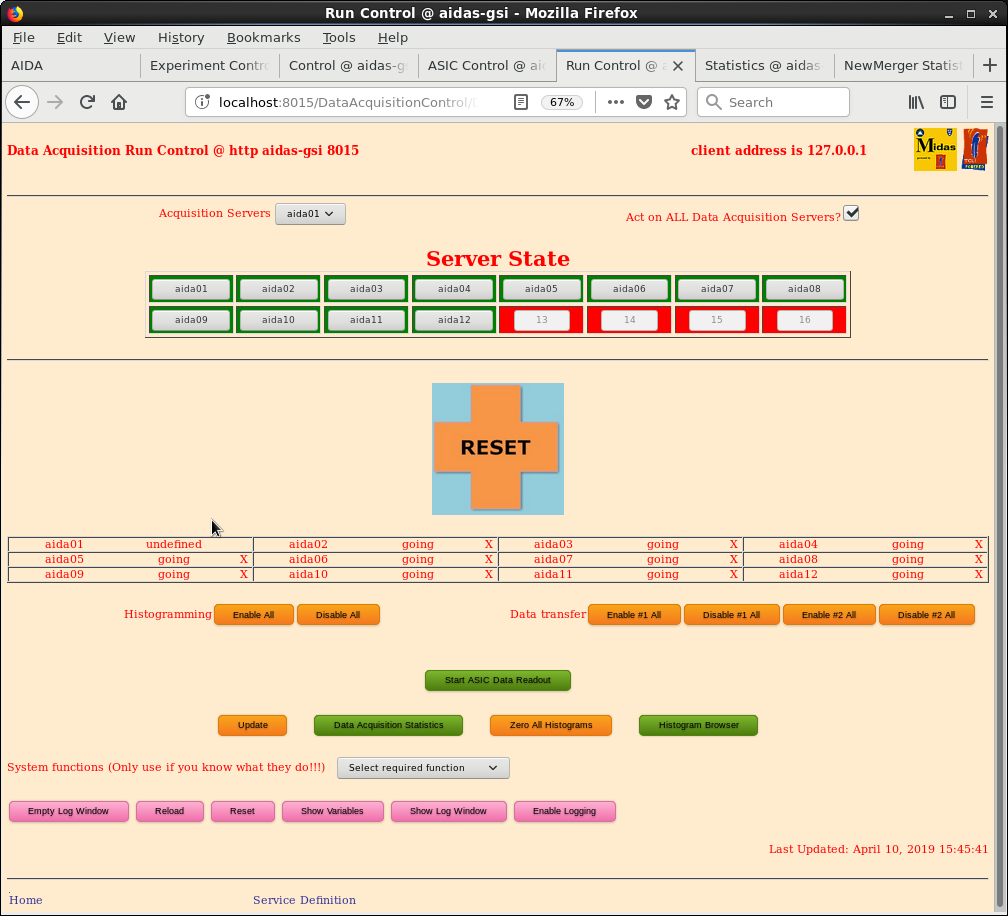
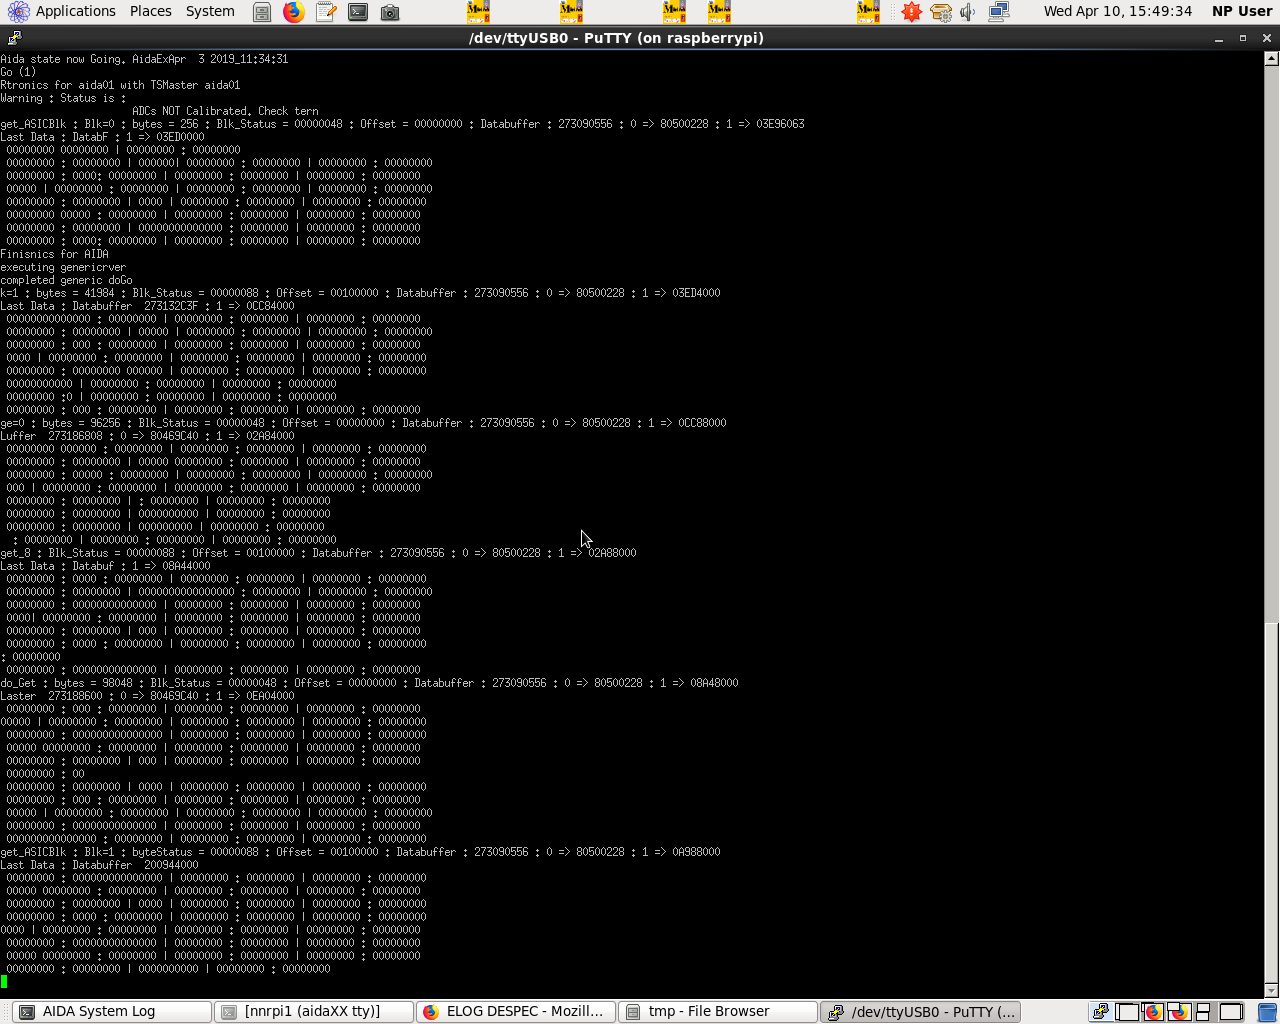
it seems a FEE somtimes enters a confusing state and stops sending data
the current merger requires all FEEs to be active and so this stops the entire system from proceeding.
On MIDAS the page reports the module is "undefined"
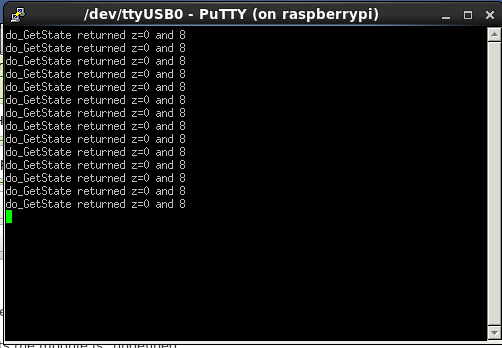
On the TTY console (PUTTY) it returns: do_GetState returned z=0 and 8
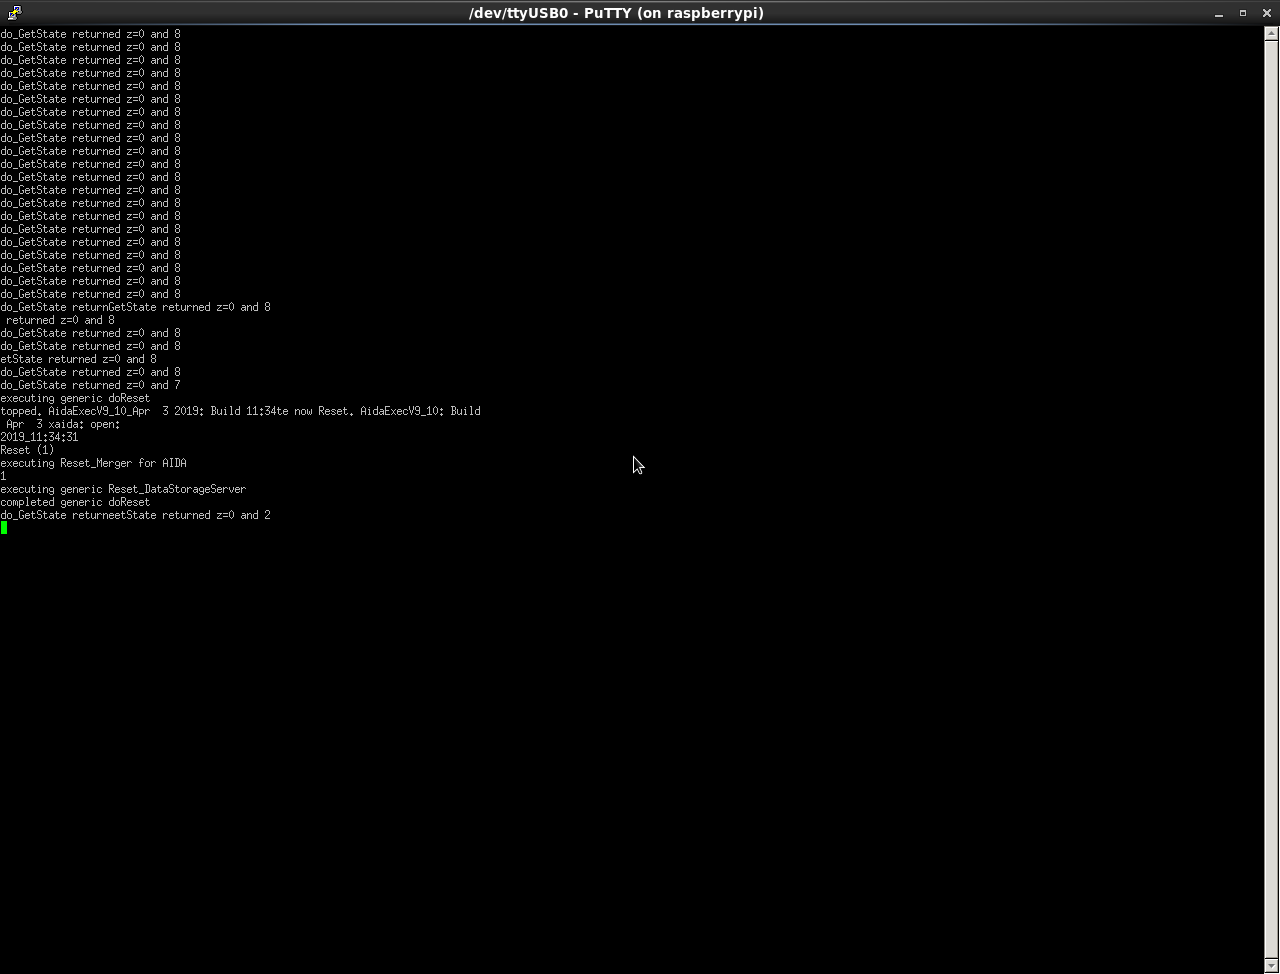
Resetting the DAQ in question via MIDAS works (Putty logs of the stages shown) and then the merger resumes without trouble. |
| Attachment 1: Report-PUTTY.png
|
|
| Attachment 2: Report-_Merger.png
|
|
| Attachment 3: Report_-_DAQ.png
|
|
| Attachment 4: Report_-_PuTTY_Reset.png
|
|
| Attachment 5: Report_-_PUTTY_Setup.png
|

|
| Attachment 6: Report_-_PUTTY_GO.png
|
|
|
50
|
Fri Apr 12 15:15:33 2019 |
NH | Report - FEE Kernel Panics (Update on 48) |
Update on issue #48 - the "confusing state" is that the FEE has restarted and hence is undefined again.
An attached TTY log from the pi shows that the module is kernel panicking.
I have seen a couple of FEEs panic with the same error now.
(NB. The Day/time of the logs is wrong as the pi does not have the correct time - pis dont have a RTC or Internet access so the time isn't corrected)
Temperature of the modules is fine.
Aida is currently powered off (and I am away from GSI)
| Quote: |
|
it seems a FEE somtimes enters a confusing state and stops sending data
the current merger requires all FEEs to be active and so this stops the entire system from proceeding.
On MIDAS the page reports the module is "undefined"
On the TTY console (PUTTY) it returns: do_GetState returned z=0 and 8
Resetting the DAQ in question via MIDAS works (Putty logs of the stages shown) and then the merger resumes without trouble.
|
|
| Attachment 1: aida01_log.txt
|
30/11:31:53|completed generic doGo
30/11:31:53|do_GetState returned z=0 and 1
30/11:31:53|get_ASICBlk : Blk=1 : bytes = 98048 : Blk_Status = 00000088 : Offset = 00100000 : Databuffer : 273090556 : 0 => 80500228 : 1 => 0AE18000
30/11:31:53|Last Data : Databuffer  273188600 : 0 => 80468F1E : 1 => 00DD4000
30/11:31:53| 00000000 : 00000000 | 00000000 : 00000000 | 00000000 : 00000000 | 00000000 : 00000000
30/11:31:53| 00000000 : 00000000 | 00000000 : 00000000 | 00000000 : 00000000 | 00000000 : 00000000
30/11:31:54| 00000000 : 00000000 | 00000000 : 00000000 | 00000000 : 00000000 | 00000000 : 00000000
30/11:31:54| 00000000 : 00000000 | 00000000 : 00000000 | 00000000 : 00000000 | 00000000 : 00000000
30/11:31:54| 00000000 : 00000000 | 00000000 : 00000000 | 00000000 : 00000000 | 00000000 : 00000000
30/11:31:54| 00000000 : 00000000 | 00000000 : 00000000 | 00000000 : 00000000 | 00000000 : 00000000
30/11:31:54| 00000000 : 00000000 | 00000000 : 00000000 | 00000000 : 00000000 | 00000000 : 00000000
30/11:31:54| 00000000 : 00000000 | 00000000 : 00000000 | 00000000 : 00000000 | 00000000 : 00000000
30/11:31:54|get_ASICBlk : Blk=0 : bytes = 98048 : Blk_Status = 00000048 : Offset = 00000000 : Databuffer : 273090556 : 0 => 80500228 : 1 => 00DD8000
30/11:31:54|Last Data : Databuffer  273188600 : 0 => 80468F1E : 1 => 06D94000
30/11:31:54| 00000000 : 00000000 | 00000000 : 00000000 | 00000000 : 00000000 | 00000000 : 00000000
30/11:31:54| 00000000 : 00000000 | 00000000 : 00000000 | 00000000 : 00000000 | 00000000 : 00000000
30/11:31:55| 00000000 : 00000000 | 00000000 : 00000000 | 00000000 : 00000000 | 00000000 : 00000000
30/11:31:55| 00000000 : 00000000 | 00000000 : 00000000 | 00000000 : 00000000 | 00000000 : 00000000
30/11:31:55| 00000000 : 00000000 | 00000000 : 00000000 | 00000000 : 00000000 | 00000000 : 00000000
30/11:31:55| 00000000 : 00000000 | 00000000 : 00000000 | 00000000 : 00000000 | 00000000 : 00000000
30/11:31:55| 00000000 : 00000000 | 00000000 : 00000000 | 00000000 : 00000000 | 00000000 : 00000000
30/11:31:55| 00000000 : 00000000 | 00000000 : 00000000 | 00000000 : 00000000 | 00000000 : 00000000
30/11:31:55|get_ASICBlk : Blk=1 : bytes = 98048 : Blk_Status = 00000088 : Offset = 00100000 : Databuffer : 273090556 : 0 => 80500228 : 1 => 06D98000
30/11:31:55|Last Data : Databuffer  273188600 : 0 => 80468F1E : 1 => 0CD54000
30/11:31:55| 00000000 : 00000000 | 00000000 : 00000000 | 00000000 : 00000000 | 00000000 : 00000000
30/11:31:55| 00000000 : 00000000 | 00000000 : 00000000 | 00000000 : 00000000 | 00000000 : 00000000
30/11:31:56| 00000000 : 00000000 | 00000000 : 00000000 | 00000000 : 00000000 | 00000000 : 00000000
30/11:31:56| 00000000 : 00000000 | 00000000 : 00000000 | 00000000 : 00000000 | 00000000 : 00000000
30/11:31:56| 00000000 : 00000000 | 00000000 : 00000000 | 00000000 : 00000000 | 00000000 : 00000000
30/11:31:56| 00000000 : 00000000 | 00000000 : 00000000 | 00000000 : 00000000 | 00000000 : 00000000
30/11:31:56| 00000000 : 00000000 | 00000000 : 00000000 | 00000000 : 00000000 | 00000000 : 00000000
30/11:31:56| 00000000 : 00000000 | 00000000 : 00000000 | 00000000 : 00000000 | 00000000 : 00000000
30/11:31:56|get_ASICBlk : Blk=0 : bytes = 98048 : Blk_Status = 00000048 : Offset = 00000000 : Databuffer : 273090556 : 0 => 80500228 : 1 => 0CD58000
30/11:31:56|Last Data : Databuffer  273188600 : 0 => 80468F1F : 1 => 02D14000
30/11:31:56| 00000000 : 00000000 | 00000000 : 00000000 | 00000000 : 00000000 | 00000000 : 00000000
30/11:31:56| 00000000 : 00000000 | 00000000 : 00000000 | 00000000 : 00000000 | 00000000 : 00000000
30/11:31:57| 00000000 : 00000000 | 00000000 : 00000000 | 00000000 : 00000000 | 00000000 : 00000000
30/11:31:57| 00000000 : 00000000 | 00000000 : 00000000 | 00000000 : 00000000 | 00000000 : 00000000
30/11:31:57| 00000000 : 00000000 | 00000000 : 00000000 | 00000000 : 00000000 | 00000000 : 00000000
30/11:31:57| 00000000 : 00000000 | 00000000 : 00000000 | 00000000 : 00000000 | 00000000 : 00000000
30/11:31:57| 00000000 : 00000000 | 00000000 : 00000000 | 00000000 : 00000000 | 00000000 : 00000000
30/11:31:57| 00000000 : 00000000 | 00000000 : 00000000 | 00000000 : 00000000 | 00000000 : 00000000
30/11:31:57|get_ASICBlk : Blk=1 : bytes = 98048 : Blk_Status = 00000088 : Offset = 00100000 : Databuffer : 273090556 : 0 => 80500228 : 1 => 02D18000
30/11:31:57|Last Data : Databuffer  273188600 : 0 => 80468F1F : 1 => 08CD4000
30/11:31:57| 00000000 : 00000000 | 00000000 : 00000000 | 00000000 : 00000000 | 00000000 : 00000000
30/11:31:57| 00000000 : 00000000 | 00000000 : 00000000 | 00000000 : 00000000 | 00000000 : 00000000
30/11:31:58| 00000000 : 00000000 | 00000000 : 00000000 | 00000000 : 00000000 | 00000000 : 00000000
30/11:31:58| 00000000 : 00000000 | 00000000 : 00000000 | 00000000 : 00000000 | 00000000 : 00000000
30/11:31:58| 00000000 : 00000000 | 00000000 : 00000000 | 00000000 : 00000000 | 00000000 : 00000000
30/11:31:58| 00000000 : 00000000 | 00000000 : 00000000 | 00000000 : 00000000 | 00000000 : 00000000
30/11:31:58| 00000000 : 00000000 | 00000000 : 00000000 | 00000000 : 00000000 | 00000000 : 00000000
30/11:31:58| 00000000 : 00000000 | 00000000 : 00000000 | 00000000 : 00000000 | 00000000 : 00000000
30/11:31:58|get_ASICBlk : Blk=0 : bytes = 98048 : Blk_Status = 00000048 : Offset = 00000000 : Databuffer : 273090556 : 0 => 80500228 : 1 => 08CD8000
30/11:31:58|Last Data : Databuffer  273188600 : 0 => 80468F1F : 1 => 0EC94000
30/11:31:58| 00000000 : 00000000 | 00000000 : 00000000 | 00000000 : 00000000 | 00000000 : 00000000
30/11:31:58| 00000000 : 00000000 | 00000000 : 00000000 | 00000000 : 00000000 | 00000000 : 00000000
30/11:31:59| 00000000 : 00000000 | 00000000 : 00000000 | 00000000 : 00000000 | 00000000 : 00000000
30/11:31:59| 00000000 : 00000000 | 00000000 : 00000000 | 00000000 : 00000000 | 00000000 : 00000000
30/11:31:59| 00000000 : 00000000 | 00000000 : 00000000 | 00000000 : 00000000 | 00000000 : 00000000
30/11:31:59| 00000000 : 00000000 | 00000000 : 00000000 | 00000000 : 00000000 | 00000000 : 00000000
30/11:31:59| 00000000 : 00000000 | 00000000 : 00000000 | 00000000 : 00000000 | 00000000 : 00000000
30/11:31:59| 00000000 : 00000000 | 00000000 : 00000000 | 00000000 : 00000000 | 00000000 : 00000000
30/11:31:59|get_ASICBlk : Blk=1 : bytes = 98048 : Blk_Status = 00000088 : Offset = 00100000 : Databuffer : 273090556 : 0 => 80500228 : 1 => 0EC98000
30/11:31:59|Last Data : Databuffer  273188600 : 0 => 80468F20 : 1 => 04C54000
30/11:31:59| 00000000 : 00000000 | 00000000 : 00000000 | 00000000 : 00000000 | 00000000 : 00000000
30/11:31:59| 00000000 : 00000000 | 00000000 : 00000000 | 00000000 : 00000000 | 00000000 : 00000000
30/11:32:00| 00000000 : 00000000 | 00000000 : 00000000 | 00000000 : 00000000 | 00000000 : 00000000
30/11:32:00| 00000000 : 00000000 | 00000000 : 00000000 | 00000000 : 00000000 | 00000000 : 00000000
30/11:32:00| 00000000 : 00000000 | 00000000 : 00000000 | 00000000 : 00000000 | 00000000 : 00000000
30/11:32:00| 00000000 : 00000000 | 00000000 : 00000000 | 00000000 : 00000000 | 00000000 : 00000000
30/11:32:00| 00000000 : 00000000 | 00000000 : 00000000 | 00000000 : 00000000 | 00000000 : 00000000
30/11:32:00| 00000000 : 00000000 | 00000000 : 00000000 | 00000000 : 00000000 | 00000000 : 00000000
30/11:32:00|get_ASICBlk : Blk=0 : bytes = 98048 : Blk_Status = 00000048 : Offset = 00000000 : Databuffer : 273090556 : 0 => 80500228 : 1 => 04C58000
30/11:32:00|Last Data : Databuffer  273188600 : 0 => 80468F20 : 1 => 0AC14000
30/11:32:00| 00000000 : 00000000 | 00000000 : 00000000 | 00000000 : 00000000 | 00000000 : 00000000
30/11:32:00| 00000000 : 00000000 | 00000000 : 00000000 | 00000000 : 00000000 | 00000000 : 00000000
30/11:32:01| 00000000 : 00000000 | 00000000 : 00000000 | 00000000 : 00000000 | 00000000 : 00000000
30/11:32:01| 00000000 : 00000000 | 00000000 : 00000000 | 00000000 : 00000000 | 00000000 : 00000000
30/11:32:01| 00000000 : 00000000 | 00000000 : 00000000 | 00000000 : 00000000 | 00000000 : 00000000
30/11:32:01| 00000000 : 00000000 | 00000000 : 00000000 | 00000000 : 00000000 | 00000000 : 00000000
30/11:32:01| 00000000 : 00000000 | 00000000 : 00000000 | 00000000 : 00000000 | 00000000 : 00000000
30/11:32:01| 00000000 : 00000000 | 00000000 : 00000000 | 00000000 : 00000000 | 00000000 : 00000000
30/11:32:01|get_ASICBlk : Blk=1 : bytes = 98816 : Blk_Status = 00000088 : Offset = 00100000 : Databuffer : 273090556 : 0 => 80500228 : 1 => 0AC18000
30/11:32:01|Last Data : Databuffer  273189368 : 0 => 80468F21 : 1 => 00C94000
30/11:32:01| 00000000 : 00000000 | 00000000 : 00000000 | 00000000 : 00000000 | 00000000 : 00000000
30/11:32:01| 00000000 : 00000000 | 00000000 : 00000000 | 00000000 : 00000000 | 00000000 : 00000000
30/11:32:02| 00000000 : 00000000 | 00000000 : 00000000 | 00000000 : 00000000 | 00000000 : 00000000
30/11:32:02| 00000000 : 00000000 | 00000000 : 00000000 | 00000000 : 00000000 | 00000000 : 00000000
30/11:32:02| 00000000 : 00000000 | 00000000 : 00000000 | 00000000 : 00000000 | 00000000 : 00000000
30/11:32:02| 00000000 : 00000000 | 00000000 : 00000000 | 00000000 : 00000000 | 00000000 : 00000000
30/11:32:02| 00000000 : 00000000 | 00000000 : 00000000 | 00000000 : 00000000 | 00000000 : 00000000
30/11:32:02| 00000000 : 00000000 | 00000000 : 00000000 | 00000000 : 00000000 | 00000000 : 00000000
30/11:32:02|do_GetState returned z=0 and 1
30/11:32:58|In RDOGo_Operate: Enabled Correlation, ASIC and discriminator readout
30/11:32:59|do_GetState returned z=0 and 1
30/11:33:00|Unable to handle kernel paging request for data at address 0x80501594
30/12:52:57|Faulting instruction address: 0xc0072d74
30/12:52:57|Oops: Kernel access of bad area, sig: 11 [#1]
30/12:52:57|PREEMPT Xilinx Virtex440
30/12:52:57|Modules linked in: aidamem xdriver xh_spidev_register
30/12:52:57|NIP: c0072d74 LR: c021671c CTR: c000da98
30/12:52:57|REGS: c0391cf0 TRAP: 0300   Not tainted  (2.6.31)
30/12:52:57|MSR: 00021000 <ME,CE>  CR: 22000044  XER: 20000000
30/12:52:57|DEAR: 80501594, ESR: 00000000
30/12:52:57|TASK = c036e318[0] 'swapper' THREAD: c0390000
30/12:52:57|GPR00: c021671c c0391da0 c036e318 80501594 c69352e0 00000000 0694009e 00000042
30/12:52:58|GPR08: 00000001 c69400e0 c03b8000 00000000 22000022 00005aa8 fffbbfff fff77fff
30/12:52:58|GPR16: fffff77f fffffbbf fffffffb c0390000 c0391de8 c68e13b4 c0390000 c0385dc8
30/12:52:58|GPR24: c0385bf8 c68e1000 00000055 00029000 00000042 00000002 c6935520 80501594
30/12:52:58|NIP [c0072d74] put_page+0x14/0x1a0
30/12:52:58|LR [c021671c] skb_release_data+0xac/0xd4
30/12:52:58|Call Trace:
30/12:52:58|[c0391da0] [c009191c] kfree+0x68/0xe4 (unreliable)
30/12:52:58|[c0391dc0] [c021671c] skb_release_data+0xac/0xd4
30/12:52:58|[c0391dd0] [c0216338] __kfree_skb+0x18/0xe8
30/12:52:58|[c0391de0] [c01d54a4] DmaSendHandlerBH+0x1c4/0x298
30/12:52:58|[c0391e30] [c003a968] tasklet_action+0x6c/0xec
30/12:52:58|[c0391e50] [c003aaa4] __do_softirq+0xbc/0x138
30/12:52:58|[c0391e90] [c0003c1c] do_softirq+0x74/0x7c
30/12:52:58|[c0391ea0] [c003a6b8] irq_exit+0x64/0x7c
30/12:52:58|[c0391eb0] [c000410c] do_IRQ+0x9c/0xb4
30/12:52:58|[c0391ed0] [c000e9c4] ret_from_except+0x0/0x18
30/12:52:58|[c0391f90] [c0006fac] cpu_idle+0xcc/0xdc
30/12:52:58|[c0391fb0] [c000172c] rest_init+0x70/0x84
30/12:52:58|[c0391fc0] [c0341854] start_kernel+0x230/0x2ac
30/12:52:58|[c0391ff0] [c0000204] skpinv+0x194/0x1d0
30/12:52:59|Instruction dump:
30/12:52:59|387d0140 4bfffdb9 7fe00106 4bffffb0 48235409 4bffffc0 4bffff50 9421ffe0
30/12:52:59|7c0802a6 bfa10014 90010024 7c7f1b78 <80030000> 7009c000 40820170 38030004
30/12:52:59|Kernel panic - not syncing: Fatal exception in interrupt
30/12:52:59|Call Trace:
30/12:52:59|[c0391c20] [c0005de8] show_stack+0x44/0x16c (unreliable)
30/12:52:59|[c0391c60] [c00345bc] panic+0x94/0x168
30/12:52:59|[c0391cb0] [c000bd44] die+0x178/0x18c
30/12:52:59|[c0391cd0] [c001191c] bad_page_fault+0x90/0xd8
30/12:52:59|[c0391ce0] [c000e834] handle_page_fault+0x7c/0x80
30/12:52:59|[c0391da0] [c009191c] kfree+0x68/0xe4
30/12:52:59|[c0391dc0] [c021671c] skb_release_data+0xac/0xd4
30/12:52:59|[c0391dd0] [c0216338] __kfree_skb+0x18/0xe8
30/12:52:59|[c0391de0] [c01d54a4] DmaSendHandlerBH+0x1c4/0x298
30/12:52:59|[c0391e30] [c003a968] tasklet_action+0x6c/0xec
30/12:52:59|[c0391e50] [c003aaa4] __do_softirq+0xbc/0x138
30/12:52:59|[c0391e90] [c0003c1c] do_softirq+0x74/0x7c
30/12:52:59|[c0391ea0] [c003a6b8] irq_exit+0x64/0x7c
30/12:52:59|[c0391eb0] [c000410c] do_IRQ+0x9c/0xb4
30/12:52:59|[c0391ed0] [c000e9c4] ret_from_except+0x0/0x18
30/12:52:59|[c0391f90] [c0006fac] cpu_idle+0xcc/0xdc
30/12:53:00|[c0391fb0] [c000172c] rest_init+0x70/0x84
30/12:53:00|[c0391fc0] [c0341854] start_kernel+0x230/0x2ac
30/12:53:00|[c0391ff0] [c0000204] skpinv+0x194/0x1d0
30/12:53:00|Rebooting in 180 seconds..
|
|
51
|
Mon May 20 13:33:06 2019 |
NH | New Merger/MBS Test Runs |
New merger has been worked on by VP which fixes the timewarp issues and MBS integration.
Currently no WAVE capture is supported, VP will re-add WAVE histogramming for startup testing.
10.05.2019 - Pulser walkthrough
-> Pulser rate 50 Hz
-> 1 minute per 0.1 V (0.1 to 1 V)
-> extra time on 1 V
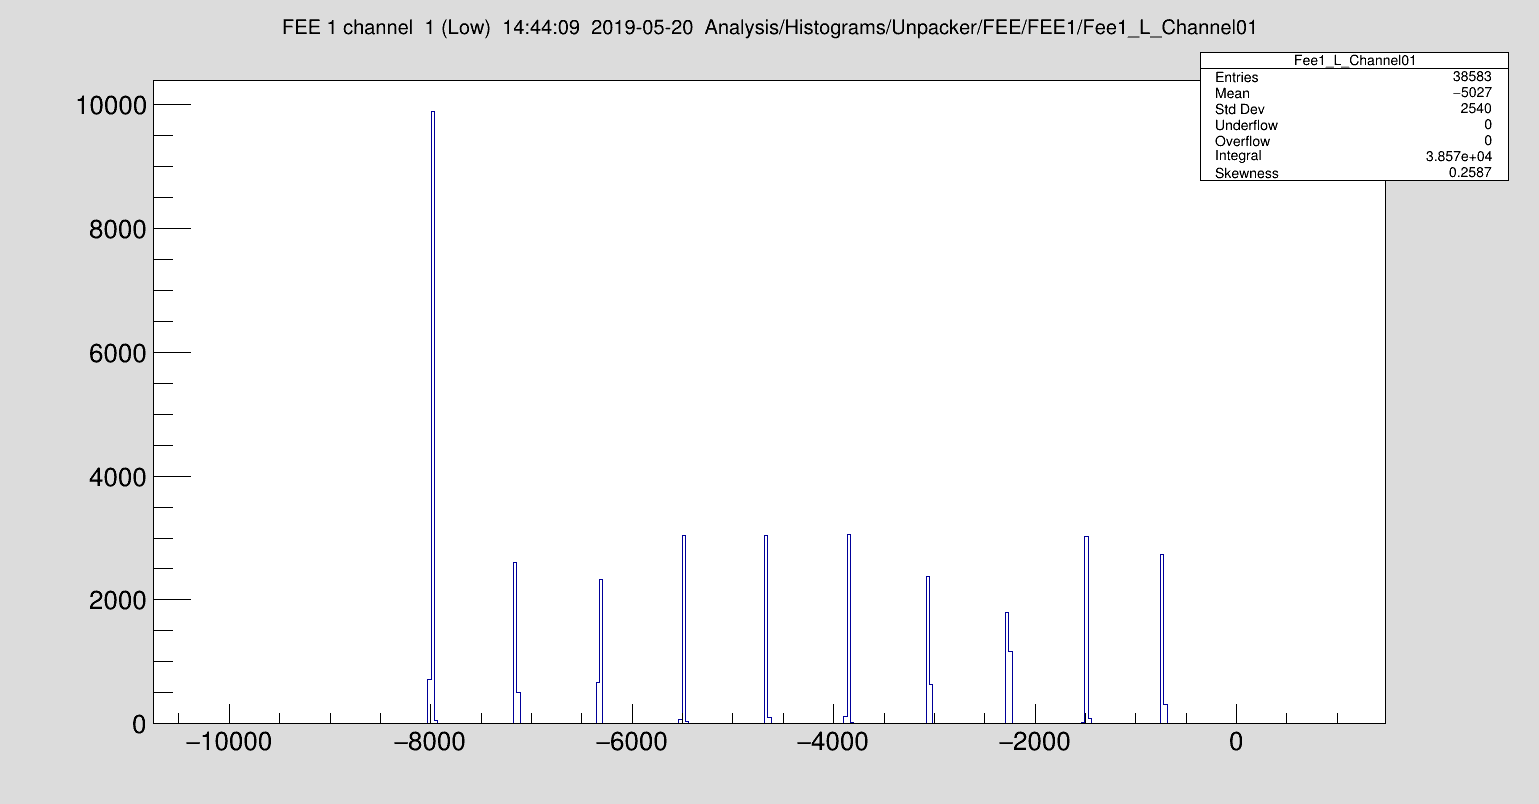
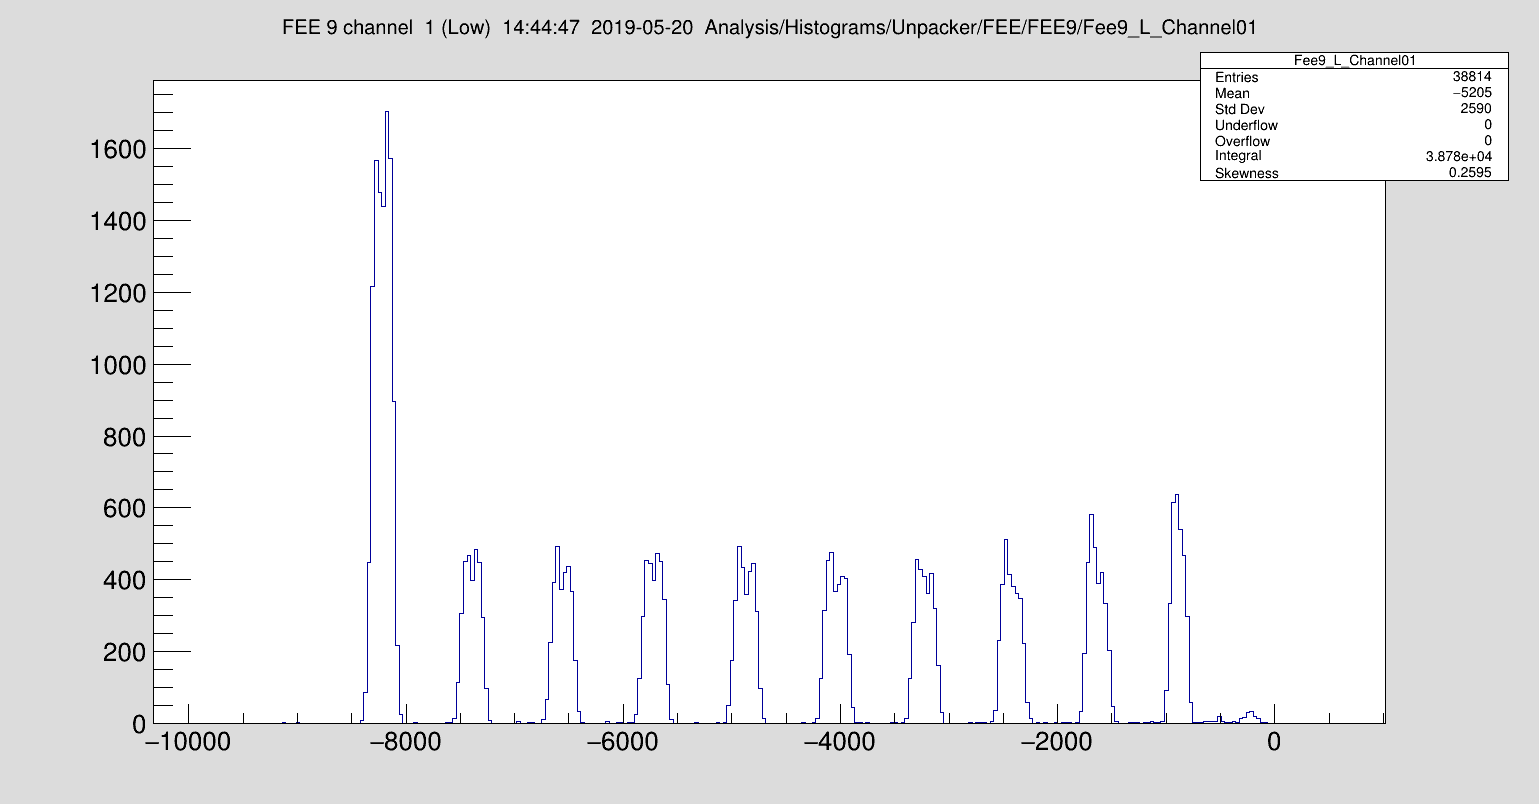
With this 95% of channels calibrate easily (good statistics)
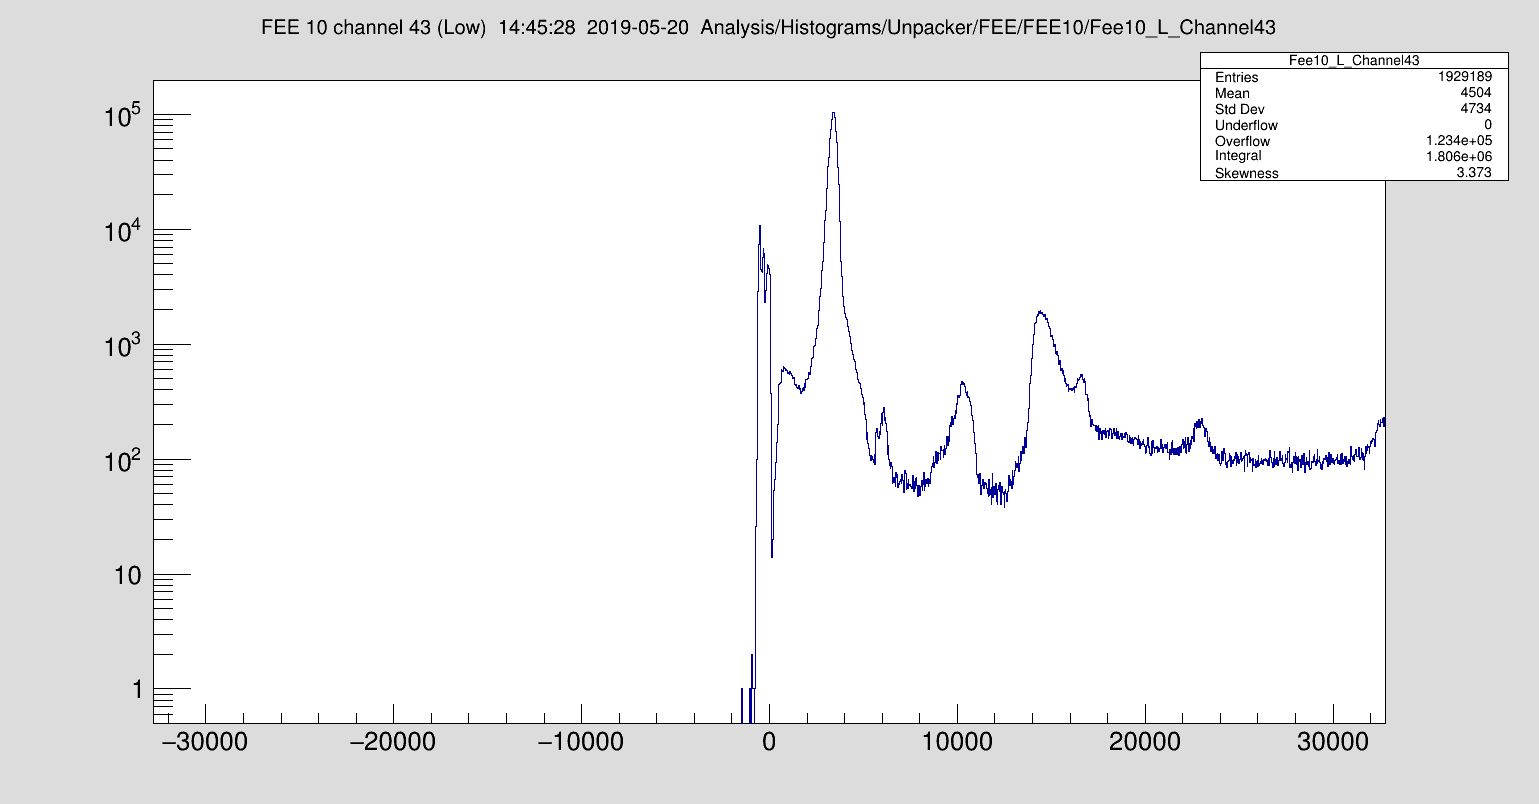
Issue: ~16 channels (most of ASIC3) in FEE10 are horrificly noisy. Not calibrated
Fig 1. Pulser of FEE1 (no DSSD)
Fig 2. Pulser of FEE9 (DSSD)
Fig 3&4. Pulser of FEE10 noisy channels
Future TODO: Will investigate WAVE data and look if issue can be found.
20.05.2019 - Alpha walkthrough
-> Pulser off
-> FEE10ASIC3 has readout off & discriminator masked
-> Slow threshold 0x64
-> Fast threshold 0xff
-> HEC threshold 0x2
File is nyx/gamma/nhubbard/AIDA/alpha_bg_200519_
Rate is approx. 1MB/s still of WR timestamp data.
(NB, MIDAS Alpha walkthrough before beamtime I see no alpha events in!)
Fig 5: Temps
Fig 6: Stats
Fig 7: Merger Stats
Fig 8: MBS Stats |
| Attachment 1: 20190522-PulserFEE1.png
|
|
| Attachment 2: 20190522-PulserFEE9.png
|
|
| Attachment 3: 20190522-PulserFEE10-Bad.png
|

|
| Attachment 4: 20190522-PulserFEE10-VBad.png
|
|
| Attachment 5: 20190522-Temps.png
|

|
| Attachment 6: 20190522-Stats.png
|

|
| Attachment 7: 20190522-StatsMerger.png
|

|
| Attachment 8: 20190522-MBSRate.png
|

|
|
52
|
Mon May 20 13:51:45 2019 |
NH | HowTo Verify WR Times |
The latest version of MIDAS has a new page to check the WR timestamp of each FEE.
In AIDA Hardware control click: GSI White Rabbit Control
In expert options click: Collect all Timestamps
Verify every FEE has a good timestamp. |
| Attachment 1: HowTo-WR1.png
|

|
| Attachment 2: HowTo-WR2.png
|

|
| Attachment 3: HowTo-WR3.png
|

|
|
53
|
Tue Jun 4 09:19:10 2019 |
NH | AIDA Interlock |
Currently AIDA's interlock is off (no lights) and hence AIDA cannot be powered on. Under investigation - power supply has been replugged but seems ok.
Update: It seems the interlock is correctly stopping AIDA from being powered on due to high humidity on the cooling lines. Am currently trying to verify the temperature with GSI technical staff |
|
54
|
Fri Jun 28 15:05:49 2019 |
NH | Aida 28/6/2019 - WATER OFF |
The humidity sensor hasn't reported humdities under 90% yet. In order to try and help dry the pipes and turn AIDA the water has been turned off the weekend.
Sunday temperatures might reach 40 C which means it may struggle anyway.
Will consider trying to get a temperature/humidity monitor for S4 to check if the environment is fine too. |
|
55
|
Mon Jul 1 09:42:16 2019 |
NH | AIDA - 01/07/2019 |
Water is still off.
Checked dewpoint sensor still flashing red light (indicating an error). Pipes warmed. Not what I expected. Possible fault?
I checked S4's ambient temp/humidity with a home-brought sensor: Reports 27 C/50% RH (Dew Point = 16 C)
Water temperature is set to exactly 20 C (there's a second dial showing ~18 C but I am unsure if that's the same water supply, I will ask)
Checking the dewpoint PSU with a multimeter shows a voltage of 16 V.
The PSU itself is rated for 12 V output, and the humidity sensor expects 24 V.
Regardless of which voltage 16 V seems incorrect. Might be causing issues.
Humidity is a bit lower now (4pm) the sensor has been in all day, 28 C/35% RH (Dew Point = 11 C) which isn't an issue.
Water is still off until I am sure what to do, or until the dewpoint sensor stops complaining.
|
|
57
|
Wed Jul 10 10:46:05 2019 |
NH | AIDA/Water 10.07.2019 |
S4 Conditions:
25.2 C, 35.3% RH, Td = 8.8 C
Water temperature: 20 C
-
Rotating the dewpoint sensor on the pipe seems to have made it switch over to solid red = humidity OK.
Waiting confirmation to see if we should check a FEE (as per PJCS suggestion) before water is turned back on.
Will check the outside copper after lunch.
13:04 : Copper seems warm and dry, humidity sensor still solid red. |
|
58
|
Mon Aug 5 12:57:48 2019 |
NH | S4 Conditions |
Temp: 26 C
Humidity: 50%
Dew Point: ~15 C
There are two temperature dials outside S4, one shows exactly 20 C and one shows nearer 16 C.
Trying to clarify this discrepancy as 16 C is too cold at the moment.
In contact with developer of cooling system to confirm apparent 16 C after the heat exchanger
Today's conditions:
Temp: 26.9 C
Humidity: 48.7%
Dewpoint 15.2 C |
|
59
|
Fri Aug 9 12:33:14 2019 |
NH | Aida Test 9/8/19 - FEES 1-6 |
The water issue has been resolved - merely incorrect temperature guages (replaced). Water is 20 C as required.
S4 conditions at 13:12 CEST
26.5 C / 47.2 % / Td = 14.3 C
Based on email by TD doing the following procedure to ensure FEEs are OK after water issue
1) disconnect the power cables of *all* FEE64s at the FEE64 PSUs
2) re-connect power cable, power-up and check/test the FEE64s
*one at a time* until stable operatinmg temperature is achieved
... say 30mins?
13:34 CEST: All be FEE1 unplugged. Powering on!
Vertex temp read slightly warm (67 C) so powered off. Waiting for a while for water to circulate since off for a while...
15:01 CEST: FEE1 Powered on again, Vertex reading 67 C again but it's stable and slowly going down. Watching and seeing but I think it's OK.
15:35 CEST: FEE1 has been stable around 67 C all the time. Other temps fine. Presuming this isn't a major concern. (Perhaps related to reasonably warm/humid conditions?)
15:47 CEST: FEE2 Powered on.
16:02 CEST: Temperature stable, not exceeded 60 C.
16:07 CEST: FEE3 Powered On.
16:17 CEST: Temperature stable, peaked at 58.44 C
16:21 CEST: FEE4 Powered On.
16:40 CEST: Both FPGA and ASIC reading warm: 65.5 C and 58 C. Seeming to not be rising anymore.
16:41 CEST: FEE5 Powered On.
16:53 CEST: Temperature stable, at 64 C
16:56 CEST: FEE6 Powered On.
17:12 CEST: FPGA temp is ok but ASIC warm. Tmax ASIC = 56.88, FPGA = 55.38, PSU = 27.44
17:15 Turning FEEs and Water off for the weekend
Will test 7-12 on Monday.
Might be cooler in S4.
Cooling seems to be working but temps hotter than before.
|
|
60
|
Tue Aug 13 09:17:02 2019 |
NH | AIDA 12/08/2019 |
The other 6 FEEs were powered on one at a time to check no issues. None found.
All 12 FEEs plugged back into the PSU.
Note: The FEE temperatures reported on Friday were before a Reset/Setup of the DAQ, which means the ASICs run very fast and the hence run hotter.
Reset/Setup shows more sustainable temps (attached)
These temps are similar to those observed in Sep 2018 but warmer by ~4 C than those observed Dec-Jan and April. |
| Attachment 1: AIDATemps-1208191457.png
|

|
|
61
|
Tue Aug 13 13:55:45 2019 |
NH | New Merger/MBS Test Runs |
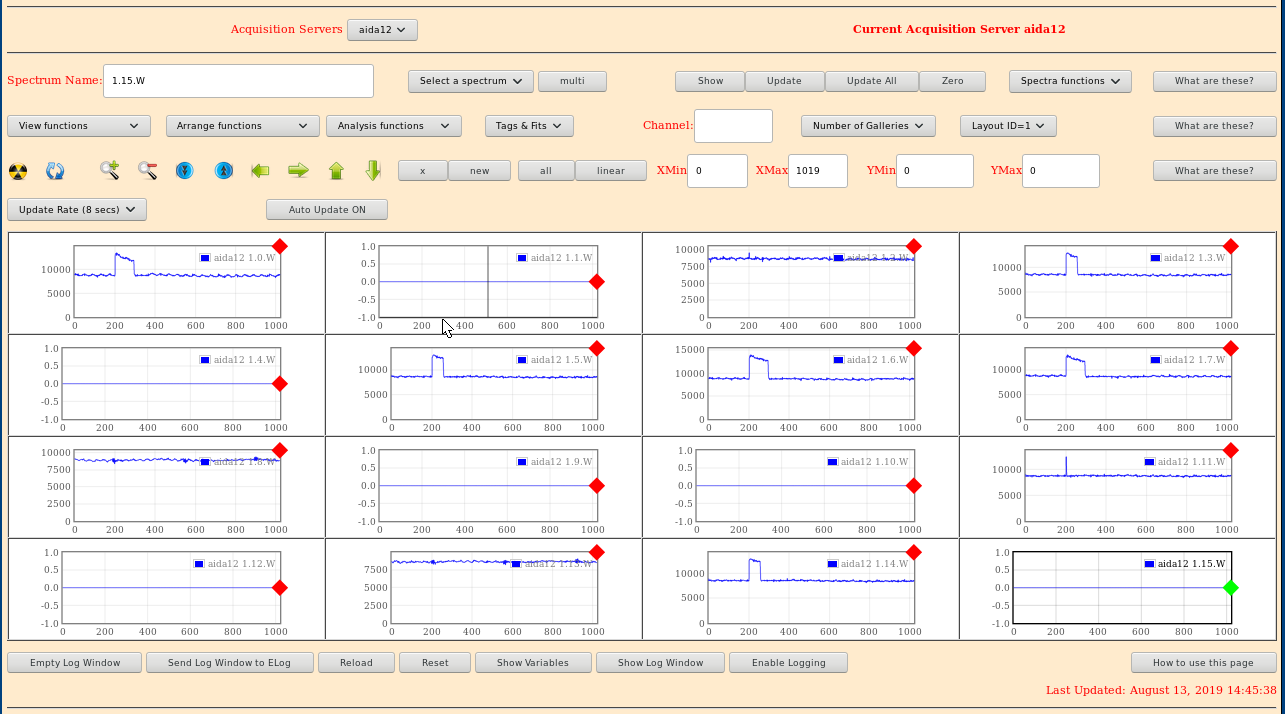
AIDA Finally working again so can test VP's added WAVE histogramming mode.
Fig 1. Waveforms for FEE12 ASIC 1. Sample rate = 10, Threshold = 10500
n.b. lots of "blank" wave channels for unknown reason, all low-energy channels show pulser so it's not a DSSD signal problem?
Fig 2. Pulser spectrum for FEE12 ASIC 1. (10 peaks 0.1 -> 1 V)
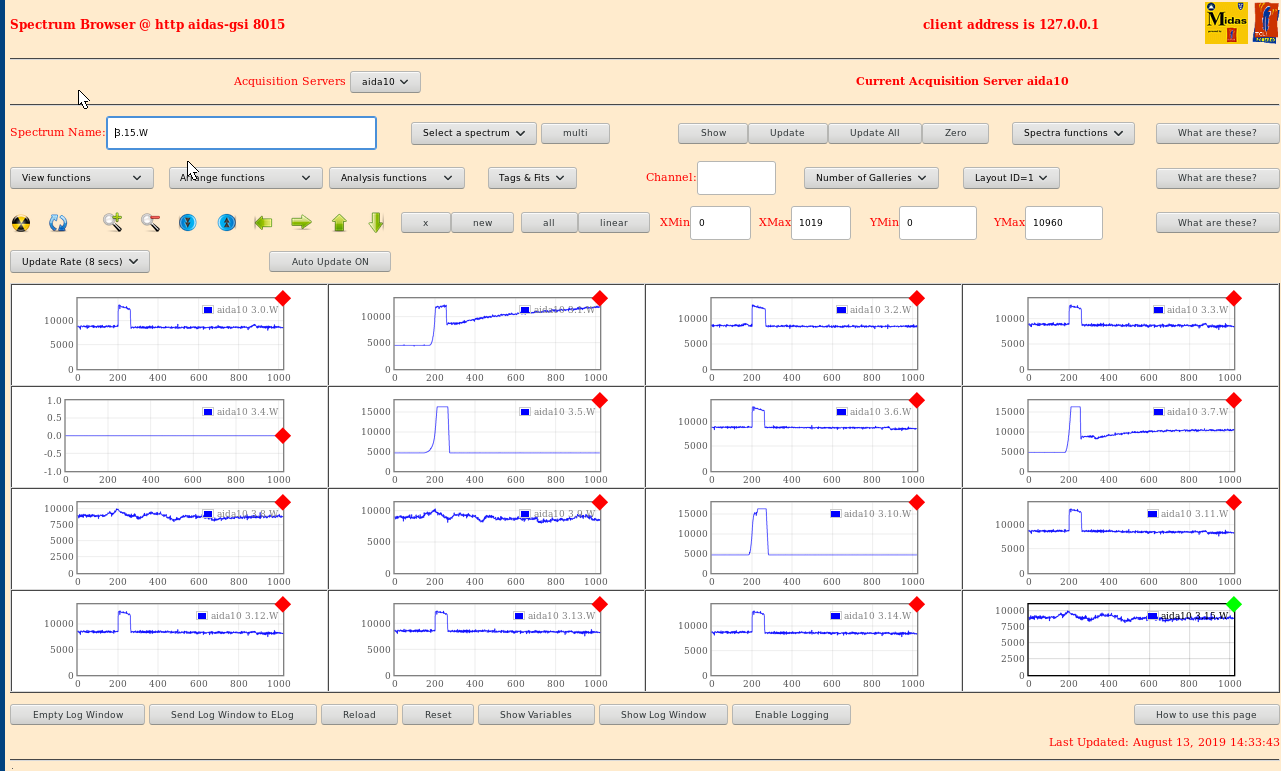
Fig 3. Waveforms for FEE10 ASIC 3.
n.b. WAVE channels frequently stopped updating, needed start/stop DAQ or restart WAVE readout option. Unsure if it's related to high rate/odd signals.
Might be related to issue in FEE12 too. WAVE good events statistics lower than empty FEEs.
All rates quite high, looks quite noisy at the moment.
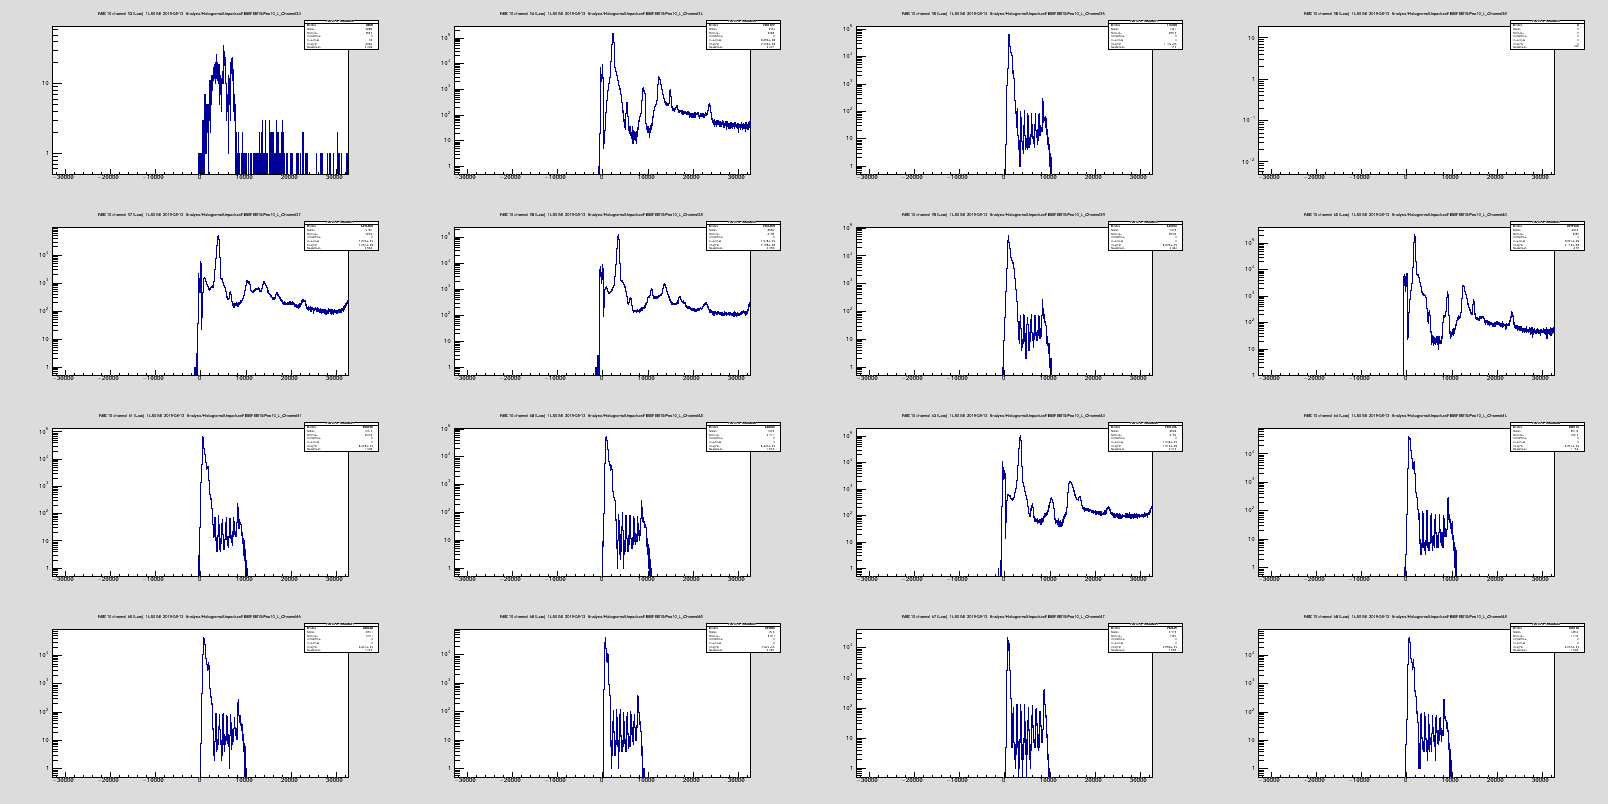
Fig 4. Pulser of FEE10 ASIC 3.
Note that FEE10.3 has poor peaks, in WAVE we see:
Some normal looking pulses which are merely noiser than other channels.
Some pulses which look very odd (baseline really low, etc).
Will recheck ground for noise issues, but the huge peaks are confusing to me. (3.5.W, etc)
| Quote: |
|
New merger has been worked on by VP which fixes the timewarp issues and MBS integration.
Currently no WAVE capture is supported, VP will re-add WAVE histogramming for startup testing.
10.05.2019 - Pulser walkthrough
-> Pulser rate 50 Hz
-> 1 minute per 0.1 V (0.1 to 1 V)
-> extra time on 1 V
With this 95% of channels calibrate easily (good statistics)
Issue: ~16 channels (most of ASIC3) in FEE10 are horrificly noisy. Not calibrated
Fig 1. Pulser of FEE1 (no DSSD)
Fig 2. Pulser of FEE9 (DSSD)
Fig 3&4. Pulser of FEE10 noisy channels
Future TODO: Will investigate WAVE data and look if issue can be found.
20.05.2019 - Alpha walkthrough
-> Pulser off
-> FEE10ASIC3 has readout off & discriminator masked
-> Slow threshold 0x64
-> Fast threshold 0xff
-> HEC threshold 0x2
File is nyx/gamma/nhubbard/AIDA/alpha_bg_200519_
Rate is approx. 1MB/s still of WR timestamp data.
(NB, MIDAS Alpha walkthrough before beamtime I see no alpha events in!)
Fig 5: Temps
Fig 6: Stats
Fig 7: Merger Stats
Fig 8: MBS Stats
|
|
| Attachment 1: AIDA_FEE122-ASIC1.png
|
|
| Attachment 2: Pulser-FEE12-ASIC1.png
|

|
| Attachment 3: AIDA-FEE10-ASIC3.png
|
|
| Attachment 4: Pulser-FEE10-ASIC3.png
|
|
| Attachment 5: Rates-WAVE.png
|

|
| Attachment 6: Rates-good.png
|

|
|
63
|
Wed Aug 14 14:40:18 2019 |
NH | High Frequency Noise in AIDA |
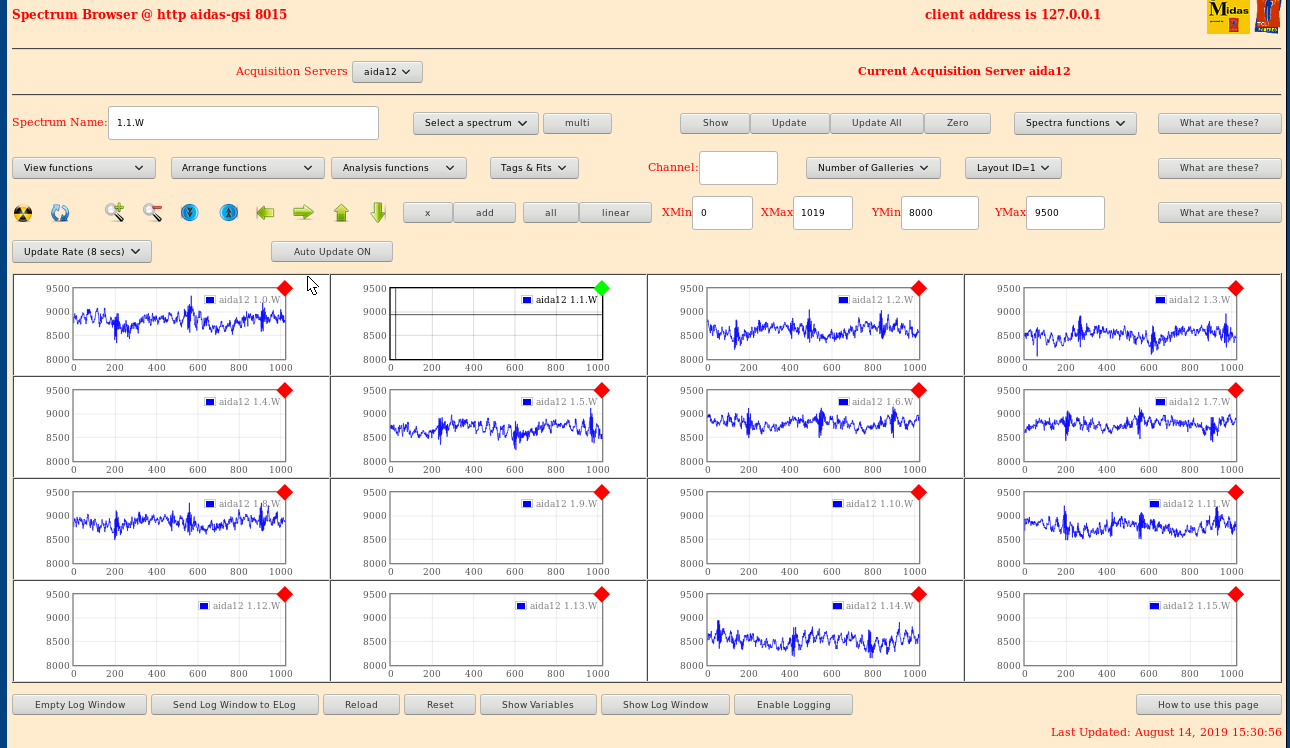
Figures of intense high frequency noise pickup in AIDA.
Will investigate source in S4.
Edit: Period is approx 40 cycles / approx 2.5 MHz (?) |
| Attachment 1: HF.png
|
|
| Attachment 2: HFZ.png
|
|
|
64
|
Thu Aug 15 14:09:39 2019 |
NH | AIDA Waveforms |
Noise seemed less strong today, unsure of cause. I had re-taped snout as tape was not sticking well.
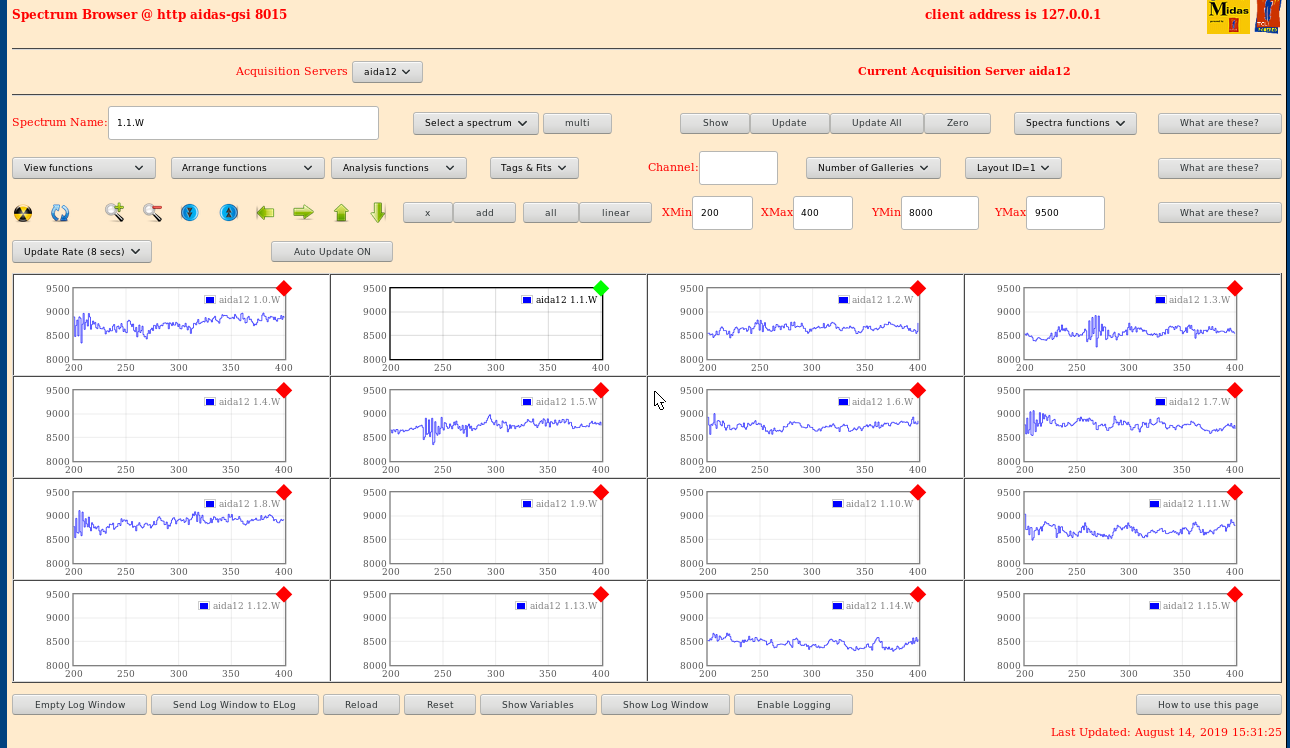
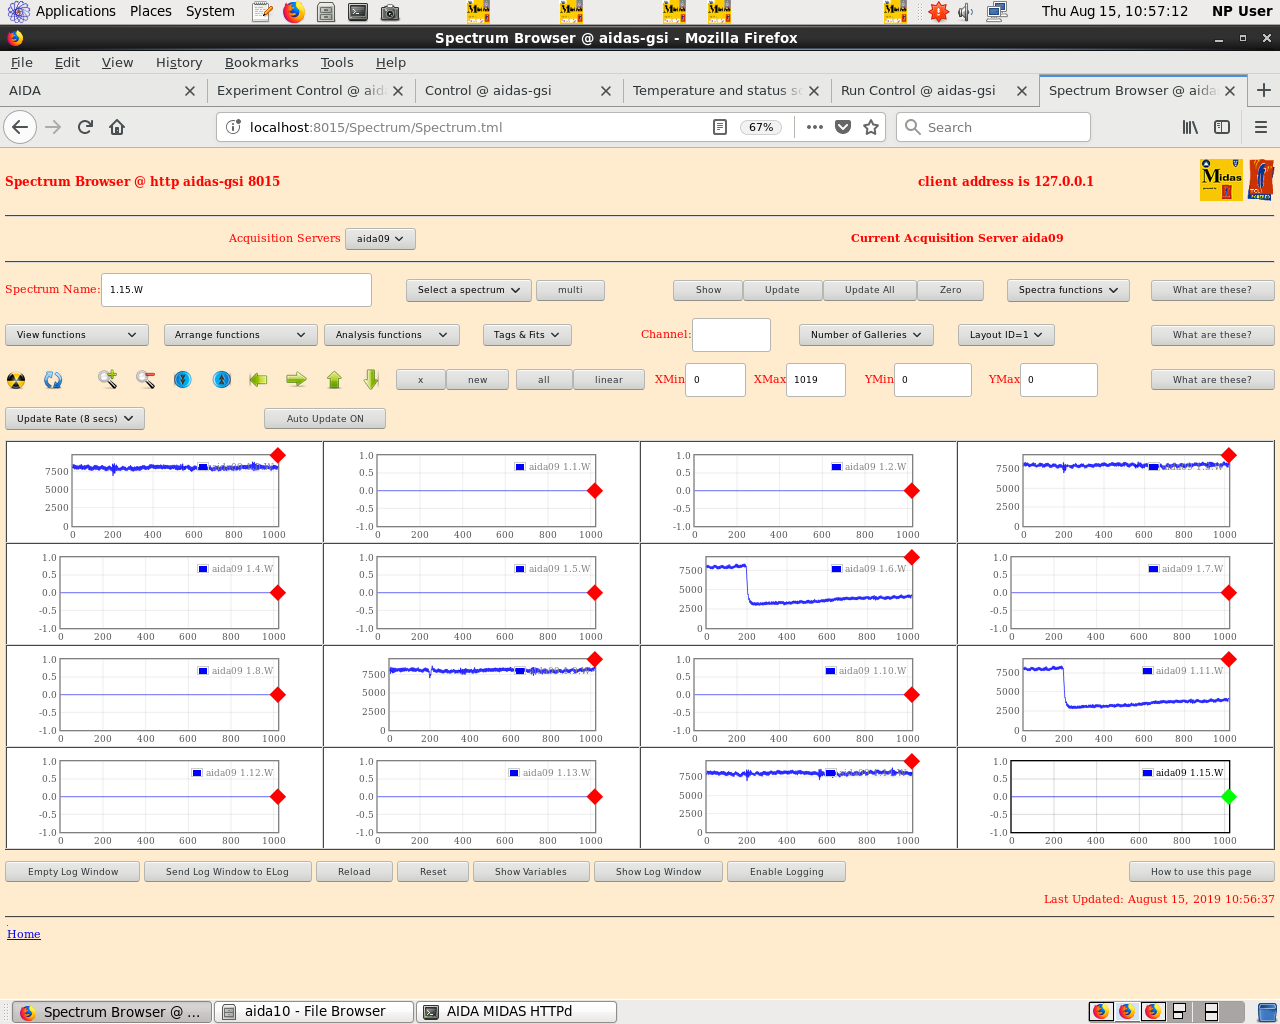
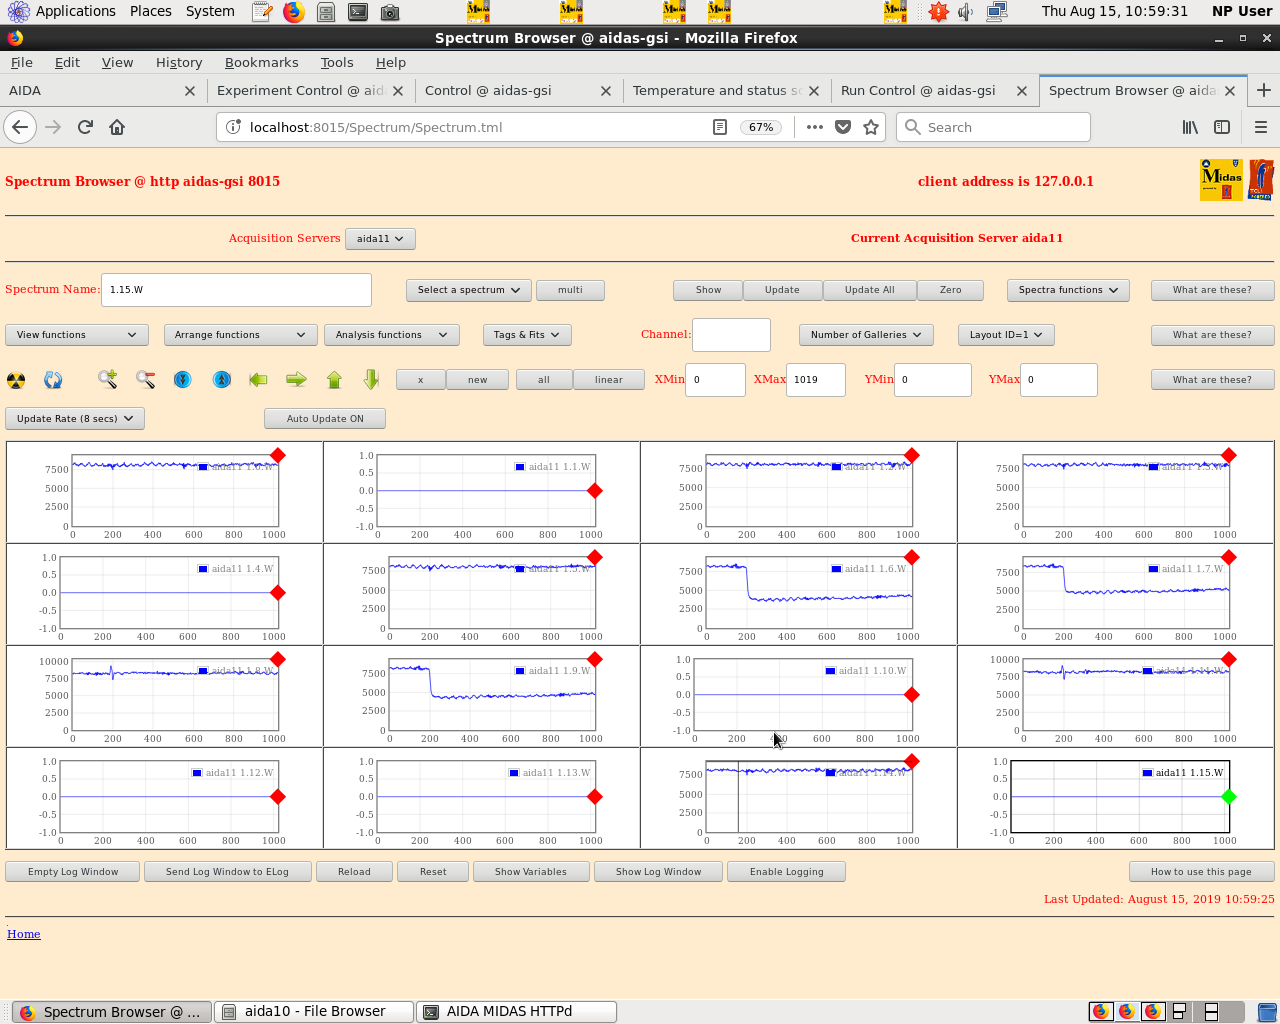
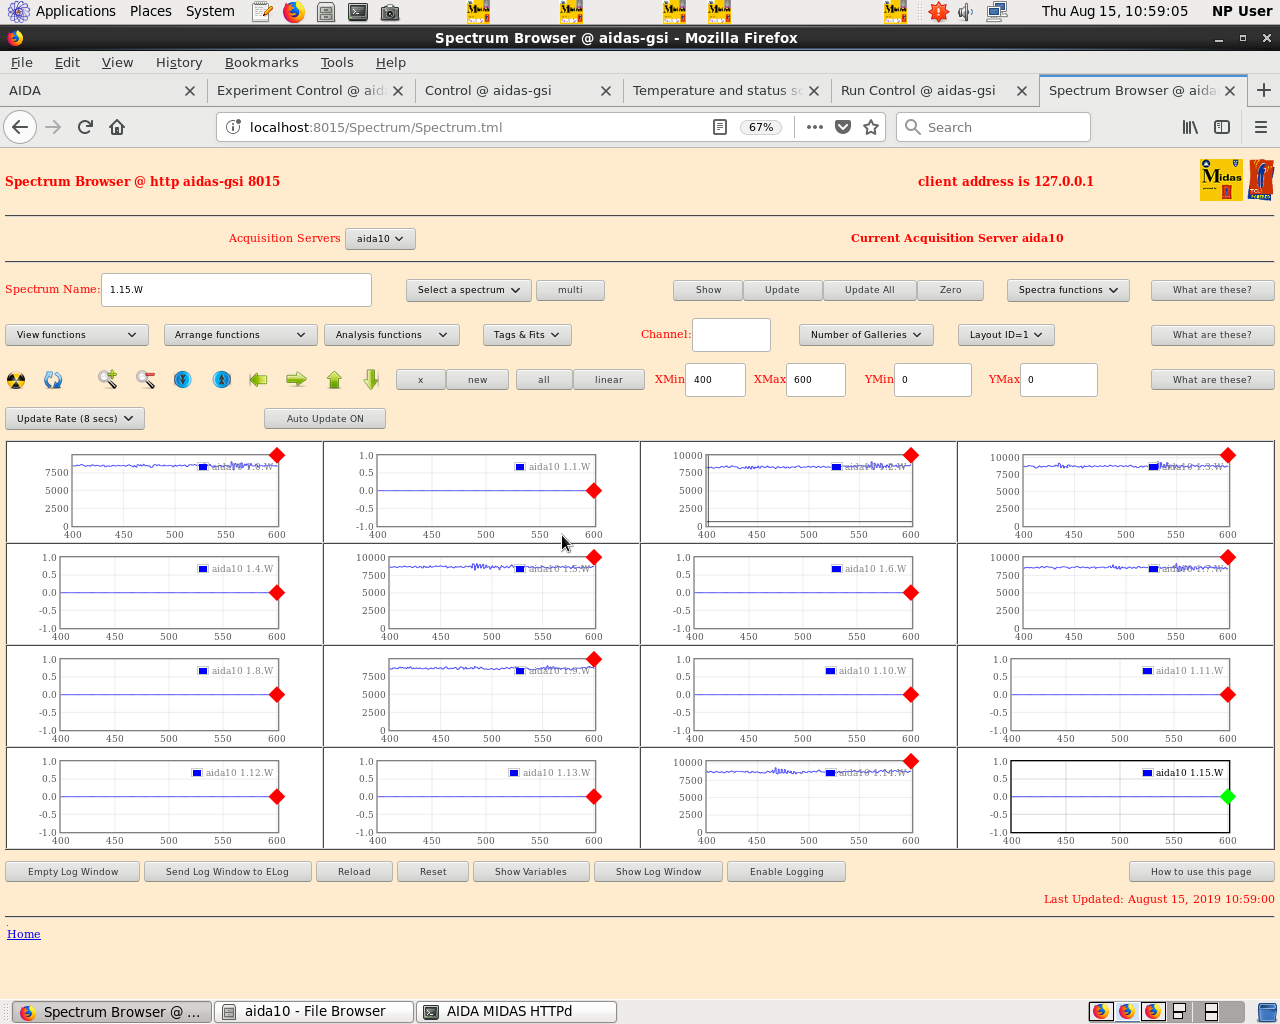
Figures 1-4: Waves for all 4 FEEs connected to the DSSD
Figures 5-8: Zoomed in on region 400-600
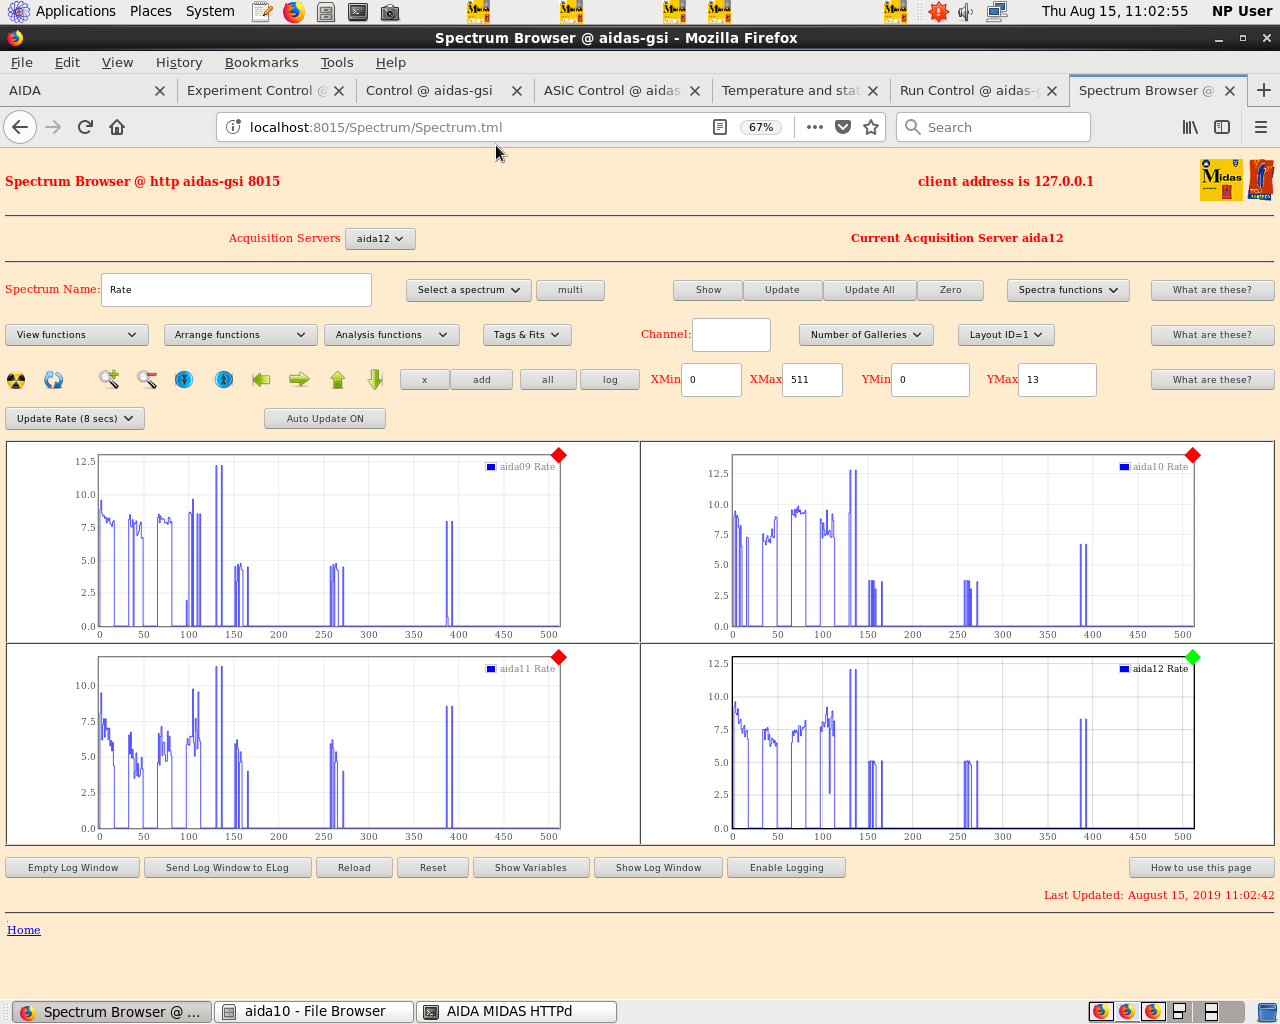
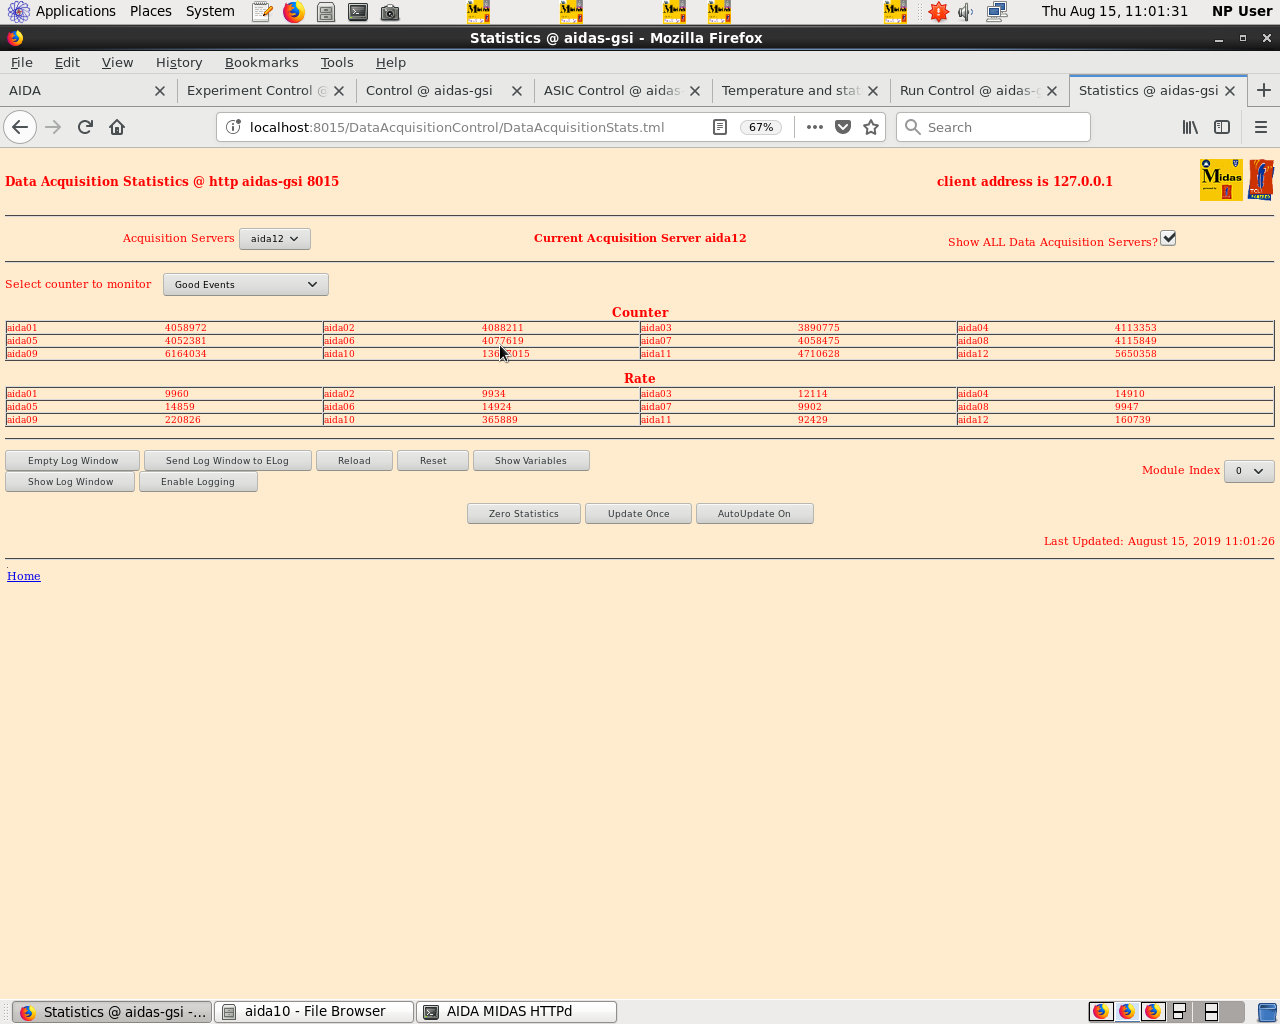
Figures 9-10: Rates in DSSD
Note in particular fee09 has a clear noise pickup somewhere. Also appears when no DSSD voltage.
Peak distance = 6 channels = 16.6 MHz.
Fee09 is connected to HV bias core (-160 V)
However unplugging the HV cable from it shows no difference.
Must be related to something else.
Update 16:29 CEST:
Distance is more like 5 channels (20 MHz)
Fee09 picks it by far most strongly but all fees you can make it out
Additionally can see a slower waveform especially on other fees... approximately 40 channels = 2.5 MHz
Checked with multimeter that low resistance path between FEE cooling plate and ground LEMO connector
also low resistance between ribbon cable copper shield and ground LEMO connector.
Noise seems to appear even if pulser cable unplugged at pulser end or when attentuation is increased weaking pulse.
|
| Attachment 1: aida09-wave-all.PNG
|
|
| Attachment 2: aida10-wave-all.png
|

|
| Attachment 3: aida11-wave-all.png
|
|
| Attachment 4: aida12-wave-all.png
|

|
| Attachment 5: aida09-wave-zoom.png
|

|
| Attachment 6: aida10-wave-zoom.png
|
|
| Attachment 7: aida11-wave-zoom.png
|

|
| Attachment 8: aida12-wave-zoom.png
|

|
| Attachment 9: RateHists.png
|
|
| Attachment 10: Rates.png
|
|
|
65
|
Fri Aug 16 15:09:05 2019 |
NH | Aida Waves (All FEEs) |
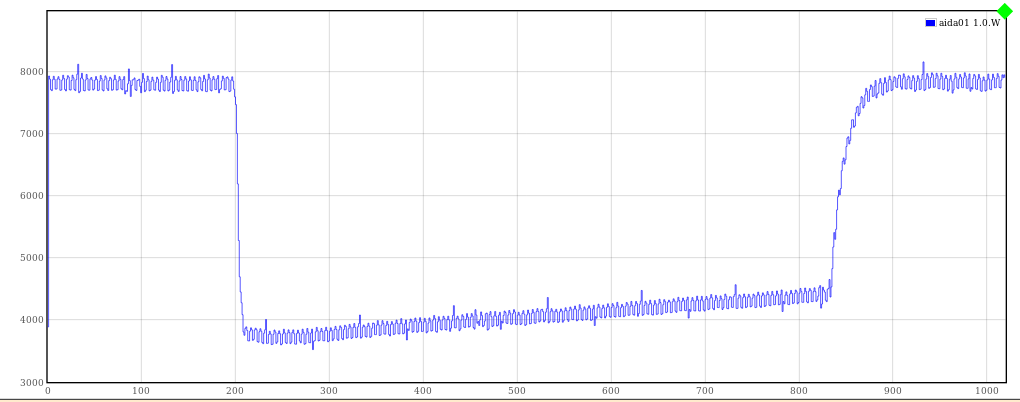
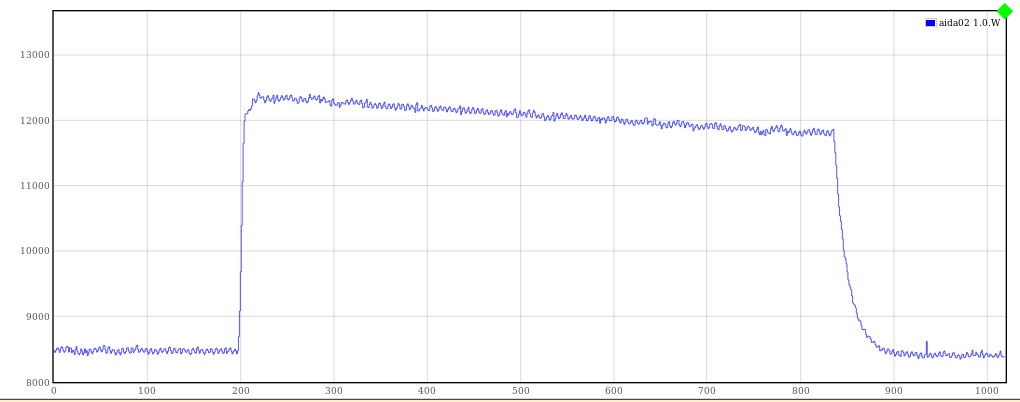
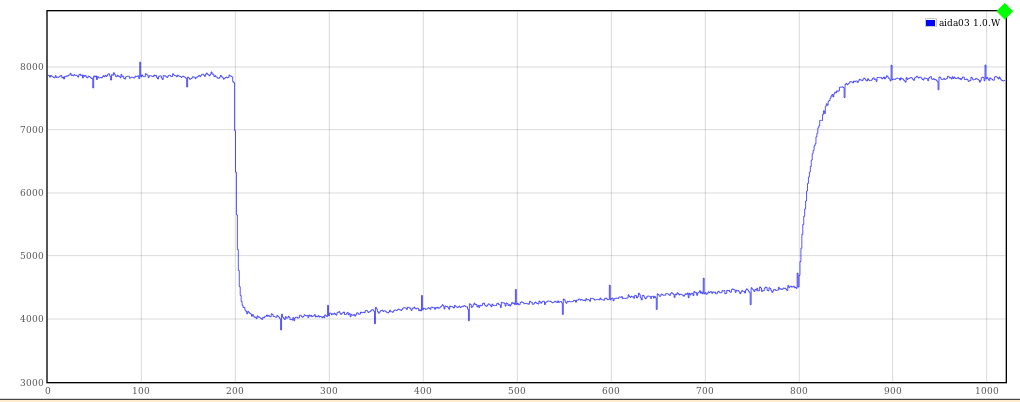
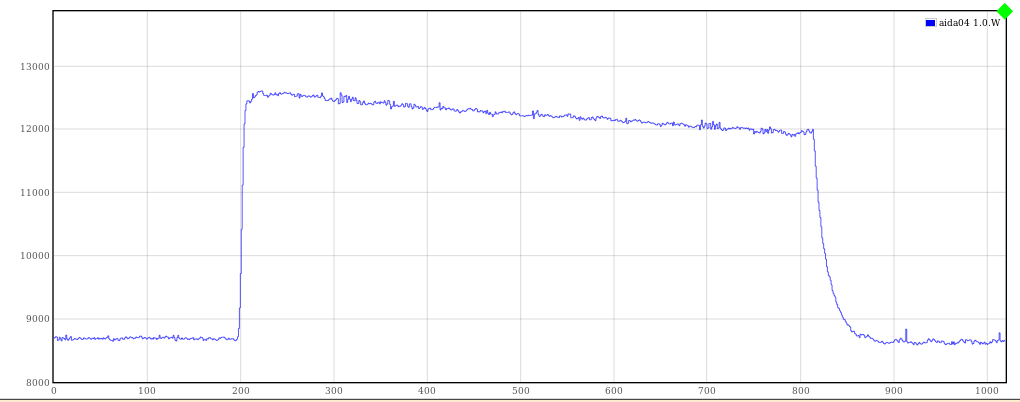
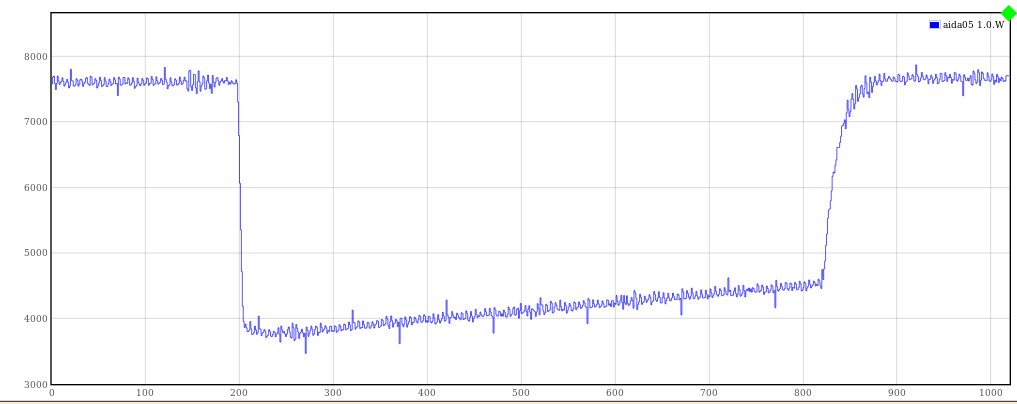
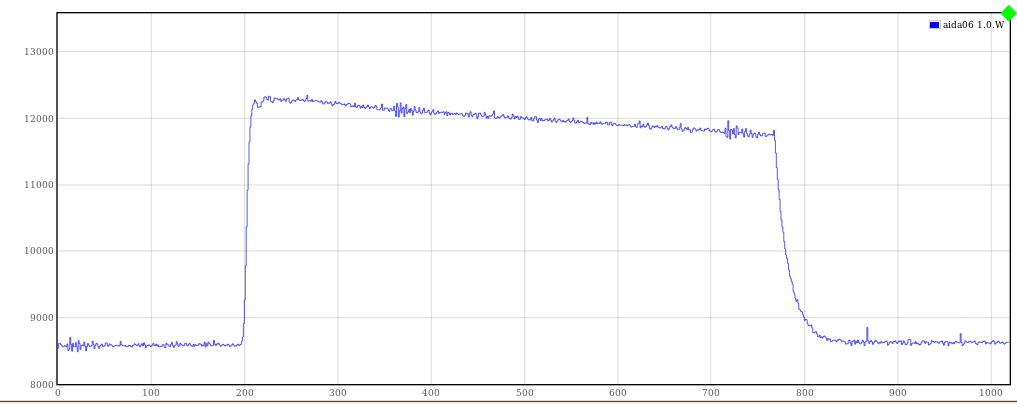
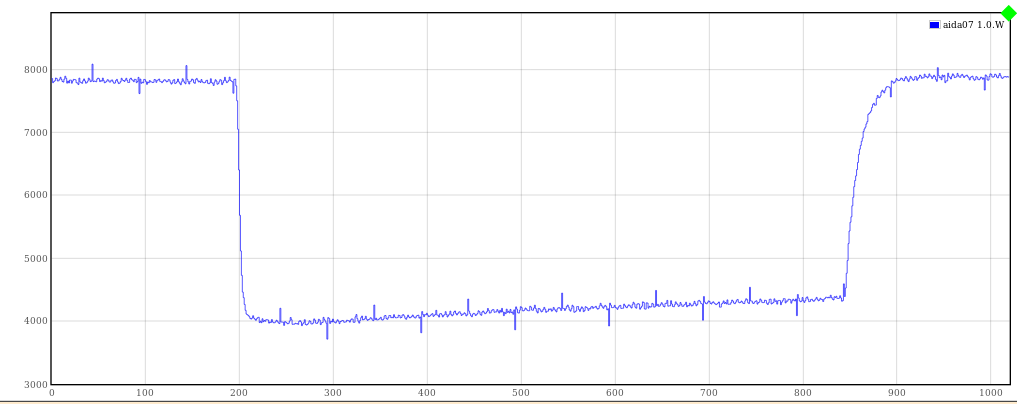
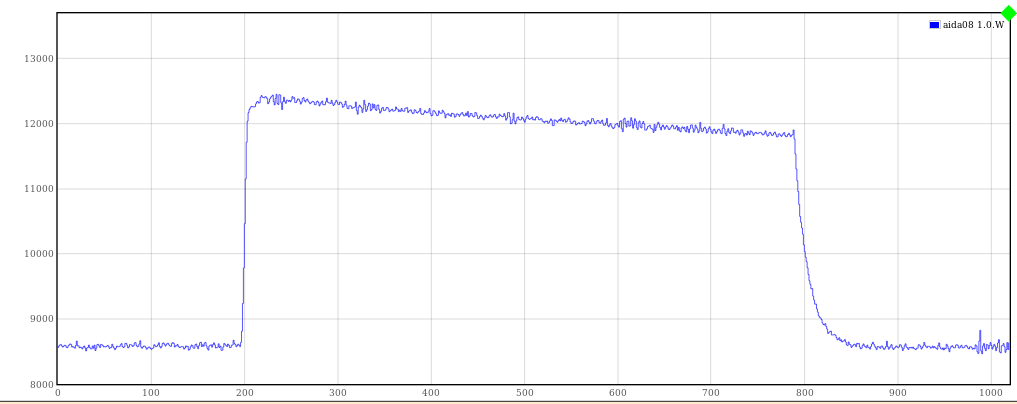
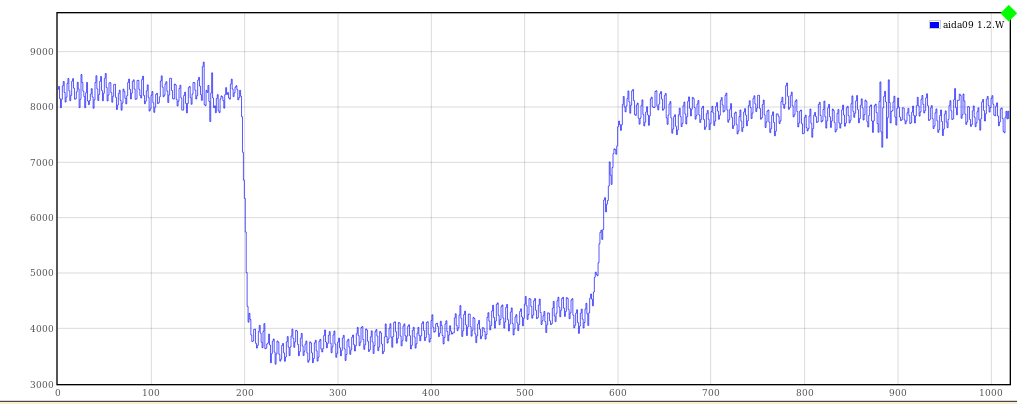
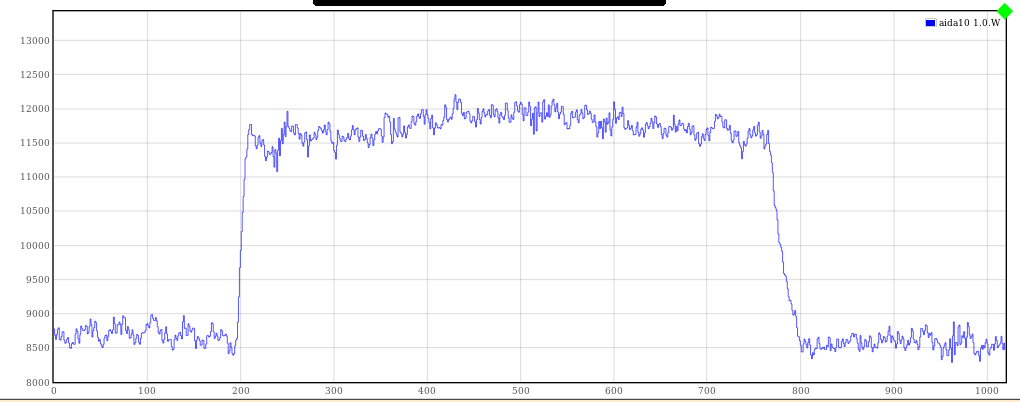
Included waves for all 12 FEEs
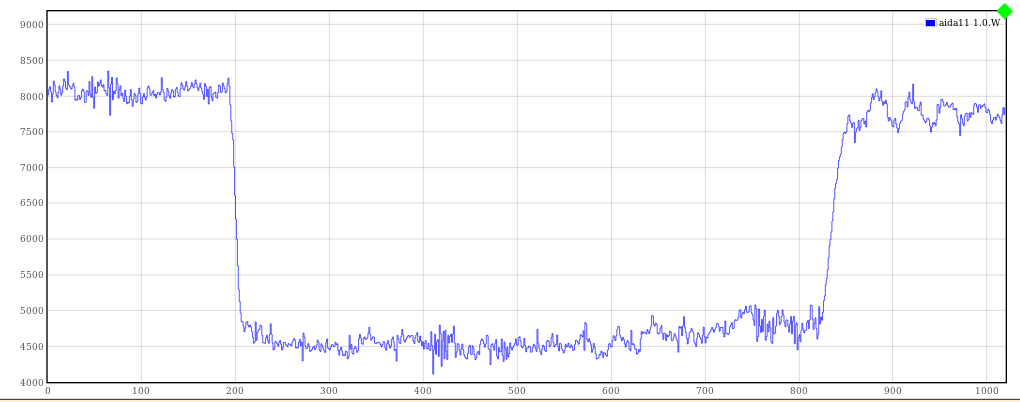
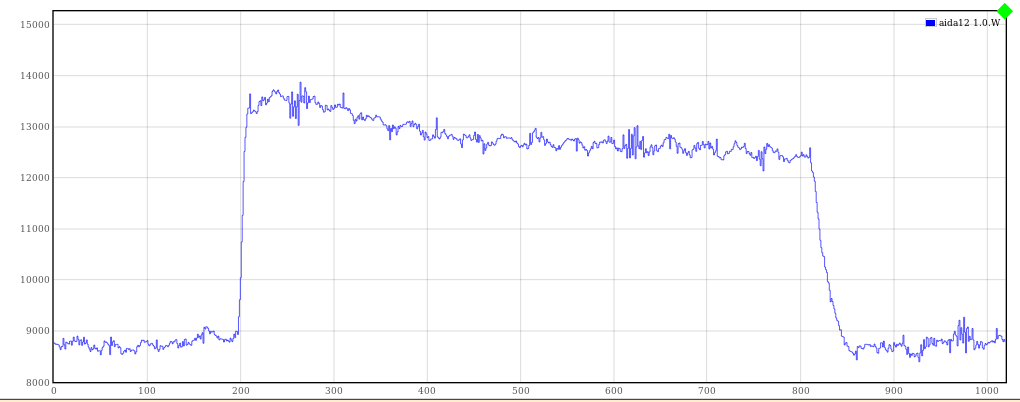
FEES 1, 5, 9 all show this HF noise on it, and are all located at the top of the AIDA mount.
Connections: HV from DSSD (-ve) is in FEE9
Pulser input is in FEE9 (non-inverted)
Resistance between FEE cooling plate and LEMO connector for all 3 FEEs is a few Ohms, as is resistance between copper braid on DSSD cable and the LEMO connector.
All FEEs show some noise but mainly those 3 and all four with DSSD. Will try to check DSSD connections in case something is messed up.
FEE layout for reference: (Beam's perspective)
FEE9
FEE5
FEE1
FEE10 FEE6 FEE2 FEE4 FEE8 FEE12
FEE3
FEE7
FEE11 |
| Attachment 1: Pulse-AIDA01.png
|
|
| Attachment 2: Pulse-AIDA02.png
|
|
| Attachment 3: Pulse-AIDA03.png
|
|
| Attachment 4: Pulse-AIDA04.png
|
|
| Attachment 5: Pulse-AIDA05.png
|
|
| Attachment 6: Pulse-AIDA06.png
|
|
| Attachment 7: Pulse-AIDA07.png
|
|
| Attachment 8: Pulse-AIDA08.png
|
|
| Attachment 9: Pulse-AIDA09.png
|
|
| Attachment 10: Pulse-AIDA10.png
|
|
| Attachment 11: Pulse-AIDA11.png
|
|
| Attachment 12: Pulse-AIDA12.png
|
|
|
66
|
Mon Sep 16 12:24:46 2019 |
NH | AIDA Monitoring |
https://docs.google.com/spreadsheets/d/1fZBybHodSvacUdKpDM_VKznqTrh49CKnqKVQVMEDWGs/edit?usp=sharing
A spreadsheet of ambient conditions and water temperature in S4 for AIDA.
Will show the distance to danger points (interlock shutdown and condensation on the pipes) |
|
74
|
Thu Oct 31 14:27:06 2019 |
NH | WR Timestamps |
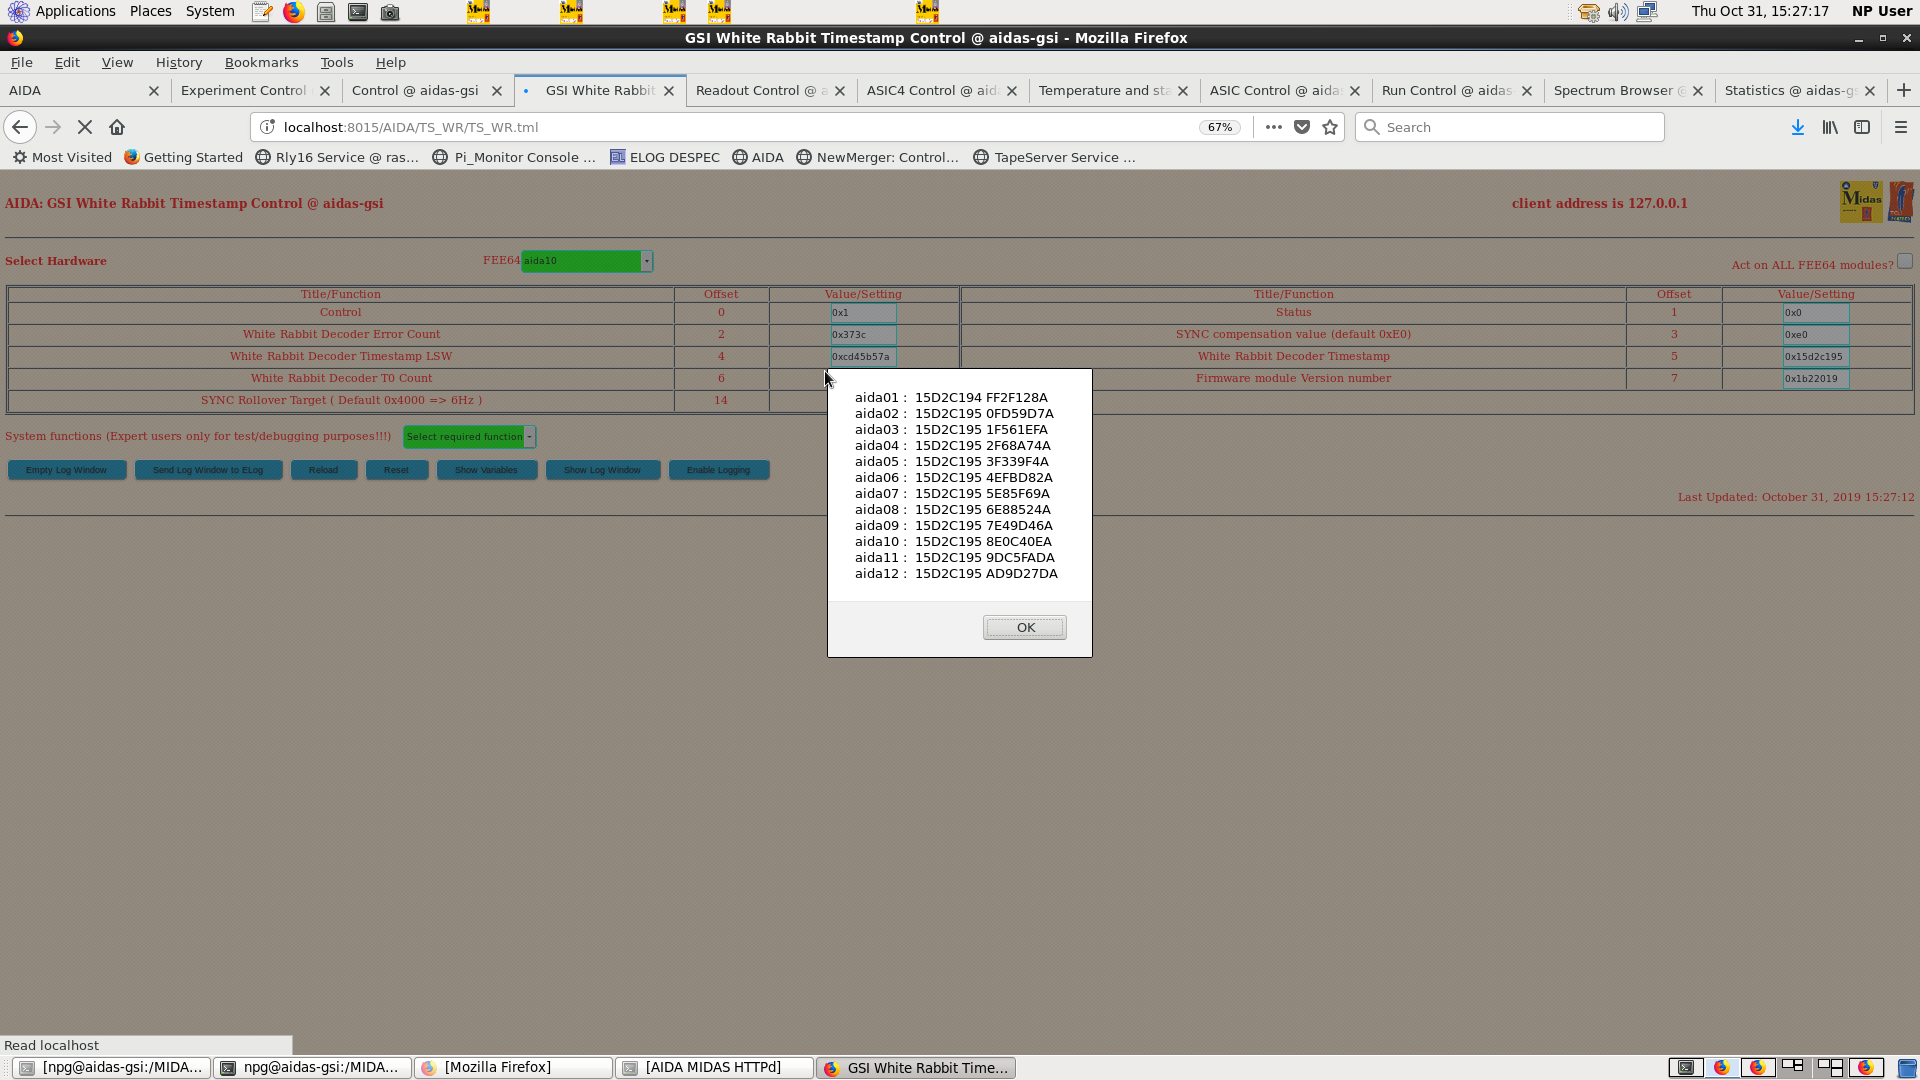
All 12 FEEs have valid WR Timestamps
Had to powercycle aida09 once as before raw readout was displaying upper 12 bits of WR timestamp as 0. Unsure of other method.

HDMI cables in aida09 checked and good. |
| Attachment 1: WRTimes.png
|
|
|
77
|
Thu Oct 31 17:13:54 2019 |
NH | Alpha Run |
Beginning Alpha run

Thresholds set to 100 (LEC/Slow) 255 (LEC/Fast) 2 (HEC)

Pulser is OFF

Recording to MIDAS: /TapeData/31Oct19/R1

Recording to MBS: /lustre/gamma/nhubbard/AIDA/Alphas311019_

Disk rate approximately 0 as expected.

01.11.19 19:11 CET: FEE10 Stat histogram was empty - performed a check/load and now rare events come in - Merger also emitted 10 blocks to storage quickly (presumably waiting on FEE10 data)
All FEEs now slowly showing alpha data |