| ID |
Date |
Author |
Subject |
|
16
|
Wed Feb 28 18:42:54 2024 |
Jakub Skowronski | Analysis and Shift Status |
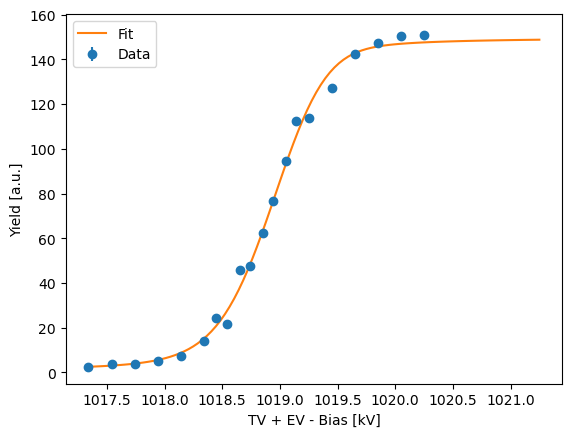
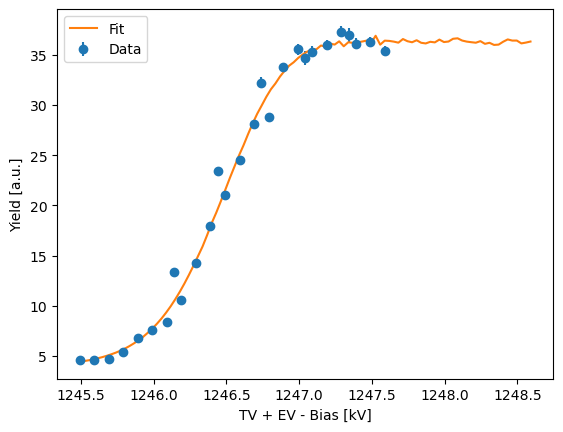
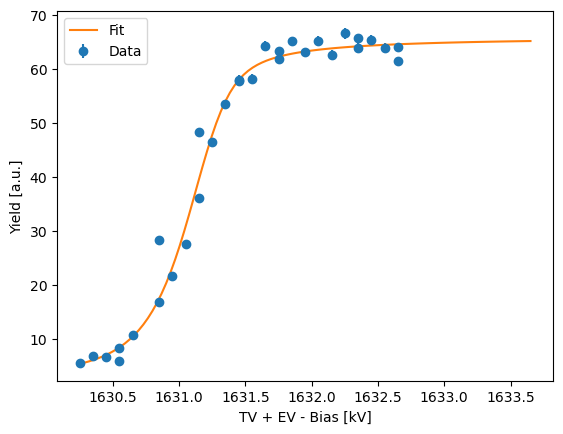
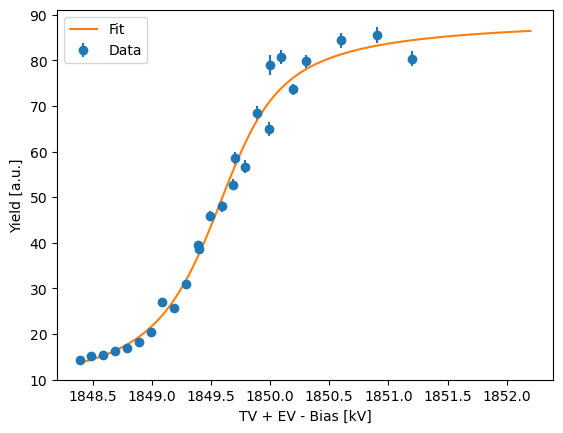
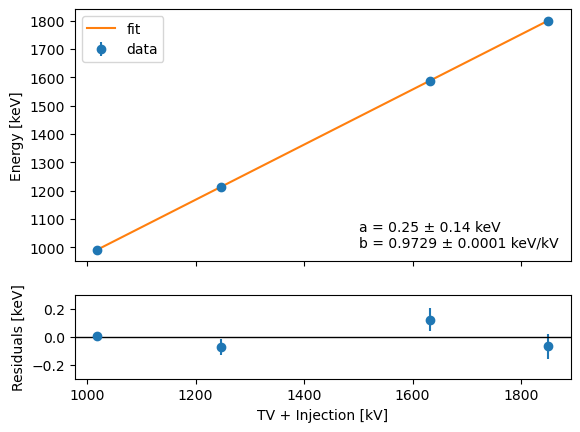
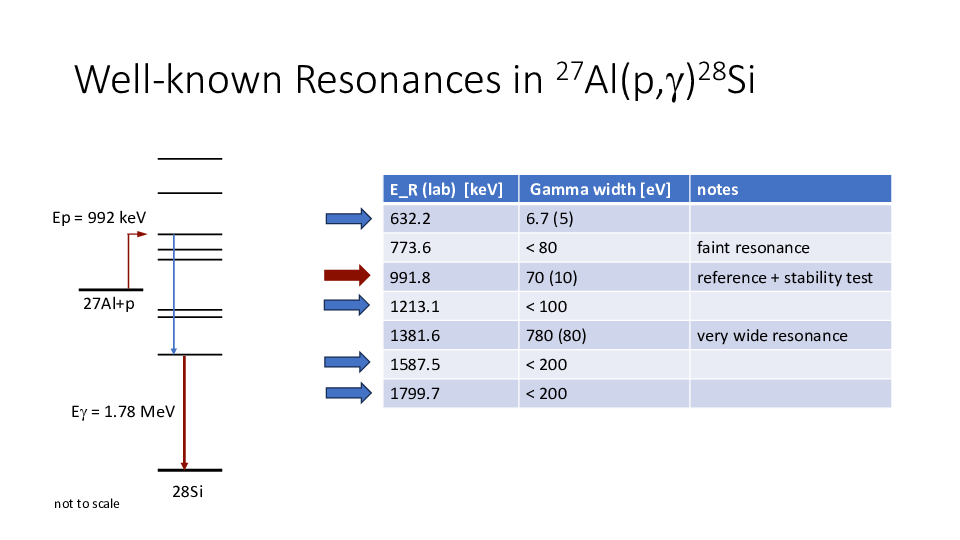
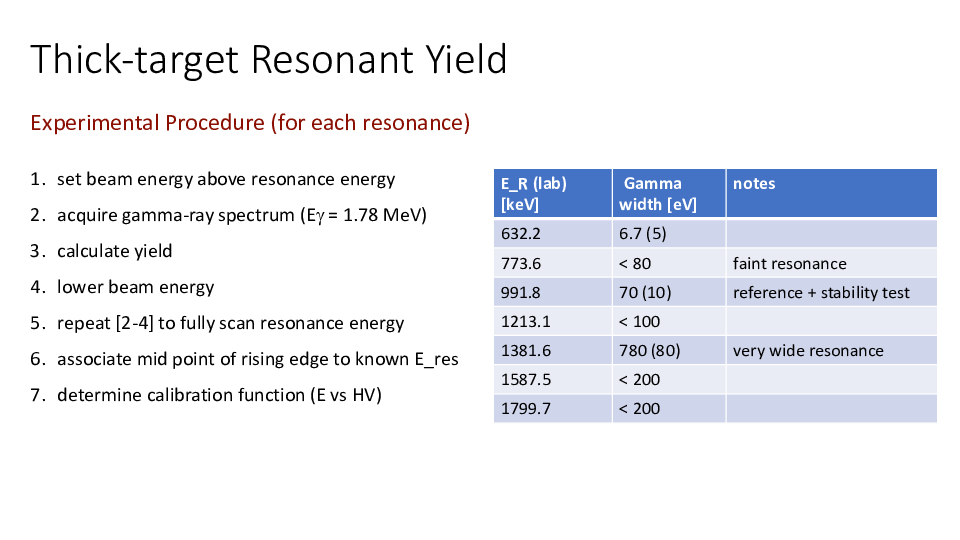
We have acquired the profiles for the 991 keV, 1213 keV, 1587 keV and 1799 keV resonances. The fits looks reasonably well (in the attachement). We also get a preliminary (but very good) calibration curve (in attachment).
The beam spread from the fits seems to be close to 200 eV. The only problem we see is the stability of the beam energy: it tends to drift a bit from run to run. Tomorrow we will take some stability measurements and we will scan the last resonances at 632 keV. |
| Attachment 1: fit_991.png
|
|
| Attachment 2: fit_1213.png
|
|
| Attachment 3: fit_1587.png
|
|
| Attachment 4: fit_1799.png
|
|
| Attachment 5: calib.png
|
|
|
15
|
Mon Feb 26 10:14:08 2024 |
RSS / Dan Robertson | Beam delivery (Full Week) |
26-Feb-2024
- Proton beam on Quartz target.
27-Feb-2024
28-Feb-2024
- Late start (11:00) due to contractor access to accelerator vault and target room access. Lookin at the 1213 KeV resonance
- Machine at start up set to Tv: 1.22576 MV. Switching mag @ -477G.
- Initial runs show we are below the resonance with a flat trend. A quick check of the trend of the 992KeV resonance tells us this is reasonable and we decide to increase the machine voltage.
- Machine set to Tv: 1.23274 MV as we try to land firmly on the plateau of the 1213 resonance.
- During initial this voltage change the machine becomes very unstable and the beam also looks to be mis-aligned through the first and second quads.
- DCF operators will retune the beam while we leave for lunch.
- Reports showed that in fact the beam was steered through the quads, and fed into the switching magnet at a slight angle.
- Running conditions for next runs are Tv: 1.23274 MV, magnet @ -452.9G. Maintaining beam currents at target cup of approx. 2uA
- Rough scan over the resonance in 300V steps. We map out the plateau and start of the front edge, but will be unable to cover the full front edge to "off resonance" conditions with the power supply. We choose to lower the machine.
- Machine set to Tv: 1.23179 MV, magnet @ -452.9G.
- Continue to scan back down the resonance in steps of 100V for better clarity on the front edge.
- Full scan of the front edge complete with a rough idea of the 50% mark at Eff = 1.24650 MeV for the 1.213 MeV resonance.
Move to the 1.587 MeV resonance scans.
- Predict that the 1.587 MeV resonance will need a Tv: 1.6165 MV for us to sit on the plateau and be able to scan the front edge with just using the bias supply.
- Machine set to Tv: 1.61655 MV, magnet @ -552.5G. Thanks to the retune during lunch this energy change is very smooth and not significant loss of beam. Quartz checked after voltage change.
- Perform a first rough scan with bias voltage steps of 300V. Establish that we have enough range to complete and come off the resonance without a shift in machine voltage required.
- Reset the bias supply and perform a more detailed scan in 100V steps.
Start a preliminary energy calibration using the last 3 points and use this to predict the location and voltage for the 1.799 MeV resonance.
- Machine set to Tv:1.83600 MV, magnet @ -561.8G. Slight retune of the beamline quad as we want a reduced beam on target of 1uA. This effectively defocuses the beam on the LE and HE slits. Checked on quartz
- With 1uA on target we see an approx. deadtime of 7%, decide to perform a rough scan quickly with this set up before looking to reduce the beam on target.
- Perform a rough scan in 300V steps. Find that we will not be able to complete the scan to off resonance with the bias supply, choose to reduce the machine energy instead.
- Machine set to Tv: 1.83409 MV, magnet @ -563.8G. Slight defocus again to reduce the beam from 1uA to 870nA. Check the beam on quartz.
- Perform a full scan in 100V steps.
29-Feb-2024
Looking for re-evaluation of the 992 keV resonance to check reproducibility before moving lower.
- Bring machine to Tv: 1.00524 MV, magnet @ -403.5G at start of day. Should put the energy firmly on the plateau. We will be slightly too high to complete a full scan of the front edge of the 992 resonance, but we should be guaranteed to the resonance and we can adjust from there.
- Beam current is slowly decreasing as the source settles, but this shouldn't affect the energy or stability, since we are integrating.
- Perform scan in 300V increments to confirm energy location. See we are approx. 1kV too high, as expected.
- Reduce machine voltage to locate us at the front edge for a more detailed scan.
- Machine to Tv: 1.00374 MV, magnet @ -403.5G. Sadly due to the low selectivity of the magnet we do not have to change the field setting. We are making sure that the beam is centered on the LE/HE slits as a feel for best energy selection.
- NOTE: There is a concern with this and earlier that any misshape in the beam will balance the HE/LE slits while the energy slice we are looking at is not where expected.
- The main concern would be during an energy change if the beam shape changes then the balance of the slits would appear correct for the selected energy, but we would be centered on a different energy slice of the transported beam. We are double checking the shape for continuity though the use of scanners and quartz positioning.
- Perform more detailed scan of the front edge in 100V steps for confirmation of calibration after a machine shutdown cycle.
- Front edge 50% shows an offset from last measurement of approx. 10eV. This may refine with further fitting, but this is close enough for us not to worry about any significant offset from the previous days running.
- Will move to the lowest resonance to complete the 5 point calibration.
Looking at 632.2 keV resonance.
- Scaling machine down to a predicted setting of 0.63453 MV, which should put us approx. 2keV onto the plateau.
- We initially attempt to scale the machine down to 634 kV without shorting rods.
- NOTE: Due to the machines operational parameters, very often shorting rods need to be inserted to short out active sections in the accelerator column. This is required to aid in beam transport out of the machine and not because of machine stability. The lower the voltage, the weaker the focusing effect of each active section and the larger the beam spread inside the machine, and subsequent loss of beam intensity.
- Machine at Tv: 0.63372 MV, magnet @ -295.8G.
- Start a rough scan of 300V steps. CANCELLED. The beam starts to drift on the LE/HE slits, moving further to LE. Stop the runs and adjust the magnet for drift.
- Magnet now @ -294.3G. Recheck the beam on the quartz for shape and direction.
- Start rough scan of 300V steps.
- During this set of measurements we see the beam on the slits drift again towards the low energy.
- We have to increase by 1kV anyway, so we quickly readjust the magnet to center the beam.
- Machine Tv: 0.63469 MV, magnet @ 292.4G. Assume that the drifting issue is with the tuning program for the switching magnet as it tries to maintain a field using the hall probe. For next set of runs we turn off this system and let the set current control the magnet.
- No more slit drift so we start a new set of scans.
- Perform scan in 300V steps
- We see the end of the plateau and then the front edge. We will increase the machine voltage to incorporate some more of the plateau.
- Machine Tv: 0.63525 MV, magnet @ -293.2G. Rerun scan in 100V steps before lunch.
SWITCH TO TANDEM FOR FOLLOWING
- Before performing the 632 scan in 100V steps we ask the operators to bring up the tandem in the range of the 992 resonance.
- Intial setting is Tv:0.48776 MV with injection voltage of 0.051 MV.
- NOTE: Effective Energy (Eff) = (Inj Voltage + (2 x Terminal voltage)) x Charge state
- Therefore Eff: 1.02652 MV, magnet @ 796.9G. We assume since the small machine was calibrated in the same way as the tandem, that voltage reading will be higher by approx. 3%.
- We see no counts in the ROI and assume we are too high.
- We change attention to run the 100V steps over the 632 before lunch
- We will make a large jump down, still assuming a 10keV target thickness, we will aim closer to the actual 992keV energy value.
- Make a 20keV jump. Tv: 0.4777 MV, magnet @ 788.0G, Eff:1.0064 MeV.
- Perform scan in 300V steps.
- Front edge appears very broard, maybe 1keV. Further fitting needed.
- We realise the slits on this line are fully open at +/- 25mm, we reduce to +/- 2.5 mm. And increase by 2keV.
- Tv: 0.47857 MV, magnet @ 792.5G, Eff:1.00814 MeV.
- Rescan in 100V steps.
BACK TO SINGLE ENDED MACHINE
- Return to Tv:1.00523 MV to perform a stability test.
- Use the power supply to alter beam energy to the 50% mark and run in 3 minute increments until we have to leave. Should be able to perform 6 measurements before shutdown.
01-Mar-2024
Initial set-up. We will bring the single ended machine to the front edge of the 992 resonance and perform another stability run after the few points we saw yesterday seem to indicate a longer baseline variation. The tandem will be brought up to the previoius settings of yesterday, which we believe showed us the 1025keV resonance and not the 992keV. From these known numbers we will scale down to the suspected region for the tru 992, as shown below.
- TANDEM calc. Previous (Eff. = 1.00784 MV) with Inj = 51kV, Tv:478.42 kV (Assumed resonance energy reached 1025.3 keV)
- Predicted next run (Eff = 0.97484 MV) with inj = 51kV , Tv: 461.92 kV (Assumed location of 992 keV)
SINGLE ENDED MACHINE
- Machine setteld at Tv: 1.00489 MV (std=0.00032), magnet @ -404.2G
- We use the bias supply to center us on the front edge and will run here in 2 min saved runs.The granularity of 2 minutes is not supper important as we can combine data at a later date, but a more "real time" feedback of the trend is important for comparing with any fluctuations in the machine parameters.
- NOTE: For any furhter measurements it would be advnatageous to simultaneously log the grid voltage (GridVR) from the system in comparison to the stability measuerement.
- The intial scan of the stability measurement is somewhat confusing. (Further analysis should generate plots for comparison)
- The trend seems stable within a reasonable range for the first several points then the calculated yeild drops sharply before continuing a slow drop off. During this we see a continuous drop in beam current, but since we are integrating the current with the run this should ahve no effect.
- A possible explanation would be a shift in the ion source that is moving the beam relative to the transport envelope. This would pass a slightly different energy slice through the switching magnet. In reality we should see this on the LE/HE slits but we do not.
- We recheck the tune to make sure all internal systems are balanced and also check the quartz for beam shape. All looks as before.
- Change the bais supply to make sure the effective energy is back at the front edge.
- When beam is placed back on target we see again a decrease again.
- There seems to be a few runs where the stability is constant but then a drop off. At this point the beam on target is approx. 700nA and appears to have stabilized.
- NOTE: I do not believe this is associated with a shift in the accelerator. The LE/HE slit balance looks very stable and the machine GVM reading is with a varaition of 200V.
- It is either an artifact of the magnet drifting. Which would be strange, as it appears that we are drifting only towards lower energy and not osciallting. Or this is a target effect based on the bias supply or target surface.
- A peoposal is a build up of carbon. This also wuld be very strange considering the cleanliness of the system and the very small accumilated charge we have put on the target. However, we try an new target just in case.
- The new target is now seeing only 700nA and has not seen beam before. All of the accelerator ssytems have had a chance to settle over time and so those are not suspected.
- The same drift occurs on the fresh target. We see some immediate stability and then the yield drops off with time. We have not see this when measureing the resonance front edges and I am currently at a loss to explain the trends.
|
| Attachment 1: trim.4B949AD4-6E9C-4F12-947C-3E36A061E383.MOV
|
|
14
|
Wed Feb 21 11:53:46 2024 |
RSS MA TD PB KL | Run Info |
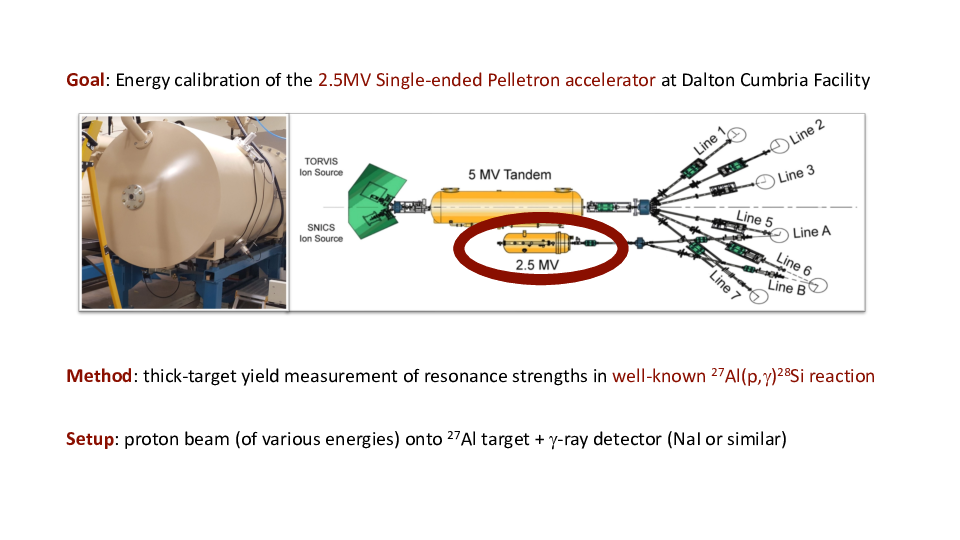
DCF 2.5 MV Single ended accelerator - https://docs.google.com/spreadsheets/d/1jks2Y5VR_BGf1YwUndlmW_C43jZDB7QyLkldrHH80Bg/edit#gid=0
DCF 5 MV Tandem accelerator - https://docs.google.com/spreadsheets/d/1t1edlHz1Ib8VLhuYZccxvRvof_44Y1LJ6sL3j_olk2I/edit#gid=0 |
|
13
|
Wed Feb 21 10:36:48 2024 |
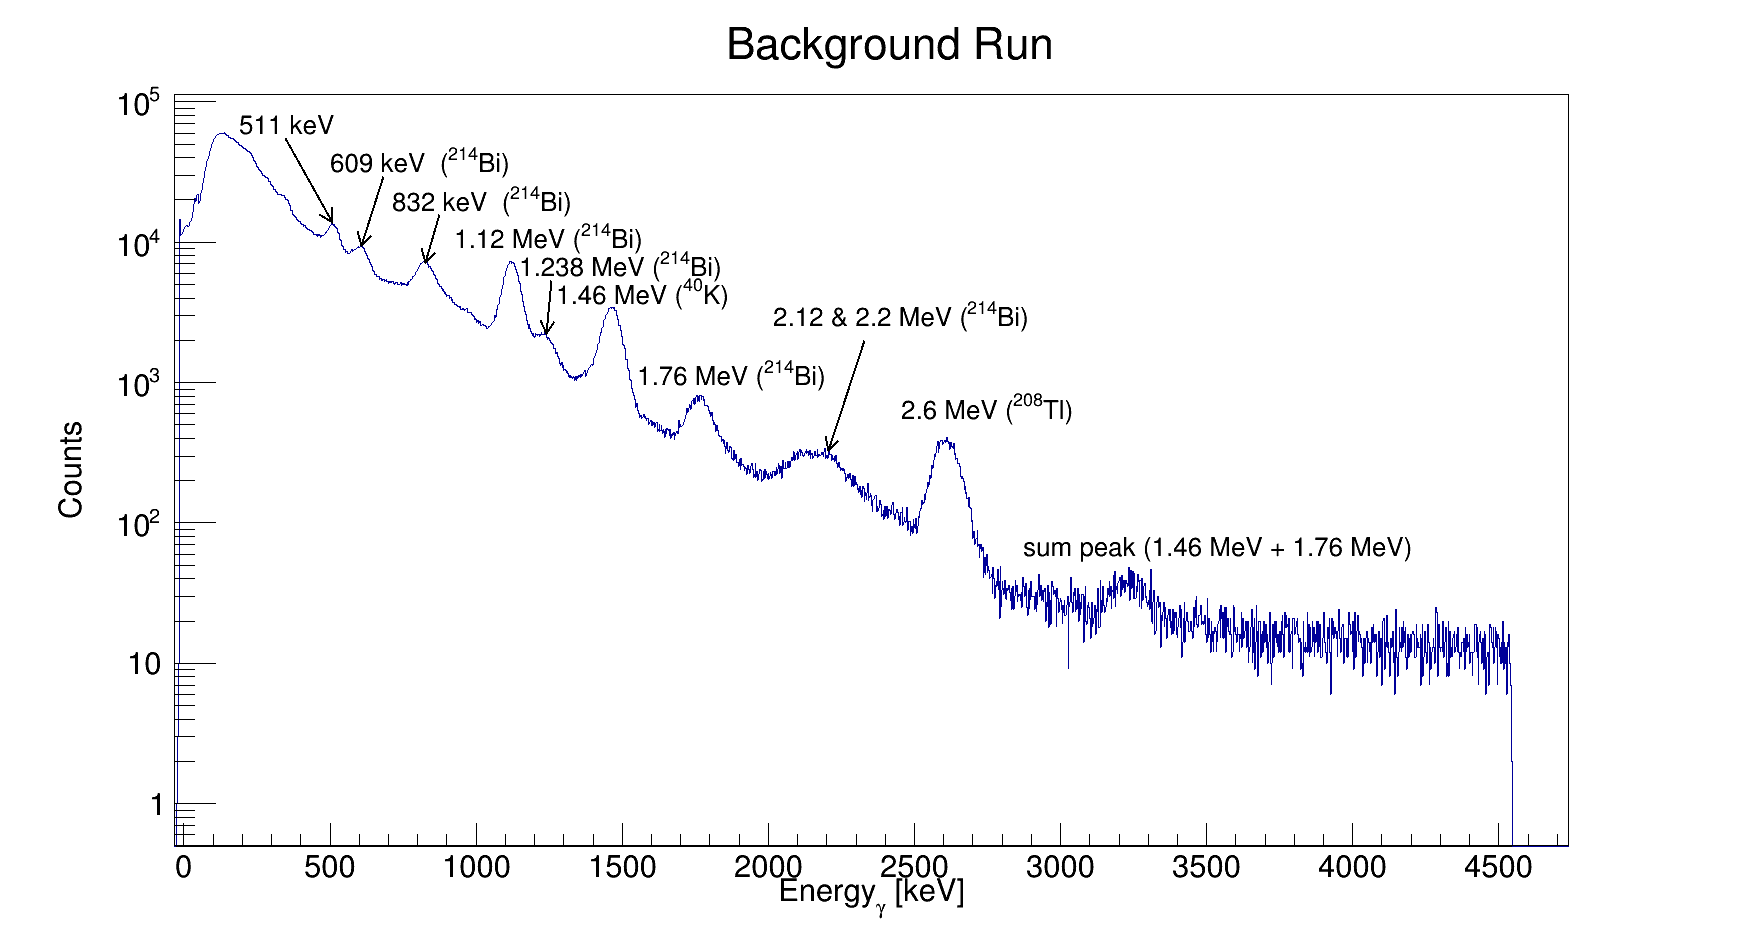
RSS MA TD PB KL | Natural background run |
|
| Attachment 1: Natural_Background_21.02.2024.png
|
|
|
12
|
Tue Feb 20 16:16:31 2024 |
RSS MA TD PB | 22Na source and natural background run |
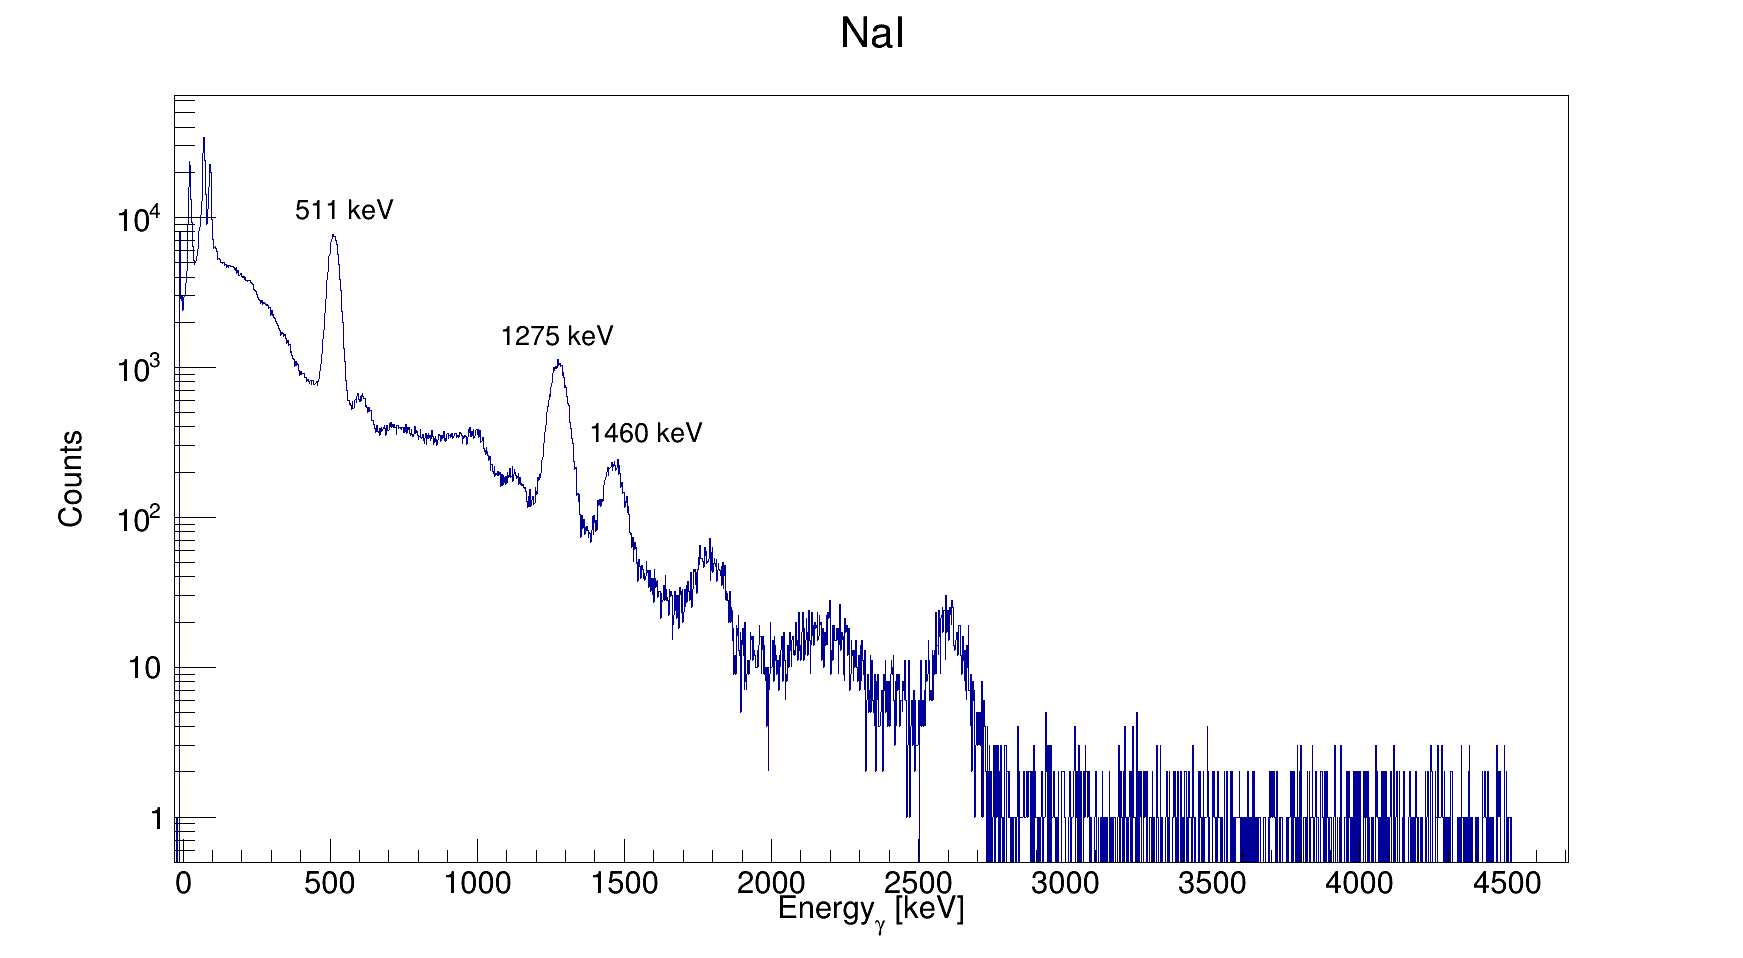
We used a 22Na source for calibration. Attached is the calibrated spectrum. |
| Attachment 1: calibration_22Na_source.png
|
|
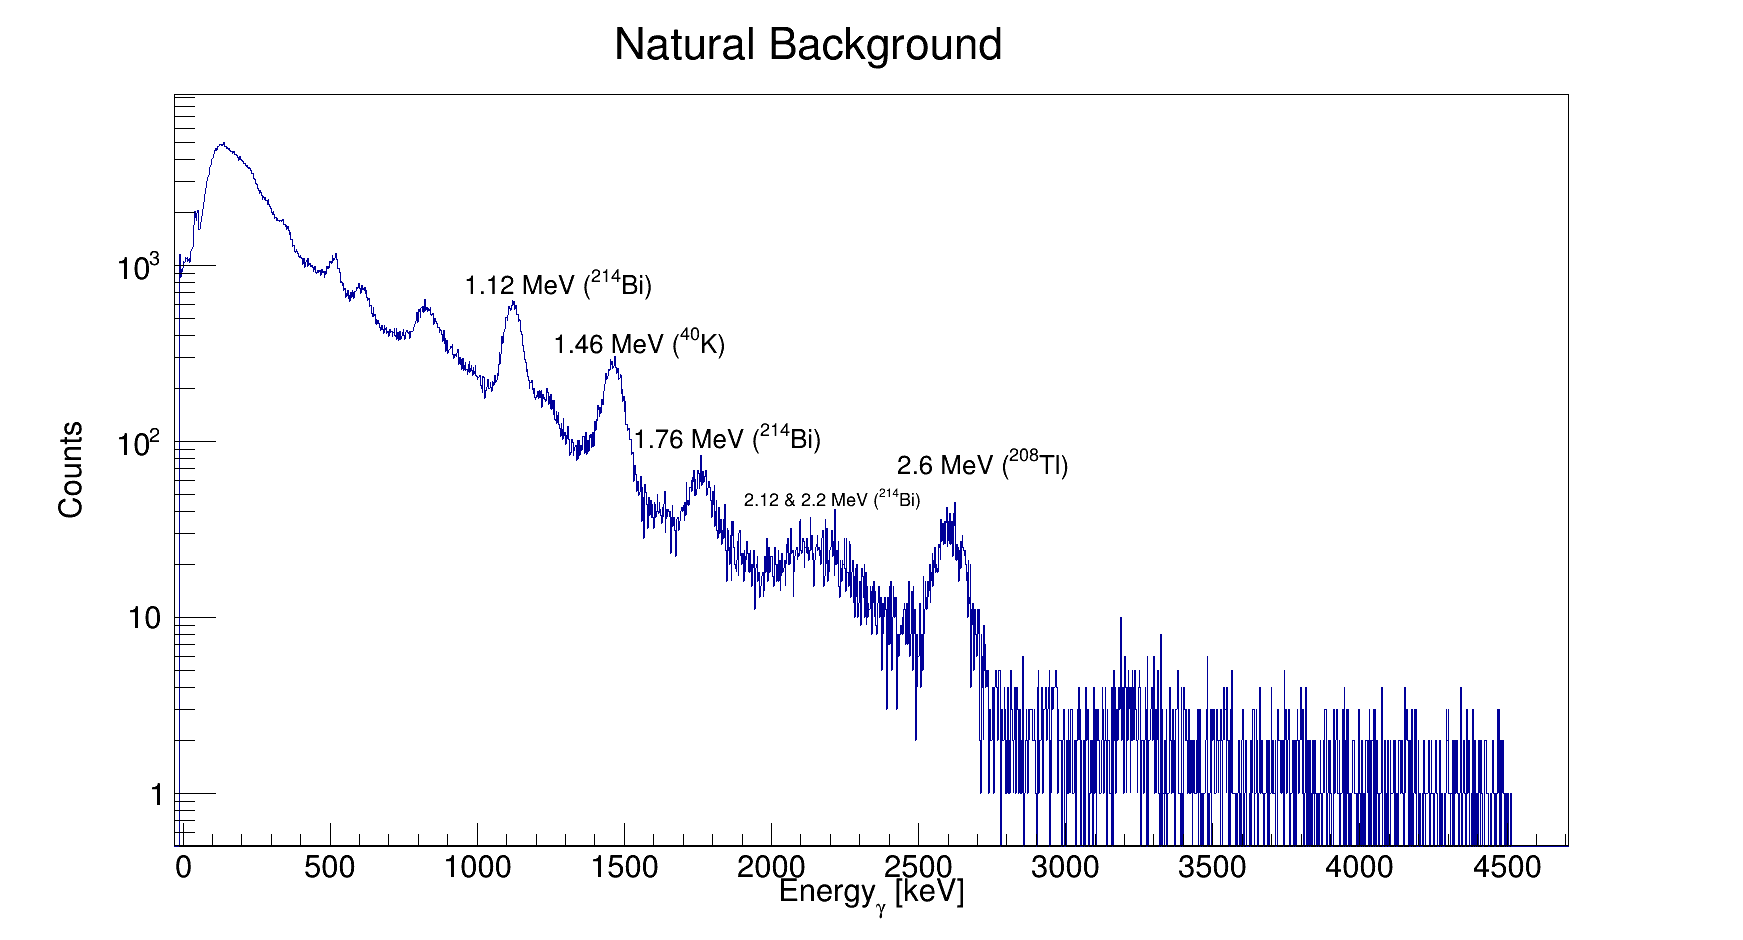
| Attachment 2: Natural_Background.png
|
|
|
11
|
Tue Feb 20 13:17:12 2024 |
RSS MA TD PB | Mounting at DCF |
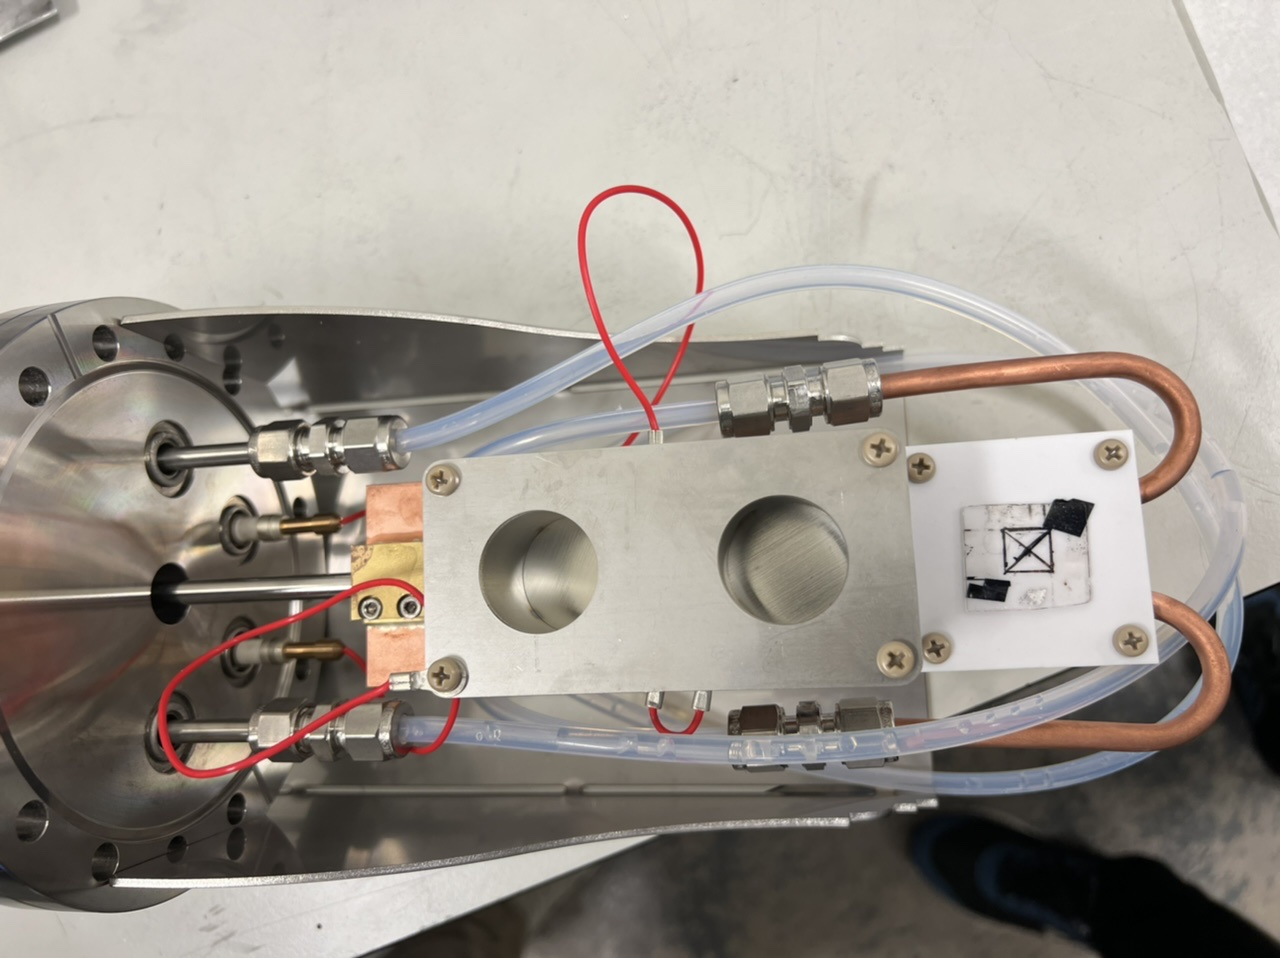
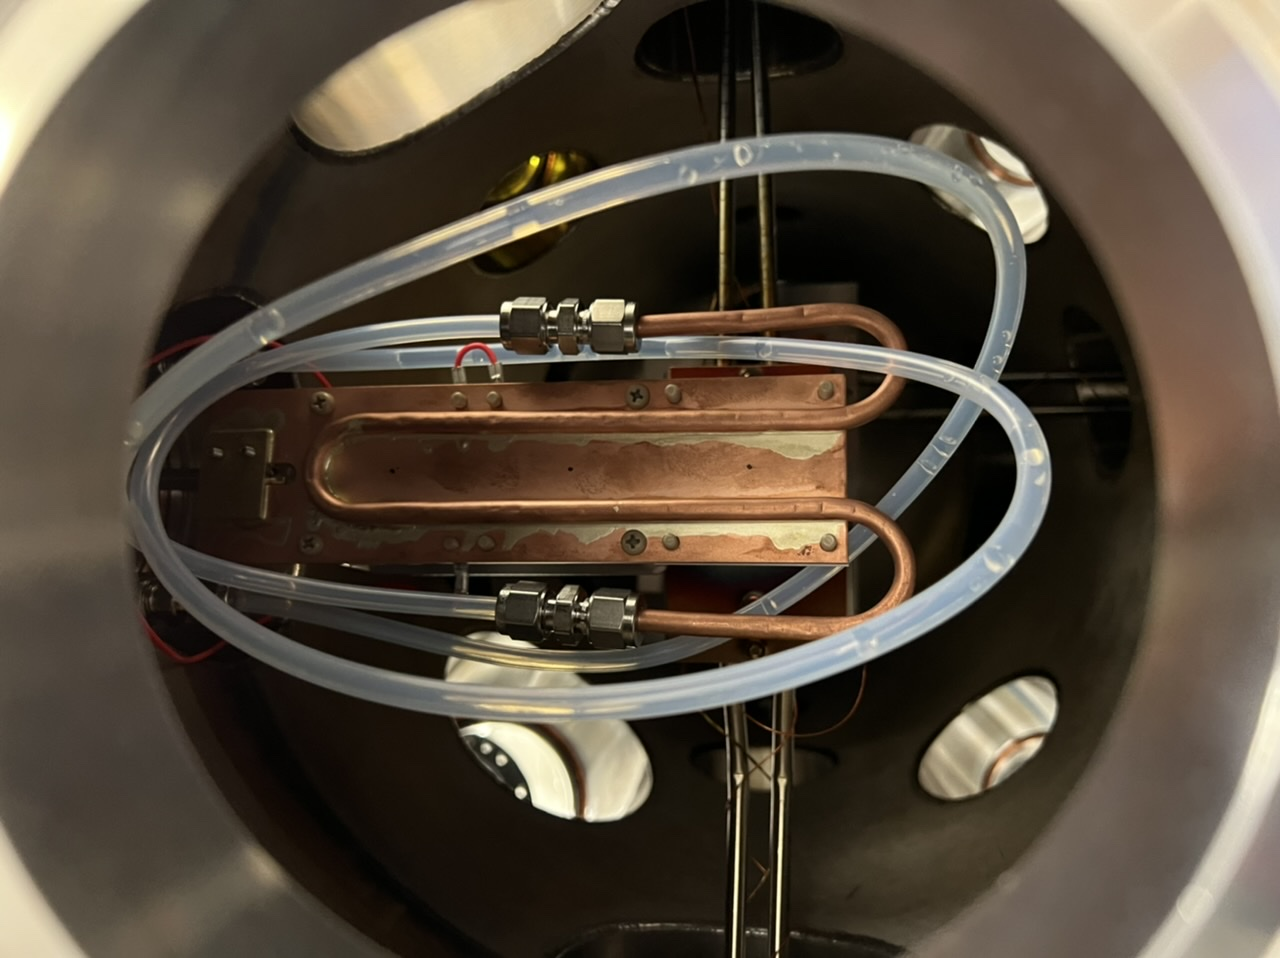
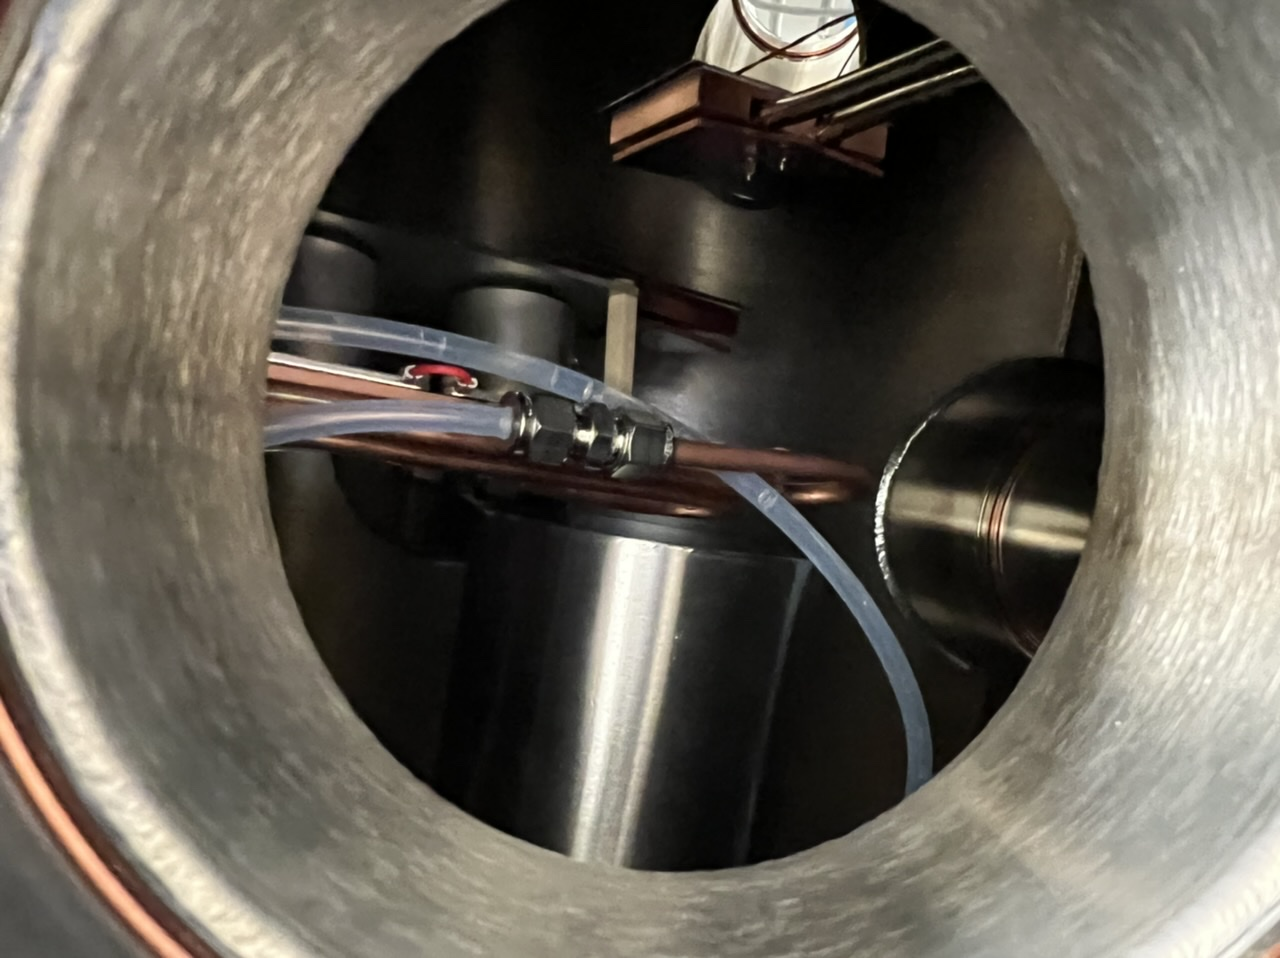
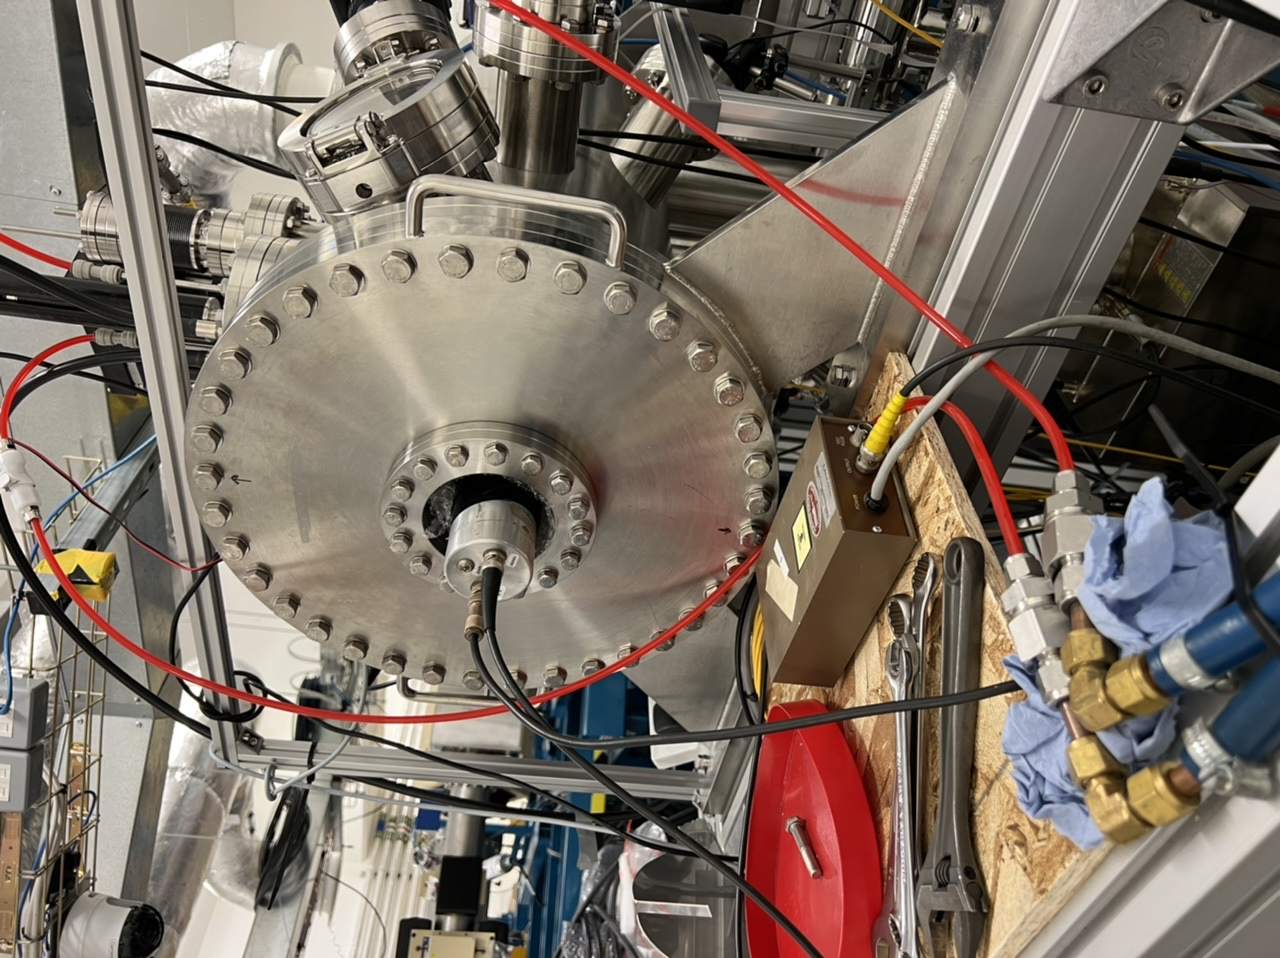
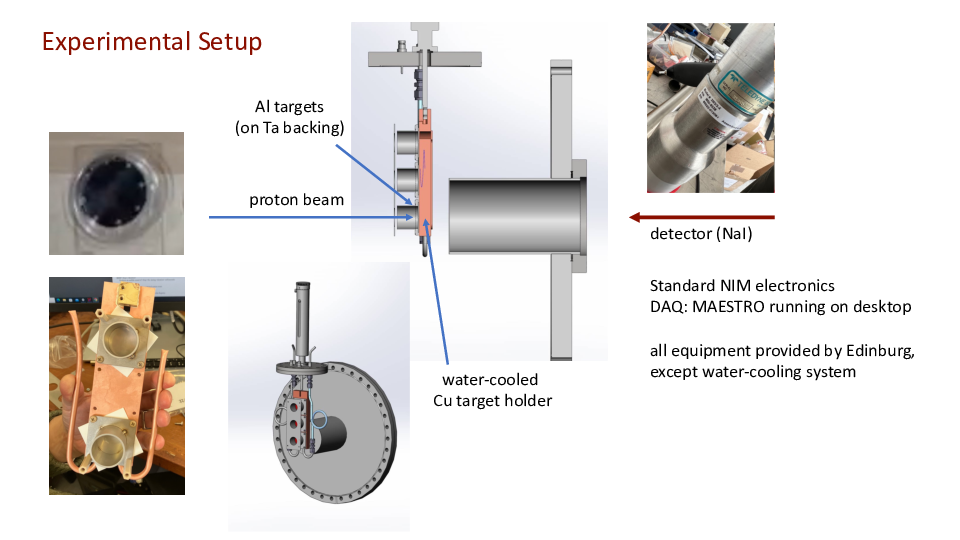
On the ladder, Quartz was mounted on the bottom position. The bottom position (Quartz) is called target 1 at 0 mm, middle position (27Al target on Ta backing) is called target 2 at 50 mm, and top position (27Al target on Ta backing) is called target 3 at 100 mm.
On HV supply, Channel 0 is connected to Suppressor and Channel 1 is connected to Target.
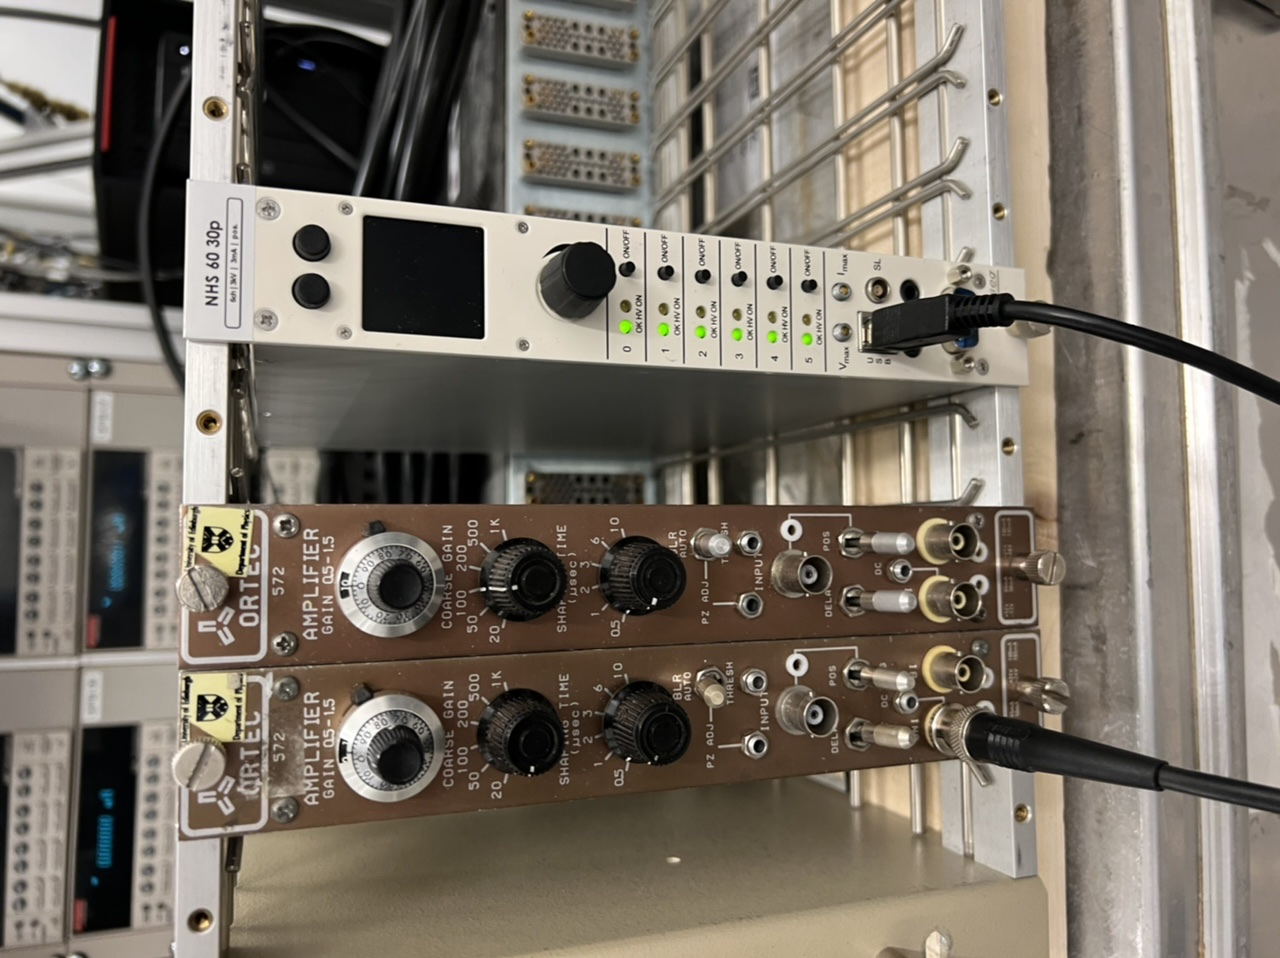
Settings on Electronics:
HV to NaI detector = +694 V
Amplifier gain x1 (internal jumper) x1.5 (fine gain) x20 (course gain)
Shaping time is 0.5 us |
| Attachment 1: 7409CED3-B991-4CAD-AB47-60591C07DBE7.jpeg
|
|
| Attachment 2: C166146D-5A59-4C2F-A1D8-EF062DA672D4.jpeg
|
|
| Attachment 3: E0EDF9BB-23D9-4DAD-B0AB-684A07616DF1.jpeg
|
|
| Attachment 4: 8E092802-CABF-4207-89F6-775210CBA1E1.jpeg
|
|
| Attachment 5: E053DDE4-57F1-4F9D-BB13-6EC57A67E756.jpeg
|
|
|
10
|
Tue Feb 20 13:11:54 2024 |
RSS MA TD PB | Vacuum & Leakage current |
Leakage current test for channel zero before pumping down:
Voltage [V] Current [nA]
500 40
1000 20
2000 10
3000 10
We started pumping down.
Date Time Pressure
20.02.24 12:30 4.5E-5 mbar
20.02.24 13:10 1.9E-5 mbar
20.02.24 14:04 1.6E-5 mbar
20.02.24 14:53 1.3E-5 mbar
20.02.24 15:44 1.1E-5 mbar
21.02.24 09:40 5.7E-7 mbar
|
|
9
|
Mon Feb 19 18:26:23 2024 |
RSS MA TD PB | Mounting at DCF |
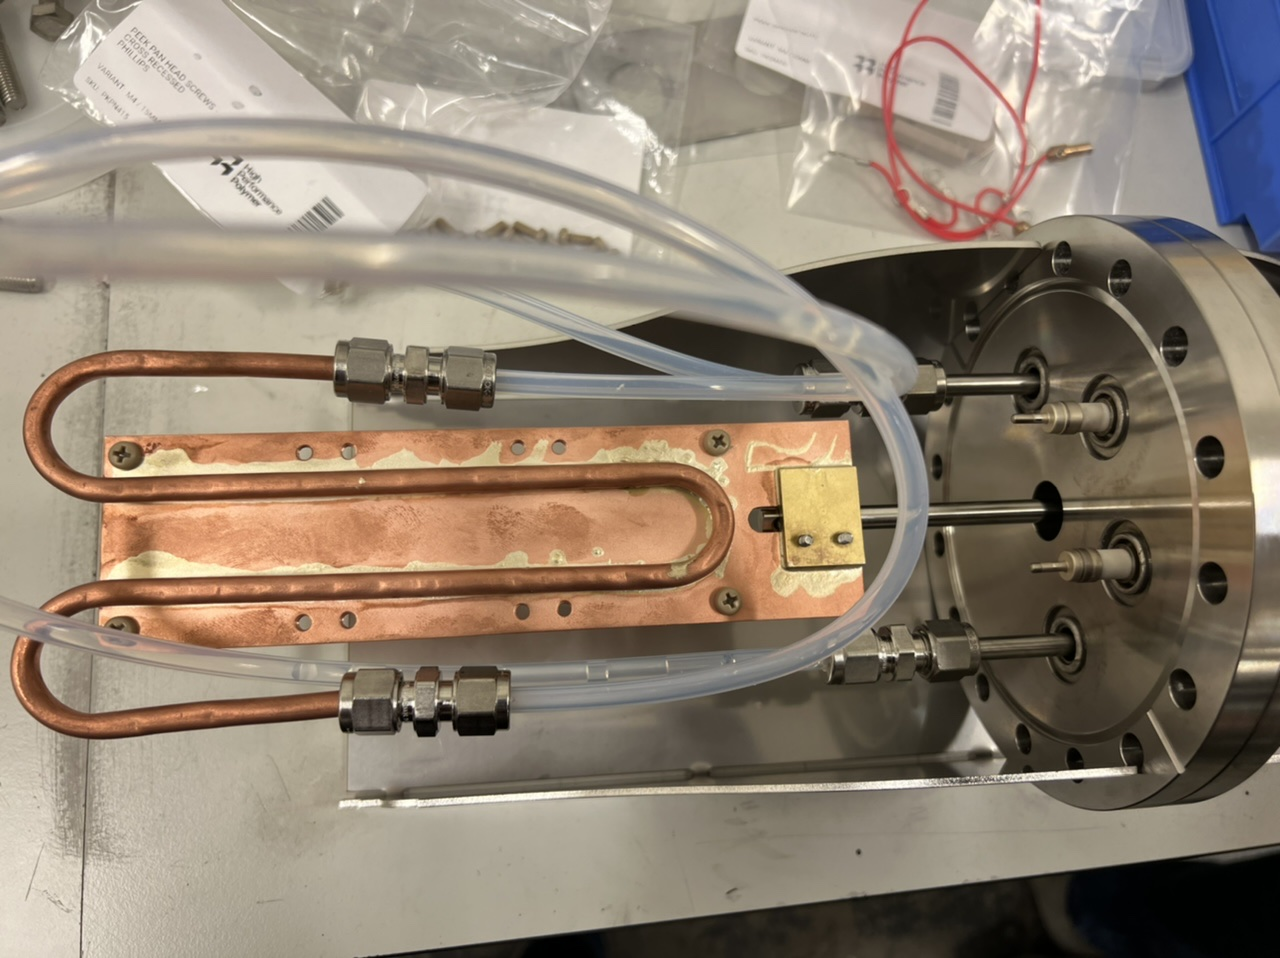
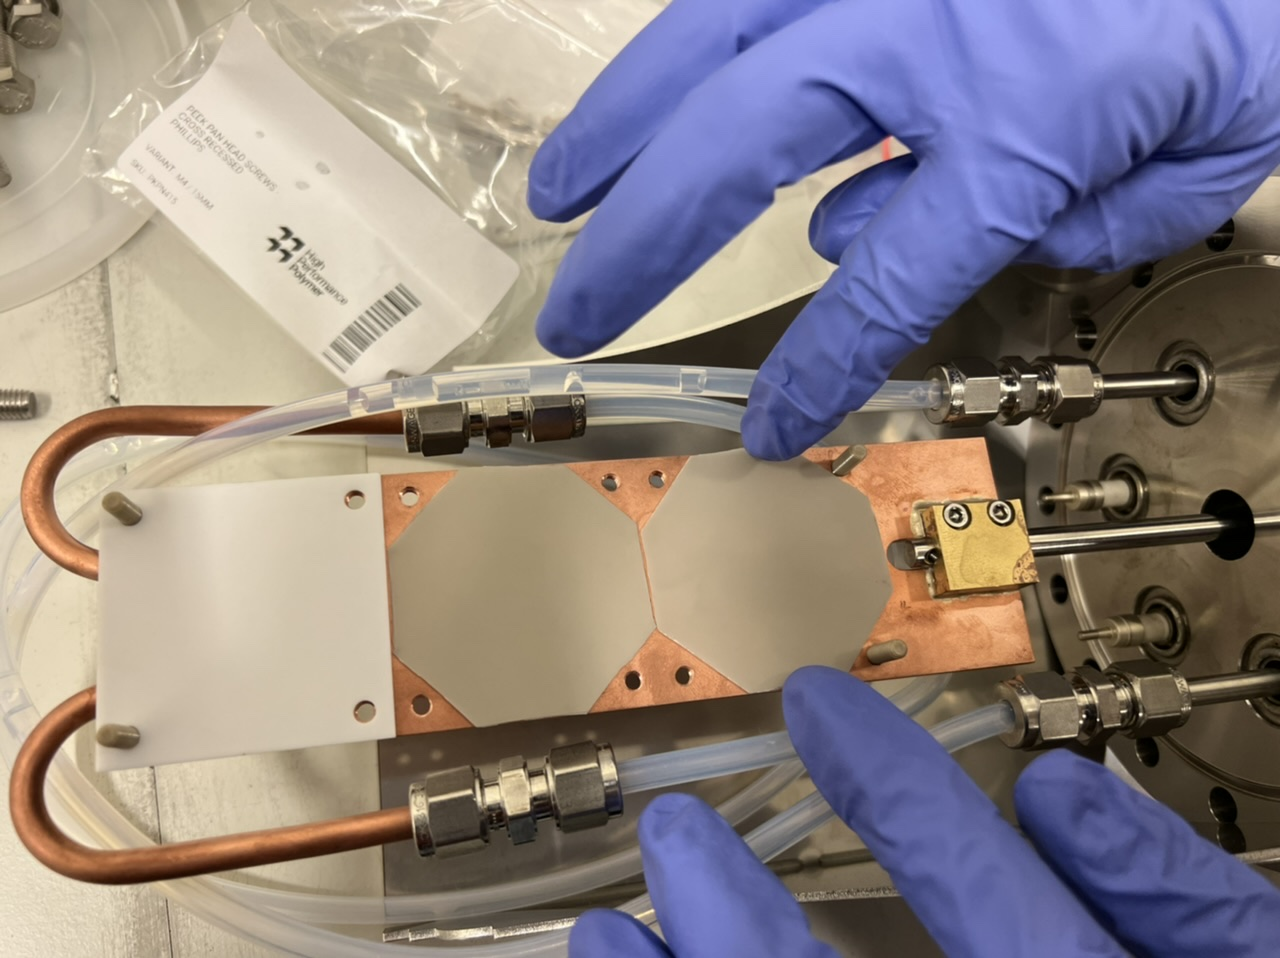
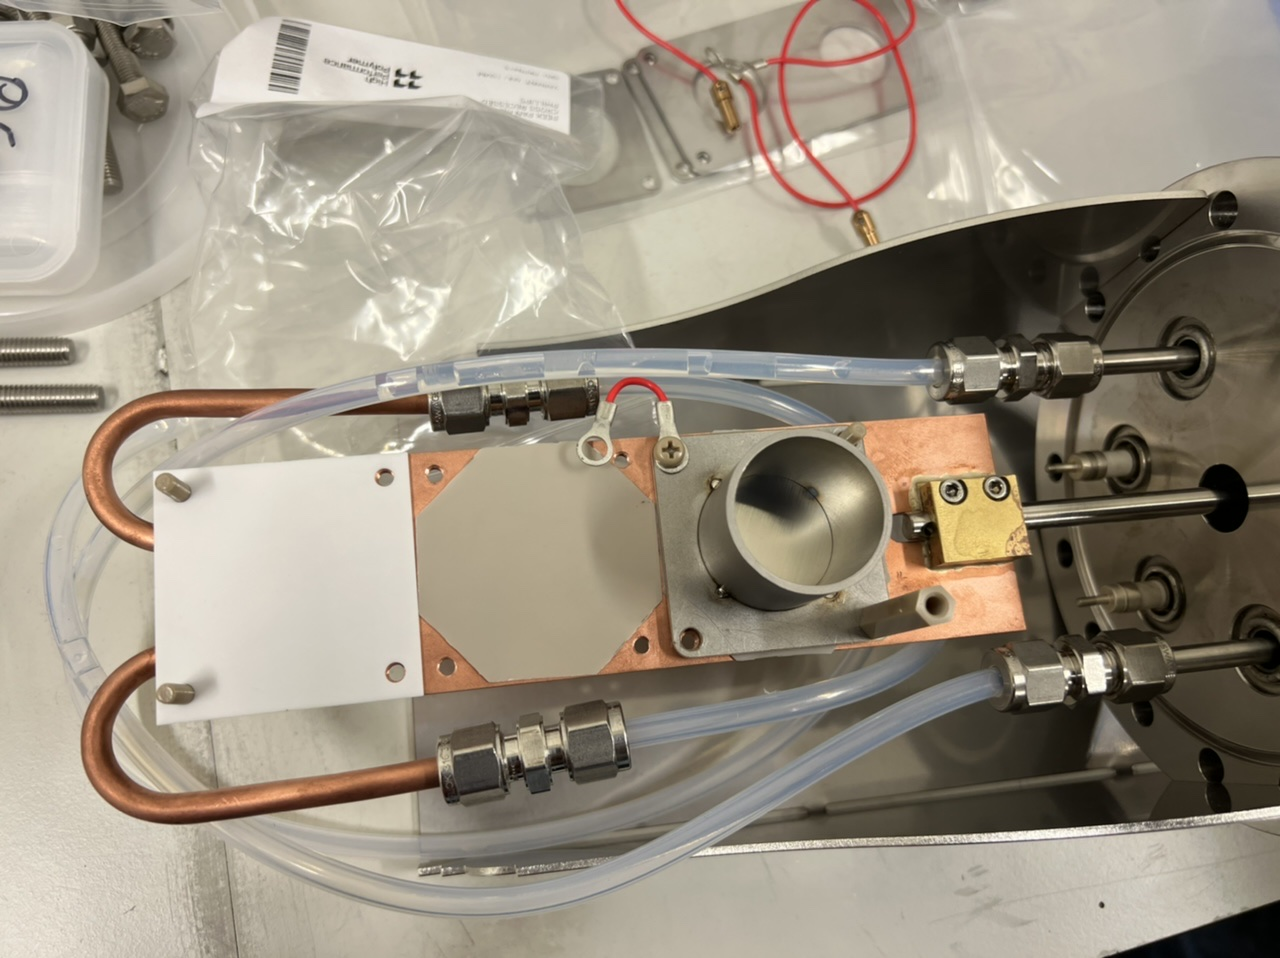
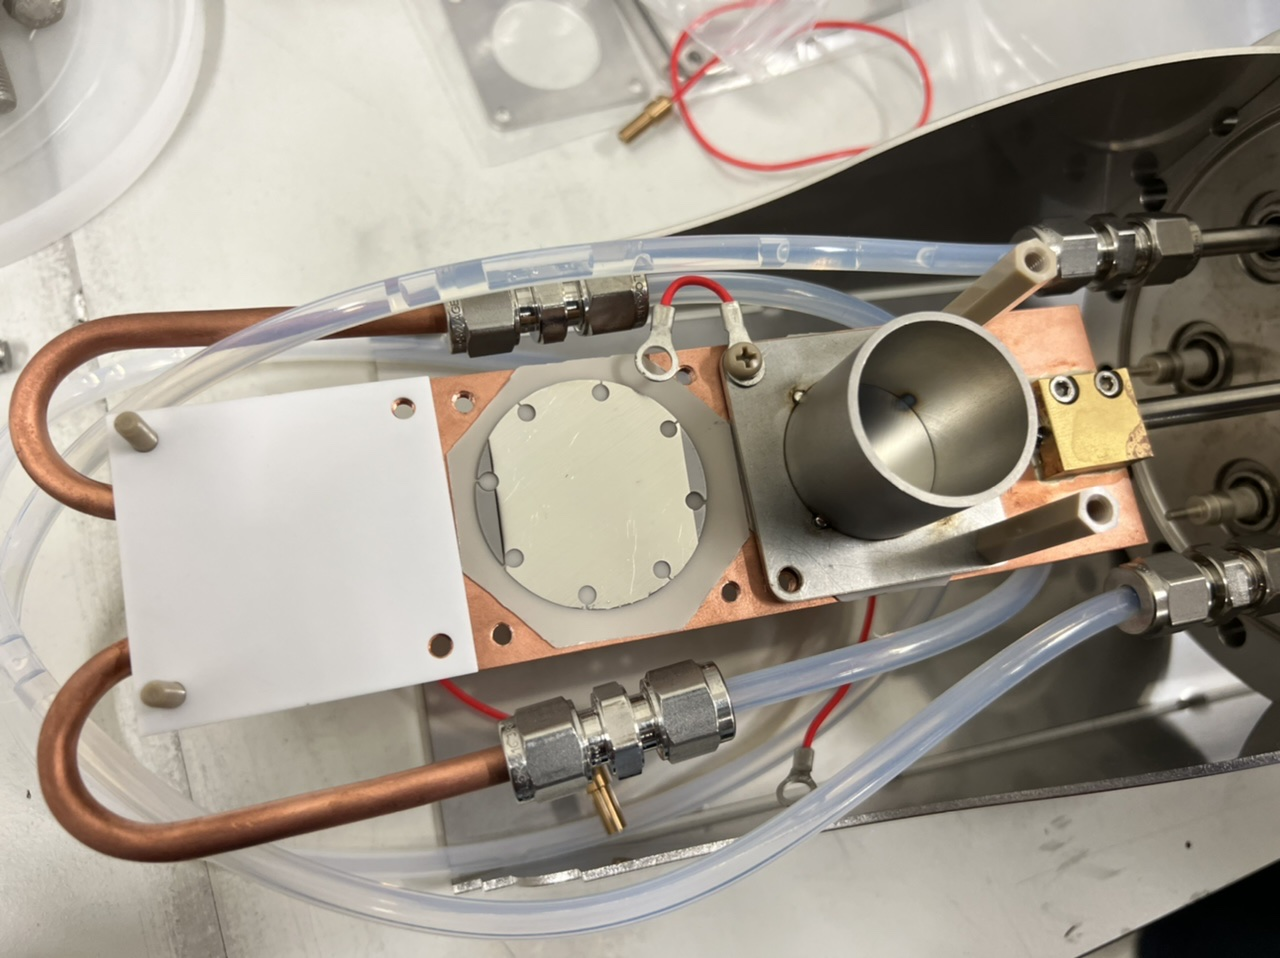
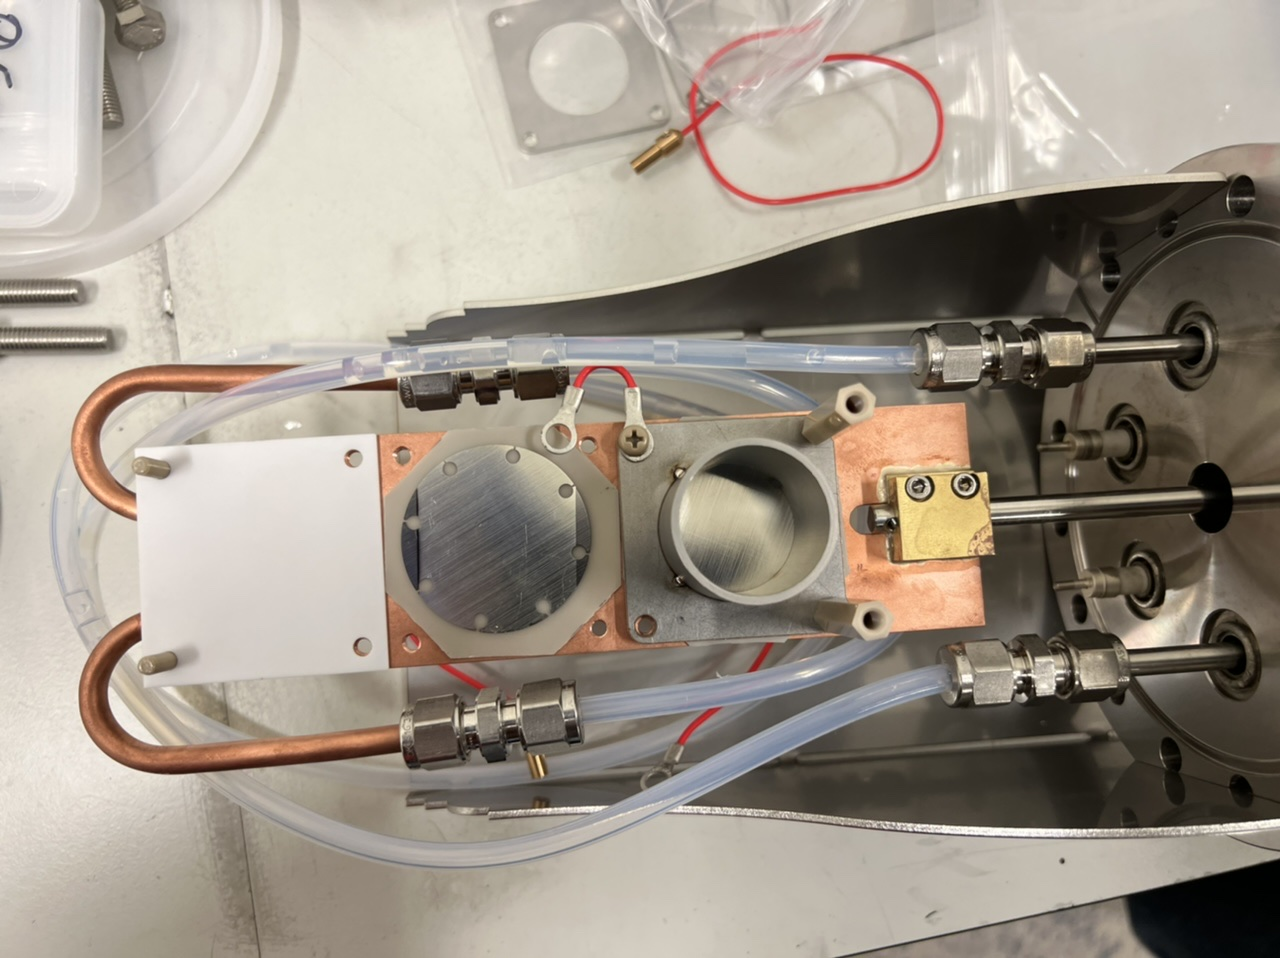
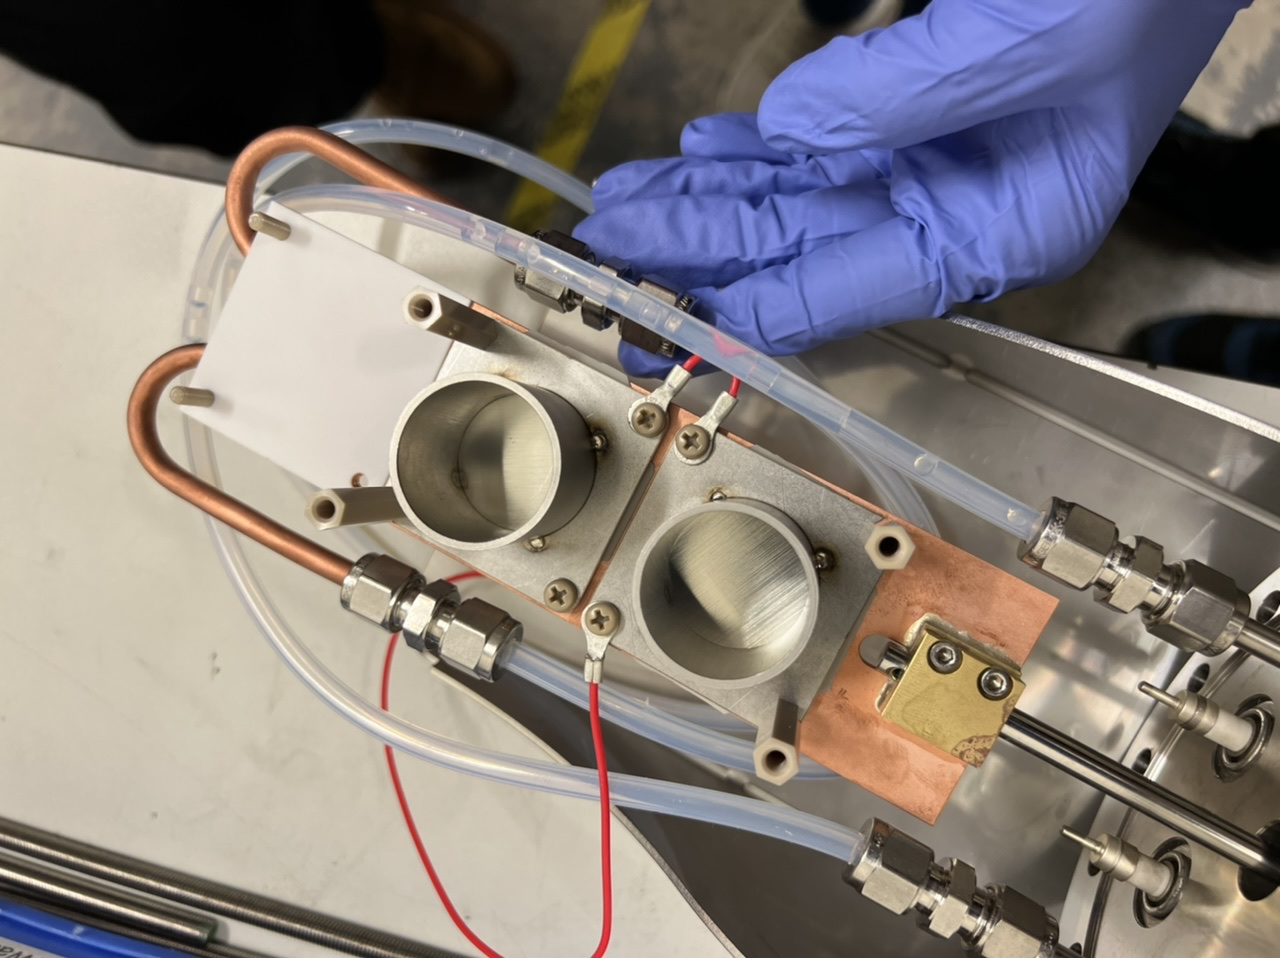
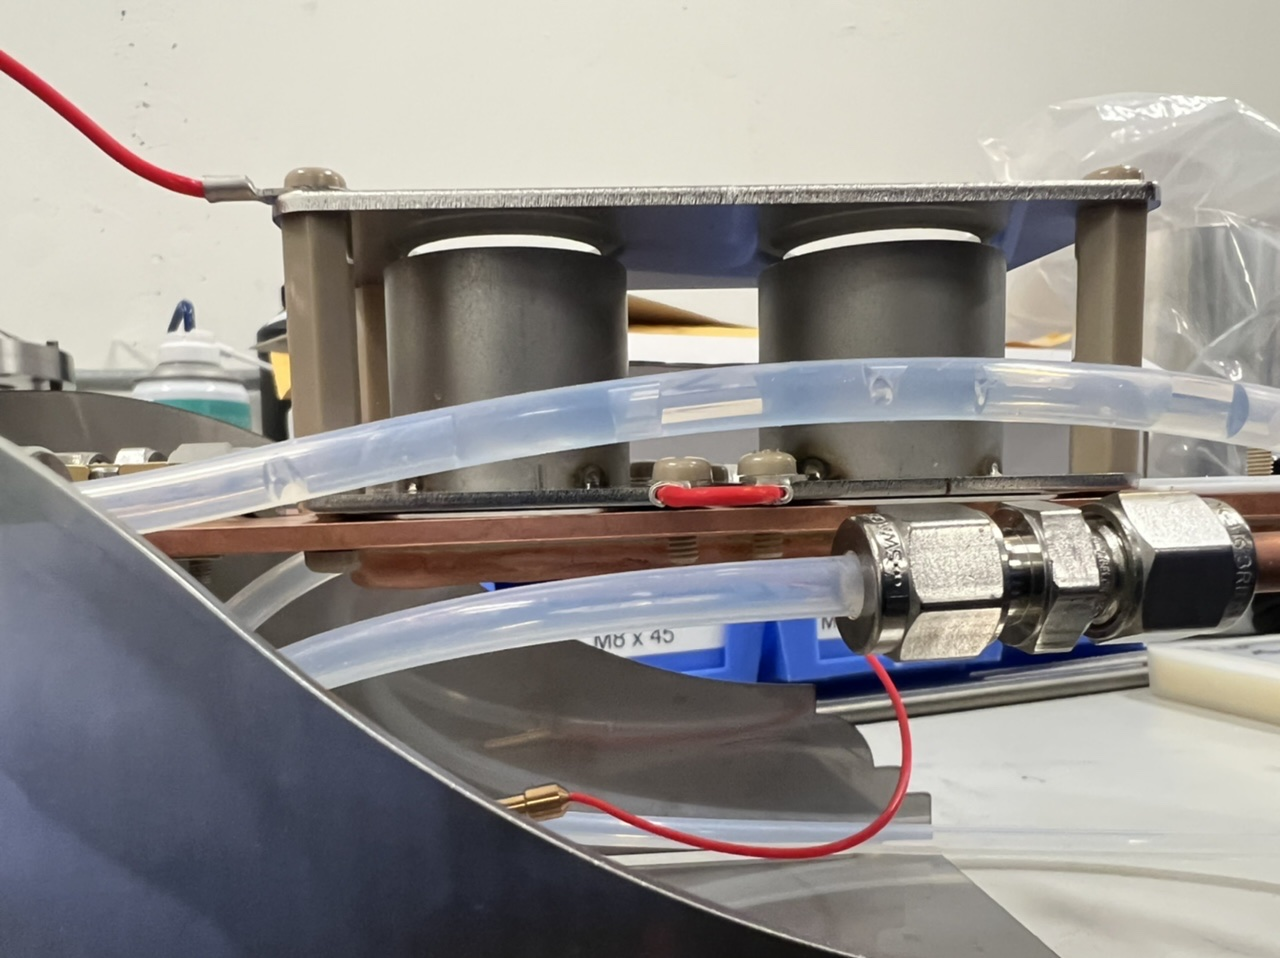
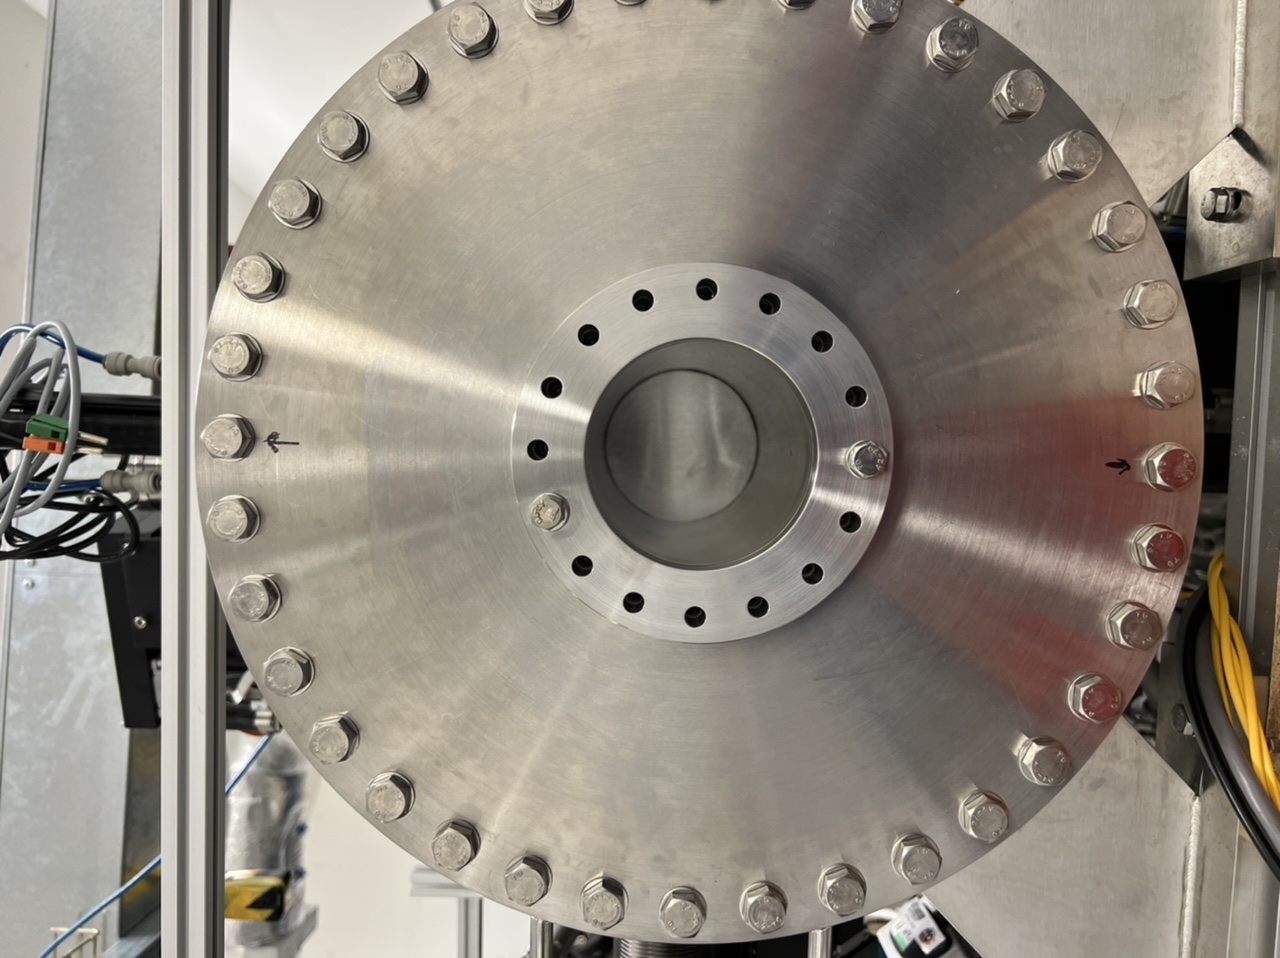
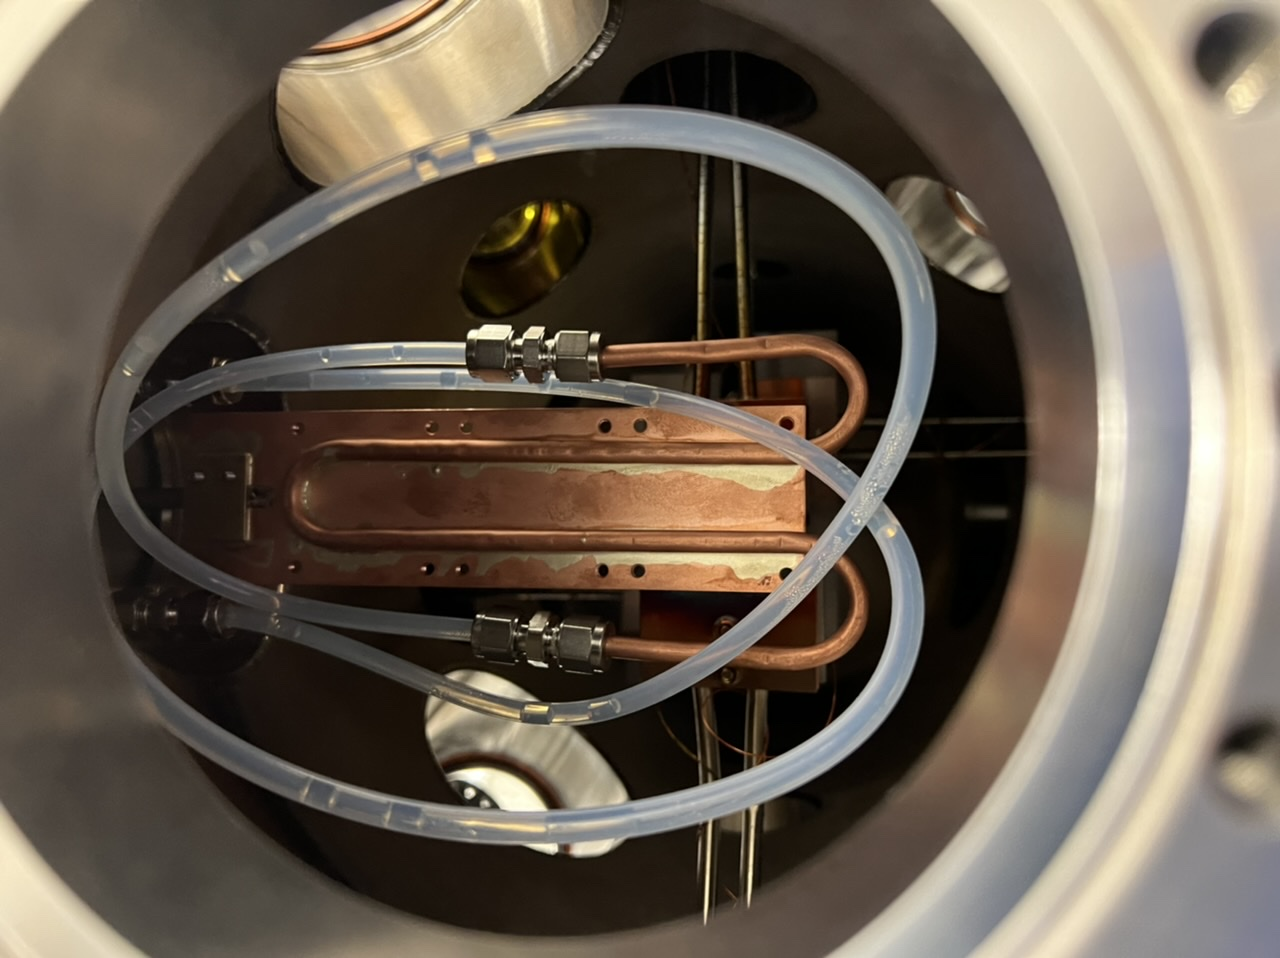
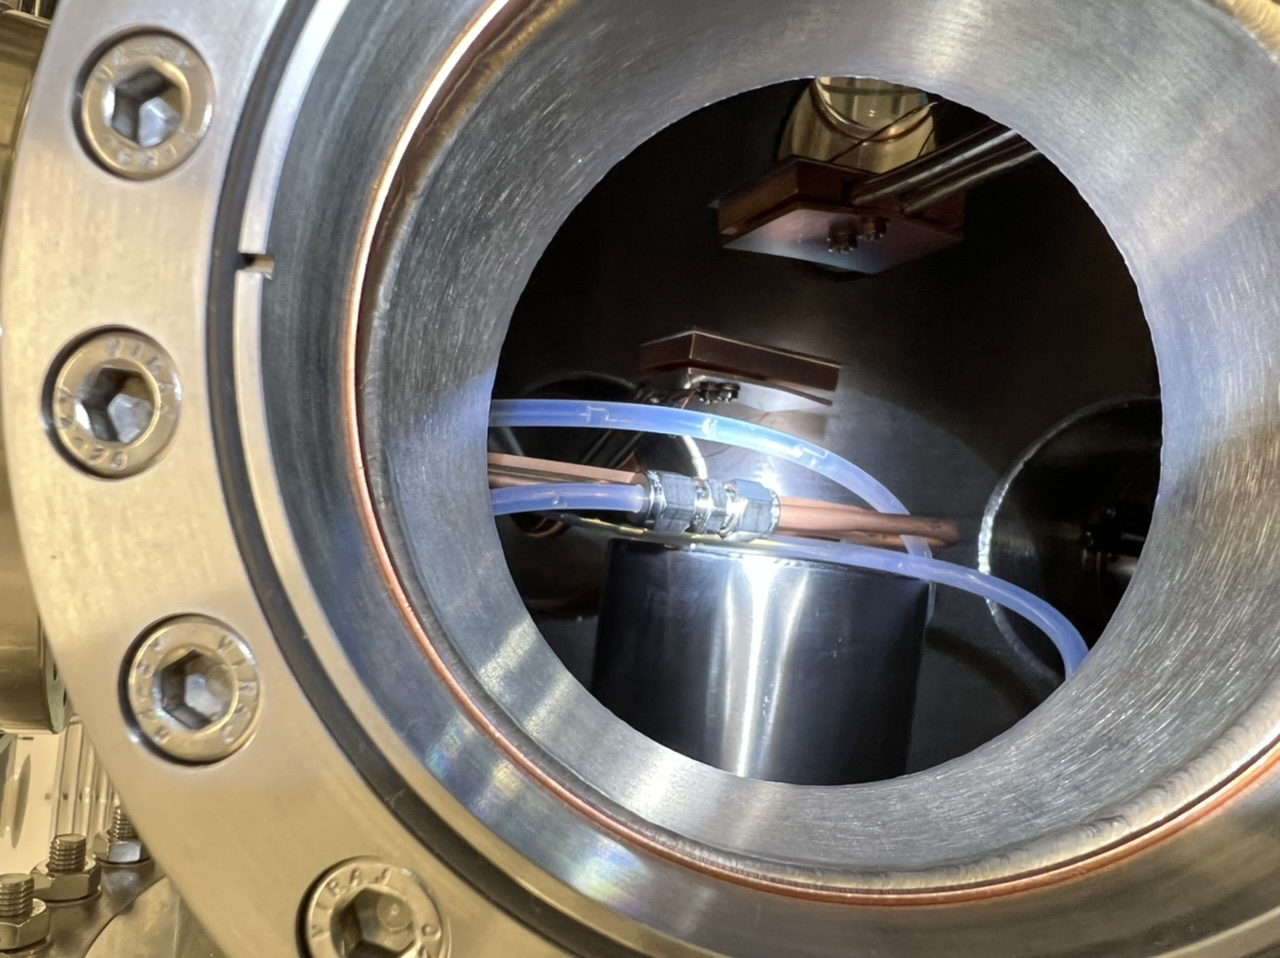
Computer was attached to the network. Both flanges were mounted to check the fit, and everything was fine. Cooling hoses were connected and water cooling was checked by turning on the chiller, with no leak. On the actuator flange, two Al targets were mounted on the top and the middle position of the ladder and Quartz crystal will be mounted on the bottom position tomorrow. |
| Attachment 1: F31EFF91-7B90-48B3-97CF-74BEE94402F4.jpeg
|
|
| Attachment 2: 341F8791-F881-4260-95B5-5B5E51FDDEB1.jpeg
|
|
| Attachment 3: 9DC1122F-7DA8-4B27-9670-C62F5D66D7AE.jpeg
|
|
| Attachment 4: 0F6AF433-2AFD-4953-9E3E-0859862D29E5.jpeg
|
|
| Attachment 5: 9C59EC2B-8BA6-48A8-8C33-0BD49074EA80.jpeg
|
|
| Attachment 6: 0639A740-544C-42B2-BD9D-6908BB93B7CA.jpeg
|
|
| Attachment 7: 9817E4C5-0FA9-4AF2-9A43-0D7A5F208198.jpeg
|
|
| Attachment 8: F0D019C7-B1E4-4910-8CF0-1E3B7EDEE282.jpeg
|
|
| Attachment 9: 5797BCF8-85F6-4AC9-A8BB-762E7468B7C2.jpeg
|
|
| Attachment 10: E41C813D-E887-435F-85BE-1F918ED17242.jpeg
|
|
|
8
|
Wed Feb 14 11:43:46 2024 |
Peter Ragan | Packing list |
IT:
PC, monitor, mouse, keyboard. 75m cat6 cable. 100m 2 pair fibre + 2 media converters. 2 cat5 patch leads. USB webcam. USB cables. 3x USB extensions. Spare motor driver. Extension leads
Vacuum:
main flange with actuator, water pipes an cooling plate attached. Cf100 stand. Reenterent flange.
Instrumentation:
NIM crate. HV PSU. 572 Amplifier. 2x 113 preamp. 2x 3M3/3 NaI + bases. 2x EasyMCA 2k +psu. 477 HV PMT PSU. 1x scope
hardware:
insulators: [ 1mm macor. 0.5mm AlN, 2mm macor, 2.4mm saphire]. Faraday cups. Suppressor plate. 3 bags of PEEK fixings. 2x Teflon wires with rings on on end and 2.4mm slip on sockets on the other. Swagelok fittings + ferrules. Cf100 and cf16 gaskets copper and viton
Other/spares:
SHV-SHV x3. SHV-MHV x2, SHV coupler x1. Bnc leads various.
tools
13/14mm spanner's x3
screwdrivers 2.5mm flat, ph1
gloves
wipes
7mm spanner
Allen key set
|
|
7
|
Fri Feb 9 13:13:28 2024 |
Marialuisa | Experimental Plan |
|
| Attachment 1: DCF-experiment-plan.pdf
|
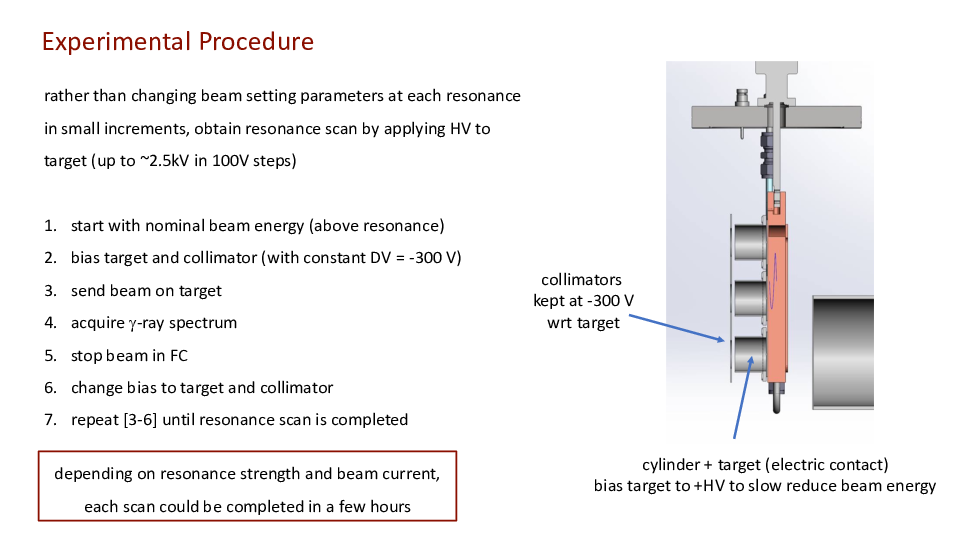

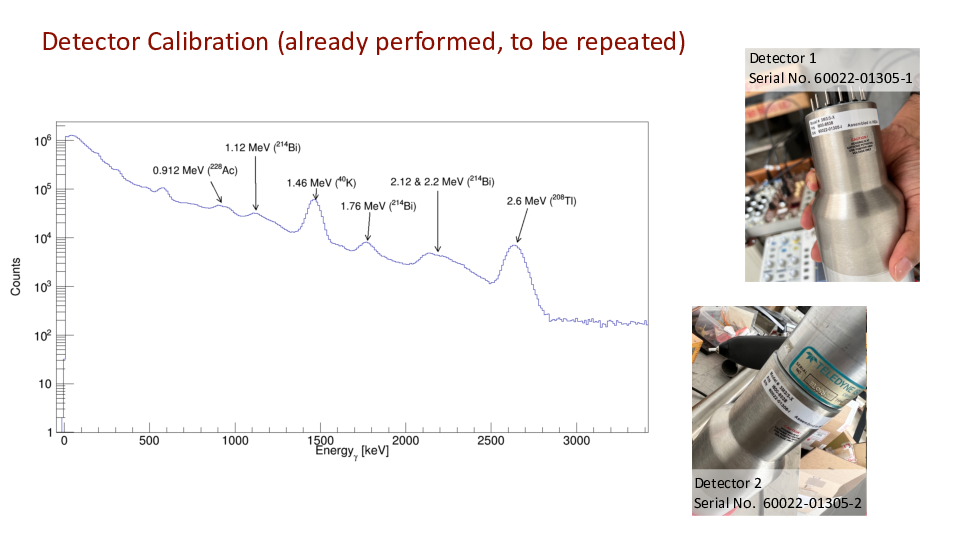
|
|
6
|
Fri Feb 9 13:12:44 2024 |
Konrad, Peter | Actuator control |
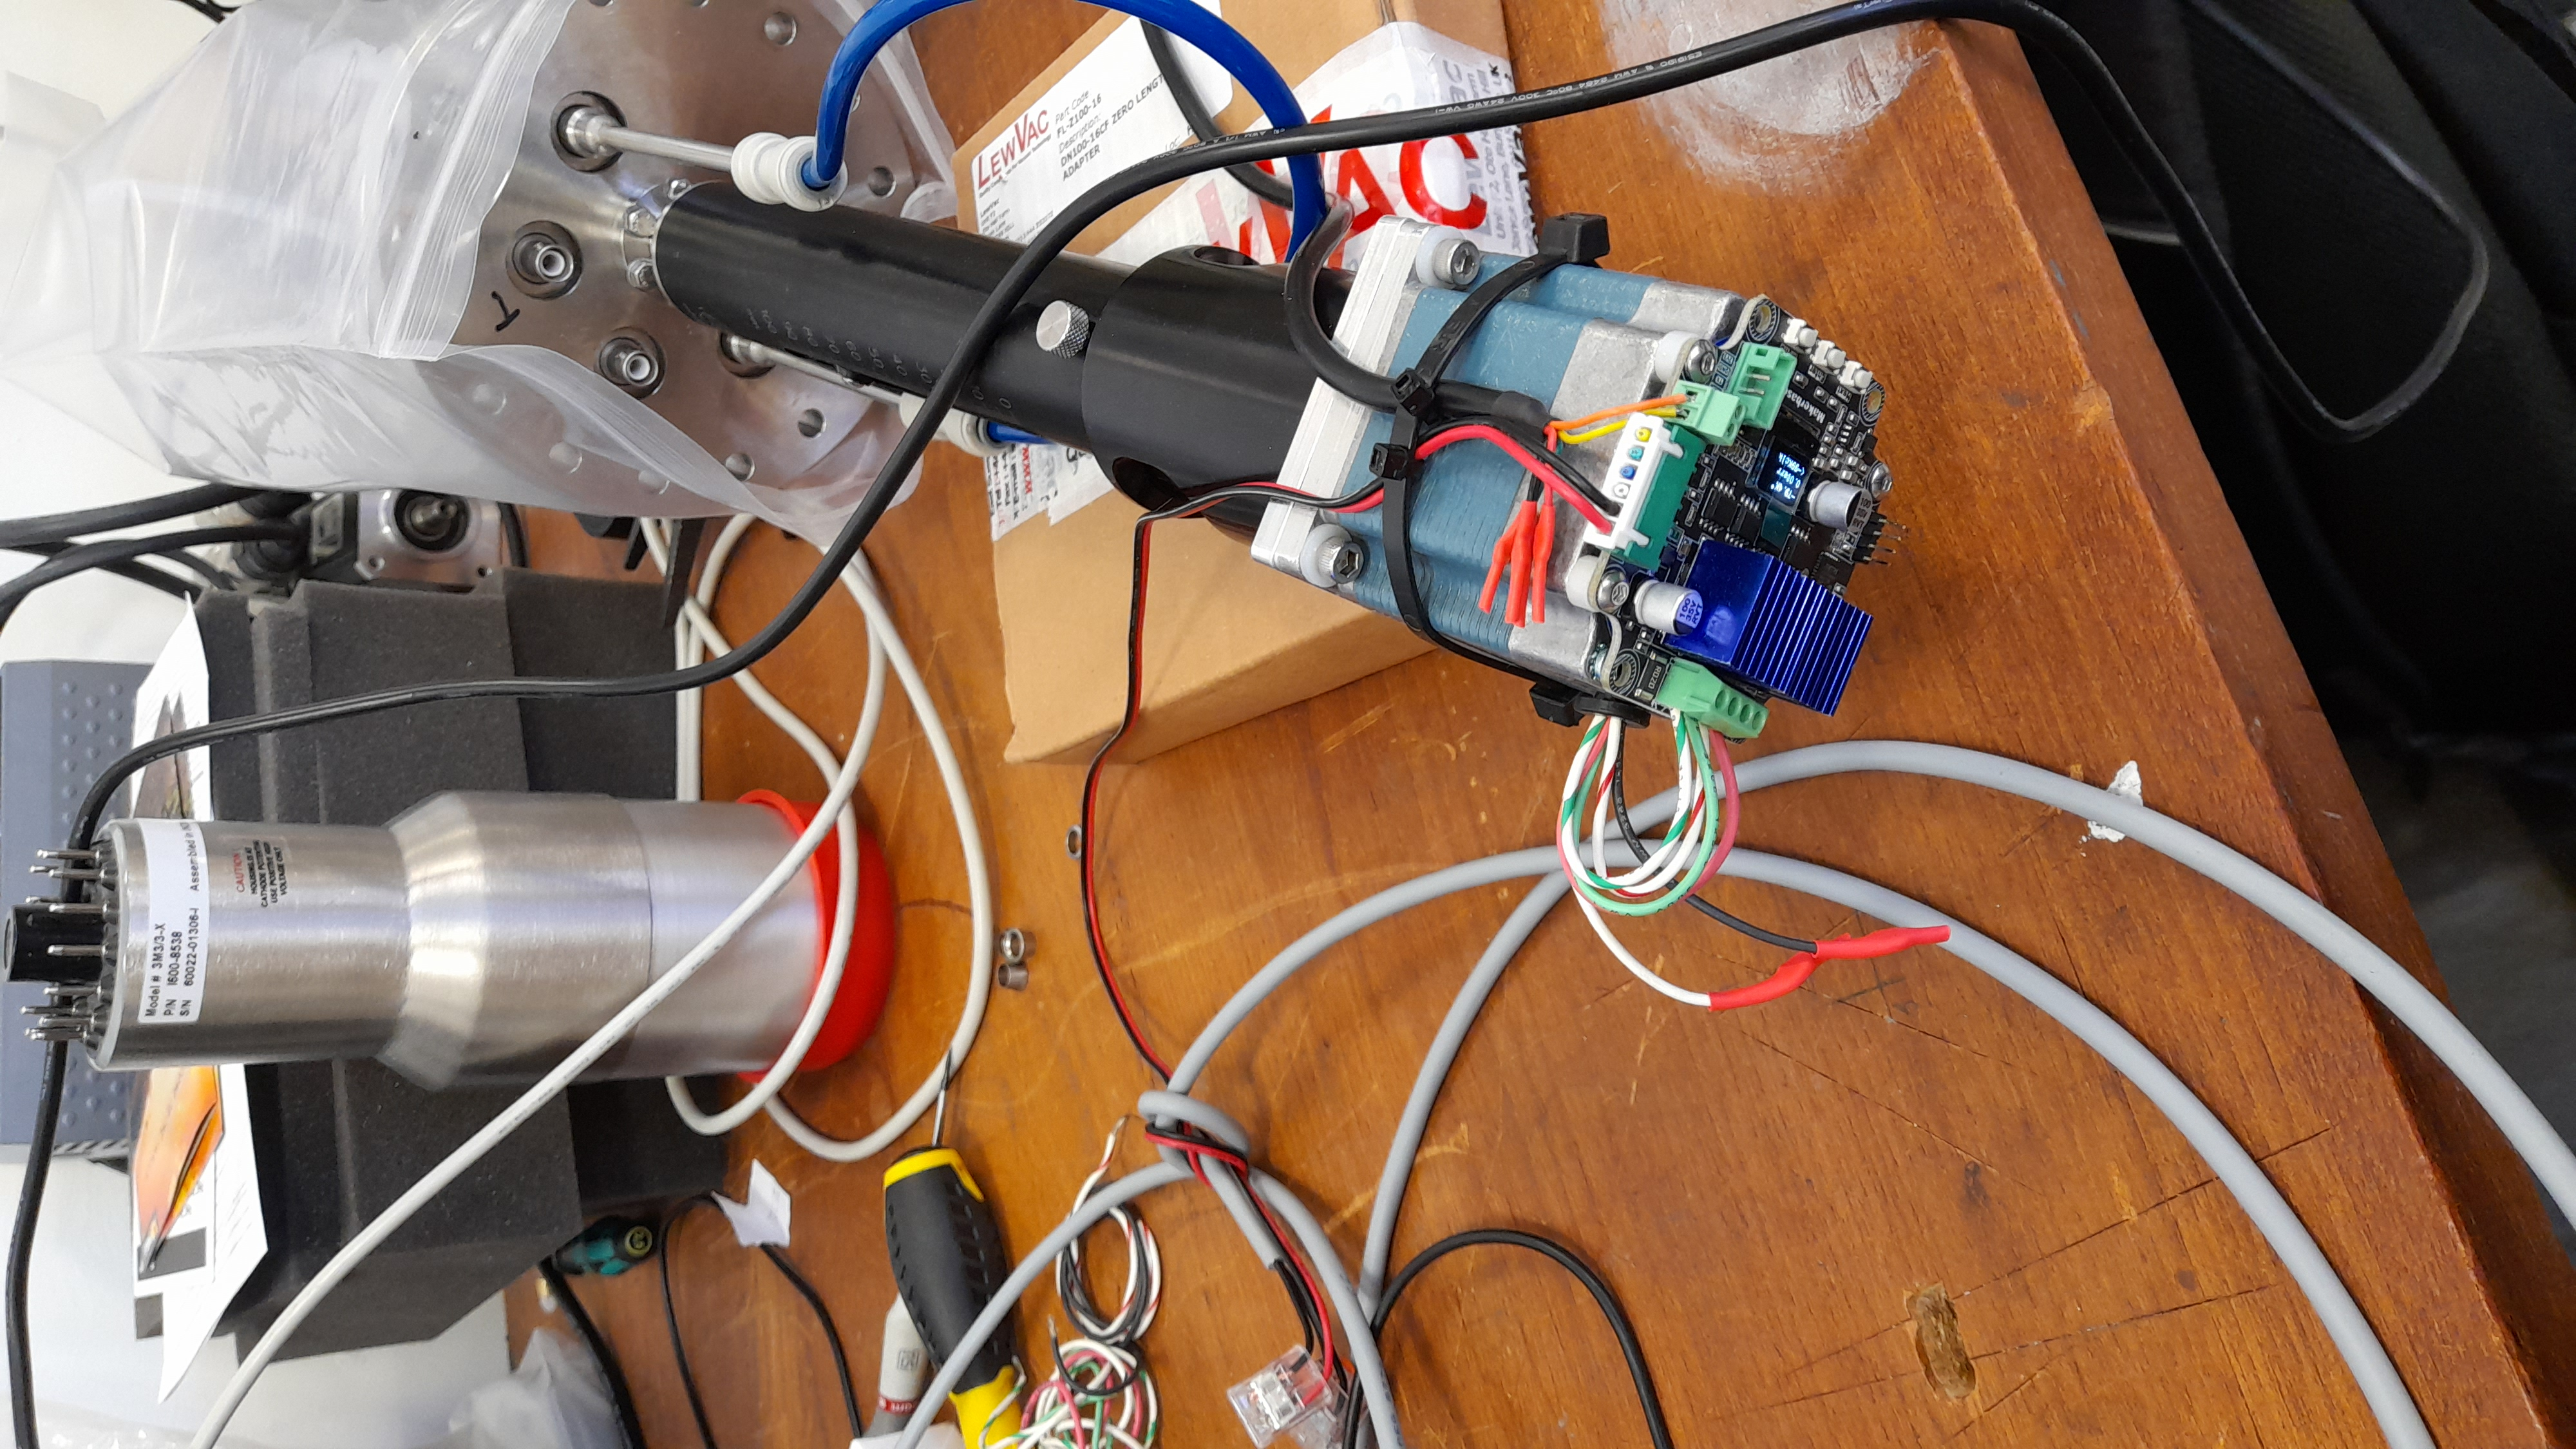
| Image of the cabling for the actuator, code base tested and functional. |
| Attachment 1: 20240209_130953.jpg
|
|
|
5
|
Thu Feb 8 16:24:50 2024 |
Ragan | DAQ Parameters |
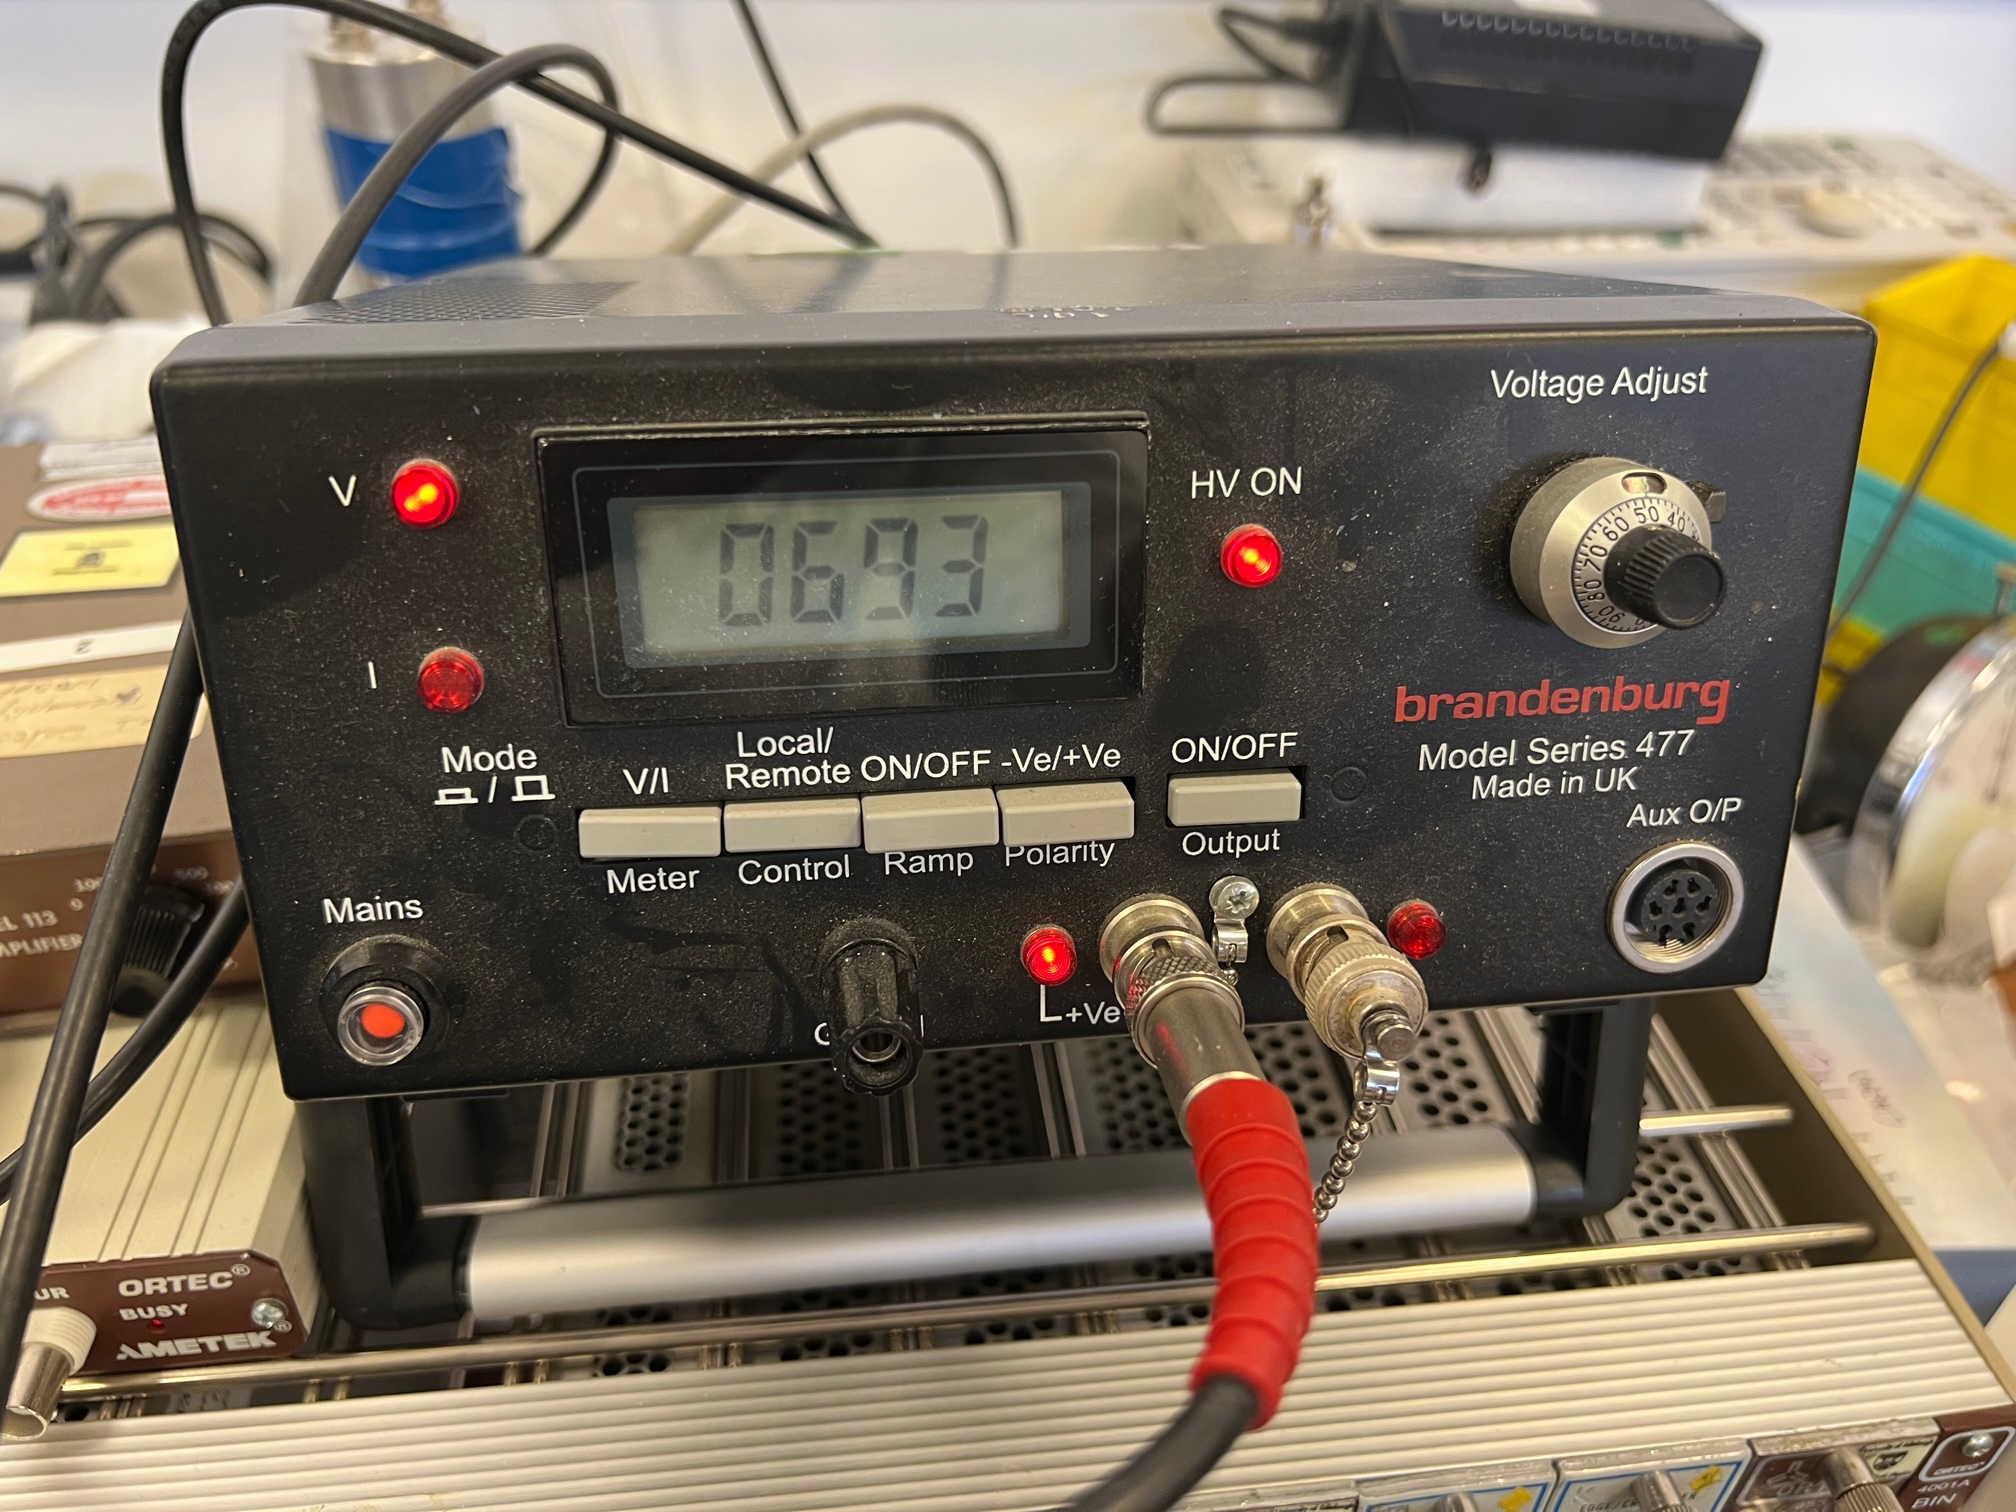
HV for NaI = + 693 V
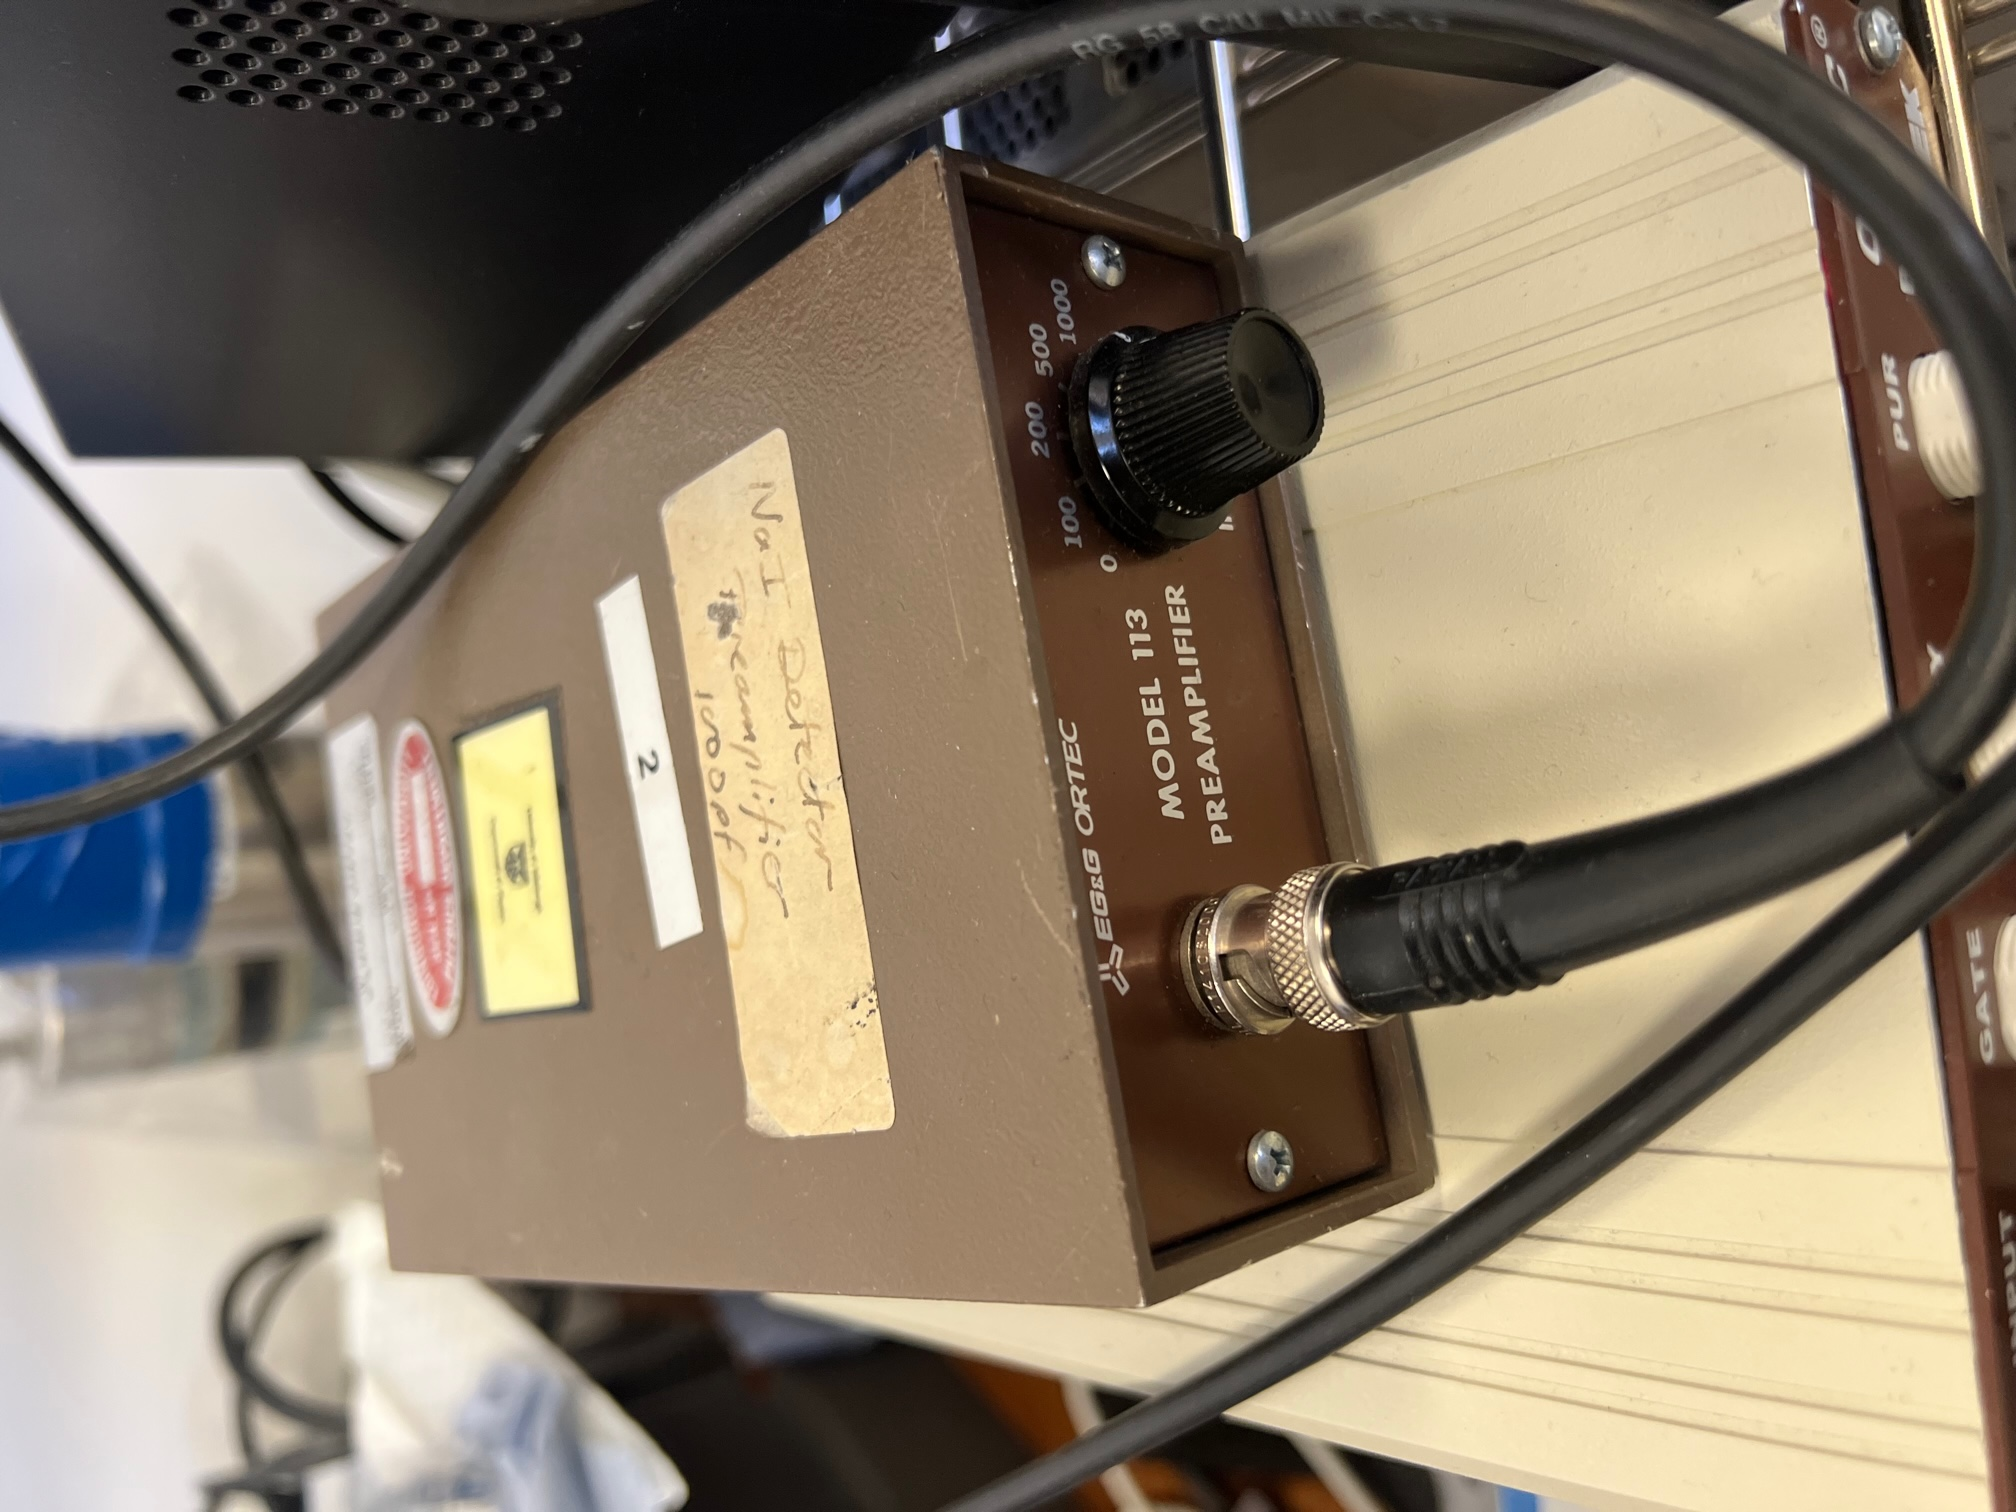
Preamplifier: ORTEC Model 113, I/P Capacitor = 1000 pF
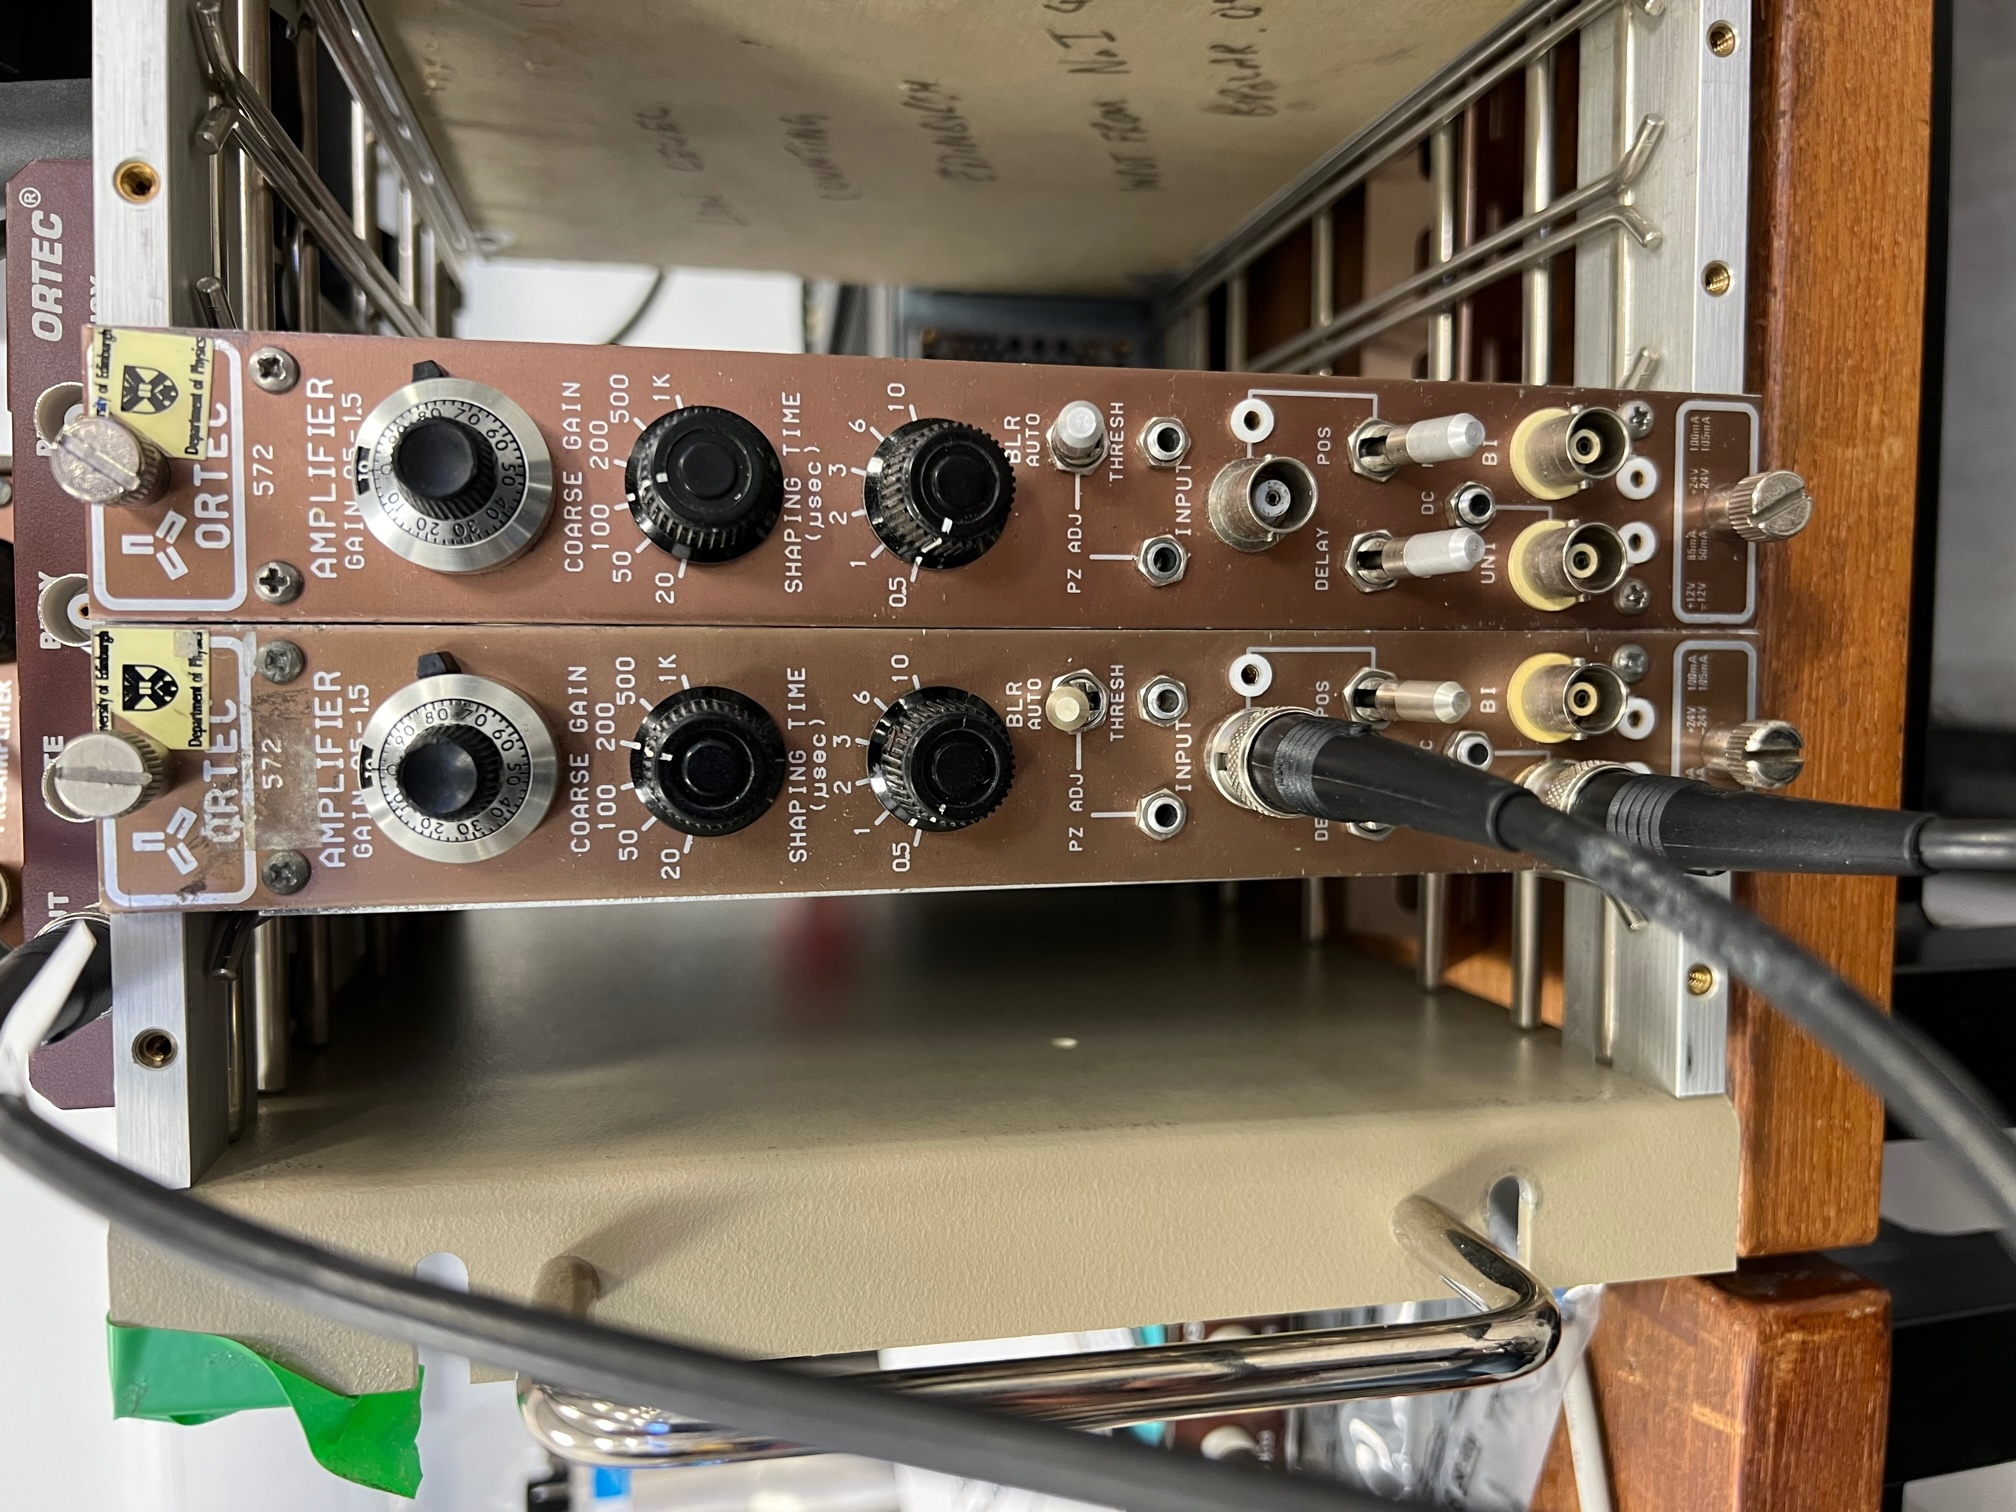
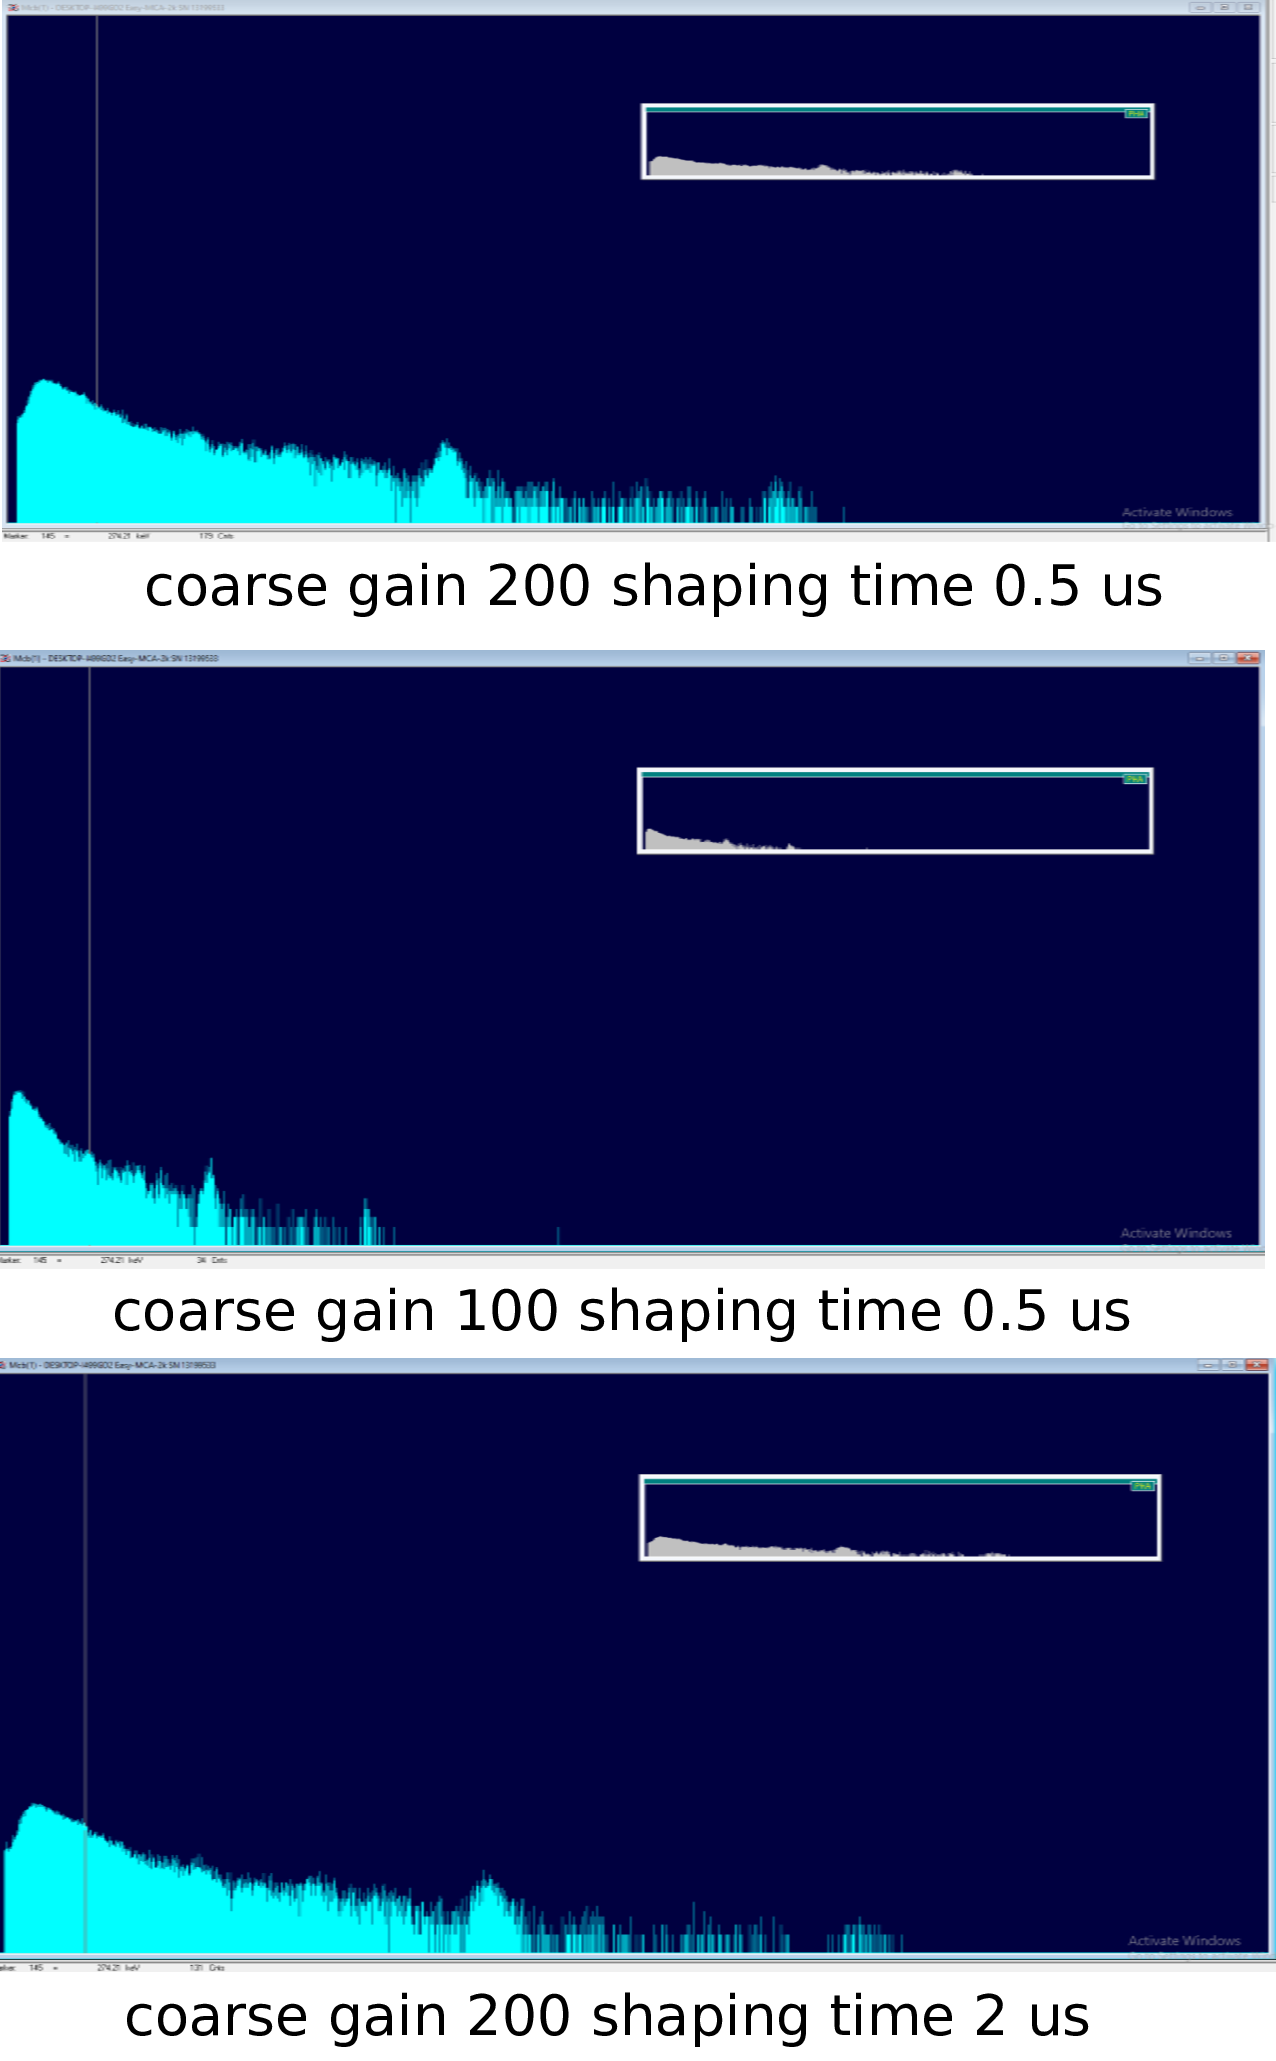
Amplifier: ORTEC 572, internal jumpers = x1, Gain = x1, Coarse Gain = x200, Shaping Time = 0.5 us, I/P polarity: negative, O/P: Unipolar
Signals from the detector and preamp are negative and from ampifier is positive. |
| Attachment 1: IMG_3142.jpg
|
|
| Attachment 2: IMG_3144.jpg
|
|
| Attachment 3: IMG_3151.jpg
|
|
| Attachment 4: plot.pdf
|
|
|
4
|
Wed Feb 7 13:11:54 2024 |
Ragan, Peter | Vacuum testing of the actuator flange |
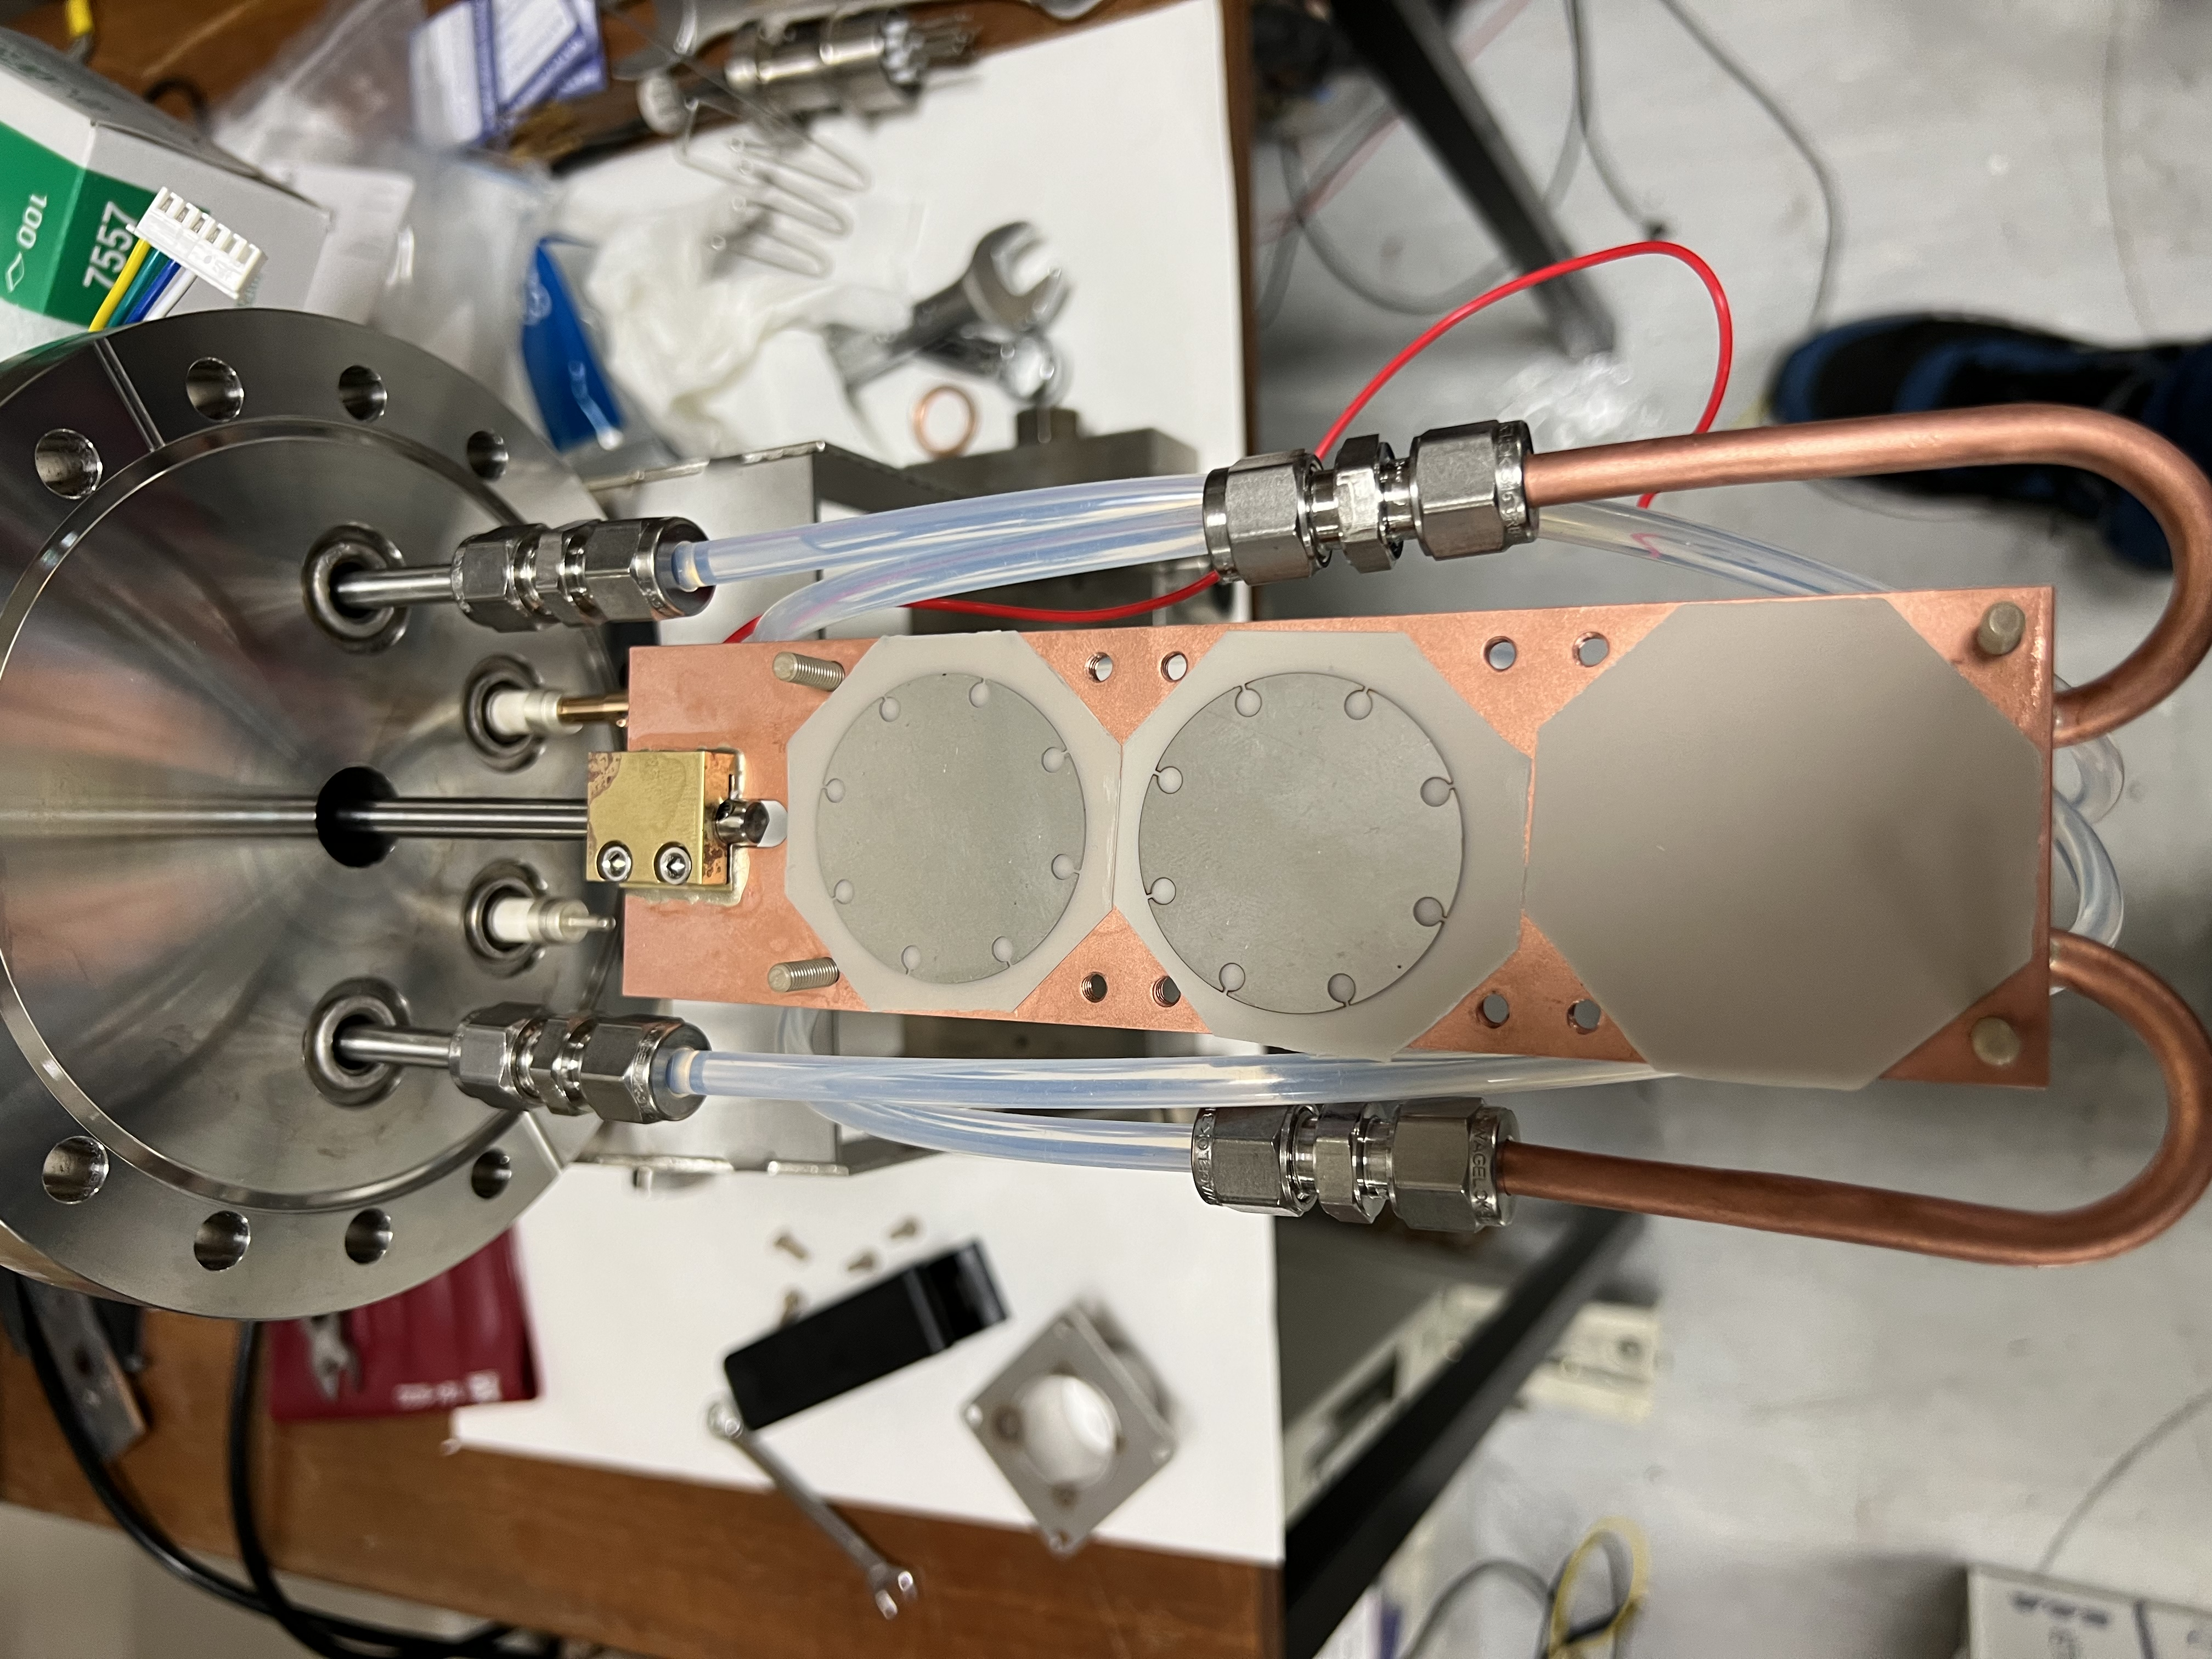
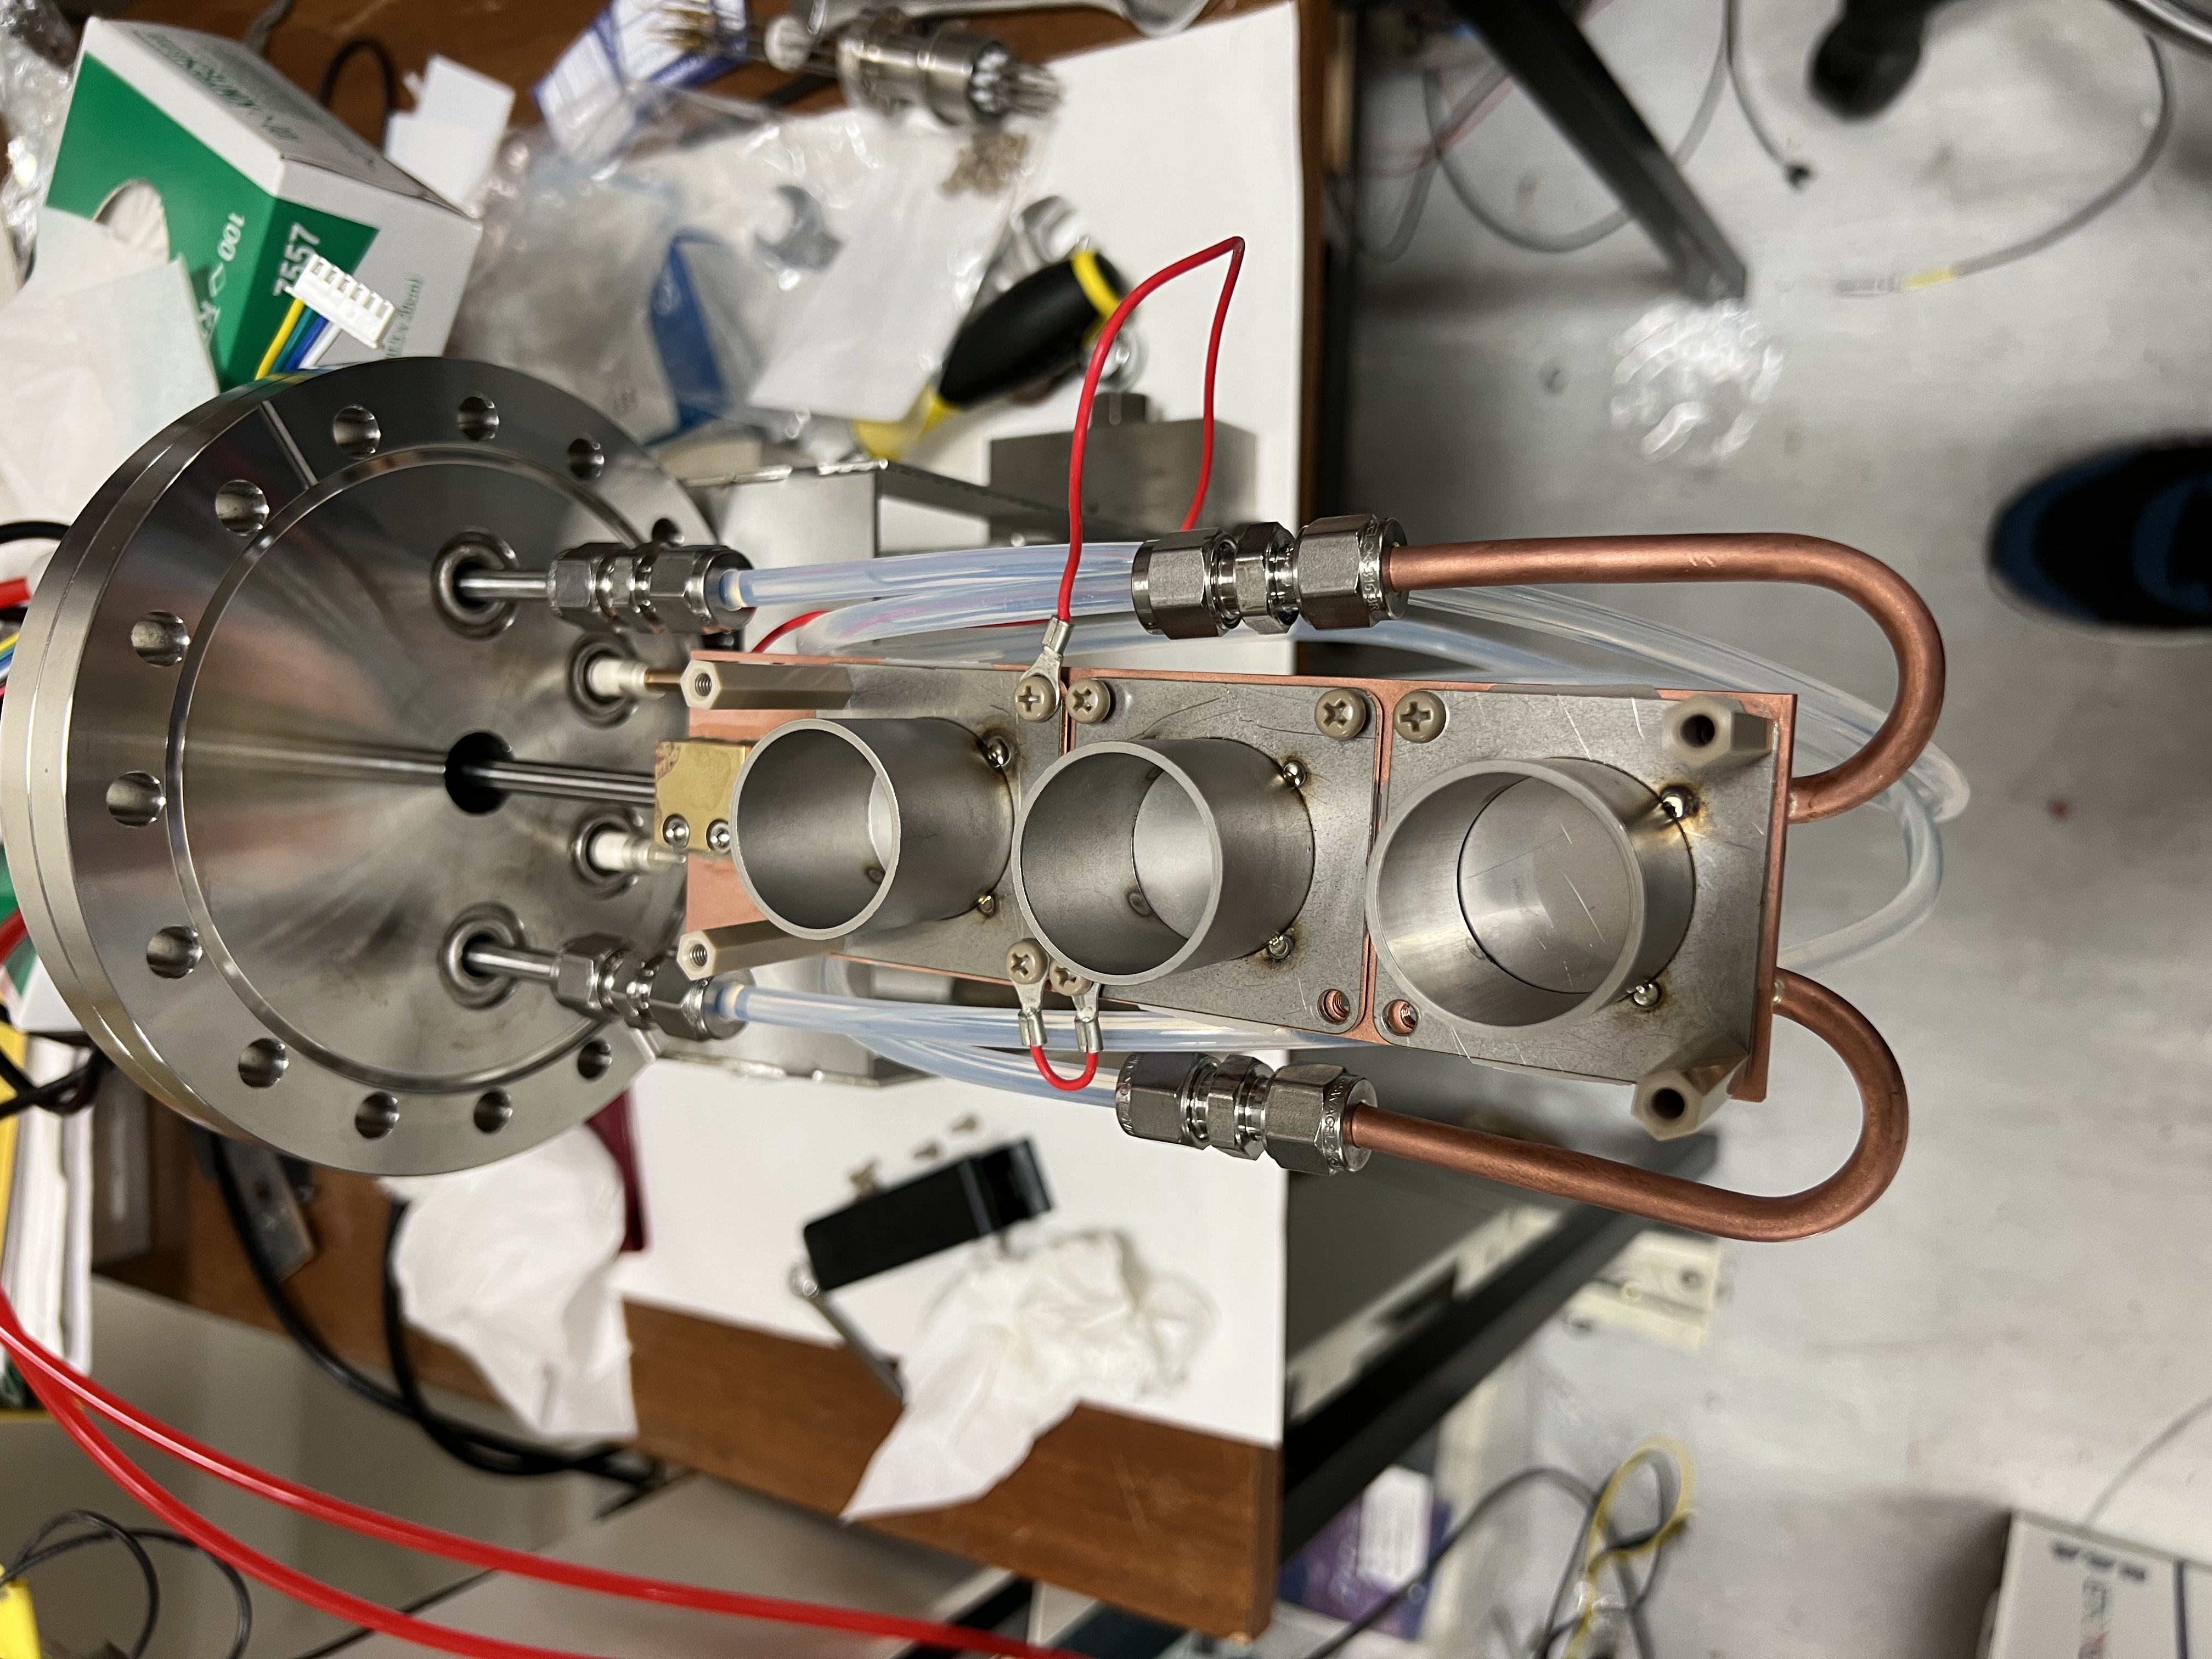
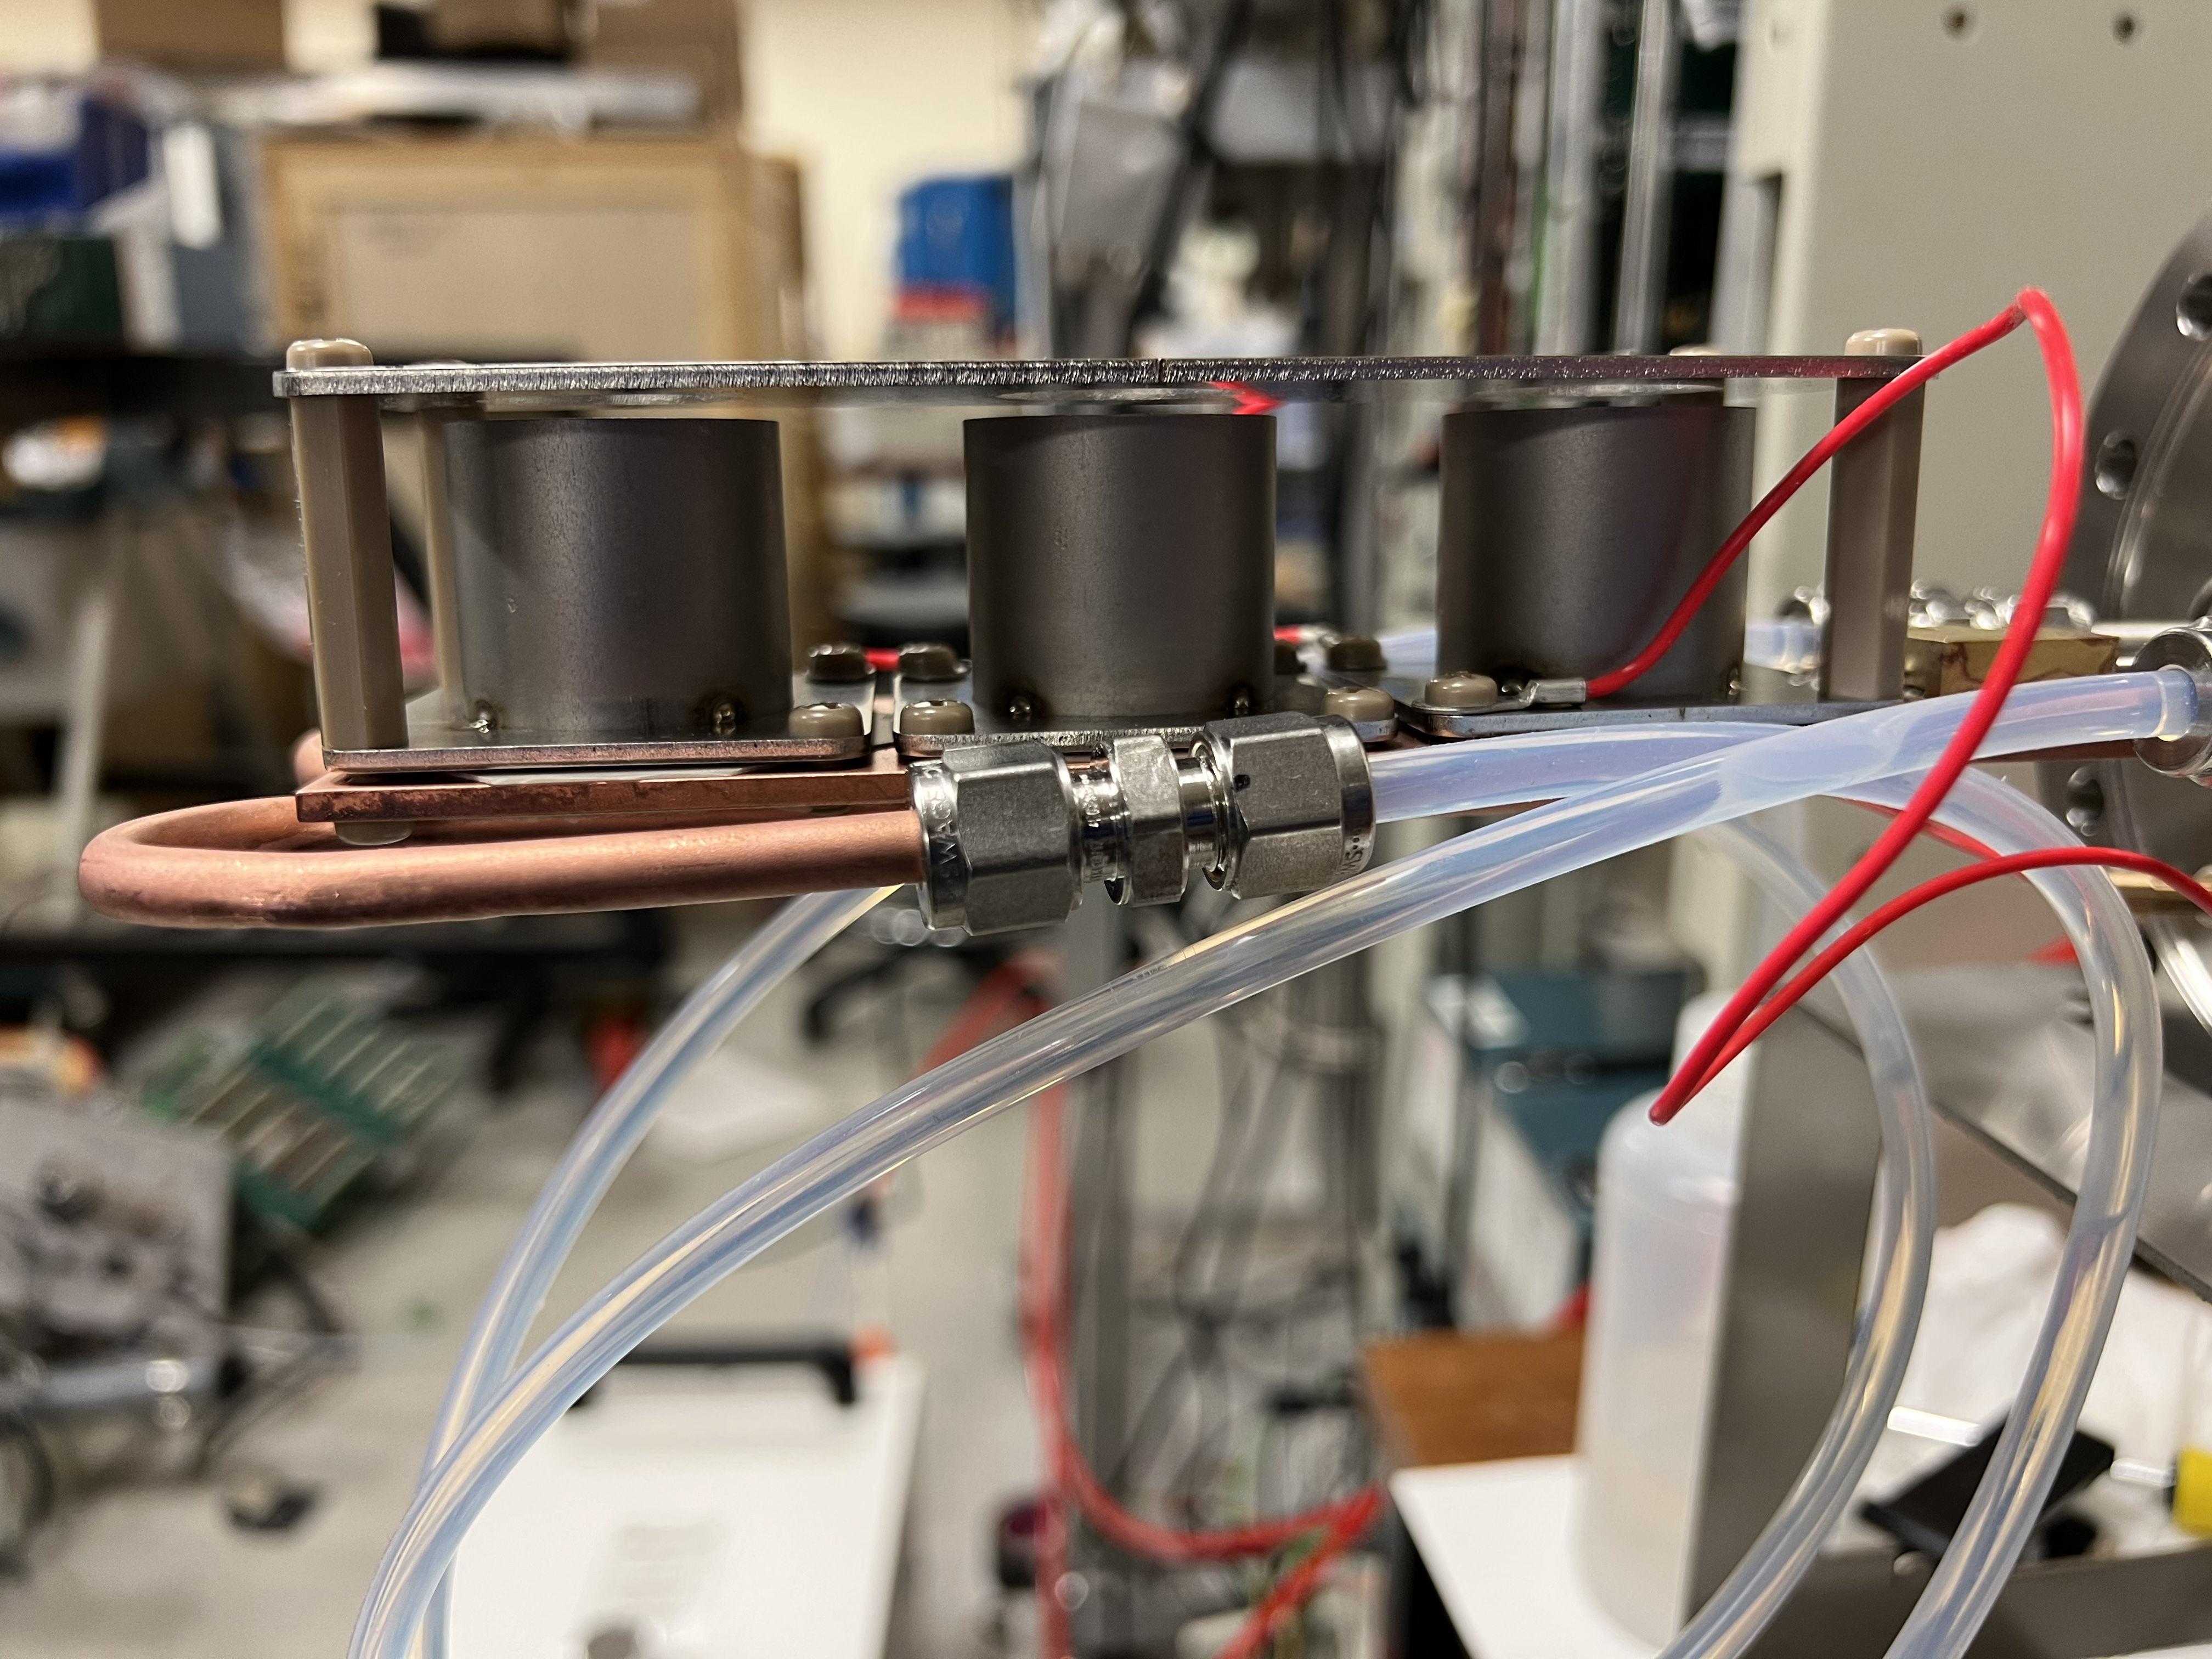
The entire setup was tested with aluminum nitride wafers instead of Sapphirine. |
| Attachment 1: 40035F22-595D-4006-BF2E-1A3F25A86384.jpeg
|
|
| Attachment 2: CEEA80C7-7739-4F70-ADCC-C5EA239FD06C.jpeg
|
|
| Attachment 3: 82C8286D-6397-479E-88BE-1987921C0F70.jpeg
|
|
| Attachment 4: D932C006-4582-4E17-9C68-D9BEEA3C5792.jpeg
|
|
|
3
|
Wed Feb 7 08:21:24 2024 |
Ragan, Peter | Vacuum testing of the flange with water cooling |
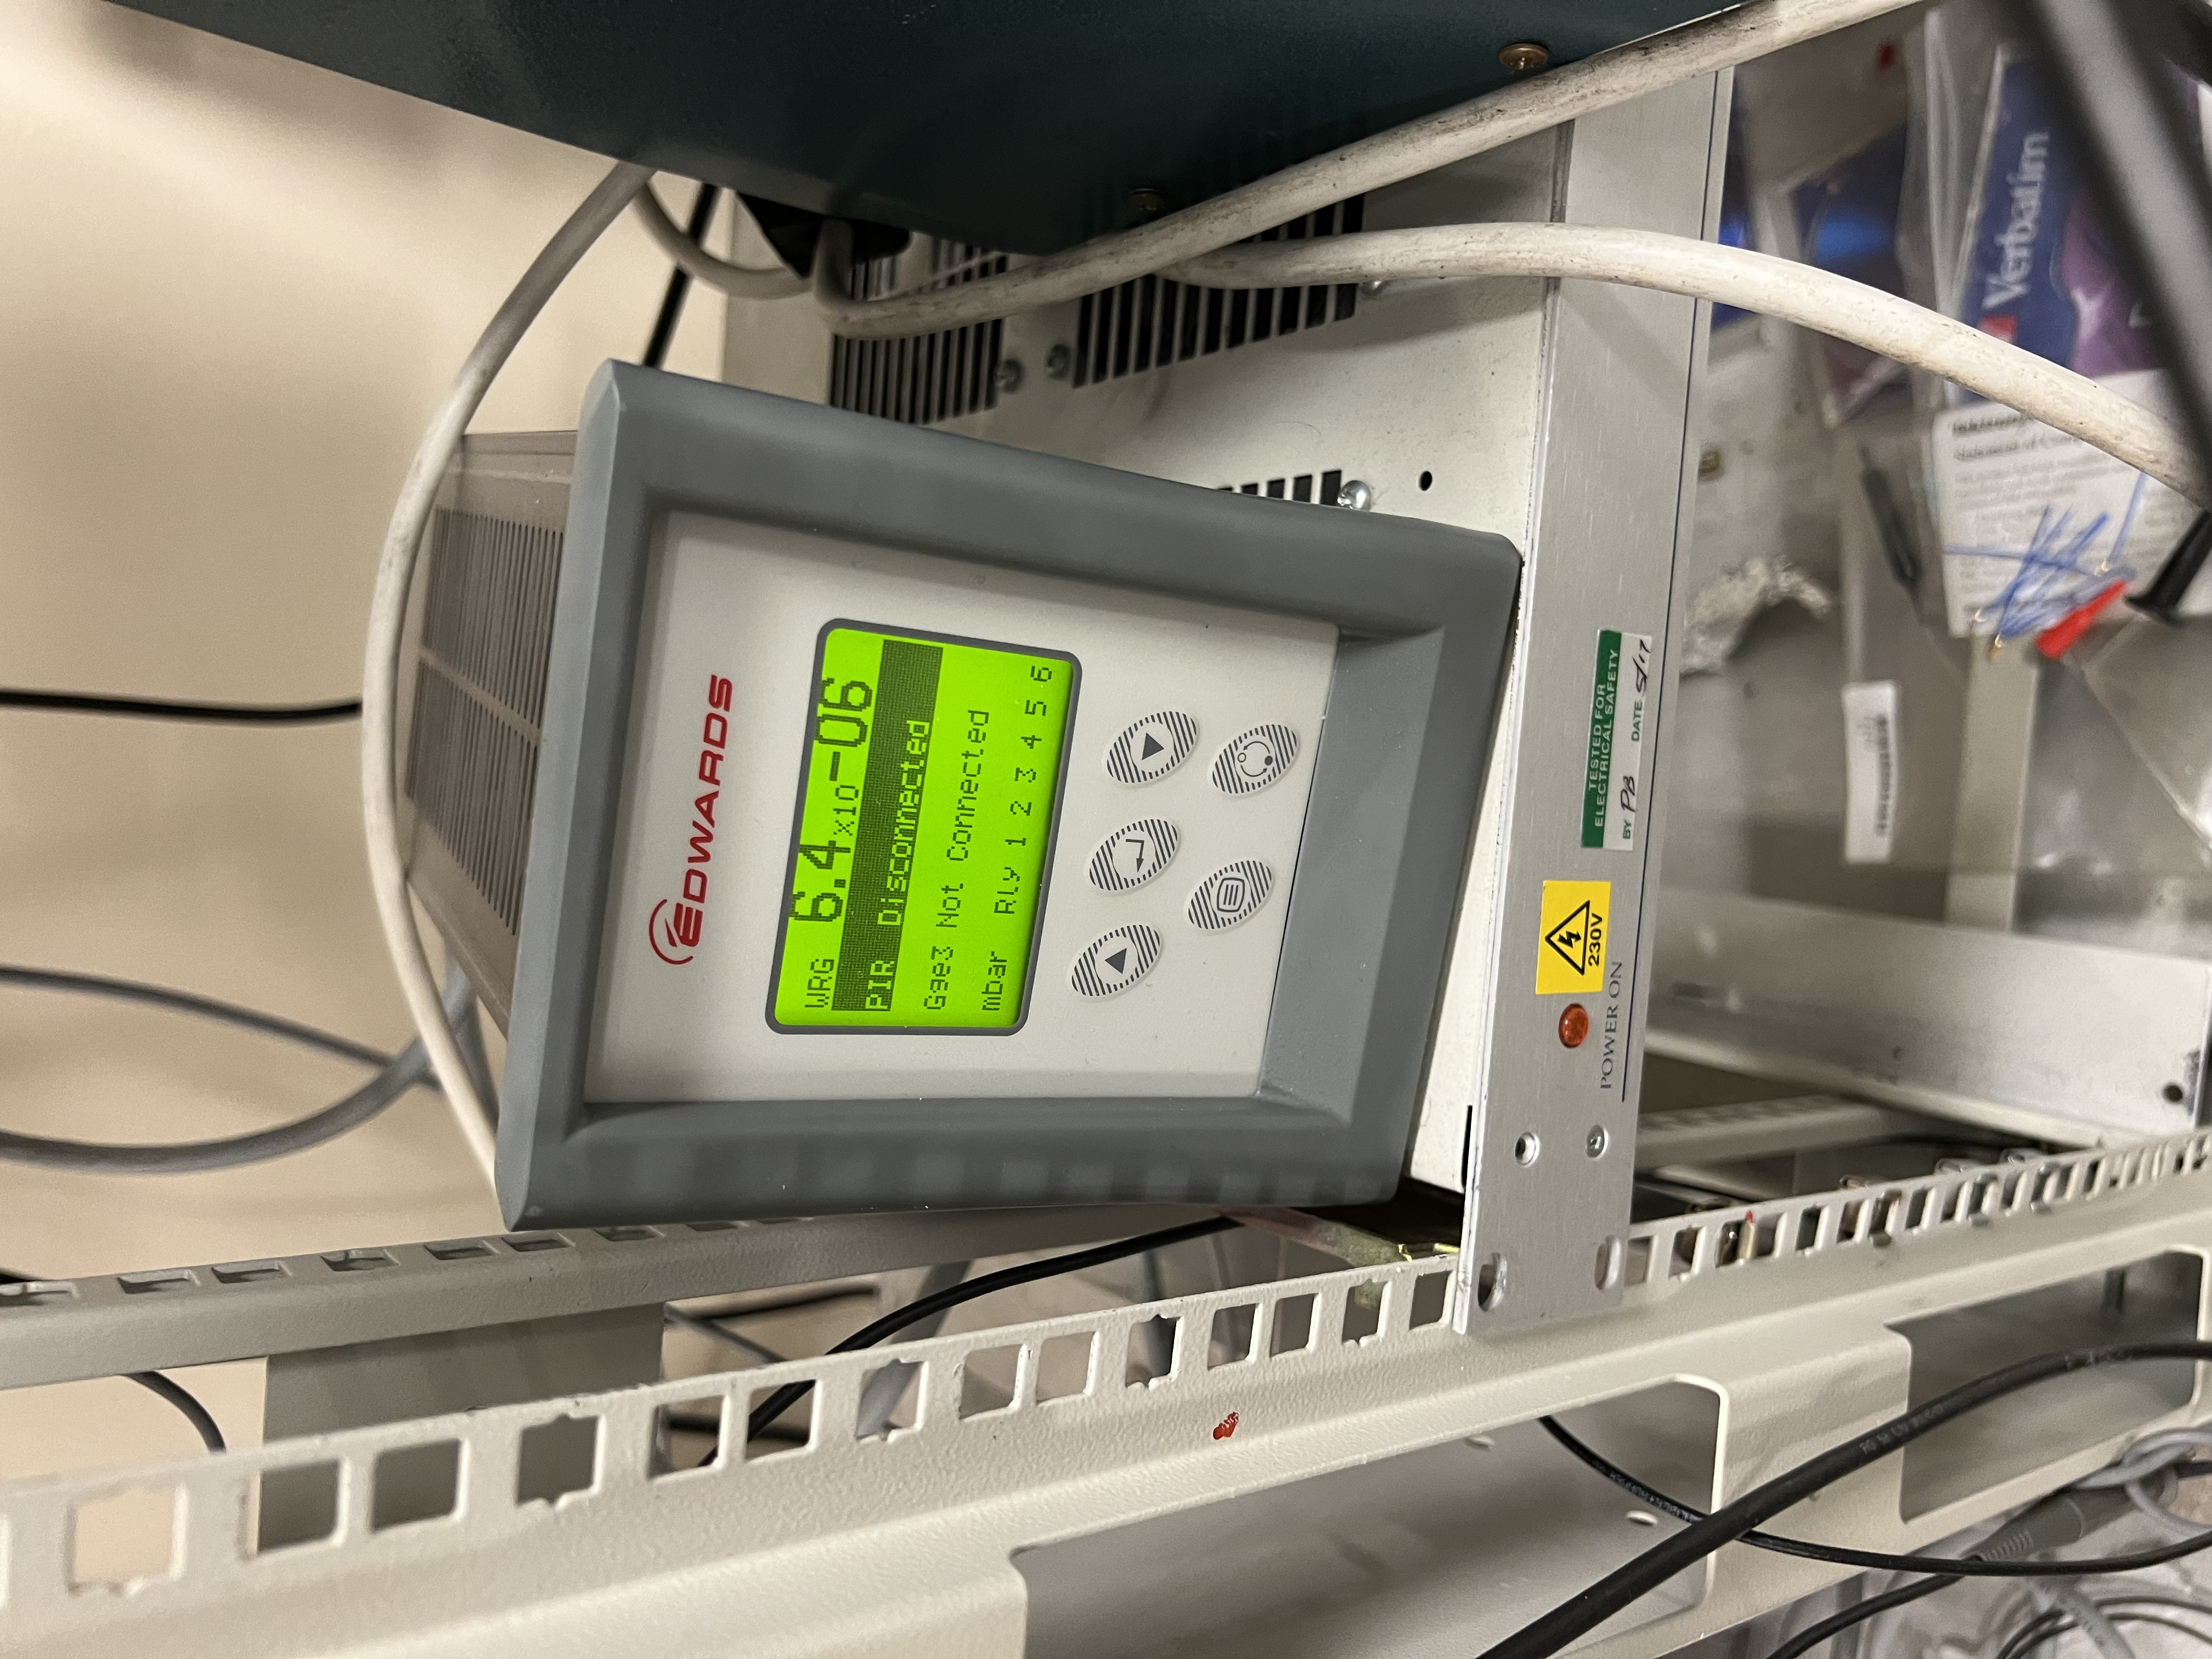
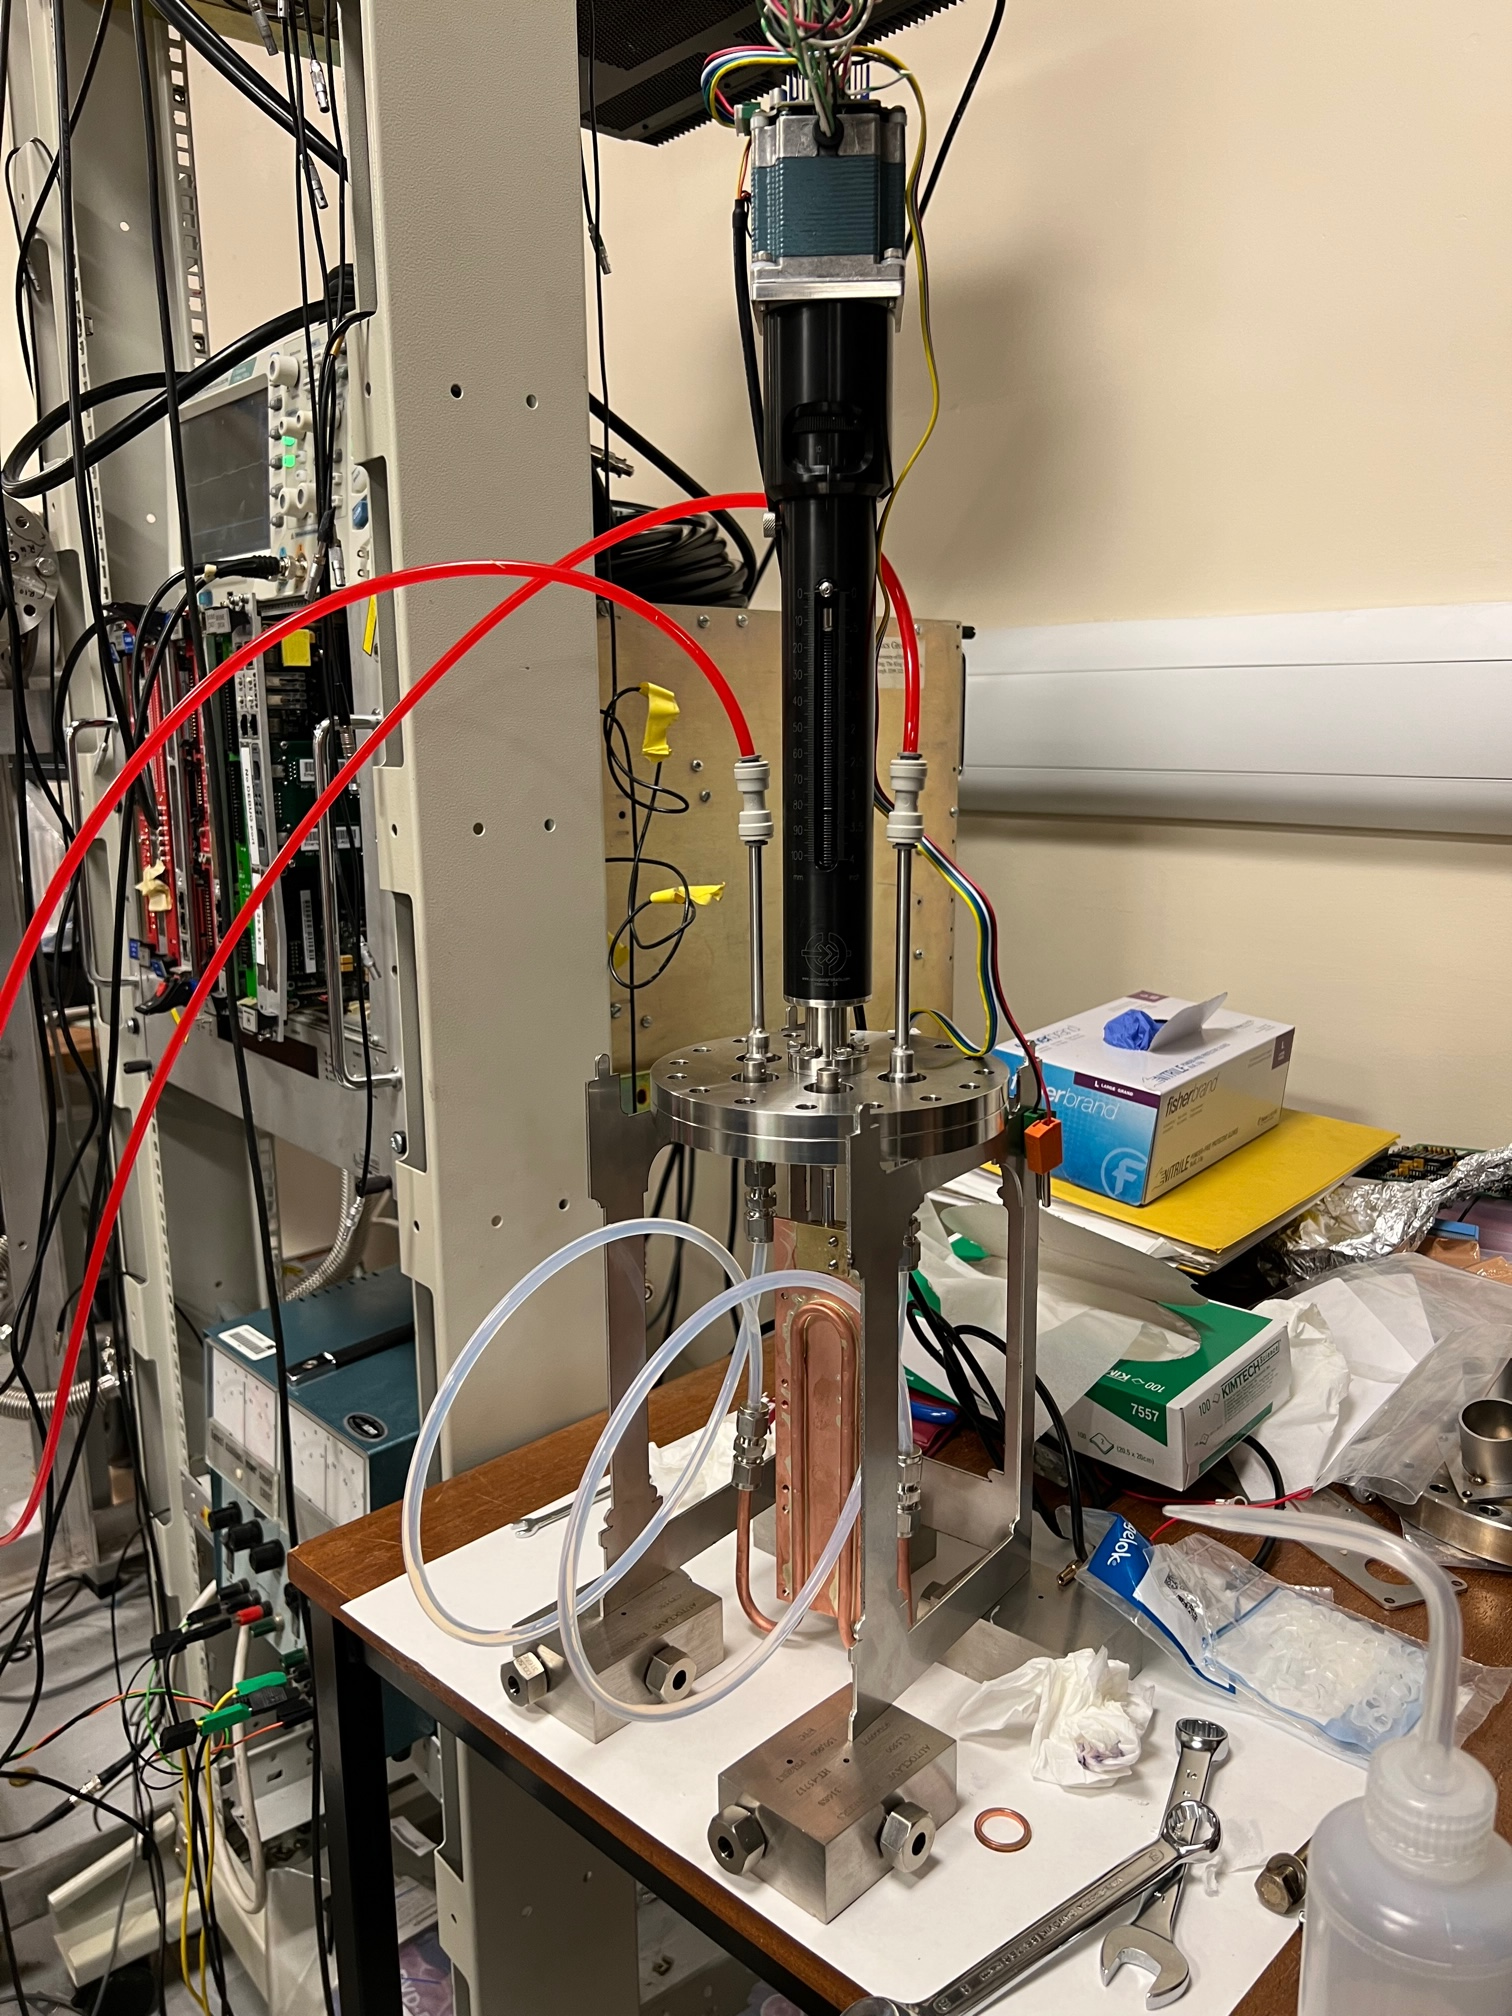
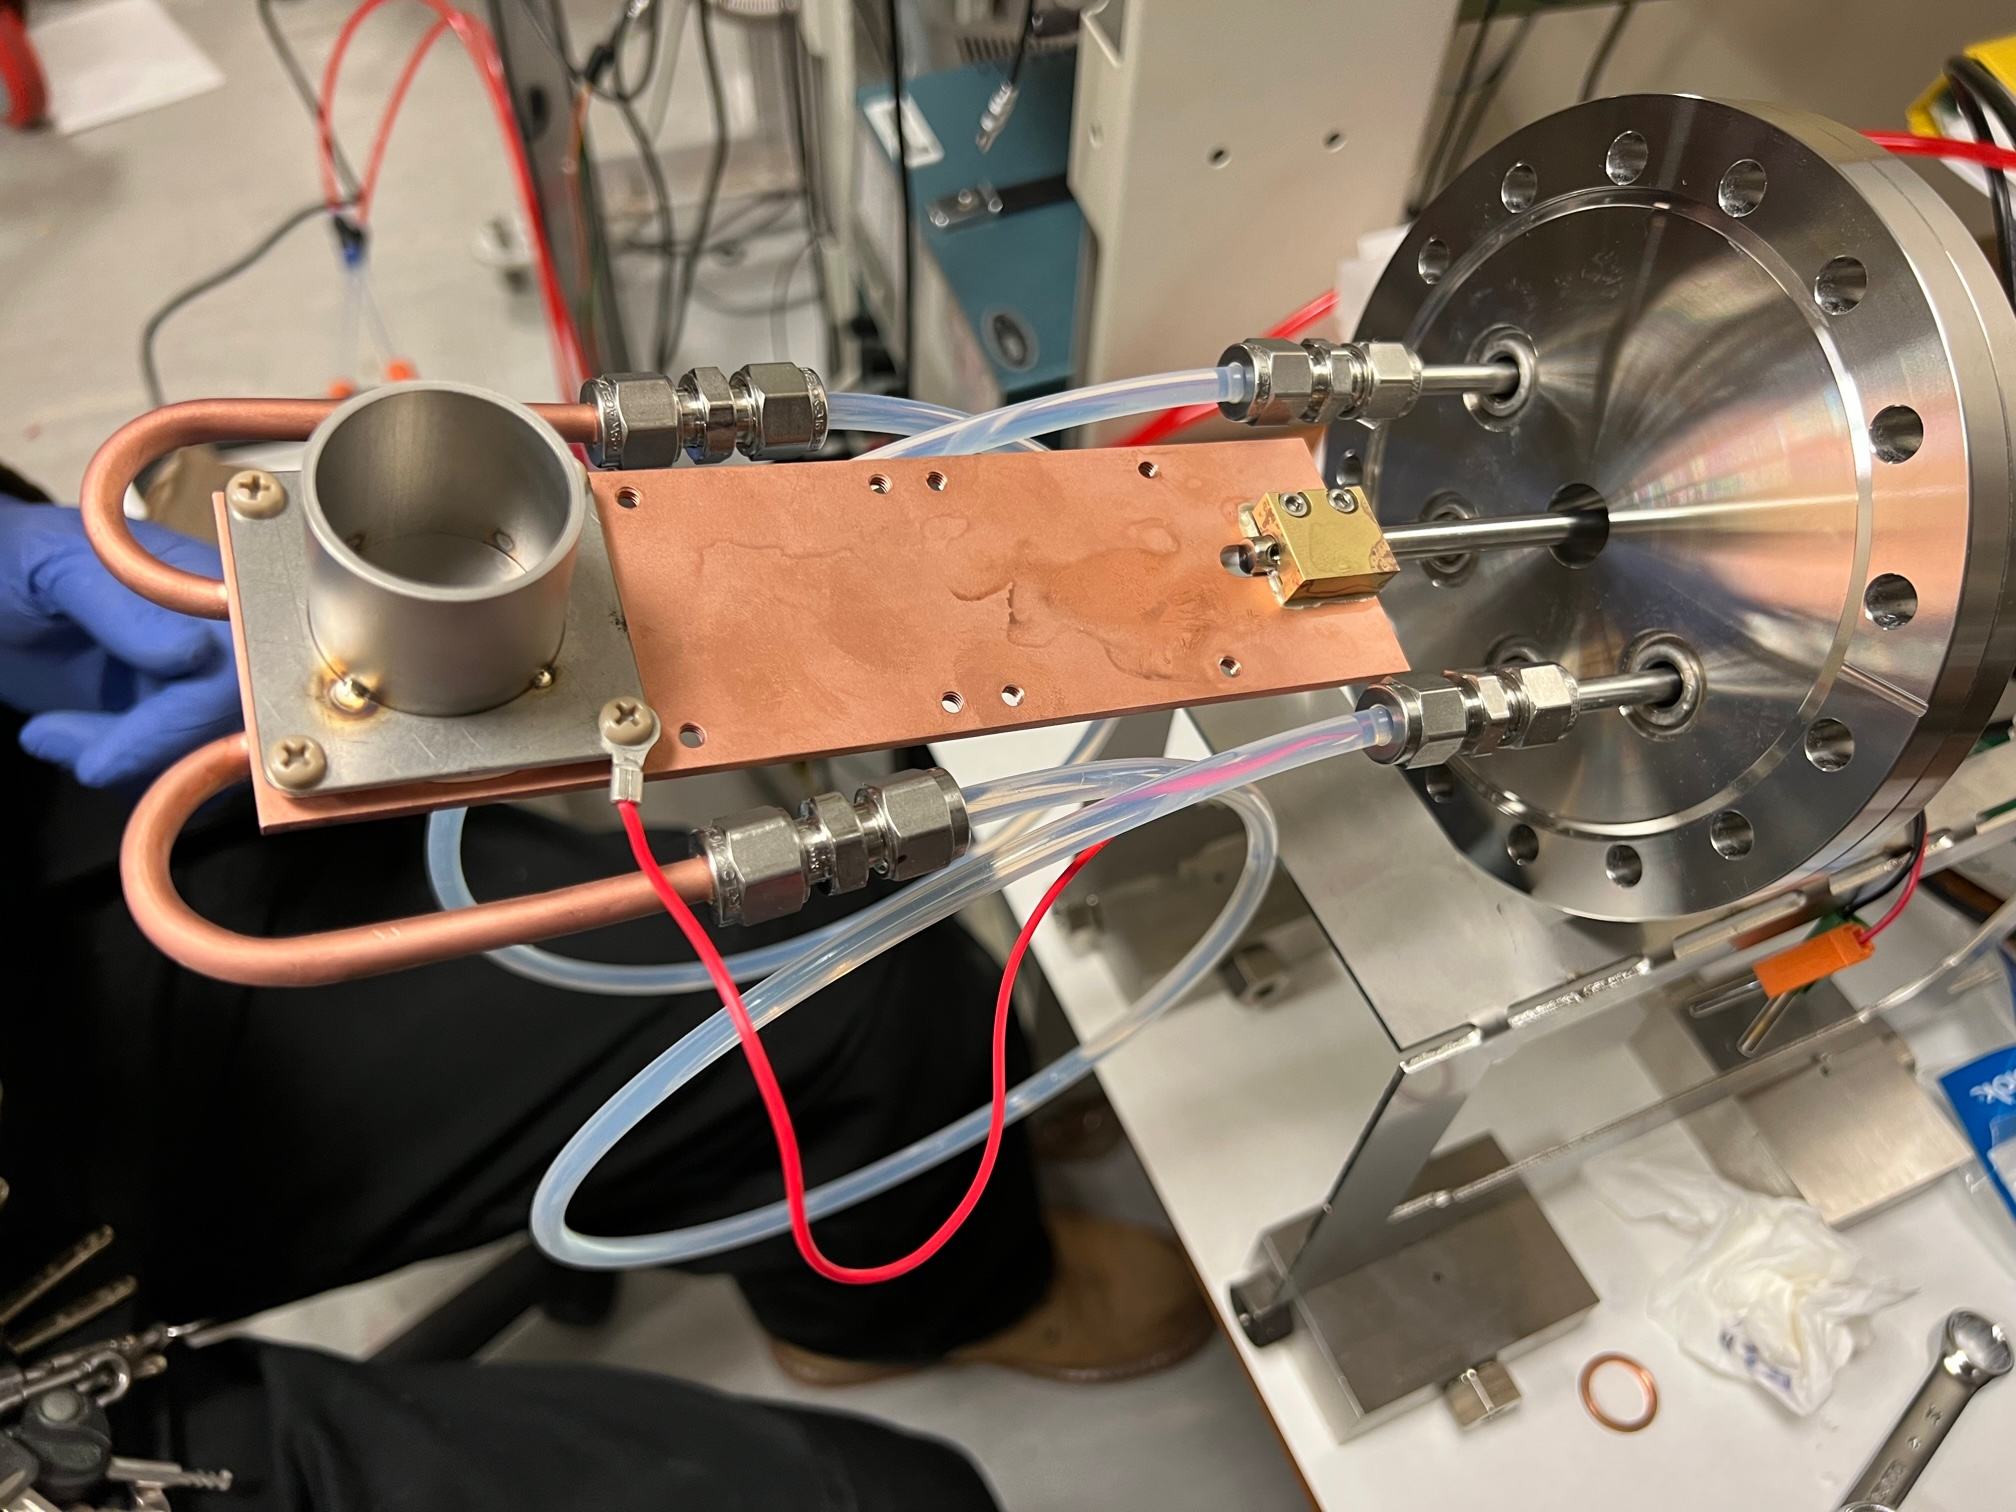
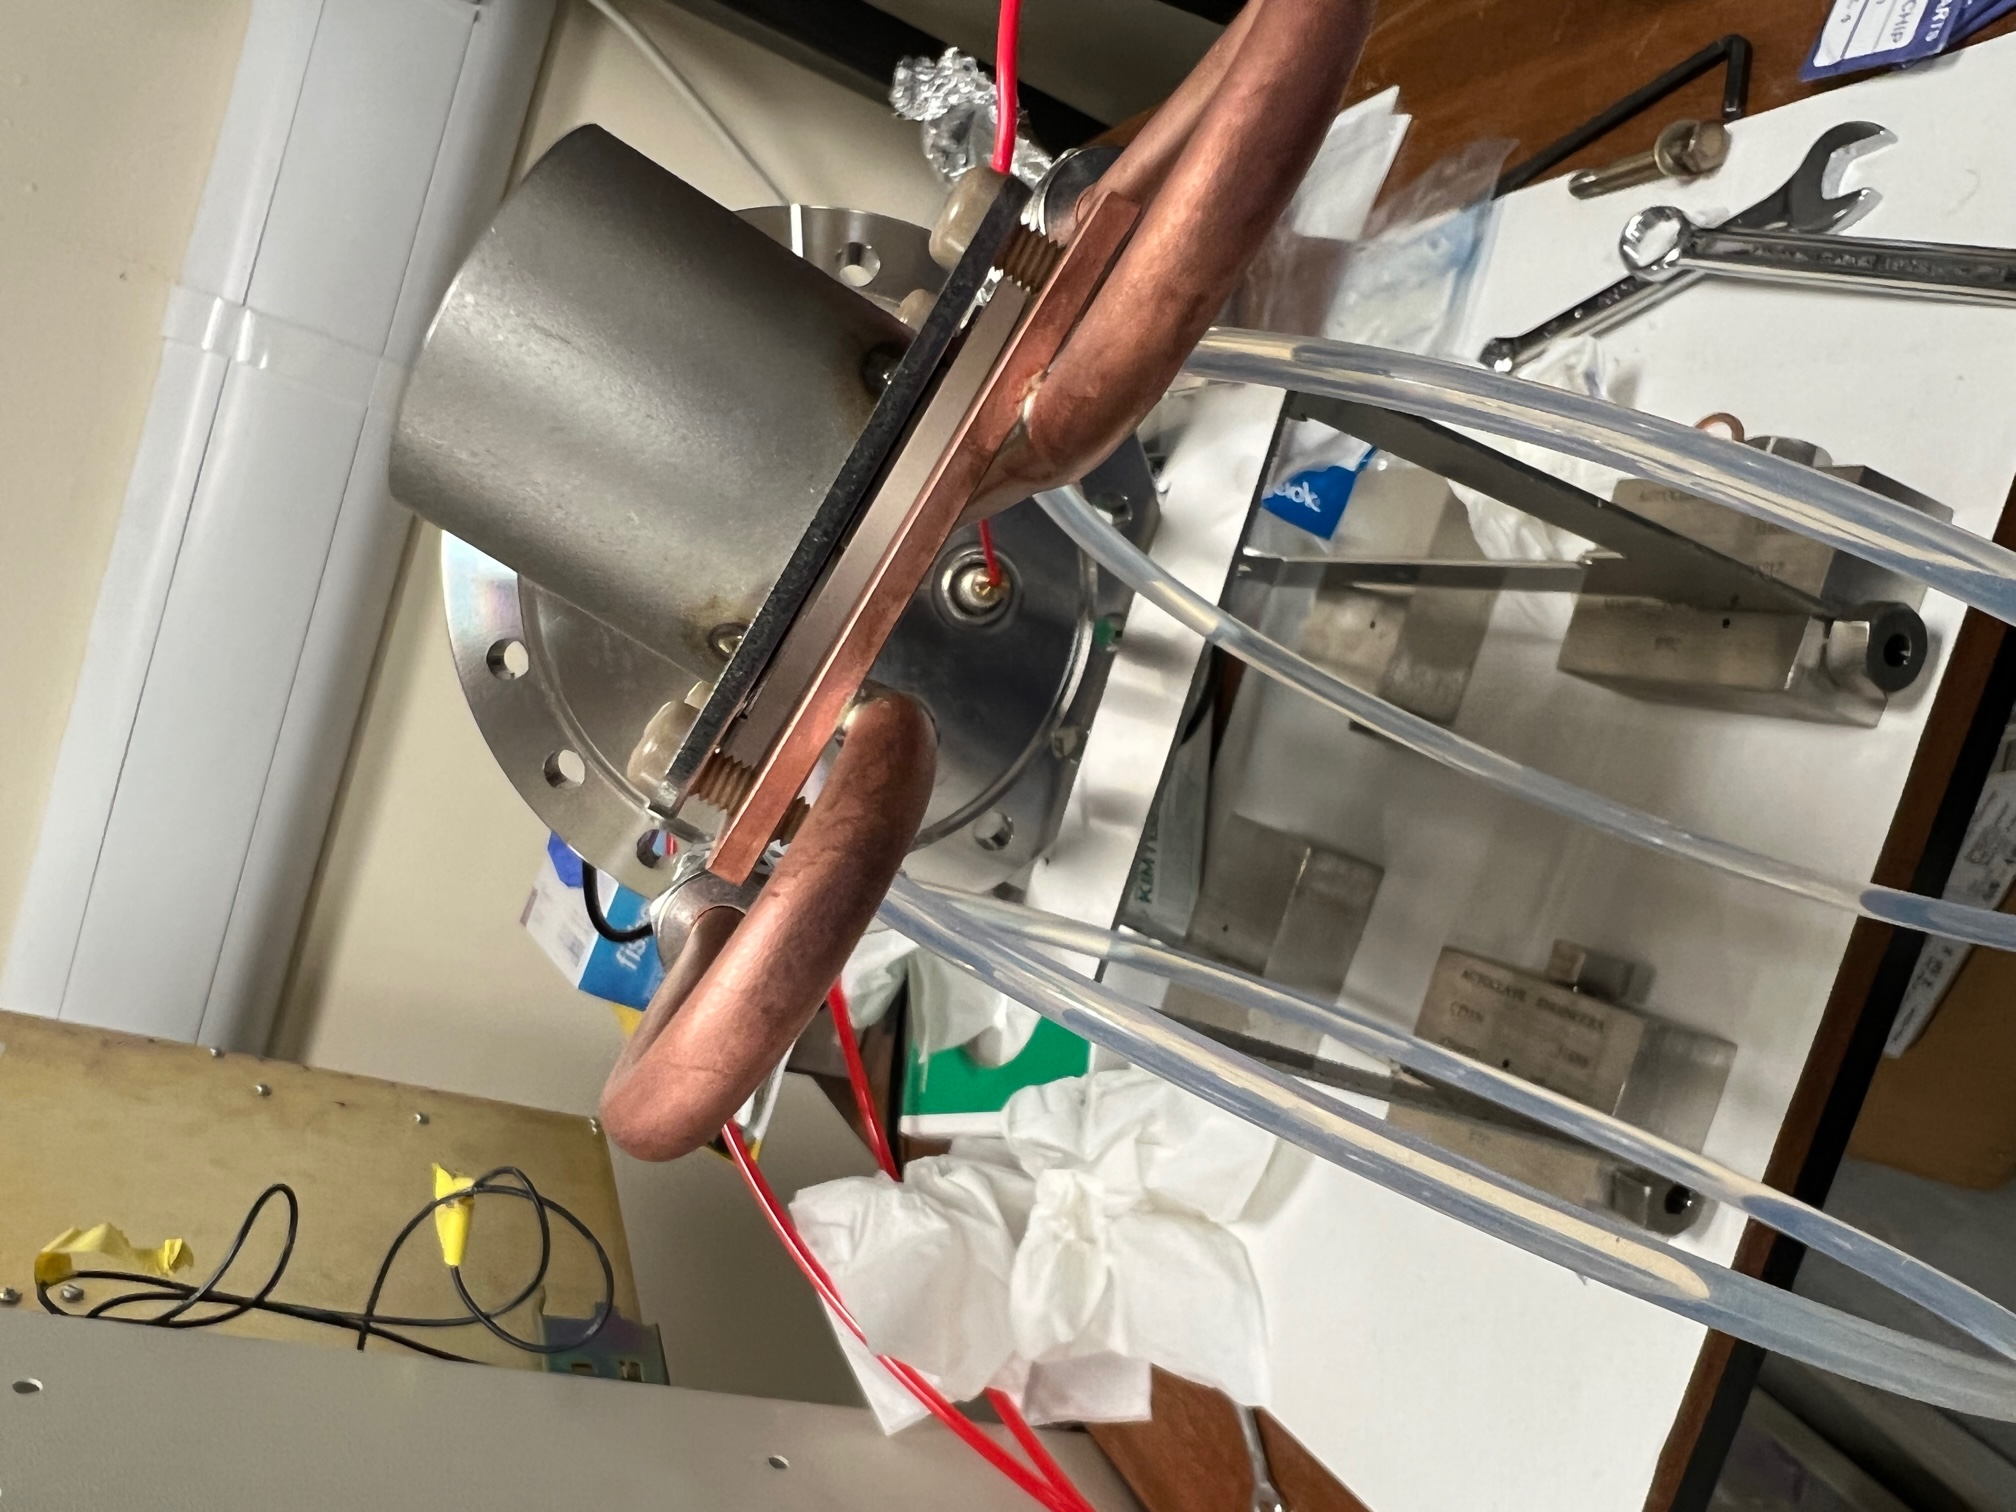
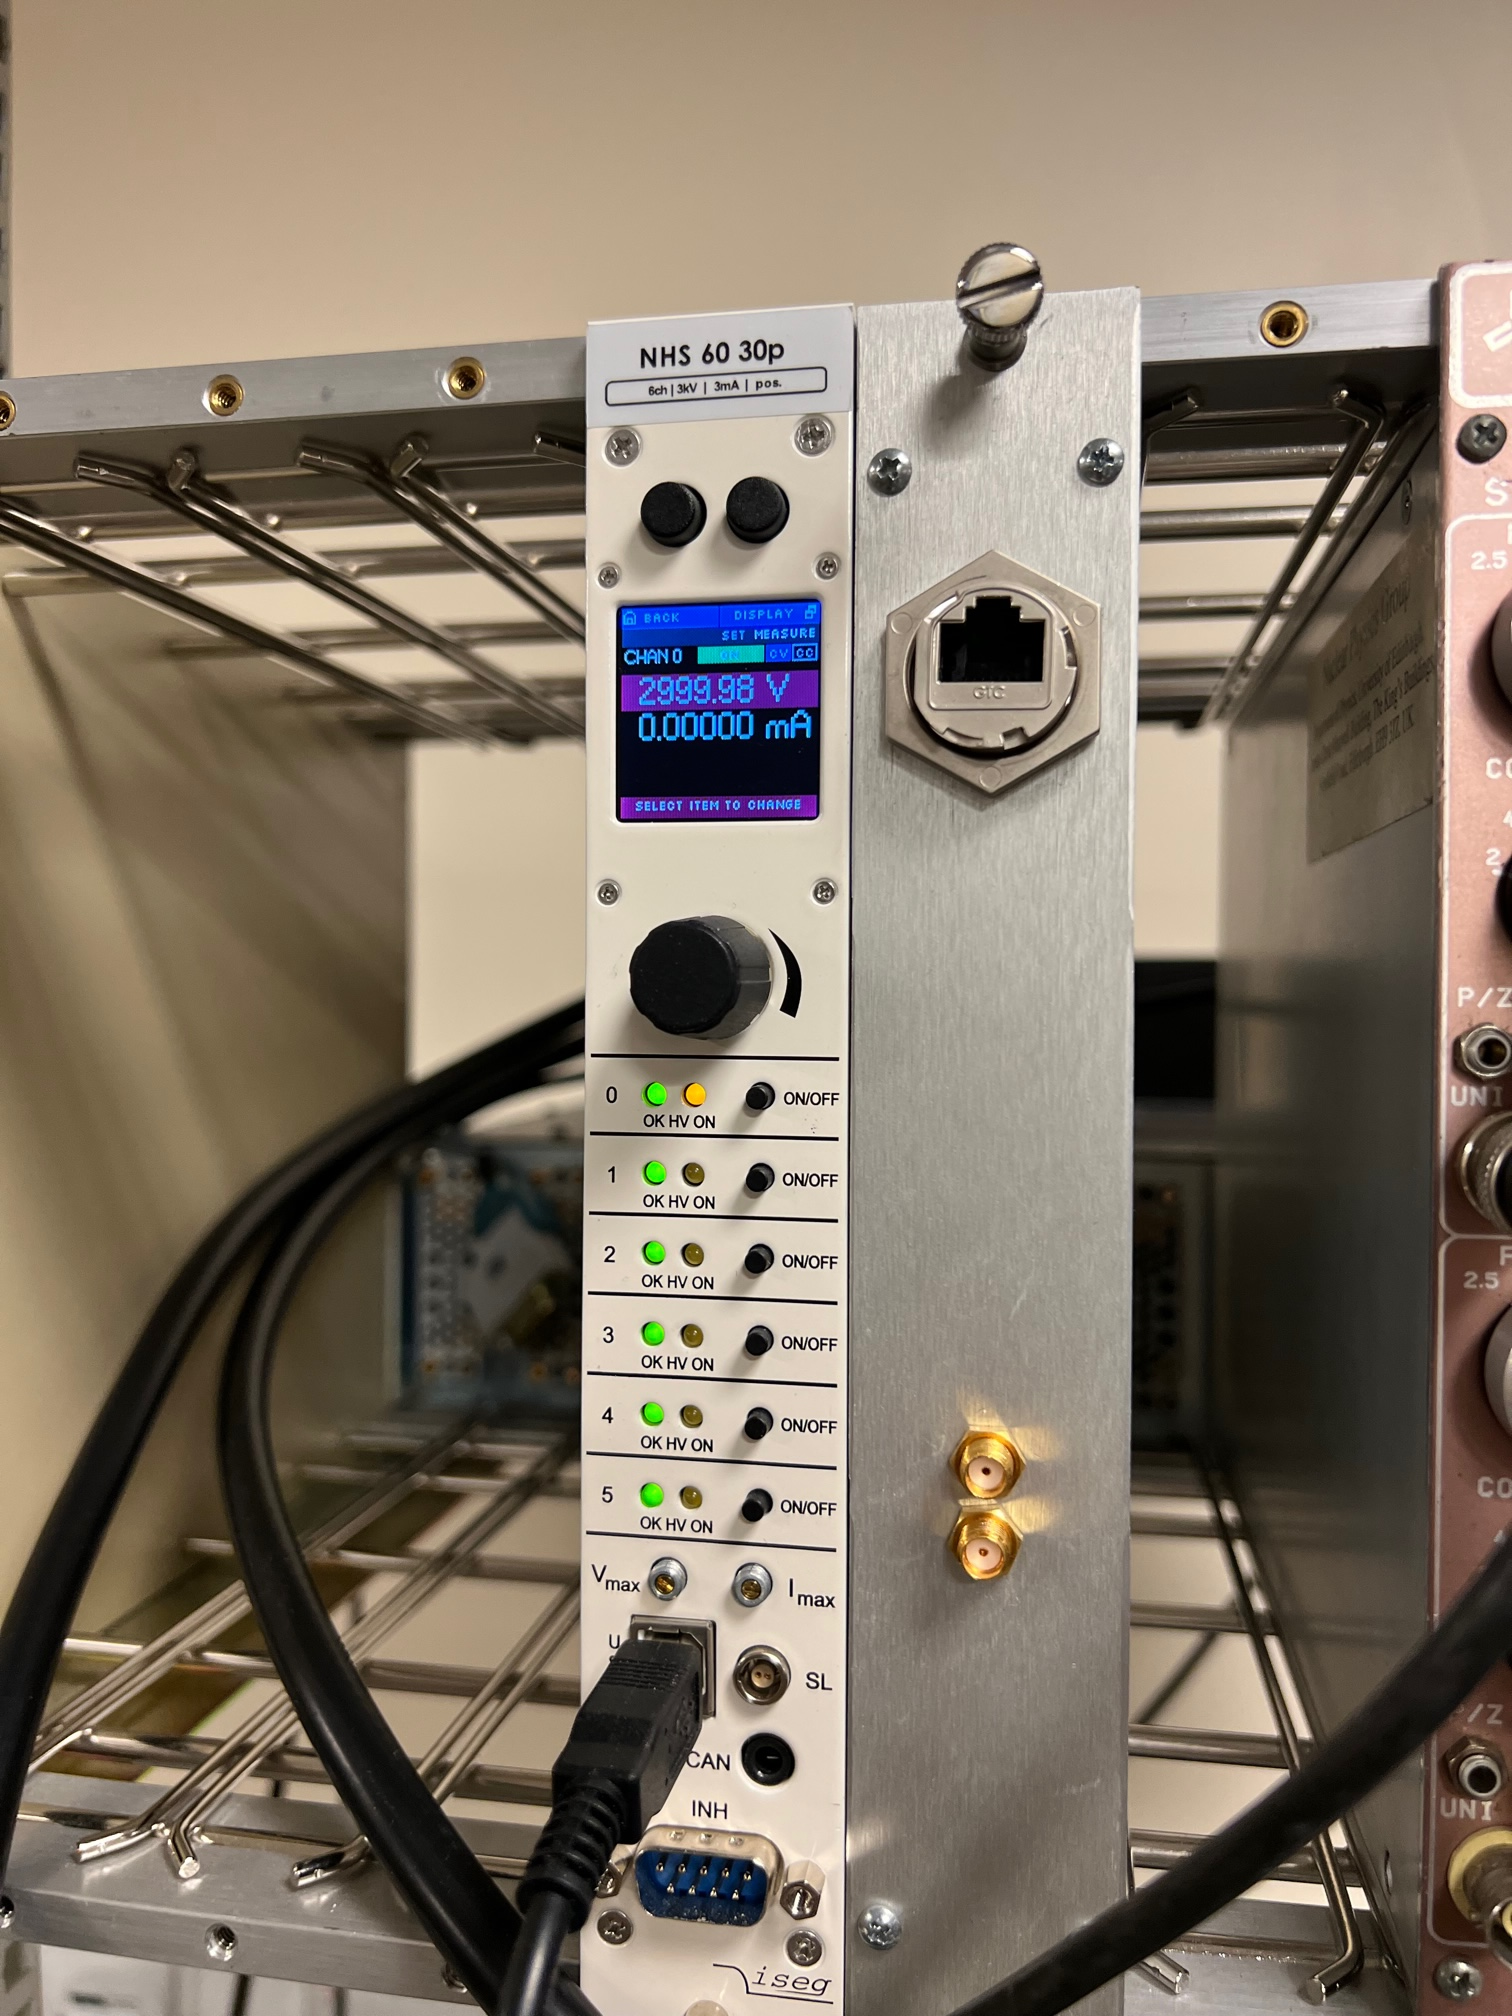
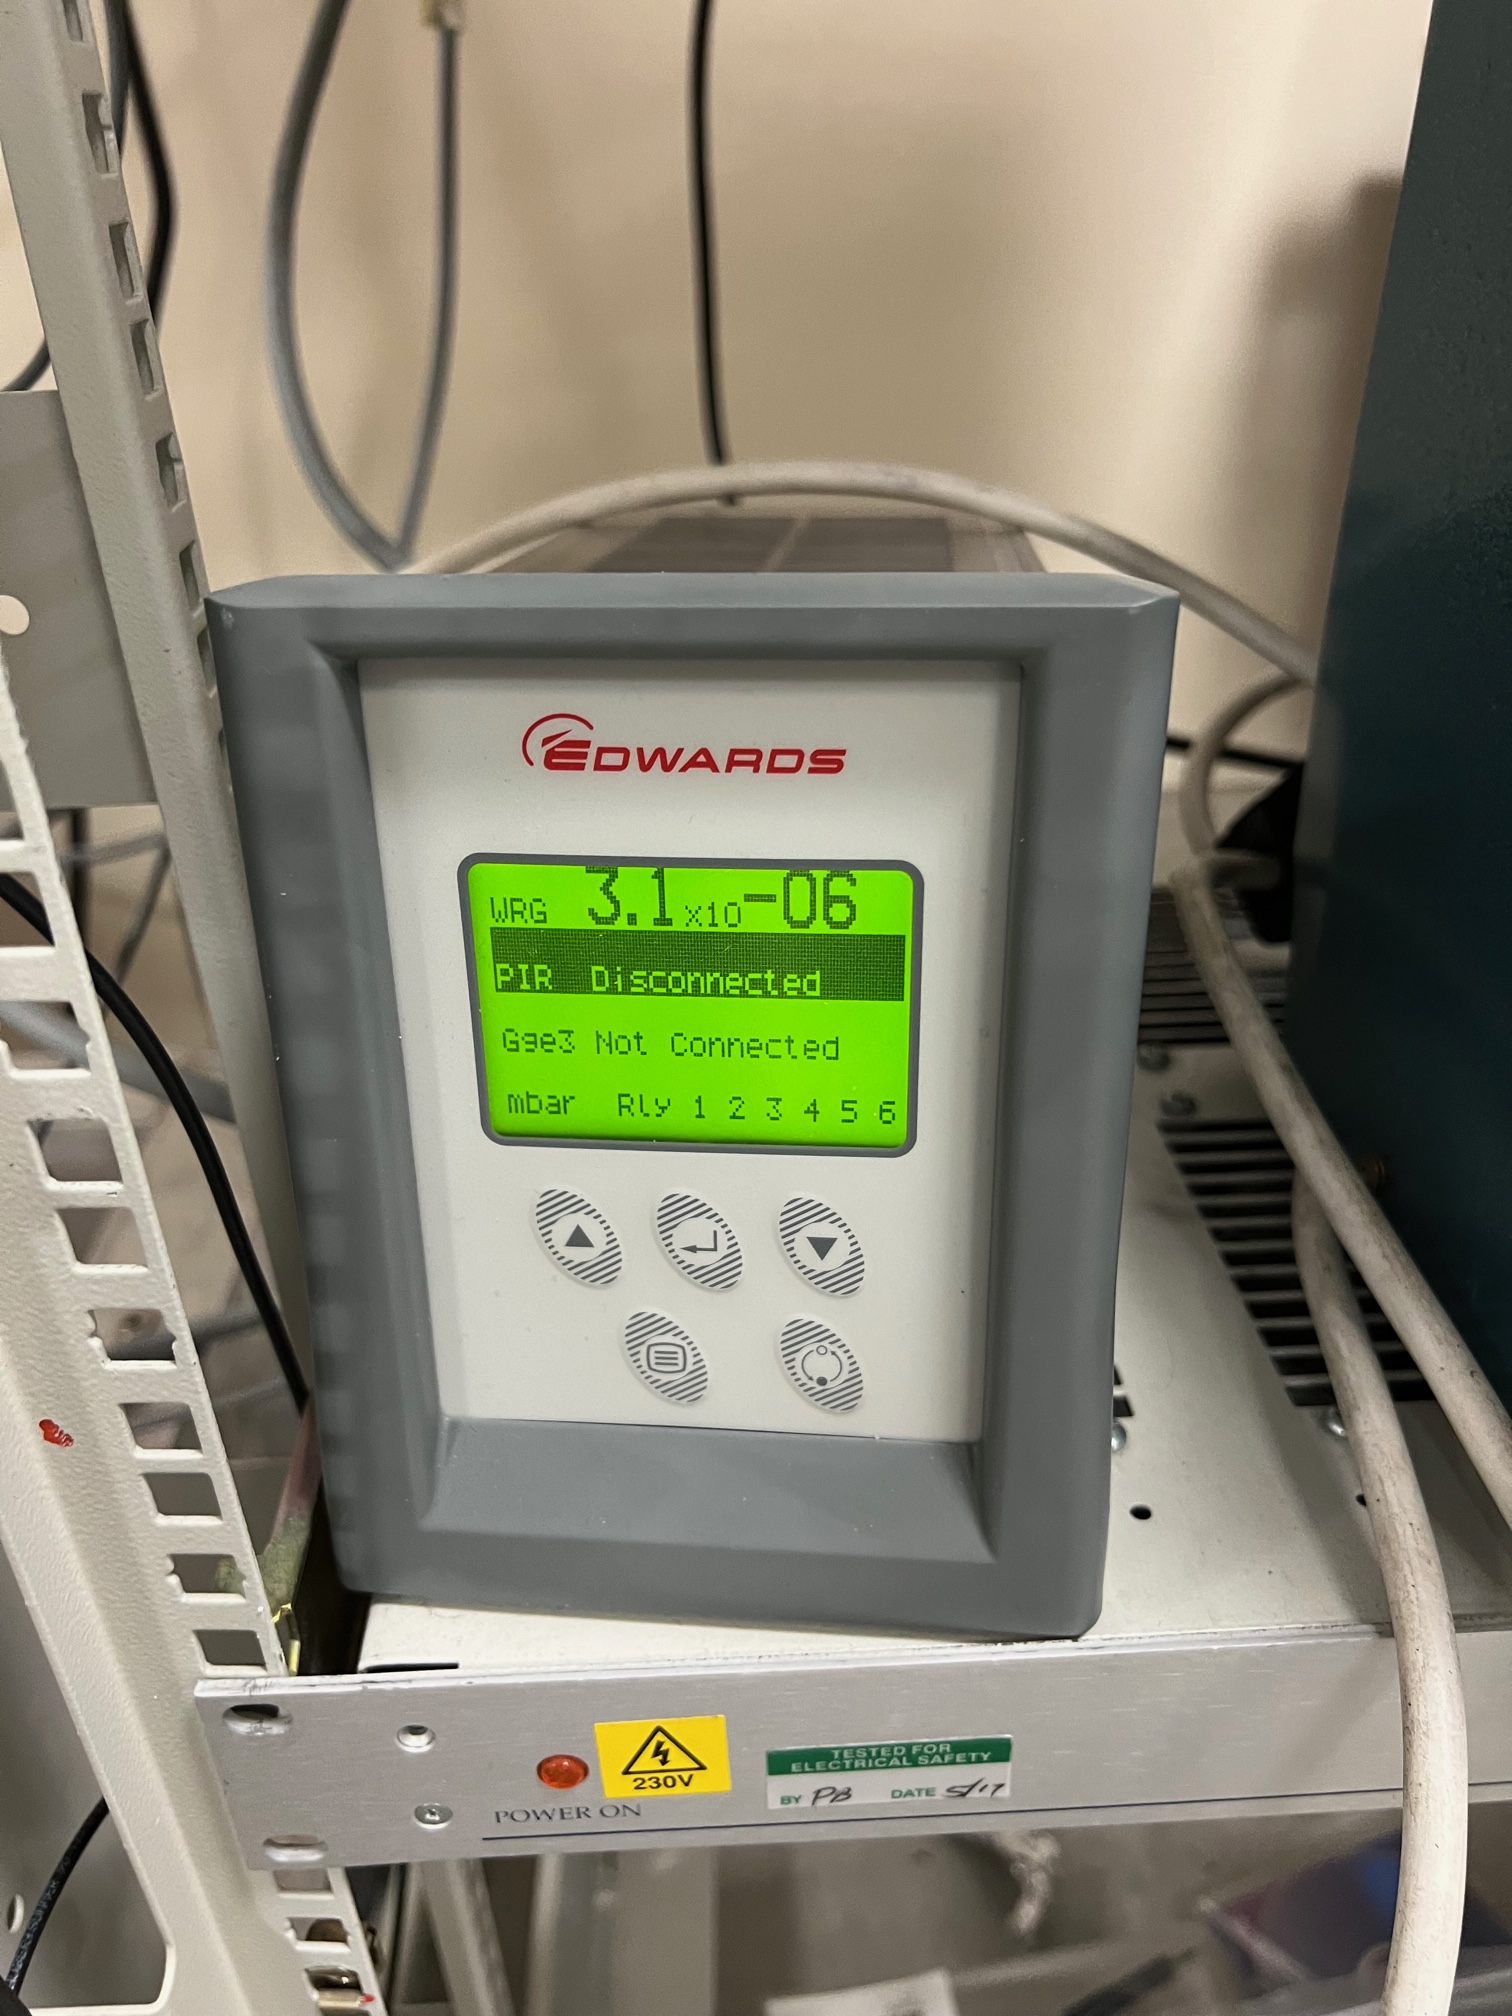
Flange connected to the cooling system was cleaned, hoses changed, and one Faraday cup mounted and tested in vacuum. Sapphirine chip was used as an insulator. A vacuum of 3.1E-6 mbar is achieved.
|
| Attachment 1: IMG_3114.jpg
|
|
| Attachment 2: IMG_3116.jpg
|
|
| Attachment 3: IMG_3117.jpg
|
|
| Attachment 4: IMG_3120.jpg
|
|
| Attachment 5: IMG_3124.jpg
|
|
|
2
|
Mon Feb 5 15:17:48 2024 |
Konrad, Ragan, Peter | Vacuum testing of the flange with water cooling |
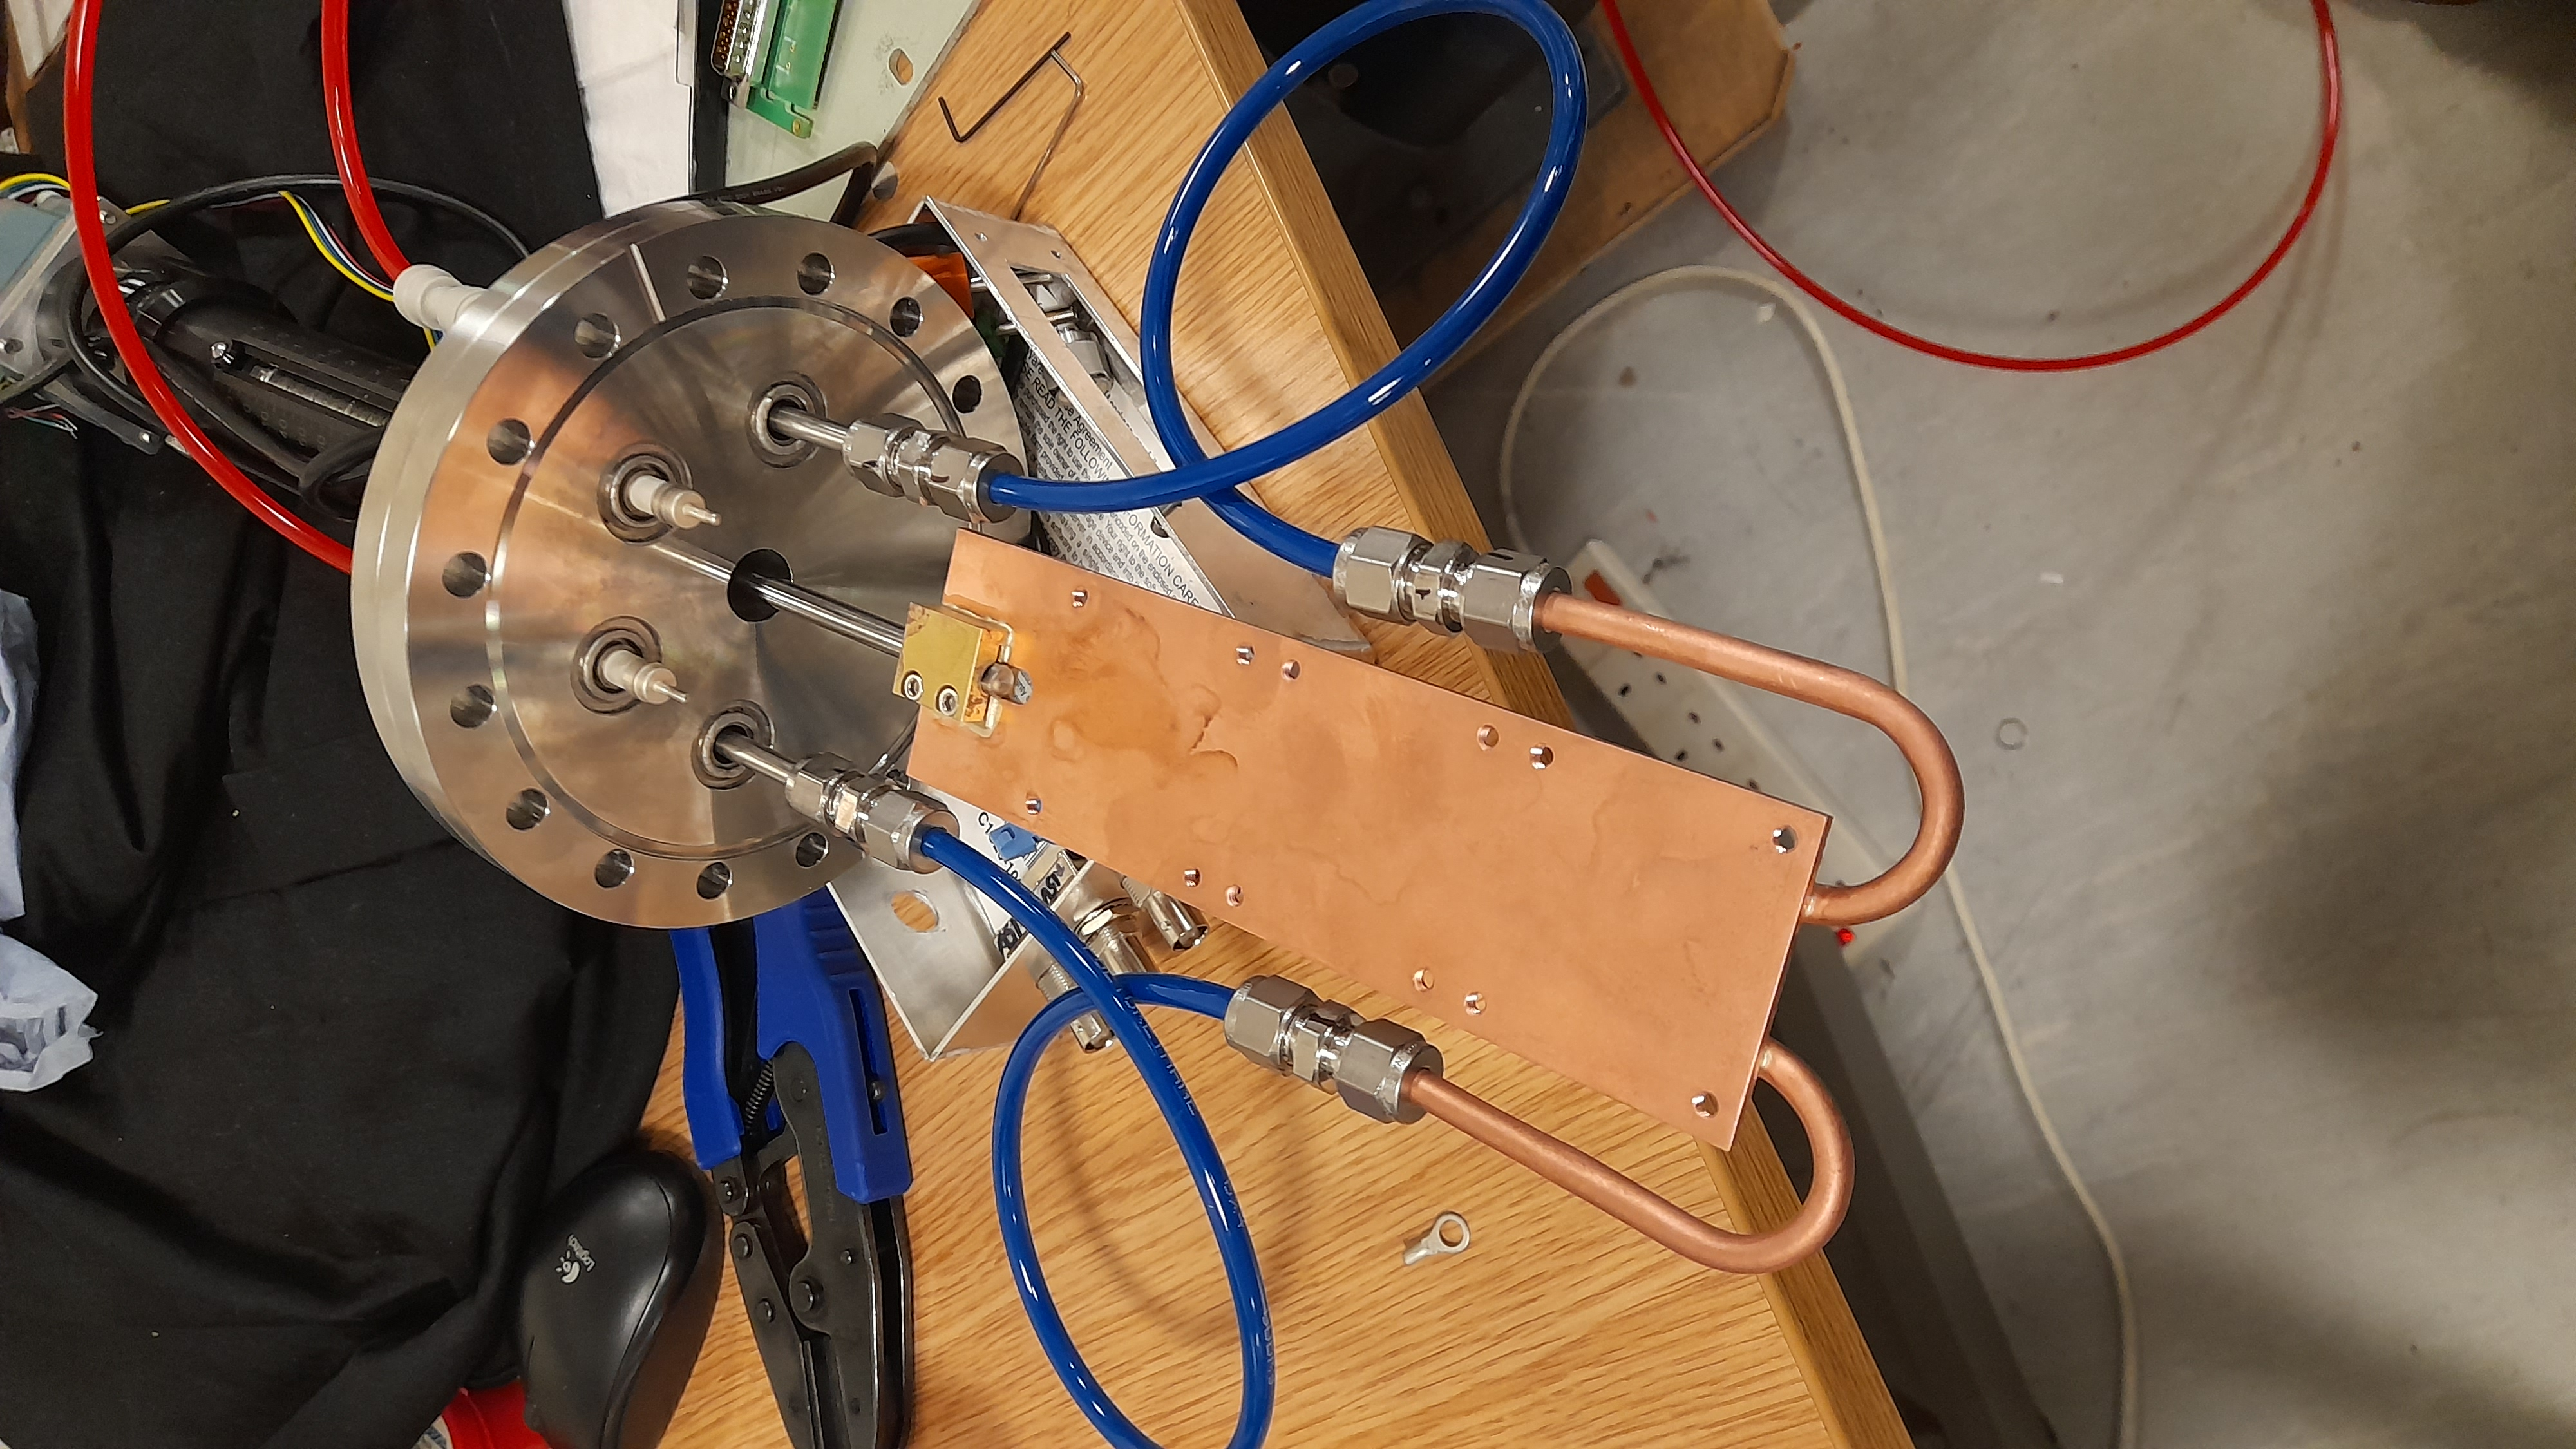
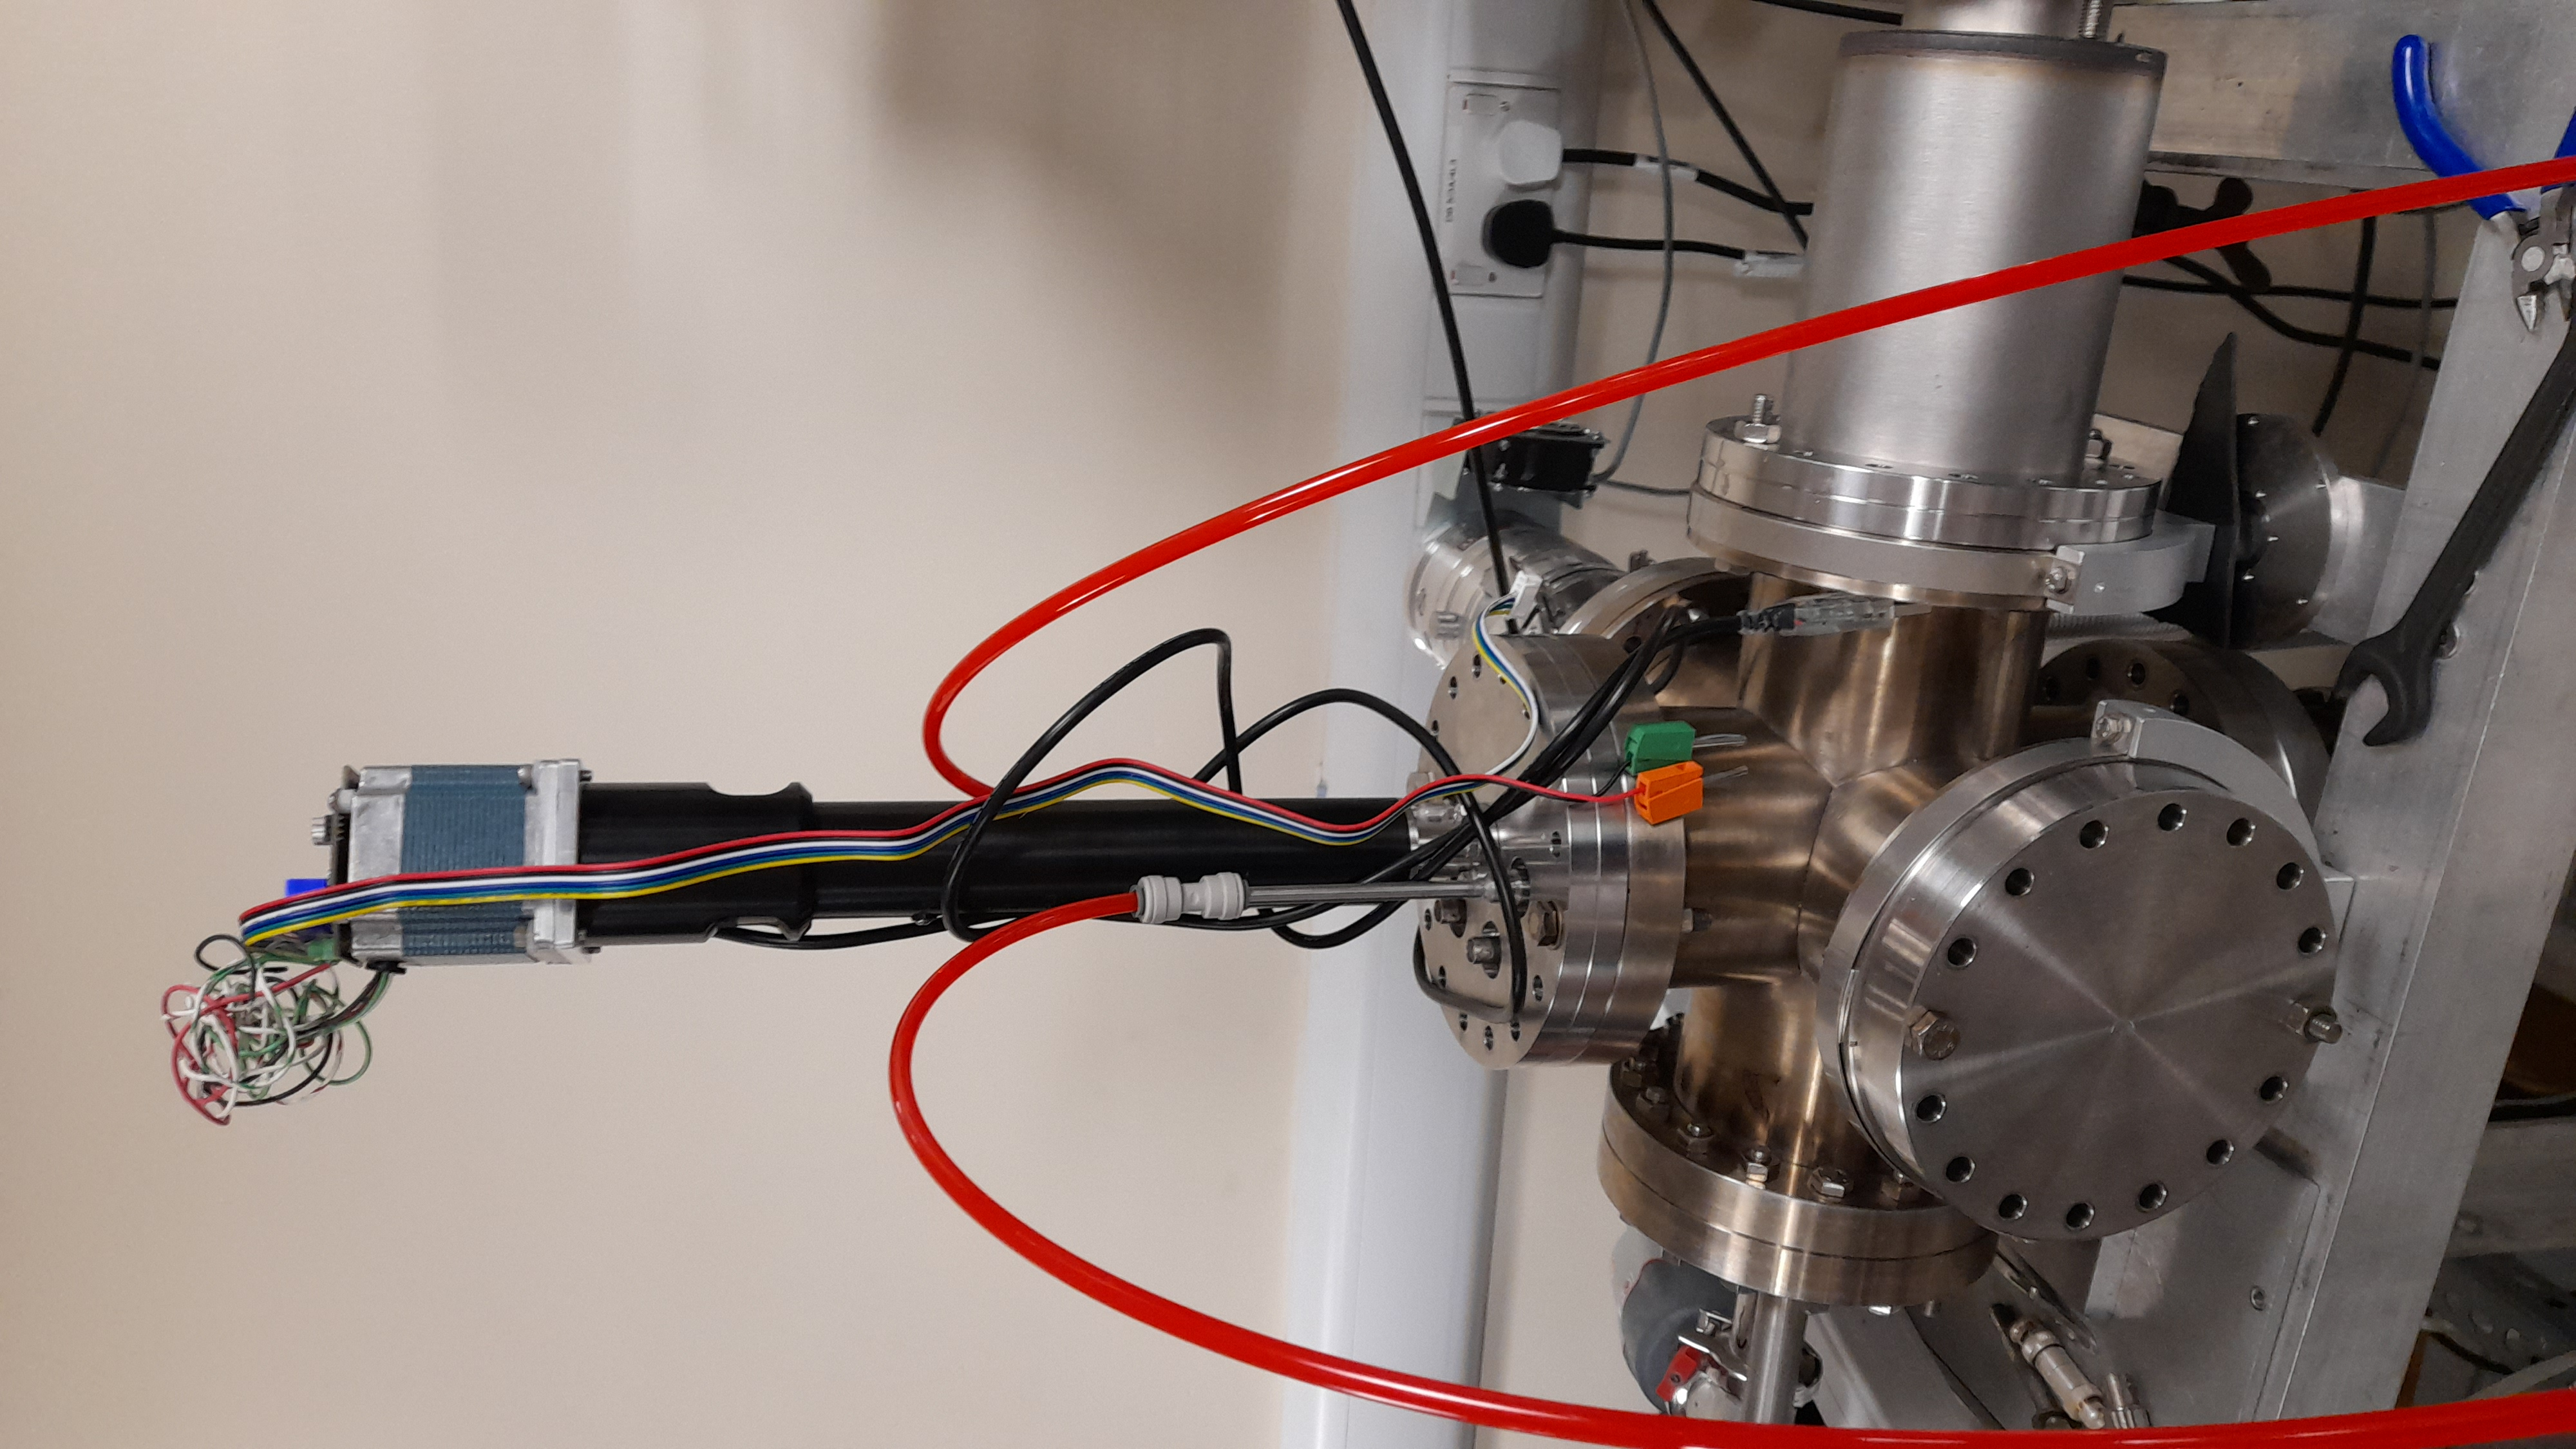
Connected the flange with the cooling system in place, attached pictures represent the set up used. Currently testing for potential leaks as minimum pressure achived is 4.0e-5 mbar
| Pressure (mbar) |
Time (sec) |
| 8.7e-4 |
109 |
| 6.3e-4 |
125 |
| 4.5e-4 |
155 |
| 3.5e-4 |
190 |
| 1.2e-4 |
430 |
| 9.6e-5 |
570 |
| 8.1e-5 |
720 |
| 6.2e-5 |
1030 |
|
5.8e-5
|
1200 |
| 5.6e-5 |
1500 |
| 5.4e-5 |
1680 |
| 5.1e-5 |
1930 |
| 4.8e-5 |
2340 |
| 4.4e-5 |
3120 |
| 4.2e-5 |
4200 |
| 4.1e-5 |
4860 |
| 4.0e-5 |
6480 |
|
| Attachment 1: 20240205_135233.jpg
|
|
| Attachment 2: 20240206_102014.jpg
|
|
|
1
|
Fri Jan 26 09:00:22 2024 |
Ragan | Shiftplan |
https://docs.google.com/spreadsheets/d/148e5YV3PrkPvQTYykbtNmv3sZqCtmdoY-Ad0gs5dplc/edit#gid=0 |