ID |
Date |
Author |
Subject |
438
|
Fri May 13 02:56:36 2022 |
ML | 2h-Shift Checks |
All seemnormal on AIDA side.
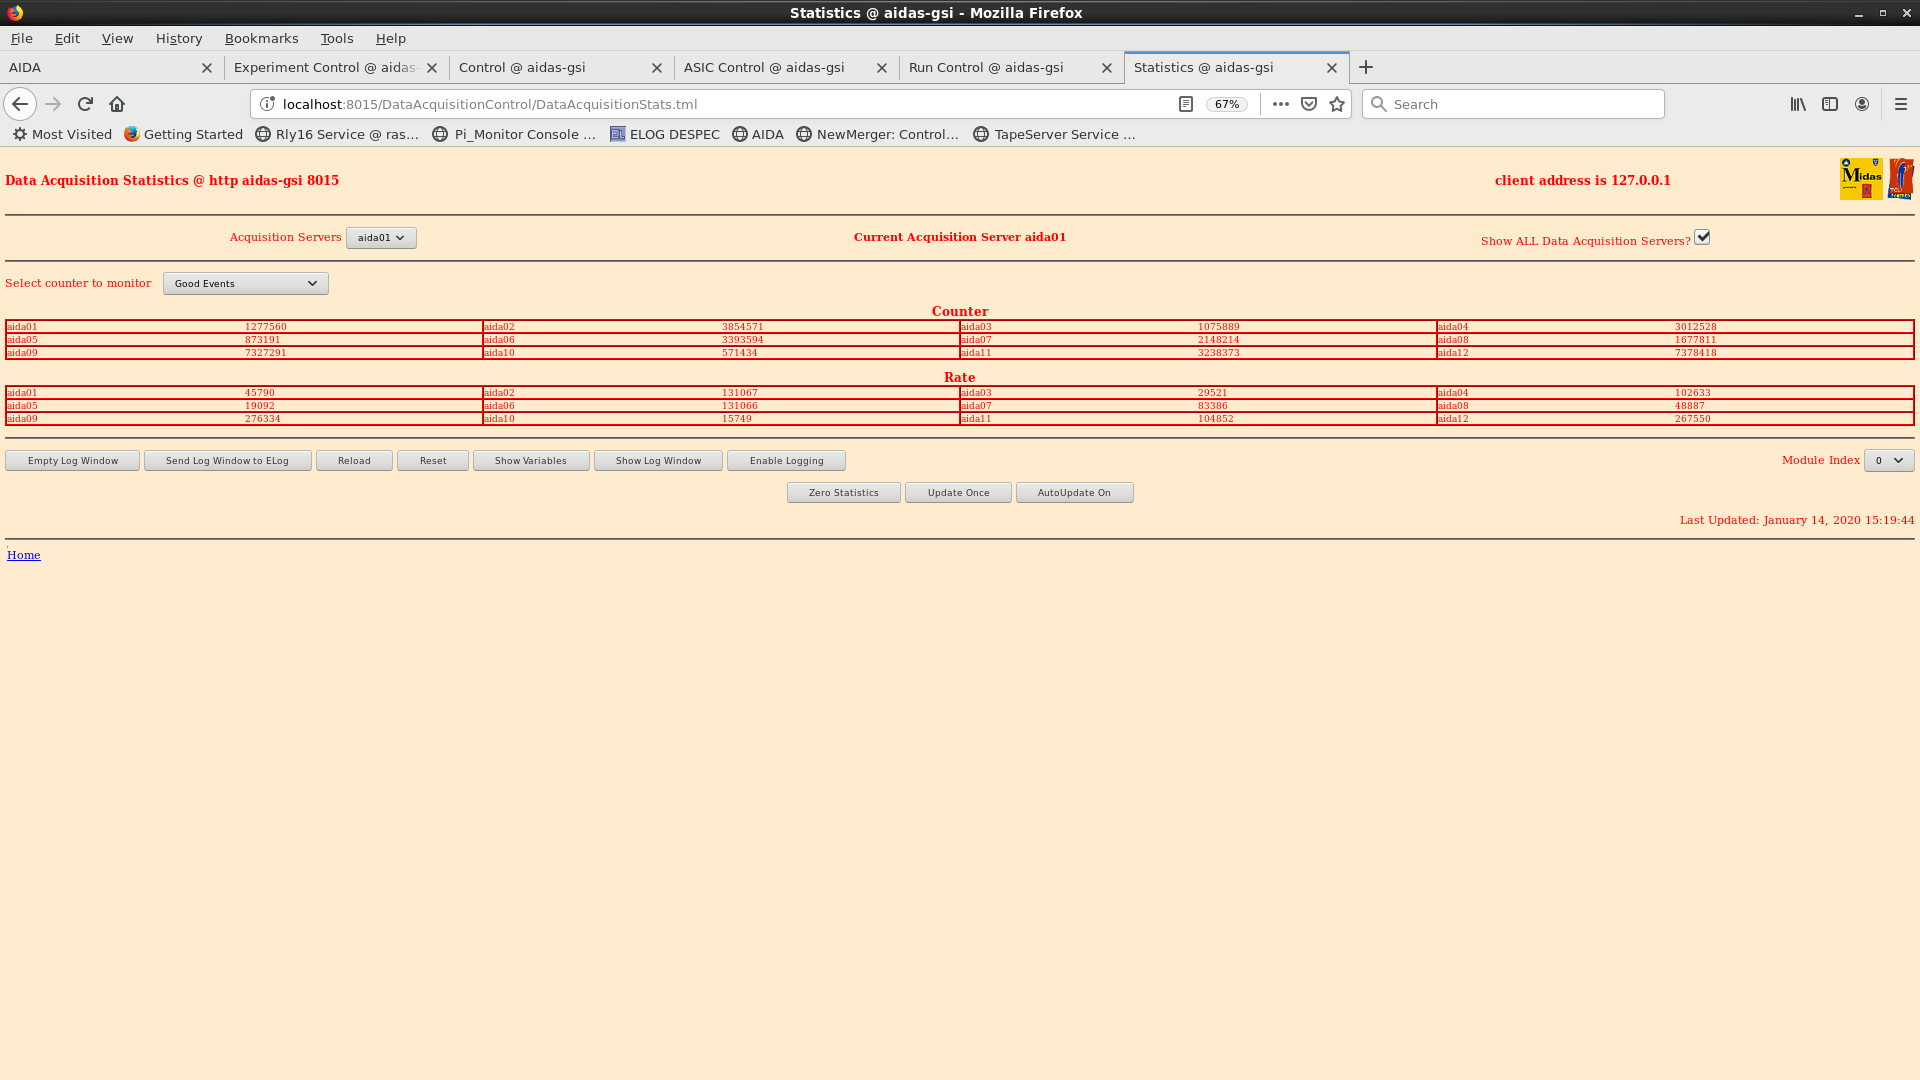
Stats as before
Temperatures stable
HV-LV ok
System wide check : all results as in the previous checks |
Attachment 1: Stats_Screenshot_from_2022-05-13_03-43-34.png
|
|
Attachment 2: Temp_Screenshot_from_2022-05-13_03-44-41.png
|
|
Attachment 3: HV_LC_Screenshot_from_2022-05-13_03-41-28.png
|
|
439
|
Fri May 13 04:45:23 2022 |
ML | 2h-Shift Checks |
AIDA is running ok. Note that, in the last hour or so, the rate of implant in DSSD1 is back to higher rate ~10 Hzto 15 Hz as at the beginning of this shift.
Stats seems ok
Temperatures stable
Leakage current: ok
A systwm wide check gives same result as for the fist check on this shift at ~1am |
Attachment 1: Stats_Screenshot_from_2022-05-13_05-43-14.png
|
|
Attachment 2: Temp_Screenshot_from_2022-05-13_05-42-10.png
|
|
Attachment 3: HV_LC_Screenshot_from_2022-05-13_05-41-23.png
|
|
440
|
Fri May 13 06:47:33 2022 |
ML | 2h-Shift Checks |
It has been a quiet night. AIDA has been stable.
Stats appears stable appear
Temperature also stable
Leakage current slowly dropping still.
System wide checks done. Status quo here again. |
Attachment 1: Stats_Screenshot_from_2022-05-13_07-43-54.png
|
|
Attachment 2: Temp_Screenshot_from_2022-05-13_07-43-13.png
|
|
Attachment 3: HV_LC_Screenshot_from_2022-05-13_07-42-38.png
|
|
444
|
Fri May 13 23:37:59 2022 |
ML | 2h-Shift Checks |
Took over remotely from CB about an hour ago
At 0h40 (CET):
Stats still ok - attach 1
Leakage still OK - Attach 2
Temps - attach 3
Grafana OK
UCESB rates ok - attach 5
System-wide checks: aida09 fails clock (1), aida02 06 09 10 13 fail ADC calibration, all pass WR |
Attachment 1: Stats_Screenshot_from_2022-05-14_00-40-56.png
|
|
Attachment 2: HV_LC_Screenshot_from_2022-05-14_00-39-51.png
|
|
Attachment 3: temp_Screenshot_from_2022-05-14_00-41-44.png
|
|
Attachment 4: UCESB_Screenshot_from_2022-05-14_01-00-00.png
|
|
445
|
Sat May 14 01:52:03 2022 |
ML | 2h-Shift Checks |
AIDA stats ok
Leakage current ok
Temperatires ok
grafana ok
ucesb rates dropped a bit in all scalers so beam intensity must have dropped a bit.
System wide check done and same results as earlier:
aida09 fails clock (1), aida02 06 09 10 13 fail ADC calibration, all pass WR |
Attachment 1: Stats_Screenshot_from_2022-05-14_02-48-14.png
|
|
Attachment 2: Temp_Screenshot_from_2022-05-14_02-47-31.png
|
|
Attachment 3: HV_LC_Screenshot_from_2022-05-14_02-46-42.png
|
|
Attachment 4: ucesb_rates_Screenshot_from_2022-05-14_02-50-36.png
|
|
Attachment 5: Grafana_Screenshot_from_2022-05-14_03-50-00.png
|
|
37
|
Tue Mar 26 14:59:30 2019 |
NH | 26.03.2019 |
Fig1: FEE temperatures from 26.03.2019 all OK
AIDA has been on today and merger setting fixed (see previous ELOG entry https://elog.ph.ed.ac.uk/DESPEC/36)
Still diagnosing issues with MBS (figure 2) but local data acquisition should be functional.
Detector has not been biased. |
Attachment 1: 20190326Temps.png
|
|
Attachment 2: aidambsrelay-error.png
|
|
23
|
Fri Jan 25 09:54:12 2019 |
CA, TD, NH, VP | 25th January 2019 |
09.30: AIDA still running, not writing to file
Still running ok
No water leaks
09.45: FEE64 temperatures ok (attachment 1)
Good event statistics ok (attachment 2)
10.00: Results of System Wide Checks
ADC Calibration check (attachment 3)
Clock Status (attachment 4)
Sync error counter (attachment 5)
White Rabbit Decoder status (attachment 7)
Memory Information (attachment 8)
10.30: Clock ReSync performed (attachment 6)
Start writing to file TapeData/NULL/R7_0
11.50: DAQ stopped, TapeServer stopped
TapeServer restarted, DAQ restarted
Writing to file TapeData/NULL/R9_0 with Clock ReSync at start.
Wasn't writing to disk, restarting (DAQ stop, TapeServer stop, TapeServer start TO DISK, DAQ Start)
Writing to file TapeData/NULL/R10_0
12.04: DAQ stopped, TapeServer stopped, merger stopped
FEE64 power relay switched off
Raspberry PIs switched off and disconnected
water cooler stopped
Mains IEC cables removed from relay
|
Attachment 1: 250119temp.png
|
|
Attachment 2: 250119stats.png
|
|
Attachment 3: adccalib.png
|
|
Attachment 4: clockstatus.png
|
|
Attachment 5: syncerror.png
|
|
Attachment 6: syncpulse.png
|
|
Attachment 7: wrdecoder.png
|
|
Attachment 8: meminfo2.png
|
|
646
|
Sun Jun 9 22:49:56 2024 |
TD | 23:00-07:00 Monday 9 June |
23.47 DSSSD bias & leakage current OK - attachments 1-2
FEE64 temperatures OK - attachment 3
ADC, PAUSE and MBS correlation scaler data item stats - attachments 4-5 & 9
WR timestamp - attachment 7
all system wide checks OK *except* attachments 6 & 10
per FEE64 Rate spectra - attachment 8
per FEE64 1.8.W spectra - 20us FSR - attachments 11-13
Merger, TapeServer etc - attachments 14-15
data file S181/R4, TapeServer No Storage mode
00.00 Beam ON 3s spill on, 2s spill off
99%+ fission fragments
ADC data item stats - attachment 16
02.03 Data storage enabled
per FEE64 1.8.H spectra - attachments 17-18
02.35 analysis data file S181/R4_28 - attachment 19
data file S181/R4
max deadtime aida08 18%
n+n FEE64s 12-18%, all p+n FEE64s < 2%
02.41 Noted that there is disc data written to disk - all disc data now disabled for all FEE64s
04.08 DSSSD bias & leakage current OK - attachment 20
FEE64 temperatures OK - attachment 21
ADC data item stats - attachment 22
per FEE64 Rate spectra - attachment 23
04.15 aida02 no data
restarted merger per https://elog.ph.ed.ac.uk/DESPEC/644
06.00 DSSSD bias & leakage current OK - attachment 24
FEE64 temperatures OK - attachment 25
ADC data item stats - attachment 26
per FEE64 Rate spectra - attachment 27 |
Attachment 1: Screenshot_from_2024-06-09_23-47-24.png
|
|
Attachment 2: Screenshot_from_2024-06-09_23-47-42.png
|
|
Attachment 3: Screenshot_from_2024-06-09_23-48-00.png
|
|
Attachment 4: Screenshot_from_2024-06-09_23-48-04.png
|
|
Attachment 5: Screenshot_from_2024-06-09_23-48-16.png
|
|
Attachment 6: Screenshot_from_2024-06-09_23-48-41.png
|
|
Attachment 7: Screenshot_from_2024-06-09_23-49-10.png
|
|
Attachment 8: Screenshot_from_2024-06-09_23-49-18.png
|
|
Attachment 9: Screenshot_from_2024-06-09_23-55-16.png
|
|
Attachment 10: Screenshot_from_2024-06-09_23-55-48.png
|
|
Attachment 11: Screenshot_from_2024-06-09_23-56-49.png
|
|
Attachment 12: Screenshot_from_2024-06-09_23-57-05.png
|
|
Attachment 13: Screenshot_from_2024-06-09_23-57-28.png
|
|
Attachment 14: Screenshot_from_2024-06-09_23-58-23.png
|
|
Attachment 15: Screenshot_from_2024-06-09_23-58-29.png
|
|
Attachment 16: Screenshot_from_2024-06-10_00-11-59.png
|
|
Attachment 17: Screenshot_from_2024-06-10_01-27-52.png
|
|
Attachment 18: Screenshot_from_2024-06-10_02-01-38.png
|
|
Attachment 19: R4_28
|
*** TDR format 3.3.0 analyser - TD - May 2021
*** ERROR: READ I/O error: 5002
blocks: 32000
ADC data format: 253194077 ( 1696553.0 Hz)
Other data format: 8725923 ( 58468.9 Hz)
Sample trace data format: 0 ( 0.0 Hz)
Undefined format: 0 ( 0.0 Hz)
Other data format type: PAUSE: 1564 ( 10.5 Hz)
RESUME: 1562 ( 10.5 Hz)
SYNC100: 32556 ( 218.1 Hz)
WR48-63: 32556 ( 218.1 Hz)
FEE64 disc: 3047502 ( 20420.1 Hz)
MBS info: 5610183 ( 37591.6 Hz)
Other info: 0 ( 0.0 Hz)
ADC data range bit set: 916603 ( 6141.8 Hz)
Timewarps: ADC: 0 ( 0.0 Hz)
PAUSE: 0 ( 0.0 Hz)
RESUME: 0 ( 0.0 Hz)
SYNC100: 0 ( 0.0 Hz)
WR48-63: 0 ( 0.0 Hz)
FEE64 disc: 0 ( 0.0 Hz)
MBS info: 0 ( 0.0 Hz)
Undefined: 0 ( 0.0 Hz)
Sample trace: 0 ( 0.0 Hz)
*** Timestamp elapsed time: 149.240 s
FEE elapsed dead time(s) elapsed idle time(s)
0 0.269 0.000
1 18.572 0.000
2 0.203 0.000
3 23.804 0.000
4 0.695 0.000
5 26.433 0.000
6 0.080 0.000
7 27.735 0.000
8 0.165 0.000
9 3.128 0.000
10 0.210 0.000
11 0.060 0.000
12 0.056 0.000
13 0.214 0.000
14 0.073 0.000
15 1.249 0.000
16 0.000 0.000
17 0.000 0.000
18 0.000 0.000
19 0.000 0.000
20 0.000 0.000
21 0.000 0.000
22 0.000 0.000
23 0.000 0.000
24 0.000 0.000
25 0.000 0.000
26 0.000 0.000
27 0.000 0.000
28 0.000 0.000
29 0.000 0.000
30 0.000 0.000
31 0.000 0.000
32 0.000 0.000
*** Statistics
FEE ADC Data Other Data Sample Undefined Pause Resume SYNC100 WR48-63 Disc MBS Other HEC Data
0 8063714 229134 0 0 29 29 1100 1100 222403 4473 0 40546
1 19451828 341670 0 0 189 189 2480 2480 336332 0 0 50938
2 9906047 1695573 0 0 32 32 1474 1474 189984 1502577 0 57685
3 25485973 434336 0 0 375 375 3209 3209 427168 0 0 33926
4 5225989 1088546 0 0 26 25 750 750 83786 1003209 0 36956
5 23827850 287577 0 0 303 303 2970 2970 281031 0 0 42461
6 7632945 803643 0 0 10 10 1067 1067 163557 637932 0 57385
7 43365063 397279 0 0 289 288 5505 5505 385692 0 0 246600
8 9556580 143268 0 0 16 16 1175 1175 140886 0 0 58513
9 31955982 1616616 0 0 155 155 4212 4212 145847 1462035 0 55475
10 13350940 89761 0 0 23 23 1645 1645 86425 0 0 31430
11 5509660 1131598 0 0 8 8 744 744 130137 999957 0 52425
12 7108103 102578 0 0 8 8 887 887 100788 0 0 34624
13 10337974 150173 0 0 26 26 1313 1313 147495 0 0 56686
14 5578272 207359 0 0 7 7 687 687 205971 0 0 33046
15 26837157 6812 0 0 68 68 3338 3338 0 0 0 27907
16 0 0 0 0 0 0 0 0 0 0 0 0
17 0 0 0 0 0 0 0 0 0 0 0 0
18 0 0 0 0 0 0 0 0 0 0 0 0
19 0 0 0 0 0 0 0 0 0 0 0 0
20 0 0 0 0 0 0 0 0 0 0 0 0
21 0 0 0 0 0 0 0 0 0 0 0 0
22 0 0 0 0 0 0 0 0 0 0 0 0
23 0 0 0 0 0 0 0 0 0 0 0 0
24 0 0 0 0 0 0 0 0 0 0 0 0
25 0 0 0 0 0 0 0 0 0 0 0 0
26 0 0 0 0 0 0 0 0 0 0 0 0
27 0 0 0 0 0 0 0 0 0 0 0 0
28 0 0 0 0 0 0 0 0 0 0 0 0
29 0 0 0 0 0 0 0 0 0 0 0 0
30 0 0 0 0 0 0 0 0 0 0 0 0
31 0 0 0 0 0 0 0 0 0 0 0 0
32 0 0 0 0 0 0 0 0 0 0 0 0
*** Timewarps
FEE ADC Pause Resume SYNC100 WR48-63 Disc MBS Undefined Samples
0 0 0 0 0 0 0 0 0 0
1 0 0 0 0 0 0 0 0 0
2 0 0 0 0 0 0 0 0 0
3 0 0 0 0 0 0 0 0 0
4 0 0 0 0 0 0 0 0 0
5 0 0 0 0 0 0 0 0 0
6 0 0 0 0 0 0 0 0 0
7 0 0 0 0 0 0 0 0 0
8 0 0 0 0 0 0 0 0 0
9 0 0 0 0 0 0 0 0 0
10 0 0 0 0 0 0 0 0 0
11 0 0 0 0 0 0 0 0 0
12 0 0 0 0 0 0 0 0 0
13 0 0 0 0 0 0 0 0 0
14 0 0 0 0 0 0 0 0 0
15 0 0 0 0 0 0 0 0 0
16 0 0 0 0 0 0 0 0 0
17 0 0 0 0 0 0 0 0 0
18 0 0 0 0 0 0 0 0 0
19 0 0 0 0 0 0 0 0 0
20 0 0 0 0 0 0 0 0 0
21 0 0 0 0 0 0 0 0 0
22 0 0 0 0 0 0 0 0 0
23 0 0 0 0 0 0 0 0 0
24 0 0 0 0 0 0 0 0 0
25 0 0 0 0 0 0 0 0 0
26 0 0 0 0 0 0 0 0 0
27 0 0 0 0 0 0 0 0 0
28 0 0 0 0 0 0 0 0 0
29 0 0 0 0 0 0 0 0 0
30 0 0 0 0 0 0 0 0 0
31 0 0 0 0 0 0 0 0 0
32 0 0 0 0 0 0 0 0 0
*** Program elapsed time: 38.183s ( 838.078 blocks/s, 52.380 Mb/s)
|
Attachment 20: Screenshot_from_2024-06-10_04-08-10.png
|
|
Attachment 21: Screenshot_from_2024-06-10_04-08-44.png
|
|
Attachment 22: Screenshot_from_2024-06-10_04-10-54.png
|
|
Attachment 23: Screenshot_from_2024-06-10_04-11-33.png
|
|
Attachment 24: Screenshot_from_2024-06-10_06-00-15.png
|
|
Attachment 25: Screenshot_from_2024-06-10_06-00-52.png
|
|
Attachment 26: Screenshot_from_2024-06-10_06-01-18.png
|
|
Attachment 27: Screenshot_from_2024-06-10_06-01-43.png
|
|
267
|
Fri Apr 23 15:13:28 2021 |
DSJ | 23 April 16.00-20.00 shift |
16:00 taking over from Muneerah
16:15 - temp, ucesb, database, stats etc. look ok.
16:41 - Nic restarting MBS
17:05 - temp, ucesb, database, stats etc. look ok.
17:43 - temp, ucesb, database, stats etc. look ok.
18.10 - system wide checks. All same as previous checks - eg elog 264 + 266
FEE64 module aida06 global clocks failed, 6
Clock status test result: Passed 11, Failed 1
Understand status as follows
Status bit 3 : firmware PLL that creates clocks from external clock not locked
Status bit 2 : always logic '1'
Status bit 1 : LMK3200(2) PLL and clock distribution chip not locked to external clock
Status bit 0 : LMK3200(1) PLL and clock distribution chip not locked to external clock
If all these bits are not set then the operation of the firmware is unreliable
FEE64 module aida06 failed
FEE64 module aida07 failed
FEE64 module aida12 failed
Calibration test result: Passed 9, Failed 3
If any modules fail calibration , check the clock status and open the FADC Align and Control browser page to rerun calibration for that module
Base Current Difference
aida06 fault 0x679f : 0x67a2 : 3
White Rabbit error counter test result: Passed 11, Failed 1
Understand the status reports as follows:-
Status bit 3 : White Rabbit decoder detected an error in the received data
Status bit 2 : Firmware registered WR error, no reload of Timestamp
Status bit 0 : White Rabbit decoder reports uncertain of Timestamp information from WR
Check FPGA Timestamp Error - HTML errors
Returned 0 0 0 0 0 0 0 0 0 0 0 0
Mem(KB) : 4 8 16 32 64 128 256 512 1k 2k 4k
aida01 : 19 7 4 7 4 3 2 4 2 3 6 : 36388
aida02 : 1 2 5 2 0 4 3 4 3 4 3 : 27044
aida03 : 28 4 4 4 4 4 2 2 3 3 6 : 36432
aida04 : 5 5 2 6 2 3 3 3 3 3 6 : 36892
aida05 : 24 4 7 3 3 3 2 2 3 3 6 : 36240
aida06 : 21 6 6 3 3 4 2 2 3 3 6 : 36356
aida07 : 15 7 4 3 3 4 2 2 3 3 6 : 36308
aida08 : 23 6 7 1 3 4 1 3 3 3 6 : 36572
aida09 : 1 8 2 1 1 2 4 2 3 3 6 : 36292
aida10 : 3 4 6 2 2 2 3 3 2 3 6 : 35660
aida11 : 15 7 4 1 2 3 2 4 2 3 6 : 36052
aida12 : 25 13 5 2 2 3 2 3 3 3 6 : 36700
18:45 - temp, ucesb, database, stats etc. look ok.
19:03 - temp, ucesb, database, stats etc. look ok.
19:26 - temp, ucesb, database, stats etc. look ok.
TapeData (df -h) - 7.2T 3.9T 2.9T 58% /media/1e121361-83d3-4825-b6ae-8700b07e0ca7
19:30 - beam being shared with R3B, implantation rates fluctuation by~ 50% back to normal 19:40
19:50 system checks - all as previous
FEE64 module aida06 global clocks failed, 6
Clock status test result: Passed 11, Failed 1
Understand status as follows
Status bit 3 : firmware PLL that creates clocks from external clock not locked
Status bit 2 : always logic '1'
Status bit 1 : LMK3200(2) PLL and clock distribution chip not locked to external clock
Status bit 0 : LMK3200(1) PLL and clock distribution chip not locked to external clock
If all these bits are not set then the operation of the firmware is unreliable
FEE64 module aida06 failed
FEE64 module aida07 failed
FEE64 module aida12 failed
Calibration test result: Passed 9, Failed 3
If any modules fail calibration , check the clock status and open the FADC Align and Control browser page to rerun calibration for that module
Base Current Difference
aida06 fault 0x679f : 0x67a2 : 3
White Rabbit error counter test result: Passed 11, Failed 1
Understand the status reports as follows:-
Status bit 3 : White Rabbit decoder detected an error in the received data
Status bit 2 : Firmware registered WR error, no reload of Timestamp
Status bit 0 : White Rabbit decoder reports uncertain of Timestamp information from WR
Check FPGA Timestamp Error - HTML errors
Returned 0 0 0 0 0 0 0 0 0 0 0 0
Mem(KB) : 4 8 16 32 64 128 256 512 1k 2k 4k
aida01 : 25 6 4 7 4 3 2 4 2 3 6 : 36404
aida02 : 20 7 5 1 0 4 2 3 2 3 4 : 27384
aida03 : 28 6 3 5 3 5 2 2 3 3 6 : 36528
aida04 : 19 8 4 6 2 4 4 2 3 3 6 : 36876
aida05 : 7 3 8 3 4 3 1 3 3 3 6 : 36500
aida06 : 25 8 4 3 3 4 2 3 3 3 6 : 36868
aida07 : 18 7 3 4 3 4 2 2 3 3 6 : 36336
aida08 : 16 10 6 2 3 3 1 3 3 3 6 : 36464
aida09 : 0 3 1 1 1 3 4 2 3 3 6 : 36360
aida10 : 8 1 10 0 2 2 2 4 2 3 6 : 35912
aida11 : 2 2 2 3 3 4 3 3 2 3 6 : 35928
aida12 : 12 7 4 1 3 3 2 3 3 3 6 : 36616
|
Attachment 1: Screenshot_2021-04-23_Statistics_aidas-gsi(5).png
|
|
Attachment 2: Screenshot_2021-04-23_Temperature_and_status_scan_aidas-gsi(5).png
|
|
Attachment 3: 555.png
|
|
Attachment 4: Screenshot_2021-04-23_Temperature_and_status_scan_aidas-gsi(6).png
|
|
Attachment 5: Screenshot_2021-04-23_Statistics_aidas-gsi(6).png
|
|
Attachment 6: 556.png
|
|
259
|
Wed Apr 21 23:05:39 2021 |
CA | 22nd April 00:00 - 08:00 |
00:07 stats/ucesb/DB checks all ok
00:30 all system wide checks ok *except* fpga errors
Base Current Difference
aida12 fault 0x0 : 0x1f : 31
FPGA Timestamp error counter test result: Passed 11, Failed 1
If any of these counts are reported as in error
The ASIC readout system has detected a timeslip.
That is the timestamp read from the time FIFO is not younger than the last
statistics ok - attachment 1
temperatures ok - attachment 2
detector bias / leakage currents ok - attachment 3
no error messages in DB terminal & ucesb ok - attachment 4
01:00 stats/ucesb/DB checks all ok
01:30 stats/ucesb/DB checks all ok
01:53 issues with beam dropping in and out - ESR working to stabilise this
02:00 stats/ucesb/DB checks all ok
02:09 beam back in a stable state
02:30 all system wide checks ok *except* fpga errors
Base Current Difference
aida12 fault 0x0 : 0x29 : 41
FPGA Timestamp error counter test result: Passed 11, Failed 1
If any of these counts are reported as in error
The ASIC readout system has detected a timeslip.
That is the timestamp read from the time FIFO is not younger than the last
02:33 statistics ok - attachment 5
temperatures ok - attachment 6
detector bias / leakage currents ok - attachment 7
no error messages in DB terminal & ucesb ok - attachment 8
02:45 beam off - potentially serious issue, awaiting update from FRS
03:00 significant issues with UNILAC, beam not expected back for a while
03:05 stats/ucesb/DB checks all ok
03:32 stats/ucesb/DB checks all ok
03:55 beam is back
04:00 stats/ucesb/DB checks all ok
04:30 all system wide checks ok *except* fpga errors
Base Current Difference
aida12 fault 0x0 : 0x2b : 43
FPGA Timestamp error counter test result: Passed 11, Failed 1
If any of these counts are reported as in error
The ASIC readout system has detected a timeslip.
That is the timestamp read from the time FIFO is not younger than the last
04:32 statistics ok - attachment 9
temperatures ok - attachment 10
detector bias / leakage currents ok - attachment 11
no error messages in DB terminal & ucesb ok - attachment 12
05:00 stats/ucesb/DB checks all ok
05:30 stats/ucesb/DB checks all ok
06:00 stats/ucesb/DB checks all ok
06:30 all system wide checks ok *except* fpga errors
Base Current Difference
aida12 fault 0x0 : 0x34 : 52
FPGA Timestamp error counter test result: Passed 11, Failed 1
If any of these counts are reported as in error
The ASIC readout system has detected a timeslip.
That is the timestamp read from the time FIFO is not younger than the last
06:32 temperatures ok - attachment 13
statistics ok - attachment 14
detector bias / leakage currents ok - attachment 15
no error messages in DB terminal & ucesb ok - attachment 16
07:00 stats/ucesb/DB checks all ok
07:30 stats/ucesb/DB checks all ok
07:59 stats/ucesb/DB checks all ok
|
Attachment 1: Screenshot_from_2021-04-21_23-31-22.png
|
|
Attachment 2: Screenshot_from_2021-04-21_23-31-44.png
|
|
Attachment 3: Screenshot_from_2021-04-21_23-32-03.png
|
|
Attachment 4: Screenshot_from_2021-04-21_23-34-46.png
|
|
Attachment 5: Screenshot_from_2021-04-22_01-31-14.png
|
|
Attachment 6: Screenshot_from_2021-04-22_01-31-37.png
|
|
Attachment 7: Screenshot_from_2021-04-22_01-34-03.png
|
|
Attachment 8: Screenshot_from_2021-04-22_01-34-31.png
|
|
Attachment 9: Screenshot_from_2021-04-22_03-32-36.png
|
|
Attachment 10: Screenshot_from_2021-04-22_03-32-57.png
|
|
Attachment 11: Screenshot_from_2021-04-22_03-33-11.png
|
|
Attachment 12: Screenshot_from_2021-04-22_03-33-57.png
|
|
Attachment 13: Screenshot_from_2021-04-22_05-33-01.png
|
|
Attachment 14: Screenshot_from_2021-04-22_05-33-19.png
|
|
Attachment 15: Screenshot_from_2021-04-22_05-33-30.png
|
|
Attachment 16: Screenshot_from_2021-04-22_05-33-43.png
|
|
587
|
Mon Apr 22 11:43:55 2024 |
TD | 21-22.4.24 overnight MIDASsort online sort |
Attachment 1 - per DSSSD LEC e_p versus e_n (20keV/channel)
Attachment 2 - per DSSSD HEC m_p versus m_n
Attachment 3 - per DSSSD HEC x versus y (I really do need to sort out the mapping!)
Attachment 4 - per DSSSD HEC e_p versus e_n (20MeV/channel)
Attachment 5 - per DSSSD per pixel HEC-HEC time (4.096us/channel)
Attachment 6 - per DSSSD implant/decay event rates (262.144us/channel)
showing beam spill cycle
Attachment 7 - colours/contour levels for all 2D spectra |
Attachment 1: Screenshot_from_2024-04-22_07-58-12.png
|
|
Attachment 2: Screenshot_from_2024-04-22_07-59-15.png
|
|
Attachment 3: Screenshot_from_2024-04-22_08-00-37.png
|
|
Attachment 4: Screenshot_from_2024-04-22_08-01-08.png
|
|
Attachment 5: Screenshot_from_2024-04-22_08-02-03.png
|
|
Attachment 6: Screenshot_from_2024-04-22_08-03-25.png
|
|
Attachment 7: Screenshot_from_2024-04-22_12-48-18.png
|
|
250
|
Mon Apr 19 23:01:02 2021 |
OH | 20th April 00:00-08:00 |
23:52 Noticed AIDA07 has dropped out of the merger and is producing no statistics
Powercycling to recover
00:14 All FEEs recovered from powercycle
aida09 running again at HEC threshold of 0x2 (Was set to 0x1 earlier in the day while testing the HEC event disparity in DSSD3)
Now writing to R34
Following the powercycle the rates in the FEEs are much improved and back to where they were before the 08:30 crash on the 19th. - Attachment 1
Waveforms also look improved - attachmens 2 and 3
Current system parameters
ASIC settings Dec19 (All LEC comparator 0xa)
Pulser at 2V and 2Hz
DSSD 1 and 2 Bias 160V
DSSD 3 at 120V (Will lower to 100 again during the beam off period tomorrow)
00:28 In analysis of R34_13 the number of HEC items in DSSD3 appears to make sense again. The number in aida09 are consistent with the number in aida05 and the same for aida11 and aida07.
This appears to confirm that the earlier HEC issues we were observing were hardware related but we are unsure what/why/how these issues were caused.
Analysis - attachment 4
00:40 Issue with one of the FRS magnets so they stop recording data. Leaving AIDA running.
01:08 While beam was down have reset DSSD3 bias to 100V as was agreed with Tom and Nic in email
Leakage current decreased as expected - attachment 5
Once beam is back will check HEC still as expected.
01:14 Last magnet in FRS has an issue with the water flowing. Either sensor issue or water flow is to low.
Hakke have increased the water flow to hopefully keep the water running.
Beam is back.
From ucesb it seems that the HEC events in DSSD3 are still appearing as expected. Will check a file once we have a complete file.
Checked R34_36 and the HEC events in DSSD3 are still consistent - attachment 6
2:20 Statistics ok - attachment 7
Temp - attachment 8
Bias and leakage current ok - attachment 9
All system wide checks ok except for WR error check:
Base Current Difference
aida07 fault 0x9154 : 0x915b : 7
aida10 fault 0x8d3 : 0x8d3 : 0
aida10 : WR status 0x10
White Rabbit error counter test result: Passed 10, Failed 2
Understand the status reports as follows:-
Status bit 3 : White Rabbit decoder detected an error in the received data
Status bit 2 : Firmware registered WR error, no reload of Timestamp
Status bit 0 : White Rabbit decoder reports uncertain of Timestamp information from WR
Note aida07 reports two bad timestamps in the merger
MERGE Data Link (3762): bad timestamp 6 3 0xc1817ea7 0x04a8fc66 0x0000683974a8fc66 0x1677683974a8fc66 0x167768397a546a56
MERGE Data Link (3762): bad timestamp 6 3 0xc1b77e25 0x04a8fc66 0x0000683974a8fc66 0x1677683974a8fc66 0x167768397a546a56
02:25 Remembered during a pre-experiment meeting with Vic, Patrick and Carl they mentioned the merger would track timestamp sequence errors
Can confirm this is true. Can see the two in aida07 in the counter in the merger stats page - attachment 10
02:45 Now up to 7 timestamp errors on aida07 in the merger
02:49 Ran R34_45 through AIDASort - It reports a greater number of implant events are able to have a front back match performed
Ratio between aida07 and 09 is 0.71 -> Double what it was before
Energy response of the HEC channels in aida07 and aida09 looks equivalent (left group aida09 right group aida11) - attahchment 11
04:40 Statistics ok - attachment 12
Temperatures ok - attachment 13
Bias and leakage currents - attachment 14
Clock status, ADC calibration and memory infomration all ok
aida07 fails both WR and FPGA
Base Current Difference
aida07 fault 0x915b : 0x9161 : 6
aida10 fault 0x8d3 : 0x8d3 : 0
aida10 : WR status 0x10
White Rabbit error counter test result: Passed 10, Failed 2
Understand the status reports as follows:-
Status bit 3 : White Rabbit decoder detected an error in the received data
Status bit 2 : Firmware registered WR error, no reload of Timestamp
Status bit 0 : White Rabbit decoder reports uncertain of Timestamp information from WR
Base Current Difference
aida07 fault 0x0 : 0x1 : 1
FPGA Timestamp error counter test result: Passed 11, Failed 1
If any of these counts are reported as in error
The ASIC readout system has detected a timeslip.
That is the timestamp read from the time FIFO is not younger than the last
TS errors in the merger still only at 7 with all in aida07
06:25 Statistics - attachment 15
Temps ok - attachment 16
Bias and leakage currents ok - attachment 17
System wide checks: clock status, adc calibration and memory information all ok
WR multiple fails
Base Current Difference
aida05 fault 0xc9ca : 0xc9cb : 1
aida06 fault 0xe900 : 0xe901 : 1
aida07 fault 0x915b : 0x9166 : 11
aida08 fault 0x641e : 0x641f : 1
aida10 fault 0x8d3 : 0x8d3 : 0
aida10 : WR status 0x10
White Rabbit error counter test result: Passed 7, Failed 5
Understand the status reports as follows:-
Status bit 3 : White Rabbit decoder detected an error in the received data
Status bit 2 : Firmware registered WR error, no reload of Timestamp
Status bit 0 : White Rabbit decoder reports uncertain of Timestamp information from WR
FPGA aida07 fails with difference of 1
No new TS sequence errors in merger
07:10 Beam has dropped out.
07:14 Beam is back |
Attachment 1: 210420_0016_Stats.png
|
|
Attachment 2: 210420_0021_Layout7.png
|
|
Attachment 3: 210420_0022_Layout8.png
|
|
Attachment 4: 210420_0026_R34_13_Analysis.txt
|
*** TDR format 3.3.0 analyser - TD - January 2019
*** ERROR: READ I/O error: 5002
blocks: 32000
ADC data format: 255975543 ( 1356743.5 Hz)
Other data format: 5944457 ( 31507.3 Hz)
Sample trace data format: 0 ( 0.0 Hz)
Undefined format: 0 ( 0.0 Hz)
Other data format type: PAUSE: 0 ( 0.0 Hz)
RESUME: 0 ( 0.0 Hz)
SYNC100: 32703 ( 173.3 Hz)
WR48-63: 32703 ( 173.3 Hz)
FEE64 disc: 1073243 ( 5688.5 Hz)
MBS info: 4805808 ( 25472.2 Hz)
Other info: 0 ( 0.0 Hz)
ADC data range bit set: 345437 ( 1830.9 Hz)
Timewarps: ADC: 0 ( 0.0 Hz)
PAUSE: 0 ( 0.0 Hz)
RESUME: 0 ( 0.0 Hz)
SYNC100: 0 ( 0.0 Hz)
WR48-63: 0 ( 0.0 Hz)
FEE64 disc: 0 ( 0.0 Hz)
MBS info: 0 ( 0.0 Hz)
Undefined: 0 ( 0.0 Hz)
Sample trace: 0 ( 0.0 Hz)
*** Timestamp elapsed time: 188.669 s
FEE elapsed dead time(s) elapsed idle time(s)
1 0.000 46.534
2 0.000 63.789
3 0.000 54.847
4 0.000 174.519
5 0.000 123.945
6 0.000 113.898
7 0.000 135.923
8 0.000 59.774
9 0.000 27.296
10 0.000 12.263
11 0.000 65.598
12 0.000 0.000
13 0.000 0.000
14 0.000 0.000
15 0.000 0.000
16 0.000 0.000
17 0.000 0.000
18 0.000 0.000
19 0.000 0.000
20 0.000 0.000
21 0.000 0.000
22 0.000 0.000
23 0.000 0.000
24 0.000 0.000
25 0.000 0.000
26 0.000 0.000
27 0.000 0.000
28 0.000 0.000
29 0.000 0.000
30 0.000 0.000
31 0.000 0.000
32 0.000 0.000
*** Statistics
FEE ADC Data Other Data Sample Undefined Pause Resume SYNC100 WR48-63 Disc MBS Other HEC Data
0 14400003 100475 0 0 0 0 1767 1767 95813 1128 0 35602
1 23251868 63483 0 0 0 0 2988 2988 57507 0 0 21204
2 17192461 2025458 0 0 0 0 2415 2415 200396 1820232 0 34093
3 20019932 1908259 0 0 0 0 2815 2815 81941 1820688 0 32715
4 3059738 405674 0 0 0 0 403 403 100680 304188 0 35774
5 10595698 355900 0 0 0 0 1322 1322 58122 295134 0 21319
6 12037952 388178 0 0 0 0 1554 1554 105230 279840 0 34521
7 9390918 368608 0 0 0 0 1205 1205 81600 284598 0 31165
8 46854628 72459 0 0 0 0 5872 5872 60715 0 0 21758
9 43874737 60599 0 0 0 0 5426 5426 49747 0 0 17382
10 36184433 112868 0 0 0 0 4528 4528 103812 0 0 31745
11 19113175 82496 0 0 0 0 2408 2408 77680 0 0 28159
12 0 0 0 0 0 0 0 0 0 0 0 0
13 0 0 0 0 0 0 0 0 0 0 0 0
14 0 0 0 0 0 0 0 0 0 0 0 0
15 0 0 0 0 0 0 0 0 0 0 0 0
16 0 0 0 0 0 0 0 0 0 0 0 0
17 0 0 0 0 0 0 0 0 0 0 0 0
18 0 0 0 0 0 0 0 0 0 0 0 0
19 0 0 0 0 0 0 0 0 0 0 0 0
20 0 0 0 0 0 0 0 0 0 0 0 0
21 0 0 0 0 0 0 0 0 0 0 0 0
22 0 0 0 0 0 0 0 0 0 0 0 0
23 0 0 0 0 0 0 0 0 0 0 0 0
24 0 0 0 0 0 0 0 0 0 0 0 0
25 0 0 0 0 0 0 0 0 0 0 0 0
26 0 0 0 0 0 0 0 0 0 0 0 0
27 0 0 0 0 0 0 0 0 0 0 0 0
28 0 0 0 0 0 0 0 0 0 0 0 0
29 0 0 0 0 0 0 0 0 0 0 0 0
30 0 0 0 0 0 0 0 0 0 0 0 0
31 0 0 0 0 0 0 0 0 0 0 0 0
32 0 0 0 0 0 0 0 0 0 0 0 0
*** Timewarps
FEE ADC Pause Resume SYNC100 WR48-63 Disc MBS Undefined Samples
0 0 0 0 0 0 0 0 0 0
1 0 0 0 0 0 0 0 0 0
2 0 0 0 0 0 0 0 0 0
3 0 0 0 0 0 0 0 0 0
4 0 0 0 0 0 0 0 0 0
5 0 0 0 0 0 0 0 0 0
6 0 0 0 0 0 0 0 0 0
7 0 0 0 0 0 0 0 0 0
8 0 0 0 0 0 0 0 0 0
9 0 0 0 0 0 0 0 0 0
10 0 0 0 0 0 0 0 0 0
11 0 0 0 0 0 0 0 0 0
12 0 0 0 0 0 0 0 0 0
13 0 0 0 0 0 0 0 0 0
14 0 0 0 0 0 0 0 0 0
15 0 0 0 0 0 0 0 0 0
16 0 0 0 0 0 0 0 0 0
17 0 0 0 0 0 0 0 0 0
18 0 0 0 0 0 0 0 0 0
19 0 0 0 0 0 0 0 0 0
20 0 0 0 0 0 0 0 0 0
21 0 0 0 0 0 0 0 0 0
22 0 0 0 0 0 0 0 0 0
23 0 0 0 0 0 0 0 0 0
24 0 0 0 0 0 0 0 0 0
25 0 0 0 0 0 0 0 0 0
26 0 0 0 0 0 0 0 0 0
27 0 0 0 0 0 0 0 0 0
28 0 0 0 0 0 0 0 0 0
29 0 0 0 0 0 0 0 0 0
30 0 0 0 0 0 0 0 0 0
31 0 0 0 0 0 0 0 0 0
32 0 0 0 0 0 0 0 0 0
*** Program elapsed time: 1641.051s ( 19.500 blocks/s, 1.219 Mb/s)
|
Attachment 5: 210420_0109_Bias.png
|
|
Attachment 6: 210420_0026_R34_36_Analysis.txt
|
*** TDR format 3.3.0 analyser - TD - January 2019
*** ERROR: READ I/O error: 5002
blocks: 32000
ADC data format: 255999603 ( 1309621.8 Hz)
Other data format: 5920397 ( 30287.1 Hz)
Sample trace data format: 0 ( 0.0 Hz)
Undefined format: 0 ( 0.0 Hz)
Other data format type: PAUSE: 0 ( 0.0 Hz)
RESUME: 0 ( 0.0 Hz)
SYNC100: 32728 ( 167.4 Hz)
WR48-63: 32728 ( 167.4 Hz)
FEE64 disc: 1044504 ( 5343.4 Hz)
MBS info: 4810437 ( 24608.8 Hz)
Other info: 0 ( 0.0 Hz)
ADC data range bit set: 327887 ( 1677.4 Hz)
Timewarps: ADC: 0 ( 0.0 Hz)
PAUSE: 0 ( 0.0 Hz)
RESUME: 0 ( 0.0 Hz)
SYNC100: 0 ( 0.0 Hz)
WR48-63: 0 ( 0.0 Hz)
FEE64 disc: 0 ( 0.0 Hz)
MBS info: 0 ( 0.0 Hz)
Undefined: 0 ( 0.0 Hz)
Sample trace: 0 ( 0.0 Hz)
*** Timestamp elapsed time: 195.476 s
FEE elapsed dead time(s) elapsed idle time(s)
1 0.000 51.325
2 0.000 68.599
3 0.000 55.115
4 0.000 180.174
5 0.000 140.295
6 0.000 123.427
7 0.000 138.446
8 0.000 55.510
9 0.000 13.463
10 0.000 24.357
11 0.000 74.336
12 0.000 0.000
13 0.000 0.000
14 0.000 0.000
15 0.000 0.000
16 0.000 0.000
17 0.000 0.000
18 0.000 0.000
19 0.000 0.000
20 0.000 0.000
21 0.000 0.000
22 0.000 0.000
23 0.000 0.000
24 0.000 0.000
25 0.000 0.000
26 0.000 0.000
27 0.000 0.000
28 0.000 0.000
29 0.000 0.000
30 0.000 0.000
31 0.000 0.000
32 0.000 0.000
*** Statistics
FEE ADC Data Other Data Sample Undefined Pause Resume SYNC100 WR48-63 Disc MBS Other HEC Data
0 14611253 94841 0 0 0 0 1936 1936 89802 1167 0 33511
1 23423897 61346 0 0 0 0 3006 3006 55334 0 0 20222
2 17311487 2050104 0 0 0 0 2477 2477 195362 1849788 0 32021
3 20533060 1944396 0 0 0 0 2862 2862 77493 1861179 0 30741
4 2942569 381933 0 0 0 0 417 417 93930 287169 0 33667
5 9776355 338395 0 0 0 0 1239 1239 56110 279807 0 20096
6 11887130 369619 0 0 0 0 1555 1555 103862 262647 0 32503
7 9239609 348065 0 0 0 0 1200 1200 76985 268680 0 29470
8 49507336 72711 0 0 0 0 6129 6129 60453 0 0 21190
9 44170393 65100 0 0 0 0 5430 5430 54240 0 0 18016
10 32977762 112783 0 0 0 0 4022 4022 104739 0 0 30280
11 19618752 81104 0 0 0 0 2455 2455 76194 0 0 26170
12 0 0 0 0 0 0 0 0 0 0 0 0
13 0 0 0 0 0 0 0 0 0 0 0 0
14 0 0 0 0 0 0 0 0 0 0 0 0
15 0 0 0 0 0 0 0 0 0 0 0 0
16 0 0 0 0 0 0 0 0 0 0 0 0
17 0 0 0 0 0 0 0 0 0 0 0 0
18 0 0 0 0 0 0 0 0 0 0 0 0
19 0 0 0 0 0 0 0 0 0 0 0 0
20 0 0 0 0 0 0 0 0 0 0 0 0
21 0 0 0 0 0 0 0 0 0 0 0 0
22 0 0 0 0 0 0 0 0 0 0 0 0
23 0 0 0 0 0 0 0 0 0 0 0 0
24 0 0 0 0 0 0 0 0 0 0 0 0
25 0 0 0 0 0 0 0 0 0 0 0 0
26 0 0 0 0 0 0 0 0 0 0 0 0
27 0 0 0 0 0 0 0 0 0 0 0 0
28 0 0 0 0 0 0 0 0 0 0 0 0
29 0 0 0 0 0 0 0 0 0 0 0 0
30 0 0 0 0 0 0 0 0 0 0 0 0
31 0 0 0 0 0 0 0 0 0 0 0 0
32 0 0 0 0 0 0 0 0 0 0 0 0
*** Timewarps
FEE ADC Pause Resume SYNC100 WR48-63 Disc MBS Undefined Samples
0 0 0 0 0 0 0 0 0 0
1 0 0 0 0 0 0 0 0 0
2 0 0 0 0 0 0 0 0 0
3 0 0 0 0 0 0 0 0 0
4 0 0 0 0 0 0 0 0 0
5 0 0 0 0 0 0 0 0 0
6 0 0 0 0 0 0 0 0 0
7 0 0 0 0 0 0 0 0 0
8 0 0 0 0 0 0 0 0 0
9 0 0 0 0 0 0 0 0 0
10 0 0 0 0 0 0 0 0 0
11 0 0 0 0 0 0 0 0 0
12 0 0 0 0 0 0 0 0 0
13 0 0 0 0 0 0 0 0 0
14 0 0 0 0 0 0 0 0 0
15 0 0 0 0 0 0 0 0 0
16 0 0 0 0 0 0 0 0 0
17 0 0 0 0 0 0 0 0 0
18 0 0 0 0 0 0 0 0 0
19 0 0 0 0 0 0 0 0 0
20 0 0 0 0 0 0 0 0 0
21 0 0 0 0 0 0 0 0 0
22 0 0 0 0 0 0 0 0 0
23 0 0 0 0 0 0 0 0 0
24 0 0 0 0 0 0 0 0 0
25 0 0 0 0 0 0 0 0 0
26 0 0 0 0 0 0 0 0 0
27 0 0 0 0 0 0 0 0 0
28 0 0 0 0 0 0 0 0 0
29 0 0 0 0 0 0 0 0 0
30 0 0 0 0 0 0 0 0 0
31 0 0 0 0 0 0 0 0 0
32 0 0 0 0 0 0 0 0 0
*** Program elapsed time: 5995.524s ( 5.337 blocks/s, 0.334 Mb/s)
|
Attachment 7: 210420_0220_Stats.png
|
|
Attachment 8: 210420_0229_Temp.png
|
|
Attachment 9: 210420_0220_Bias.png
|
|
Attachment 10: 210420_0225_MergerStats.png
|
|
Attachment 11: Capture.PNG
|
|
Attachment 12: 210420_0437_stats.png
|
|
Attachment 13: 210420_0538_Temp.png
|
|
Attachment 14: 210420_0439_Bias.png
|
|
Attachment 15: 210420_0624_stats.png
|
|
Attachment 16: 210420_0624_Temp.png
|
|
Attachment 17: 210420_0625_Bias.png
|
|
599
|
Tue Apr 23 19:23:42 2024 |
PP | 20:30 checks |
All looks good.
Screenshots attached. |
Attachment 1: Screenshot_from_2024-04-23_20-24-09.png
|
|
Attachment 2: Screenshot_from_2024-04-23_20-24-25.png
|
|
Attachment 3: Screenshot_from_2024-04-23_20-24-52.png
|
|
Attachment 4: Screenshot_from_2024-04-23_20-25-35.png
|
|
Attachment 5: Screenshot_from_2024-04-23_20-26-16.png
|
|
Attachment 6: Screenshot_from_2024-04-23_20-27-01.png
|
|
Attachment 7: Screenshot_from_2024-04-23_20-27-26.png
|
|
Attachment 8: Screenshot_from_2024-04-23_20-27-53.png
|
|
99
|
Wed Nov 20 20:36:14 2019 |
CA, CB, DK, NH | 20/21 November Night Shift |
21:35 (NH) - A few merger timestamp errors were appearing - Decided to powercycle all FEE64s, all checks OK.
No Screenshot due to forgetting before I closed merger
FEEs were often not stopping properly and needing merger reset as well.
Beam Plan:
40Ar 300 MeV/u Primary Beam
and/or
34Si Fragment from Ar
22:45
FEES were restart near these timestamps in the TapeData, evidently
-rw-rw-r--. 1 npg npg 2.0G Nov 20 21:17 R1_361
-rw-rw-r--. 1 npg npg 2.0G Nov 20 21:36 R1_362
Run number was kept the same (Tape Server was not stopped @ FEE restart?)
All system wide checks are okay (except of course the master clock fails)
Temps look okay (attachment 1, dated 21/Nov by mistake)
Leak currents all around 0.9 uA as before (attachment 2)
Stats are behaved. We don't have beam yet (attachment 3)
Merger and tape server happy (see attachment 4)
Data rate histos while beam is still off (see attachment 5)
==Nov 21==
0:00
TD noted that the data rates have gone up at some point (about double).
Now we increased the slow comparator thresholds from 0xa to 0xb (data rate drops from 24 Mb/s to 16 Mb/s).
We increased it again from 0xb to 0xc, but near that time the beam was also turned on, and the data rate was about 25 Mb/s.
Beam was turned on near R1_472 or a bit earlier.
TD requested waveforms, but at the moment they are not appearing. Will enable WFs after a condition change.
Beam seen in all three DSSSDs, see attachment 6. Beam was turned off before I could get more screencaps.
Degrader change ... near R1_481
00:32 waveforms now enabled under Run Control. They also appear to be enabled on ASIC1 undre LED and Waveform controls. However, we are unable to see the waveforms in the relevant histograms.
00:44 3 g/cm^2 inserted R1_488
00:45 3.2 g/cm^2 degrader in R1_489.
1:00 Several degraders and combinations are being tested since last note.
1:10 It seems 1 g/cm^2 of energy loss is not accounted for by LISE++. Trying to understand the reason.
1:28 Satisfied with a total degrader thickness of 2.6 g/cm^2 -- seems to calculate that fragments should implant mainly in DSSSD2? Issue seems to be resolved updating the LISE++ file.
Near R1_507
Can see the implant samples attached as #7 and #8
1:43 According to the stats, most of the beam energy is being deposited in DSSSD1. See #9.
Present beam burst repetition is around 0.1 Hz (each ~10 sec)
2:00 better example of stats histos (see #10)
2:45 tuning the FRS degraders (ones for RIB separation rather than AIDA implantation depth).
3:17 Just started fragments. Disregard previous filenames with "34Si". Finally no degrader in the FRS was needed to get Z separation.
R1_559
As the DAQs are not synchronized, a quick call to the BNC PB-5 pulser shifiting from 2 -> 50 -> 2 Hz was used to make a signal burst.
S4 degrader is 5.2 g/cm^2
3:22 Updated biases in Google Sheets.
Having trouble seeing the fragments in the AIDA histograms. Since we just started fragments, zero the histos.
3:35 Attachment 11, with 34Si fragments as Stats. Difficult to click Update on the Rates at the right time.
From the beam monitors, fragments should be at around 3000 cps.
3:45 (Up to now, some optics tuning with slits, etc)
3:46 Optics settings accepted, AIDA at R1_572, accept this condition for data runs on ~34Si fragments.
3:47 Sent a pulser burst 2 -> 50 -> 2 Hz
3:50 zero histograms again.
Temperatures attachment 12
Biases attachment 13
Statistics attachment 14
Merger / Tape Server attachment 15
3:56
StatHistos attachment 16
4:09 FRS starts new run #56, AIDA R1_583. Pulser 2-> 50 -> 2 Hz
4:56 Stat histograms in attachment 17. Not zeroed since noted at 3:50 |
Attachment 1: 21-11-temps.png
|
|
Attachment 2: 20-11-biases.png
|
|
Attachment 3: 20-11-stats.png
|
|
Attachment 4: 20-11-merger-ts.png
|
|
Attachment 5: 20-11-statshistos.png
|
|
Attachment 6: 21-11-layout5histos.png
|
|
Attachment 7: 34si-implants-130-1.png
|
|
Attachment 8: 34si-implants-130-2.png
|
|
Attachment 9: 34si-stats-histos.png
|
|
Attachment 10: stats-histos-2am.png
|
|
Attachment 11: 34si-fragments-stats.png
|
|
Attachment 12: temperatures-fragments.png
|
|
Attachment 13: biases-fragments.png
|
|
Attachment 14: stats-fragments.png
|
|
Attachment 15: merger-tapeserver-fragments.png
|
|
Attachment 16: stathistos-fragments.png
|
|
Attachment 17: stathistos-5am.png
|
|
603
|
Wed Apr 24 18:44:05 2024 |
PP | 19:30 checks |
All seems smooth.
Screenshots attached. |
Attachment 1: Screenshot_from_2024-04-24_19-34-58.png
|
|
Attachment 2: Screenshot_from_2024-04-24_19-37-12.png
|
|
Attachment 3: Screenshot_from_2024-04-24_19-40-36.png
|
|
Attachment 4: Screenshot_from_2024-04-24_19-41-39.png
|
|
Attachment 5: Screenshot_from_2024-04-24_19-42-20.png
|
|
Attachment 6: Screenshot_from_2024-04-24_19-42-53.png
|
|
Attachment 7: Screenshot_from_2024-04-24_19-43-21.png
|
|
Attachment 8: Screenshot_from_2024-04-24_19-43-41.png
|
|
98
|
Tue Nov 19 21:22:06 2019 |
CA, CB, DK, NH | 19/20 November 2019 - overnight shift |
19 November
Waiting for 40Ar beam to be delivered for tests.
Objective today is to assess degrader thickness suitable to stop 40Ar in 2nd DSSD layer.
Energy expected at 300 MeV/A, around 1E3-4 beam intensity - to be determined.
Tomorrow fragments could be expected.
DSSD / FEE64 pairing as follows
DSSD3 (most downstream): FEEs 9,10,11,12
DSSD2 (middle): FEEs 5,6,7,8
DSSD1 (most upstream): FEEs 1,2,3,4
+plastic scintillator furthest upstream
New AIDA Google spreadsheet created with leakage current, to monitor them during beamtime. First entry added. Bias attached.
https://docs.google.com/spreadsheets/d/12hgbrywB10hGsKt5uc2HnLfZymh8_uvM6cEASbbqnBE/edit#gid=813167023
DESPEC platform has already been moved. No effect on rates - see attached. FEE1 is missing one channel. FEE9, 10 noisy as expected. See attached.
System wide checks *all OK* except
Master clock failed (normal)
ADC calibration fails on 6 and 12. Recalibrated via FADC Align. All OK now.
MBS transfer OK. See attached.
Good event statistics OK. See attached.
FEE64 temperatures OK. See attached.
Merger and data rate OK. See attached.
Waiting for beam.
20 November
01:07 - Still no beam.
System wide checks OK.
Stats OK.
Temps OK.
MBS OK.
Merger and data rate OK.
02:35 - Beam is expected soon
Tried enabling writing data to disk. Merger crashed. FEE64 stopped responding to commands.
Reset Merger. FEE64 now respond to commands.
Tried enabling writing to disk again. Merger crashed once more. Reset merger.
Reset Tape Server interface. Now writing to disk.
No data currently being sent to MBS, but operators say they "are adding a new detector". May be normal.
DAQ & Merger going OK. Writing to Nov19/R1
No beam yet.
Temperatures OK
System wide checks OK
Stats OK. See attached.
MBS not working.
Merger and data rate OK. See attached.
~02:48 Beam on. 40Ar. 300 MeV/A, 500 pps. Degrader settings unclear.
03:54 Degrader settings have been changing between 4.5, 1 and 6 ug/cm2
Currently on 6 g/cm2.
AIDA seen through MBS shows no HE on detector 3, and Det 1 and 2 show no counts on positive y (FEE6 and 1). That is not the case from MIDAS.
04:30 The aim of the tests above was to have no 40Ar at all in DSSD3. It does not appear that 6 g/cm2 is sufficient, as we still see events. The reduction between 1 & 2 vs. 3 is about a factor of 2-10 depending on ADC channel. See attached.
~04:30 Moved to 6.2 g/cm2 degrader. See attached.
~04:45 Moved to 5.8 g/cm2. See attached.
~05:09 Moved to 6.4 g/cm2. See attached.
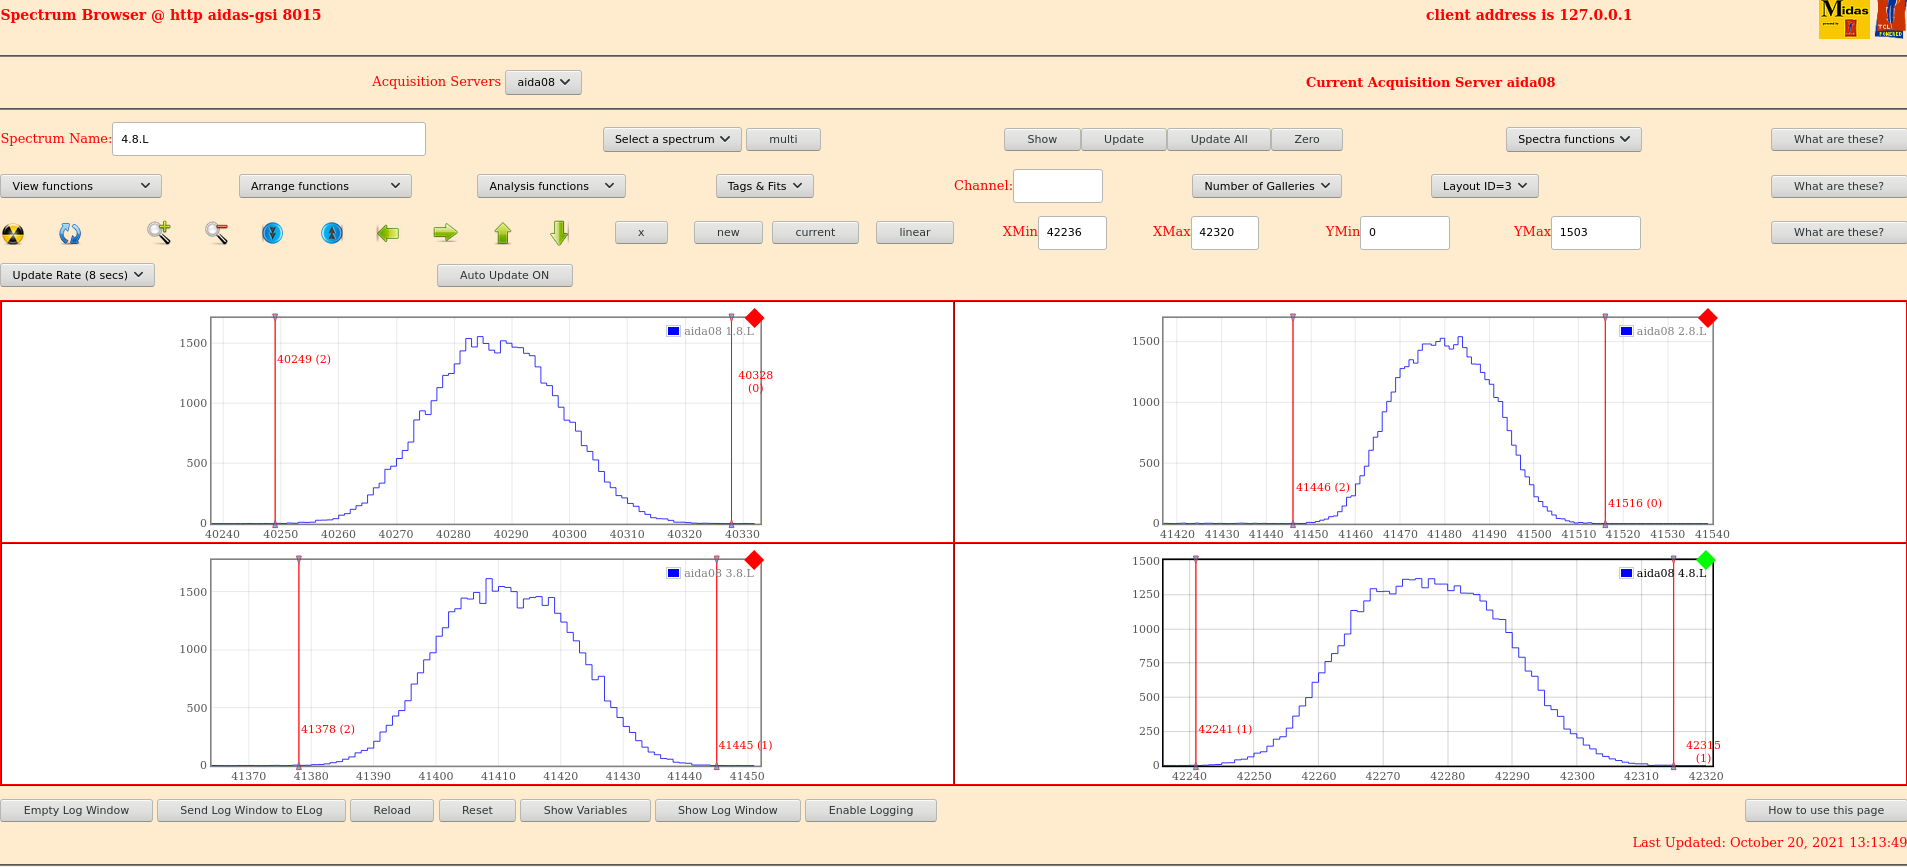
05:31 High energy channel spectra (1.8.H) for all FEE64 w/ 6.4 g/cm2 degrader - See attachments 13 & 14
05:38: Moved to 1.0 g/cm2. See attached. Difference is not huge which may indicate these spectra are misleading, as partly expected. A more detailed analysis will be carried out off line.
06:00: Beam stopped. ~R77. AIDA keeps running background over the day. Beam should restart around 11 pm later today. |
Attachment 1: Bias2235.png
|
|
Attachment 2: Rates2236.png
|
|
Attachment 3: 19112241MBS.png
|
|
Attachment 4: 19112242Stats.png
|
|
Attachment 5: 19112244Temperatures.png
|
|
Attachment 6: 19112246Merger.png
|
|
Attachment 7: 20110239.png
|
|
Attachment 8: 20110240DataTransfer.png
|
|
Attachment 9: 6gdegrader.png
|
|
Attachment 10: 6.2degrader.png
|
|
Attachment 11: 5.8degrader.png
|
|
Attachment 12: 6.4degrader.png
|
|
Attachment 13: 18h_0530.png
|
|
Attachment 14: 18H_0528.png
|
|
Attachment 15: 1gcm2degrader.png
|
|
330
|
Wed May 19 09:12:52 2021 |
Muneerah, Betool, LS | 17th May 00:00-12:00 |
Auther: Muneerah and Betool
02:00 The dead time have been checked every 30 min from the start of the shift, it seemes Ok
Statistics ok - 210517_0202_Stats
Temperatures ok - 210517_0202_Temp
Bias and leakage ok - 210517_0200_Bias
02:05 System wide checks:
Clock status test result: Passed 16, Failed 0
Understand status as follows
Status bit 3 : firmware PLL that creates clocks from external clock not locked
Status bit 2 : always logic '1'
Status bit 1 : LMK3200(2) PLL and clock distribution chip not locked to external clock
Status bit 0 : LMK3200(1) PLL and clock distribution chip not locked to external clock
If all these bits are not set then the operation of the firmware is unreliable
FEE64 module aida02 failed
FEE64 module aida03 failed
FEE64 module aida06 failed
FEE64 module aida10 failed
Calibration test result: Passed 12, Failed 4
If any modules fail calibration , check the clock status and open the FADC Align and Control browser page to rerun calibration for that module
Base Current Difference
aida05 fault 0x1552 : 0x155d : 11
White Rabbit error counter test result: Passed 15, Failed 1
Understand the status reports as follows:-
Status bit 3 : White Rabbit decoder detected an error in the received data
Status bit 2 : Firmware registered WR error, no reload of Timestamp
Status bit 0 : White Rabbit decoder reports uncertain of Timestamp information from WR
Base Current Difference
aida05 fault 0x0 : 0x2 : 2
FPGA Timestamp error counter test result: Passed 15, Failed 1
If any of these counts are reported as in error
The ASIC readout system has detected a timeslip.
That is the timestamp read from the time FIFO is not younger than the last
Returned 0 0 0 0 0 0 0 0 0 0 0 0 0 0 0 0
Mem(KB) : 4 8 16 32 64 128 256 512 1k 2k 4k
aida01 : 5 8 3 3 3 5 2 2 2 3 7 : 39460
aida02 : 22 4 5 0 3 2 2 3 2 3 7 : 39560
aida03 : 21 10 2 1 1 3 2 4 2 3 7 : 40100
aida04 : 18 7 2 0 3 3 3 2 2 3 7 : 39392
aida05 : 16 6 5 1 2 4 3 2 2 3 7 : 39520
aida06 : 18 6 6 2 2 2 2 3 2 3 7 : 39576
aida07 : 12 8 6 1 2 3 1 3 2 3 7 : 39408
aida08 : 13 11 4 0 1 3 3 2 2 3 7 : 39308
aida09 : 10 8 4 2 3 4 2 3 2 3 7 : 39848
aida10 : 16 8 2 1 2 4 2 3 1 4 7 : 40768
aida11 : 26 10 2 2 1 2 2 3 2 3 7 : 39512
aida12 : 16 9 2 1 2 4 2 2 2 3 7 : 39240
aida13 : 15 9 3 2 2 4 2 2 2 3 7 : 39284
aida14 : 25 10 2 3 3 3 2 3 2 3 7 : 39796
aida15 : 4 2 2 1 1 3 2 2 2 3 7 : 38944
aida16 : 16 7 3 3 1 3 3 2 2 3 7 : 39368
04:00 Statistics ok - 210517_0403_Stats
Temperatures ok - 210517_0403_Temp
Bias and leakage ok - 210517_0400_Bias
04:05 System wide checks:
Clock status test result: Passed 16, Failed 0
Understand status as follows
Status bit 3 : firmware PLL that creates clocks from external clock not locked
Status bit 2 : always logic '1'
Status bit 1 : LMK3200(2) PLL and clock distribution chip not locked to external clock
Status bit 0 : LMK3200(1) PLL and clock distribution chip not locked to external clock
If all these bits are not set then the operation of the firmware is unreliable
FEE64 module aida02 failed
FEE64 module aida03 failed
FEE64 module aida06 failed
FEE64 module aida10 failed
Calibration test result: Passed 12, Failed 4
If any modules fail calibration , check the clock status and open the FADC Align and Control browser page to rerun calibration for that module
Base Current Difference
aida05 fault 0x1552 : 0x1560 : 14
White Rabbit error counter test result: Passed 15, Failed 1
Understand the status reports as follows:-
Status bit 3 : White Rabbit decoder detected an error in the received data
Status bit 2 : Firmware registered WR error, no reload of Timestamp
Status bit 0 : White Rabbit decoder reports uncertain of Timestamp information from WR
Base Current Difference
aida05 fault 0x0 : 0x2 : 2
FPGA Timestamp error counter test result: Passed 15, Failed 1
If any of these counts are reported as in error
The ASIC readout system has detected a timeslip.
That is the timestamp read from the time FIFO is not younger than the last
Returned 0 0 0 0 0 0 0 0 0 0 0 0 0 0 0 0
Mem(KB) : 4 8 16 32 64 128 256 512 1k 2k 4k
aida01 : 15 7 5 2 3 5 2 2 2 3 7 : 39492
aida02 : 23 6 7 2 1 3 2 3 2 3 7 : 39676
aida03 : 17 9 3 2 0 3 2 3 2 3 7 : 39548
aida04 : 16 4 1 2 1 3 3 3 2 3 7 : 39792
aida05 : 22 7 3 3 1 4 3 3 2 3 7 : 40032
aida06 : 18 6 7 3 1 3 2 3 2 3 7 : 39688
aida07 : 18 7 4 1 2 4 1 4 2 3 7 : 40032
aida08 : 19 5 4 1 1 3 3 3 2 3 7 : 39828
aida09 : 10 6 7 1 3 4 2 2 2 3 7 : 39336
aida10 : 12 10 2 3 1 4 2 3 1 4 7 : 40768
aida11 : 10 9 4 3 2 1 2 3 2 3 7 : 39440
aida12 : 8 7 6 1 2 4 2 3 2 3 7 : 39768
aida13 : 11 2 6 1 2 3 2 3 2 3 7 : 39612
aida14 : 27 7 4 2 3 3 2 3 2 3 7 : 39780
aida15 : 4 2 3 1 1 3 2 2 2 3 7 : 38960
aida16 : 18 8 4 2 1 4 2 2 2 3 7 : 39240
06:27 aida07 has dropped out and lost connection with the merger. Powercycling AIDA
06:48 Restarted system but the noise was extremely high. Equivalent to yesterday 15:00. Restarting again.
07:01 it is working fine.
07:40 Screen shots after the restart
Statistics ok - 210517_0742_Stats
Temperatures ok - 210517_0743_Temp
Bias and leakage ok - 210517_0740_Bias
System wide checks
FEE64 module aida06 global clocks failed, 6
Clock status test result: Passed 15, Failed 1
Understand status as follows
Status bit 3 : firmware PLL that creates clocks from external clock not locked
Status bit 2 : always logic '1'
Status bit 1 : LMK3200(2) PLL and clock distribution chip not locked to external clock
Status bit 0 : LMK3200(1) PLL and clock distribution chip not locked to external clock
If all these bits are not set then the operation of the firmware is unreliable
FEE64 module aida01 failed
FEE64 module aida02 failed
FEE64 module aida03 failed
FEE64 module aida04 failed
FEE64 module aida05 failed
FEE64 module aida06 failed
FEE64 module aida07 failed
FEE64 module aida08 failed
FEE64 module aida09 failed
FEE64 module aida10 failed
FEE64 module aida11 failed
FEE64 module aida12 failed
FEE64 module aida13 failed
FEE64 module aida14 failed
FEE64 module aida15 failed
FEE64 module aida16 failed
Calibration test result: Passed 0, Failed 16
If any modules fail calibration , check the clock status and open the FADC Align and Control browser page to rerun calibration for that module
Base Current Difference
aida05 fault 0x61da : 0x61dd : 3
White Rabbit error counter test result: Passed 15, Failed 1
Understand the status reports as follows:-
Status bit 3 : White Rabbit decoder detected an error in the received data
Status bit 2 : Firmware registered WR error, no reload of Timestamp
Status bit 0 : White Rabbit decoder reports uncertain of Timestamp information from WR
FPGA Timestamp error counter test result: Passed 16, Failed 0
If any of these counts are reported as in error
The ASIC readout system has detected a timeslip.
That is the timestamp read from the time FIFO is not younger than the last
Returned 0 0 0 0 0 0 0 0 0 0 0 0 0 0 0 0
Mem(KB) : 4 8 16 32 64 128 256 512 1k 2k 4k
aida01 : 20 6 3 1 1 3 1 3 3 3 7 : 40336
aida02 : 11 6 0 1 1 5 2 4 2 3 7 : 40252
aida03 : 0 5 2 3 3 3 3 4 2 3 7 : 40424
aida04 : 2 4 2 1 2 4 3 3 2 3 7 : 39912
aida05 : 11 7 5 1 2 2 4 2 3 3 7 : 40532
aida06 : 20 6 0 2 3 2 1 3 3 3 7 : 40320
aida07 : 15 5 1 2 2 3 2 2 3 3 7 : 40116
aida08 : 2 3 4 1 3 3 2 2 3 3 7 : 40128
aida09 : 18 5 1 3 2 4 2 2 3 3 7 : 40288
aida10 : 11 6 3 4 2 3 3 2 2 4 7 : 41484
aida11 : 4 4 5 2 2 2 3 3 2 3 7 : 39744
aida12 : 18 7 2 3 2 2 4 3 2 3 7 : 40064
aida13 : 2 2 1 3 0 3 2 4 2 3 7 : 39944
aida14 : 16 4 5 3 3 3 3 2 2 4 7 : 41552
aida15 : 9 3 1 1 2 3 2 3 3 3 7 : 40556
aida16 : 16 5 1 2 1 2 3 4 2 3 7 : 40184
Date:17/05/2021
Elog for shift: 08.00 to 12.00
Author: Lewis Sexton
Screenshots saved to: /tmp/Elog_210517_0800_1200
***** 08.30 *****
Checked R12_34 through analyser, dead time seems okay:
*** Timestamp elapsed time: 232.154 s
FEE elapsed dead time(s) elapsed idle time(s)
0 0.021 0.000
1 2.781 0.000
2 0.849 0.000
3 5.686 0.000
4 0.000 25.816
5 0.017 0.000
6 0.177 0.000
7 1.349 0.000
8 1.791 0.000
9 0.000 91.660
10 6.194 0.000
11 0.320 0.000
12 1.425 0.000
13 0.000 72.999
14 0.052 0.000
15 1.729 0.000
16 0.000 0.000
17 0.000 0.000
18 0.000 0.000
19 0.000 0.000
20 0.000 0.000
21 0.000 0.000
22 0.000 0.000
23 0.000 0.000
24 0.000 0.000
25 0.000 0.000
26 0.000 0.000
27 0.000 0.000
28 0.000 0.000
29 0.000 0.000
30 0.000 0.000
31 0.000 0.000
32 0.000 0.000
Stats checked seem okay (0833_Stats.png)
Merger rate ~3M items/s
Tape server ~12 MB/s
***** 09.00 *****
Checked R12_48 through analyser, dead time seems okay:
*** Timestamp elapsed time: 170.459 s
FEE elapsed dead time(s) elapsed idle time(s)
0 0.196 0.000
1 6.294 0.000
2 0.992 0.000
3 8.944 0.000
4 0.024 0.000
5 0.001 0.000
6 0.605 0.000
7 2.096 0.000
8 1.654 0.000
9 0.000 31.395
10 6.175 0.000
11 2.524 0.000
12 2.076 0.000
13 0.000 10.337
14 0.103 0.000
15 2.203 0.000
16 0.000 0.000
17 0.000 0.000
18 0.000 0.000
19 0.000 0.000
20 0.000 0.000
21 0.000 0.000
22 0.000 0.000
23 0.000 0.000
24 0.000 0.000
25 0.000 0.000
26 0.000 0.000
27 0.000 0.000
28 0.000 0.000
29 0.000 0.000
30 0.000 0.000
31 0.000 0.000
32 0.000 0.000
Stats checked seem okay (0902_Stats.png)
***** 09.30 *****
AIDA crash aida05 displaying 0 in stats
Power cycle performed with help of TD
Writing to R13 now
MBS relay restared
AIDA back up at 10.20
Ran analyser for R13_16
*** Timestamp elapsed time: 168.059 s
FEE elapsed dead time(s) elapsed idle time(s)
0 0.047 0.000
1 2.282 0.000
2 0.080 0.000
3 0.806 0.000
4 0.000 0.000
5 0.260 0.000
6 0.030 0.000
7 1.471 0.000
8 67.467 0.000
9 80.552 0.000
10 0.057 0.000
11 0.000 11.671
12 1.191 0.000
13 0.080 0.000
14 0.091 0.000
15 0.202 0.000
16 0.000 0.000
17 0.000 0.000
18 0.000 0.000
19 0.000 0.000
20 0.000 0.000
21 0.000 0.000
22 0.000 0.000
23 0.000 0.000
24 0.000 0.000
25 0.000 0.000
26 0.000 0.000
27 0.000 0.000
28 0.000 0.000
29 0.000 0.000
30 0.000 0.000
31 0.000 0.000
32 0.000 0.000
High deadtime in aida09 and aida10, changed slow comparator threshold to 0xe (previously 0xc)
Ran analyser for R13_21 for comparision
*** Timestamp elapsed time: 149.082 s
FEE elapsed dead time(s) elapsed idle time(s)
0 0.000 0.000
1 3.580 0.000
2 0.000 0.000
3 2.800 0.000
4 0.000 0.000
5 0.514 0.000
6 0.140 0.000
7 1.372 0.000
8 55.544 0.000
9 66.588 0.000
10 1.065 0.000
11 0.000 10.010
12 0.681 0.000
13 0.044 0.000
14 0.070 0.000
15 0.400 0.000
16 0.000 0.000
17 0.000 0.000
18 0.000 0.000
19 0.000 0.000
20 0.000 0.000
21 0.000 0.000
22 0.000 0.000
23 0.000 0.000
24 0.000 0.000
25 0.000 0.000
26 0.000 0.000
27 0.000 0.000
28 0.000 0.000
29 0.000 0.000
30 0.000 0.000
31 0.000 0.000
32 0.000 0.000
FEE temp slightly high in aida04, 0.44 above limit of 65 (FEETemps_1042.png)
Merger rate ~5M items/s
Tape server ~17 MB/s
Raised slow comparator in aida09 and aida10 to 0xf, analyse R13_26 for comparision
*** Timestamp elapsed time: 122.147 s
FEE elapsed dead time(s) elapsed idle time(s)
0 0.027 0.000
1 19.945 0.000
2 0.601 0.000
3 21.555 0.000
4 0.042 0.000
5 3.226 0.000
6 1.211 0.000
7 9.674 0.000
8 52.817 0.000
9 54.972 0.000
10 1.848 0.000
11 0.008 0.000
12 2.034 0.000
13 0.278 0.000
14 0.018 0.000
15 0.634 0.000
16 0.000 0.000
17 0.000 0.000
18 0.000 0.000
19 0.000 0.000
20 0.000 0.000
21 0.000 0.000
22 0.000 0.000
23 0.000 0.000
24 0.000 0.000
25 0.000 0.000
26 0.000 0.000
27 0.000 0.000
28 0.000 0.000
29 0.000 0.000
30 0.000 0.000
31 0.000 0.000
32 0.000 0.000
high deatime now also seen in aida02 and aida04
Several powercycles performed as high rates after restart, analysis of R14_13 showed low deadtime for all FEEs
Back running as of 10.45
Analyser of R14_15 to double check
*** Timestamp elapsed time: 205.006 s
FEE elapsed dead time(s) elapsed idle time(s)
0 0.000 40.176
1 0.438 0.000
2 0.199 0.000
3 2.927 0.000
4 0.000 140.347
5 1.282 0.000
6 0.150 0.000
7 2.097 0.000
8 1.673 0.000
9 0.000 87.749
10 1.150 0.000
11 0.489 0.000
12 0.374 0.000
13 0.048 20.995
14 0.251 0.000
15 2.441 0.000
16 0.000 0.000
17 0.000 0.000
18 0.000 0.000
19 0.000 0.000
20 0.000 0.000
21 0.000 0.000
22 0.000 0.000
23 0.000 0.000
24 0.000 0.000
25 0.000 0.000
26 0.000 0.000
27 0.000 0.000
28 0.000 0.000
29 0.000 0.000
30 0.000 0.000
31 0.000 0.000
32 0.000 0.000
12:04 During access Sultan added an additional ground cable and also noted the bias cable going into FEE12 was loose. He pushed it in solidly and the rates appear to have dropped across the FEEs
12:52 Check FPGA Timestamp errors gives following error message:
Got the error Server Internal Error
while trying to obtain /AIDA/Check/Check.tml.
can't read "TS_Base_Collected": no such variable while executing "if { $TS_Base_Collected == 0 } { collect_TS_Base }" (procedure "do_TS_errors" line 8) invoked from within "do_TS_errors " ("TSERRORS" arm line 1) invoked from within "switch -glob $w { RESET {set started 0} CLEAR {EmptyLog} ELOG {PrintLog} ..." (procedure "do_click" line 23) invoked from within "do_click" invoked from within "if {$started != 0} { variable JS "" variable LogFlag if {$LogFlag == 1} {InsertLog "Last Updated: [clock format [clock seconds] -form..." (file "Check.tcl" line 8) invoked from within "source Check.tcl" (in namespace eval "::Check" script line 6) invoked from within "namespace eval Check { global env source [file join $env(MIDASBASE) TclHttpd tcl Common common.tcl] source [file join $env(MIDASB..." invoked from within "subst { [Doc_Dynamic] <! [global Httpd; upvar #0 Httpd[set Httpd(currentSocket)] data; set ClientIPAddress $data(ipaddr); set MyInfo $data(self)] >..." ("uplevel" body line 1) invoked from within "uplevel #0 [list subst $script]" (procedure "SubstFile" line 12) invoked from within "SubstFile /home/npg/MIDAS_Releases/23Jan19/MIDAS_200119/TclHttpd/Html/AIDA/Check/Check.tml {}" ("uplevel" body line 1) invoked from within "uplevel 1 [list SubstFile $path $interp]" (procedure "Subst_File" line 7) invoked from within "Subst_File $template $interp" invoked from within "TemplateInstantiate $sock $path {} $suffix {} $Template(templateInterp)" (procedure "Doc_application/x-tcl-template" line 9) invoked from within "$cmd $path $suffix $sock" (procedure "Doc_Handle" line 20) invoked from within "Doc_Handle $prefix $path $suffix $sock" (procedure "DocDomain" line 44) invoked from within "DocDomain / /MIDAS/TclHttpd/Html sock8 AIDA/Check/Check.tml" ("eval" body line 1) invoked from within "eval $Url(command,$prefix) [list $sock $suffix]"
Tcl Call Trace
6: DocSubstSystemFile sock8 error 500 can't\ read\ "\;TS_Base_Collected"\;:\ no\ such\ variable\n\ \ \ \ while\ executing\n"\;if\ \{\ \$TS_Base_Collected\ ==\ 0\ \}\ \{\ collect_TS_Base\ \}"\;\n\ \ \ \ (procedure\ "\;do_TS_errors"\;\ line\ 8)\n\ \ \ \ invoked\ from\ within\n"\;do_TS_errors\ "\;\n\ \ \ \ ("\;TSERRORS"\;\ arm\ line\ 1)\n\ \ \ \ invoked\ from\ within\n"\;switch\ -glob\ \$w\ \{\n\n\ \ \ \ \ \ \ \ \ \ \ \ \ \ \ \ \ \ \ RESET\ \ \ \ \{set\ started\ 0\}\n\ \ \ \ \ \ \ \ \ \ \ \ \ \ \ \ \ \ \ CLEAR\ \ \ \ \{EmptyLog\}\n\ \ \ \ \ \ \ \ \ \ \ \ \ \ \ \ \ \ \ ELOG\ \ \ \ \ \{PrintLog\}\n\ \ \ \ \ \ \ \ \ ..."\;\n\ \ \ \ (procedure\ "\;do_click"\;\ line\ 23)\n\ \ \ \ invoked\ from\ within\n"\;do_click"\;\n\ \ \ \ invoked\ from\ within\n"\;if\ \{\$started\ !=\ 0\}\ \{\n\n\ \ \ \ \ variable\ JS\ "\;"\;\n\ \ \ \ \ variable\ LogFlag\n\n\ \ \ \ \ if\ \{\$LogFlag\ ==\ 1\}\ \{InsertLog\ "\;Last\ Updated:\ [clock\ format\ [clock\ seconds\]\ -form..."\;\n\ \ \ \ (file\ "\;Check.tcl"\;\ line\ 8)\n\ \ \ \ invoked\ from\ within\n"\;source\ Check.tcl"\;\n\ \ \ \ (in\ namespace\ eval\ "\;::Check"\;\ script\ line\ 6)\n\ \ \ \ invoked\ from\ within\n"\;namespace\ eval\ Check\ \{\n\ \ \ \ \ \ \ global\ env\n\ \ \ \ \ \ \ source\ [file\ join\ \$env(MIDASBASE)\ TclHttpd\ tcl\ Common\ common.tcl\]\n\ \ \ \ \ \ \ source\ [file\ join\ \$env(MIDASB..."\;\n\ \ \ \ invoked\ from\ within\n"\;subst\ \{\n\n[Doc_Dynamic\]\n\n\n<\;!\n[global\ Httpd\;\ upvar\ #0\ Httpd[set\ Httpd(currentSocket)\]\ data\;\ set\ ClientIPAddress\ \$data(ipaddr)\;\ set\ MyInfo\ \$data(self)\]\n>\;..."\;\n\ \ \ \ ("\;uplevel"\;\ body\ line\ 1)\n\ \ \ \ invoked\ from\ within\n"\;uplevel\ #0\ [list\ subst\ \$script\]"\;\n\ \ \ \ (procedure\ "\;SubstFile"\;\ line\ 12)\n\ \ \ \ invoked\ from\ within\n"\;SubstFile\ /home/npg/MIDAS_Releases/23Jan19/MIDAS_200119/TclHttpd/Html/AIDA/Check/Check.tml\ \{\}"\;\n\ \ \ \ ("\;uplevel"\;\ body\ line\ 1)\n\ \ \ \ invoked\ from\ within\n"\;uplevel\ 1\ [list\ SubstFile\ \$path\ \$interp\]"\;\n\ \ \ \ (procedure\ "\;Subst_File"\;\ line\ 7)\n\ \ \ \ invoked\ from\ within\n"\;Subst_File\ \$template\ \$interp"\;\n\ \ \ \ invoked\ from\ within\n"\;TemplateInstantiate\ \$sock\ \$path\ \{\}\ \$suffix\ \{\}\ \$Template(templateInterp)"\;\n\ \ \ \ (procedure\ "\;Doc_application/x-tcl-template"\;\ line\ 9)\n\ \ \ \ invoked\ from\ within\n"\;\$cmd\ \$path\ \$suffix\ \$sock"\;\n\ \ \ \ (procedure\ "\;Doc_Handle"\;\ line\ 20)\n\ \ \ \ invoked\ from\ within\n"\;Doc_Handle\ \$prefix\ \$path\ \$suffix\ \$sock"\;\n\ \ \ \ (procedure\ "\;DocDomain"\;\ line\ 44)\n\ \ \ \ invoked\ from\ within\n"\;DocDomain\ /\ /MIDAS/TclHttpd/Html\ sock8\ AIDA/Check/Check.tml"\;\n\ \ \ \ ("\;eval"\;\ body\ line\ 1)\n\ \ \ \ invoked\ from\ within\n"\;eval\ \$Url(command,\$prefix)\ [list\ \$sock\ \$suffix\]"\;
5: Doc_Error sock8 can't\ read\ \"TS_Base_Collected\":\ no\ such\ variable\n\ \ \ \ while\ executing\n\"if\ \{\ \$TS_Base_Collected\ ==\ 0\ \}\ \{\ collect_TS_Base\ \}\"\n\ \ \ \ (procedure\ \"do_TS_errors\"\ line\ 8)\n\ \ \ \ invoked\ from\ within\n\"do_TS_errors\ \"\n\ \ \ \ (\"TSERRORS\"\ arm\ line\ 1)\n\ \ \ \ invoked\ from\ within\n\"switch\ -glob\ \$w\ \{\n\n\ \ \ \ \ \ \ \ \ \ \ \ \ \ \ \ \ \ \ RESET\ \ \ \ \{set\ started\ 0\}\n\ \ \ \ \ \ \ \ \ \ \ \ \ \ \ \ \ \ \ CLEAR\ \ \ \ \{EmptyLog\}\n\ \ \ \ \ \ \ \ \ \ \ \ \ \ \ \ \ \ \ ELOG\ \ \ \ \ \{PrintLog\}\n\ \ \ \ \ \ \ \ \ ...\"\n\ \ \ \ (procedure\ \"do_click\"\ line\ 23)\n\ \ \ \ invoked\ from\ within\n\"do_click\"\n\ \ \ \ invoked\ from\ within\n\"if\ \{\$started\ !=\ 0\}\ \{\n\n\ \ \ \ \ variable\ JS\ \"\"\n\ \ \ \ \ variable\ LogFlag\n\n\ \ \ \ \ if\ \{\$LogFlag\ ==\ 1\}\ \{InsertLog\ \"Last\ Updated:\ [clock\ format\ [clock\ seconds\]\ -form...\"\n\ \ \ \ (file\ \"Check.tcl\"\ line\ 8)\n\ \ \ \ invoked\ from\ within\n\"source\ Check.tcl\"\n\ \ \ \ (in\ namespace\ eval\ \"::Check\"\ script\ line\ 6)\n\ \ \ \ invoked\ from\ within\n\"namespace\ eval\ Check\ \{\n\ \ \ \ \ \ \ global\ env\n\ \ \ \ \ \ \ source\ [file\ join\ \$env(MIDASBASE)\ TclHttpd\ tcl\ Common\ common.tcl\]\n\ \ \ \ \ \ \ source\ [file\ join\ \$env(MIDASB...\"\n\ \ \ \ invoked\ from\ within\n\"subst\ \{\n\n[Doc_Dynamic\]\n\n\n<!\n[global\ Httpd\;\ upvar\ #0\ Httpd[set\ Httpd(currentSocket)\]\ data\;\ set\ ClientIPAddress\ \$data(ipaddr)\;\ set\ MyInfo\ \$data(self)\]\n>...\"\n\ \ \ \ (\"uplevel\"\ body\ line\ 1)\n\ \ \ \ invoked\ from\ within\n\"uplevel\ #0\ [list\ subst\ \$script\]\"\n\ \ \ \ (procedure\ \"SubstFile\"\ line\ 12)\n\ \ \ \ invoked\ from\ within\n\"SubstFile\ /home/npg/MIDAS_Releases/23Jan19/MIDAS_200119/TclHttpd/Html/AIDA/Check/Check.tml\ \{\}\"\n\ \ \ \ (\"uplevel\"\ body\ line\ 1)\n\ \ \ \ invoked\ from\ within\n\"uplevel\ 1\ [list\ SubstFile\ \$path\ \$interp\]\"\n\ \ \ \ (procedure\ \"Subst_File\"\ line\ 7)\n\ \ \ \ invoked\ from\ within\n\"Subst_File\ \$template\ \$interp\"\n\ \ \ \ invoked\ from\ within\n\"TemplateInstantiate\ \$sock\ \$path\ \{\}\ \$suffix\ \{\}\ \$Template(templateInterp)\"\n\ \ \ \ (procedure\ \"Doc_application/x-tcl-template\"\ line\ 9)\n\ \ \ \ invoked\ from\ within\n\"\$cmd\ \$path\ \$suffix\ \$sock\"\n\ \ \ \ (procedure\ \"Doc_Handle\"\ line\ 20)\n\ \ \ \ invoked\ from\ within\n\"Doc_Handle\ \$prefix\ \$path\ \$suffix\ \$sock\"\n\ \ \ \ (procedure\ \"DocDomain\"\ line\ 44)\n\ \ \ \ invoked\ from\ within\n\"DocDomain\ /\ /MIDAS/TclHttpd/Html\ sock8\ AIDA/Check/Check.tml\"\n\ \ \ \ (\"eval\"\ body\ line\ 1)\n\ \ \ \ invoked\ from\ within\n\"eval\ \$Url(command,\$prefix)\ [list\ \$sock\ \$suffix\]\"
4: Url_Unwind sock8 can't\ read\ \"TS_Base_Collected\":\ no\ such\ variable\n\ \ \ \ while\ executing\n\"if\ \{\ \$TS_Base_Collected\ ==\ 0\ \}\ \{\ collect_TS_Base\ \}\"\n\ \ \ \ (procedure\ \"do_TS_errors\"\ line\ 8)\n\ \ \ \ invoked\ from\ within\n\"do_TS_errors\ \"\n\ \ \ \ (\"TSERRORS\"\ arm\ line\ 1)\n\ \ \ \ invoked\ from\ within\n\"switch\ -glob\ \$w\ \{\n\n\ \ \ \ \ \ \ \ \ \ \ \ \ \ \ \ \ \ \ RESET\ \ \ \ \{set\ started\ 0\}\n\ \ \ \ \ \ \ \ \ \ \ \ \ \ \ \ \ \ \ CLEAR\ \ \ \ \{EmptyLog\}\n\ \ \ \ \ \ \ \ \ \ \ \ \ \ \ \ \ \ \ ELOG\ \ \ \ \ \{PrintLog\}\n\ \ \ \ \ \ \ \ \ ...\"\n\ \ \ \ (procedure\ \"do_click\"\ line\ 23)\n\ \ \ \ invoked\ from\ within\n\"do_click\"\n\ \ \ \ invoked\ from\ within\n\"if\ \{\$started\ !=\ 0\}\ \{\n\n\ \ \ \ \ variable\ JS\ \"\"\n\ \ \ \ \ variable\ LogFlag\n\n\ \ \ \ \ if\ \{\$LogFlag\ ==\ 1\}\ \{InsertLog\ \"Last\ Updated:\ [clock\ format\ [clock\ seconds\]\ -form...\"\n\ \ \ \ (file\ \"Check.tcl\"\ line\ 8)\n\ \ \ \ invoked\ from\ within\n\"source\ Check.tcl\"\n\ \ \ \ (in\ namespace\ eval\ \"::Check\"\ script\ line\ 6)\n\ \ \ \ invoked\ from\ within\n\"namespace\ eval\ Check\ \{\n\ \ \ \ \ \ \ global\ env\n\ \ \ \ \ \ \ source\ [file\ join\ \$env(MIDASBASE)\ TclHttpd\ tcl\ Common\ common.tcl\]\n\ \ \ \ \ \ \ source\ [file\ join\ \$env(MIDASB...\"\n\ \ \ \ invoked\ from\ within\n\"subst\ \{\n\n[Doc_Dynamic\]\n\n\n<!\n[global\ Httpd\;\ upvar\ #0\ Httpd[set\ Httpd(currentSocket)\]\ data\;\ set\ ClientIPAddress\ \$data(ipaddr)\;\ set\ MyInfo\ \$data(self)\]\n>...\"\n\ \ \ \ (\"uplevel\"\ body\ line\ 1)\n\ \ \ \ invoked\ from\ within\n\"uplevel\ #0\ [list\ subst\ \$script\]\"\n\ \ \ \ (procedure\ \"SubstFile\"\ line\ 12)\n\ \ \ \ invoked\ from\ within\n\"SubstFile\ /home/npg/MIDAS_Releases/23Jan19/MIDAS_200119/TclHttpd/Html/AIDA/Check/Check.tml\ \{\}\"\n\ \ \ \ (\"uplevel\"\ body\ line\ 1)\n\ \ \ \ invoked\ from\ within\n\"uplevel\ 1\ [list\ SubstFile\ \$path\ \$interp\]\"\n\ \ \ \ (procedure\ \"Subst_File\"\ line\ 7)\n\ \ \ \ invoked\ from\ within\n\"Subst_File\ \$template\ \$interp\"\n\ \ \ \ invoked\ from\ within\n\"TemplateInstantiate\ \$sock\ \$path\ \{\}\ \$suffix\ \{\}\ \$Template(templateInterp)\"\n\ \ \ \ (procedure\ \"Doc_application/x-tcl-template\"\ line\ 9)\n\ \ \ \ invoked\ from\ within\n\"\$cmd\ \$path\ \$suffix\ \$sock\"\n\ \ \ \ (procedure\ \"Doc_Handle\"\ line\ 20)\n\ \ \ \ invoked\ from\ within\n\"Doc_Handle\ \$prefix\ \$path\ \$suffix\ \$sock\"\n\ \ \ \ (procedure\ \"DocDomain\"\ line\ 44)\n\ \ \ \ invoked\ from\ within\n\"DocDomain\ /\ /MIDAS/TclHttpd/Html\ sock8\ AIDA/Check/Check.tml\"\n\ \ \ \ (\"eval\"\ body\ line\ 1)\n\ \ \ \ invoked\ from\ within\n\"eval\ \$Url(command,\$prefix)\ [list\ \$sock\ \$suffix\]\" NONE
3: Url_DeferredDispatch / AIDA/Check/Check.tml sock8 buffer {}
2: HttpdReadPost sock8 buffer 16384 {Url_DeferredDispatch / AIDA/Check/Check.tml}
1: HttpdReadPostGlobal sock8 Httpds
Dead time check:
[npg@aidas-gsi S496]$ ~/analyser/analyser R14_24
*** TDR format 3.3.0 analyser - TD - May 2021
*** ERROR: READ I/O error: 5002
blocks: 32000
ADC data format: 252995858 ( 451517.9 Hz)
Other data format: 8924143 ( 15926.8 Hz)
Sample trace data format: 0 ( 0.0 Hz)
Undefined format: 0 ( 0.0 Hz)
Other data format type: PAUSE: 85 ( 0.2 Hz)
RESUME: 85 ( 0.2 Hz)
SYNC100: 34087 ( 60.8 Hz)
WR48-63: 34087 ( 60.8 Hz)
FEE64 disc: 0 ( 0.0 Hz)
MBS info: 8855799 ( 15804.8 Hz)
Other info: 0 ( 0.0 Hz)
ADC data range bit set: 0 ( 0.0 Hz)
Timewarps: ADC: 0 ( 0.0 Hz)
PAUSE: 0 ( 0.0 Hz)
RESUME: 0 ( 0.0 Hz)
SYNC100: 0 ( 0.0 Hz)
WR48-63: 0 ( 0.0 Hz)
FEE64 disc: 0 ( 0.0 Hz)
MBS info: 0 ( 0.0 Hz)
Undefined: 0 ( 0.0 Hz)
Sample trace: 0 ( 0.0 Hz)
*** Timestamp elapsed time: 560.323 s
FEE elapsed dead time(s) elapsed idle time(s)
0 0.000 349.960
1 0.002 0.000
2 0.000 5.974
3 1.105 0.000
4 0.000 447.454
5 0.000 2.809
6 0.000 16.727
7 0.137 0.000
8 0.090 0.000
9 0.000 429.897
10 0.461 0.000
11 0.018 0.000
12 0.000 8.985
13 0.000 466.311
14 0.000 15.095
15 0.346 0.000
13:24 Beam is off at the moment...
13:43 Changing spill structure from 1.5s/3.5s to 1s.
13:50
[npg@aidas-gsi S496]$ ~/analyser/analyser R14_29
*** TDR format 3.3.0 analyser - TD - May 2021
*** ERROR: READ I/O error: 5002
blocks: 32000
ADC data format: 251763810 ( 930342.1 Hz)
Other data format: 10156190 ( 37530.1 Hz)
Sample trace data format: 0 ( 0.0 Hz)
Undefined format: 0 ( 0.0 Hz)
Other data format type: PAUSE: 205 ( 0.8 Hz)
RESUME: 205 ( 0.8 Hz)
SYNC100: 33009 ( 122.0 Hz)
WR48-63: 33009 ( 122.0 Hz)
FEE64 disc: 0 ( 0.0 Hz)
MBS info: 10089762 ( 37284.7 Hz)
Other info: 0 ( 0.0 Hz)
ADC data range bit set: 527077 ( 1947.7 Hz)
Timewarps: ADC: 0 ( 0.0 Hz)
PAUSE: 0 ( 0.0 Hz)
RESUME: 0 ( 0.0 Hz)
SYNC100: 0 ( 0.0 Hz)
WR48-63: 0 ( 0.0 Hz)
FEE64 disc: 0 ( 0.0 Hz)
MBS info: 0 ( 0.0 Hz)
Undefined: 0 ( 0.0 Hz)
Sample trace: 0 ( 0.0 Hz)
*** Timestamp elapsed time: 270.614 s
FEE elapsed dead time(s) elapsed idle time(s)
0 0.034 6.803
1 8.461 0.000
2 0.569 0.000
3 11.664 0.000
4 0.024 26.416
5 0.854 0.000
6 0.069 0.000
7 0.741 0.000
8 1.336 0.000
9 0.000 75.926
10 0.353 0.000
11 0.105 0.000
12 0.070 0.000
13 0.000 93.585
14 0.017 0.000
15 0.121 0.000
15:06 Spill structure back to 1.5 on 2s off. |
Attachment 1: 210517_0200_Bias.png
|
|
Attachment 2: 210517_0202_stats.png
|
|
Attachment 3: 210517_0202_temp.png
|
|
Attachment 4: 210517_0400_Bias.png
|
|
Attachment 5: 210517_0403_stats.png
|
|
Attachment 6: 210517_0403_temp.png
|
|
Attachment 7: 210517_0740_Bias.png
|
|
Attachment 8: 210517_0742_Stats.png
|
|
Attachment 9: 210517_0743_Temp.png
|
|
Attachment 10: 0833_Stats.png
|
|
Attachment 11: 0902_Stats.png
|
|
Attachment 12: 1241_Stats.png
|
|
Attachment 13: 1347_Stats.png
|
|
Attachment 14: FEETemps_1042.png
|
|
Attachment 15: FEETemps_1246.png
|
|
Attachment 16: FEETemps_1350.png
|
|
Attachment 17: leakage_currents_1302.png
|
|
108
|
Wed Dec 18 02:44:27 2019 |
NH | 17.12.19, 18.12.19 |
Beam: 238U (850 MeV/u)
Fragment: 168Re
Tuning accelerator and FRS, believed since 3AM we are implanting on AIDA.
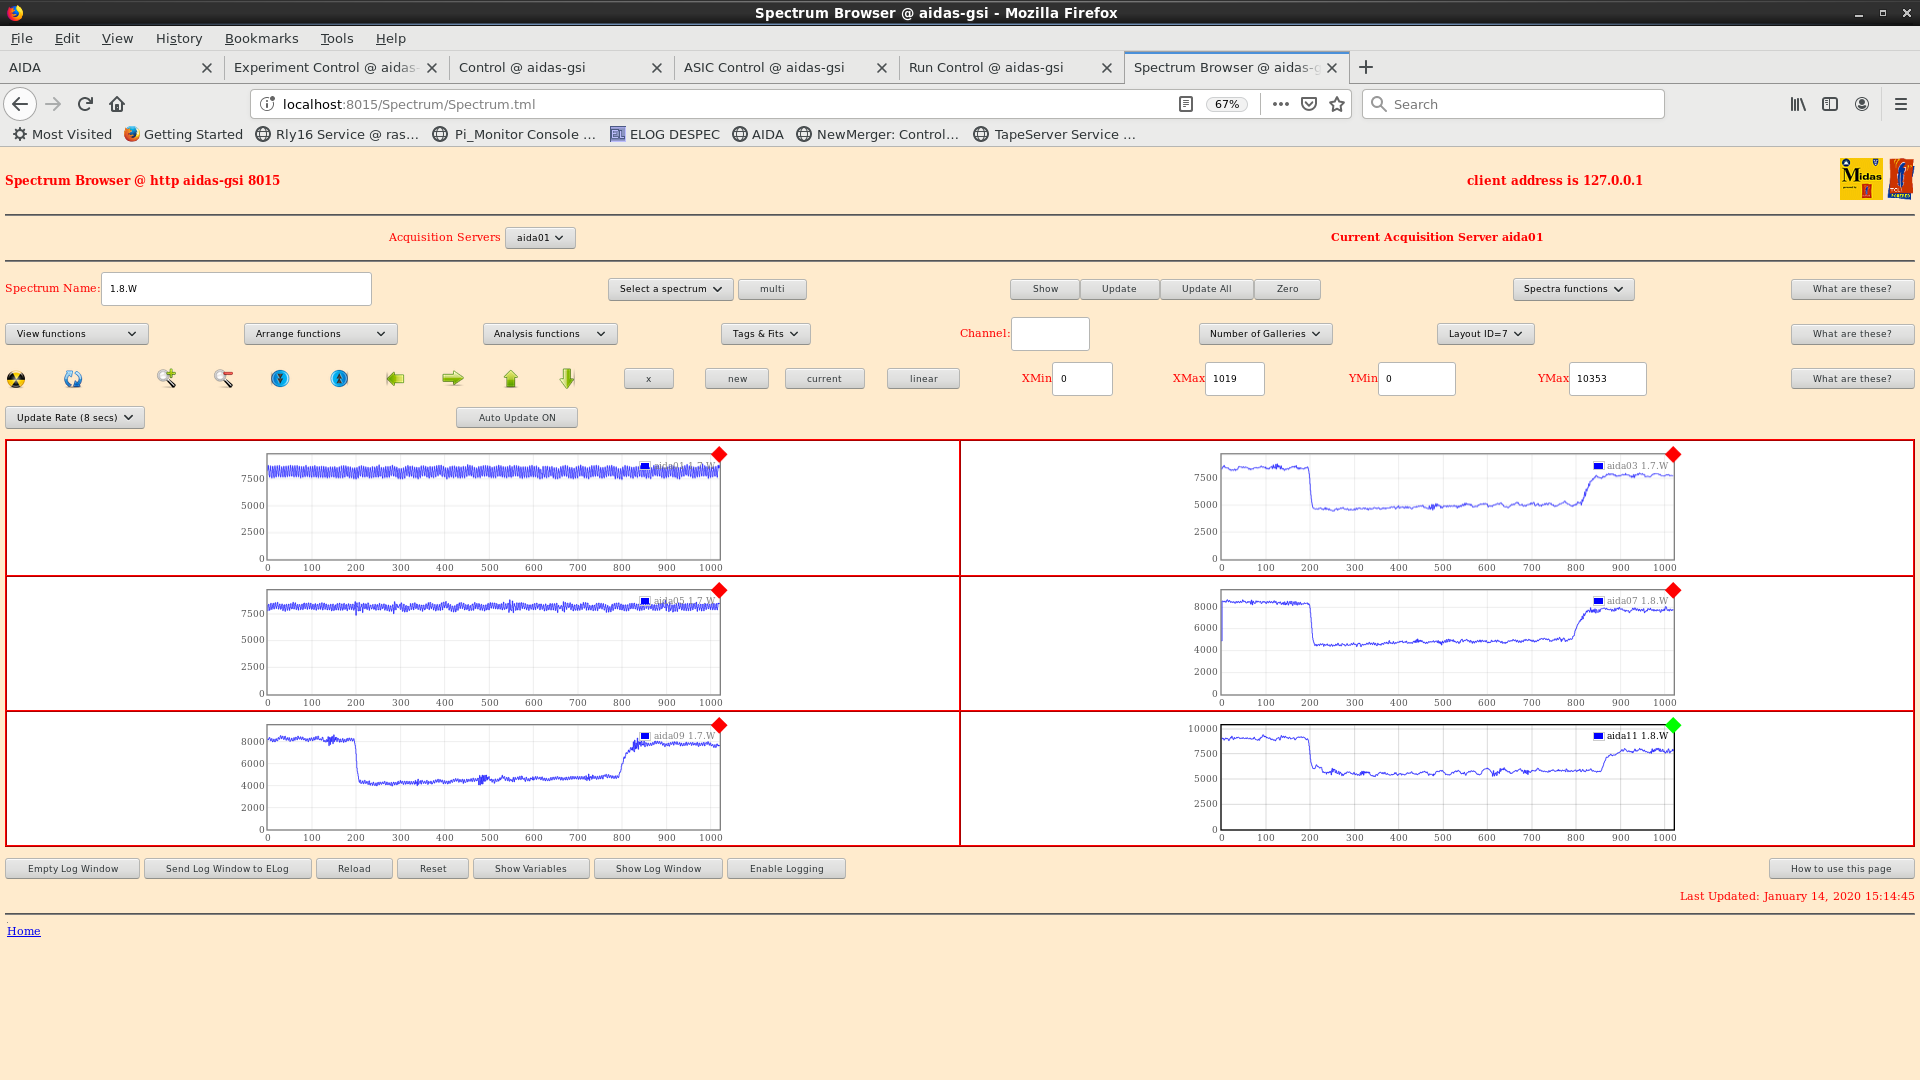
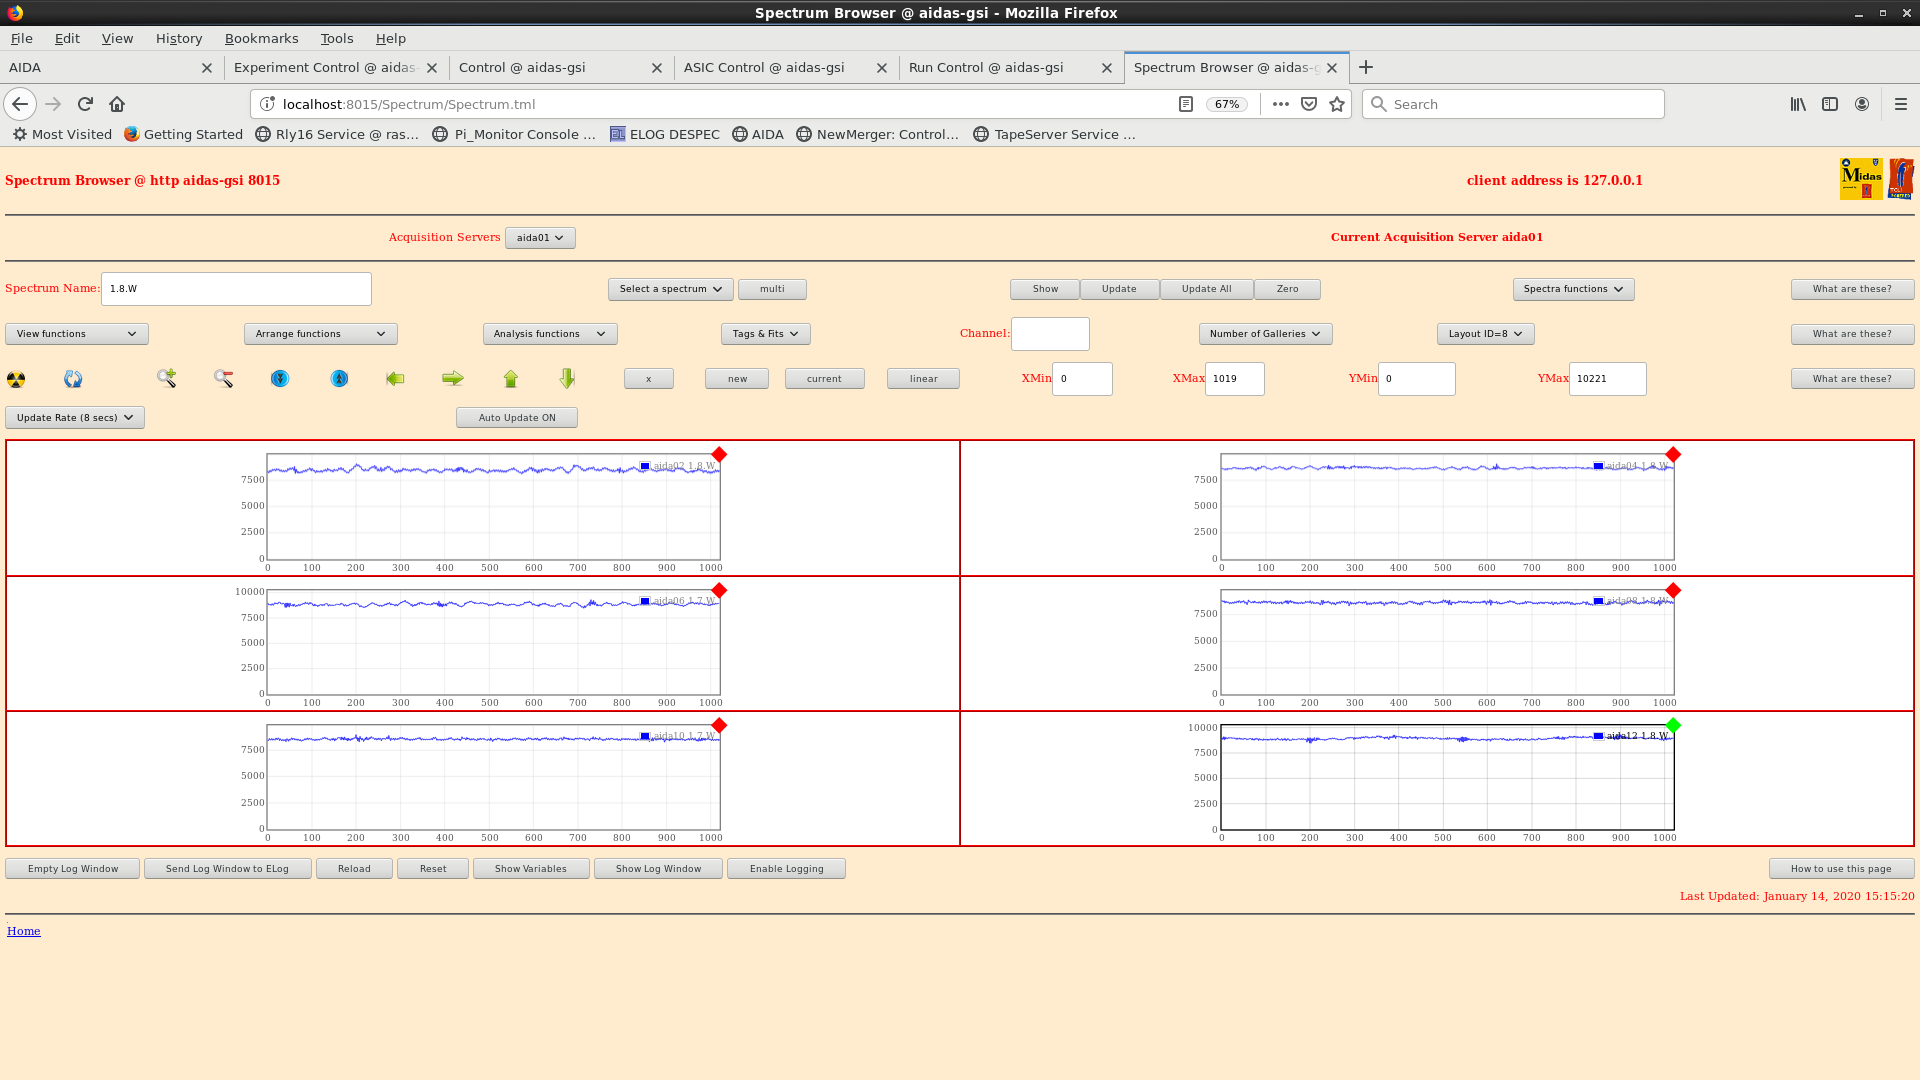
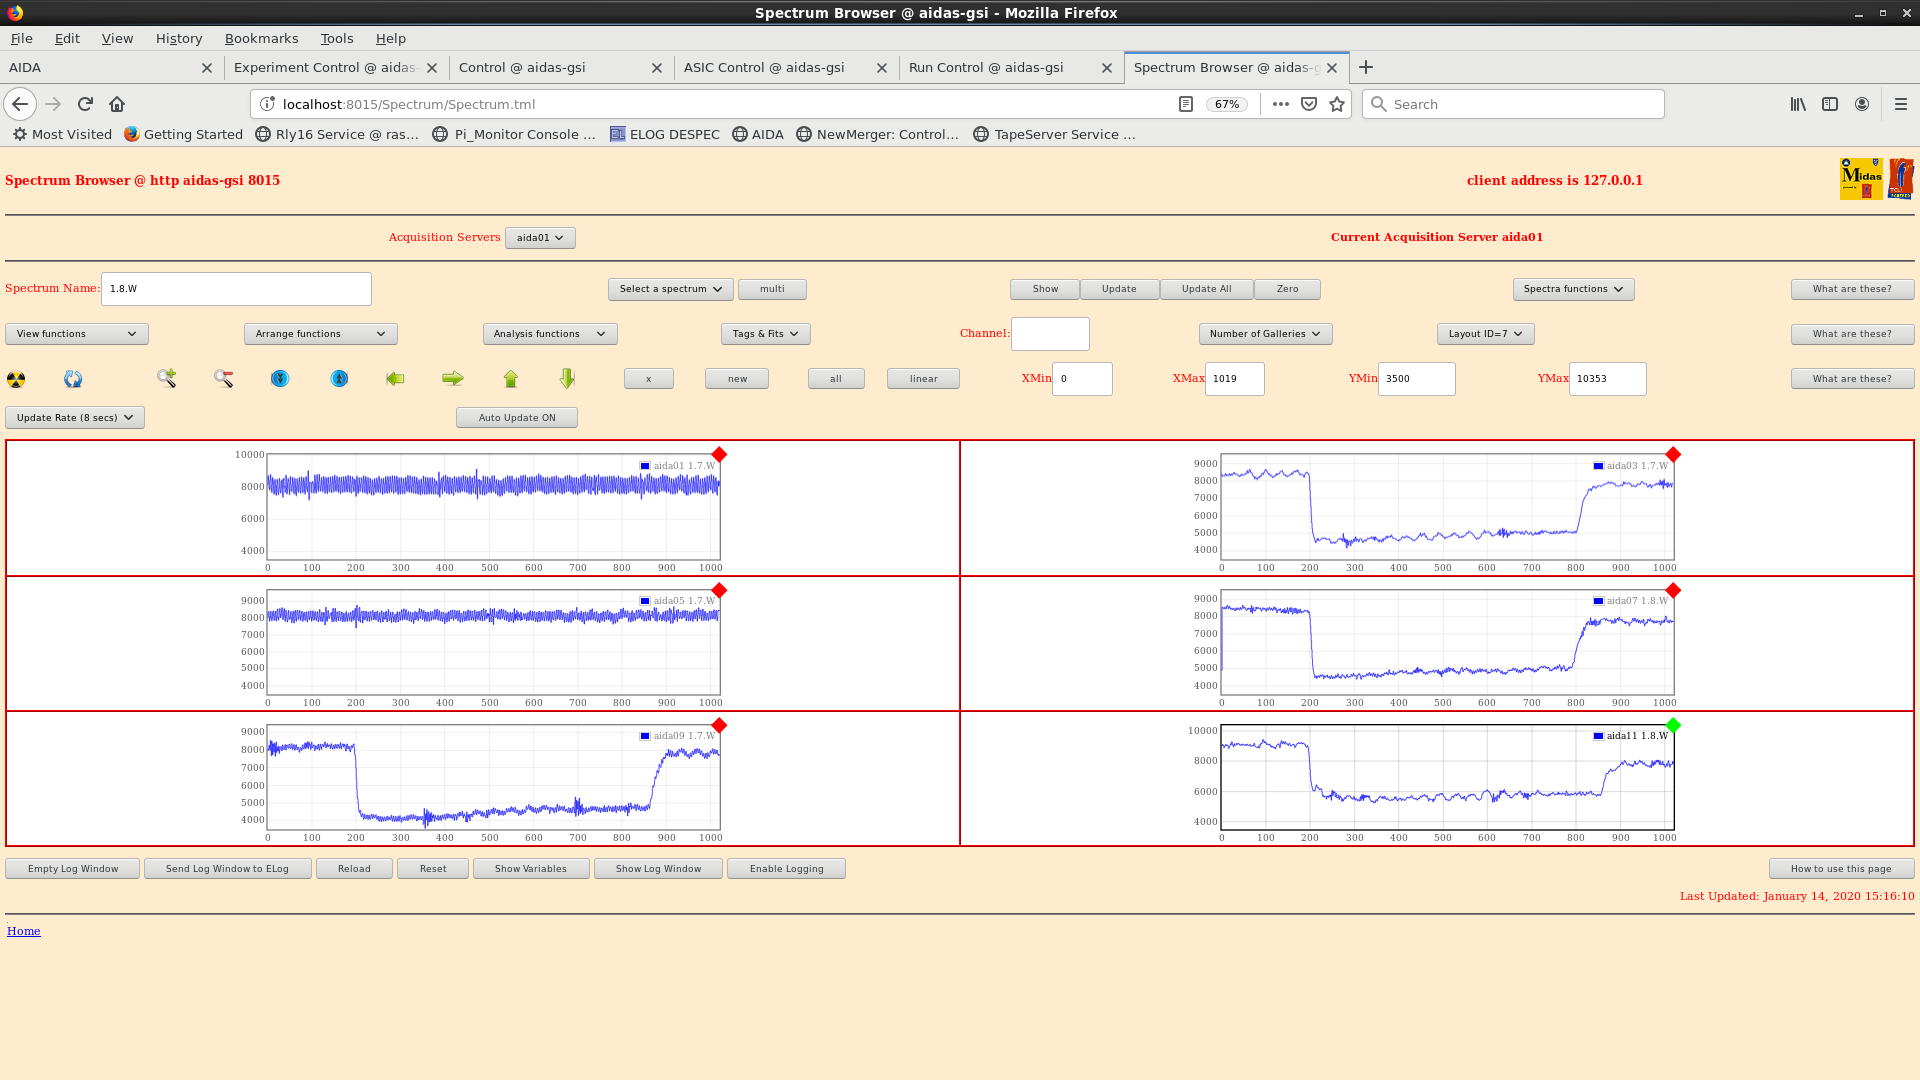
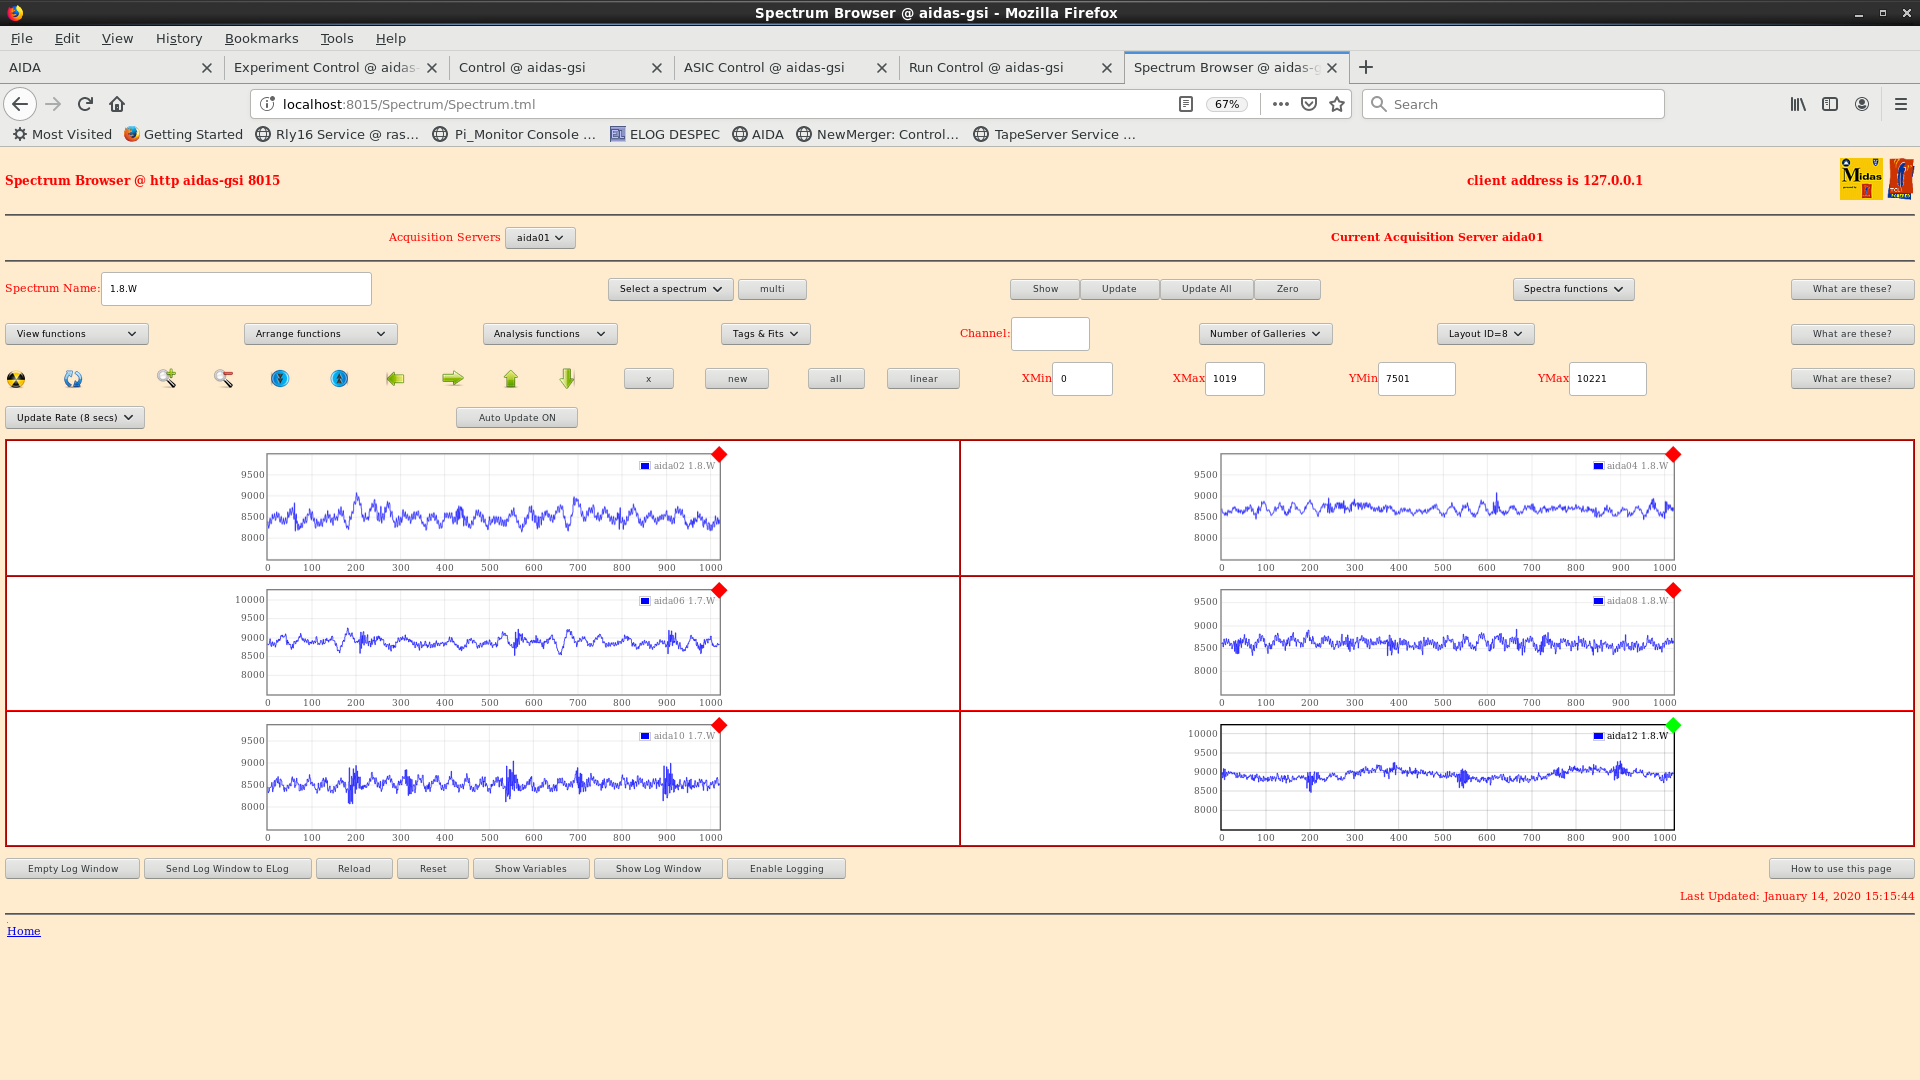
FEE issues:
One HEC in aida03 seems to be empty - LEC channel fills
aida09 has a lot of weird channels, check/load doesn't seem to fix
aida10 still no data after cable replaced
DSSD leakages OK - slightly higher now
Temps good
Fig 4: Rates 14:32
Leakages and temps good AS Before
Checking if we are implanting properly - possibly into the first DSSD at the moment
Fig 5 FRS PID
Fig 6 DSSD
Fig 7 DSSD (PID gated) |
Attachment 1: 1812-stats.png
|
|
Attachment 2: 1812-leakages.png
|
|
Attachment 3: 1812-temps.png
|
|
Attachment 4: 1812v2-Rates.png
|
|
Attachment 5: nh_1712_zaoq.png
|
|
Attachment 6: nh_1712_dssd.png
|
|
Attachment 7: nh_1712_dssd_id.png
|
|
602
|
Wed Apr 24 15:37:59 2024 |
PP | 16:00-00:00 shift Wednesday 24 April |
All seems OK.
Screenshots attached. |
Attachment 1: Screenshot_from_2024-04-24_16-38-45.png
|
|
Attachment 2: Screenshot_from_2024-04-24_16-39-09.png
|
|
Attachment 3: Screenshot_from_2024-04-24_16-39-38.png
|
|
Attachment 4: Screenshot_from_2024-04-24_16-40-24.png
|
|
Attachment 5: Screenshot_from_2024-04-24_16-41-15.png
|
|
Attachment 6: Screenshot_from_2024-04-24_16-43-41.png
|
|
Attachment 7: Screenshot_from_2024-04-24_16-44-15.png
|
|
Attachment 8: Screenshot_from_2024-04-24_16-44-32.png
|
|
651
|
Tue Jun 11 15:01:07 2024 |
PP TD | 16:00-00:00 shift Tuesday 11/06/24 |
All seems OK
Screenshots attached.
17.33 per FEE64 1.8.W spectra - attachments 8-9
per p+n FEE64 1.8.L spectra - attachment 10
aida09 pulser peak width 66 ch FWHM
cf
c. 11:00 today 57 ch FWHM https://elog.ph.ed.ac.uk/DESPEC/650
cf
c. 00:10 today 53 ch FWHM https://elog.ph.ed.ac.uk/DESPEC/649
17.48 ADC data item stats - attachment 11
All histograms zero'd
17.51 Analysis data file S181/R6_96 - attachment 12
max deadtime 5% (aida08)
HEC Data items 3.7kHz, LEC data items 1.8MHz
cf.
c. 12.29 today 1.1MHz https://elog.ph.ed.ac.uk/DESPEC/650
c. 00.09 today 1.1MHz https://elog.ph.ed.ac.uk/DESPEC/649 |
Attachment 1: Screenshot_from_2024-06-11_16-06-43.png
|
|
Attachment 2: Screenshot_from_2024-06-11_16-07-53.png
|
|
Attachment 3: Screenshot_from_2024-06-11_16-09-03.png
|
|
Attachment 4: Screenshot_from_2024-06-11_16-12-05.png
|
|
Attachment 5: Screenshot_from_2024-06-11_16-12-46.png
|
|
Attachment 6: Screenshot_from_2024-06-11_16-13-40.png
|
|
Attachment 7: Screenshot_from_2024-06-11_16-14-11.png
|
|
Attachment 8: Screenshot_from_2024-06-11_16-17-21.png
|
|
Attachment 9: Screenshot_from_2024-06-11_17-34-26.png
|
|
Attachment 10: Screenshot_from_2024-06-11_17-33-33.png
|
|
Attachment 11: Screenshot_from_2024-06-11_17-39-32.png
|
|
Attachment 12: Screenshot_from_2024-06-11_17-48-43.png
|
|
Attachment 13: R6_98
|
*** TDR format 3.3.0 analyser - TD - May 2021
*** ERROR: READ I/O error: 5002
blocks: 32000
ADC data format: 258260025 ( 1785474.1 Hz)
Other data format: 3659975 ( 25303.1 Hz)
Sample trace data format: 0 ( 0.0 Hz)
Undefined format: 0 ( 0.0 Hz)
Other data format type: PAUSE: 939 ( 6.5 Hz)
RESUME: 938 ( 6.5 Hz)
SYNC100: 32538 ( 225.0 Hz)
WR48-63: 32538 ( 225.0 Hz)
FEE64 disc: 0 ( 0.0 Hz)
MBS info: 3593022 ( 24840.3 Hz)
Other info: 0 ( 0.0 Hz)
ADC data range bit set: 539819 ( 3732.0 Hz)
Timewarps: ADC: 0 ( 0.0 Hz)
PAUSE: 0 ( 0.0 Hz)
RESUME: 0 ( 0.0 Hz)
SYNC100: 0 ( 0.0 Hz)
WR48-63: 0 ( 0.0 Hz)
FEE64 disc: 0 ( 0.0 Hz)
MBS info: 0 ( 0.0 Hz)
Undefined: 0 ( 0.0 Hz)
Sample trace: 0 ( 0.0 Hz)
*** Timestamp elapsed time: 144.645 s
FEE elapsed dead time(s) elapsed idle time(s)
0 0.468 0.000
1 0.015 0.000
2 0.040 0.000
3 0.872 0.000
4 0.007 0.000
5 0.312 0.000
6 0.000 0.000
7 7.299 0.000
8 0.001 0.000
9 3.731 0.000
10 2.112 0.000
11 0.008 0.000
12 0.000 0.000
13 0.367 0.000
14 0.001 0.000
15 1.636 0.000
16 0.000 0.000
17 0.000 0.000
18 0.000 0.000
19 0.000 0.000
20 0.000 0.000
21 0.000 0.000
22 0.000 0.000
23 0.000 0.000
24 0.000 0.000
25 0.000 0.000
26 0.000 0.000
27 0.000 0.000
28 0.000 0.000
29 0.000 0.000
30 0.000 0.000
31 0.000 0.000
32 0.000 0.000
*** Statistics
FEE ADC Data Other Data Sample Undefined Pause Resume SYNC100 WR48-63 Disc MBS Other HEC Data
0 15794317 8531 0 0 49 49 2058 2058 0 4317 0 10696
1 7121332 1752 0 0 3 3 873 873 0 0 0 24880
2 15560192 1259782 0 0 6 6 2078 2078 0 1255614 0 14645
3 17271150 4664 0 0 134 134 2198 2198 0 0 0 19004
4 6664272 367237 0 0 2 2 840 840 0 365553 0 5226
5 16529211 4220 0 0 48 48 2062 2062 0 0 0 23130
6 5459932 300460 0 0 0 0 680 680 0 299100 0 14450
7 45345978 11675 0 0 200 199 5638 5638 0 0 0 336191
8 6229388 1534 0 0 1 1 766 766 0 0 0 16825
9 38606423 1232596 0 0 155 155 5043 5043 0 1222200 0 15969
10 19820101 5140 0 0 195 195 2375 2375 0 0 0 9560
11 4555885 447544 0 0 2 2 651 651 0 446238 0 14419
12 4015114 976 0 0 0 0 488 488 0 0 0 3706
13 15417116 3872 0 0 46 46 1890 1890 0 0 0 14088
14 5845488 1420 0 0 1 1 709 709 0 0 0 10117
15 34024126 8572 0 0 97 97 4189 4189 0 0 0 6913
16 0 0 0 0 0 0 0 0 0 0 0 0
17 0 0 0 0 0 0 0 0 0 0 0 0
18 0 0 0 0 0 0 0 0 0 0 0 0
19 0 0 0 0 0 0 0 0 0 0 0 0
20 0 0 0 0 0 0 0 0 0 0 0 0
21 0 0 0 0 0 0 0 0 0 0 0 0
22 0 0 0 0 0 0 0 0 0 0 0 0
23 0 0 0 0 0 0 0 0 0 0 0 0
24 0 0 0 0 0 0 0 0 0 0 0 0
25 0 0 0 0 0 0 0 0 0 0 0 0
26 0 0 0 0 0 0 0 0 0 0 0 0
27 0 0 0 0 0 0 0 0 0 0 0 0
28 0 0 0 0 0 0 0 0 0 0 0 0
29 0 0 0 0 0 0 0 0 0 0 0 0
30 0 0 0 0 0 0 0 0 0 0 0 0
31 0 0 0 0 0 0 0 0 0 0 0 0
32 0 0 0 0 0 0 0 0 0 0 0 0
*** Timewarps
FEE ADC Pause Resume SYNC100 WR48-63 Disc MBS Undefined Samples
0 0 0 0 0 0 0 0 0 0
1 0 0 0 0 0 0 0 0 0
2 0 0 0 0 0 0 0 0 0
3 0 0 0 0 0 0 0 0 0
4 0 0 0 0 0 0 0 0 0
5 0 0 0 0 0 0 0 0 0
6 0 0 0 0 0 0 0 0 0
7 0 0 0 0 0 0 0 0 0
8 0 0 0 0 0 0 0 0 0
9 0 0 0 0 0 0 0 0 0
10 0 0 0 0 0 0 0 0 0
11 0 0 0 0 0 0 0 0 0
12 0 0 0 0 0 0 0 0 0
13 0 0 0 0 0 0 0 0 0
14 0 0 0 0 0 0 0 0 0
15 0 0 0 0 0 0 0 0 0
16 0 0 0 0 0 0 0 0 0
17 0 0 0 0 0 0 0 0 0
18 0 0 0 0 0 0 0 0 0
19 0 0 0 0 0 0 0 0 0
20 0 0 0 0 0 0 0 0 0
21 0 0 0 0 0 0 0 0 0
22 0 0 0 0 0 0 0 0 0
23 0 0 0 0 0 0 0 0 0
24 0 0 0 0 0 0 0 0 0
25 0 0 0 0 0 0 0 0 0
26 0 0 0 0 0 0 0 0 0
27 0 0 0 0 0 0 0 0 0
28 0 0 0 0 0 0 0 0 0
29 0 0 0 0 0 0 0 0 0
30 0 0 0 0 0 0 0 0 0
31 0 0 0 0 0 0 0 0 0
32 0 0 0 0 0 0 0 0 0
*** Program elapsed time: 36.520s ( 876.243 blocks/s, 54.765 Mb/s)
|