| ID |
Date |
Author |
Subject |
|
462
|
Wed Jan 10 10:22:41 2024 |
CB, JM | Some FEEs mounted - issues with Det#2 (bottom left) |
Started mounting some FEEs. We ran into some mechanical issues due to the new ERNI connectors on the new flexi-rigid adaptor PCBs. Davide skimmed 6.5 mm off the edge with the groove (the groove is gone). This is suffiicent to support the flexi-rigid and in spite of our earlier concerns, the flexi-rigid can be mated/un-mated with the FEEs without major alignment issues.
We still have issues for the bottom-right detector, where the FEE holder will just not fit - will probably figure something out with Davide.
We observe a peculiar issue with the bottom-left detector. At 150V, the leakage current for this detector as tested with just the adaptor cards on the feedthroughs that carry the bias (no FEEs) is of the order of 3 uA.
We mounted all four flexi-rigid PCBs - still 3 uA.
We mounted the FEE that slots into the bottom-most feedthrough (which corresponds to the n-n bias). Still 3 uA.
We mounted the FEE that slots in to the second bottom feedthrough (not corresponding to bias). 15 uA! Upon lowerint the bias, the leakage current goes to zero around 30V as opposed to 0V like all the other detectors, and like this detector when this particular FEE is not mounted.
Tests were performed exchanging all PCBs, and all FEEs. The same behaviour is observed. It is not an issue with the FEE or the PCB. We suspect some cross-contact between detector bias and some strip that feeds into the second FEE? In any case, it is most likely a vacuum side issue - nothing we can do now.
The detector can be biased to 80V or so without major issue, and it appears this behaviour improves over time, i.e. leaving the bias on reduces the leakage current dramatically so it may even be possible to reach 150V.
See plots attached. Note in 2nd plot the plotting script has some issues - detector names are correct until the bias in Ch#2 is brough to 150V, then the colours are incorrect. Only Ch#2 was being changed. Note the drop in leakage current by a factor 2 just increasing the bias to 150V for a few seconds and returning down. |
| Attachment 1: Screenshot_2024-01-10_11-59-39.png
|

|
| Attachment 2: Screenshot_2024-01-10_12-56-36.png
|

|
|
236
|
Tue Feb 22 12:23:23 2022 |
CB | Slow comparator thresholds lowered - test run |
13:20 Stopped run.
Slow comp thresh 0x64 -> 0x32 on all FEEs
Checkload x2
New run - R55
Restarted Data Spy code
Zerod histograms
Data rate acceptable.
Dead channels seem to come back online
Please check for deadtime/idle time once we collect enough stats. |
|
407
|
Thu Jun 22 18:58:02 2023 |
JM, TD | Slide back onto ring |
The wire seal has been tightend further to 160 Nm. Open neg feed-through flange has also been fully tightend.
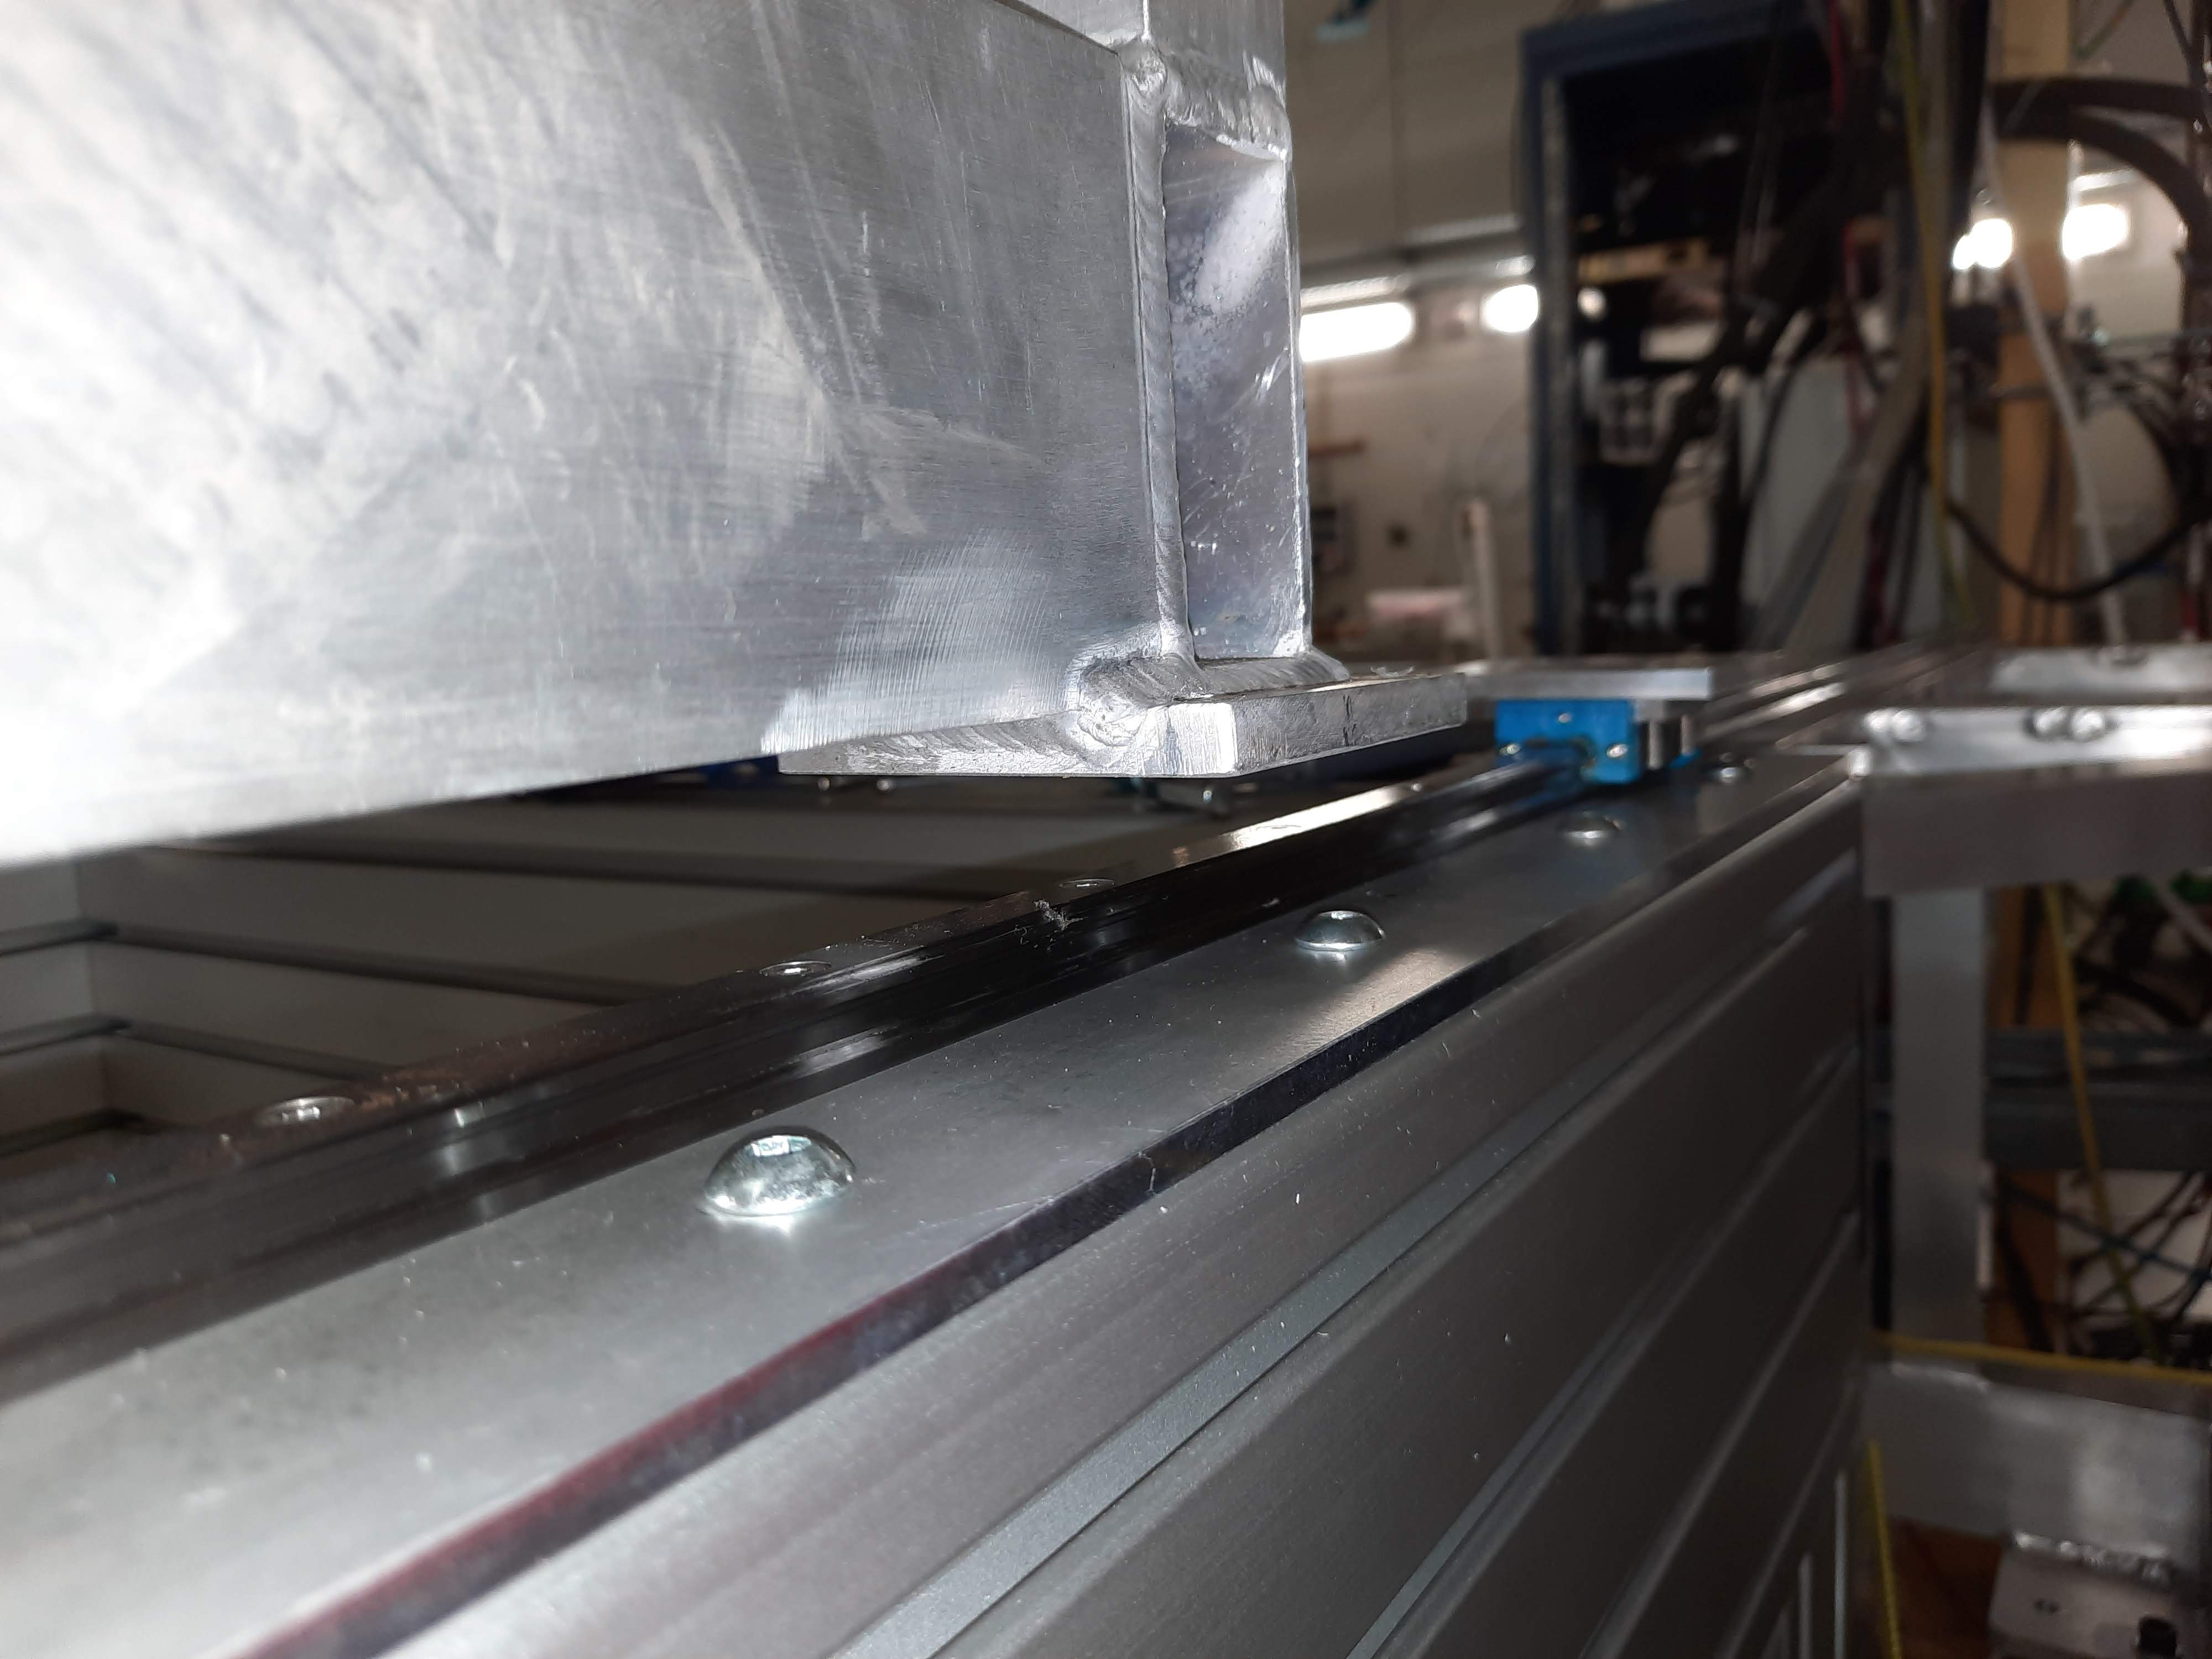
The CARME chamber was then slid back onto the aluminium frame on the ring. Two carriages were damaged during the sliding process, which have now been replaced. Carriages were replaced by lifting one end of the upper frame section using the crane by only ~1mm. This was sufficient to slide out the broken carriage and replace it (see images to be uploaded).. It appears there is some deformation in the rails on the temporary frame as CARME is slid across, which resulted in the damaged carriages -> further refinements are required for future slidings. The height of the chamber has been checked using the laser allignment.
The turbo pump has also been mounted to the top of the chamber . Current plan is to close to the interaction chamber tomorrow and begin pumping. |
| Attachment 1: 20230622_112534.jpg
|
|
| Attachment 2: 20230622_112827.jpg
|

|
| Attachment 3: 20230622_120307.jpg
|

|
|
64
|
Wed Sep 8 17:03:07 2021 |
CB RSS + OG NB | Six feedthrough flanges mounted |
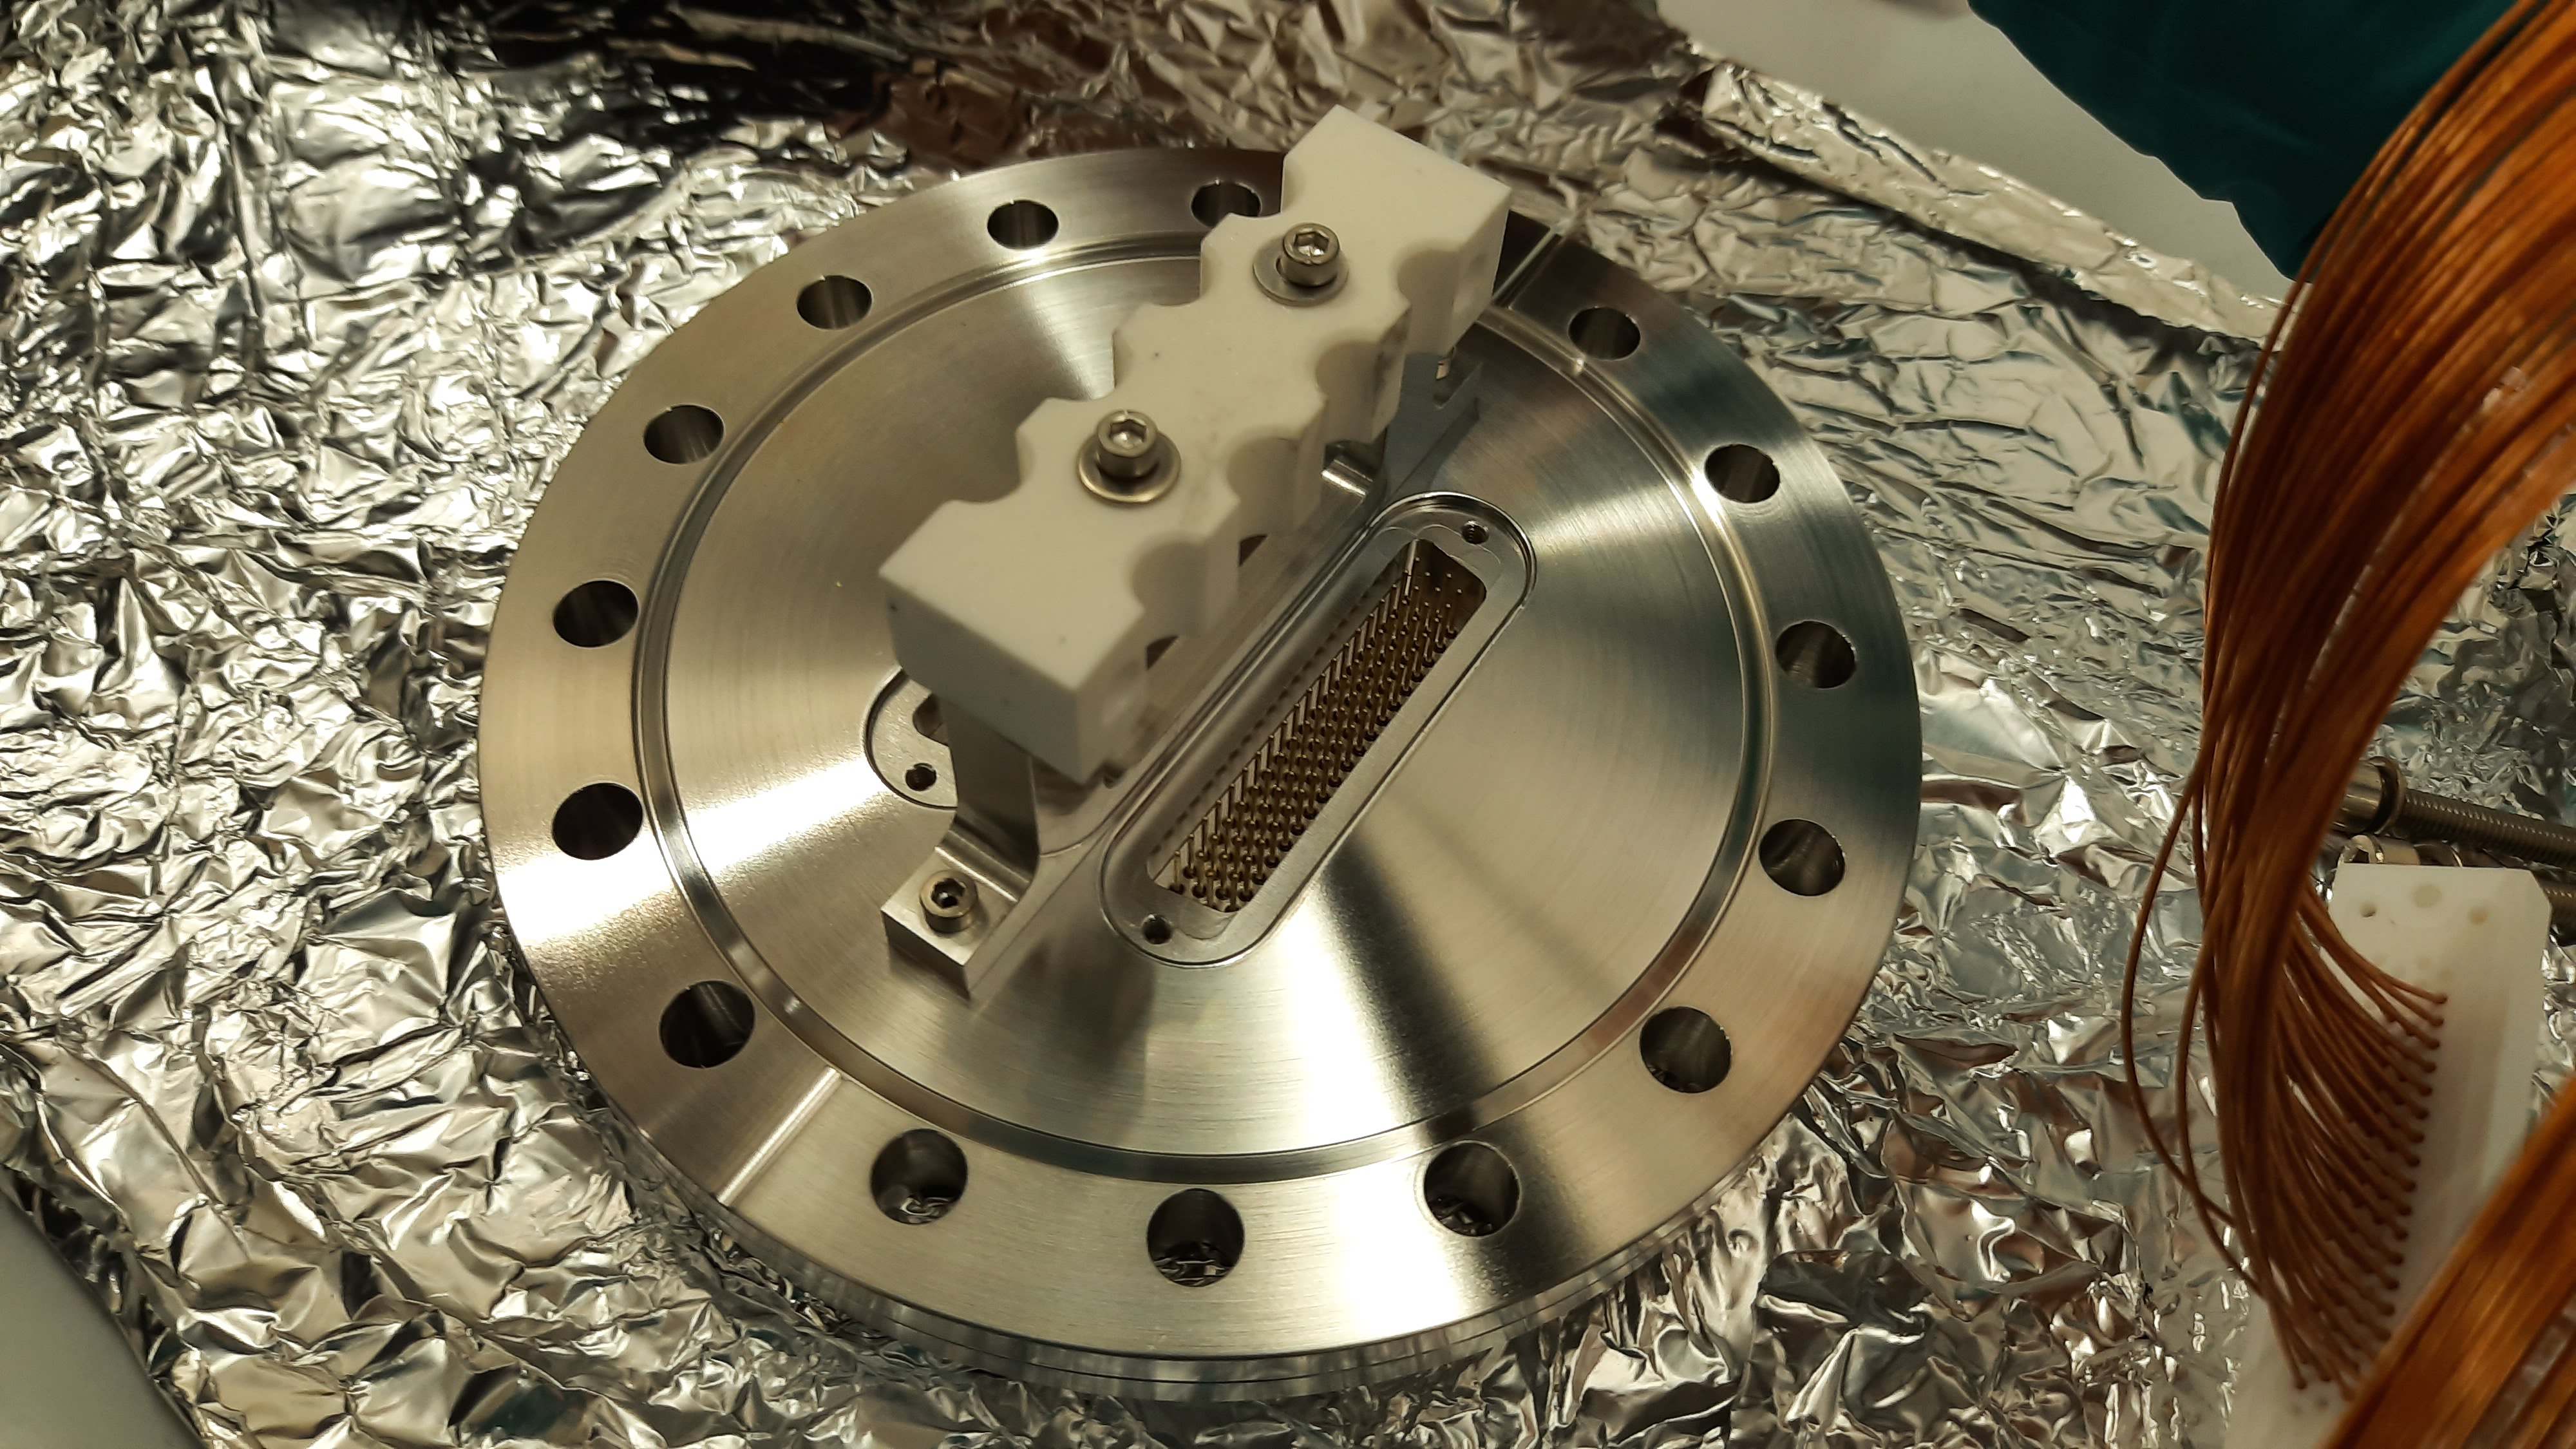
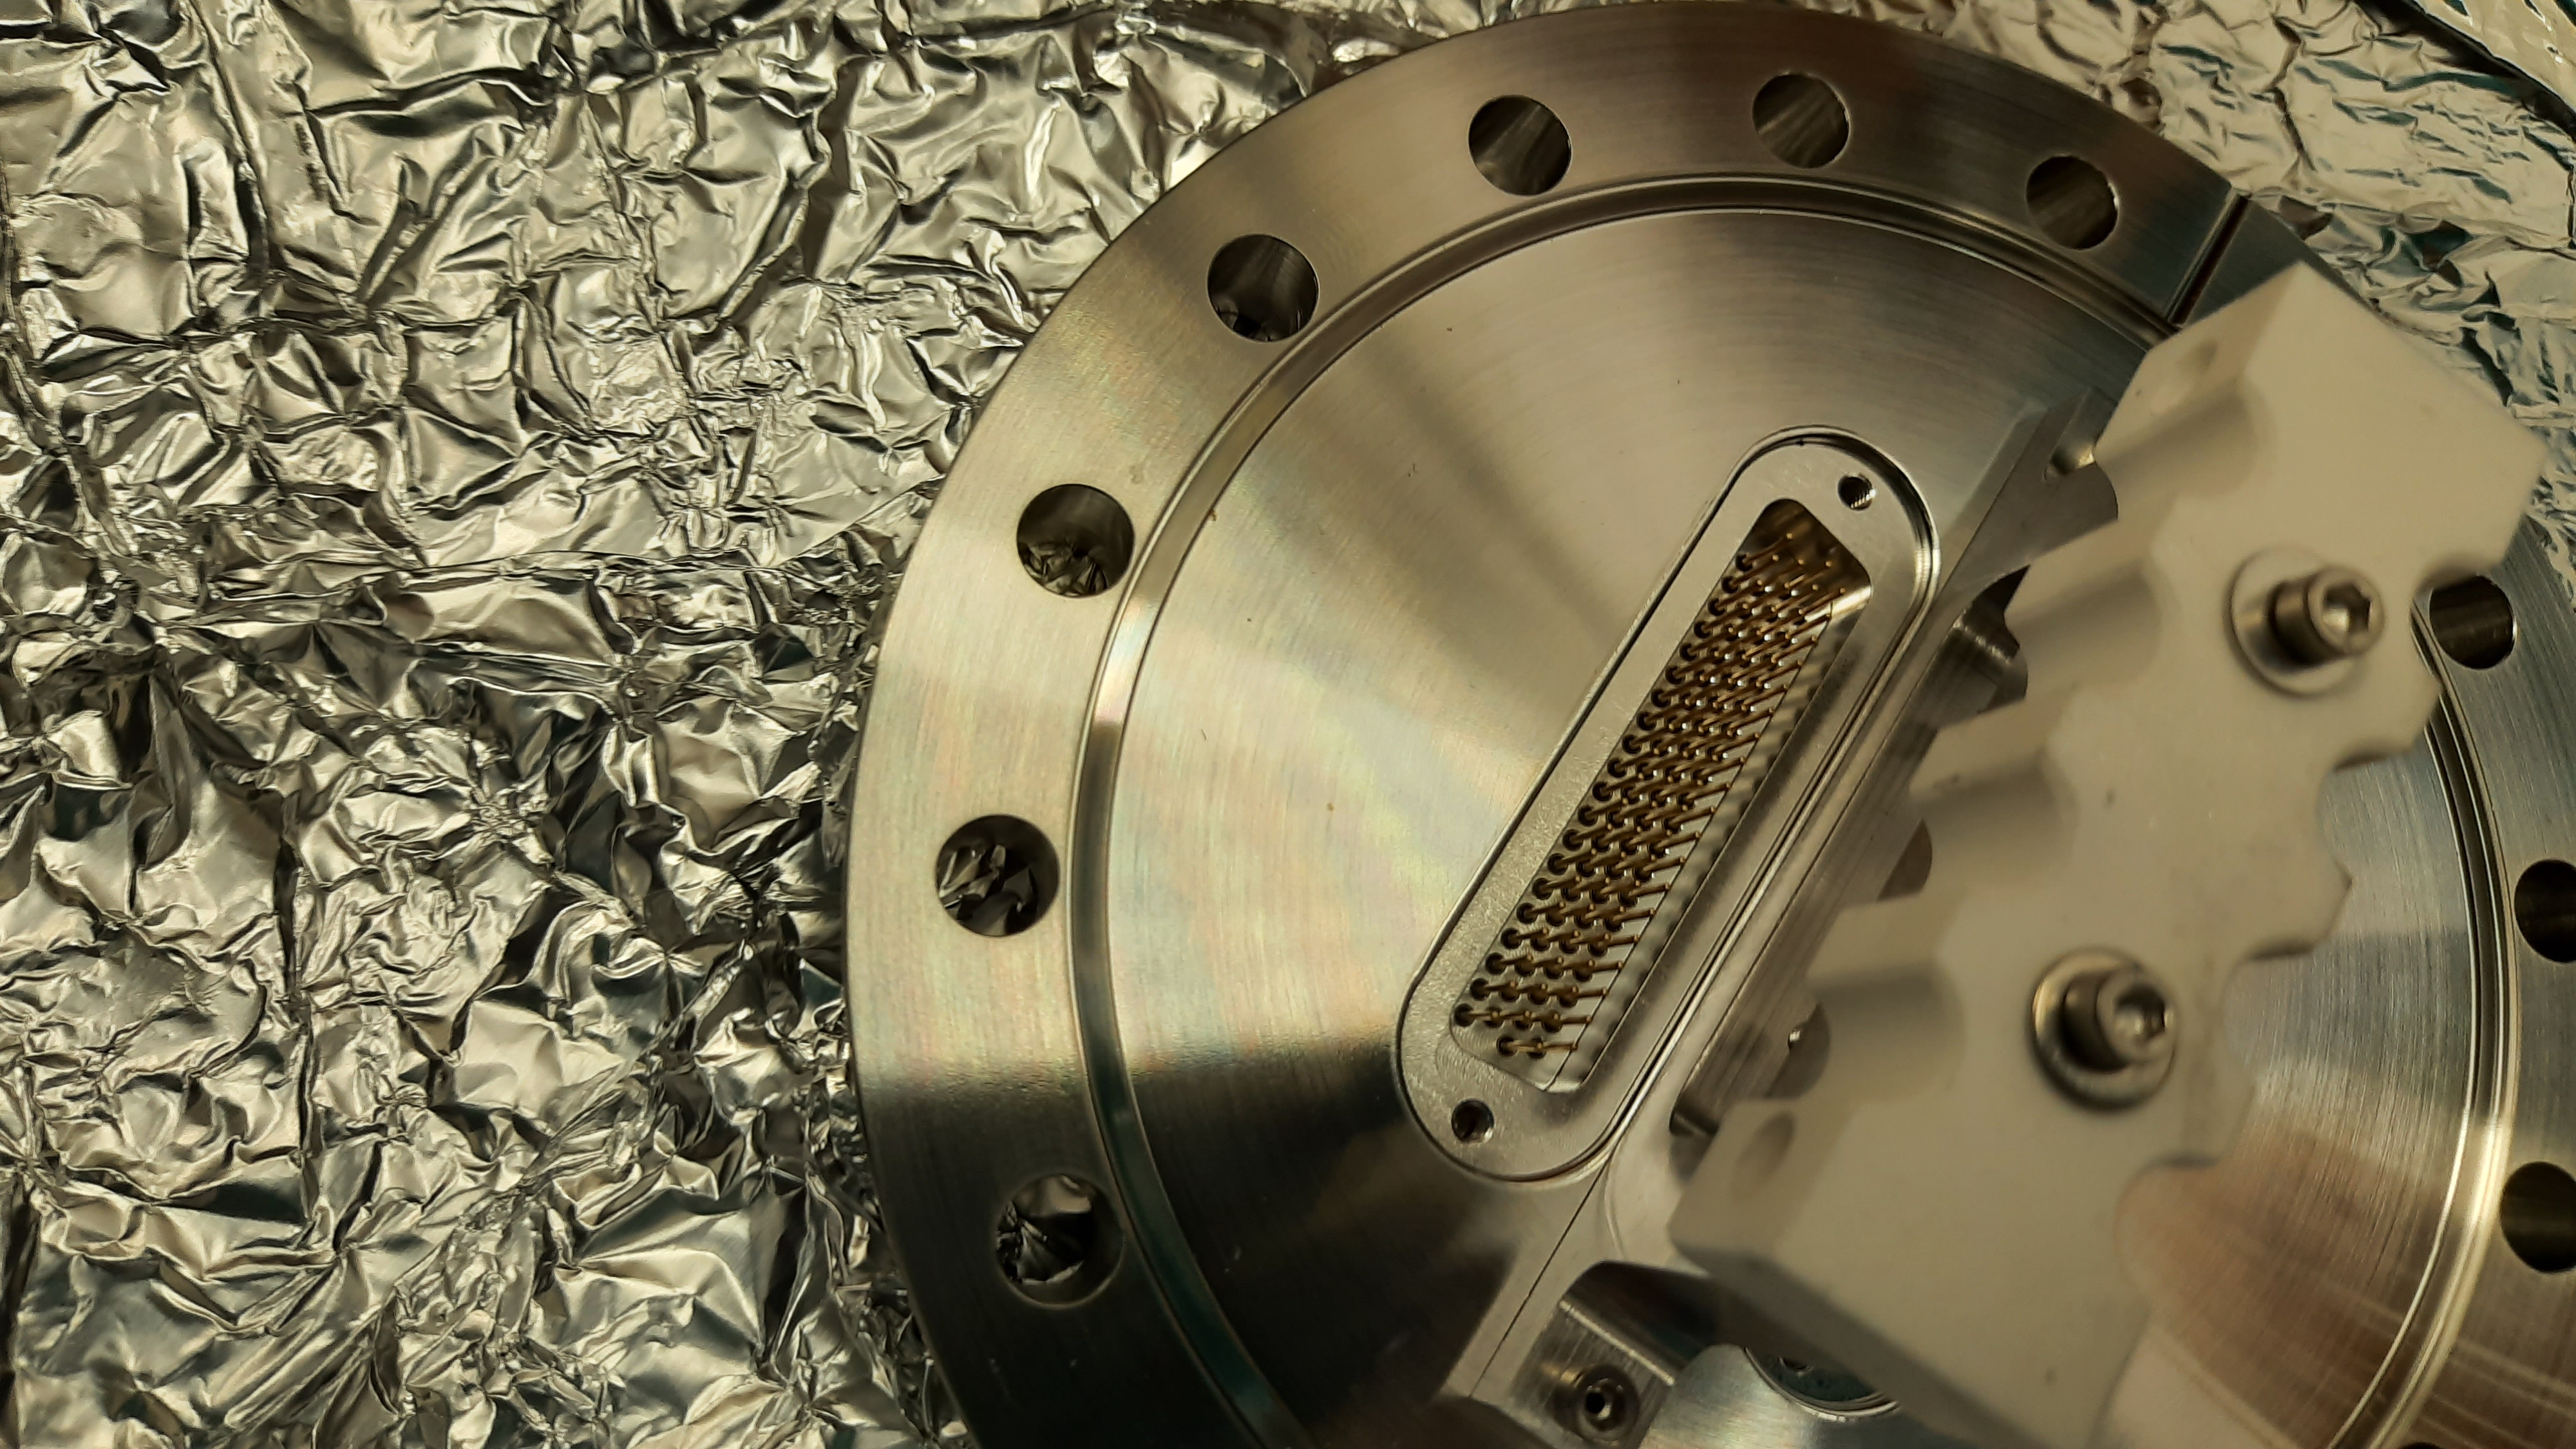
Continued to mount flanges as per previous ELOG entry.
Peter also remarked that the wires look a bit loose inside the holes, although this is how they were during
dirty tests in Edinburgh.

Attempted to pack the wires in two holes rather than 4 - too tight. Cannot close.
Packed the wires in 3 holes instead. Better, but still a bit loose. Wire harness feels quite robust and no
obvious strain is placed on the connectors.

#1 flange left with four strands for now.
Connectors were tested in this way in Edinburgh for motion tests. No broken cables after several thousand
repetitions.

Had troubles with second flange being mounted. Glove was caught under MACOR connector. Managed to free it
somehow with a cleaned screwdriver. Other half of the flange refused to go in due to bent pins, until NB was
able to repair it.
Mounted as #5.

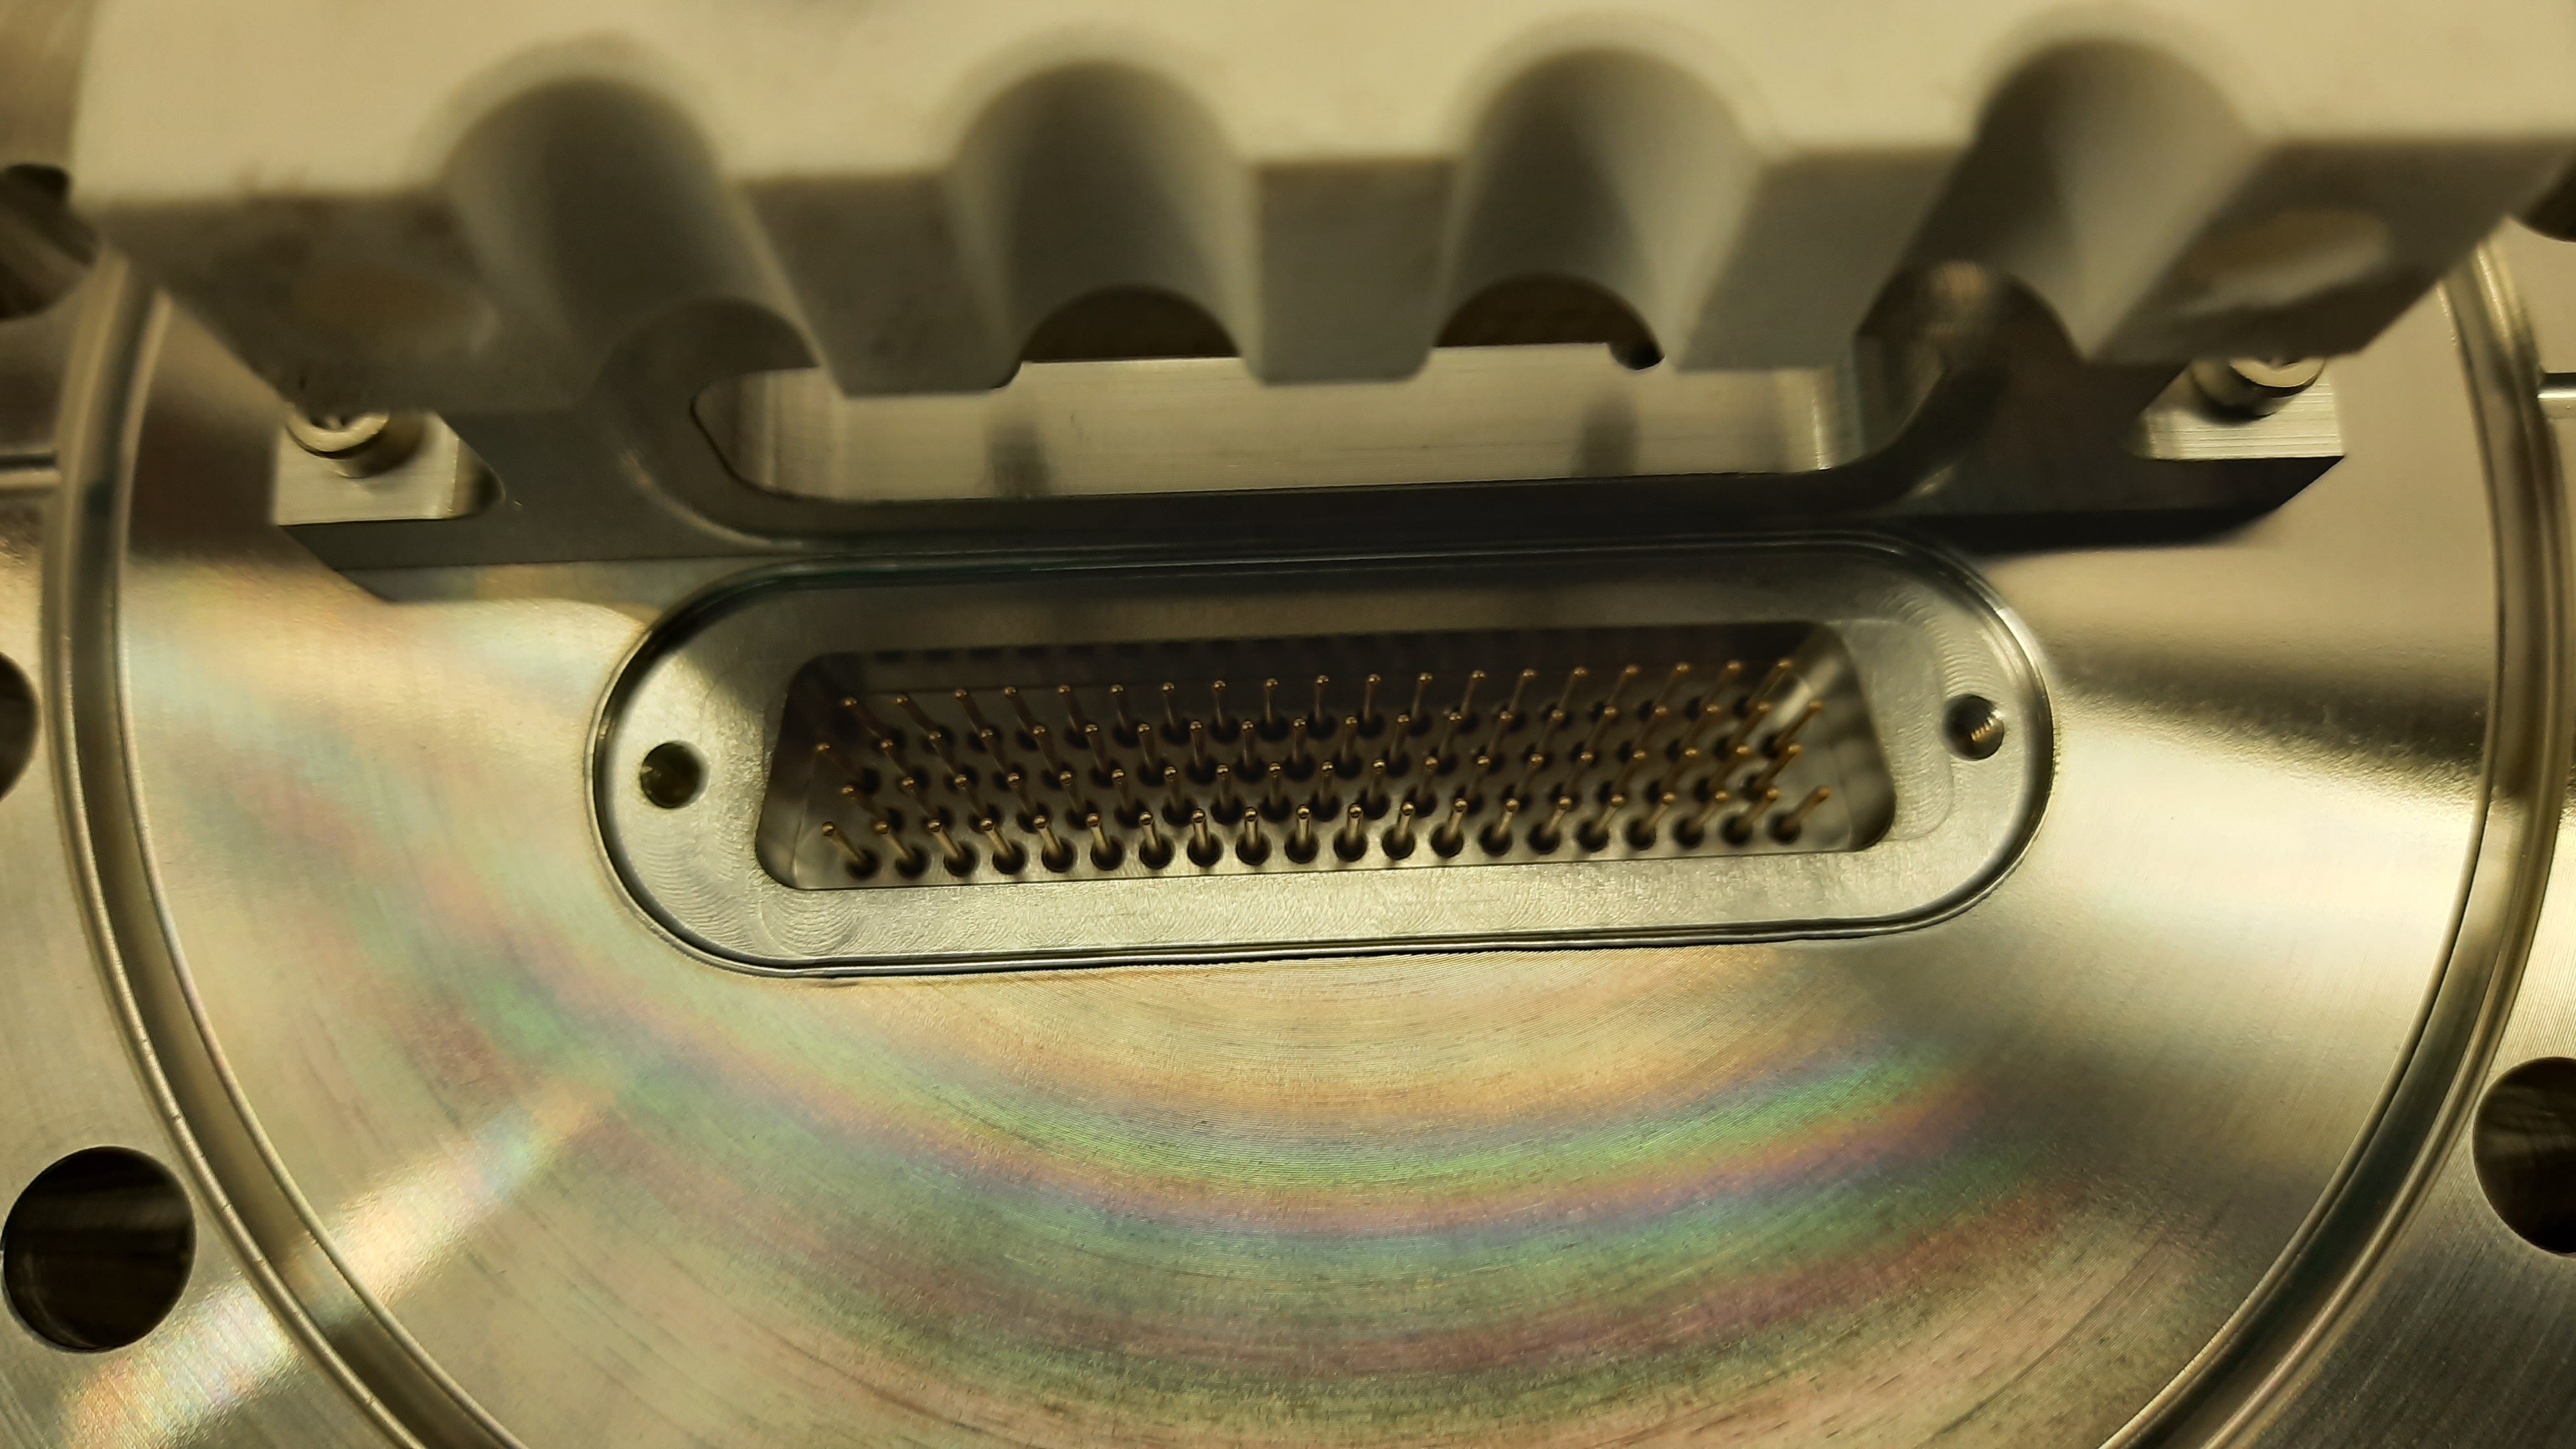
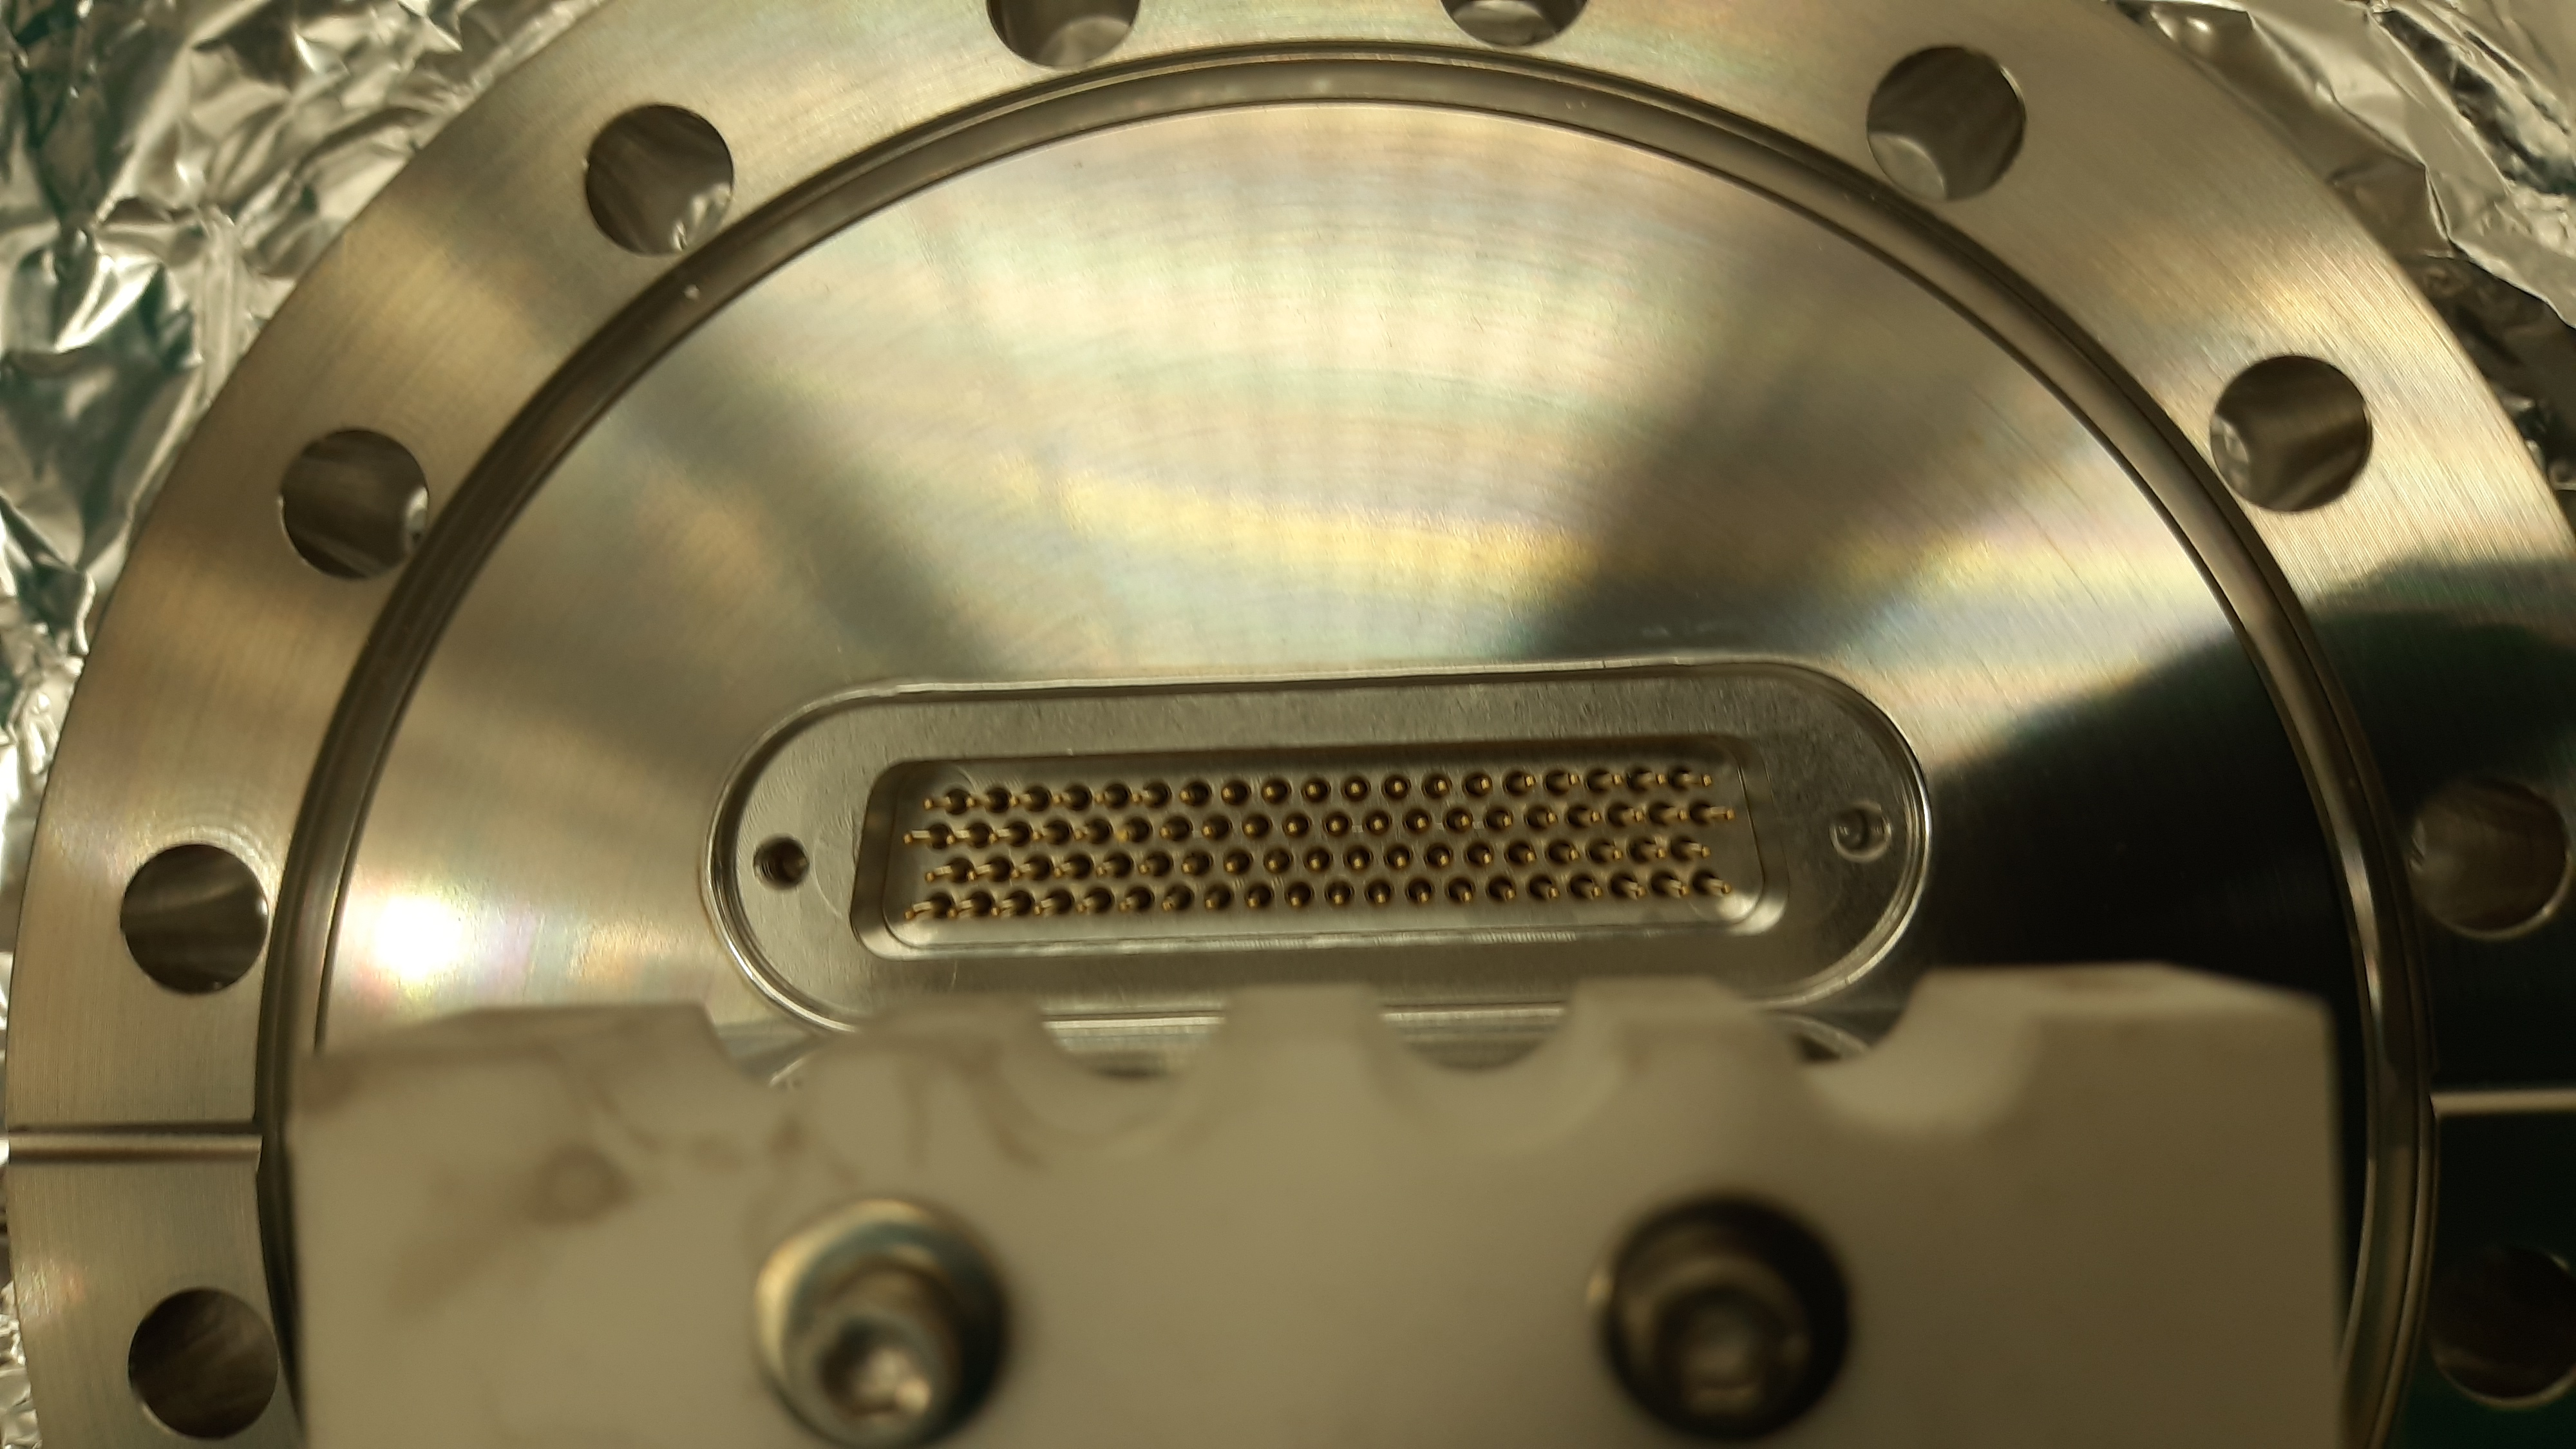
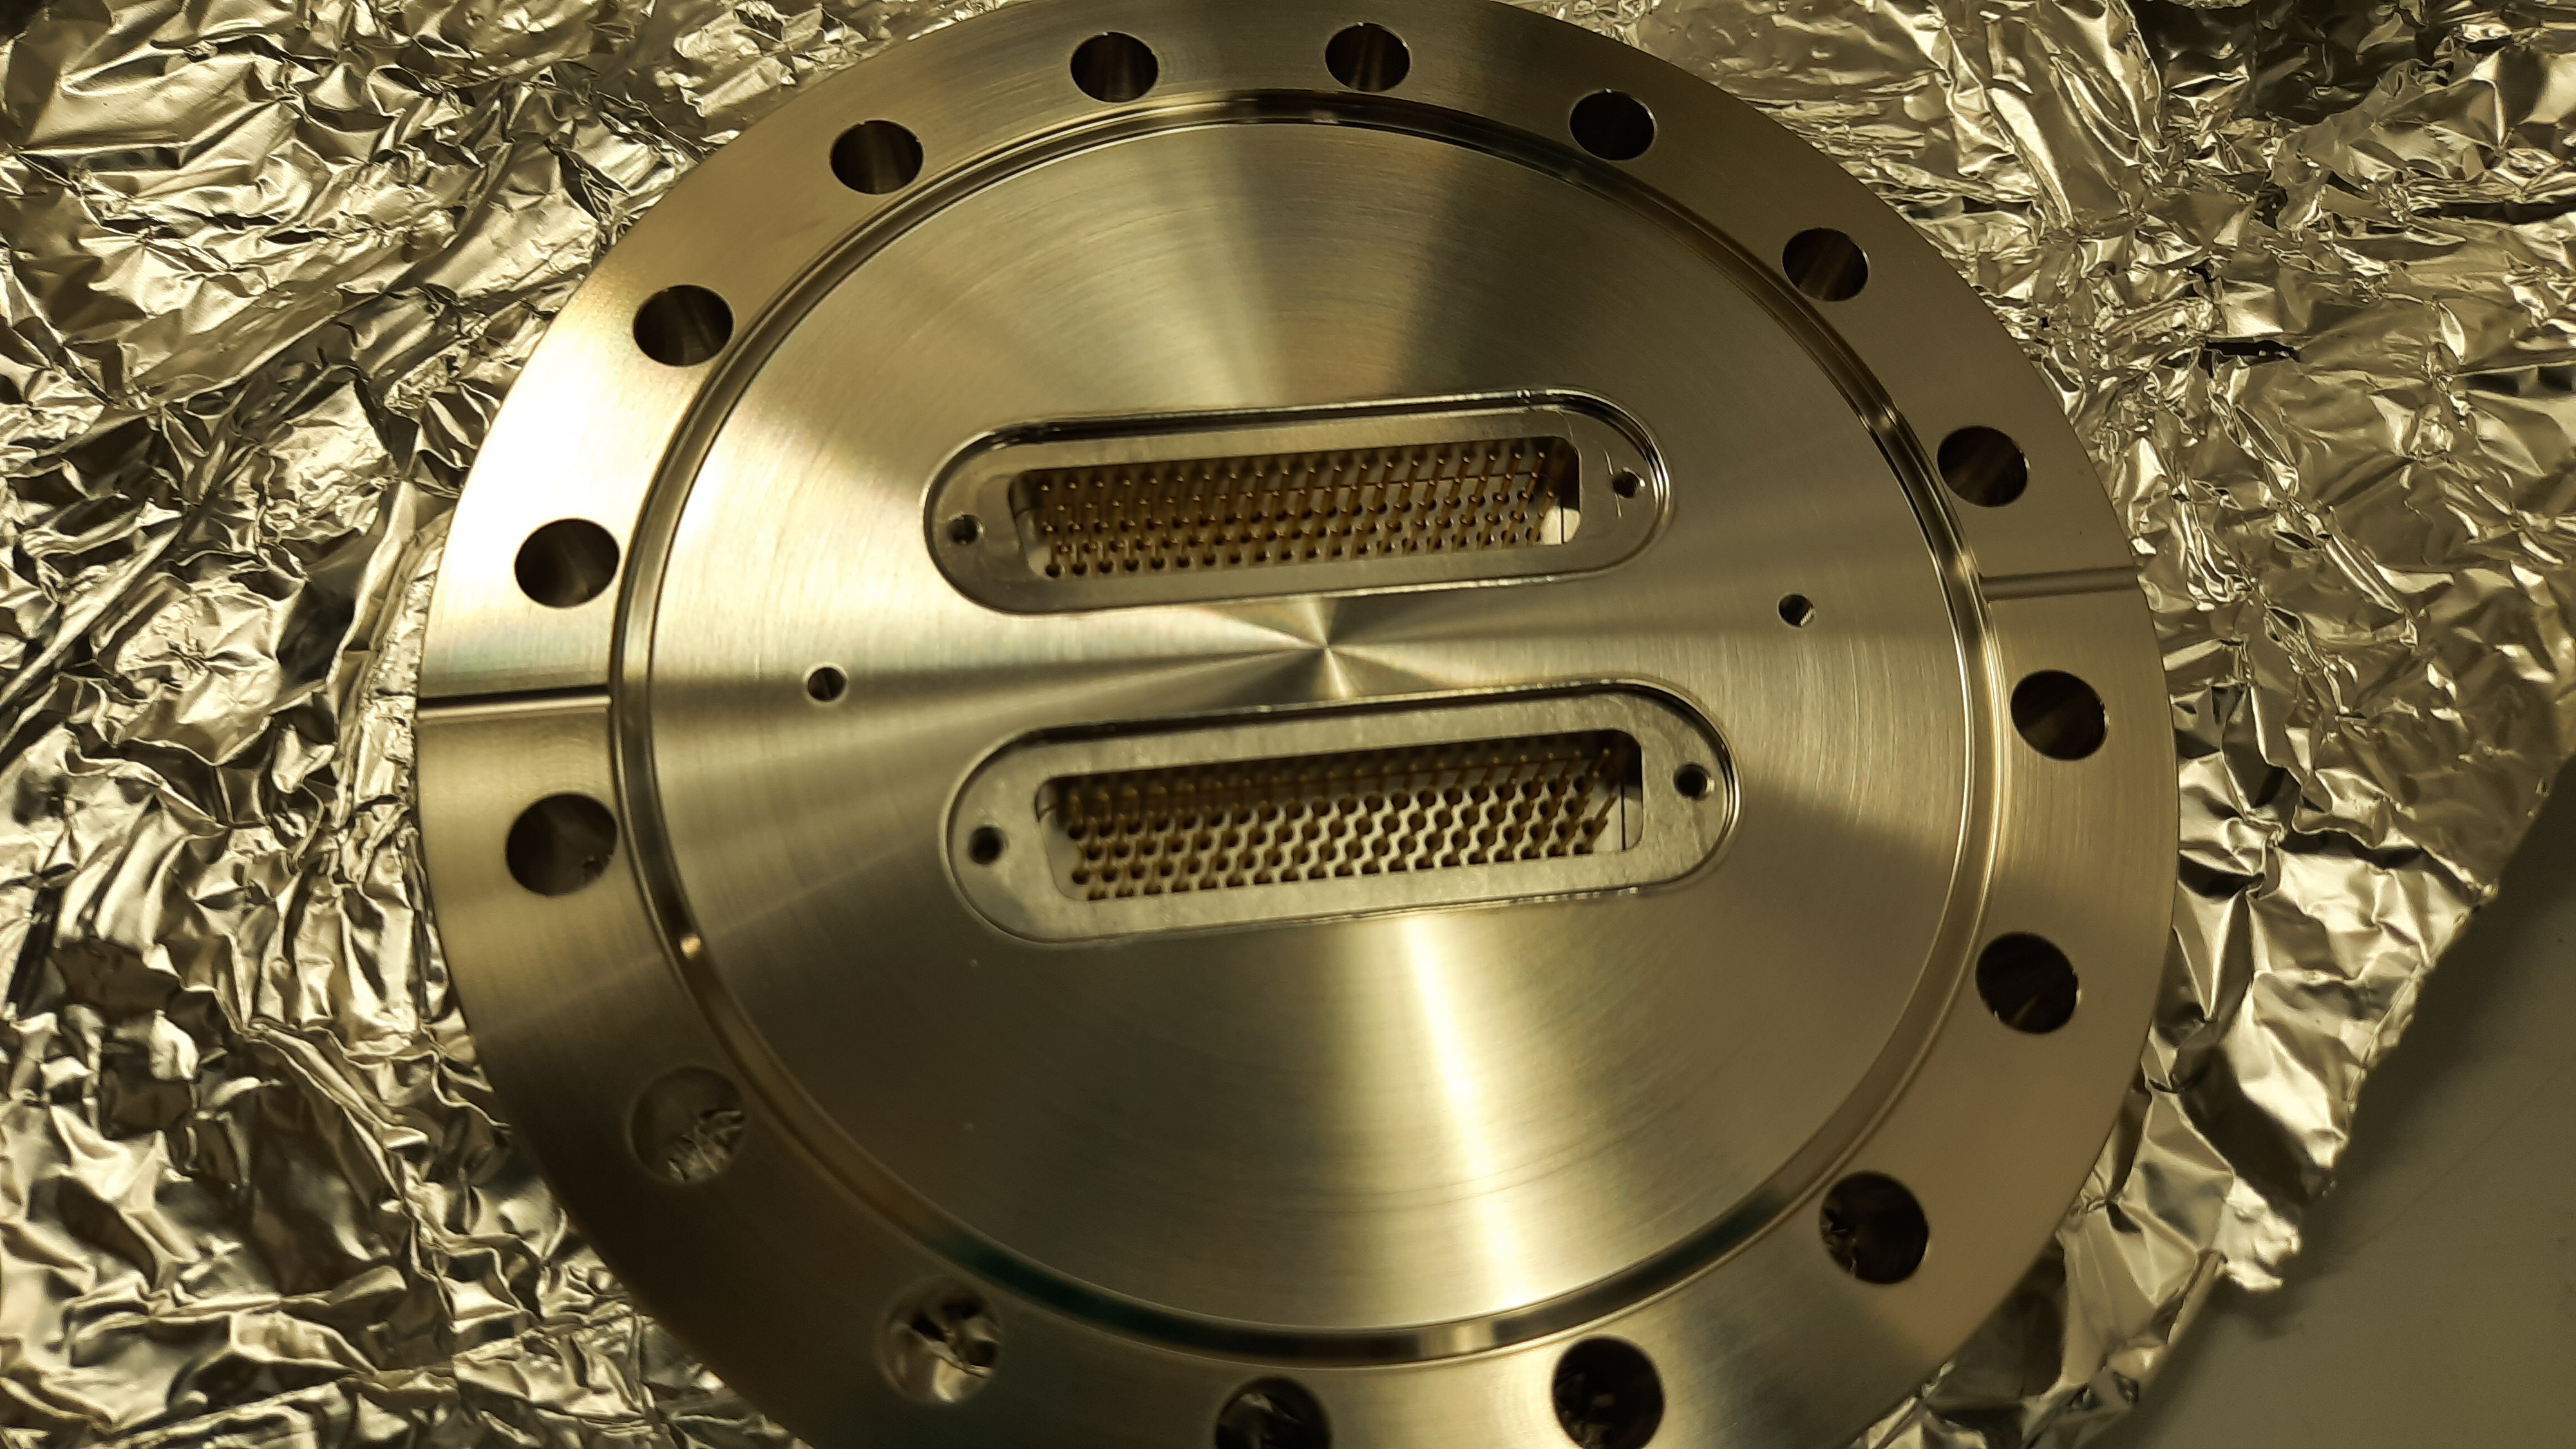
Most other connector pins OK. Had to adjust a very small number. Cause of damage unclear - transportation? See
photos.

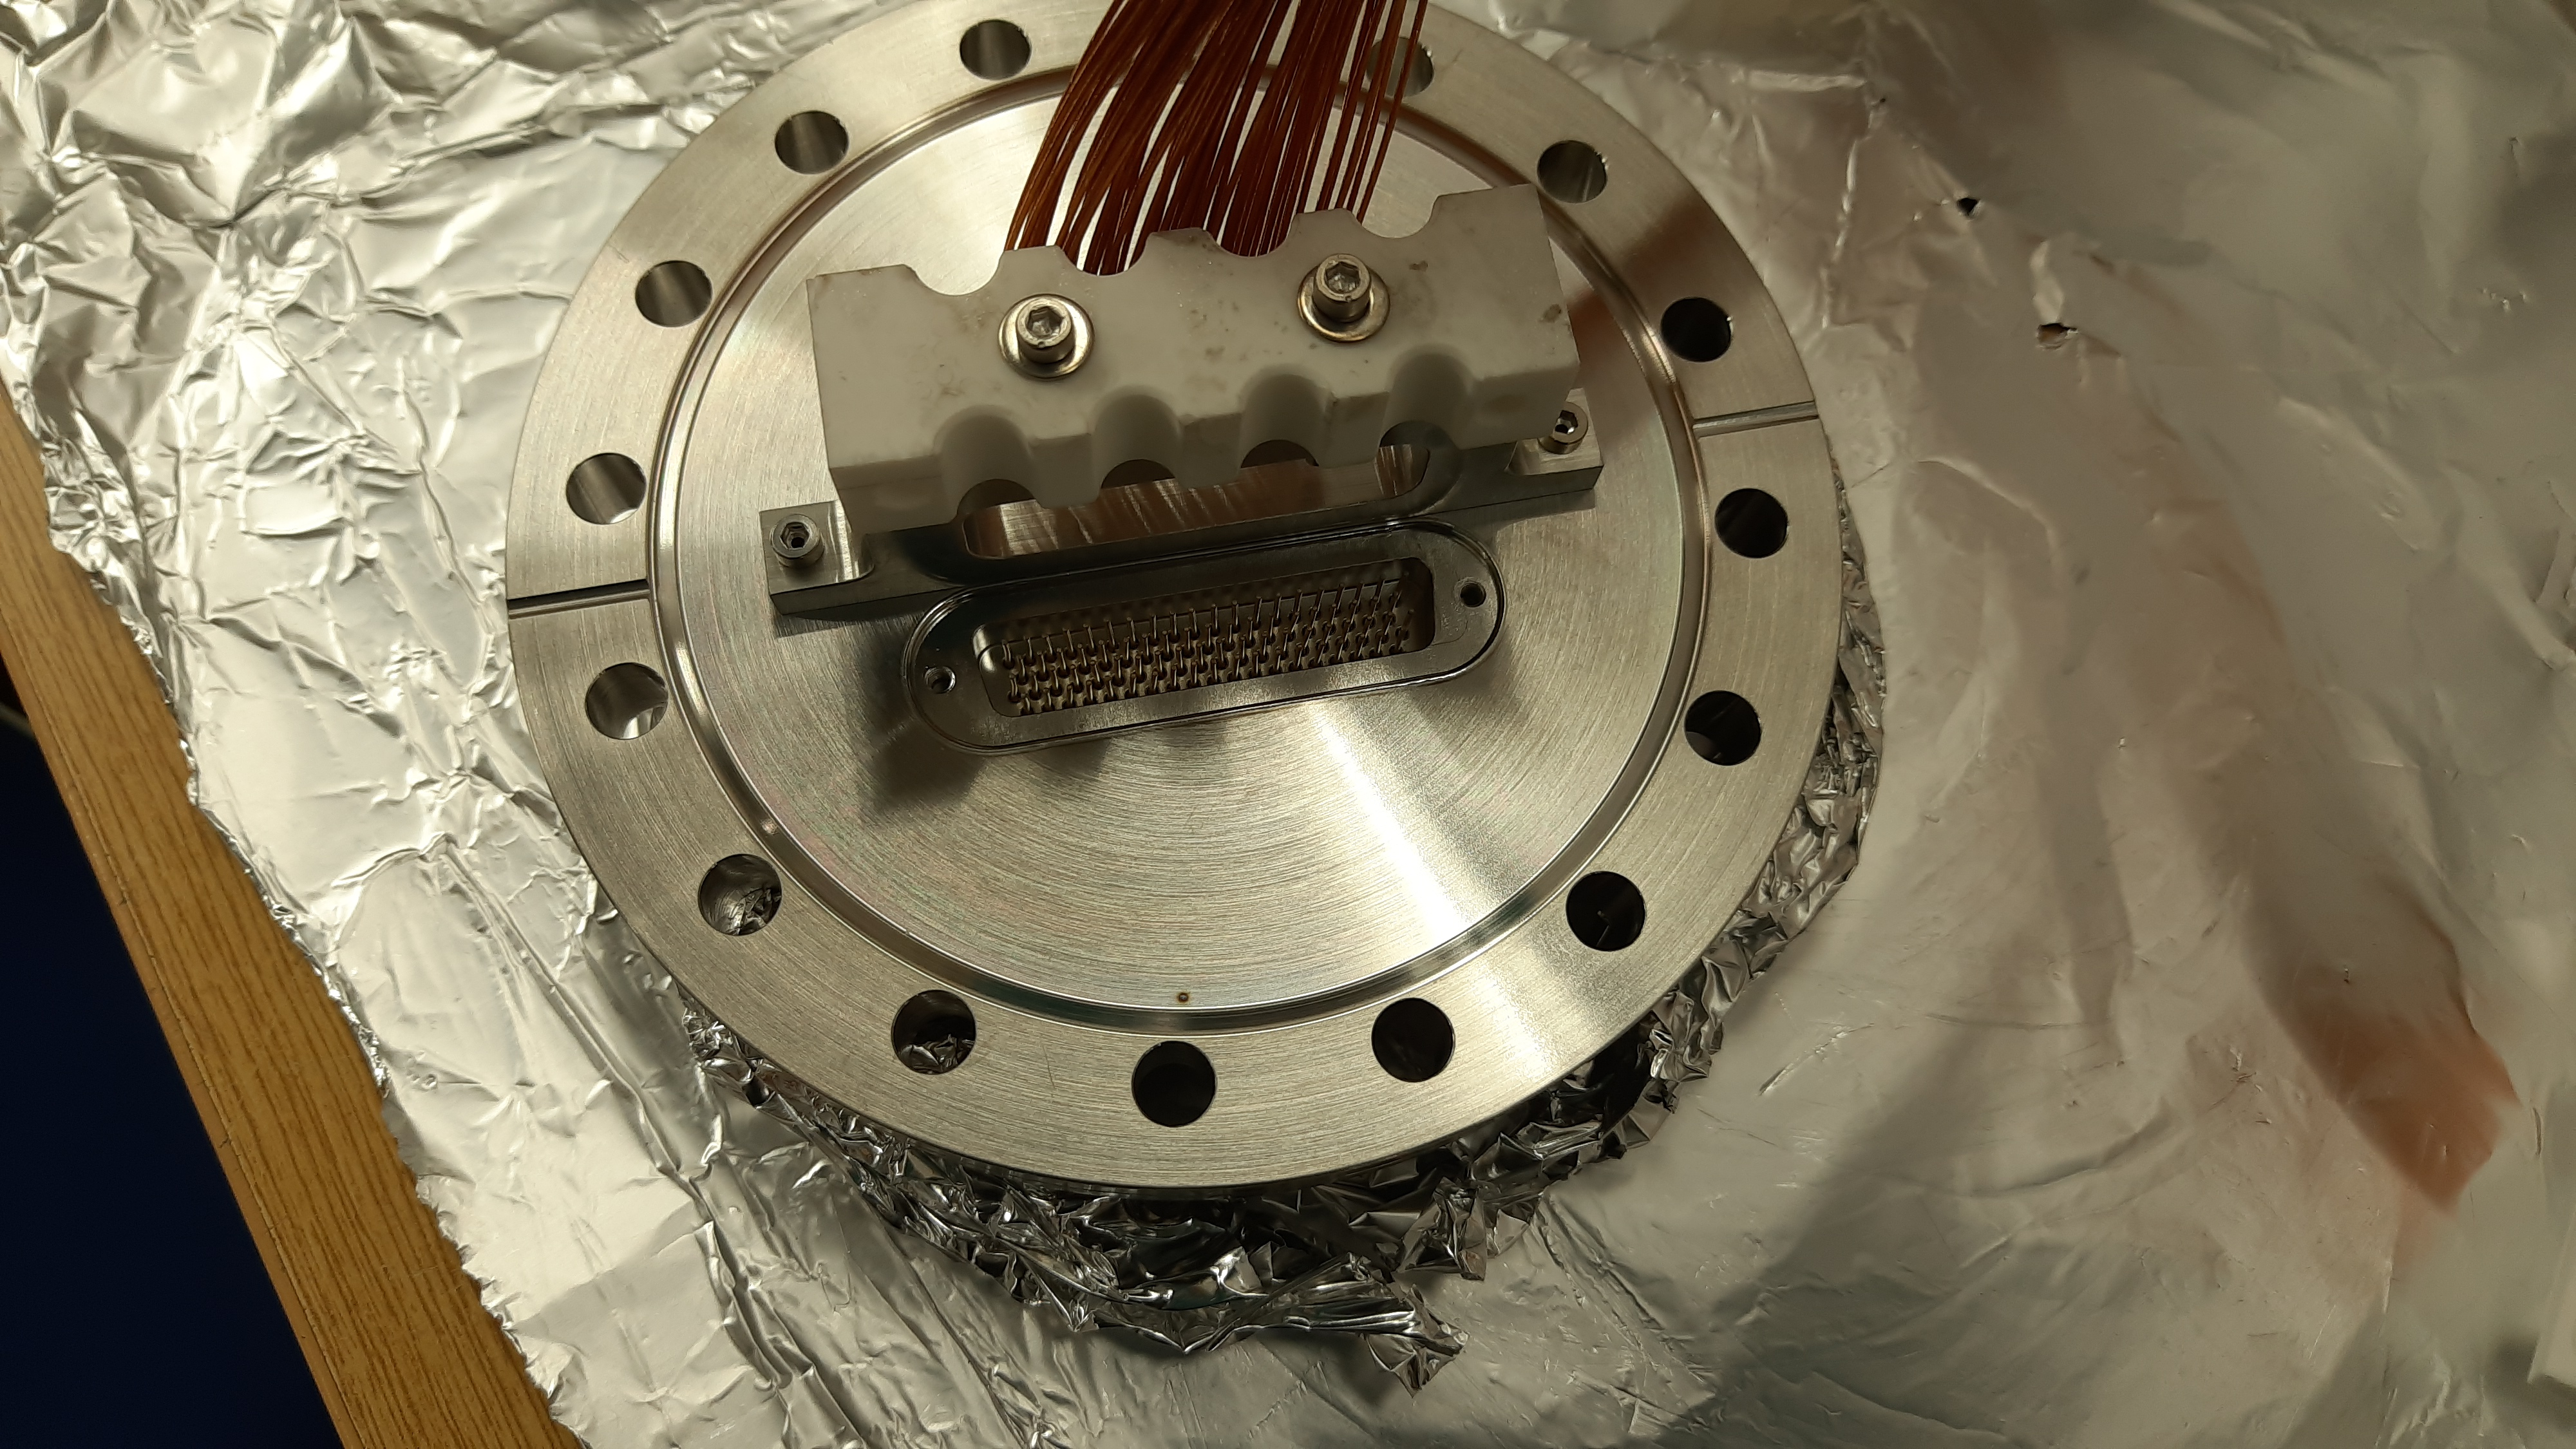
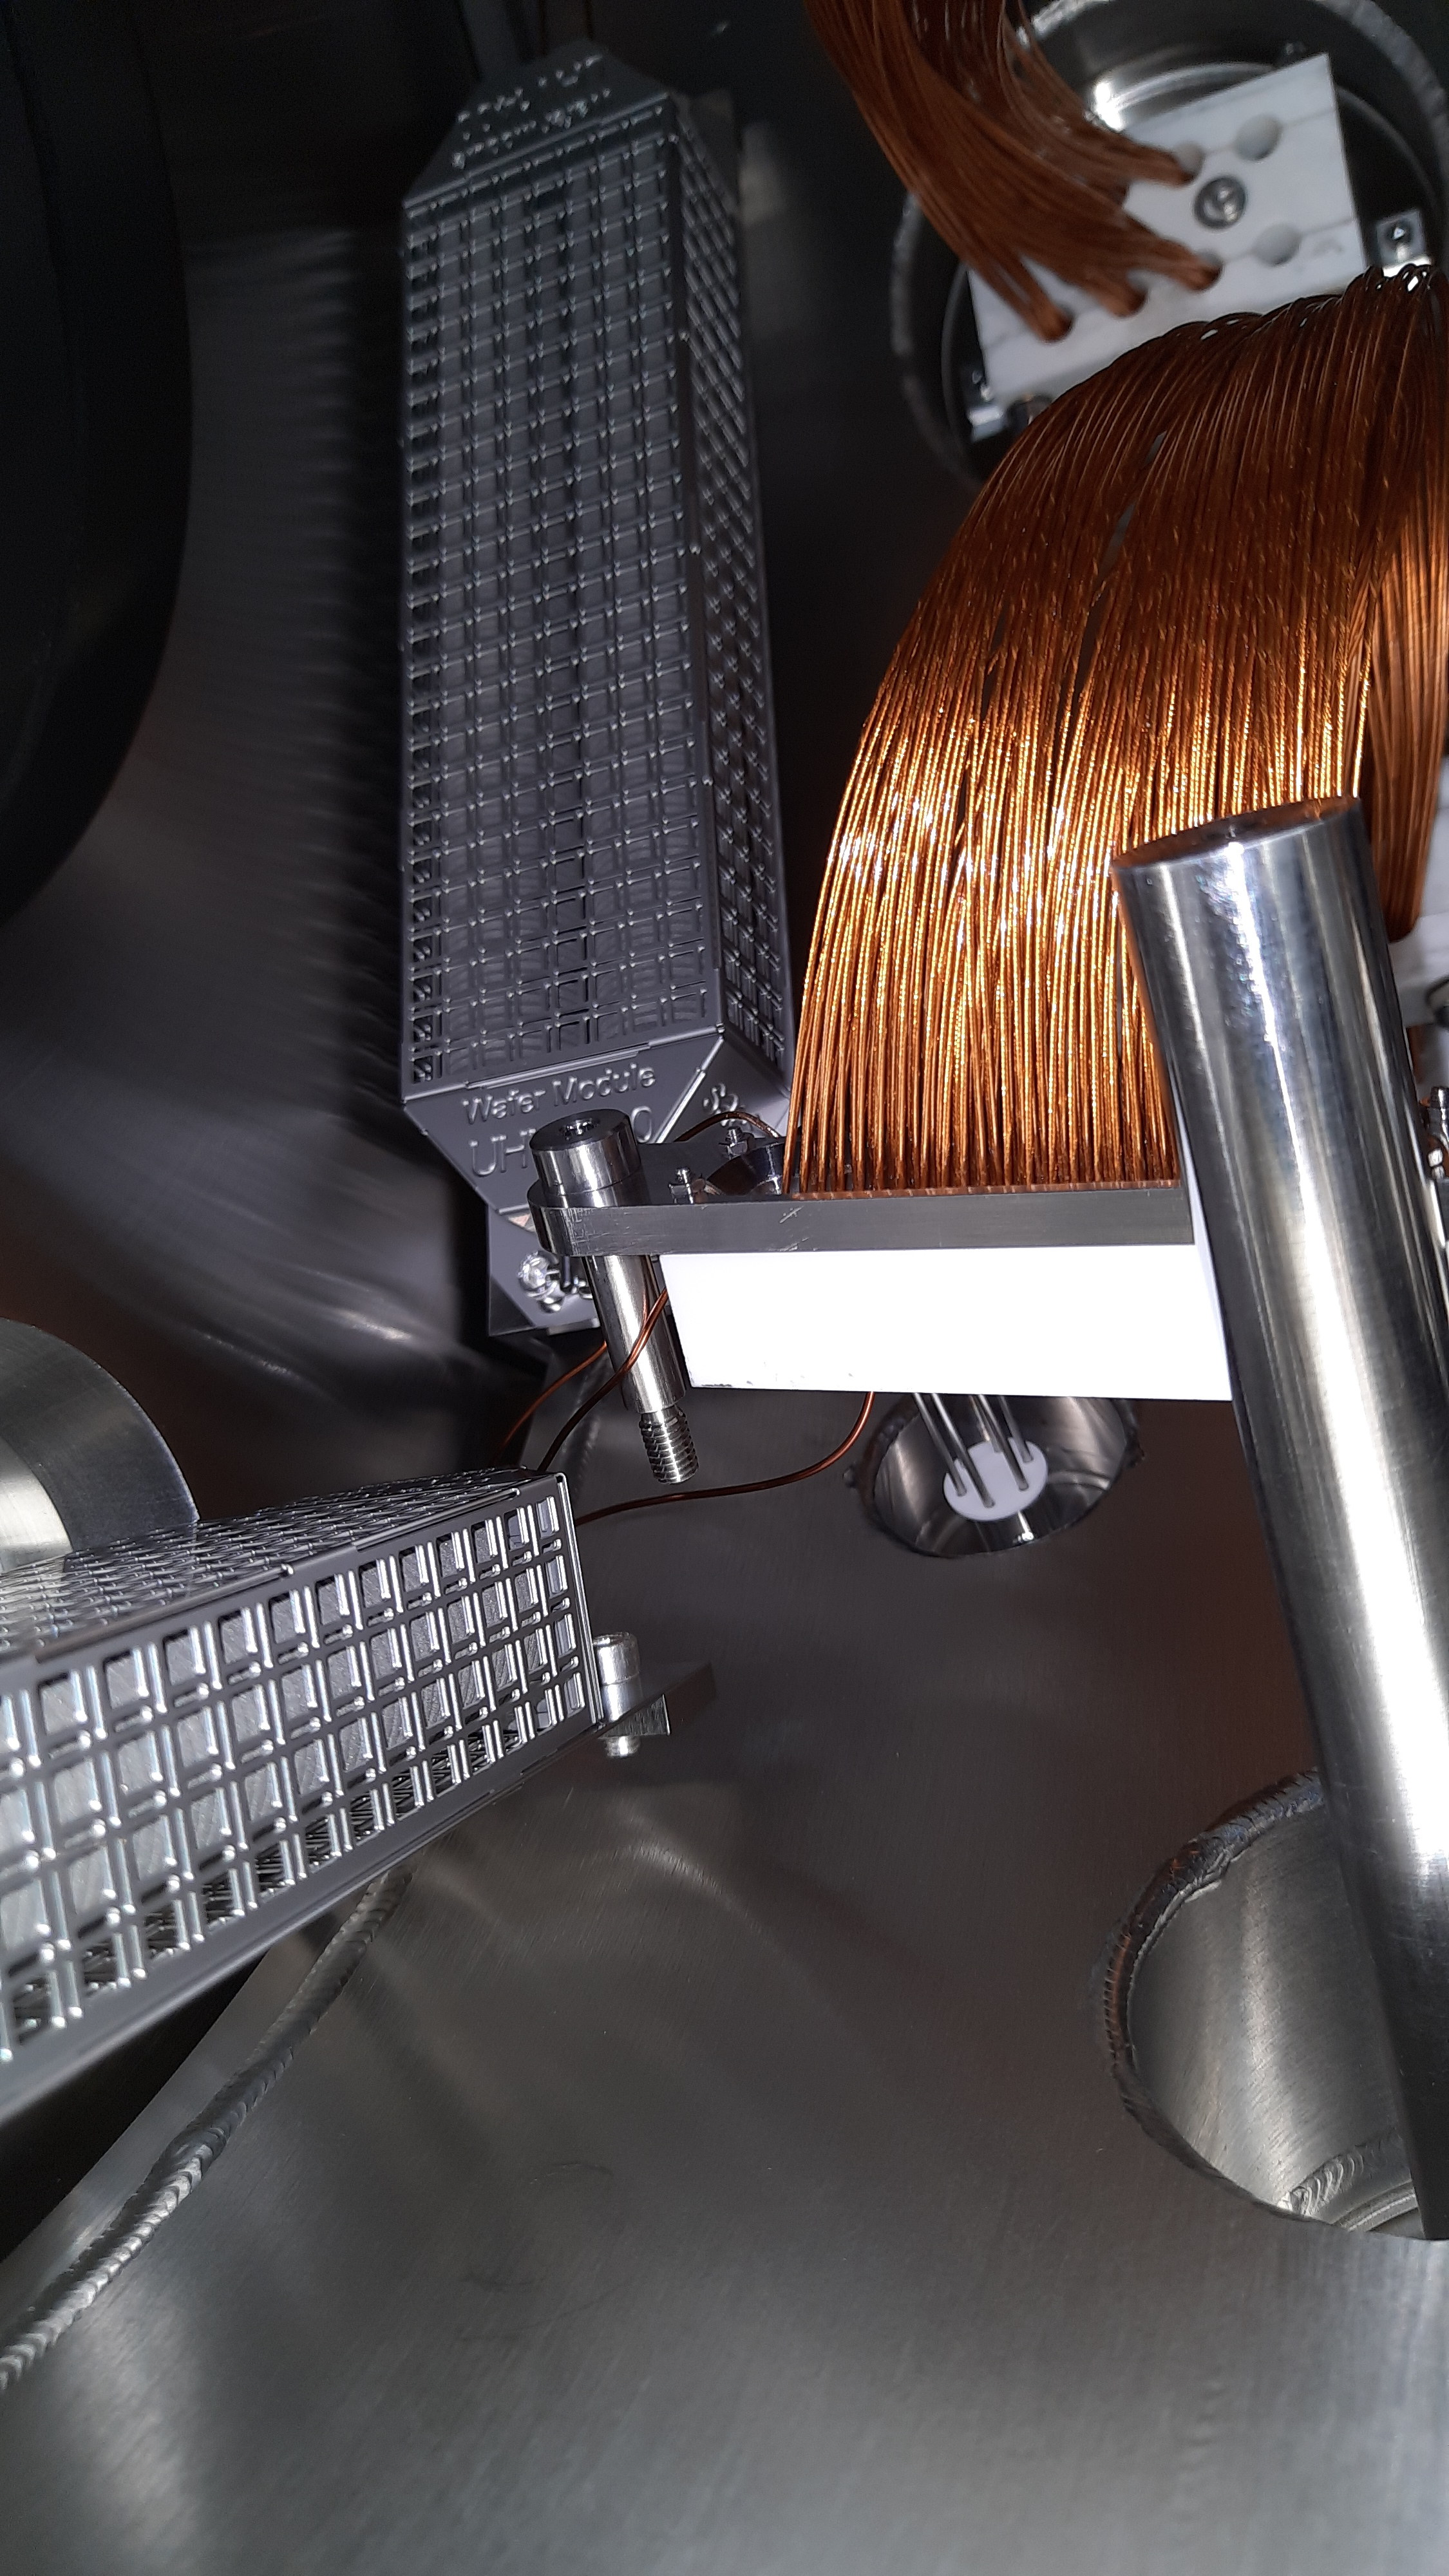
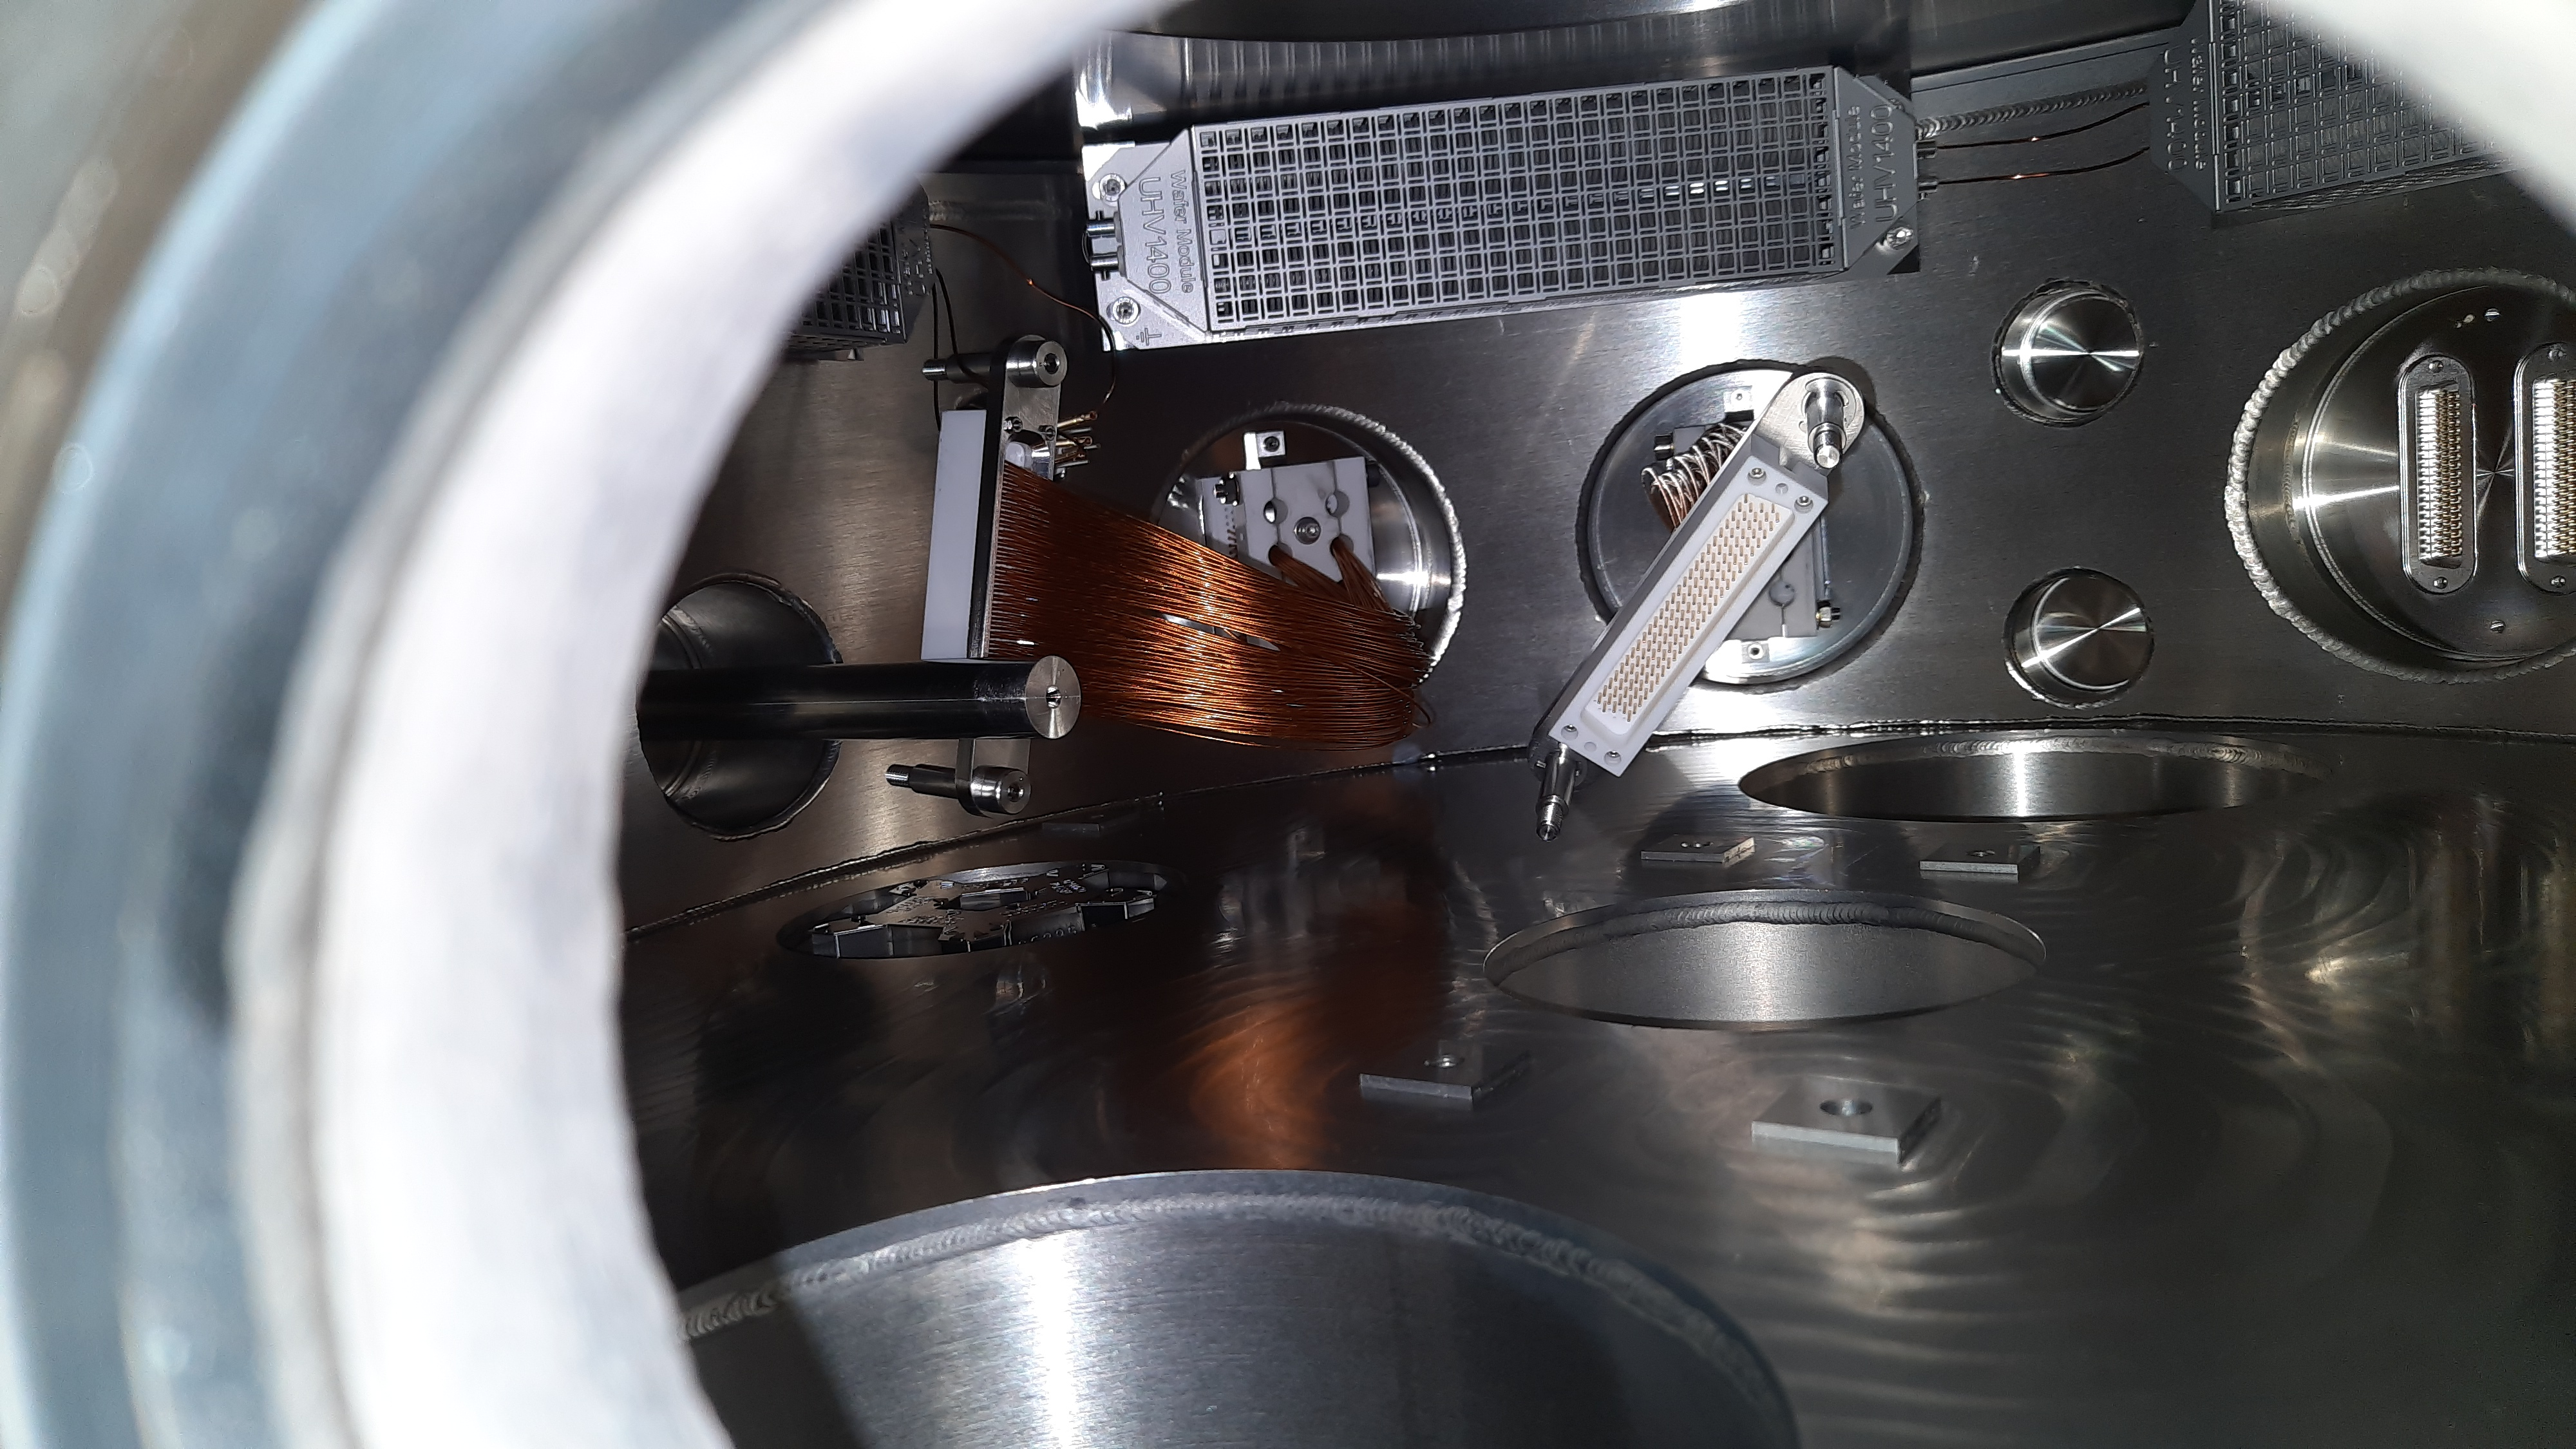
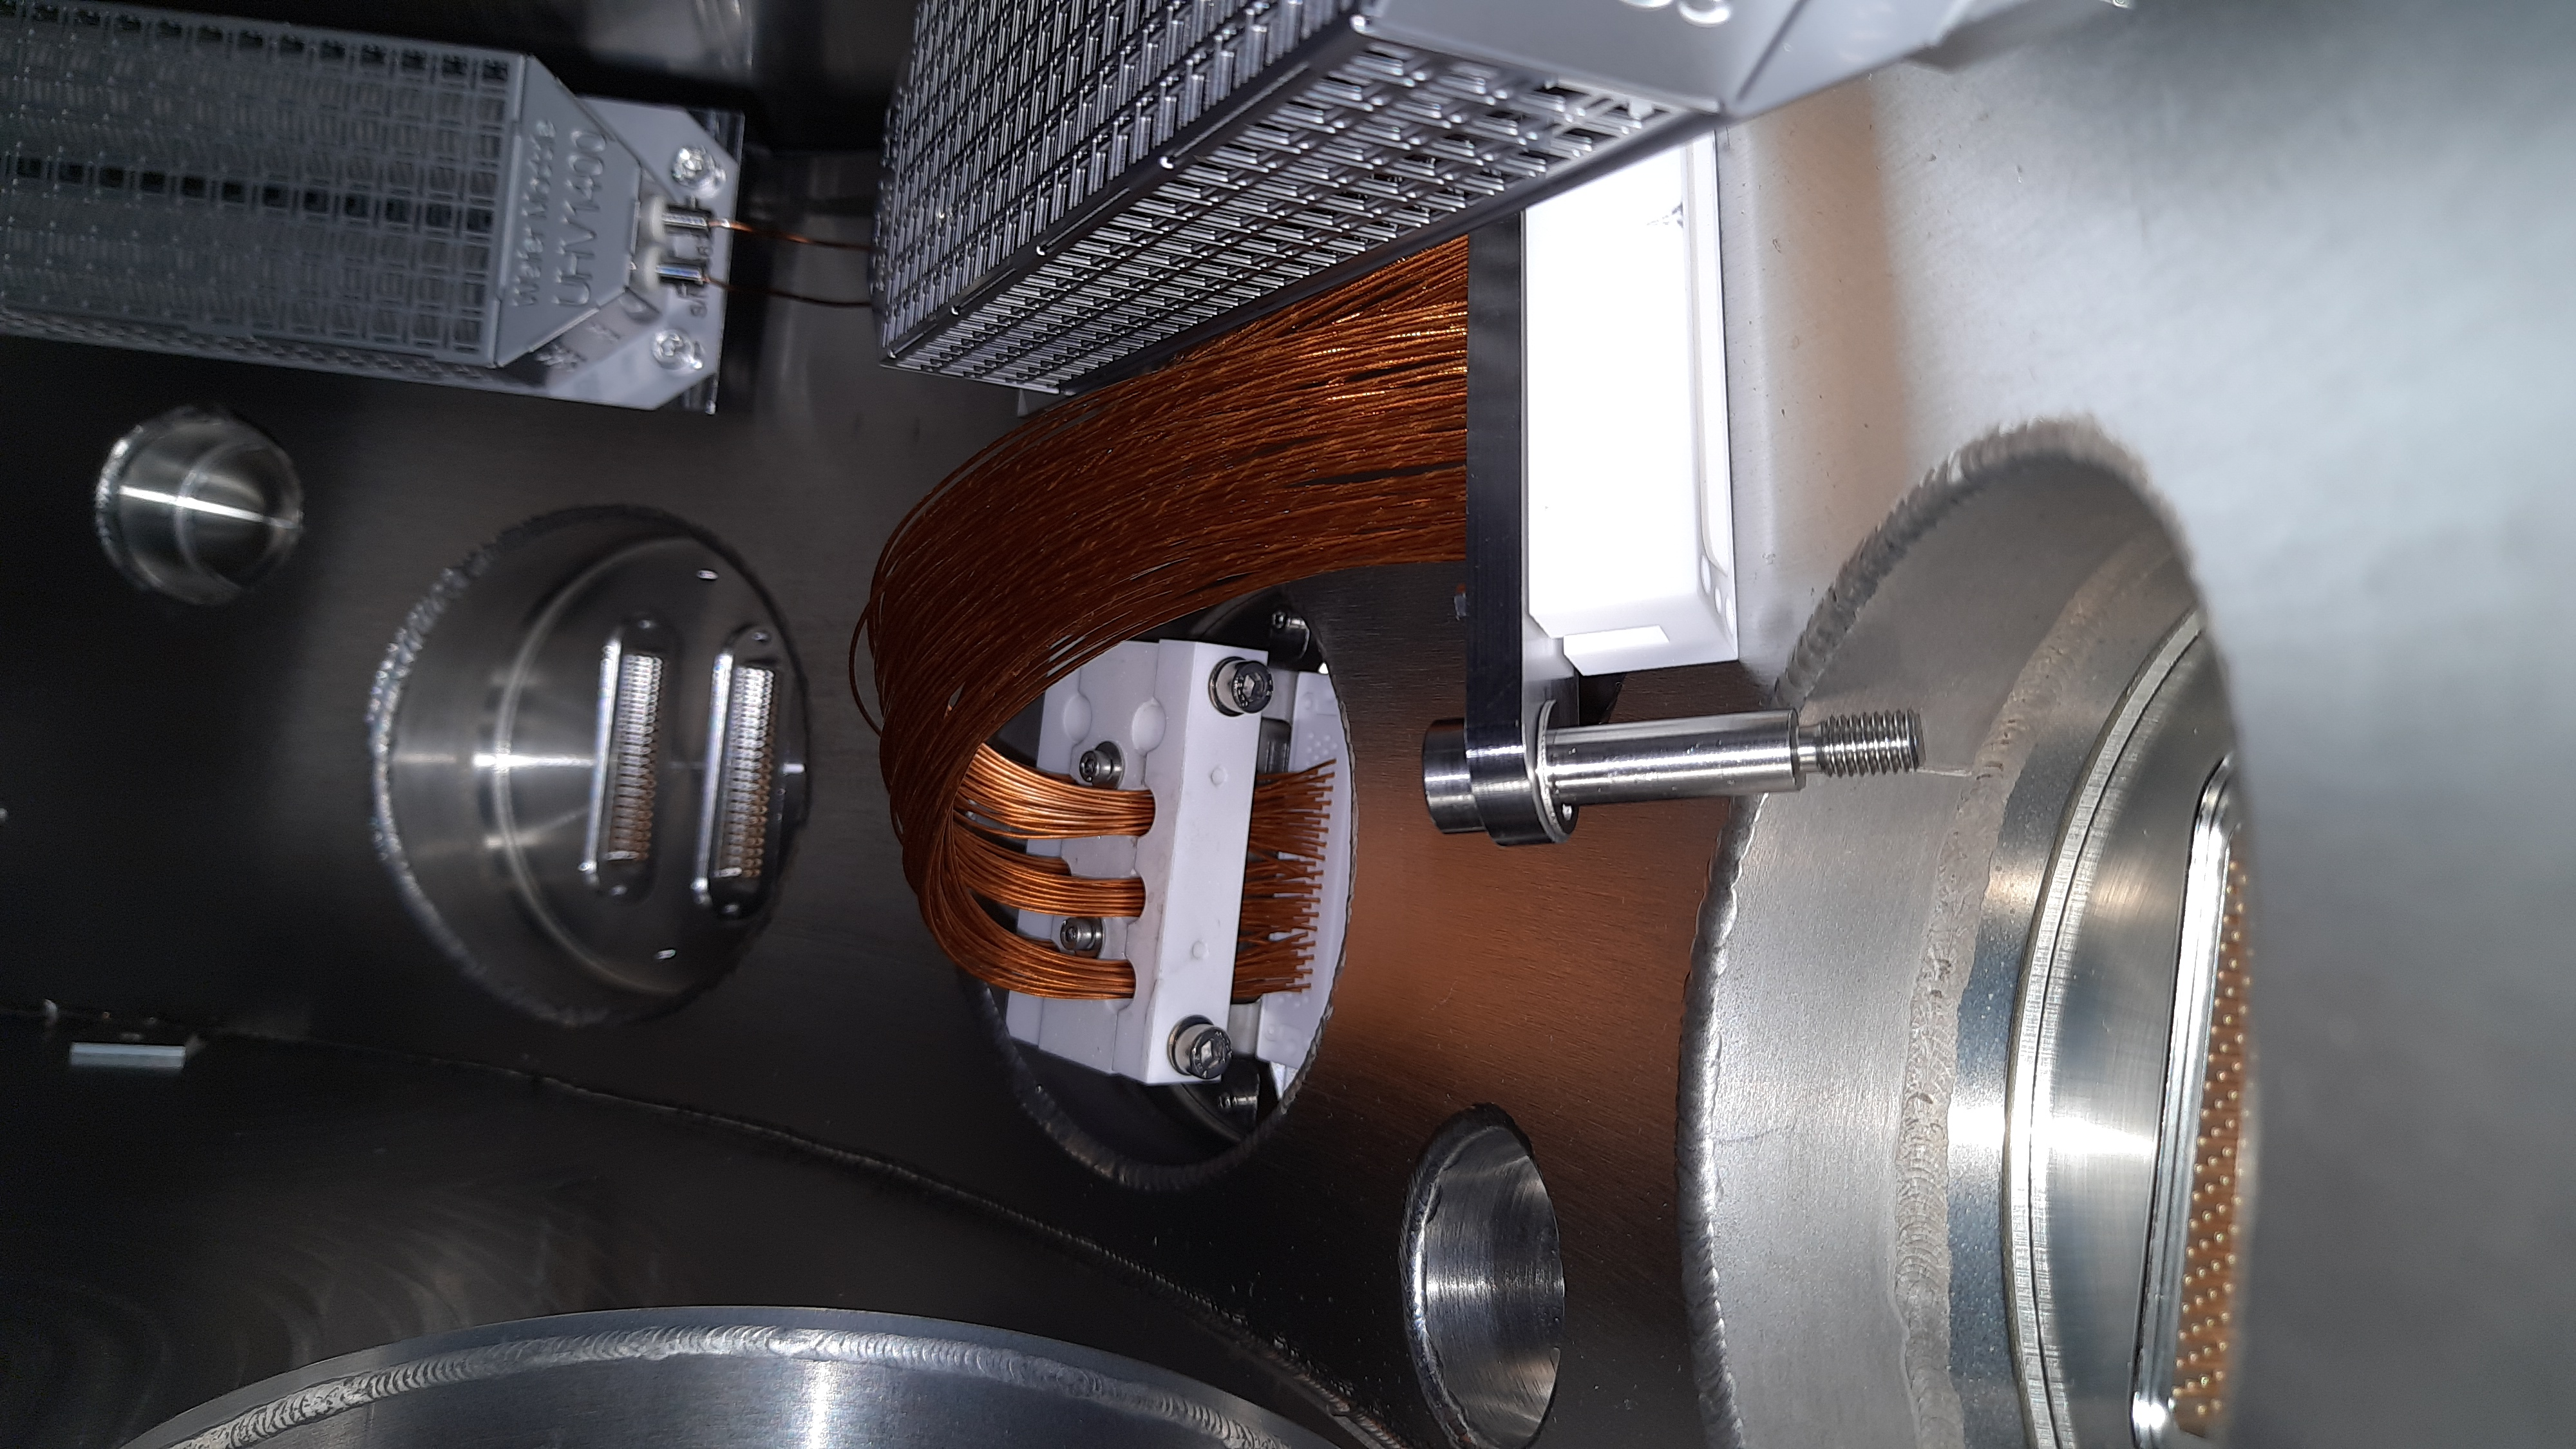
Took some pictures inside the chamber. Most connectors look OK, but

- One harness is touching the NEG wires (#2). This could be an issue. Will try to move it tomorrow
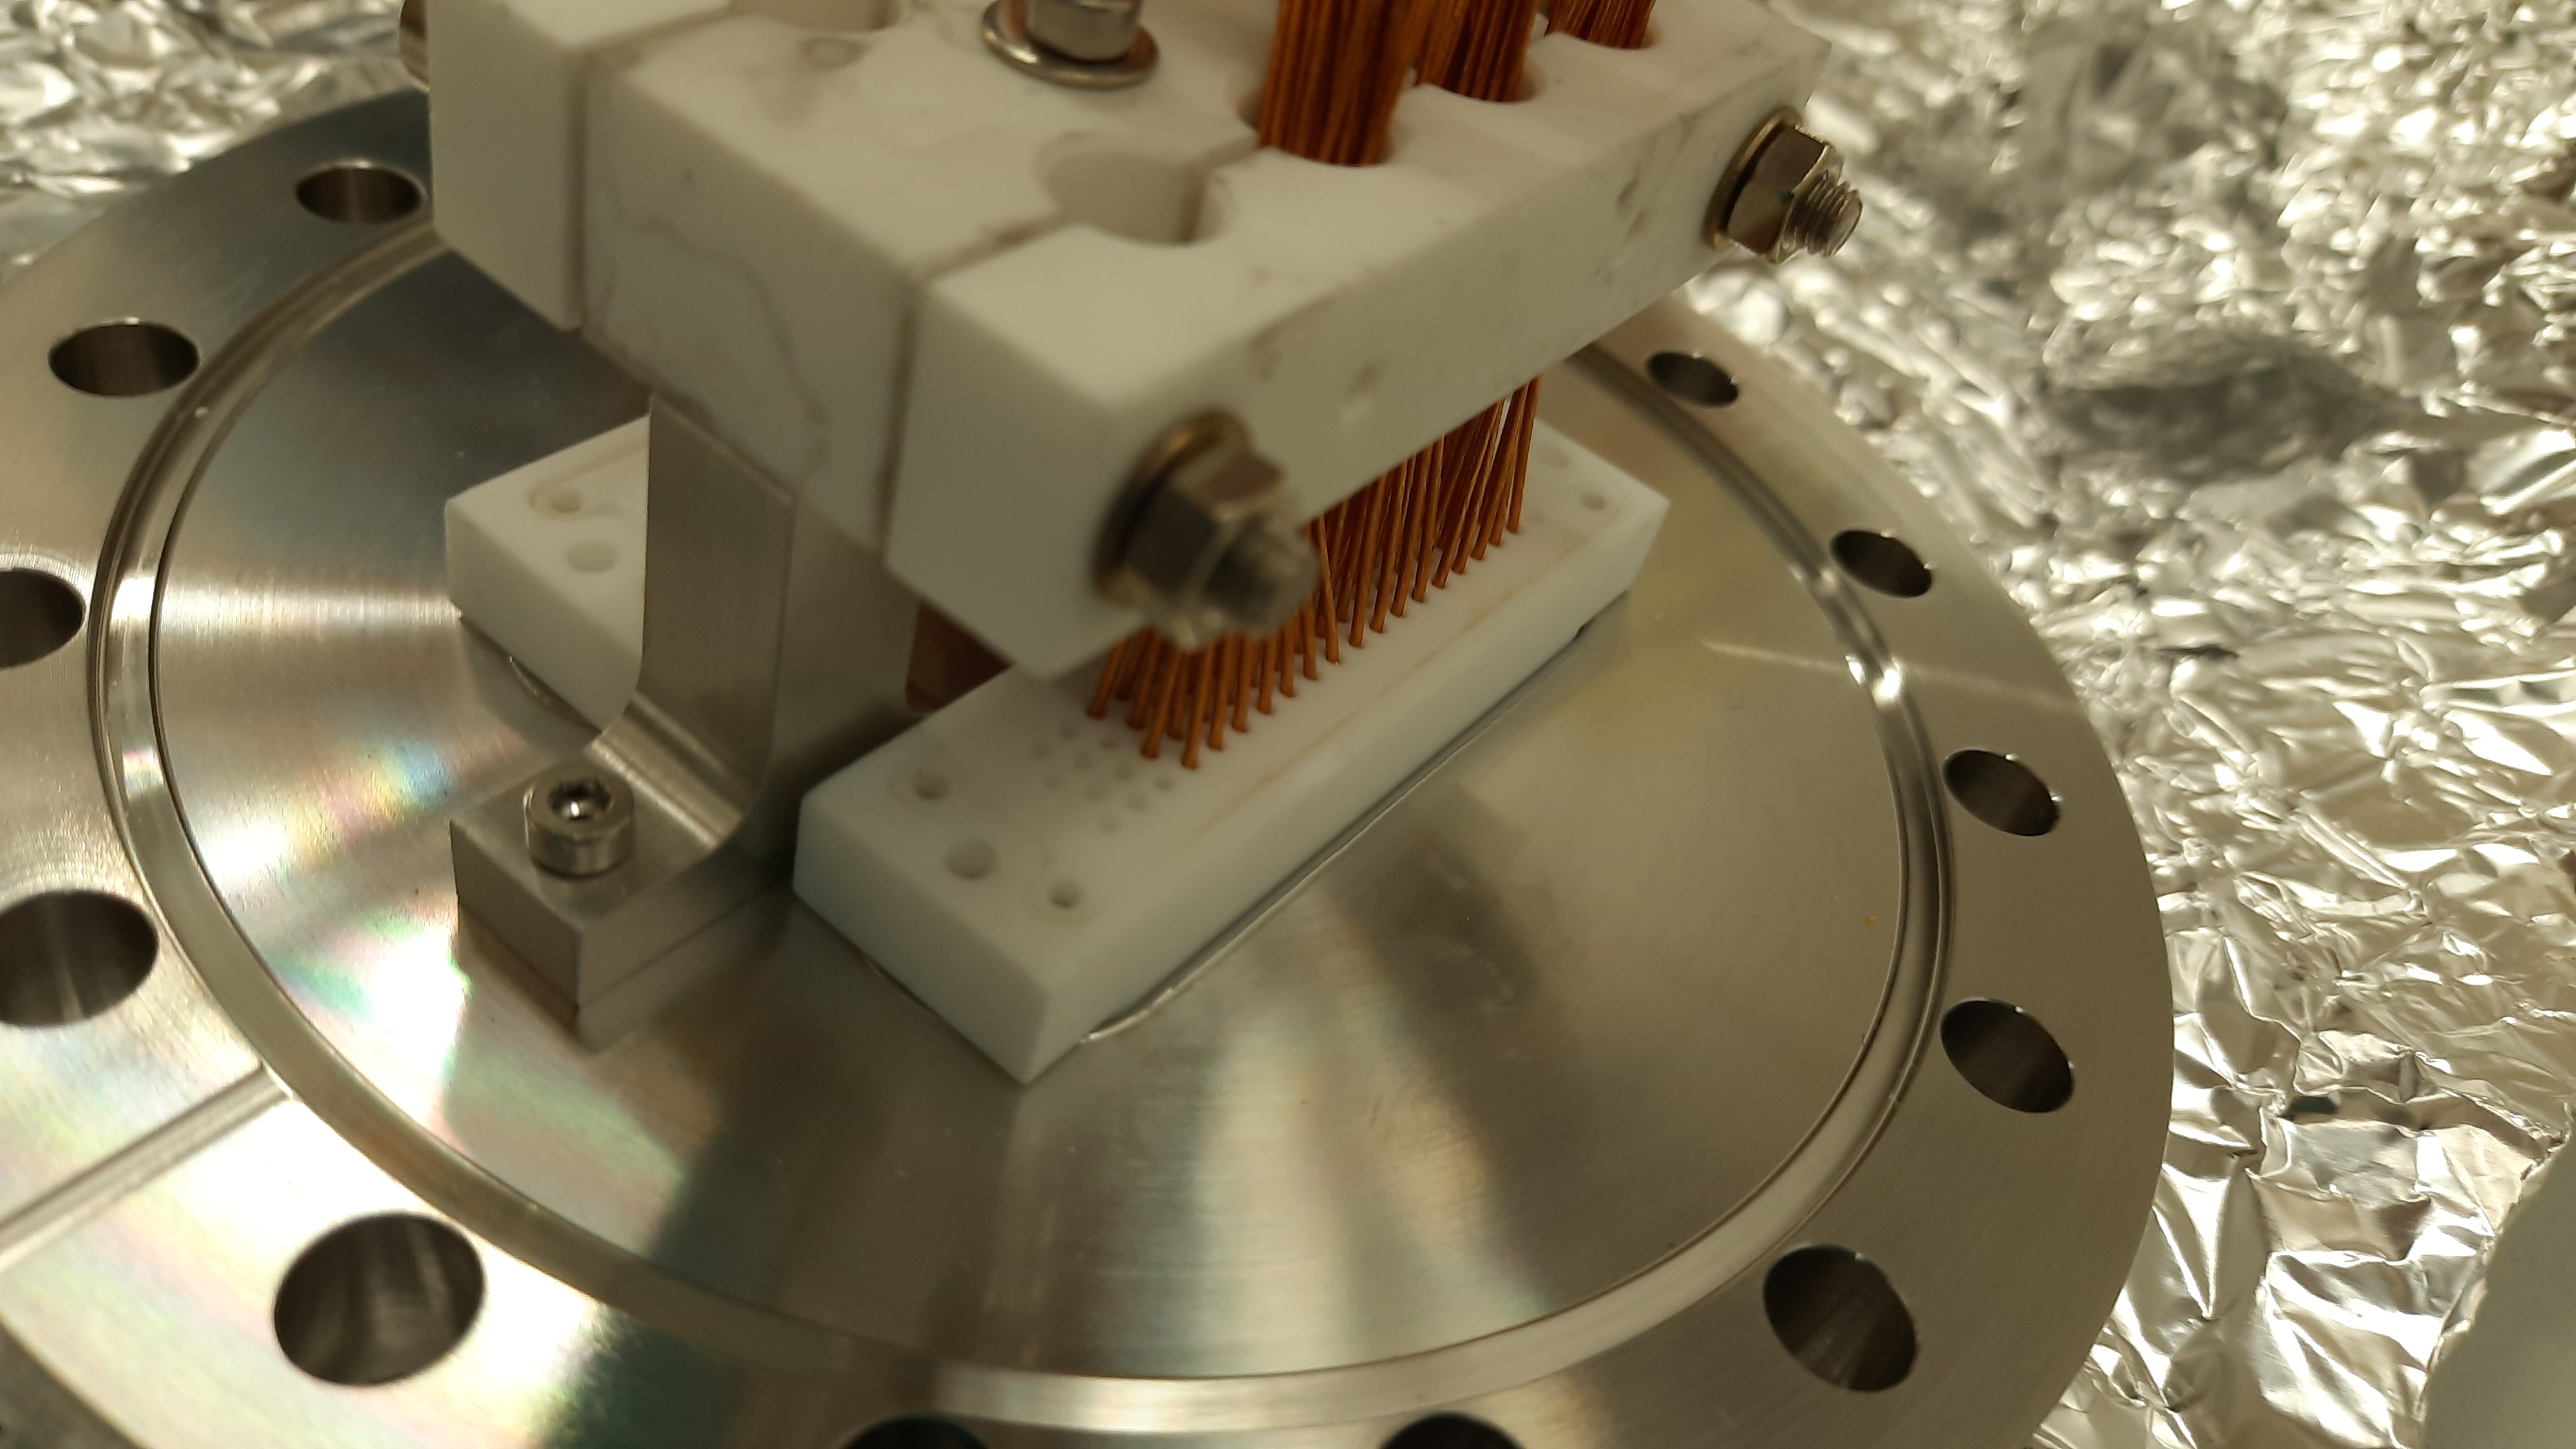
- Wires hanging from the top may be putting a lot of weight on the connectors. See pictures. Given number of
wires this may be acceptable.
- One harness is touching the NEG cage. Definitely an issue. Will fix tomorrow

Top/bottom flanges mounted with short harnesses. Side flanges mounted with long harnesses.

Two flanges left to mount.
Only #1 has been tightened. Other flanges left finger tight for Grossmontage to tighten properly tomorrow.

Outside motor to be fixed tomorrow. |
| Attachment 1: 20210908_132331.jpg
|

|
| Attachment 2: 20210908_132410.jpg
|

|
| Attachment 3: 20210908_132430.jpg
|

|
| Attachment 4: 20210908_133340.jpg
|

|
| Attachment 5: 20210908_141933.jpg
|
|
| Attachment 6: 20210908_141938.jpg
|
|
| Attachment 7: 20210908_144225.jpg
|

|
| Attachment 8: 20210908_144229.jpg
|

|
| Attachment 9: 20210908_144234.jpg
|
|
| Attachment 10: 20210908_144857.jpg
|
|
| Attachment 11: 20210908_144916.jpg
|
|
| Attachment 12: 20210908_145931.jpg
|

|
| Attachment 13: 20210908_151808.jpg
|
|
| Attachment 14: 20210908_152422.jpg
|

|
| Attachment 15: 20210908_152440.jpg
|

|
| Attachment 16: 20210908_152653.jpg
|
|
| Attachment 17: 20210908_153333.jpg
|
|
| Attachment 18: 20210908_153336.jpg
|
|
| Attachment 19: 20210908_155714.jpg
|

|
| Attachment 20: 20210908_163205.jpg
|

|
| Attachment 21: 20210908_155714.jpg
|
|
| Attachment 22: 20210908_164845.jpg
|

|
| Attachment 23: 20210908_164853.jpg
|

|
|
538
|
Tue Feb 20 14:12:32 2024 |
JM | Shutdown |
CARME DAQ shutdown. FEEs turned OFF and all MIDAS server windows closed.
Detector bias turned OFF.
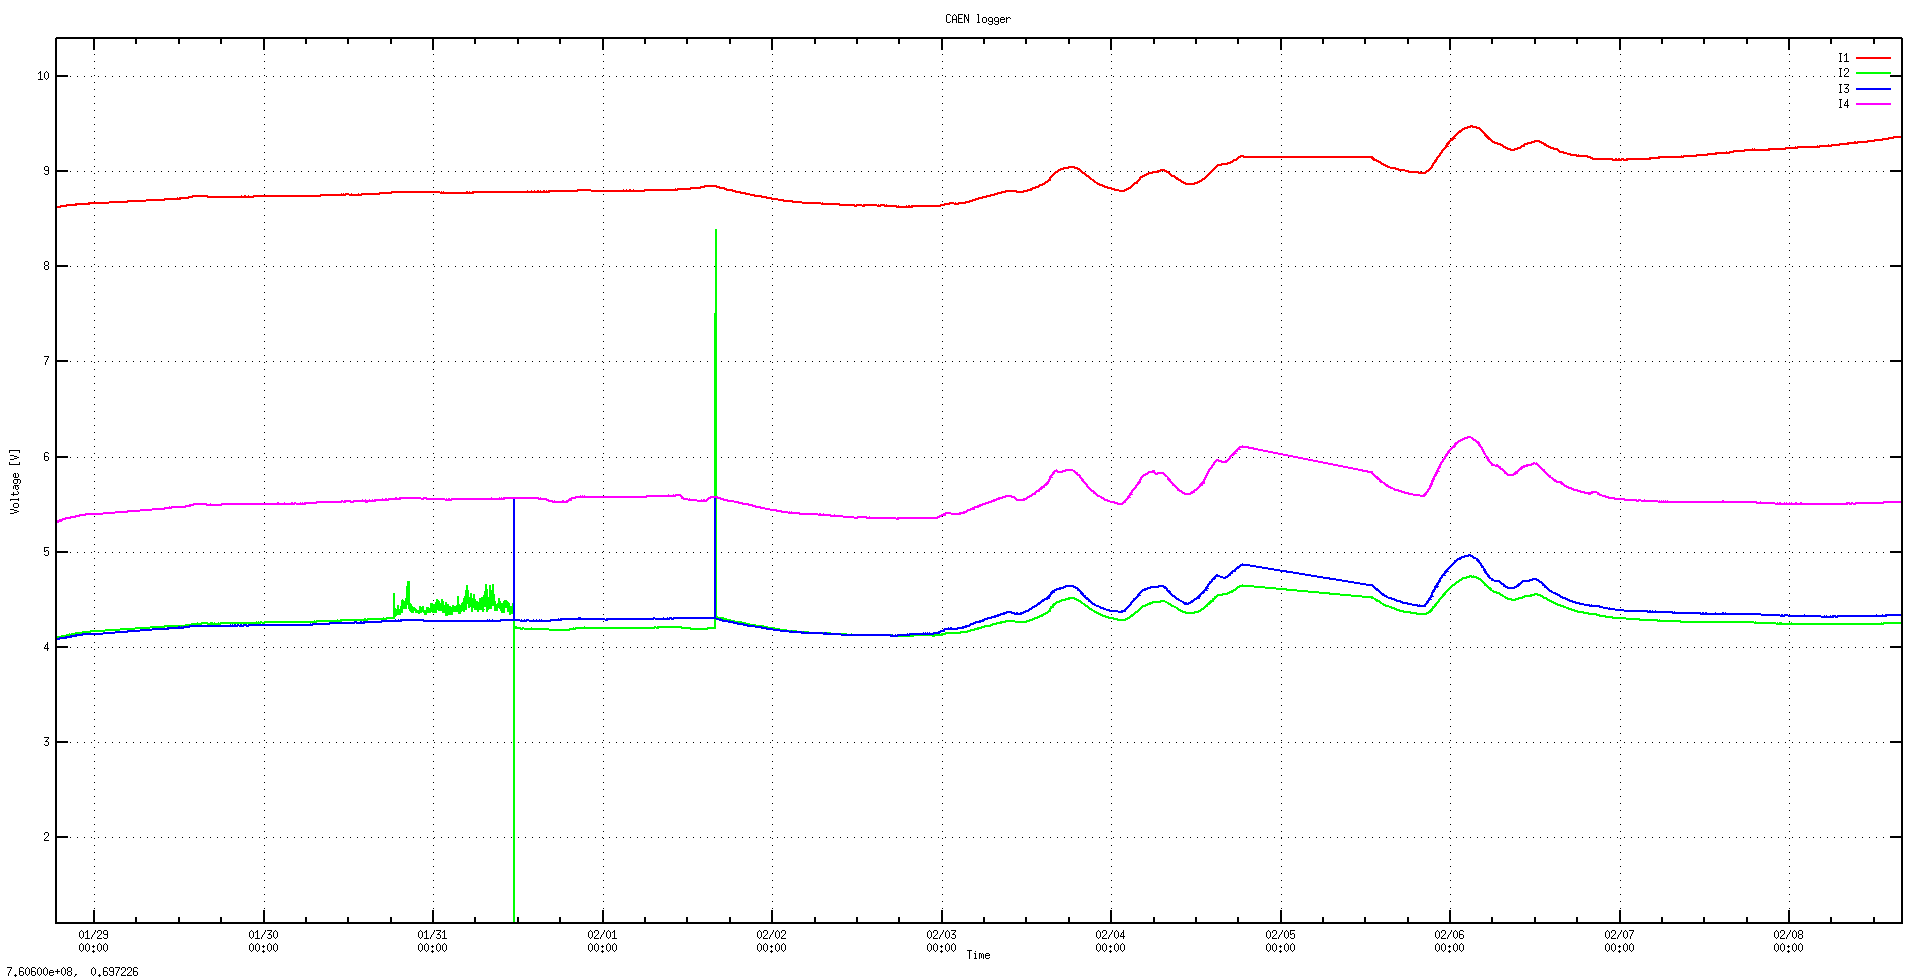
Final leakage current plot - attachment 1 |
| Attachment 1: Screenshot_from_2024-02-20_15-11-40.png
|
|
|
194
|
Mon Feb 14 09:56:39 2022 |
CB | Shifters instructions 2022 |
EMERGENCY SHUTDOWNS
1. CARME motors: Q key on keyboard while on workspace 1 of appc218 (right of this double-monitor setup)
2. Internal target: Q on keyboard while on workspace 3 of appc218, go to server room, press "CLOSE" button on DUMP.
CARME DAQ
CARME computer has 6 workspaces (WS), two monitors for each WS.
- WS1 : left monitor - fee power
right monitor - fee power server
- WS2 : left monitor - DAQ controls
right monitor - CAEN bias control
Most important tabs (right hand monitor)
- Run control : shows daq status, stopped / going
- Fee temperatures : temperatures of fees labelled aida01, aida02, aida03, aida04, aida05
- Statistics : shows the statistics for each fee
- System wide checks : checks for the setup
- Spectrum browser : loads histograms for fees and fee channels from preset layouts
- Asic control : sets asic parameters
- WS3 : left monitor - Merge control, tape server
right monitor - servers, data being written
- WS4 : leakage current plot
- WS5 : online data monitoring
- WS6 : browser, elog
- Motors are running on second computer
TO DO FOR THE SHIFTERS - CHECK EVERY HOUR AND POST TO ELOG WITH SCREENSHOTS
-->IMPORTANT NOTE: MIDAS DAQ can respond slowly. DO NOT try to change tab or give new command while the previous one is being executed. Check activity in right-hand part of tab currently in use. Do not double click on buttons.
Motors computer (Computer to the right)
- Check motors cycle is running. The code will cycle through the loaded motors instructions. When an instruction is being done it is highlighted in bold. Check the bold highlighting cycles through entire set of instructions.
- Check potentiometer is reproducing same max/min values for each cycle of instructions. 74.02 fully in, 29.5 fully out.
- Detectors are on LEFT arm. Nothing on RIGHT arm which should not move.
- No need for screenshots, but record in the ELOG you checked this.
Merger, Tape server (WS3)
- Check NewMerger tab. Hit reload button and see if 'current links with data' and 'current merged data rate' are updating. All links should go green, but not necessarily at the same time. Keep hitting refresh until you see all of them going green at least once.
- Data rate should be around 100,000. Take screenshot.
- Check tapeService tab. Hit reload button. Check data rate in Kbytes/sec box. Record data rate to elog. This is where the current run number is displayed. Take screenshot.
- On the right-hand monitor, bottom right terminal, check the current run fragment (sub-run) is being written and is slowly increasing in size. It refreshed automatically every 5 seconds.
Leakage current (WS4)
- Check leakage current plot is stable. Make sure it is updating and time is correct. Take screenshot. Check present values on WS2, CAEN window, channel 1.
DAQ (WS2)
- Check Fee temperatures tab. Hit reload, temperatures will update and should all be green. 1-2 C above safe limit (top) is OK. More than that - warn expert shifter immediately. Take screenshot.
- Check system wide checks tab. Click on 'Check Clock Status', 'Check ADC Calibration' and 'Check the White rabbit decoder status' to run checks. Copy-paste test in the ELOG the first time you do it. If there are no changes throughout the shift, just record no changes.
- Check statistics tab. Hit Update All to see if the counter and rate are updating. Change counter being displayed using drop-down menu on the right hand side of the left monitor.
- Good events - aida 1-4 should have similar counting rates. If any rate is a lot higher than the others, warn expert shifter.
- ADC coincidence-info #8
- Take screenshot of each for the ELOG
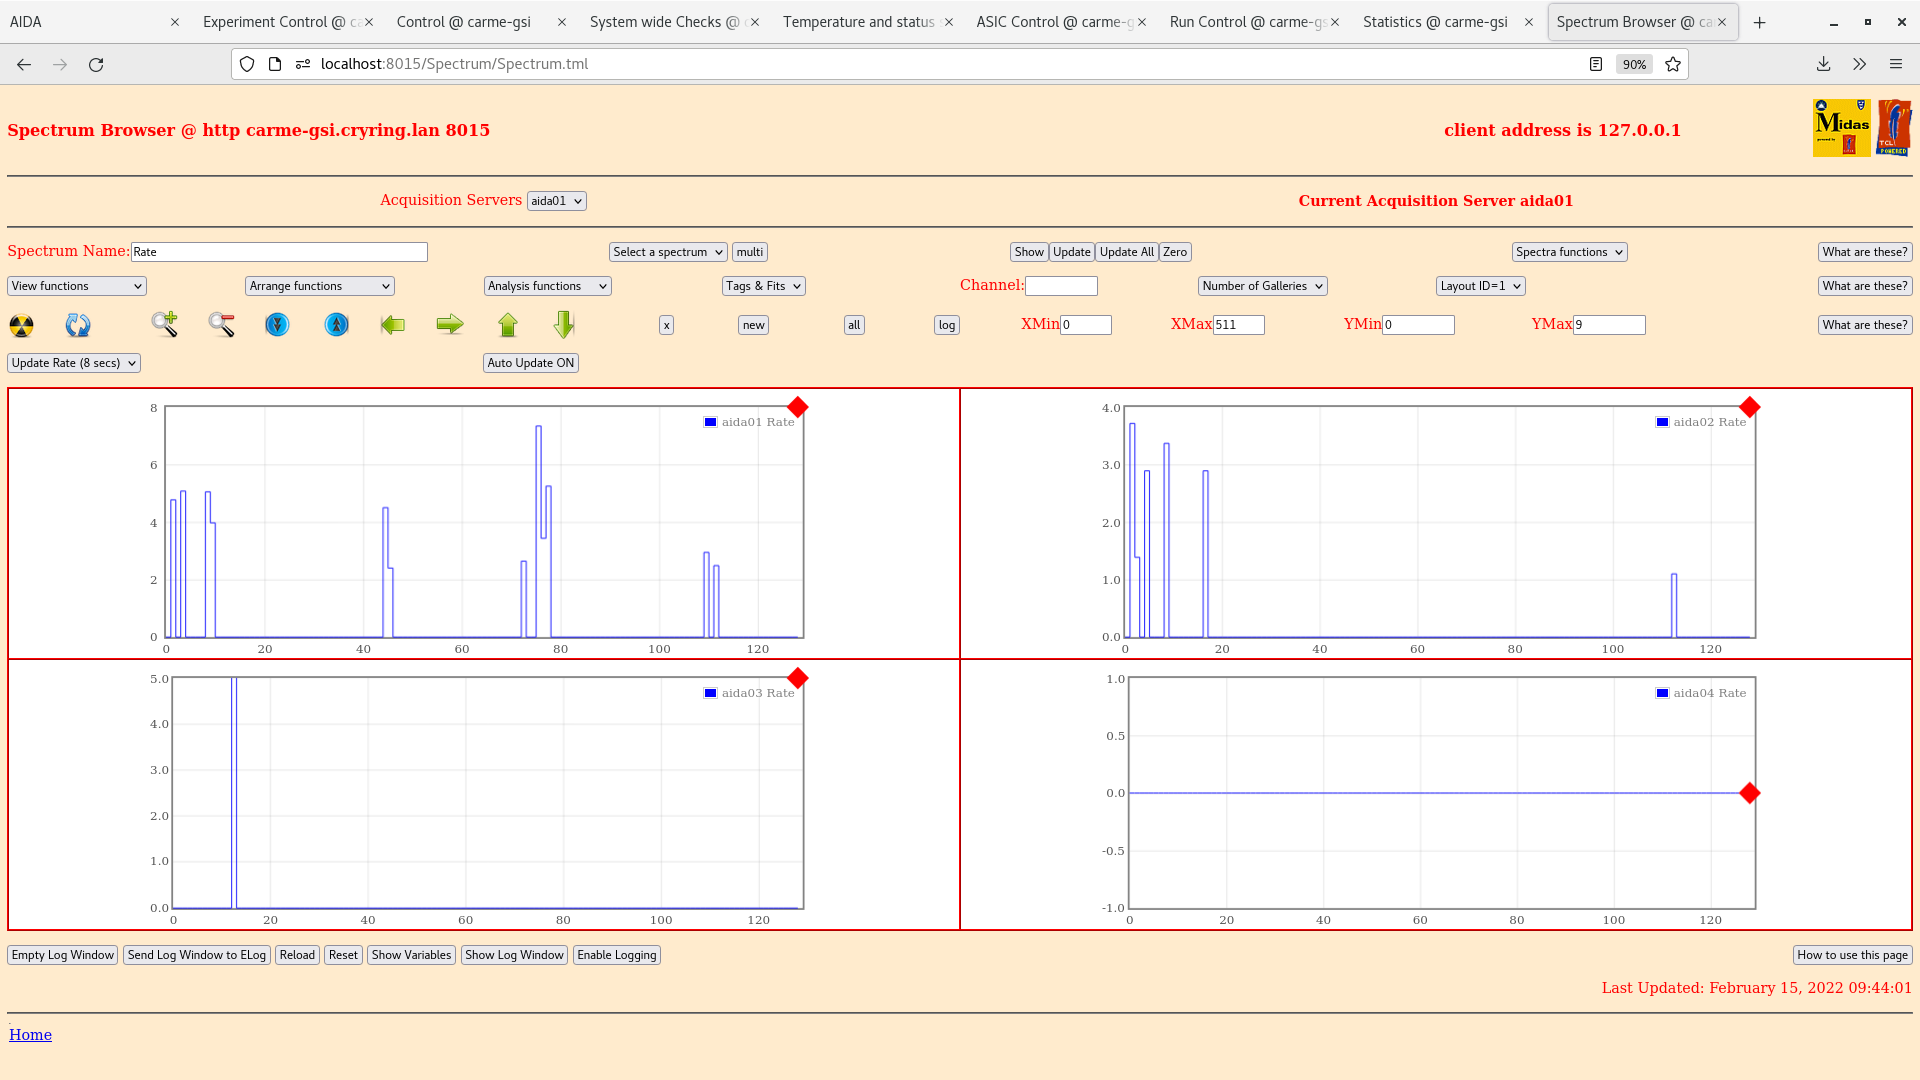
- Spectrum browser tab. Check it is displaying aida 1-4 rate (top right of each histogram). IF NOT: select layout 1 from 'layout ID' then restore layout from 'Arrange functions' drop down menu. Select log scale and change xmax as 128. This displays the data rate per strip. If any strips are a lot higher than the others, or very different from previous entry, make a note in the ELOG. Take screenshot.
Online monitoring (WS 5)
- Check the following plots are updating
- LowEnergyXYTotal (right click - col - colz). This shows the total number of events, per pixel, since the code was started / re-started.
- LowEnergyXYRate (right click - col - colz). This shows the rate over the last minute.
- LowEnergyExTotal (double left click. Right click on y axis - Log scale on y). This shows the total energy deposited on all X strips since code restart.
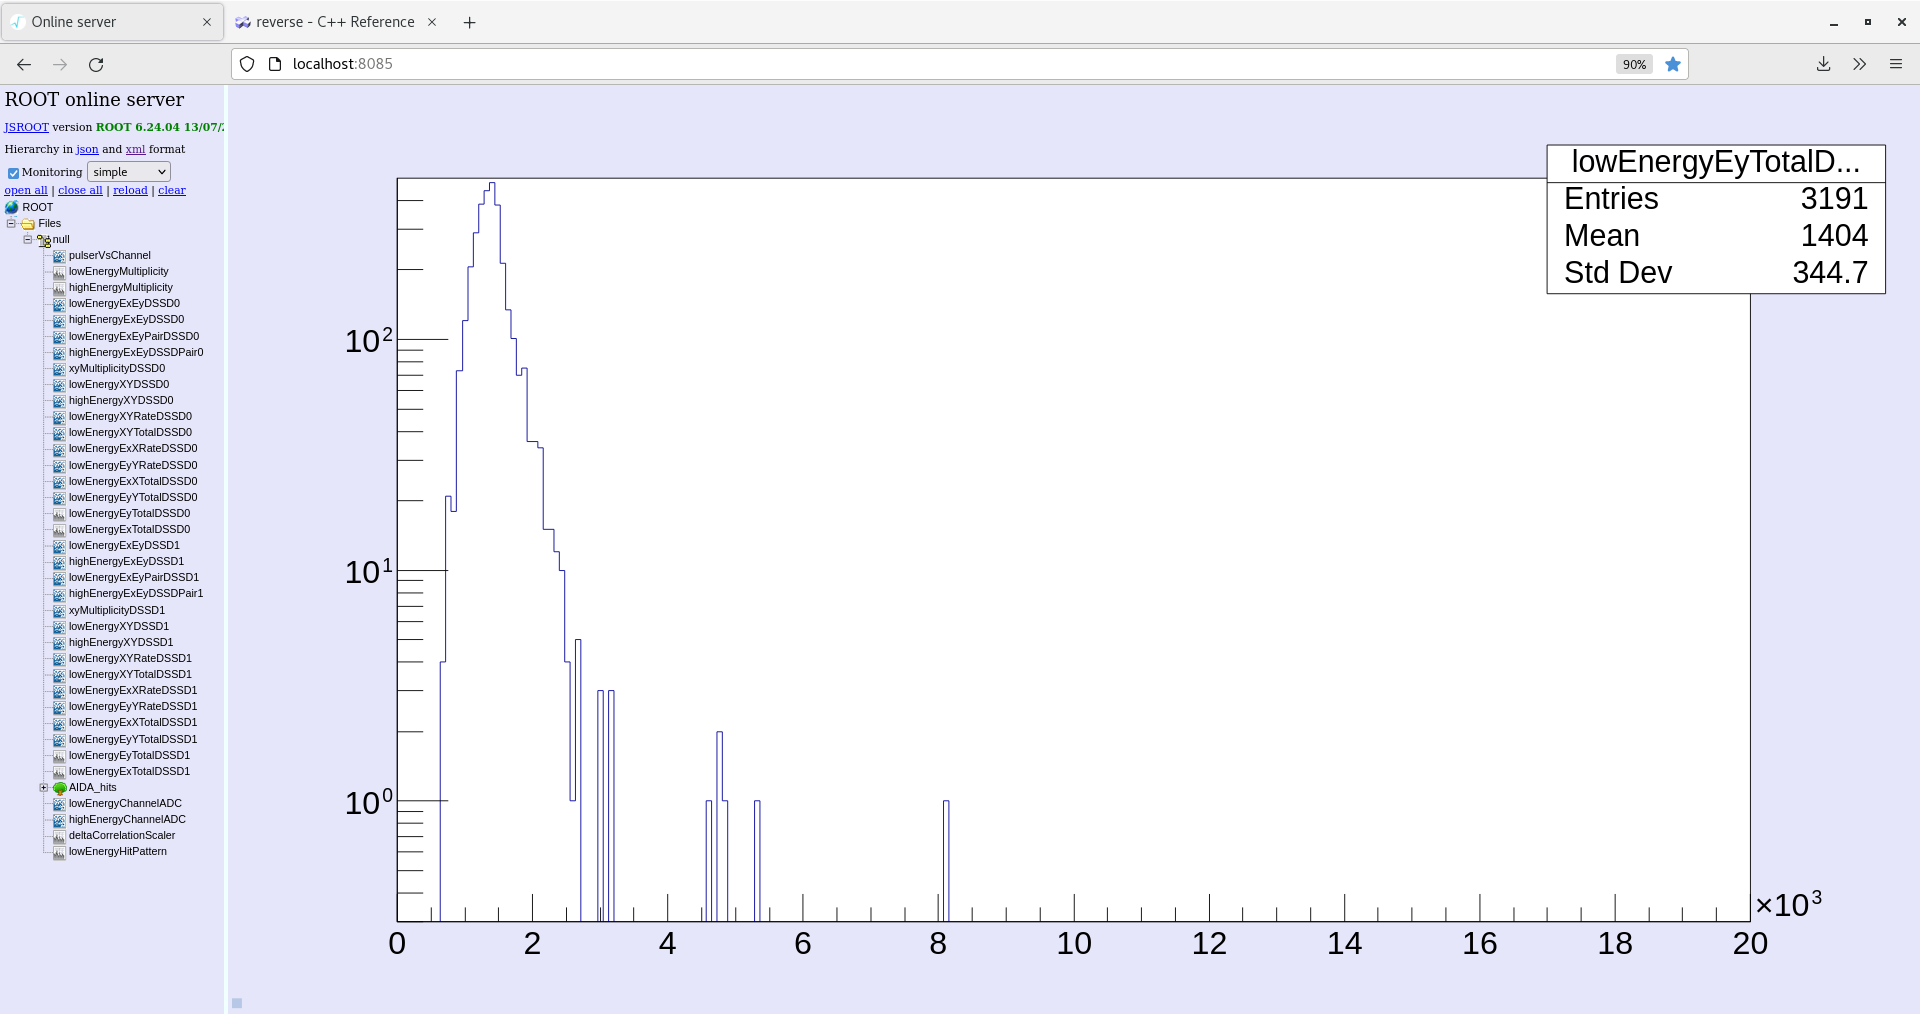
- LowEnergyEyTotal (as above). as above, Y strips.
- Please take screenshot of each
|
| Attachment 1: good_events_2022-02-15_09-40-40.png
|

|
| Attachment 2: ADC_data_items_2022-02-15_09-42-55.png
|

|
| Attachment 3: merger_control_2022-02-15_09-36-06.png
|

|
| Attachment 4: leakage_current_2022-02-15_09-37-22.png
|

|
| Attachment 5: fee_temperatures_2022-02-15_09-38-36.png
|

|
| Attachment 6: spectrum_browser_2022-02-15_09-44-10.png
|
|
| Attachment 7: correlation_info8_2022-02-15_09-41-16.png
|

|
| Attachment 8: lowEnergyExTotalDSSD0_2022-02-15_09-48-13.png
|

|
| Attachment 9: lowEnergyEyTotalDSSD0_2022-02-15_09-47-28.png
|
|
| Attachment 10: lowEnergyXYTotalDSSD0_2022-02-15_09-45-35.png
|

|
|
498
|
Thu Feb 8 11:22:28 2024 |
JM | Shifters instruction 2024 |
EMERGENCY SHUTDOWNS
1. CARME motors: Q key on keyboard while on workspace 1 of appc218 (right of this double-monitor setup)
2. Internal target:
ELOG
Each shift should put all information relating to the shift in ONE elog entry unless a significant change occurs during the shift i.e beam off, target off, run change, detectors out etc.
Elog entry should be named by the shift - morning/afternoon/night followed by the current run number
TO DO FOR THE SHIFTERS - CHECK EVERY HOUR AND POST TO ELOG WITH SCREENSHOTS. ELOG should be updated with current beam energy, injection beam intensity, system checks OK/not, FEE temperature OK/not, Statistics OK/not, Merger OK/not, tape server data rate, Motors OK/not and min/max motors potentiometer value. The time of each update should be noted in the elog. Screenshots of important screens (detailed below) should also be uploaded to the elog.
CARME DAQ
CARME computer has 6 workspaces (WS), two monitors for each WS.
WS1 : left monitor - fee power
right monitor - Detector Bias control, fee power server (just a terminal, do not close)
WS2 : left monitor - DAQ controls
right monitor - DAQ server (just a terminal, do not close)
Most important tabs (DAQ controls)
- Run control : shows daq status, stopped / going
- Fee temperatures : temperatures of fees labelled aida01, aida02, aida03, aida04, aida05, aida06, aida07, aida08, aida09, aida10, aida11, aida12, aida13, aida14, aida15, aida16. Hit reload, temperatures will update and should all be green. 1-2 C above safe limit (top) is OK. More than that - warn expert shifter immediately.
- Statistics : shows the statistics for each fee. Make sure ADC Data Items is selected in the left hand menu. Hit update all (SCREENSHOT once, if no changes record OK in elog)
- System wide checks : checks for the setup. Click on 'Check Clock Status', 'Check ADC Calibration' and 'Check the White rabbit decoder status' to run checks. (SCREENSHOT once, if no changes record OK in elog)
- Spectrum browser : loads histograms for fees and fee channels from preset layouts. select layout from 'layout ID' then restore layout from 'Arrange functions' drop down menu. Check layout 1, Select log scale and change xmax as 128 . This displays the data rate per strip. If any strips are a lot higher than the others, or very different from previous entry, make a note in the ELOG. (SCREENSHOT once, if no changes record OK in elog)
- Asic control : sets asic parameters
WS3 : left monitor - Merge control, Tape server
right monitor - servers (just terminals, do not close) , data being written to file
- Check NewMerger tab. Hit reload button and see if 'current links with data' and 'current merged data rate' are updating. All links should go green, but not necessarily at the same time. Keep hitting refresh until you see all of them going green at least once.
- Data rate, hit reload should be around 100,000. Record data rate in elog
- Check tapeService tab. Hit reload button. Check data rate in Kbytes/sec box. Record data rate to elog. This is where the current run number is displayed
- On the right-hand monitor, bottom right terminal, check the current run fragment (sub-run) is being written and is slowly increasing in size. It refreshed automatically every 5 seconds.
WS4 : Leakage current plot
- Check leakage current plot is stable. Transients will occur during motors movement but baseline current should remain consistent. Make sure it is updating and time is correct. (SCREENSHOT once, record OK in elog if no changes) Check present values on WS2, CAEN window
WS5 : Online data monitoring
- Check the following plots are updating for each DSSD
- LowEnergyXYTotal (right click - col - colz). This shows the total number of events, per pixel, since the code was started / re-started.
- LowEnergyXYRate (right click - col - colz). This shows the rate over the last 20 seconds.
- LowEnergyExRate (double left click. Right click on y axis - Log scale on y). Rate over the last 20 seconds
- LowEnergyExTotal (double left click. Right click on y axis - Log scale on y). This shows the total energy deposited on all X strips since code restart.
- LowEnergyEyTotal (as above). as above, Y strips. (SCREENSHOT of each per DSSD per shift. If significant changes are observed screenshot again)
WS6 : Browser, ELOG
-->IMPORTANT NOTE: MIDAS DAQ can respond slowly. DO NOT try to change tab or give new command while the previous one is being executed. Check activity in right-hand part of tab currently in use. Do not double click on buttons.
Motors computer (Computer to the right)
- Check motors cycle is running. The code will cycle through the loaded motors instructions. When an instruction is being done it is highlighted in bold. Check the bold highlighting cycles through entire set of instructions.
- Check potentiometer is reproducing same max/min values for each cycle of instructions.
- Detectors are on LEFT and RIGHT arm.
- No need for screenshots, but record in the ELOG you checked this.
|
|
684
|
Sat May 17 11:19:06 2025 |
JM | Shifter intructions 2025 |
EMERGENCY SHUTDOWNS
1. CARME motors: Q key on keyboard while on workspace 1 of appc218 (right of this double-monitor setup)
2. Internal target:
ELOG
The shift should put all information relating to the current run in ONE elog entry. If a significant change occurs during the shift i.e beam off, target off, run change, detectors out etc, start a new run and add a new elog entry.
Elog entry should be named by the current run number.
At the start of each new elog entry please state current detector positions, beam energy and run type (e.g. beam on target, background etc).
TO DO FOR THE SHIFTERS - CHECK EVERY HOUR AND POST TO ELOG WITH SCREENSHOTS. ELOG should be updated with current beam energy, injection beam intensity, system checks OK/not, FEE temperature OK/not, Statistics OK/not, Merger OK/not, tape server data rate, Motors OK/not and min/max motors potentiometer value. The time of each update should be noted in the elog. Screenshots of important screens (detailed below) should also be uploaded to the elog regularly (not required every hour).
CARME DAQ
CARME computer has 6 workspaces (WS), two monitors for each WS.
WS1 : left monitor - fee power
right monitor - Detector Bias control, fee power server (just a terminal, do not close). Check detector bias is stable. If any detector current levels become unstable contact Jordan or Carlo and note time in the elog.
WS2 : left monitor - DAQ controls
right monitor - DAQ server (just a terminal, do not close)
Most important tabs (DAQ controls)
- Run control : shows daq status, stopped / going
- Fee temperatures : temperatures of fees labelled aida01, aida02, aida03, aida04, aida05, aida06, aida07, aida08, aida09, aida10, aida11, aida12, aida13, aida14, aida15, aida16. Hit reload, temperatures will update and should all be green. 1-2 C above safe limit (top) is OK. More than that - warn expert shifter immediately.
- Statistics : shows the statistics for each fee. Make sure ADC Data Items is selected in the left hand menu. Hit update all (SCREENSHOT once, if no changes record OK in elog)
- System wide checks : checks for the setup. Click on 'Check Clock Status', 'Check ADC Calibration' and 'Check the White rabbit decoder status' to run checks. (SCREENSHOT once, if no changes record OK in elog)
- Spectrum browser : loads histograms for fees and fee channels from preset layouts. select layout from 'layout ID' then restore layout from 'Arrange functions' drop down menu. Check layout 1, Select log scale and change xmax as 128 . This displays the data rate per strip. If any strips are a lot higher than the others, or very different from previous entry, make a note in the ELOG. (SCREENSHOT once, if no changes record OK in elog)
- Asic control : sets asic parameters
WS3 : left monitor - Merge control, Tape server
right monitor - servers (just terminals, do not close) , data being written to file
- Check NewMerger tab. Hit reload button and see if 'current links with data' and 'current merged data rate' are updating. All links should go green, but not necessarily at the same time. Keep hitting refresh until you see all of them going green at least once.
- Data rate, hit reload should be around 100,000. Record data rate in elog
- Check tapeService tab. Hit reload button. Check data rate in Kbytes/sec box. Record data rate to elog. This is where the current run number is displayed
- On the right-hand monitor, bottom right terminal, check the current run fragment (sub-run) is being written and is slowly increasing in size. It refreshed automatically every 5 seconds.
WS4 : Leakage current plot
- Check leakage current plot is stable. Transients will occur during motors movement but baseline current should remain consistent. Make sure it is updating and time is correct. (SCREENSHOT once, record OK in elog if no changes) Check present values on WS2, CAEN window
WS5 : Online data monitoring
- Check the following plots are updating for each DSSD
- LowEnergyXY (right click - col - colz). This shows the total number of events, per pixel, since the code was started / re-started.
- LowEnergyAngleE. This shows the angle vs energy plot of all detected events. Can be used to observed elastic scattering / 7Be from lithium measurement
- LowEnergyXYRate (right click - col - colz). This shows the rate over the last 20 seconds.
- LowEnergyExRate (double left click. Right click on y axis - Log scale on y). Rate over the last 20 seconds
- LowEnergyExTotal (double left click. Right click on y axis - Log scale on y). This shows the total energy deposited on all X strips since code restart.
- LowEnergyEyTotall (as above). as above, Y strips. (SCREENSHOT of each per DSSD per shift. If significant changes are observed screenshot again)
- During the shift, shifters should try to integrate peaks of interest. Area to integrate will be given in spreadsheet in same workspace as monitoring code. This is particularly important for D+D where peaks from each detectors for reaction products should be integrated every hour to determine how much time before moving to the next datapoint. For lithium beamtime this should also be done in the angle vs energy plot. Note the number of counts in the spreadsheet in the same workspace.
WS6 : Browser, ELOG
-->IMPORTANT NOTE: MIDAS DAQ can respond slowly. DO NOT try to change tab or give new command while the previous one is being executed. Check activity in right-hand part of tab currently in use. Do not double click on buttons.
Motors computer (Computer to the right)
- Check motors cycle is running. The code will cycle through the loaded motors instructions. When an instruction is being done it is highlighted in bold. Check the bold highlighting cycles through entire set of instructions.
- Check potentiometer is reproducing same max/min values for each cycle of instructions.
- Detectors are on LEFT and RIGHT arm.
- No need for screenshots, but record in the ELOG you checked this.
|
|
484
|
Thu Feb 1 10:04:11 2024 |
JM, CB | Shaping time testing |
Arrived at the control room to find we had lost connection to the power relay. We rebooted the nnrpi1 and re-connected according to the steps laid out in elog 471 -> all okay
11:00 Restarted daq with no changes to the system from yesterday. Bias consistent with previous days. All pulser peaks are slightly improved (even more for the pn pulser, one goes from 91 chn to 78). No pulser observed in nn FEE modules 9, 10, 13, 14 again.
ADC data items check OK - all ~3k
Rates - all OK - attachment 1
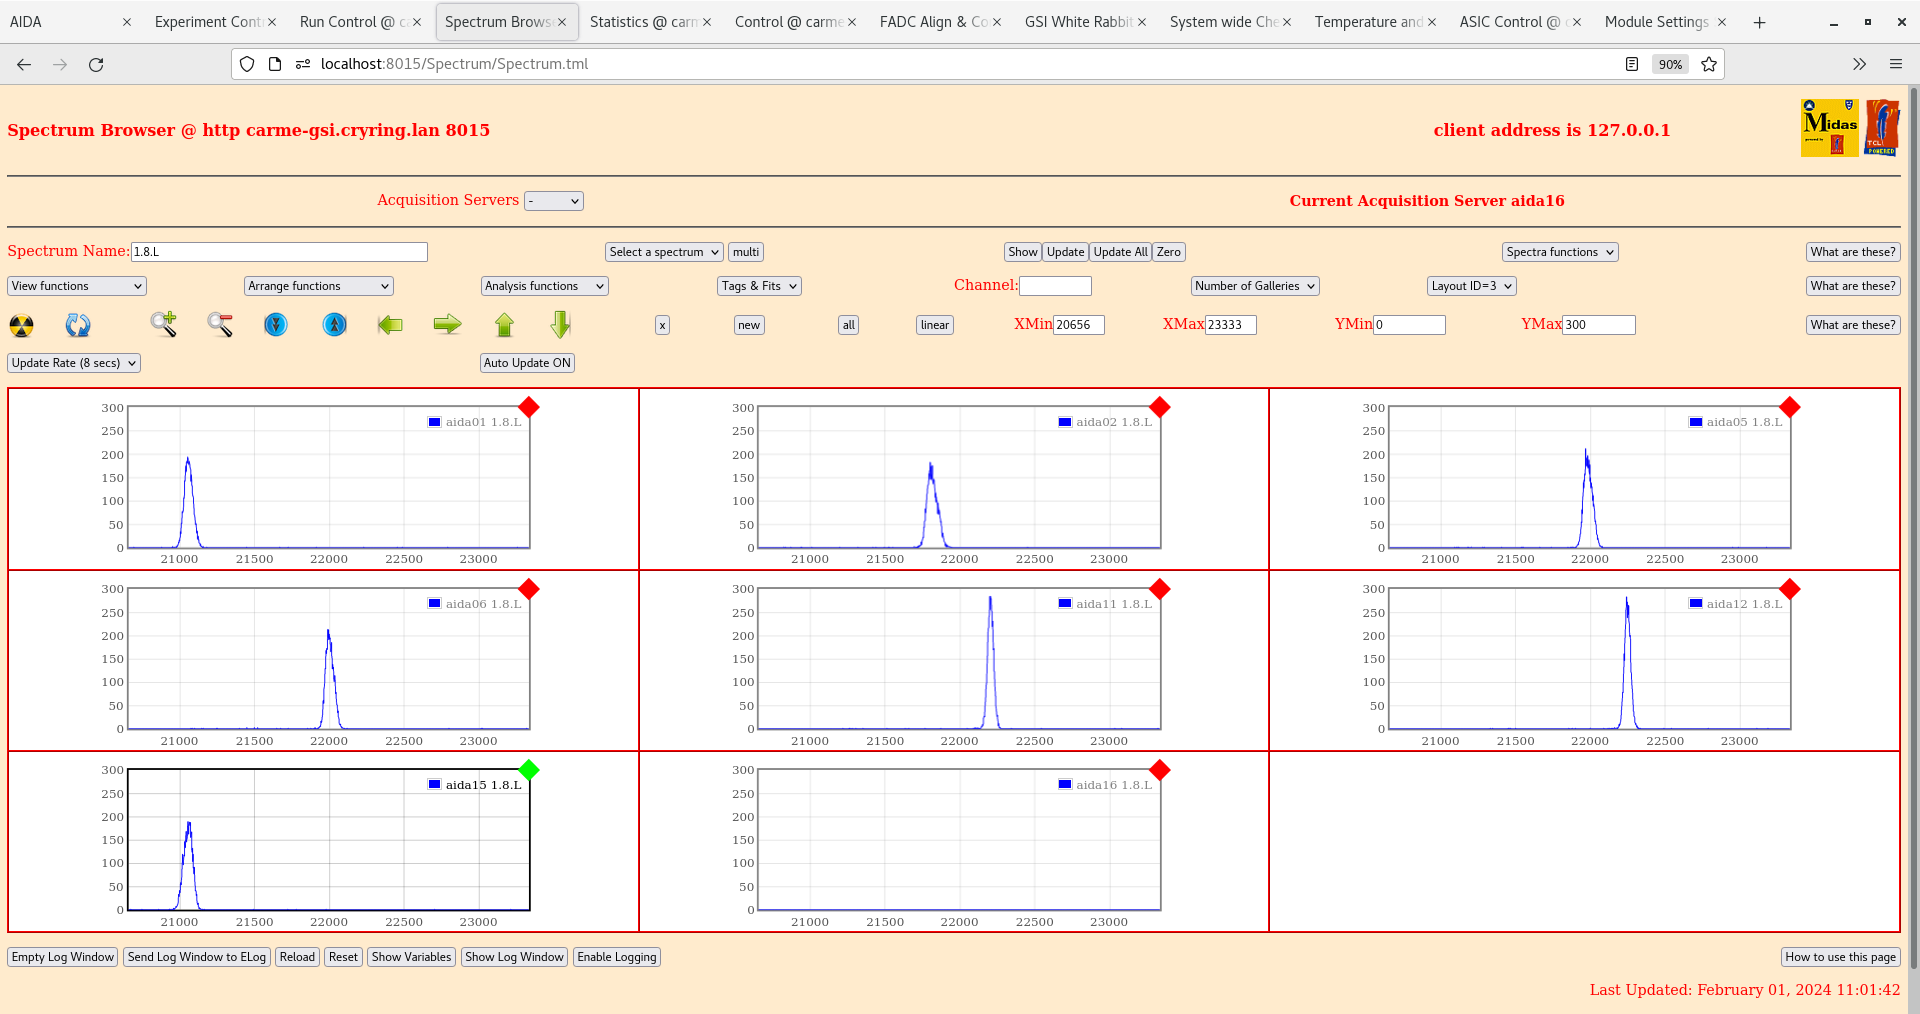
1.8L spectra. - attachment 2,3
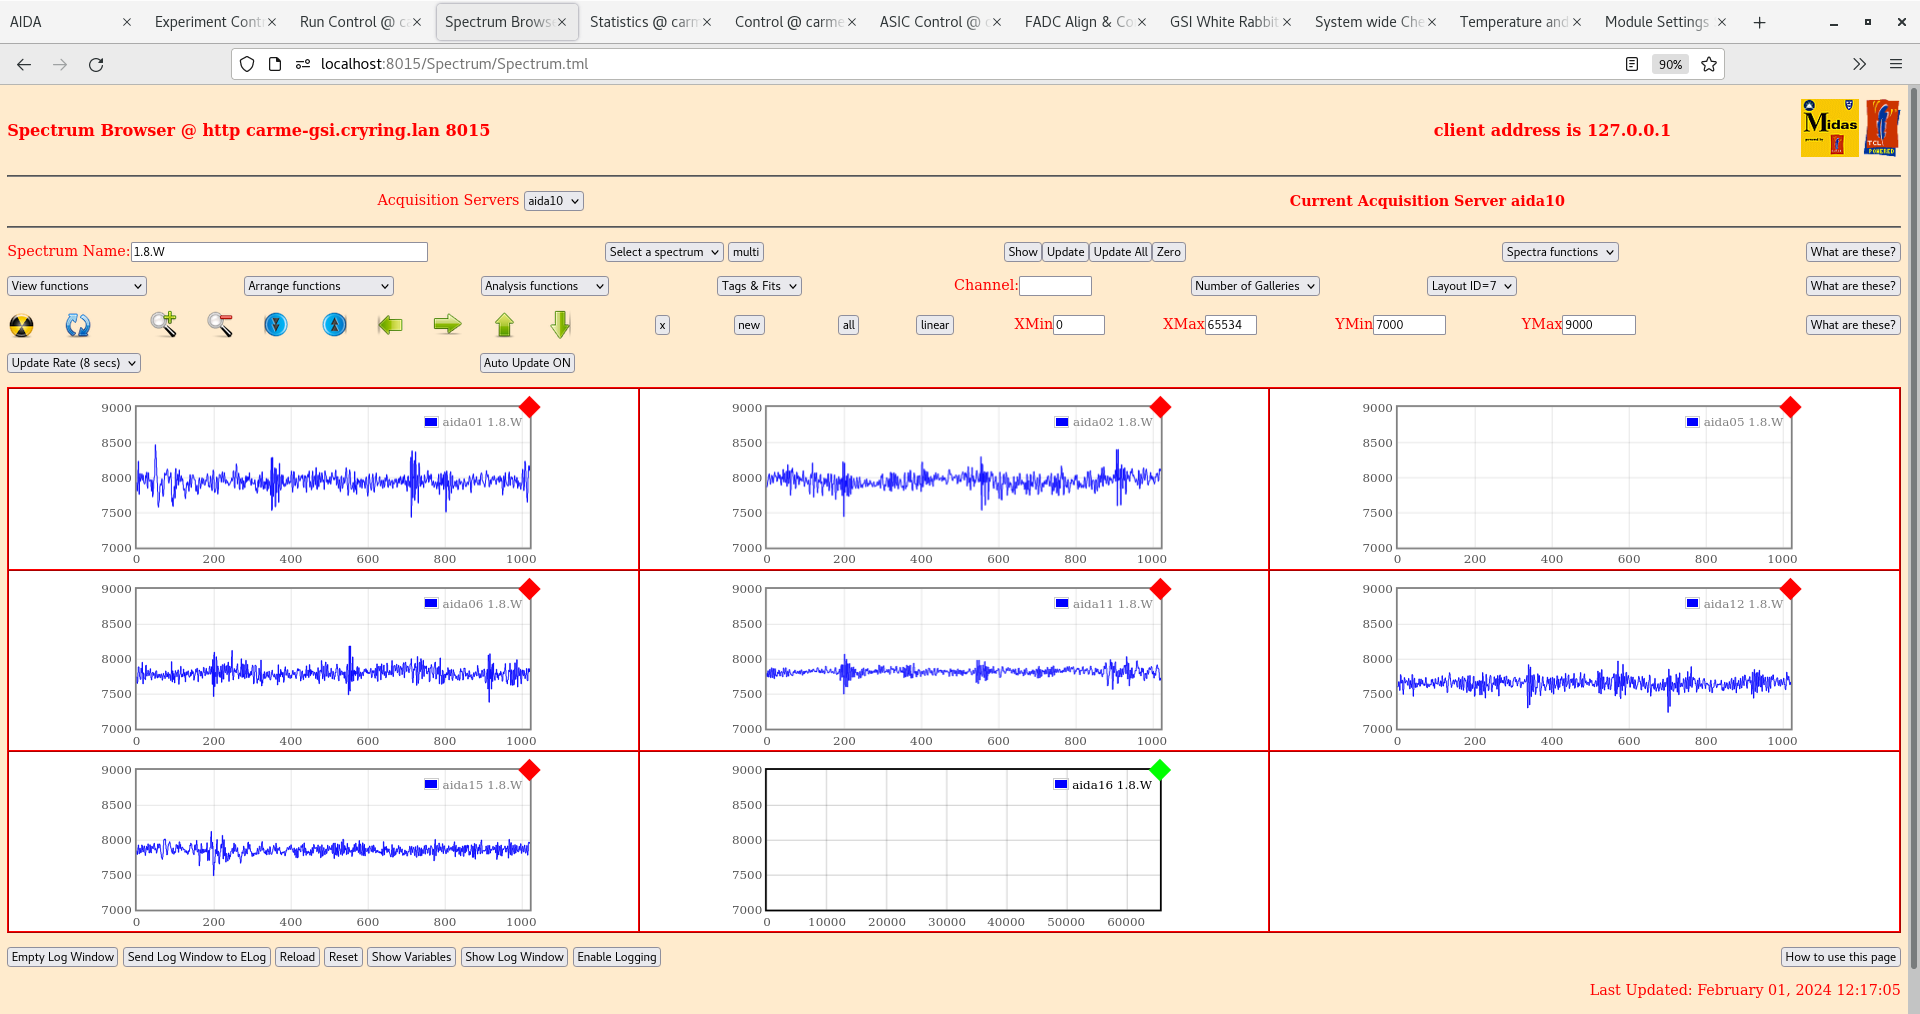
1.8W waveforms - attachment 4,5
11:20 Changed shaping time from 0xf to 0x3 (2us)
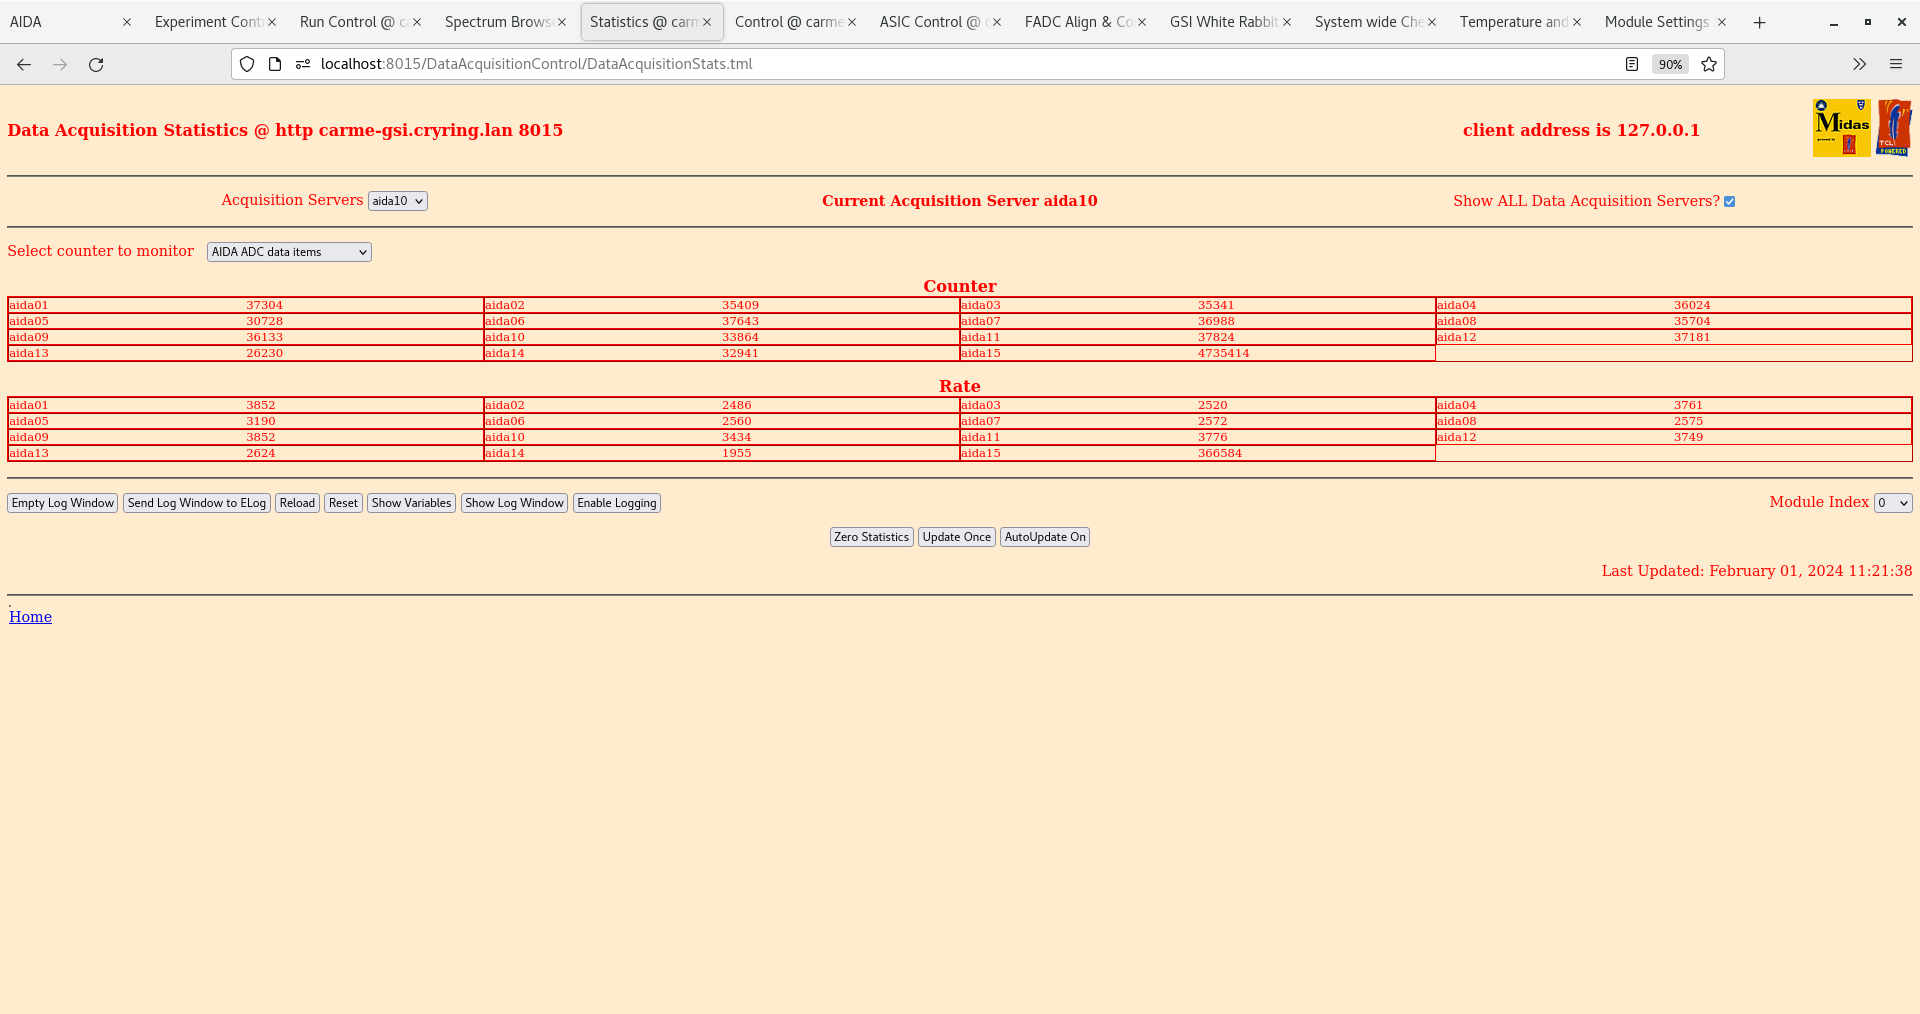
ADC data items check OK - all ~3k attachment 6
Rates - all OK - attachment 7
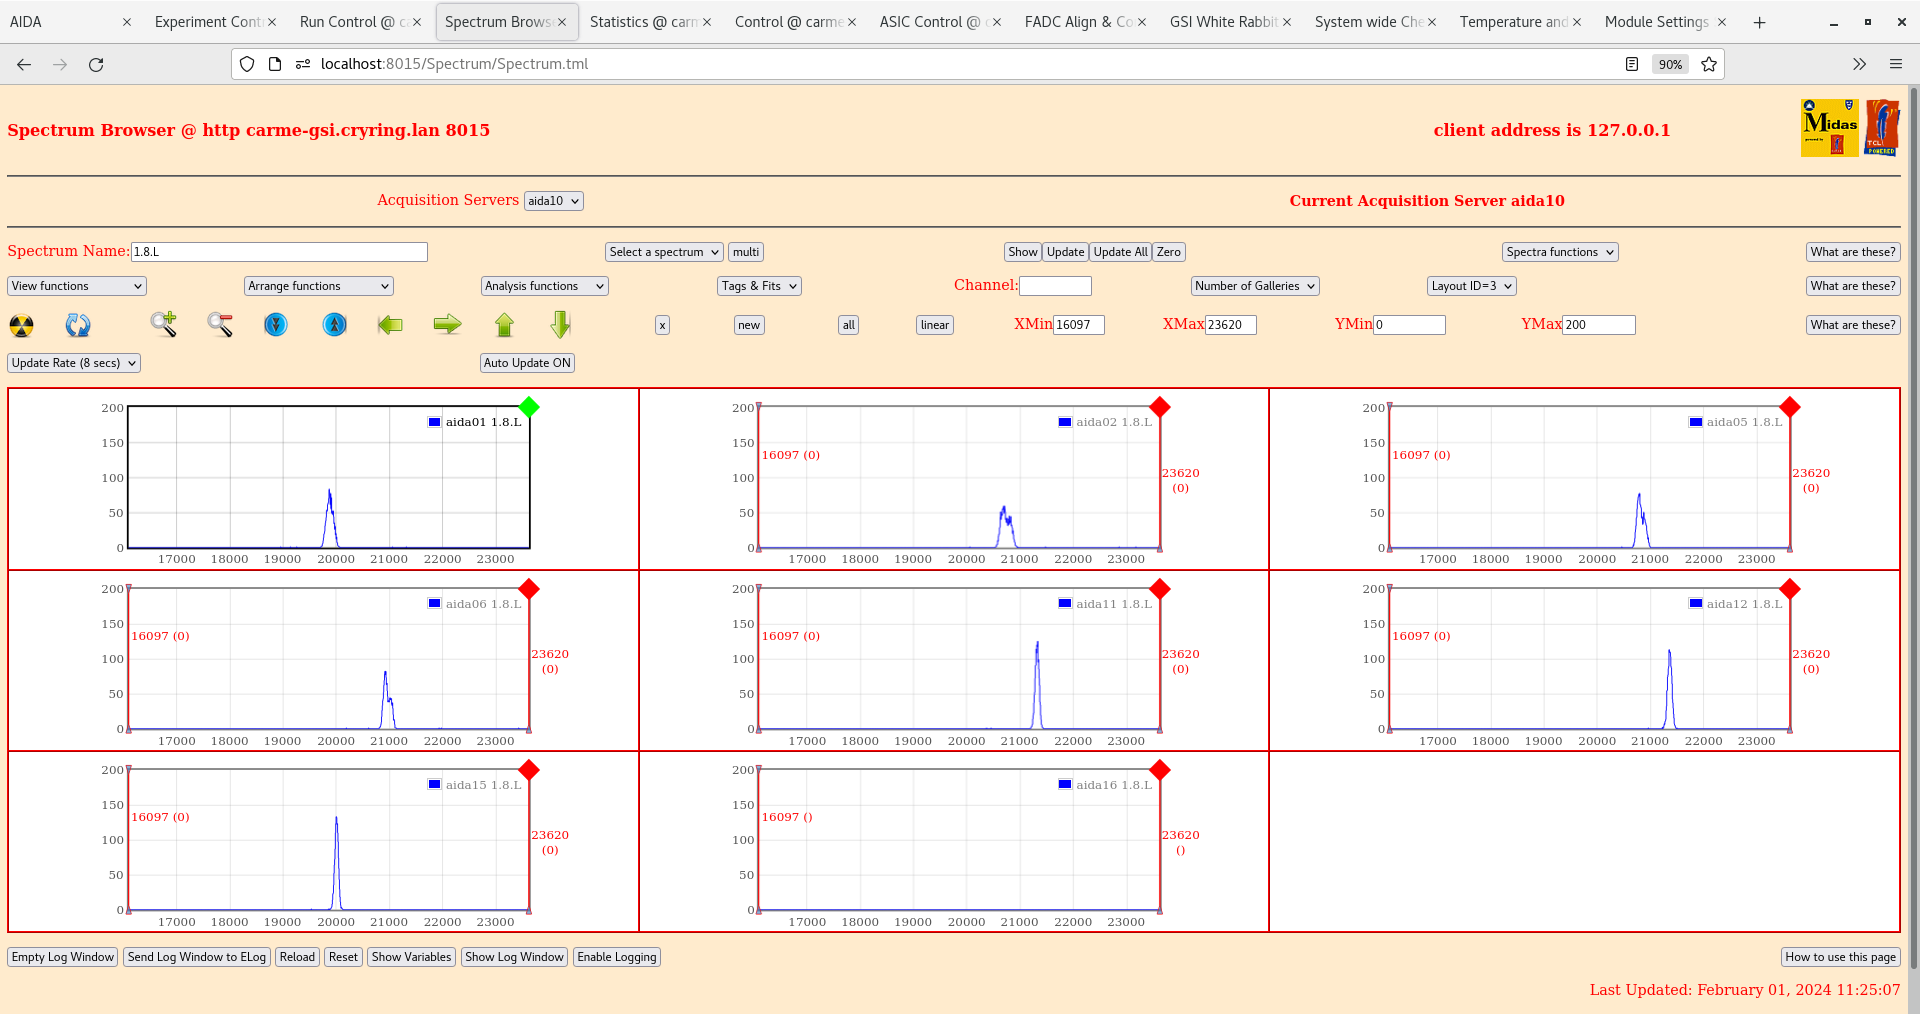
1.8L pn spectra. - attachment 8
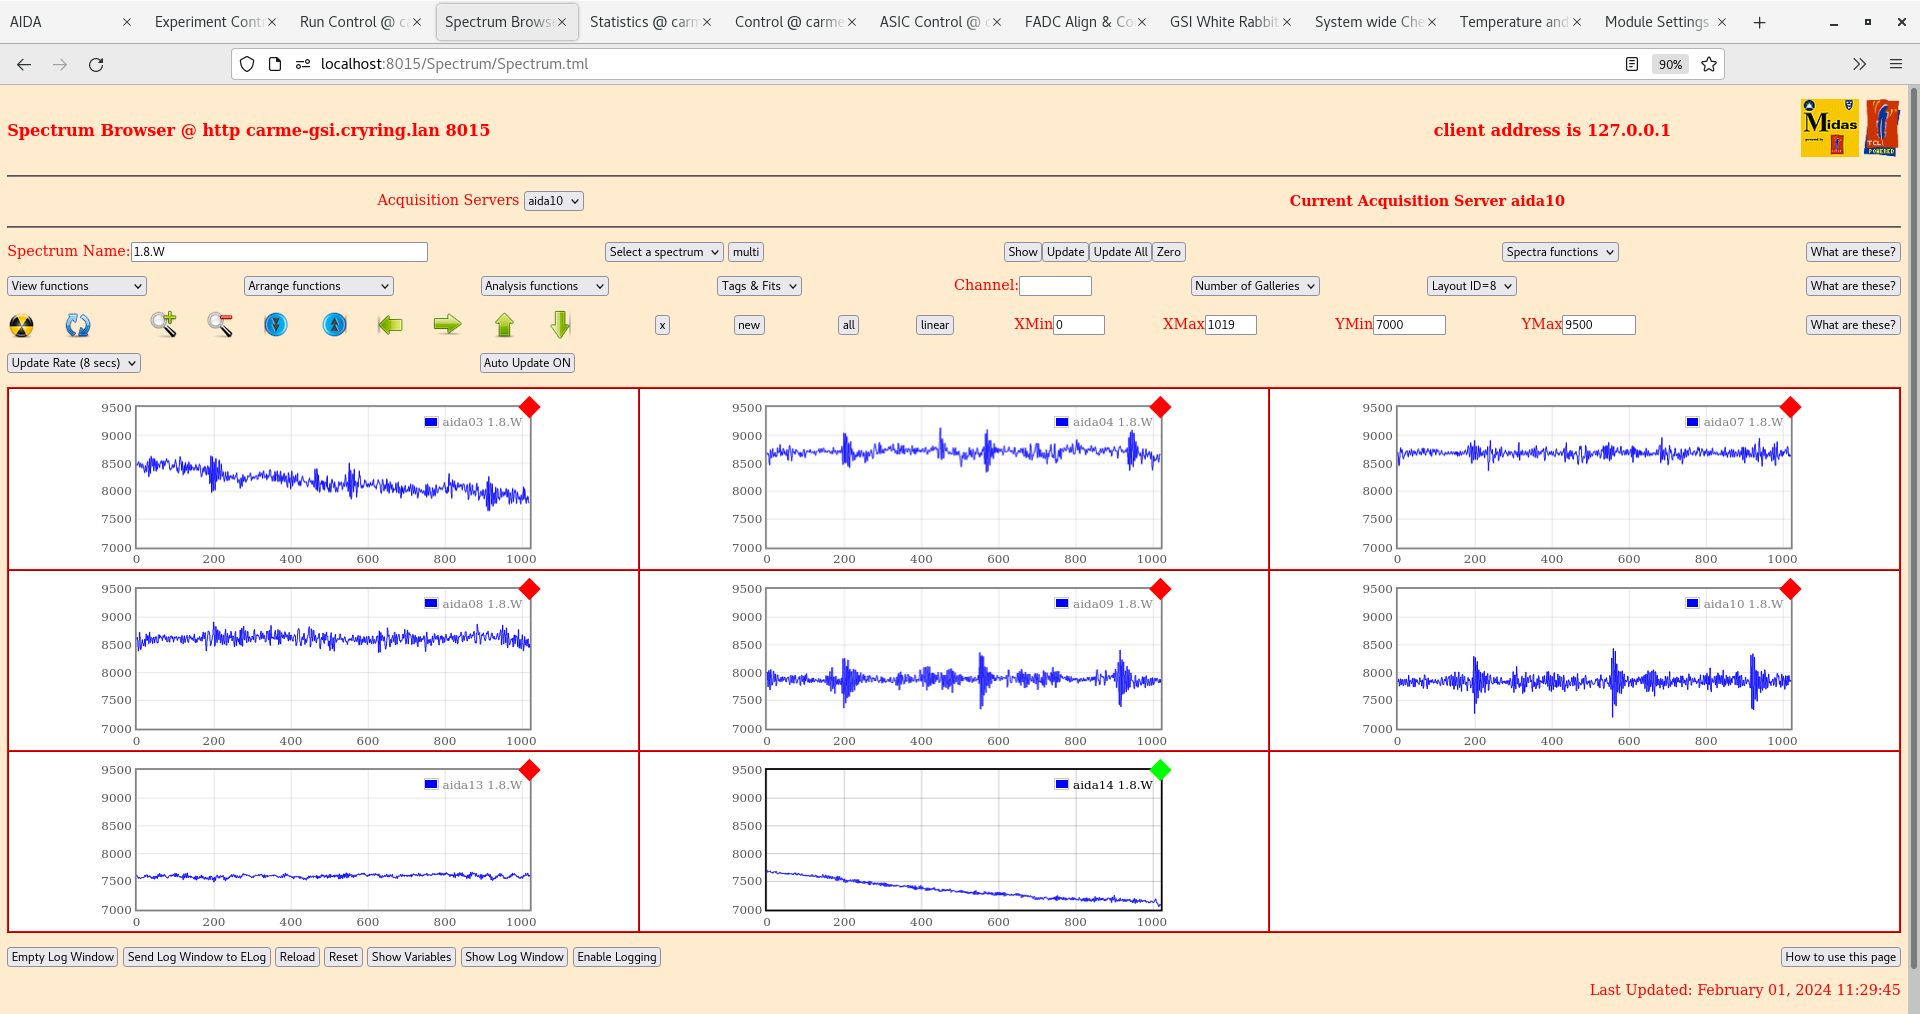
1.8W waveforms - attachment 9,10
11:35 Changed shaping time from 0x3 to 0x7 (4us)
ADC data items check OK - all ~3k attachment 11
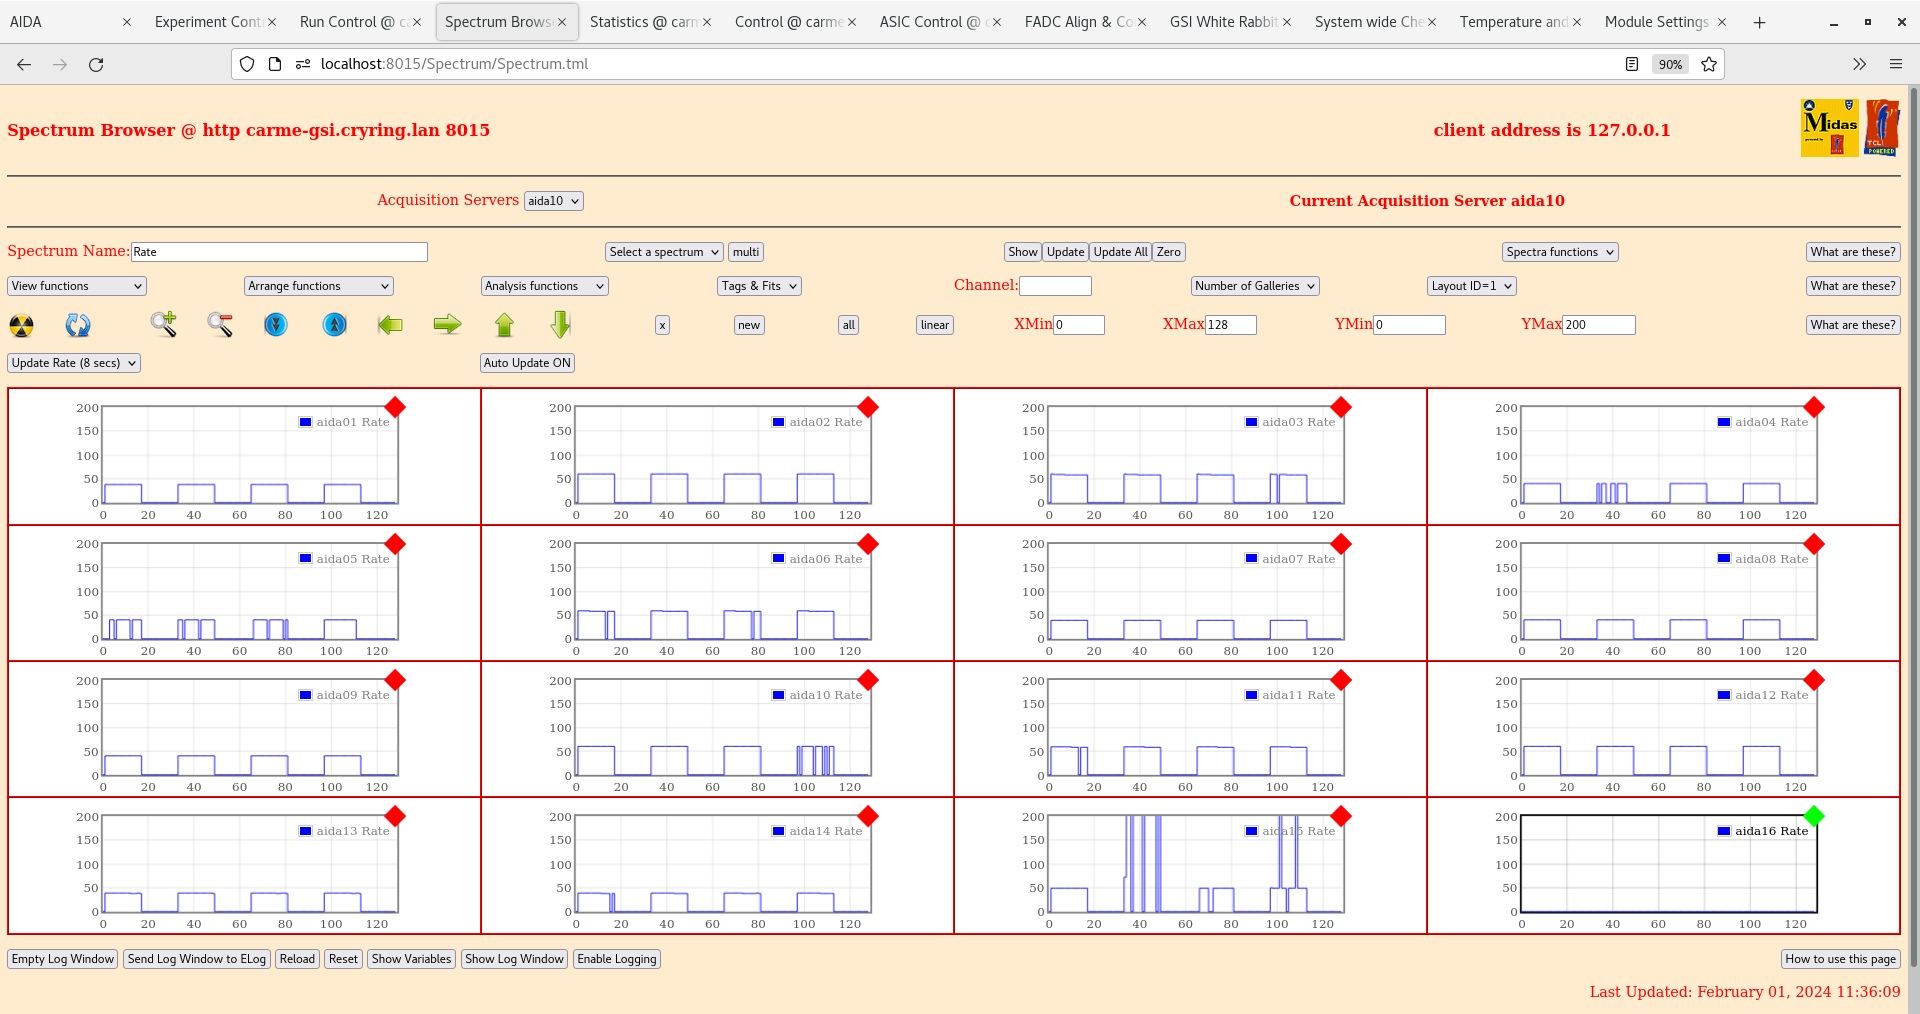
Rates - all OK - attachment 12
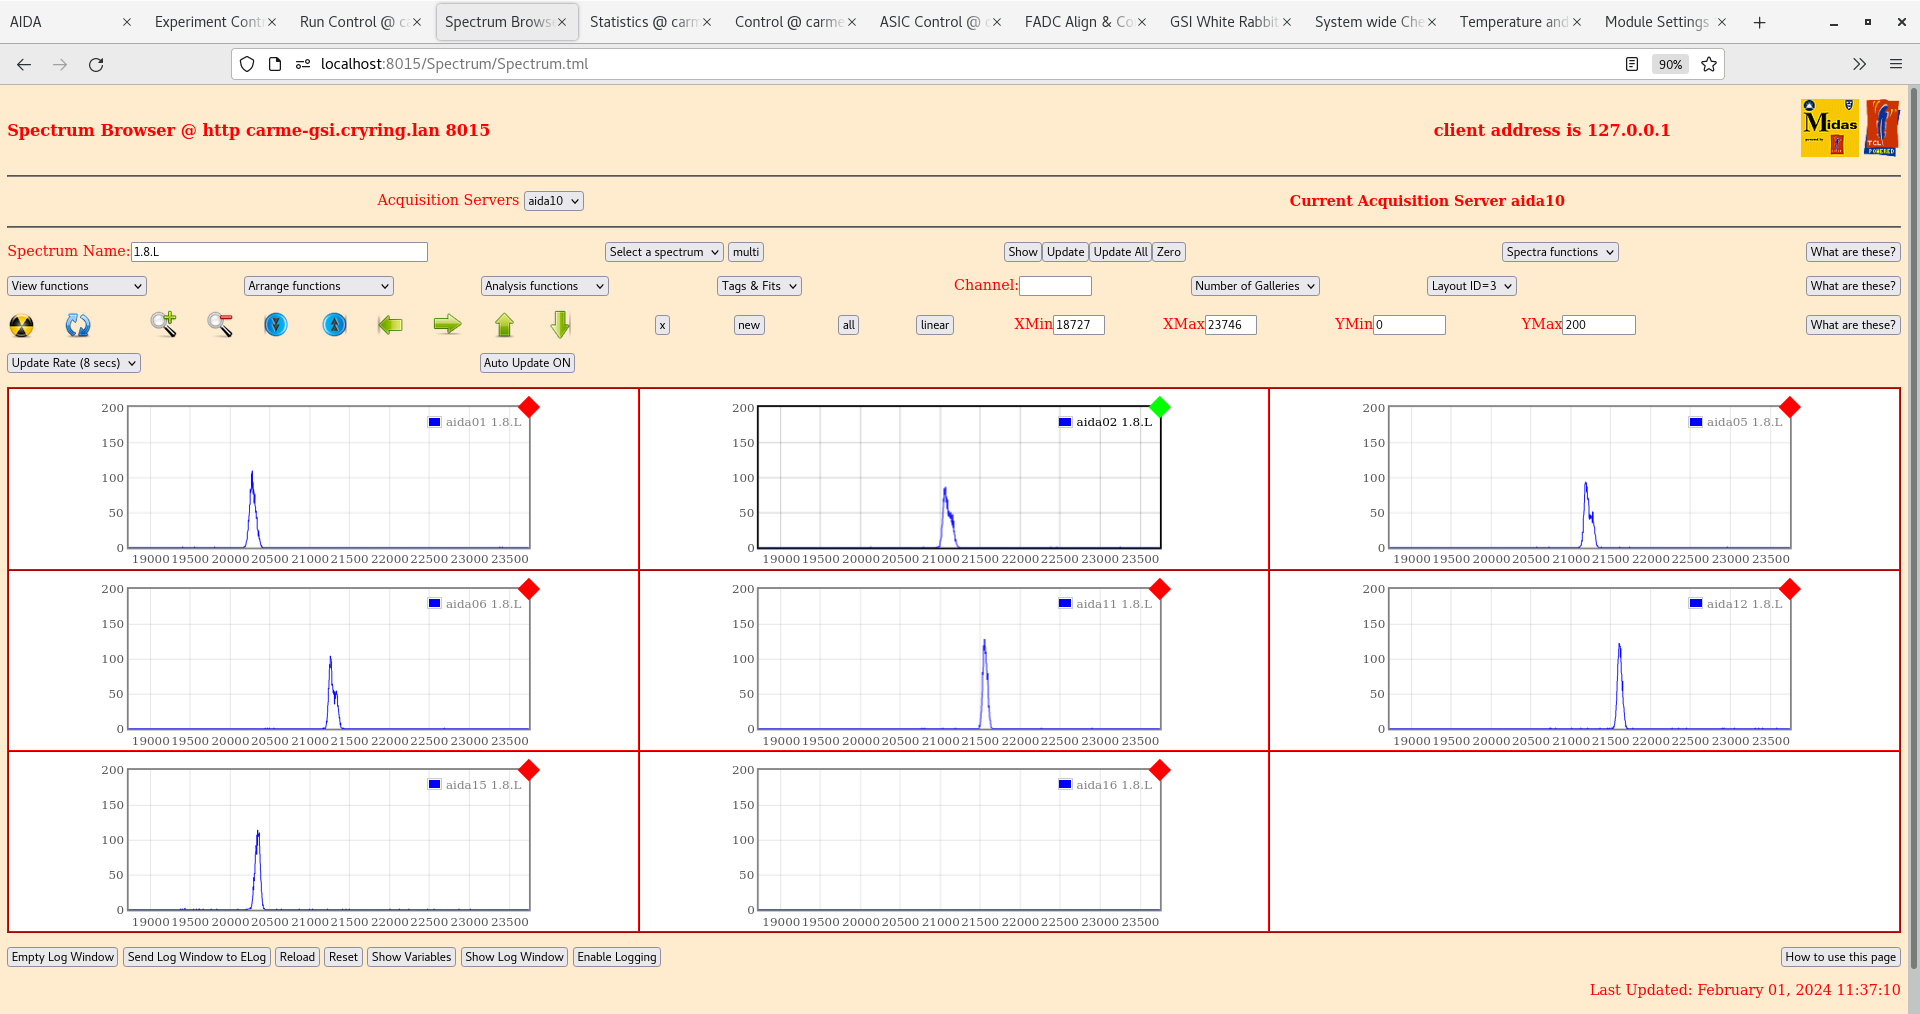
1.8L pn spectra. - attachment 13
1.8W waveforms - attachment 14,15
11:45 Changed shaping time from 0x7 to 0xb (6us)
ADC data items check OK - all ~3k - attachment 16
Rates - all OK - attachment 17
1.8L spectra. - attachment 18,19
1.8W waveforms - attachment 20,21
11:59 Changed shaping time from 0xb to 0xd (7us)
ADC data items check OK - all ~3k - attchment 22
Rates - all OK - attachment 23
1.8L pn spectra. - attachment 24
1.8W waveforms - attachment 25, 26
12:09 Changed shaping time back to 0xf (8us)
ADC data items check OK - all ~3k - attchment 27
Rates - all OK - attachment 28
1.8L pn spectra. - attachment 29
1.8W waveforms - attachment 30,31
13:10 Power cycled FEE modules. nn pulser for FEEs 9,10,13,14 are now active again (no changes made in the cave) Pulser widths for nn and pn both consistent with before lunch
|
| Attachment 1: Screenshot_from_2024-02-01_10-55-39.png
|

|
| Attachment 2: Screenshot_from_2024-02-01_11-01-55.png
|
|
| Attachment 3: Screenshot_from_2024-02-01_11-04-08.png
|

|
| Attachment 4: Screenshot_from_2024-02-01_11-06-41.png
|

|
| Attachment 5: Screenshot_from_2024-02-01_11-07-25.png
|

|
| Attachment 6: Screenshot_from_2024-02-01_11-21-46.png
|
|
| Attachment 7: Screenshot_from_2024-02-01_11-24-21.png
|

|
| Attachment 8: Screenshot_from_2024-02-01_11-25-17.png
|
|
| Attachment 9: Screenshot_from_2024-02-01_11-29-19.png
|

|
| Attachment 10: Screenshot_from_2024-02-01_11-29-58.png
|
|
| Attachment 11: Screenshot_from_2024-02-01_11-34-19.png
|

|
| Attachment 12: Screenshot_from_2024-02-01_11-36-16.png
|
|
| Attachment 13: Screenshot_from_2024-02-01_11-37-15.png
|
|
| Attachment 14: Screenshot_from_2024-02-01_11-41-14.png
|

|
| Attachment 15: Screenshot_from_2024-02-01_11-41-50.png
|

|
| Attachment 16: Screenshot_from_2024-02-01_11-45-20.png
|

|
| Attachment 17: Screenshot_from_2024-02-01_11-46-03.png
|

|
| Attachment 18: Screenshot_from_2024-02-01_11-46-56.png
|

|
| Attachment 19: Screenshot_from_2024-02-01_11-50-59.png
|

|
| Attachment 20: Screenshot_from_2024-02-01_11-52-32.png
|

|
| Attachment 21: Screenshot_from_2024-02-01_11-53-17.png
|

|
| Attachment 22: Screenshot_from_2024-02-01_11-59-19.png
|

|
| Attachment 23: Screenshot_from_2024-02-01_12-00-18.png
|

|
| Attachment 24: Screenshot_from_2024-02-01_12-01-00.png
|

|
| Attachment 25: Screenshot_from_2024-02-01_12-07-16.png
|

|
| Attachment 26: Screenshot_from_2024-02-01_12-07-48.png
|

|
| Attachment 27: Screenshot_from_2024-02-01_12-10-03.png
|

|
| Attachment 28: Screenshot_from_2024-02-01_12-10-47.png
|

|
| Attachment 29: Screenshot_from_2024-02-01_12-12-15.png
|

|
| Attachment 30: Screenshot_from_2024-02-01_12-17-28.png
|
|
| Attachment 31: Screenshot_from_2024-02-01_12-18-20.png
|

|
|
408
|
Sat Jun 24 10:38:42 2023 |
JM, TD | Section 9 closed, begin pumping |
23/06/23
The CARME chamber and interaction chamber were connected and section 9 has been fully closed. New valves have been installed on the interaction chamber, in addition to new diamond windows. A leak cart has been connected to the backing line of CARME. Before begining the pumpdown, the manual valve between the interaction chamber and the electron target was closed.
The pumpdown was started at 17:15, the valve on the scroll pump was very slowly opened to not damage the berylium window. By 18:00 a pressure of 1 mbar was achieved and the turbopump was activated. By 18:20 a pressure of 2E-3 mbar was achieved, the ion gauge was activated and briefly flashed 5E-4 mbar but this is over its limit so the gauge shutdown. At 19:20, 1.3E-3 mbar was achieved, the ion gauge was activated but the reading was 1.7E-4 mbar which is still over its limit. The turbo fan was not working and temperatures on the turbo were ~50C and increasing, so it was decided to close the main gate valve and turno off the turbo overnight in order to fix the fan.
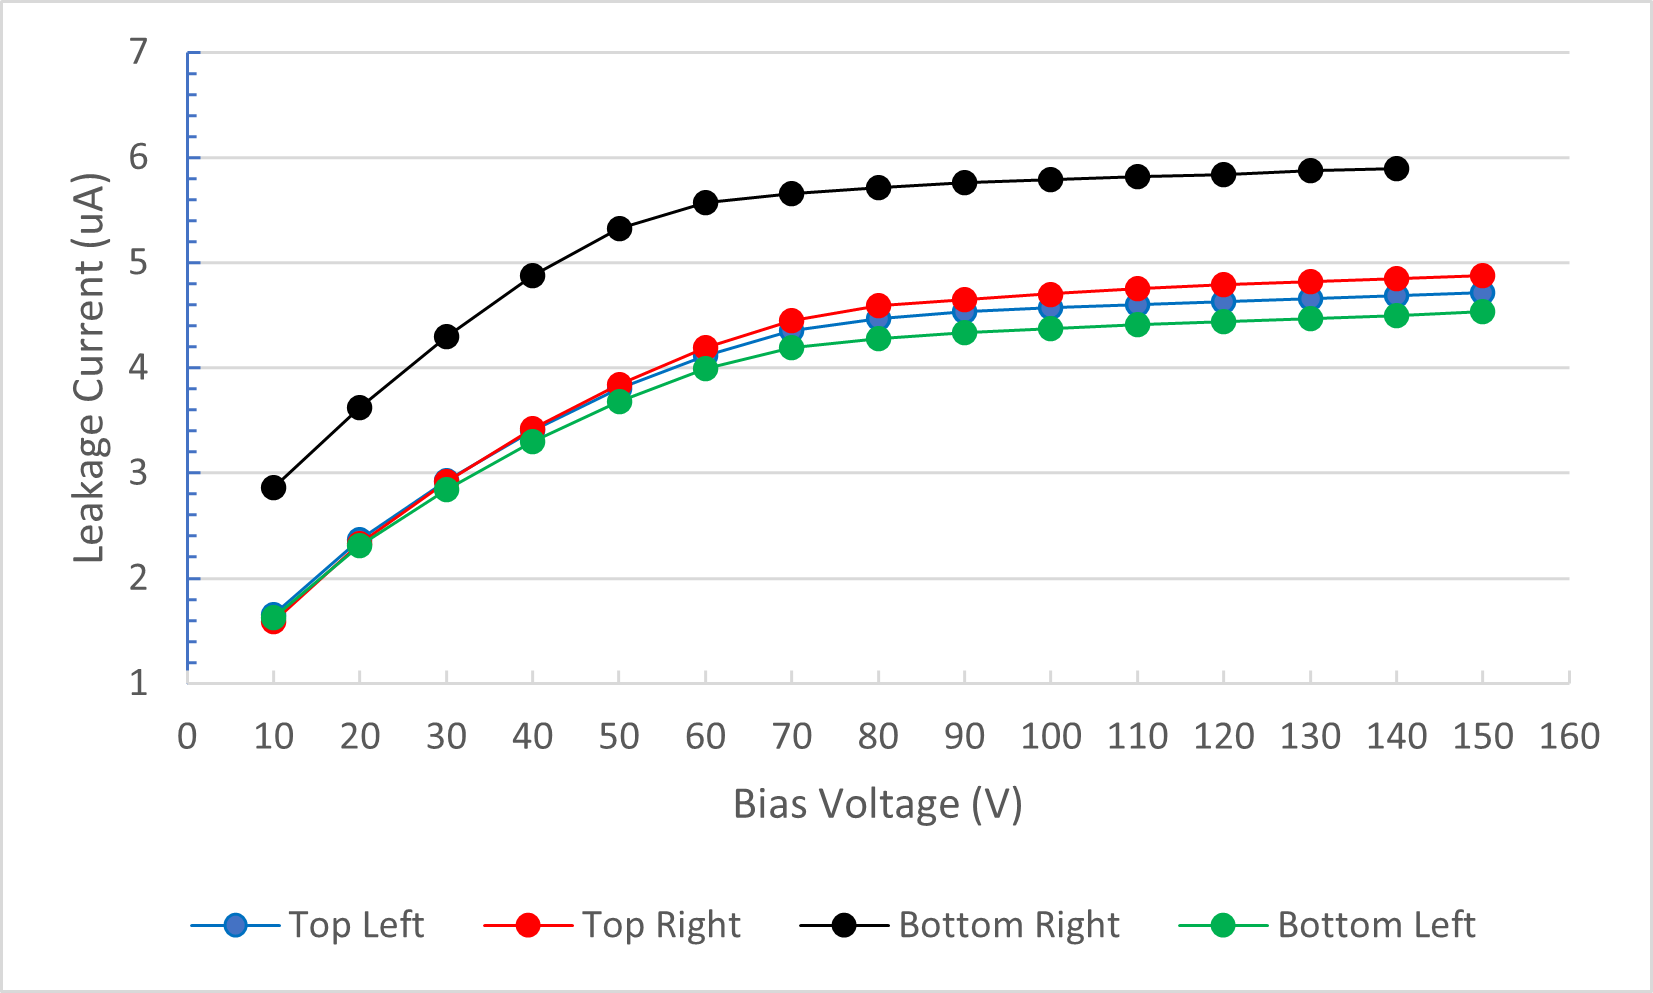
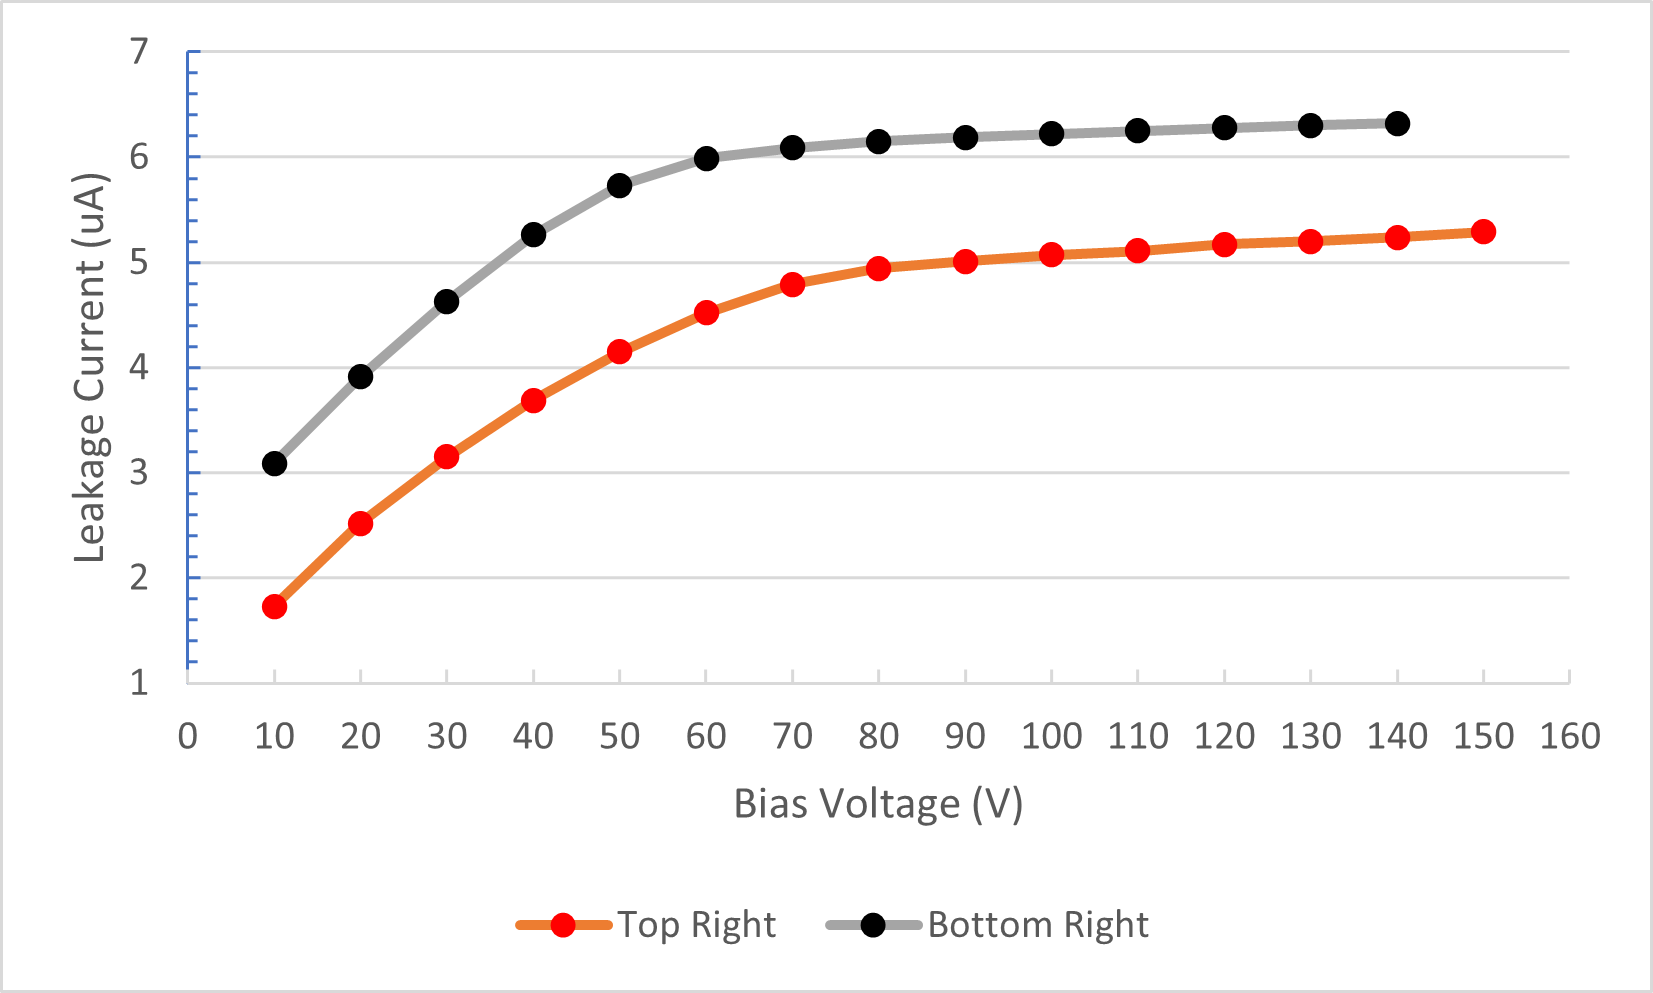
A bias test of the detectors was also performed while in vacuum, T=20.5 C. All detectors show expected V-I curve and the leakage current is ~1-2 uA lower than the previous test in air, probably due to reduced light leaks. The top right detector did initially produce >10 uA at 20 V but the adaptor card was not properly seated on the p-n feed-through. Seating the adaptor card correctly yielded the expected V-I curve. Further inspection of the pins on this feed-through will be performed tomorrow.
24/06/23
Overnight the pressure had increased to 0.8 mbar. Opening the gate valve decreased the pressure by an order of magnitude. The turbo fan was fixed and the turbo was re-activated, the pressure dropped to 1E-3 mbar level within 20 minutes. Ion gauge was turned on after 30 minutes with a pressure of 3.7e-5 mbar. Pump down plot and comparison to previous pump downs will be uploaded in a seperate elog. Turbo pump maximum temperature reads 46C and has been consistent for several hours.
V-I tests completed for the right hand side detectors. Leakage currents ~0.4 uA higher than yesterday which is consistent with the increase in temperature of ~ 0.5-0.7C. |
| Attachment 1: 23-06-23-VI.png
|
|
| Attachment 2: 24-06-23-VI.png
|
|
|
222
|
Mon Feb 21 21:04:08 2022 |
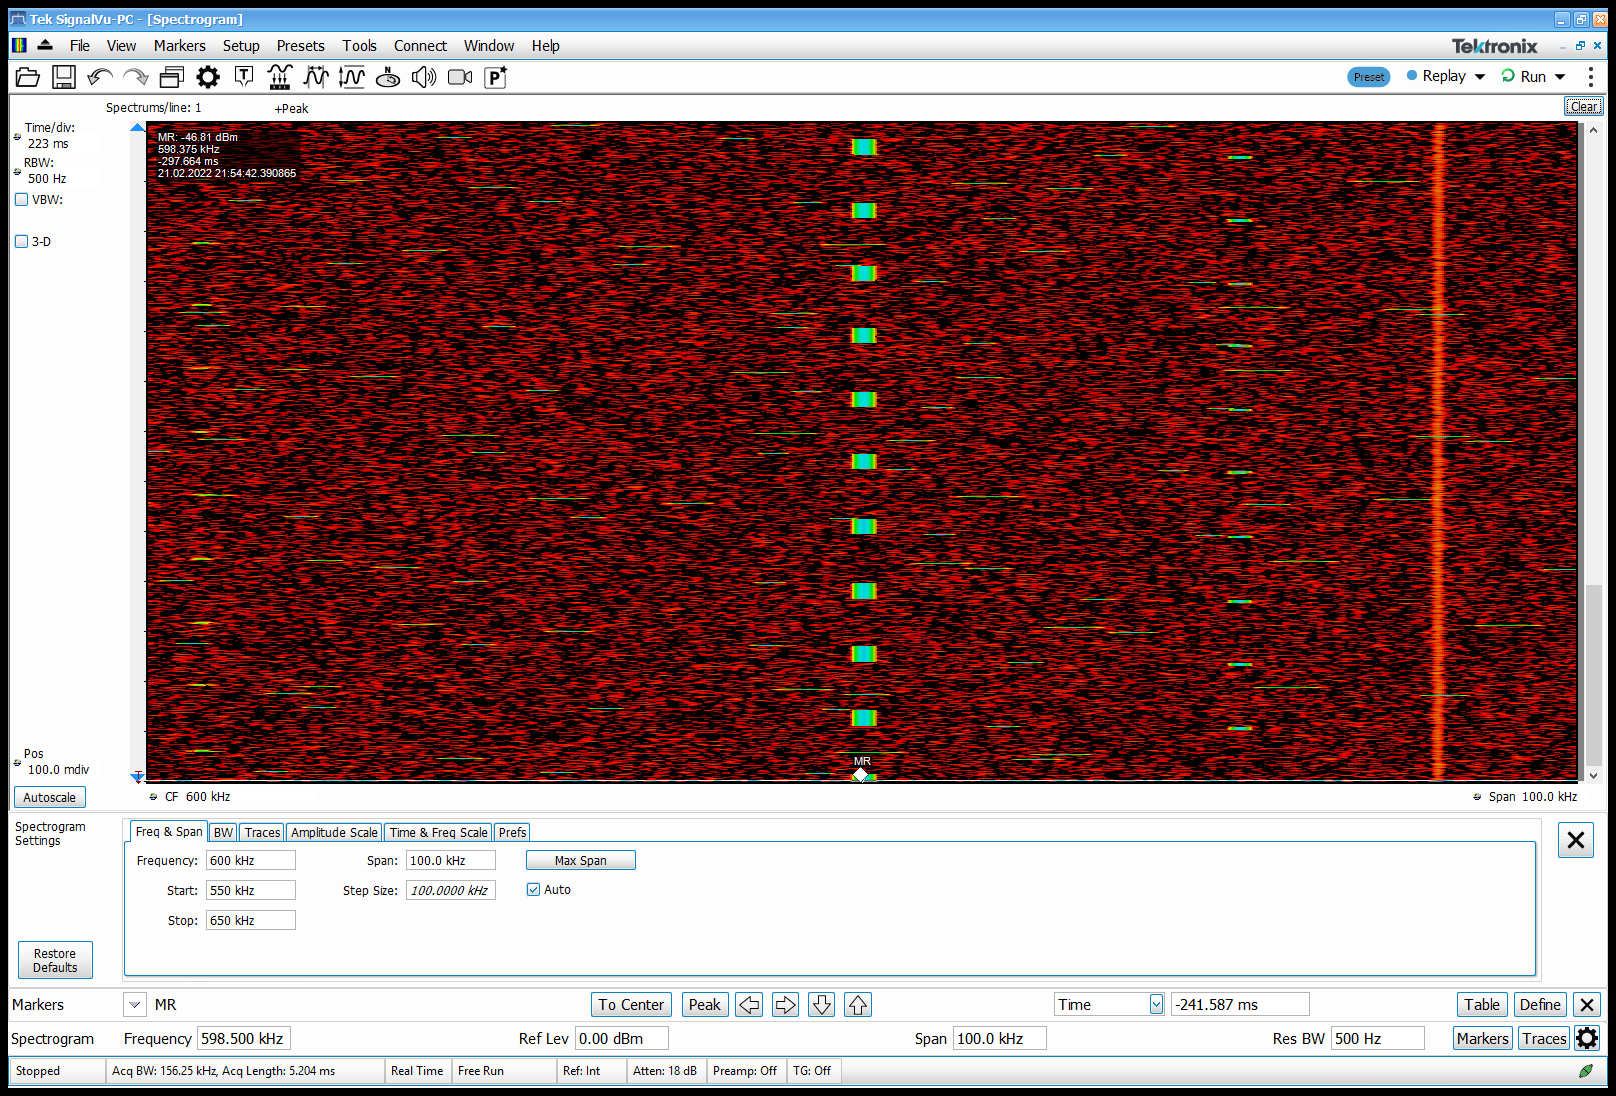
SHB, JM, CB, OH (remotely) | Schottky RF view from the beam inside |
|
| Attachment 1: pio-2022.02.21.21.54.46.895.PNG
|
|
|
662
|
Sat Apr 5 16:13:32 2025 |
TD | Saturday 5 April |
12.00 CARME IE514 ion gauge 4.2e-11 mbar
      CARME IE514 OFF


      aida08 red coolant line and HDMI cable found disconnected - blue coolant line, network cable and FEE^$ power are still connected
      Now re-connected


13.57 DSSSD bias & leakage current - attachment 1
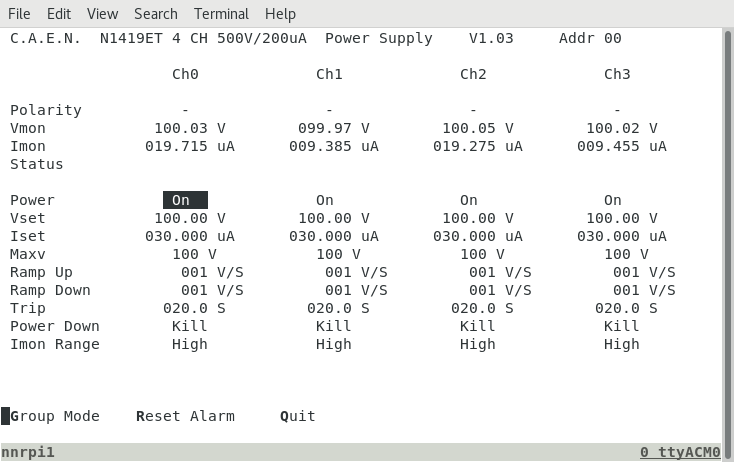
       leakage currents high (especially DSSSD#1 and DSSSD#3) cf. most recent values from June 2024 values https://elog.ph.ed.ac.uk/CARME/654
       another ion gauge on with line of sight to DSSSDs?

      FEE64 power ON

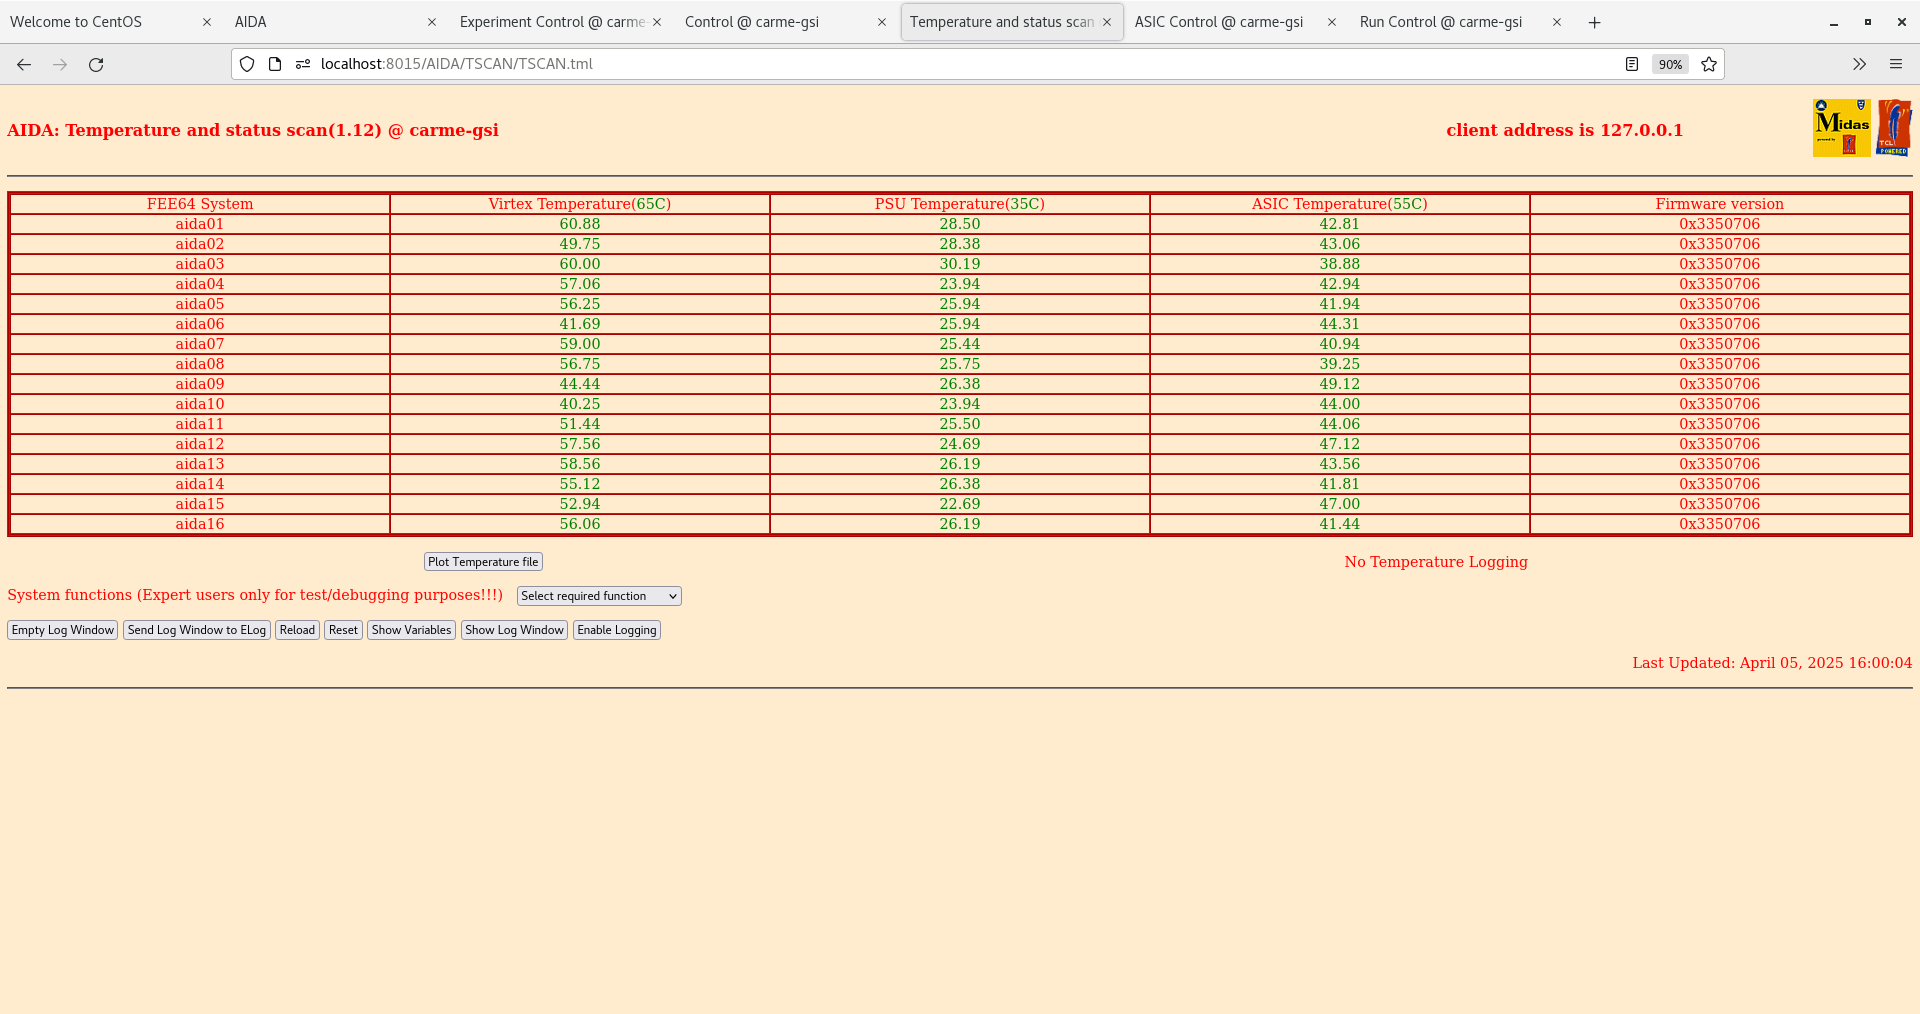
      FEE64 temps OK - attachment 2

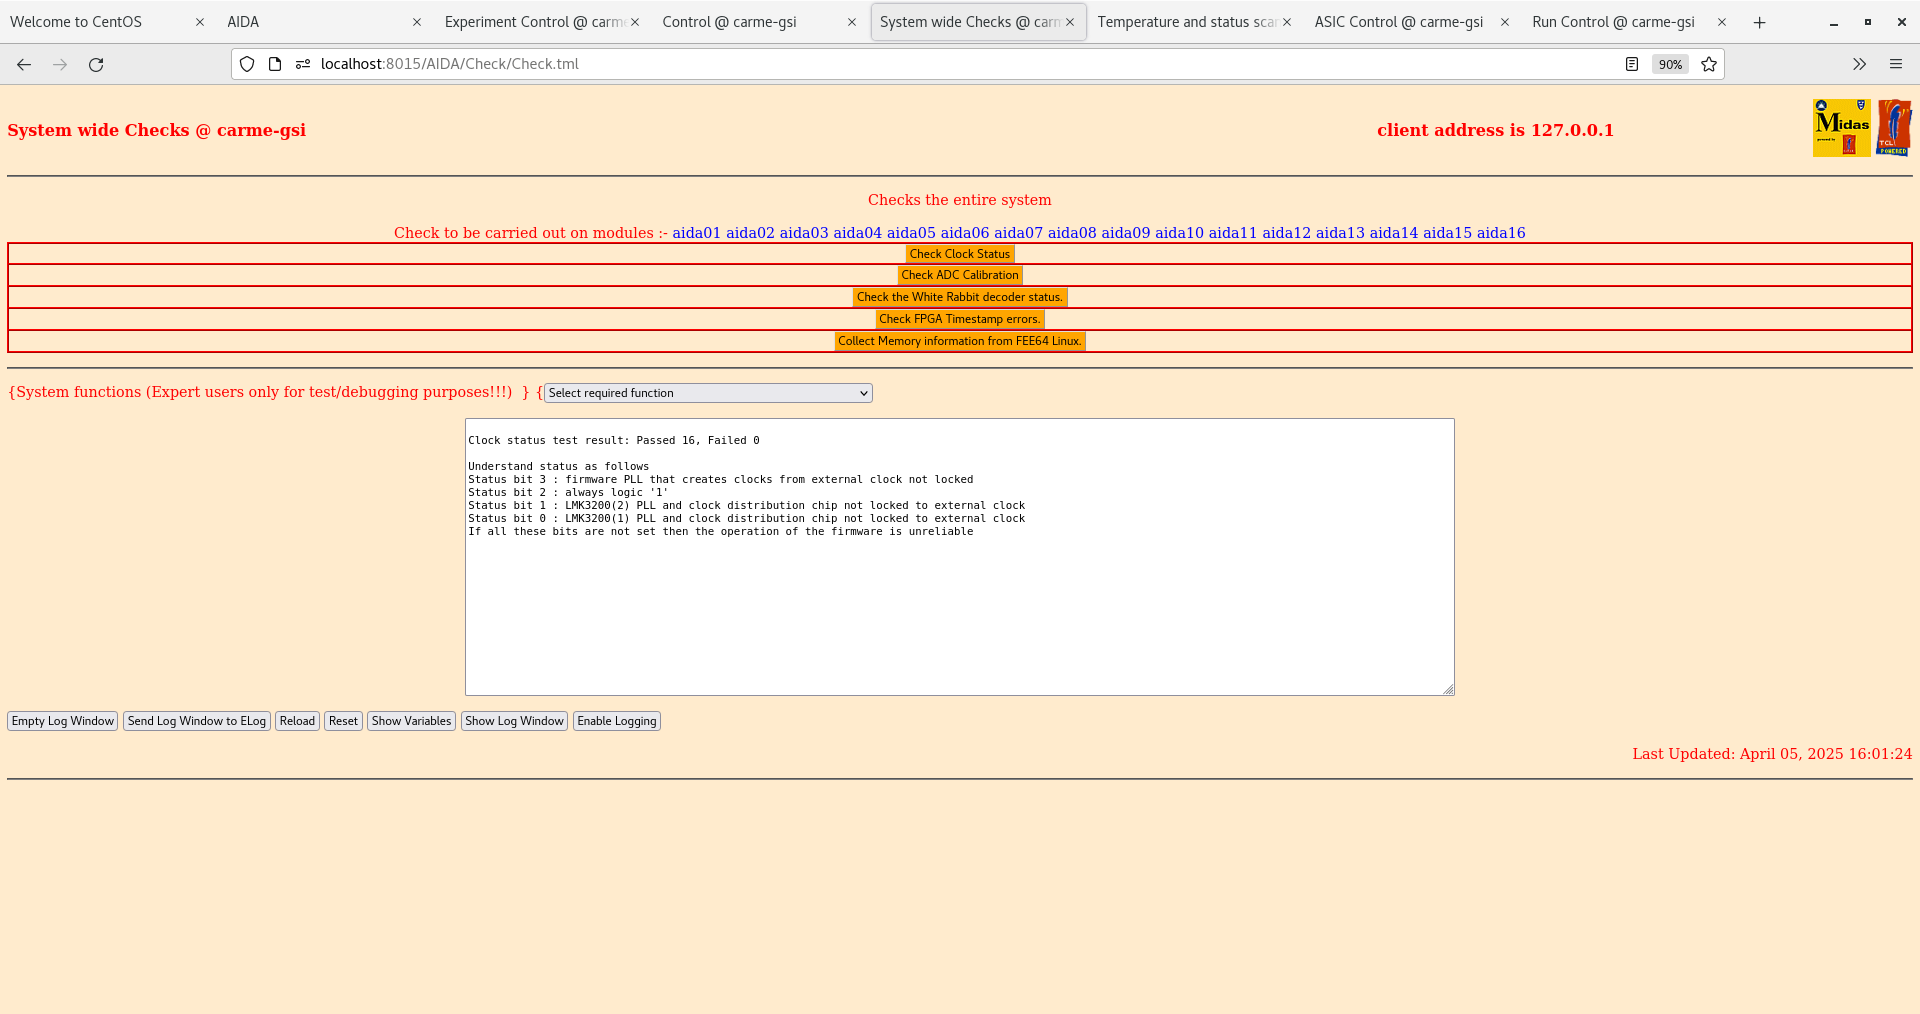
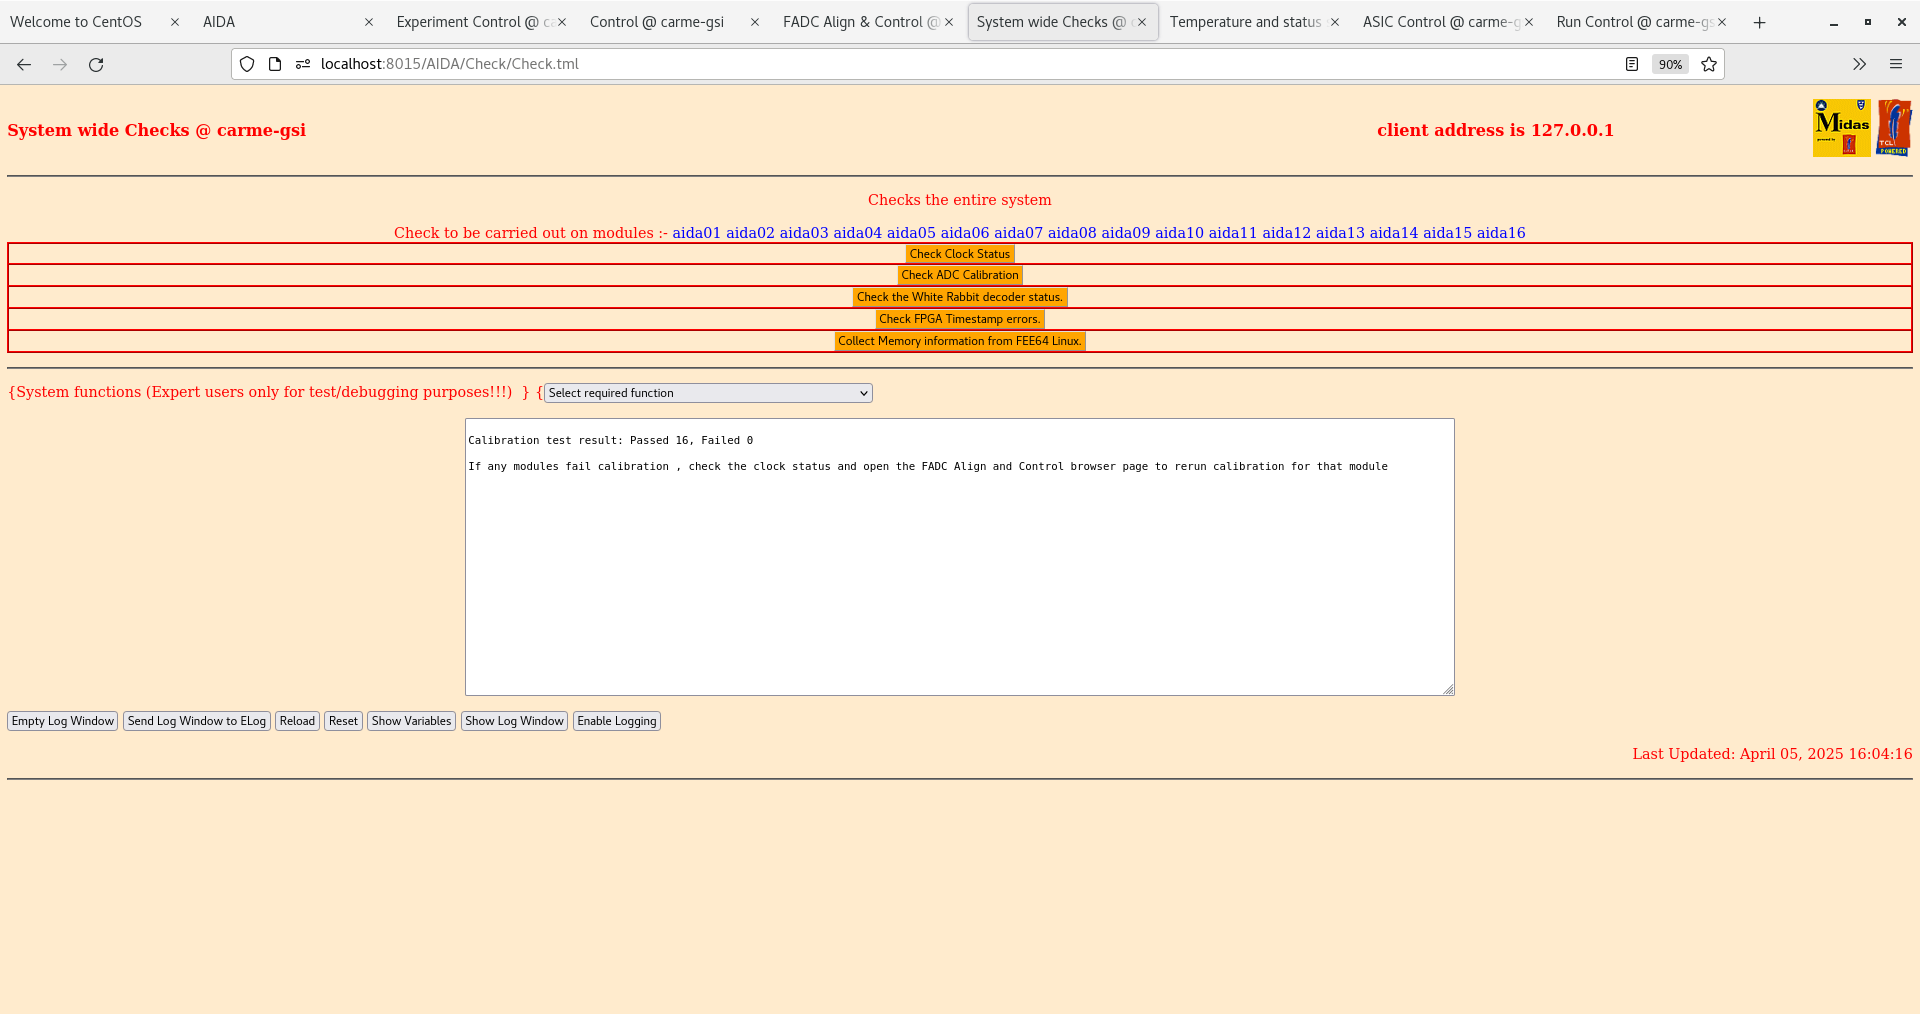
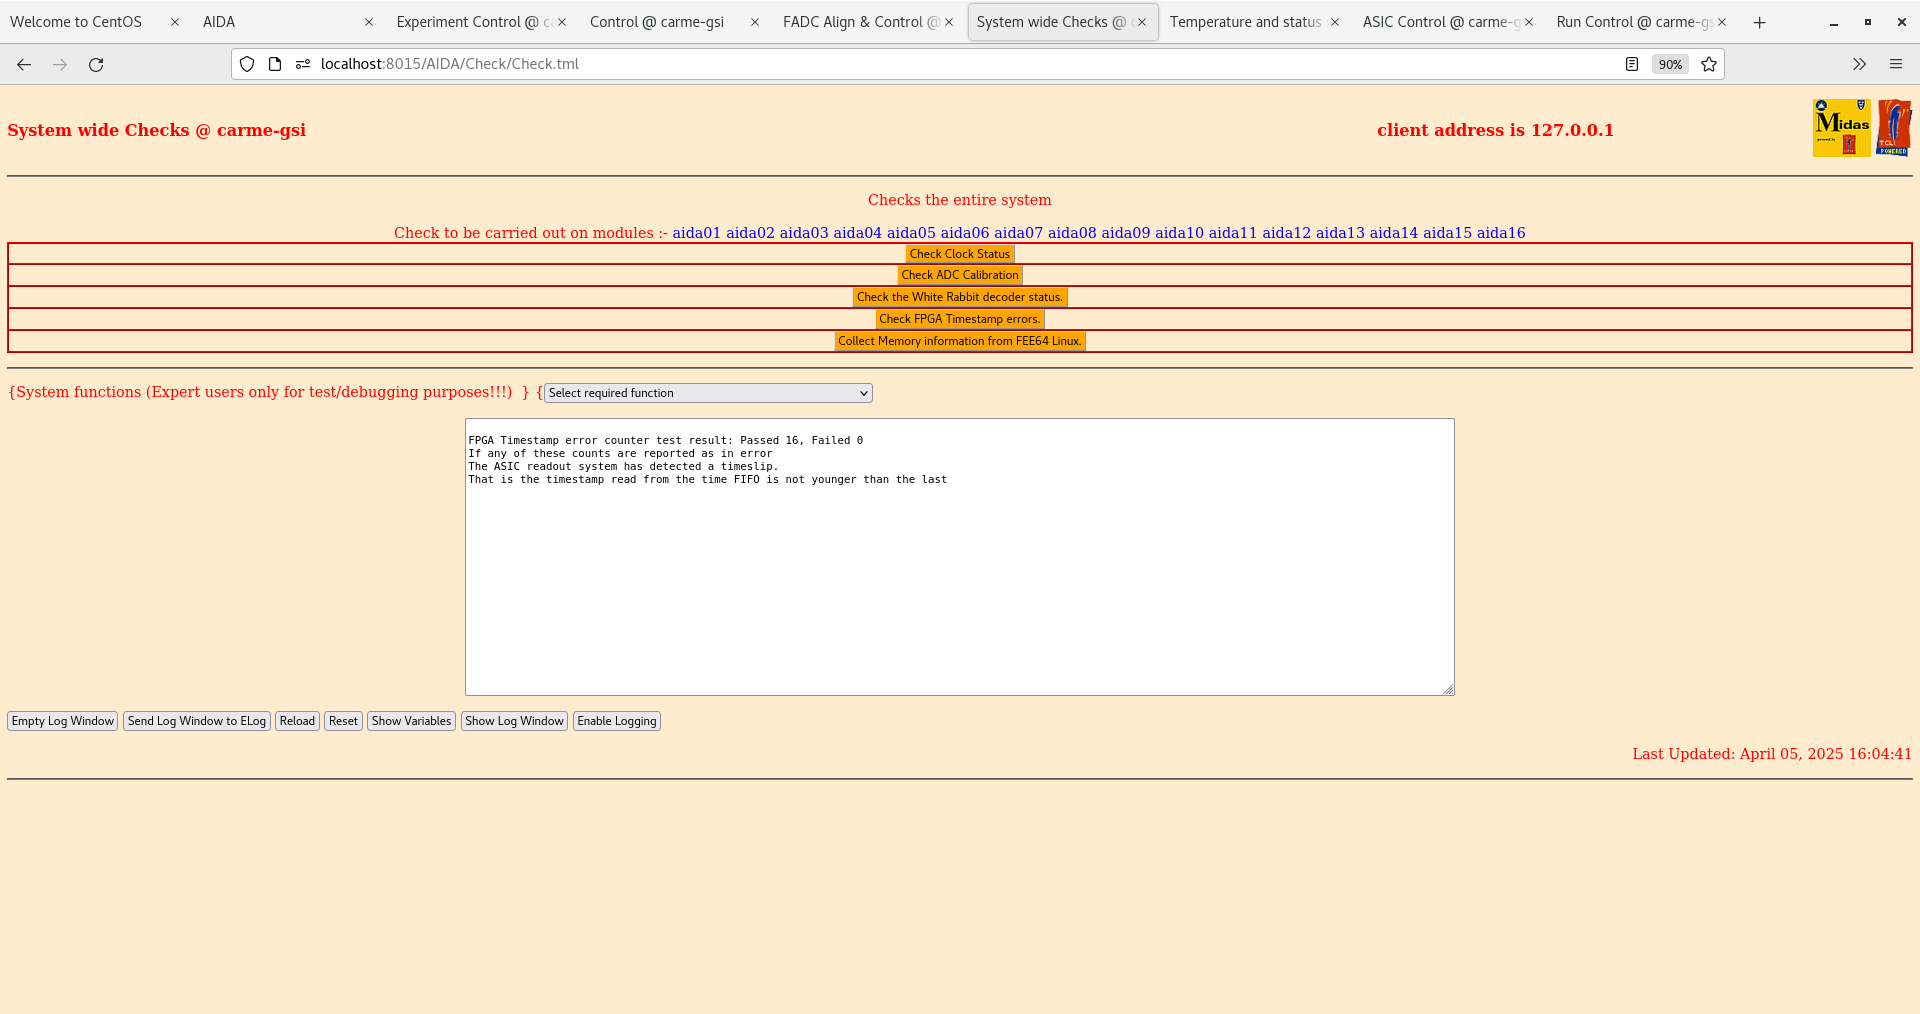
      All system wide checks OK - attachments 3-6

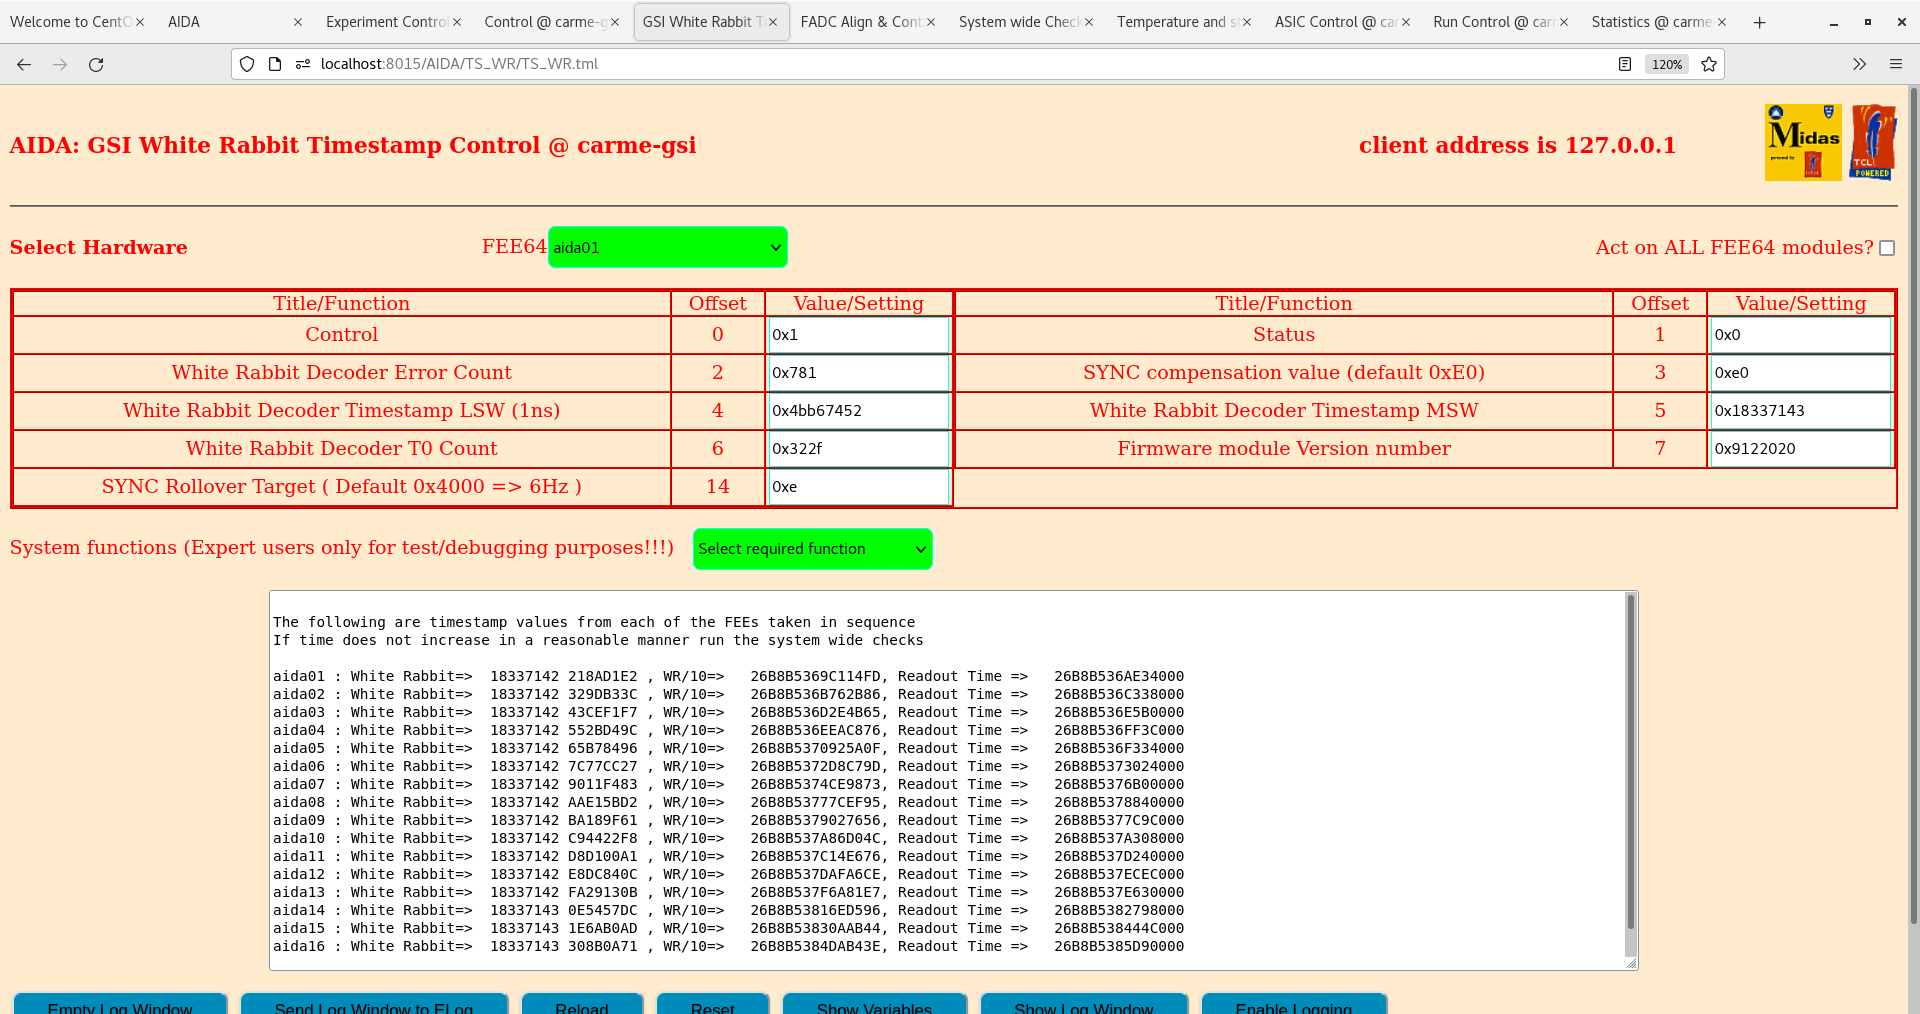
      WR timestamps OK - attachment 7


18.00 DSSSD bias OFF
FEE64 power OFF |
| Attachment 1: Screenshot_from_2025-04-05_13-57-06.png
|
|
| Attachment 2: Screenshot_from_2025-04-05_16-00-19.png
|
|
| Attachment 3: Screenshot_from_2025-04-05_16-01-31.png
|
|
| Attachment 4: Screenshot_from_2025-04-05_16-04-22.png
|
|
| Attachment 5: Screenshot_from_2025-04-05_16-04-36.png
|

|
| Attachment 6: Screenshot_from_2025-04-05_16-04-47.png
|
|
| Attachment 7: Screenshot_from_2025-04-05_16-06-41.png
|
|
|
449
|
Sat Sep 30 10:58:14 2023 |
TD | Saturday 30 September |
10.50 CARME IE514 7.14e-10 mbar, ambient temperature 20.8 deg C

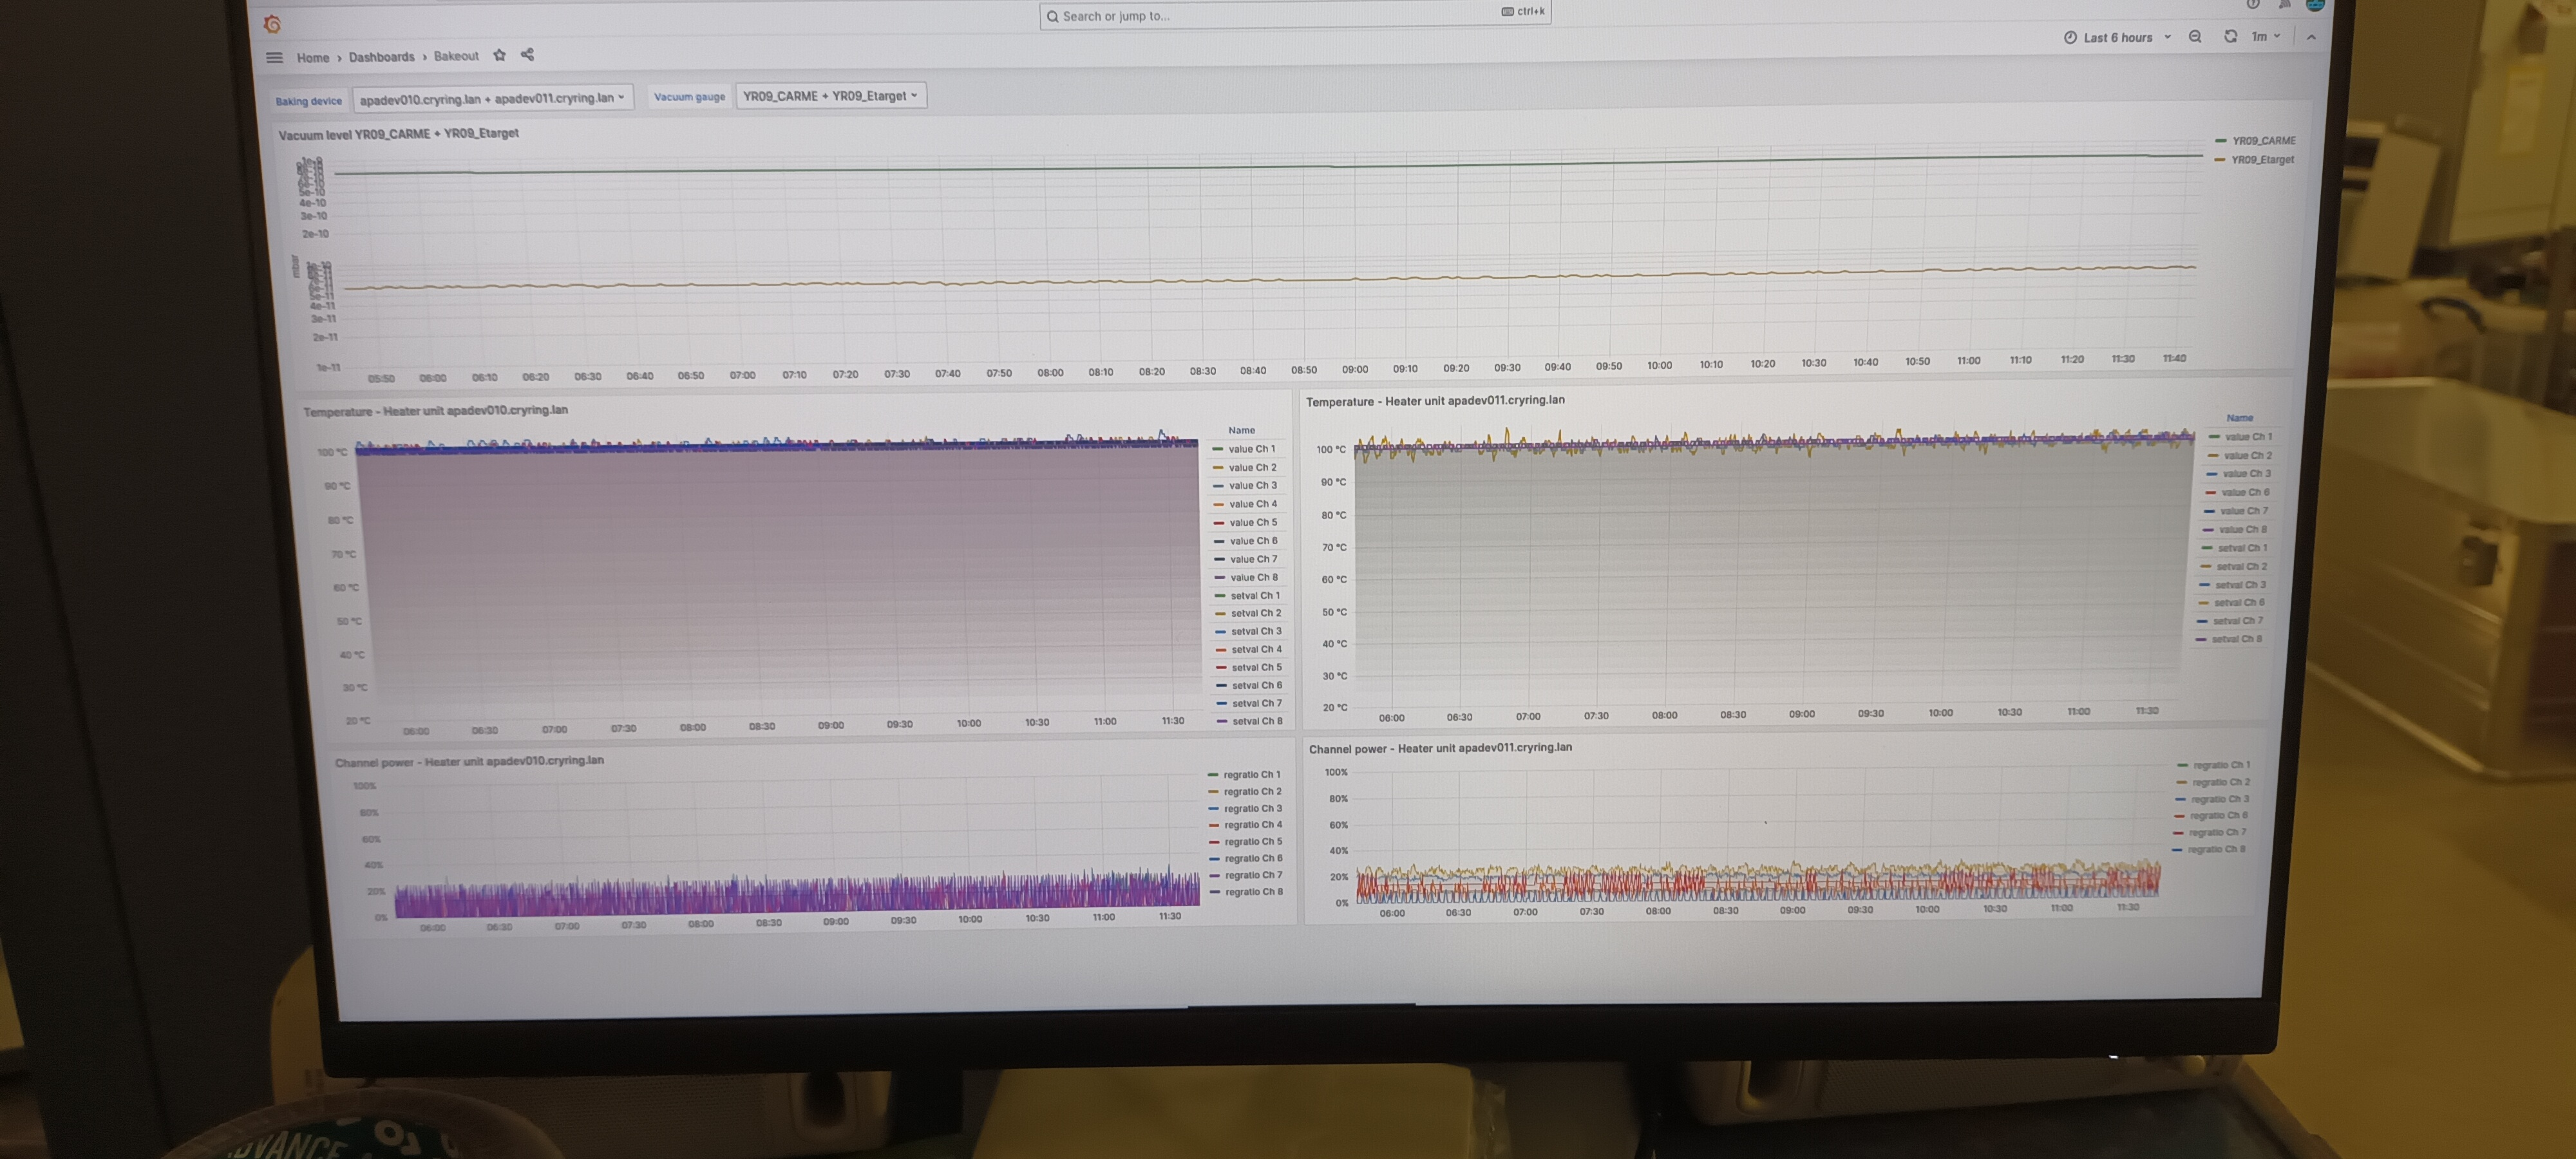
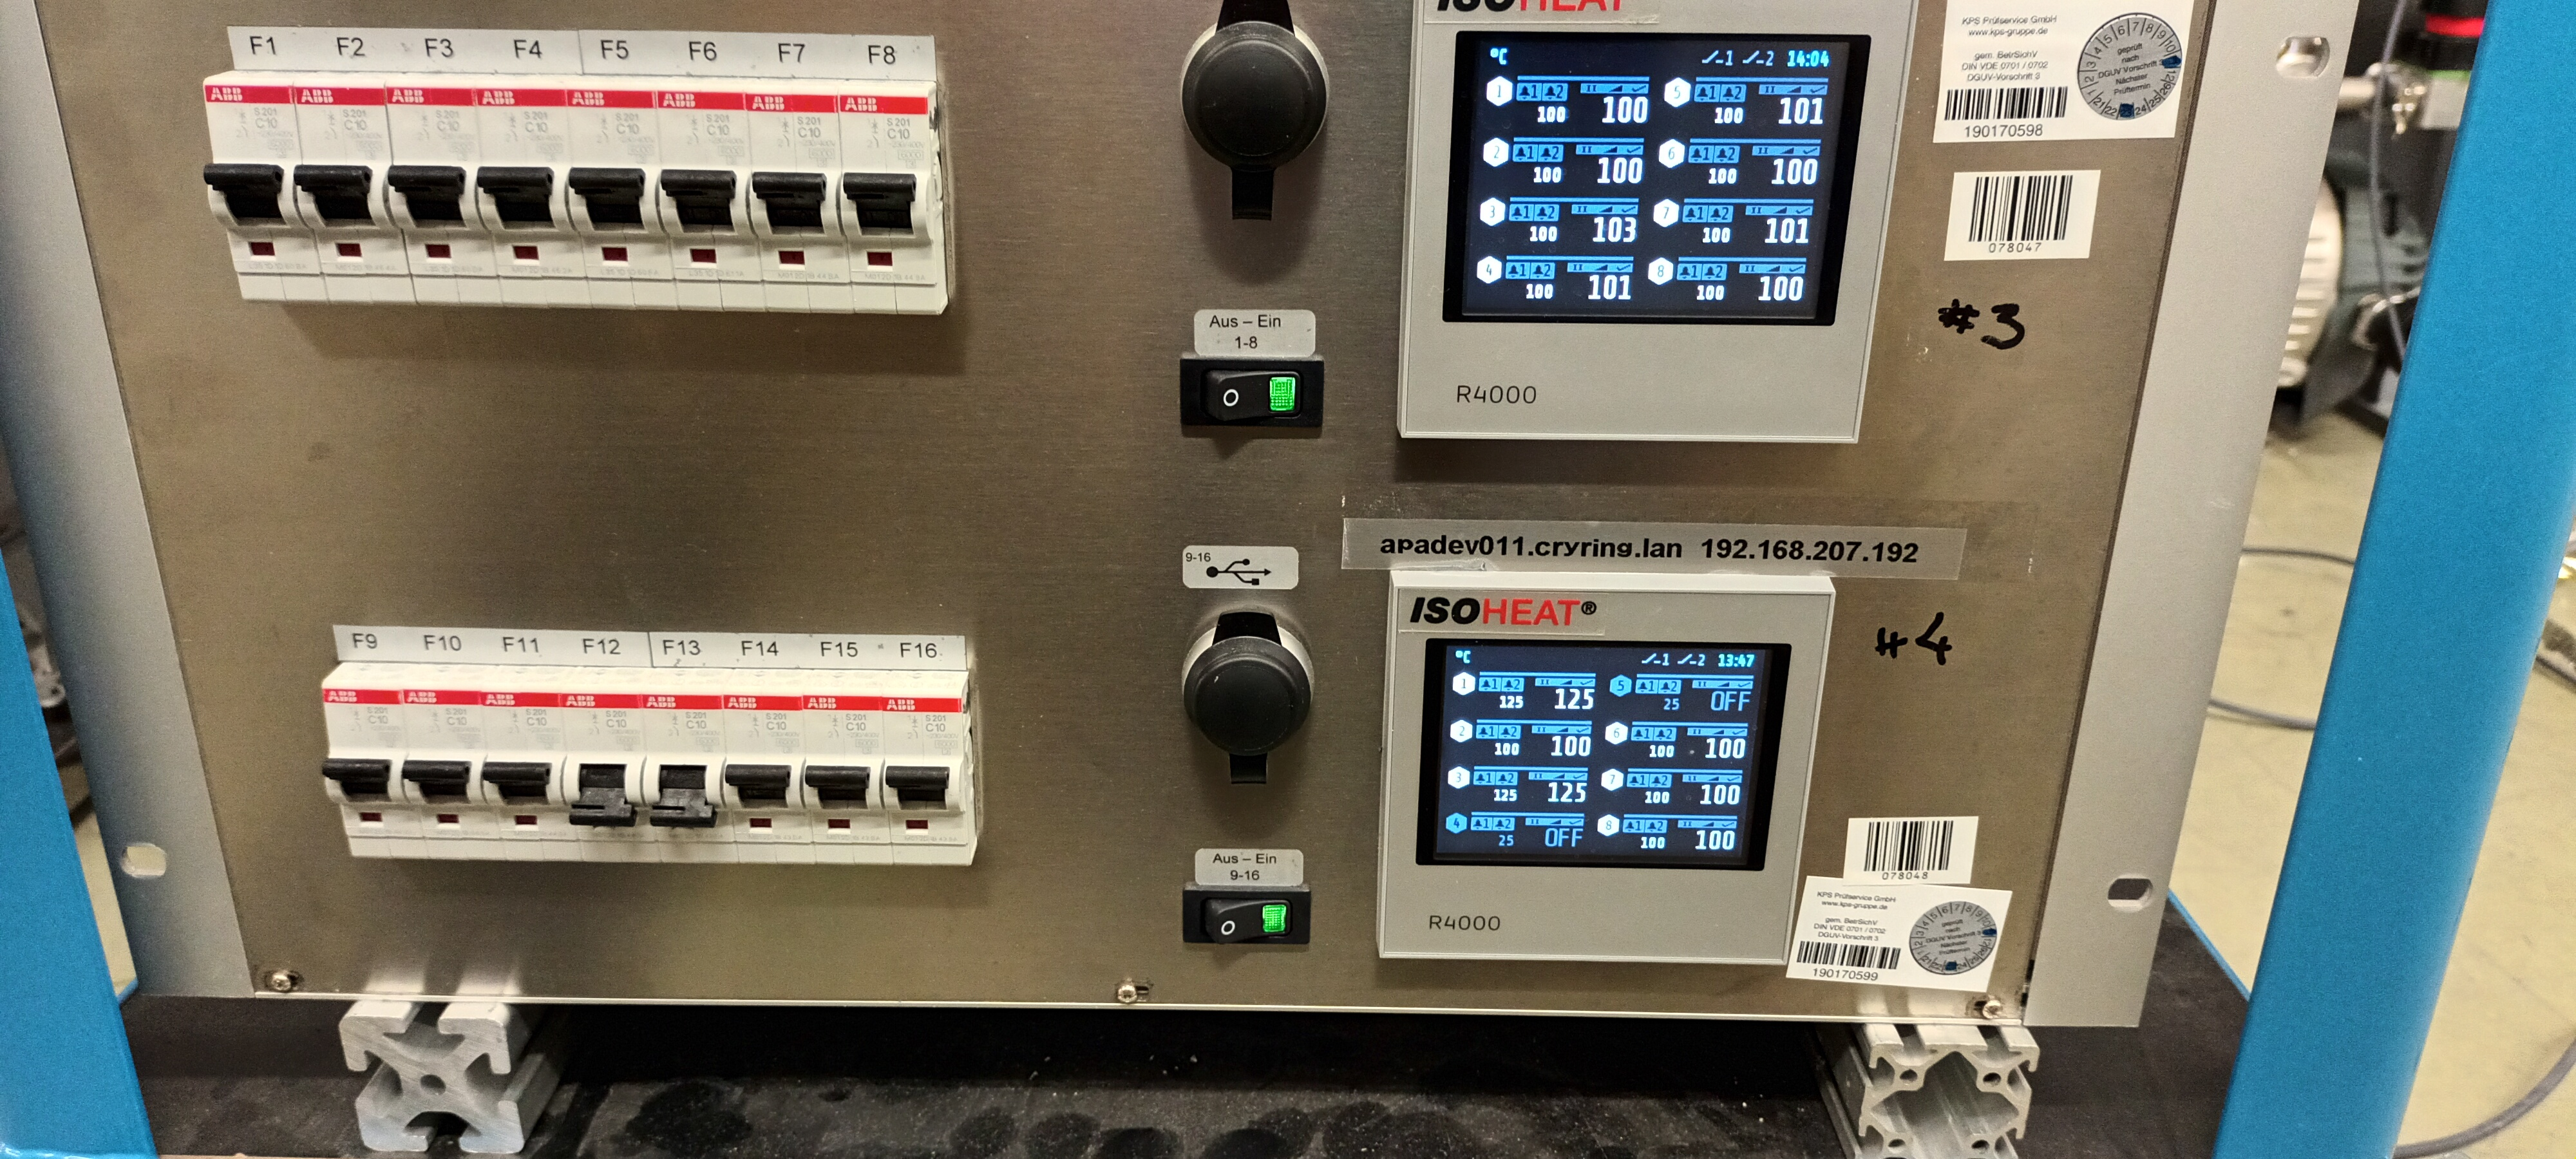
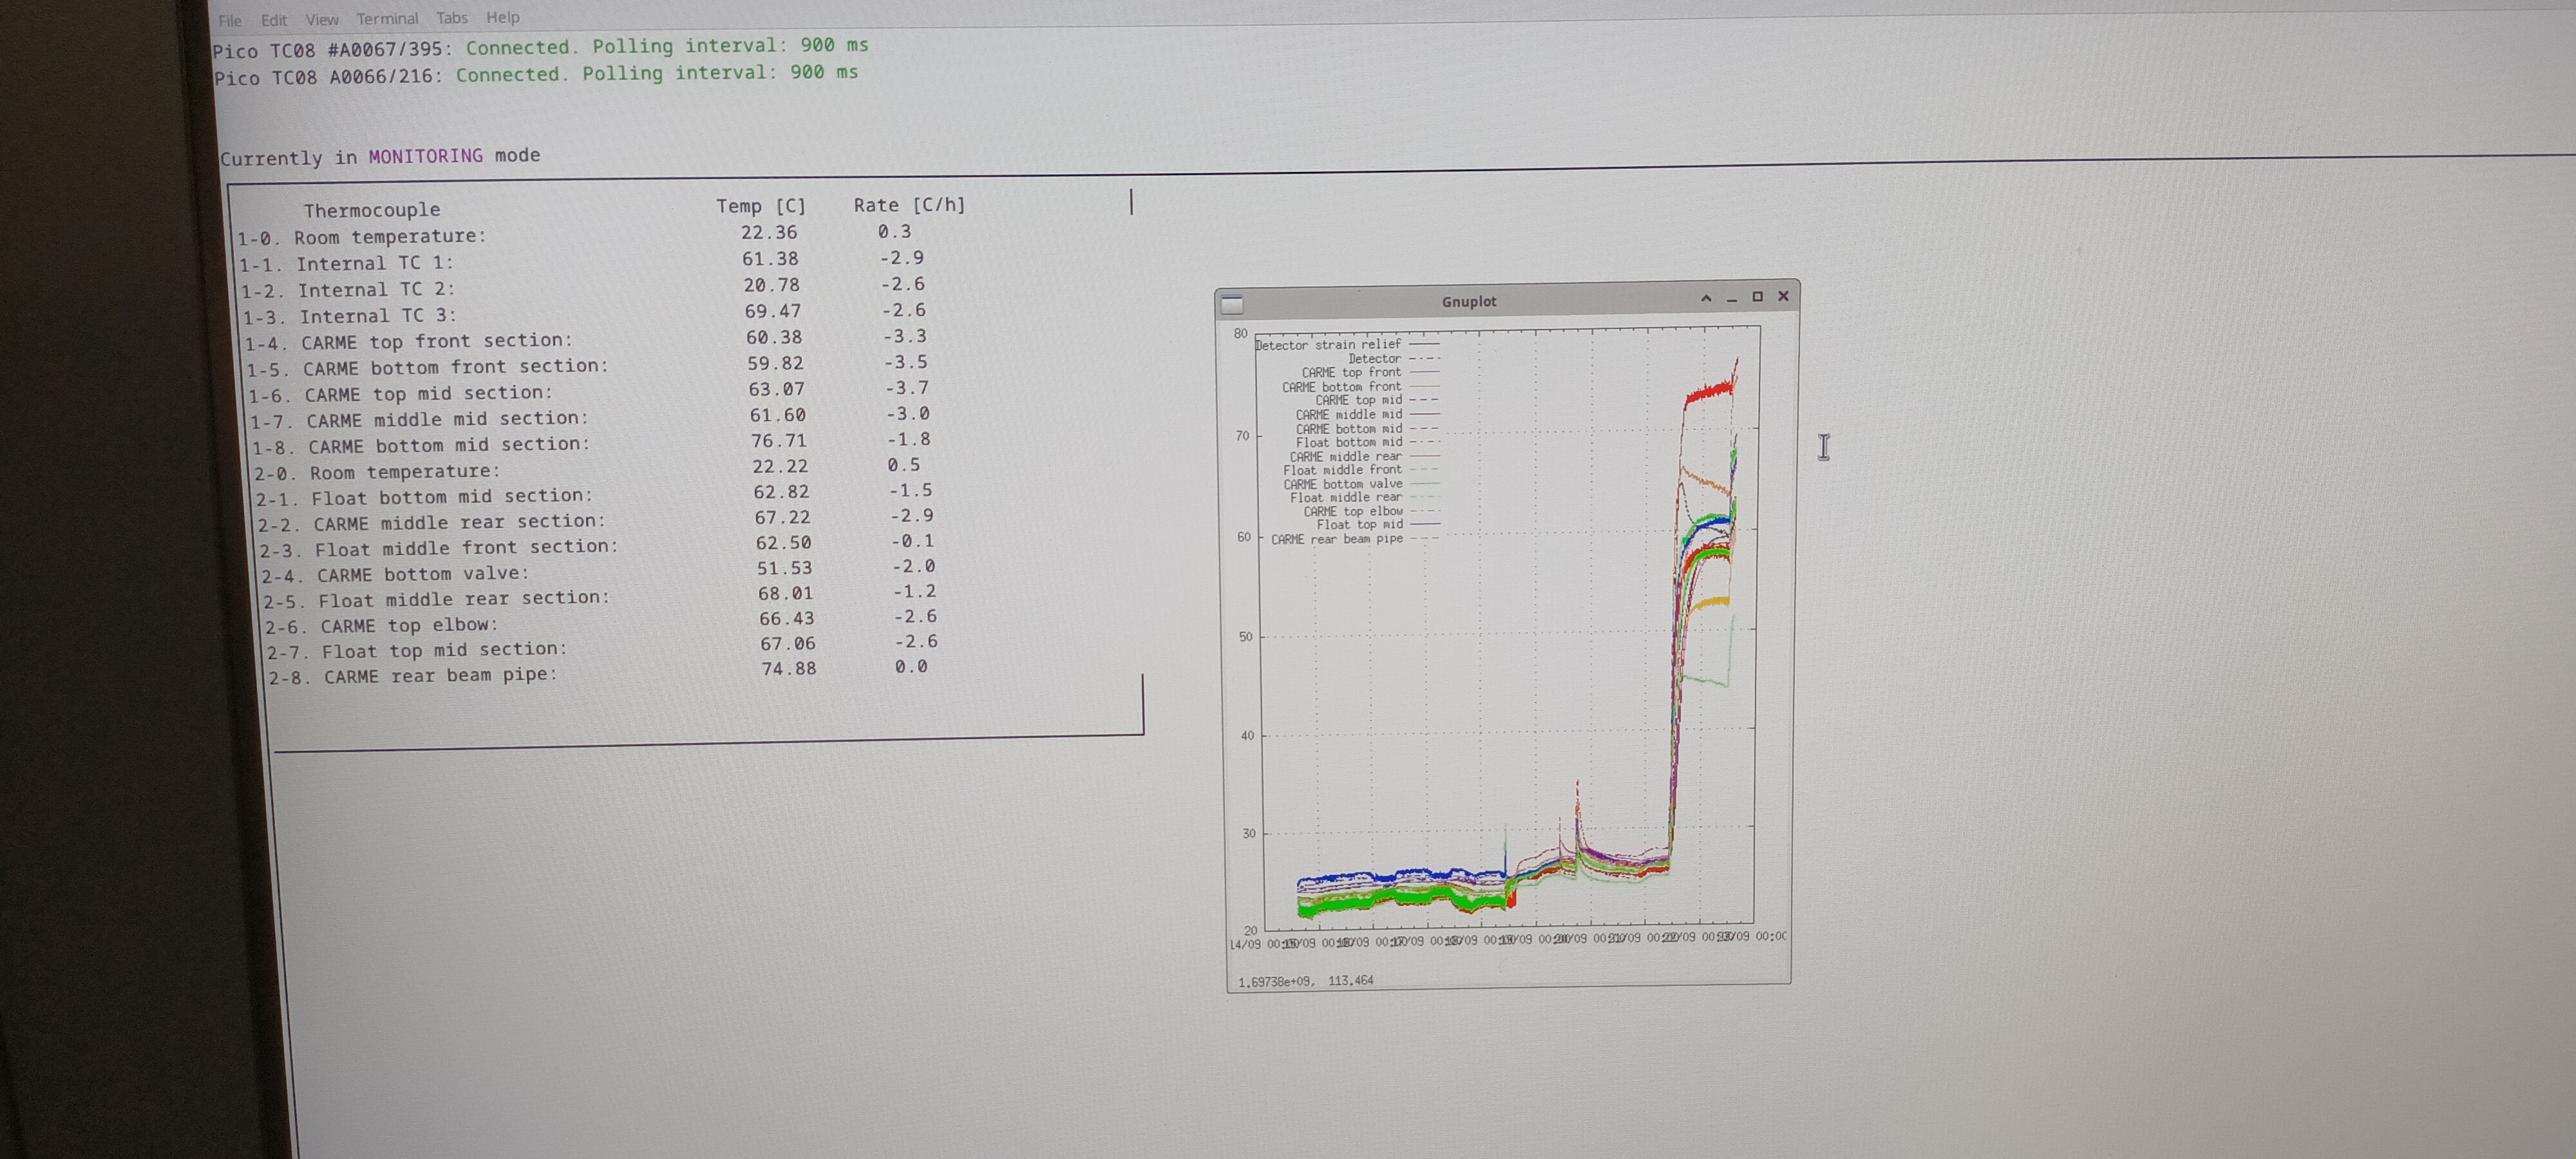
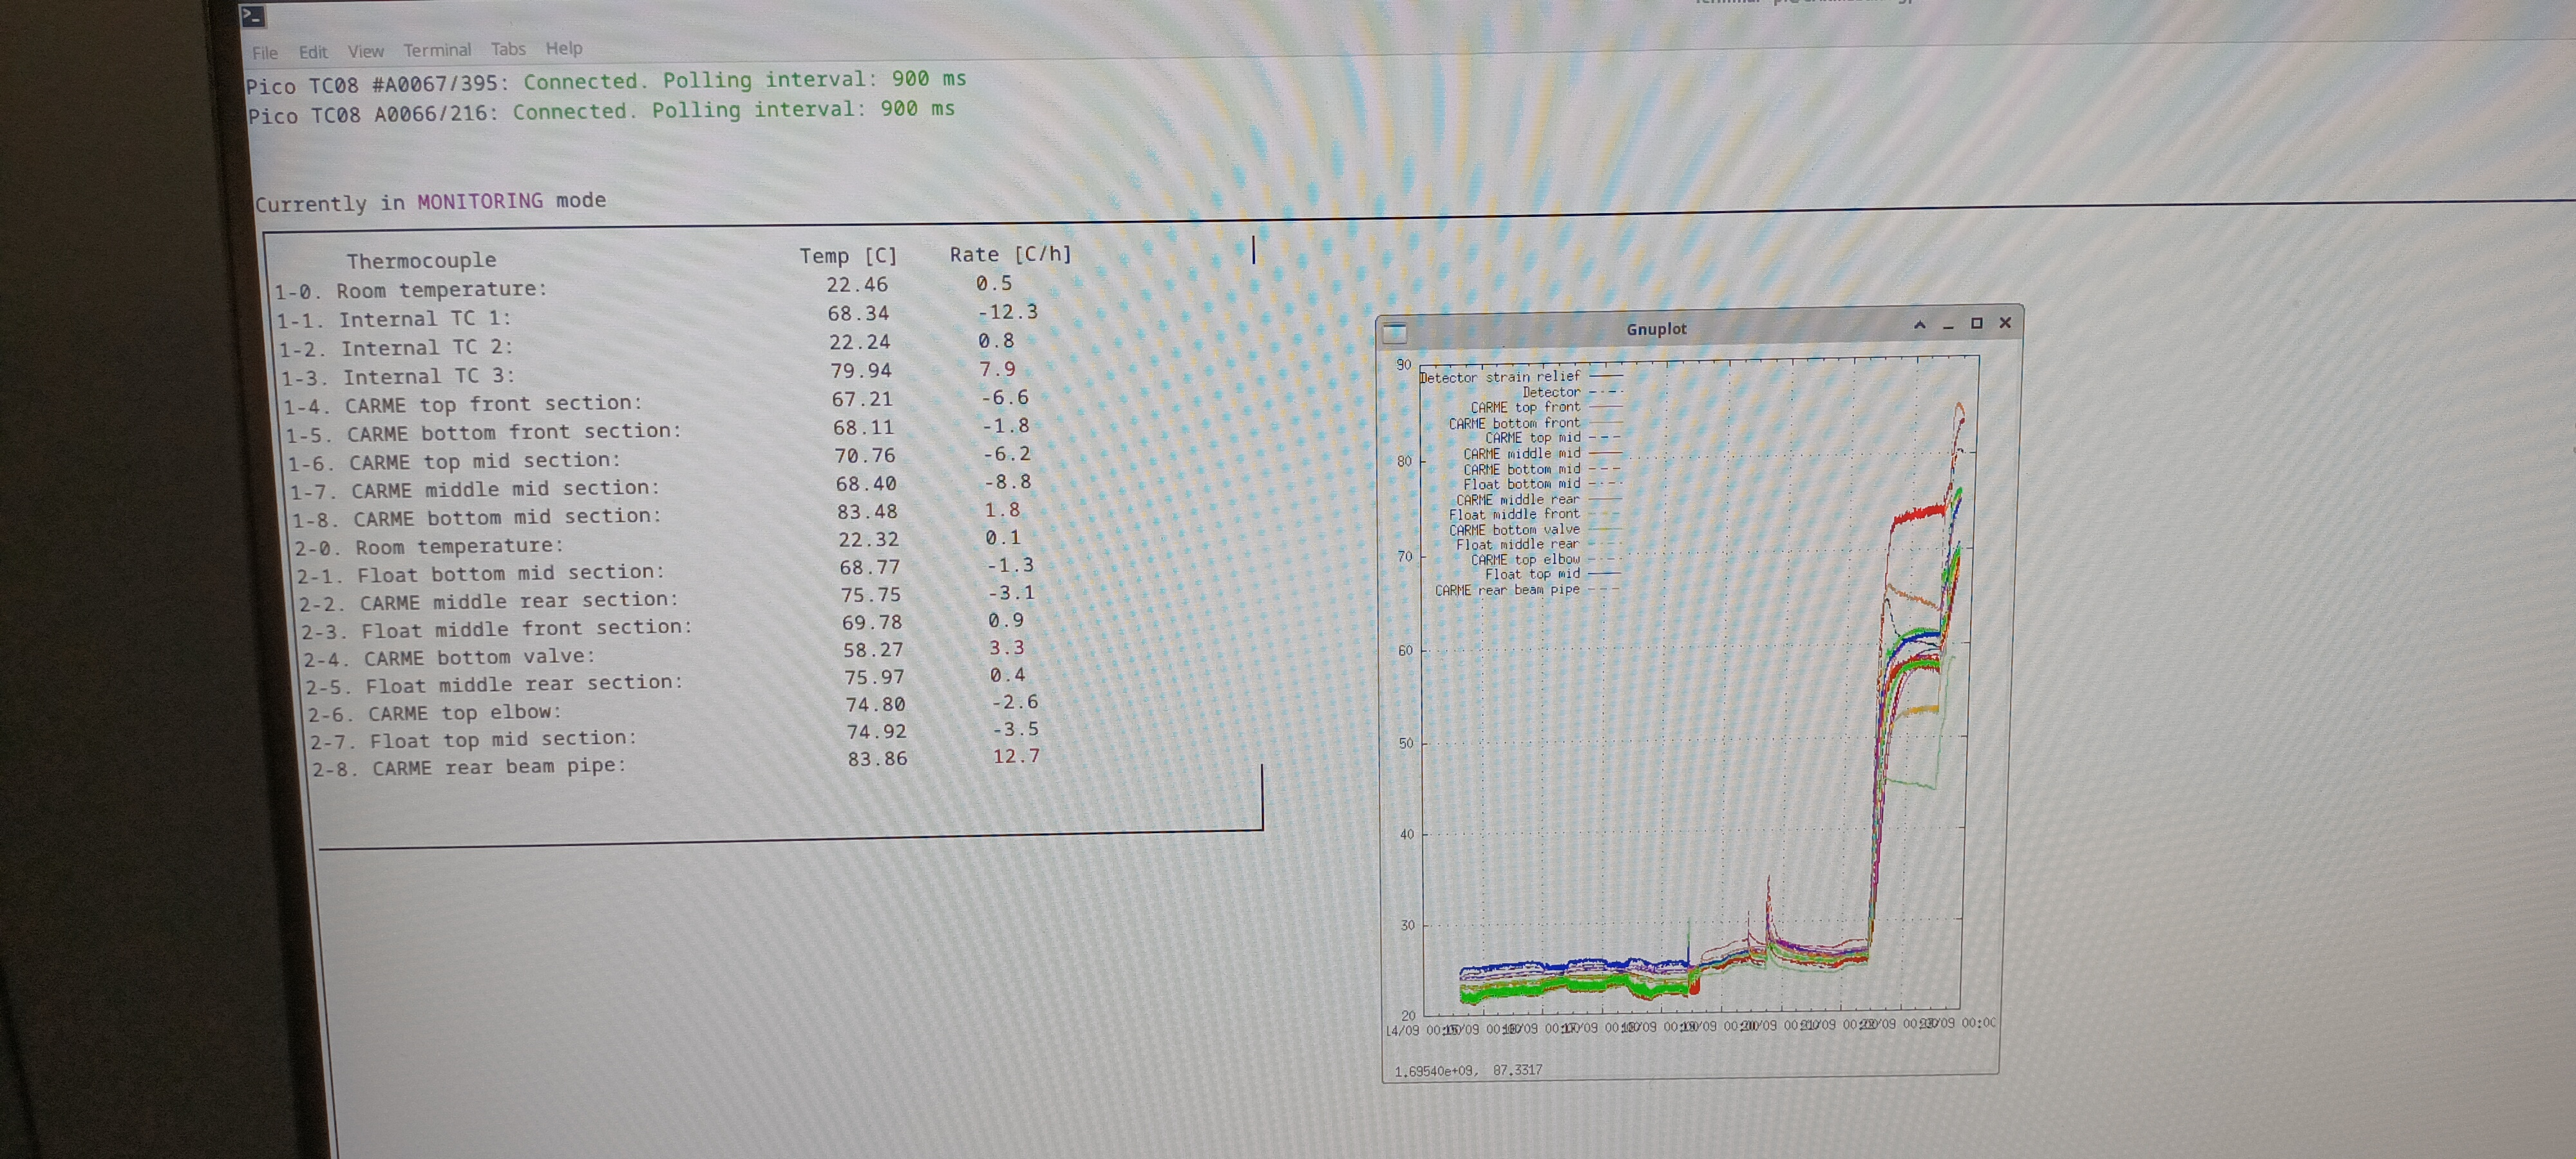
      CARME bakeout monitor, ELOTECH R4000 temperature controller front panel and Grafana bakeout dashboard- attachments 1-3

      Change ELOTECH R4000 set points for CARME heaters #1 and #3 to 125 deg C

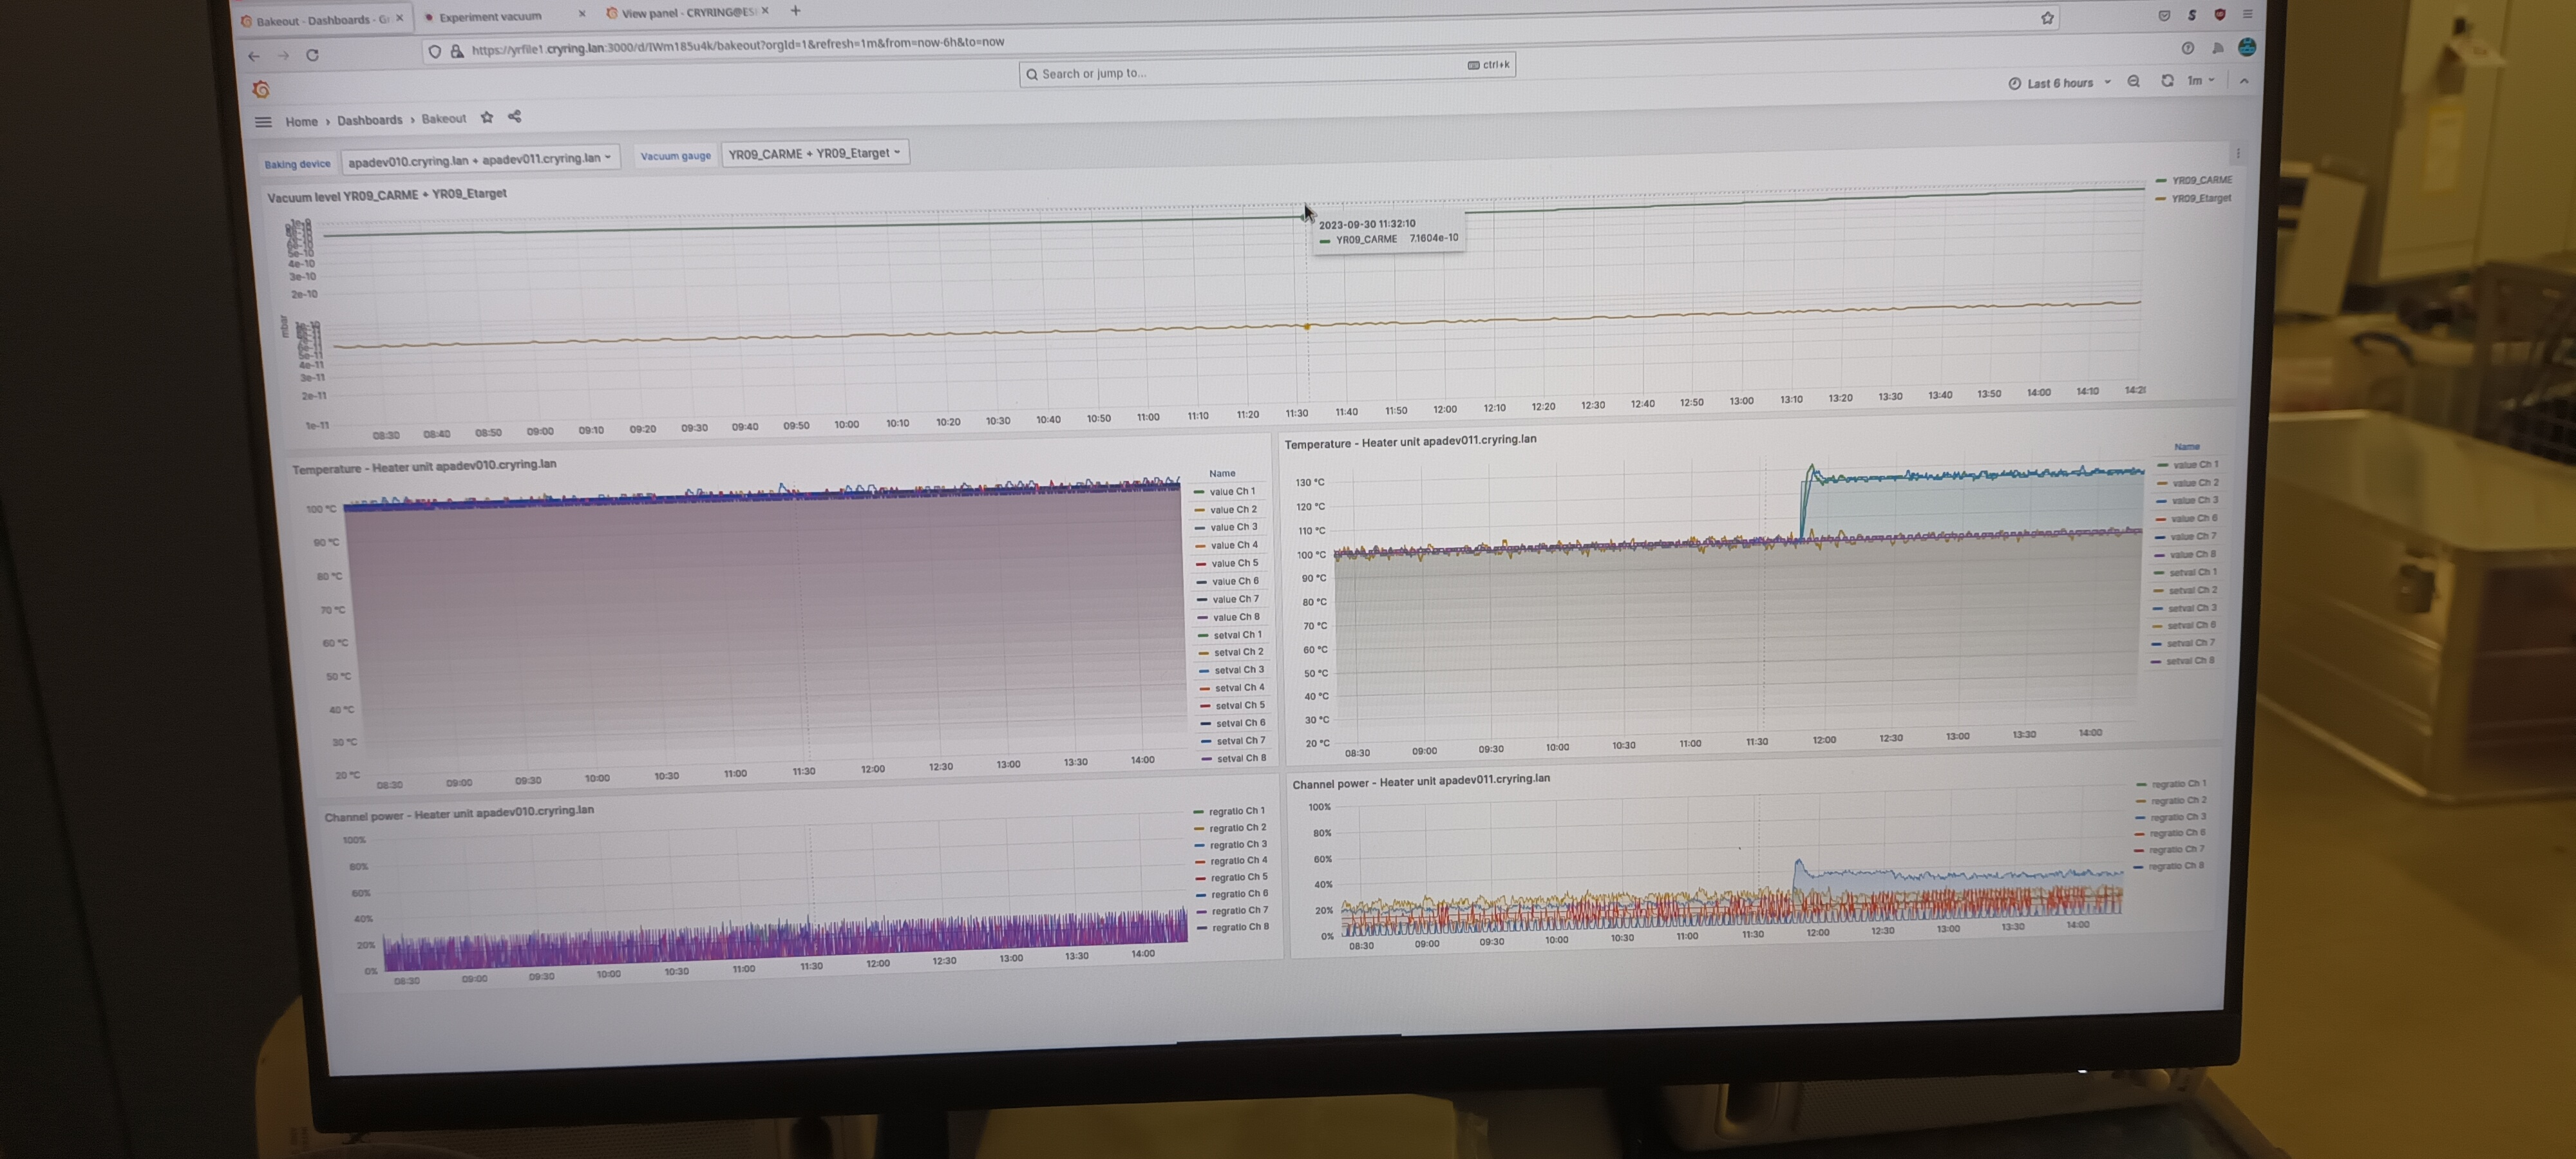
14.20 CARME IE514 8.25e-10 mbar, ambient temperature 20.8 deg C

      CARME bakeout monitor, ELOTECH R4000 temperature controller front panel and Grafana bakeout dashboard- attachments 4-6

      Change ELOTECH R4000 set points for CARME heaters #1 and #3 to 150 deg C

18.30 CARME IE514 1.29e-9 mbar, ambient temperature 20.7 deg C

      CARME bakeout monitor, ELOTECH R4000 temperature controller front panel and Grafana bakeout dashboard- attachments 7-9

Change ELOTECH R4000 set points for CARME heaters #1 and #3 to 175 deg C and heater #2 to 125 deg C |
| Attachment 1: 1000007236.jpg
|

|
| Attachment 2: 1000007239.jpg
|

|
| Attachment 3: 1000007237.jpg
|
|
| Attachment 4: 1000007251.jpg
|
|
| Attachment 5: 1000007250.jpg
|
|
| Attachment 6: 1000007252.jpg
|
|
| Attachment 7: 1000007256.jpg
|

|
| Attachment 8: 1000007257.jpg
|
|
| Attachment 9: 1000007255.jpg
|

|
|
548
|
Fri Apr 26 23:41:16 2024 |
TD | Saturday 27 April |
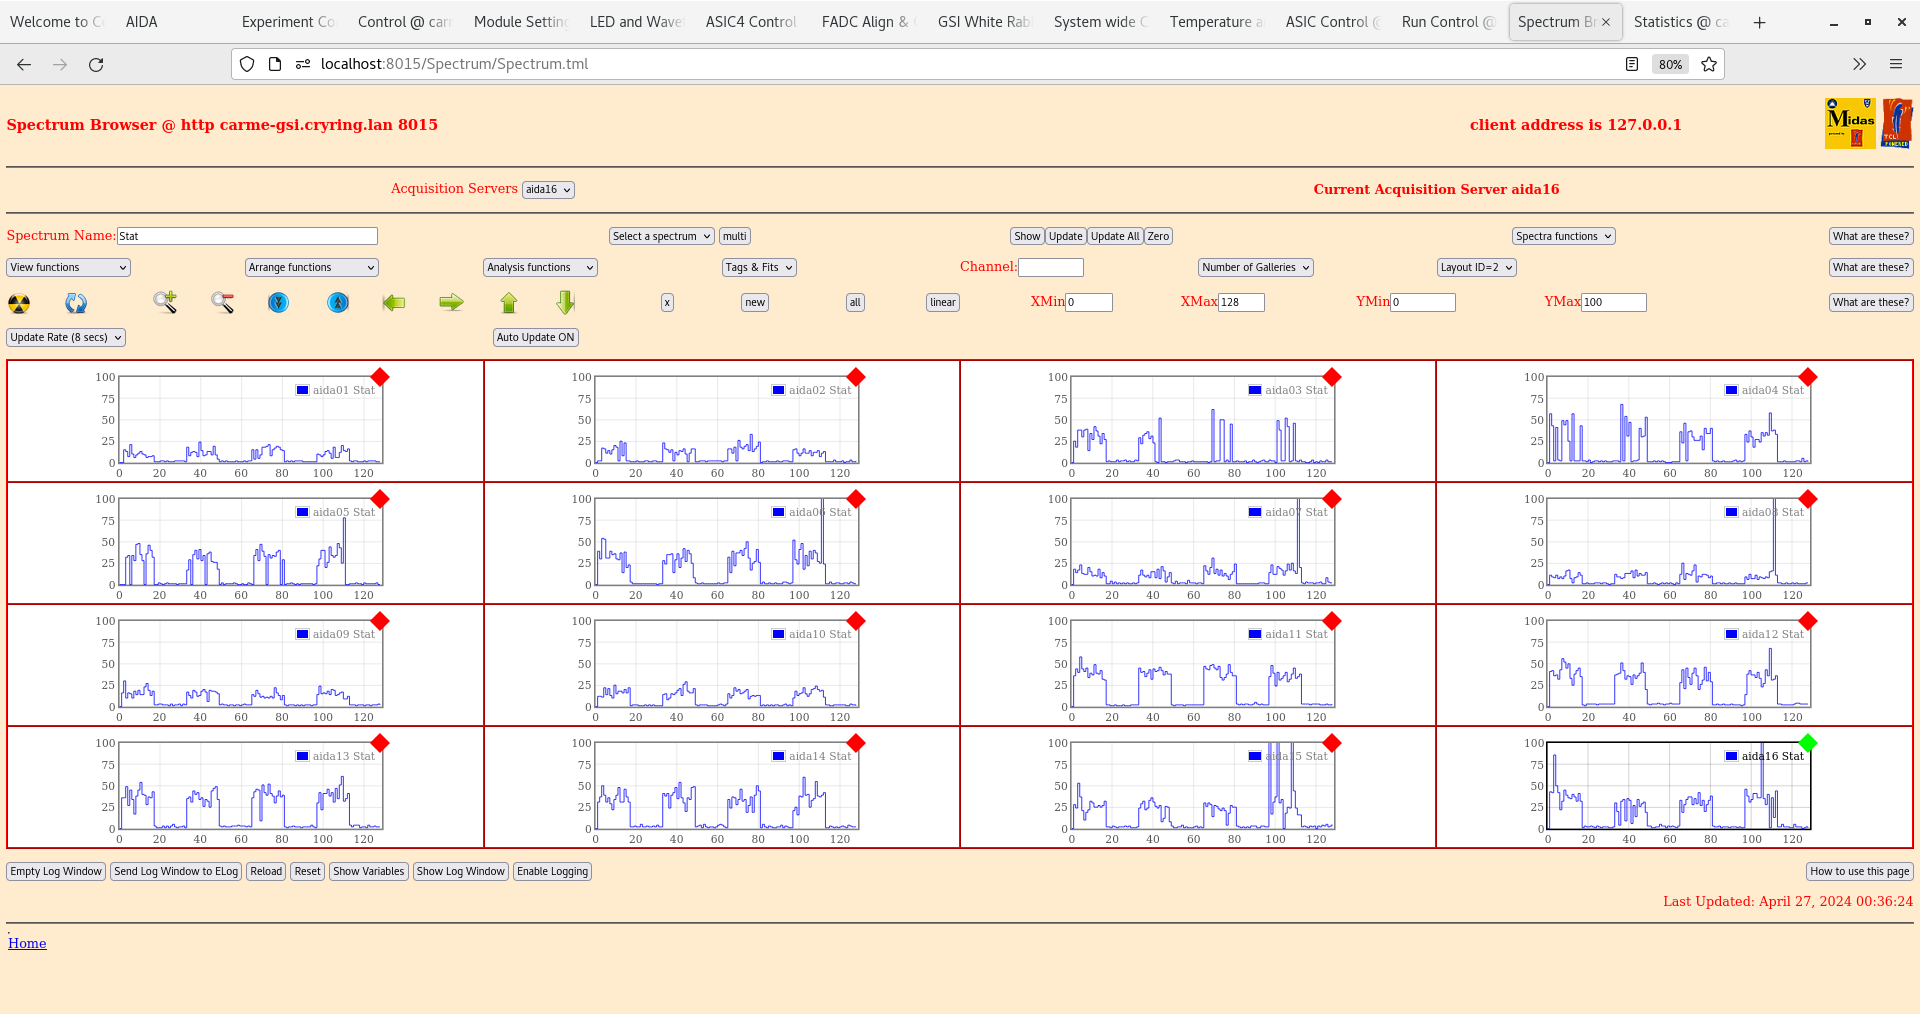
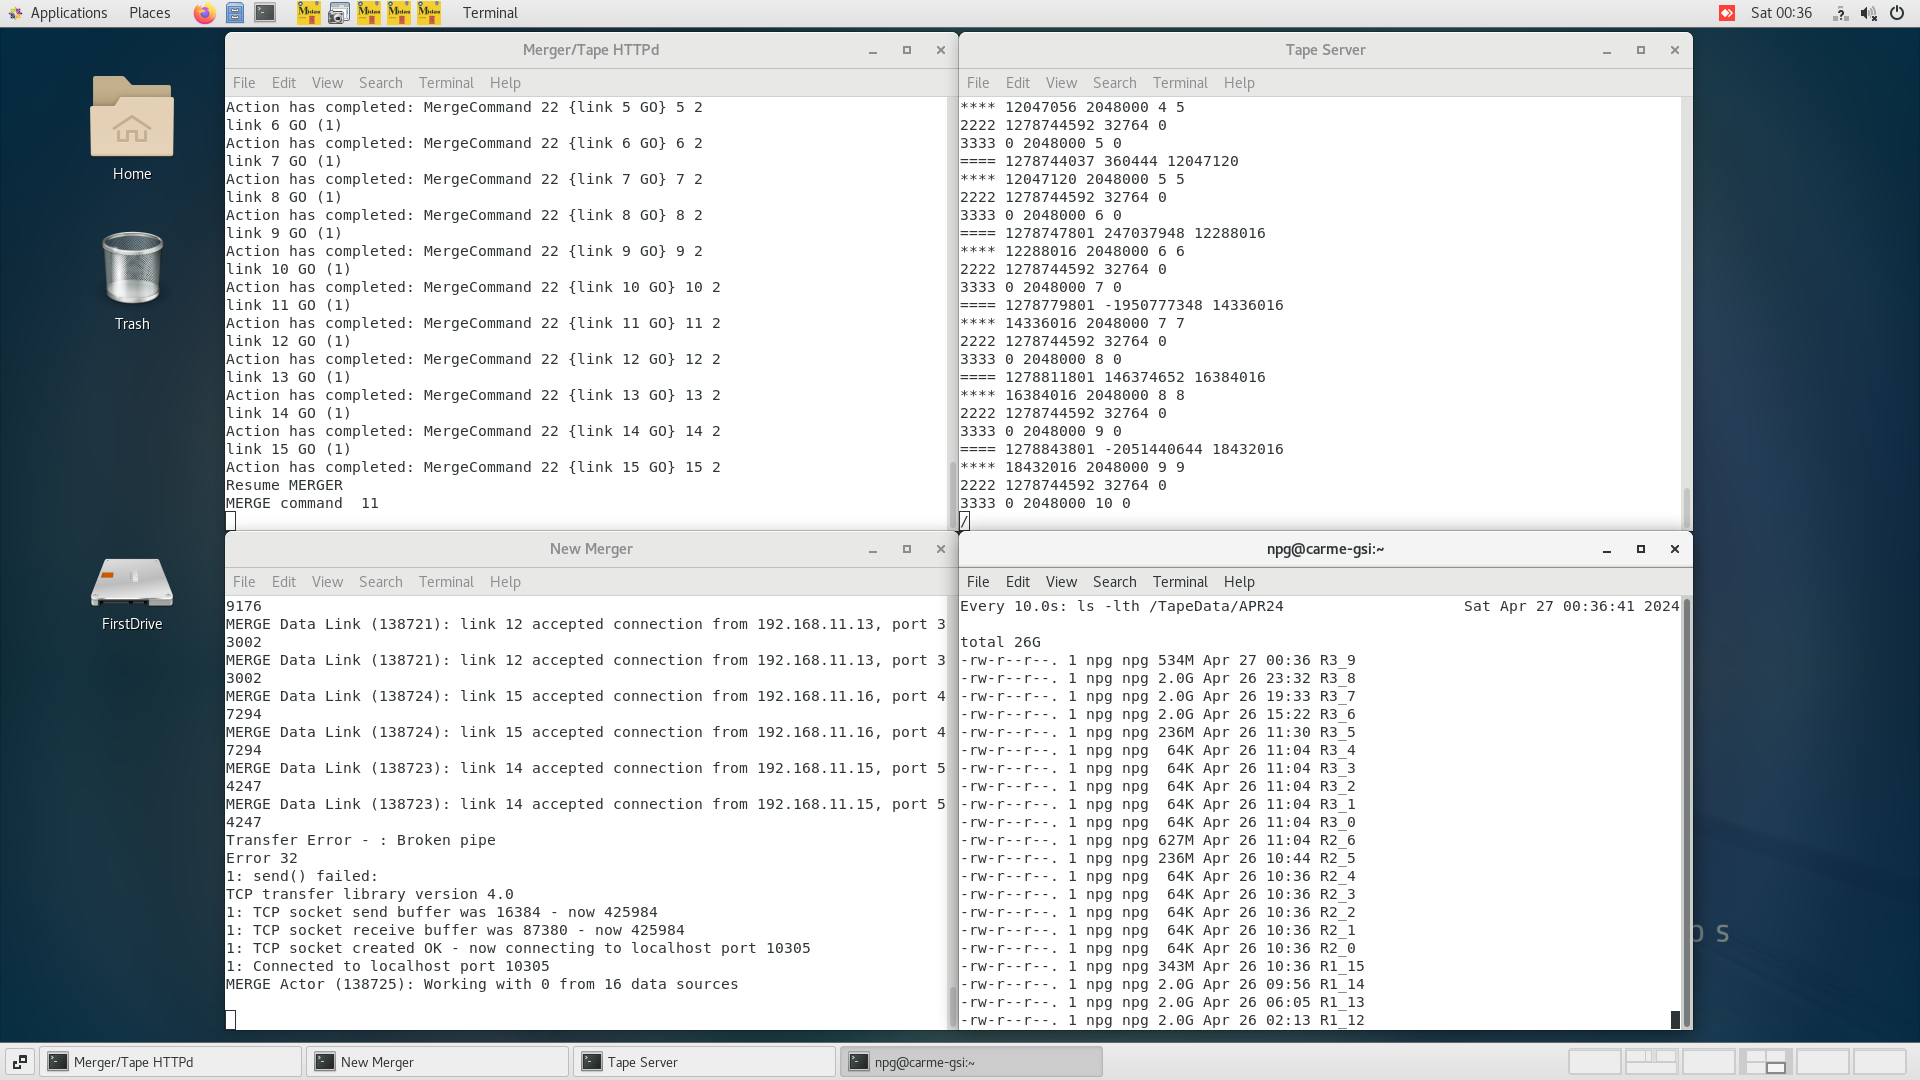
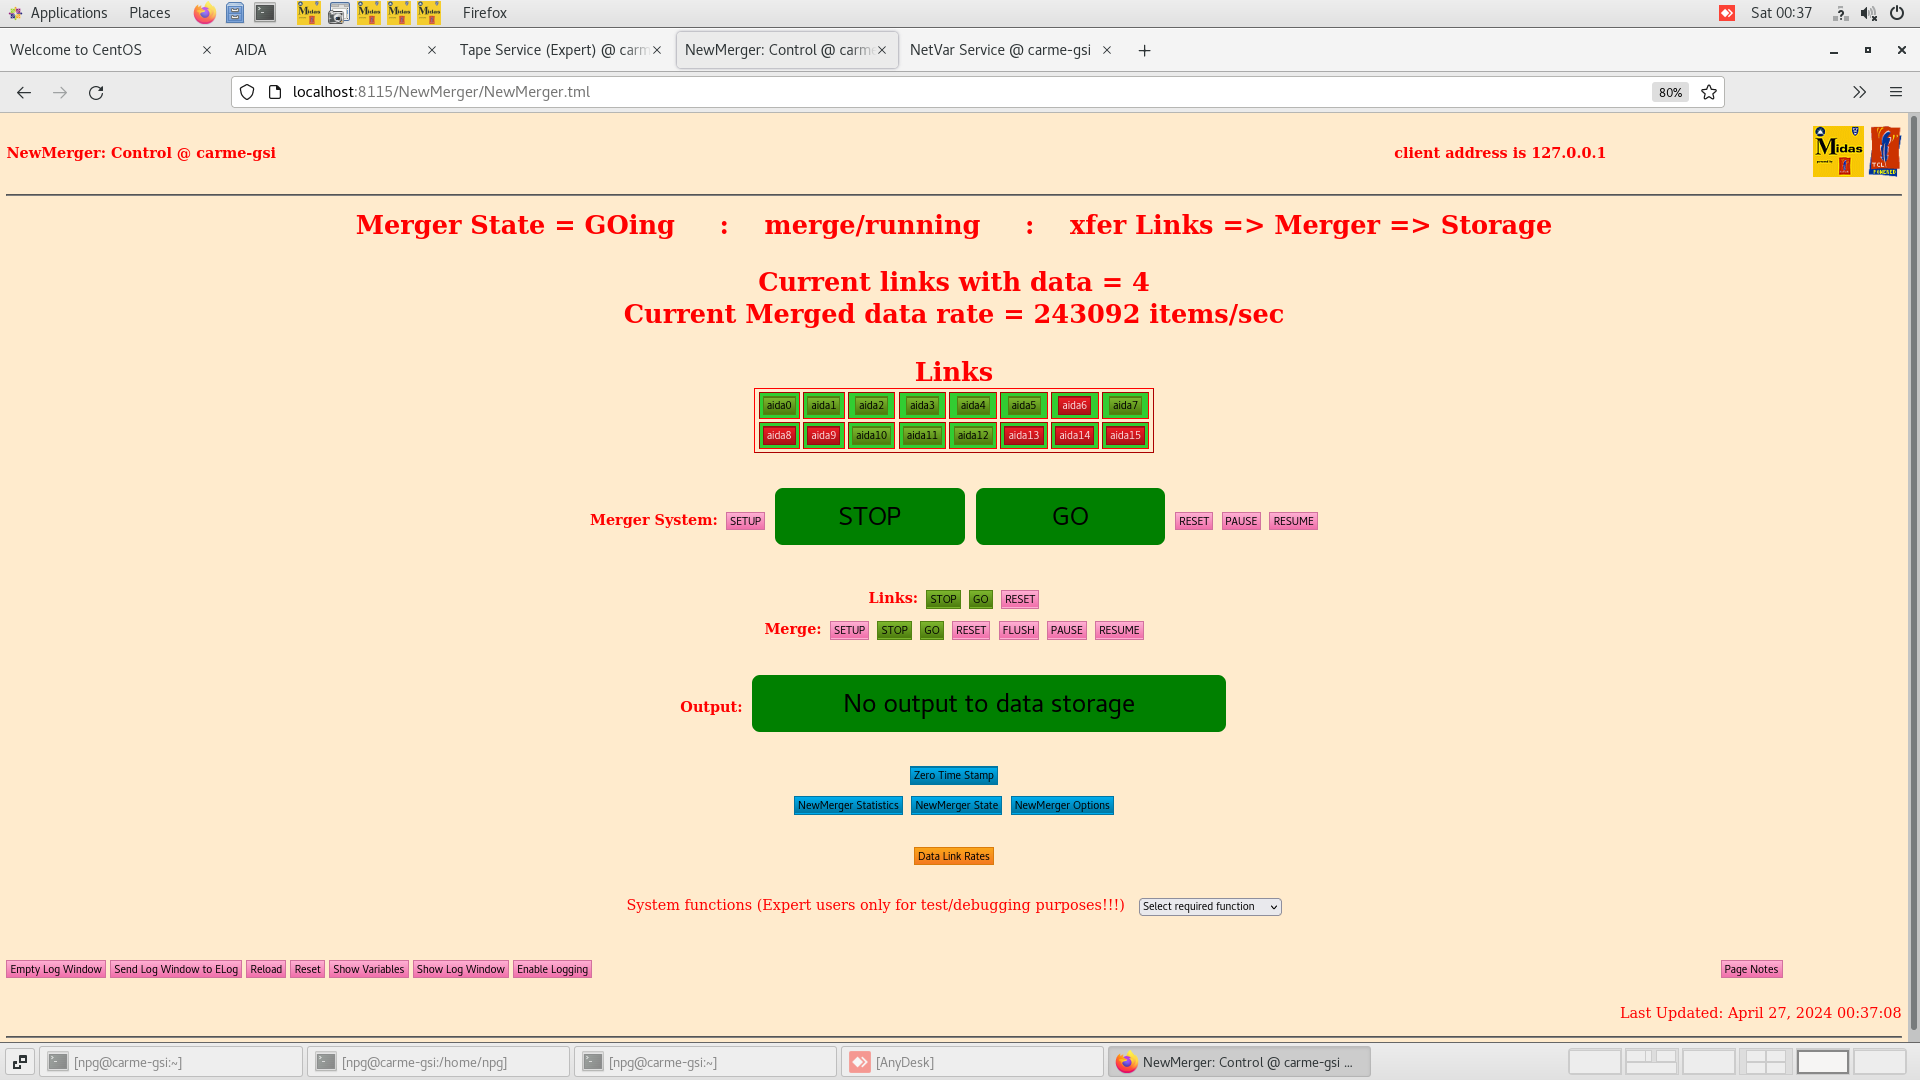
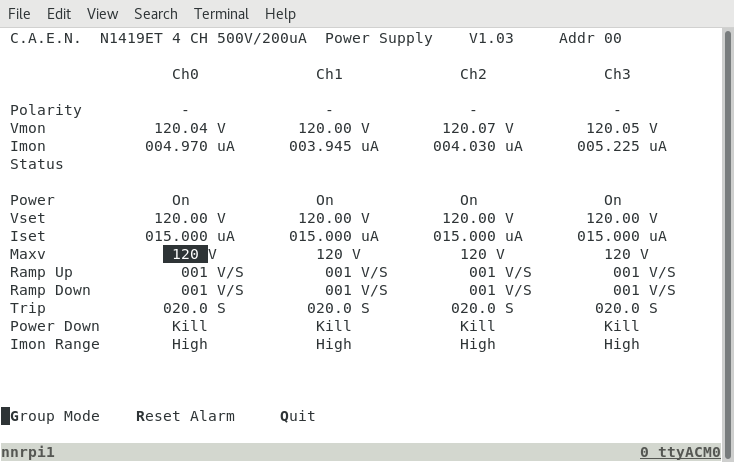
00.34 DAQ continues data file R3_9

      DSSSD bias & leakage current OK - attachment 1

      FEE64 temps OK - attachment 2

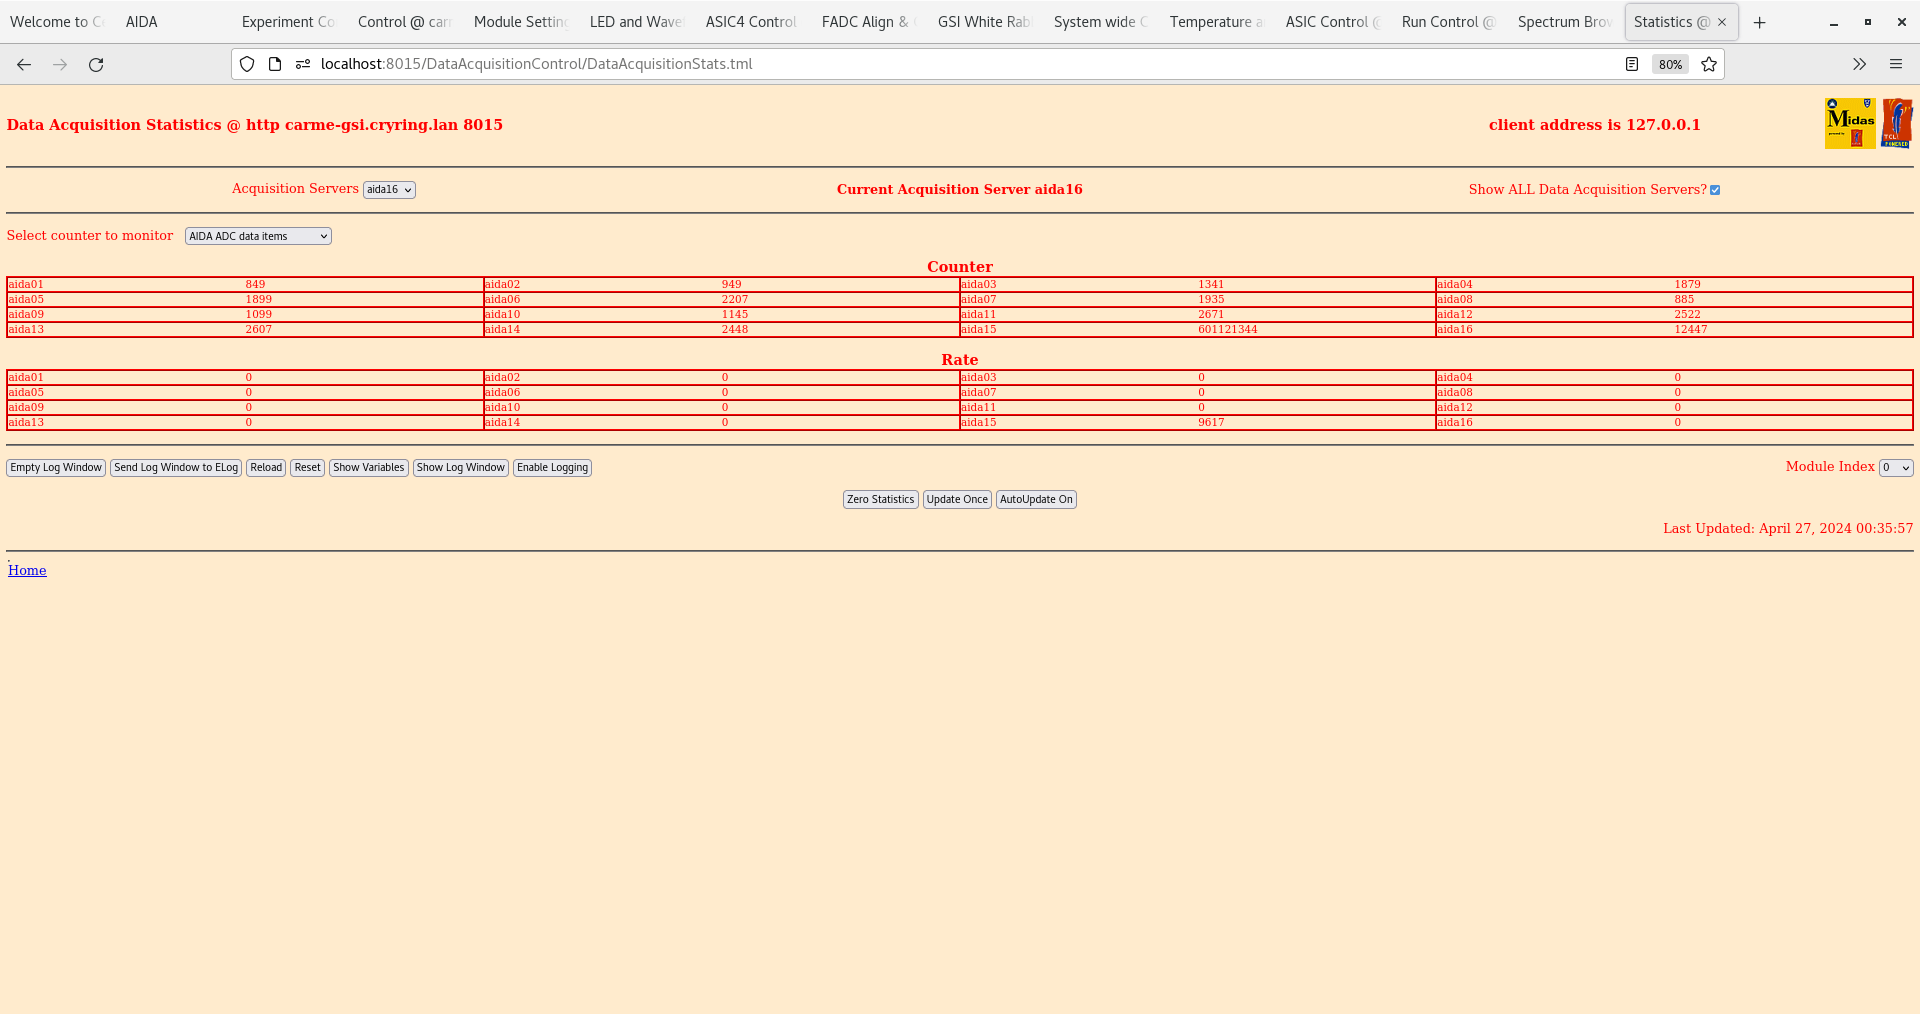
      ADC data item stats OK - attachment 3

      per FEE64 Rate spectra - attachment 4

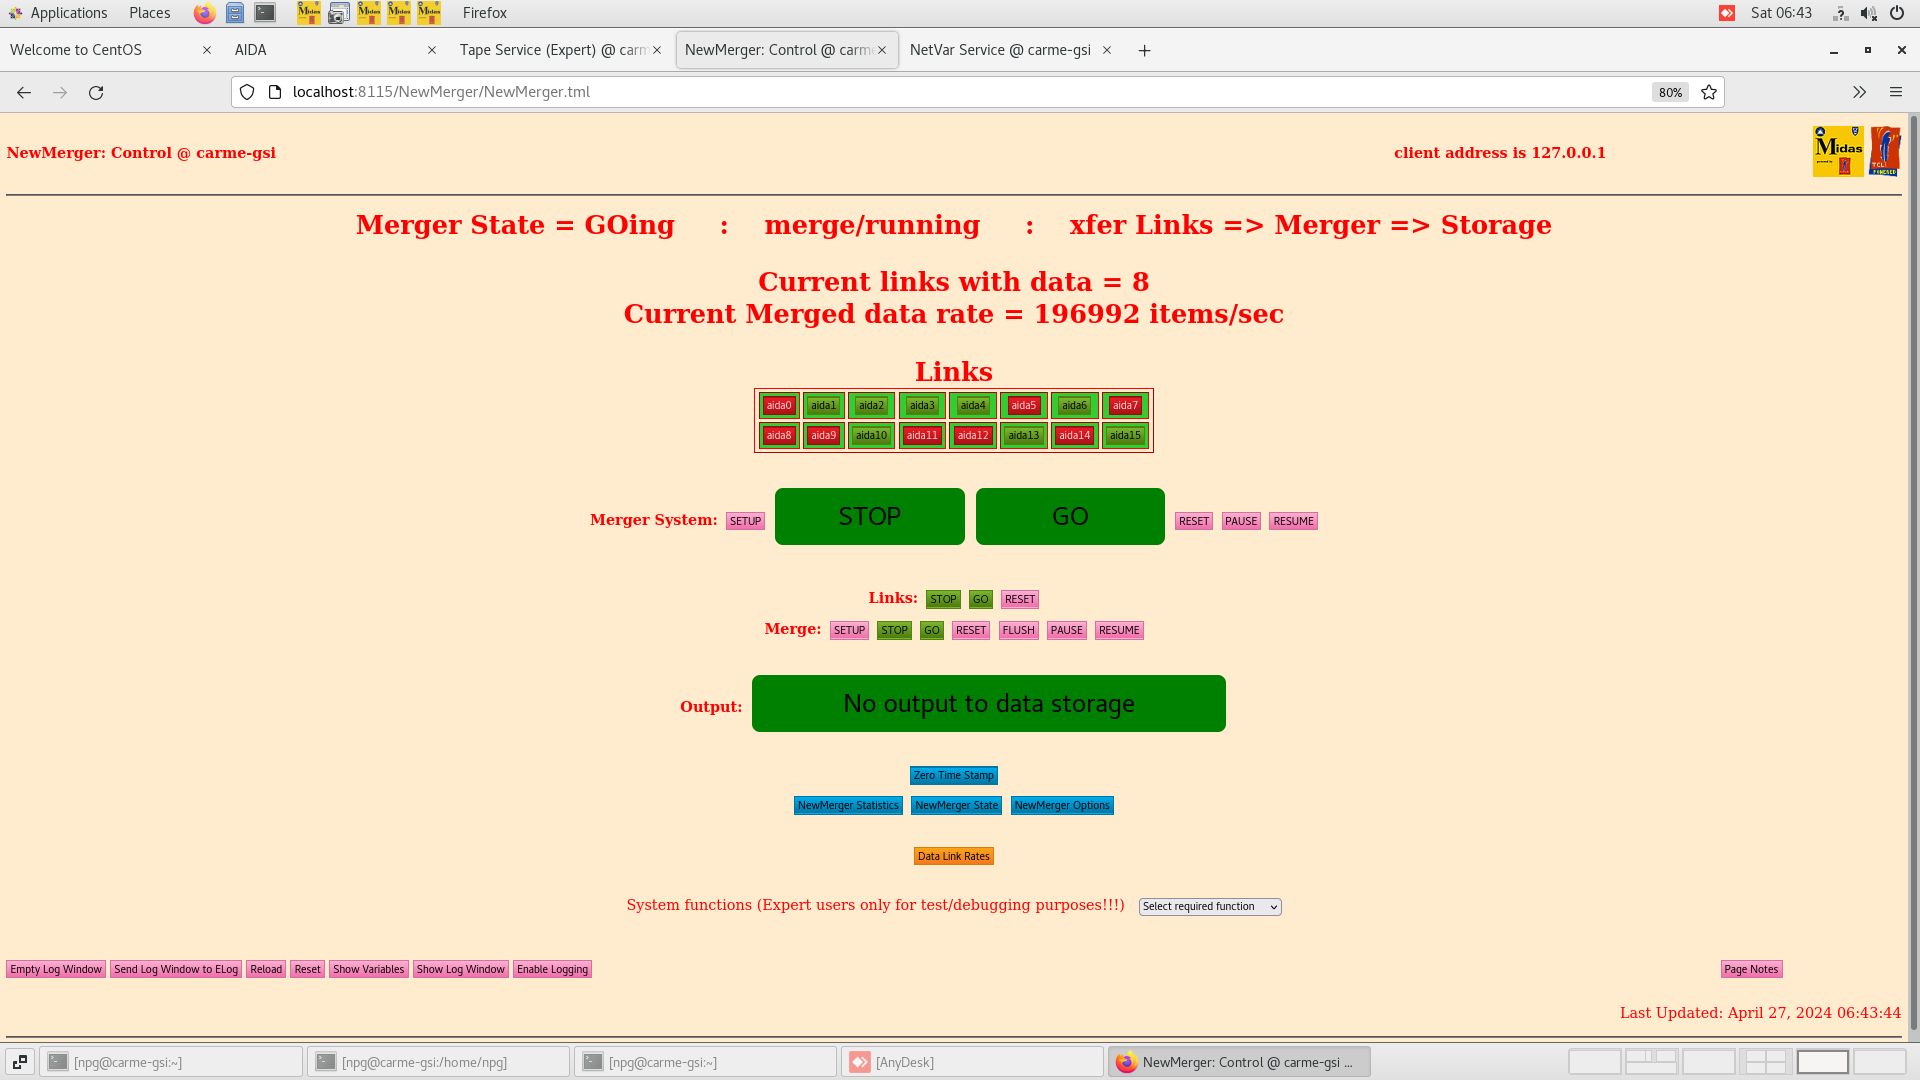
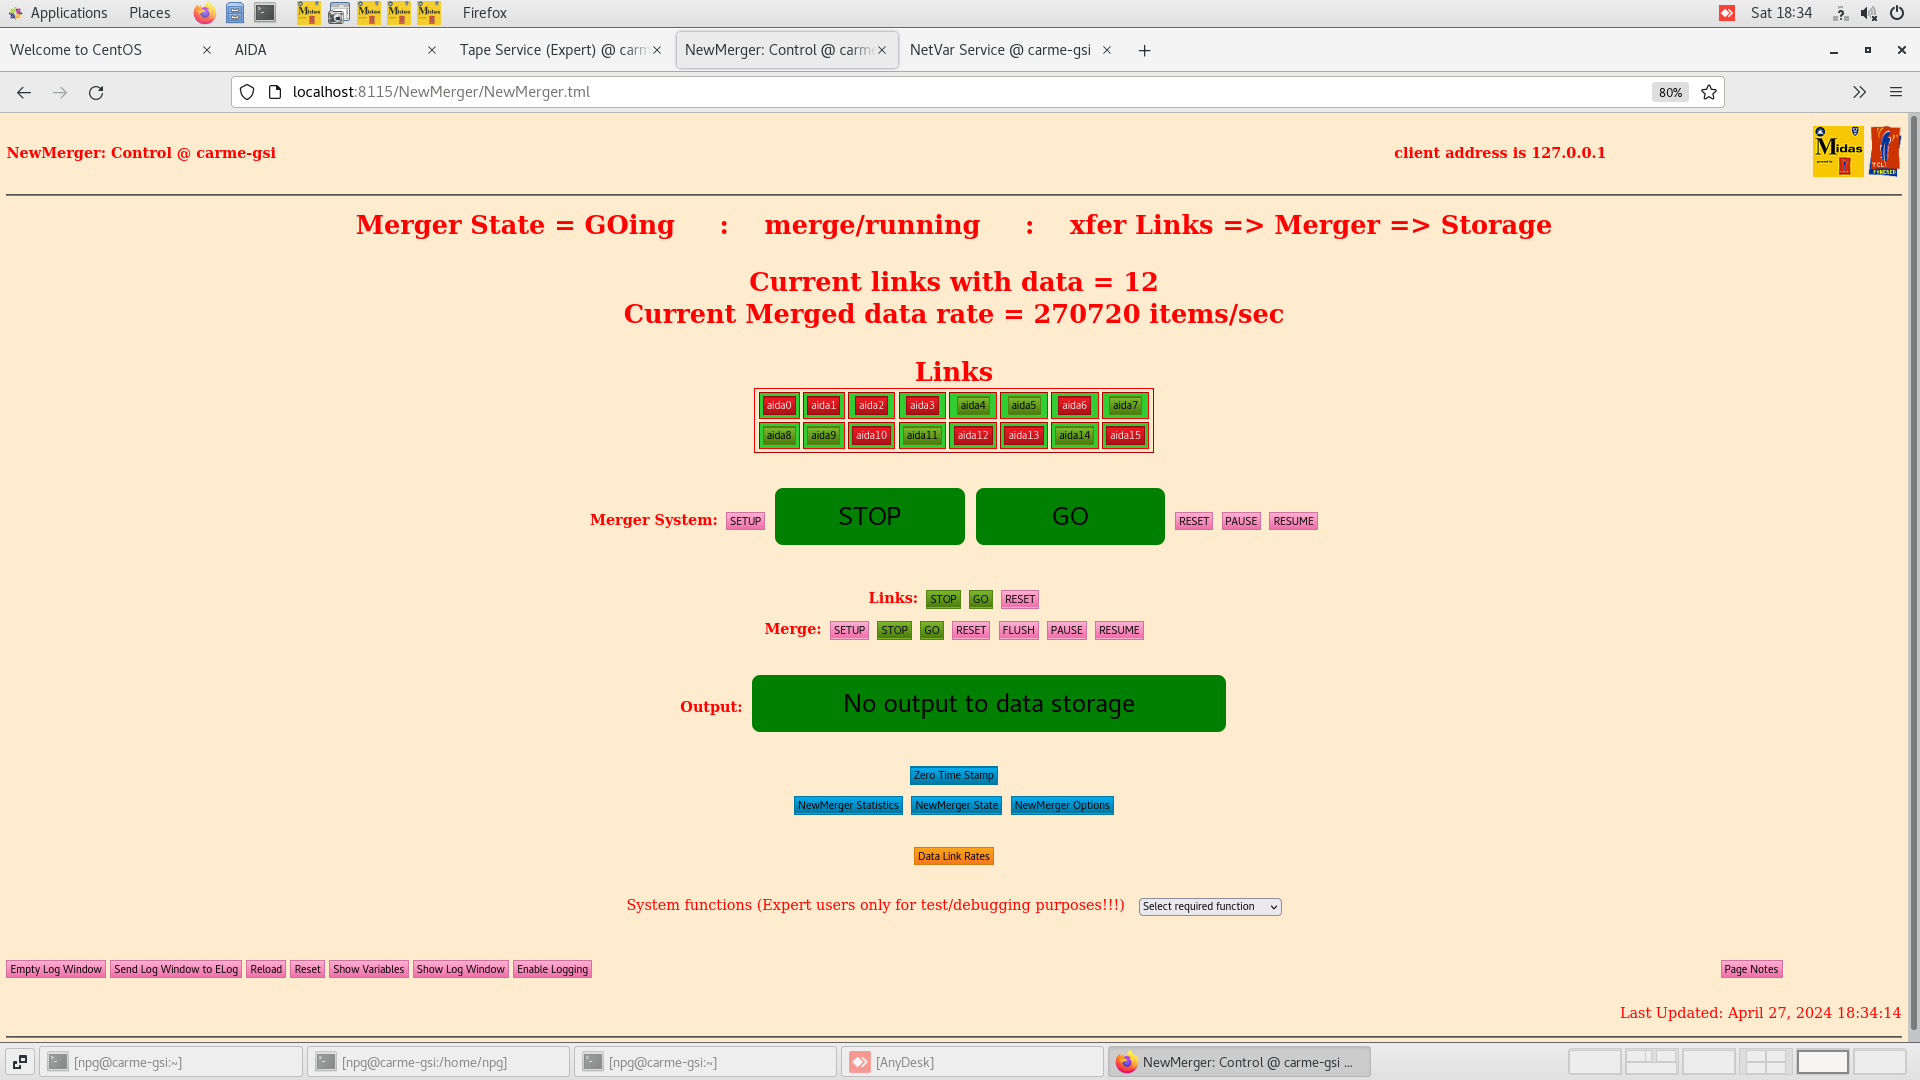
      Merger, TapeServer etc - attachments 5-7

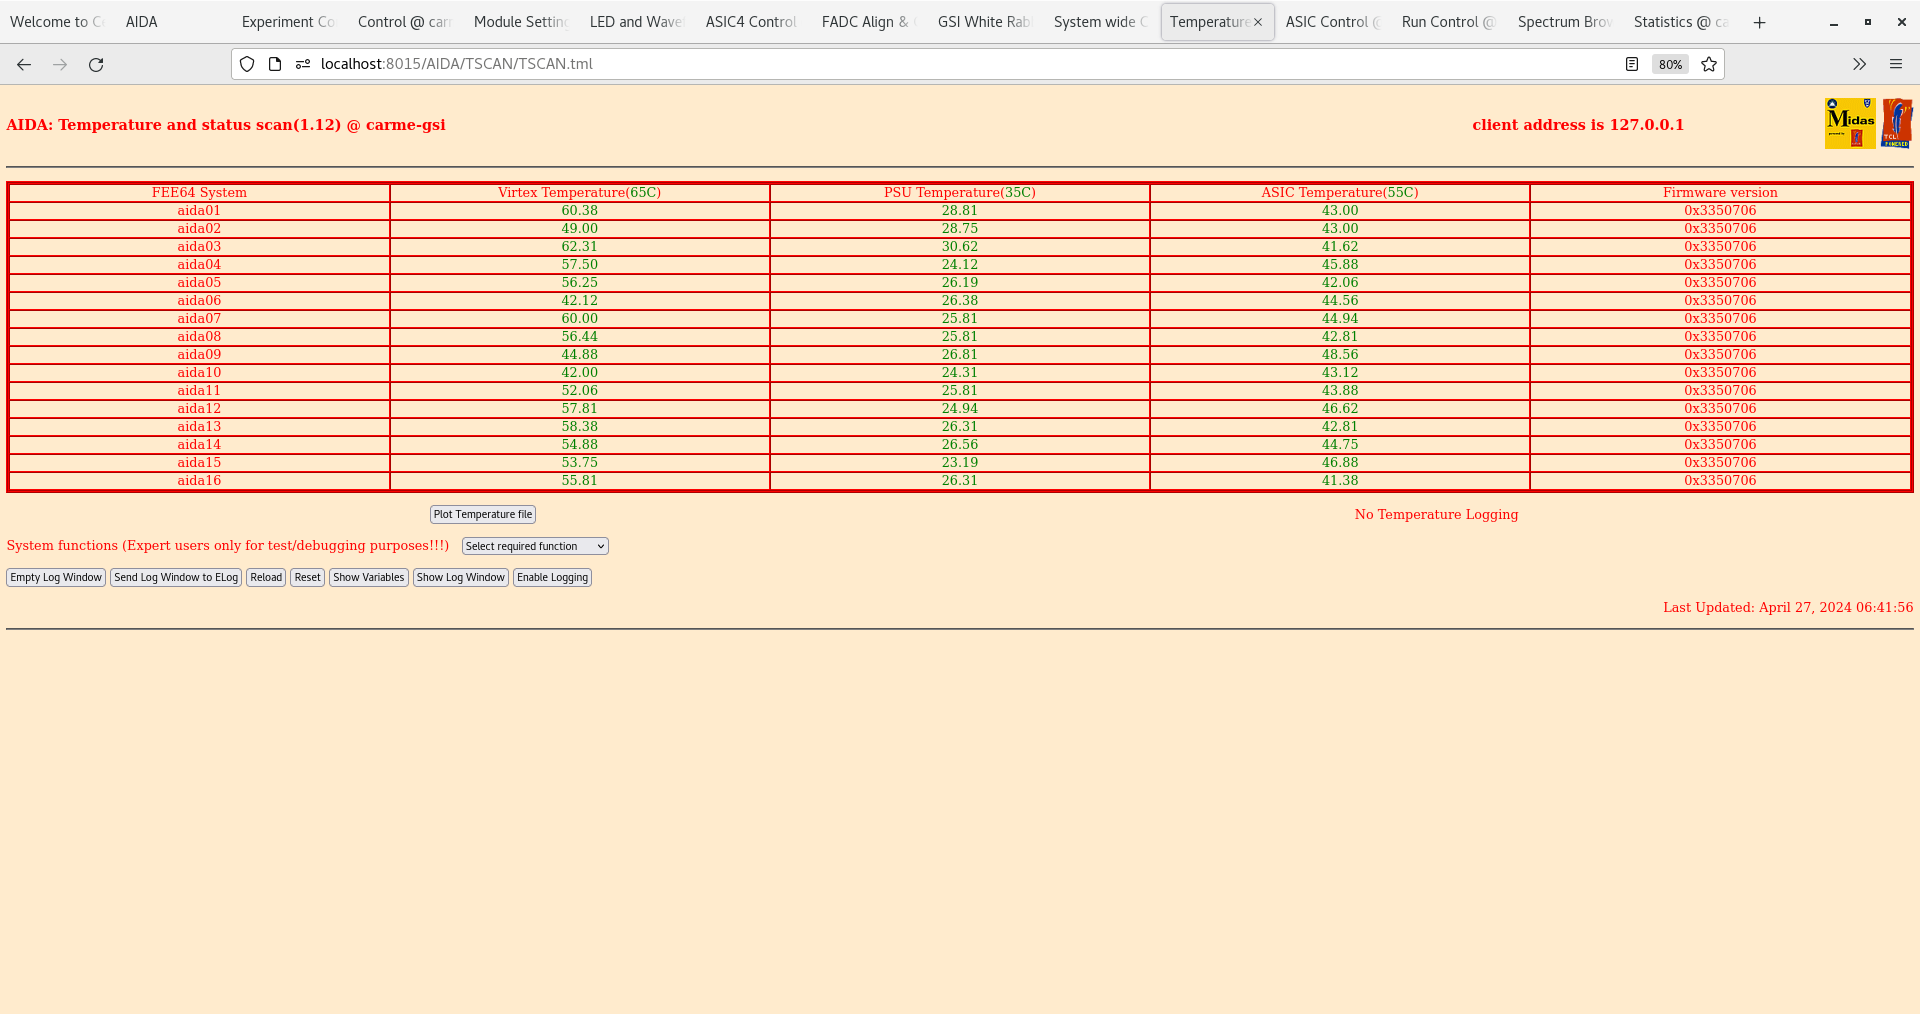
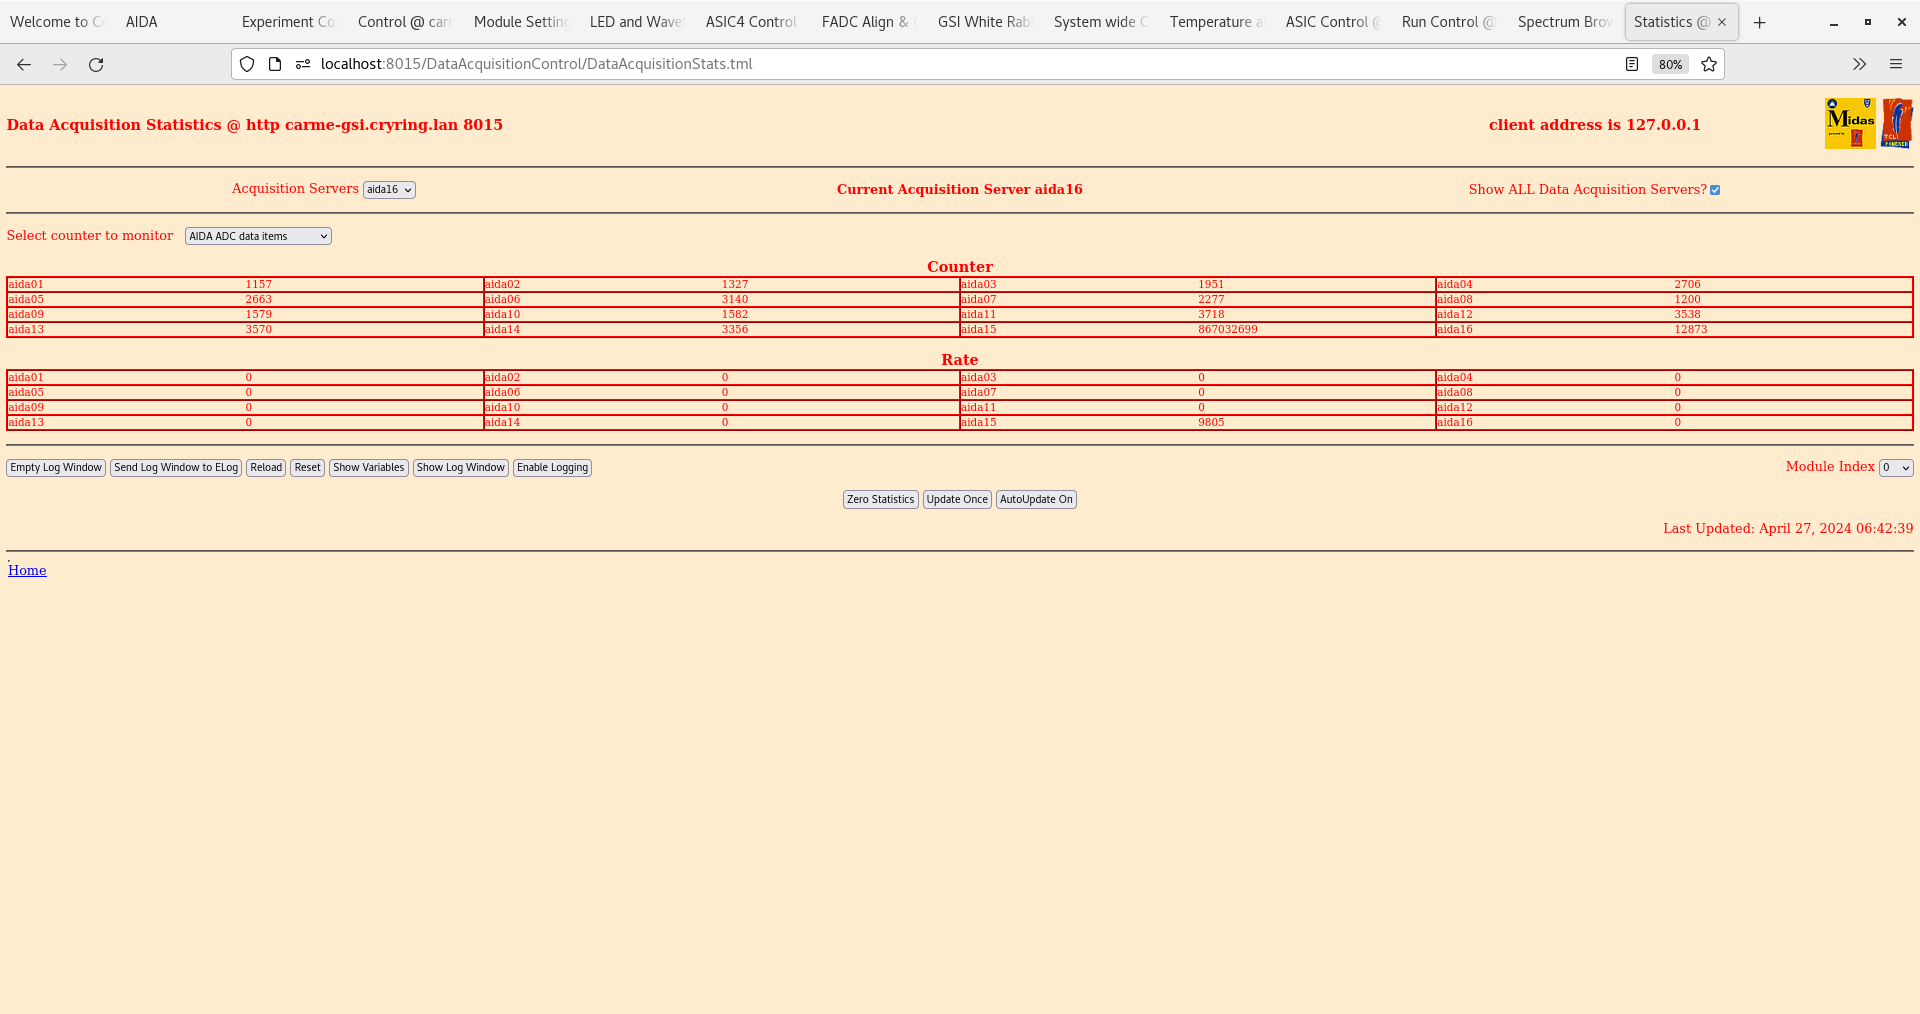
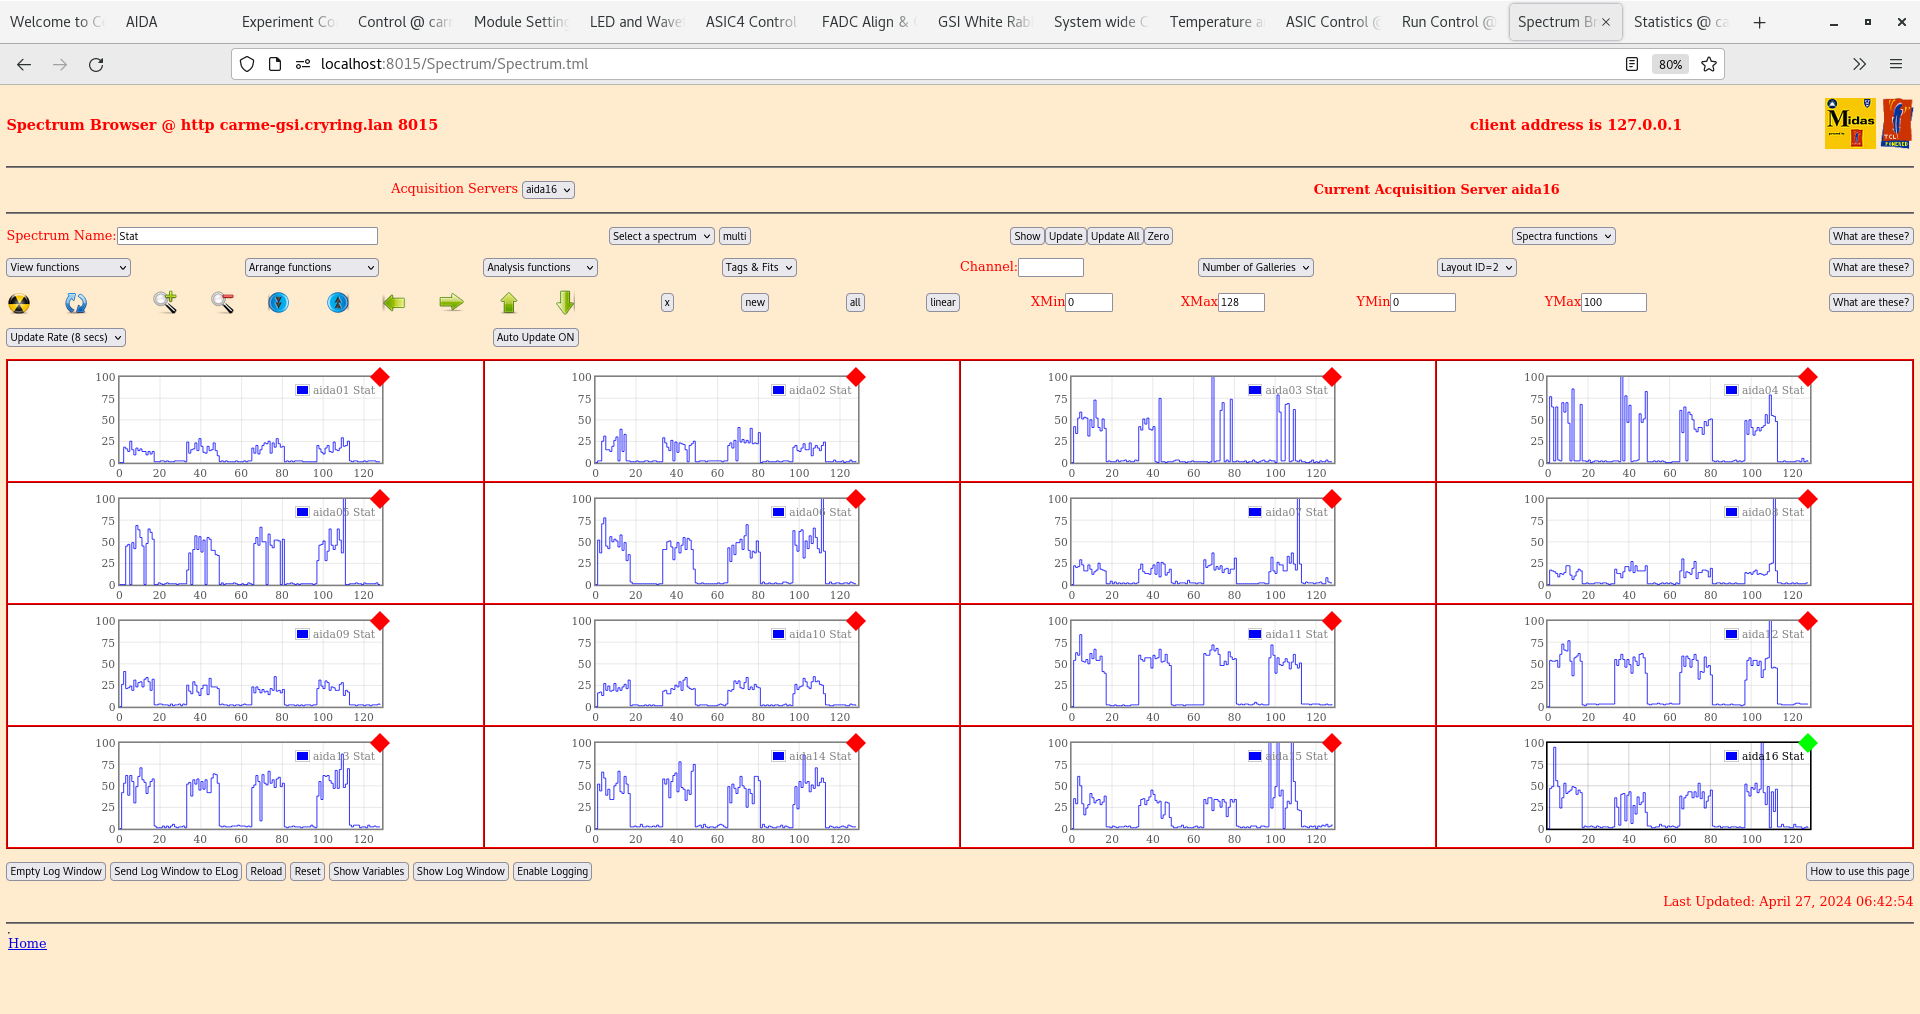
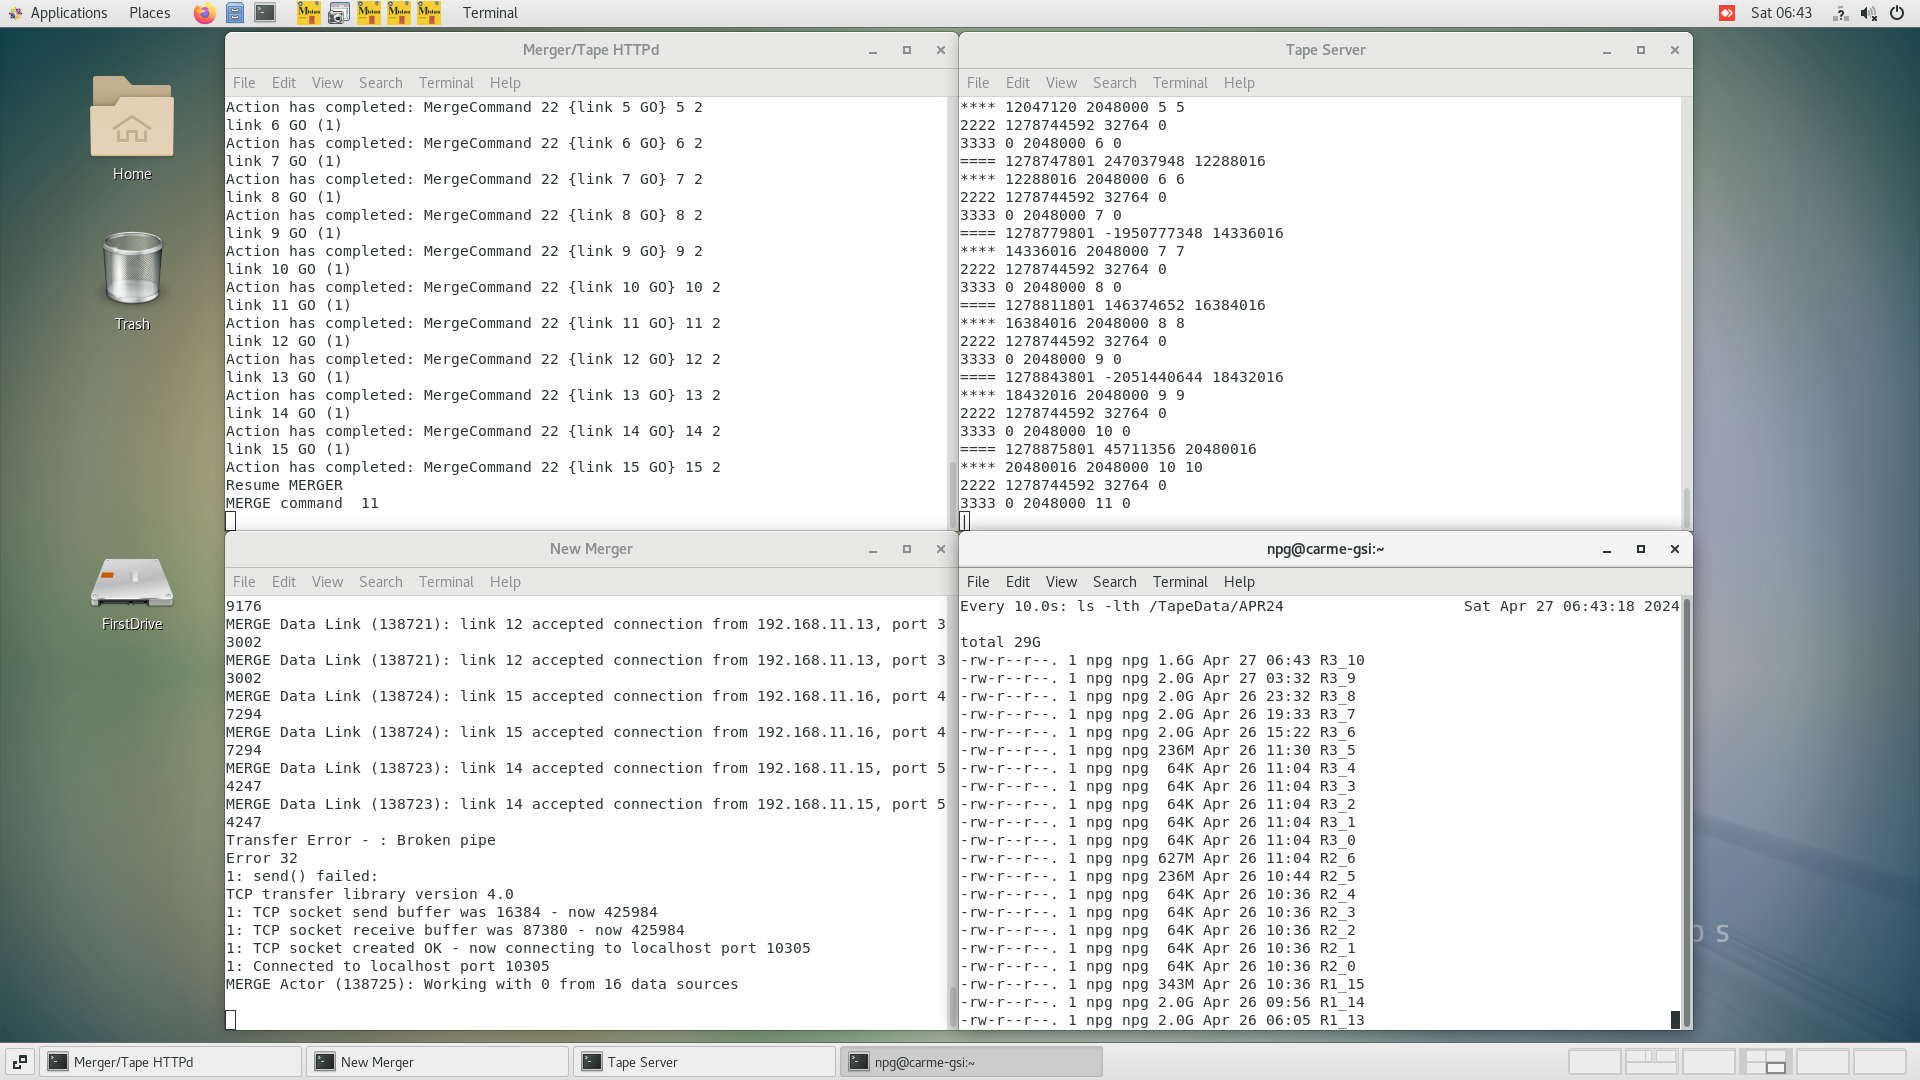
06.41 DAQ continues data file R3_10

      DSSSD bias & leakage current OK - attachment 8

      FEE64 temps OK - attachment 9

      ADC data item stats OK - attachment 10

      per FEE64 Rate spectra - attachment 11

      Merger, TapeServer etc - attachments 12-14


10.56 DAQ continues data file R3_11

      DSSSD bias & leakage current OK - attachment 15

      FEE64 temps OK - attachment 16

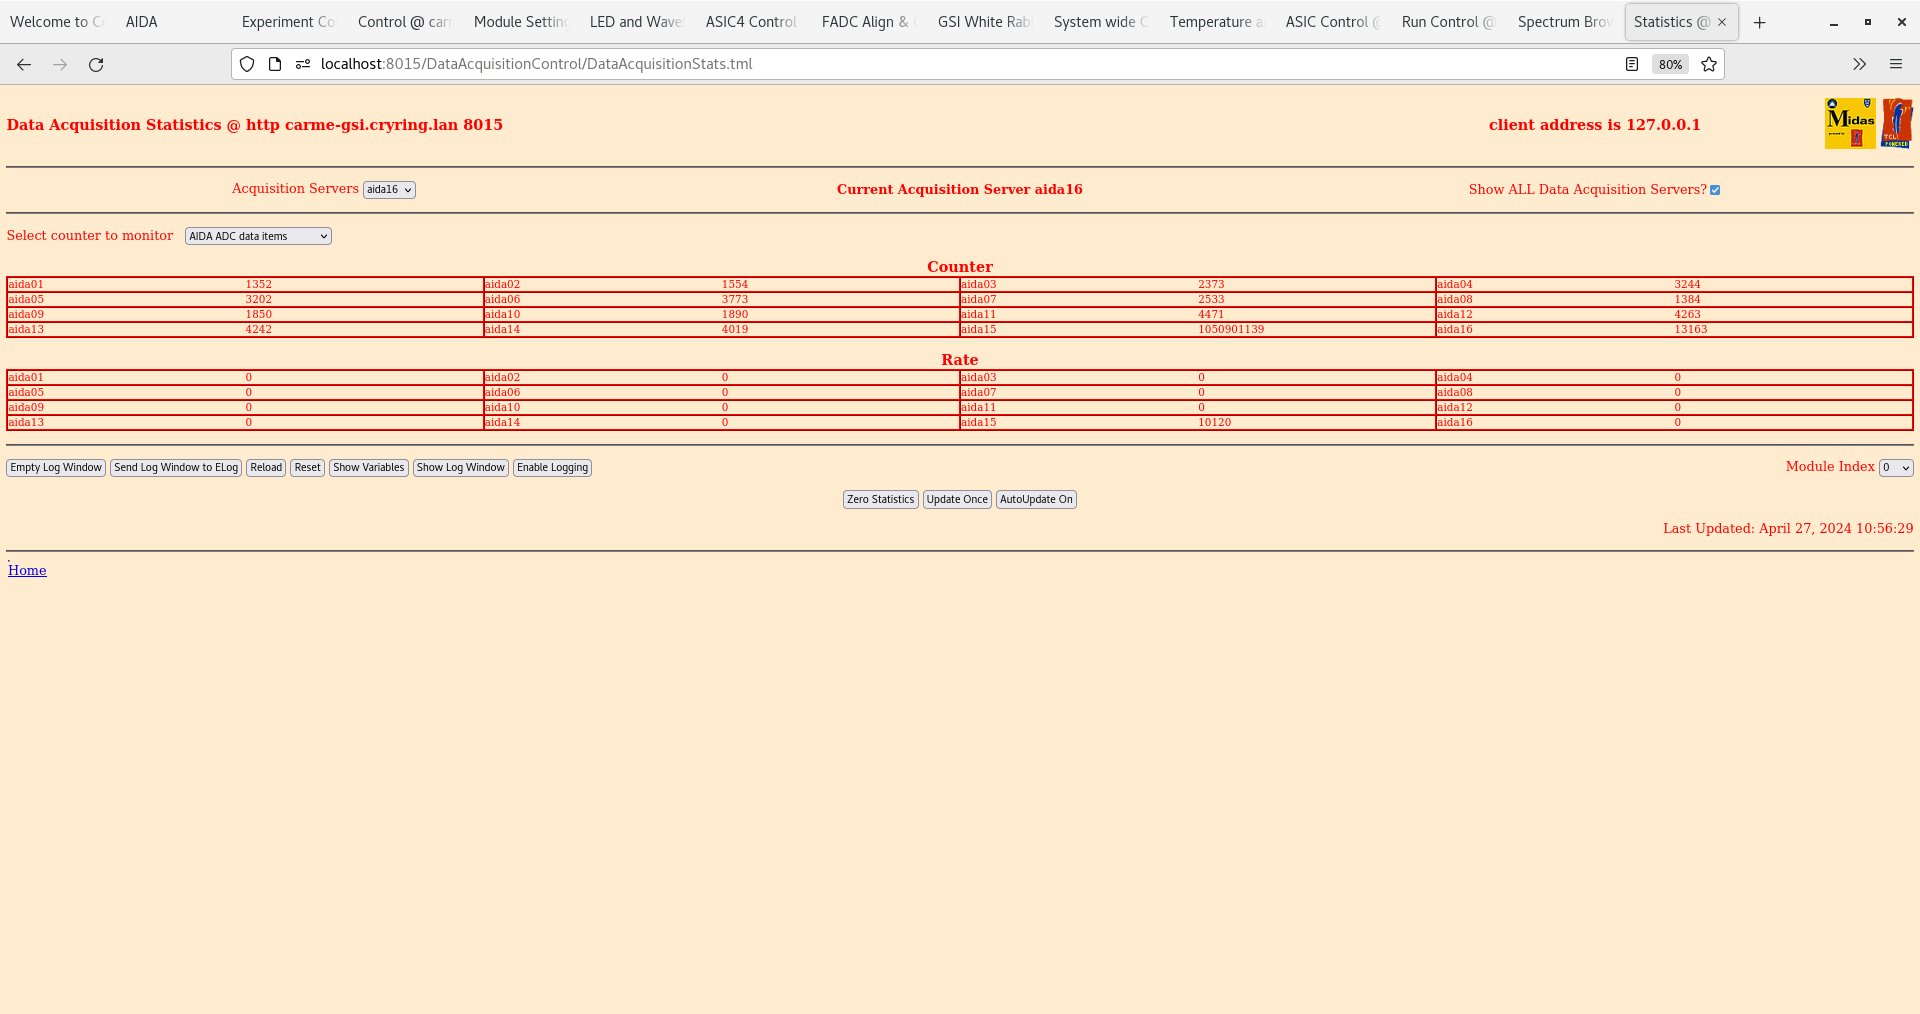
      ADC data item stats OK - attachment 17

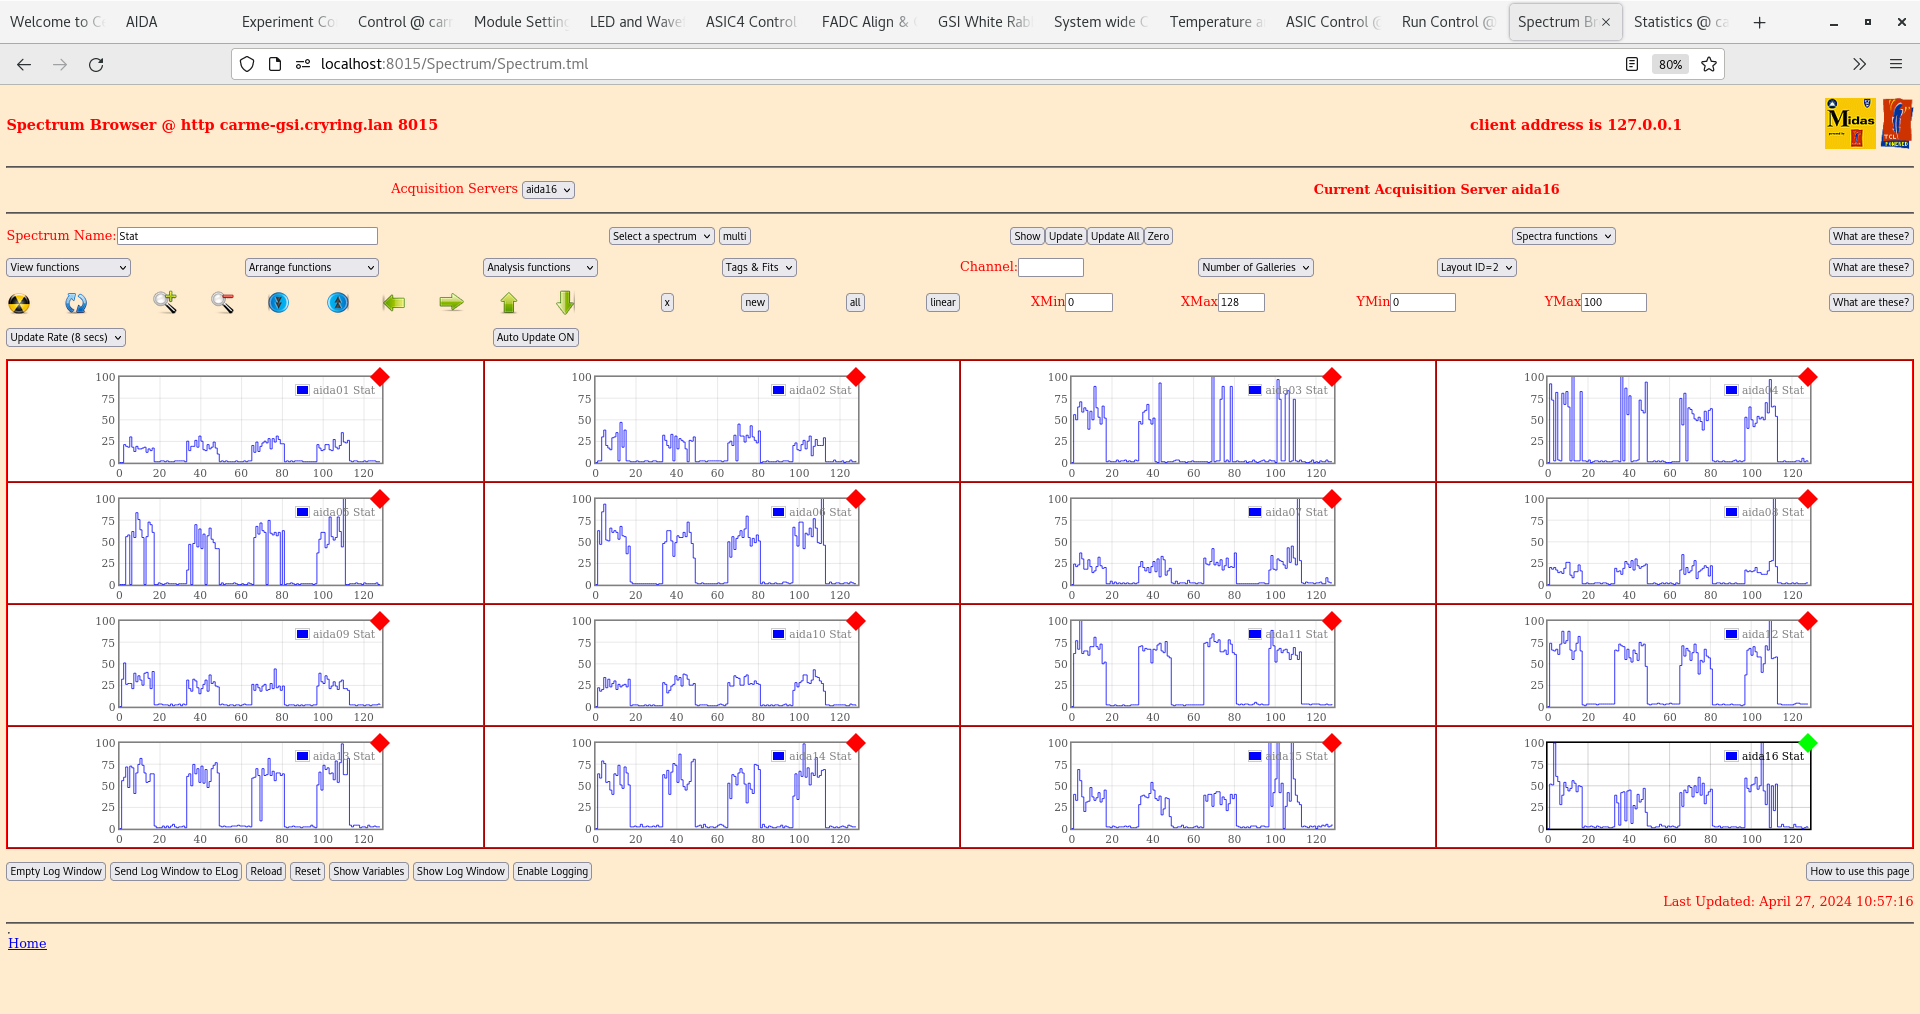
      per FEE64 Rate spectra - attachment 18

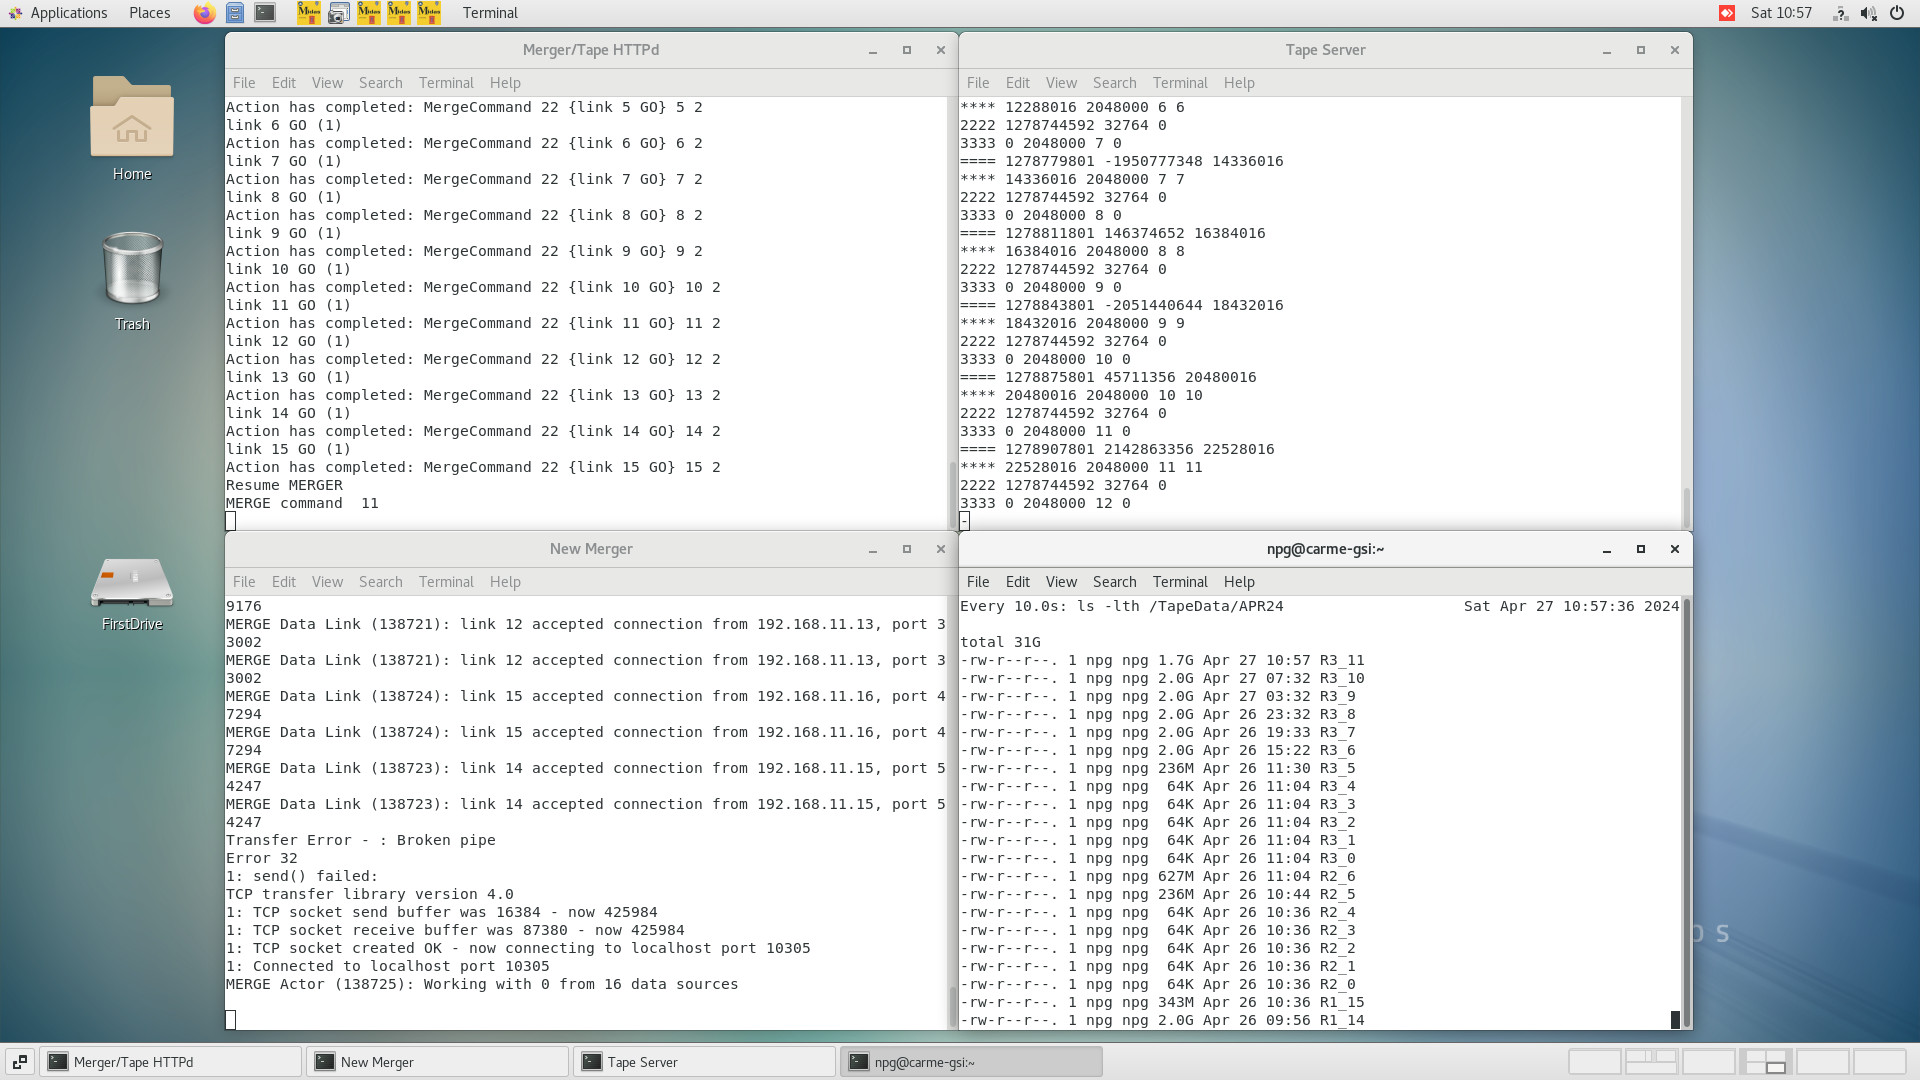
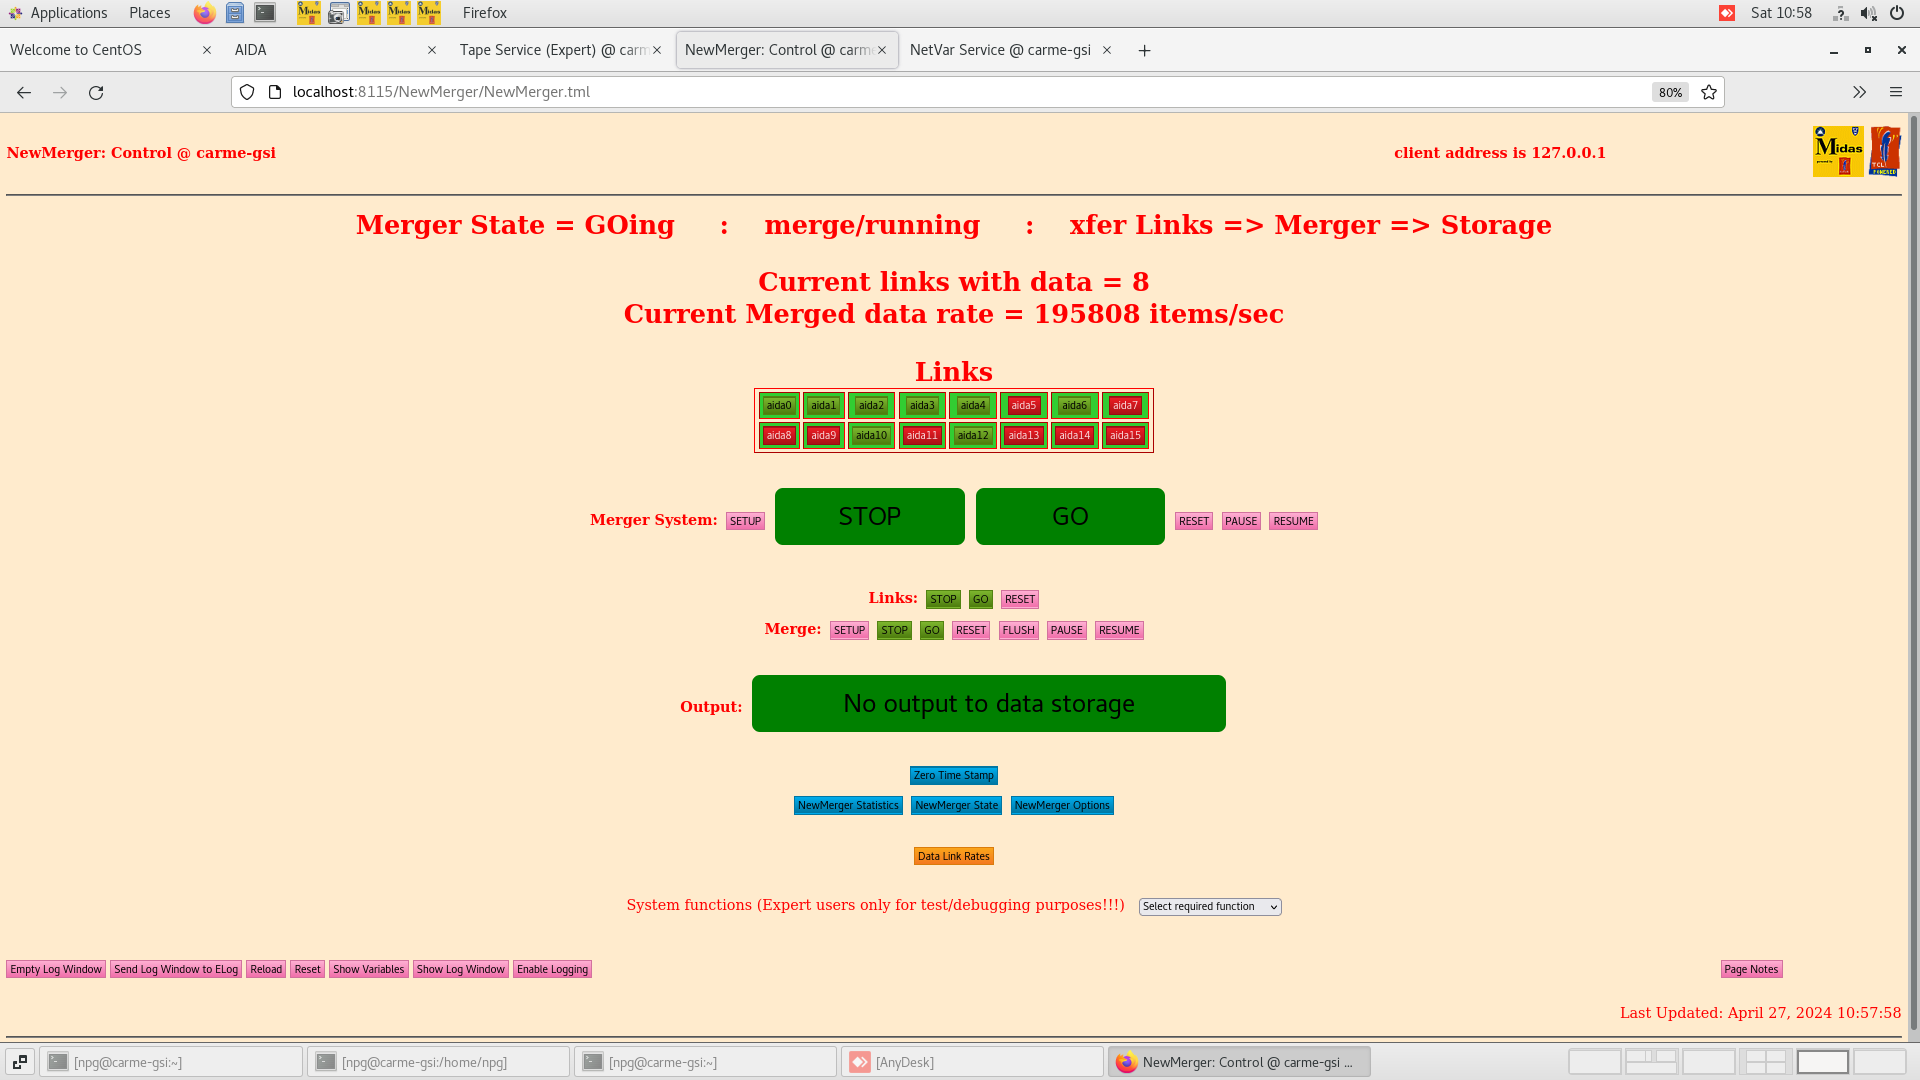
      Merger, TapeServer etc - attachments 19-21

14.33 DAQ continues data file R3_12

      DSSSD bias & leakage current OK - attachment 22

      FEE64 temps OK - attachment 23

      ADC data item stats OK - attachment 24

      per FEE64 Rate spectra - attachment 25

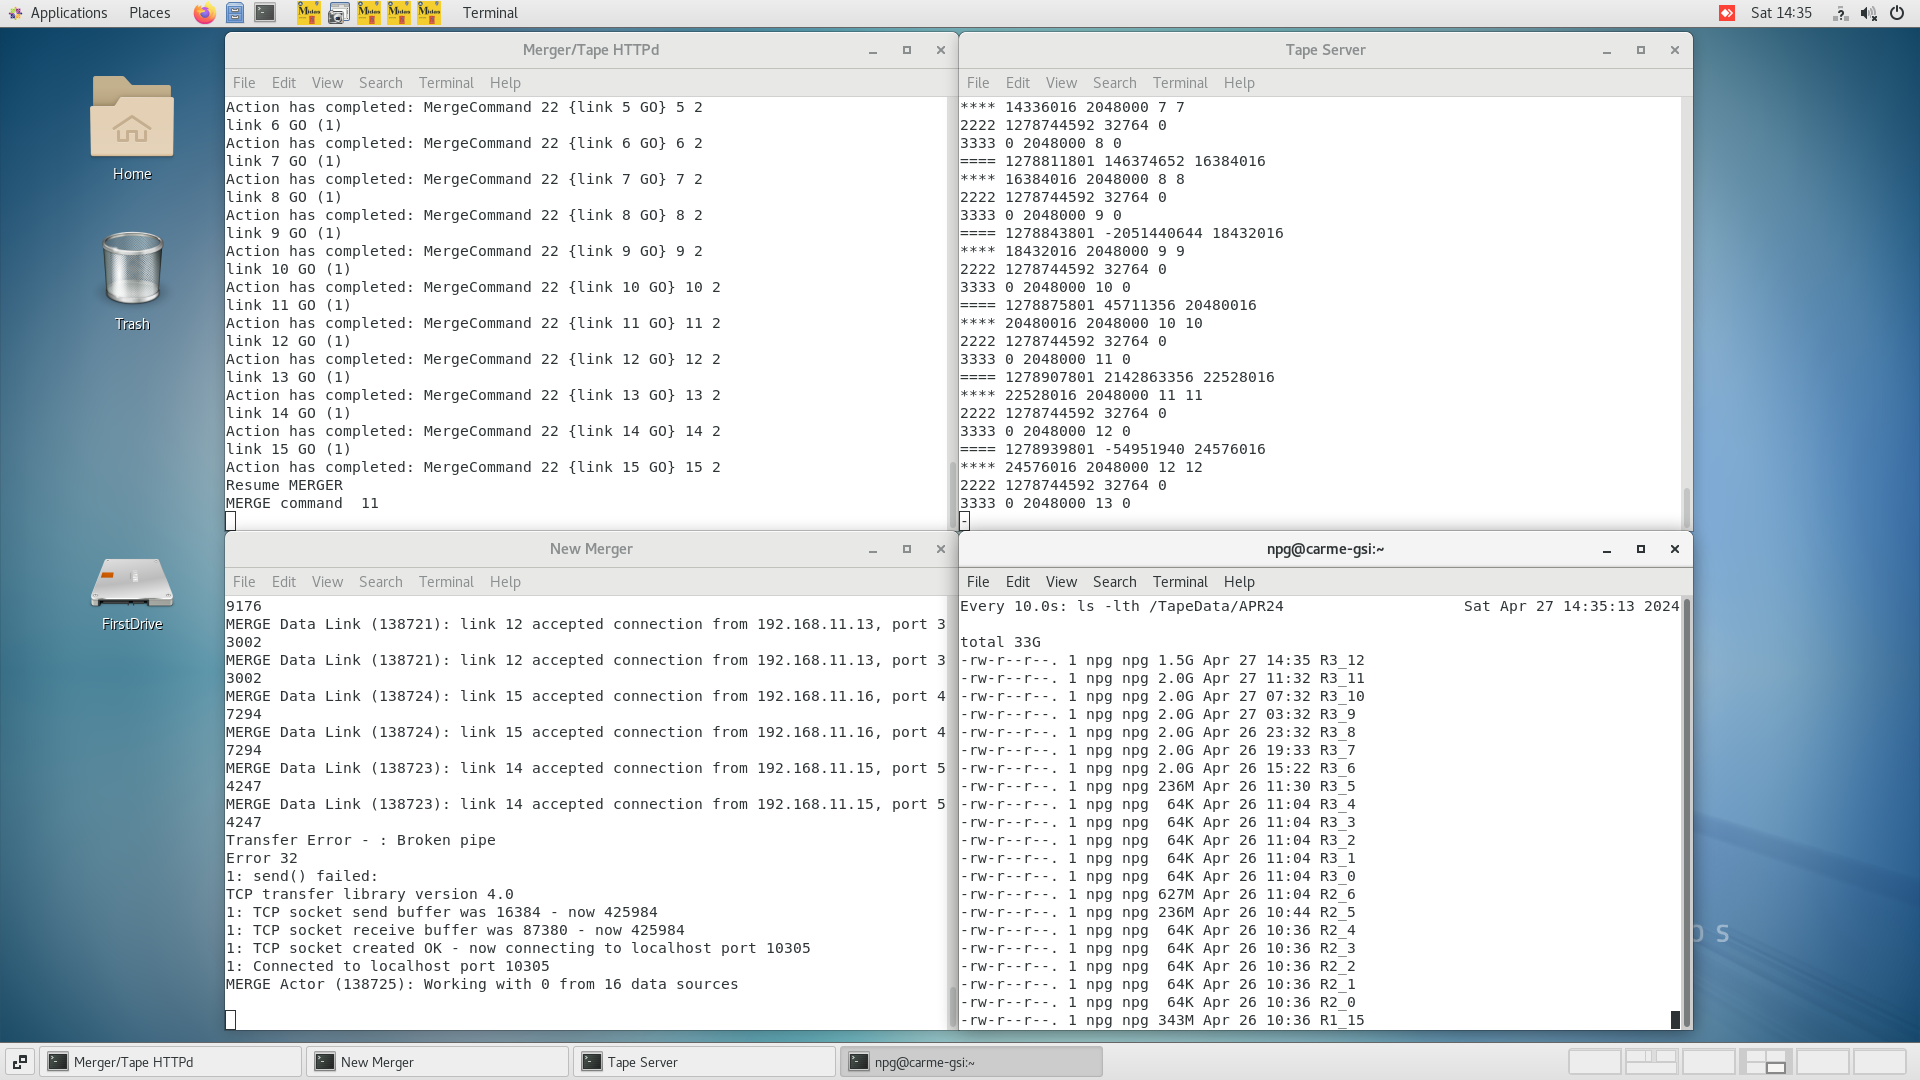
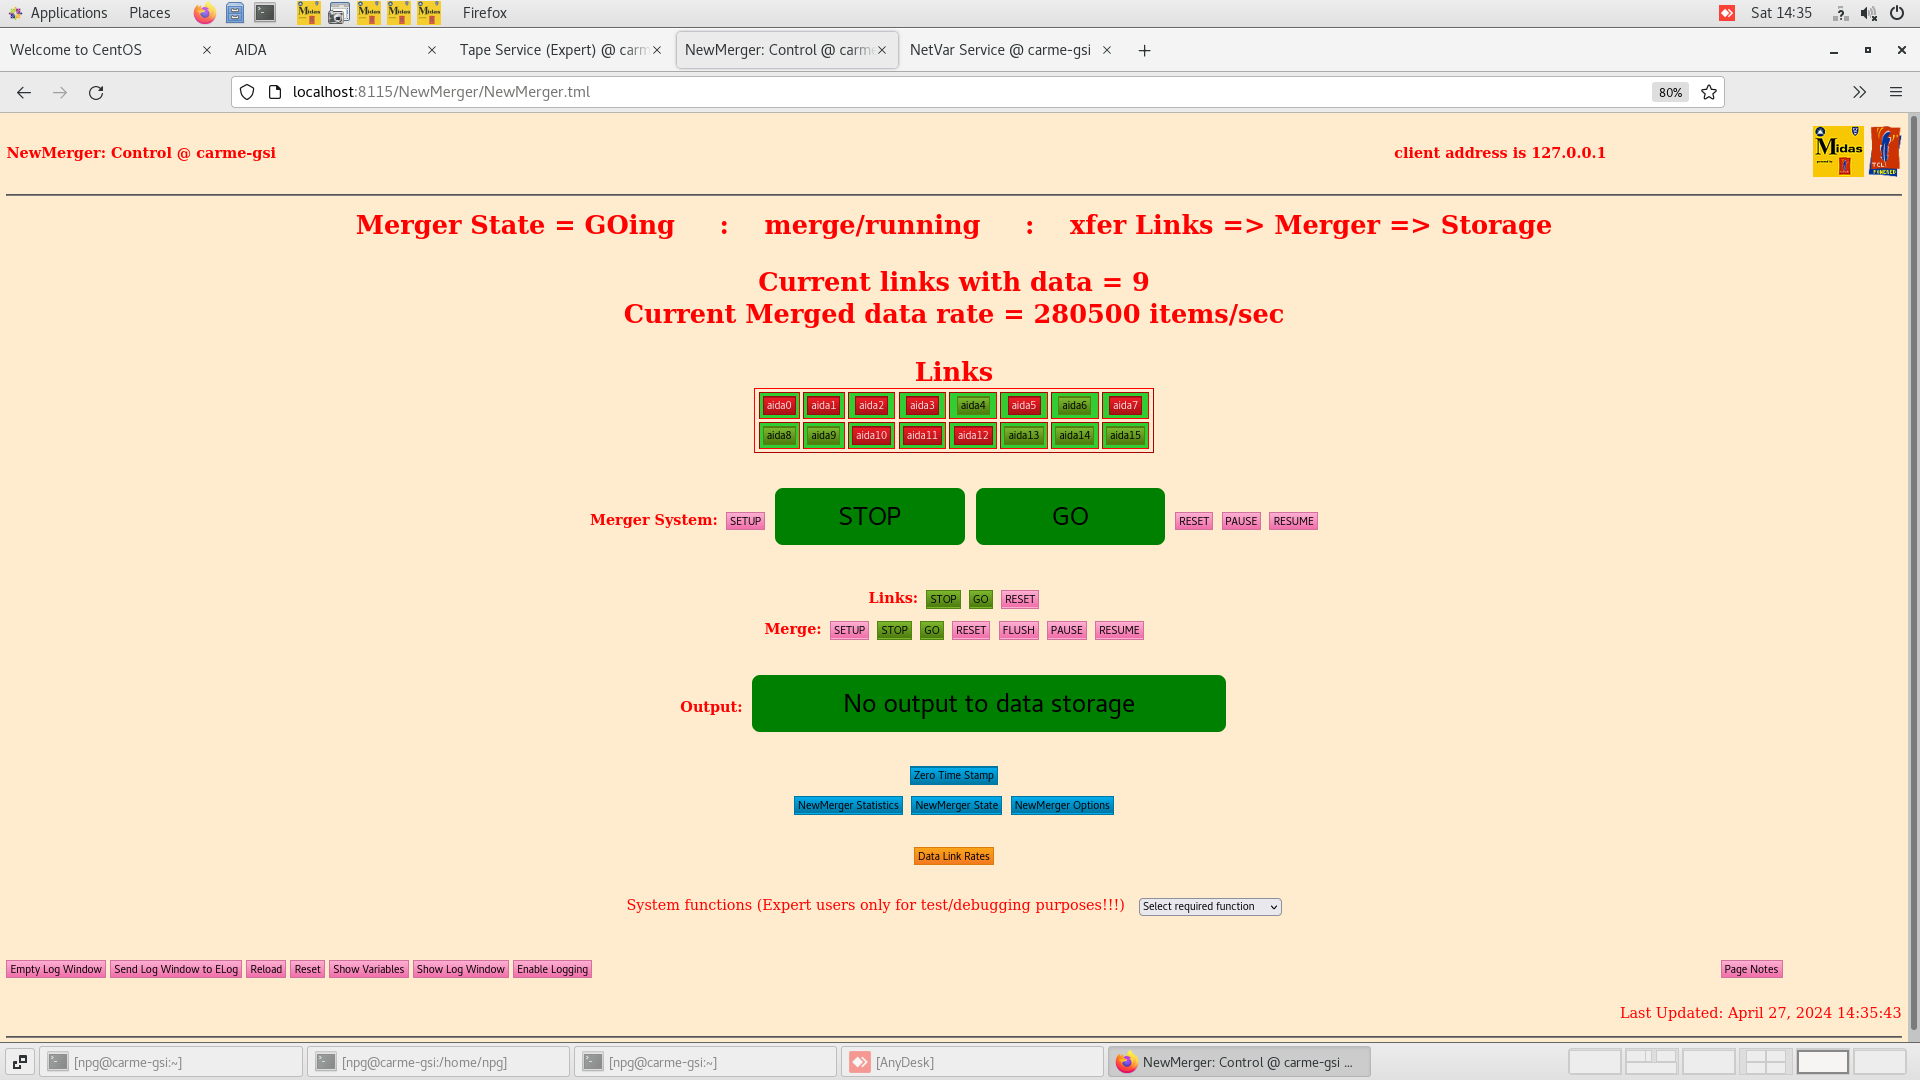
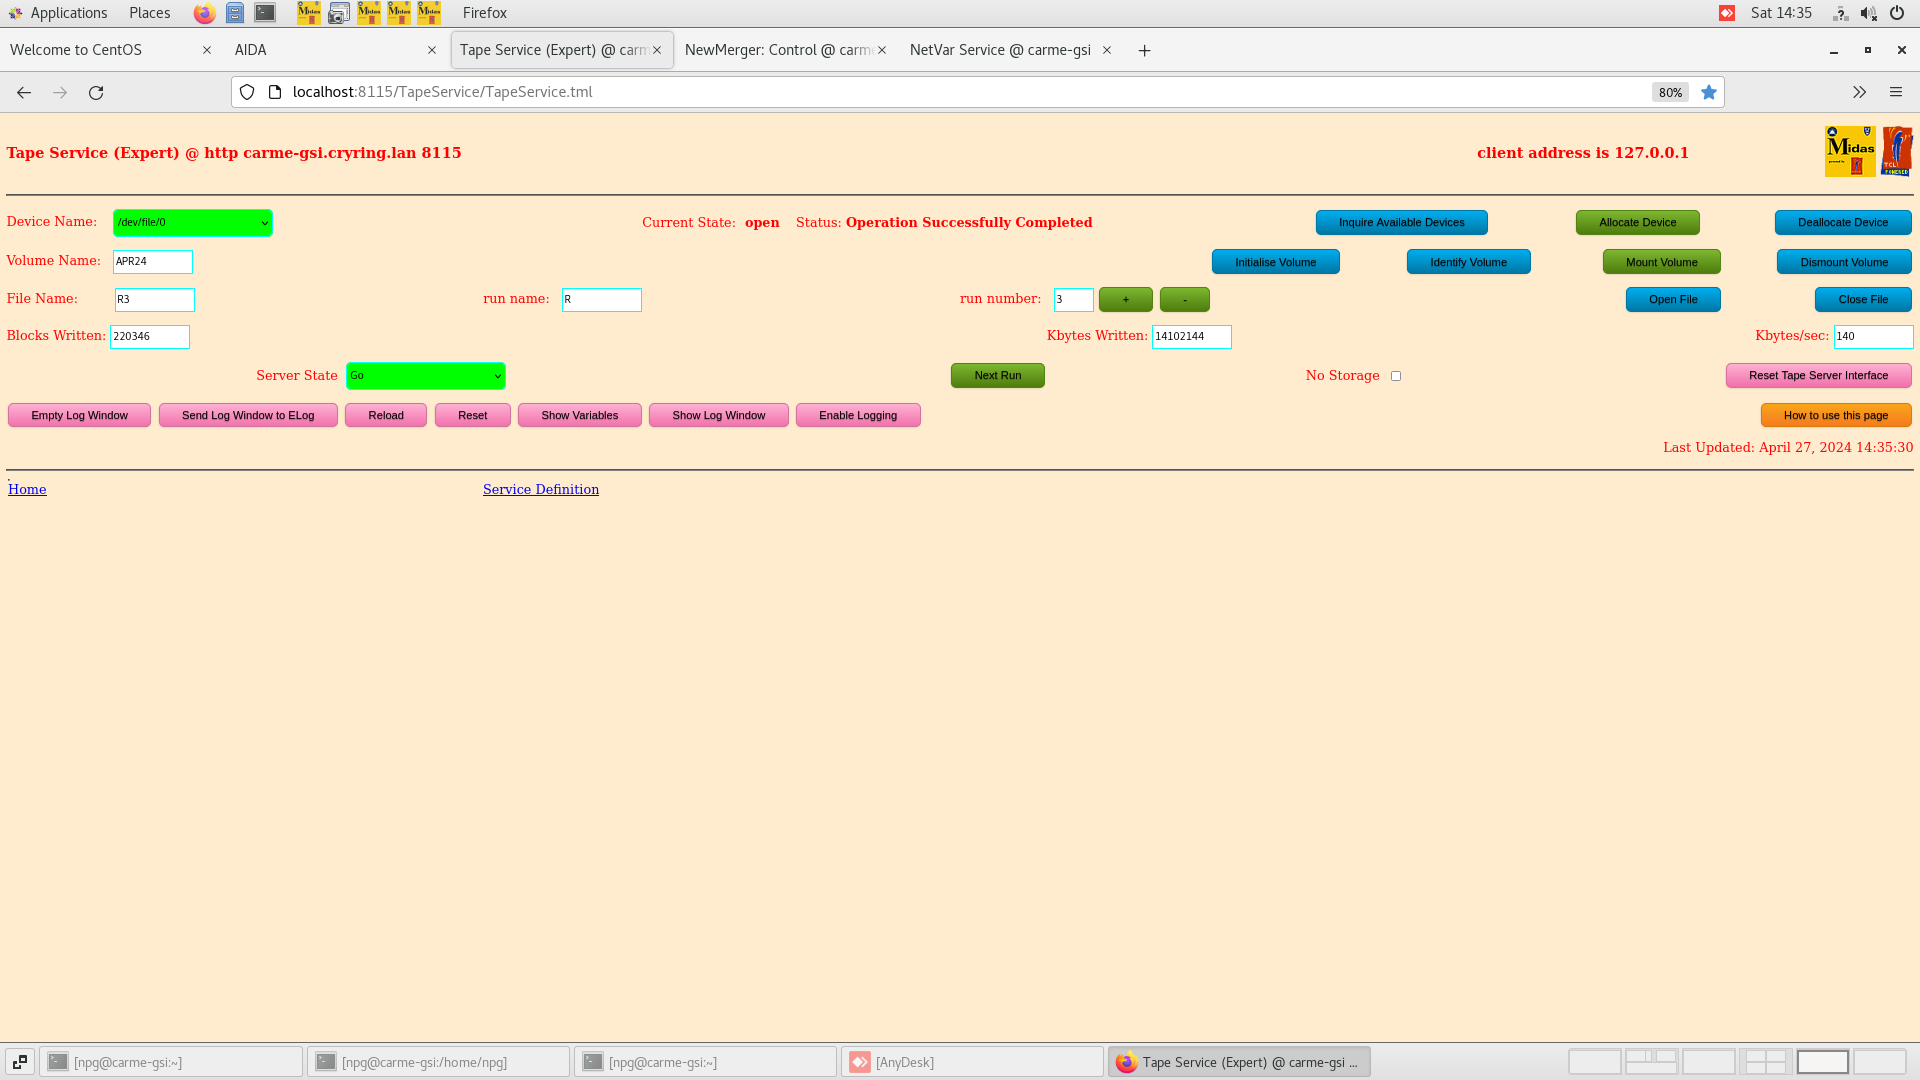
      Merger, TapeServer etc - attachments 26-28

18.31 DAQ continues data file R3_13

      DSSSD bias & leakage current OK - attachment 29

      FEE64 temps OK - attachment 30

      ADC data item stats OK - attachment 31

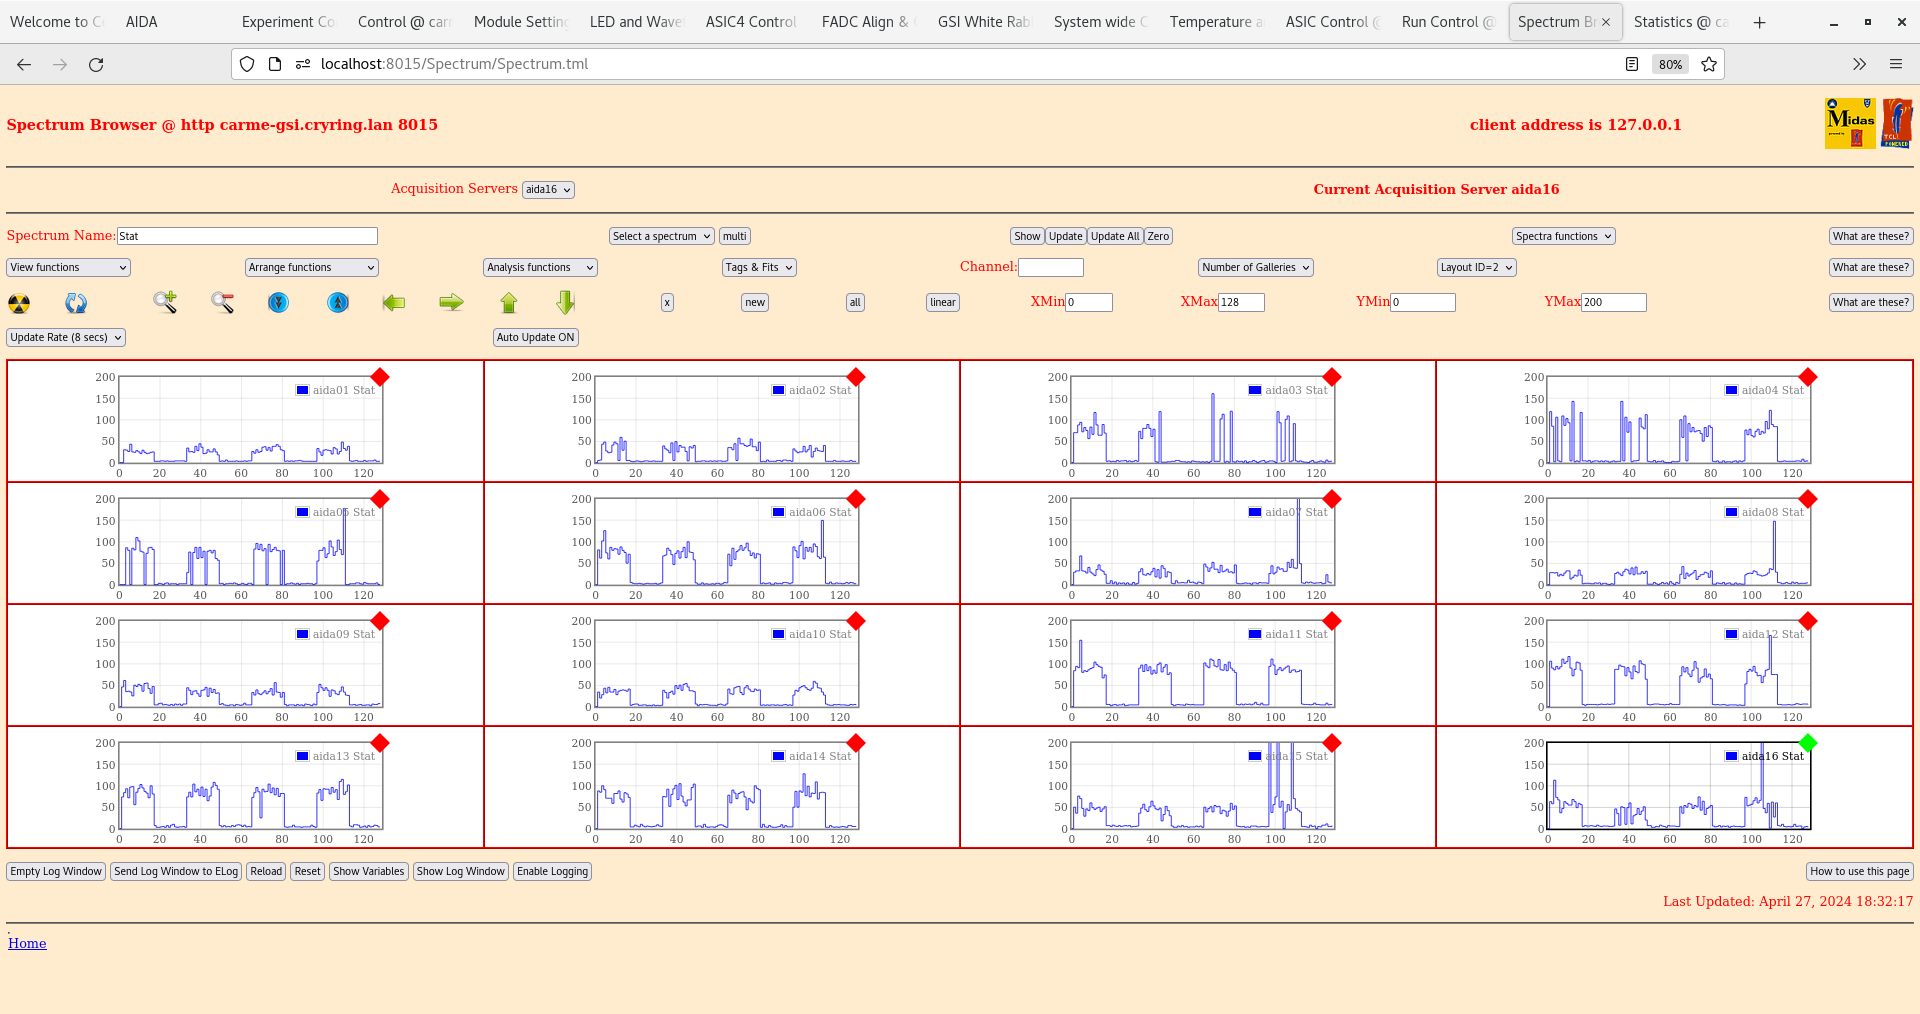
      per FEE64 Rate spectra - attachment 32

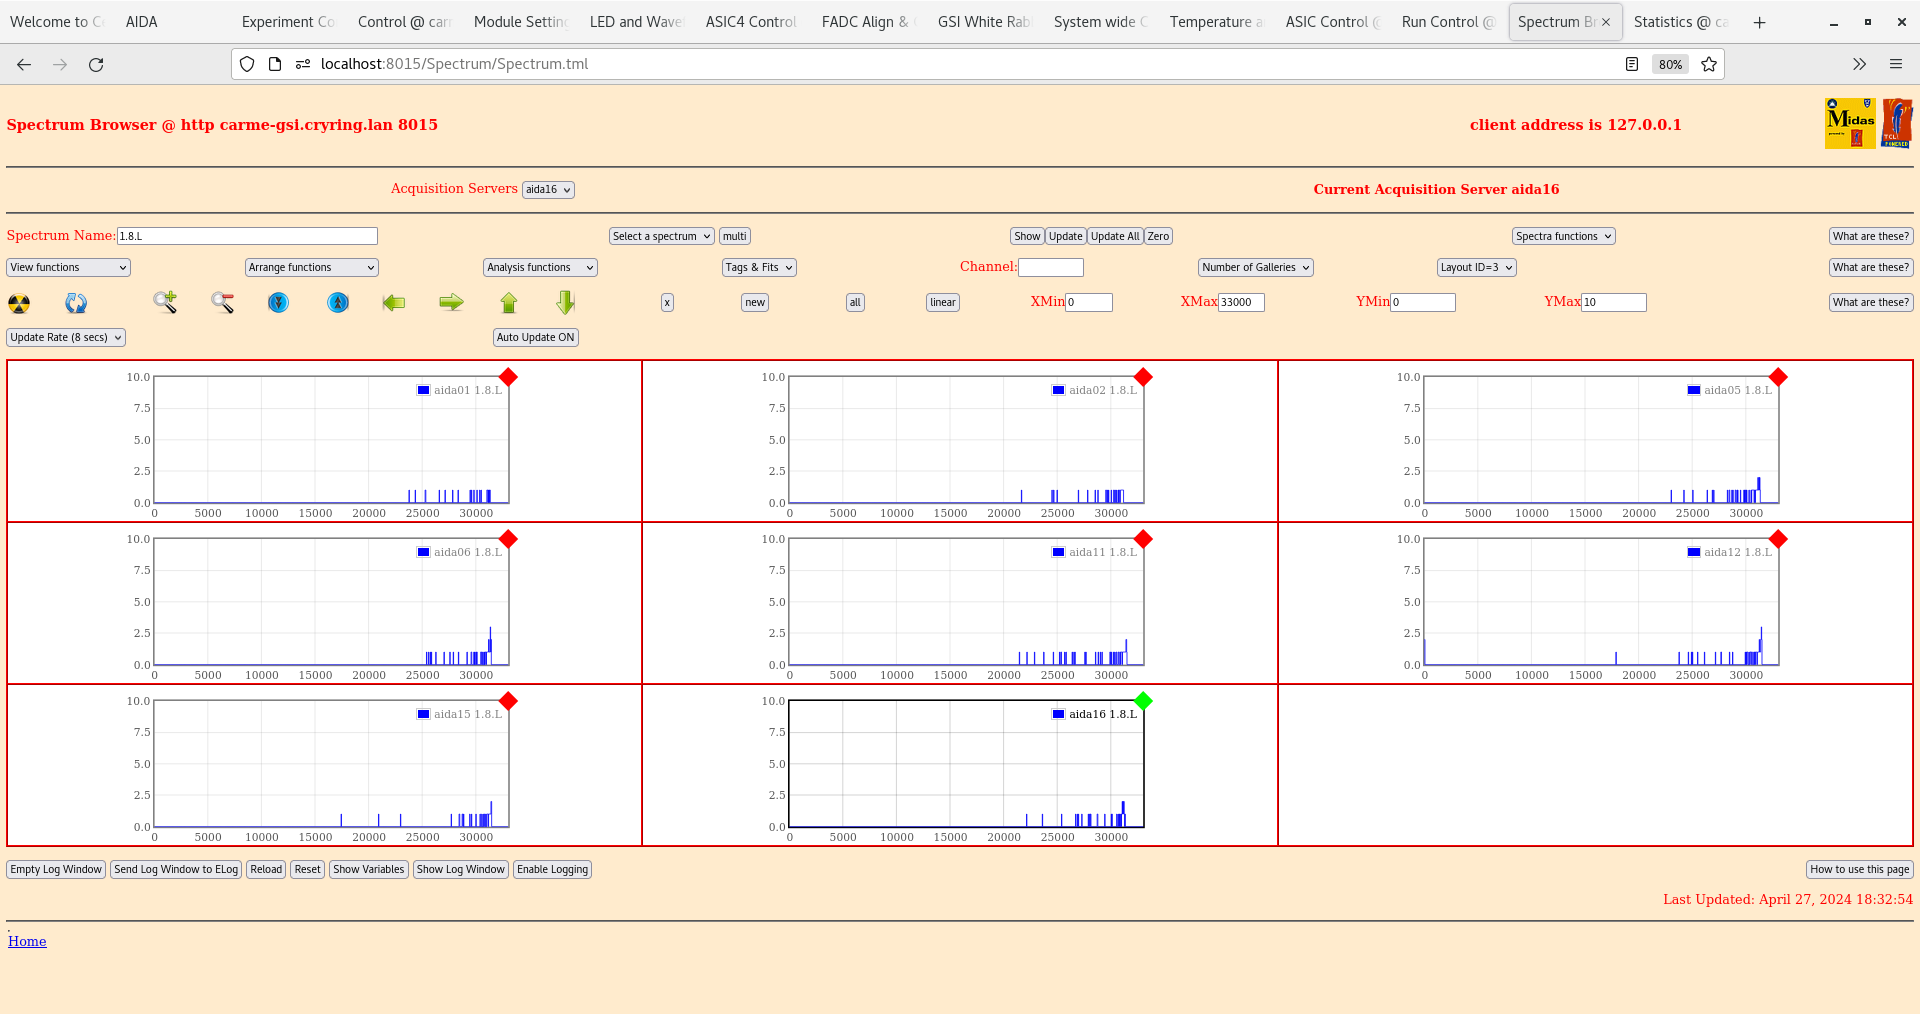
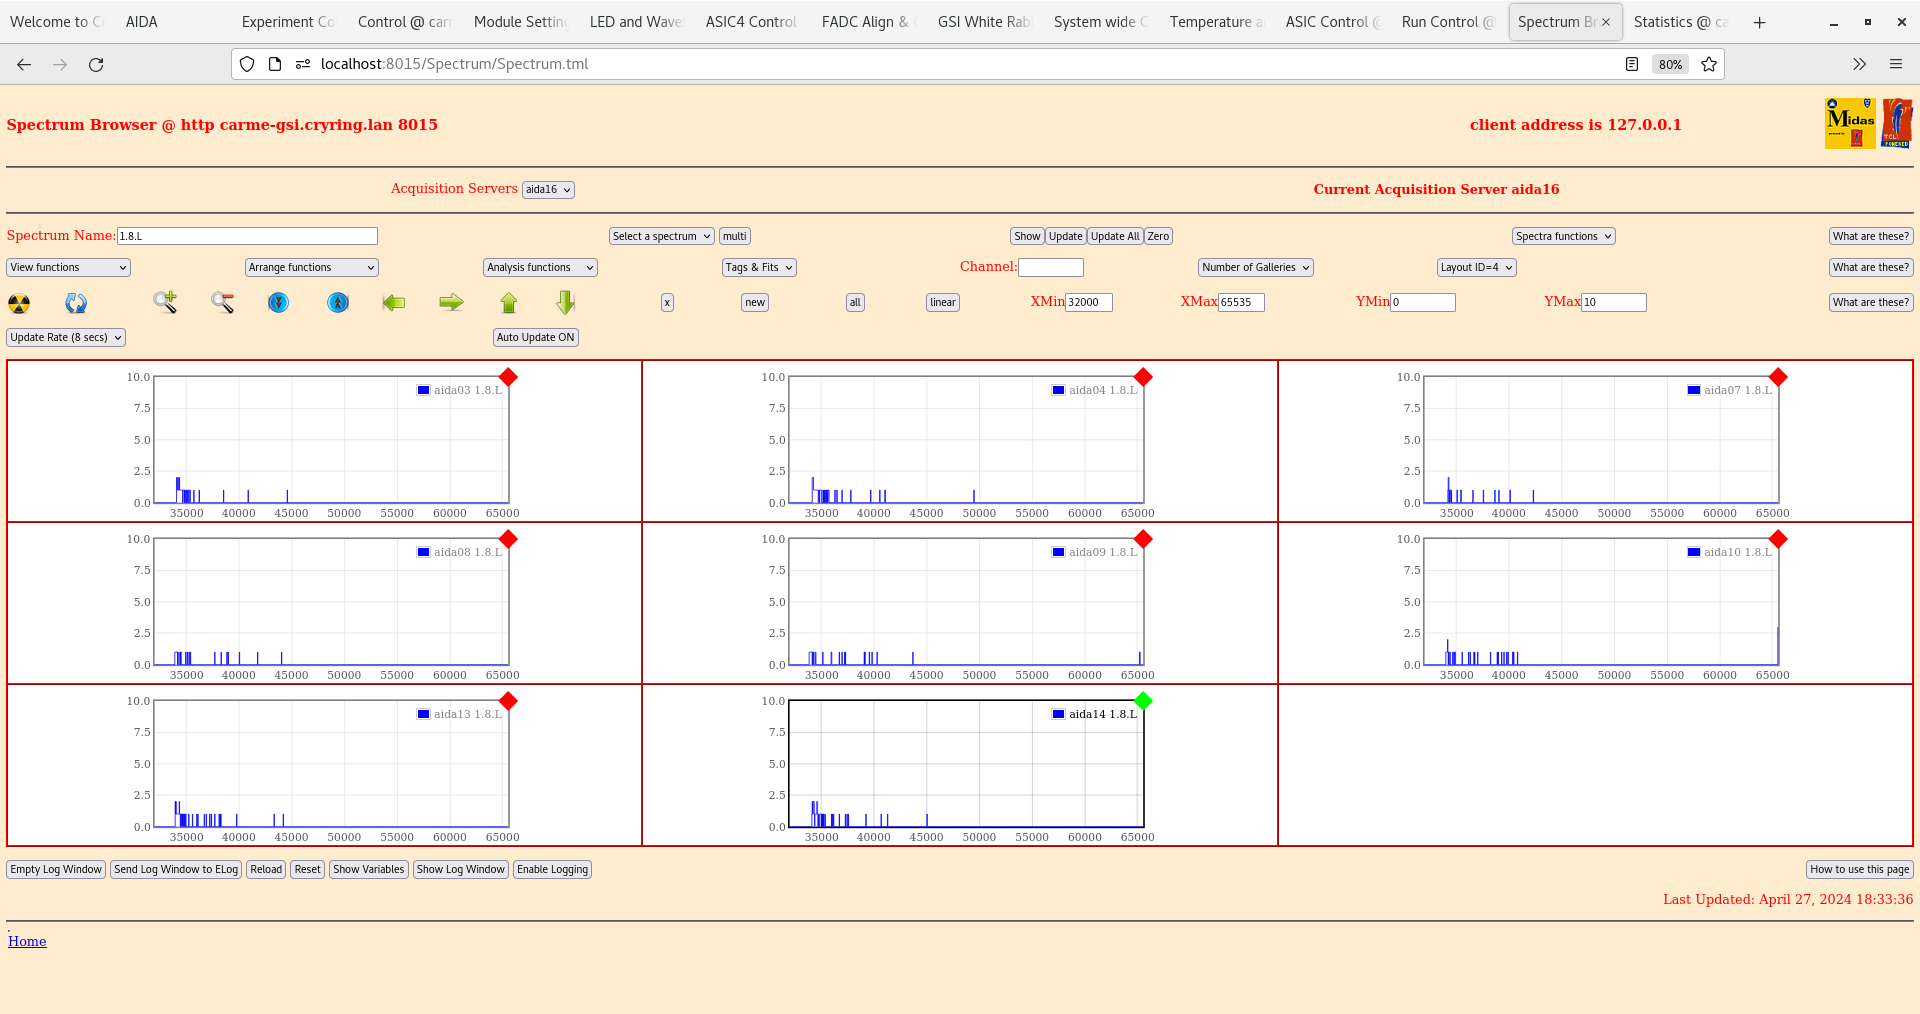
      per FEE64 1.8.L spectra - attachments 33-34

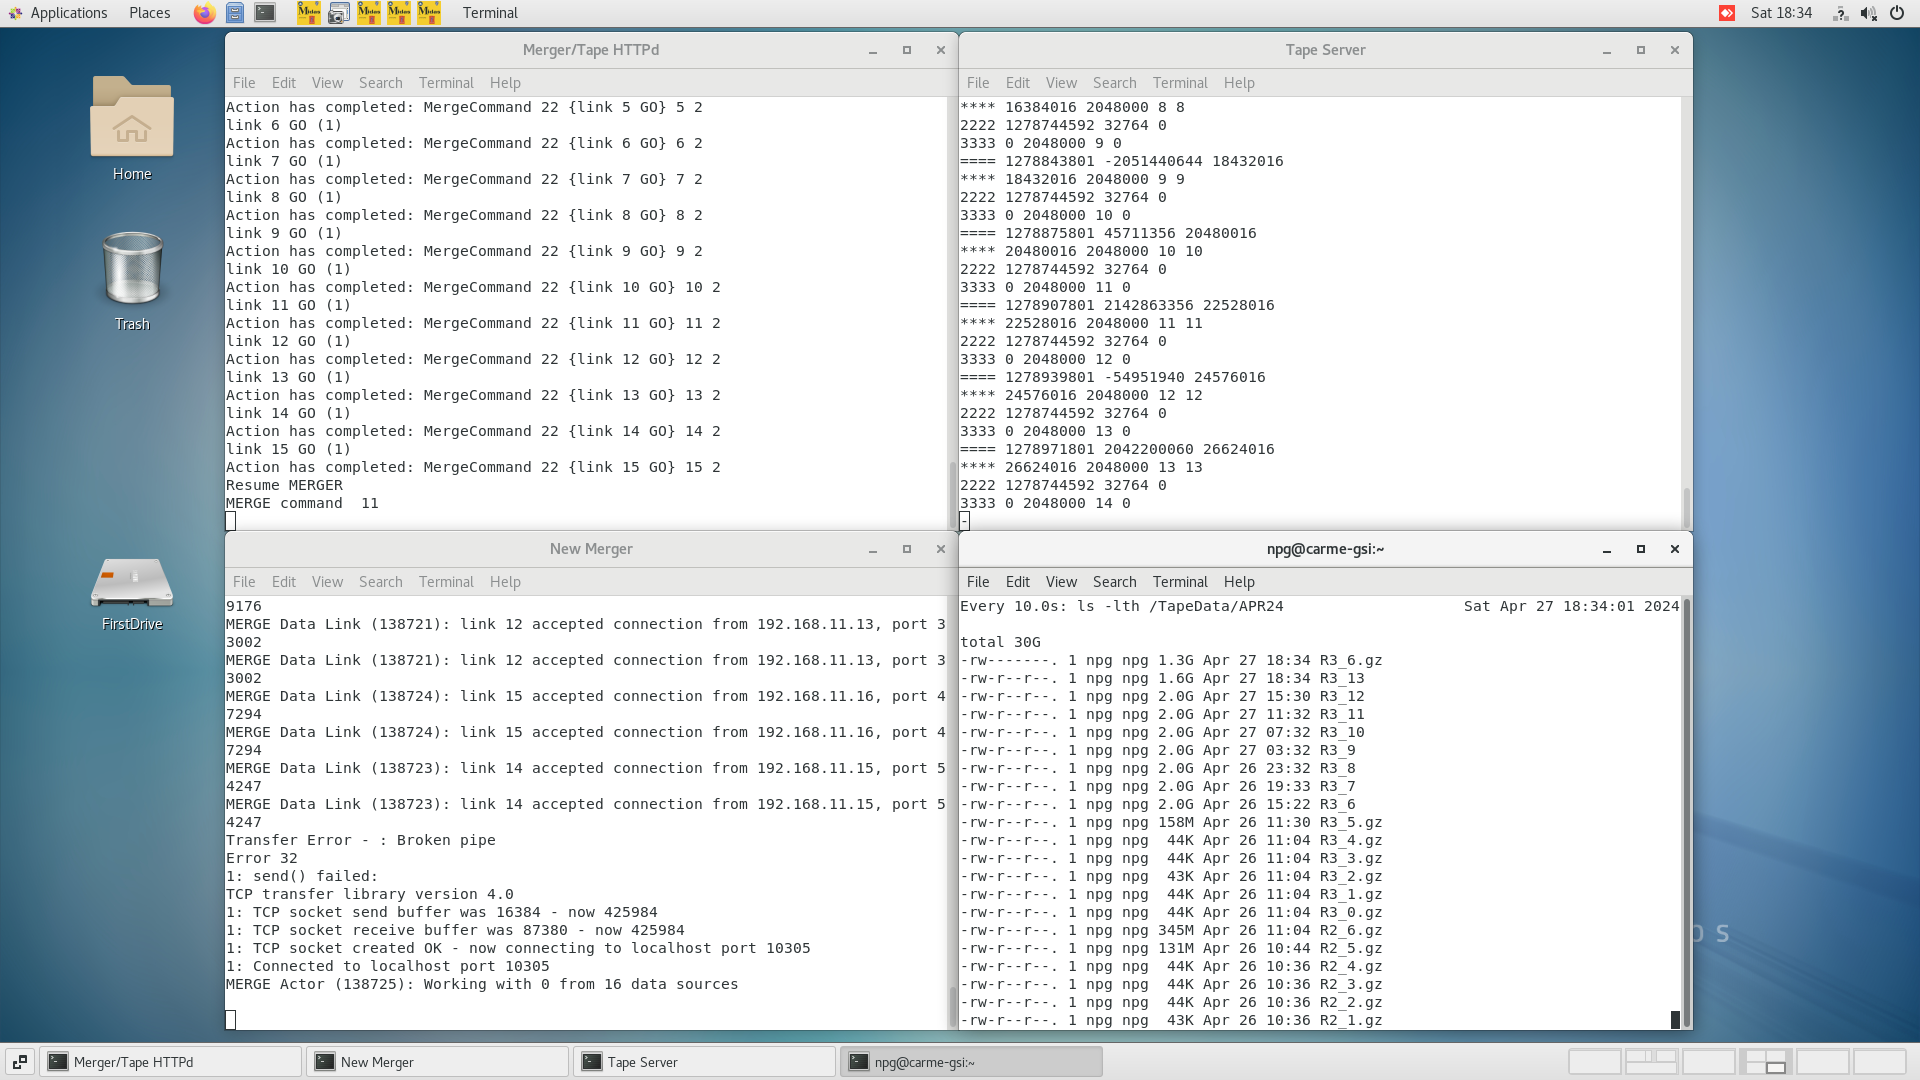
Merger, TapeServer etc - attachments 35-37 |
| Attachment 1: Screenshot_from_2024-04-27_00-34-52.png
|

|
| Attachment 2: Screenshot_from_2024-04-27_00-35-25.png
|

|
| Attachment 3: Screenshot_from_2024-04-27_00-36-07.png
|
|
| Attachment 4: Screenshot_from_2024-04-27_00-36-34.png
|
|
| Attachment 5: Screenshot_from_2024-04-27_00-36-49.png
|
|
| Attachment 6: Screenshot_from_2024-04-27_00-37-14.png
|
|
| Attachment 7: Screenshot_from_2024-04-27_00-37-37.png
|

|
| Attachment 8: Screenshot_from_2024-04-27_06-41-34.png
|
|
| Attachment 9: Screenshot_from_2024-04-27_06-42-06.png
|
|
| Attachment 10: Screenshot_from_2024-04-27_06-42-48.png
|
|
| Attachment 11: Screenshot_from_2024-04-27_06-43-08.png
|
|
| Attachment 12: Screenshot_from_2024-04-27_06-43-19.png
|
|
| Attachment 13: Screenshot_from_2024-04-27_06-43-36.png
|

|
| Attachment 14: Screenshot_from_2024-04-27_06-43-50.png
|
|
| Attachment 15: Screenshot_from_2024-04-27_10-55-54.png
|

|
| Attachment 16: Screenshot_from_2024-04-27_10-56-21.png
|

|
| Attachment 17: Screenshot_from_2024-04-27_10-56-38.png
|
|
| Attachment 18: Screenshot_from_2024-04-27_10-57-26.png
|
|
| Attachment 19: Screenshot_from_2024-04-27_10-57-45.png
|
|
| Attachment 20: Screenshot_from_2024-04-27_10-58-04.png
|
|
| Attachment 21: Screenshot_from_2024-04-27_10-58-16.png
|

|
| Attachment 22: Screenshot_from_2024-04-27_14-33-33.png
|

|
| Attachment 23: Screenshot_from_2024-04-27_14-34-04.png
|

|
| Attachment 24: Screenshot_from_2024-04-27_14-34-52.png
|

|
| Attachment 25: Screenshot_from_2024-04-27_14-35-08.png
|

|
| Attachment 26: Screenshot_from_2024-04-27_14-35-19.png
|
|
| Attachment 27: Screenshot_from_2024-04-27_14-35-50.png
|
|
| Attachment 28: Screenshot_from_2024-04-27_14-35-34.png
|
|
| Attachment 29: Screenshot_from_2024-04-27_18-31-01.png
|

|
| Attachment 30: Screenshot_from_2024-04-27_18-31-22.png
|

|
| Attachment 31: Screenshot_from_2024-04-27_18-31-40.png
|

|
| Attachment 32: Screenshot_from_2024-04-27_18-32-27.png
|
|
| Attachment 33: Screenshot_from_2024-04-27_18-33-04.png
|
|
| Attachment 34: Screenshot_from_2024-04-27_18-33-47.png
|
|
| Attachment 35: Screenshot_from_2024-04-27_18-34-04.png
|
|
| Attachment 36: Screenshot_from_2024-04-27_18-34-22.png
|
|
| Attachment 37: Screenshot_from_2024-04-27_18-34-44.png
|

|
|
287
|
Sat Feb 26 04:36:38 2022 |
RSS TD | Saturday 26 February 07:00-15:00 |
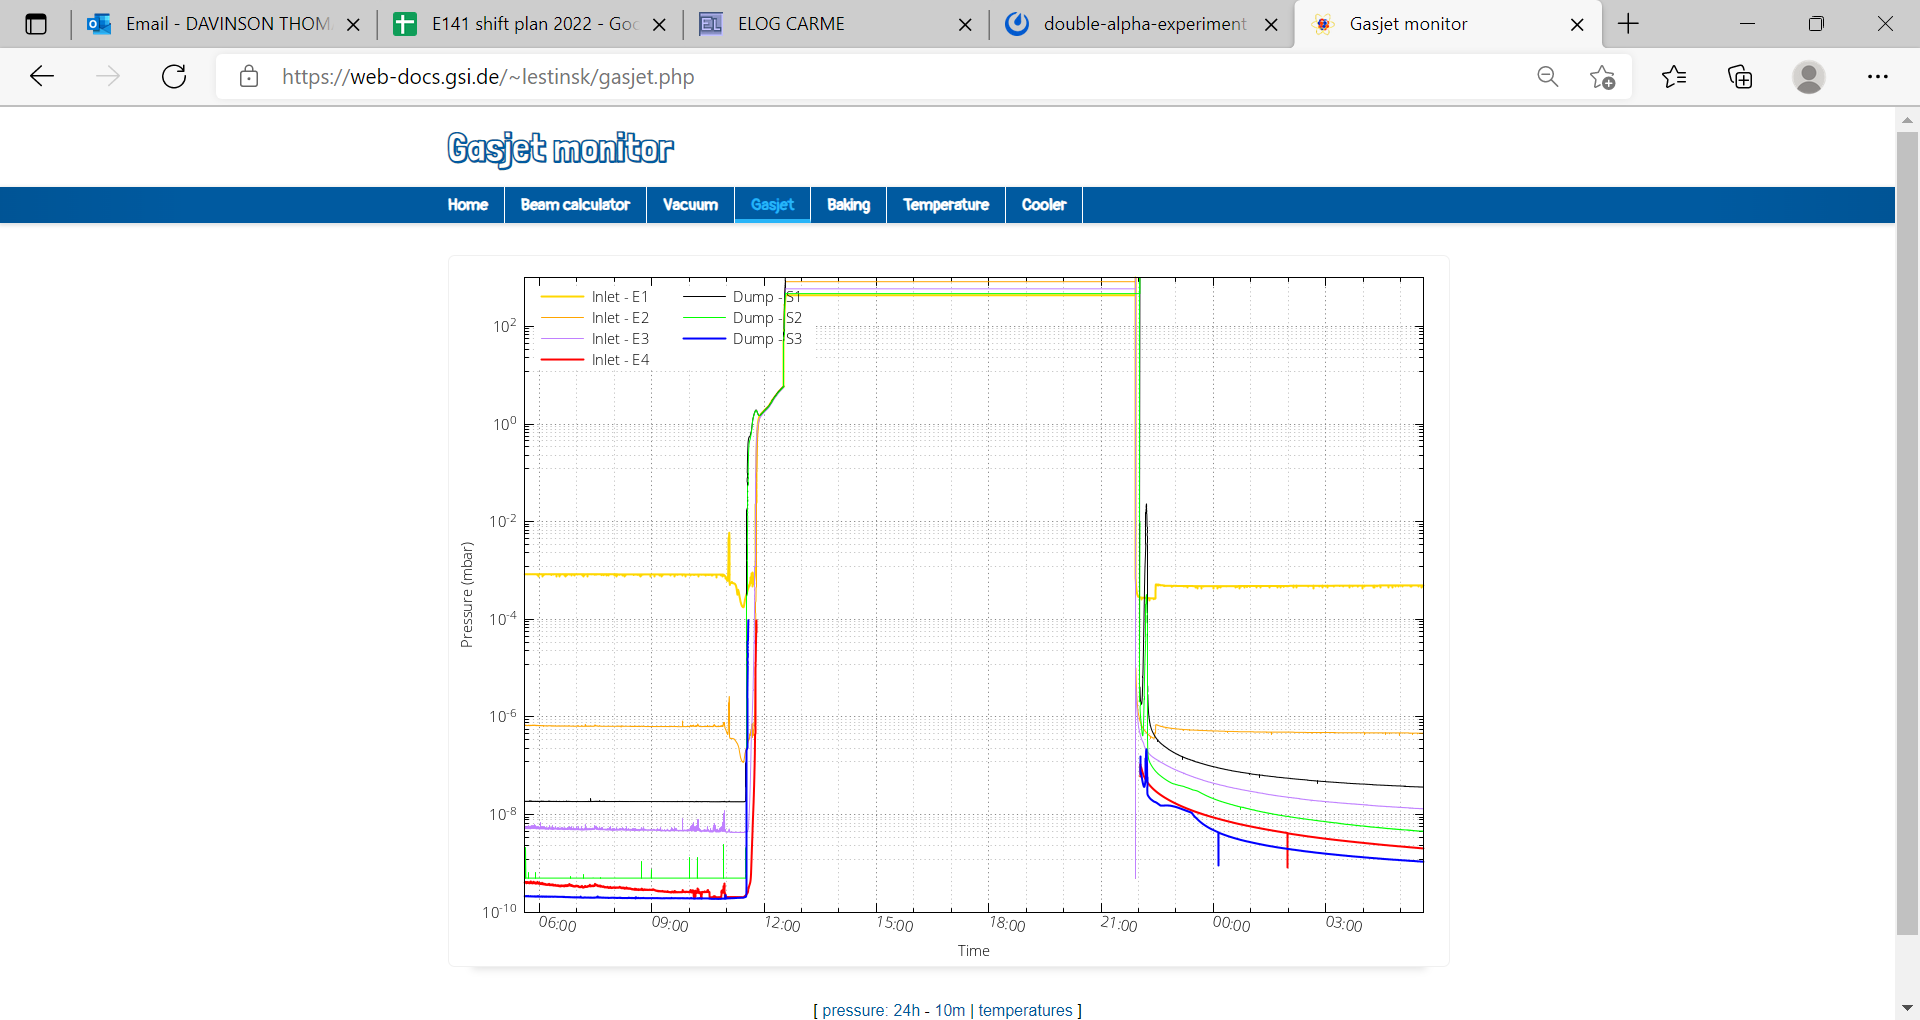
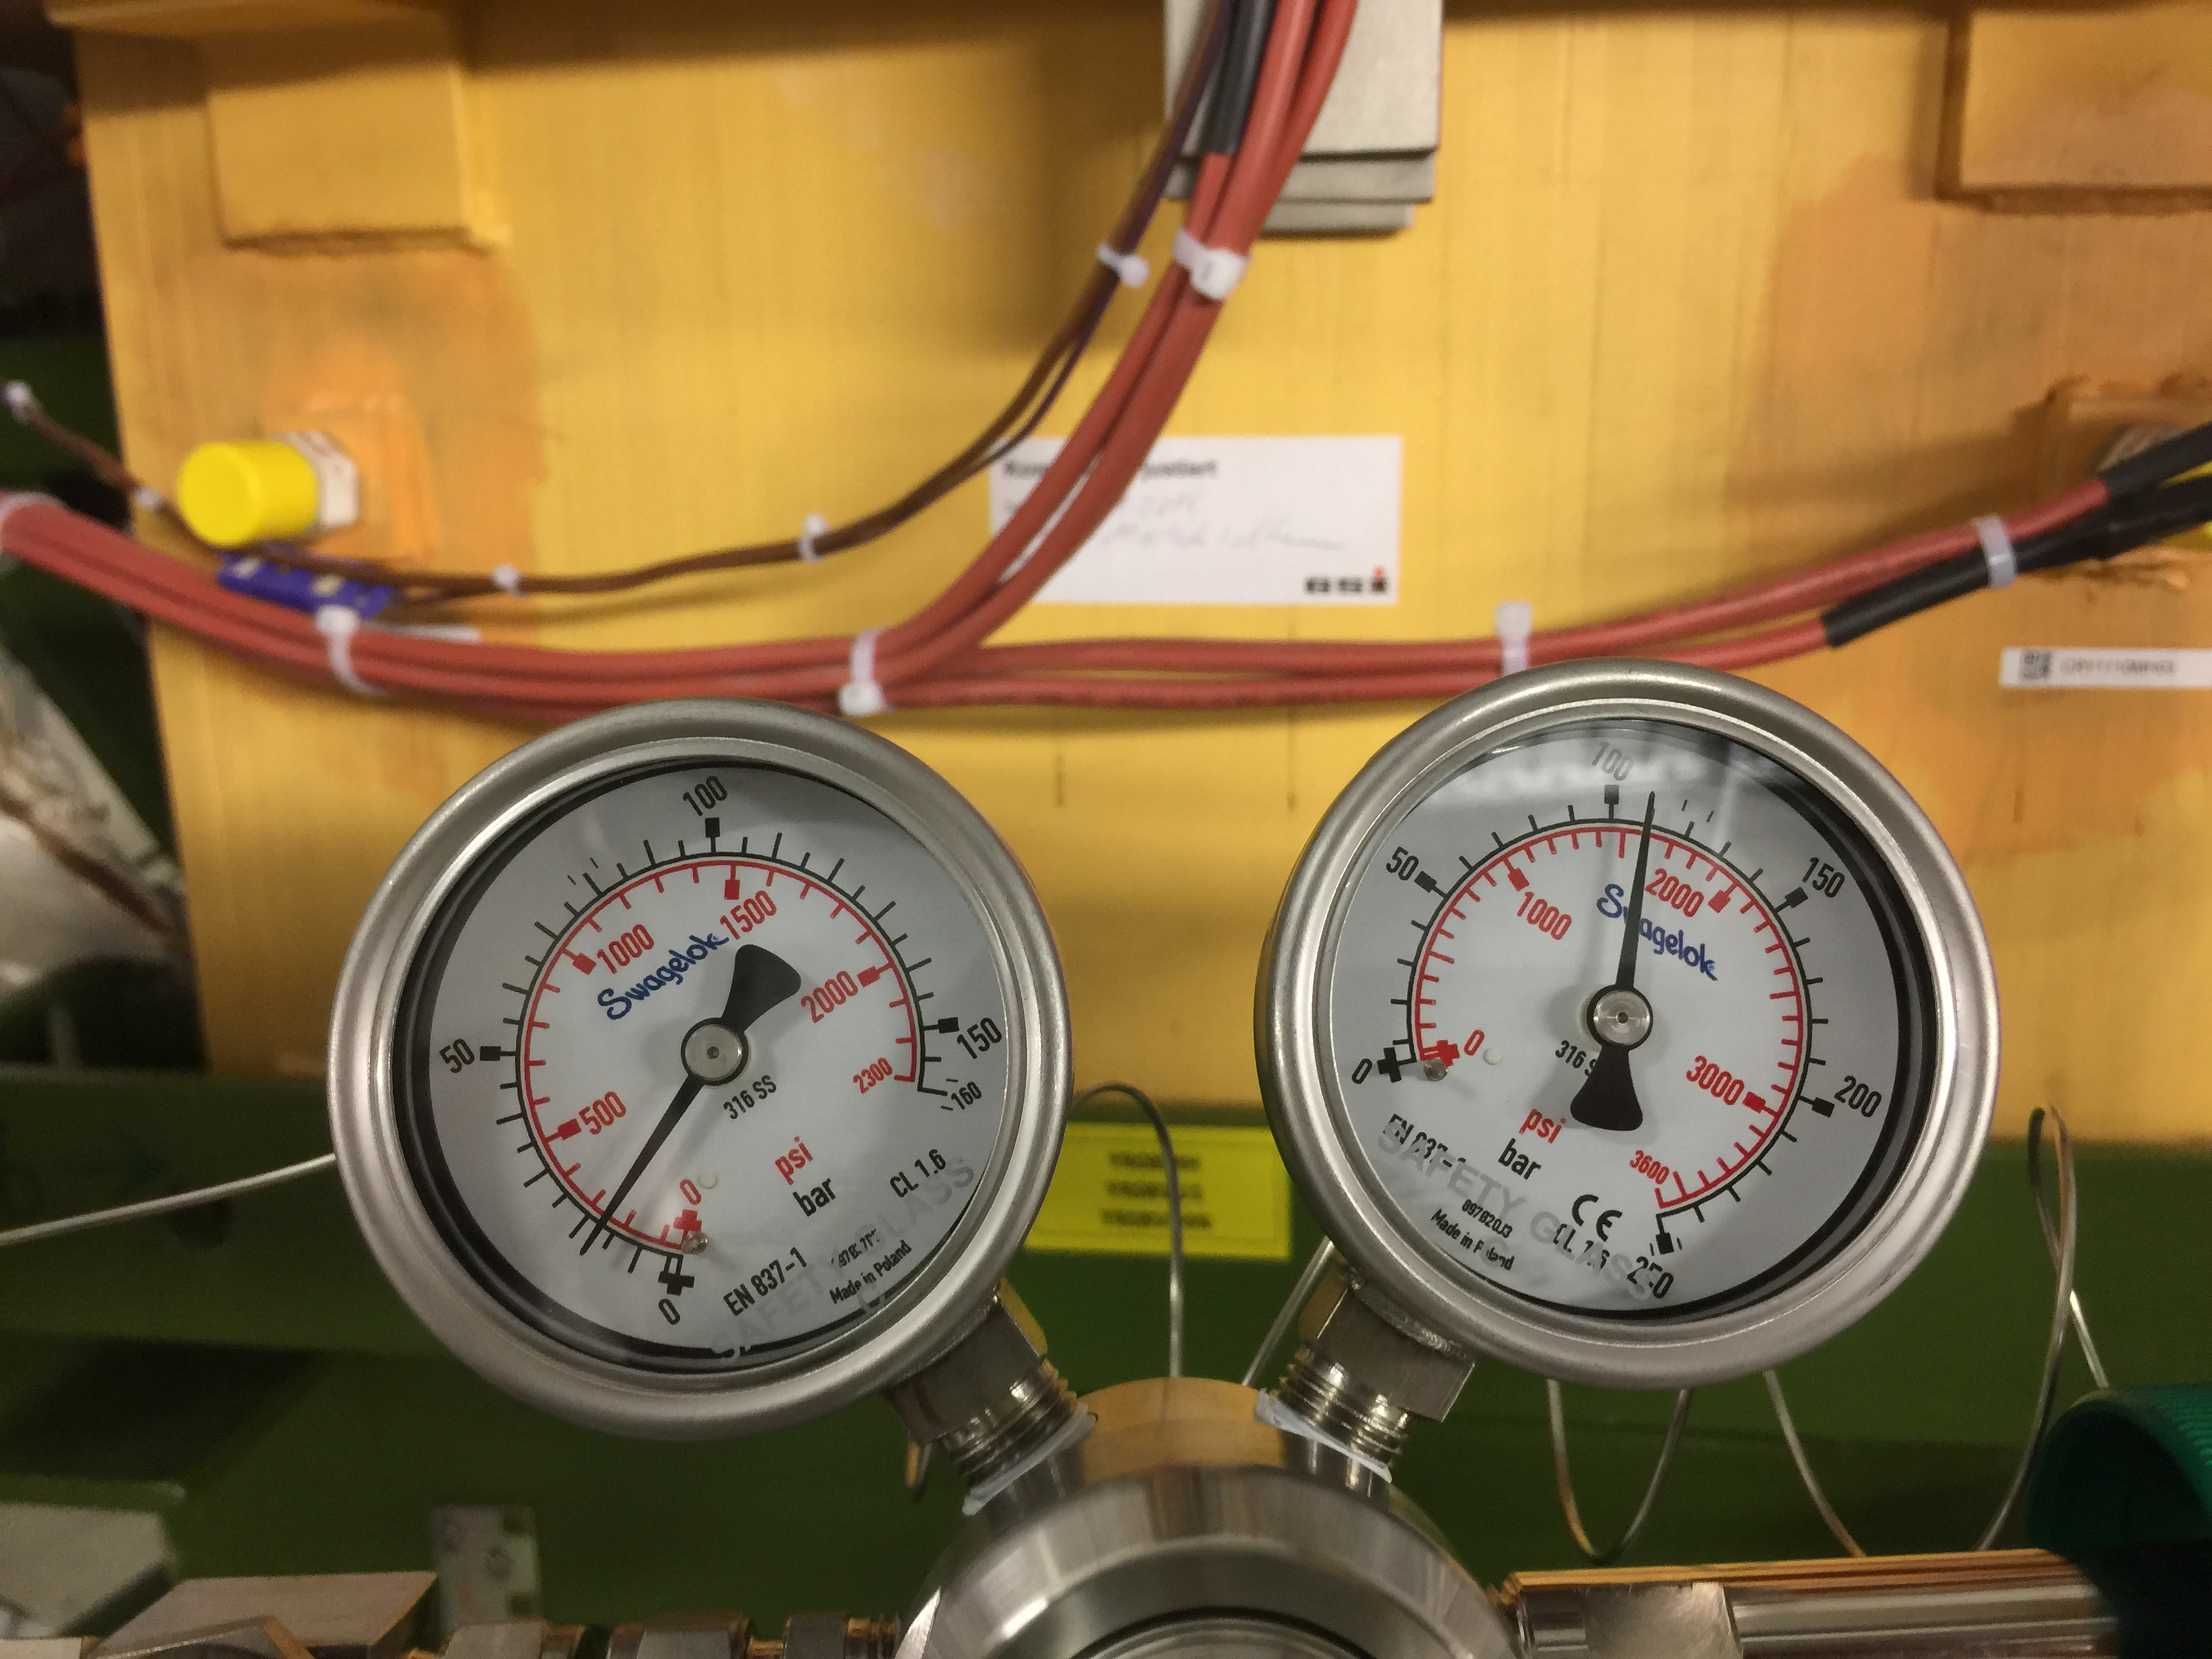
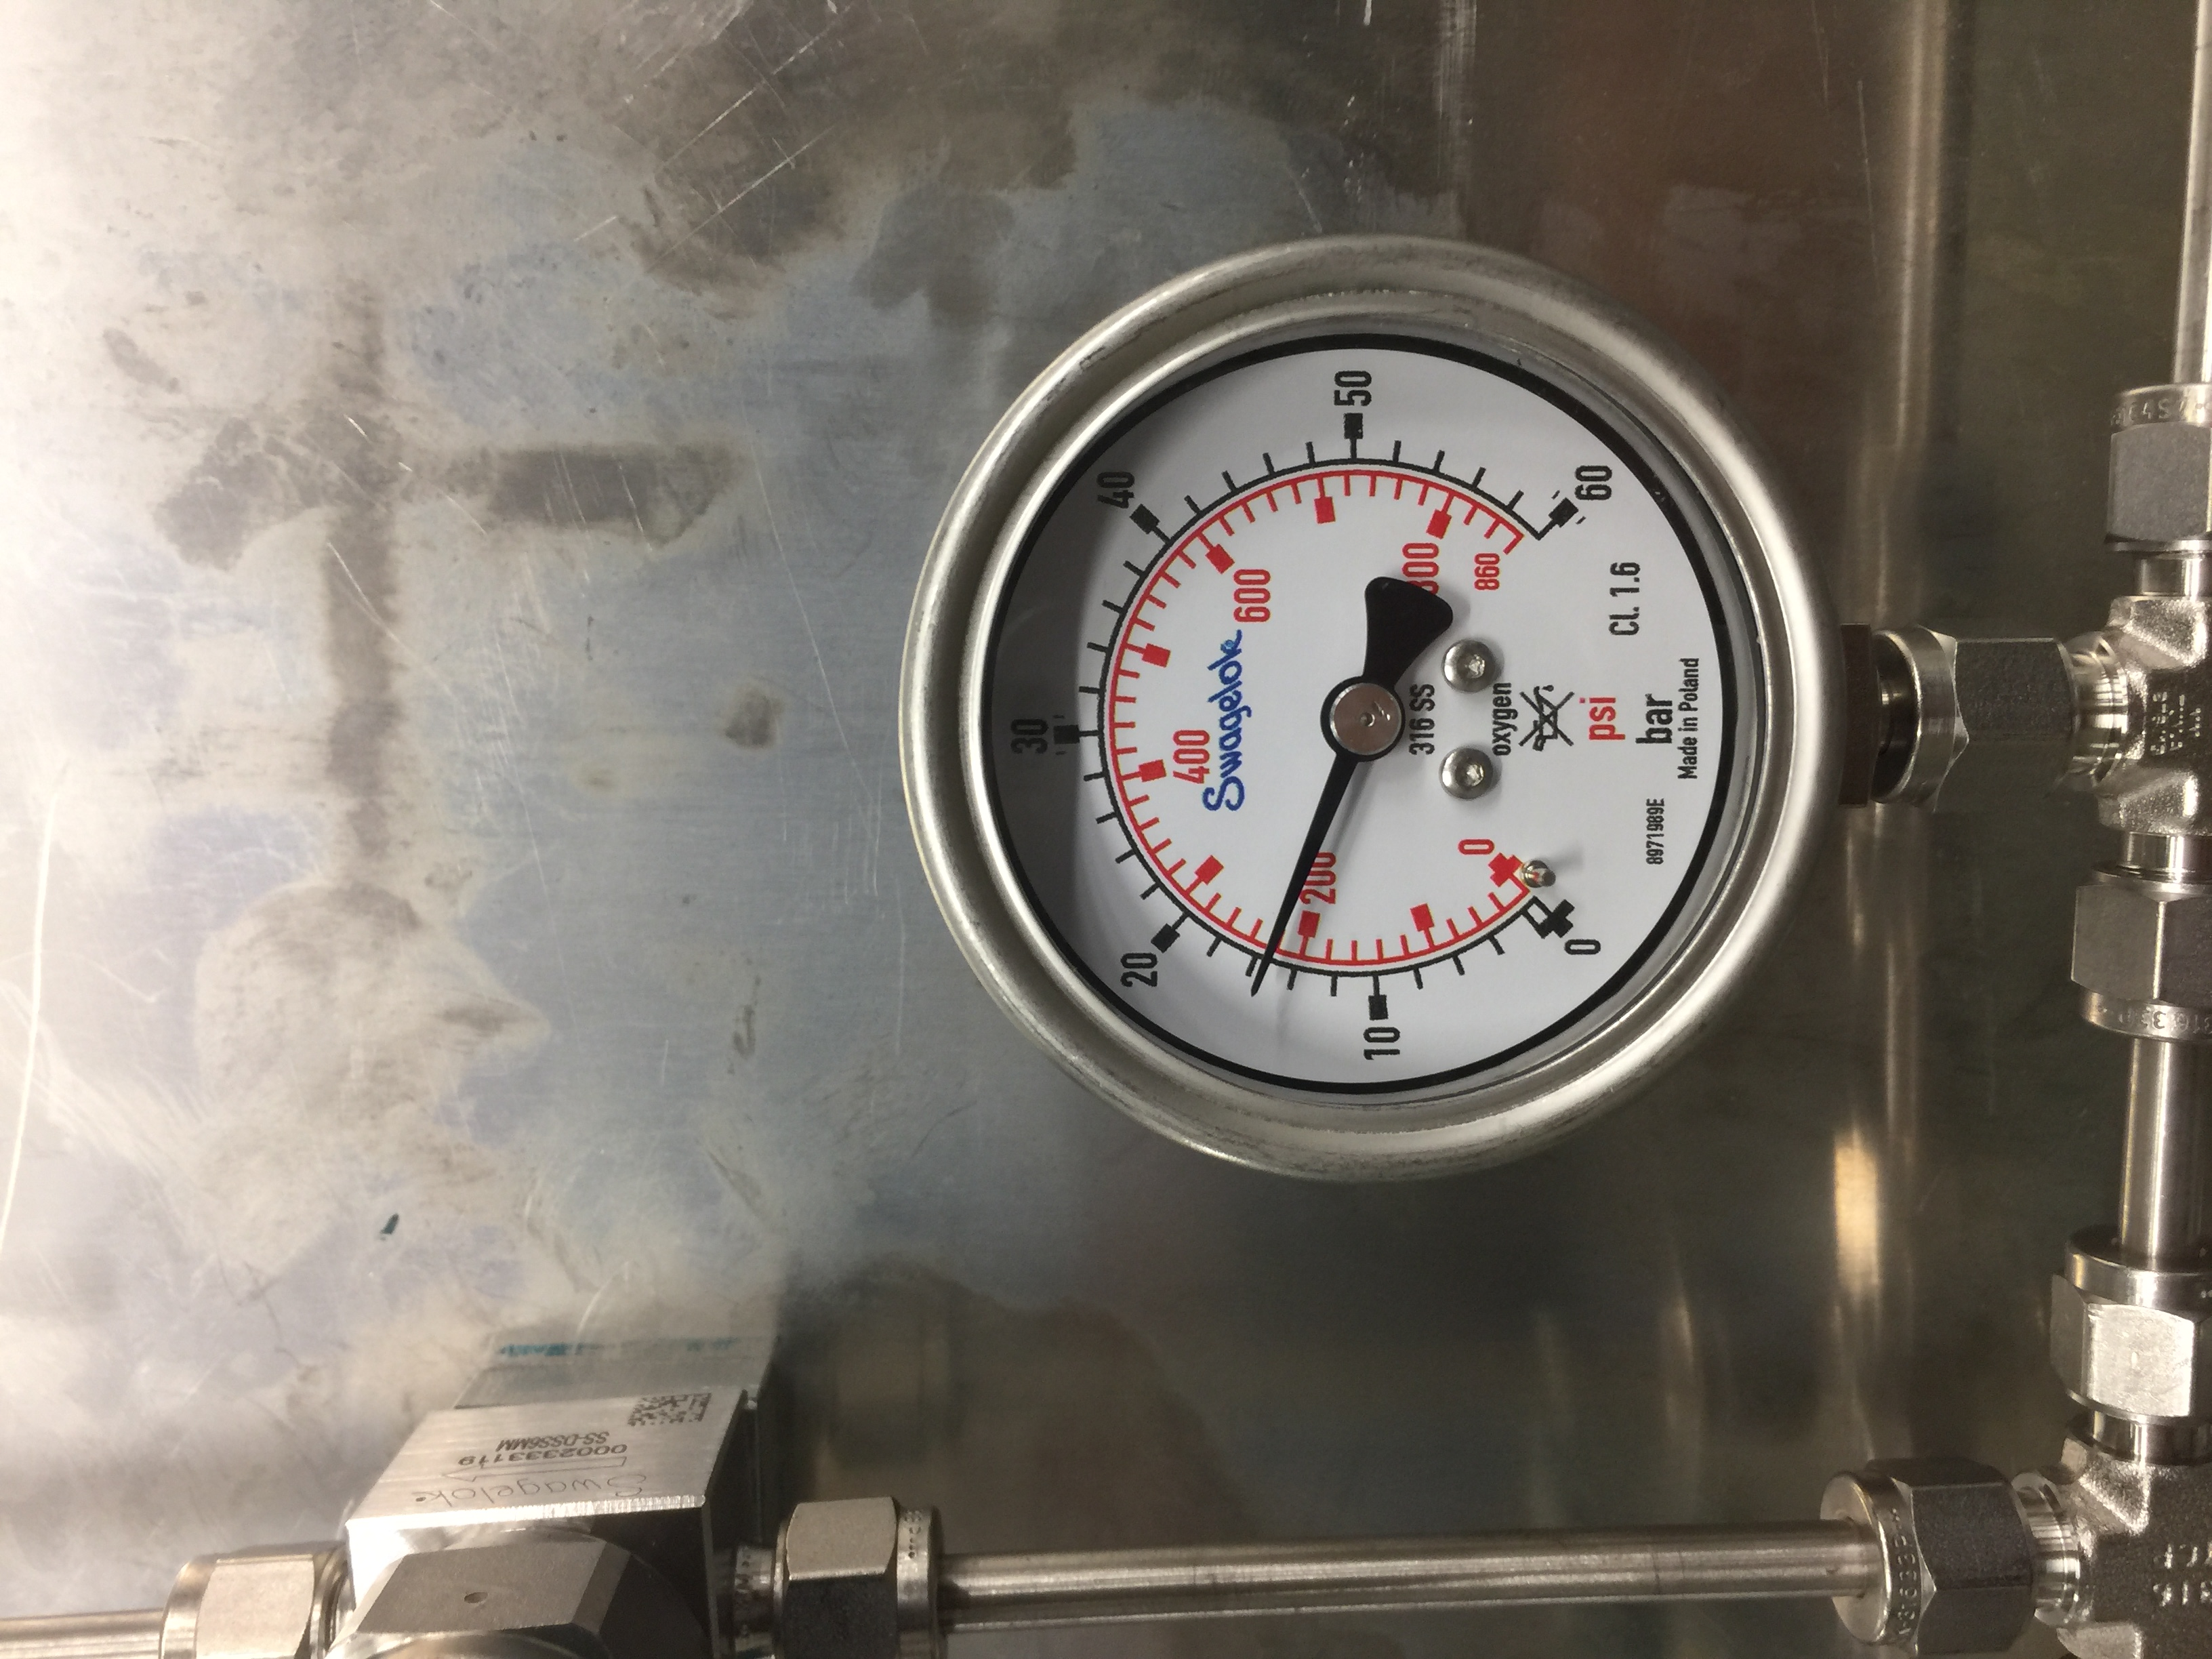
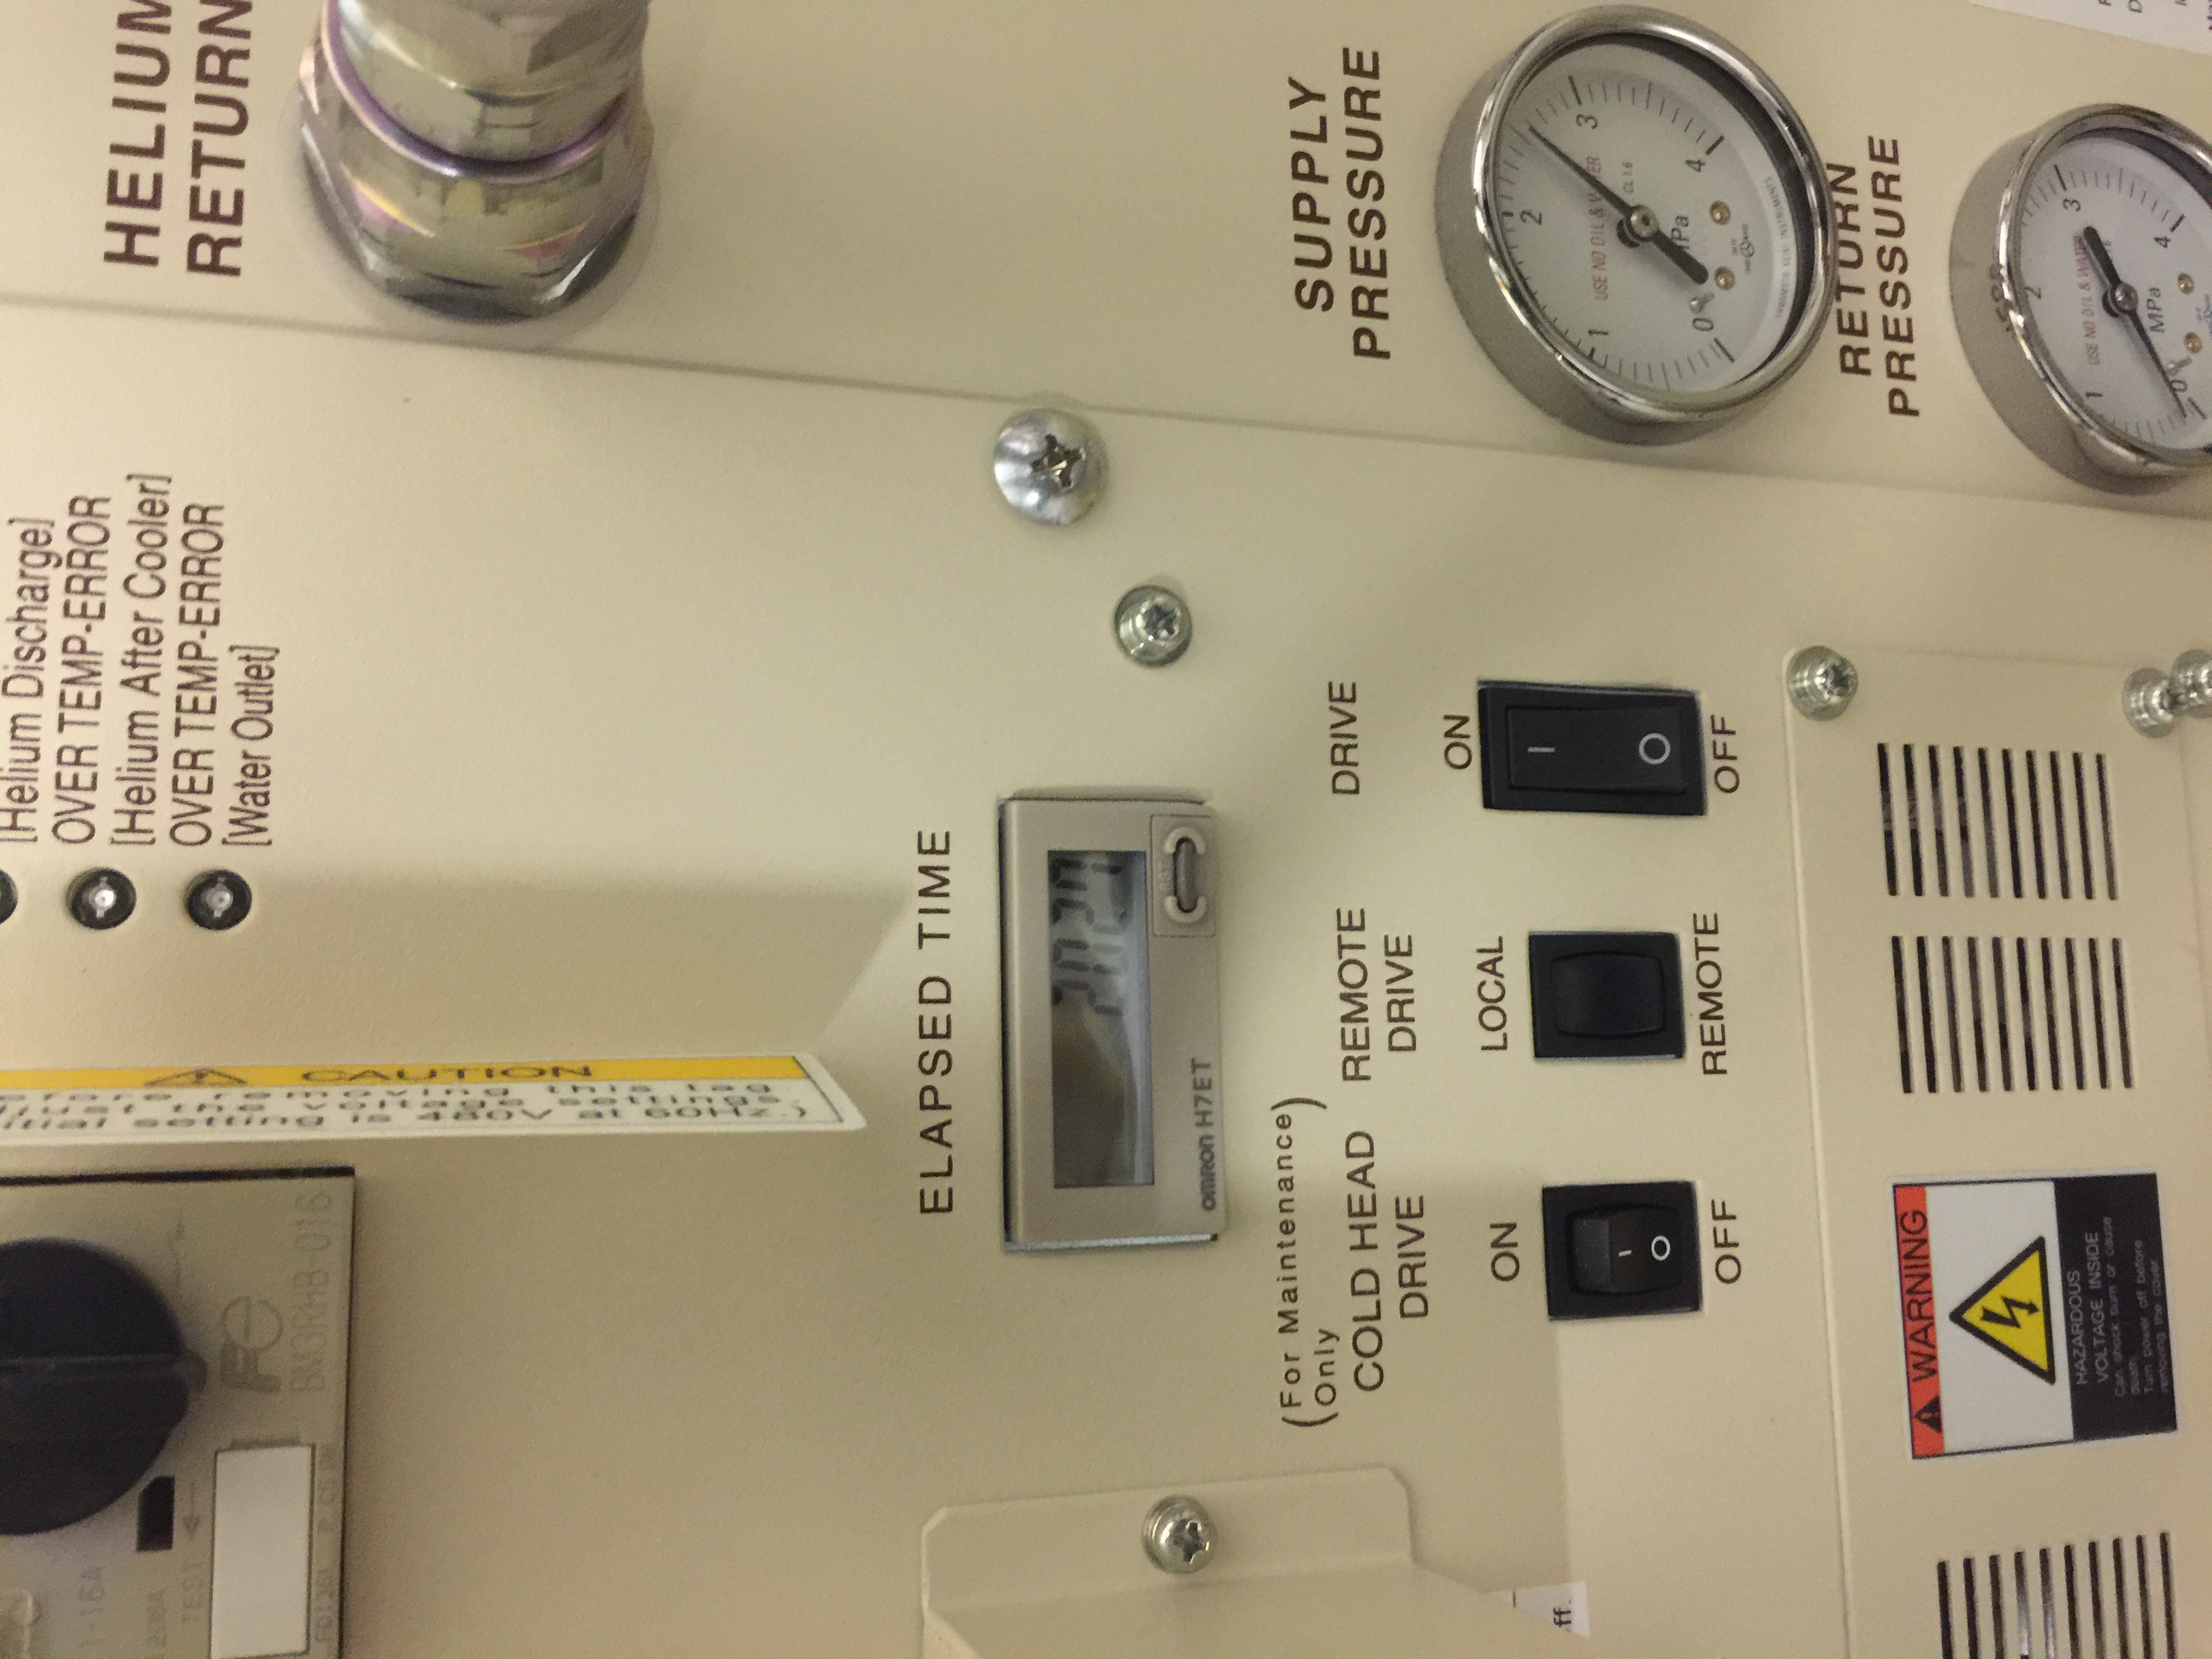
05:36 E4 pressure c. 1.7e-9mbar *not* 3e-10mbar as reported earlier
      See attachments 1 & 2
      E4 pressure not < 5e-10mbar - wait to startup gas jet target

06:47 RSS & TD on-site

07.00 E4 1.70e-9mbar
      S3 9.42e-10mbar

07:00 Checks: all good except for the white rabbit decoder status.

07:15 All histograms cleared in the run control tab.

07.32 E4 1.60e-9mbar
      S3 9.00e-10mbar

08:06 E4 1.49e-9mbar
      S3 8.59e-10mbar

08:30 E4 1.43e-9mbar
      S3 8.34e-10mbar

09:00 E4 1.35e-9mbar
      S3 8.03e-10mbar

09:30 E4 1.29e-9mbar
      S3 7.70e-10mbar

10:00 E4 1.23e-9mbar
      S3 7.49e-10mbar

10:00 Checks: all good except for the white rabbit decoder status.

10:30 E4 1.18e-9mbar
      S3 7.22e-10mbar

11:00 E4 1.14e-9mbar
      S3 7.02e-10mbar

11:20 Compressor was switched on.

11:30 E4 1.10e-9mbar
      S3 6.82e-10mbar

12:00 E4 1.35e-9mbar
      S3 6.64e-10mbar

12:30 E4 1.23e-9mbar
      S3 6.46e-10mbar

14:45 Checks: all good except for the white rabbit decoder status.

17.20 System wide checks OK *except* WR decoder status

		 Base 		Current 	Difference
aida01 fault 	 0xab60 : 	 0xab85 : 	 37
aida02 fault 	 0x88d3 : 	 0x88f7 : 	 36
aida03 fault 	 0x23aa : 	 0x23cf : 	 37
aida04 fault 	 0x15d7 : 	 0x15fc : 	 37
aida05 fault 	 0x2f03 : 	 0x2f0e : 	 11
White Rabbit error counter test result: Passed 0, Failed 5

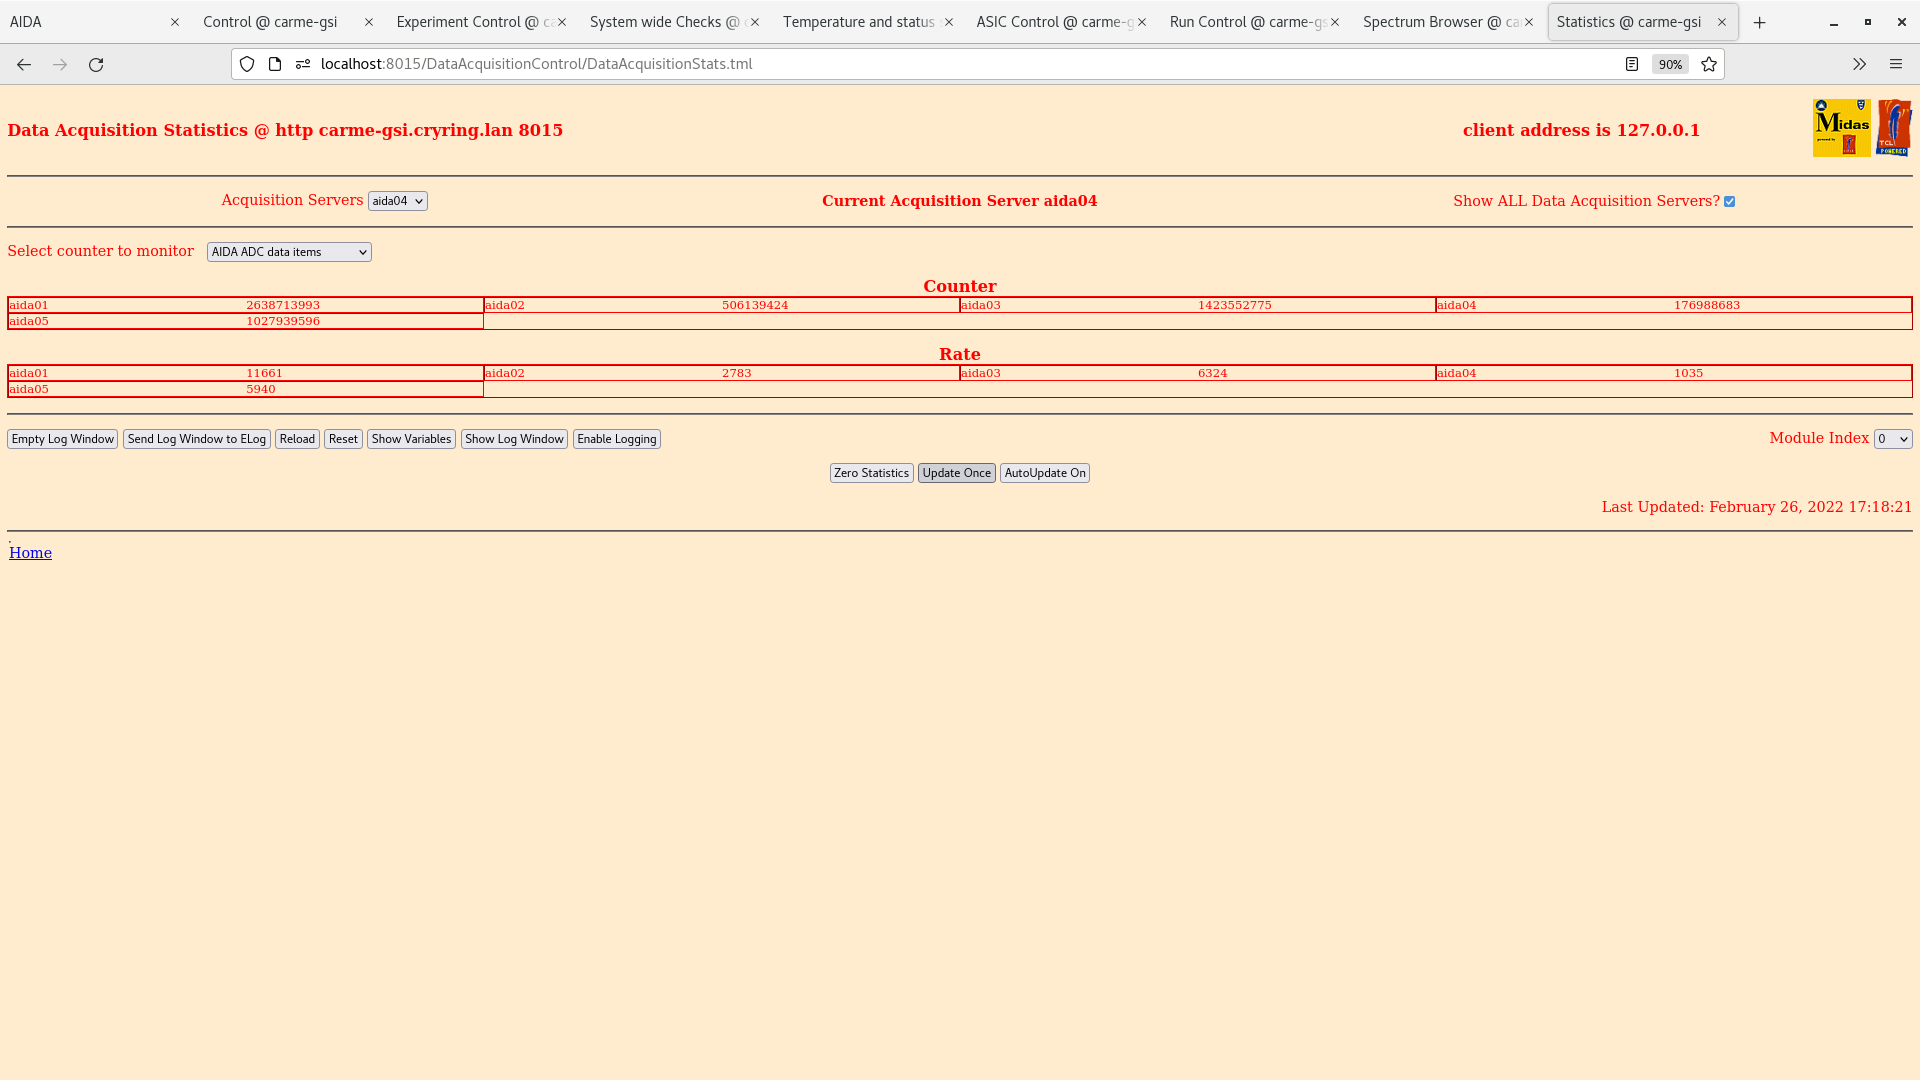
FEE64 temperatures OK - attachment 26
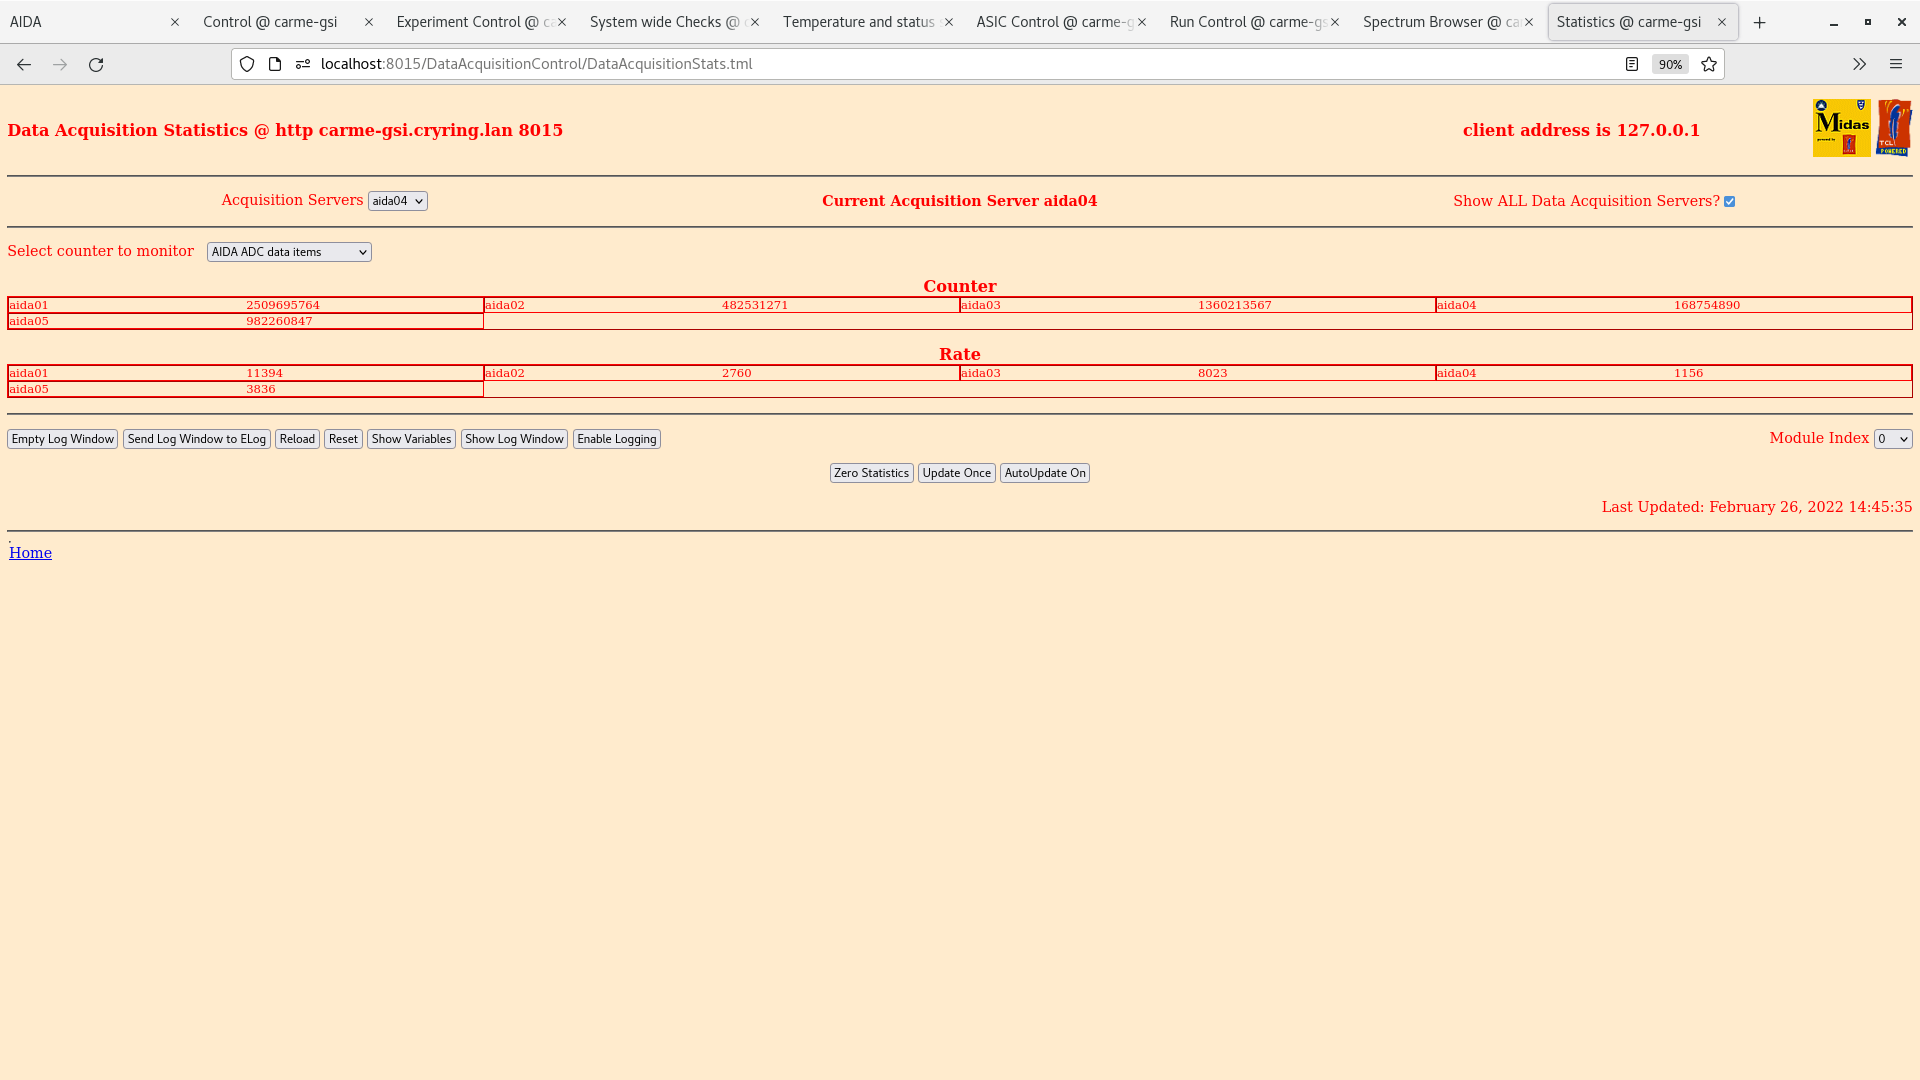
stats (adc data items) OK - attachment 27

DSSSD bias -100V leakage current -3.31uA |
| Attachment 1: Capture_1.PNG
|
|
| Attachment 2: Capture_2.PNG
|

|
| Attachment 3: 7-spectrum-id8-2022-02-26_07-14-49.png
|
|
| Attachment 4: 7-spectrum-id7-2022-02-26_07-14-12.png
|

|
| Attachment 5: 7-spectrum-42022-02-26_07-13-21.png
|
|
| Attachment 6: 7-spectrum-3-2022-02-26_07-12-50.png
|

|
| Attachment 7: 7-spectrum2-2022-02-26_07-12-02.png
|

|
| Attachment 8: 7-spectrum1-2022-02-26_07-10-55.png
|

|
| Attachment 9: 7-spectrum-2022-02-26_07-10-10.png
|

|
| Attachment 10: 7-correlation-2022-02-26_07-09-11.png
|

|
| Attachment 11: 7-adc-2022-02-26_07-08-53.png
|

|
| Attachment 12: 7-good-events-2022-02-26_07-08-27.png
|

|
| Attachment 13: 10-id2-2022-02-26_10-06-08.png
|

|
| Attachment 14: 10-id1-2022-02-26_10-04-01.png
|

|
| Attachment 15: 10-correlation-2022-02-26_10-03-08.png
|

|
| Attachment 16: 10-adc-2022-02-26_10-02-47.png
|

|
| Attachment 17: 10-good-2022-02-26_10-02-27.png
|

|
| Attachment 18: IMG_7113.JPG
|
|
| Attachment 19: IMG_7112.JPG
|
|
| Attachment 20: IMG_7111.JPG
|
|
| Attachment 21: IMG_7114.JPG
|

|
| Attachment 22: 2-adc-2022-02-26_14-45-37.png
|
|
| Attachment 23: 2-good-2022-02-26_14-45-16.png
|

|
| Attachment 24: 2-correlation-2022-02-26_14-44-56.png
|

|
| Attachment 25: 2-id1-2022-02-26_14-48-13.png
|

|
| Attachment 26: Screenshot_from_2022-02-26_17-18-11.png
|

|
| Attachment 27: Screenshot_from_2022-02-26_17-18-25.png
|
|
|
477
|
Mon Jan 22 16:29:31 2024 |
TD | Saturday 20 January |
11.00 No WLAN/WiFi
      came-gsi private LAN appears to be OK

      AIDA FEE64 power ON

11.09 FEE64 temps - attachment 1
      aida06 low, otherwise OK

11:10 CARME IE514 4.0e-11 mbar, temp unknown
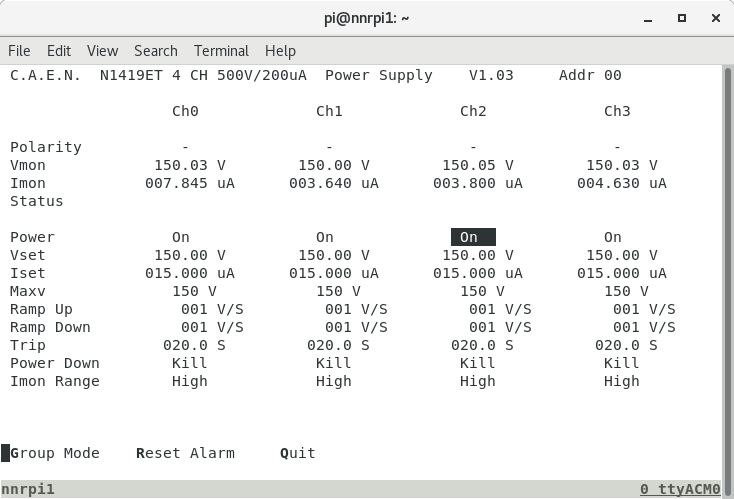
      IE514 OFF

11.22 Detector bias ON - attachment 2
      found ch 2 up ramp set to 63V/s! changed to 1V/s

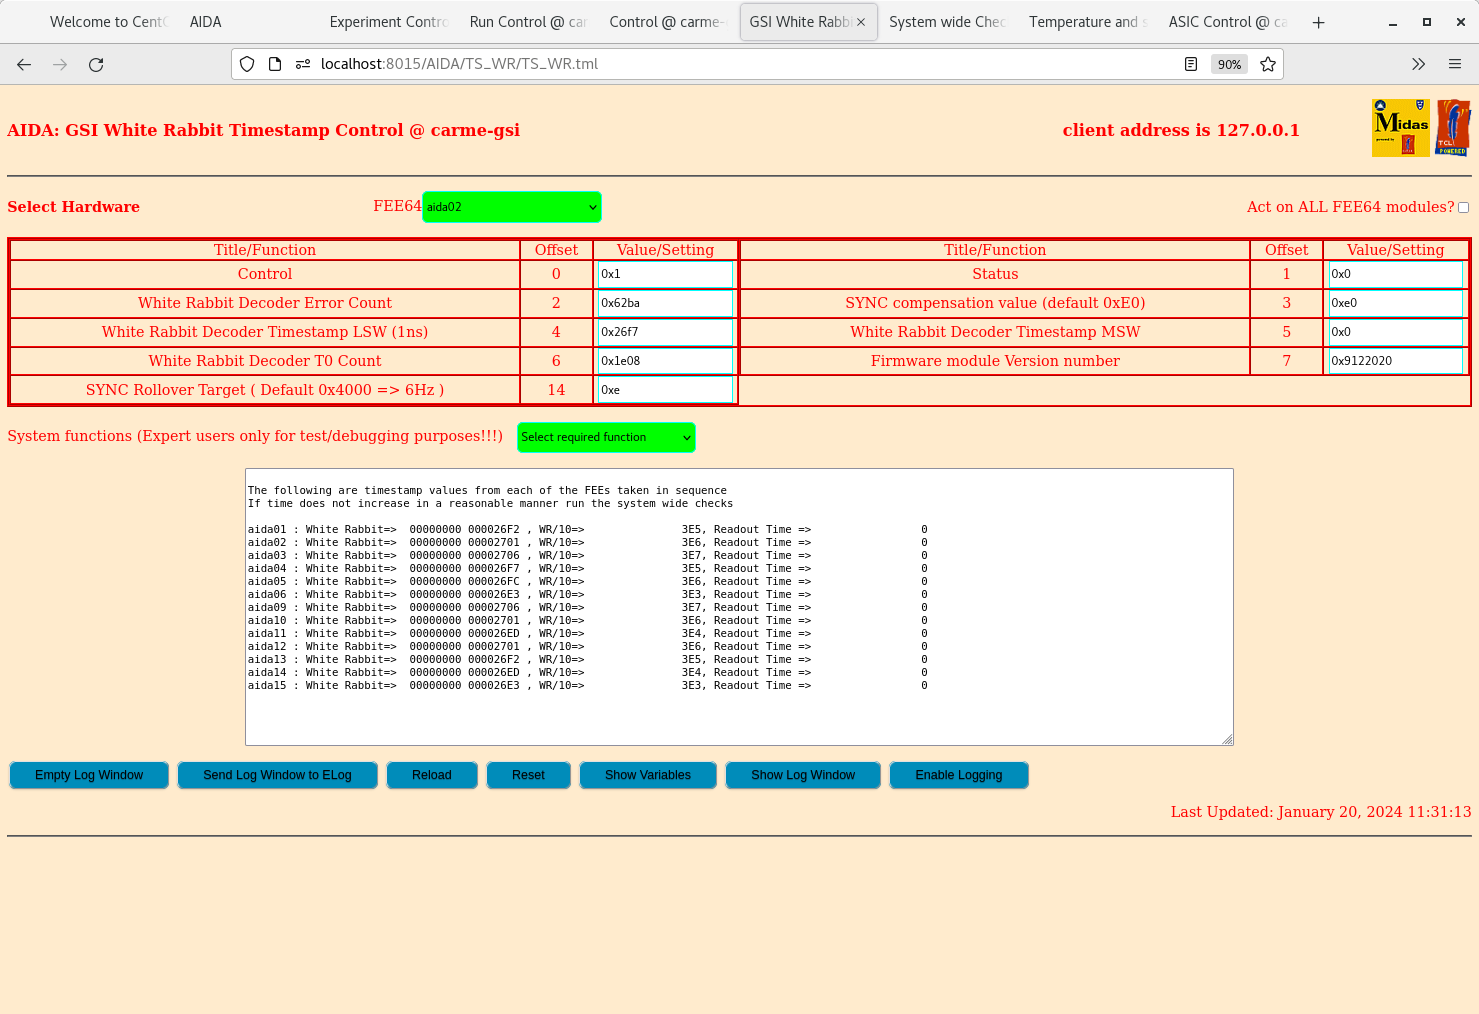
11.30 system wide checks OK except
      aida02 & aida06 fail WR decoder status

      WR ts control - attachments 3-4


12.02 ASIC settings updated for aida09-aida16
      ASIC settings DB key 2024Jan20-12:02:08

      Unable to save DB key to Options - use ASIC settings restore as workaround

12.30 Layouts for 16x FEE64s created - directory ~/LayOut/16xFEE64
      Note layouts include spectra from aida07, aida08 and aida16 so an error message will be generated but it can be ignored


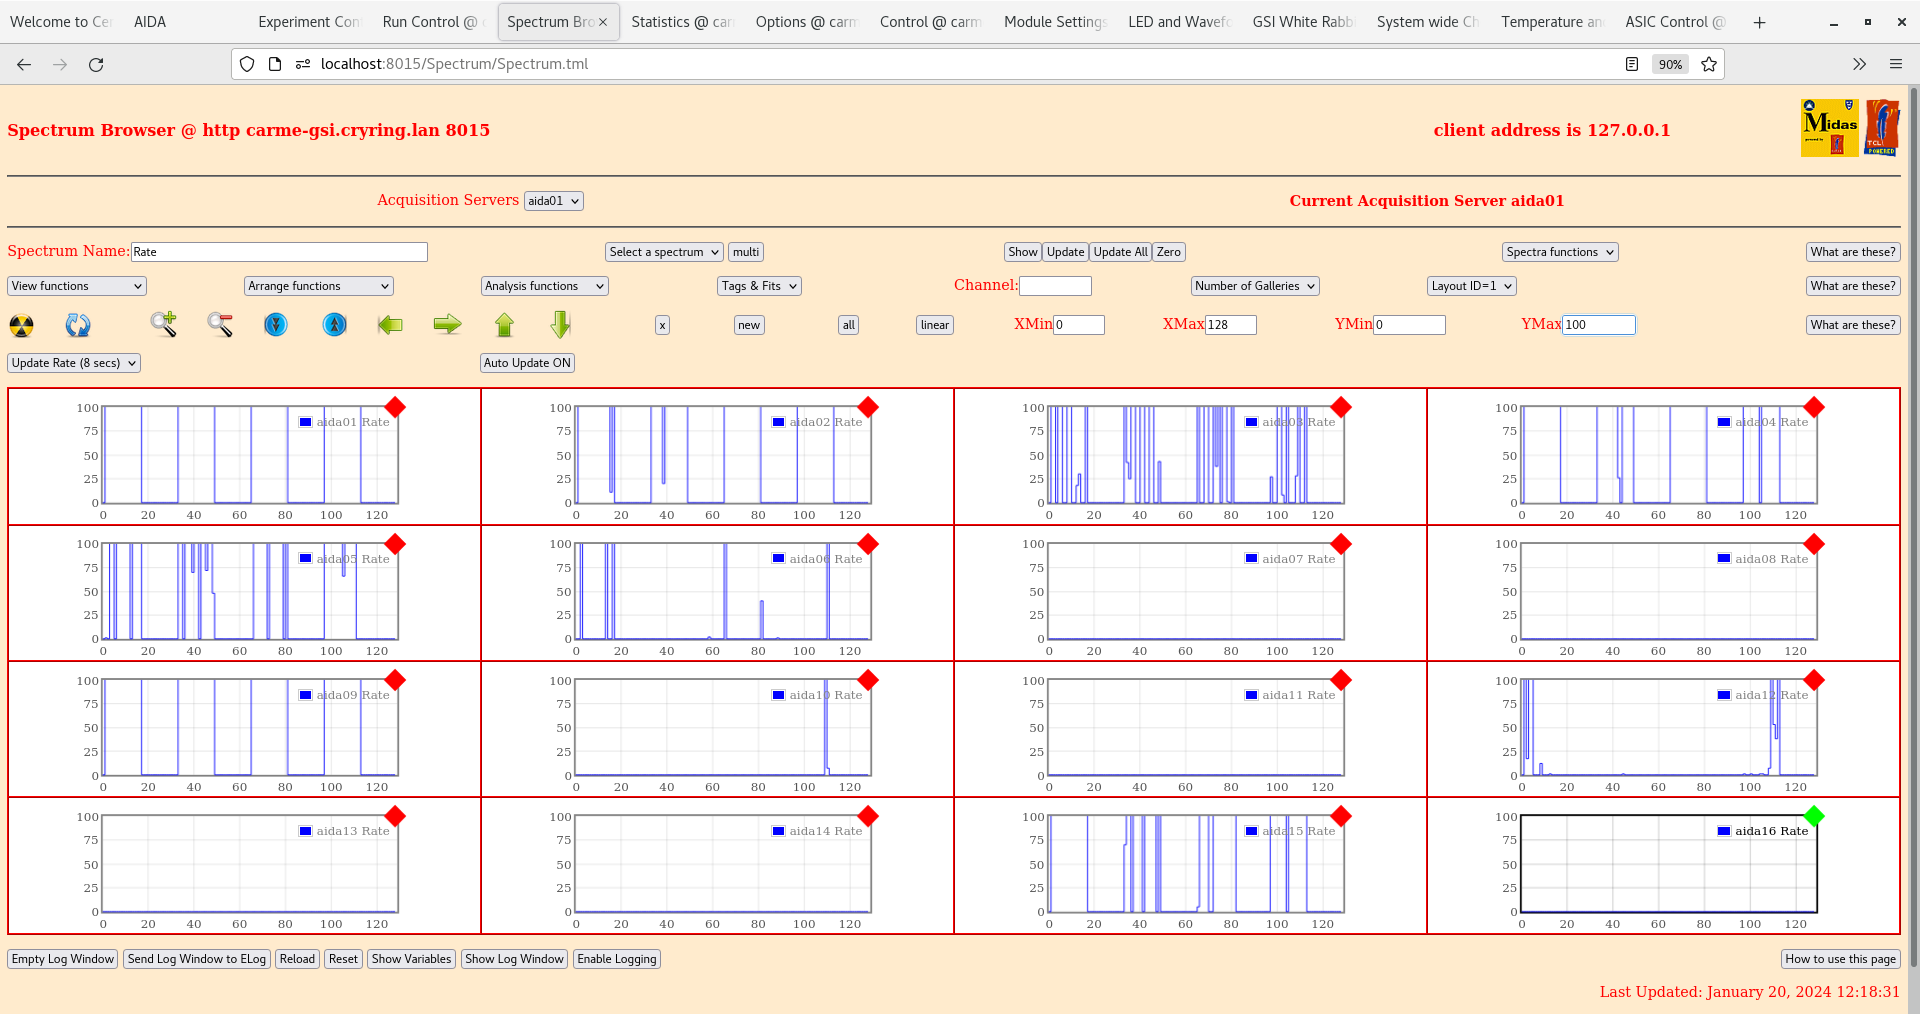
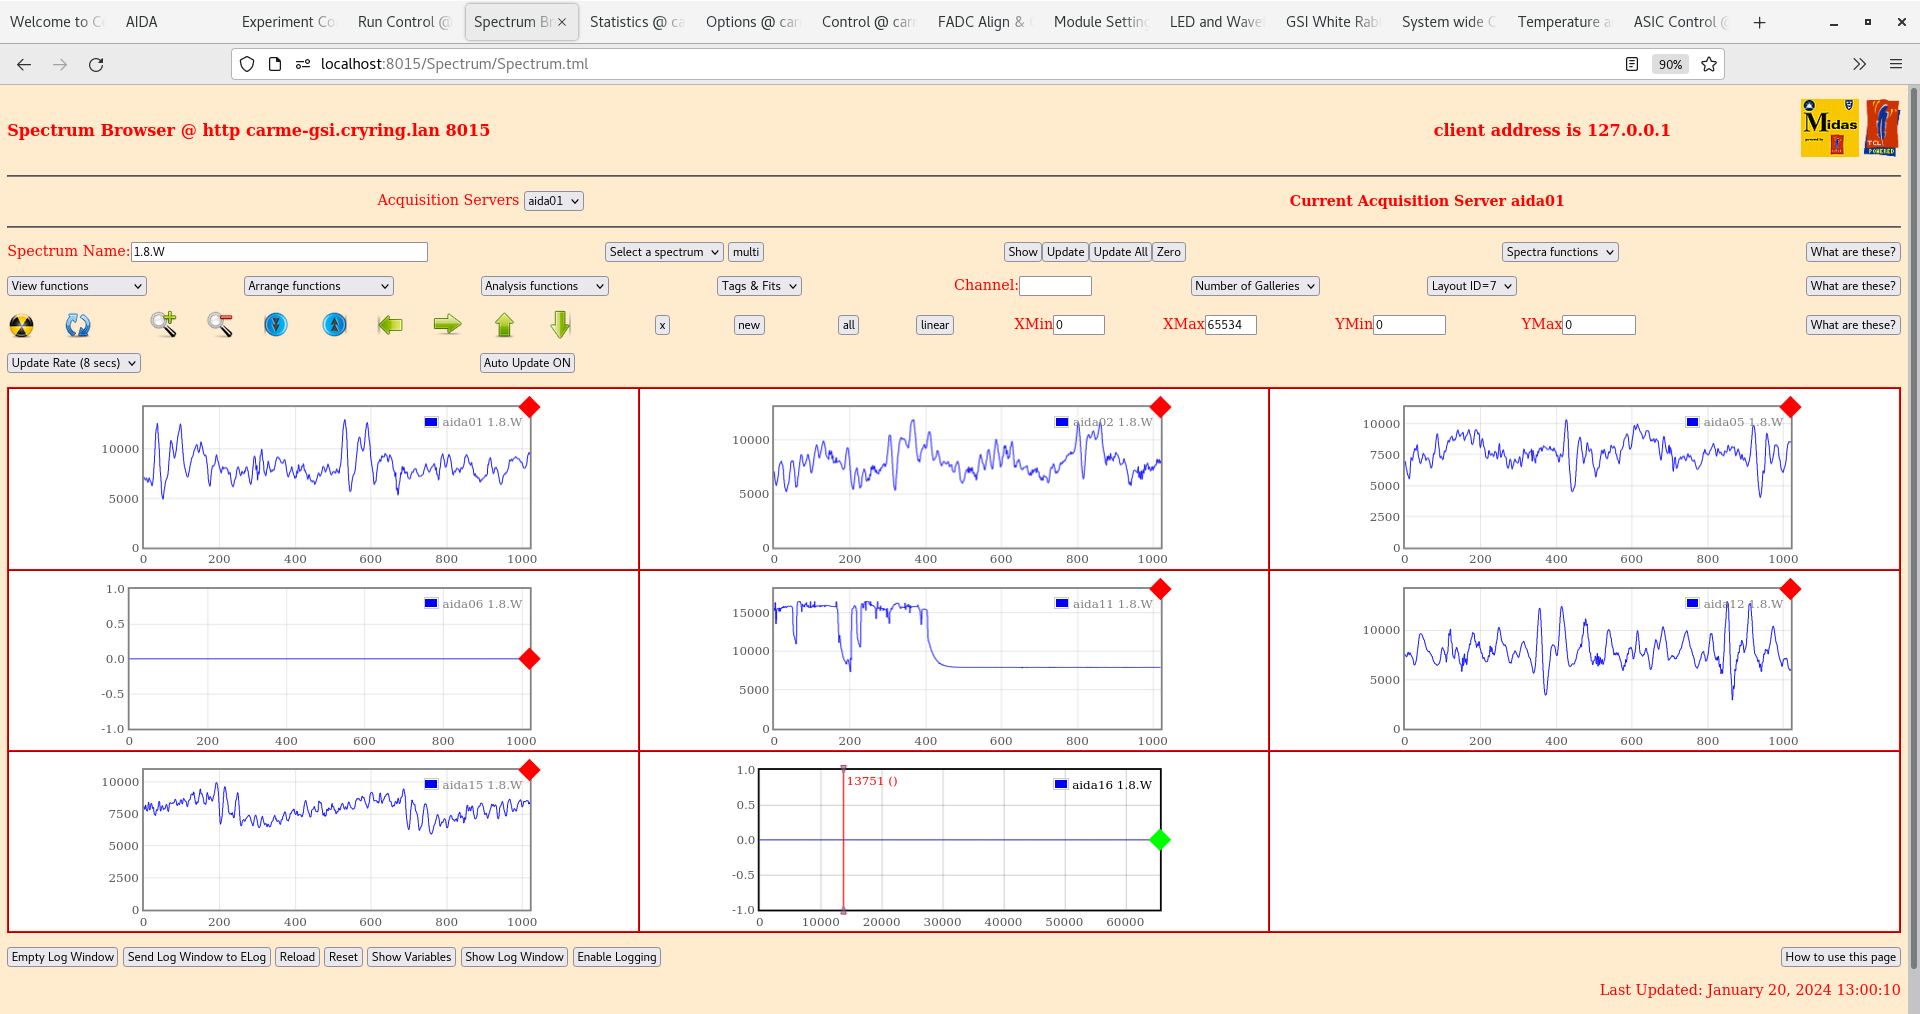
12.40 per FEE64 Rate spectra - attachments 5-6
      per FEE64 p+n & nn 1.8.W spectra - attachments 7-8

12.57 per FEE64 p+n & n+n 1.8.W spectra 20us FSR - attachments 9-10

Test signals

EG&G Ortec 448 Pulser
Amplitude 90,000
attenuation x10
Normalise 5.00
t_r 100ns
tau_d 50us
Frequency 50Hz ( relay line freq )
Polarity +

test + direct from 448, test - from Cooknell SA1 Sum & Invert

Test + daisy chain -> aida01 - aida02 - aida05 - aida06 - 50 Ohm
Test - daisy chain -> aida03 - aida04 - aida07 - aida08 - 50 Ohm

aida08 ( DSSSD #2 n+n Ohmic bias ) LK2 removed, LK1 added
aida04 ( DSSSD #1 n+n Ohmic bias ) no LK2 fitted, LK1 added

DSSSD#1 SHV - 2x Lemo 00.250 cable replaced by standard SHV - BNC/BNC Lemo-00.250 coaxial cable

Adaptor PCB ground daisy chain aida01 - aida02 - aida03 - aida04

DSSSD#2 - DSSSD#4 HV cabling unchanged

15.30 Power ON
      System wide checks OK except
          aida02 fail WR decoder status - attachment 11

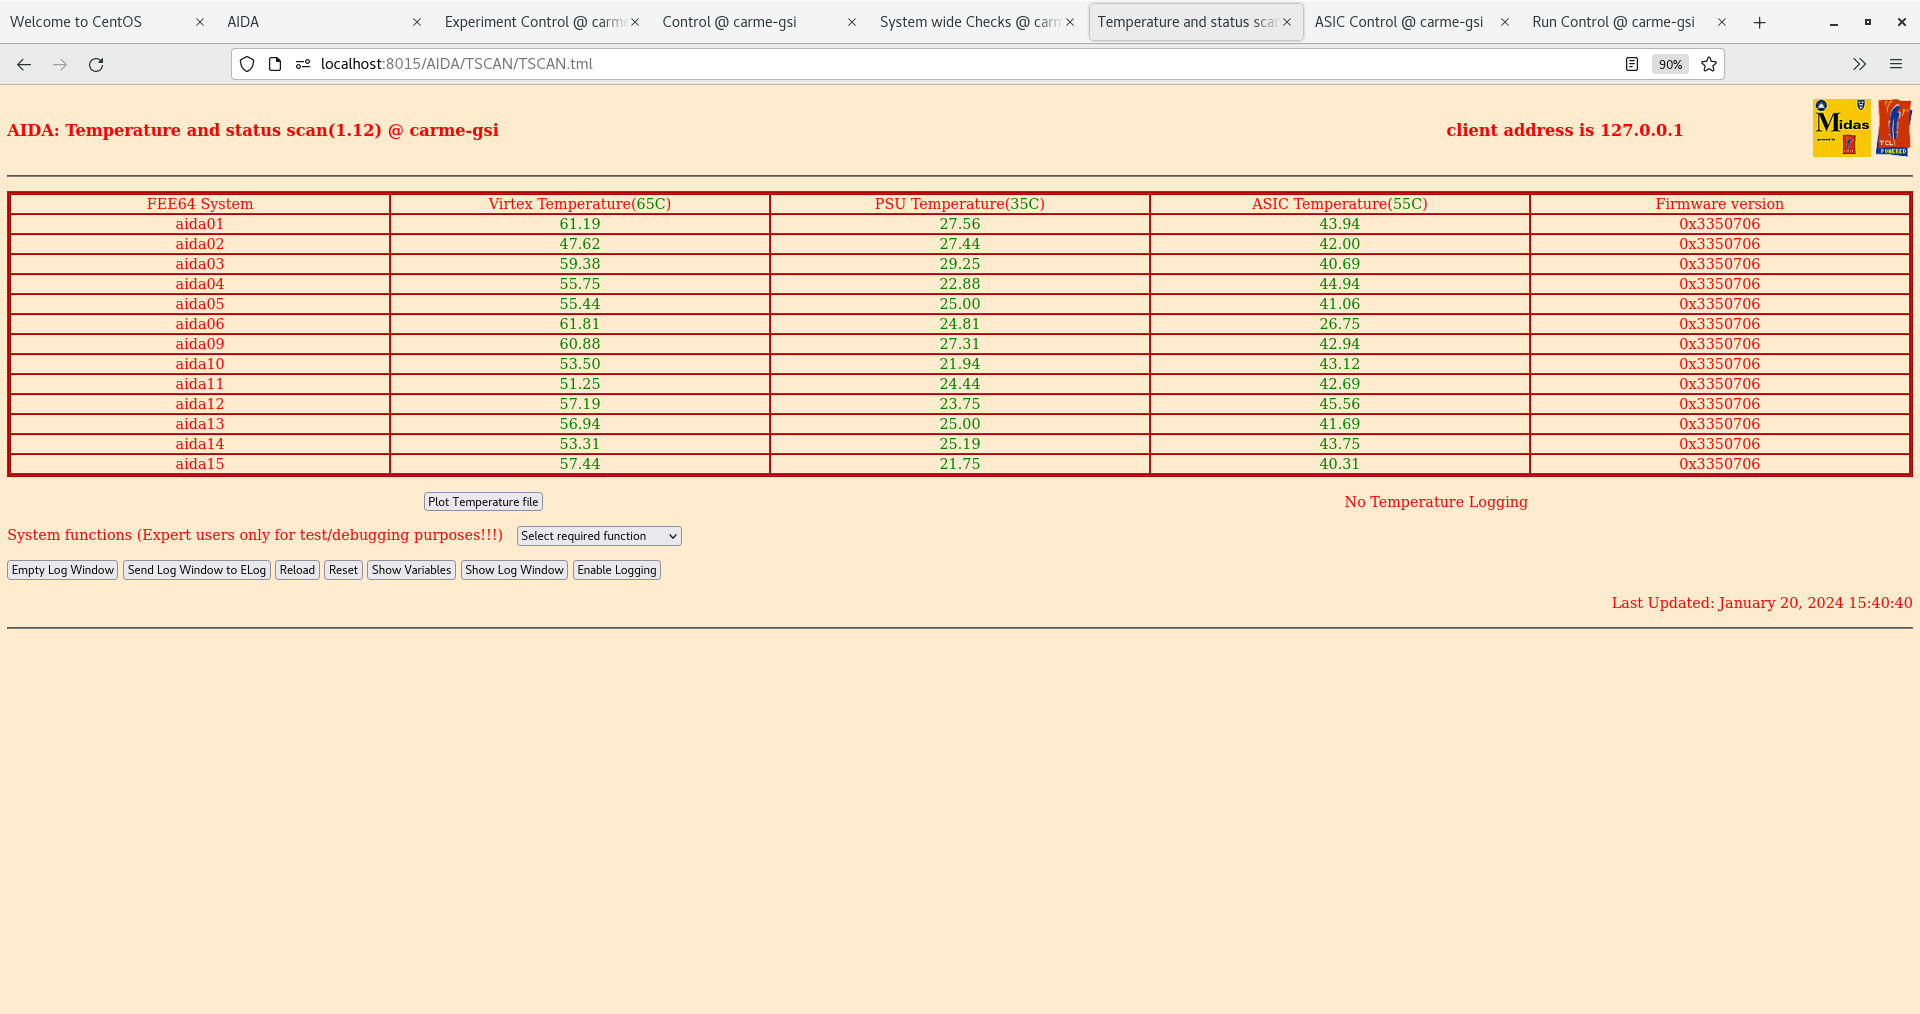
      FEE64 temperatures - attachment 12
       aida06 ASIC temp low

      DSSSD bias - attachment 13

      ADC data item stats - attachment 14
       slow comparator 0x64

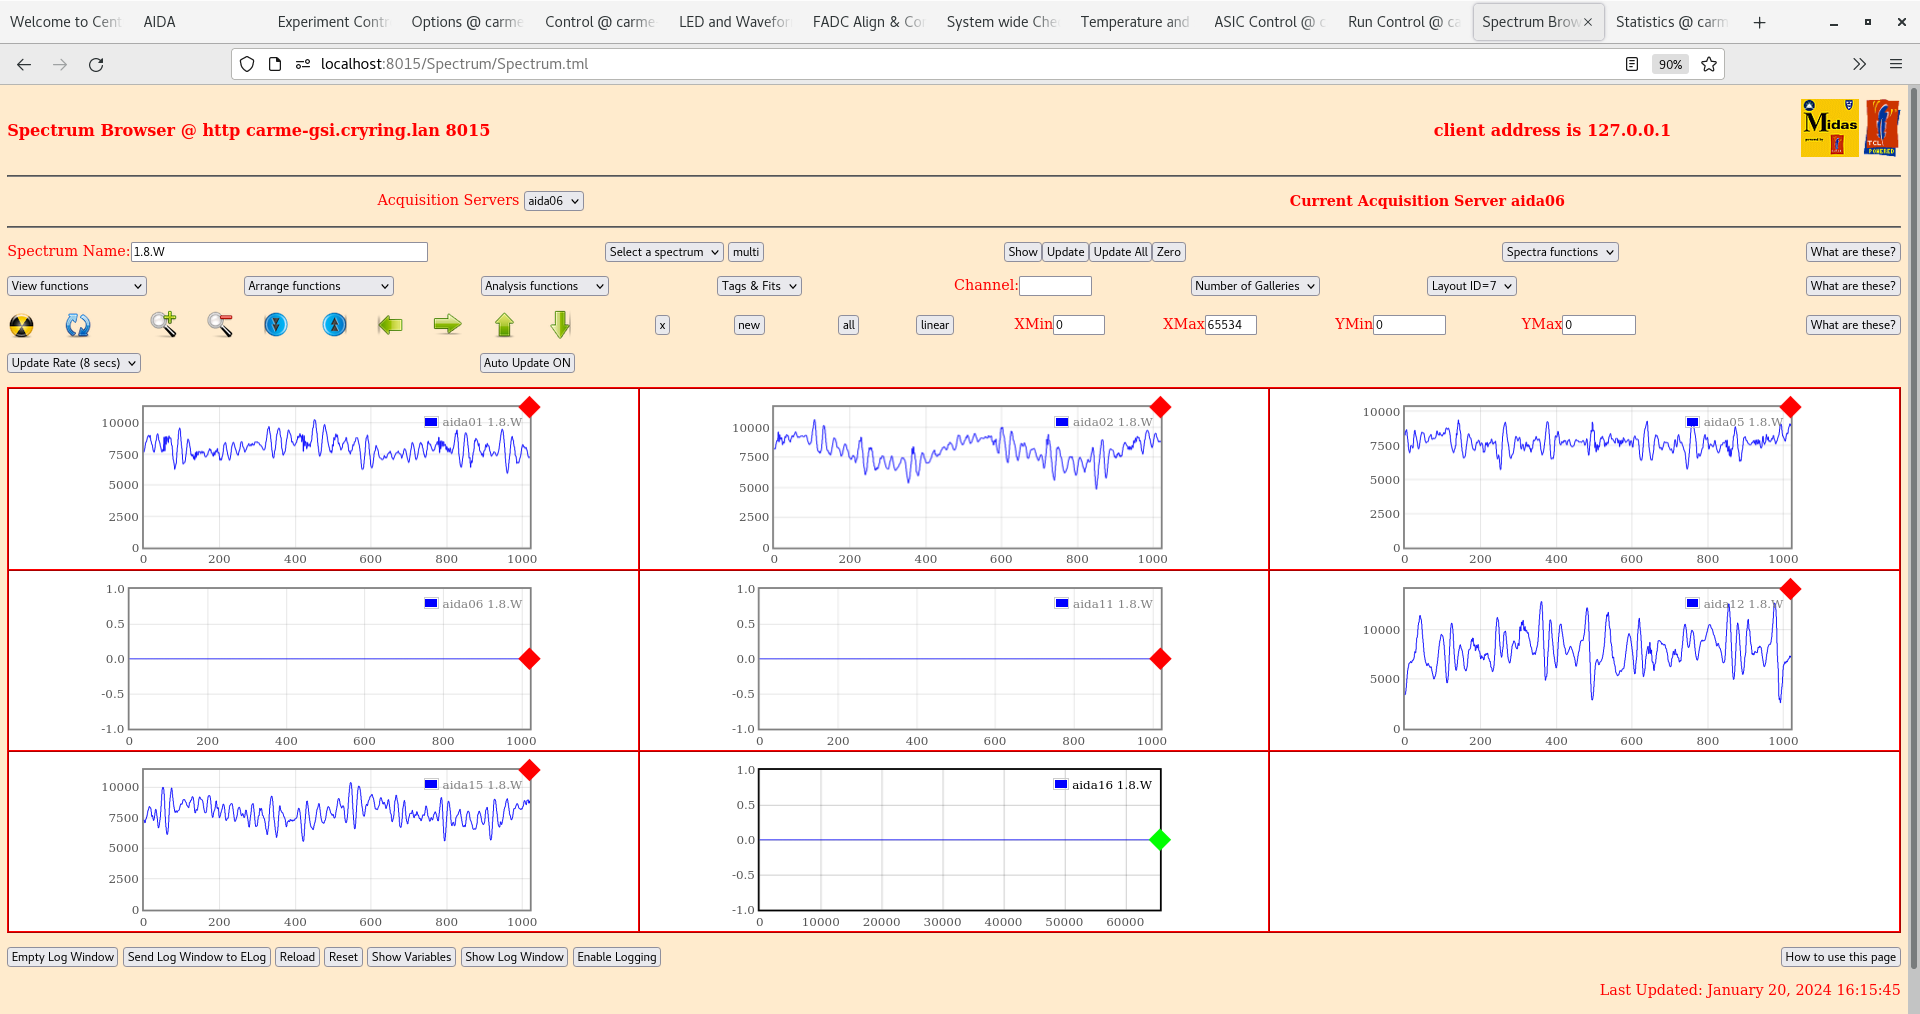
      per FEE64 Rate and 1.8.W 20us FSR spectra - attachments 15-17

16.00 per FEE64 rate spectra - attachment 18

16.15 per FEE64 Rate and 1.8.W 20us FSR spectra - attachments 19-21

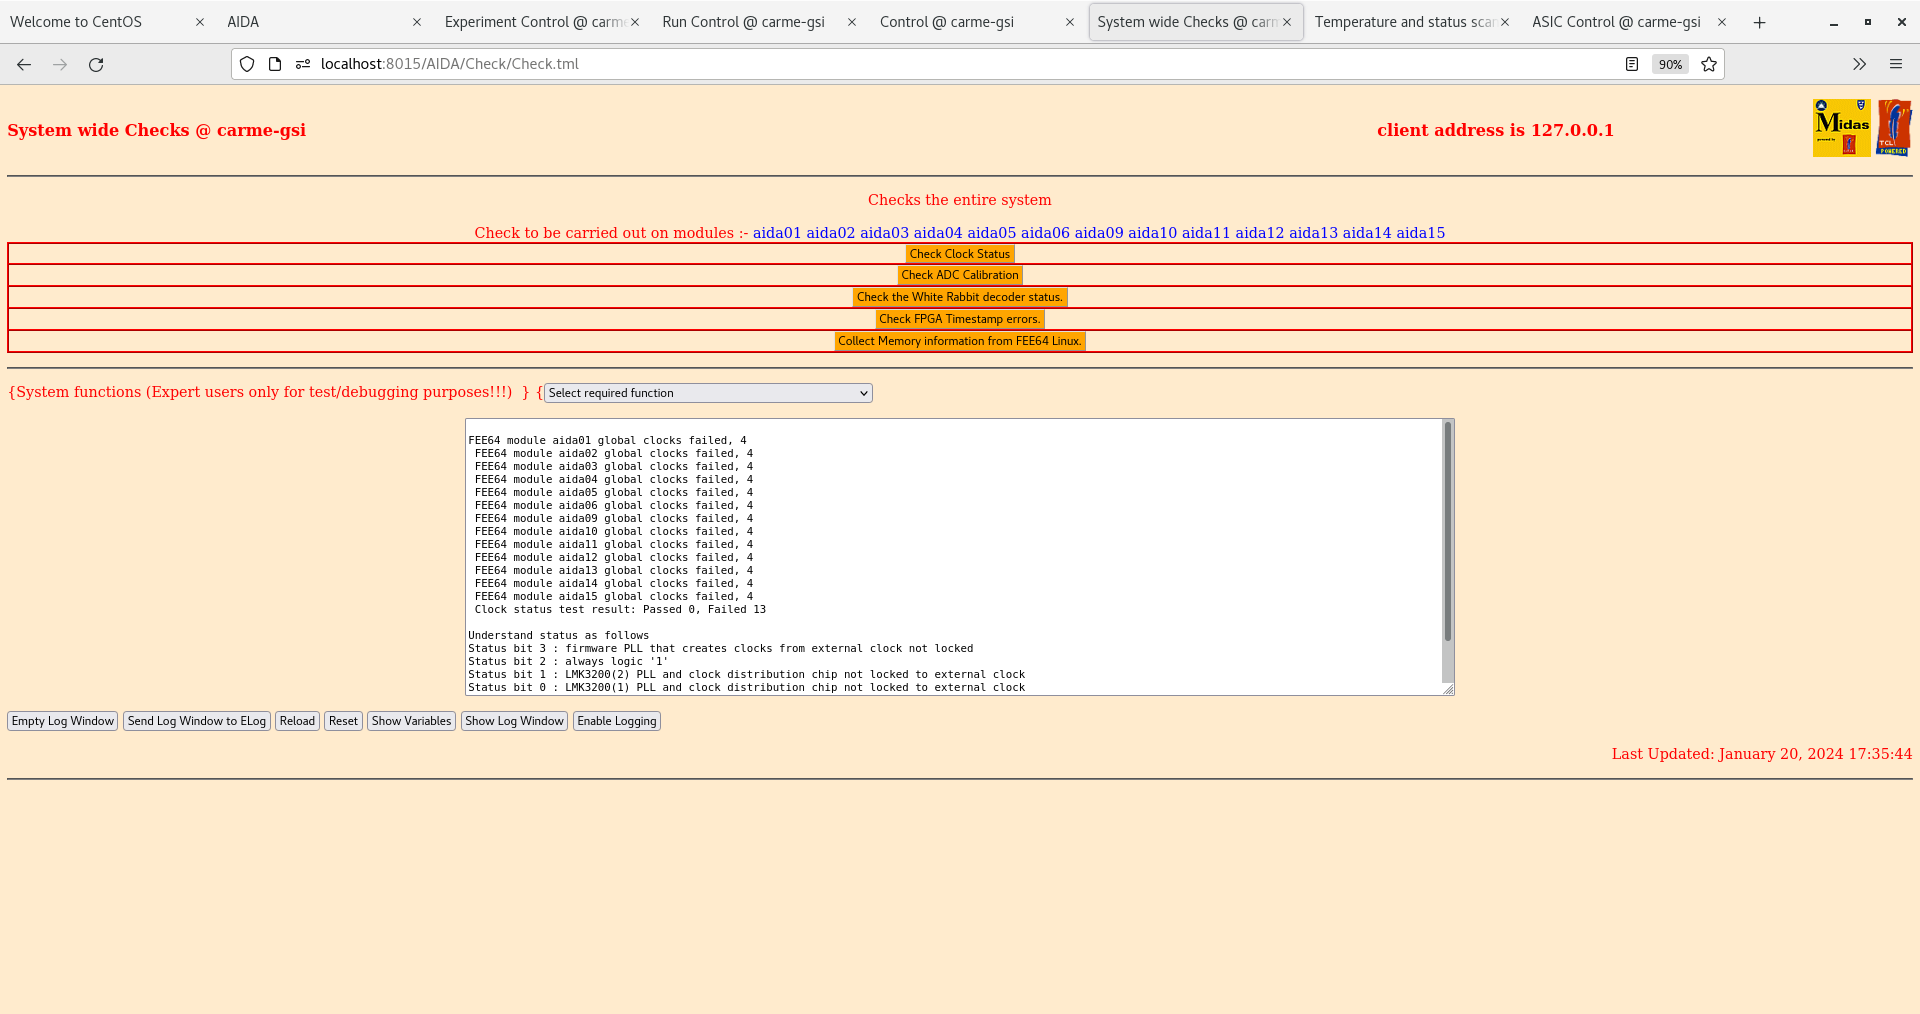
17.36 Switch from VETAR2 ( all MACB modules mode 0x3 ) to NIM WR emulator ( root MACB module 0xd, all others 0x3 )
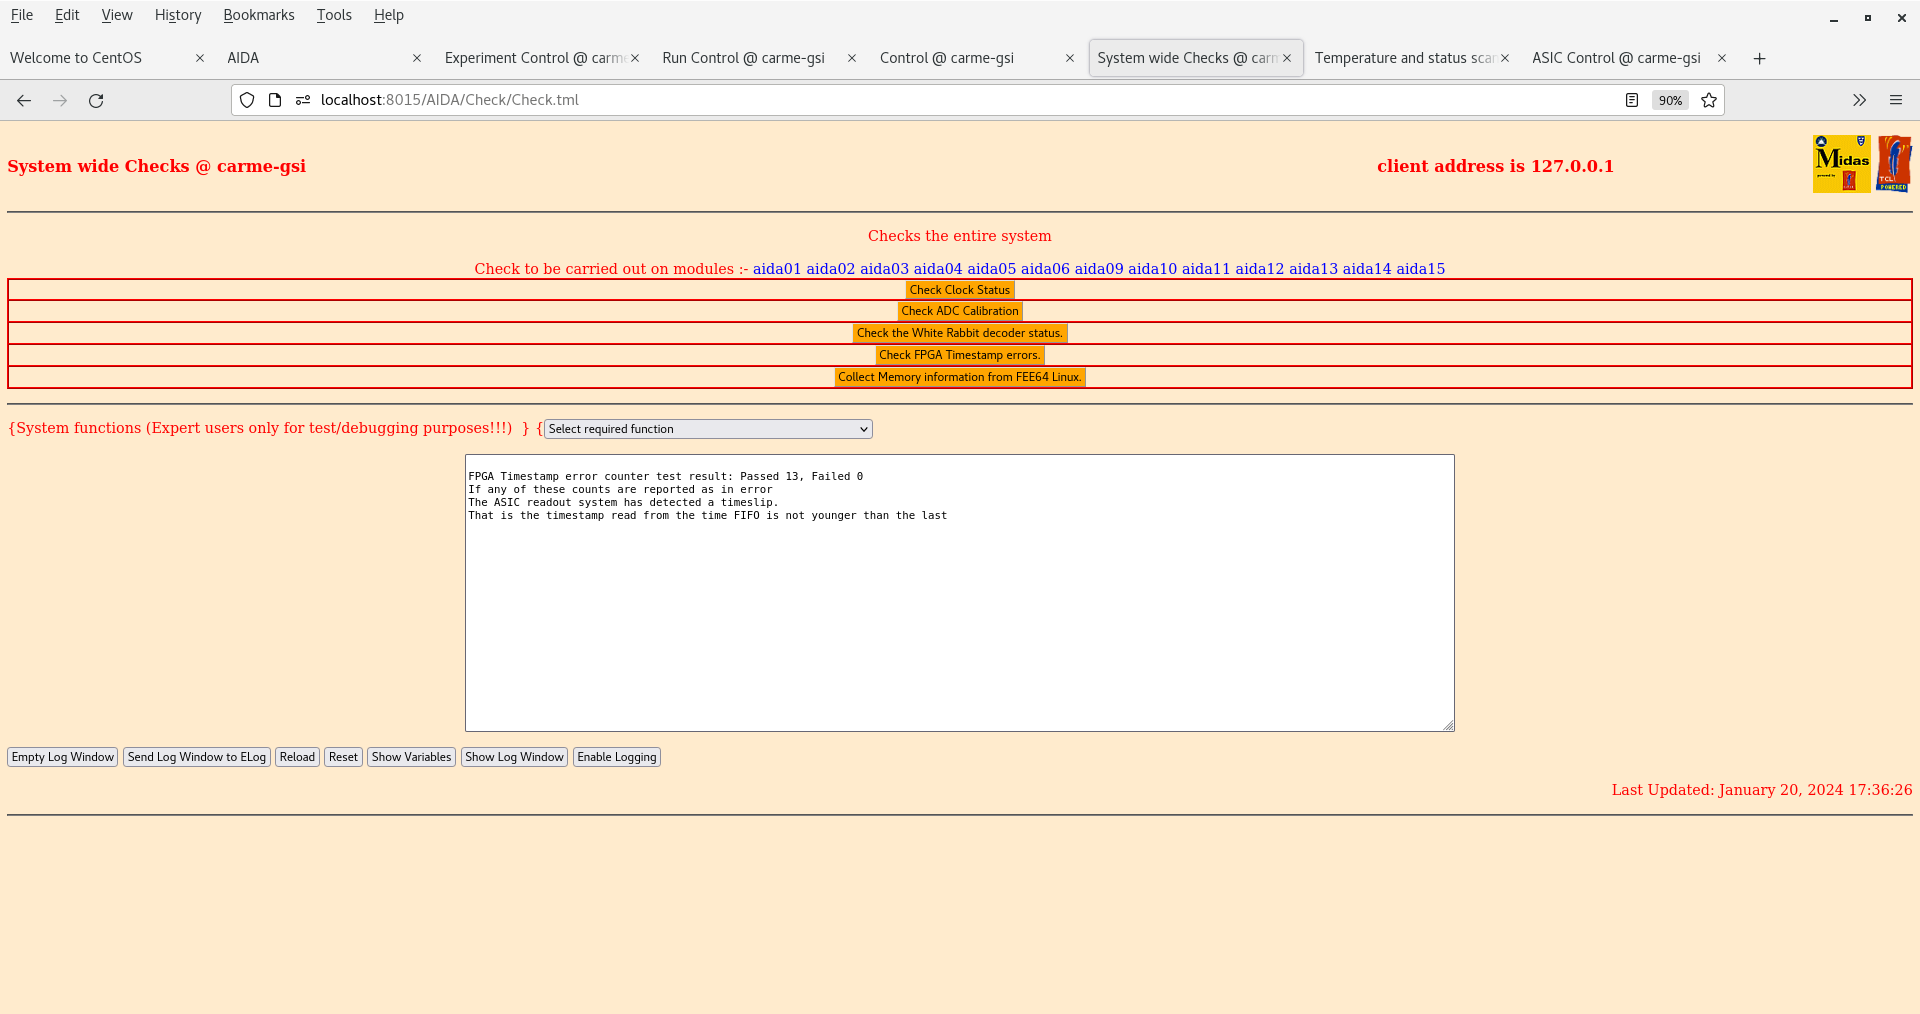
      All FEE64s fail Global clock and WR decoder - attachments 22-24
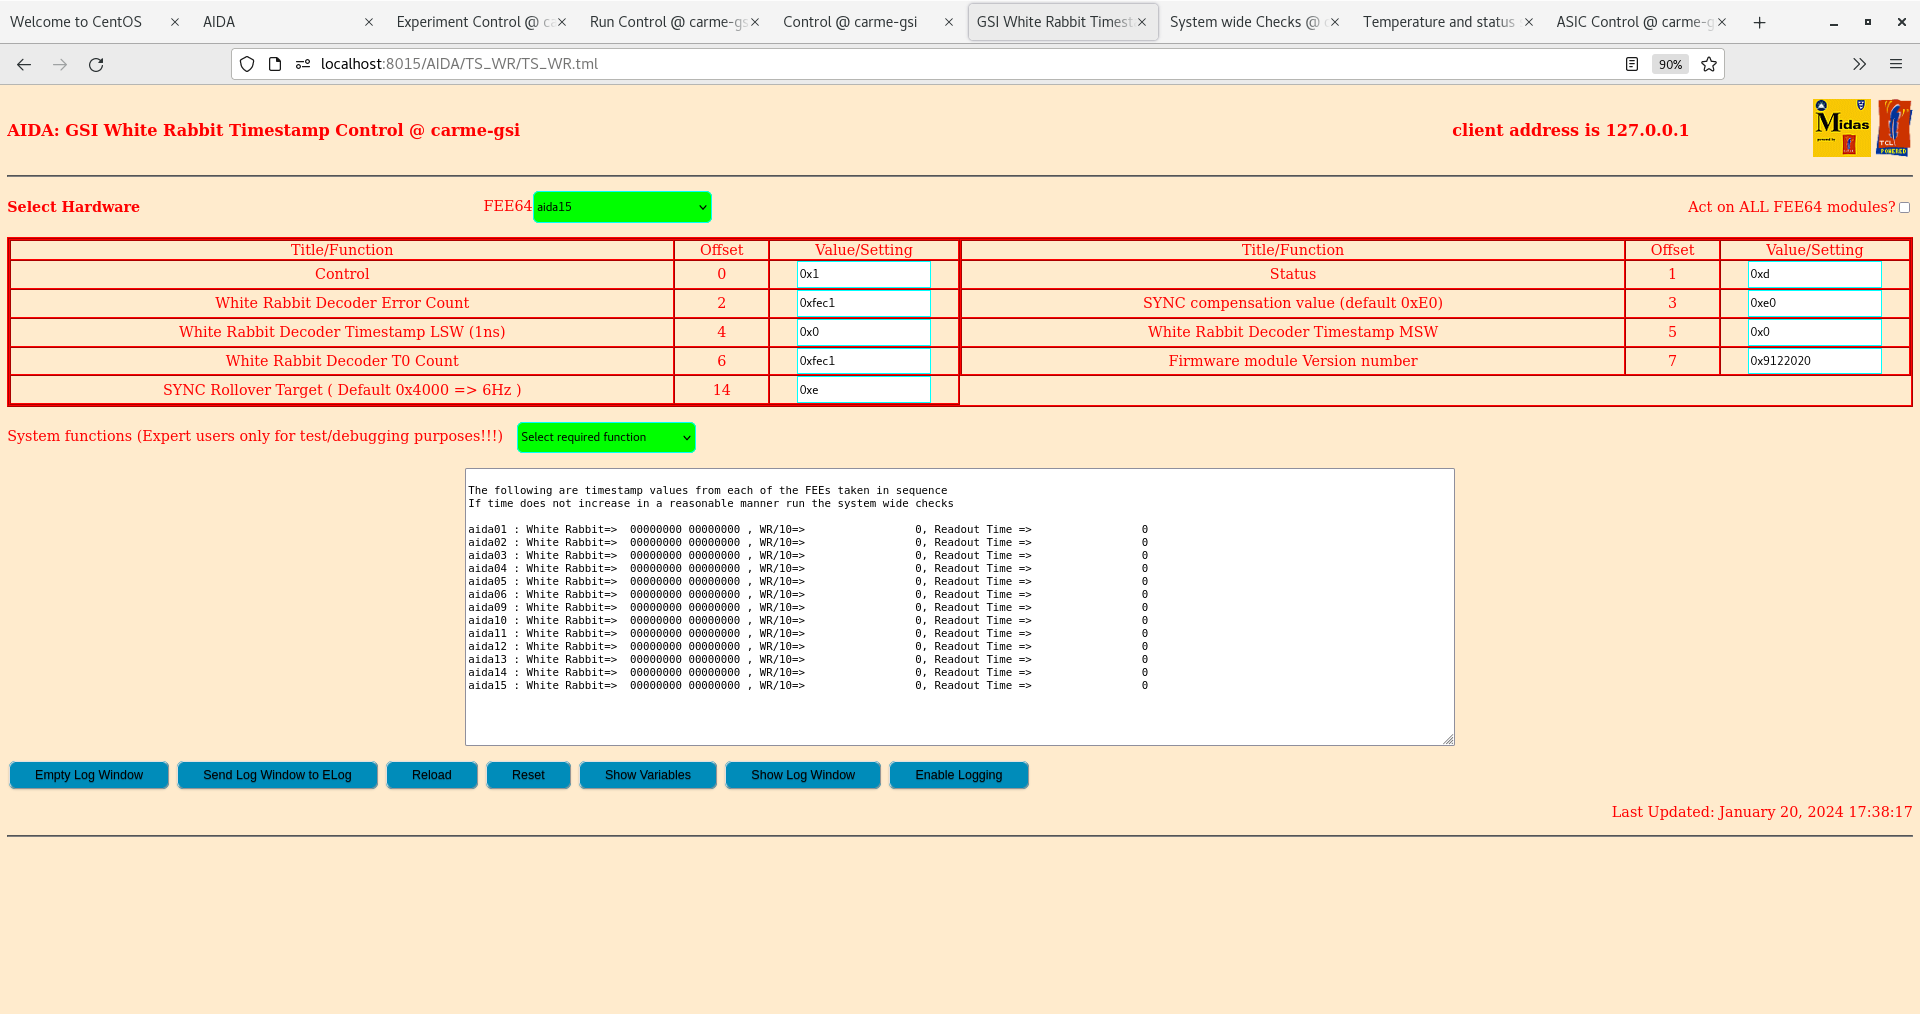
      WR timetsamp control - attachment 25


18.10 Noted MACB #4 mode actually set to 0x2 *not* 0x3 - changed to 0x3

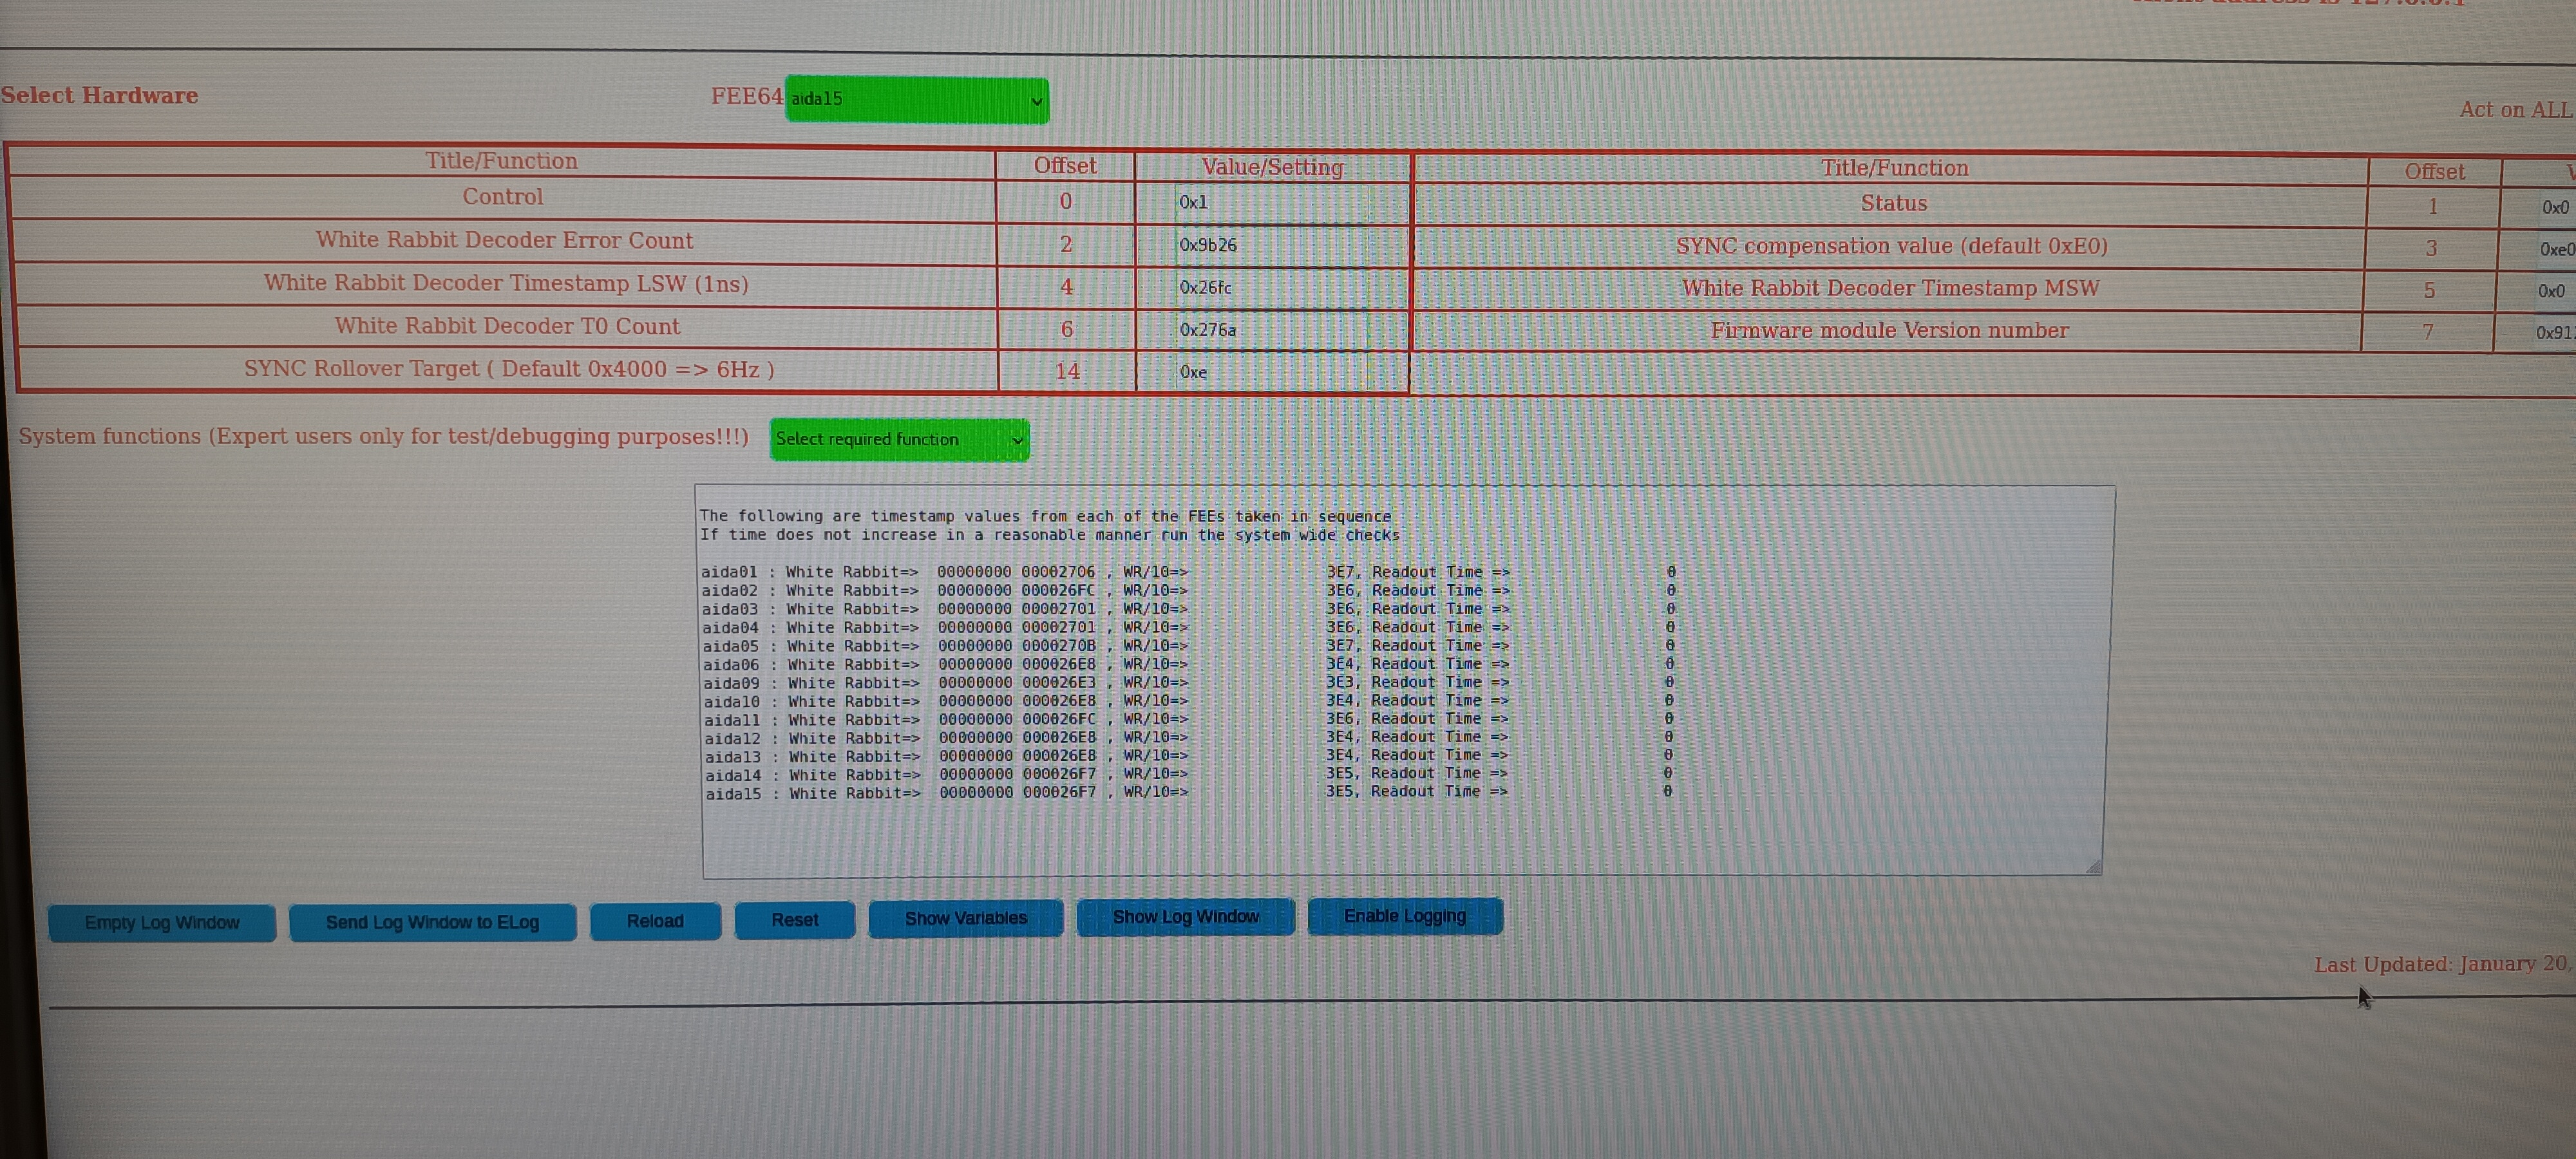
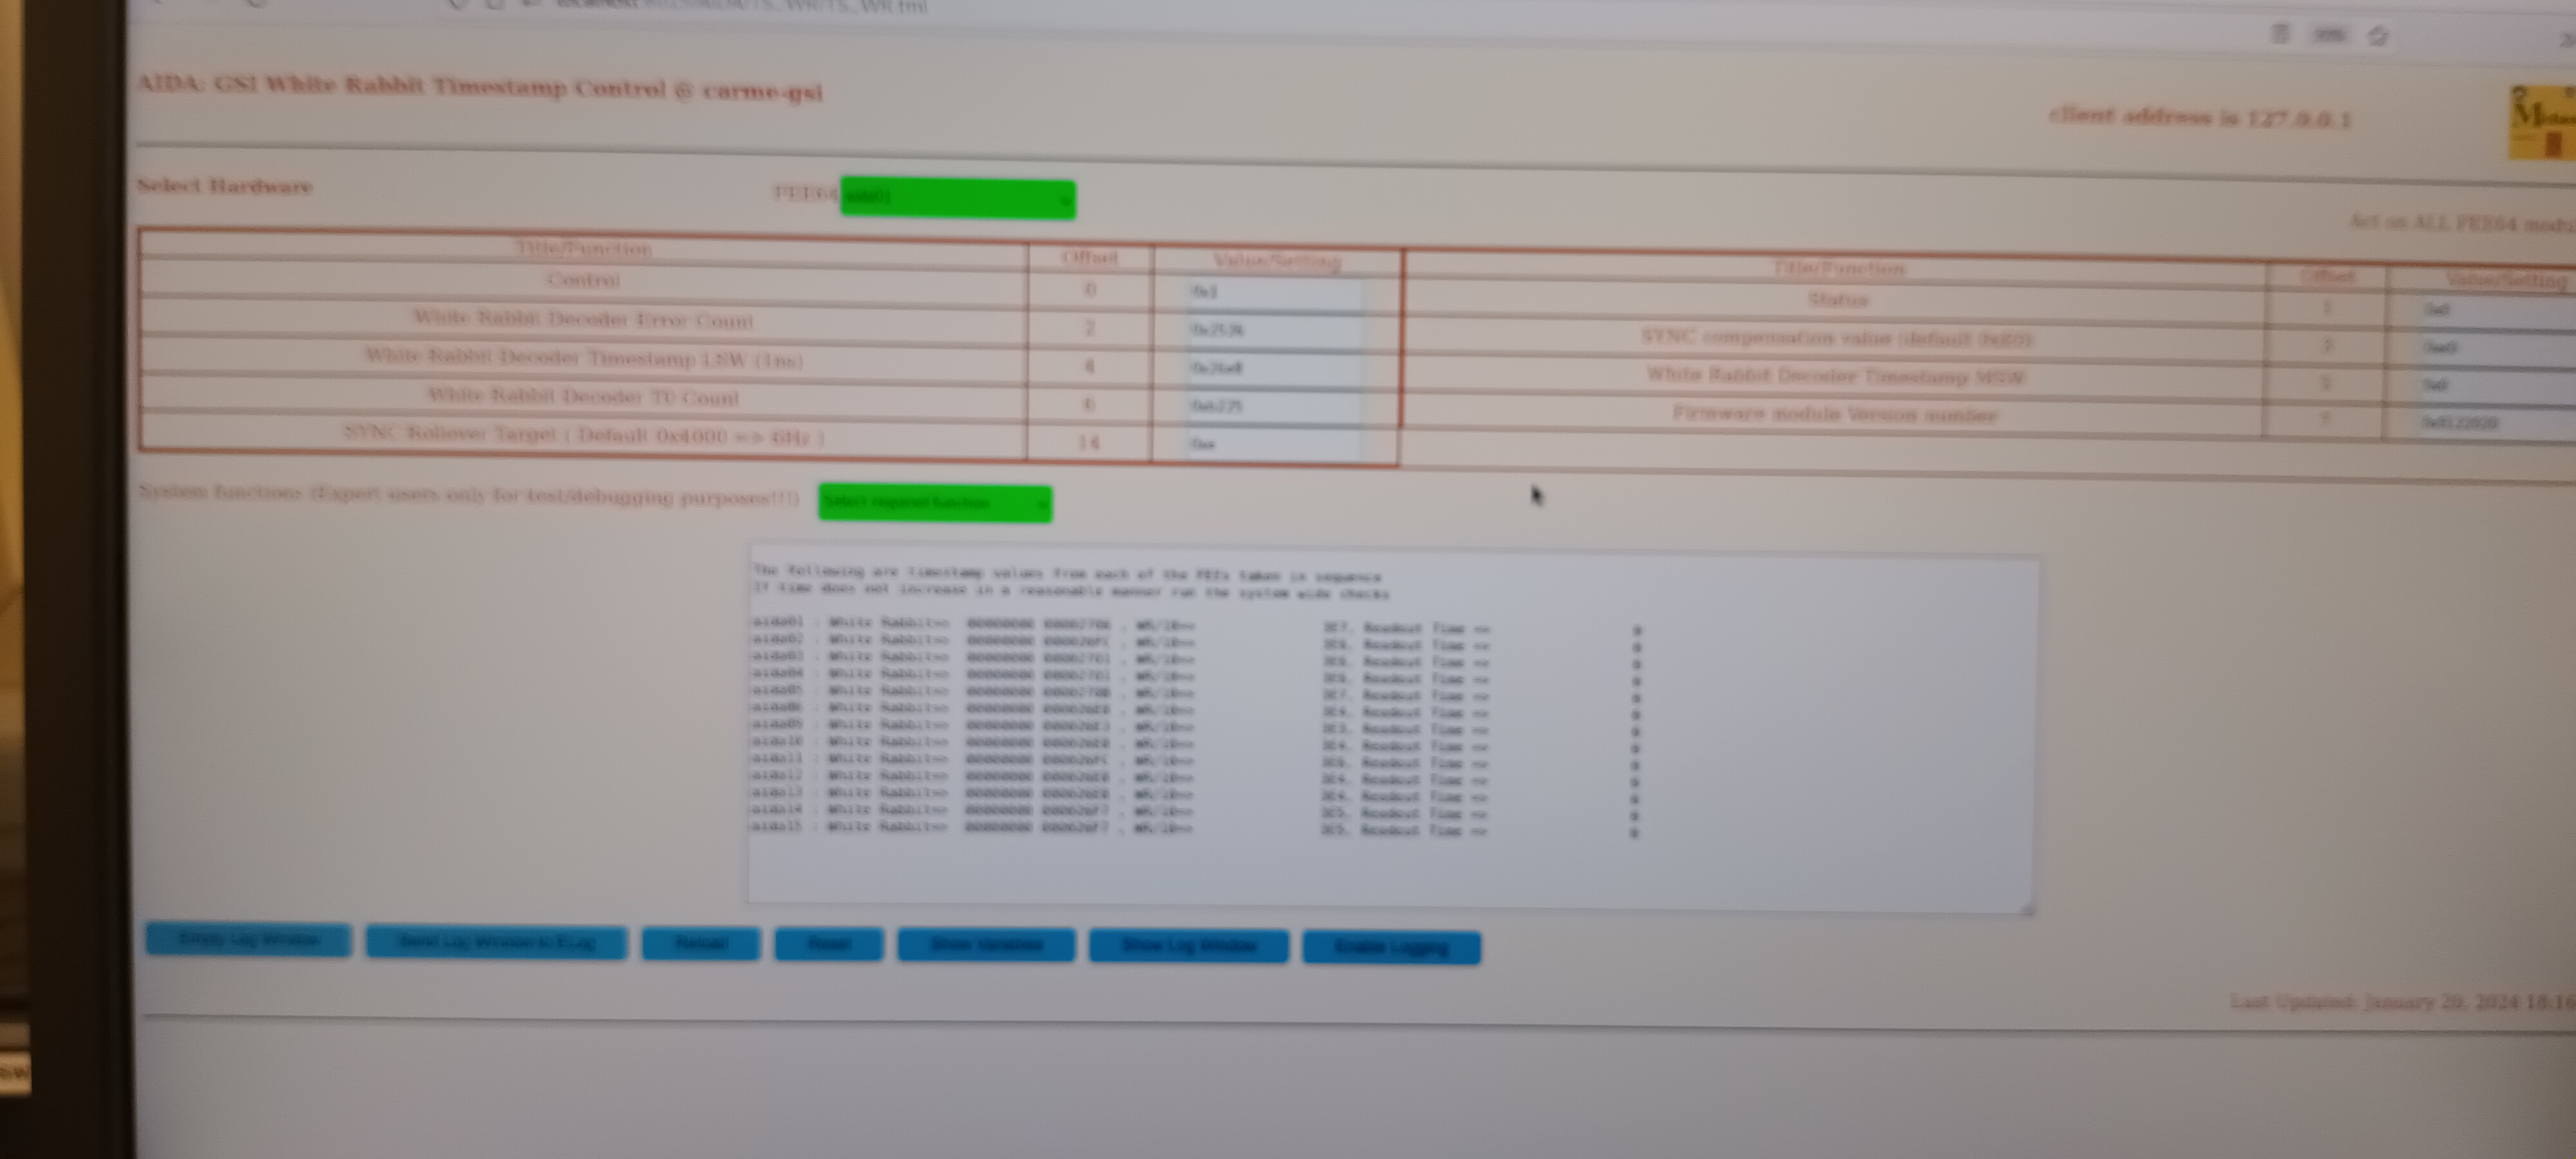
      Re-test with VETAR2 WR - same behaviour as observed this morning - see attachments 26-30


Summary

n+n sides appear to be OK but noisy

no data observed from aida06 & aida11
 aida11 known to be disconnected from adaptor PCB

aida15 asic #2 may be faulty

aida01, aida05, aida12 - data suggest FEE64/adaptor PCB alignment issue ?

aida02, aida03, aida09, aida14 - data suggest adaptor PCB damaged pins ?


aida07 - network config issue ?

aida08 - not completing boot

need to attach sys console to aida07 & aida08 to diagnose problem. |
| Attachment 1: Screenshot_from_2024-01-20_11-10-03.png
|

|
| Attachment 2: Screenshot_from_2024-01-20_11-22-20.png
|
|
| Attachment 3: Screenshot_from_2024-01-20_11-31-31.png
|
|
| Attachment 4: Screenshot_from_2024-01-20_11-31-39.png
|

|
| Attachment 5: Screenshot_from_2024-01-20_12-18-27.png
|

|
| Attachment 6: Screenshot_from_2024-01-20_12-18-37.png
|
|
| Attachment 7: Screenshot_from_2024-01-20_12-44-07.png
|

|
| Attachment 8: Screenshot_from_2024-01-20_12-42-58.png
|

|
| Attachment 9: Screenshot_from_2024-01-20_12-59-12.png
|

|
| Attachment 10: Screenshot_from_2024-01-20_13-00-18.png
|
|
| Attachment 11: Screenshot_from_2024-01-20_15-30-48.png
|

|
| Attachment 12: Screenshot_from_2024-01-20_15-40-44.png
|
|
| Attachment 13: Screenshot_from_2024-01-20_15-40-58.png
|

|
| Attachment 14: Screenshot_from_2024-01-20_15-43-06.png
|

|
| Attachment 15: Screenshot_from_2024-01-20_15-44-18.png
|

|
| Attachment 16: Screenshot_from_2024-01-20_15-45-14.png
|

|
| Attachment 17: Screenshot_from_2024-01-20_15-45-47.png
|

|
| Attachment 18: Screenshot_from_2024-01-20_16-03-18.png
|

|
| Attachment 19: Screenshot_from_2024-01-20_16-15-24.png
|

|
| Attachment 20: Screenshot_from_2024-01-20_16-15-52.png
|
|
| Attachment 21: Screenshot_from_2024-01-20_16-16-37.png
|

|
| Attachment 22: Screenshot_from_2024-01-20_17-36-22.png
|
|
| Attachment 23: Screenshot_from_2024-01-20_17-36-28.png
|
|
| Attachment 24: Screenshot_from_2024-01-20_17-36-43.png
|

|
| Attachment 25: Screenshot_from_2024-01-20_17-38-22.png
|
|
| Attachment 26: 1000009752.jpg
|

|
| Attachment 27: 1000009753.jpg
|
|
| Attachment 28: 1000009754.jpg
|

|
| Attachment 29: 1000009755.jpg
|
|
| Attachment 30: 1000009756.jpg
|

|
|
399
|
Sat May 13 11:34:25 2023 |
TD, RSS | Saturday 13 May |
12.34 DSSSD#3 bias -149.95V leakage current -6.763uA temperature +21.2 deg C ( https://web-docs.gsi.de/~lestinsk/tempplot.php )

CRYRING cave lights ON - leakage current measurements @ 60s intervals

6.763
6.764
6.764
6.765
6.767
6.767
6.767
6.767
6.768
6.769

12.48 CRYRING cave lights OFF

13.03 leakage current -6.771uA - no obvious change due to the CRYRING cave lighting

17.31 DSSSD#3 bias -149.95V leakage current -6.658uA temperature +21.0 deg C ( https://web-docs.gsi.de/~lestinsk/tempplot.php )

leakage current measurements @ 60s intervals

6.656
6.655
6.655
6.655
6.654
6.652
6.652
6.651
6.650
6.649

CRYRING cave temperature variations/cycles ~0.1 deg C at +21 deg C ambient temperature can produce leakage current variations ~60nA for a leakage current of ~6.6uA

td@winder:~/f77$ ./jgen
 *** Enter reference temperature (K)
294
 *** Enter minimum temperature, maximum temperature
 *** and temperature increment (K)
290 298 0.1

 Temperature (K)   Ratio (J(T)/J(294.0))

      290.0                0.702
      290.1                0.708
      290.2                0.714
      290.3                0.721
      290.4                0.727
      290.5                0.734
      290.6                0.740
      290.7                0.747
      290.8                0.754
      290.9                0.761
      291.0                0.767
      291.1                0.774
      291.2                0.781
      291.3                0.788
      291.4                0.795
      291.5                0.802
      291.6                0.809
      291.7                0.817
      291.8                0.824
      291.9                0.831
      292.0                0.839
      292.1                0.846
      292.2                0.854
      292.3                0.861
      292.4                0.869
      292.5                0.877
      292.6                0.884
      292.7                0.892
      292.8                0.900
      292.9                0.908
      293.0                0.916
      293.1                0.924
      293.2                0.932
      293.3                0.941
      293.4                0.949
      293.5                0.957
      293.6                0.966
      293.7                0.974
      293.8                0.983
      293.9                0.991
      294.0                1.000
      294.1                1.009
      294.2                1.018
      294.3                1.027
      294.4                1.036
      294.5                1.045
      294.6                1.054
      294.7                1.063
      294.8                1.072
      294.9                1.082
      295.0                1.091
      295.1                1.101
      295.2                1.110
      295.3                1.120
      295.4                1.130
      295.5                1.139
      295.6                1.149
      295.7                1.159
      295.8                1.169
      295.9                1.179
      296.0                1.190
      296.1                1.200
      296.2                1.210
      296.3                1.221
      296.4                1.231
      296.5                1.242
      296.6                1.253
      296.7                1.263
      296.8                1.274
      296.9                1.285
      297.0                1.296
      297.1                1.308
      297.2                1.319
      297.3                1.330
      297.4                1.342
      297.5                1.353
      297.6                1.365
      297.7                1.376
      297.8                1.388
      297.9                1.400

STOP *** Program ends |
|
107
|
Tue Oct 5 11:44:11 2021 |
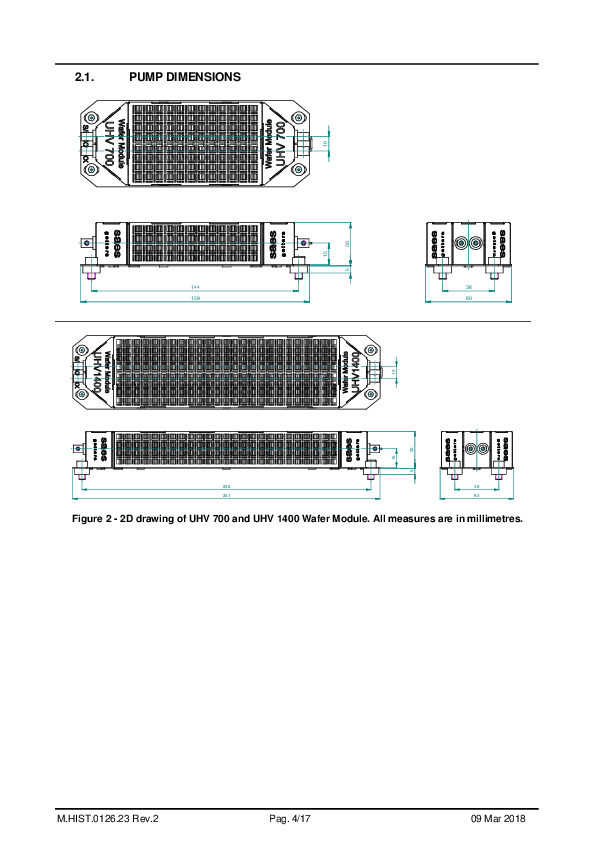
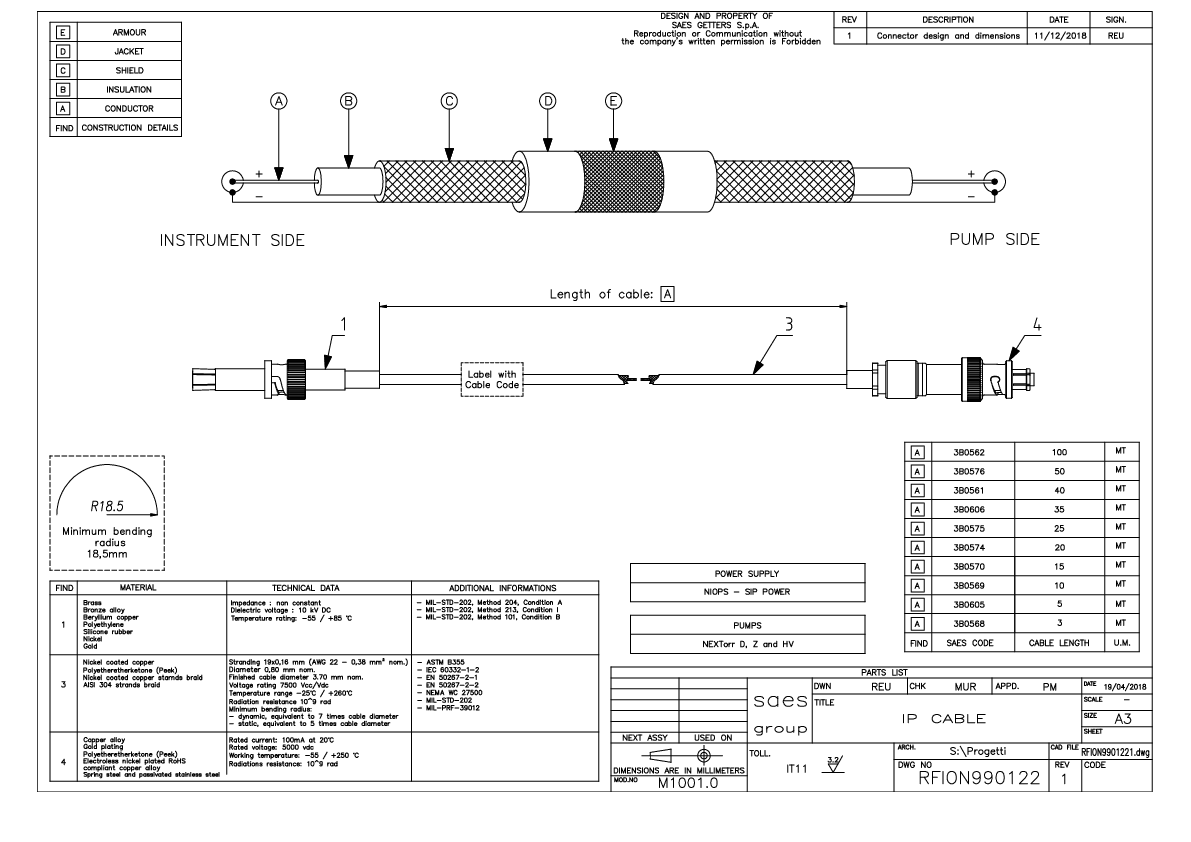
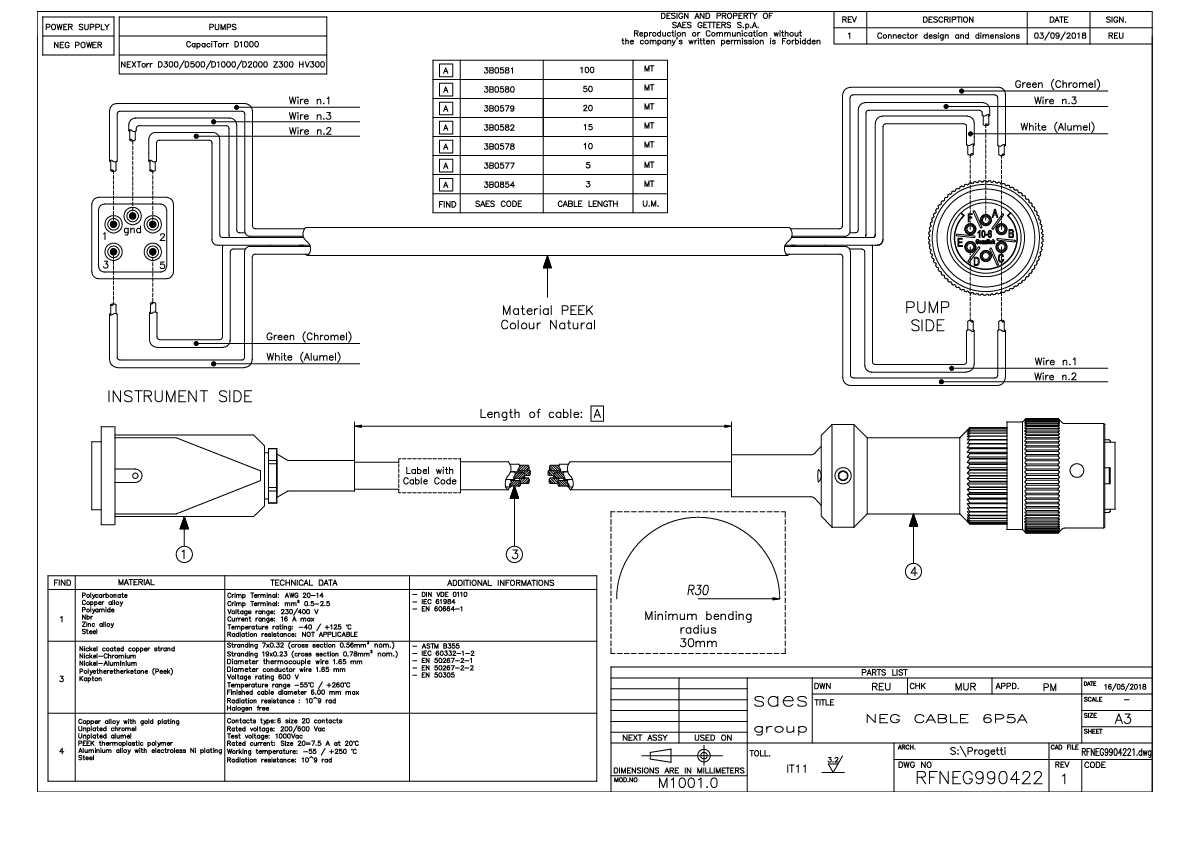
CB, TD | SAES manuals & cable drawings |
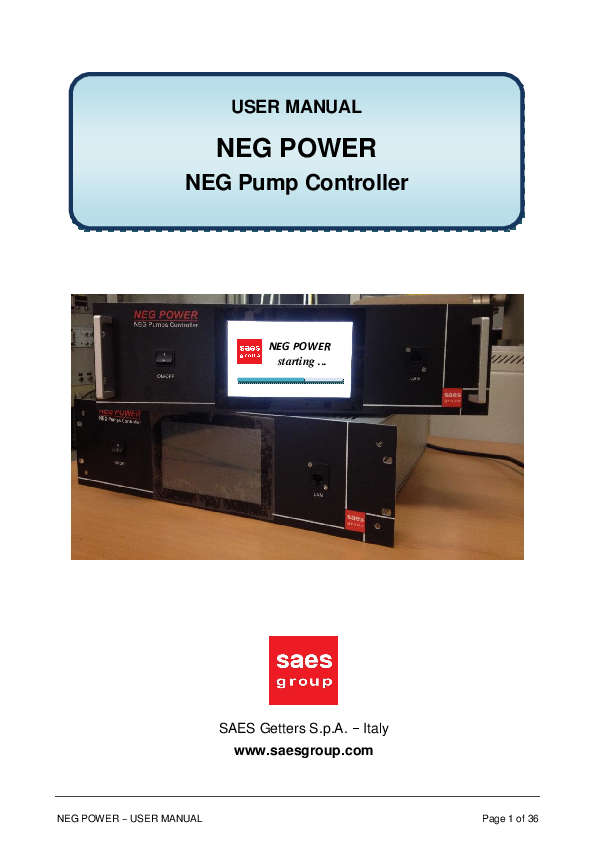
NEG power
SIP power
UHV1400 operating instructions |
| Attachment 1: NEG_POWER_user_manual.pdf
|


|
| Attachment 2: operating_instructions_SIP_POWER.pdf
|




|
| Attachment 3: operating_instructions_UHV1400-UHV700_wafer_modules.pdf
|

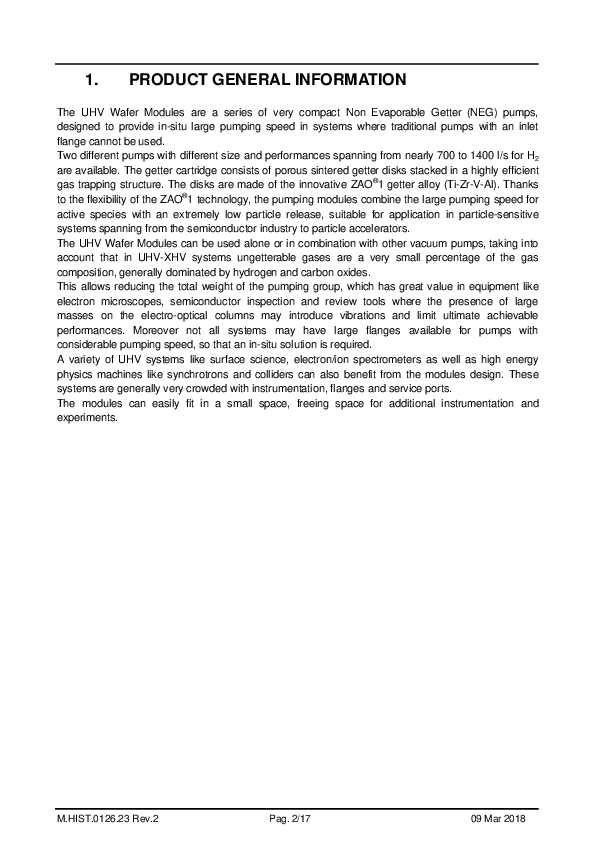
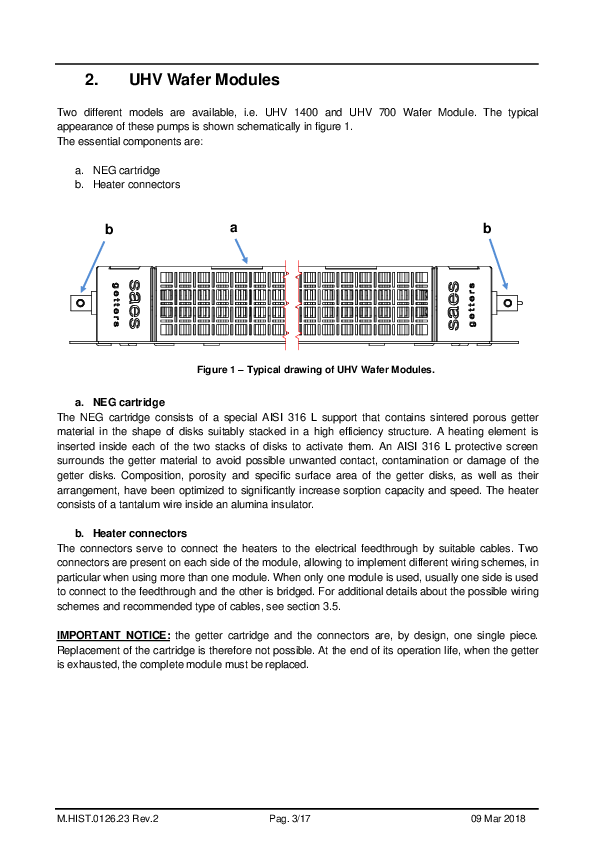


|
| Attachment 4: RFION9901221.pdf
|
|
| Attachment 5: RFKIT9903220.pdf
|

|
| Attachment 6: RFKIT9904220_(2).pdf
|
-0.png)
|
| Attachment 7: RFKIT9905220_(2).pdf
|
-0.png)
|
| Attachment 8: RFNEG9904221.pdf
|
|
|
3
|
Tue Aug 18 17:35:20 2020 |
TD | SAES UHV1400 pin assignment |
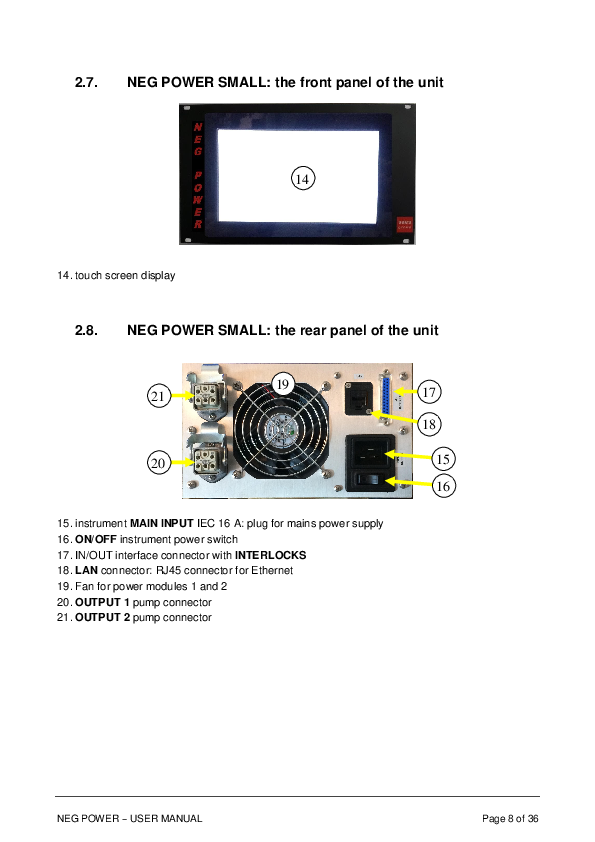
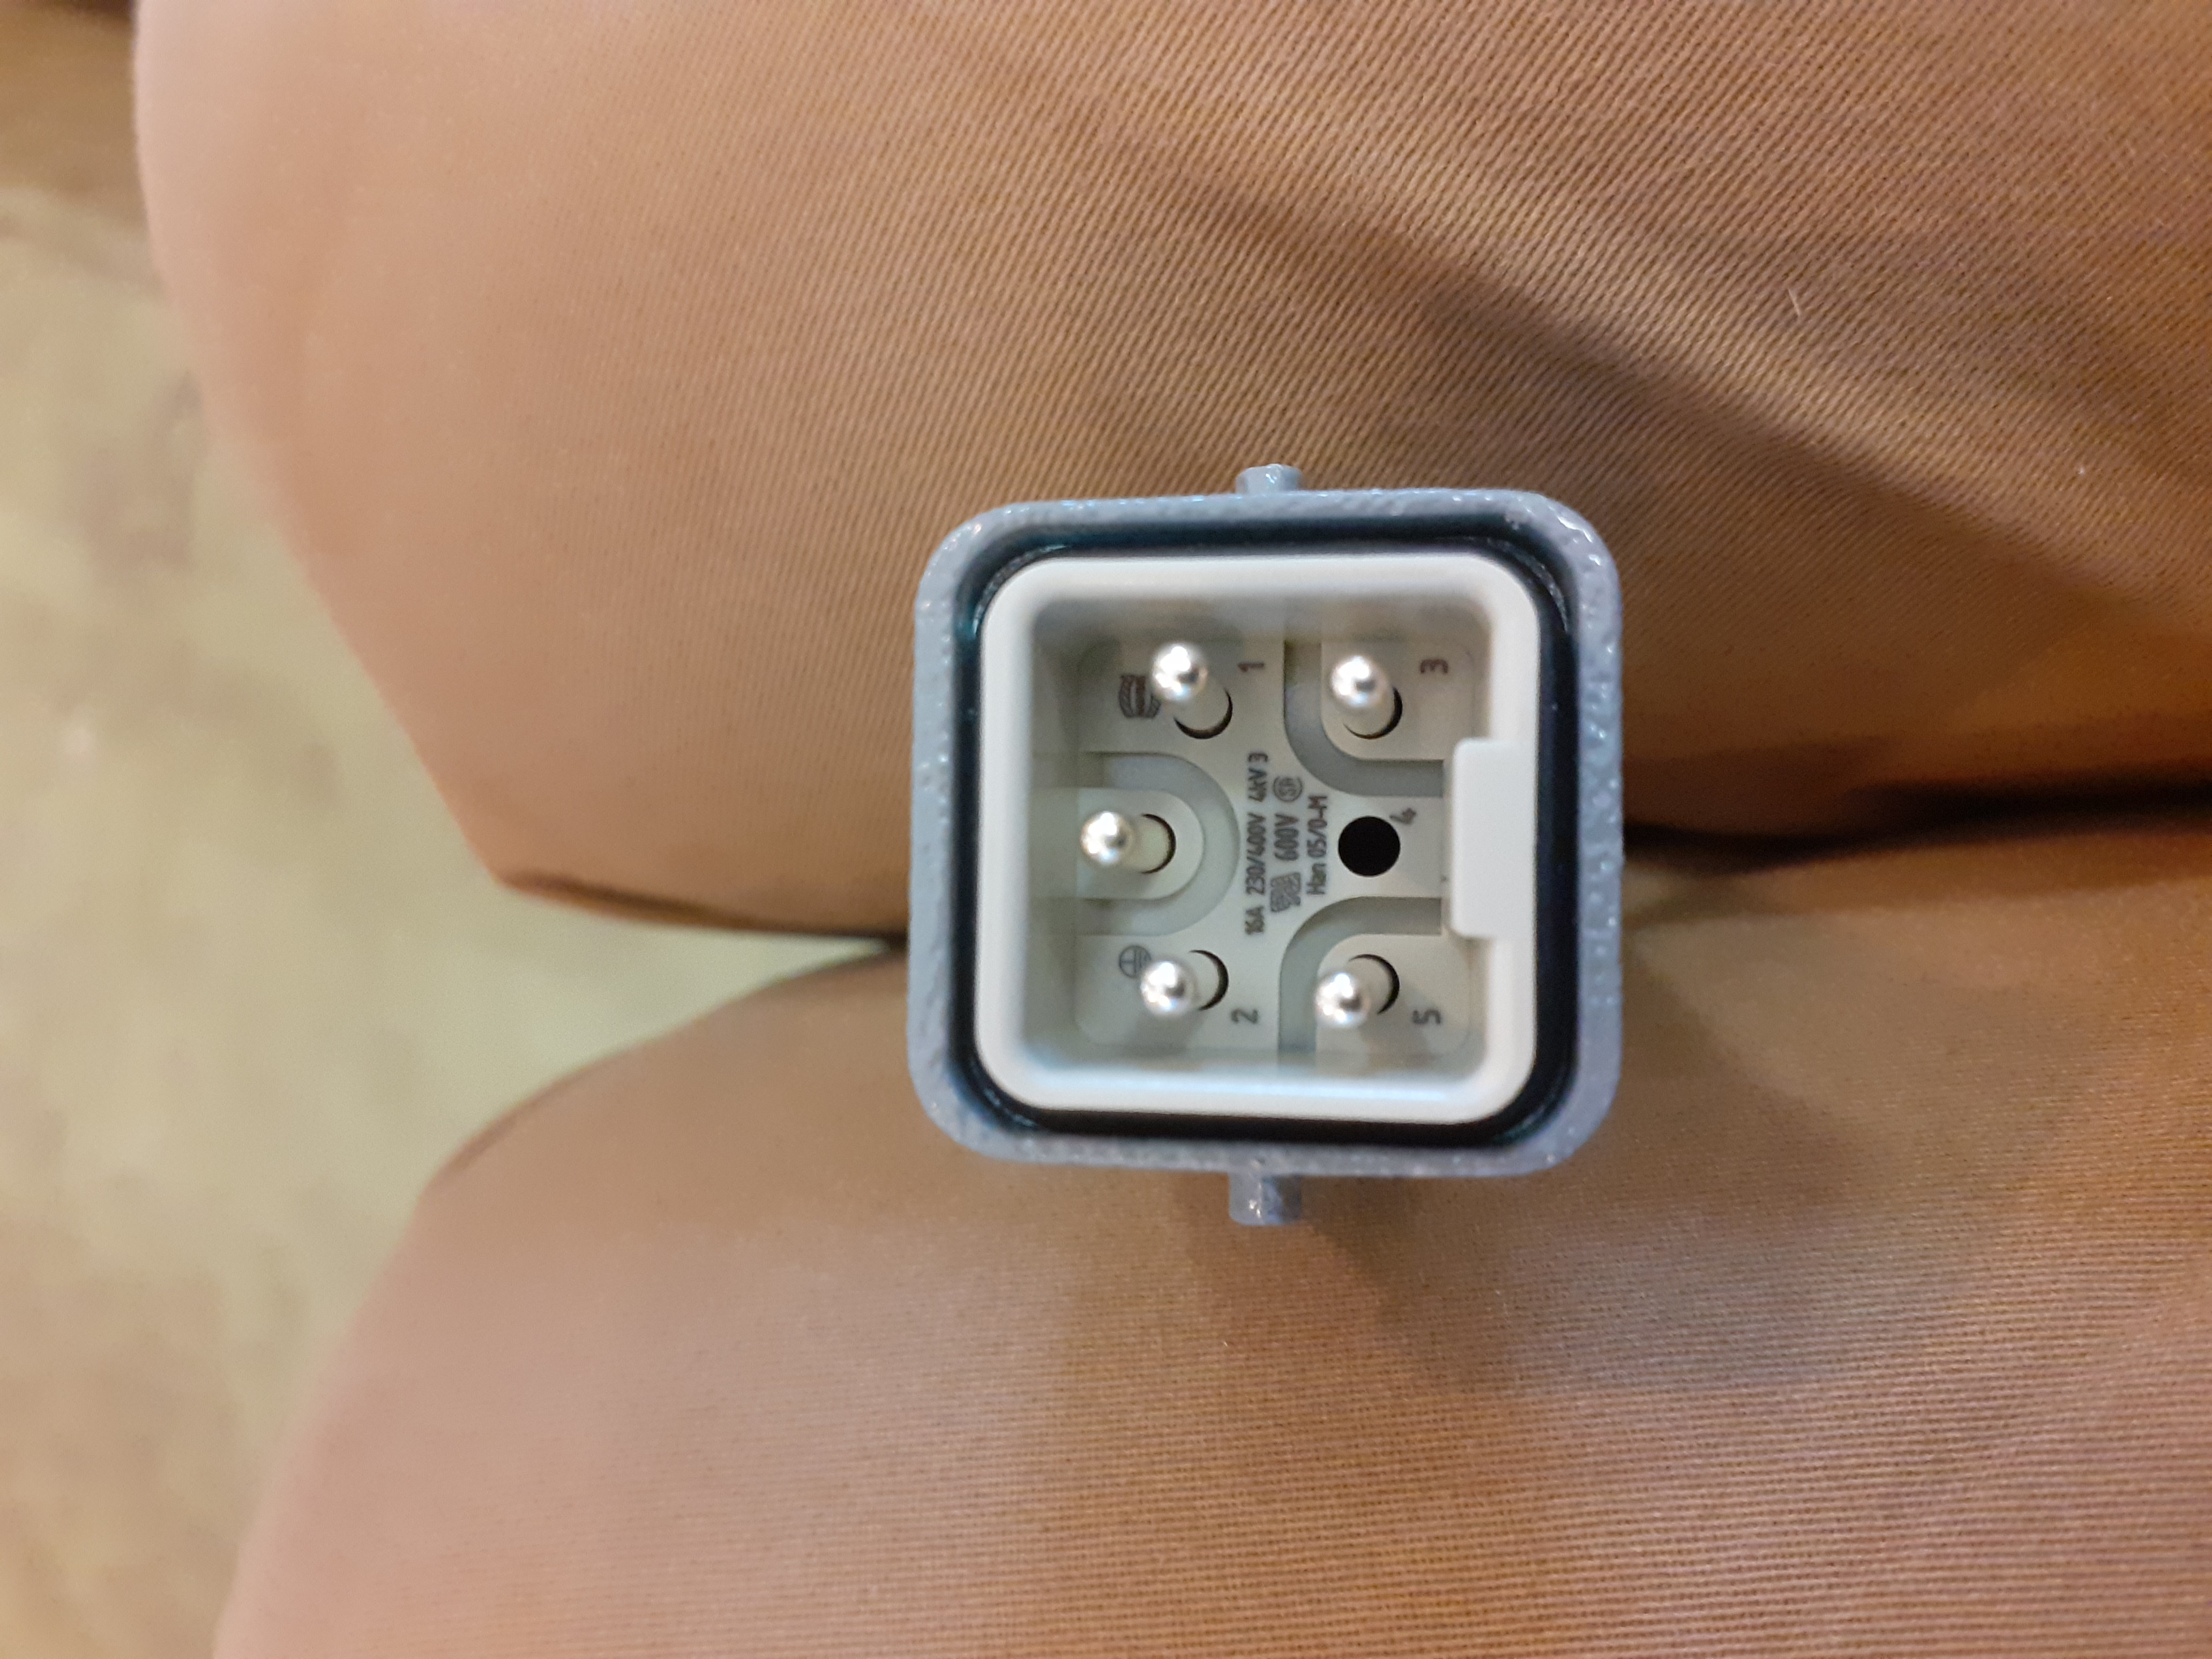
Using a digital multimeter confirmed continuity for SAES-supplied
power cable (Amphenol (circular) 6-pin plug to Han 05 plug) for
the following pins

pin A - pin 5
pin F - pin 3

which correspond to the type K chromel/alumel thermocouple contacts
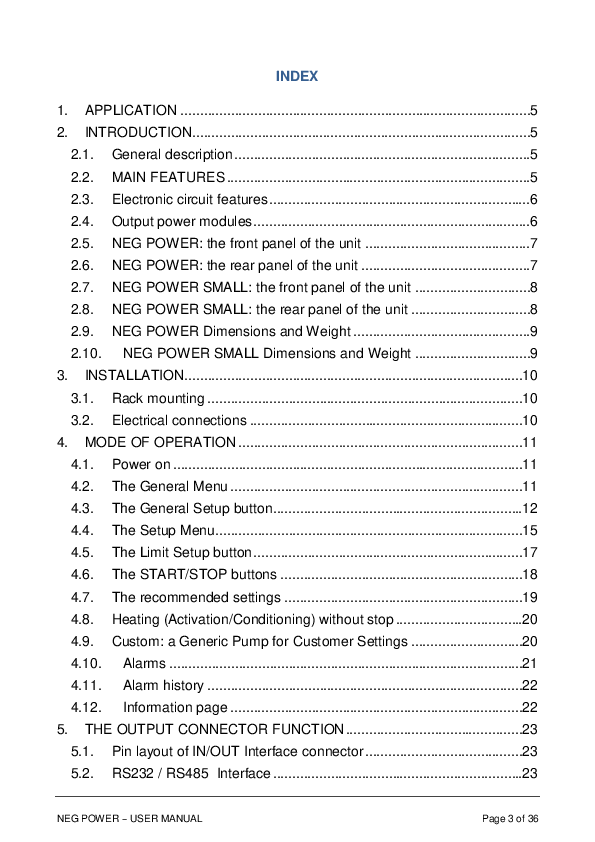
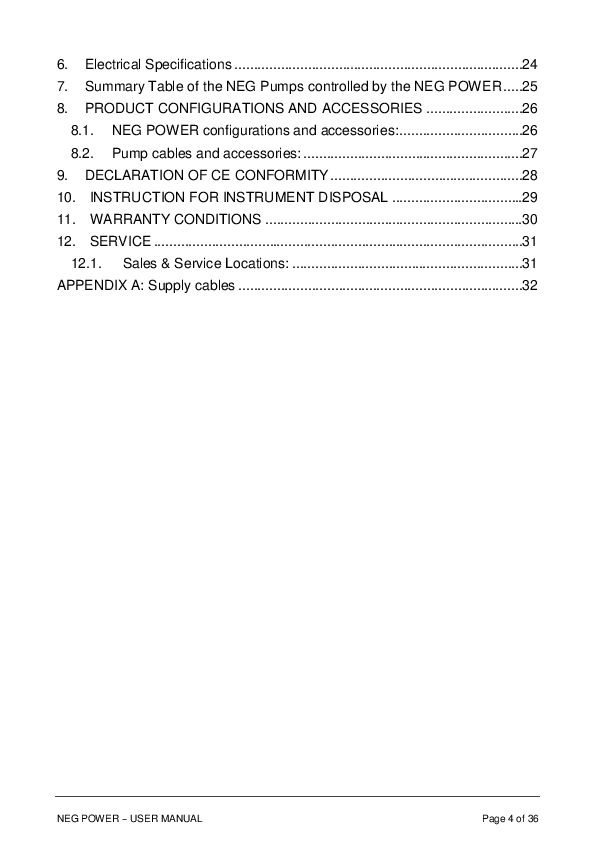
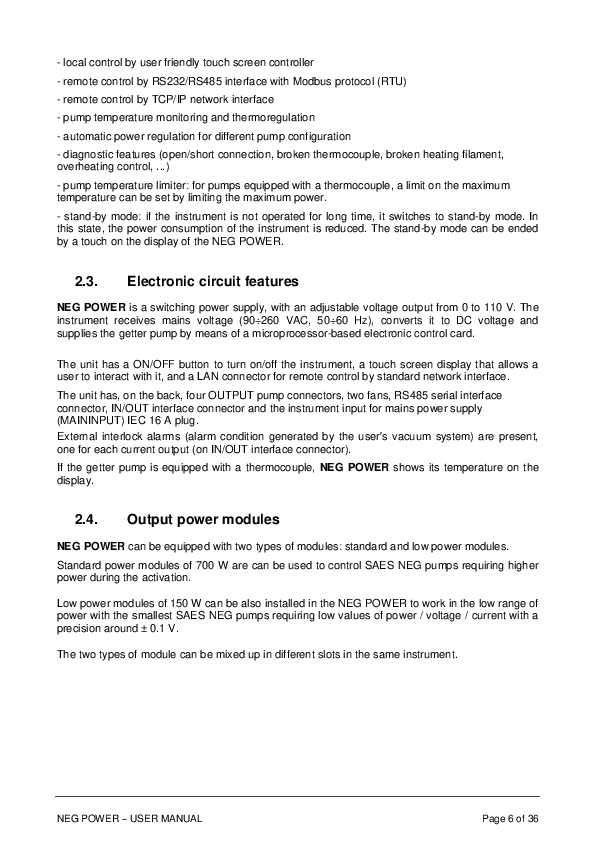
and Neg PSU output connector pins for the thermocouple (e.g. see p.34
of Neg PSU manual). |
| Attachment 1: NEG_POWER_user_manual.pdf
|


|
| Attachment 2: 20200813_121944_(1).jpg
|
.jpg.png)
|
| Attachment 3: 20200813_134548.jpg
|
|
| Attachment 4: RFKIT9904220_(2).pdf
|
-0.png)
|
| Attachment 5: RFKIT9905220_(2).pdf
|
-0.png)
|
|
751
|
Mon Jun 16 21:58:00 2025 |
CB AR | Runs 84-89 |
Found all Merger Links background black - inactive. Nontheless the tapeservice was working, the data rate to disk was normal, and the file was being written and the histograms were being updated.
Decided to stop DAQ, stop Merger, restart merger. Links rest to green background - but no more writing to disk!
Killed Merger, killed Tape Service. Restarted.
Netvar read out at 3 - set to 1. When the Output of the Merger is enabled Netvar returns to 3. Tapeservice not writing to disk
Killed Merger, killed Tape Service. Restarted x3. Same behaviour.
Not working. No blocks being written.
With Tape Server status Stopped Ticked No storage, Unticked No storage -> Now writing blocks ?!
Tape Server Go. Writing to disk. Merger OK. Histograms updated, observables as normal (see next ELOG).
Lost runs 84-89 in the process. |