| |
ID |
Date |
Author |
Subject |
|
|
3
|
Thu Sep 6 15:42:53 2018 |
OH, TD | FEE64 system console logs |
Kernel panics during boot cab be observed in files ttyUSB1 and ttyUSB5

In each case the FEE64 successfully completed reboot c. 5 minutes later |
| Attachment 1: logs.tar
|
|
|
5
|
Wed Sep 19 12:40:41 2018 |
OH, TD | Single DSSD Installation and Tests |
On the 18th of September we installed DSSD 3208-14

Was found to have problems including exponential leakage behavior

  V      Ic
 -5   15.4uA
 -10  53uA
 -15  Tripped at over 100uA

Cables were double checked, bond wires were checked and no problems could be observed.

DSSD replaced with 3208-15

Bias at -100V Ic 10.2uA GP/grnd Jumpers removed,
                         rising upwards, possible short circuit as well.

Jumpers replaced

Bias -100V Ic 1.6uA
Bias -160V Ic 1.62uA

Possibility that mechanical sample 3208-17 and 3208-14 have been swapped. (To check at later date)

FEEs powered up and Adapter boards and all grounding installed with DSSD going to 9,10,11 and 12

Rates shown - attachment 1
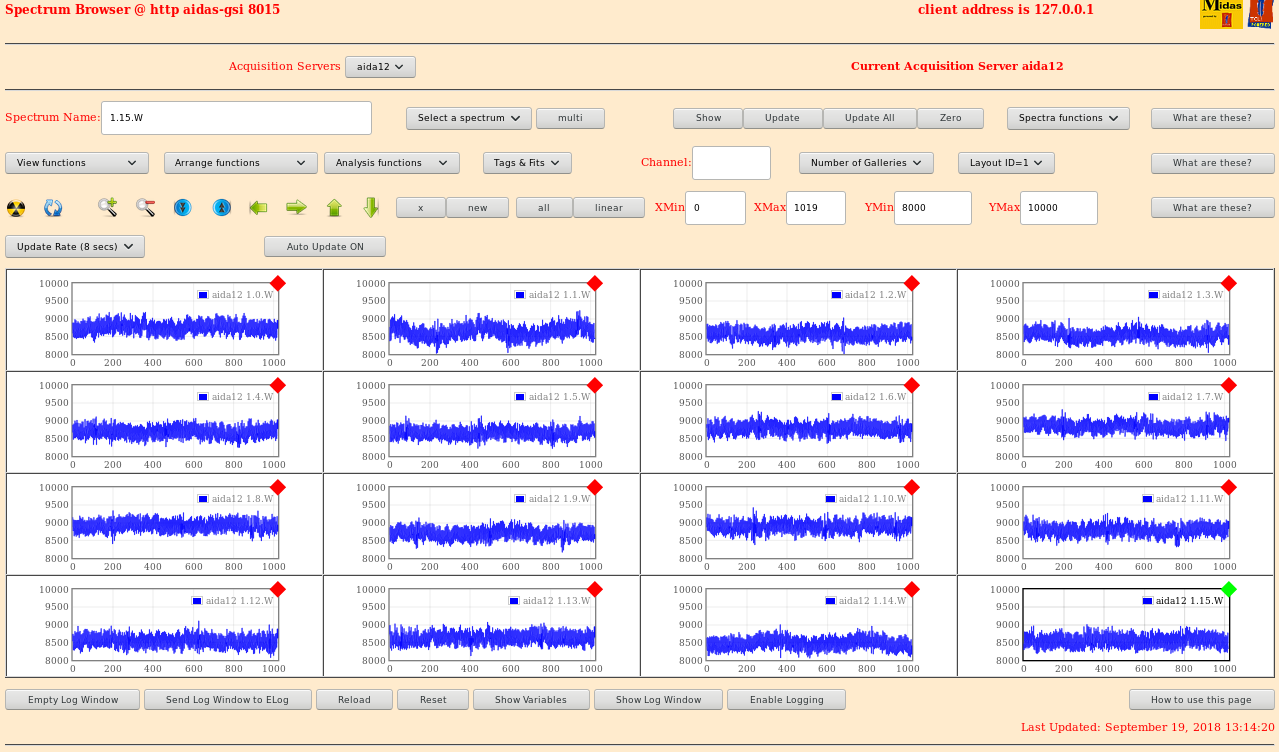
Waveforms - attachment 2-4
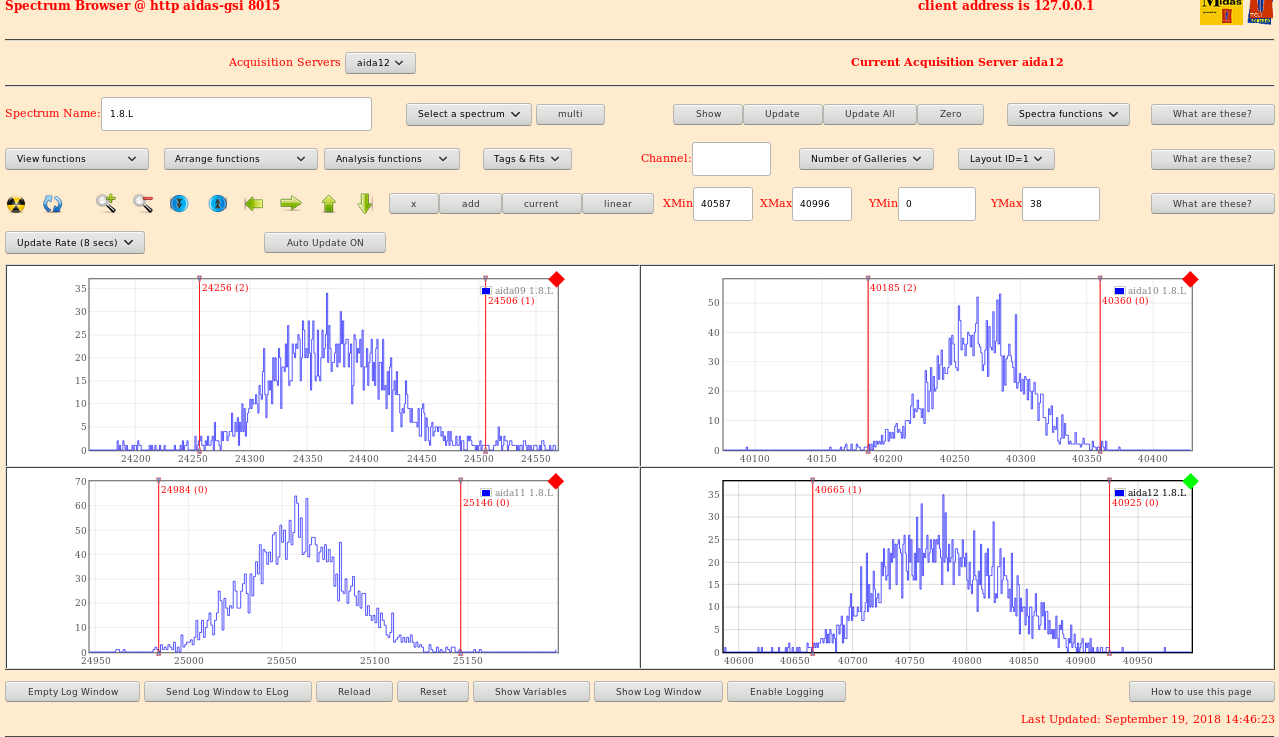
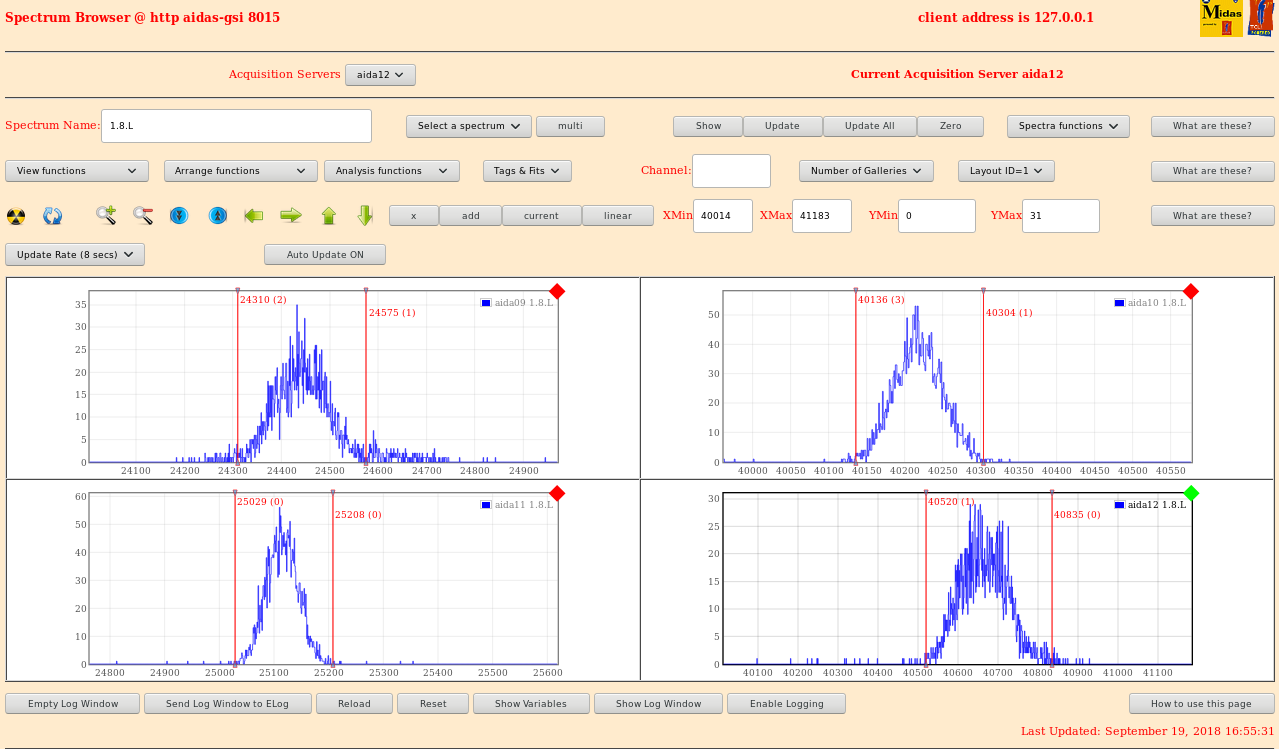
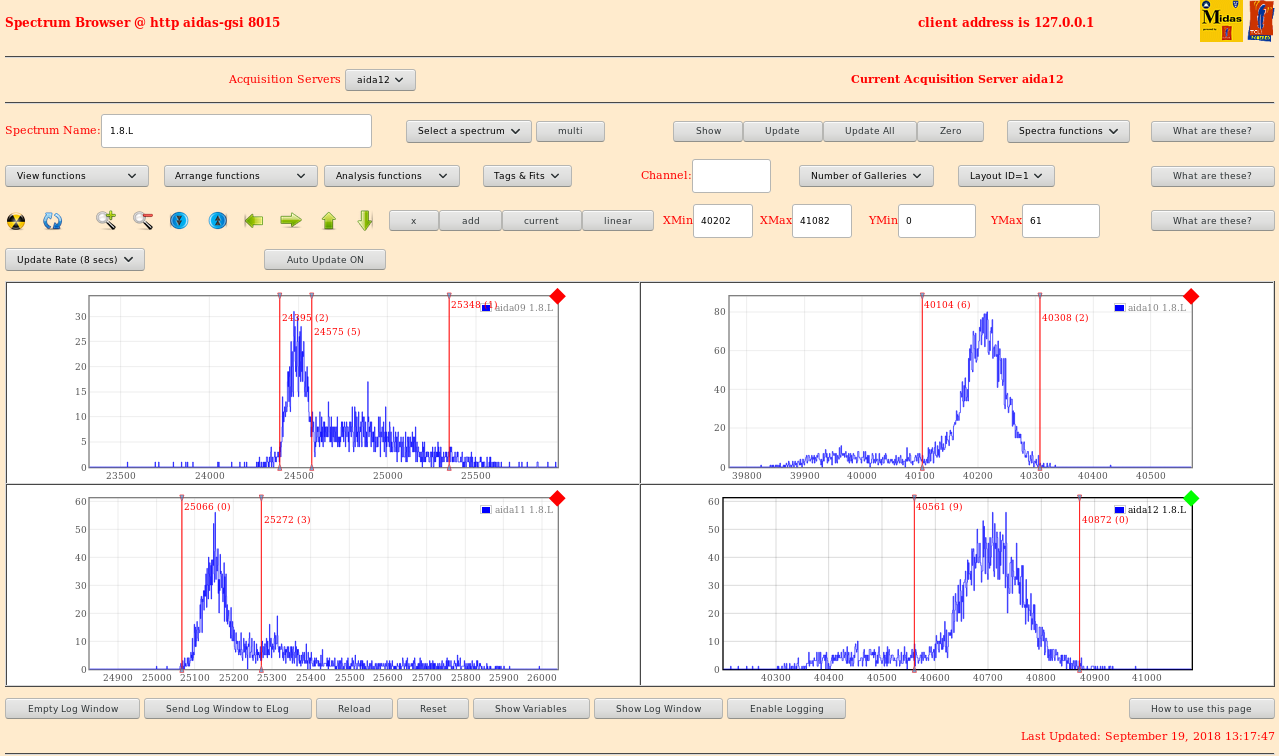
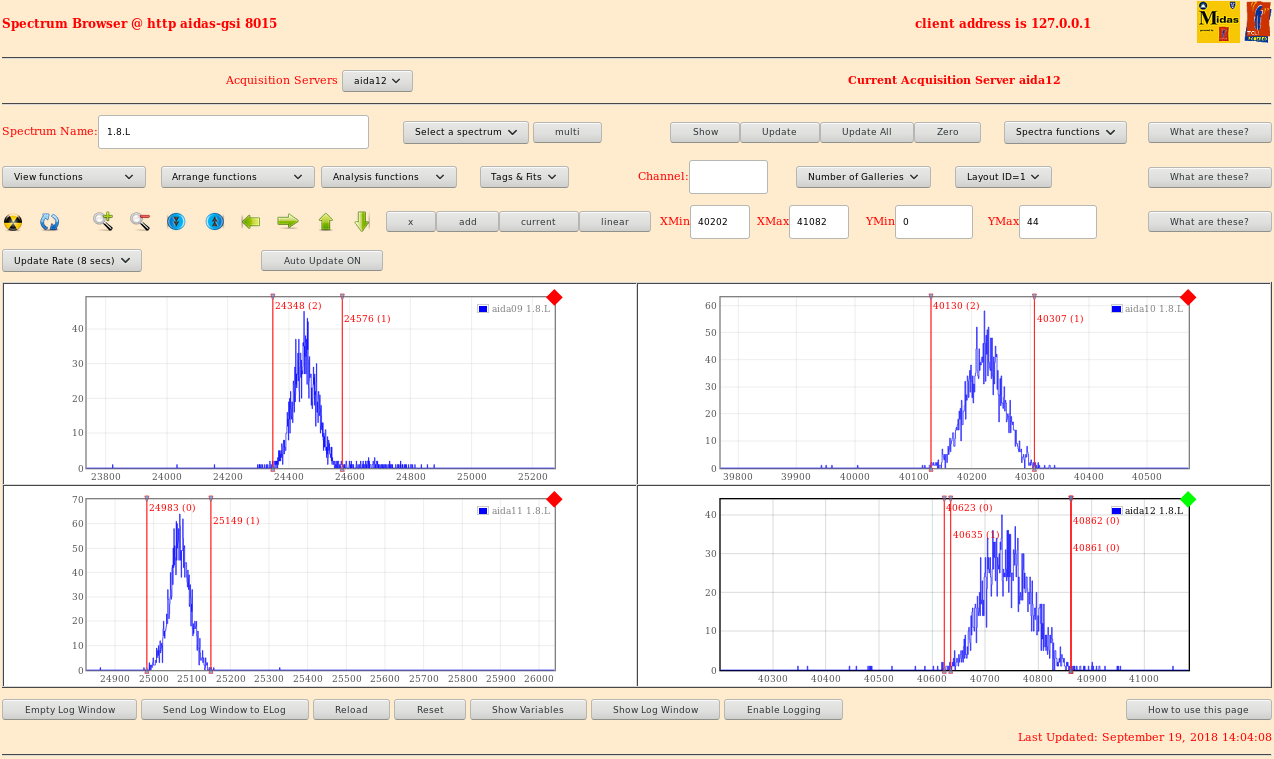
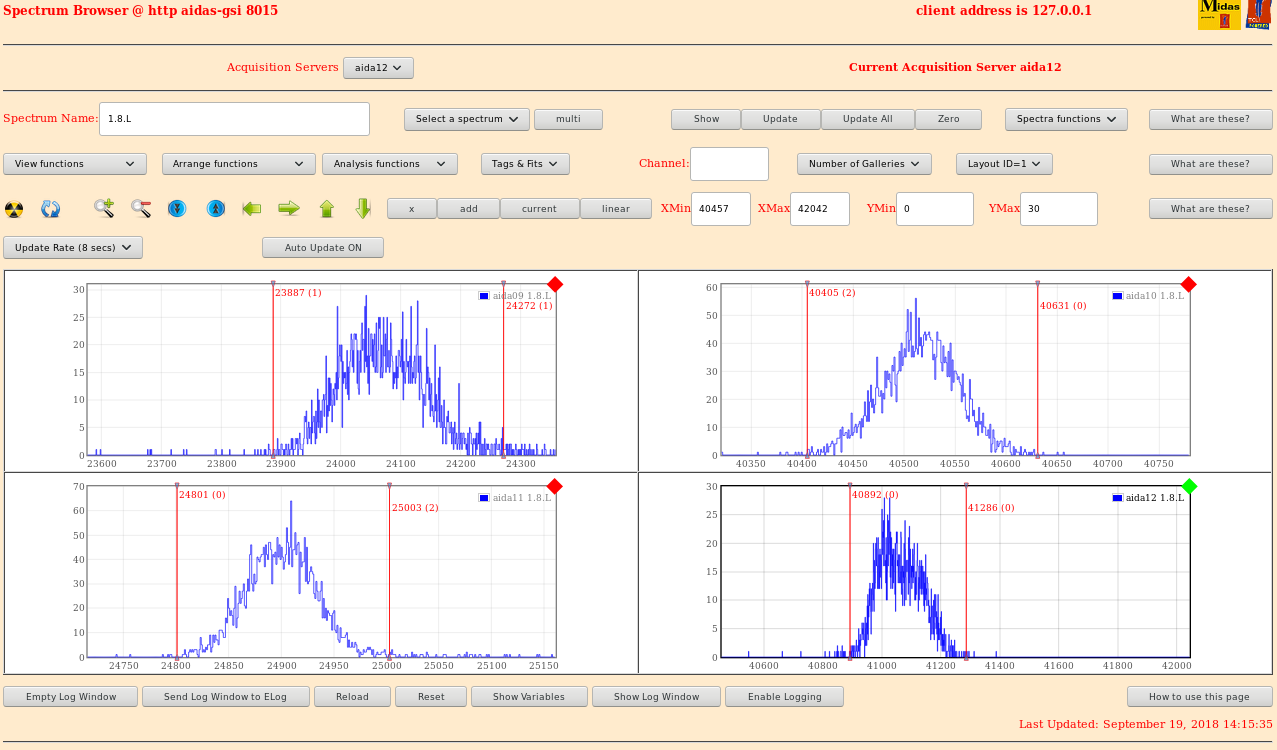
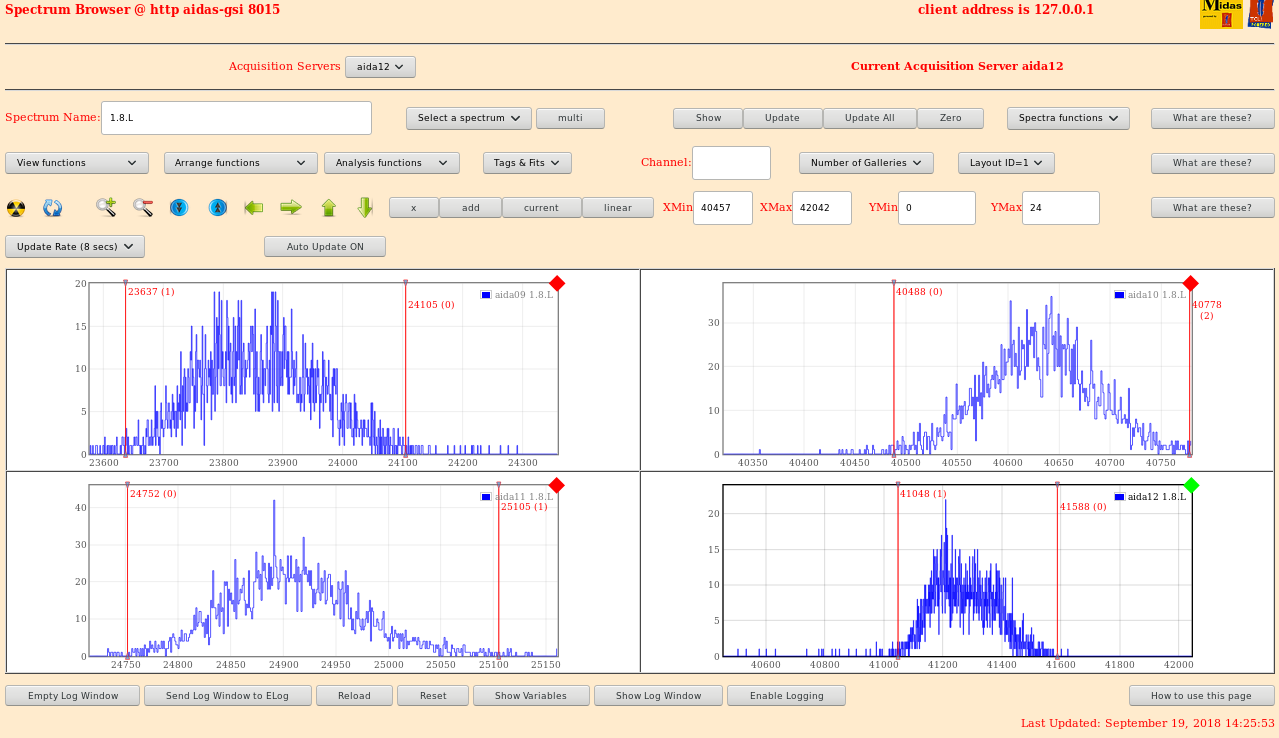
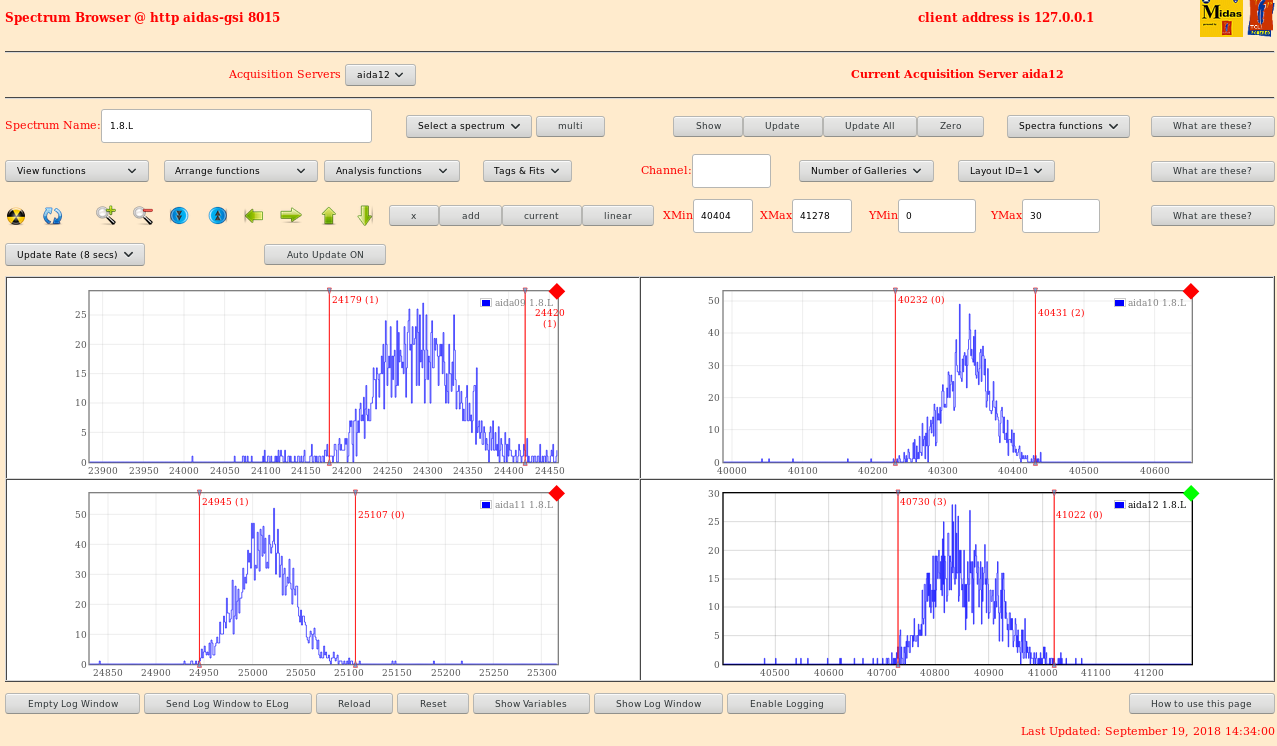
1.8.l Spectra - attachment 5
FEEs 10 and 11 around 60FWHM and 9 and 12 around 80-90FWHM
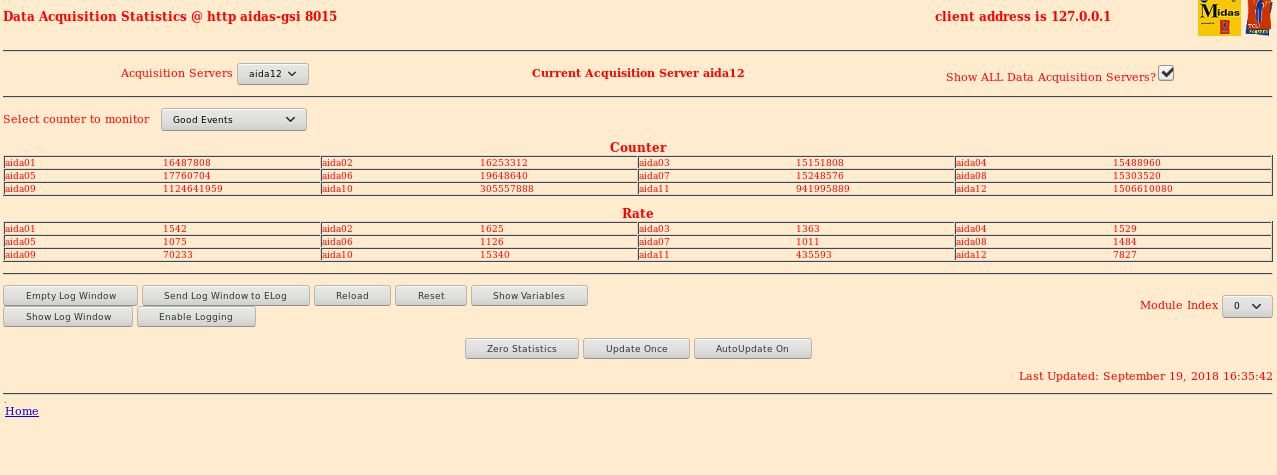
Stats page - attachment 6

Aluminium foil used to make sure all ports are light tight shows a stats drop of around half - attachment 8

New peak widths

aida09 - 79.65
aida10 - 67.37
aida11 - 59.99
aida12 - 97.83

Going to begin a systematic study of shaping time

                              FWHM
Shaping Time   aida09   aida10   aida11   aida12

     8          79.65   67.37    59.99     97.83
     7          97.55   70.84    62.67     115.34
     6         100.72   70.04    62.77     120.05
     4         147.47   80.64    71.34     167.23
     2         217.62   114.98   133.35    232.47

Shaping time 8us 1.8.L Shots
Shaping time 4us Stats appear obviously worse - attachment 7
                 1.8.L Widths - attachment 8
Shaping time 2us Stats appear worse again - attachment 9
                 1.8.L Widths - attachment 10
Shaping time 6us Stats are better than 2 and 4 - attachment 11
                 1.8.L widths - attachment 12
Shaping time 7us Stats are better than 6 - attachment 13
                 1.8.L widths - attachment 14


8us is the optimum shaping time.
Taken back to 8us and similar shaping times are observed.

Connected the ground of all 4 adapter boards with direct cables. Observed improvements in both FEEs 9 and 12
however the noise in 11 went
through the roof >500kHz - attachment 15

Tested just having 9,10 and 12 connected the rates are comparable to when disconnected - attachment 16

All 4 grounded together with a ground running to the snout as well stats No difference to all 4 together -
attachment 17
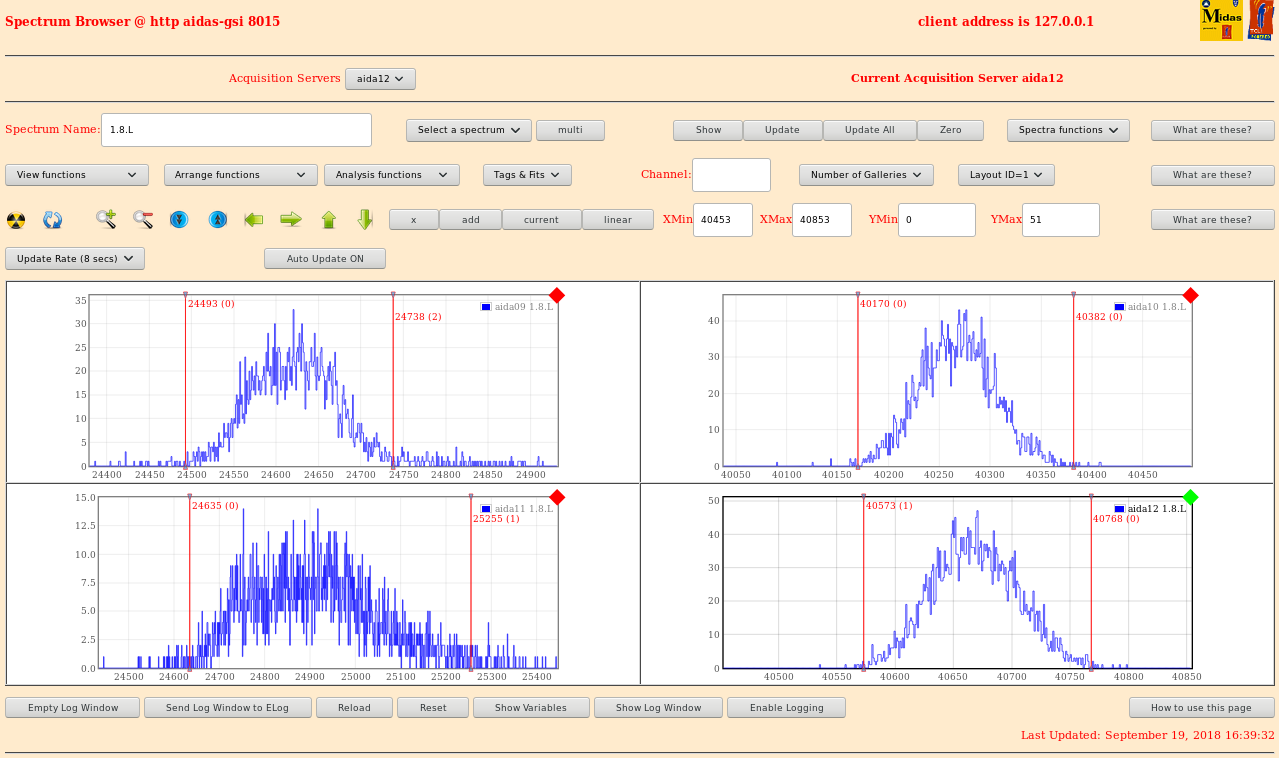
              1.8.L Widths - attachment 17
aida09 104.76
aida10 84.58
aida11 281.77
aida12 82.58

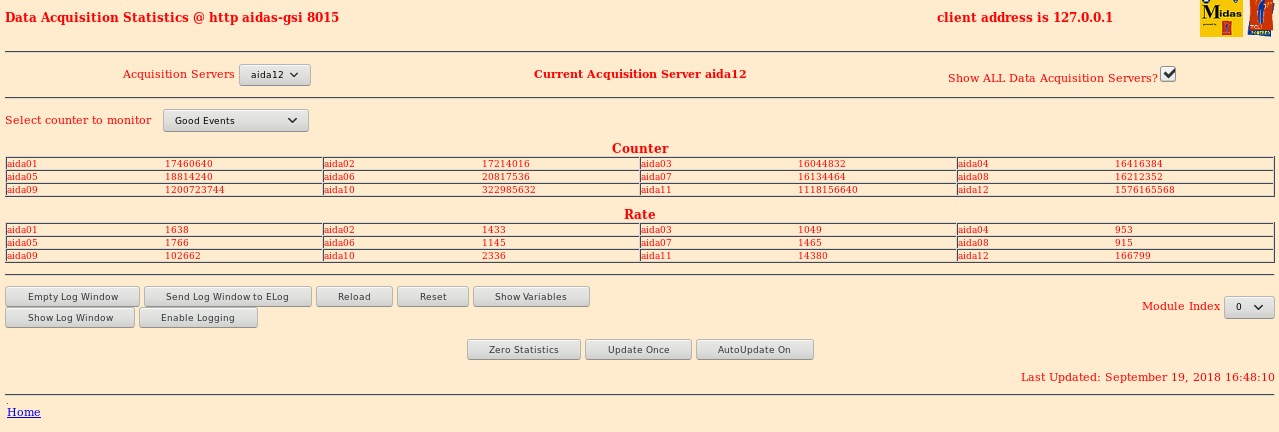
Tested just having 10 and 12 directly connected. Same side of the DSSD: Noise is the same as when disconnected.
Stats - attachment 19
1.8.L spectra - attachment 20

aida09 107.13
aida10 67.02
aida11 66.78
aida12 131.51

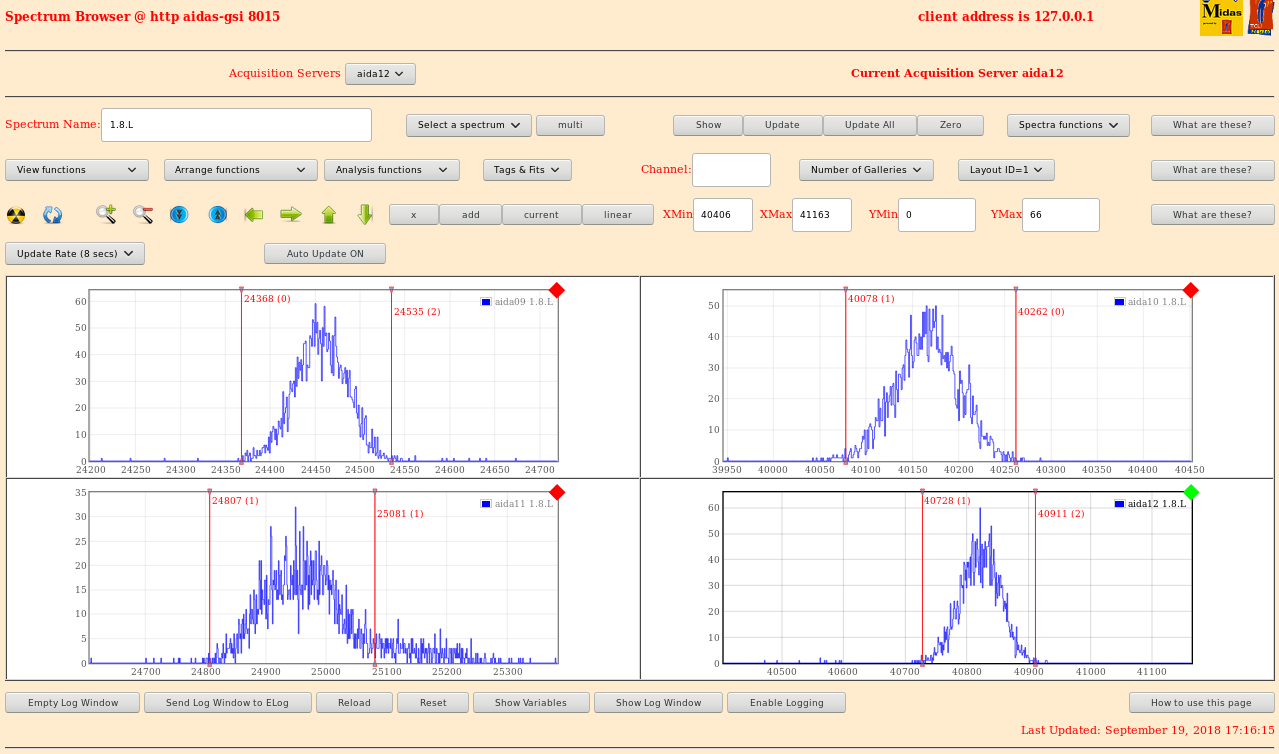
Tested having 11 and 12 connected directly. This is the two adapter boards responsible for the bias with 11
carrying the core and 12 the braid.
Massively reduced noise in 9 and 12, comparable noise in 10 but much more noise in 11. Stats - attachment 21
aida09 63.96
aida10 76.64
aida11 125.96
aida12 68.05
1.8.L spectra - attachment 23


18:39 Alpha run started in /TapeData/Sep18/R2
      Writing at 96kb/s
      11 Was fast at start bus asic control brought it down
|
| Attachment 1: 180919_1447_7us_1_8_L.png
|
|
| Attachment 2: 180919_1607_FEEsConnected.png
|

|
| Attachment 3: 180919_1635_StatsSnoutGrnd.png
|
|
| Attachment 4: 8_L_SnoutGround.png
|
|
| Attachment 5: 180919_1648_12and10Connect_Stats.png
|
|
| Attachment 6: 180919_1656_10and12_1_8_L.png
|
|
| Attachment 7: 180919_1710_11and12_Stats.png
|

|
| Attachment 8: 180919_1717_11and12_1_8_L.png
|
|
| Attachment 9: 180919_1310_Rate.png
|

|
| Attachment 10: 180919_1312_aida10W.png
|

|
| Attachment 11: 180919_1312_aida11W.png
|

|
| Attachment 12: 180919_1314_aida12W.png
|
|
| Attachment 13: 8_L.png
|
|
| Attachment 14: 180919_1324_8usStats.png
|

|
| Attachment 15: 180919_1346_4usStats.png
|

|
| Attachment 16: 180919_1404_8us_1_8_L.png
|
|
| Attachment 17: 180919_1416_4us_1_8_L.png
|
|
| Attachment 18: 180919_1419_2usStats.png
|

|
| Attachment 19: 180919_1426_2us_1_8_L.png
|
|
| Attachment 20: 180919_1429_6usStats.png
|

|
| Attachment 21: 180919_1438_6us_1_8_L.png
|
|
|
|
214
|
Sat Apr 10 12:15:54 2021 |
OH, TD | Saturday 10 April |
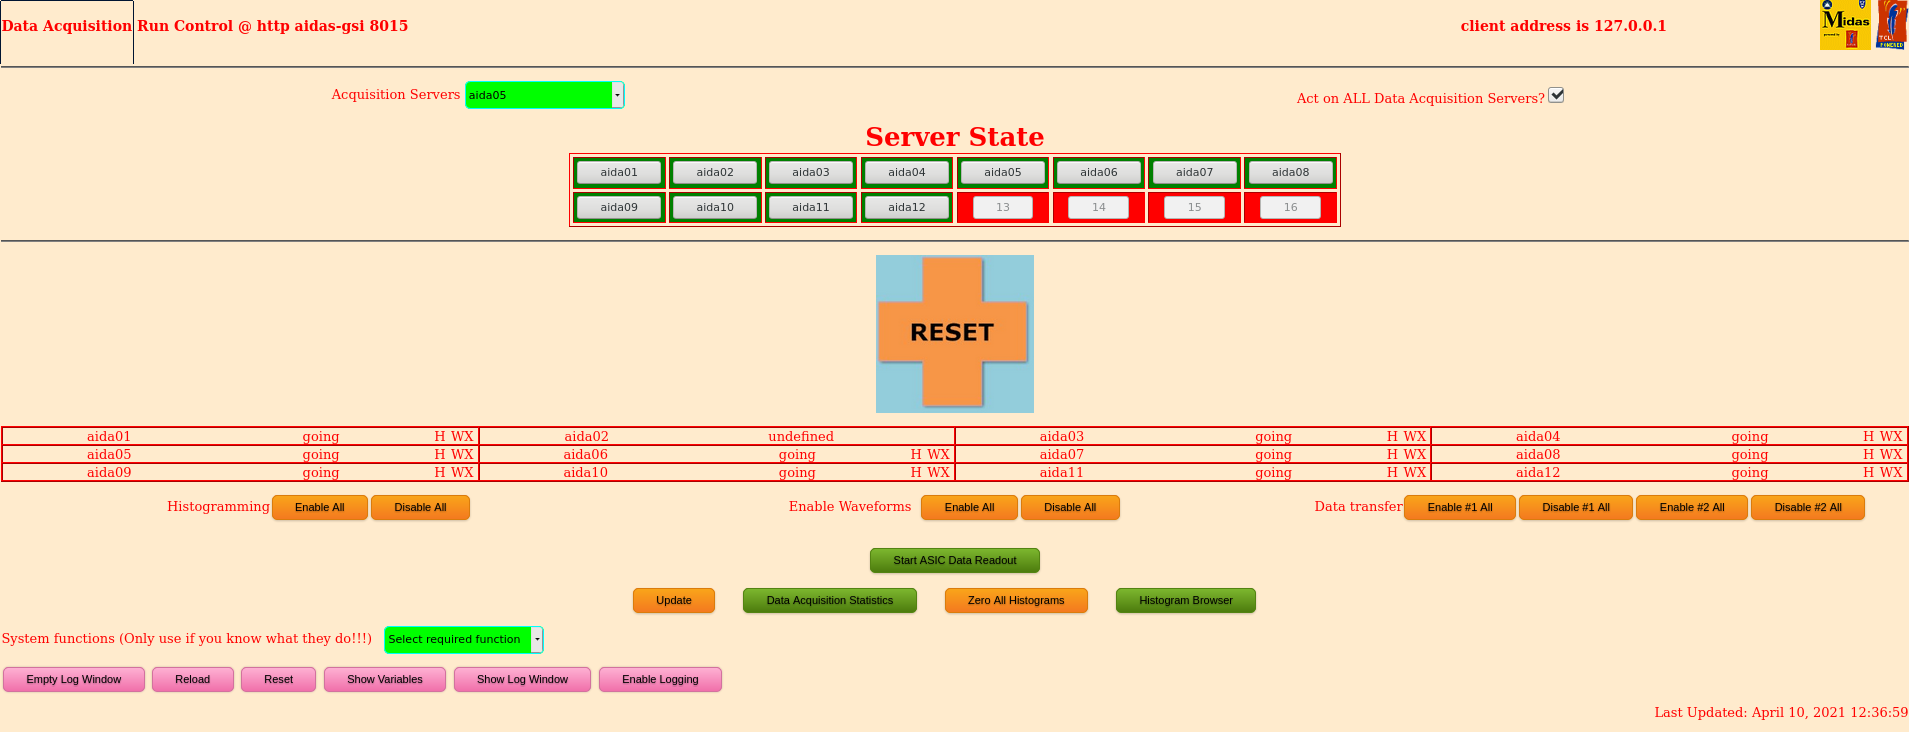
12:37 DAQ found crashed. Had crashed at some time following 7:50am following previous statistics update
      Unable to recover the FEEs so forced to power cycle
      Following power cycle statistics much improved from yesterday.
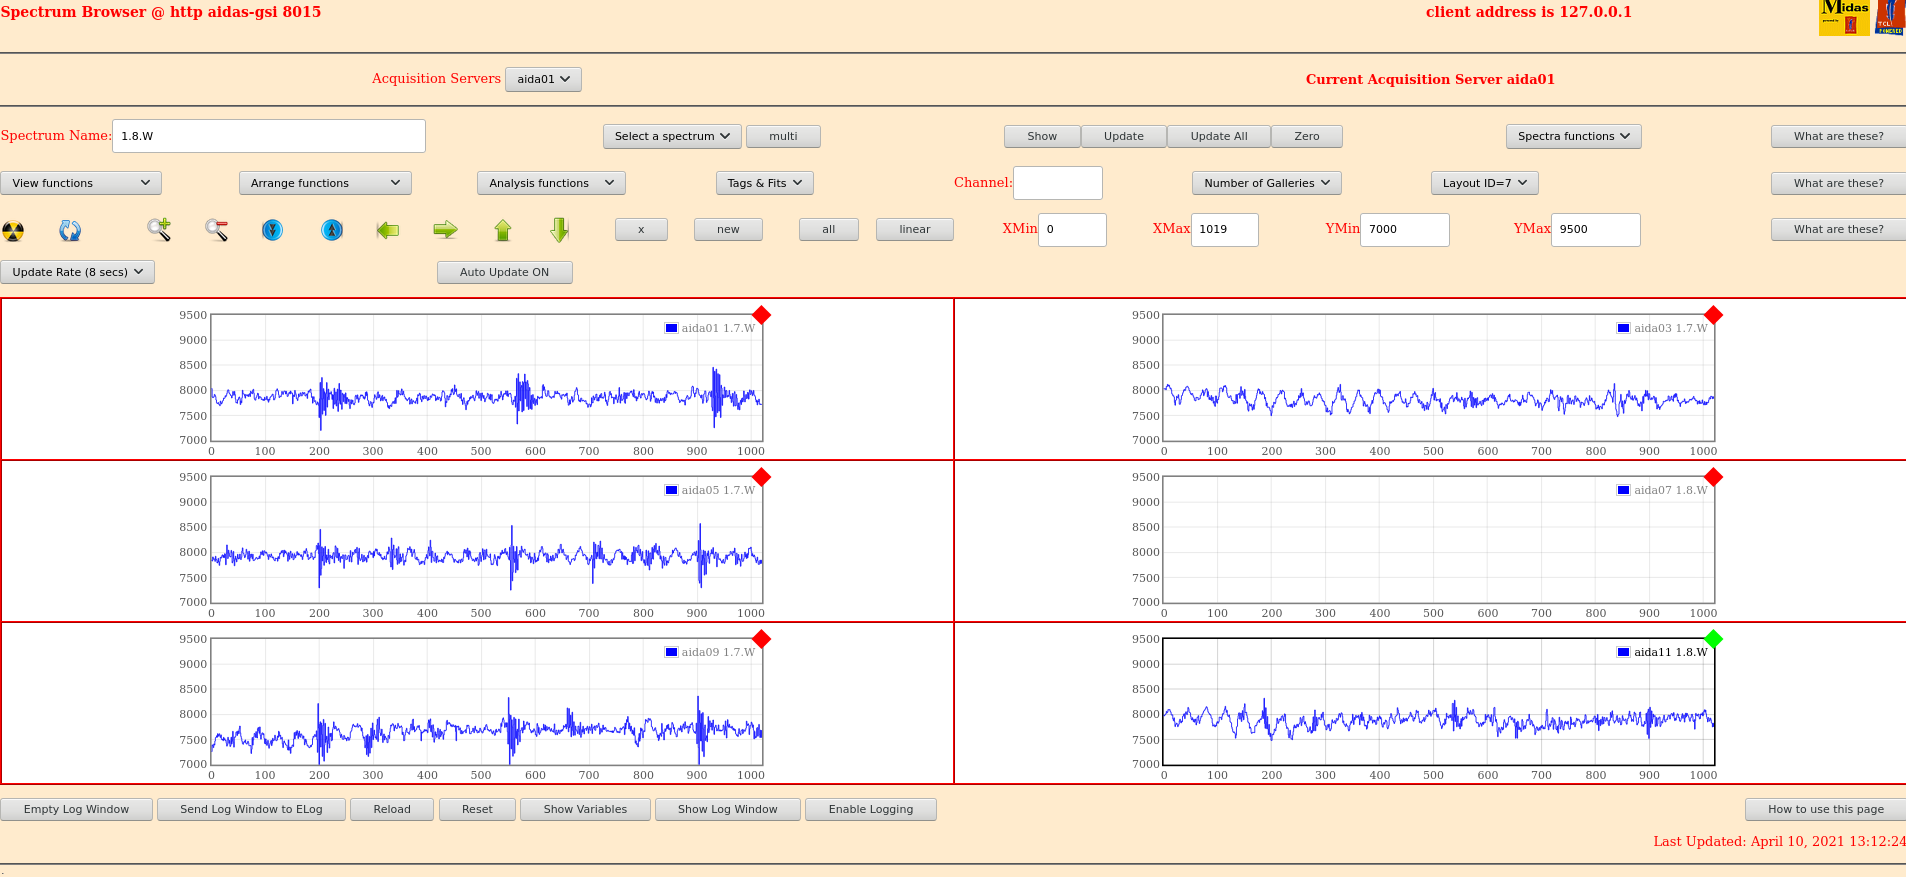
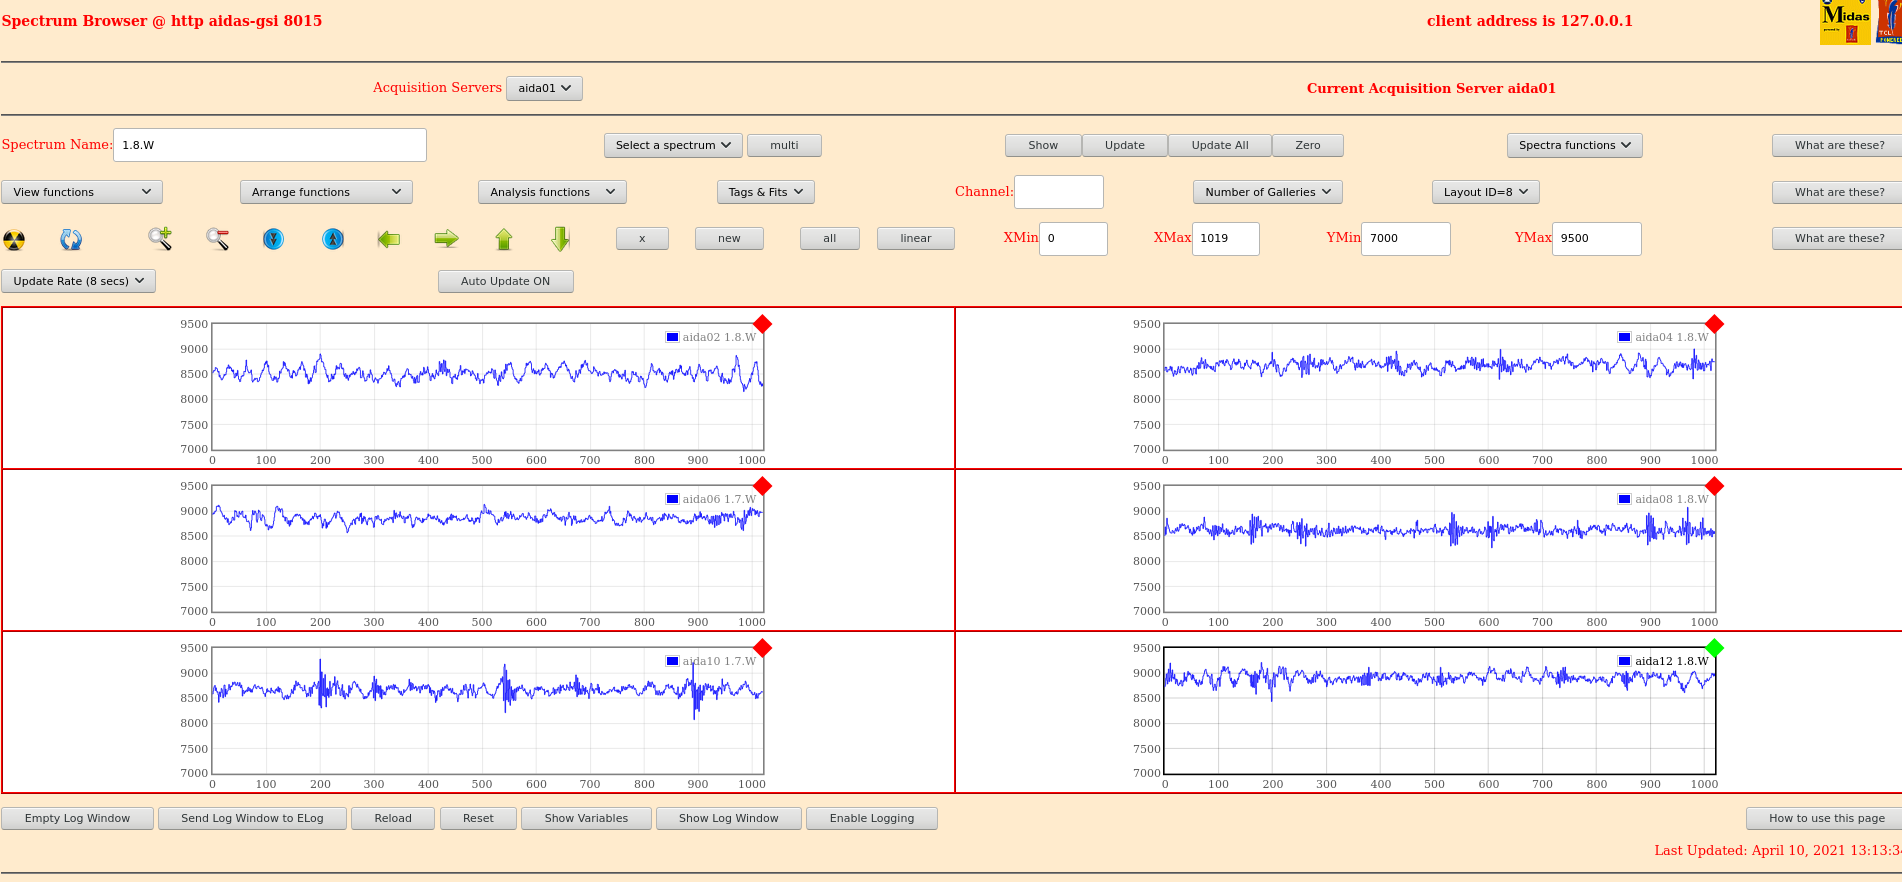
      In the waveforms the lower frequency component that was prevalent yesterday is no longer visible.
      The waveforms are not perfect by any means though
      Also note that following an ASIC synchronisation all of the FEEs lose ADC calibration and must be manually recalibrated.

16.42 UTC+1

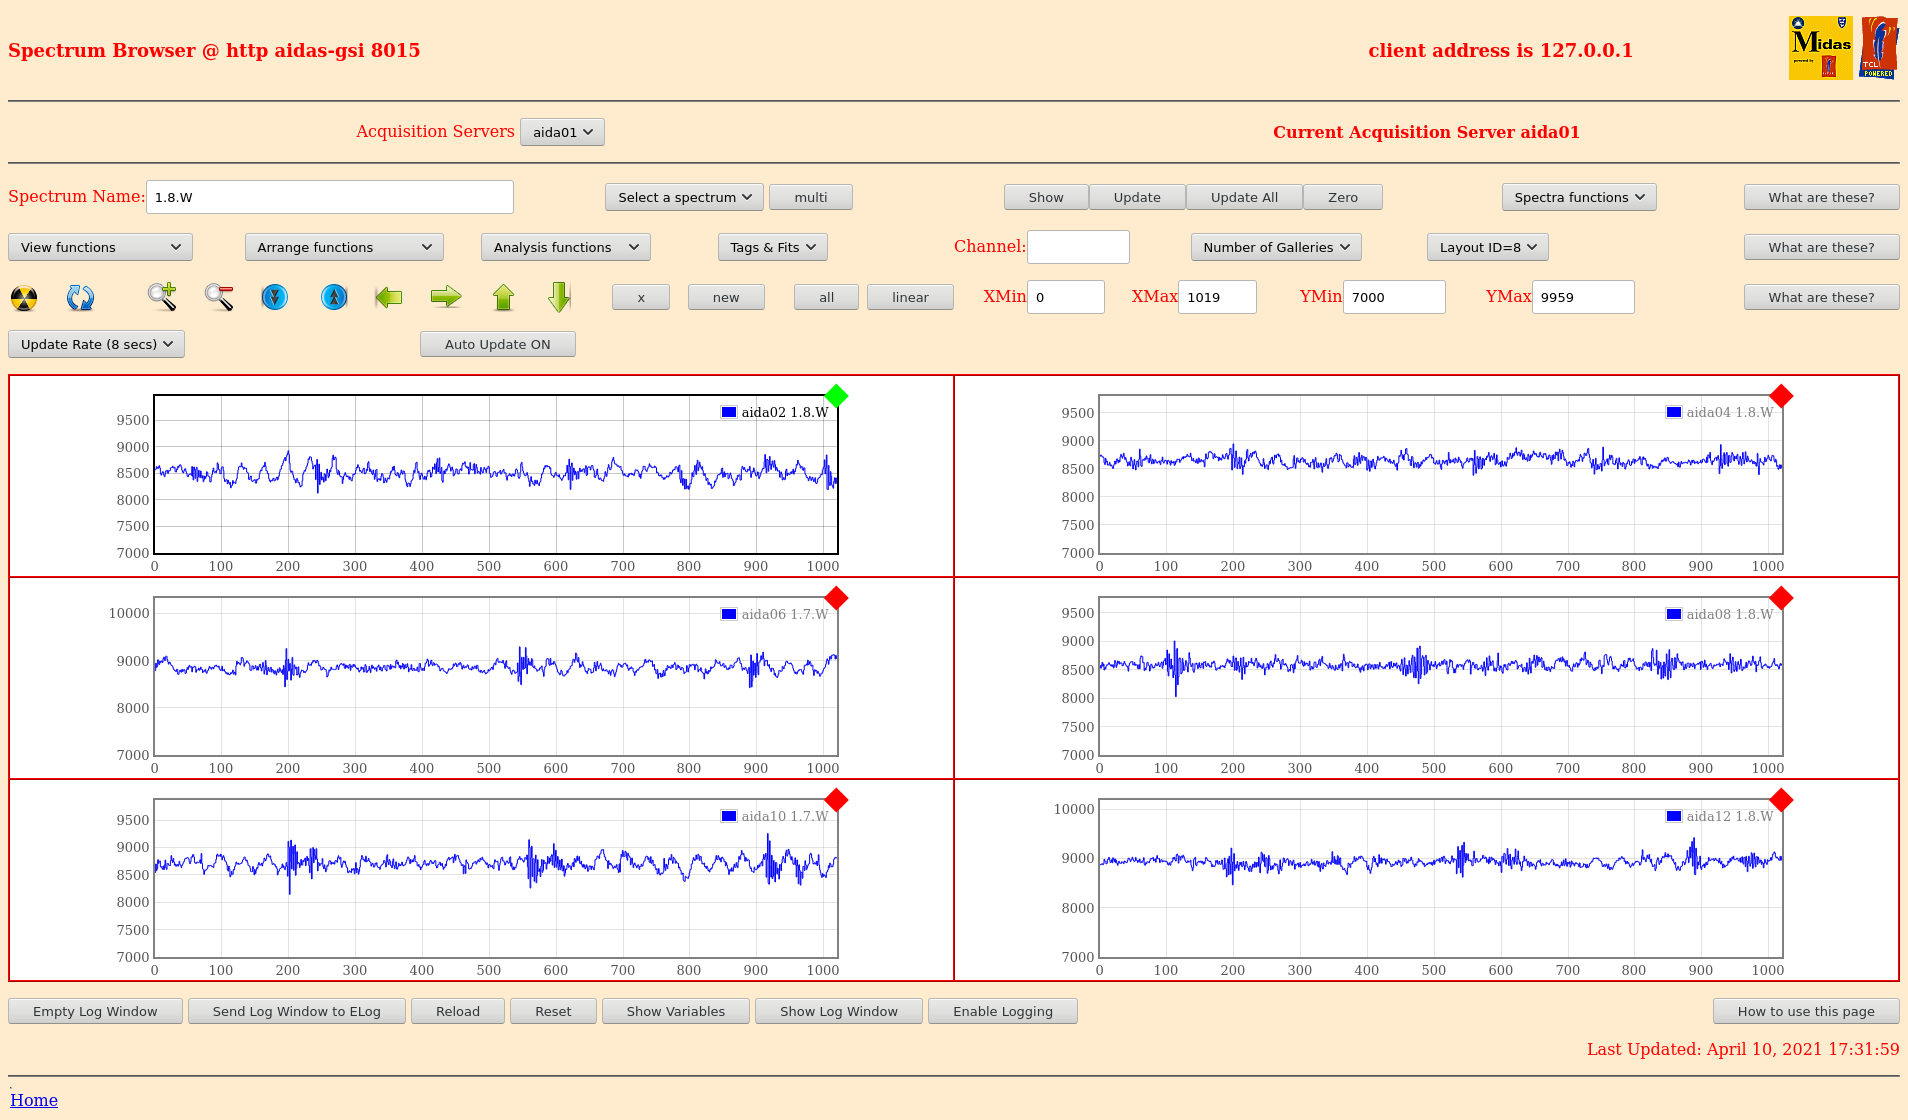
      per FEE64 1.8.W spectra

      20us FSR attachments 7 & 8
      200us FSR attachments 9 & 10
      2ms FSR attachments 11 & 12
      20ms FSR attachments 15 & 16


      rate spectra attachment 13
good events statistics attachment 14 |
| Attachment 1: 210410_1237_Aida_crash.png
|
|
| Attachment 2: 210410_1242_Crash.png
|

|
| Attachment 3: 210410_1251_aida06_drop.png
|

|
| Attachment 4: 210410_1312_Waveform1.png
|
|
| Attachment 5: 210304_1313_Waveform2.png
|
|
| Attachment 6: 210410_1318_Stats.png
|

|
| Attachment 7: Screenshot_2021-04-10_Spectrum_Browser_aidas-gsi.png
|
|
| Attachment 8: Screenshot_2021-04-10_Spectrum_Browser_aidas-gsi(5).png
|
.png.png)
|
| Attachment 9: Screenshot_2021-04-10_Spectrum_Browser_aidas-gsi(1).png
|
.png.png)
|
| Attachment 10: Screenshot_2021-04-10_Spectrum_Browser_aidas-gsi(4).png
|
.png.png)
|
| Attachment 11: Screenshot_2021-04-10_Spectrum_Browser_aidas-gsi(2).png
|
.png.png)
|
| Attachment 12: Screenshot_2021-04-10_Spectrum_Browser_aidas-gsi(3).png
|
.png.png)
|
| Attachment 13: Screenshot_2021-04-10_Spectrum_Browser_aidas-gsi(6).png
|
.png.png)
|
| Attachment 14: Screenshot_2021-04-10_Statistics_aidas-gsi.png
|

|
| Attachment 15: Screenshot_2021-04-10_Spectrum_Browser_aidas-gsi(7).png
|
.png.png)
|
| Attachment 16: Screenshot_2021-04-10_Spectrum_Browser_aidas-gsi(8).png
|
.png.png)
|
|
|
291
|
Tue May 4 13:53:22 2021 |
OH, TD | Tuesday 4 May |
NH has re-checked alignment of AIDA adaptor PCBs cf. Elog:290

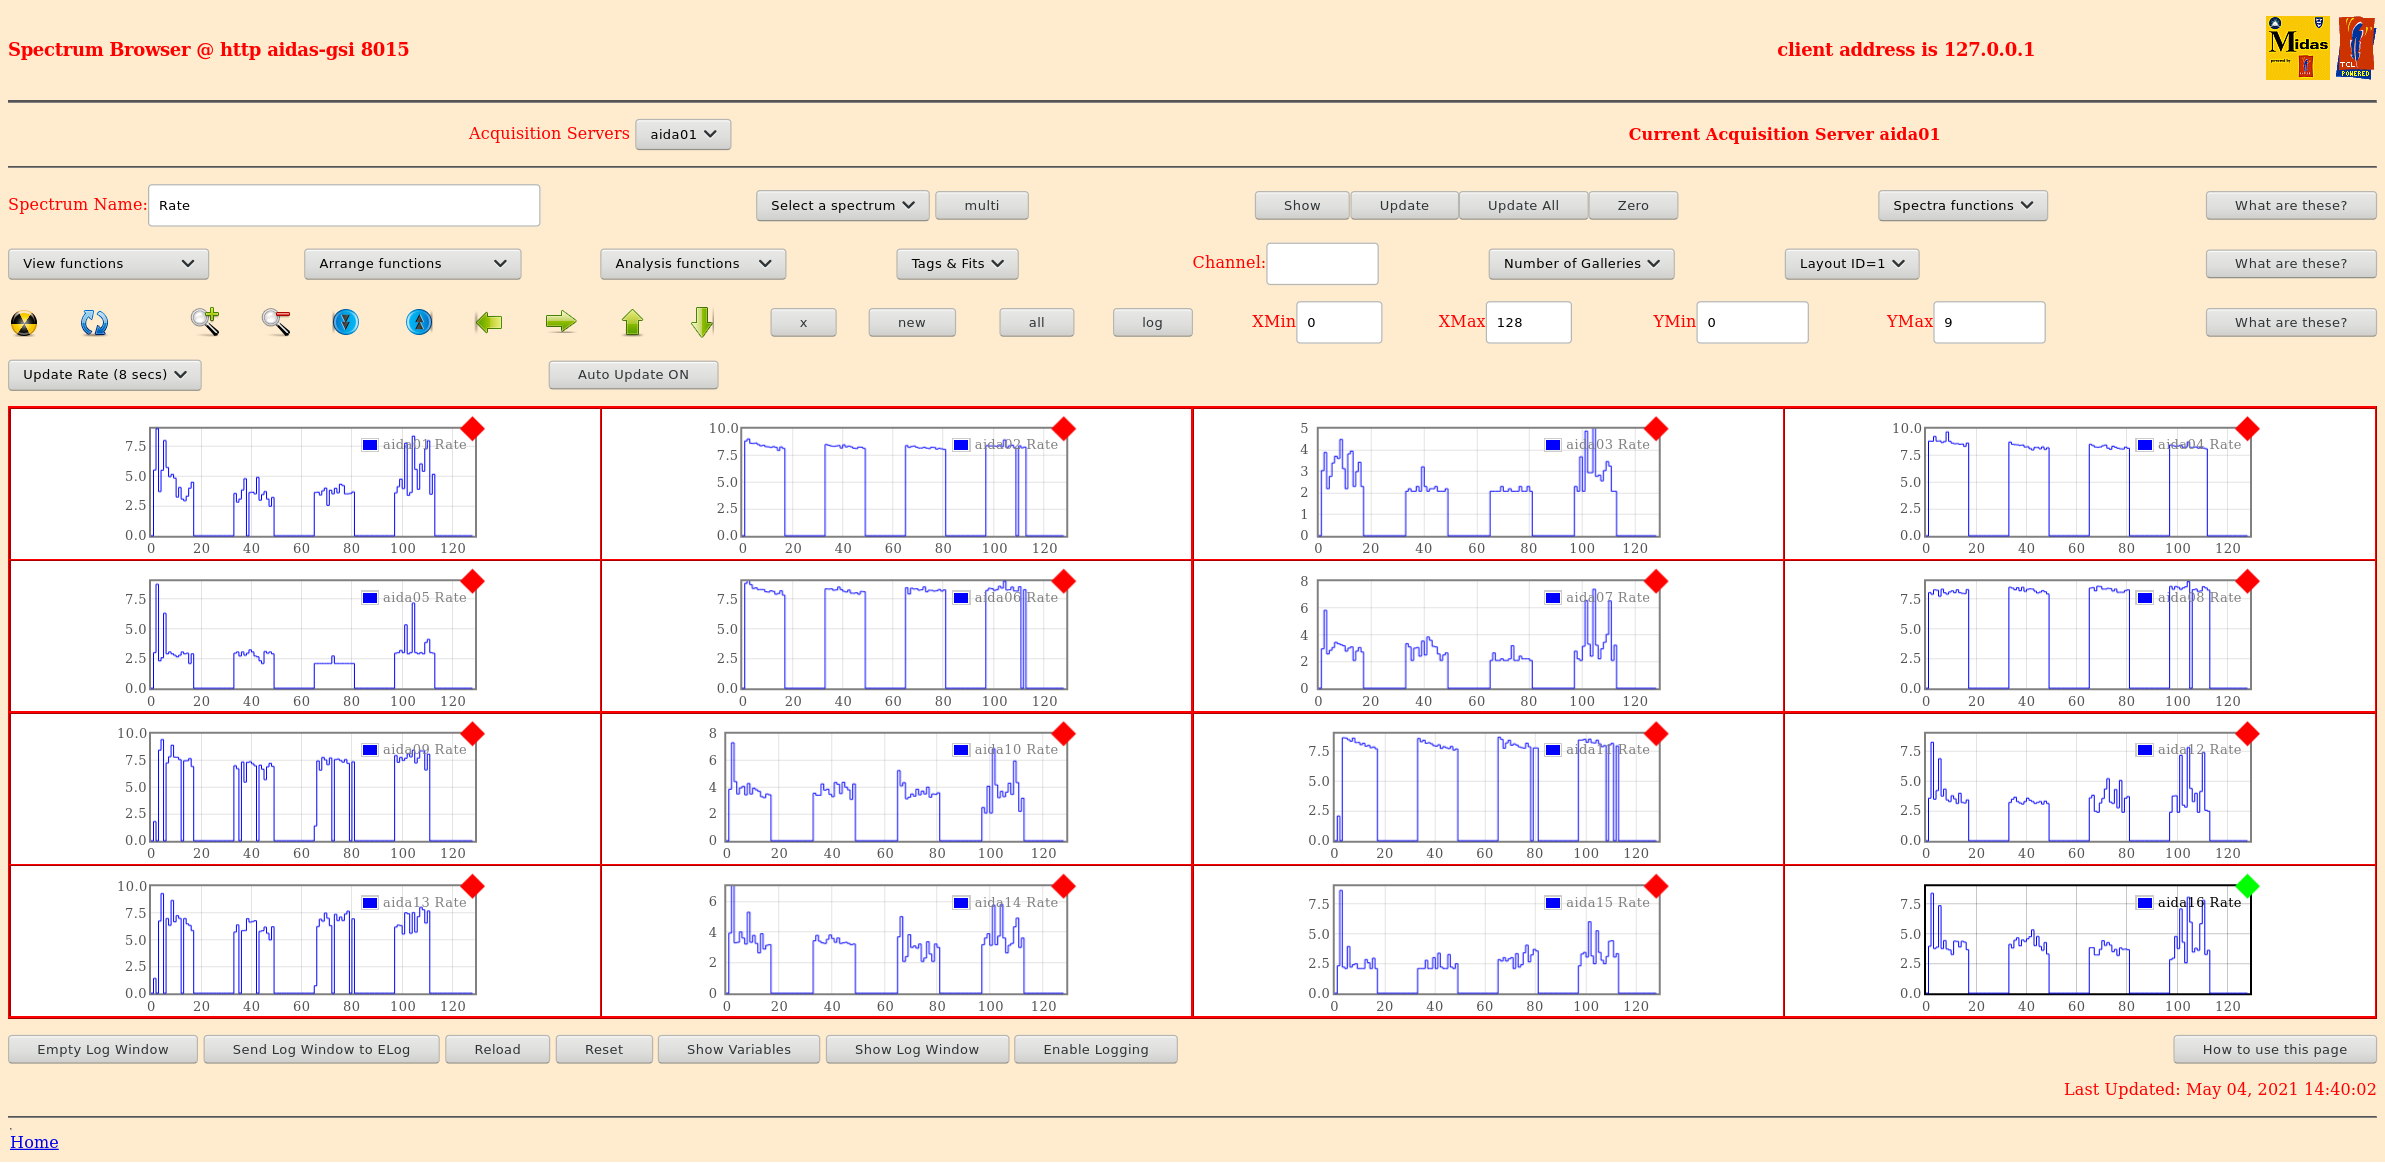
14.40 Rate spectra - attachment 1
      adc data items - attachment 2
       slow comparator 0xa
       stats for p+n much improved, n+n remain poor
      1.8.W spectra - attachments 3 & 4
      1.8.L spectra - attachments 5 & 6
       pulser peak widths aida01 69 ch FWHM, aida02 247 ch FWHM

17:31 Bias lowered to 100V on DSSD2 after noticing the leakage current has increased 2uA over the previous 3 hours. - attachment 7 |
| Attachment 1: Screenshot_2021-05-04_Spectrum_Browser_aidas-gsi.png
|
|
| Attachment 2: Screenshot_2021-05-04_Statistics_aidas-gsi.png
|

|
| Attachment 3: Screenshot_2021-05-04_Spectrum_Browser_aidas-gsi(1).png
|
.png.png)
|
| Attachment 4: Screenshot_2021-05-04_Spectrum_Browser_aidas-gsi(2).png
|
.png.png)
|
| Attachment 5: Screenshot_2021-05-04_Spectrum_Browser_aidas-gsi(3).png
|
.png.png)
|
| Attachment 6: Screenshot_2021-05-04_Spectrum_Browser_aidas-gsi(4).png
|
.png.png)
|
| Attachment 7: 210504_Leakage.png
|

|
|
|
341
|
Fri May 21 07:03:50 2021 |
OH, TD | Friday 21 May 08:00-16:00 |
08:00 OH and TD take over
      Current settings p+n sides at 0xc
      DSSD1 n+n sides 0x20 on ASICs 1-3 and 0x64 on ASIC 4
      DSSD2 n+n sides 0x1b on ASICs 1-3 and 0x64 on ASIC 4

       PULSER SETTINGS
      ---------------------------
       Pulse is ON
       Positive Tail Pulse
       Trigger Source is Internal Clock
       Trigger Threshold is 3.5
       Amplitude   : 2.0 Volts
       Rep Rate    : 2.0 hZ
       Delay       : 250.0 ns
       Fall Time   : 1 ms
       Attenuation : 1
       Display is  : Volts
       Equivalent keV is : 200.0
       Ramp Start at 0.01 Volts
       Ramp Stop  at 9.99 Volts
       Ramp Start at 1.0 keV
       Ramp Stop  at 999.0 keV
       Ramp Time  is 60 seconds
       # Ramp Cycles is 1

08:29 System wide checks ok - WR difference at 111
      Statistics ok (Still high following the sharp rise at 18:30 yesterday) - attachment 1
      Temperature ok - attachment 2
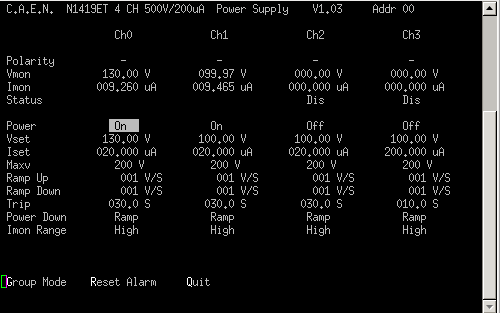
      Bias and leakage current ok - attachment 3

09:58 System wide checks ok - WR difference at 111
      Statistics ok - attachment 4
      Temperature ok - attachment 5
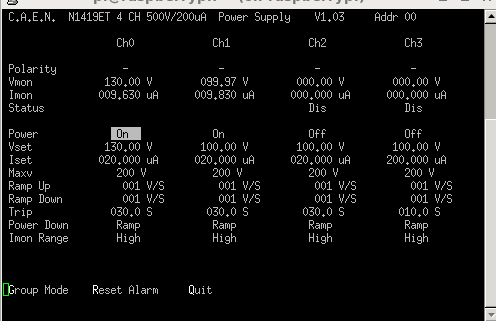
      Bias and leakage current ok - attachment 6

      Max deadtime this morning has been around 5.5% on FEE8

12:32 System wide checks ok - WR difference at 111
      Statistics ok - attachment 7
      Temperature ok - attachment 9
Bias and leakage current ok - attachment 8 |
| Attachment 1: 210521_0829_Stats.png
|

|
| Attachment 2: 210521_0829_Temp.png
|

|
| Attachment 3: 210521_0830_Bias.png
|
|
| Attachment 4: 210521_0957.png
|

|
| Attachment 5: 210521_0957_Temp.png
|

|
| Attachment 6: 210521_0958_Bias.png
|
|
| Attachment 7: 210521_1232_Stats.png
|

|
| Attachment 8: 210521_1233_Bias.png
|

|
| Attachment 9: 210521_1233_Temp.png
|

|
|
|
353
|
Wed Jun 2 14:53:05 2021 |
OH, TD | Merger/Tapeserver issues after reboot of aida-3 |
On 01/06/21 aida-3 was rebooted as the graphical user interface had frozen.
We were also unable to connected to MIDAS via ssh port forwarding.

Since the restart we have been unable to write to file.

The tapeserver will allocate/mount/open a file but nothing will be written to it.
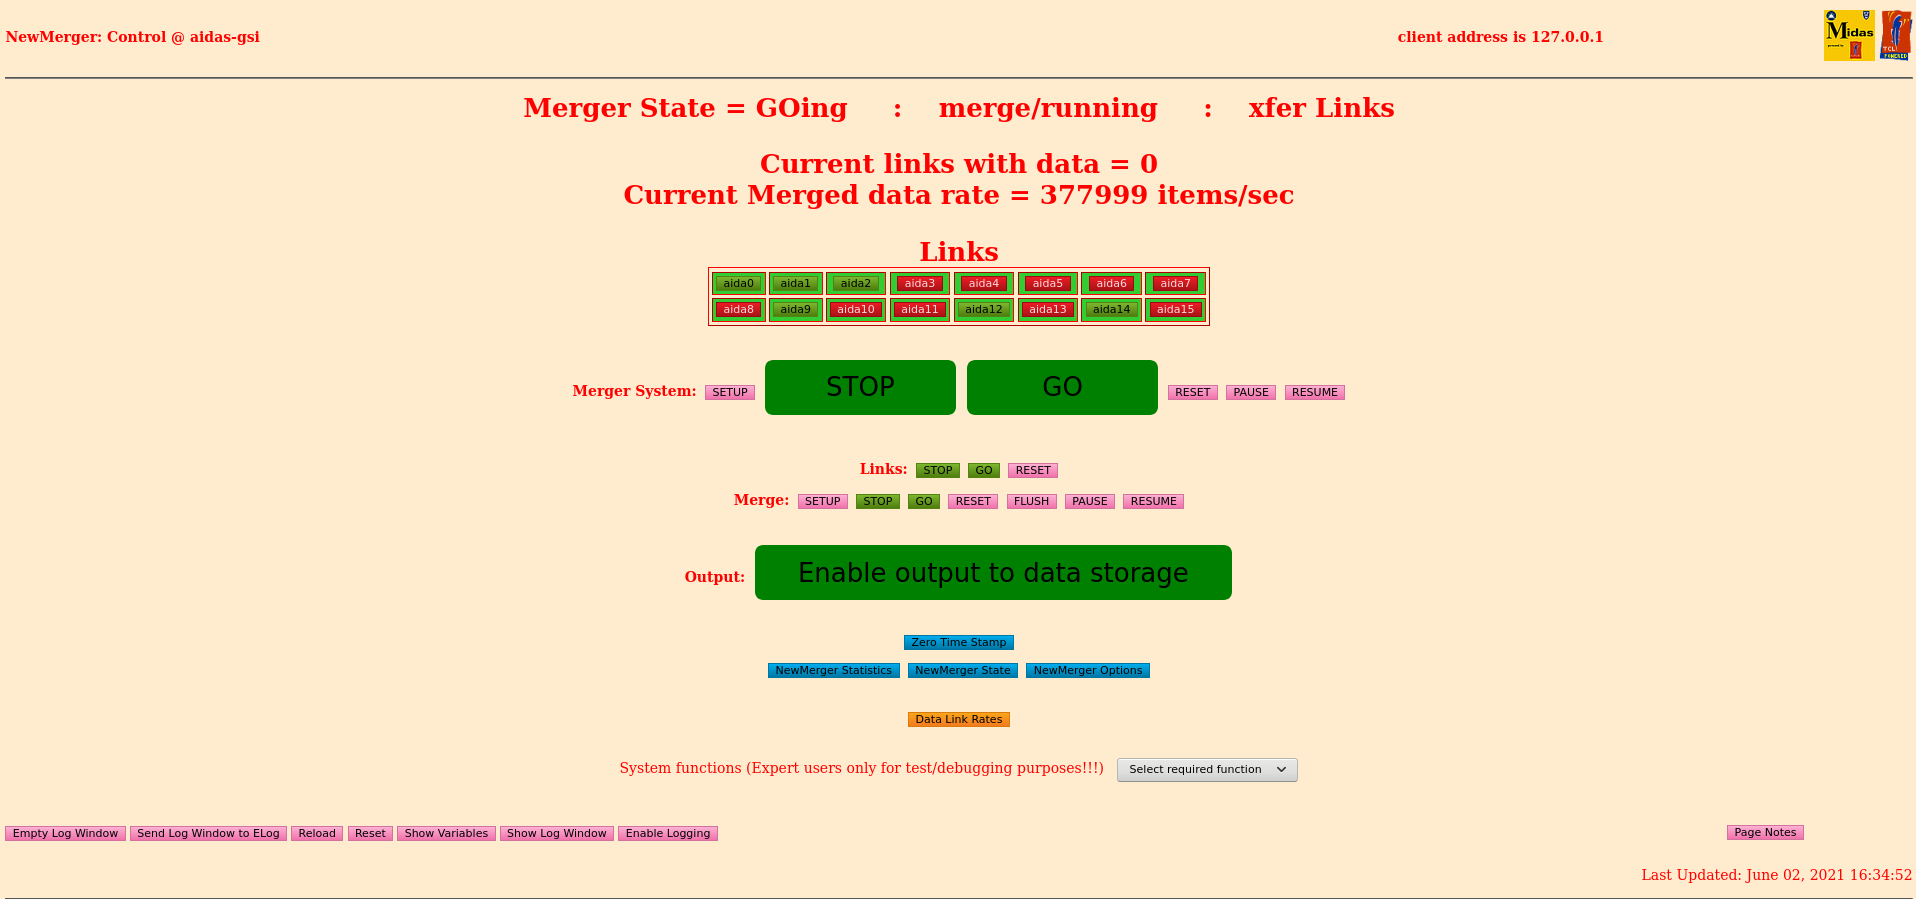
The merger will be receiving data but never shows as having any "Current links with data".

/MIDAS currently points to lrwxrwxrwx. 1 root root 45 Jan 23  2019 /MIDAS -> /home/npg/MIDAS_Releases/23Jan19/MIDAS_200119

The current disk structure is:
[npg@aidas-gsi npg]$ lsblk
NAME   MAJ:MIN RM   SIZE RO TYPE MOUNTPOINT
sr0     11:0    1  1024M  0 rom
sdb      8:16   0   7.3T  0 disk
├─sdb1   8:17   0   200M  0 part
├─sdb2   8:18   0   500M  0 part
└─sdb3   8:19   0   7.3T  0 part
  ├─vg_aidas2-lv_root (dm-2)
       253:2    0    50G  0 lvm
  ├─vg_aidas2-lv_home (dm-3)
       253:3    0   7.2T  0 lvm  /media/1e121361-83d3-4825-b6ae-8700b07e0ca7
  └─vg_aidas2-lv_swap (dm-4)
       253:4    0   7.8G  0 lvm
sdc      8:32   0   7.3T  0 disk
└─sdc1   8:33   0   7.3T  0 part /media/ThirdDrive
sdd      8:48   0   7.3T  0 disk
└─sdd1   8:49   0   7.3T  0 part /media/SecondDrive
sda      8:0    0 465.8G  0 disk
├─sda1   8:1    0   200M  0 part /boot/efi
├─sda2   8:2    0   500M  0 part /boot
└─sda3   8:3    0 465.1G  0 part
  ├─vg_aidasgsi-lv_root (dm-0)
       253:0    0    50G  0 lvm  /
  ├─vg_aidasgsi-lv_swap (dm-1)
       253:1    0   7.8G  0 lvm  [SWAP]
  └─vg_aidasgsi-lv_home (dm-5)
       253:5    0 407.3G  0 lvm  /home


Terminal outputs for the HTTPd, Merger and TapeServer terminals - attachments 1-3

TapeServer config file - attachment 4
Merger options - attachment 5

Note in the merger window the top bar is different to what we have seen previously - Attachment 6 and https://elog.ph.ed.ac.uk/DESPEC/210418_124830/51.png |
| Attachment 1: 210602_MergerTape_HTTPd_Startup
|
tidy up
tclsh8.5_copy2: no process killed

System identified is CPU x86_64; Platform is unix; OS is Linux and Version is 2.6.32-696.el6.x86_64
Environment selected is CPU x64_64; Platform unix; OS Linux64 and Operating System Linux64
MIDASBASE = /MIDAS and MIDAS_LIBRARY = /MIDAS/TclHttpd/Linux64
PATH = /MIDAS/bin_Linux64:/MIDAS/TclHttpd/Linux64:/MIDAS/Linux/bin64:/usr/lib64/qt-3.3/bin:/usr/local/bin:/usr/bin:/bin:/usr/local/sbin:/usr/sbin:/sbin:/home/npg/bin
Computer Name = aidas-gsi; Temp Directory = /tmp/tcl25624
package limit is not available: can't find package limit
Running with default file descriptor limit
package setuid is not available: can't find package setuid
Could not change to user 50 group 50: not owner
/debug user "debug" password "z5y30nlwy2e4"
httpd started on port 8115

Custom startup from /MIDAS/config/TclHttpd/aidas-gsi@8115/startup.tcl
/DataBaseAccessServer
/NetVarService
/SigTaskService
Loaded MemSasAccess
/SpectrumService
/TapeServer
loading tcl/NewMergerControl.tcl for namespace ::
/DataAcquisitionControlServer
DefineMessage unknown
Run Control Server Implementation for MERGE
RunControlServer loaded
loading Html/RunControl/implementation.tcl
/MIDAS/TclHttpd/Html/RunControl/common.tcl returned z=1 and couldn't read file "/MIDAS/TclHttpd/Html/RunControl/common.tcl": no such file or directory
ReadRegister failed: Name=NetVar.EXEC.ID; Code= 0x10004; Info= Register name does not exist
Created UI registers
RunControl loaded
loading Html/NewMerger/RunControl/implementation.tcl for namespace ::
ReadRegister failed: Name=NetVar.MERGE.ID; Code= 0x10004; Info= Register name does not exist
Created UI registers
NewMerge Control loaded
Completed custom startup from /MIDAS/TclHttpd/Html/NewMerger/RunControl/stats.defn.tcl
Shared memory area located at 0x7f34d3028000
Tape Server comms table located at 0x7f34d3028000
MERGE command  30
setup MERGER
Stop Merge
Halt (1)
Action has completed: MergeCommand 2 Halt
Setup Merge
Setup (1)
Action has completed: MergeCommand 1 Setup
MERGE command  32
go MERGER
Go Merge
Go (1)
Action has completed: MergeCommand 3 Go
link 0 GO (1)
Action has completed: MergeCommand 22 {link 0 GO} 0 2
link 1 GO (1)
Action has completed: MergeCommand 22 {link 1 GO} 1 2
link 2 GO (1)
Action has completed: MergeCommand 22 {link 2 GO} 2 2
link 3 GO (1)
Action has completed: MergeCommand 22 {link 3 GO} 3 2
link 4 GO (1)
Action has completed: MergeCommand 22 {link 4 GO} 4 2
link 5 GO (1)
Action has completed: MergeCommand 22 {link 5 GO} 5 2
link 6 GO (1)
Action has completed: MergeCommand 22 {link 6 GO} 6 2
link 7 GO (1)
Action has completed: MergeCommand 22 {link 7 GO} 7 2
link 8 GO (1)
Action has completed: MergeCommand 22 {link 8 GO} 8 2
link 9 GO (1)
Action has completed: MergeCommand 22 {link 9 GO} 9 2
link 10 GO (1)
Action has completed: MergeCommand 22 {link 10 GO} 10 2
link 11 GO (1)
Action has completed: MergeCommand 22 {link 11 GO} 11 2
link 12 GO (1)
Action has completed: MergeCommand 22 {link 12 GO} 12 2
link 13 GO (1)
Action has completed: MergeCommand 22 {link 13 GO} 13 2
link 14 GO (1)
Action has completed: MergeCommand 22 {link 14 GO} 14 2
link 15 GO (1)
Action has completed: MergeCommand 22 {link 15 GO} 15 2
Resume MERGER
|
| Attachment 2: 210602_NewMerger_Startup
|
Tidy up
MERGE: no process killed
merge64.AD: no process killed
Starting New Merger

[1] 25659
MERGE Master (25659): Message logger not contacted.
MERGE Master (25659): MIDAS MERGE Server 64 bit Build May 11 2021  20:32:01
Creating NetVars
Creating NetVars complete
MERGE Master (25659): MIDAS MERGE Server 64 bit Build May 11 2021  20:32:01
MERGE Master (25659): Configuration: TCP port base=11001 ; SHM key=11000; ids=16; links=16; Hardware=0
MERGE Master (25659): File mapped object /SHM_11000 of size 536628 created
MERGE Master (25659): Memory mapping 536628 bytes
MERGE Master (25659): Shared memory segment located at address 0x7fc0a99b8000.
MERGE Master (25659): File mapped object /SHM_11001 of size 100669480 created
MERGE Master (25659): Memory mapping 100669480 bytes
MERGE Master (25659): Shared memory segment located at address 0x7fc0a39b6000.
MERGE Master (25659): File mapped object /SHM_11002 of size 100669480 created
MERGE Master (25659): Memory mapping 100669480 bytes
MERGE Master (25659): Shared memory segment located at address 0x7fc09d9b4000.
MERGE Master (25659): File mapped object /SHM_11003 of size 100669480 created
MERGE Master (25659): Memory mapping 100669480 bytes
MERGE Master (25659): Shared memory segment located at address 0x7fc0979b2000.
MERGE Master (25659): File mapped object /SHM_11004 of size 100669480 created
MERGE Master (25659): Memory mapping 100669480 bytes
MERGE Master (25659): Shared memory segment located at address 0x7fc0919b0000.
MERGE Master (25659): File mapped object /SHM_11005 of size 100669480 created
MERGE Master (25659): Memory mapping 100669480 bytes
MERGE Master (25659): Shared memory segment located at address 0x7fc08b9ae000.
MERGE Master (25659): File mapped object /SHM_11006 of size 100669480 created
MERGE Master (25659): Memory mapping 100669480 bytes
MERGE Master (25659): Shared memory segment located at address 0x7fc0859ac000.
MERGE Master (25659): File mapped object /SHM_11007 of size 100669480 created
MERGE Master (25659): Memory mapping 100669480 bytes
MERGE Master (25659): Shared memory segment located at address 0x7fc07f9aa000.
MERGE Master (25659): File mapped object /SHM_11008 of size 100669480 created
MERGE Master (25659): Memory mapping 100669480 bytes
MERGE Master (25659): Shared memory segment located at address 0x7fc0799a8000.
MERGE Master (25659): File mapped object /SHM_11009 of size 100669480 created
MERGE Master (25659): Memory mapping 100669480 bytes
MERGE Master (25659): Shared memory segment located at address 0x7fc0739a6000.
MERGE Master (25659): File mapped object /SHM_11010 of size 100669480 created
MERGE Master (25659): Memory mapping 100669480 bytes
MERGE Master (25659): Shared memory segment located at address 0x7fc06d9a4000.
MERGE Master (25659): File mapped object /SHM_11011 of size 100669480 created
MERGE Master (25659): Memory mapping 100669480 bytes
MERGE Master (25659): Shared memory segment located at address 0x7fc0679a2000.
MERGE Master (25659): File mapped object /SHM_11012 of size 100669480 created
MERGE Master (25659): Memory mapping 100669480 bytes
MERGE Master (25659): Shared memory segment located at address 0x7fc0619a0000.
MERGE Master (25659): File mapped object /SHM_11013 of size 100669480 created
MERGE Master (25659): Memory mapping 100669480 bytes
MERGE Master (25659): Shared memory segment located at address 0x7fc05b99e000.
MERGE Master (25659): File mapped object /SHM_11014 of size 100669480 created
MERGE Master (25659): Memory mapping 100669480 bytes
MERGE Master (25659): Shared memory segment located at address 0x7fc05599c000.
MERGE Master (25659): File mapped object /SHM_11015 of size 100669480 created
MERGE Master (25659): Memory mapping 100669480 bytes
MERGE Master (25659): Shared memory segment located at address 0x7fc04f99a000.
MERGE Master (25659): File mapped object /SHM_11016 of size 100669480 created
MERGE Master (25659): Memory mapping 100669480 bytes
MERGE Master (25659): Shared memory segment located at address 0x7fc049998000.
MERGE Master (25659): Shared memory segment located at address 0x7fc049998000.
MERGE Master (25659): Starting stats/rates task
MERGE Master (25659): Stats/Rates task has pid 25661
MERGE Master (25659): Starting 16 link tasks
MERGE Master (25659): Link task has pid 25662
MERGE Master (25659): Link task has pid 25663
MERGE Statistics/Rates (25661): Message logger not contacted.
MERGE Statistics/Rates (25661): MIDAS MERGE Statistics 64 bit Build May 11 2021  20:32:03
Creating NetVars
Creating NetVars complete
MERGE Master (25659): Link task has pid 25664
MERGE Data Link (25662): Message logger not contacted.
MERGE Data Link (25662): MIDAS MERGE Data Link 64 bit Build May 11 2021  20:32:02
Creating NetVars
Creating NetVars complete
MERGE Data Link (25662): Configuration: index = 0, SHM key=11000, TCP port base = 11001, module = -1, hardware = 0
MERGE Data Link (25662): File mapped object /SHM_11000 accessed
MERGE Data Link (25662): Memory mapping 536628 bytes
MERGE Data Link (25662): Shared memory segment located at address 0x7f198ee7a000.
MERGE Data Link (25662): Allocated 71720 bytes for local input buffer
MERGE Data Link (25662): File mapped object /SHM_11001 accessed
MERGE Data Link (25662): Memory mapping 100669480 bytes
MERGE Data Link (25662): Shared memory segment located at address 0x7f1988e78000.
MERGE Master (25659): Link task has pid 25665
MERGE Data Link (25663): Message logger not contacted.
MERGE Data Link (25663): MIDAS MERGE Data Link 64 bit Build May 11 2021  20:32:02
Creating NetVars
Creating NetVars complete
MERGE Data Link (25663): Configuration: index = 1, SHM key=11000, TCP port base = 11002, module = 0, hardware = 0
MERGE Data Link (25663): File mapped object /SHM_11000 accessed
MERGE Data Link (25663): Memory mapping 536628 bytes
MERGE Data Link (25663): Shared memory segment located at address 0x7f3bee603000.
MERGE Data Link (25663): Allocated 71720 bytes for local input buffer
MERGE Data Link (25663): File mapped object /SHM_11002 accessed
MERGE Data Link (25663): Memory mapping 100669480 bytes
MERGE Data Link (25663): Shared memory segment located at address 0x7f3be8601000.
MERGE Master (25659): Link task has pid 25666
MERGE Data Link (25664): Message logger not contacted.
MERGE Data Link (25665): Message logger not contacted.
MERGE Data Link (25664): MIDAS MERGE Data Link 64 bit Build May 11 2021  20:32:02
MERGE Data Link (25665): MIDAS MERGE Data Link 64 bit Build May 11 2021  20:32:02
Creating NetVars
Creating NetVars
Creating NetVars complete
MERGE Data Link (25665): Configuration: index = 3, SHM key=11000, TCP port base = 11004, module = 2, hardware = 0
MERGE Data Link (25665): File mapped object /SHM_11000 accessed
MERGE Data Link (25665): Memory mapping 536628 bytes
MERGE Data Link (25665): Shared memory segment located at address 0x7f7418ae6000.
MERGE Data Link (25665): Allocated 71720 bytes for local input buffer
MERGE Data Link (25665): File mapped object /SHM_11004 accessed
MERGE Data Link (25665): Memory mapping 100669480 bytes
MERGE Data Link (25665): Shared memory segment located at address 0x7f7412ae4000.
Creating NetVars complete
MERGE Data Link (25664): Configuration: index = 2, SHM key=11000, TCP port base = 11003, module = 1, hardware = 0
MERGE Data Link (25664): File mapped object /SHM_11000 accessed
MERGE Data Link (25664): Memory mapping 536628 bytes
MERGE Data Link (25664): Shared memory segment located at address 0x7f0da72c8000.
MERGE Data Link (25664): Allocated 71720 bytes for local input buffer
MERGE Data Link (25664): File mapped object /SHM_11003 accessed
MERGE Data Link (25664): Memory mapping 100669480 bytes
MERGE Data Link (25664): Shared memory segment located at address 0x7f0da12c6000.
MERGE Master (25659): Link task has pid 25667
MERGE Master (25659): Link task has pid 25668
MERGE Data Link (25666): Message logger not contacted.
MERGE Data Link (25666): MIDAS MERGE Data Link 64 bit Build May 11 2021  20:32:02
Creating NetVars
Creating NetVars complete
MERGE Data Link (25666): Configuration: index = 4, SHM key=11000, TCP port base = 11005, module = 3, hardware = 0
MERGE Data Link (25666): File mapped object /SHM_11000 accessed
MERGE Data Link (25666): Memory mapping 536628 bytes
MERGE Data Link (25666): Shared memory segment located at address 0x7fb7f4ec2000.
MERGE Data Link (25666): Allocated 71720 bytes for local input buffer
MERGE Data Link (25666): File mapped object /SHM_11005 accessed
MERGE Data Link (25666): Memory mapping 100669480 bytes
MERGE Data Link (25666): Shared memory segment located at address 0x7fb7eeec0000.
MERGE Master (25659): Link task has pid 25669
MERGE Data Link (25667): Message logger not contacted.
MERGE Data Link (25667): MIDAS MERGE Data Link 64 bit Build May 11 2021  20:32:02
Creating NetVars
Creating NetVars complete
MERGE Data Link (25667): Configuration: index = 5, SHM key=11000, TCP port base = 11006, module = 4, hardware = 0
MERGE Data Link (25667): File mapped object /SHM_11000 accessed
MERGE Data Link (25667): Memory mapping 536628 bytes
MERGE Data Link (25667): Shared memory segment located at address 0x7f8b878c9000.
MERGE Data Link (25667): Allocated 71720 bytes for local input buffer
MERGE Data Link (25667): File mapped object /SHM_11006 accessed
MERGE Data Link (25667): Memory mapping 100669480 bytes
MERGE Data Link (25667): Shared memory segment located at address 0x7f8b818c7000.
MERGE Master (25659): Link task has pid 25670
MERGE Data Link (25668): Message logger not contacted.
MERGE Data Link (25668): MIDAS MERGE Data Link 64 bit Build May 11 2021  20:32:02
Creating NetVars
MERGE Master (25659): Link task has pid 25671
Creating NetVars complete
MERGE Data Link (25668): Configuration: index = 6, SHM key=11000, TCP port base = 11007, module = 5, hardware = 0
MERGE Data Link (25668): File mapped object /SHM_11000 accessed
MERGE Data Link (25668): Memory mapping 536628 bytes
MERGE Data Link (25668): Shared memory segment located at address 0x7f88c7c9a000.
MERGE Data Link (25668): Allocated 71720 bytes for local input buffer
MERGE Data Link (25668): File mapped object /SHM_11007 accessed
MERGE Data Link (25668): Memory mapping 100669480 bytes
MERGE Data Link (25668): Shared memory segment located at address 0x7f88c1c98000.
MERGE Data Link (25669): Message logger not contacted.
MERGE Data Link (25669): MIDAS MERGE Data Link 64 bit Build May 11 2021  20:32:02
Creating NetVars
MERGE Master (25659): Link task has pid 25672
Creating NetVars complete
MERGE Data Link (25669): Configuration: index = 7, SHM key=11000, TCP port base = 11008, module = 6, hardware = 0
MERGE Data Link (25669): File mapped object /SHM_11000 accessed
MERGE Data Link (25669): Memory mapping 536628 bytes
MERGE Data Link (25669): Shared memory segment located at address 0x7f87e7704000.
MERGE Data Link (25669): Allocated 71720 bytes for local input buffer
MERGE Data Link (25669): File mapped object /SHM_11008 accessed
MERGE Data Link (25669): Memory mapping 100669480 bytes
MERGE Data Link (25669): Shared memory segment located at address 0x7f87e1702000.
MERGE Data Link (25671): Message logger not contacted.
MERGE Data Link (25671): MIDAS MERGE Data Link 64 bit Build May 11 2021  20:32:02
Creating NetVars
Creating NetVars complete
MERGE Data Link (25671): Configuration: index = 9, SHM key=11000, TCP port base = 11010, module = 8, hardware = 0
MERGE Data Link (25671): File mapped object /SHM_11000 accessed
MERGE Data Link (25671): Memory mapping 536628 bytes
MERGE Data Link (25671): Shared memory segment located at address 0x7f38b4f59000.
MERGE Data Link (25671): Allocated 71720 bytes for local input buffer
MERGE Data Link (25671): File mapped object /SHM_11010 accessed
MERGE Data Link (25671): Memory mapping 100669480 bytes
MERGE Data Link (25671): Shared memory segment located at address 0x7f38aef57000.
MERGE Data Link (25670): Message logger not contacted.
MERGE Data Link (25670): MIDAS MERGE Data Link 64 bit Build May 11 2021  20:32:02
Creating NetVars
MERGE Master (25659): Link task has pid 25673
Creating NetVars complete
MERGE Data Link (25670): Configuration: index = 8, SHM key=11000, TCP port base = 11009, module = 7, hardware = 0
MERGE Data Link (25670): File mapped object /SHM_11000 accessed
MERGE Data Link (25670): Memory mapping 536628 bytes
MERGE Data Link (25672): Message logger not contacted.
MERGE Data Link (25670): Shared memory segment located at address 0x7ff7744ce000.
MERGE Data Link (25672): MIDAS MERGE Data Link 64 bit Build May 11 2021  20:32:02
Creating NetVars
MERGE Data Link (25670): Allocated 71720 bytes for local input buffer
MERGE Data Link (25670): File mapped object /SHM_11009 accessed
MERGE Data Link (25670): Memory mapping 100669480 bytes
MERGE Data Link (25670): Shared memory segment located at address 0x7ff76e4cc000.
Creating NetVars complete
MERGE Data Link (25672): Configuration: index = 10, SHM key=11000, TCP port base = 11011, module = 9, hardware = 0
MERGE Data Link (25672): File mapped object /SHM_11000 accessed
MERGE Data Link (25672): Memory mapping 536628 bytes
MERGE Data Link (25672): Shared memory segment located at address 0x7f4bb287e000.
MERGE Data Link (25672): Allocated 71720 bytes for local input buffer
MERGE Data Link (25672): File mapped object /SHM_11011 accessed
MERGE Data Link (25672): Memory mapping 100669480 bytes
MERGE Data Link (25672): Shared memory segment located at address 0x7f4bac87c000.
MERGE Master (25659): Link task has pid 25674
MERGE Data Link (25673): Message logger not contacted.
MERGE Data Link (25673): MIDAS MERGE Data Link 64 bit Build May 11 2021  20:32:02
Creating NetVars
Creating NetVars complete
MERGE Data Link (25673): Configuration: index = 11, SHM key=11000, TCP port base = 11012, module = 10, hardware = 0
MERGE Data Link (25673): File mapped object /SHM_11000 accessed
MERGE Data Link (25673): Memory mapping 536628 bytes
MERGE Data Link (25673): Shared memory segment located at address 0x7fe3cd54a000.
MERGE Data Link (25673): Allocated 71720 bytes for local input buffer
MERGE Data Link (25673): File mapped object /SHM_11012 accessed
MERGE Data Link (25673): Memory mapping 100669480 bytes
MERGE Data Link (25673): Shared memory segment located at address 0x7fe3c7548000.
MERGE Master (25659): Link task has pid 25675
MERGE Data Link (25674): Message logger not contacted.
MERGE Data Link (25674): MIDAS MERGE Data Link 64 bit Build May 11 2021  20:32:02
Creating NetVars
Creating NetVars complete
MERGE Data Link (25674): Configuration: index = 12, SHM key=11000, TCP port base = 11013, module = 11, hardware = 0
MERGE Data Link (25674): File mapped object /SHM_11000 accessed
MERGE Data Link (25674): Memory mapping 536628 bytes
MERGE Data Link (25674): Shared memory segment located at address 0x7faec5dbd000.
MERGE Data Link (25674): Allocated 71720 bytes for local input buffer
MERGE Data Link (25674): File mapped object /SHM_11013 accessed
MERGE Data Link (25674): Memory mapping 100669480 bytes
MERGE Data Link (25674): Shared memory segment located at address 0x7faebfdbb000.
MERGE Master (25659): Link task has pid 25676
MERGE Master (25659): Link task has pid 25677
MERGE Data Link (25675): Message logger not contacted.
MERGE Data Link (25675): MIDAS MERGE Data Link 64 bit Build May 11 2021  20:32:02
Creating NetVars
Creating NetVars complete
MERGE Data Link (25675): Configuration: index = 13, SHM key=11000, TCP port base = 11014, module = 12, hardware = 0
MERGE Data Link (25675): File mapped object /SHM_11000 accessed
MERGE Data Link (25675): Memory mapping 536628 bytes
MERGE Data Link (25675): Shared memory segment located at address 0x7fef43120000.
MERGE Data Link (25675): Allocated 71720 bytes for local input buffer
MERGE Data Link (25675): File mapped object /SHM_11014 accessed
MERGE Data Link (25675): Memory mapping 100669480 bytes
MERGE Data Link (25675): Shared memory segment located at address 0x7fef3d11e000.
MERGE Data Link (25676): Message logger not contacted.
MERGE Data Link (25676): MIDAS MERGE Data Link 64 bit Build May 11 2021  20:32:02
Creating NetVars
Creating NetVars complete
MERGE Data Link (25676): Configuration: index = 14, SHM key=11000, TCP port base = 11015, module = 13, hardware = 0
MERGE Data Link (25676): File mapped object /SHM_11000 accessed
MERGE Data Link (25676): Memory mapping 536628 bytes
MERGE Data Link (25676): Shared memory segment located at address 0x7f6aea271000.
MERGE Data Link (25676): Allocated 71720 bytes for local input buffer
MERGE Data Link (25676): File mapped object /SHM_11015 accessed
MERGE Data Link (25676): Memory mapping 100669480 bytes
MERGE Data Link (25676): Shared memory segment located at address 0x7f6ae426f000.
MERGE Data Link (25677): Message logger not contacted.
MERGE Data Link (25677): MIDAS MERGE Data Link 64 bit Build May 11 2021  20:32:02
Creating NetVars
Creating NetVars complete
MERGE Data Link (25677): Configuration: index = 15, SHM key=11000, TCP port base = 11016, module = 14, hardware = 0
MERGE Data Link (25677): File mapped object /SHM_11000 accessed
MERGE Data Link (25677): Memory mapping 536628 bytes
MERGE Data Link (25677): Shared memory segment located at address 0x7fc4281e9000.
MERGE Data Link (25677): Allocated 71720 bytes for local input buffer
MERGE Data Link (25677): File mapped object /SHM_11016 accessed
MERGE Data Link (25677): Memory mapping 100669480 bytes
MERGE Data Link (25677): Shared memory segment located at address 0x7fc4221e7000.
MERGE Statistics/Rates (25661): MIDAS MERGE Statistics 64 bit Build May 11 2021  20:32:03
MERGE Statistics thread starting
MERGE Data Link (25665): Shared memory segment located at address 0x7f7412ae4000.
MERGE Data Link (25665): Shared memory segment located at address 0x7f7412ae4000.
MERGE Data Link (25663): Shared memory segment located at address 0x7f3be8601000.
MERGE Data Link (25663): Shared memory segment located at address 0x7f3be8601000.
MERGE Data Link (25662): Shared memory segment located at address 0x7f1988e78000.
MERGE Data Link (25662): Shared memory segment located at address 0x7f1988e78000.
MERGE Data Link (25667): Shared memory segment located at address 0x7f8b818c7000.
MERGE Data Link (25667): Shared memory segment located at address 0x7f8b818c7000.
MERGE Data Link (25668): Shared memory segment located at address 0x7f88c1c98000.
MERGE Data Link (25668): Shared memory segment located at address 0x7f88c1c98000.
MERGE Data Link (25664): Shared memory segment located at address 0x7f0da12c6000.
MERGE Data Link (25664): Shared memory segment located at address 0x7f0da12c6000.
MERGE Data Link (25666): Shared memory segment located at address 0x7fb7eeec0000.
MERGE Data Link (25666): Shared memory segment located at address 0x7fb7eeec0000.
MERGE Data Link (25670): Shared memory segment located at address 0x7ff76e4cc000.
MERGE Data Link (25670): Shared memory segment located at address 0x7ff76e4cc000.
MERGE Data Link (25673): Shared memory segment located at address 0x7fe3c7548000.
MERGE Data Link (25673): Shared memory segment located at address 0x7fe3c7548000.
MERGE Data Link (25672): Shared memory segment located at address 0x7f4bac87c000.
... 201 more lines ...
|
| Attachment 3: 210602_TapeServerStartup
|
Tidy up
master(4596): Operation not permitted
Starting Tape Server

[1] 25639
MIDAS Tape Server: Message logger not contacted.
MIDAS Tape Server: MIDAS Tape Server Build Mar 16 2021  12:22:14
MIDAS Tape Server: Unable to change scheduling priority - Permission denied
MIDAS Tape Server: Using default startup
MIDAS Tape Server: Configuration: UDP port = 10205, SHM key=10205.
MIDAS Tape Server: File mapped object /SHM_10205 of size 1331104 created
MIDAS Tape Server: Shared memory ID is 3
MIDAS Tape Server: Shared memory segment located at address 7fdf19721000.
MIDAS Tape Server: Configuration file used - /MIDAS/config/TS_10205/TS_configuration
MIDAS Tape Server: Stats task /MIDAS/TapeServer/Linux64/stats
MIDAS Tape Server: Using device file /dev/file/0 /MIDAS/TapeServer/Linux64/driver
MIDAS Tape Server: Using device file /dev/file/1 /MIDAS/TapeServer/Linux64/driver
MIDAS Tape Server: Using device sink /dev/null/0 /MIDAS/TapeServer/Linux64/driver
MIDAS Tape Server: Data link /MIDAS/TapeServer/Linux64/linkTCP 10305
MIDAS Tape Server: Data link /MIDAS/TapeServer/Linux64/linkTCP 21001 21002
MIDAS Tape Server: Message reporting level = 0x180fff8
MIDAS Tape Server: Message logging level = 0xfff8
MIDAS Tape Server: Tape Server Options = 0x0
MIDAS Tape Server: File device path base = /TapeData
MIDAS Tape Server: Data buffer size = 65536
MIDAS Tape Server: Tape block size = 65536
MIDAS Tape Server: File mapped object /SHM_110205 of size 4195880 created
MIDAS Tape Server: Shared memory ID is 3
MIDAS Tape Server: Shared memory segment located at address 7fdf19320000.
MIDAS Tape Server: File mapped object /SHM_210205 of size 3100 created
MIDAS Tape Server: Shared memory ID is 3
MIDAS Tape Server: Shared memory segment located at address 7fdf19881000.
MIDAS Tape Server: Capabilities restored.
MIDAS Tape Server: Master global area initialised.
MIDAS Tape Server: Stats task has pid 25641
MIDAS Tape Server: Driver process for /dev/file/0 has pid 25642
MIDAS Tape Server: Driver process for /dev/file/1 has pid 25643
MIDAS Tape Server: Driver process for /dev/null/0 has pid 25644
MIDAS Tape Server: Link task 0 has pid 25645
MIDAS Tape Server: Link task 1 has pid 25646
MIDAS Tape Server: Starting the RPC interface
MIDAS Tape Statistics: Message logger not contacted.
MIDAS Tape Statistics: MIDAS Tape Statistics Build Mar 16 2021  12:22:20
MIDAS Tape Statistics: Started with args 10205
MIDAS Tape Statistics: Configuration: SHM key=10205
MIDAS Tape Statistics: File mapped object /SHM_10205 of size 1331104 created
MIDAS Tape Statistics: Shared memory ID is 3
MIDAS Tape Statistics: Shared memory segment located at address 7f9c551f7000.
MIDAS Data Link (25645): Message logger not contacted.
MIDAS Data Link (25645): MIDAS Tape Data Link Build Mar 16 2021  12:22:19
MIDAS Data Link (25645): Started with args 10205 10305
MIDAS Data Link (25645): Configuration: SHM key=10205, TCP port = 10305, Data Stream = 1
MIDAS Tape Driver (25644): Message logger not contacted.
MIDAS Tape Driver (25644): Message logger not contacted.
MIDAS Data Link (25646): Message logger not contacted.
MIDAS Tape Driver (25644): Started with args 2 10205
MIDAS Data Link (25645): File mapped object /SHM_10205 of size 1331104 created
MIDAS Data Link (25645): Shared memory ID is 3
MIDAS Data Link (25645): Shared memory segment located at address 7f6ba30ef000.
MIDAS Data Link (25646): MIDAS Tape Data Link Build Mar 16 2021  12:22:19
MIDAS Tape Driver (25644): Configuration: driver=2, key=10205.
MIDAS Data Link (25646): Started with args 10205 21001 21002
MIDAS Data Link (25645): Starting the network interface
MIDAS Tape Driver (25644): File mapped object /SHM_10205 of size 1331104 created
MIDAS Data Link (25646): Configuration: SHM key=10205, TCP port = 21001, Data Stream = 2
MIDAS Tape Driver (25644): Shared memory ID is 3
MIDAS Tape Driver (25644): Shared memory segment located at address 7f09d718d000.
MIDAS Tape Driver (25644): Using device /dev/null/0 of type sink.
MIDAS Data Link (25646): File mapped object /SHM_10205 of size 1331104 created
MIDAS Data Link (25646): Shared memory ID is 3
MIDAS Data Link (25646): Shared memory segment located at address 7fa75ae3c000.
MIDAS Data Link (25646): Starting the network interface
MIDAS Tape Driver (25642): Message logger not contacted.
MIDAS Data Link (25645): TCP socket receive buffer was 87380 - now 249856
MIDAS Tape Driver (25642): Message logger not contacted.
MIDAS Tape Driver (25642): Started with args 0 10205
MIDAS Tape Driver (25642): Configuration: driver=0, key=10205.
MIDAS Tape Driver (25643): Message logger not contacted.
MIDAS Tape Driver (25642): File mapped object /SHM_10205 of size 1331104 created
MIDAS Tape Driver (25643): Message logger not contacted.
MIDAS Tape Driver (25642): Shared memory ID is 3
MIDAS Data Link (25646): TCP socket receive buffer was 87380 - now 249856
MIDAS Data Link (25645): TCP socket send buffer was 16384 - now 249856
MIDAS Tape Driver (25643): Started with args 1 10205
MIDAS Tape Driver (25642): Shared memory segment located at address 7f48b1ea4000.
MIDAS Tape Driver (25642): Using device /dev/file/0 of type file.
MIDAS Data Link (25645): MIDAS Data Link thread 0 using TCP port 10305.
MIDAS Data Link (25645): Entering server loop
MIDAS Tape Driver (25643): Configuration: driver=1, key=10205.
MIDAS Data Link (25645): thread 0 listening on port 10305
MIDAS Tape Driver (25643): File mapped object /SHM_10205 of size 1331104 created
MIDAS Tape Driver (25643): Shared memory ID is 3
MIDAS Tape Driver (25643): Shared memory segment located at address 7f6044052000.
MIDAS Data Link (25646): TCP socket send buffer was 16384 - now 249856
MIDAS Tape Driver (25643): Using device /dev/file/1 of type file.
MIDAS Data Link (25646): MIDAS Data Link thread 0 using TCP port 21001.
MIDAS Data Link (25646): TCP socket receive buffer was 87380 - now 249856
MIDAS Data Link (25646): TCP socket send buffer was 16384 - now 249856
MIDAS Data Link (25646): MIDAS Data Link thread 1 using TCP port 21002.
MIDAS Data Link (25646): Entering server loop
MIDAS Data Link (25646): thread 0 listening on port 21001
MIDAS Data Link (25646): thread 1 listening on port 21002
MIDAS Tape Server: Created RPC Program 28000205 Version 4 on UDP port 10205.
MIDAS Tape Server: Entering server loop
MIDAS Tape Server: MIDAS Tape Server now available on UDP port 10205.
MIDAS Data Link (25645): thread 0 accepted connection from 127.0.0.1, port 37330
MIDAS Data Link (25645): buffer size changed to 65536
MIDAS Tape Server: device /dev/file/0 allocated.
MIDAS Tape Server: Mounting volume S496 on device /dev/file/0.
MIDAS Tape Server: Opening file R31 on device /dev/file/0.
2222 64 0 31056336
3333 31056336 2048000 1 15
|
| Attachment 4: TS_configuration
|
#device configuration information
#    any line starting with a # is a comment and is ignored
stats /MIDAS/TapeServer/Linux64/stats
#    devices available   -   list ends with a null line
#    format       class_name     device_name    driver_task_path_name
#       class_name MUST be one of dlt, exabyte, scsitape, sink
file          /dev/file/0    /MIDAS/TapeServer/Linux64/driver
file          /dev/file/1    /MIDAS/TapeServer/Linux64/driver
sink          /dev/null/0     /MIDAS/TapeServer/Linux64/driver

#data link configuration information  - list end with a null line
#    format   link_task_path_name
/MIDAS/TapeServer/Linux64/linkTCP 10305
/MIDAS/TapeServer/Linux64/linkTCP 21001 21002

#program options - list end with a null line
#tapeserver_options 0x2
tapeserver_options 0x0
msg_reporting_level 0x0180fff8
#   use 0x0080fff8 to enable msg logging
msg_logging_level 0xfff8
#    default for following is 16Kbytes - both MUST be the same at present
data_buffer_size 64
tape_block_size 64
disc_file_size 2000
#
file_path_base  /TapeData

#end of information
|
| Attachment 5: CONTENTS
|
Index string MERGE.LinksAvailable&&RunNumber&&MERGE.LinksInUse&&MERGE.RunOptions
Stat.shift string 0
0x0006dead string 0x0000
MERGE.LinksAvailable string 16
Stat.offset string 0
RunNumber string 0
Rate.channels string 1024
Stat.channels string 1024
MERGE.RunOptions string 3
MERGE.LinksInUse string 1%1%1%1%1%1%1%1%1%1%1%1%1%1%1%1%
Merge.LinksInUse string 1%1%1%1%1%1%1%1%1%1%1%1%0%0%0%0%0%0%0%0%0%0%0%0%0%0%0%0%0%0%0%0%0%0%0%0%0%0%0%0%0%0%0%0%0%0%0%0%0%0%0%0%0%0%0%0%0%0%0%0%0%0%0%0%
|
| Attachment 6: 210602_merger.png
|
|
|
|
442
|
Fri May 13 07:36:18 2022 |
OH, TD | Friday 13 May |
08:36 DAQ Still running smoothly
      Currently on run R1_328
      At current data rates we have just over 4 days of space left on the current disk
      Analysis of R1_327 - attachment 1

14.15 all histograms zero'd
      baseline system wide checks counters

      DAQ continues file S450/R4_33

      netint pushenable 6 - was 60 - to investigate FEE64 throughput issues
      netint flushenable 60 - not changed

      ASIC settings
       slow comparator aida02 aida04 0x16, aida06 aida08 0x23, aida12 0xd, all others 0xc

      BNC PB-5 settings
      amplitude 1.000V
      attenuation x1
      frequency 2Hz
      tau_d 1ms (tail pulse)
      + polarity

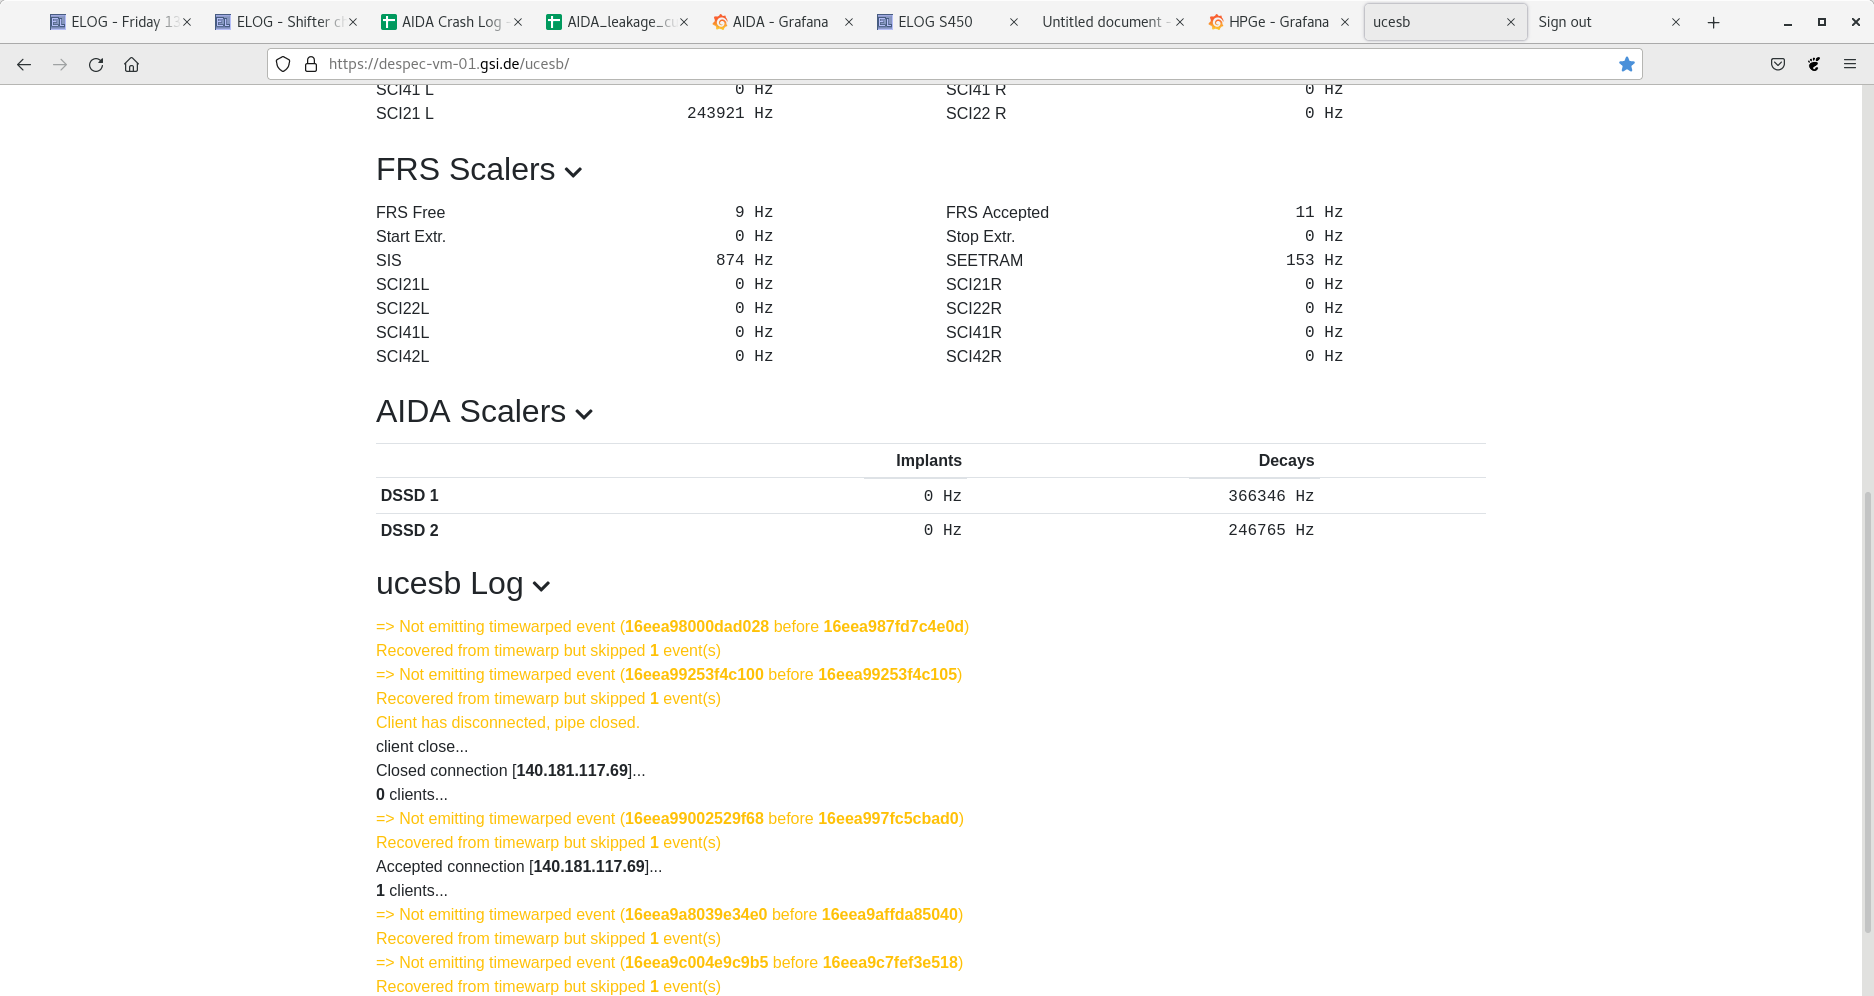
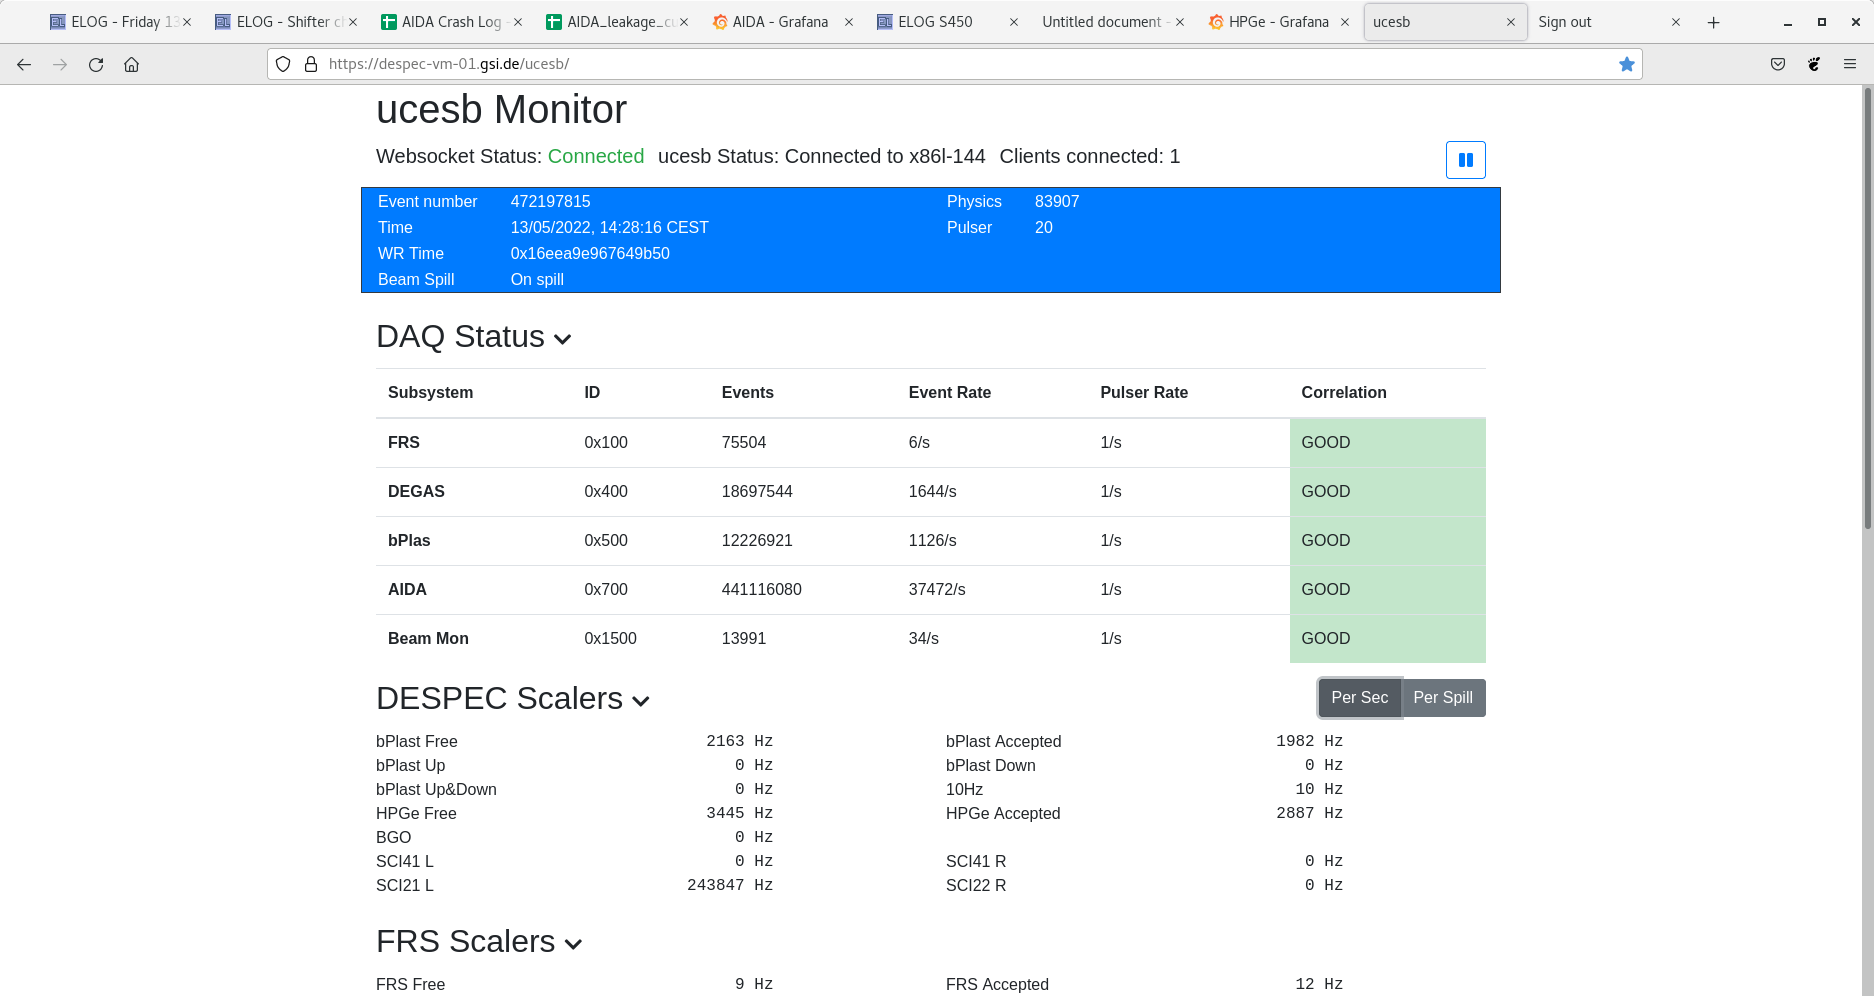
Attachments 2 & 3 - ucesb
      Pb beam intensity c. 4e+8/spill - lower than expected 1e+9/spill . Low implant rates (~Hz/spill) are expected for setting.

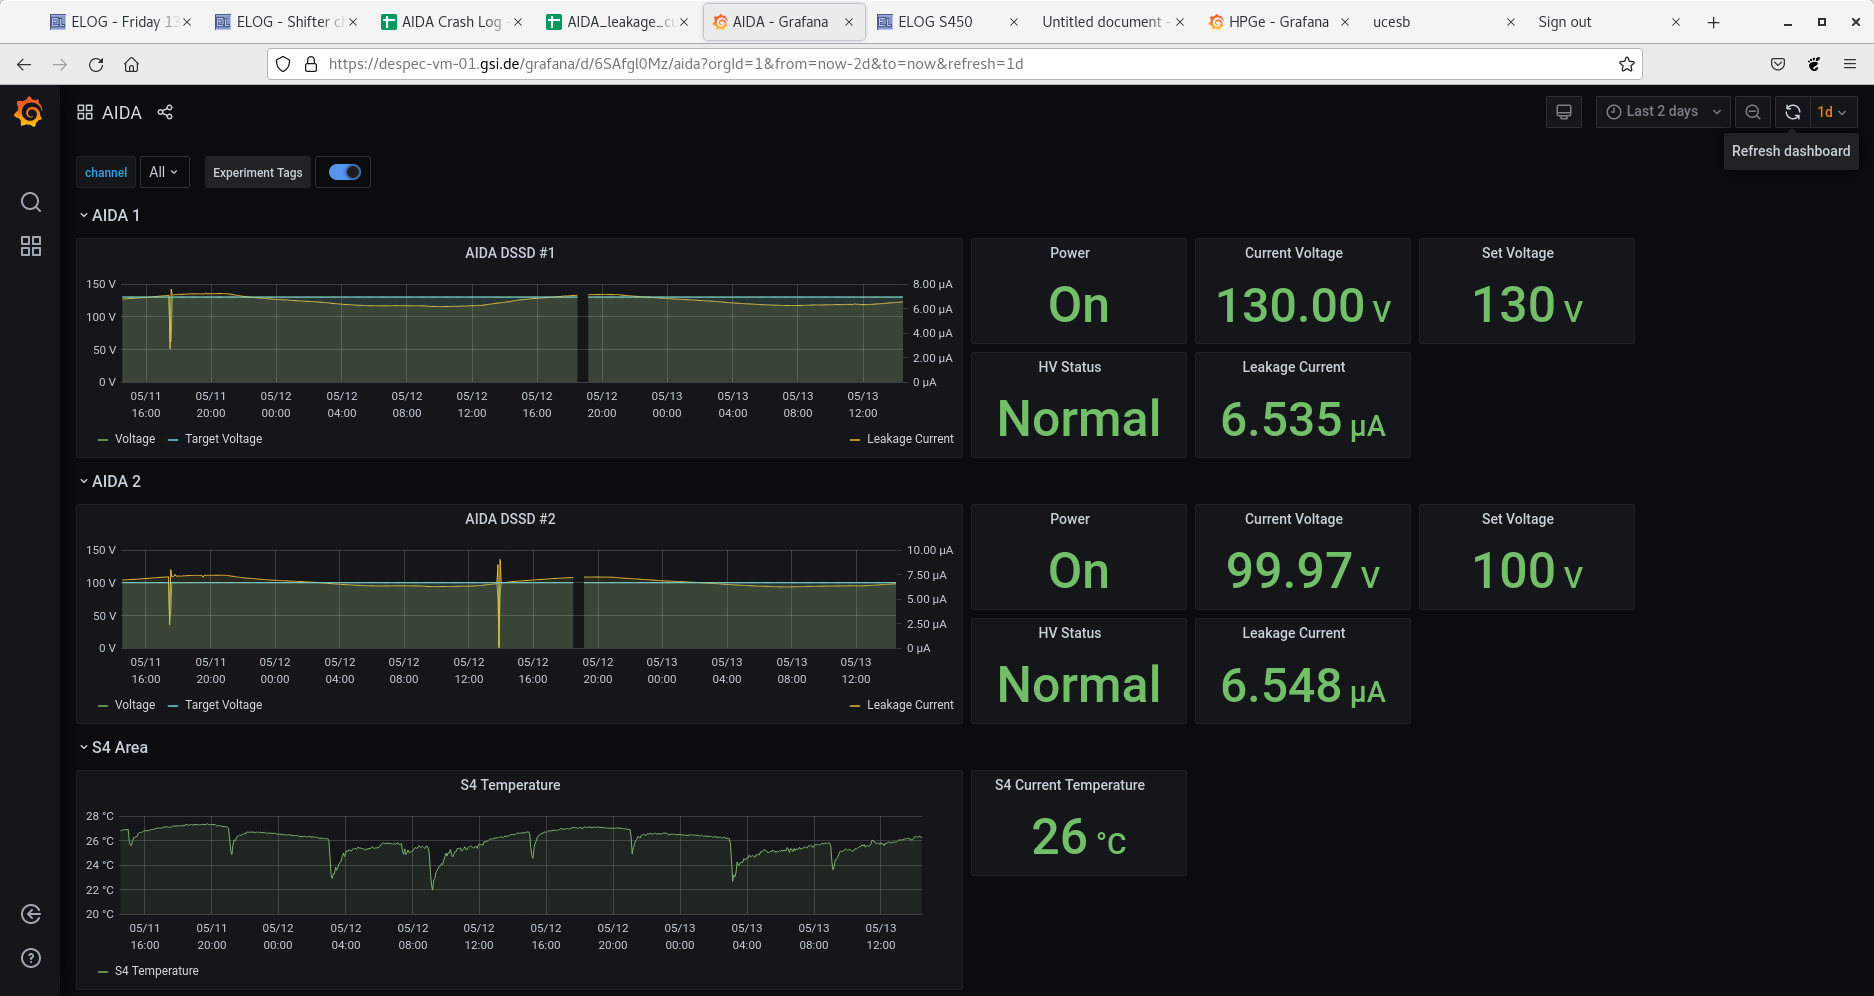
Attachment 4 & 5 - grafana DSSSD bias, leakage current & temp - OK

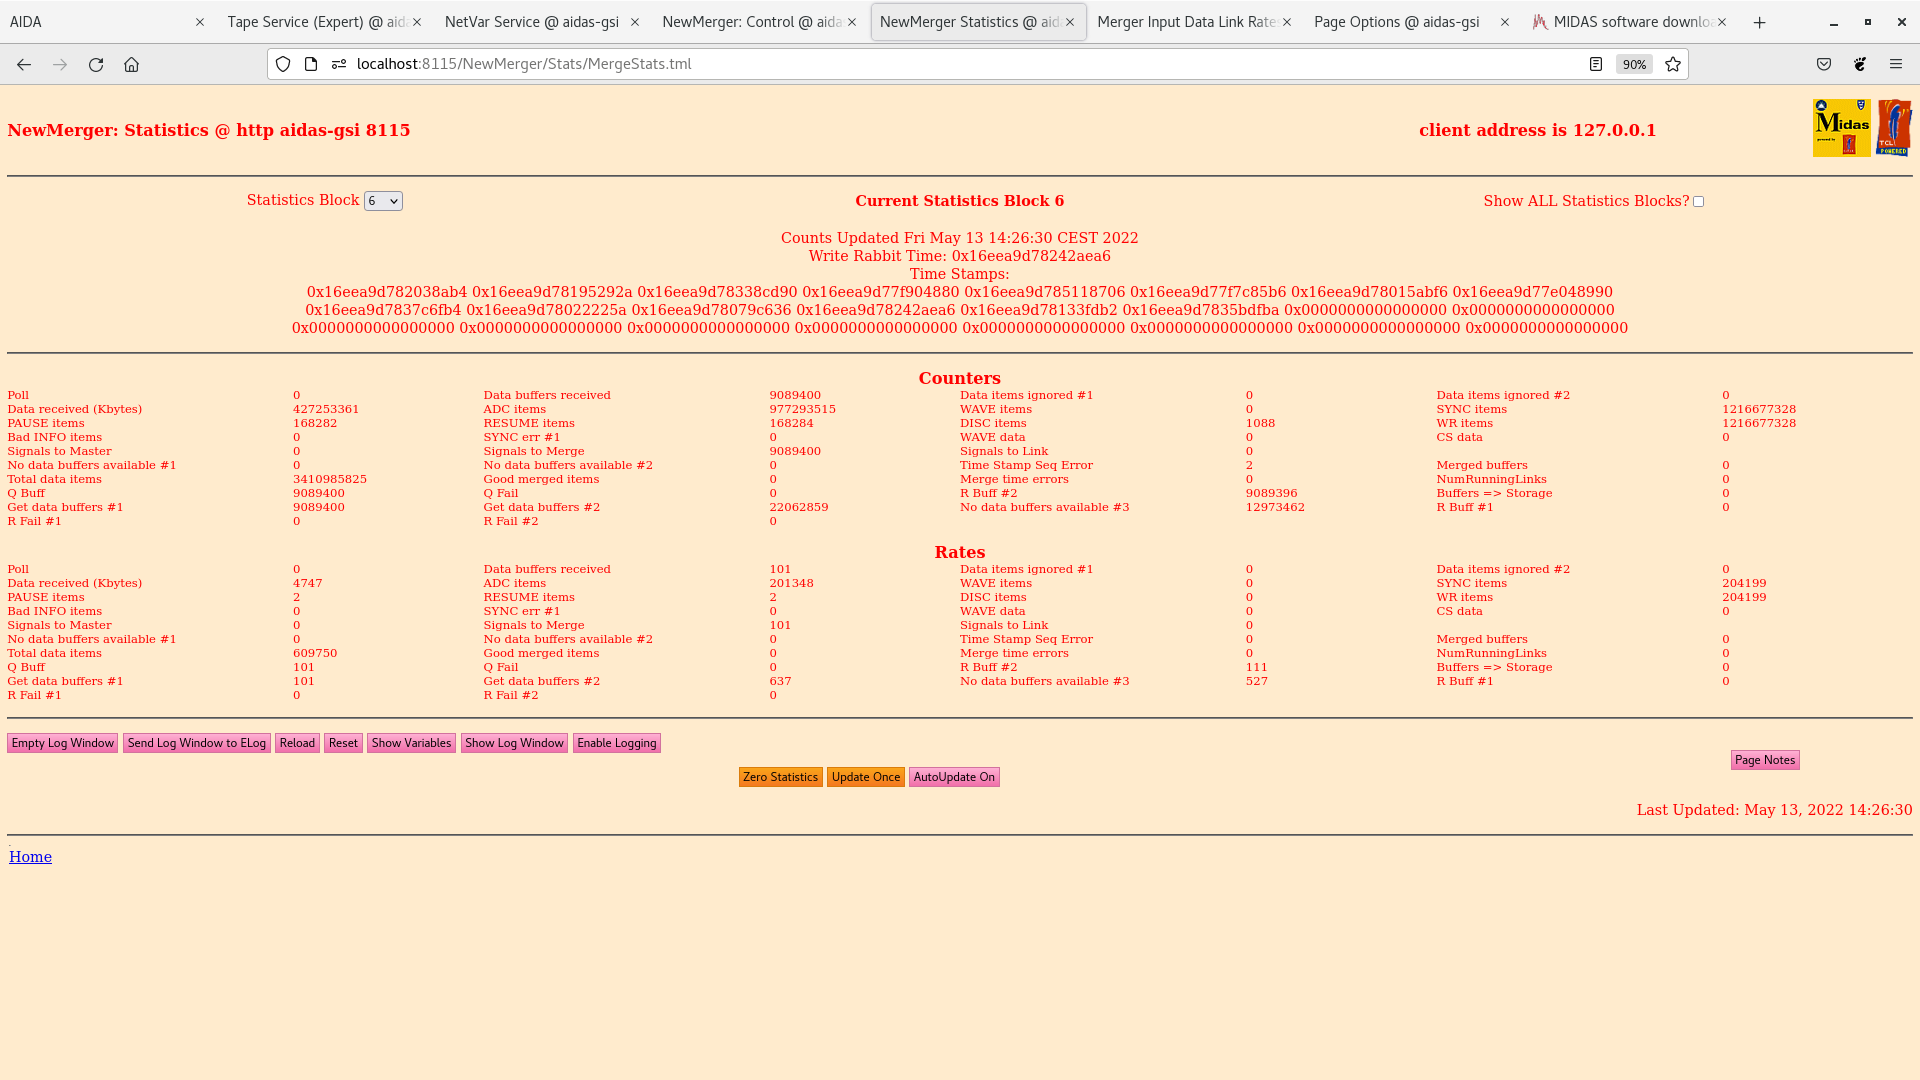
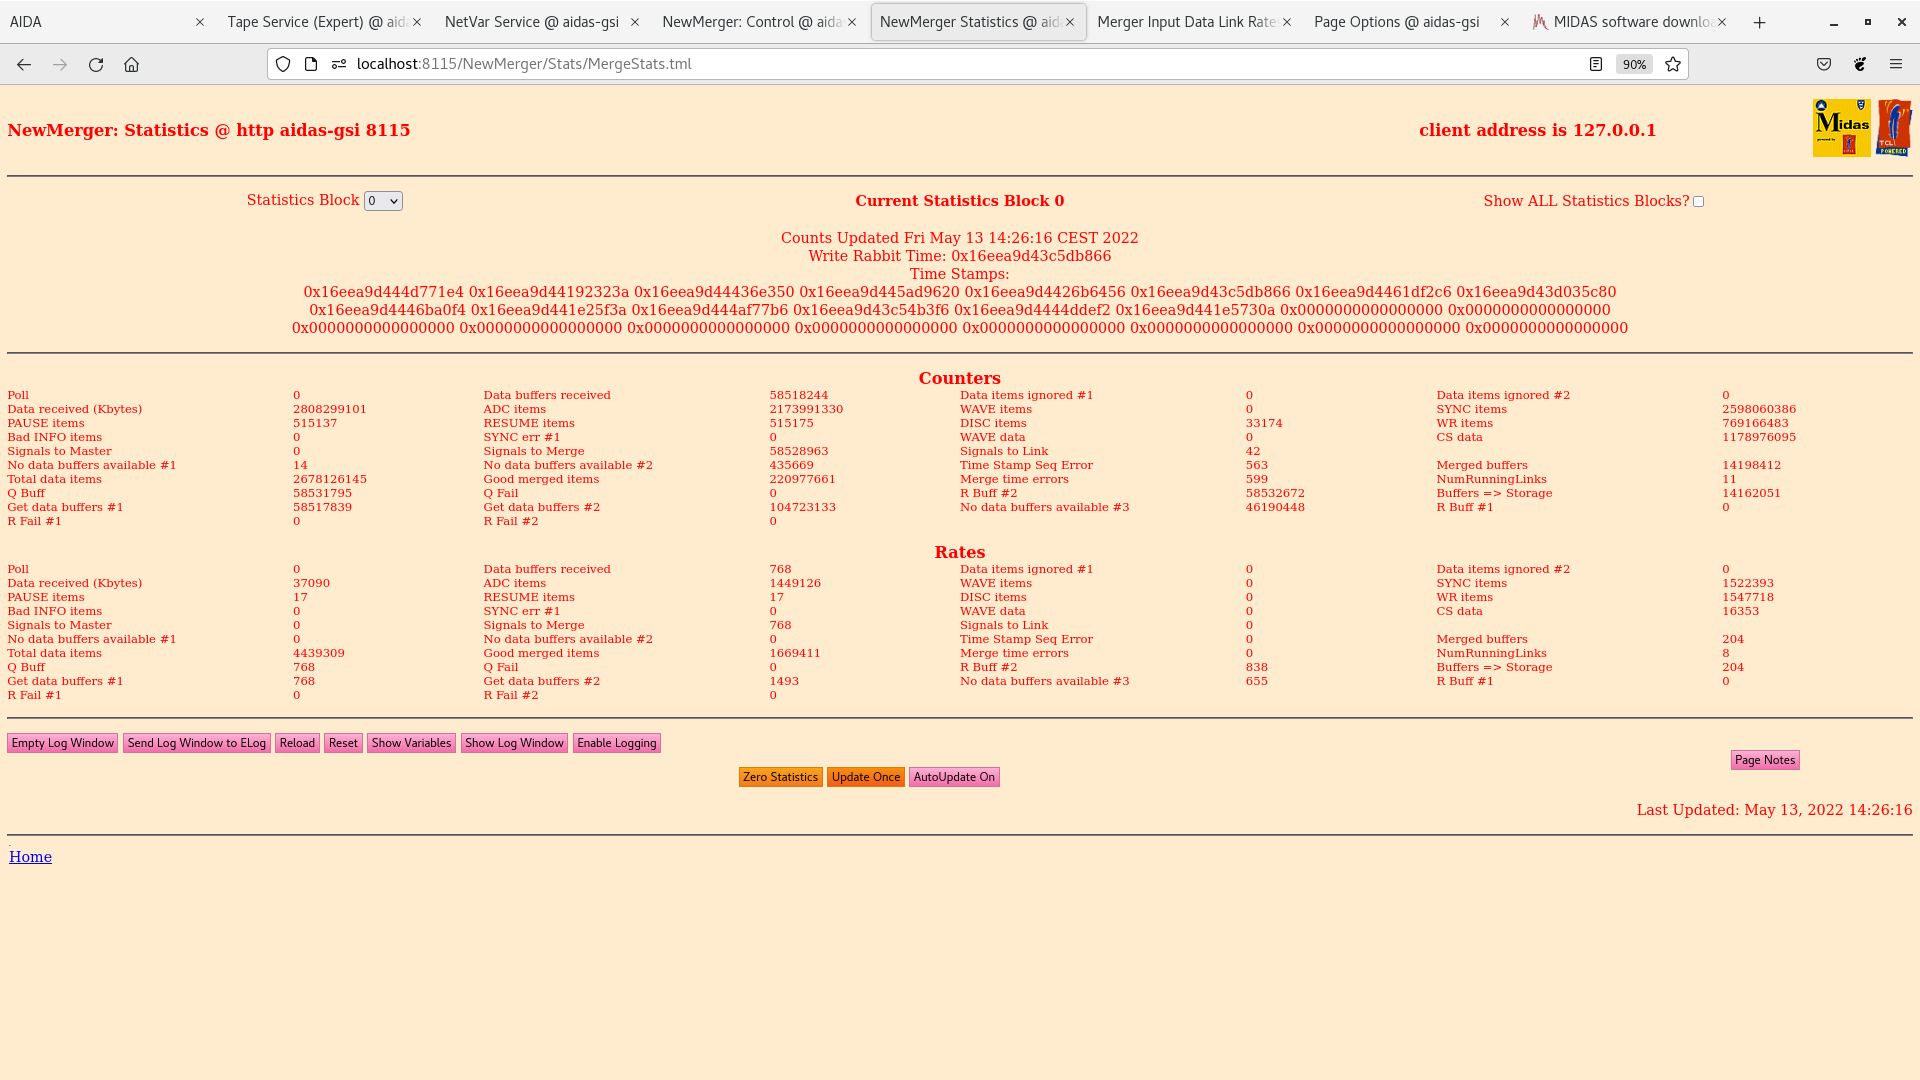
Attachments 6-8 - NewMerger stats blocks 0, 1, & 6

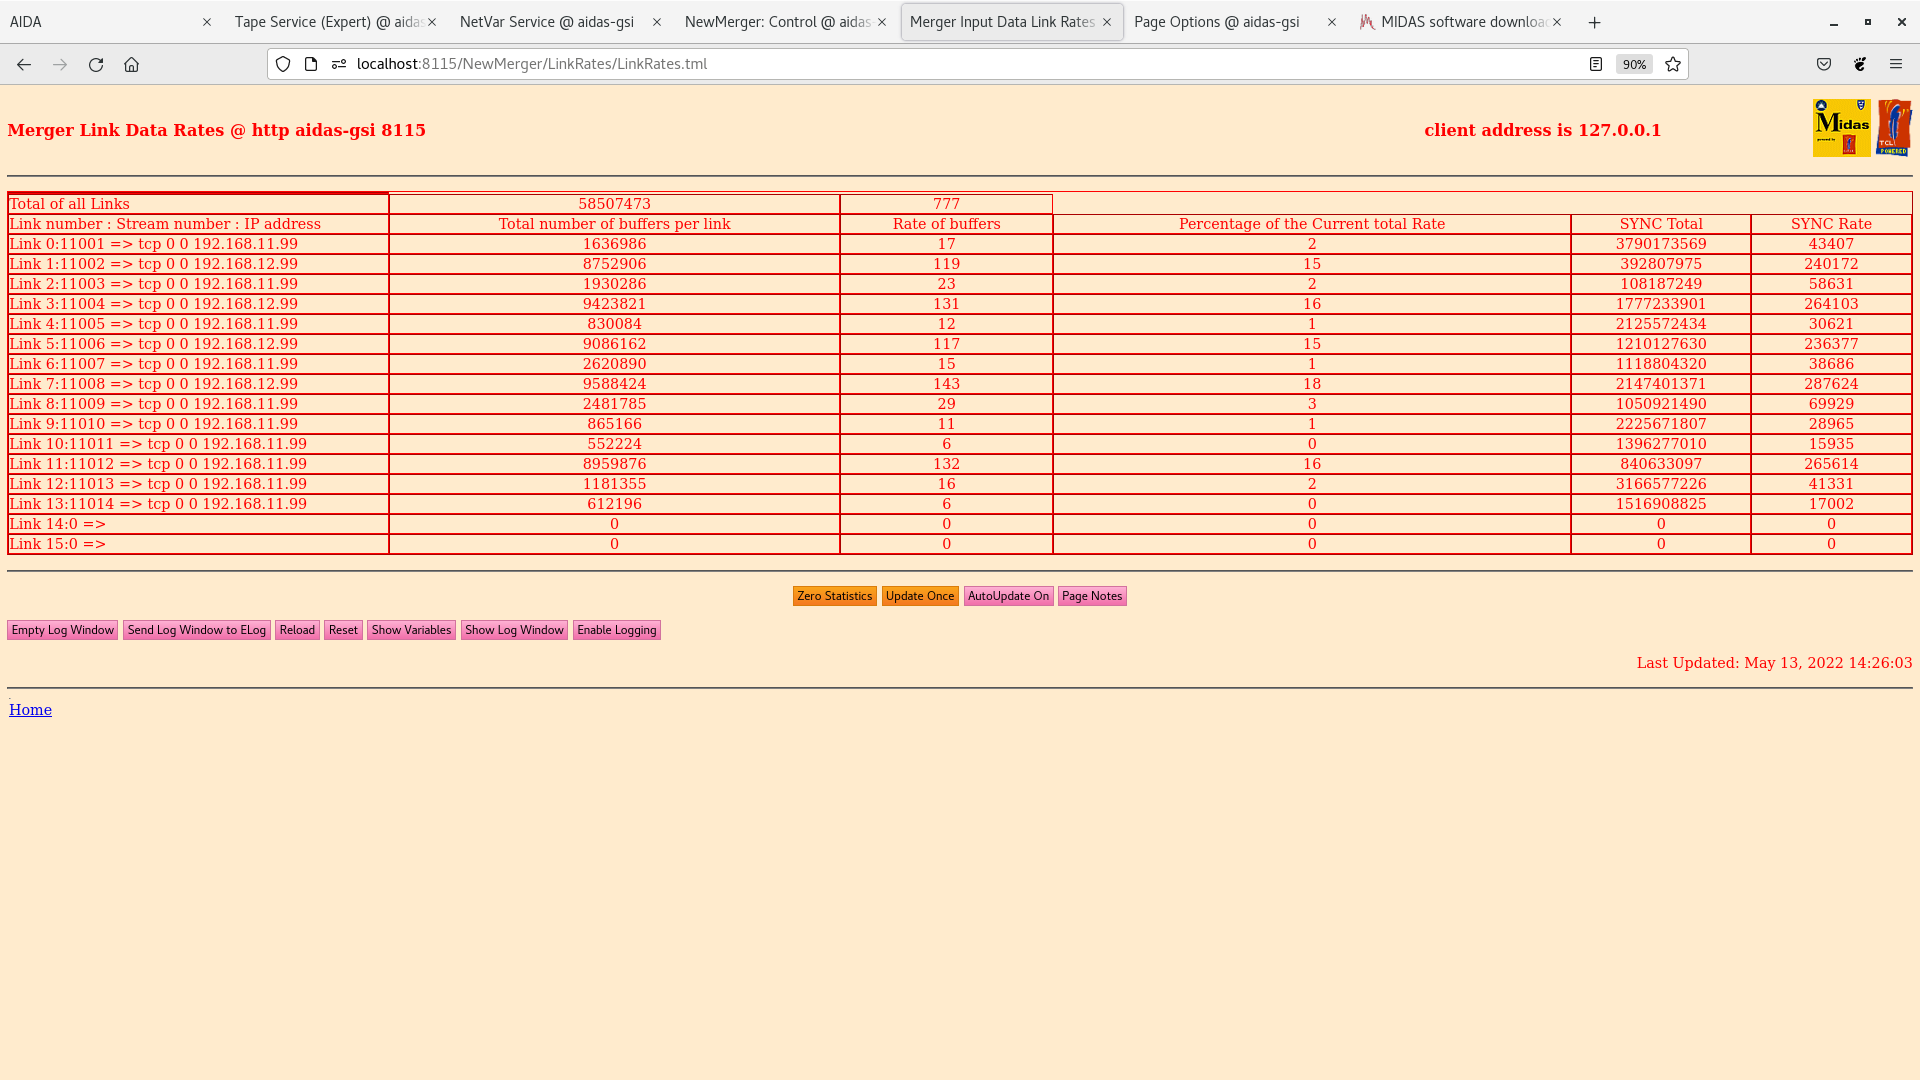
Attachment 9 - NewMerger link stats

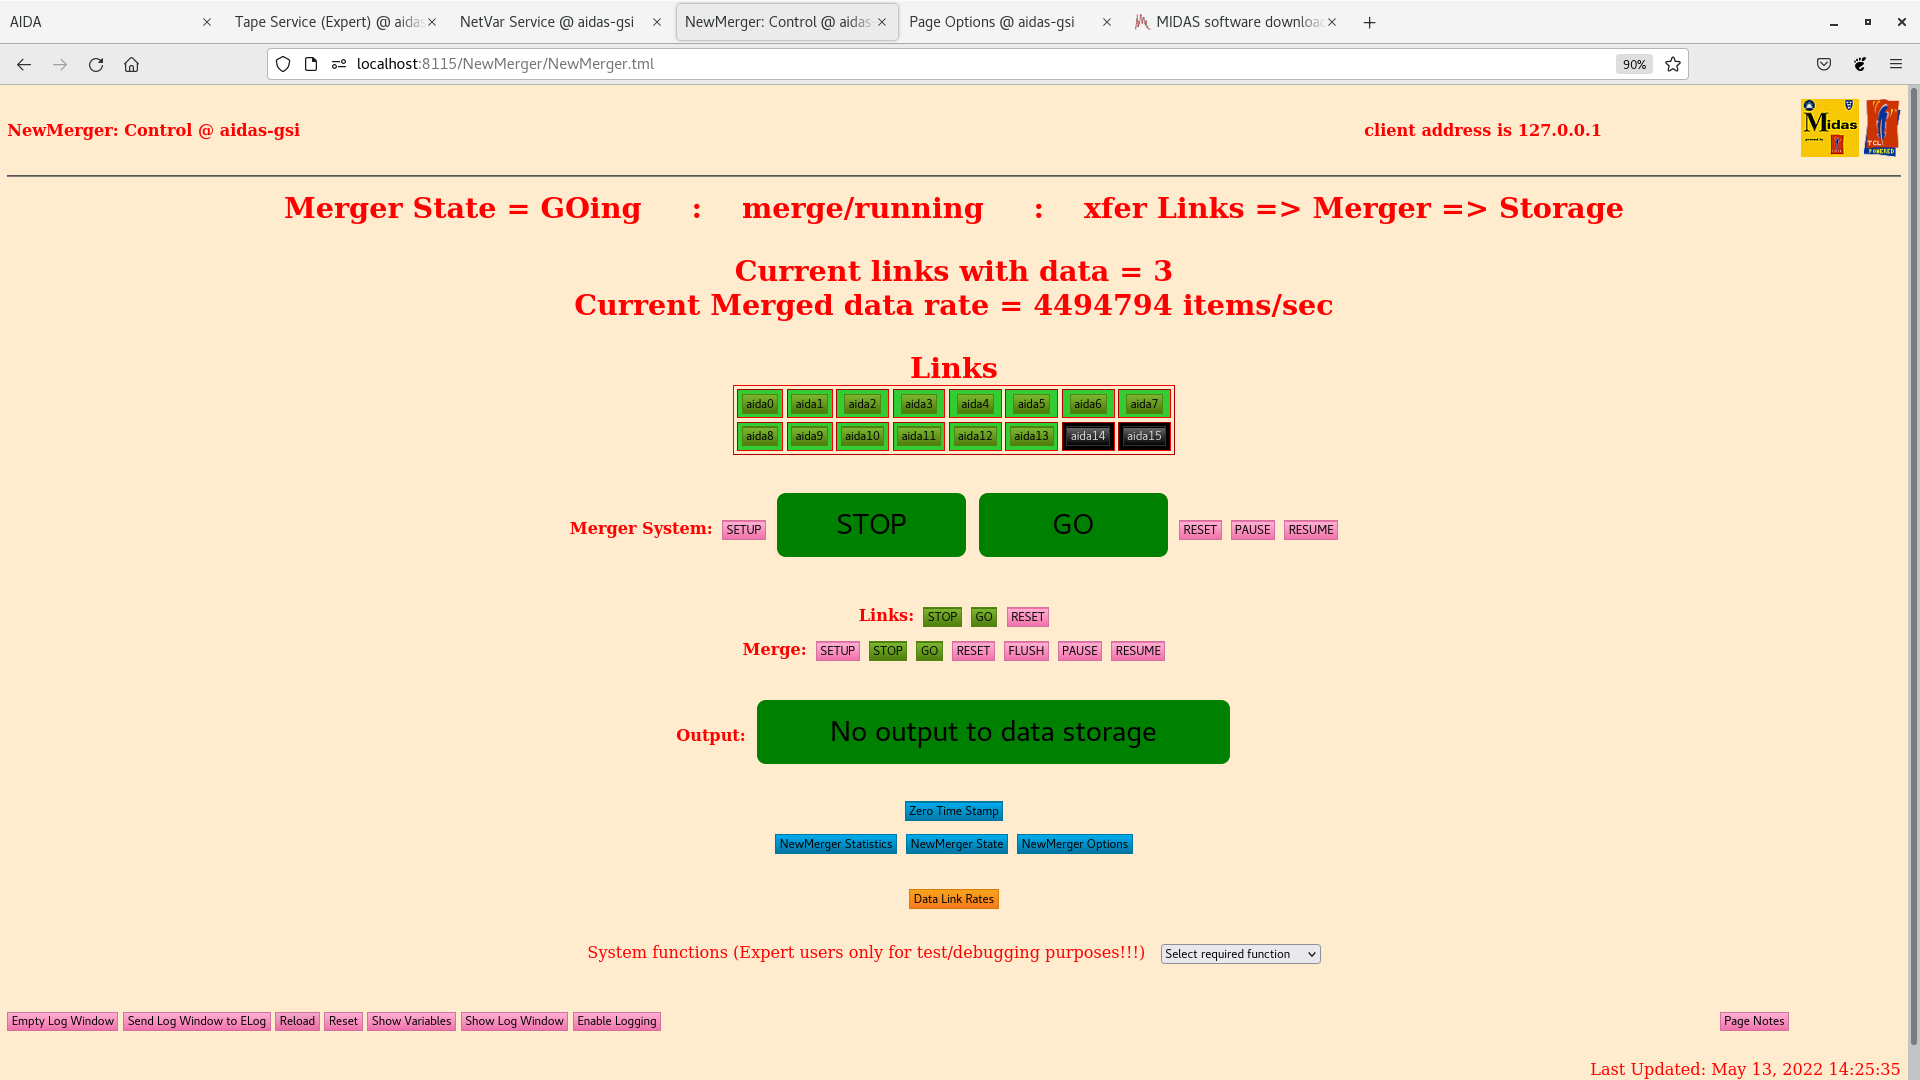
Attachments 10-11 - TapeServer/NewMerger

Attachment 12 - iptraf aida-gsi network interfaces

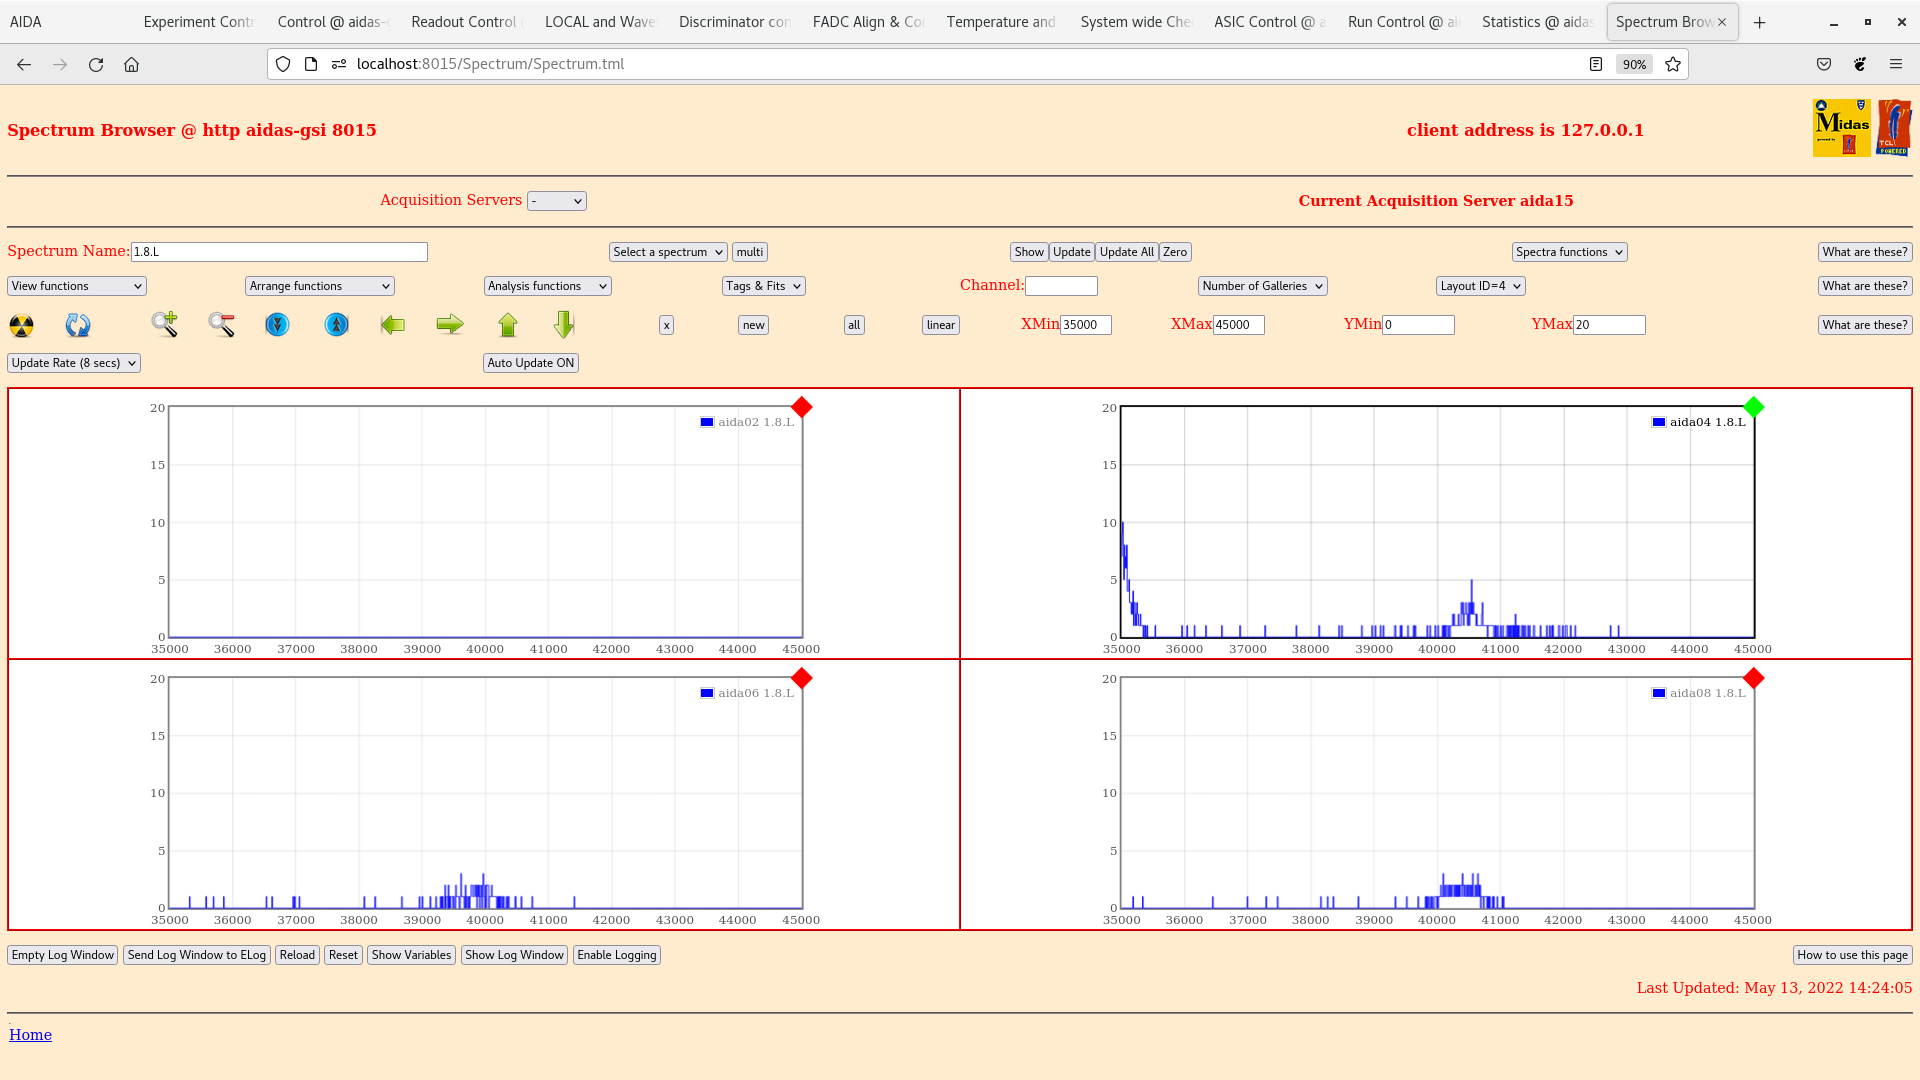
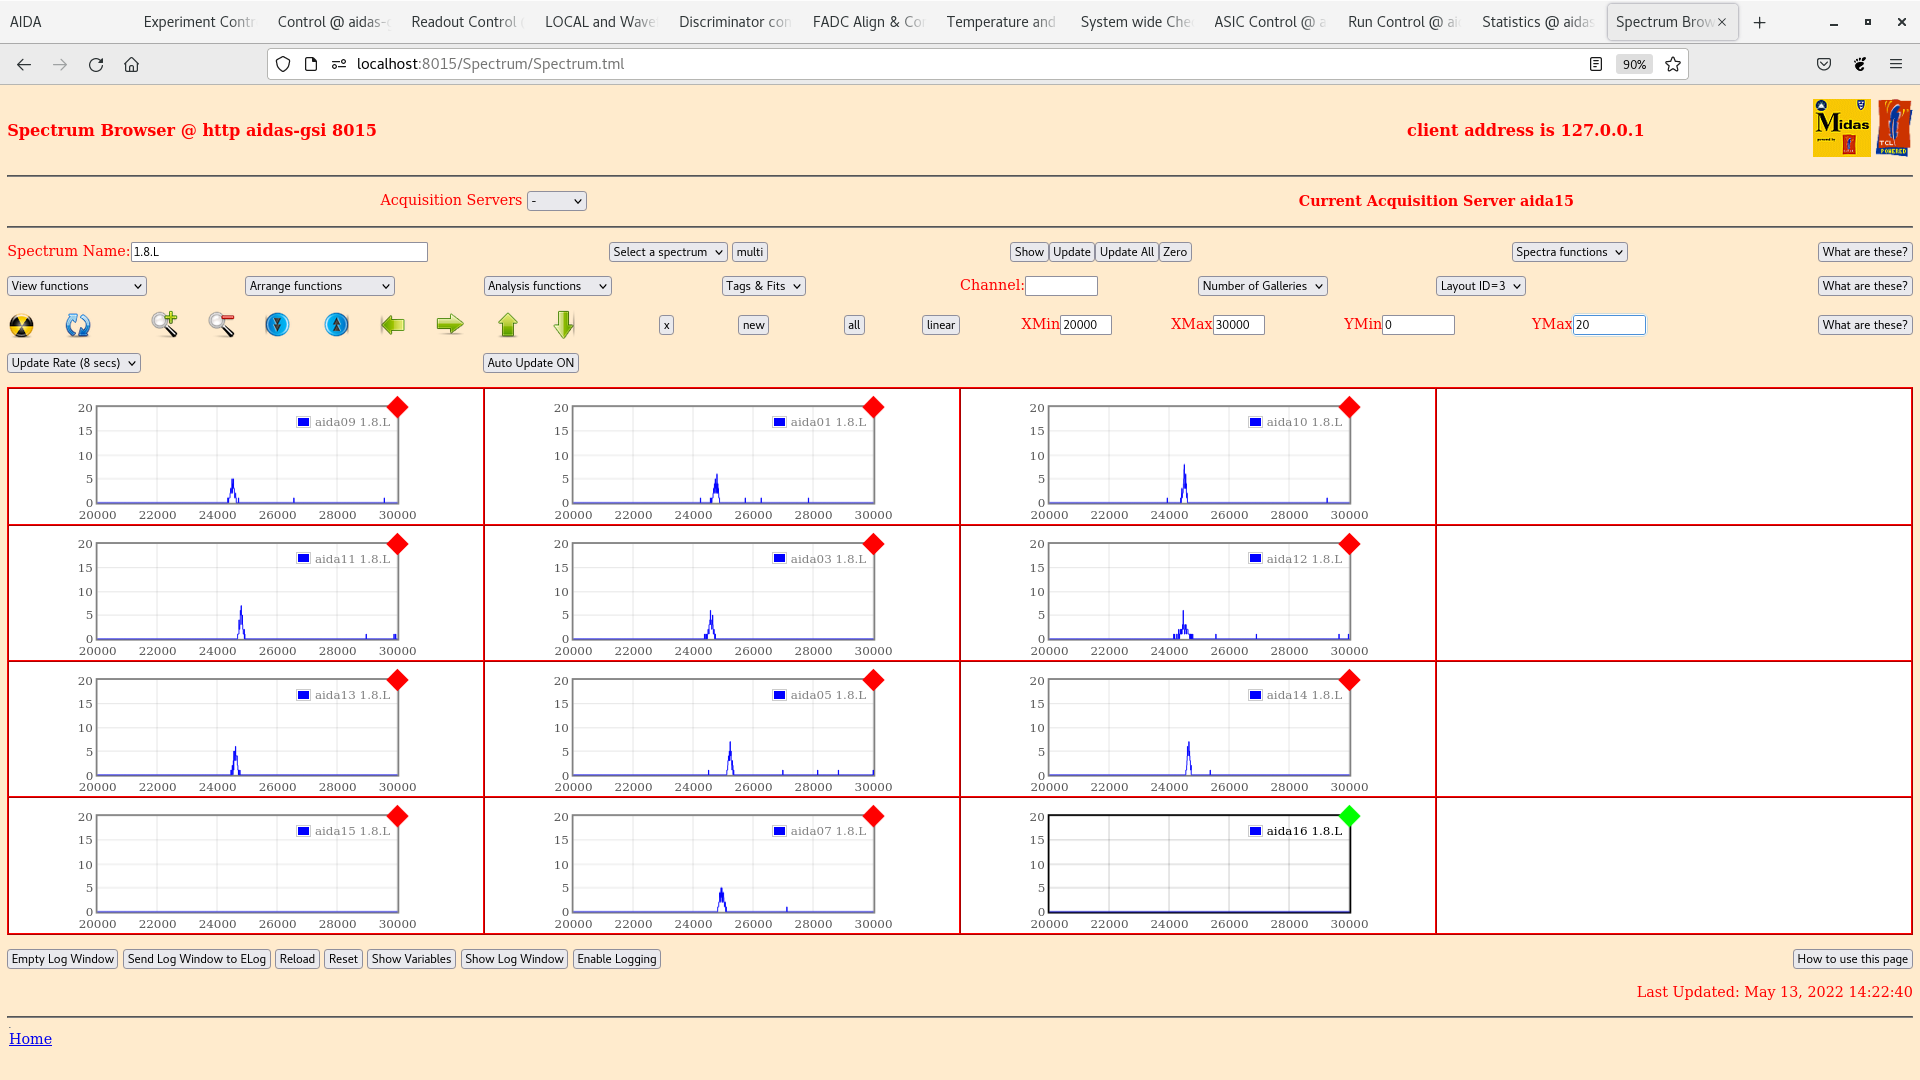
Attachments 13-14 - per FEE64 1.8.L spectra
 pulser peak width aida01 123 ch FWHM, aida04 430 ch FWHM

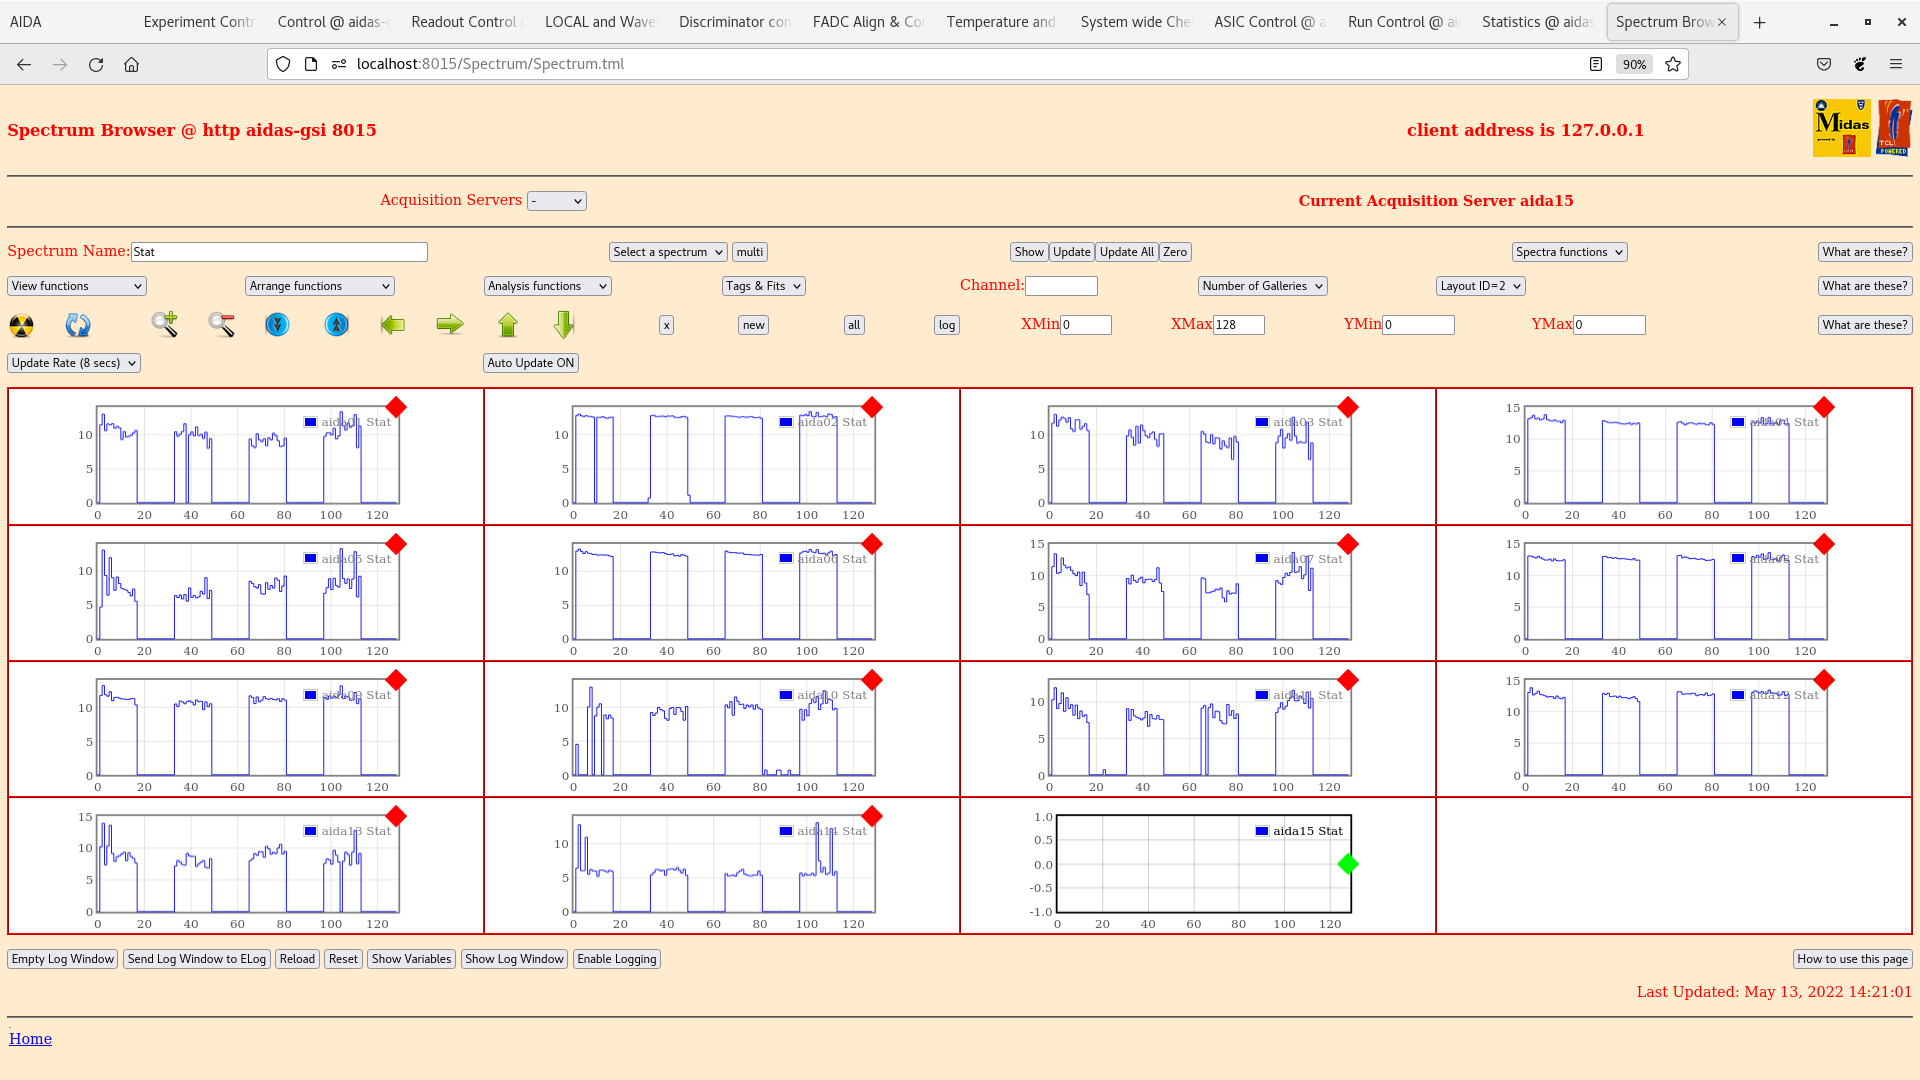
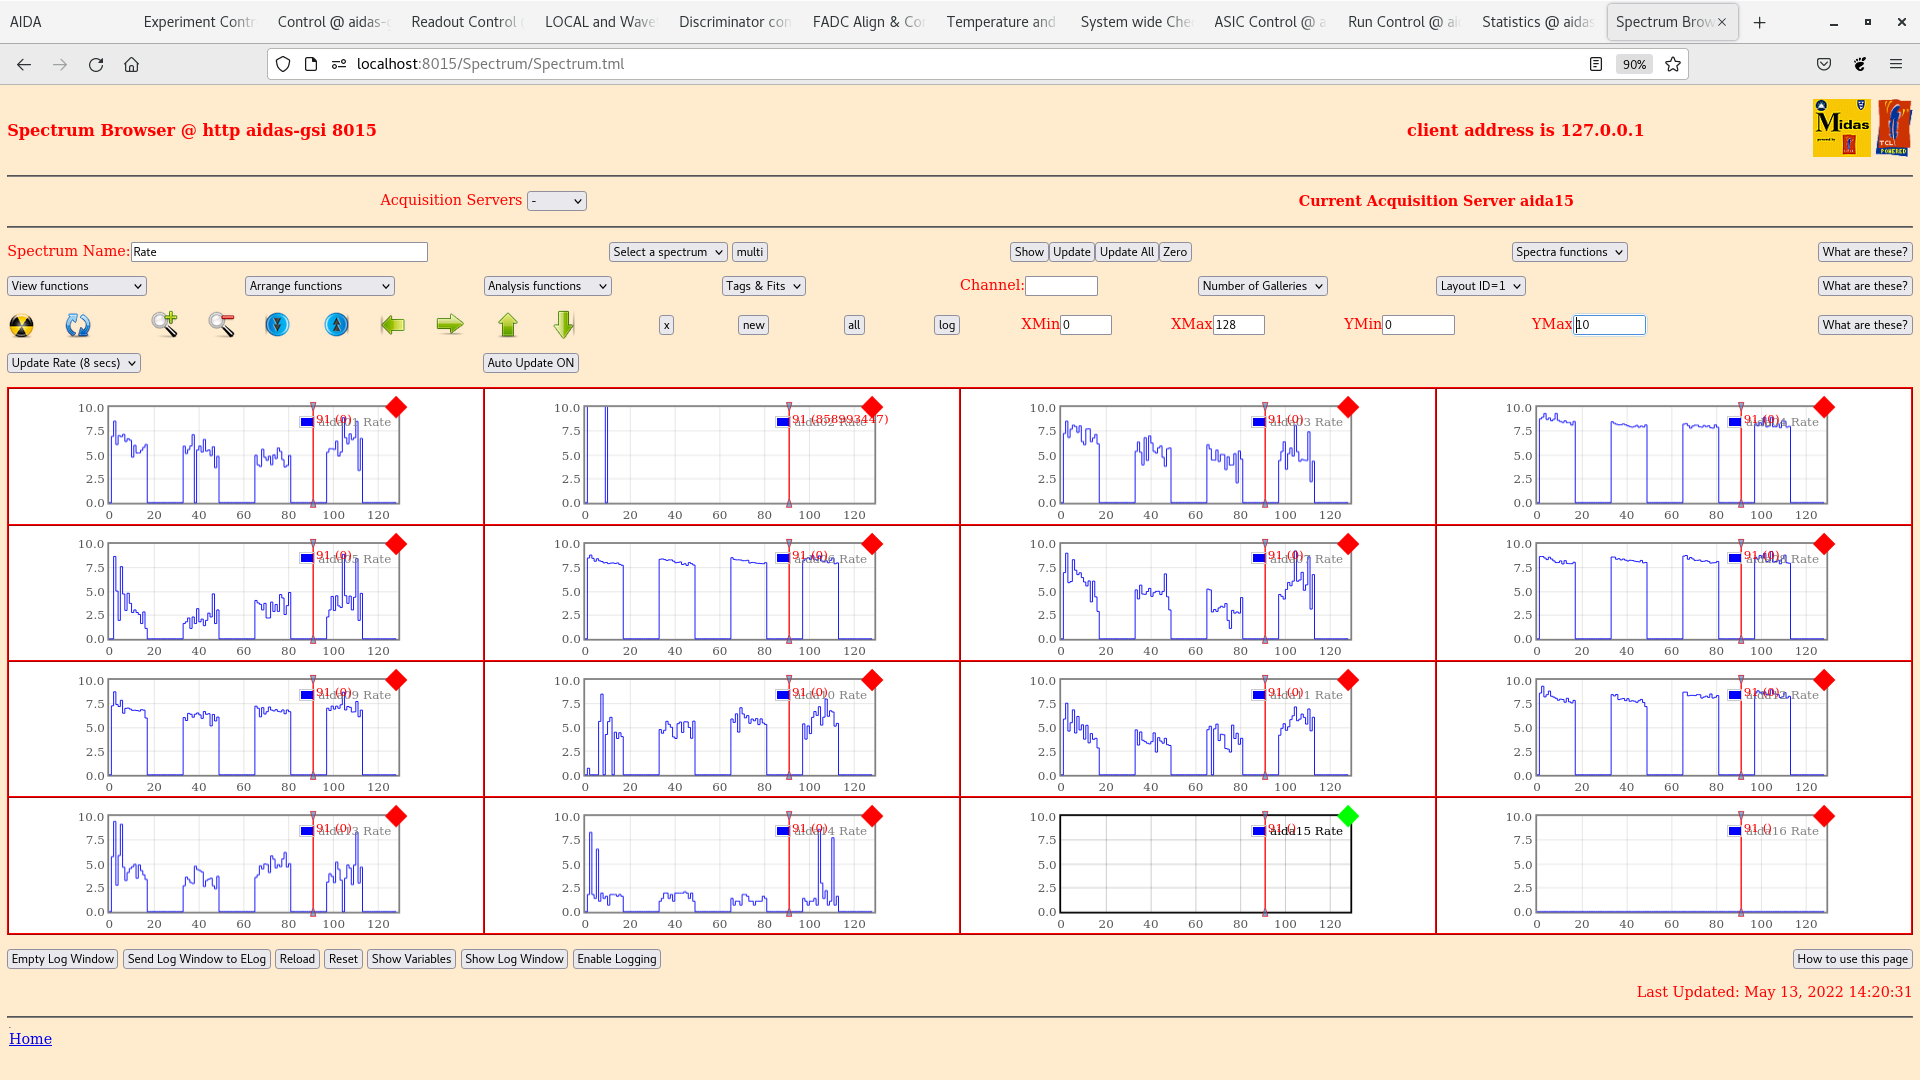
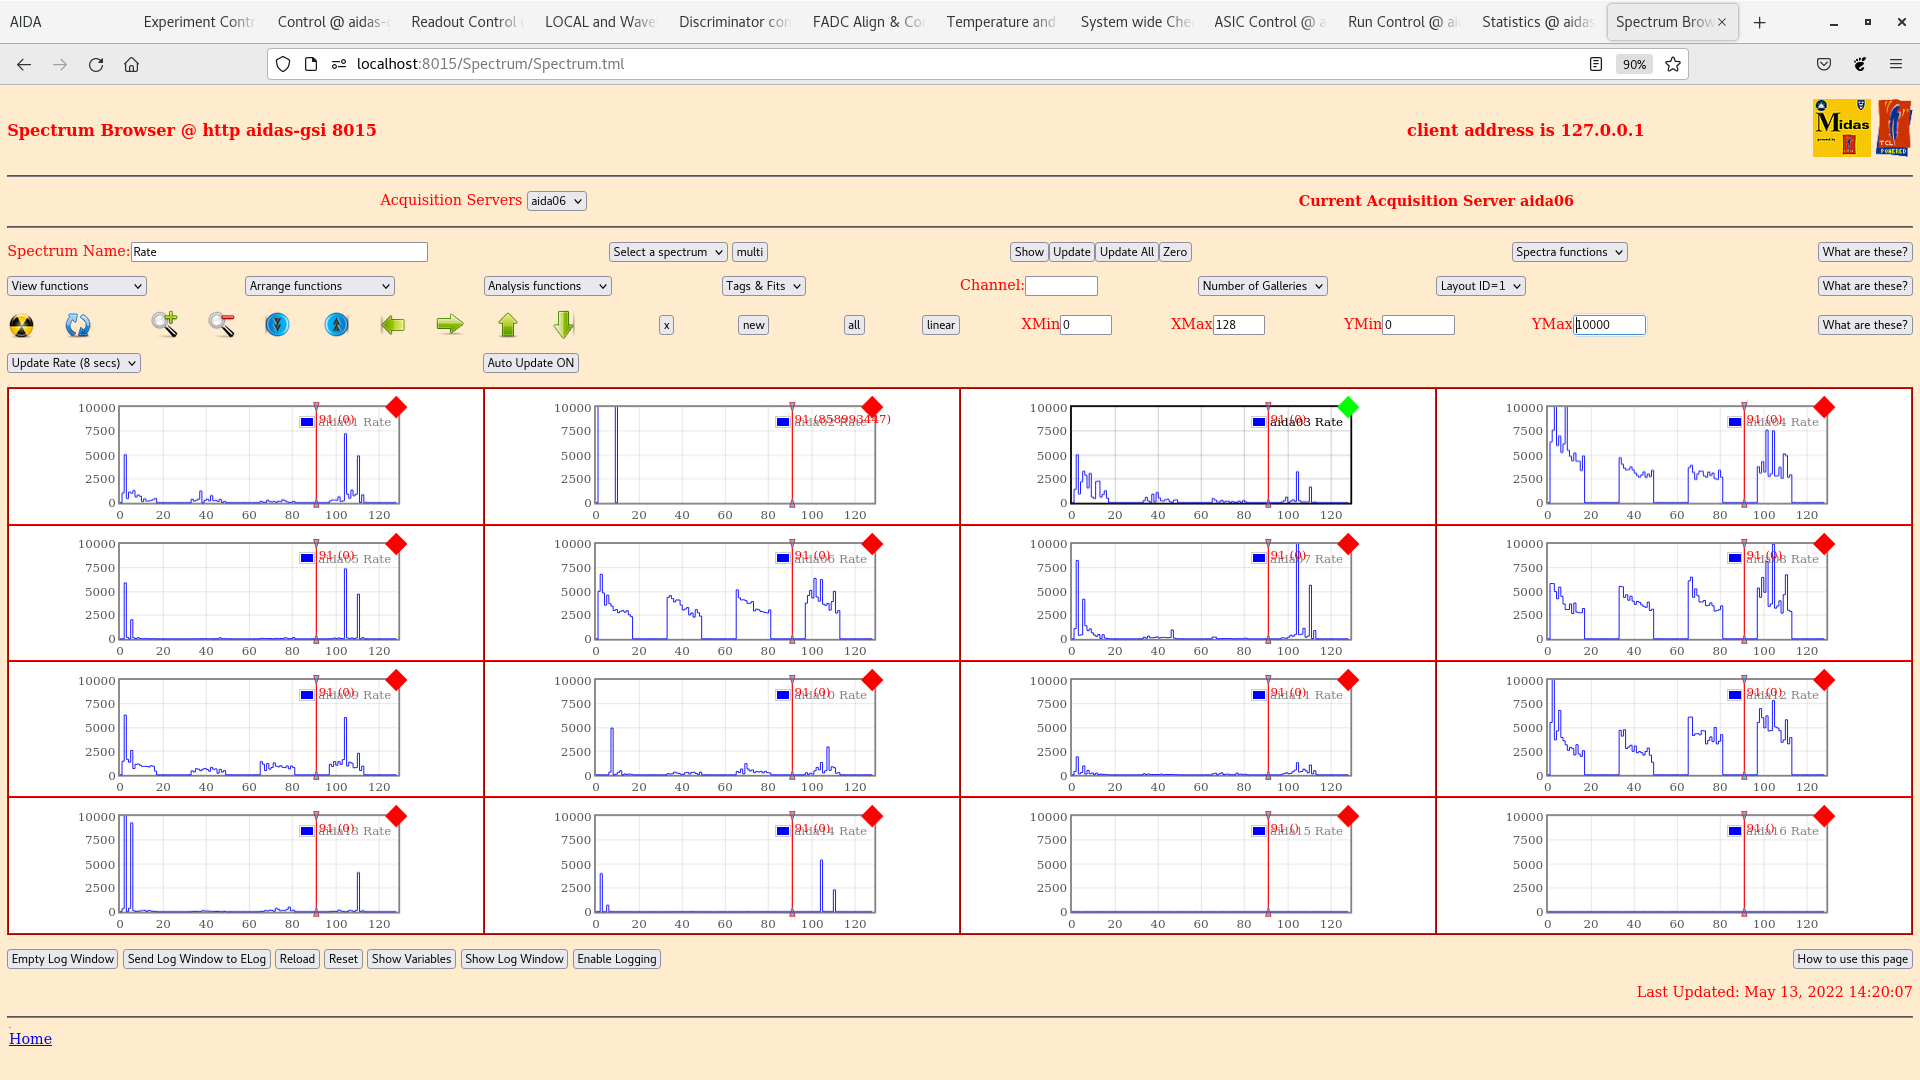
Attachments 15-18 - per FEE64 rates and stat spectra

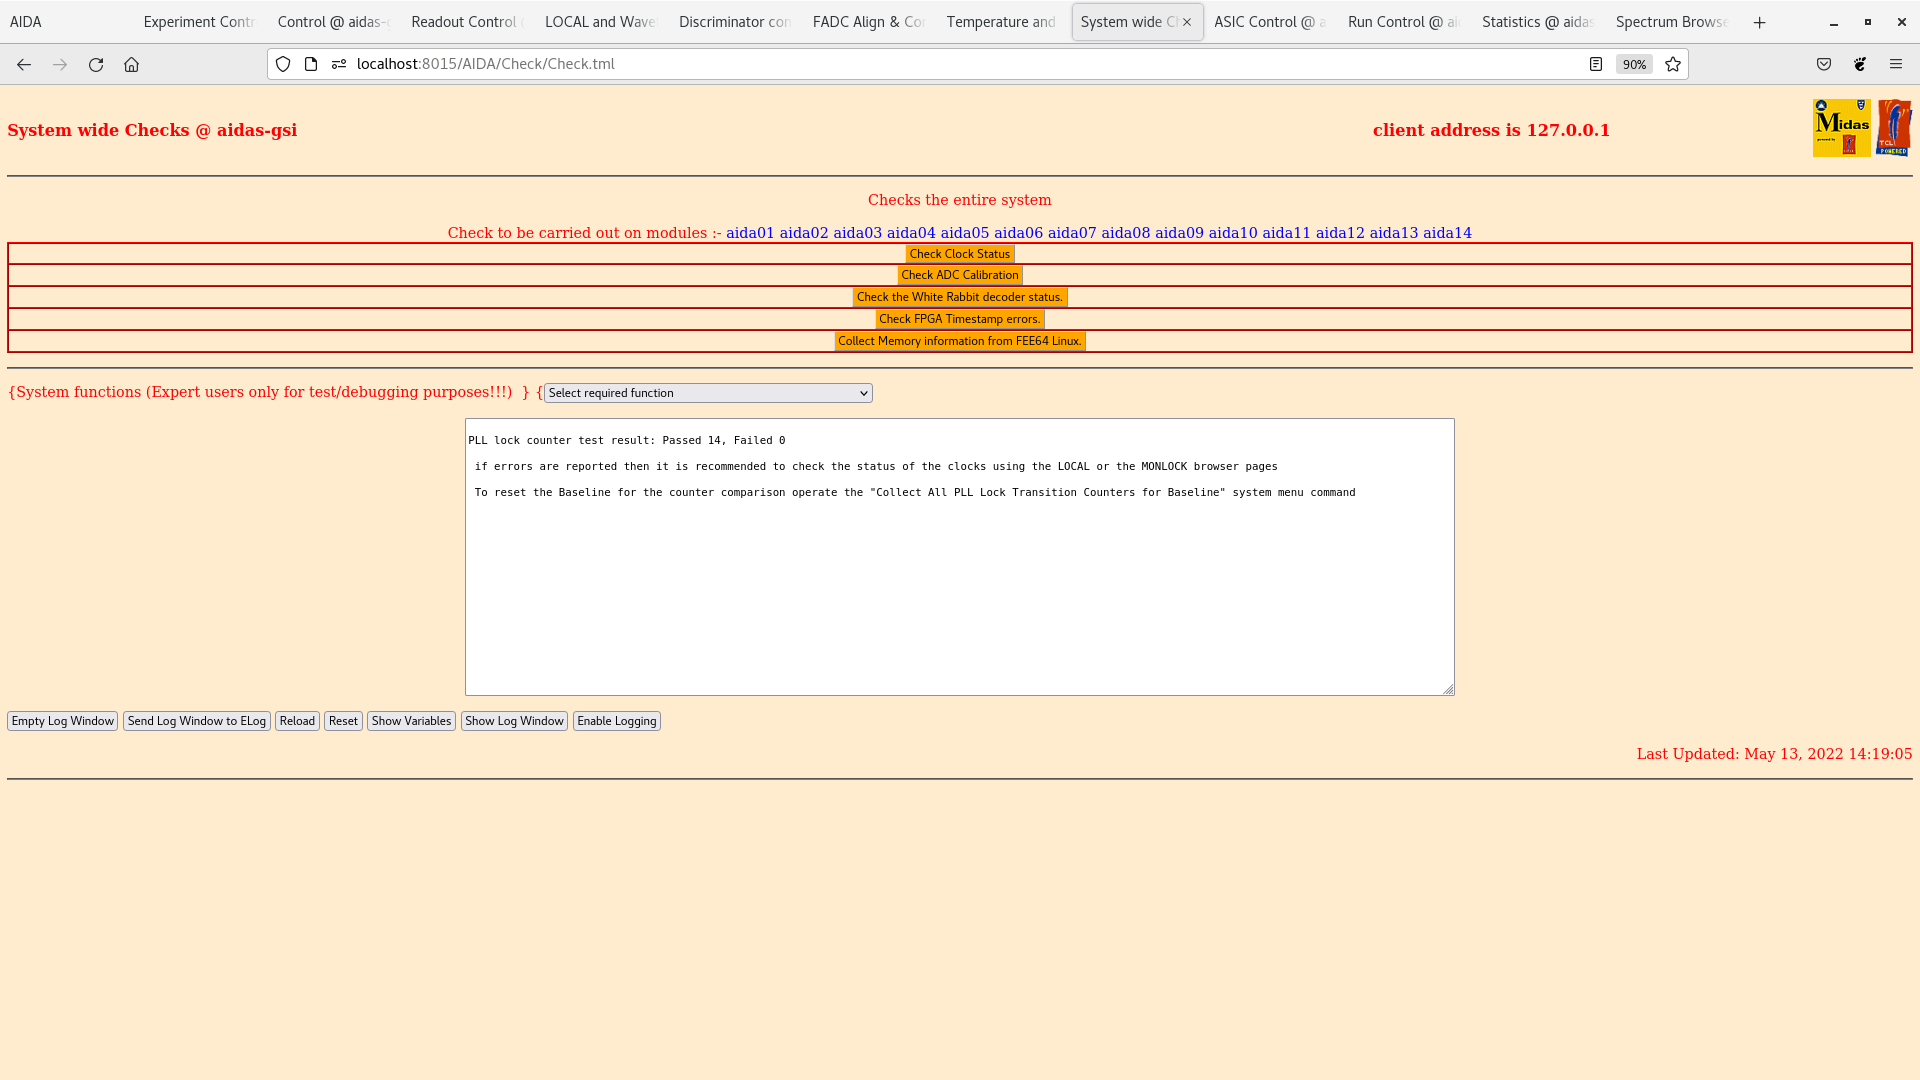
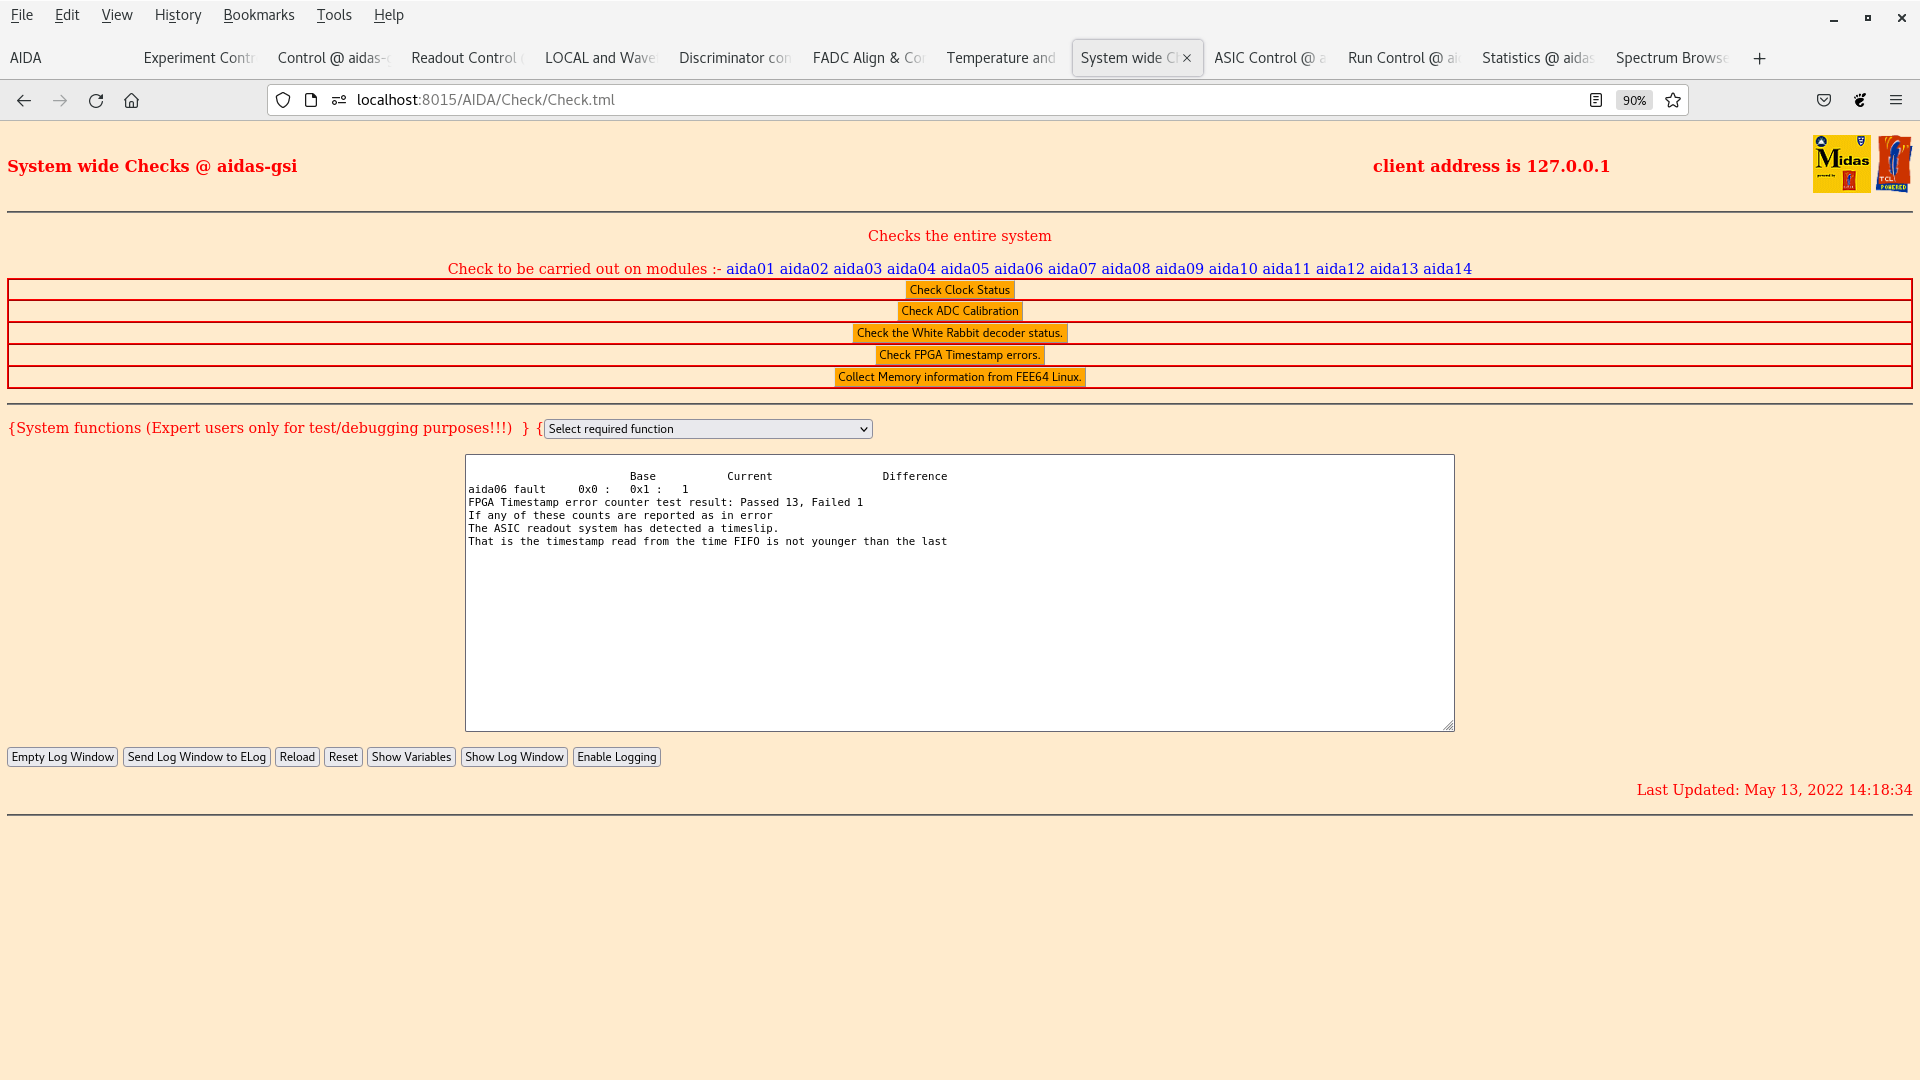
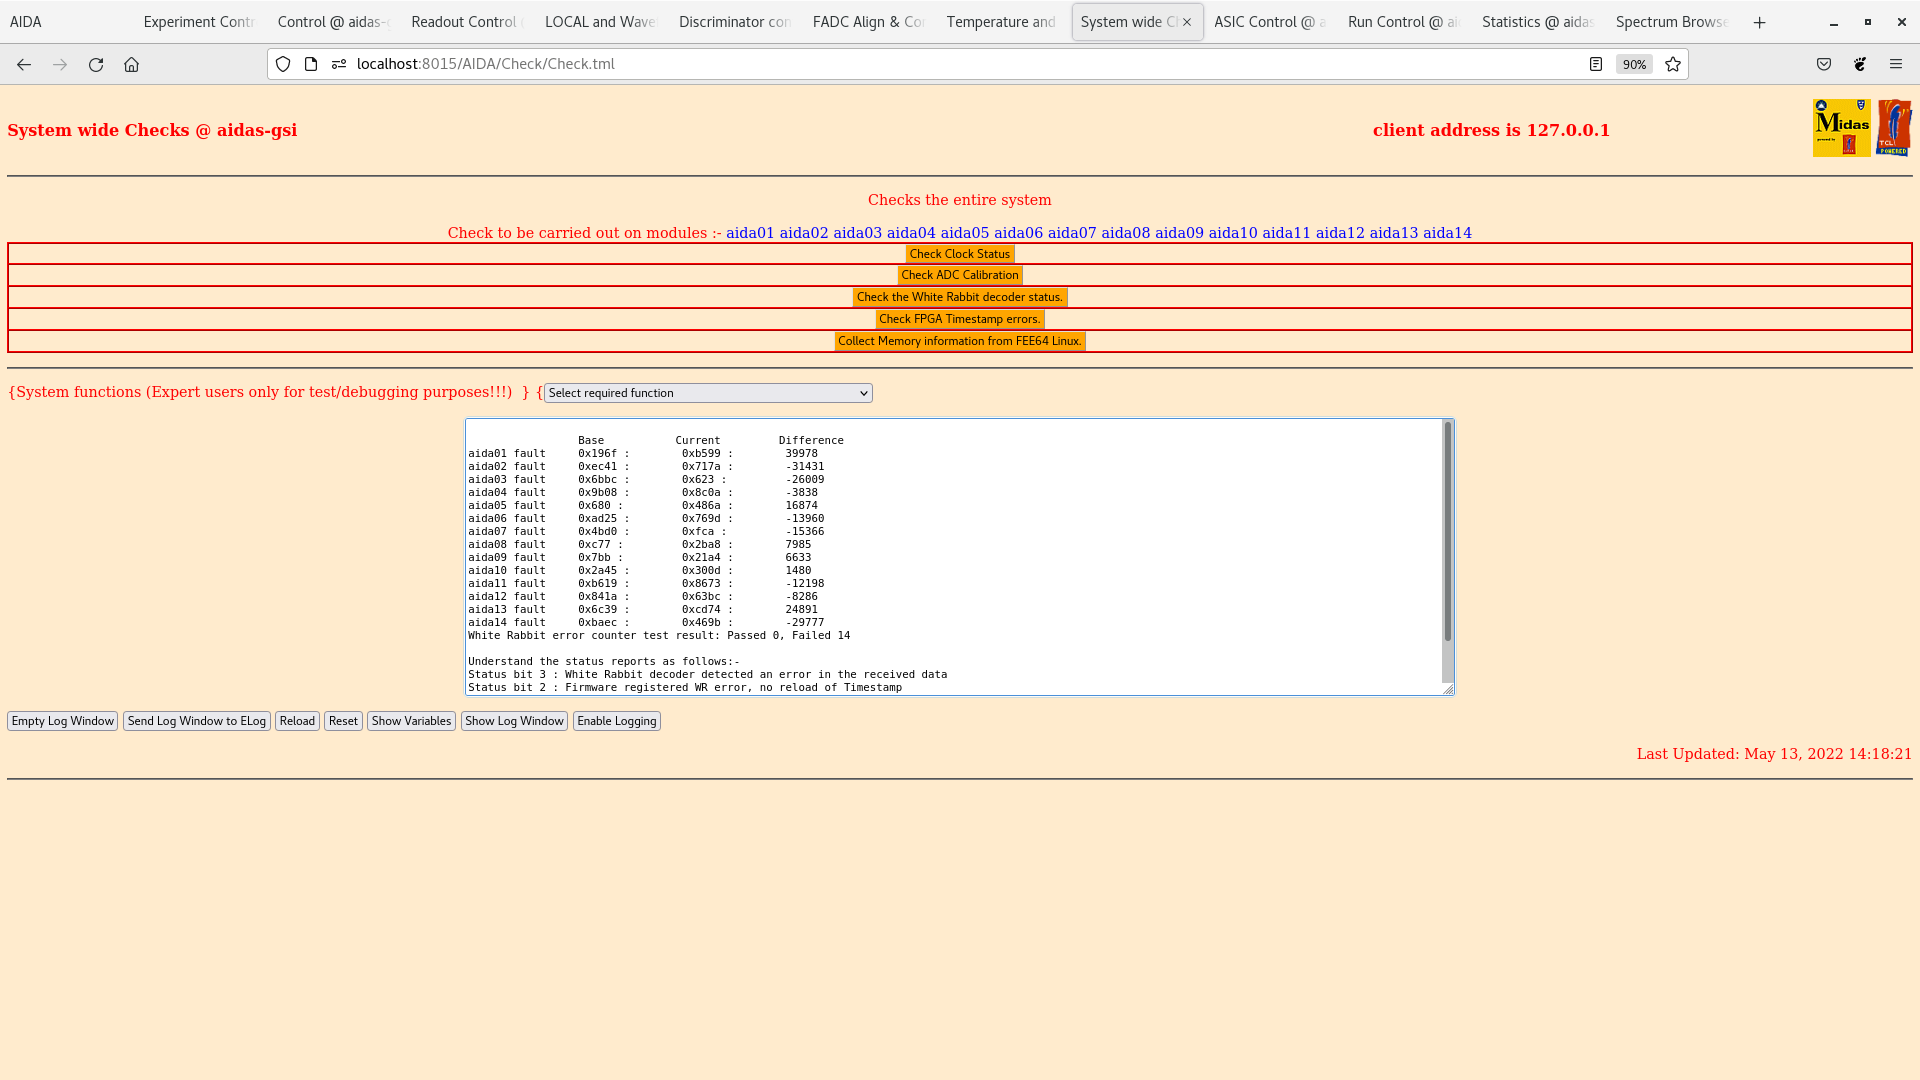
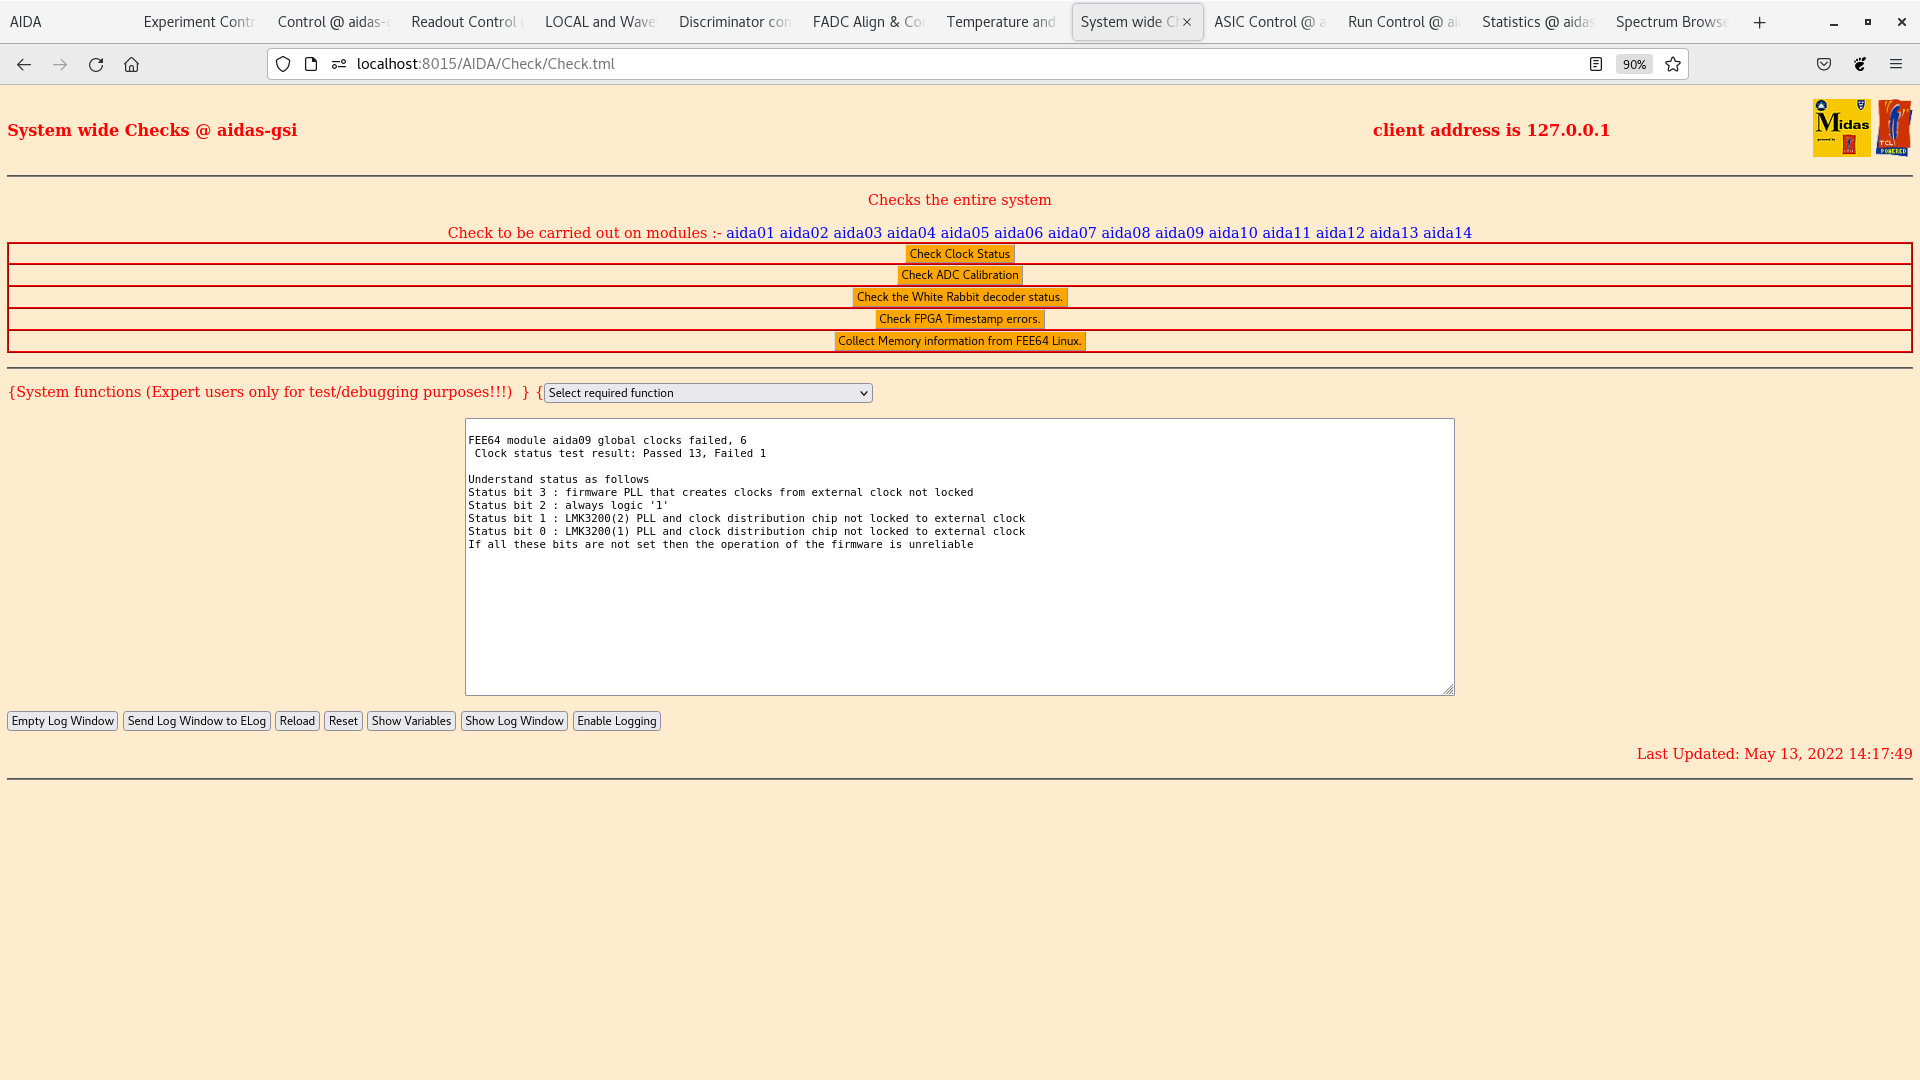
Attachments 19-22 - system wide checks
 aida09 clock status 6, WR decoder status errors

Attachments 23-26 - adc, pause, resume correlation sclaer data item stats

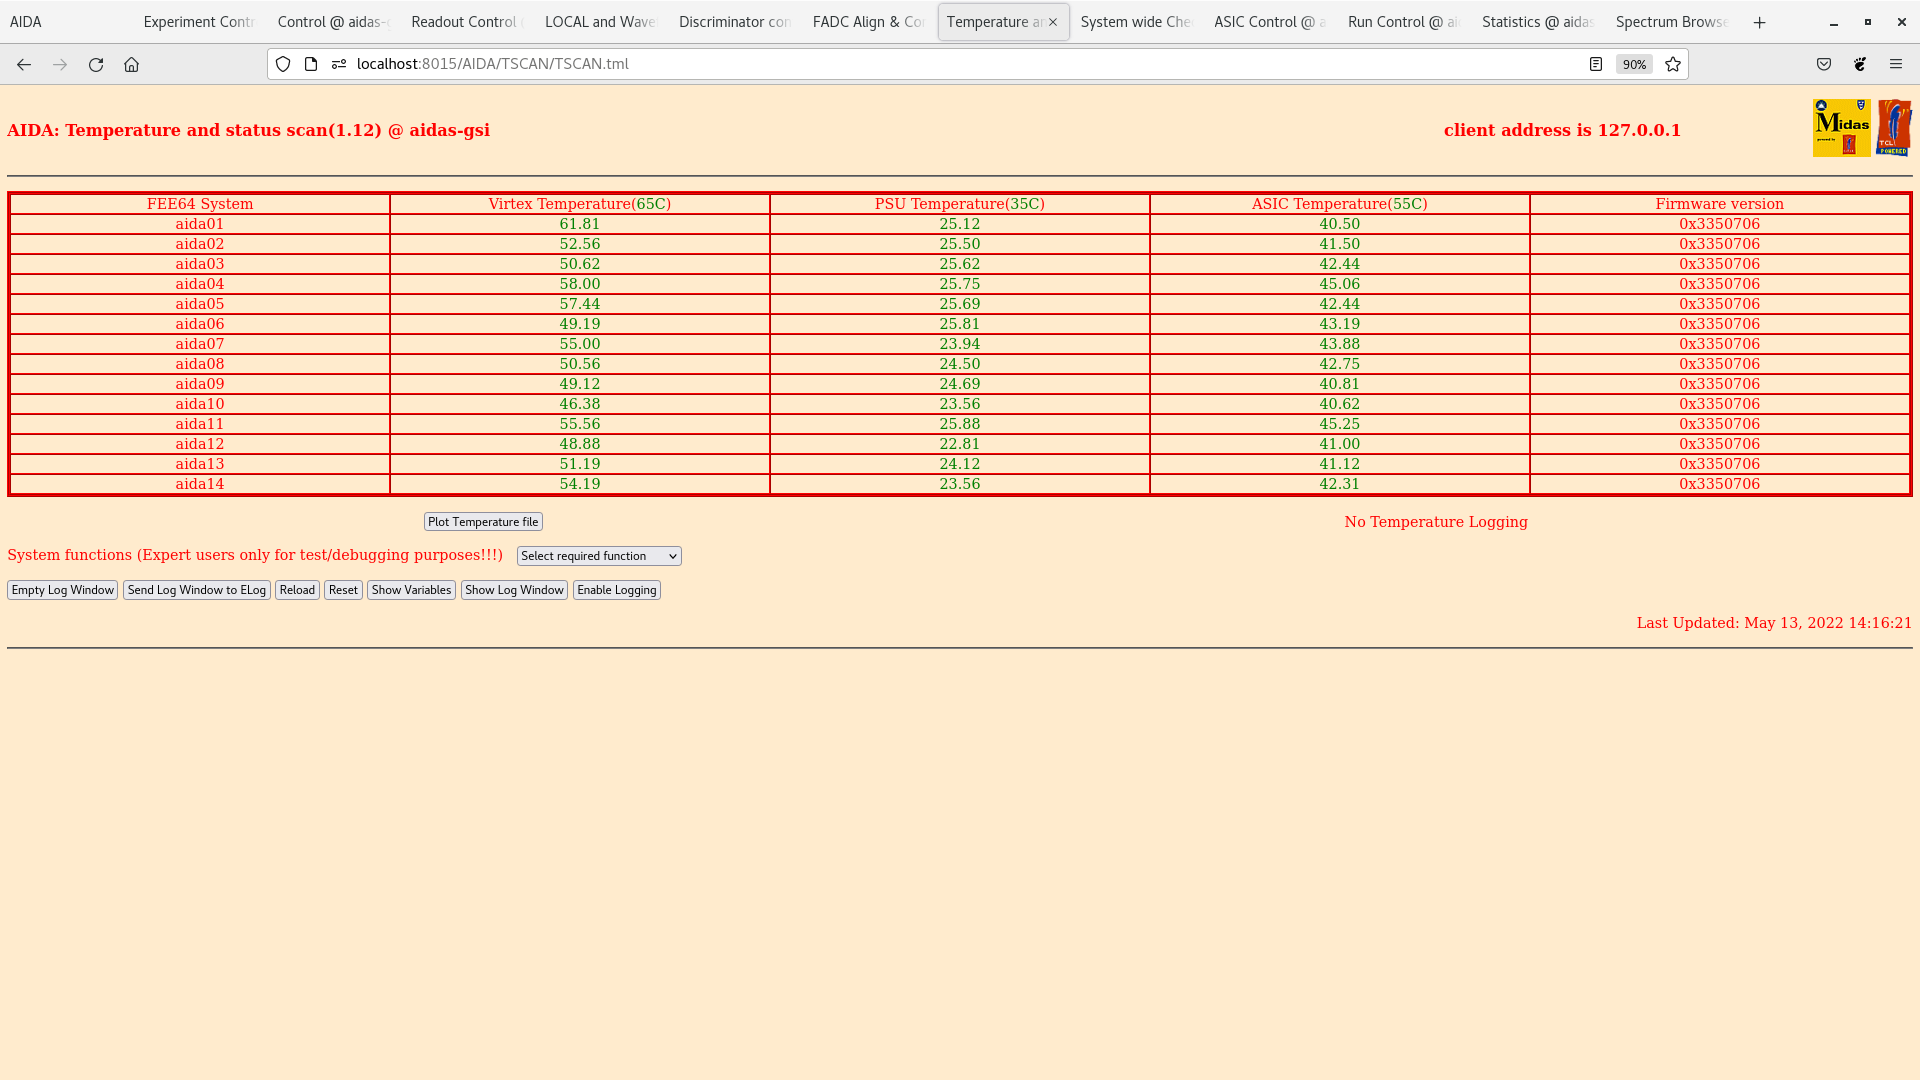
Attachment 27 - FEE64 temps OK

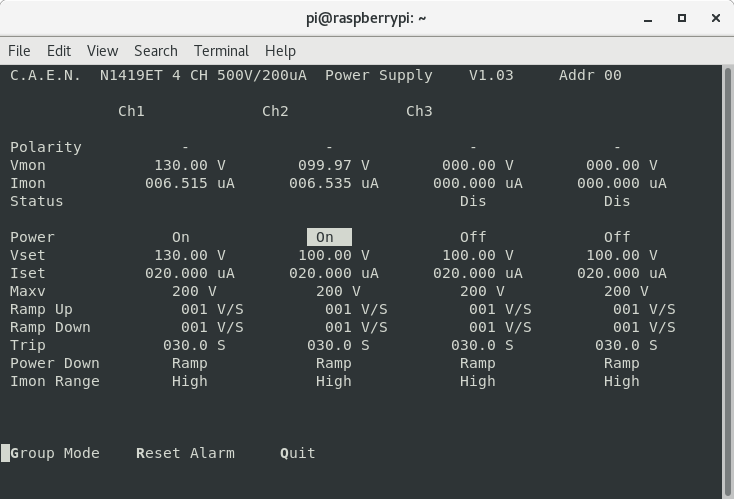
Attachment 28 - DSSSSD bias and leakage currents OK

14.30 check ASIC load

14.47 attachment 29 - analysis S450/R4_38

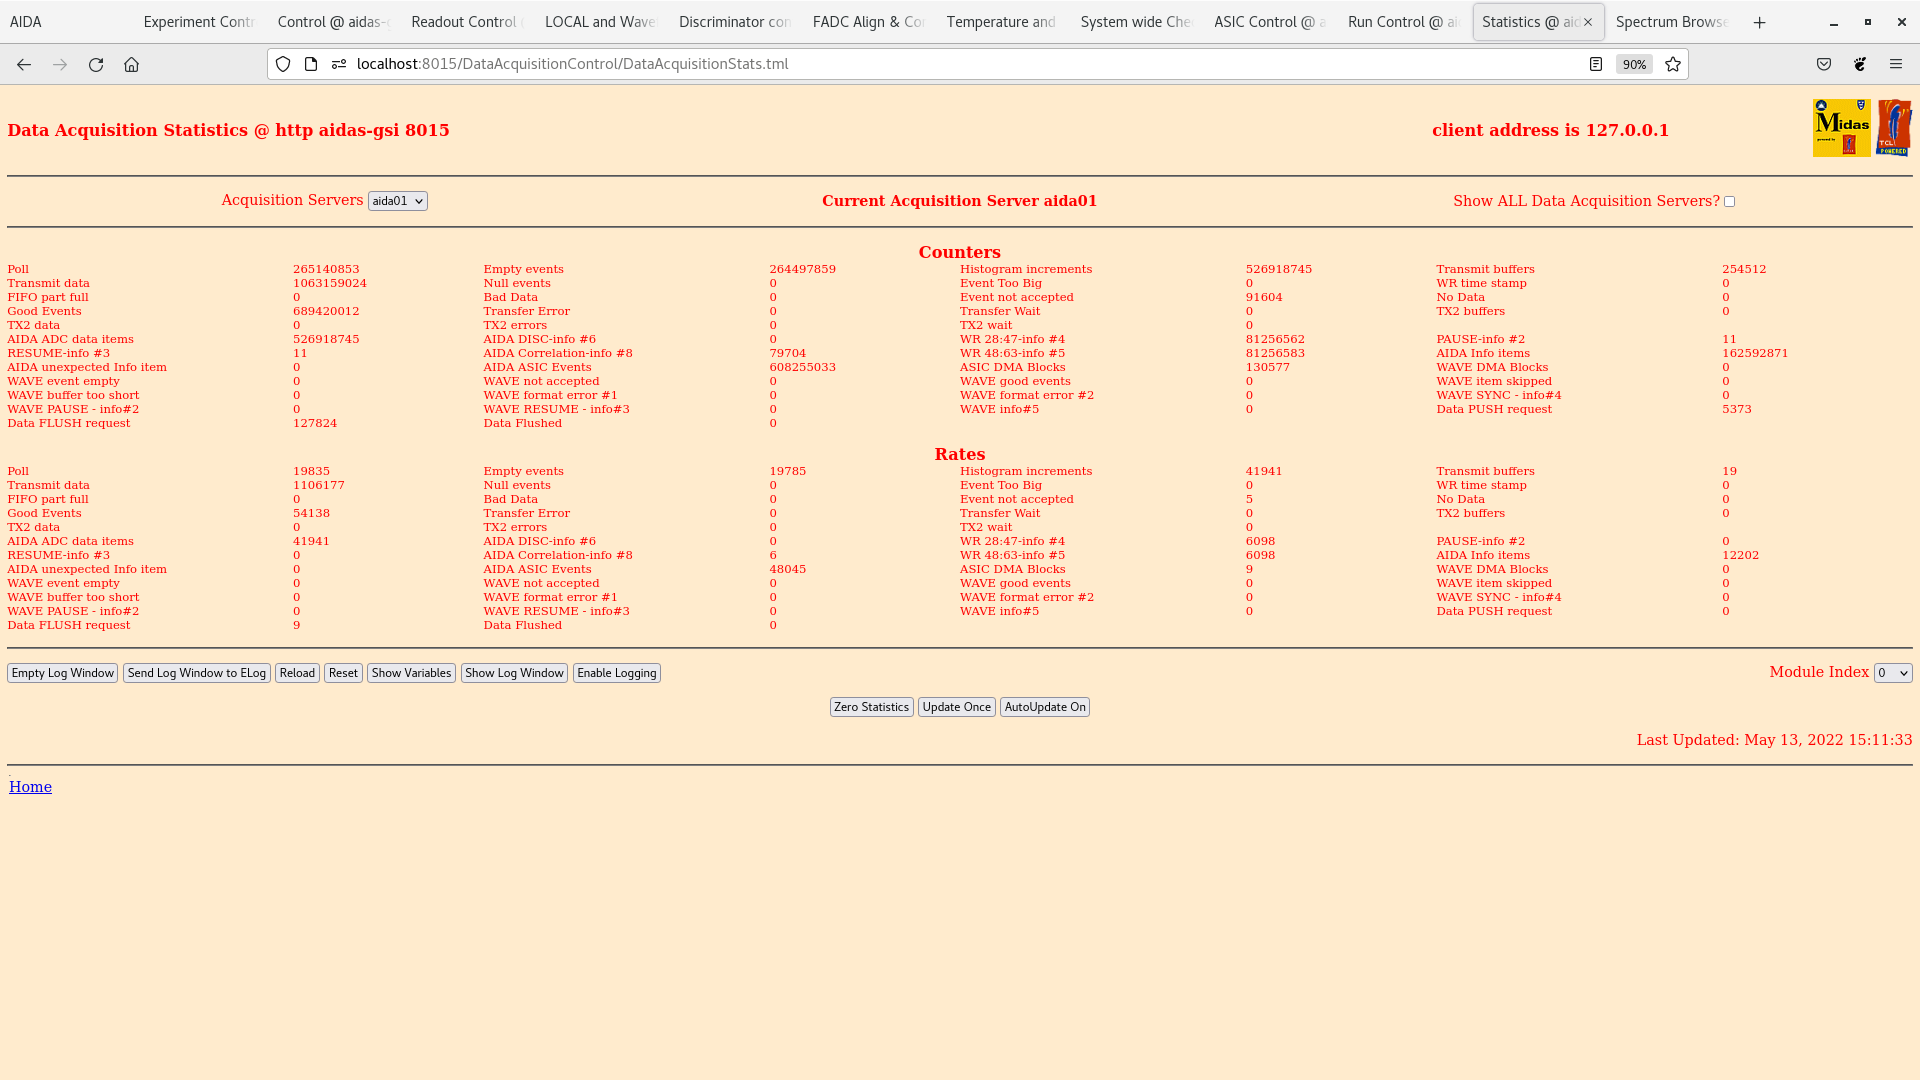
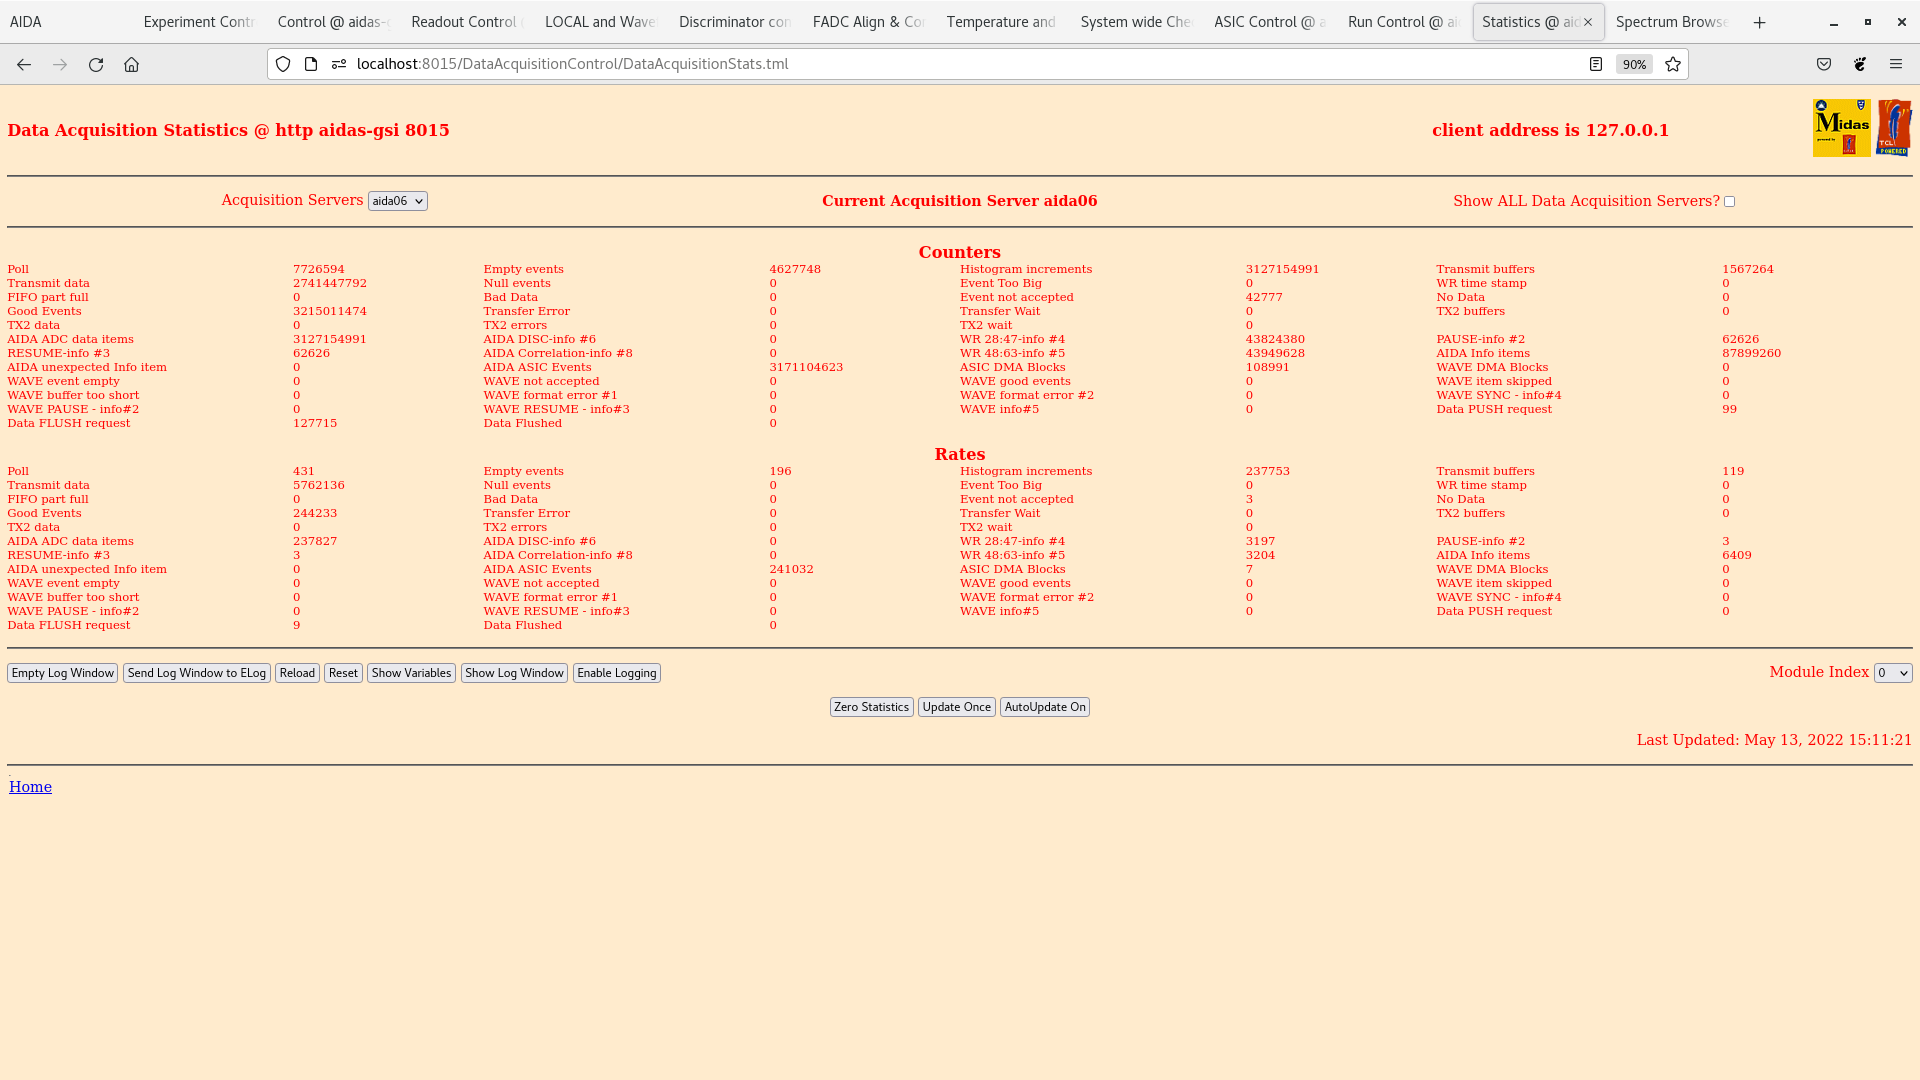
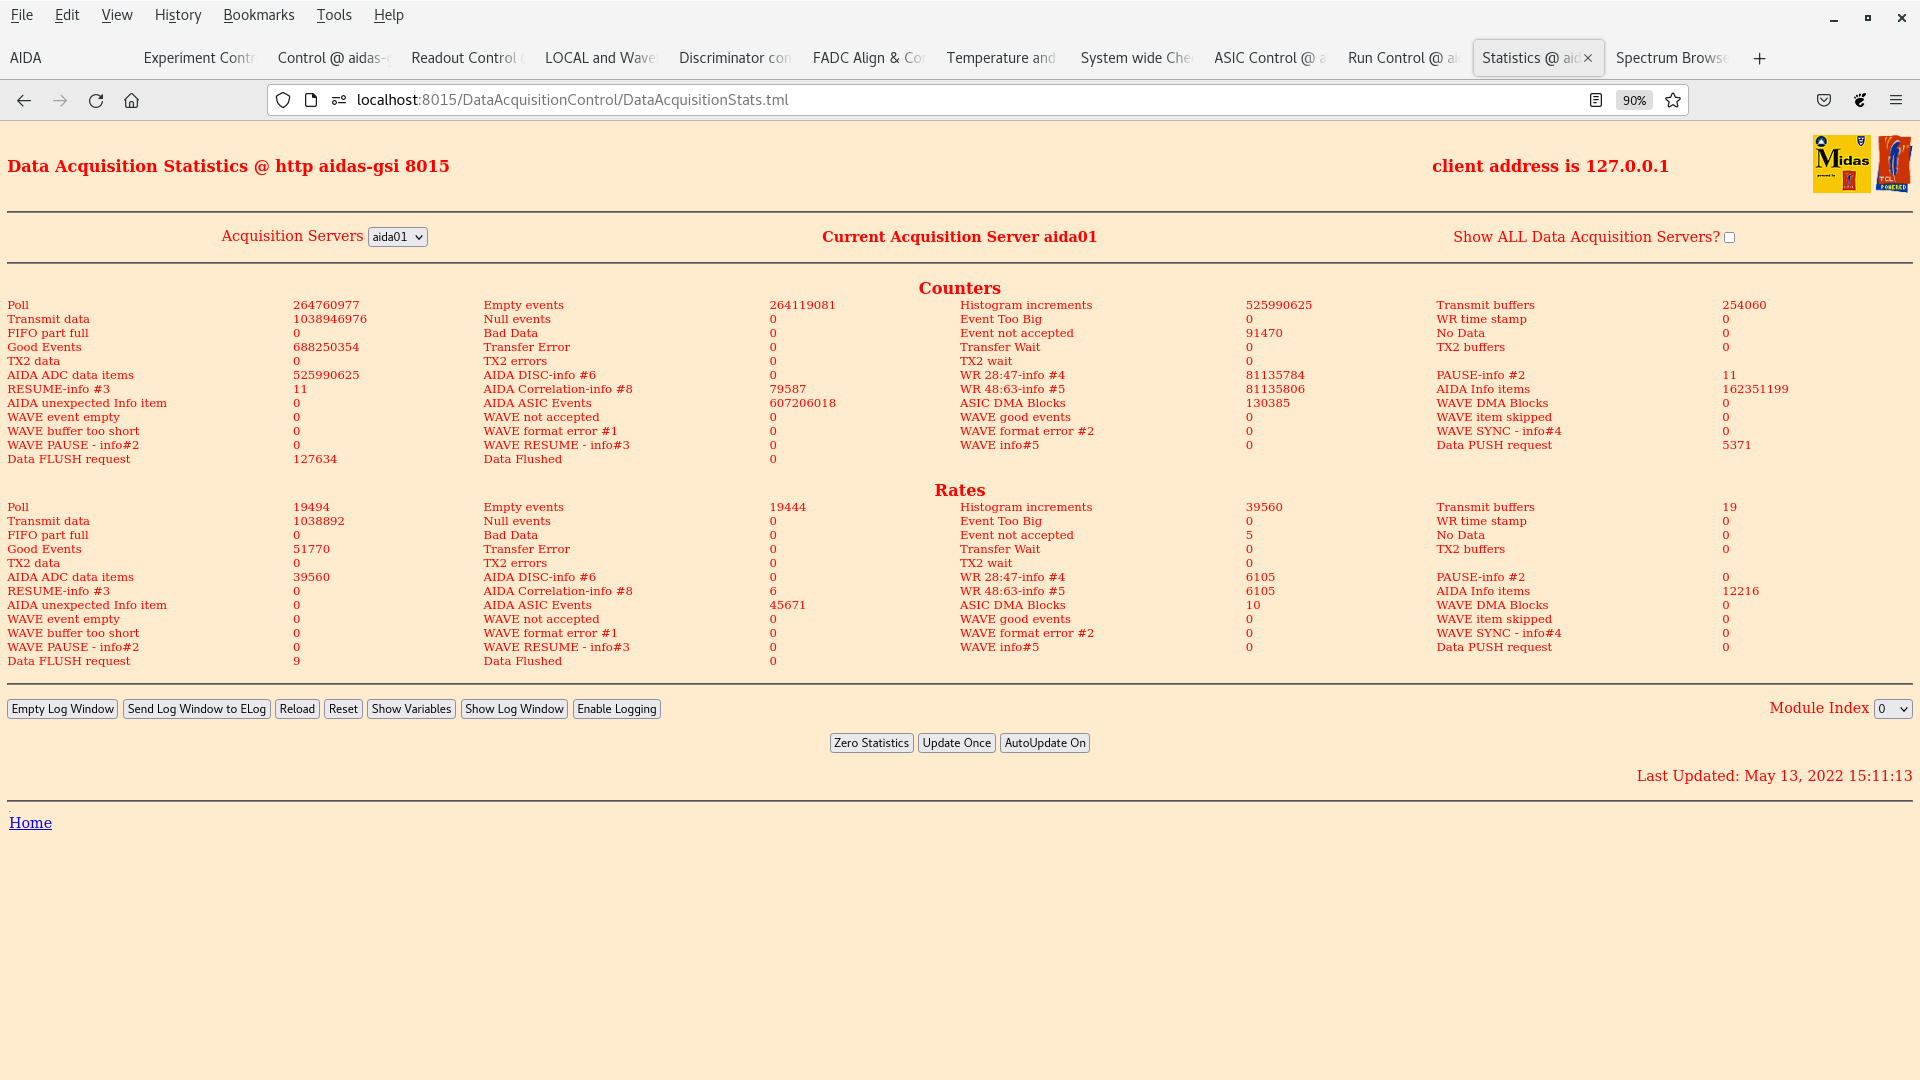
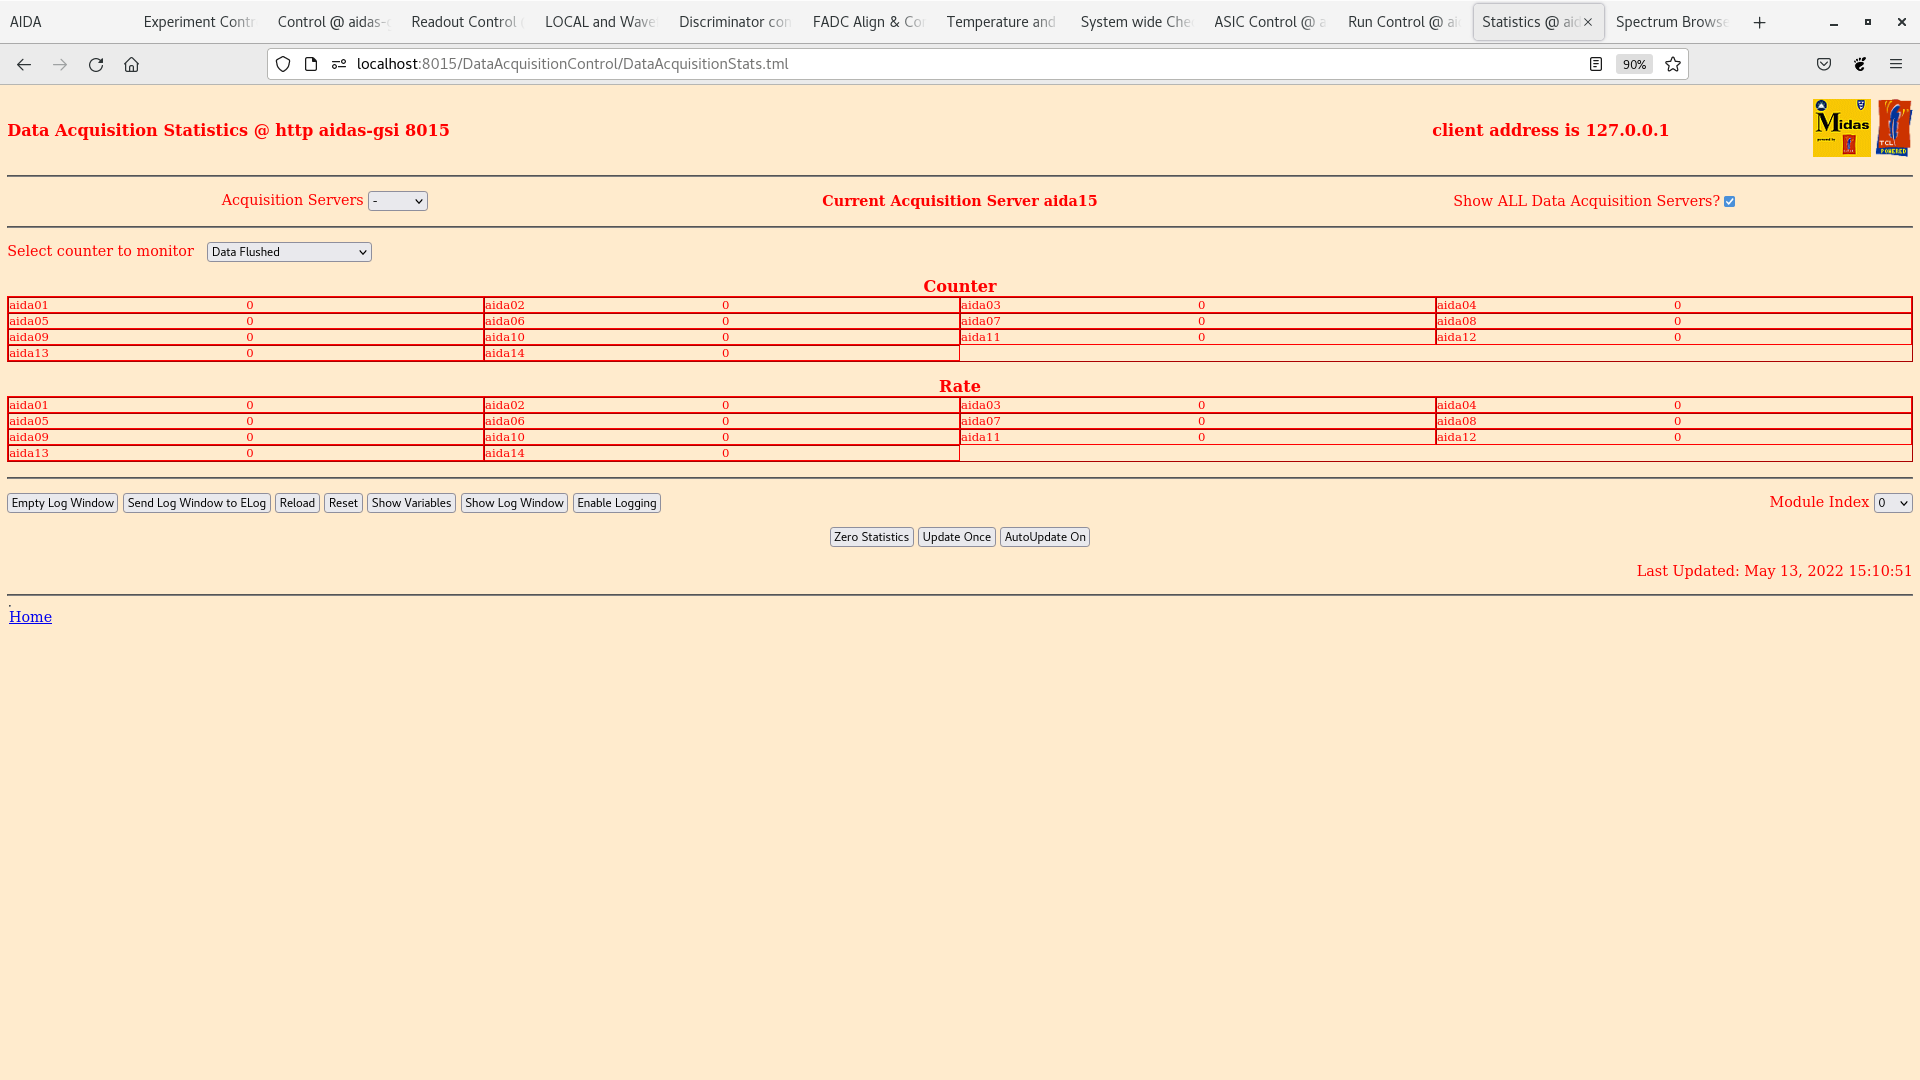
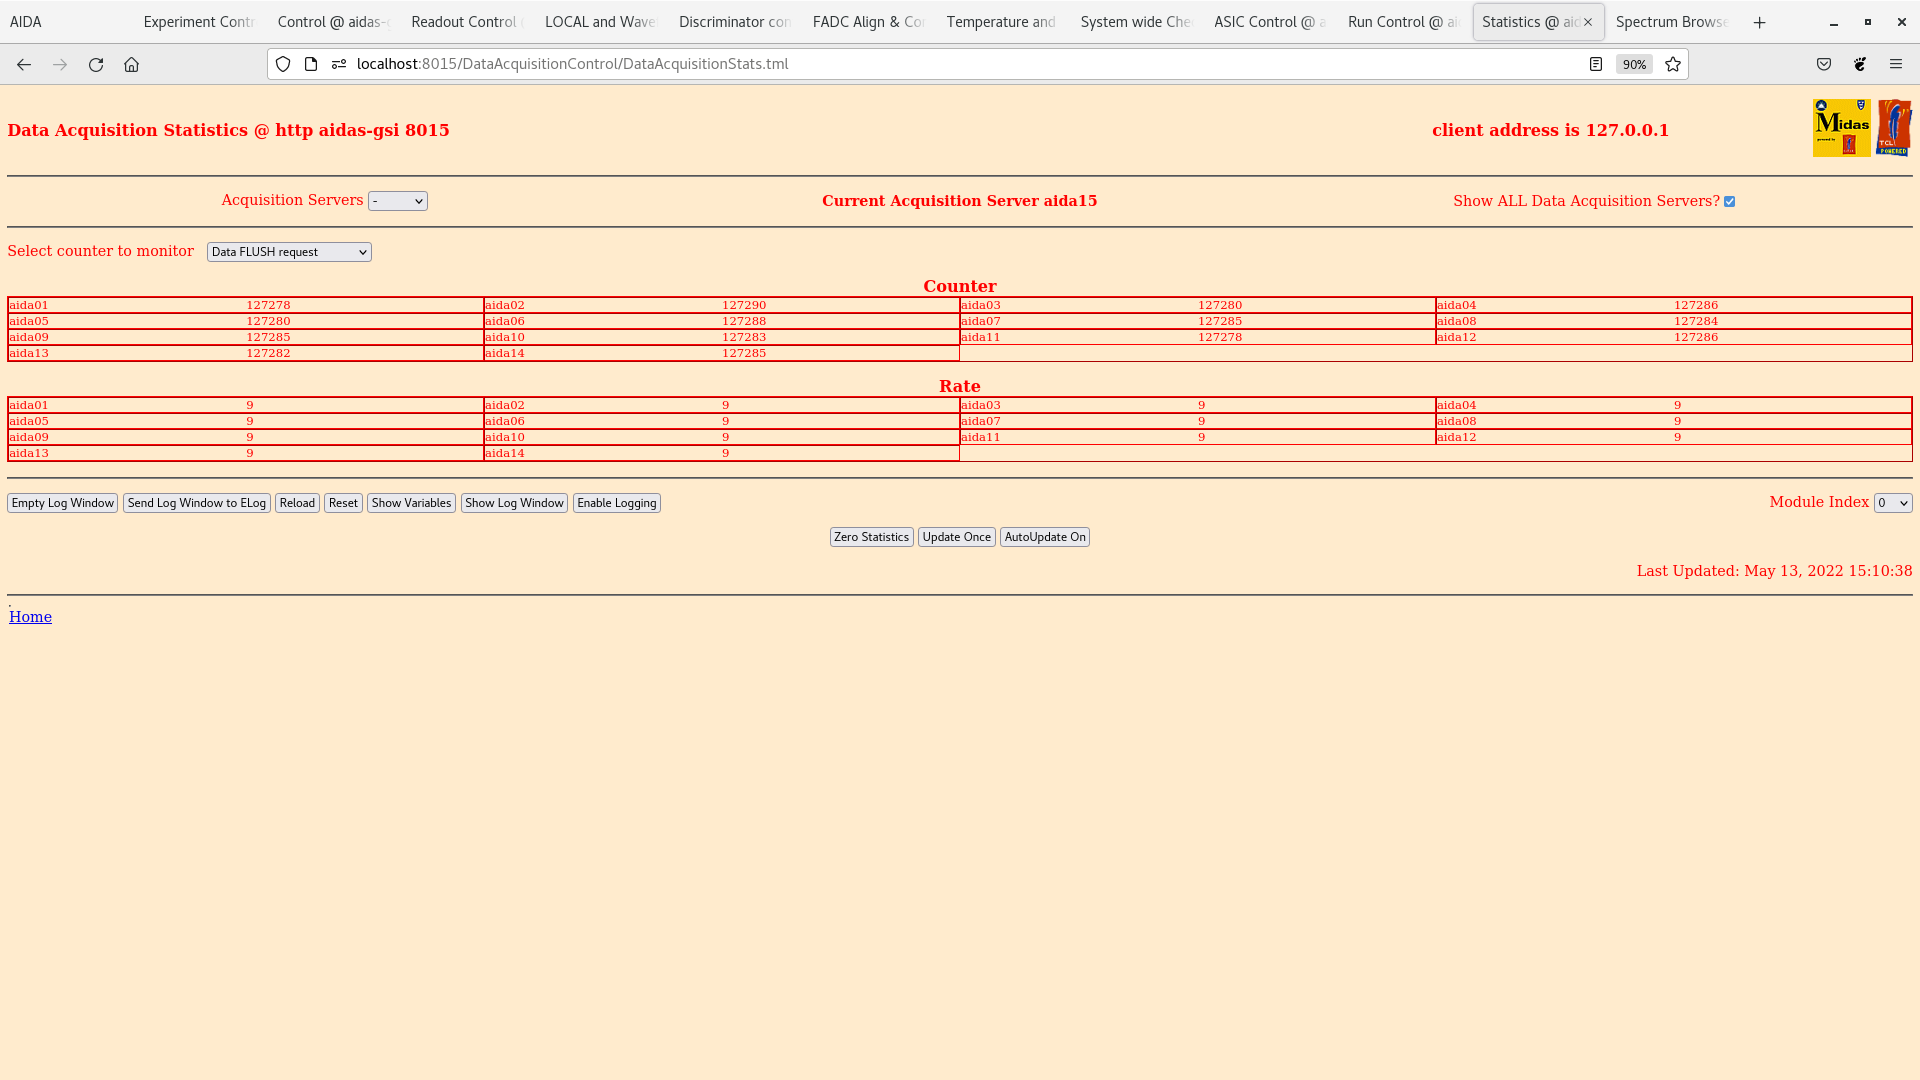
15.11 Attachments 30-35 - data push, flush stats for all FEE64s and aida01 (low ADC data item rate) and aida06 (high ADC data item rate) |
| Attachment 1: 220513_0839_R1_327_analysis.txt
|
*** TDR format 3.3.0 analyser - TD - May 2021
*** ERROR: READ I/O error: 5002
blocks: 32000
ADC data format: 259232212 ( 1719602.4 Hz)
Other data format: 2687788 ( 17829.3 Hz)
Sample trace data format: 0 ( 0.0 Hz)
Undefined format: 0 ( 0.0 Hz)
Other data format type: PAUSE: 986 ( 6.5 Hz)
RESUME: 986 ( 6.5 Hz)
SYNC100: 32562 ( 216.0 Hz)
WR48-63: 32562 ( 216.0 Hz)
FEE64 disc: 0 ( 0.0 Hz)
MBS info: 2620692 ( 17384.2 Hz)
Other info: 0 ( 0.0 Hz)
ADC data range bit set: 130683 ( 866.9 Hz)
Timewarps: ADC: 0 ( 0.0 Hz)
PAUSE: 0 ( 0.0 Hz)
RESUME: 0 ( 0.0 Hz)
SYNC100: 0 ( 0.0 Hz)
WR48-63: 0 ( 0.0 Hz)
FEE64 disc: 0 ( 0.0 Hz)
MBS info: 0 ( 0.0 Hz)
Undefined: 0 ( 0.0 Hz)
Sample trace: 0 ( 0.0 Hz)
*** Timestamp elapsed time: 150.751 s
FEE elapsed dead time(s) elapsed idle time(s)
0 0.085 0.000
1 9.978 0.000
2 0.059 0.000
3 21.640 0.000
4 0.158 0.000
5 66.897 0.000
6 1.778 0.000
7 36.972 0.000
8 0.172 0.000
9 0.018 0.000
10 0.000 7.315
11 28.135 0.000
12 0.007 0.000
13 0.000 3.034
14 0.000 0.000
15 0.000 0.000
16 0.000 0.000
17 0.000 0.000
18 0.000 0.000
19 0.000 0.000
20 0.000 0.000
21 0.000 0.000
22 0.000 0.000
23 0.000 0.000
24 0.000 0.000
25 0.000 0.000
26 0.000 0.000
27 0.000 0.000
28 0.000 0.000
29 0.000 0.000
30 0.000 0.000
31 0.000 0.000
32 0.000 0.000
*** Statistics
FEE ADC Data Other Data Sample Undefined Pause Resume SYNC100 WR48-63 Disc MBS Other HEC Data
0 7933827 2887 0 0 5 5 987 987 0 903 0 1141
1 37526918 9508 0 0 50 50 4704 4704 0 0 0 122502
2 8368319 1400718 0 0 2 2 1222 1222 0 1398270 0 647
3 39185673 1207805 0 0 156 156 5116 5116 0 1197261 0 703
4 4609566 1178 0 0 5 5 584 584 0 0 0 1170
5 40049357 10540 0 0 309 309 4961 4961 0 0 0 297
6 13162553 17502 0 0 13 13 1685 1685 0 14106 0 302
7 41199857 20850 0 0 248 248 5101 5101 0 10152 0 241
8 12021437 2864 0 0 5 5 1427 1427 0 0 0 467
9 4748197 1188 0 0 2 2 592 592 0 0 0 1165
10 3089949 744 0 0 0 0 372 372 0 0 0 247
11 38258323 9856 0 0 190 190 4738 4738 0 0 0 1052
12 6307578 1518 0 0 1 1 758 758 0 0 0 311
13 2770658 630 0 0 0 0 315 315 0 0 0 438
14 0 0 0 0 0 0 0 0 0 0 0 0
15 0 0 0 0 0 0 0 0 0 0 0 0
16 0 0 0 0 0 0 0 0 0 0 0 0
17 0 0 0 0 0 0 0 0 0 0 0 0
18 0 0 0 0 0 0 0 0 0 0 0 0
19 0 0 0 0 0 0 0 0 0 0 0 0
20 0 0 0 0 0 0 0 0 0 0 0 0
21 0 0 0 0 0 0 0 0 0 0 0 0
22 0 0 0 0 0 0 0 0 0 0 0 0
23 0 0 0 0 0 0 0 0 0 0 0 0
24 0 0 0 0 0 0 0 0 0 0 0 0
25 0 0 0 0 0 0 0 0 0 0 0 0
26 0 0 0 0 0 0 0 0 0 0 0 0
27 0 0 0 0 0 0 0 0 0 0 0 0
28 0 0 0 0 0 0 0 0 0 0 0 0
29 0 0 0 0 0 0 0 0 0 0 0 0
30 0 0 0 0 0 0 0 0 0 0 0 0
31 0 0 0 0 0 0 0 0 0 0 0 0
32 0 0 0 0 0 0 0 0 0 0 0 0
*** Timewarps
FEE ADC Pause Resume SYNC100 WR48-63 Disc MBS Undefined Samples
0 0 0 0 0 0 0 0 0 0
1 0 0 0 0 0 0 0 0 0
2 0 0 0 0 0 0 0 0 0
3 0 0 0 0 0 0 0 0 0
4 0 0 0 0 0 0 0 0 0
5 0 0 0 0 0 0 0 0 0
6 0 0 0 0 0 0 0 0 0
7 0 0 0 0 0 0 0 0 0
8 0 0 0 0 0 0 0 0 0
9 0 0 0 0 0 0 0 0 0
10 0 0 0 0 0 0 0 0 0
11 0 0 0 0 0 0 0 0 0
12 0 0 0 0 0 0 0 0 0
13 0 0 0 0 0 0 0 0 0
14 0 0 0 0 0 0 0 0 0
15 0 0 0 0 0 0 0 0 0
16 0 0 0 0 0 0 0 0 0
17 0 0 0 0 0 0 0 0 0
18 0 0 0 0 0 0 0 0 0
19 0 0 0 0 0 0 0 0 0
20 0 0 0 0 0 0 0 0 0
21 0 0 0 0 0 0 0 0 0
22 0 0 0 0 0 0 0 0 0
23 0 0 0 0 0 0 0 0 0
24 0 0 0 0 0 0 0 0 0
25 0 0 0 0 0 0 0 0 0
26 0 0 0 0 0 0 0 0 0
27 0 0 0 0 0 0 0 0 0
28 0 0 0 0 0 0 0 0 0
29 0 0 0 0 0 0 0 0 0
30 0 0 0 0 0 0 0 0 0
31 0 0 0 0 0 0 0 0 0
32 0 0 0 0 0 0 0 0 0
*** Program elapsed time: 33.600s ( 952.392 blocks/s, 59.525 Mb/s)
|
| Attachment 2: Screenshot_from_2022-05-13_14-28-00.png
|
|
| Attachment 3: Screenshot_from_2022-05-13_14-27-51.png
|
|
| Attachment 4: Screenshot_from_2022-05-13_14-27-31.png
|

|
| Attachment 5: Screenshot_from_2022-05-13_14-27-17.png
|
|
| Attachment 6: Screenshot_from_2022-05-13_14-26-32.png
|
|
| Attachment 7: Screenshot_from_2022-05-13_14-26-26.png
|

|
| Attachment 8: Screenshot_from_2022-05-13_14-26-21.png
|
|
| Attachment 9: Screenshot_from_2022-05-13_14-26-08.png
|
|
| Attachment 10: Screenshot_from_2022-05-13_14-25-46.png
|

|
| Attachment 11: Screenshot_from_2022-05-13_14-25-38.png
|
|
| Attachment 12: Screenshot_from_2022-05-13_14-25-22.png
|

|
| Attachment 13: Screenshot_from_2022-05-13_14-24-07.png
|
|
| Attachment 14: Screenshot_from_2022-05-13_14-22-44.png
|
|
| Attachment 15: Screenshot_from_2022-05-13_14-21-16.png
|

|
| Attachment 16: Screenshot_from_2022-05-13_14-21-04.png
|
|
| Attachment 17: Screenshot_from_2022-05-13_14-20-34.png
|
|
| Attachment 18: Screenshot_from_2022-05-13_14-20-14.png
|
|
| Attachment 19: Screenshot_from_2022-05-13_14-19-10.png
|
|
| Attachment 20: Screenshot_from_2022-05-13_14-18-40.png
|
|
| Attachment 21: Screenshot_from_2022-05-13_14-18-31.png
|
|
| Attachment 22: Screenshot_from_2022-05-13_14-18-14.png
|
|
| Attachment 23: Screenshot_from_2022-05-13_14-17-38.png
|

|
| Attachment 24: Screenshot_from_2022-05-13_14-17-23.png
|

|
| Attachment 25: Screenshot_from_2022-05-13_14-17-09.png
|

|
| Attachment 26: Screenshot_from_2022-05-13_14-16-56.png
|

|
| Attachment 27: Screenshot_from_2022-05-13_14-16-30.png
|
|
| Attachment 28: Screenshot_from_2022-05-13_14-16-11.png
|
|
| Attachment 29: R4_38.txt
|
*** TDR format 3.3.0 analyser - TD - May 2021
*** ERROR: READ I/O error: 5002
blocks: 32000
ADC data format: 259102731 ( 1572653.5 Hz)
Other data format: 2817271 ( 17099.7 Hz)
Sample trace data format: 0 ( 0.0 Hz)
Undefined format: 0 ( 0.0 Hz)
Other data format type: PAUSE: 2412 ( 14.6 Hz)
RESUME: 2414 ( 14.7 Hz)
SYNC100: 32614 ( 198.0 Hz)
WR48-63: 32614 ( 198.0 Hz)
FEE64 disc: 0 ( 0.0 Hz)
MBS info: 2747217 ( 16674.5 Hz)
Other info: 0 ( 0.0 Hz)
ADC data range bit set: 30594 ( 185.7 Hz)
Timewarps: ADC: 0 ( 0.0 Hz)
PAUSE: 0 ( 0.0 Hz)
RESUME: 0 ( 0.0 Hz)
SYNC100: 0 ( 0.0 Hz)
WR48-63: 0 ( 0.0 Hz)
FEE64 disc: 0 ( 0.0 Hz)
MBS info: 0 ( 0.0 Hz)
Undefined: 0 ( 0.0 Hz)
Sample trace: 0 ( 0.0 Hz)
*** Timestamp elapsed time: 164.755 s
FEE elapsed dead time(s) elapsed idle time(s)
0 0.000 0.000
1 5.297 0.000
2 0.000 0.000
3 18.287 0.000
4 0.000 0.000
5 77.894 0.000
6 0.000 0.000
7 25.402 0.000
8 0.001 0.000
9 0.000 0.000
10 0.000 2.705
11 15.617 0.000
12 0.000 0.000
13 0.000 29.550
14 0.000 0.000
15 0.000 0.000
16 0.000 0.000
17 0.000 0.000
18 0.000 0.000
19 0.000 0.000
20 0.000 0.000
21 0.000 0.000
22 0.000 0.000
23 0.000 0.000
24 0.000 0.000
25 0.000 0.000
26 0.000 0.000
27 0.000 0.000
28 0.000 0.000
29 0.000 0.000
30 0.000 0.000
31 0.000 0.000
32 0.000 0.000
*** Statistics
FEE ADC Data Other Data Sample Undefined Pause Resume SYNC100 WR48-63 Disc MBS Other HEC Data
0 6844719 2775 0 0 0 0 894 894 0 987 0 375
1 39920437 10378 0 0 277 277 4912 4912 0 0 0 27546
2 7063505 1453891 0 0 0 0 1085 1085 0 1451721 0 328
3 42633132 1301928 0 0 410 410 5590 5590 0 1289928 0 251
4 3625899 900 0 0 0 0 450 450 0 0 0 125
5 38867835 10853 0 0 768 769 4658 4658 0 0 0 129
6 7590830 4334 0 0 0 0 934 934 0 2466 0 227
7 44498336 14120 0 0 564 565 5438 5438 0 2115 0 113
8 10949373 2716 0 0 1 1 1357 1357 0 0 0 345
9 3887105 996 0 0 0 0 498 498 0 0 0 273
10 1999345 532 0 0 0 0 266 266 0 0 0 160
11 43113077 11754 0 0 392 392 5485 5485 0 0 0 288
12 6030564 1596 0 0 0 0 798 798 0 0 0 252
13 2078574 498 0 0 0 0 249 249 0 0 0 182
14 0 0 0 0 0 0 0 0 0 0 0 0
15 0 0 0 0 0 0 0 0 0 0 0 0
16 0 0 0 0 0 0 0 0 0 0 0 0
17 0 0 0 0 0 0 0 0 0 0 0 0
18 0 0 0 0 0 0 0 0 0 0 0 0
19 0 0 0 0 0 0 0 0 0 0 0 0
20 0 0 0 0 0 0 0 0 0 0 0 0
21 0 0 0 0 0 0 0 0 0 0 0 0
22 0 0 0 0 0 0 0 0 0 0 0 0
23 0 0 0 0 0 0 0 0 0 0 0 0
24 0 0 0 0 0 0 0 0 0 0 0 0
25 0 0 0 0 0 0 0 0 0 0 0 0
26 0 0 0 0 0 0 0 0 0 0 0 0
27 0 0 0 0 0 0 0 0 0 0 0 0
28 0 0 0 0 0 0 0 0 0 0 0 0
29 0 0 0 0 0 0 0 0 0 0 0 0
30 0 0 0 0 0 0 0 0 0 0 0 0
31 0 0 0 0 0 0 0 0 0 0 0 0
32 0 0 0 0 0 0 0 0 0 0 0 0
*** Timewarps
FEE ADC Pause Resume SYNC100 WR48-63 Disc MBS Undefined Samples
0 0 0 0 0 0 0 0 0 0
1 0 0 0 0 0 0 0 0 0
2 0 0 0 0 0 0 0 0 0
3 0 0 0 0 0 0 0 0 0
4 0 0 0 0 0 0 0 0 0
5 0 0 0 0 0 0 0 0 0
6 0 0 0 0 0 0 0 0 0
7 0 0 0 0 0 0 0 0 0
8 0 0 0 0 0 0 0 0 0
9 0 0 0 0 0 0 0 0 0
10 0 0 0 0 0 0 0 0 0
11 0 0 0 0 0 0 0 0 0
12 0 0 0 0 0 0 0 0 0
13 0 0 0 0 0 0 0 0 0
14 0 0 0 0 0 0 0 0 0
15 0 0 0 0 0 0 0 0 0
16 0 0 0 0 0 0 0 0 0
17 0 0 0 0 0 0 0 0 0
18 0 0 0 0 0 0 0 0 0
19 0 0 0 0 0 0 0 0 0
20 0 0 0 0 0 0 0 0 0
21 0 0 0 0 0 0 0 0 0
22 0 0 0 0 0 0 0 0 0
23 0 0 0 0 0 0 0 0 0
24 0 0 0 0 0 0 0 0 0
25 0 0 0 0 0 0 0 0 0
26 0 0 0 0 0 0 0 0 0
27 0 0 0 0 0 0 0 0 0
28 0 0 0 0 0 0 0 0 0
29 0 0 0 0 0 0 0 0 0
30 0 0 0 0 0 0 0 0 0
31 0 0 0 0 0 0 0 0 0
32 0 0 0 0 0 0 0 0 0
*** Program elapsed time: 32.668s ( 979.553 blocks/s, 61.222 Mb/s)
|
| Attachment 30: Screenshot_from_2022-05-13_15-11-36.png
|
|
| Attachment 31: Screenshot_from_2022-05-13_15-11-29.png
|
|
| Attachment 32: Screenshot_from_2022-05-13_15-11-17.png
|
|
| Attachment 33: Screenshot_from_2022-05-13_15-10-55.png
|
|
| Attachment 34: Screenshot_from_2022-05-13_15-10-41.png
|
|
| Attachment 35: Screenshot_from_2022-05-13_15-10-30.png
|

|
|
|
486
|
Mon Jun 20 09:26:23 2022 |
OH, TD | Monday 20 June |
10:26 MACB HDMI for AIDA03 and AIDA04 reseated.
      Merger and DAQ restarted - All happily sending data
      Has been running for 10 minutes with no WR errors.
      Rates from yesterday achieved again.

      DTAS will move back into position at some point.
      Once this is done, will perform pulser walkthrough.


11:14 DTAS now back in position for experiment
      Slight increase in noise noticed across a few FEEs
      Over time this has decreased on all but AIDA07 which is now running at ~80k - attachment 1
      AIDA03 is now however gaining white rabbit errors at a rate of 1 every few minutes.
      Less frequently gaining FPGA errors

12:20 AIDA power cycle to reseat the HDMI for AIDA03 - It would eventually crash if not done
      Upon powering up again rates in AIDA08 slightly worse - attachment 2

13:26 No WR errors since the last power cycle.

21:16 Baseline system wide checks, zero histograms & stats

All system wide checks OK

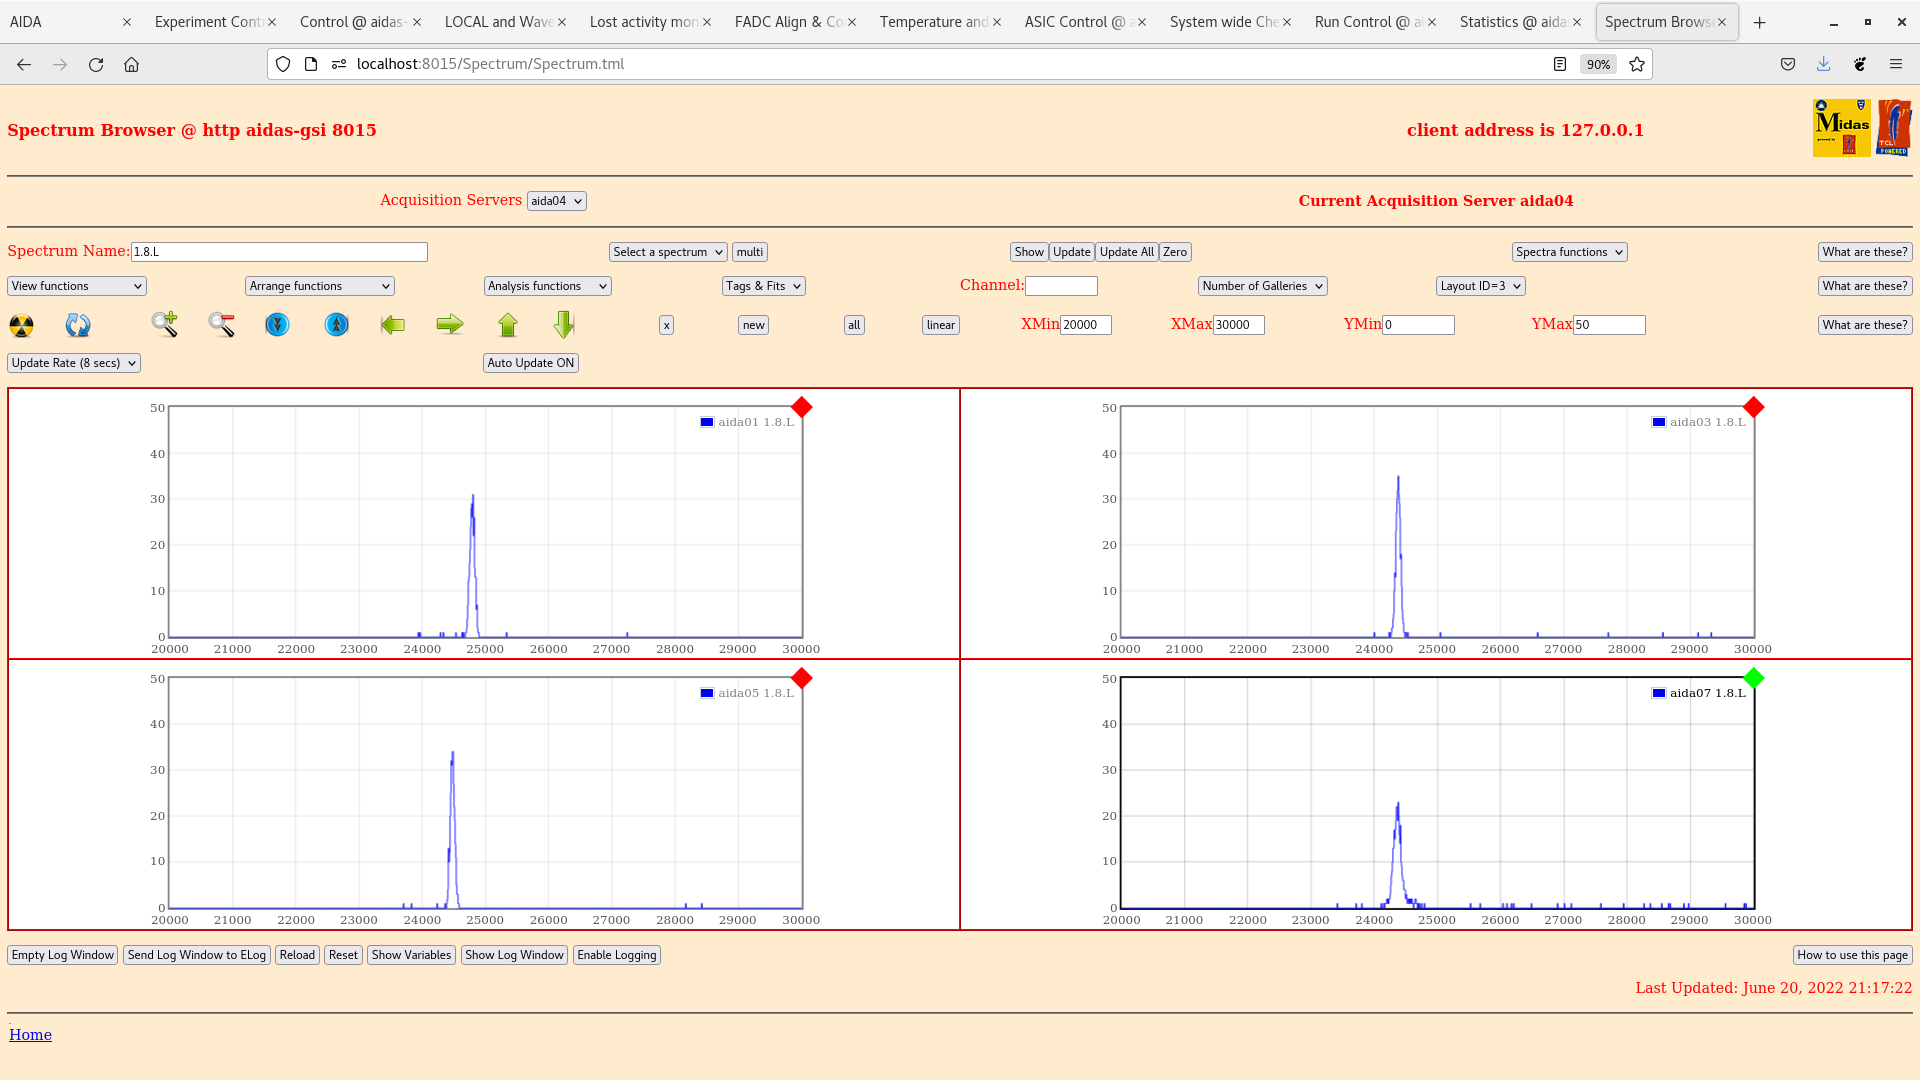
per p+n FEE64 1.8.L spectra - attachment 3
 aida01 pulser peak width 82 channels FWHM

per FEE64 rate spectra - attachment 4

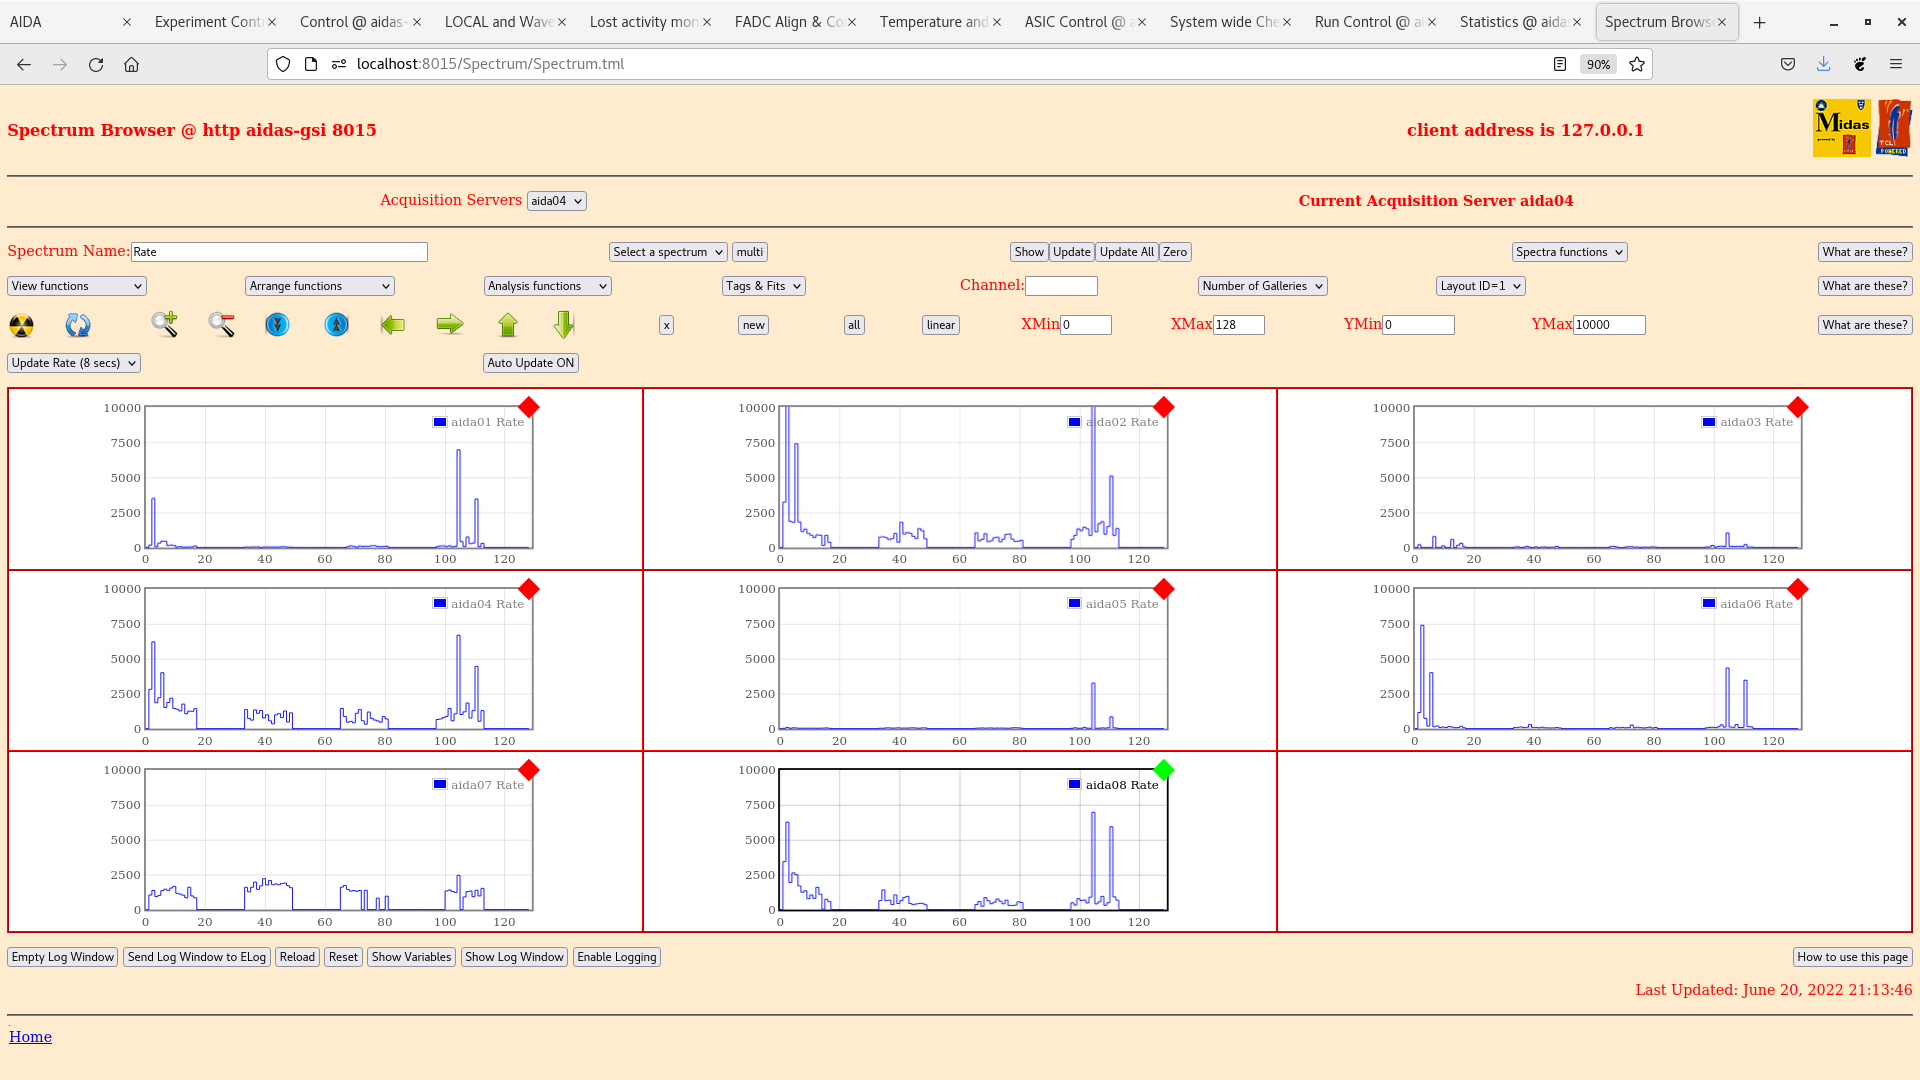
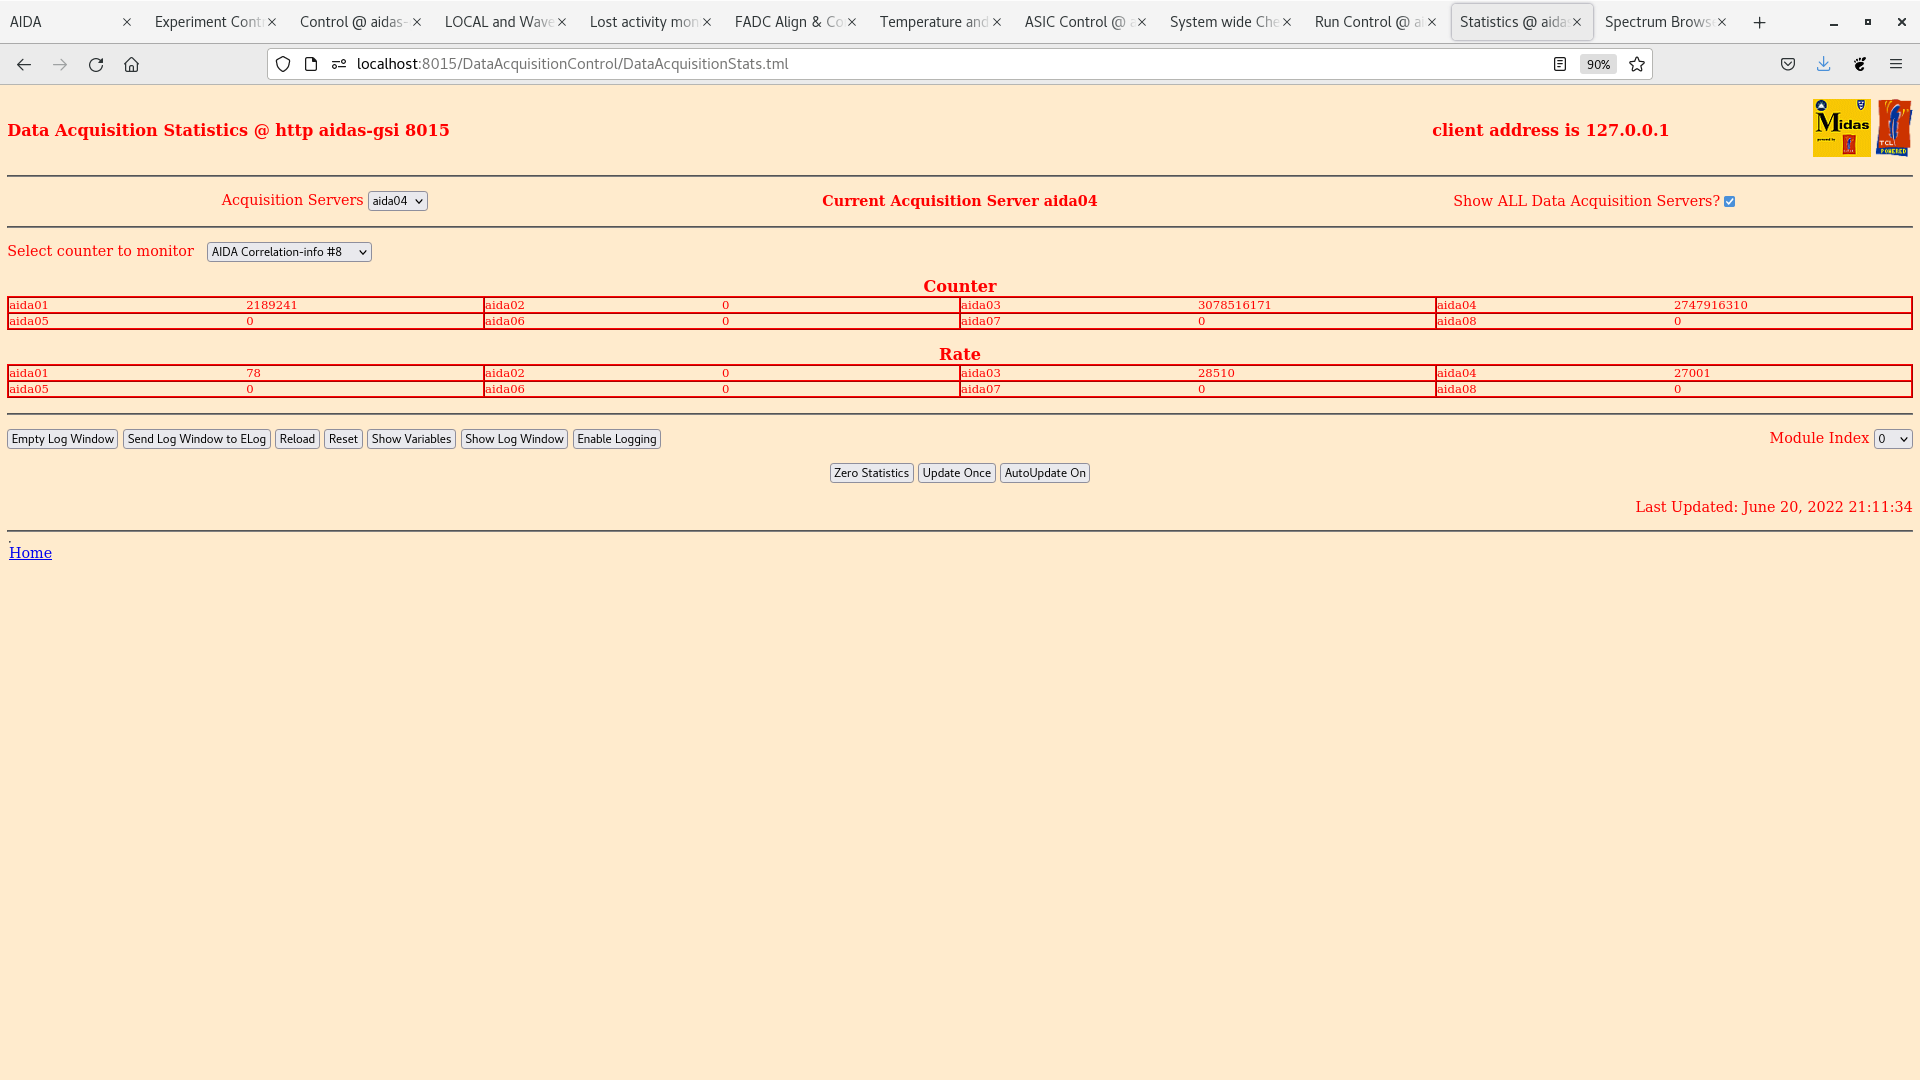
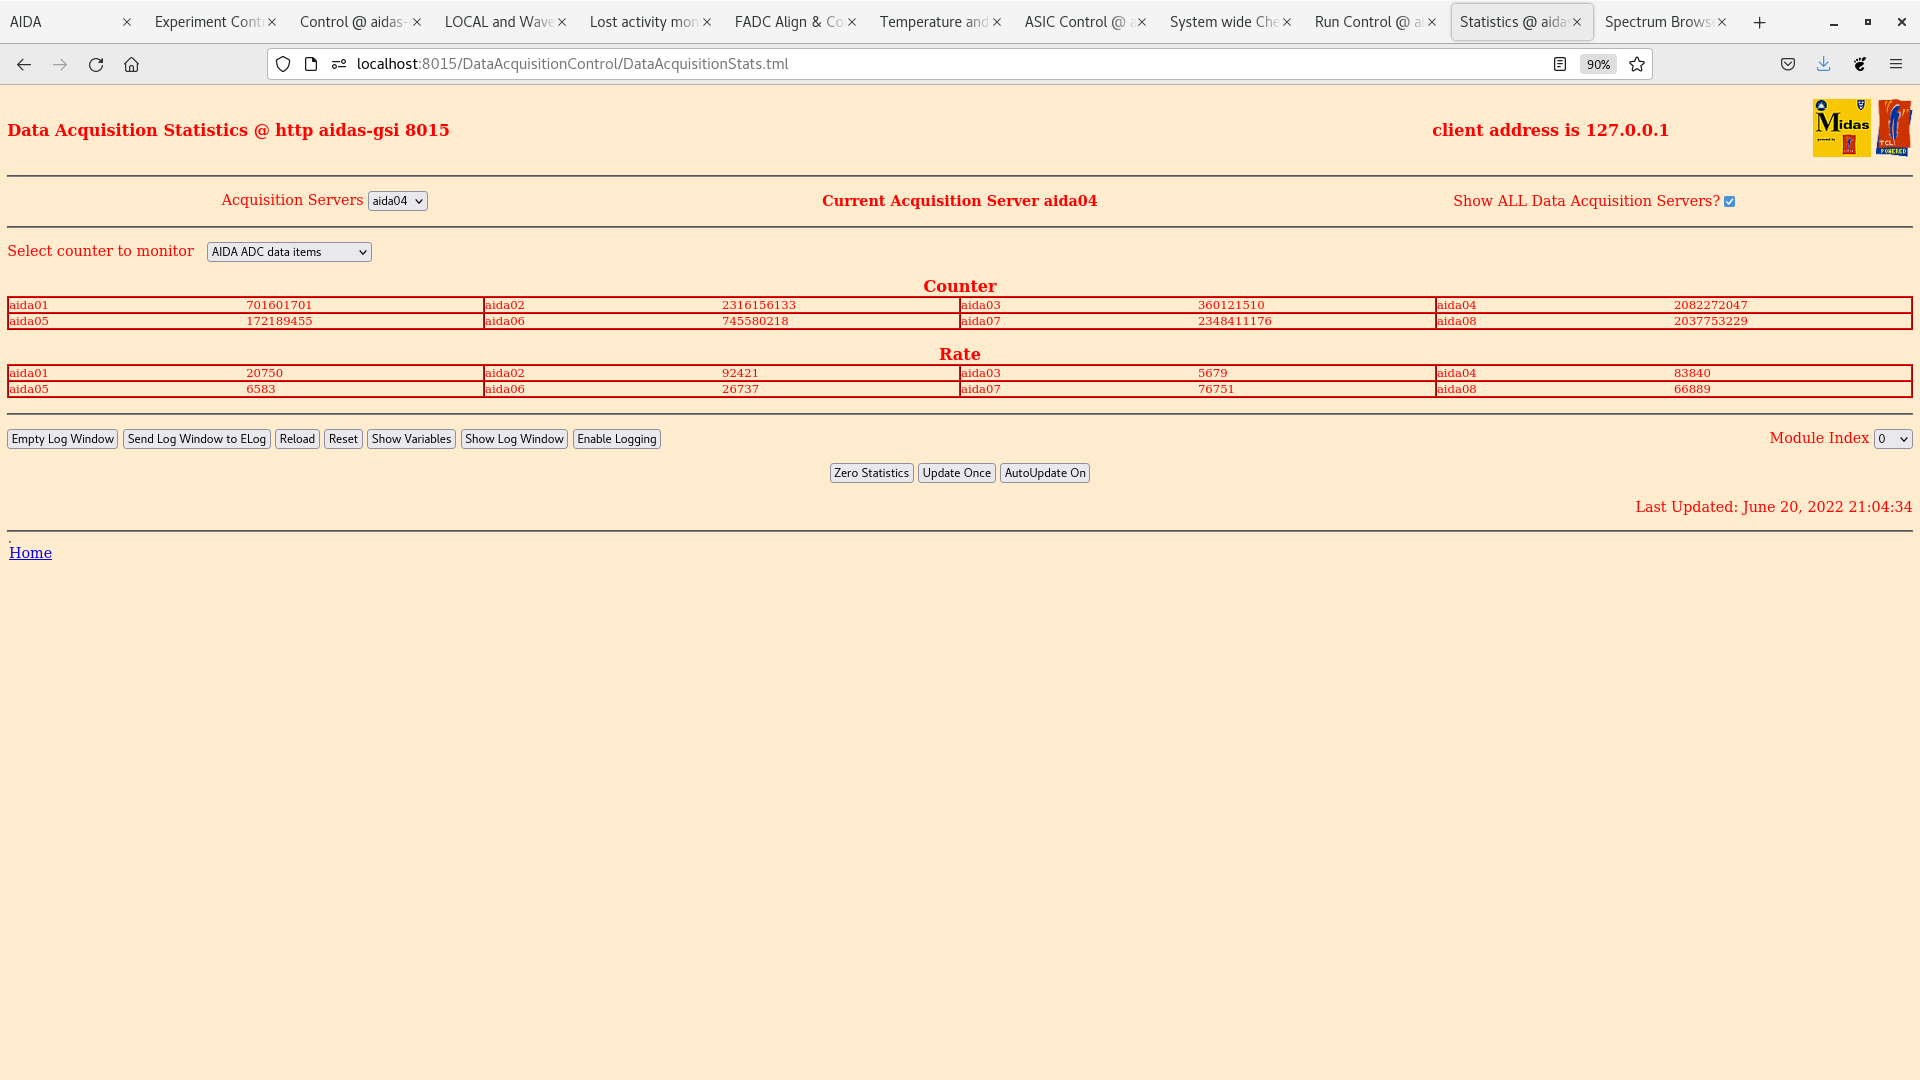
adc, pause, resume and correlation scaler data item stats - attachments 5-8

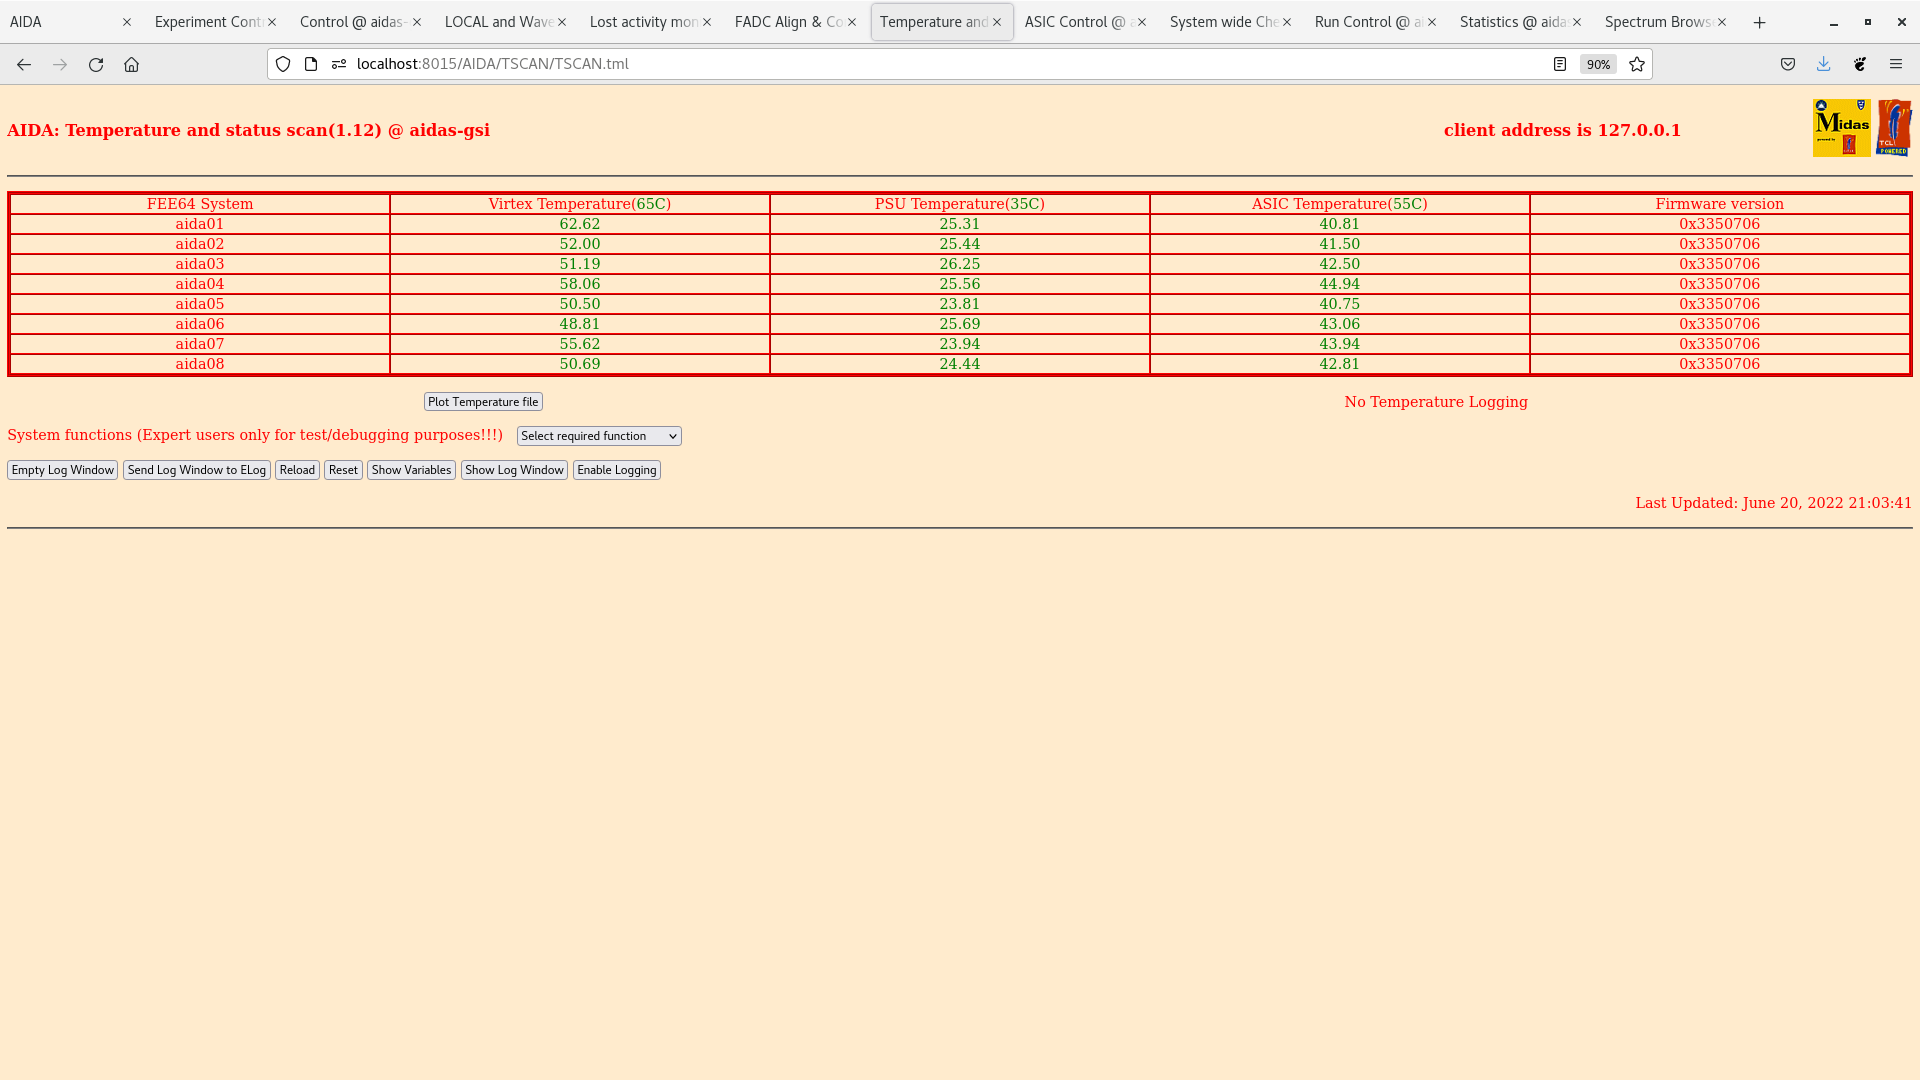
FEE64 temps OK - attachment 9

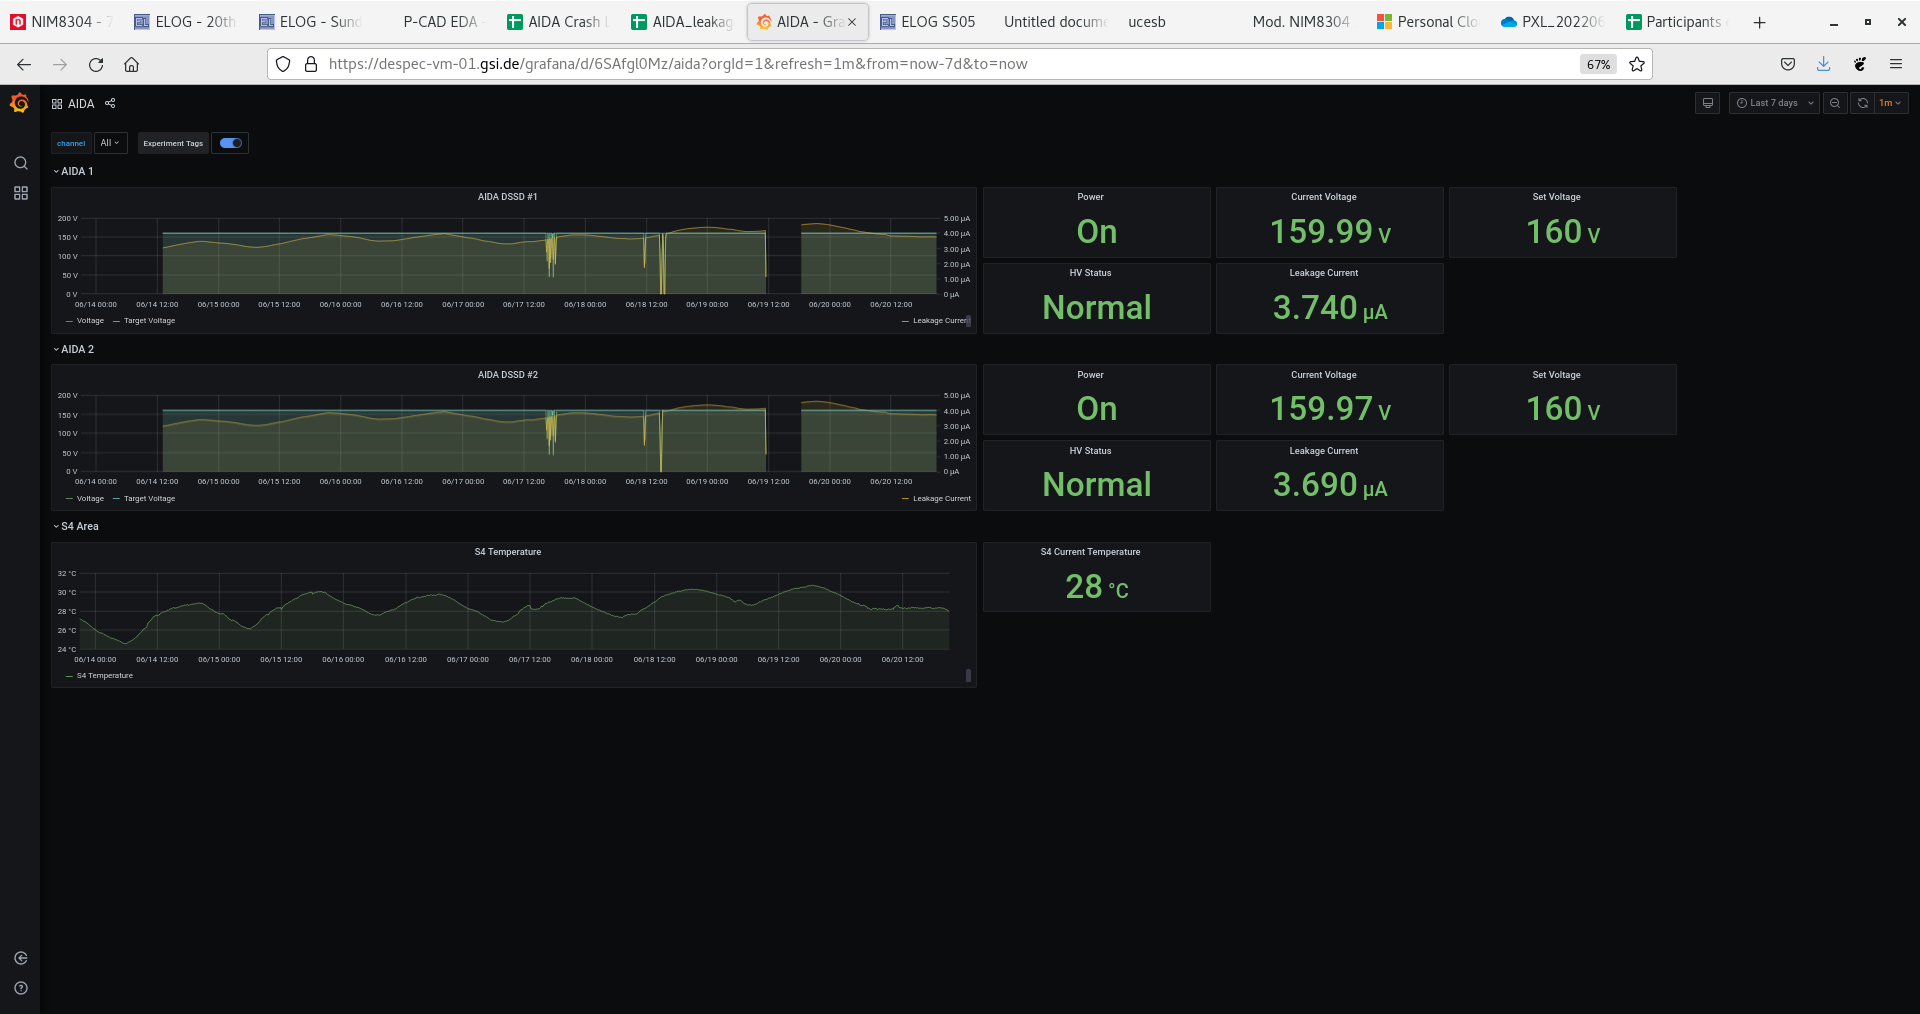
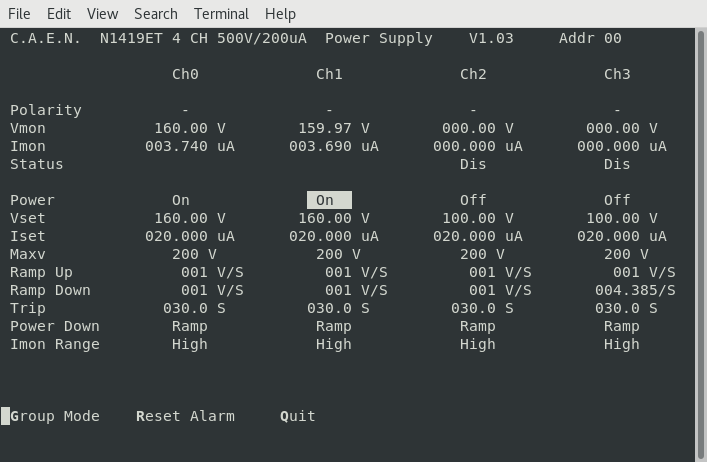
DSSSD bias & leakage currents OK - attachments 10 & 11 |
| Attachment 1: 220620_1116_stats_no_waveform.png
|

|
| Attachment 2: 220620_1223_stats_no_waveform.png
|

|
| Attachment 3: Screenshot_from_2022-06-20_21-17-41.png
|
|
| Attachment 4: Screenshot_from_2022-06-20_21-14-12.png
|
|
| Attachment 5: Screenshot_from_2022-06-20_21-12-06.png
|
|
| Attachment 6: Screenshot_from_2022-06-20_21-10-55.png
|

|
| Attachment 7: Screenshot_from_2022-06-20_21-08-58.png
|

|
| Attachment 8: Screenshot_from_2022-06-20_21-04-58.png
|
|
| Attachment 9: Screenshot_from_2022-06-20_21-04-00.png
|
|
| Attachment 10: Screenshot_from_2022-06-20_21-02-07.png
|
|
| Attachment 11: Screenshot_from_2022-06-20_21-01-07.png
|
|
|
|
307
|
Wed May 12 06:59:55 2021 |
OH, RDP | Wed 12 May 08:00-16:00 |
08:00 While the rates appeared to have quietened around 7am they are back to their previous rate now.

      They still seem to be working on the setting. Implant rate in AIDA about 8 per spill. Thick degrader is still in place
      They have collected 25 minutes of implantation data. They are analysing this data to confirm the PID

08:38 The PID confirmation was apparently run number 4. During this run they were implanting Cd in AIDA DSSD2

09:09 They are now taking data implanting somewhere in the snout. I have turned off no storage.
      Unfortunately we are writing to NOTAPE R3. I was unable to change it as they were already taking data
      Data rate 16.3MB/s
      ucesb shows similar rates in SC42 and AIDA01. We may be implanting Te in AIDA then.

09:35 They stopped the DAQ as their is no beam. Switched the tapeserver over to R1 in directory S496. Setting to no storage

09:47 Beam back turned off no storage. On file R1_10

11:04 Now that we have implants on the detector we get a better look at the strips
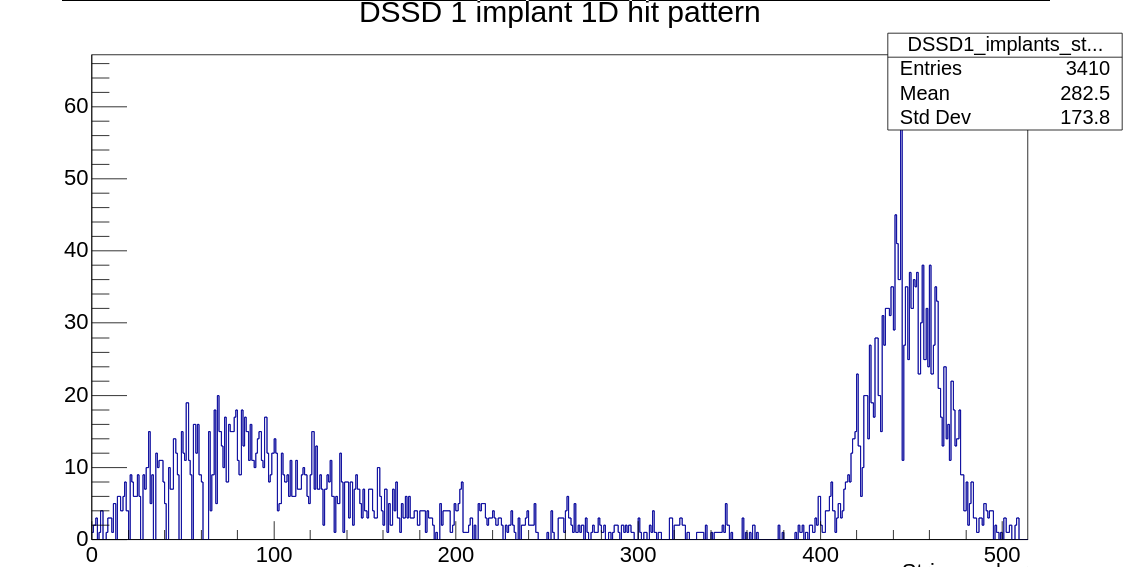
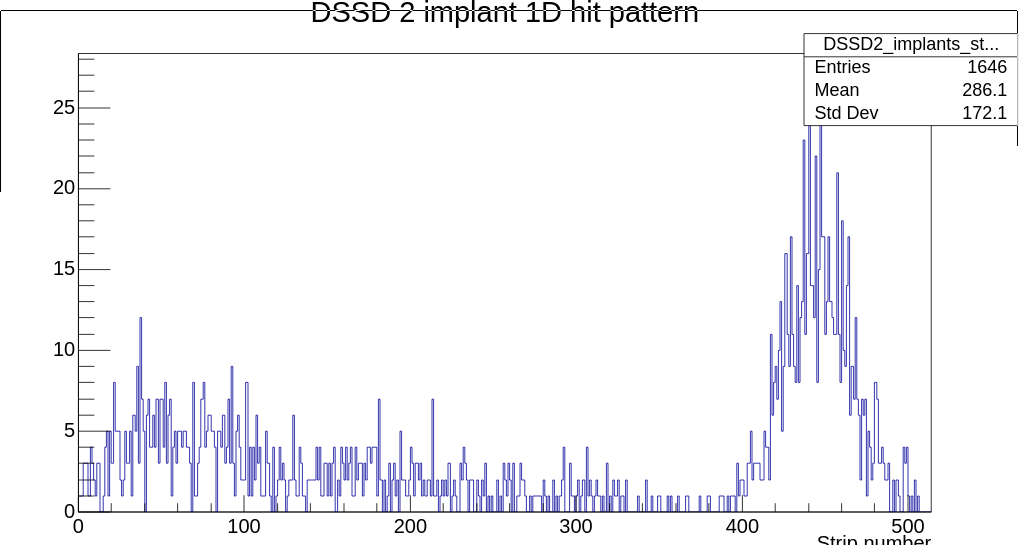
      From the 1d pattern it is obvious that there is an adapter card misaligned in DSSD1- attachments 1 and 2
      This adaptor board corresponds to FEE11

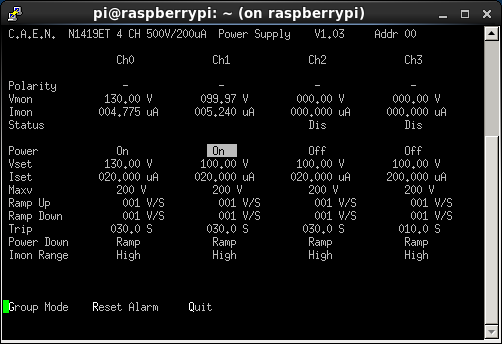
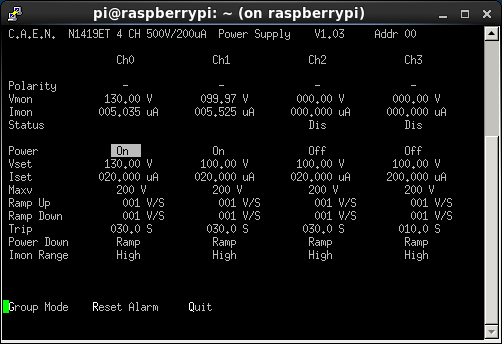
12:17 Leakage currents screenshot 512.png

13:30 Beam off. Expected back at 15:00...

14:09 Making use of the beam off time NH and HA entered S4 to investigate FEE1 and FEE11.
      They noticed FEE11 was off and have realigned that. All channels are now observed in that FEE
      They couldn't see anything wrong with the connector for FEE1. We are still missing a block of channels there.
      Rates are as before. No better, no worse.

15:31 Leakage currents screenshot 513.png. They are continuing to rise following the intervention in S4. It could just be because the temperature is rising... |
| Attachment 1: 1dImplants.png
|
|
| Attachment 2: 1dImplants2.png
|
|
| Attachment 3: 512.png
|
|
| Attachment 4: 513.png
|
|
|
|
323
|
Tue May 18 06:50:53 2021 |
OH, PP | Tuesday 18th May 08:00 - 16:00 |
08:00 OH Takes over

      Statistics still look good from yesterday. Rate is still down.
      Dead time in FEEs 2 and 4 is 2.04%

      System wide checks clock ok

		 Base 		Current 	Difference
aida05 fault 	 0x4da : 	 0x500 : 	 38
White Rabbit error counter test result: Passed 15, Failed 1

Understand the status reports as follows:-
Status bit 3 : White Rabbit decoder detected an error in the received data
Status bit 2 : Firmware registered WR error, no reload of Timestamp
Status bit 0 : White Rabbit decoder reports uncertain of Timestamp information from WR

      *Baseline reset*
      FPGA check ok
      Stats - attachment 1
      Temp - attachment 2
      Bias - attachment 3


08:11 With the decreased noise I am investigating whether we can lower the thresholds on DSSD2 y strips.
      I have set them to 0x19 on ASICS 1-3 and 0x64 on ASIC4
      The results of the test appear to indicate that it is the network link that we are saturating causing dead time
***	Before		                  After
FEE	DT (s)  Dead time %	           DT (s)	Dead time %
0	0.013	0.004184451	           0.026	0.010025681
1	6.352	2.04458693	           4.097	1.57981599
2	0.295	0.09495484	           0.292	0.112596112
3	6.349	2.043621288	           8.255	3.183153771
4	0.021	0.006759497	           0.03	        0.011568094
5	0.285	0.091736032	           3.388	1.306423377
6	0.02	0.006437616	           0.149	0.057454865
7	1.219	0.392372712	           2.133	0.822491459
8	1.137	0.365978485	           0.457	0.176220627
9	0	0	                       0	0
10	1.633	0.525631369	           1.545	0.595756823
11	0.061	0.01963473	           0.166	0.064010118
12	0.059	0.018990968	           0.085	0.032776265
13	0	0	                       0	0
14	0.016	0.005150093	           0.023	0.008868872
15	0.282	0.09077039	           0.168	0.064781324


      Note that the dead time for FEE6 and 8 remains fairly low but the dead time for FEE4 has increased

09:00 They are stopping the run to decrease the bias on the bPlast detector
09:25 No noticable change in AIDA
      They will now begin to change the spill structure.

09:46 While they are optimising the 1s spill structure raised the thresholds of FEE6 and 8 back to 0x20. Will start from here when optimising the thresholds post spill change

10:21 Beam is back on AIDA

10:39 System wide checks.
- ADC calibration check failed (this is anticipated because waveforms are off).
- 1 Failed test in White Rabbit:
		 Base 		Current 	Difference
aida05 fault 	 0x500 : 	 0x506 : 	 6
White Rabbit error counter test result: Passed 15, Failed 1

Understand the status reports as follows:-
Status bit 3 : White Rabbit decoder detected an error in the received data
Status bit 2 : Firmware registered WR error, no reload of Timestamp
Status bit 0 : White Rabbit decoder reports uncertain of Timestamp information from WR
- All other systems passed

11:00
      Stats - attachment 4
      Temp - attachment 5
      Bias - attachment 6

12:46 System wide checks
- ADC calibration check failed (this is anticipated because waveforms are off).
- 1 Failed test in White Rabbit:
		 Base 		Current 	Difference
aida05 fault 	 0x500 : 	 0x50b : 	 11
White Rabbit error counter test result: Passed 15, Failed 1

Understand the status reports as follows:-
Status bit 3 : White Rabbit decoder detected an error in the received data
Status bit 2 : Firmware registered WR error, no reload of Timestamp
Status bit 0 : White Rabbit decoder reports uncertain of Timestamp information from WR
- All other systems passed

14:36 System wide checks
- ADC calibration check failed (this is anticipated because waveforms are off).
- 1 Failed test in White Rabbit:
		 Base 		Current 	Difference
aida05 fault 	 0x500 : 	 0x50f : 	 15
White Rabbit error counter test result: Passed 15, Failed 1

Understand the status reports as follows:-
Status bit 3 : White Rabbit decoder detected an error in the received data
Status bit 2 : Firmware registered WR error, no reload of Timestamp
Status bit 0 : White Rabbit decoder reports uncertain of Timestamp information from WR
- All other systems passed |
| Attachment 1: 210518_0757_Stats.png
|

|
| Attachment 2: 210518_0758_Temp.png
|

|
| Attachment 3: 210518_0759_Bias.png
|

|
| Attachment 4: 210518_1059_Stats.png
|

|
| Attachment 5: 210518_1100_Temp.png
|

|
| Attachment 6: 210518_1101_Bias.png
|

|
|
|
412
|
Wed Apr 6 10:09:21 2022 |
OH, NH, TD | Wednesday 6 April |
DSSSD bias OFF. DAQ STOPped

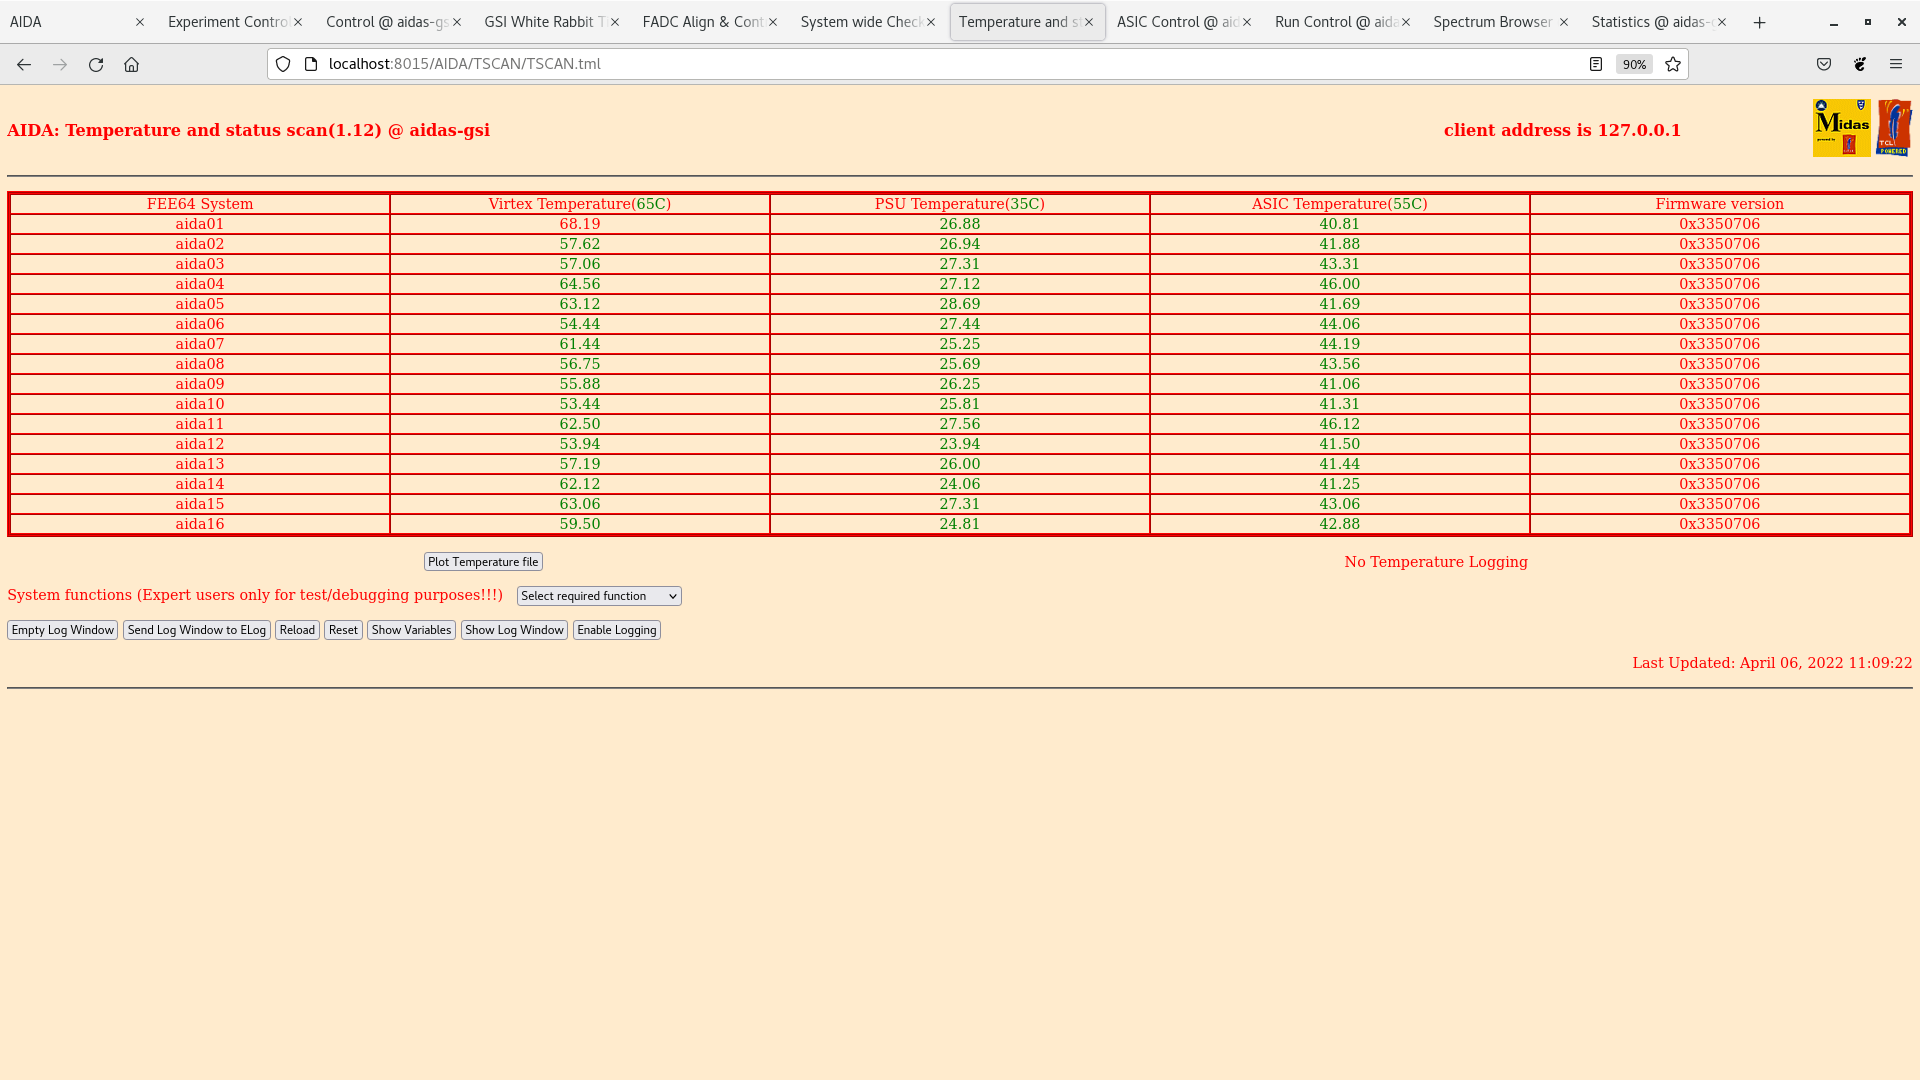
Attachment 6 FEE64 temps OK

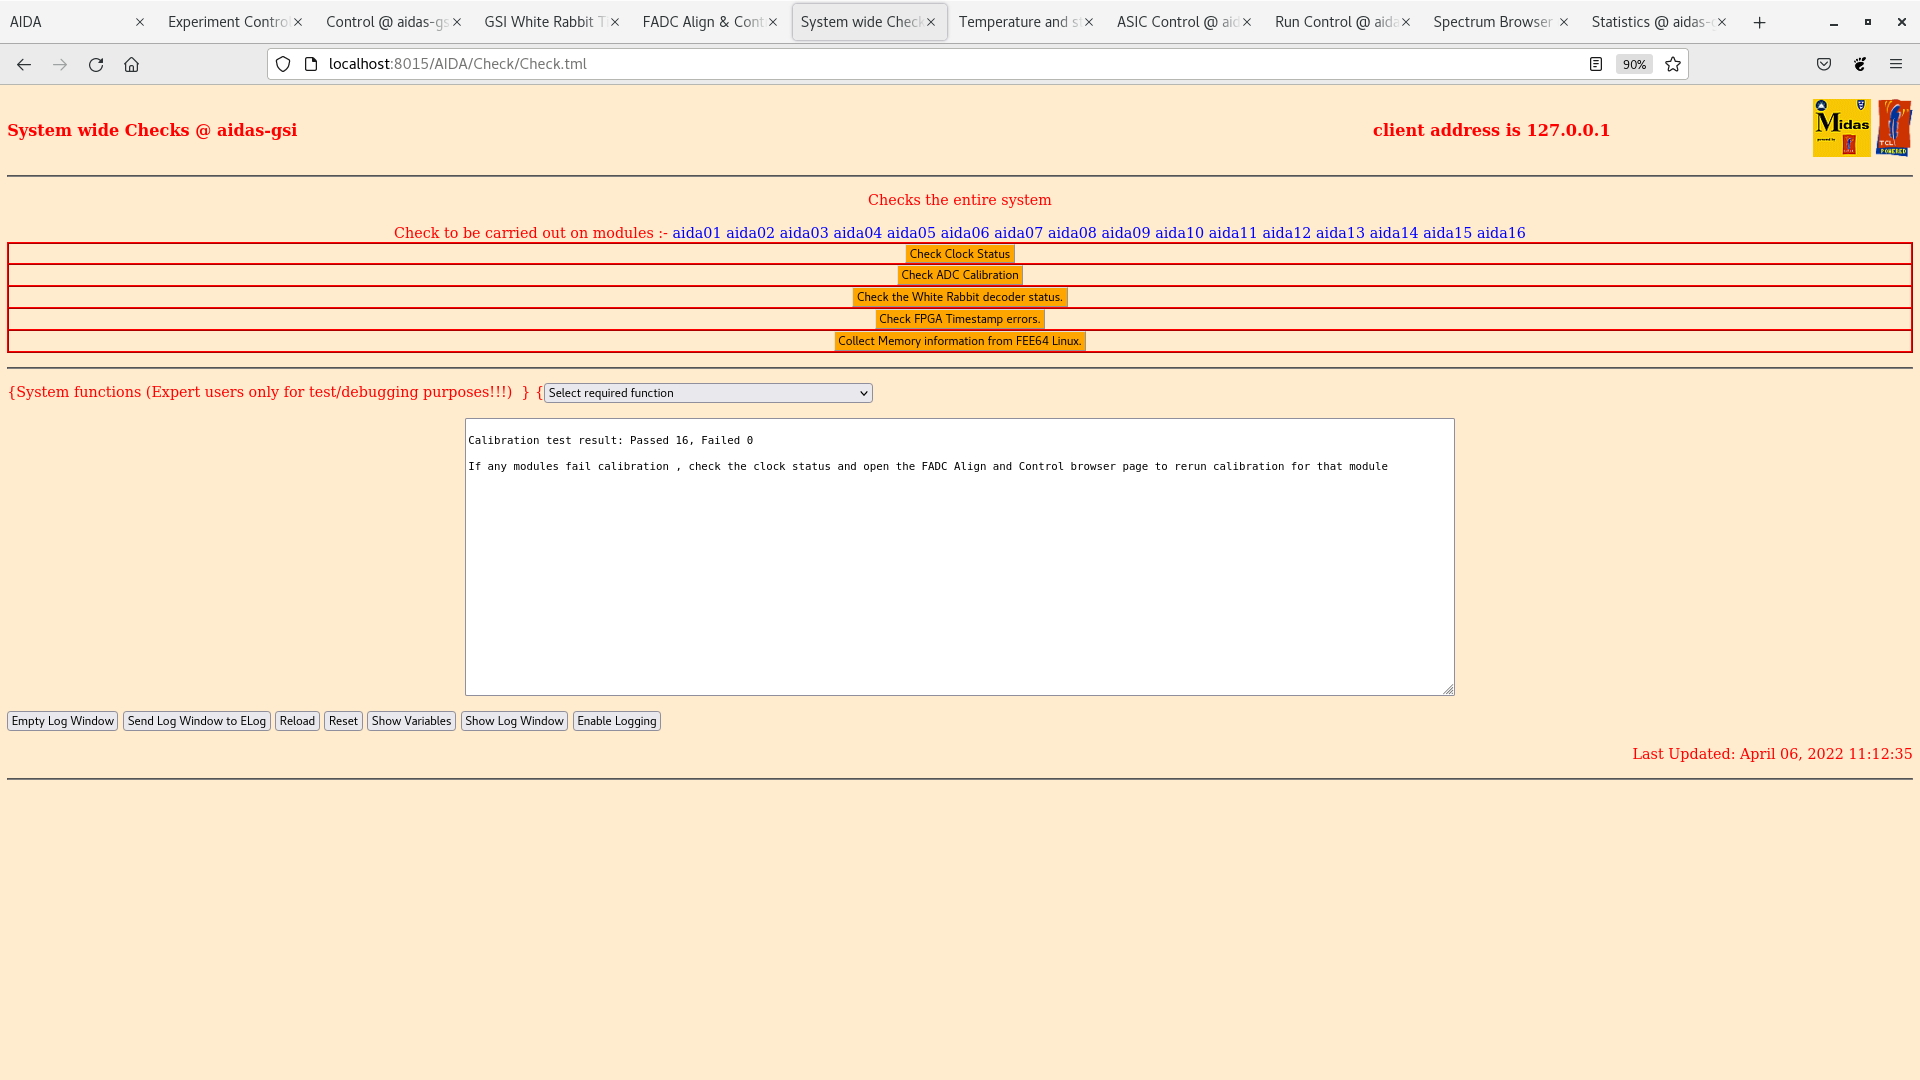
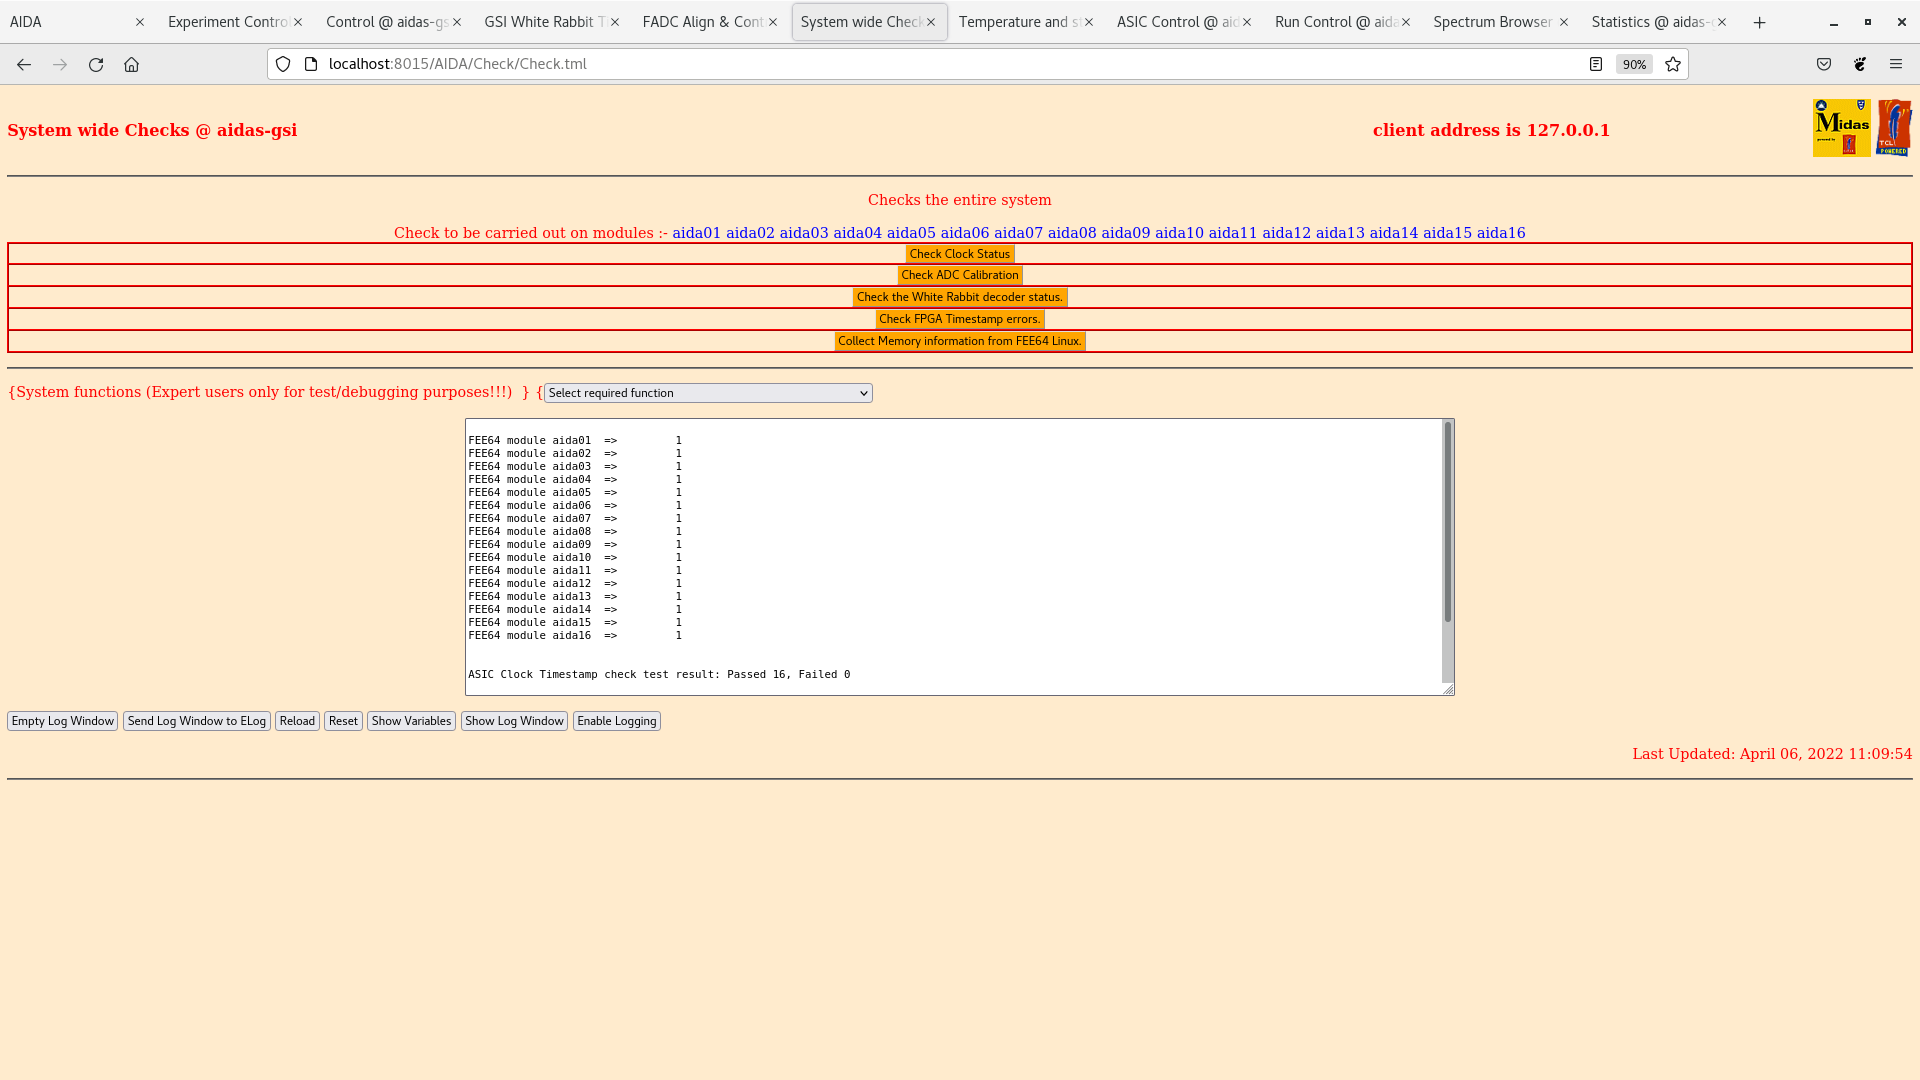
Attachment 1-5 system wide checks OK |
| Attachment 1: Screenshot_from_2022-04-06_11-12-59.png
|

|
| Attachment 2: Screenshot_from_2022-04-06_11-12-48.png
|

|
| Attachment 3: Screenshot_from_2022-04-06_11-12-38.png
|
|
| Attachment 4: Screenshot_from_2022-04-06_11-10-06.png
|

|
| Attachment 5: Screenshot_from_2022-04-06_11-09-57.png
|
|
| Attachment 6: Screenshot_from_2022-04-06_11-09-29.png
|
|
|
|
413
|
Thu Apr 7 12:42:14 2022 |
OH, NH, TD | Thursday 7 April |
Re-assembled triple snout re-installed on the AIDA stand - DSSSD ribbon cables and grounds re-connected.
FEE64 adaptor PCB LKs per https://elog.ph.ed.ac.uk/DESPEC/409

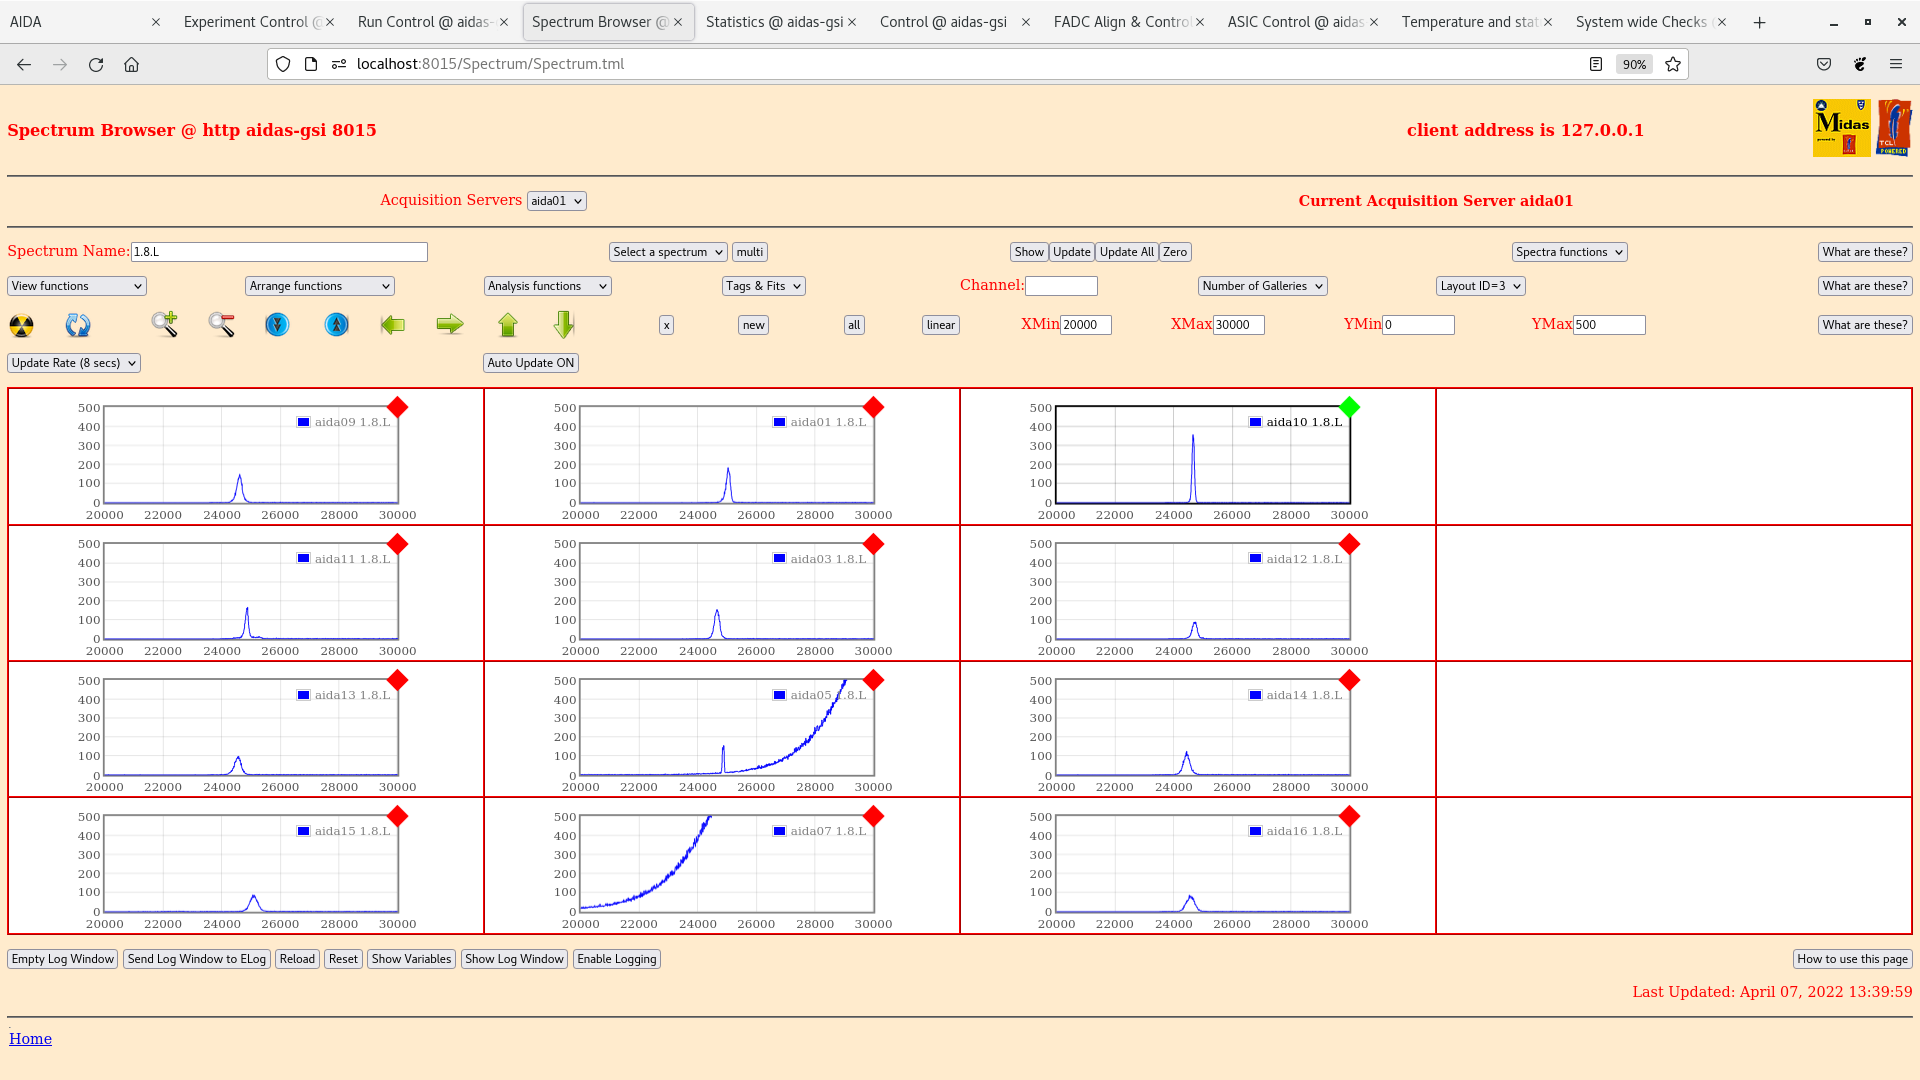
Attachments 1 & 2 1.8.L spectra
  p+n FEE64 aida10 pulser peak width 97 ch FWHM
  n+n FEE64 aida04 pulser peak width 550 ch FWHM

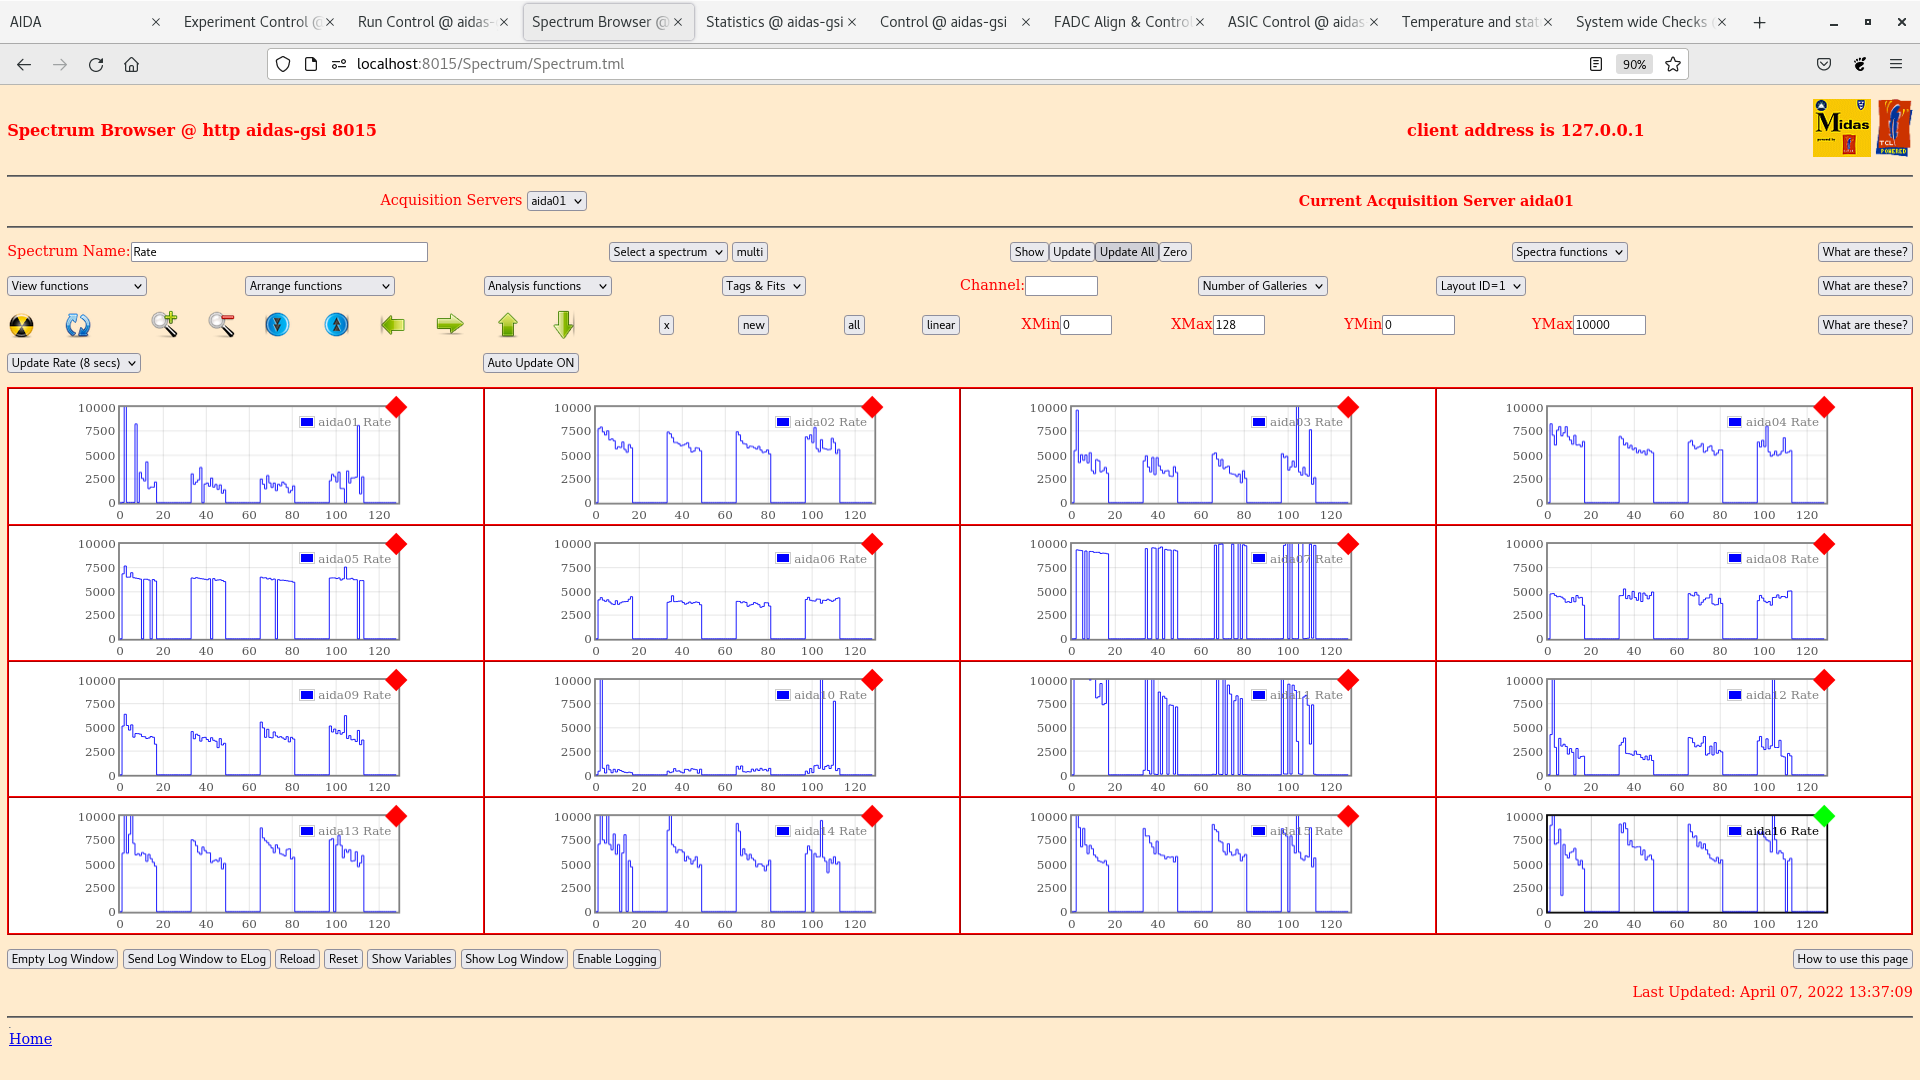
Attachment 3 rate spectra
  missing channels aida01, aida07 & aida11 - misaligned ERNI and/or Samtec connectors?

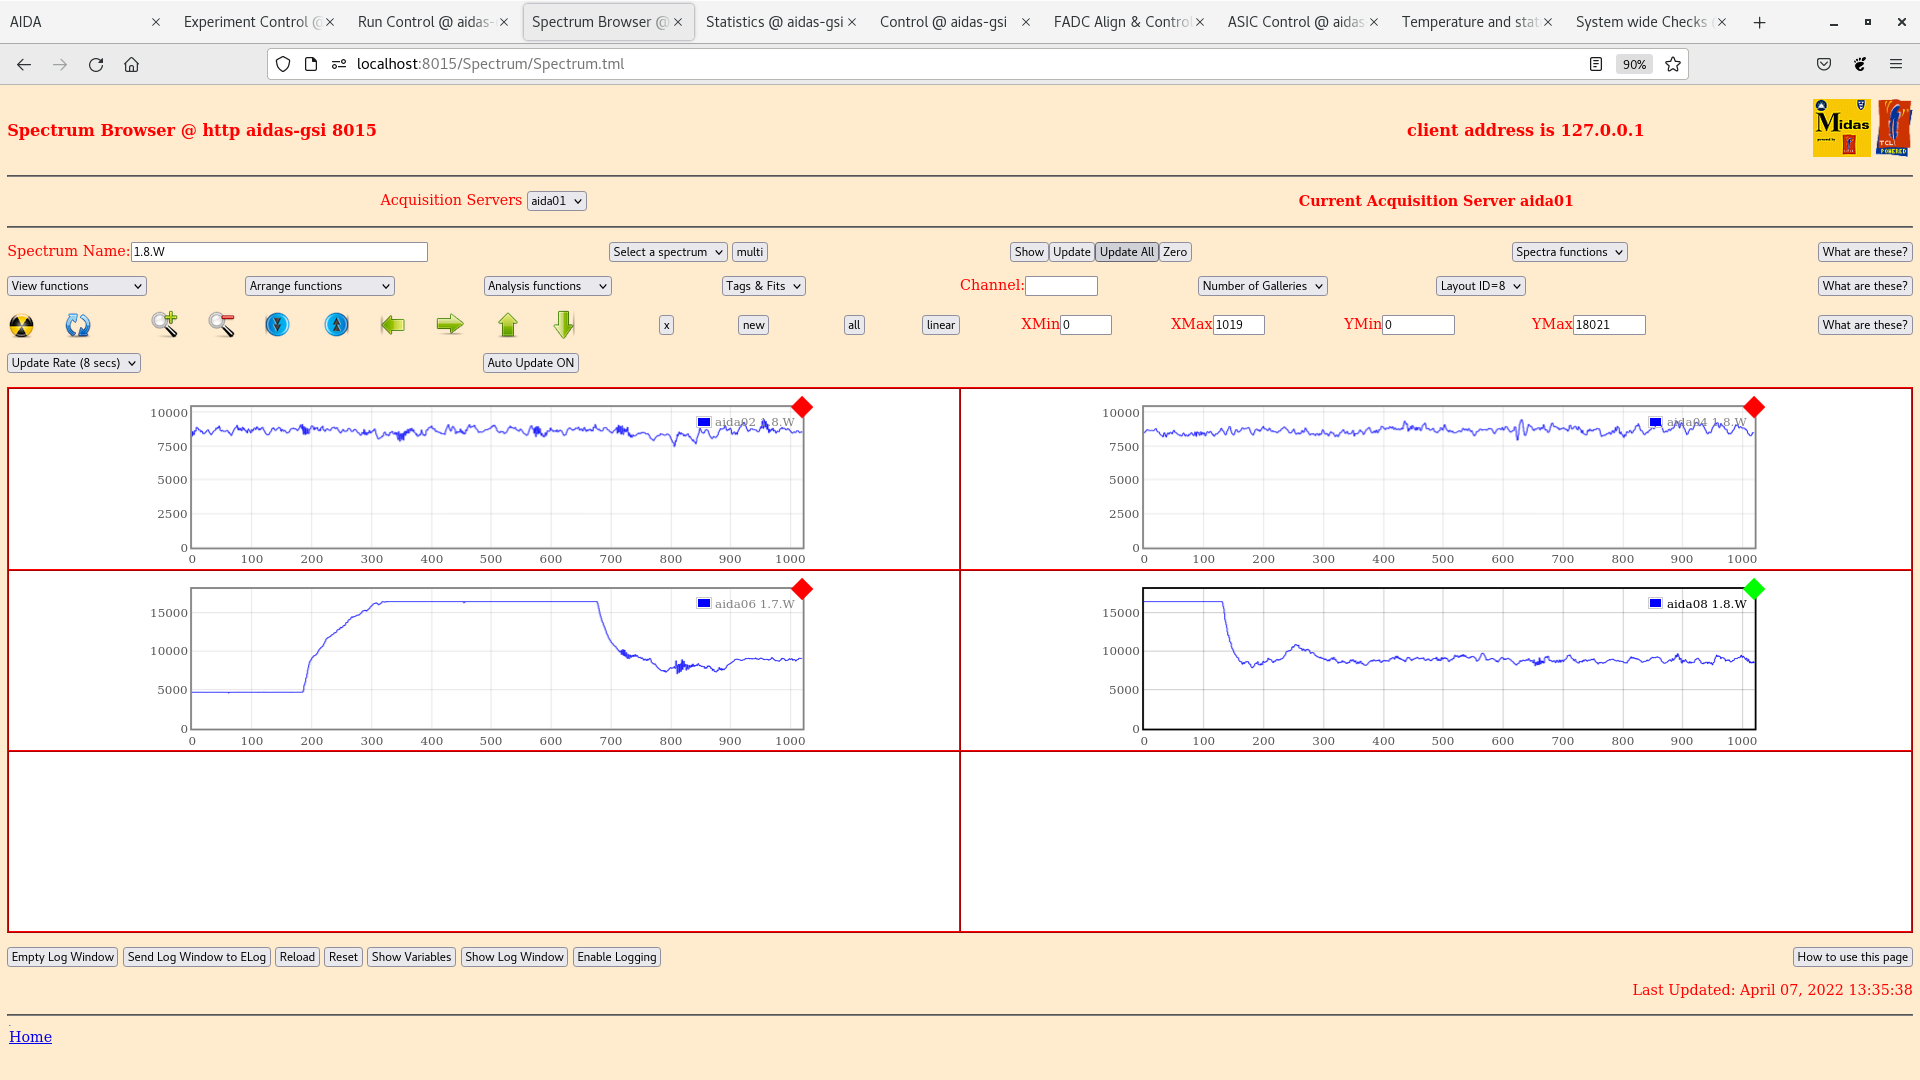
Attachments 4 & 5 1.8.W spectra

Attachment 6 ADC data item rates
 aida10 OK, all others c. 300-400k

Attachment 7 FEE64 temperatures OK

Attachment 8 DSSSD bias & leakage currents OK |
| Attachment 1: Screenshot_from_2022-04-07_13-40-55.png
|

|
| Attachment 2: Screenshot_from_2022-04-07_13-40-02.png
|
|
| Attachment 3: Screenshot_from_2022-04-07_13-37-17.png
|
|
| Attachment 4: Screenshot_from_2022-04-07_13-35-43.png
|
|
| Attachment 5: Screenshot_from_2022-04-07_13-35-23.png
|

|
| Attachment 6: Screenshot_from_2022-04-07_13-34-34.png
|

|
| Attachment 7: Screenshot_from_2022-04-07_13-34-12.png
|

|
| Attachment 8: Screenshot_from_2022-04-07_13-33-53.png
|

|
|
|
428
|
Wed May 11 07:04:13 2022 |
OH, NH, TD | Wednesday 11th May |
08:00 Overnight at some point it appears that aida14 has stopped producing any ASIC data
      It is currently sending data pause requests and data push requests but nothing else - attachment 1
      telnet into aida14 and run top to see what the current state of the FEE is. AIDAExec currently using 0% CPU usage.
      FEE appears to have hung. - attachment 2
      Still passes all system wide checks.
      When performing a check load can see the tclsh process take up CPU usage

09:02 AIDA out of time sorter. Going to perform a power cycle to see if it recovers FEE14
      AIDA14 recovered but ASIC2 still missing

      Current working hypothesis is ASIC2 on AIDA14 is dead and that the problem with AIDA05 is either DSSD, cable or adaptor board.
      Given access would change the adapter board on AIDA05.
      Could consider installing the old AIDA05 FEE above AIDA14 and moving the cables up 1.
      Would retain the option of a speedybacktrack

      Alternatively the HEC events in AIDA05 are just above threshold. Can raise the HEC threshold
      A threshold of 0x4 reduced the rate in the HEC channels considerably
      A threshold of 0x6 removes entirely

      Note when the rate of HEC channels decreases can see the pulser in all channels of AIDA05 again. Showing that the adapter board is properly aligned

09:59 Had access so replaced the adapter card on AIDA05
      Did note that while replacing the card the right hand edge of the right hand ribbon cable was lifted slightly.
      This could also have been the cause


10:09 Restarted DAQ and there is no change to the behavior of AIDA05
      Still see events in HEC
      Again raising threshold to 0x5 in ASIC1 largely removes them.

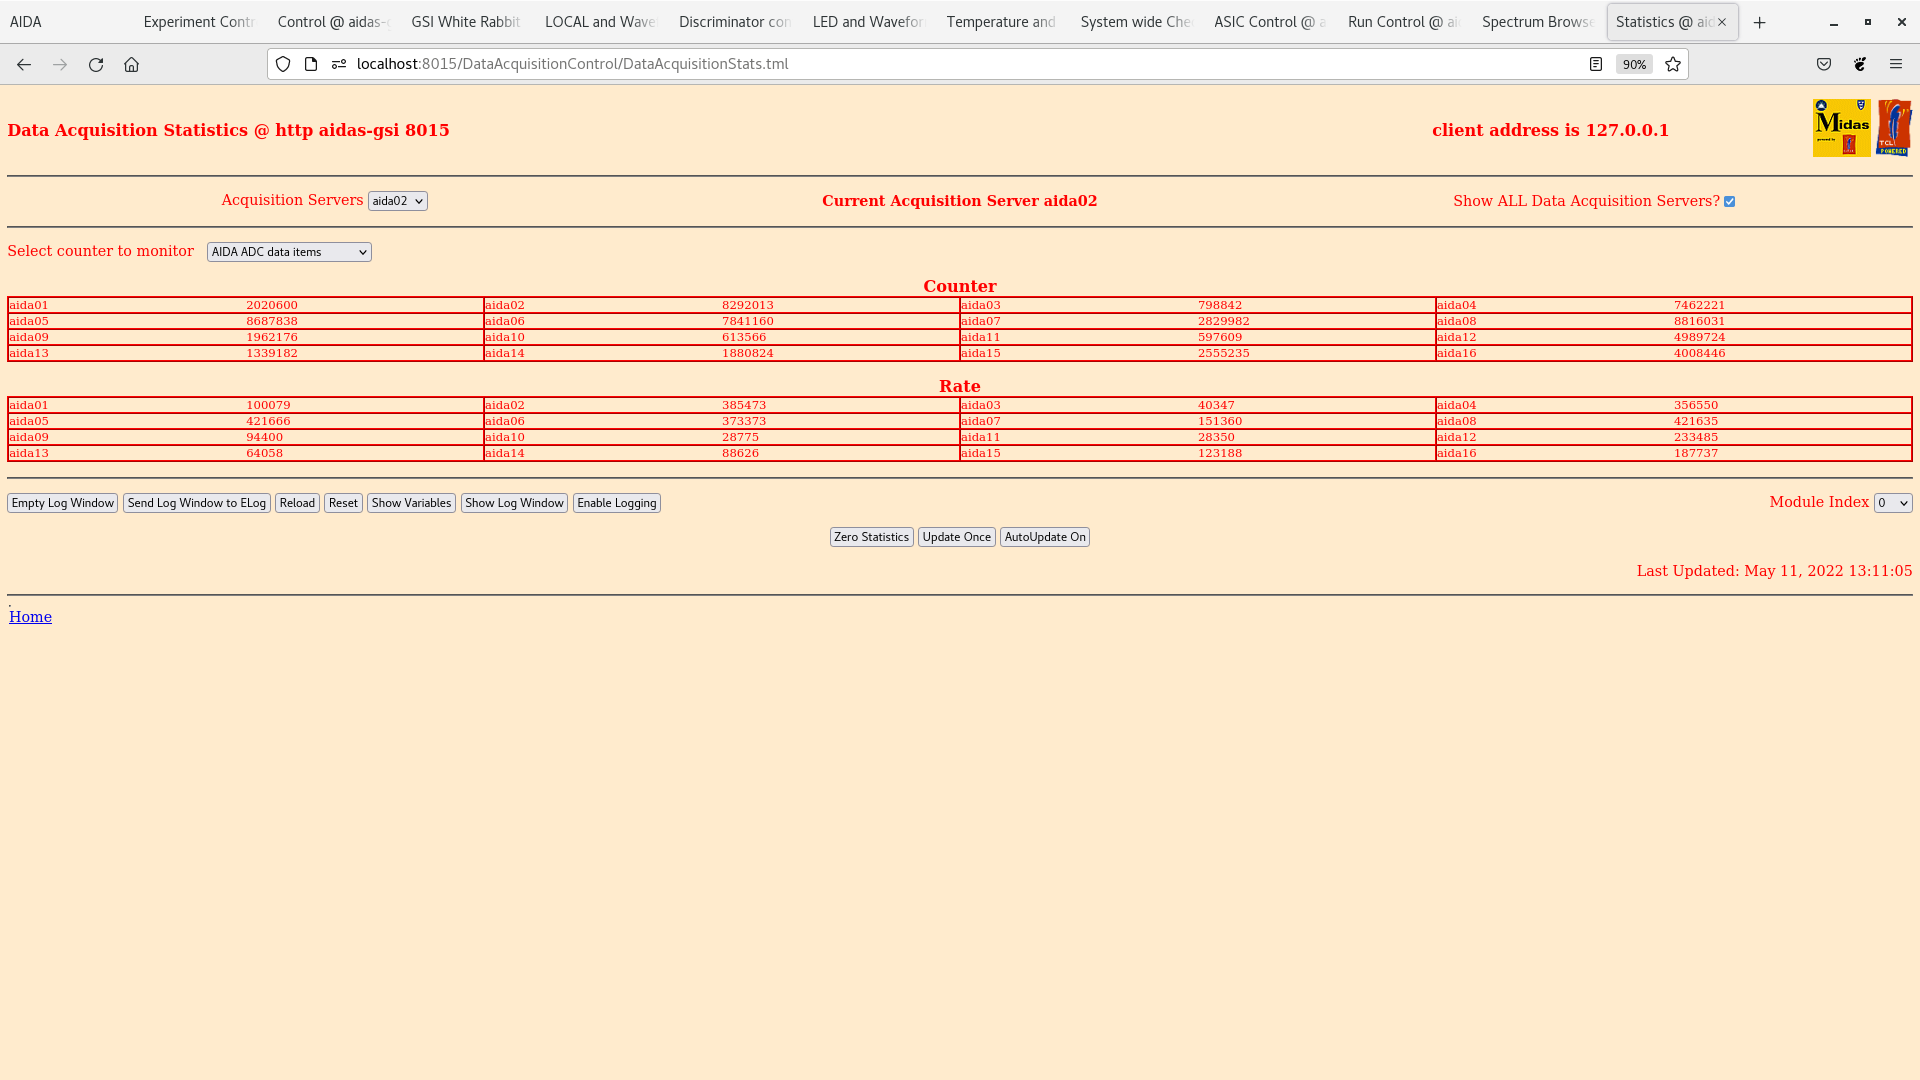
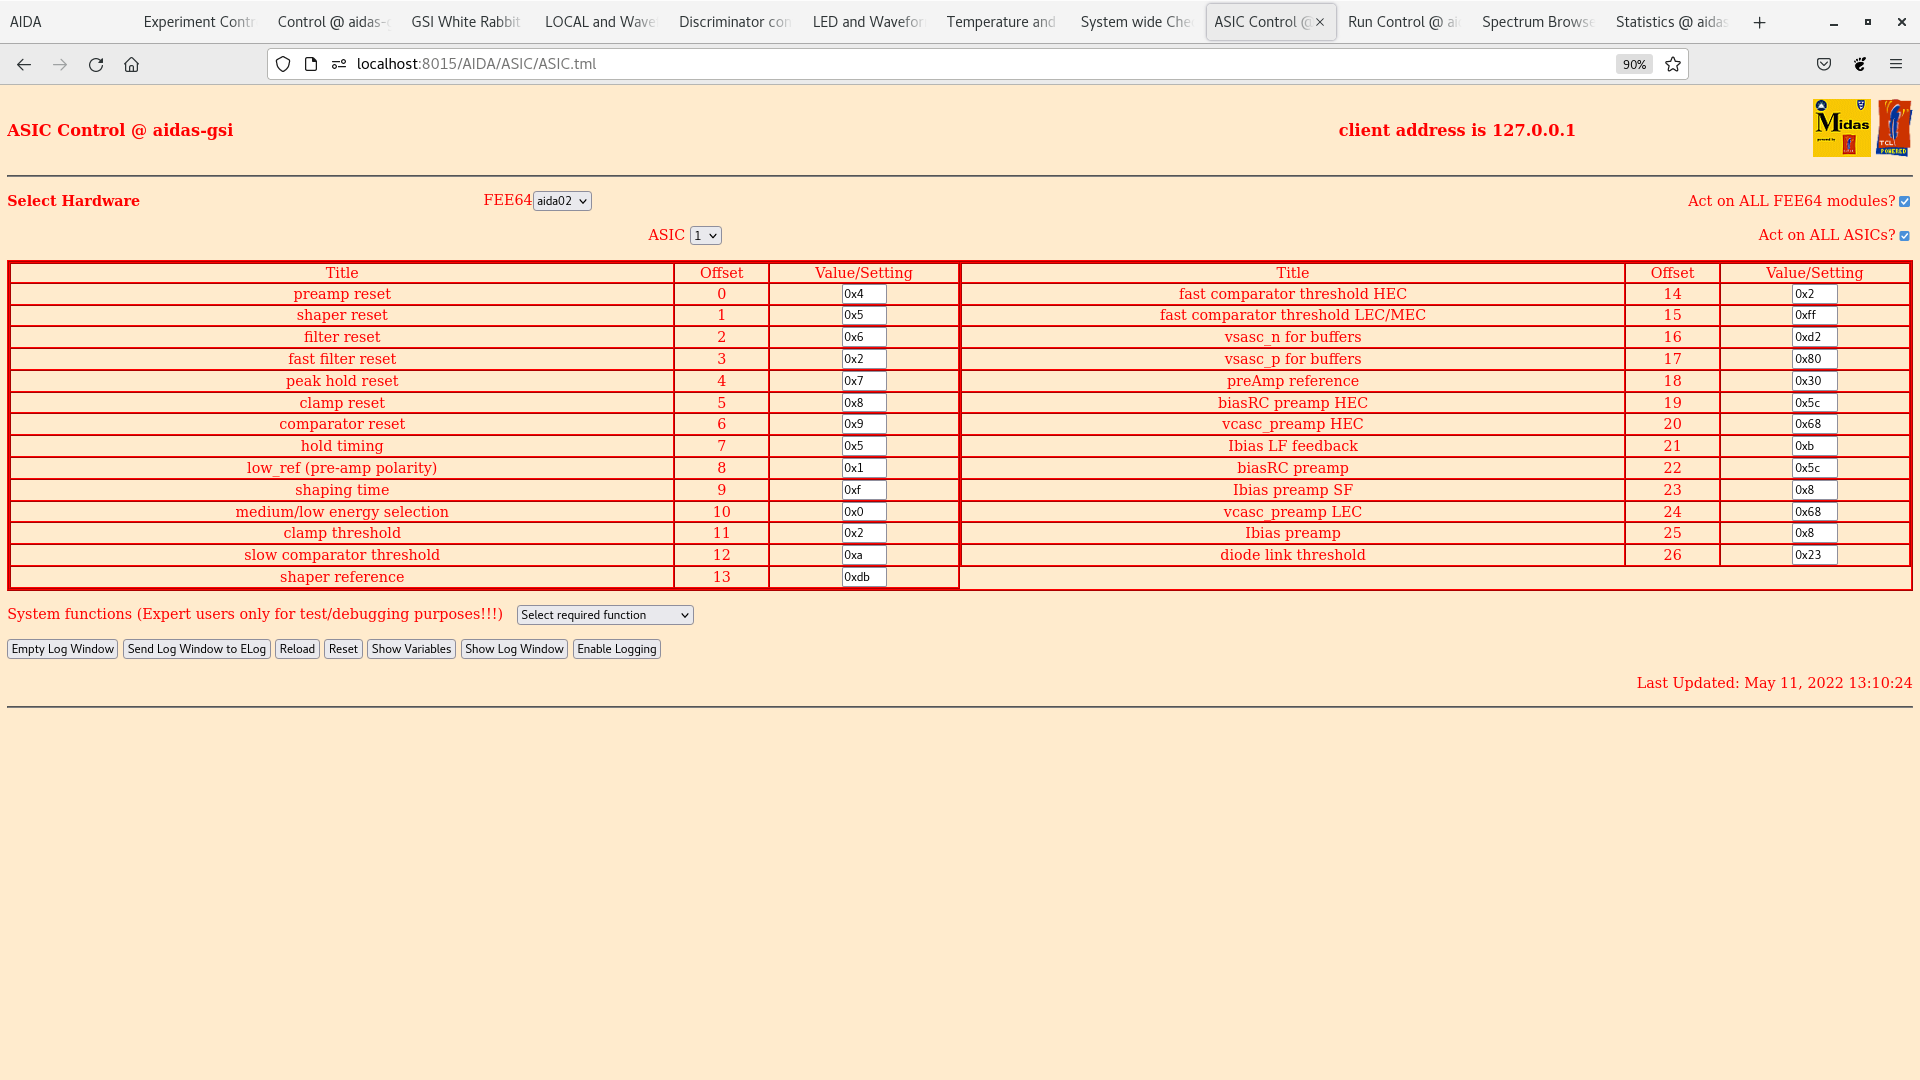
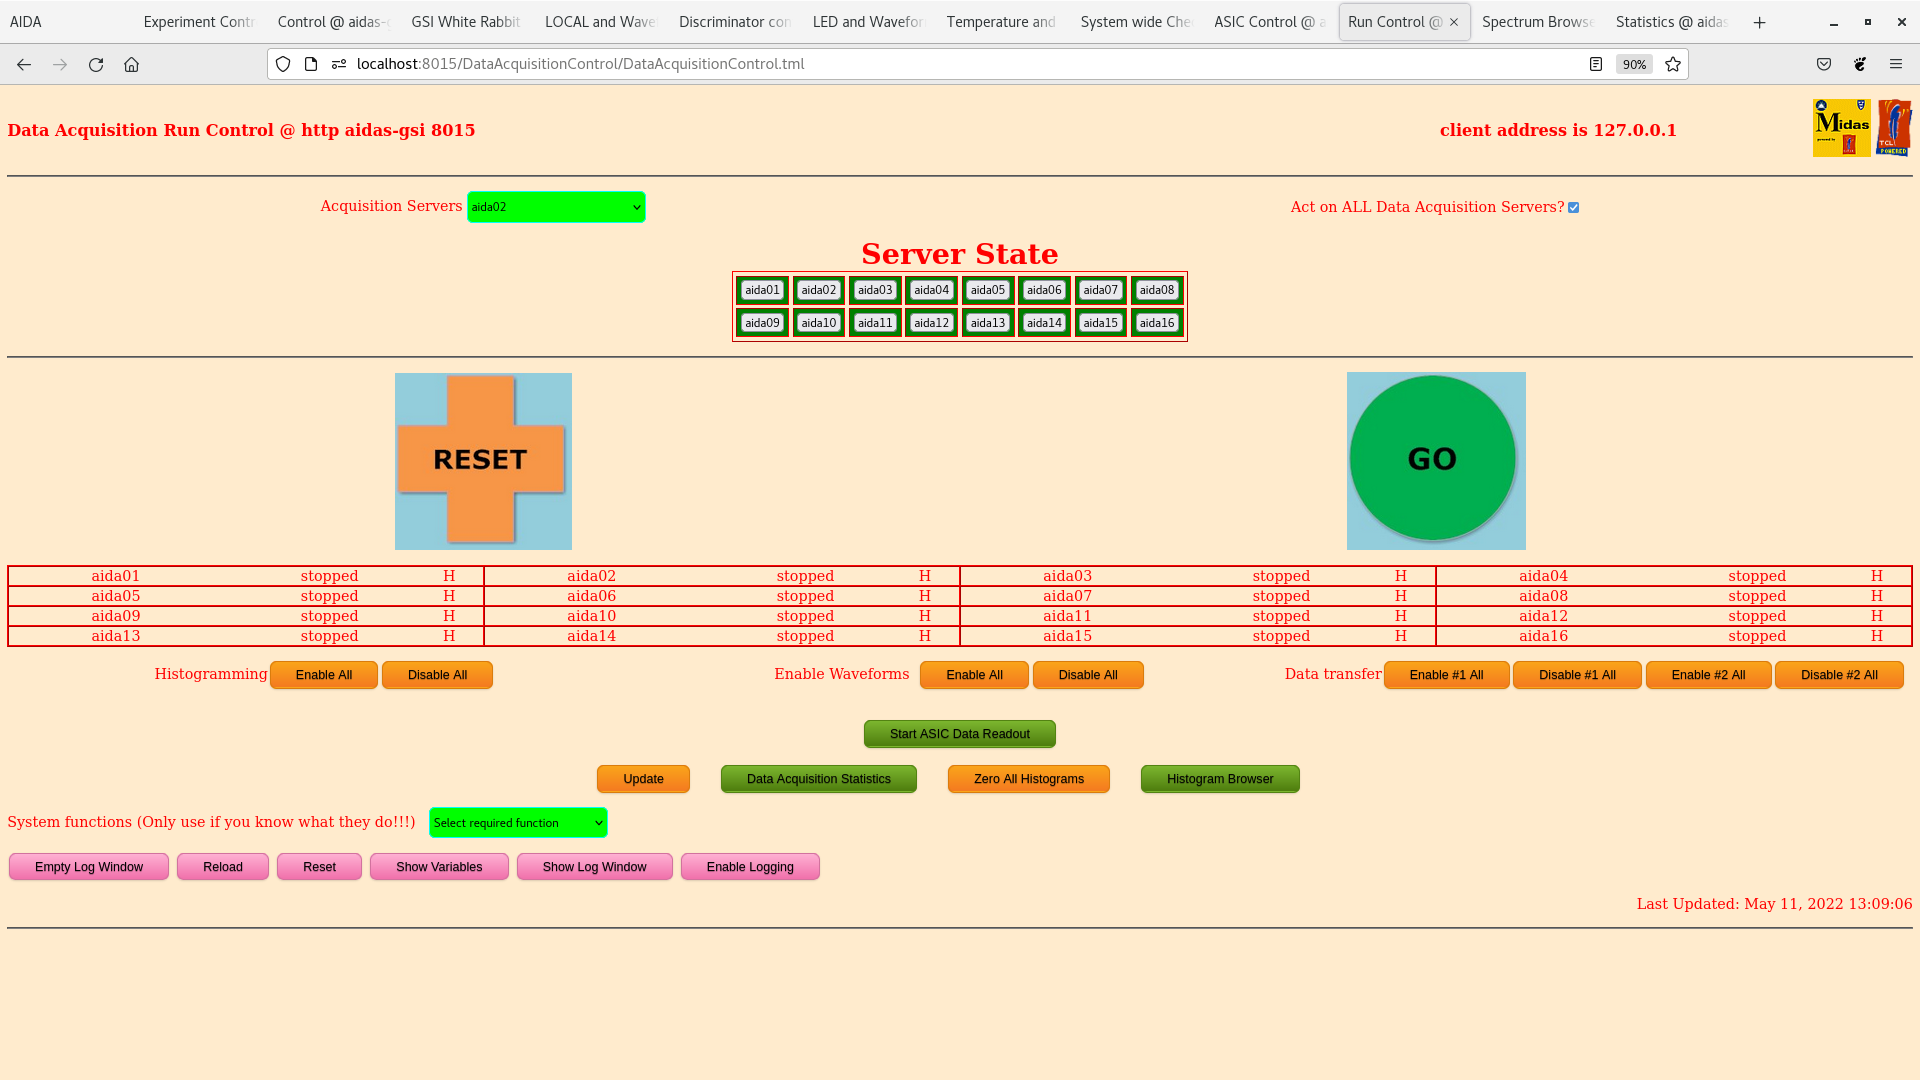
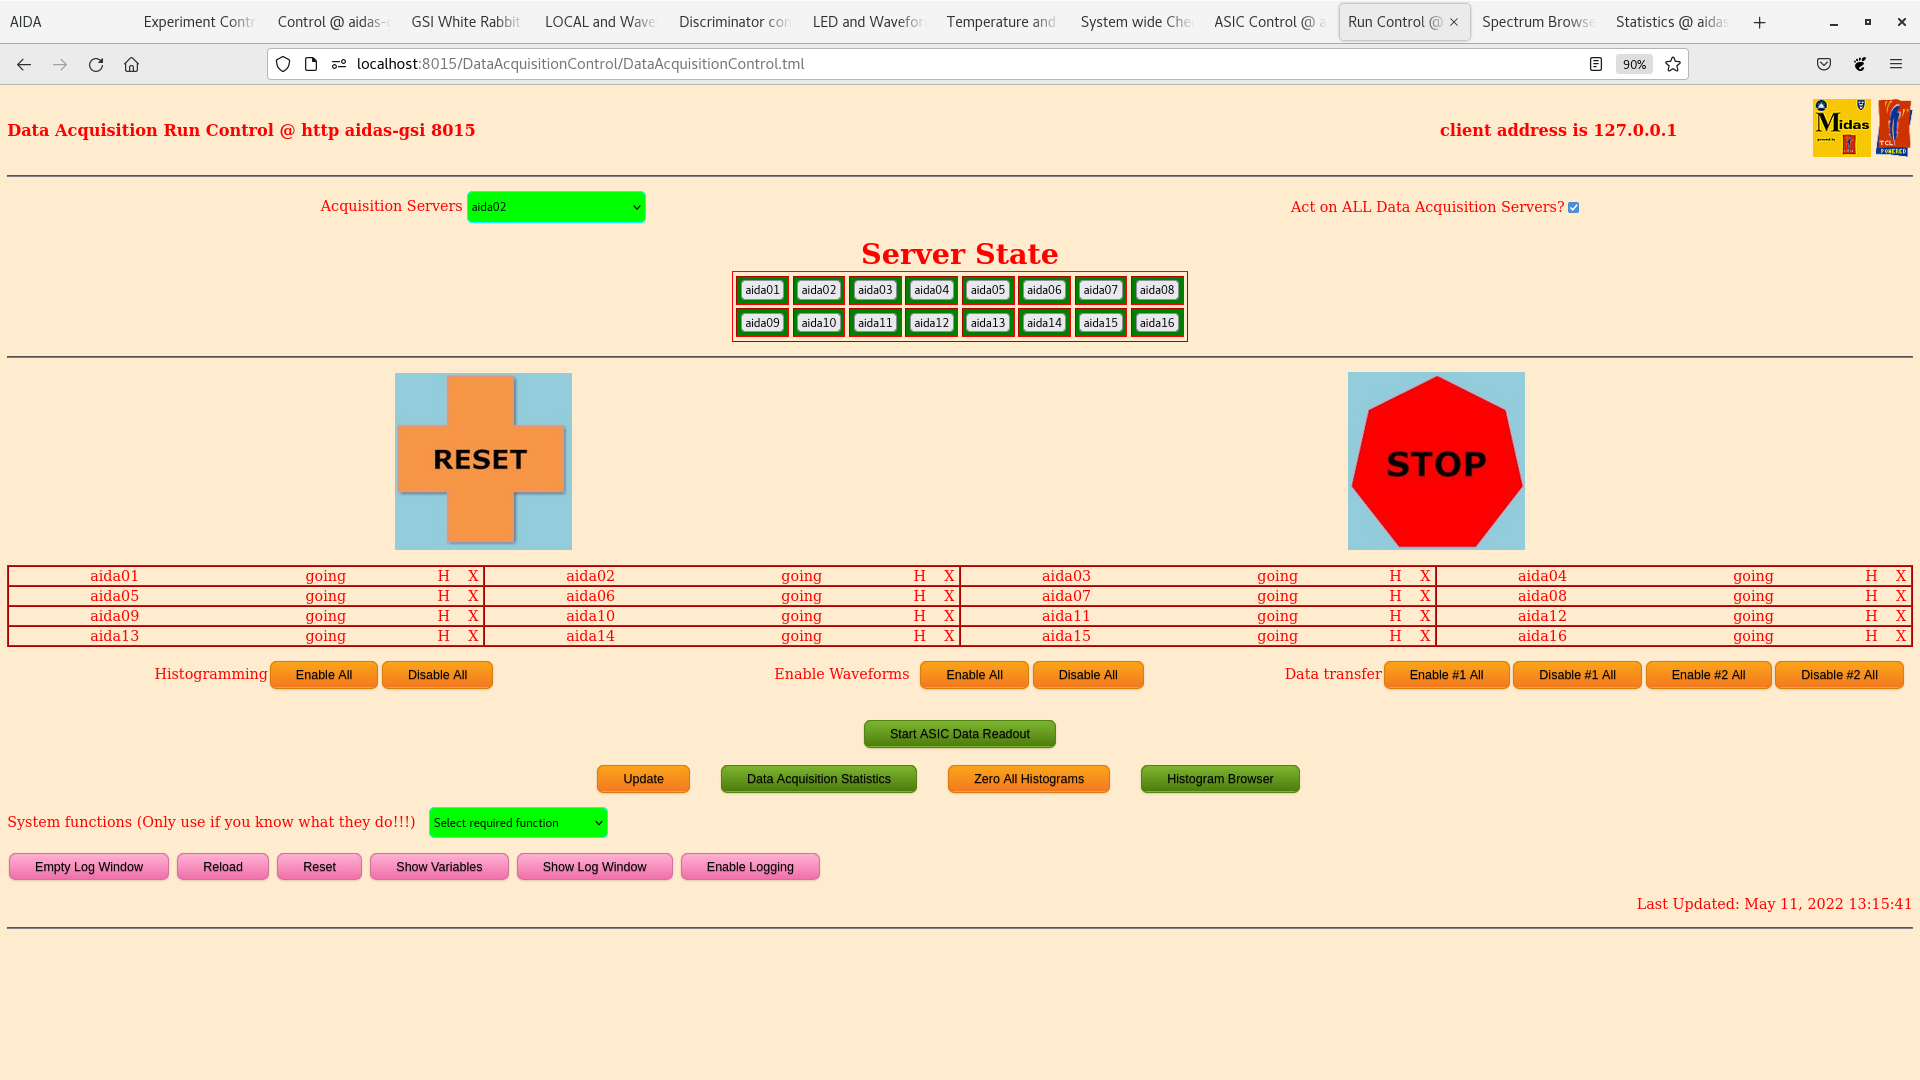
13.10 Attachments 3-5
      DAQ histogramming only enabled, waveforms/data transfer disabled, sampling ADCs OFF
      ASIC check load
      ASIC slow comparator all FEE64s all ASICS 0xa
      ADC data item stats

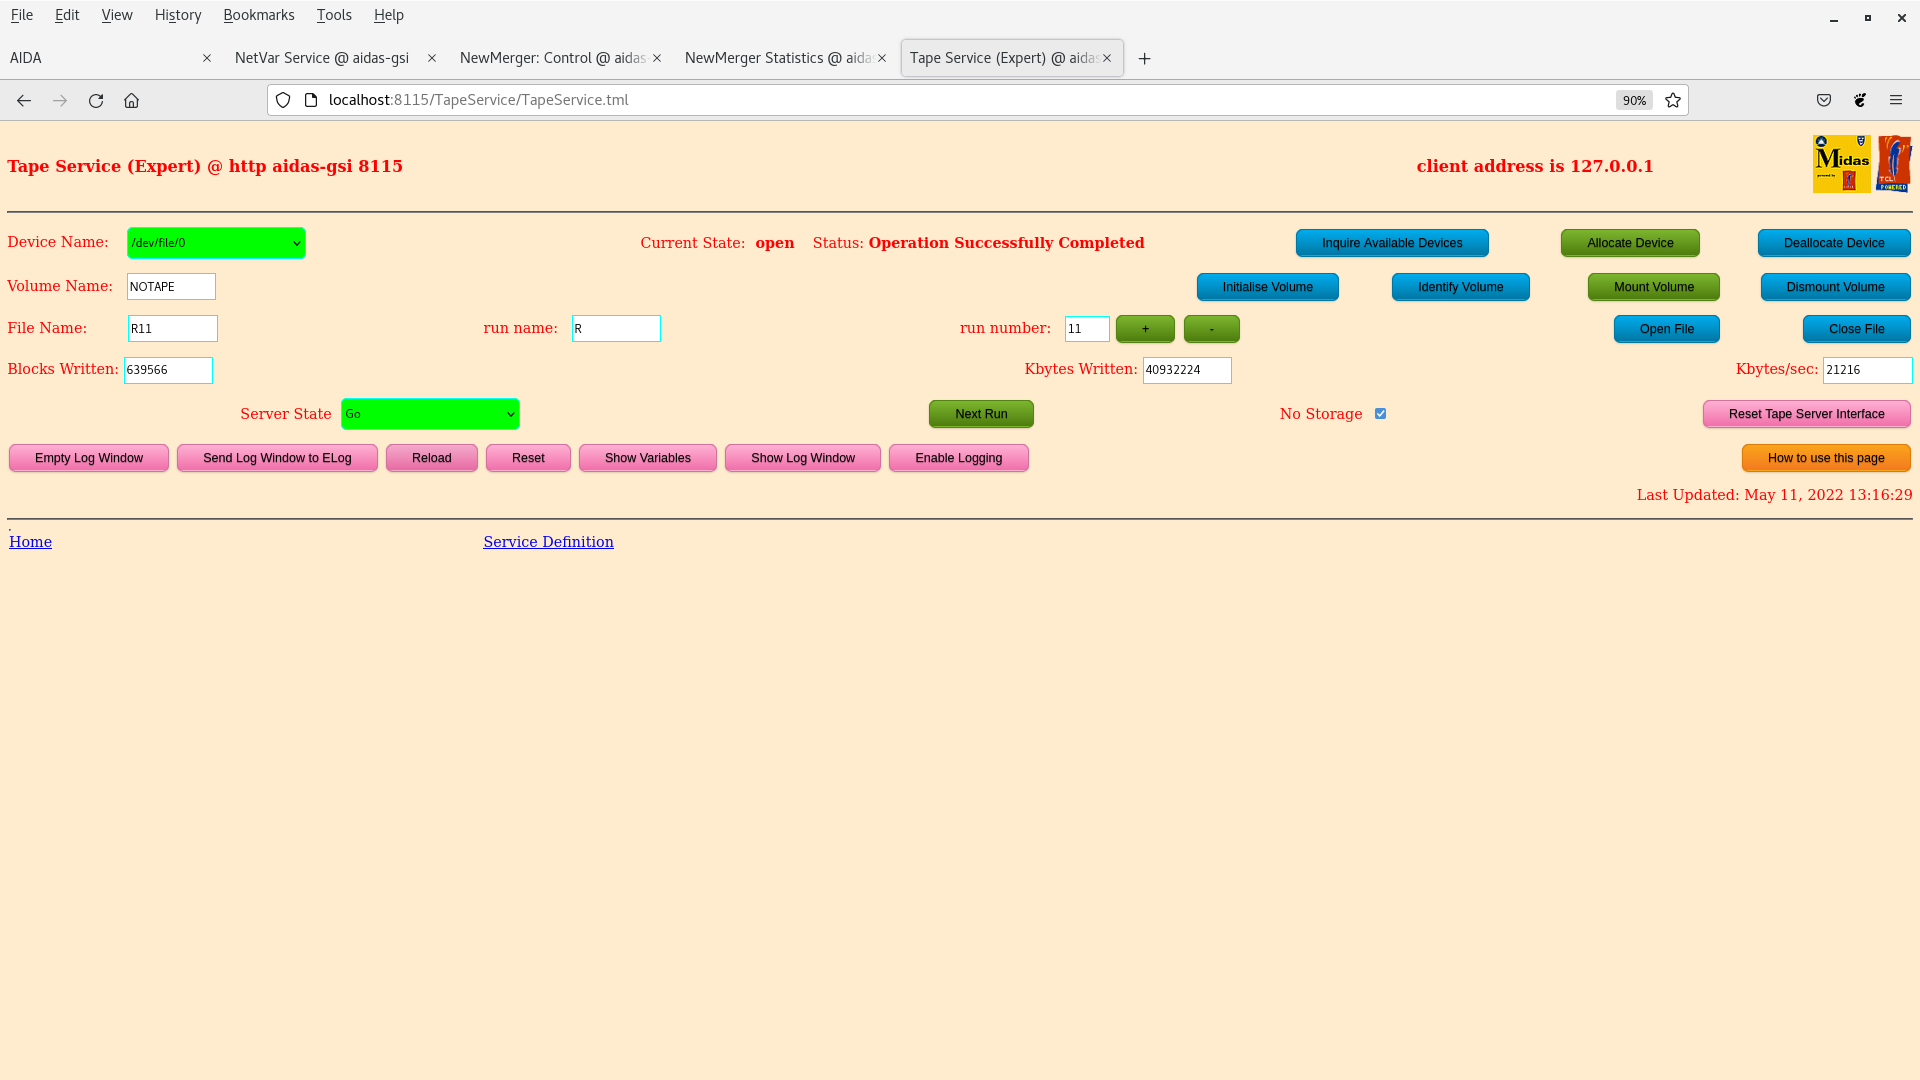
13.17 Attachments 6-9
      DAQ histogramming & data transfer enabled, waveforms disabled, sampling ADCs OFF
      ADC data item stats
      NewMerger/Tape Server

18:00 As part of tests in the afternoon it was investigated powering only one DSSD worth of FEEs at a time
      It was found that reasonable rates could be found for DSSD1 but poor rates only for DSSD2

      To try and help isolate the two detectors the jumpers 2 and 4 were removed from FEEs 13, 5 and 14 (Top, DSSD2)
      After powering on it was found there was no improvement and possible worse noise than before

We were able to recover the rates in the 1DSSD setup so instead have removed FEE power from FEE5 and FEE14 |
| Attachment 1: 220511_0806_aida14.png
|

|
| Attachment 2: 220511_0817_aida14_top.png
|

|
| Attachment 3: Screenshot_from_2022-05-11_13-11-09.png
|
|
| Attachment 4: Screenshot_from_2022-05-11_13-10-29.png
|
|
| Attachment 5: Screenshot_from_2022-05-11_13-09-12.png
|
|
| Attachment 6: Screenshot_from_2022-05-11_13-16-32.png
|
|
| Attachment 7: Screenshot_from_2022-05-11_13-16-24.png
|

|
| Attachment 8: Screenshot_from_2022-05-11_13-16-01.png
|

|
| Attachment 9: Screenshot_from_2022-05-11_13-15-45.png
|
|
|
|
92
|
Tue Nov 12 13:22:19 2019 |
OH, NH, CA | AIDA09 Replacement |
ASIC 1 on FEE9 was not producing signals.

A new HDMI cable was installed but still no signals.

AIDA09 was replaced with a new FEE.
Current list of FEE to serial numbers installed attachment 1

MAC address of new FEE was obtained.

Backup of DHCPD.conf was made dhcpd.confBACKUP191112

dhcpd.conf was updated with new MAC address.

All FEEs powered on and 09 was seen to mount and is seen by AIDAServer.

AIDA09 flashed to newest version of firmware. (0x18430701) - attachment 2 |
| Attachment 1: FEE-SerialNumber.txt
|
FEE#	Messanie Serial No.	MAC Address
4	026-1690101-0016	d8-80-39-41-f6-b7
8	026-1690101-0013	d8-80-39-41-ba-2b
12	026-1690101-0030	d8-80-39-41-cf-ac
2	026-1690101-0011	d8-80-39-41-ba-22
6	026-1690101-0035	d8-80-39-41-ee-72
10	026-1690101-0032	d8-80-39-41-ee-10
1	026-1690101-0027	d8-80-39-41-ba-8a
5	026-1690101-0008	d8-80-39-41-d7-cc
9	026-1690101-0015	d8-80-39-41-f6-ee
7	Not checked	d8-80-39-41-b4-0c
11	026-1690101-0006	d8-80-39-41-f6-5a
3	026-1690101-0019	d8-80-39-41-d8-21


Dead FEE	Messanie Serial No.	MAC Address
ASIC 1 Dead	026-1690101-0005	d8-80-39-42-0d-0c
|
|
|
390
|
Wed Oct 27 15:12:50 2021 |
OH, NH | Noise tests - 27th October |
 Began by installing the triple.
Only the upstream detector was connected to the FEEs the downstream detector cables were left loose. The two detectors are isotolated though.

Initial cabling configuration
No pulser connections to any of the FEEs connected to the DSSD.
Bias core connected to FEE 13 - FEE 3 and FEE 11 with connections made by T pieces
Bias braid connected to FEE 4 - FEE 2 with connection made by T piece
Adaptor boards grounded to FEE cooling plate via lemo
DSSD cable drain wires also connected to LEMOs

LK1 not on any adaptor boards.
LK2, 3 and 4 on all

System started and rates very high in all of the FEEs connected to DSSD.
N.B FEE 8 connected to pulser but not to cable and adaptor board not grounded to FEE cooling plate
FEE14 connected to pulser and adaptor board grounded to FEE cooling plate
Statistics - Attachment 1
It was noted one of the ribbon cable connectors for FEE13 had come off
Statistics fixed - Attachment 2
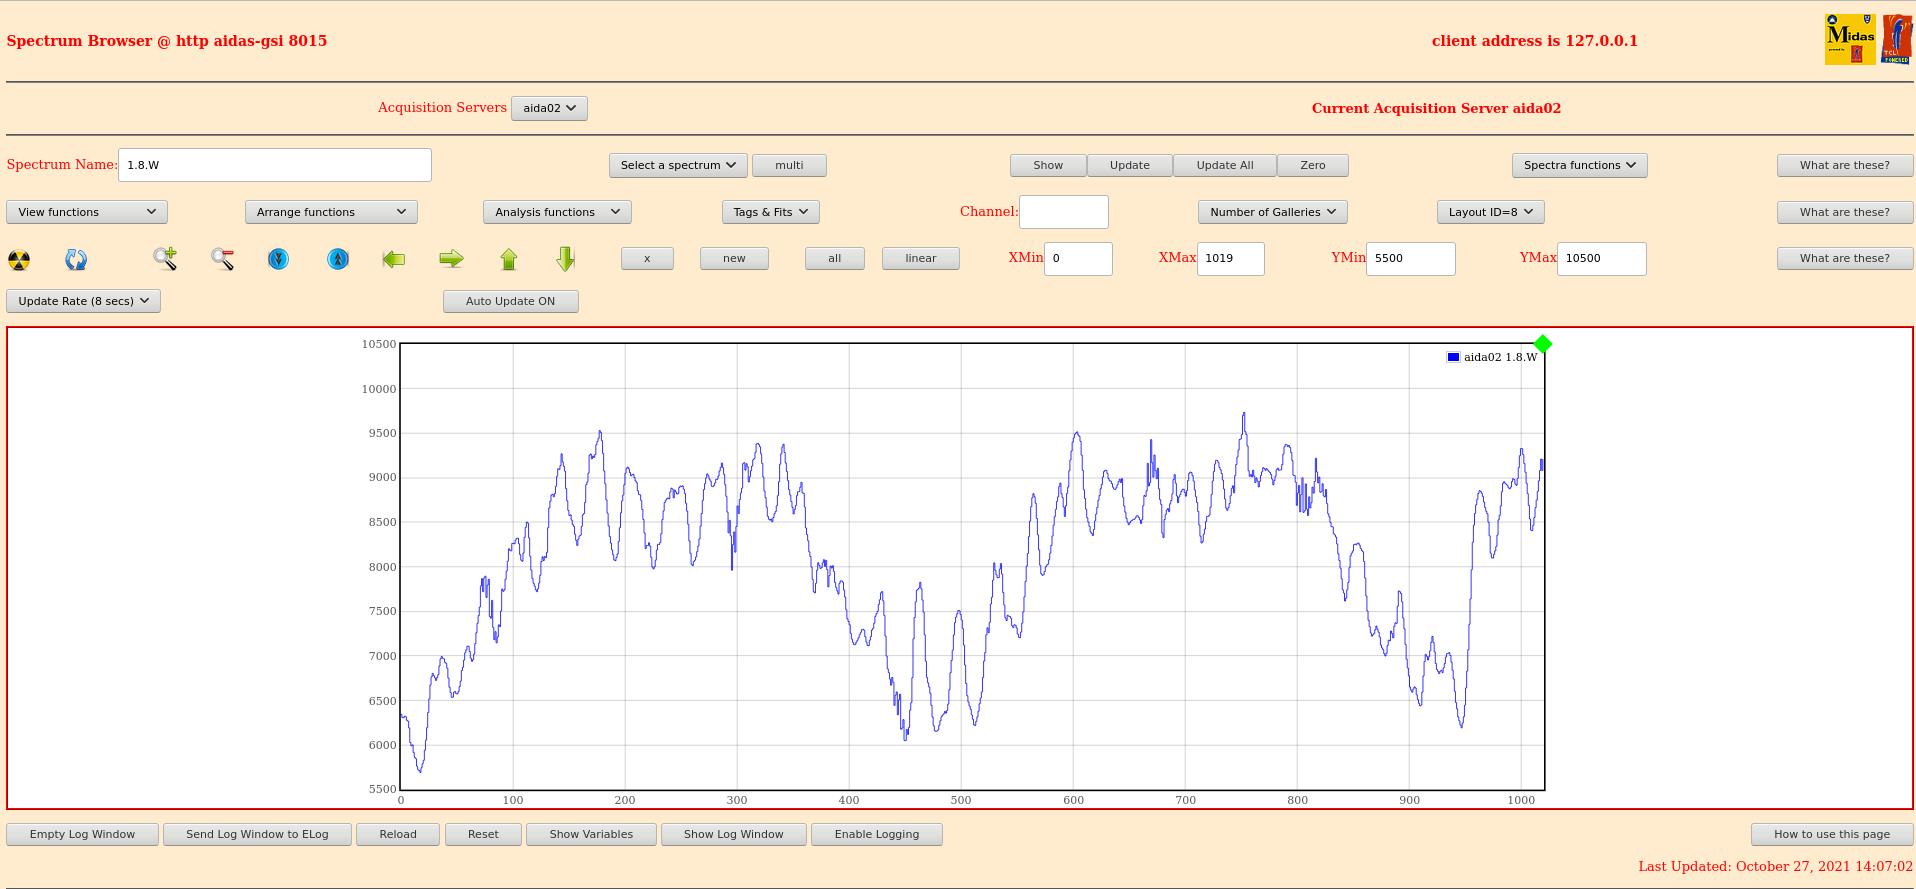
Representative waveforms showing the noise - Attachments 3 and 4

Bias turned off and HV filters connected
Issue at first as the solder connection in one filter had broken. Filter was replaced and the DSSD bias
Statistics are unchanged
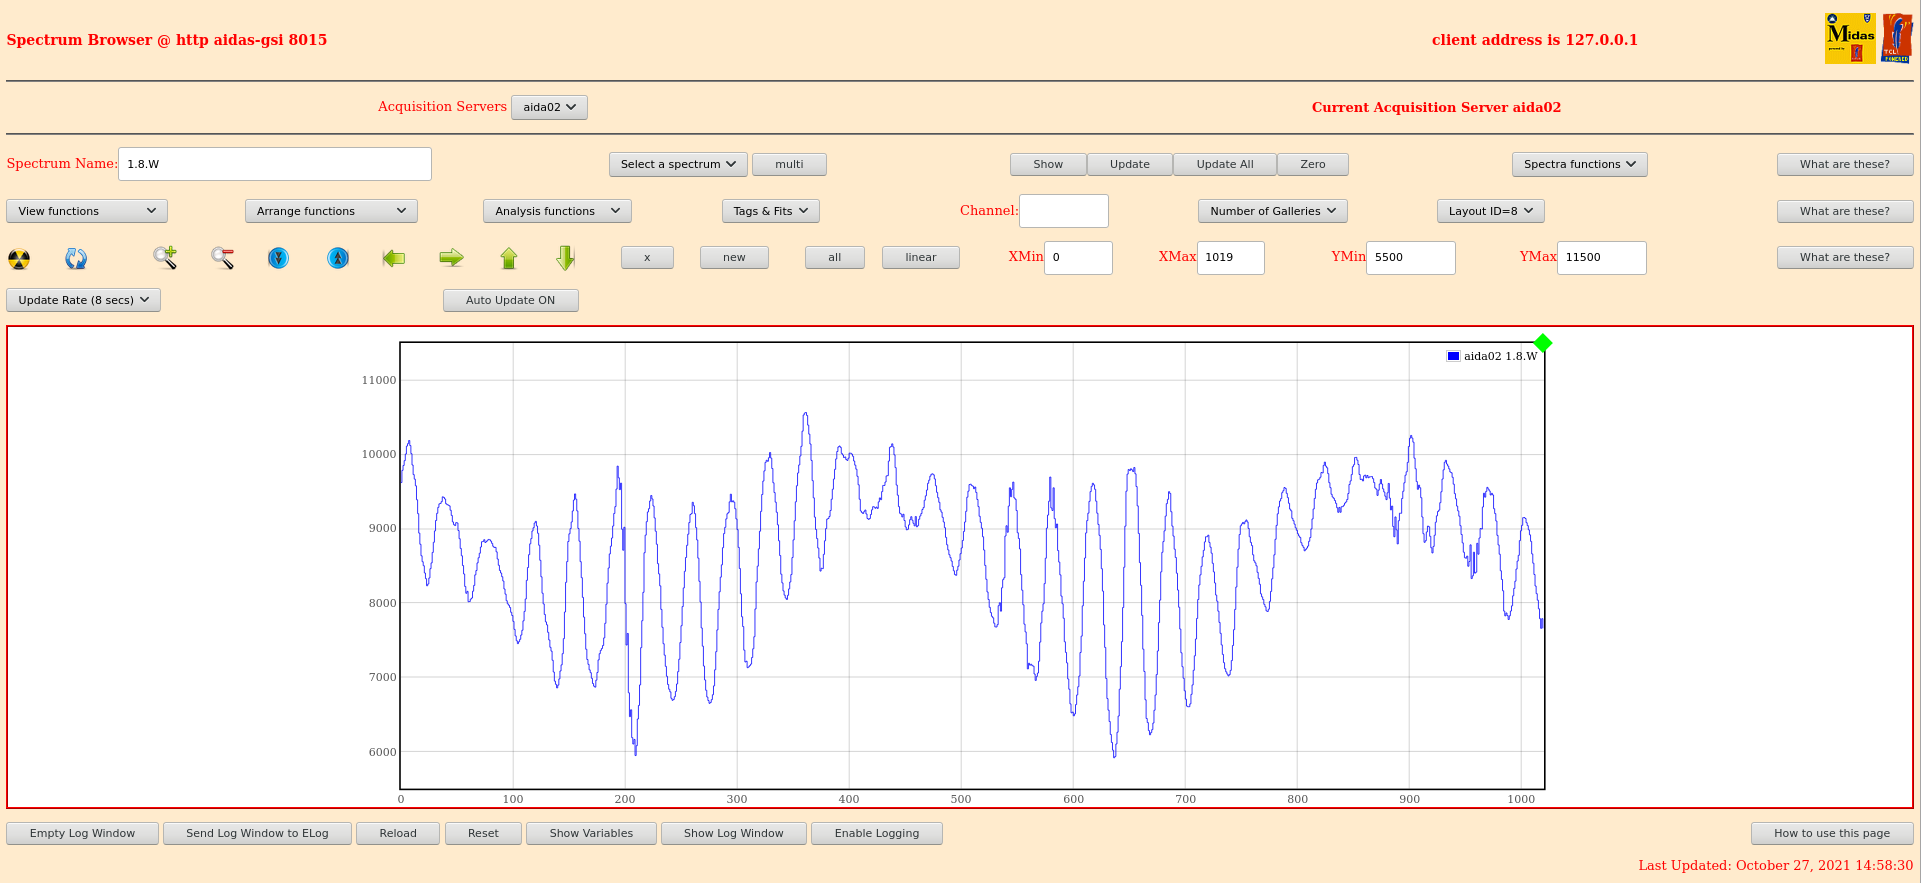
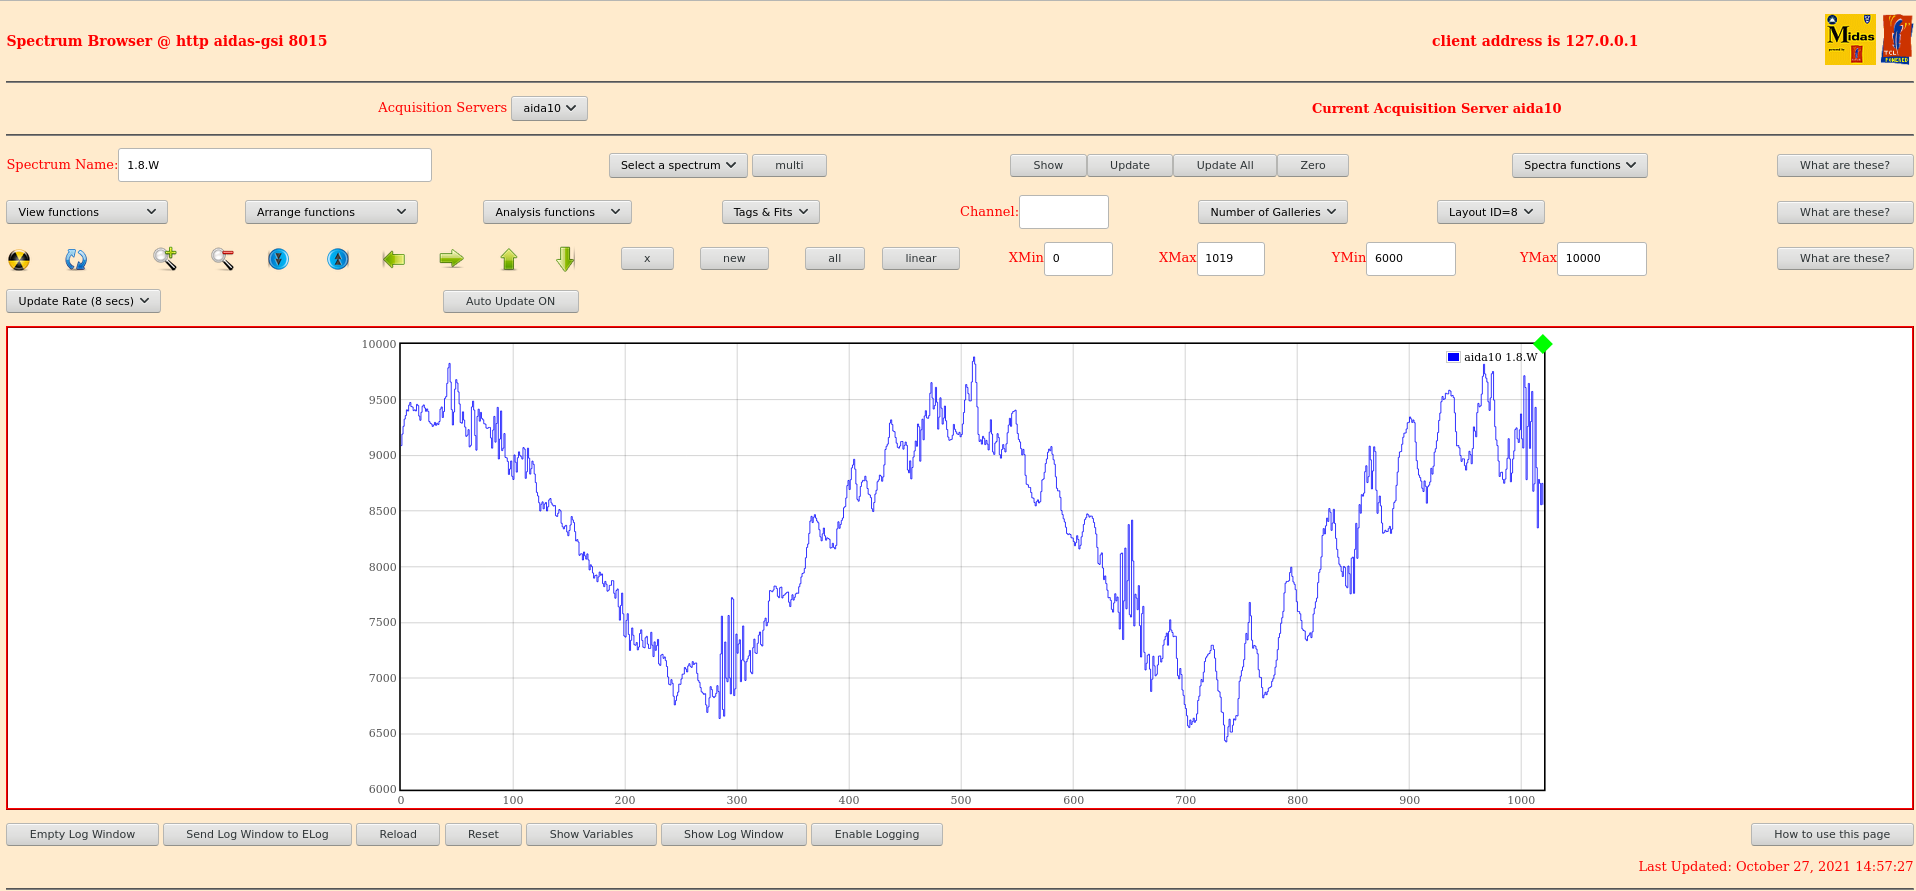
Waveforms with the HV filters installed - Attachments 5 and 6 |
| Attachment 1: 271021-waveaida10-pndssd-filter.png
|

|
| Attachment 2: 271021-dssds-fixed12.png
|

|
| Attachment 3: 271021-waves-dssd-nn.png
|
|
| Attachment 4: 271021-waveaida10-pndssd.png
|

|
| Attachment 5: 271021-waves-aida02-dssdnn-filter.png
|
|
| Attachment 6: 271021-waveaida10-pndssd-filter.png
|
|
|
|
397
|
Tue Mar 1 08:29:19 2022 |
OH, NH | Findings from the upgrade to centos7 from SL6 |
Required packages not included as default
- csh (For running MIDAS scripts)
- xinetd (Runs the rdate server for the FEEs)
- Telnet (Communication with the FEEs)
- dhcp
Configuration changes
Optional extras
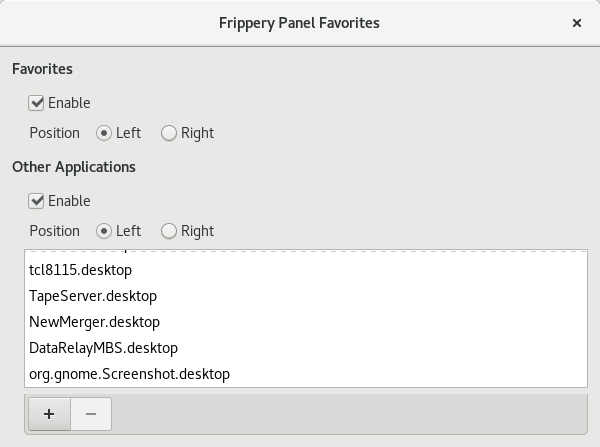
- For top bar icons similar to SL6 can use the gnome extension "Frippery panel favorites"
- Then just need to create desktop icons for each of the startup scripts within /usr/share/applications - Attachment 1
- Can also add screenshot to this - Attachment 2
- Gnome tweaks also allows the number of workspaces to be changed
- Also recommend setting workspaces to span displays
|
| Attachment 1: TapeServer.desktop
|
[Desktop Entry]
Name=TapeServer
Exec=/MIDAS/Linux/startup/TapeServer
Terminal=true
Icon=/home/npg/Downloads/midas100.gif
Type=Application
Comment=TapeServer for AIDA
|
| Attachment 2: Screenshot_from_2022-03-01_09-40-18.png
|
|
|
|
400
|
Wed Mar 2 16:00:01 2022 |
OH, NH | Noise tests - 2nd March |
An interesting find with the new sum inverter is that with the pulser at default settings the pulser peak on the n+n side is above the range of the ADC.
We have checked signals from the sum inverter and pulser and both are equal in magnitude.
We therefor determine it is over range as the charge is spread over 4 FEEs vs 12 on the p+n side.
This possibly wasn't an issue with the previous inverter if it produced a lower amplitude.

For tests going forward p+n voltage will be 2V. n+n voltage will be 0.5V - Attachment 1
Going to look into a 20dB attenuator

Seems there were issues with the lemo cables in the n+n pulser chain |
|
|
401
|
Thu Mar 3 08:45:03 2022 |
OH, NH | AIDA Noise and grounding tests 3rd March |
Pulser spectra
- Changes to the nn pulser circuit yesterday have improved the peak widths on the p+n side
- p+n peak widths averact around 100 channels
- n+n around 1000 at 0xa threshold
- n+n 1.8.L spectra - attachment 1
- p+n 1.8.L spectra attachment 2
p+n peak widths
| FEE |
Width |
| 9 |
105 |
| 1 |
82 |
| 10 |
71 |
| 11 |
79 |
| 3 |
96 |
| 12 |
72 |
| 13 |
191 |
| 5 |
101 |
| 14 |
129 |
| 15 |
118 |
| 7 |
110 |
| 16 |
100
|
n+n peak widths
| FEE |
Width |
| 2 |
1200 |
| 4 |
1179 |
| 6 |
- |
| 8 |
1813 |
Daily checks
- Fee temperatures ok - attachment 3
- Bias and leakage currents ok - attachment 4
- Stats spectra with current grounding - attachment 5
- Current grounding is just a cable going between each adaptor board and its respective FEE
- Interfee grounding done by power supply and also pulser circuit
- Rates for each of the asics - attachment 6
- p+n waveforms - attachment 7
- n+n waveforms - attachment 8
- Lots of noise evident on them
Plans for the day
- Connect FEEs up to the copper earth bars installed
- Powercycle and check noise levels
- If n+n remains significantly higher investigate the n+n pulser circuit further
- Investigate the effects of different jumper connetions At present n+n have all LK jumpers on and p+n have lk2-4
|
| Attachment 1: 220303_0927_nn_18L.png
|

|
| Attachment 2: 220303_0928_pn_18L.png
|

|
| Attachment 3: 220303_0932_TEMP.png
|

|
| Attachment 4: 220303_0933_Bias.png
|

|
| Attachment 5: 220303_0933_Stats.png
|

|
| Attachment 6: 220303_0936_Layout1.png
|
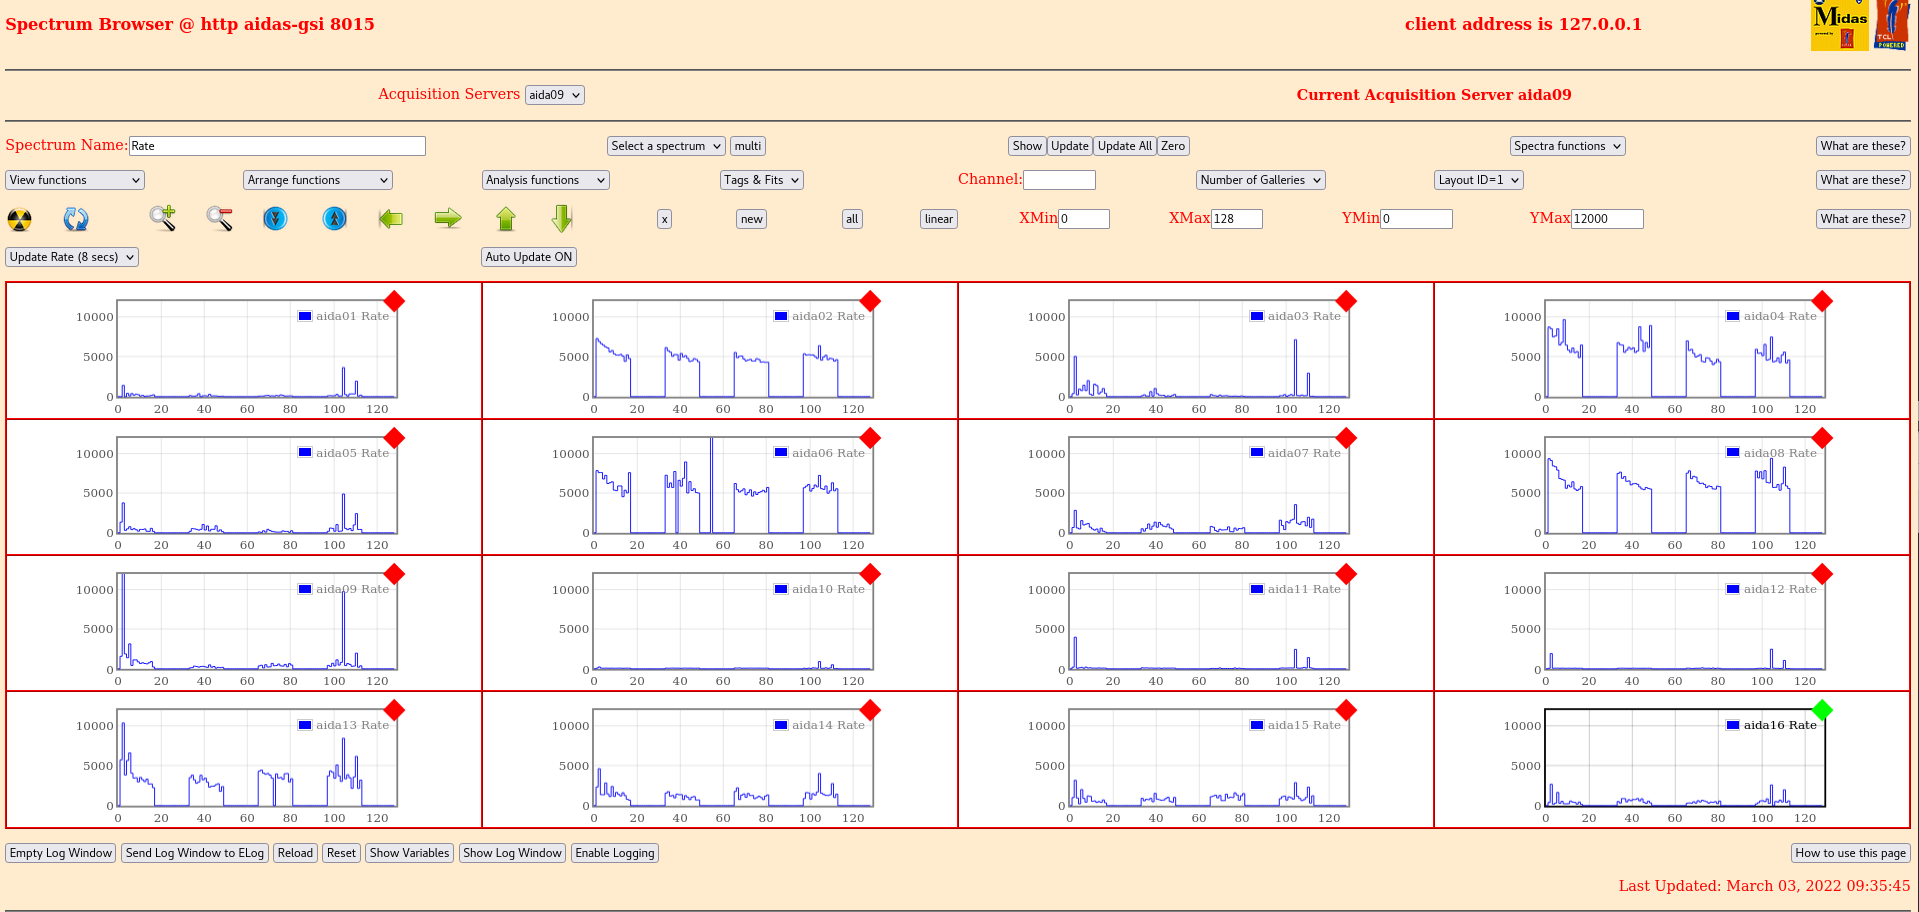
|
| Attachment 7: 220303_0941_pn_waveform.png
|

|
| Attachment 8: 220303_0942_nn_waveform.png
|
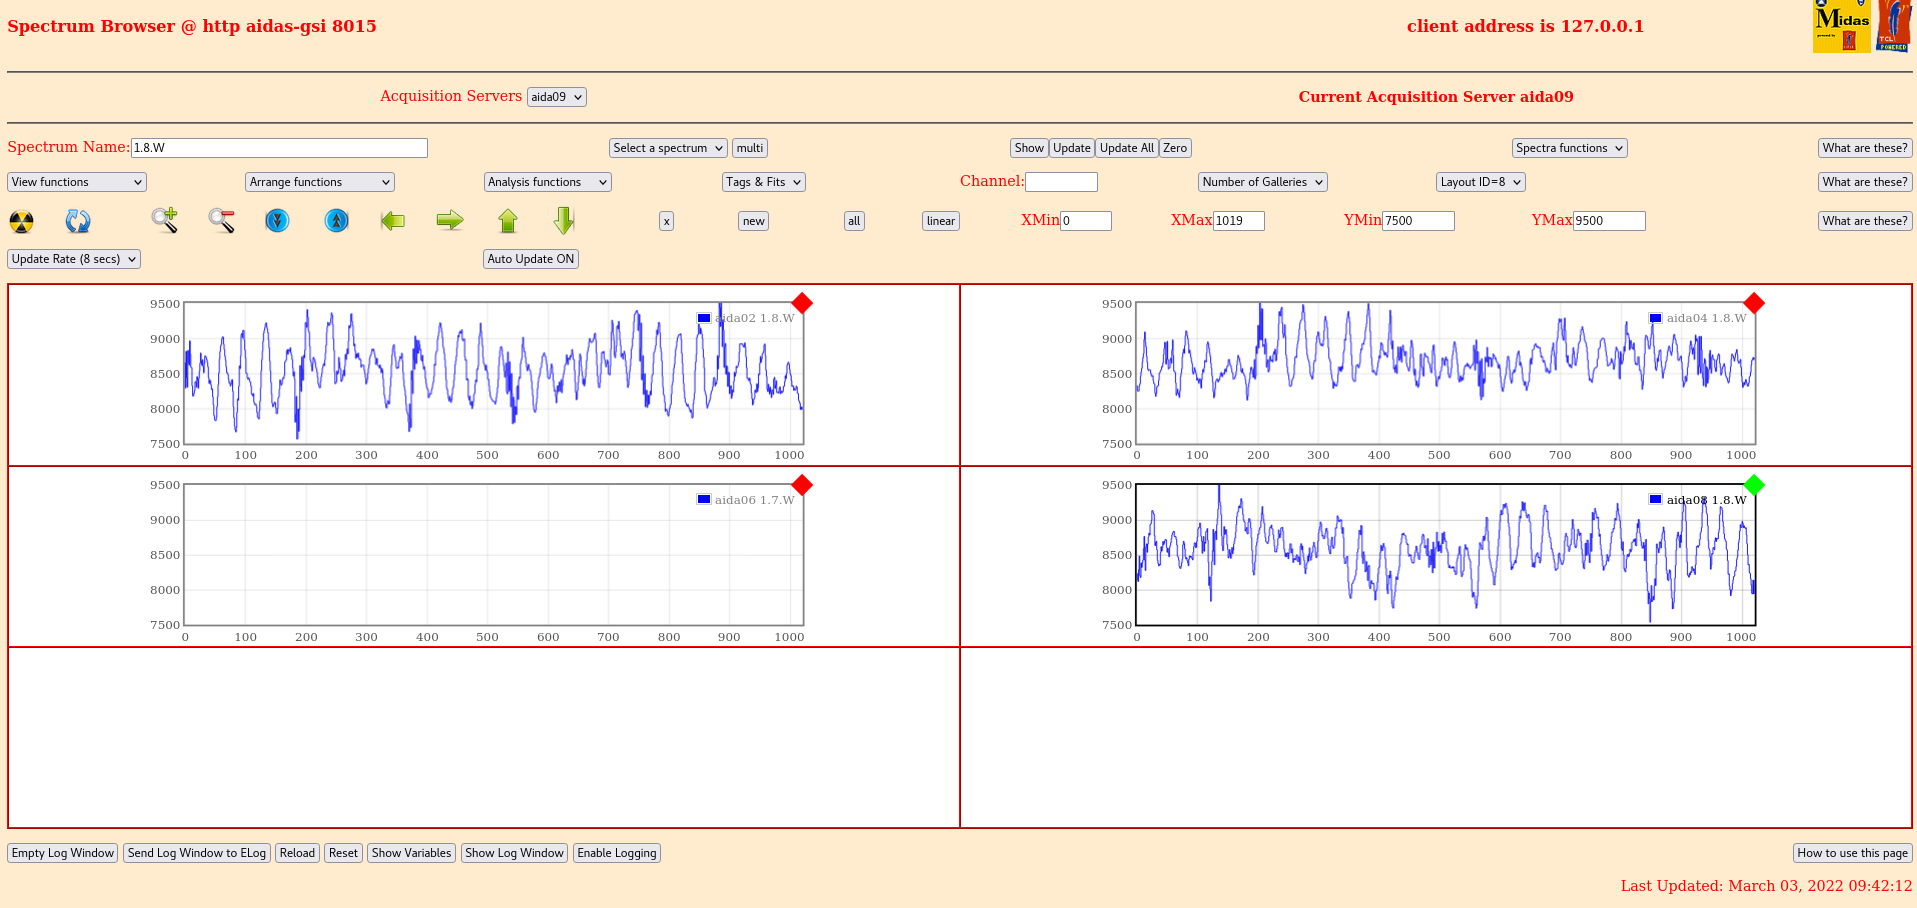
|
|
|
402
|
Fri Mar 4 08:40:36 2022 |
OH, NH | AIDA Noise and grounding tests 3rd March - Results |
Grounding implemented
- Each FEE given direct connection to heavy duty earth bar via adaptor board lemo ground
- Earth bars are then connected to platform ground on AIDA frame
- Photo of grounding - attachment 1
- Improvements not as large as expected from previous experience though
- Particularly in the n+n side where widths still appear awful
- While implementing the grounding it was noticed the ground lemo socket on FEE7 was damaged and no longer gripped onto a lemo cable
- It was noted that it would need changing at some point but continued with it for the time being
- Jumper configuration was n+n LK1-4 all on, p+n LK2-4 all on
p+n widths
| FEE |
Width |
| 9 |
147 |
| 1 |
116 |
| 10 |
92 |
| 11 |
77 |
| 3 |
128 |
| 12 |
72 |
| 13 |
75 |
| 5 |
59 |
| 14 |
75 |
| 15 |
80 |
| 7 |
150 |
| 16 |
75 |
- Compared to the width with no grounding the FEEs for the first DSSD (First 6) range from no change to slightly worse
- 1.8.L spectra - attachment 3
n+n widths
- Widths still very large
- Width for 8 is around 500
- 1.8.L attachment 2
Additional info
- Statistics - attachment 4
Jumper optimisation
- Went to our previously found optimal jumper configuration for the trips
- n+n LK1 only
- p+n LK 2 and 4 on all FEE
- p+n LK3 on non isolated cables (PCB ground on lower middle cable and n+n side bias on top middle cable)
- While changing the jumpers we also swapped out the damaged adaptor board on aida07 for a new one
- Saw an improvement for most FEEs
| FEE |
Width |
| 9 |
134 |
| 1 |
83 |
| 10 |
80 |
| 11 |
68 |
| 3 |
60 |
| 12 |
60 |
| 13 |
71 |
| 5 |
60 |
| 14 |
75 |
| 15 |
82 |
| 7 |
97 |
| 16 |
77 |
- Unfortunately saw no improvement for the n+n
- We event tested having the pulser only going into a single FEE (aida08)
- Still have a width of 622 for that FEE
- To compare FEEs we have layout 1 - attachment 5
- Layouot 1 on a common timescale - attachment 6
- Note that the rate is typically dominated by a single strip or a couple of strips within a FEE
- Many channels are just showing the pulser rate 25Hz
- p+n 1.8.L attachment 7
- p+n waveforms attachment 8
- n+n waveforms attachment 9
- Testing the noise on the n+n strips we observe noise with slow comparator set to 200 (2MeV)
- Meanwhile the p+n strips are silent at 0x64 for the most part.
- DAQ left running overnight with 0x64 on ASIC settings to see if we observe any alphas
Plan for the day
- Test daisy chaining the n+n across to the other n+n strips
- Currently the n+n braid is only plugged into either aida06 or aida08 (depending on DSSD)
- All of the jumpers are however grounded
- Will still test
- May investigate also trying this on LK3 on adaptors for aida01 and aida03
- Observe the output of the new sum inverter on the scope to check for variation in amplitude
|
| Attachment 1: PXL_20220303_104253926.jpg
|
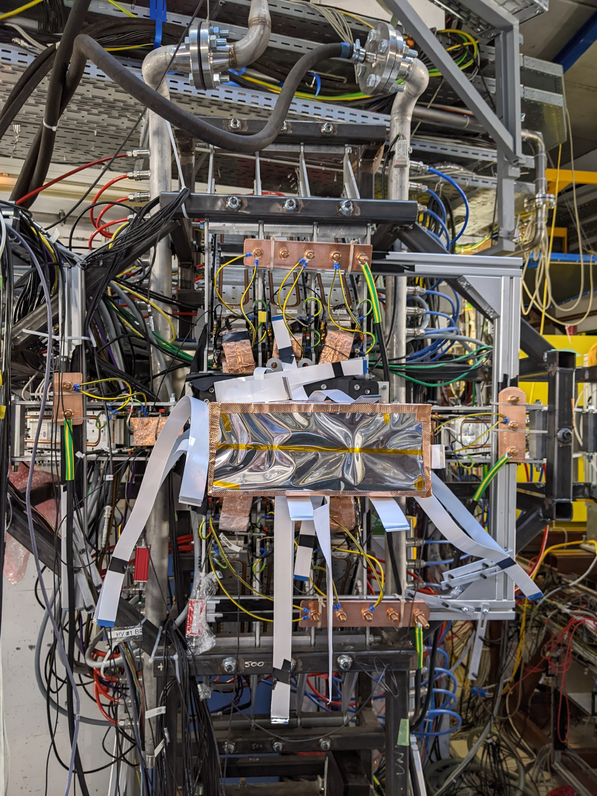
|
| Attachment 2: 220303_1310_nn_18l.png
|

|
| Attachment 3: 220303_1313_pn_18L.png
|

|
| Attachment 4: 220303_1313_stats.png
|

|
| Attachment 5: 220303_1438_layout1.png
|
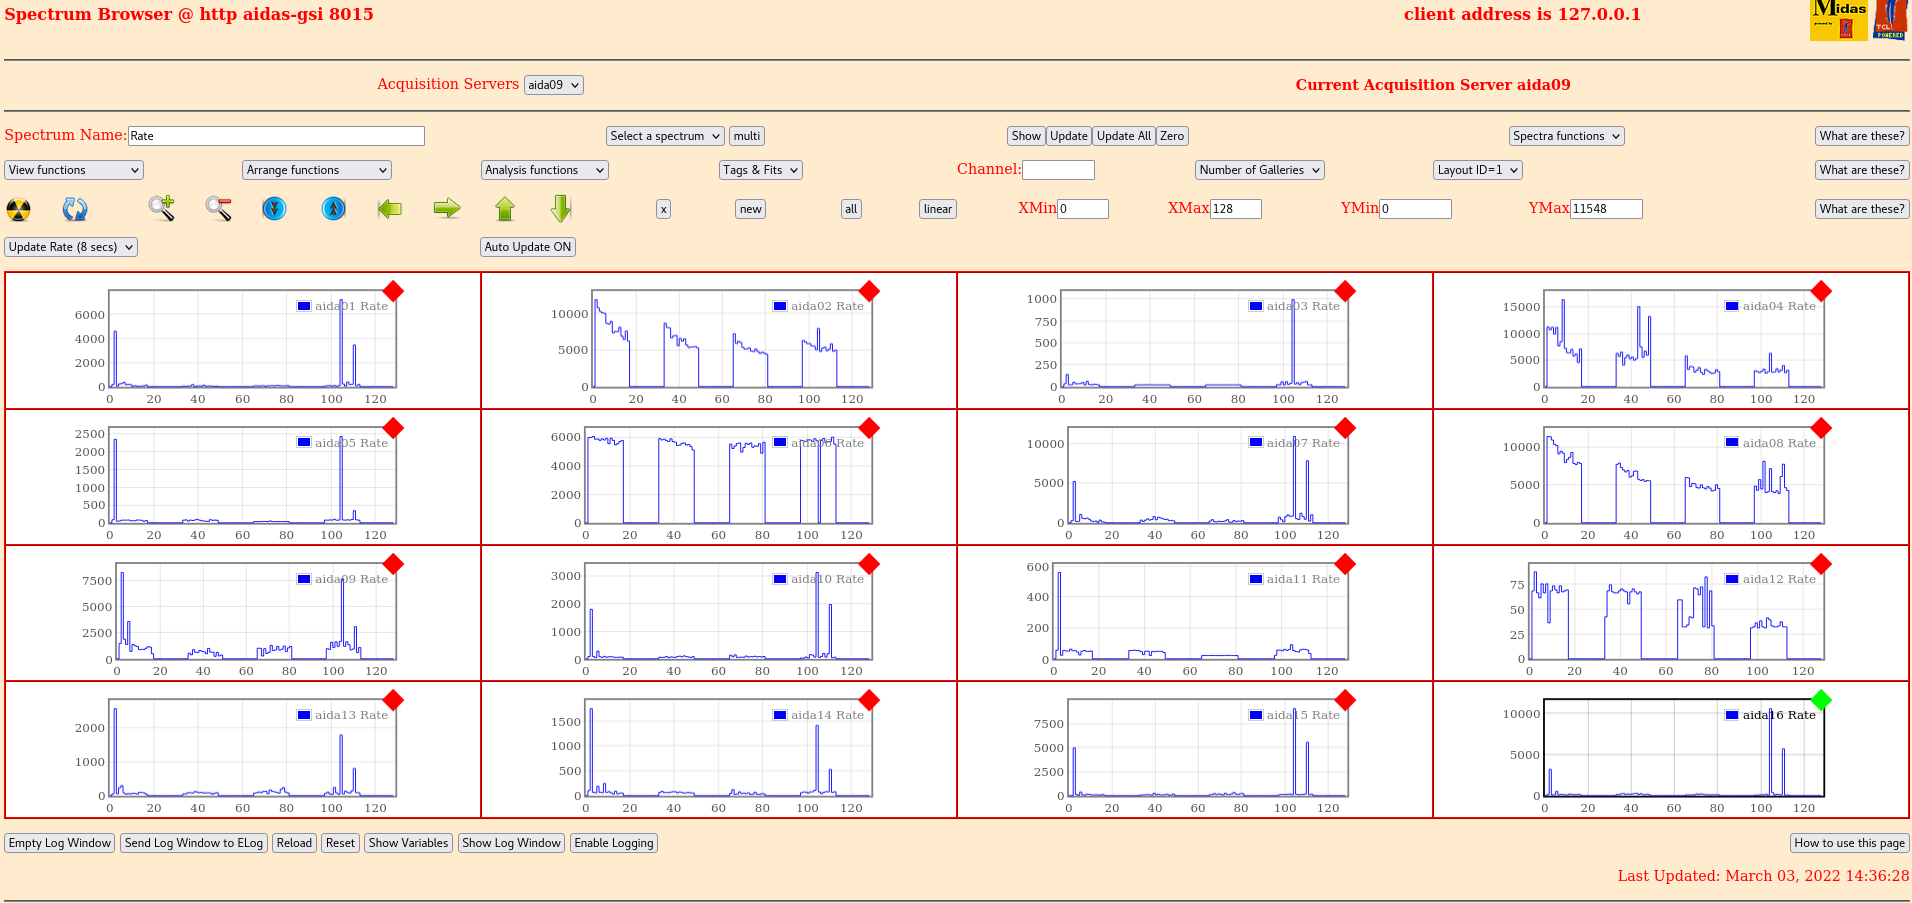
|
| Attachment 6: 220303_1439_layout1common.png
|
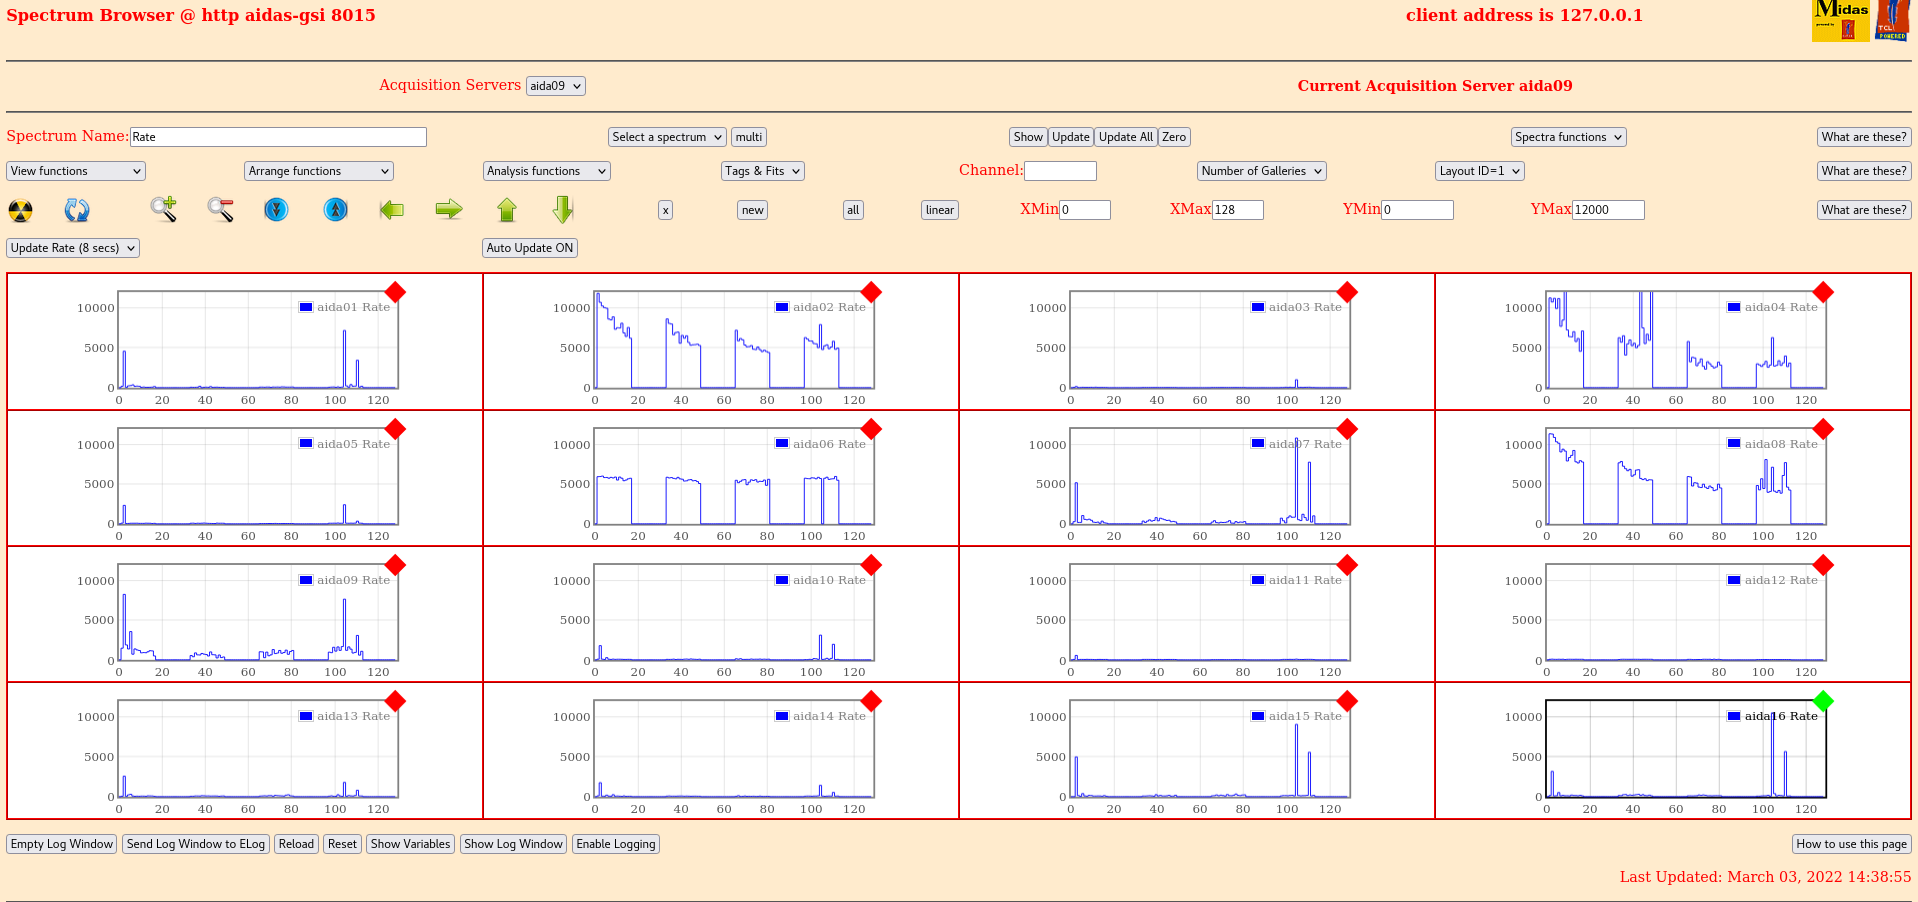
|
| Attachment 7: 220303_1446_pn_18L.png
|

|
| Attachment 8: 220303_1452_pn_waveform.png
|

|
| Attachment 9: 220303_1453_nn_waveforms.png
|

|
|
|
403
|
Sat Mar 5 10:43:45 2022 |
OH, NH | Grounding and noise tests 4th-5th March Summary |
Tests performed
- After leaving overnight noticed the pulser was not fully inserted into aida09
- Little change in rates observed in 9 but otherwise nothing else
- Connected bias of aida02 (n+n ground) to aida06 (n+n ground) and likewise 4-8
- No change observed in rates
- Also tested covering the snout in light tight material
- Unplugged the system monitor from 6 and 8, no change
- Connected the snout to ground with copper tape
- Rates became very unpredictable in the FEEs unsure if this was snout grounding related though
- Removed the ground and powercycled and rates restored to where previously
- Changed the bias supply jumper inside to have the bias line connected to the rack ground
- At the same time noticed that the ground cable connecting the adaptor board of aida06 to the FEE had become disconnected from the ring terminal
- Recrimped and inserted again
- Saw an improvment in the rates of the p+n strips and also the n+n strips - attachment 1
- Pulser widths however larger than yesterday
p+n width
| FEE |
Width |
| 9 |
118 |
| 1 |
88 |
| 10 |
75 |
| 11 |
77 |
| 3 |
67 |
| 12 |
66 |
| 13 |
96 |
| 5 |
89 |
| 14 |
107 |
| 15 |
93 |
| 7 |
118 |
| 16 |
87 |
n+n width
- Connected up entire pulser circuit to n+n FEEs
| FEE |
Width |
| 2 |
428 |
| 4 |
N/A |
| 6 |
428 |
| 8 |
343 |
Switching bias supply back
- because changes were made to the n+n ground, and the pulser circuit it was decided to go back and check the previous bias configuration with the module set in a floating configuration
- DAQ was then left overnight as had to leave to catch the bus
- Rates are observed to be back at their higher values - attachment 2
- n+n 1.8.L spectra - attachment 3
- p+n 1.8.L spectra - attachment 4
p+n widths
| FEE |
Wdith |
| 9 |
130 |
| 1 |
128 |
| 10 |
75 |
| 11 |
78 |
| 3 |
71 |
| 12 |
71 |
| 13 |
96 |
| 5 |
85 |
| 14 |
110 |
| 15 |
99 |
| 7 |
123 Dbl |
| 16 |
92 |
n+n widths
| FEE |
width |
| 2 |
56 |
| 4 |
983 |
| 6 |
523 |
| 8 |
358 |
- The results show no improvment to slightly worse performance so will go back to having the bias module grounded internally and check the previous conclusions hold before making further changes
Return to grounded bias module
Widths
p+n
| FEE |
Width |
| 9 |
106 |
| 1 |
79 |
| 10 |
72 |
| 11 |
78 |
| 3 |
70 |
| 12 |
73 |
| 13 |
102 |
| 5 |
112 |
| 14 |
105 |
| 15 |
110 |
| 7 |
131 |
| 16 |
104 |
n+n
| FEE |
Width |
| 2 |
- |
| 4 |
298 |
| 6- |
- |
| 8 |
278 |
- Don't see a pulser peak in 4 or 2
- Will replace cable between 4 and 2 and 2 and 6
- Statistics at 0x64 with pulser on - atachment 5
- Now see peaks - attachment 6
- Statistics at 0xa - attachment 7
| FEE |
Width |
| 2 |
284 |
| 4 |
1089 (Triple) |
| 6 |
371 |
| 8 |
318 |
With the grounded bias in place in the module move the braid cable to the frame rather than being connected to bias line
- Still observe a triple peak in 4 and have worse perfromance in 2 and no improvement in p+n
- 0x64 stats - attachment 7
- 0xa statistics - attachment 8
- p+n 1.8.L - attachment 9
- p+n waveform - attachment 10
- n+n waveform - attachment 11
- Same high frequency component in both
- 35 channel spacing corresponds to a frequency of ~1.4MHz
| FEE p+n |
Width |
| 9 |
109 |
| 1 |
118 |
| 10 |
78 |
| 11 |
80 |
| 3 |
70 |
| 12 |
73 |
| 13 |
92 |
| 5 |
85 |
| 14 |
99 |
| 15 |
100 |
| 7 |
123 |
| 16 |
92 |
| FEE n+n |
Width |
| 2 |
531 |
| 4 |
1185 (Triple) |
| 6 |
536 |
| 8 |
376 |
Next tests
- Returned braid to FEE 4 and 8
- Recovered earlier rates and performance
- Re-added the ground cable to the snout
- Much worse noise performance across all FEEs
- p+n rates in 200k
- Removed the ground from the snout
- Got really good rates originally - attachment 12
- Noticed 1 and 5 failed ADC calibration
- Calibrated them and there rates increased massively - attachment 13
- Notice that the pulser peak in FEE2 and 6 keeps dropping out
- As the cables have been changed multiple times thought it could be that an adaptor board was broken
- 4 seemed the most likely suspect with its high rates and triple peaks
- Replaced the adaptor board with one missing an outer ERNI pin (PIN doesn't interface with the FEE so didn't see any issues)
- Pulser peaks were still muissing
- Issue could be then with adaptor board 2 possibly
Conclusions
- Rates on the FEEs are in a better place now than they were at the start of the week
- p+n in particular have shown a large amount of improvement
- There are still however issues with the n+n FEEs
- I think there is likely an issue with one of the adaptor boards
- Possible aida02 at the pulser connection point
- Could explain the triple peaking in aida04 and the pulser issues with aida02 and aida06 dropping out.
- Would recomend swapping out aida02 as a test next week
- Other possible issues coiuld be the clingfilm around the cables has torn and we are grounding the cables to the inside of the snout
- Nic would like to use something other than clingfilm in future
- One suggestion would be mylar which could be held in place with strips of double sided tape
- This would make the cables less likely to stick to each other which is an issue with the tightness of the snout
- Could also try removing LK3 from FEE3 and 7 leaving the PCB ground floating
- I am at a slight loss of what else to try
- I have left the daq running at 0x64 overnight to check for alphas
- Histograms and statistics zeroed
|
| Attachment 1: 220304_1704_groundedbias_stats.png
|

|
| Attachment 2: 220305_1154_Stats.png
|

|
| Attachment 3: 220305_1157_nn_18L.png
|

|
| Attachment 4: 220305_1200_pn_18L.png
|

|
| Attachment 5: 220305_1336_0x64Stats.png
|

|
| Attachment 6: 220305_1341_nn_18L.png
|

|
| Attachment 7: 220305_1342_Stats.png
|

|
| Attachment 8: 220305_1405_0x64_stats.png
|

|
| Attachment 9: 220305_1421_pn_18L.png
|

|
| Attachment 10: 220305_1424_pn_waveform.png
|

|
| Attachment 11: 220305_1429_nn_waveform.png
|

|
| Attachment 12: 220305_1518_stats.png
|

|
| Attachment 13: 220305_1519_waveform_enabled.png
|

|