| ID |
Date |
Author |
Subject |
|
228
|
Tue Feb 22 05:47:18 2022 |
JM, CB, LV, PM, AK | Beam ON, Target ON Run 54 - 2 events at 10MeV! |
06:47
Beam ON ~2.0E6 pps, still fluctates between 1e6 and 6e6 (like a step function)
Target ON and open to the ring
YR09xxx ETarget ~1.8e-10 (saturated)
Target E4 inlet pressure 8.0E-9 mbar
Dump S3 ~ 6.6E-10 mbar
Nozzle temperature 150 K
Run 54 started, monitoring code restarted. |
| Attachment 1: Screenshot_from_2022-02-22_06-43-36.png
|

|
| Attachment 2: Screenshot_from_2022-02-22_06-43-20.png
|

|
| Attachment 3: Screenshot_from_2022-02-22_06-42-48.png
|

|
| Attachment 4: Screenshot_from_2022-02-22_06-42-27.png
|

|
| Attachment 5: Screenshot_from_2022-02-22_06-42-00.png
|

|
| Attachment 6: Screenshot_from_2022-02-22_06-46-02.png
|

|
| Attachment 7: Screenshot_from_2022-02-22_06-45-48.png
|

|
| Attachment 8: Screenshot_from_2022-02-22_06-45-30.png
|

|
| Attachment 9: Screenshot_from_2022-02-22_06-44-28.png
|

|
| Attachment 10: Screenshot_from_2022-02-22_06-43-54.png
|

|
| Attachment 11: Screenshot_from_2022-02-22_06-46-32.png
|

|
|
734
|
Tue Jun 10 16:46:39 2025 |
JM, CB, EW, AY, PC | 150 keV - Run64 |
Run 64 started.
150 keV/u beam on target, Target overlap confirmed with lifetime measurement using bunched beam.
We do not see Rutherford on the detector - perhaps this is a calibration issue - perhaps too much noise at threshold.
We leave for a few hours to see if we obsrerve any reactions peaks
Moved detectors in with servos only. Both arms are IN and stationary.
Left potentiometer = 36.54 mm
Right potentiometer = 37.96 mm
Horizontal beam position = -3.0 mm
data rate is ~5 MB/sec
Electron cooler read values; Cooler voltage = 88.57V, cooler current=1.28 mA.
19:05
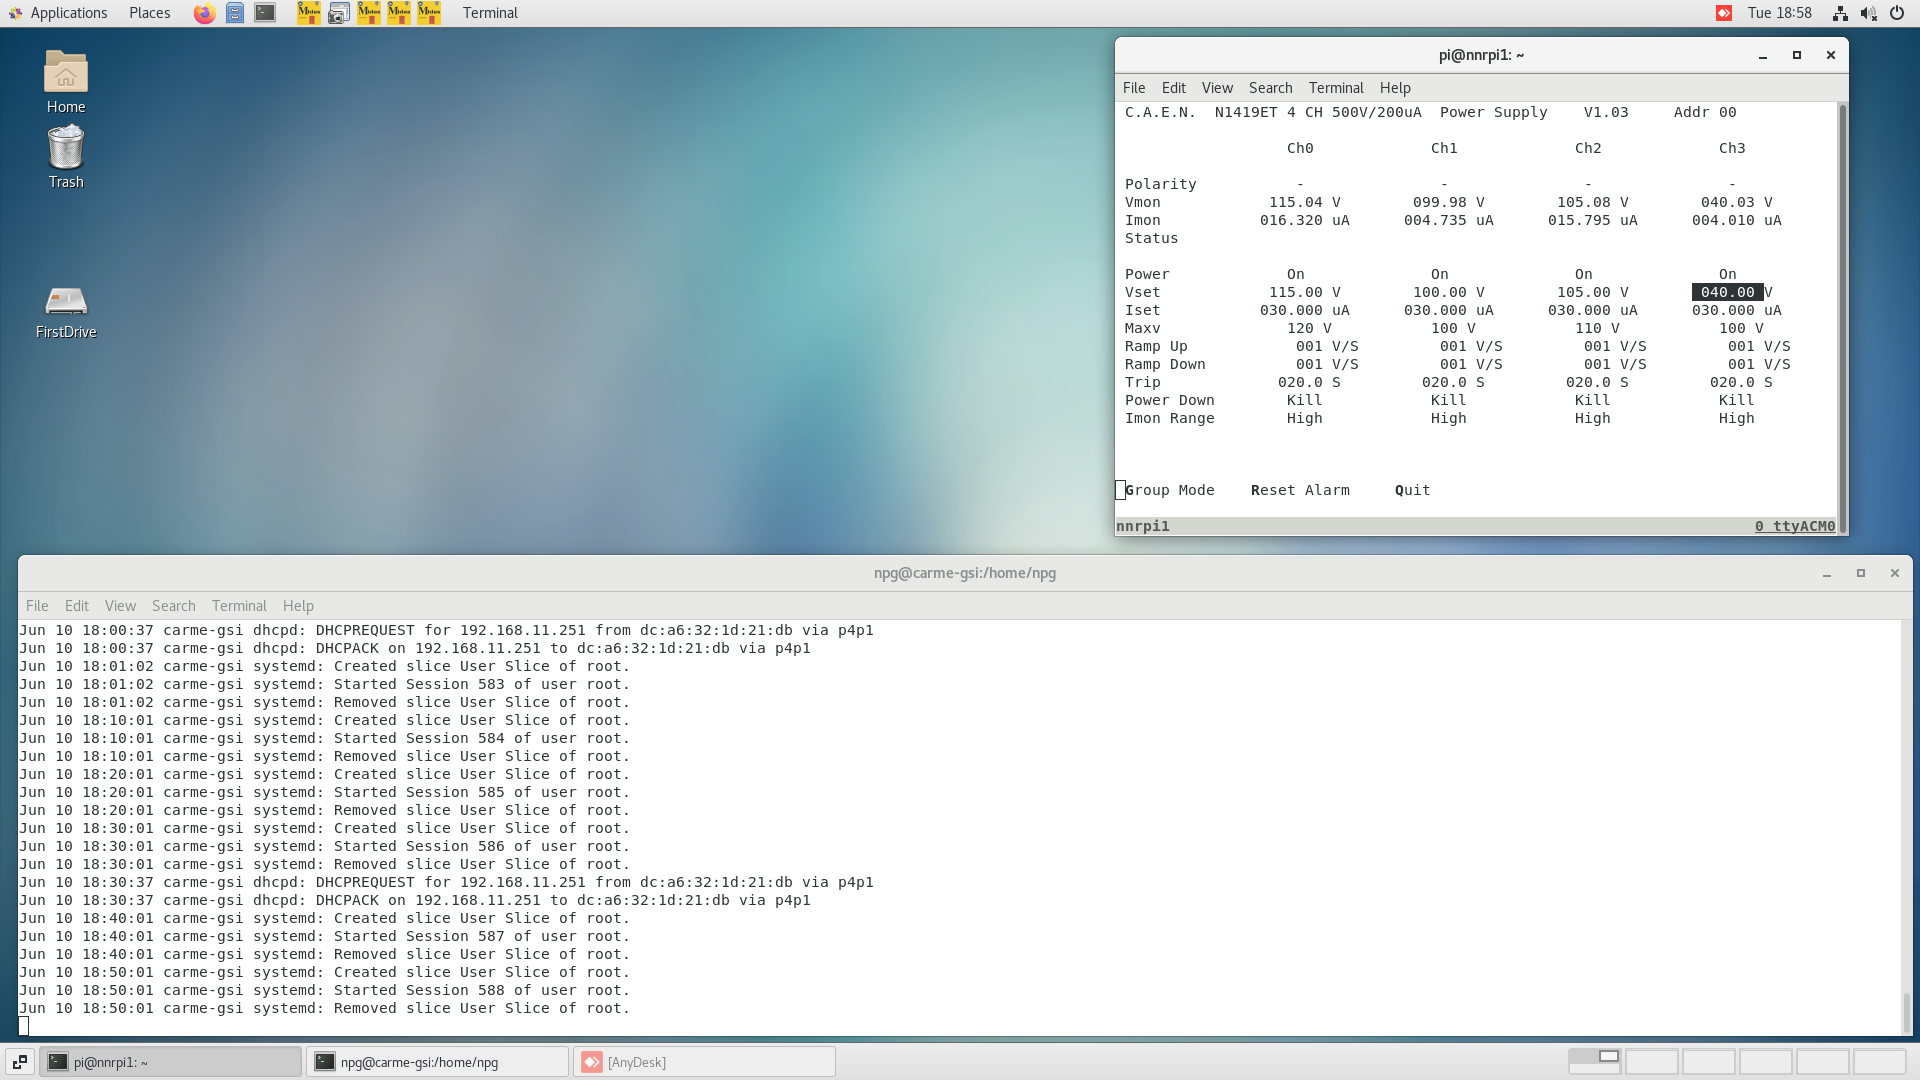
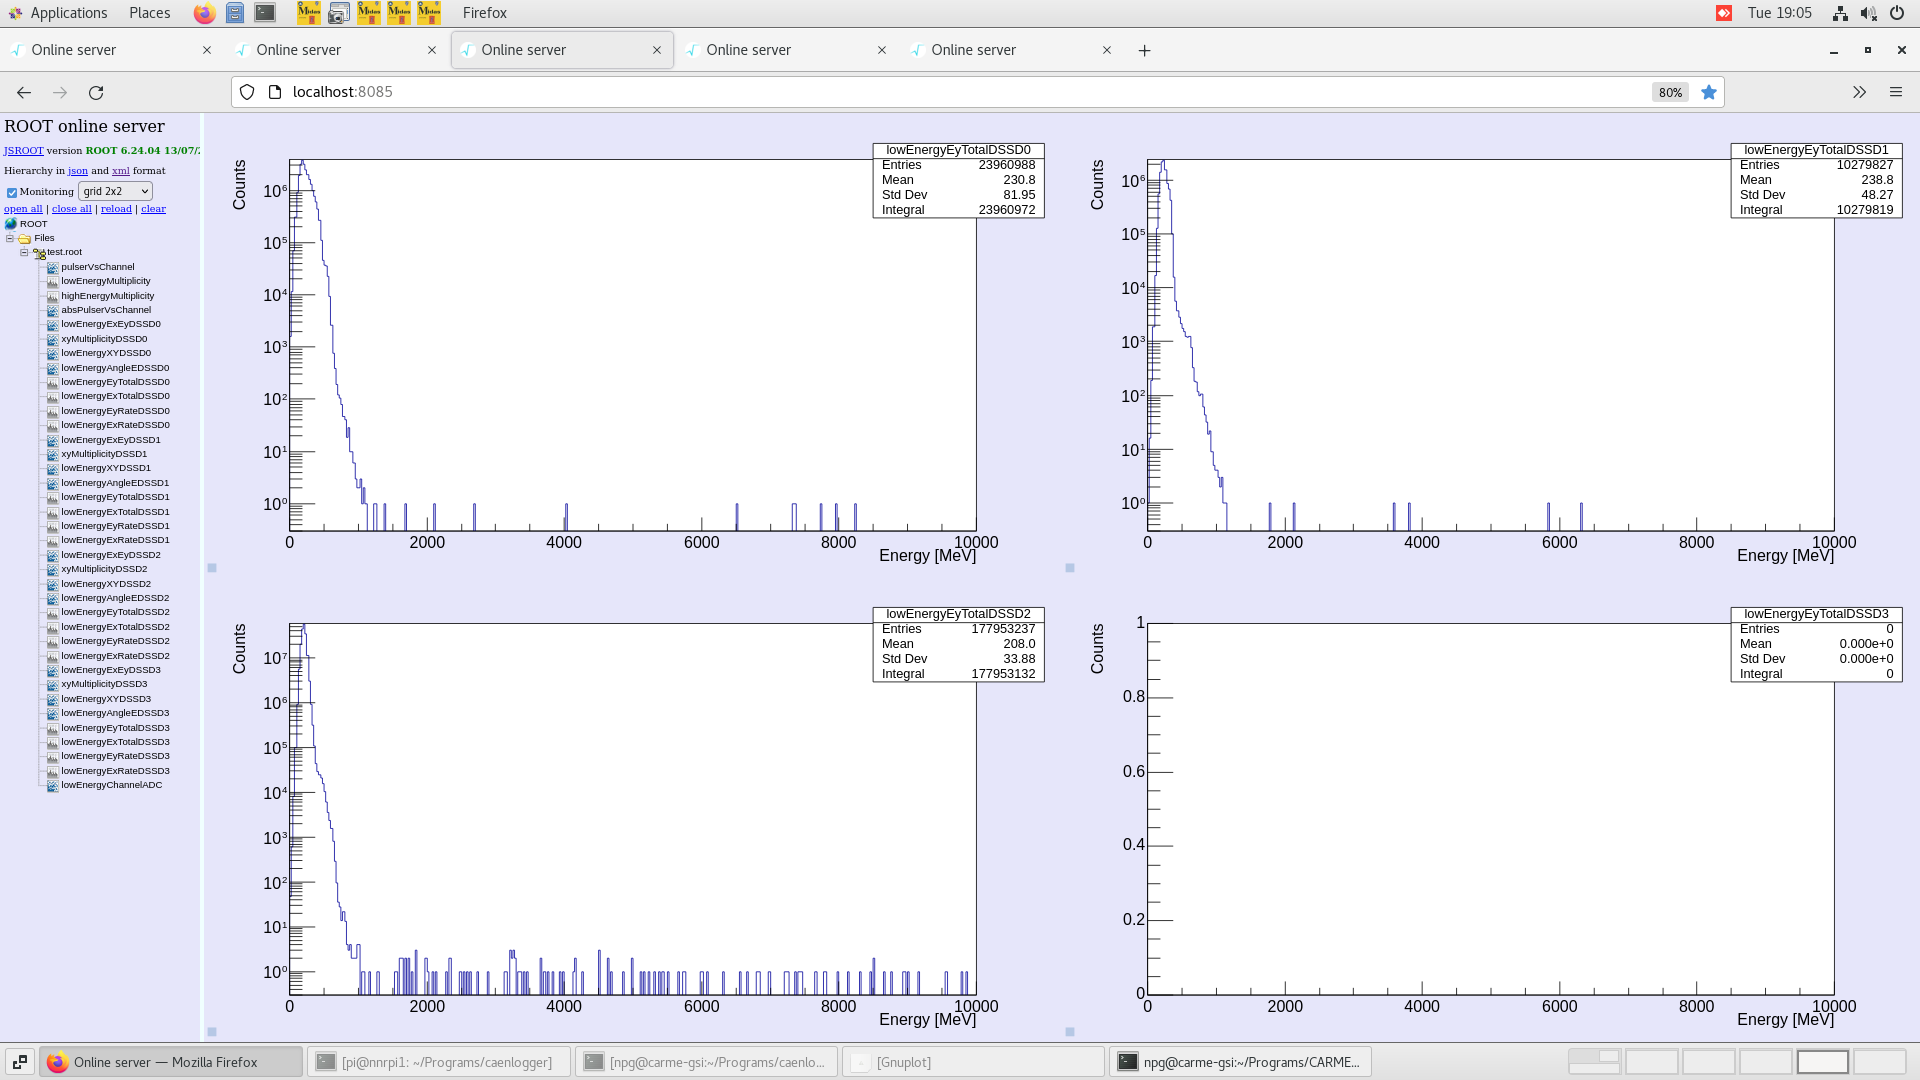
Full check, Status - Okay! Target thickness ~ 2E12. For more details, check the attached screenshots
20:12
Full check, Status - Okay! Target thickness ~ 1.6E12, For more details, check the attached screenshots
21:22
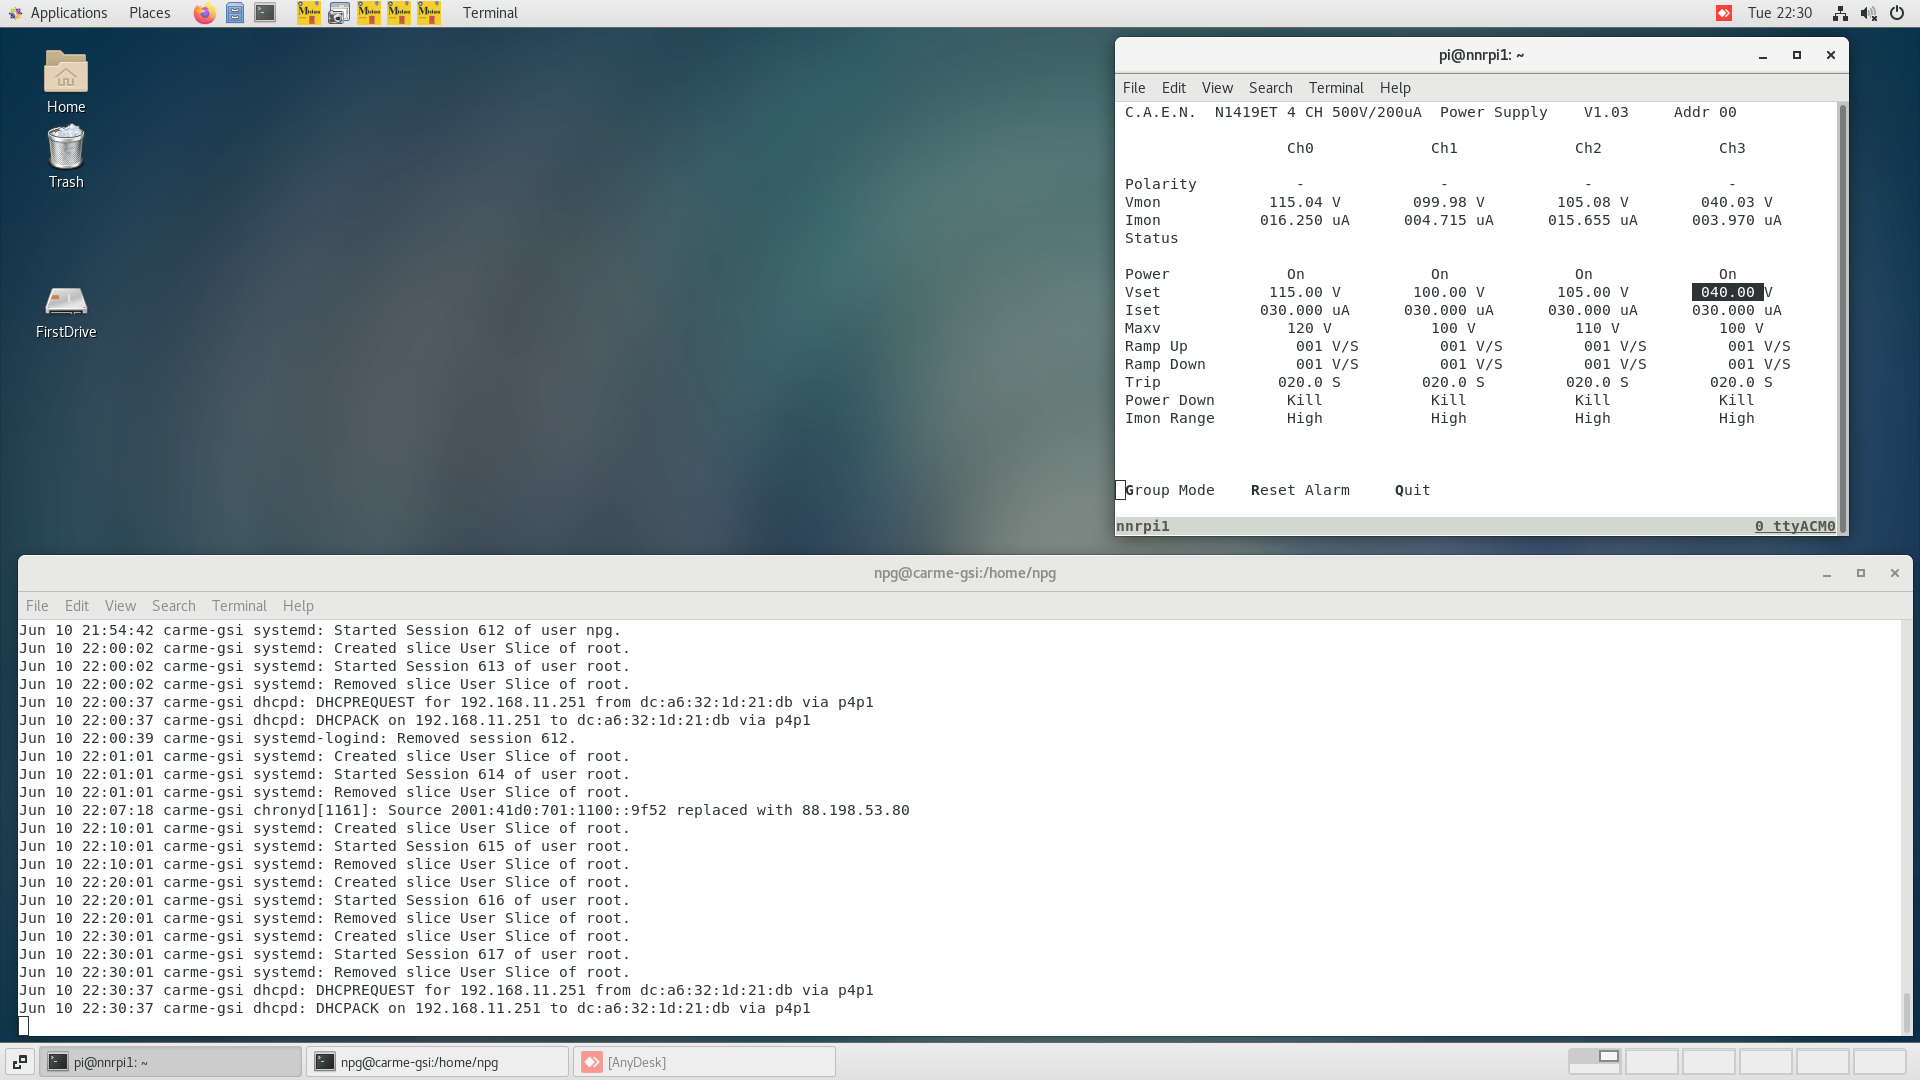
Full check, Status - Okay! For more details, check the attached screenshots
22:30
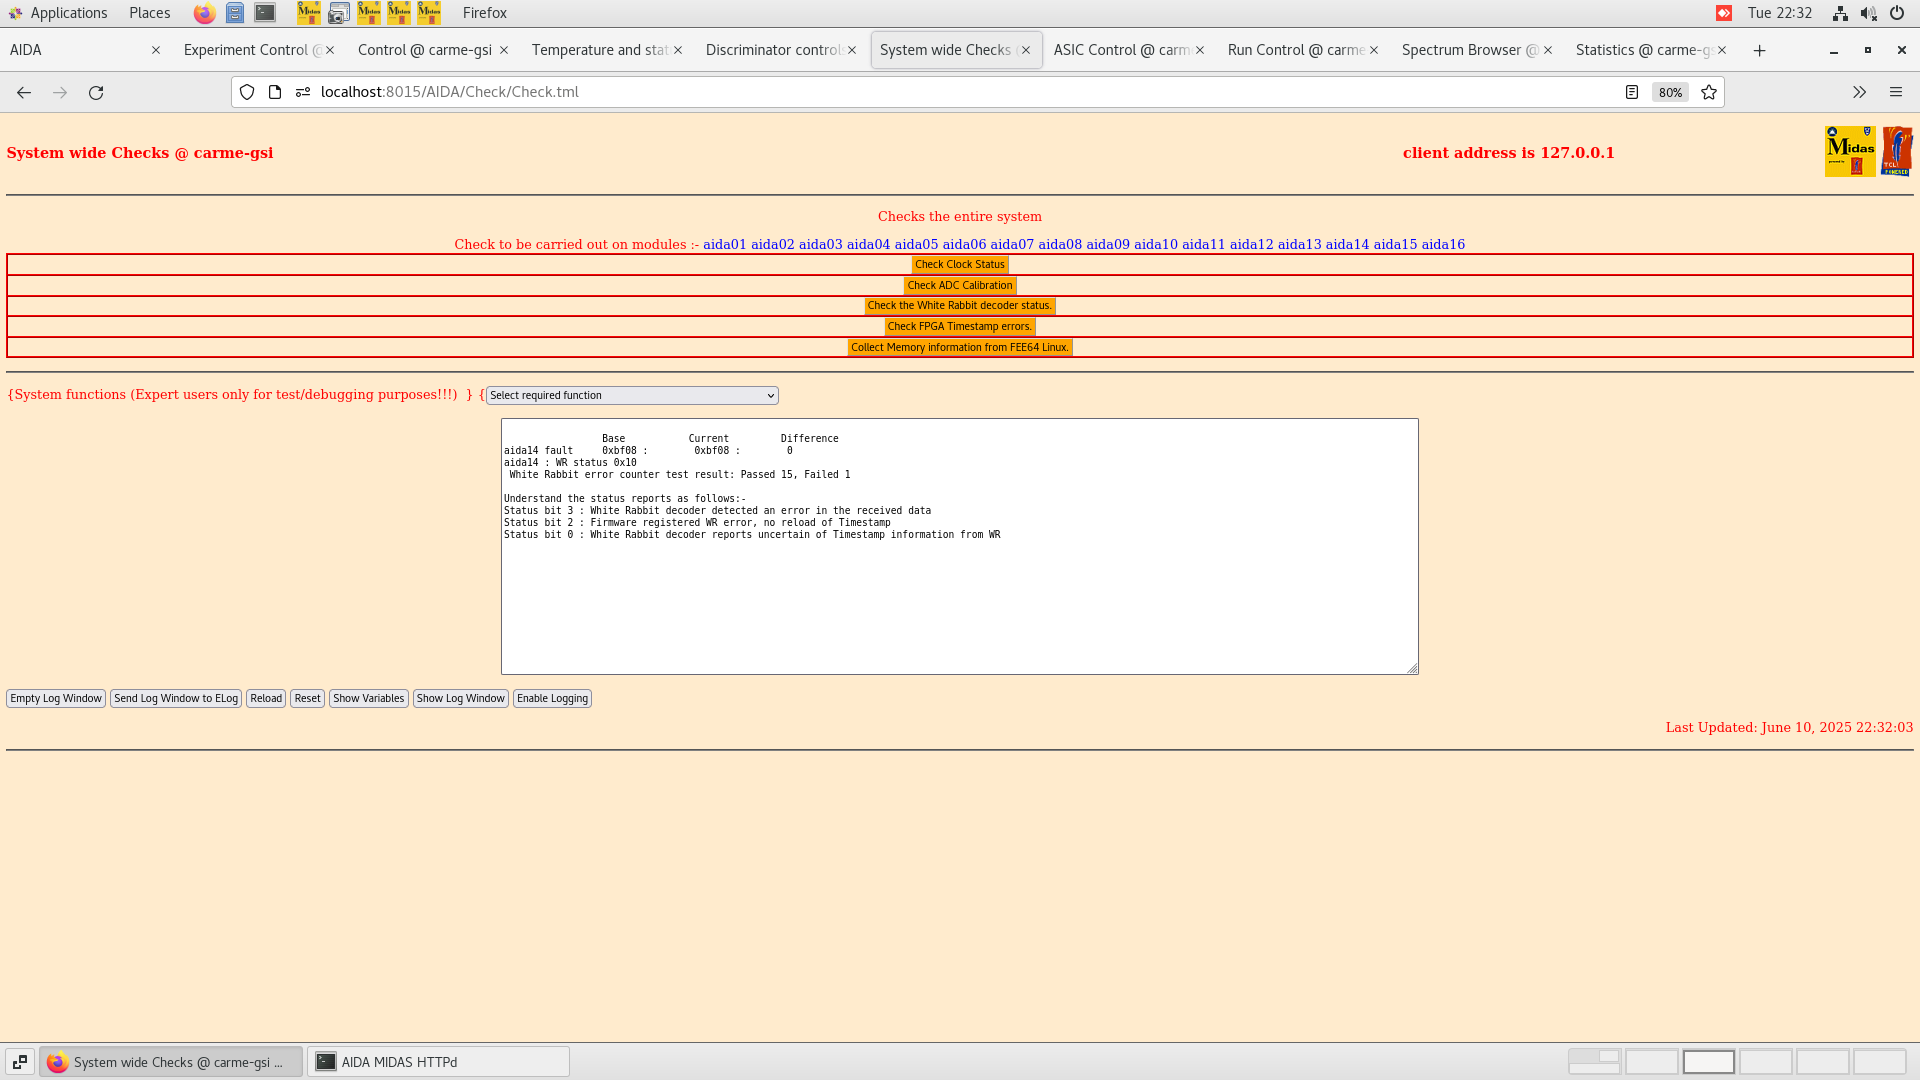
Full check, Status - Okay! Target thickness ~ 1.8E12, For more details, check the attached screenshots
23:00
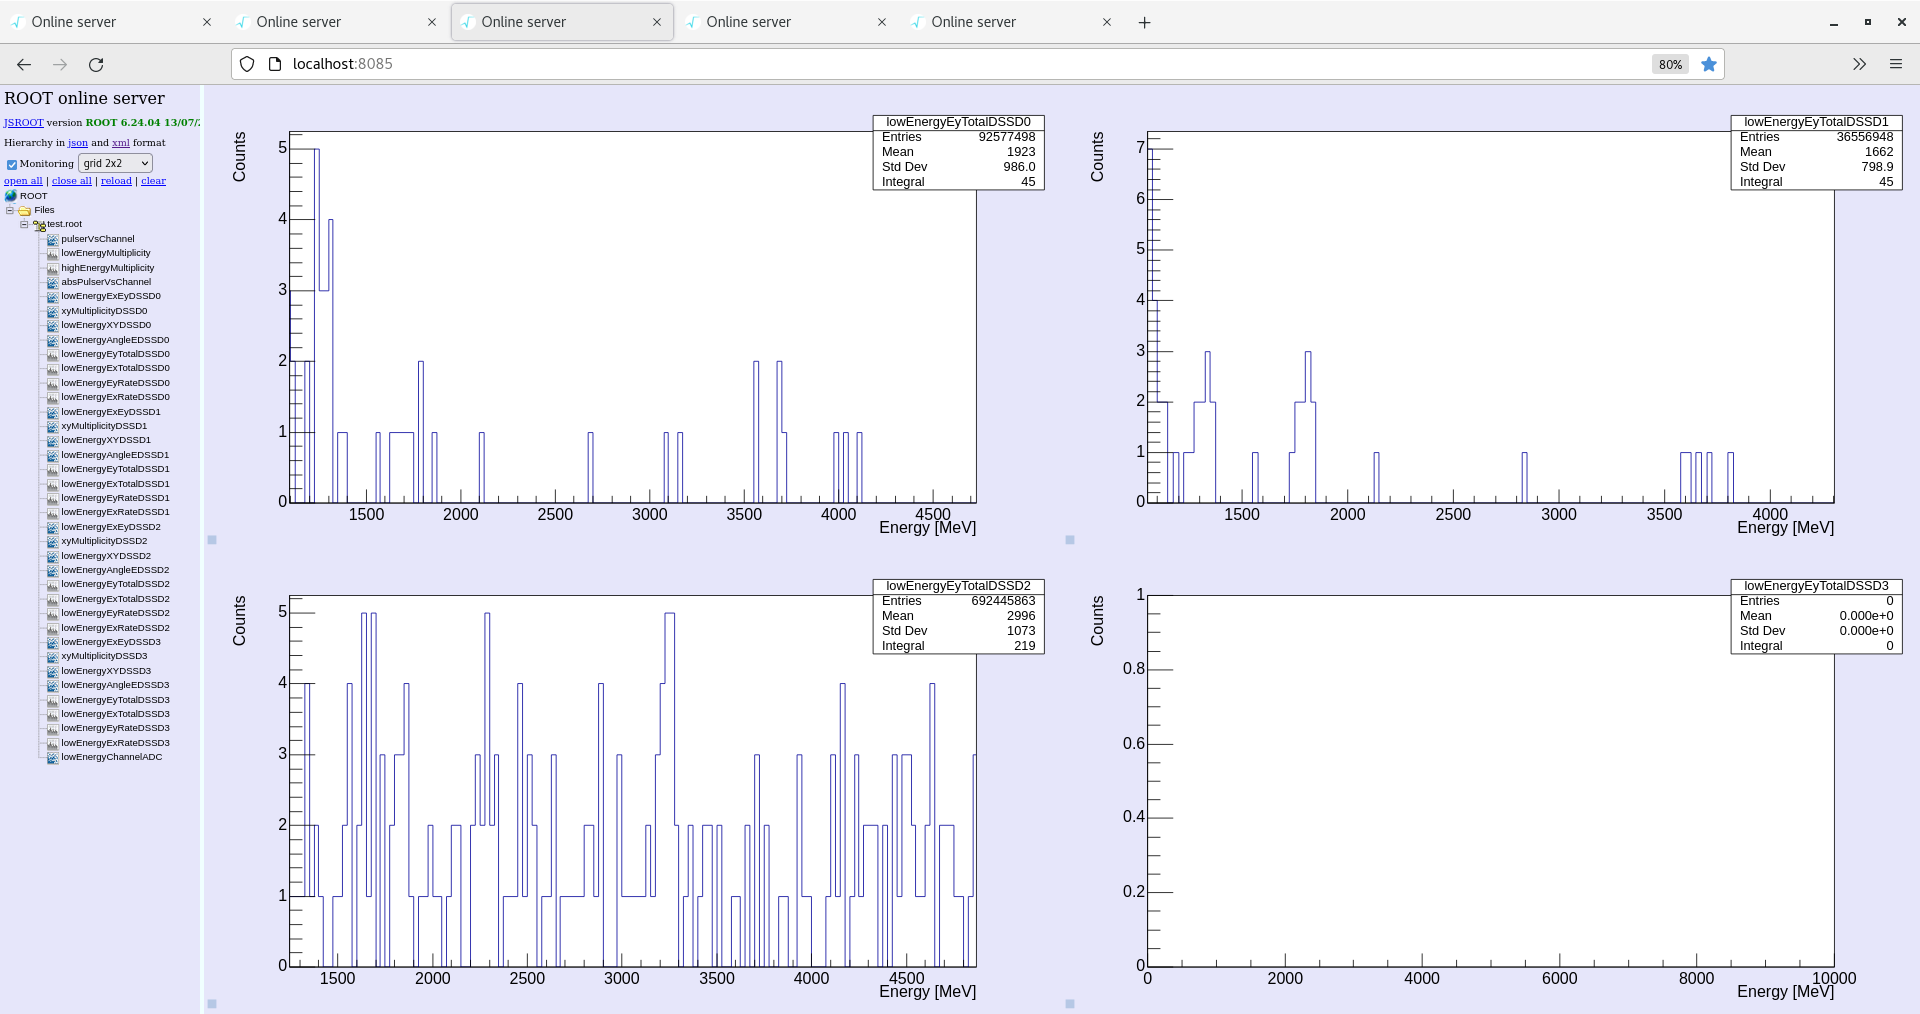
Checks OK. I have increased the equal energy cut back to 500 keV and increased bin size on Ey energy histogram to 50 keV to try and see the nuclear peaks better.
Screen shot attached of monitoring code before it was reset. Some small peaks visible. |
| Attachment 1: Screenshot_from_2025-06-10_18-58-46.png
|
|
| Attachment 2: Screenshot_from_2025-06-10_18-59-09.png
|

|
| Attachment 3: Screenshot_from_2025-06-10_18-59-20.png
|

|
| Attachment 4: Screenshot_from_2025-06-10_18-59-48.png
|

|
| Attachment 5: Screenshot_from_2025-06-10_19-00-45.png
|

|
| Attachment 6: Screenshot_from_2025-06-10_19-01-12.png
|

|
| Attachment 7: Screenshot_from_2025-06-10_19-03-55.png
|

|
| Attachment 8: Screenshot_from_2025-06-10_19-05-08.png
|
|
| Attachment 9: Screenshot_from_2025-06-10_19-05-13.png
|

|
| Attachment 10: Screenshot_from_2025-06-10_19-05-22.png
|

|
| Attachment 11: Screenshot_from_2025-06-10_19-06-15.png
|

|
| Attachment 12: Screenshot_from_2025-06-10_20-13-17.png
|

|
| Attachment 13: Screenshot_from_2025-06-10_20-13-36.png
|

|
| Attachment 14: Screenshot_from_2025-06-10_20-14-36.png
|

|
| Attachment 15: Screenshot_from_2025-06-10_20-15-30.png
|

|
| Attachment 16: Screenshot_from_2025-06-10_20-15-55.png
|

|
| Attachment 17: Screenshot_from_2025-06-10_20-16-07.png
|

|
| Attachment 18: Screenshot_from_2025-06-10_20-16-19.png
|

|
| Attachment 19: Screenshot_from_2025-06-10_21-18-16.png
|

|
| Attachment 20: Screenshot_from_2025-06-10_21-19-10.png
|

|
| Attachment 21: Screenshot_from_2025-06-10_21-19-48.png
|

|
| Attachment 22: Screenshot_from_2025-06-10_21-20-30.png
|

|
| Attachment 23: Screenshot_from_2025-06-10_21-20-55.png
|

|
| Attachment 24: Screenshot_from_2025-06-10_21-22-56.png
|

|
| Attachment 25: Screenshot_from_2025-06-10_21-23-03.png
|

|
| Attachment 26: Screenshot_from_2025-06-10_21-23-10.png
|

|
| Attachment 27: Screenshot_from_2025-06-10_21-56-07.png
|

|
| Attachment 28: Screenshot_from_2025-06-10_22-30-47.png
|
|
| Attachment 29: Screenshot_from_2025-06-10_22-31-13.png
|

|
| Attachment 30: Screenshot_from_2025-06-10_22-31-49.png
|

|
| Attachment 31: Screenshot_from_2025-06-10_22-31-59.png
|

|
| Attachment 32: Screenshot_from_2025-06-10_22-32-06.png
|
|
| Attachment 33: Screenshot_from_2025-06-10_22-32-16.png
|

|
| Attachment 34: Screenshot_from_2025-06-10_22-32-48.png
|

|
| Attachment 35: Screenshot_from_2025-06-10_22-33-04.png
|

|
| Attachment 36: Screenshot_from_2025-06-10_22-33-19.png
|

|
| Attachment 37: Screenshot_from_2025-06-10_22-33-24.png
|

|
| Attachment 38: Screenshot_from_2025-06-10_22-33-38.png
|

|
| Attachment 39: Screenshot_from_2025-06-10_22-33-42.png
|

|
| Attachment 40: Screenshot_from_2025-06-10_22-33-58.png
|

|
| Attachment 41: Screenshot_2025-06-10_22-37-40.png
|

|
| Attachment 42: Screenshot_from_2025-06-10_23-00-20.png
|
|
|
763
|
Tue Aug 26 14:43:44 2025 |
JM, CB, EW | CARME on, background run |
26 August
14:40
Turned CARME on
Everything started up okay, all detectors on and stable.
Note aida16 clock and ADC are uncalibrated. Note dssd4 is on MEC
Detector 1 noisy.
AIDA started - all okay.
All FEEs set to LEC (0x0) and slow comparator threshold set to 300keV (0x1e).
Currently writing to data to G22-205/R100, doing background run, ~400 kB/s.
16:40
Checks OK.
19:00
Checks OK
22:30
Temps OK, Rates OK
x2go window size weird on different monitor as well.
27th August
Stopped Run 100. We had accidently set the threshold to 140 keV (0xe) not 300 keV (0x1e) as intended.
Either way we require data on the alphas for electronics testing in October and the data rate at this threshold is too high. Threshold set to 0x64 (1 MeV) to look only at the alphas.
Run 101 started. See attached leakage currents
20:30
Checks OK
28th August
10:00
Checks OK
CARME daq crashed this afternoon. Aida14 had a disconnection error. Seemed to coincide with dssd4 tripping again.
Rebooting FEEs. On reboot there are always some FEEs which seem to have some error. The FEE changes each time. i.e aida12 one time, aida09 next time. I will give them a little while to compose themselves before trying again.
Unable to get the system writing data to disk again. I think the system is unhappy with the merger / tape server not being closed properly. Will have a proper look tomorrow.
29th August
20:15
Running again R102. 0x64 slow comparator thresholds. DSSD4 off due to leakage current tripping -> MEC
30th August
Daq continues R102
31st August
Daq continues R102
11:30
R102 stopped. CARME shutdown. This week, potentially tomorrow morning, the Kasell group will dismount the VUV spectrometer. CARME off and bias off during these works. |
| Attachment 1: bias.png
|

|
|
596
|
Fri Jun 7 14:09:04 2024 |
JM, CB, DR, CN, LB | Run 44 - 15N Data Taking |
15:35
Electron cooler voltage set point = 244.3 V
Electron cooler voltage readout = 243.75 V
Collector current = 4.29 mA
All system checks OK
Cycle time = 6 s
Detector positions: left = 36.54 mm, right = 64.60 mm
Target density = 2.5e11
Injection = 3 - 4 e7 pps
15:50
Injection intensity dropped to 1e7 pps
15:54
Injection intensity back to ~4e7 pps
17:30
All system checks OK
Target at 3.7e11
Beam dropped to 1e7 pps
17:34
Beam back to 3-4 e7 pps
19:10
Beam started varying between 1e7 and 4e7. The operators briefly closed the Faraday cup (~30 seconds), the beam is now back to ~5e7
19:25
All system checks OK
Target at 2.6e11
Beam at 5e7
21:25
All system checks OK
Target at 2.7e11
Beam at 4-5 e7
|
|
586
|
Tue Jun 4 14:13:17 2024 |
JM, CB, DB, US | Run 32- beam only background |
15:15
Run 32 started - Beam, no target
Beam energy = 3 MeV.
Horizontal beam position = 4.0 mm, vertical beam position = 0.0 mm.
Beam intensity at inj ~ 2.5e7
Detectors are positioned IN. Left arm = 36.54, right arm = 64.60 mm
Histograms and stats zero'd, monitoring code restarted.
Beam in the ring ~ 5 minutes.
Pressure in YR09 E target ~ 4.5e-11 mbar.
Motors code crashed. Beam removed from ring to re-home detectors.
15:20
Beam in the ring again, detectors homed, no target
Detectors have been set up to send signals on injection / dump
15:35
Merger OK, Tape server OK
ADC data item statistics looks as before. OK
FEE temperatures look OK
System checks OK
Leakage current stable
|
|
523
|
Sat Feb 17 14:29:03 2024 |
JM, CB, AR, AB | Run 40 - cooled beam on target |
15:27
Run 40 started cooled beam on target
Detectors IN (left arm pot =36.5 mm, right arm pot = 70.49 mm). Stationary. Same as run 35
Electron cooler voltage 751.095 this corresponds to 1.338 MeV/u. This should be on the left of the peak of the resonance.
Target density is 4e11 at/cm2, ring pressure looks OK YR09 1.43e-10 mbar.
Horizontal beam position is -7.5 mm, vertical beam position is 0.0 mm. Same as run 35.
Beam is in the ring for 4 seconds and total cycle time between injections is 8 seconds. Notice this is different than run 35.
Statistics, merger statistics, histograms all zero'd
15:39
System wide checks ok. Merger ok. Temperatures ok.
Attatchment 1: statistics
Attatchment 2: Temperatures
Attatchment 3-6: Waveforms. Layout 2 - (attach 4) had a strnageish waveform for aida11, stays after reload.It was the HEC firing so did an ASIC control and Zero'd histograms and all is okay.
Attatchment 7: Leakage current
17:04
System wide checks ok. Merger ok. Temperatures ok. The beam is on target and everything runs smoothly.
Attatchment 8: statistics
Attatchment 9: Temperatures
Attatchment 10-13: Waveforms. Everything looks ok.
Attatchment 14: Leakage current
18:55
System wide checks ok. Merger ok. Temperatures ok. The beam is on target and everything runs smoothly.
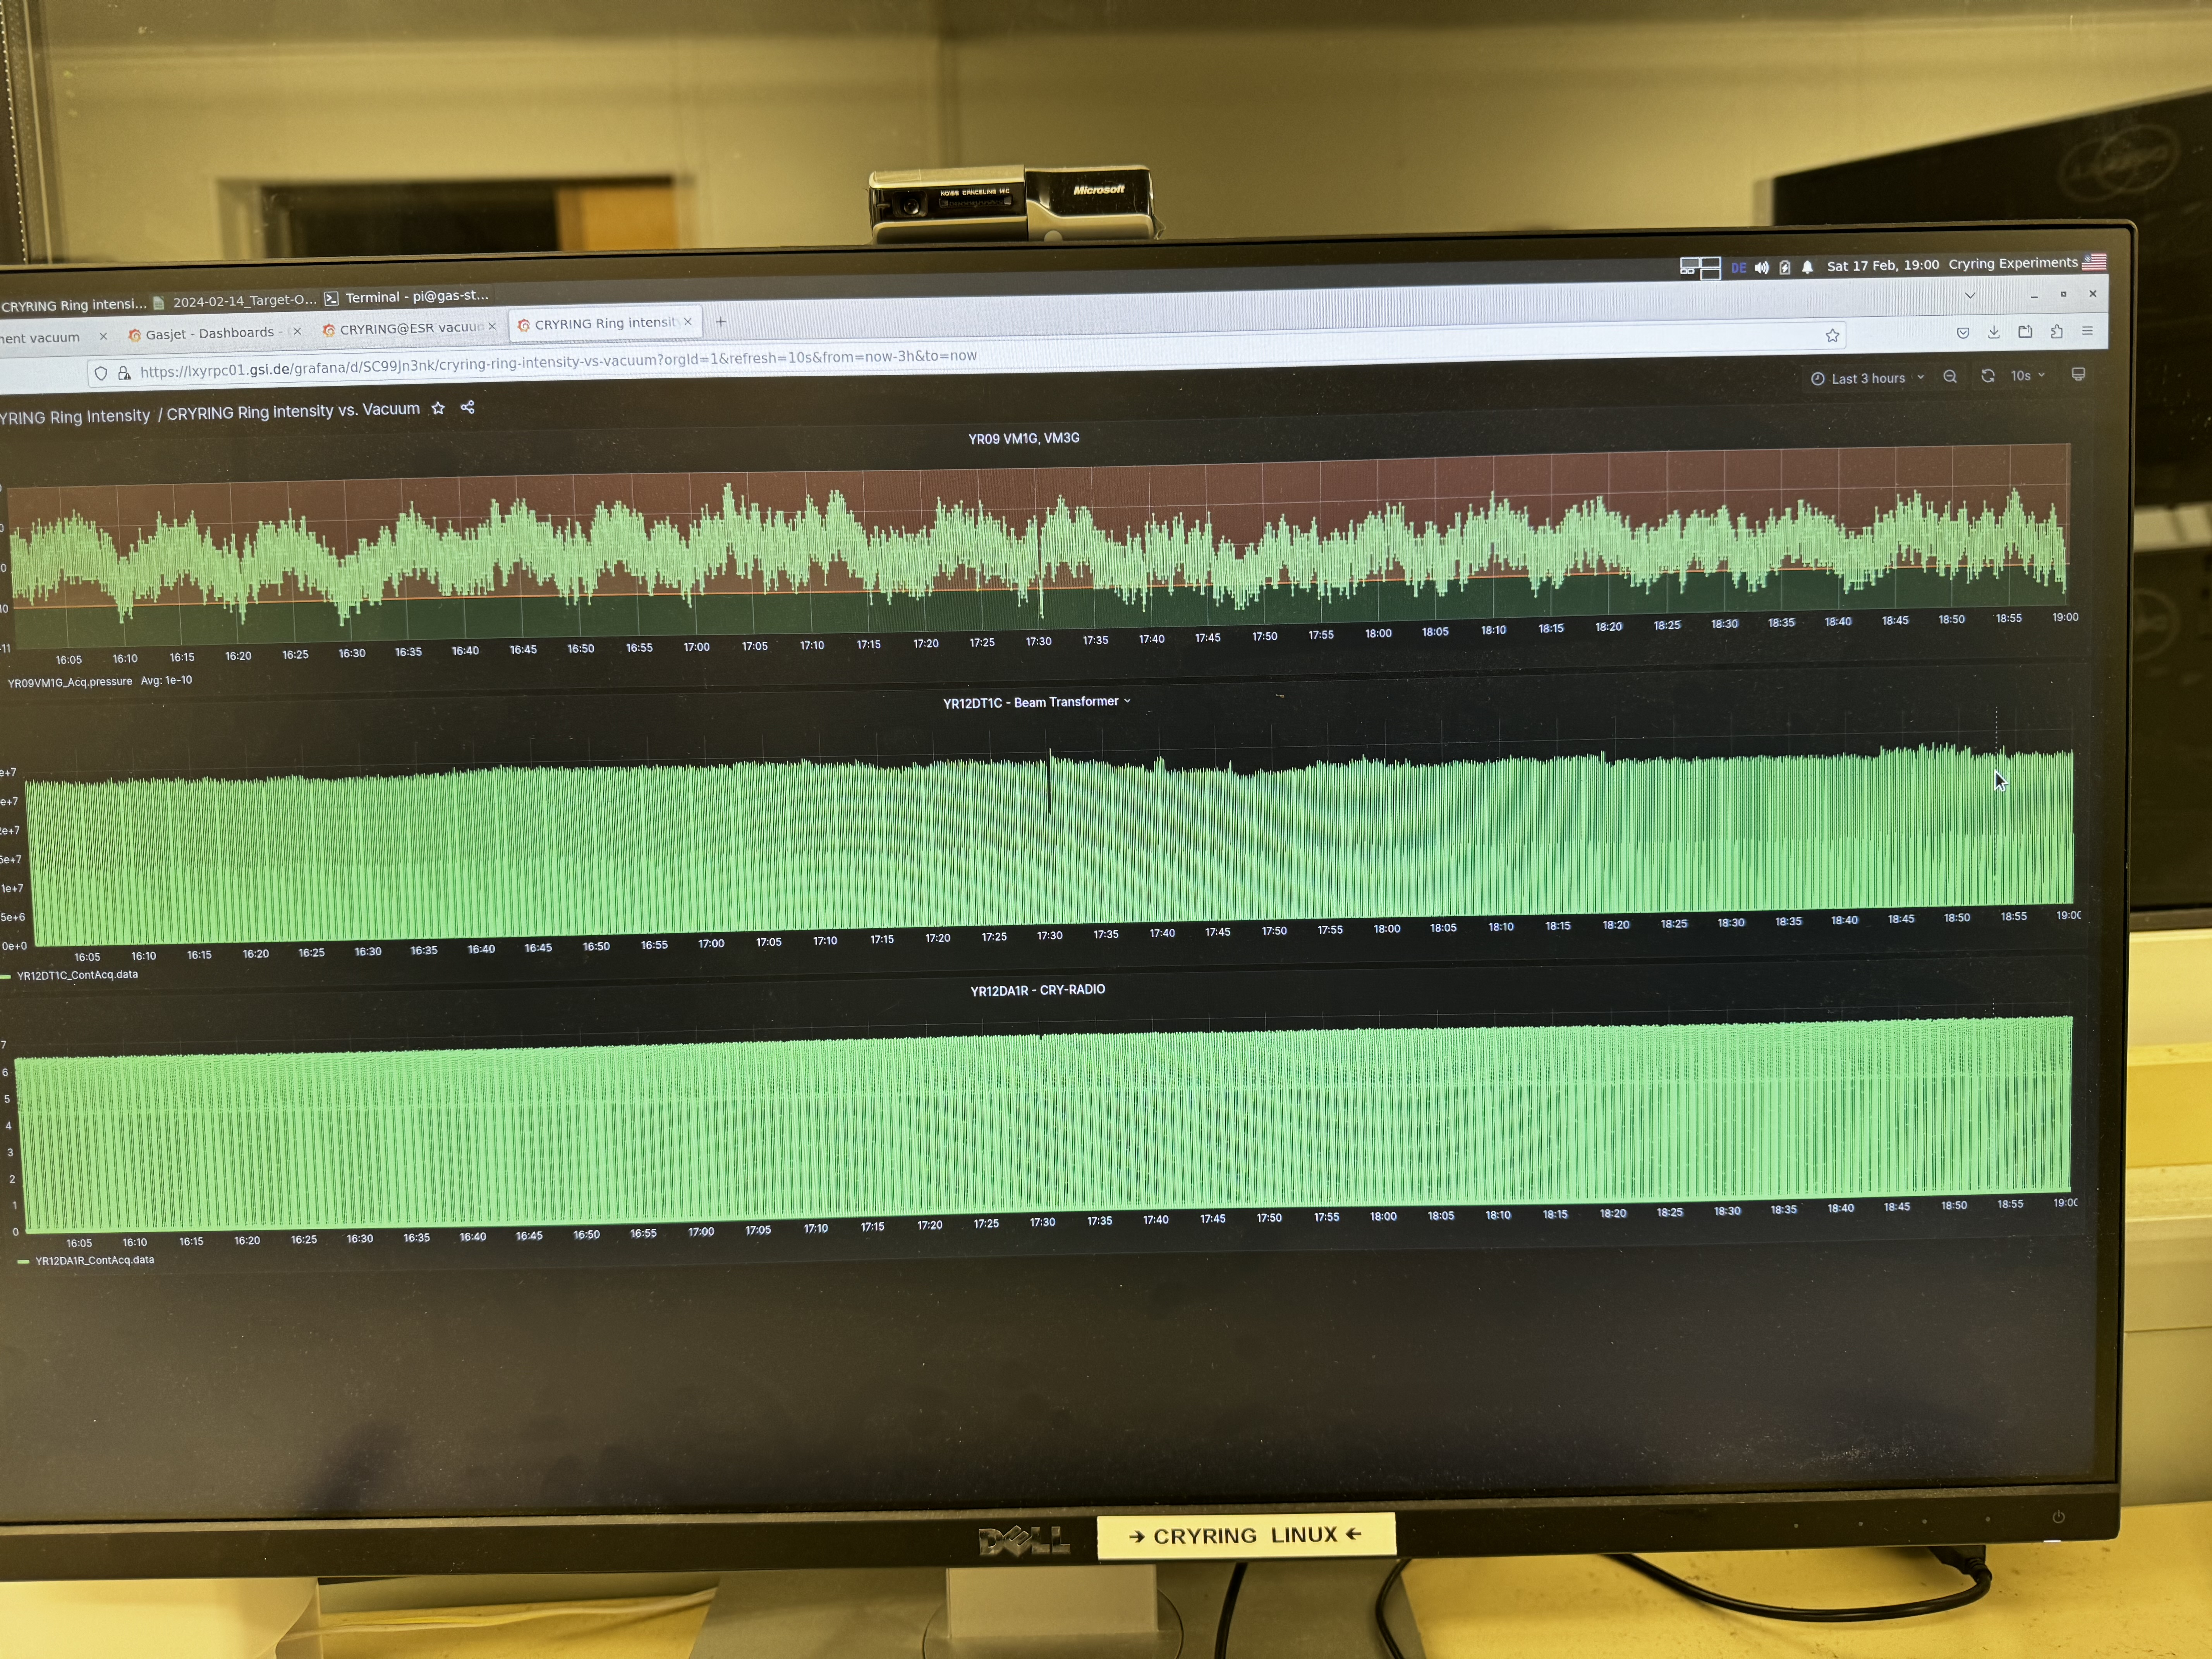
Beam transformer shows a small decrease in beam intensity, not drastic but small slow decrease, see attachment 22. Target density 4e11. Vacuum pressue ok.
Attatchment 15: Statistics
Attatchment 16: Temperatures
Attatchment 17-20: Waveforms
Attatchment 21: Leakage current
19:28
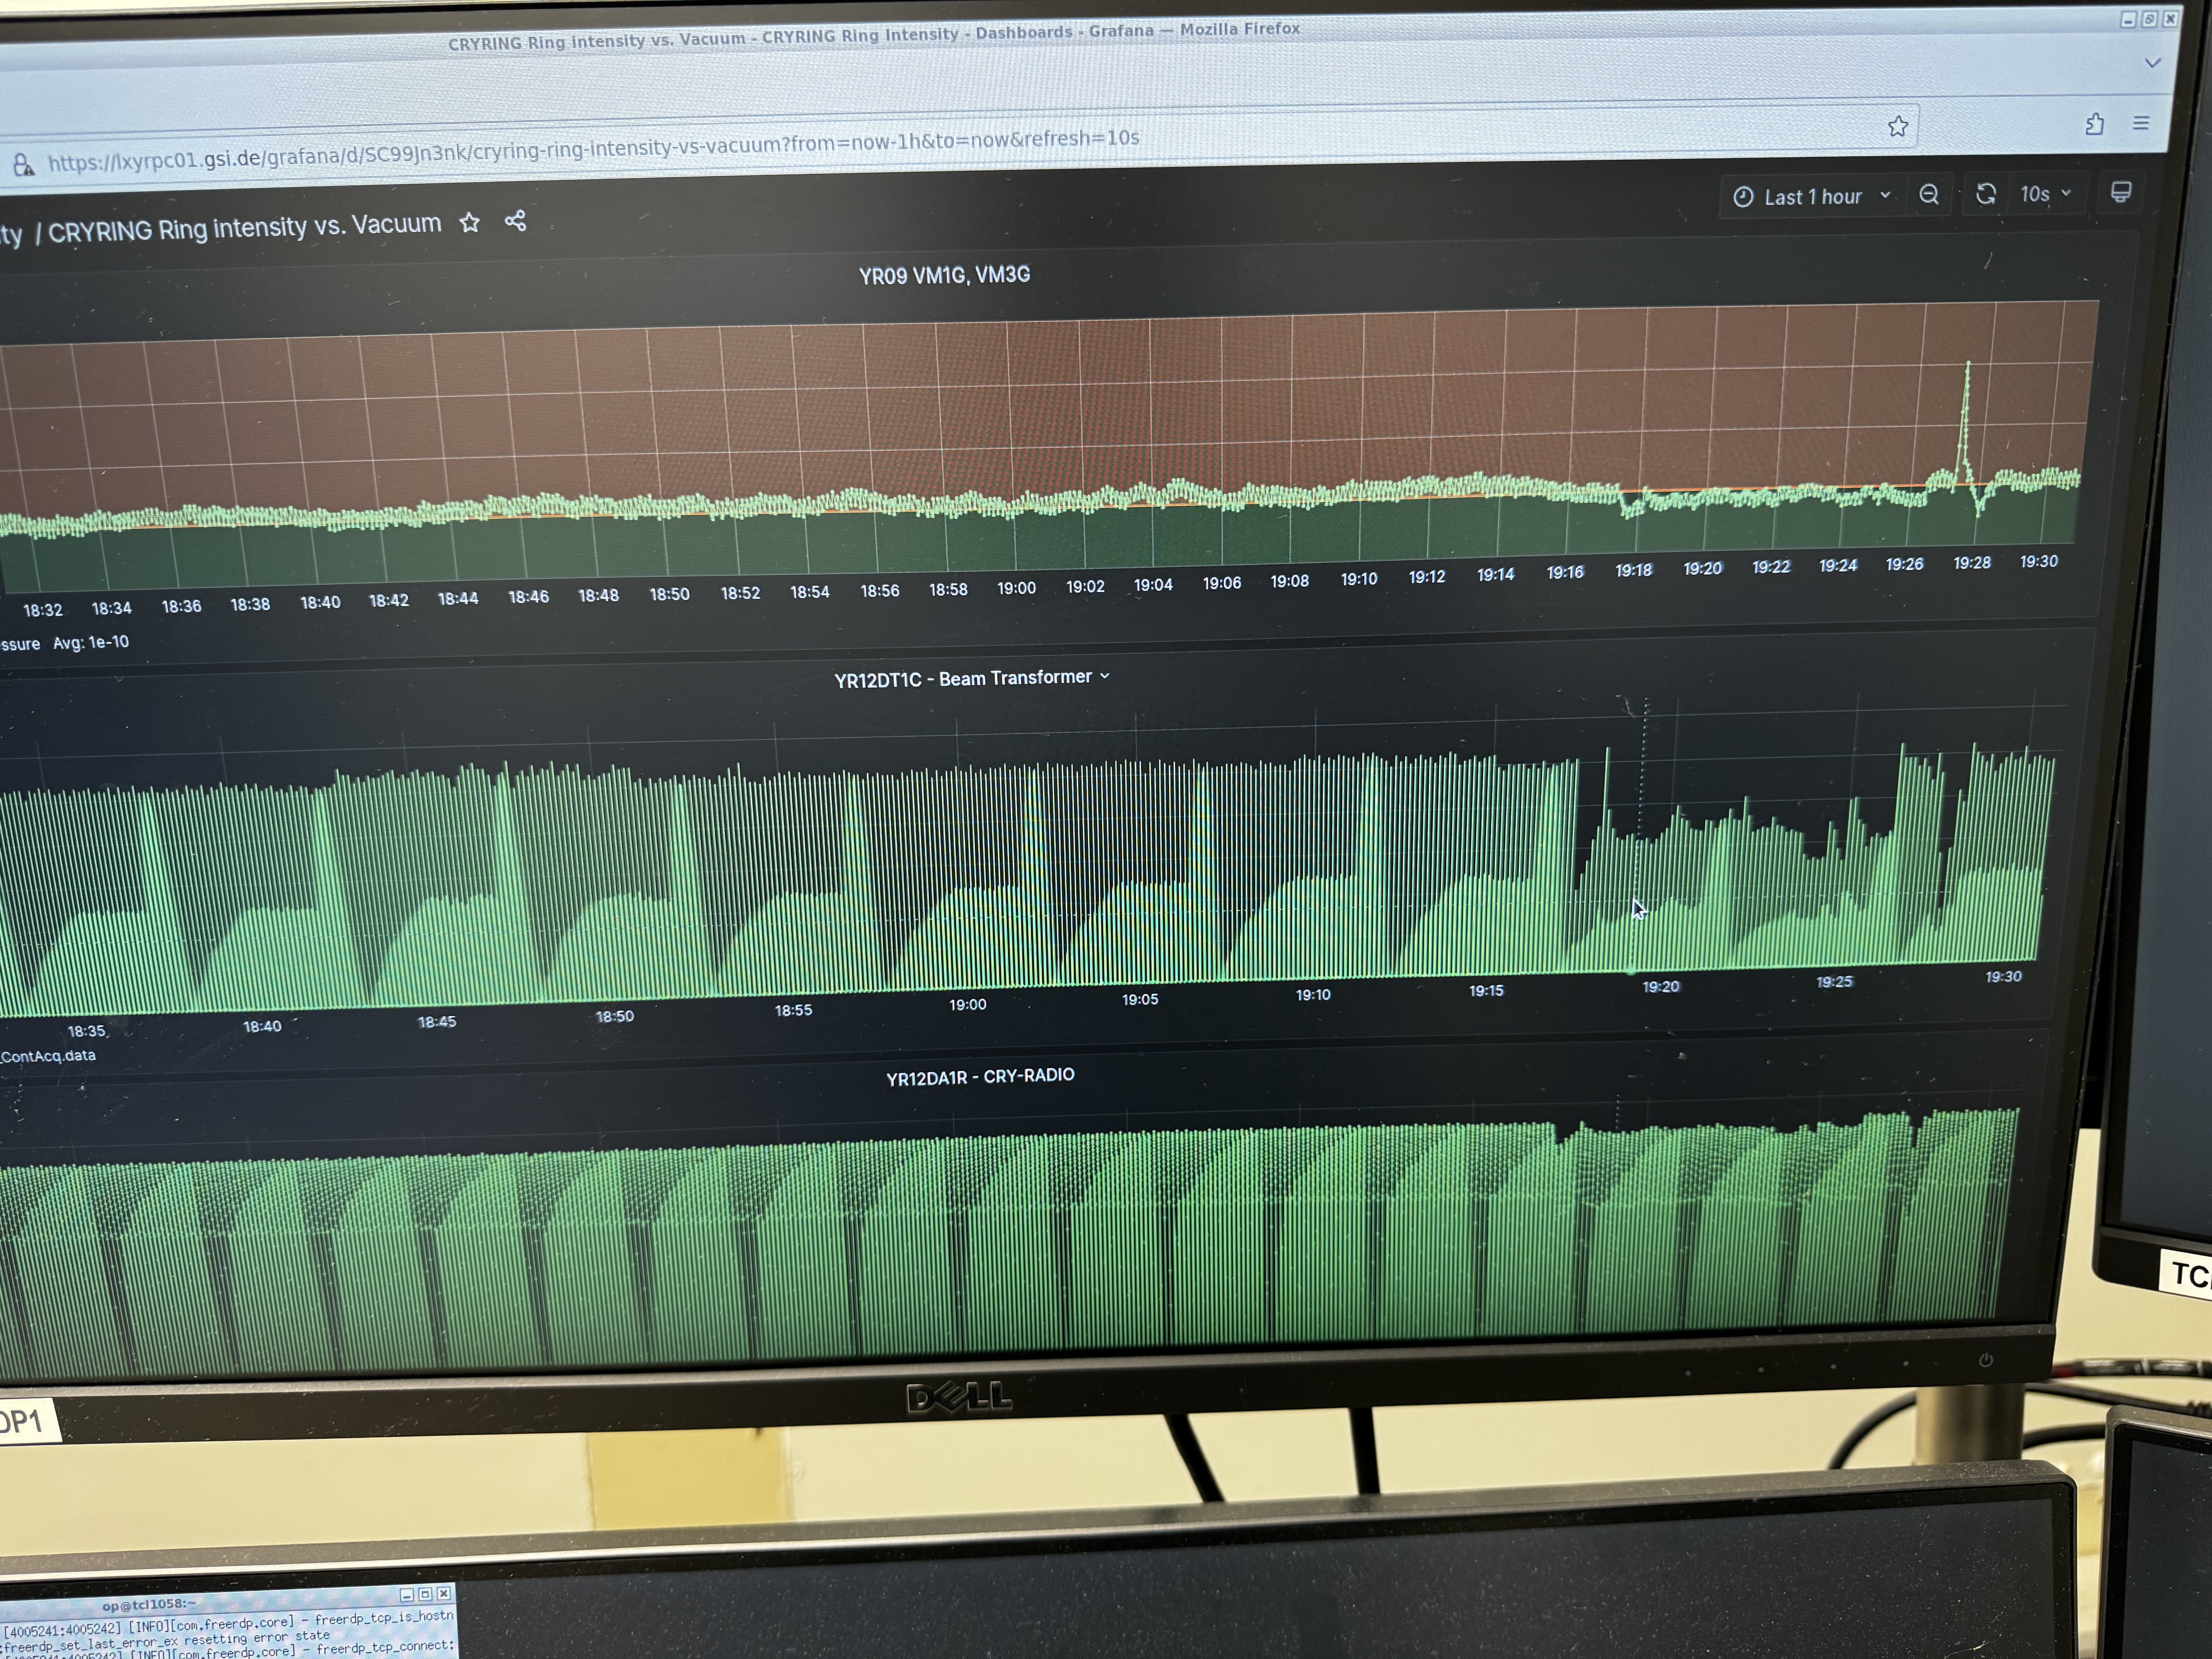
Run40 - Beam dropped intesntiy at 19:17, moved detectors out, called gleb. Beam intensity started increasing again - not sure whats happenig at present (see image 23).
20:26
Around 19:50 beam decreased again and stayed down for a while. Beam not stable. Gleb was called, target turned off, beam restabilied - around 2.5e7 ish. Unsure if it will remain stable during the night (image 24).
20:35
detectors moved back in. Target back in, stable at 4e11.
Potentiometer Left: 36.54 mm
Potentiometer Right: 70.49 mm
Beam stable at the moment (image 25).
System checks 20:40
Base Current Difference
aida03 fault 0x0 : 0x1 : 1
aida04 fault 0x0 : 0x1 : 1
aida05 fault 0x0 : 0x1 : 1
aida06 fault 0x0 : 0x1 : 1
aida07 fault 0x0 : 0x1 : 1
aida08 fault 0xe : 0xf : 1
aida09 fault 0xb : 0xc : 1
aida10 fault 0x0 : 0x1 : 1
aida13 fault 0x0 : 0x1 : 1
aida14 fault 0x0 : 0x1 : 1
FPGA Timestamp error counter test result: Passed 6, Failed 10
If any of these counts are reported as in error
The ASIC readout system has detected a timeslip.
That is the timestamp read from the time FIFO is not younger than the last
System wide checks ok except the FPGA timestamps - see error above - collected them and it went away. Merger ok. Temperatures ok. The beam is on target and everything runs smoothly for now.
Attatchment 26: Temperatures
Attatchment 27-30: Waveforms
Attatchment 31: Leakage current
21:50
FEE temperatures OK
System wide checks OK
Statistics and spectrum browser rate look OK
Merger and tape server OK
Monitoring code rates are consistent with beam on target
X2go seems to not be loading full screen for me - may be my laptop misbehaving?
Can see ring intensity has been stable for the last hour, target density is 4.33e11 and YR09 pressure is 1-2e-10 mbar.
23:22
Target density 4.3e11, beam intensity stable.
Monitoring code rates are consistent with beam on target
Fee temps all OK
System checks OK
Statistics and FEErates OK.
Merger and tape server OK
|
| Attachment 1: Screenshot_from_2024-02-17_15-39-50.png
|

|
| Attachment 2: Screenshot_from_2024-02-17_15-40-05.png
|

|
| Attachment 3: Screenshot_from_2024-02-17_15-40-49.png
|

|
| Attachment 4: Screenshot_from_2024-02-17_15-43-04.png
|

|
| Attachment 5: Screenshot_from_2024-02-17_15-44-12.png
|

|
| Attachment 6: Screenshot_from_2024-02-17_15-44-36.png
|

|
| Attachment 7: Screenshot_from_2024-02-17_15-45-02.png
|

|
| Attachment 8: Screenshot_from_2024-02-17_16-58-47.png
|

|
| Attachment 9: Screenshot_from_2024-02-17_16-59-18.png
|

|
| Attachment 10: Screenshot_from_2024-02-17_17-00-48.png
|

|
| Attachment 11: Screenshot_from_2024-02-17_17-01-41.png
|

|
| Attachment 12: Screenshot_from_2024-02-17_17-02-26.png
|

|
| Attachment 13: Screenshot_from_2024-02-17_17-03-01.png
|

|
| Attachment 14: Screenshot_from_2024-02-17_17-03-51.png
|

|
| Attachment 15: Screenshot_from_2024-02-17_18-55-13.png
|

|
| Attachment 16: Screenshot_from_2024-02-17_18-55-48.png
|

|
| Attachment 17: Screenshot_from_2024-02-17_18-56-55.png
|

|
| Attachment 18: Screenshot_from_2024-02-17_18-57-26.png
|

|
| Attachment 19: Screenshot_from_2024-02-17_18-57-54.png
|

|
| Attachment 20: Screenshot_from_2024-02-17_18-58-27.png
|

|
| Attachment 21: Screenshot_from_2024-02-17_18-58-44.png
|

|
| Attachment 22: IMG_7902.jpeg
|
|
| Attachment 23: IMG_7903.jpeg
|
|
| Attachment 24: IMG_7906.jpeg
|

|
| Attachment 25: IMG_7907.jpeg
|

|
| Attachment 26: Screenshot_from_2024-02-17_20-38-37.png
|

|
| Attachment 27: Screenshot_from_2024-02-17_20-42-41.png
|

|
| Attachment 28: Screenshot_from_2024-02-17_20-43-17.png
|

|
| Attachment 29: Screenshot_from_2024-02-17_20-43-50.png
|

|
| Attachment 30: Screenshot_from_2024-02-17_20-55-50.png
|

|
| Attachment 31: Screenshot_from_2024-02-17_20-45-30.png
|

|
|
15
|
Thu Sep 17 10:13:43 2020 |
JM, CB(remotely) | Bakeout cooling and pumping of chamber |
The Chamber has continued to pump overnight and we have reached a pressure of 3.3e-6 mbar as of 10:15. Power cable for the hot cathode gauge was found. Gauge did not give a reading so pin connections were checked, all is okay so it may be thepressure is still too high within the chamber, gauge was thus turned off. I have attached the RGA from this morning which has increased accuracy so has been cleared up for most of the noise from yesterday. I have begun removing the covers for the neg-ion pumps, attached is the how it looks without the cover. The covers have strong magnets in them so I will put in a box far away from our electronics.
10:15 3.3e-6 mbar (cart)
11:27 3.2e-6 mbar (cart)
13:26 3.2e-6 mbar (cart)
16:00 3.2e-6 mbar (cart)
I have begun manually reducing the temperature for the bakeout, to observe the rate of cooling across the vessel. I have noticed a bug in the program, the rate of each thermocouple reads as if it is increasing despite the decrease in temperature of the thermocouple. The actual temperatures and averages appear to be working okay.
09:43 RE-72 temperatures are 135 deg. Temperature set to 125 deg.
11:01 RE-72 temperatures are 125 deg. Chamber temps equillibriating, average chamber temperature 125.5 deg and max difference is ~3 deg. Temperature set to 100 deg.
11:14 RE-72 temperatures are 115 deg. Chamber max difference exceeds 10 deg, chamber average is 115 deg. Temperature set to 115 deg will wait to equilllibriate. Recommend not to lower temperature by >10 deg. Top of the chamber cools much slower than the bottom.
13:26 RE-72 temperatures are 115 deg. Chamber average is 115.3 deg, chamber max difference is 2.8 deg. Temperature set to 105 deg.
14:20 Previously unobserved bug occured - all temperature display frozen. Rates still OK. Temperature control still OK. Rebooted Baking.x remotely. Back OK. Reduced temperature to 90 C. See attached temperature plot before rebooting.
18:00 Temperature reduced to 80 deg.
21:25 Temperature reduced to 75 deg. |
| Attachment 1: Photos.zip
|
| Attachment 2: 20200917_1428_temp_last.png
|

|
|
16
|
Fri Sep 18 10:28:57 2020 |
JM, CB(remotely) | Baking status |
10:28
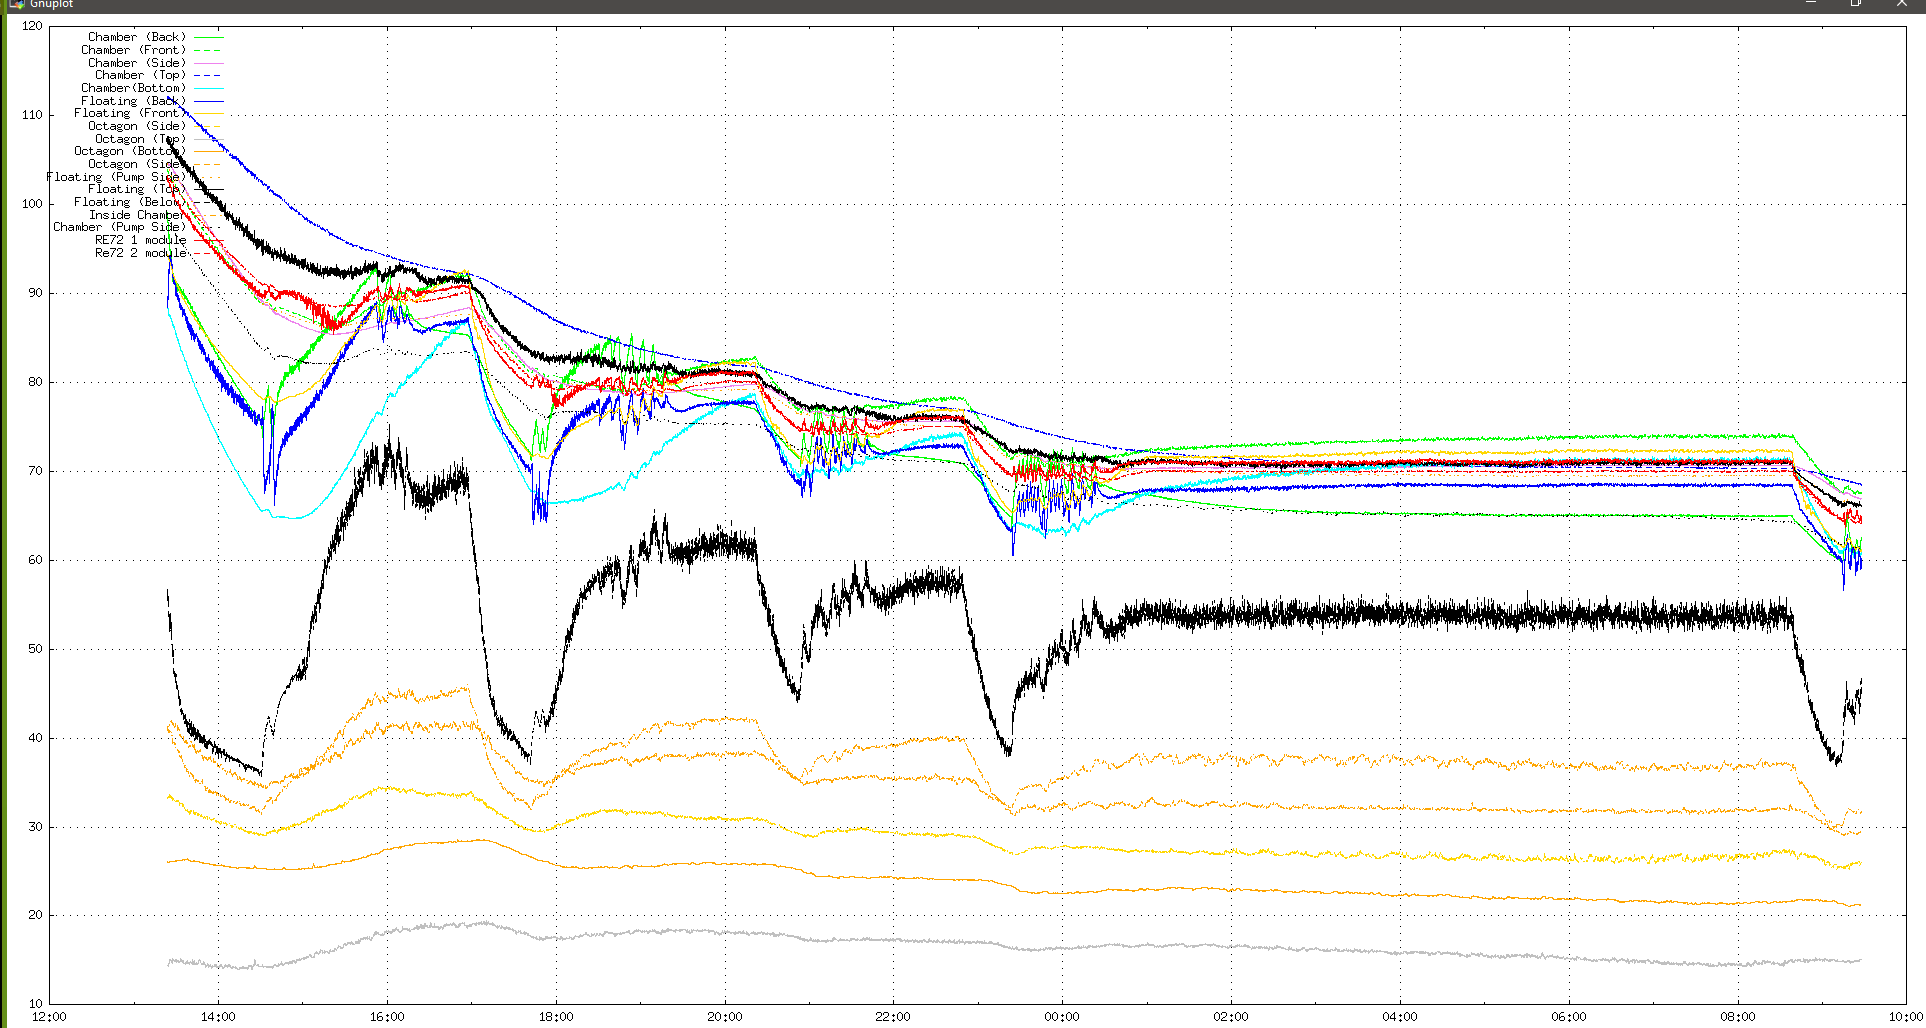
Reducing temperature in steps. System cooling down. See attached.

Pressure on the leak cart: 1.6e-6 mbar |
| Attachment 1: 20200918_1029_temps.png
|
|
|
30
|
Mon Oct 26 10:35:05 2020 |
JM, CB(remotely) | Cooling |
10:10 Pressure on the chamber = 3.1e-8mbar. RE-72 temperatures are ~120-125C with set limits at 80C. D2000 temperatures are ~370C. D2000's reduced from 60W to 30W and all UHV 1400s reduced to 50W each to cool both the chamber and the D2000s so that ion pumps can be activated.
10:38 Pressure on the chamber = 1.7e-9mbar. Re-72 temperatures begining to fall and are currently ~117-122C. D2000 temperatures are ~290C.
11:05 Pressure on chamber = 1.1e-9mbar. RE-72 temperatures are ~114-118C. D2000 temperatures ~275C.
11:42 Pressure on chamber = 9e-10mbar. RE-72 temperatures are ~109-113C. D2000 temperatures ~230C. Power in the D2000s reduced to 10W each to speed up cooling.
13:02 Pressure on chamber = 3e-10mbar. RE-72 temperatures are 100-103C. D2000 temperatures ~200C. Power in the UHV 1400s reduced to 25W to speed up cooling. Total heating power is now 325W from the UHV1400s and 40W from the D2000s.
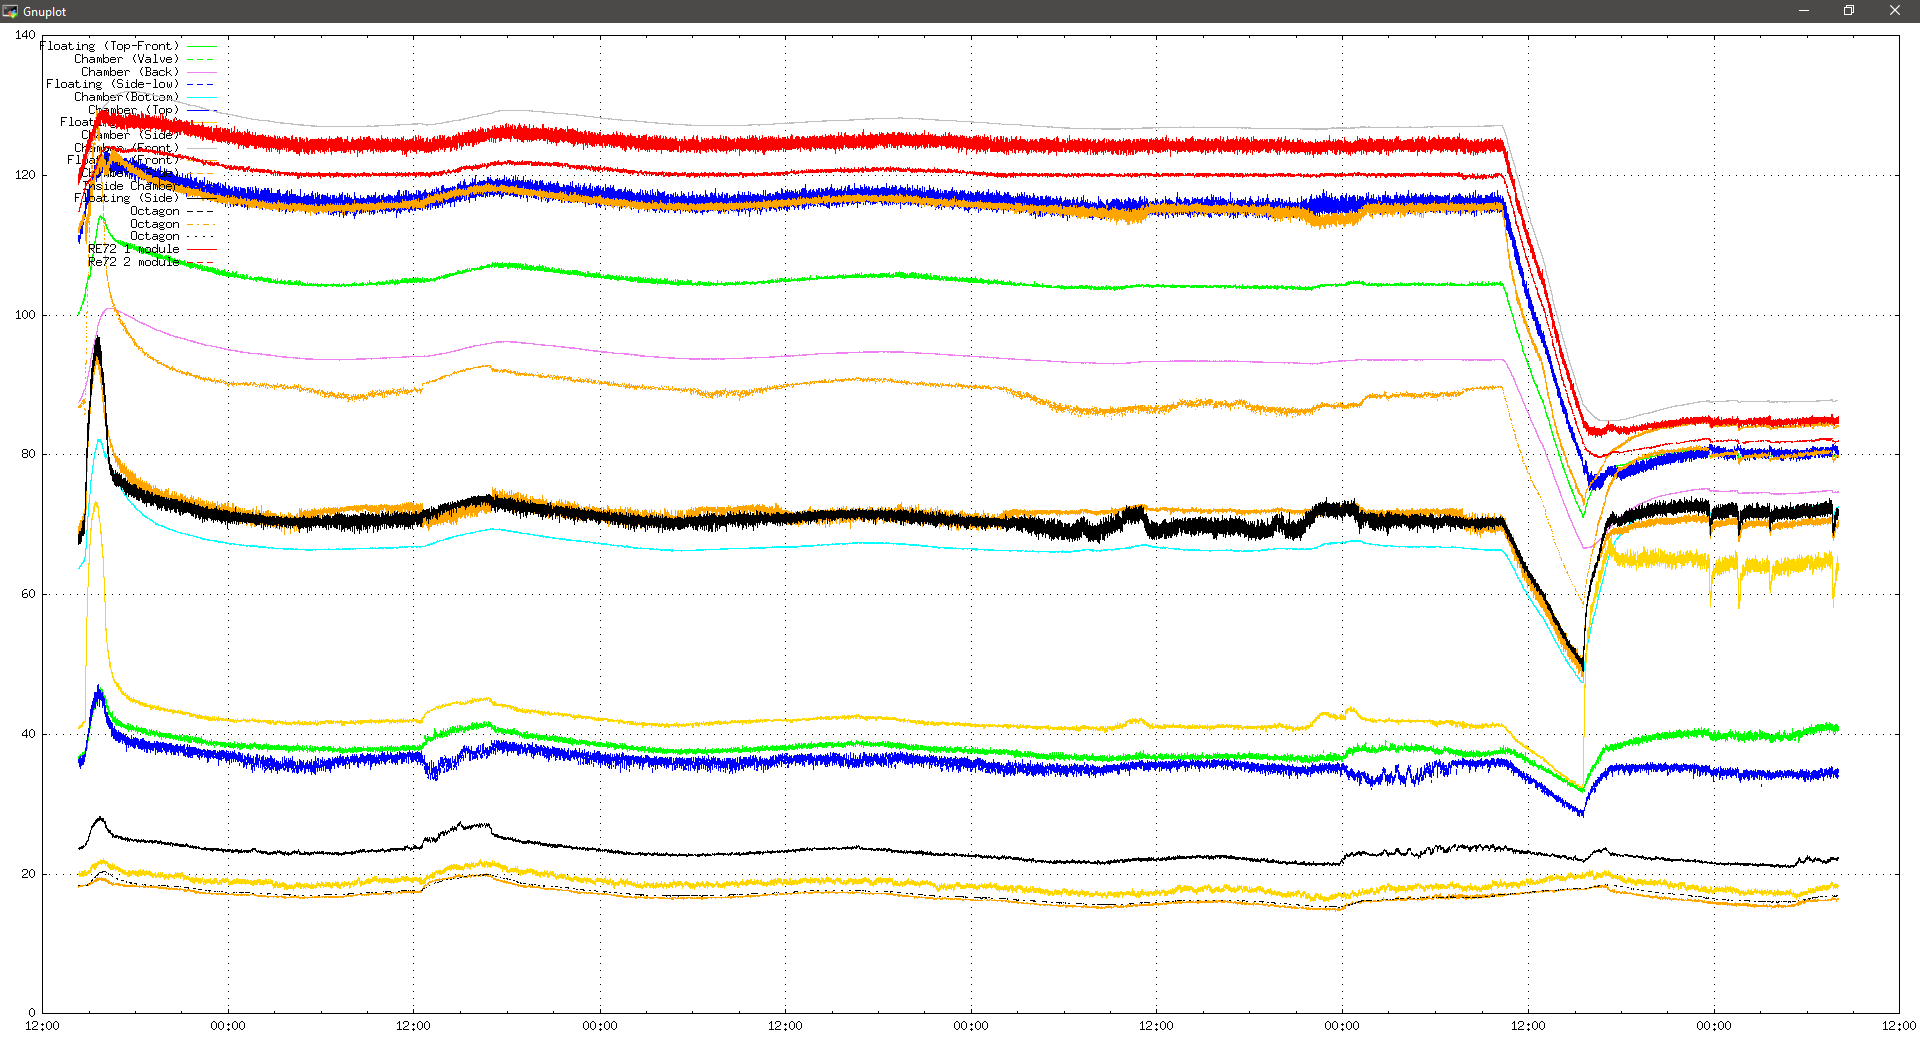
14:11 Temperature plot attached.
15:40 Pressure on chamber = 1.2e-10mbar. RE-72 temperatures are ~80-84C with the heaters starting to control temperature of the bakeout. D2000s temperatures are ~150C. I will leave things as they are to let temperatures reach equillibrium overnight.
27 October
08:00 Temperature stable. See attached.
08:30 Pressure on chamber = 1.2e-10mbar. D2000s temperatures are 150C, have turned them off to cool to below 80C
09:35 Pressure on chamber 1.18e-10mbar. D2000s temperatures are 110C. Bakeout set point reduced to 0C and neg elements switched off. Ion pumps set up and will be activated when D2000 temperatures are below 80C.
Settings on the ion pump have been left to default, except for the ramp rate which has been reduced to 1s from 10s as we are only flashing pumps for a short period of time, and the conversion factor which is set to 150A/torr for D2000 pumps.
10:50 Pressure on the chamber = 7.53e-11mbar. D2000 temperatures at 80C. Gate valve was closed leading to an increase in pressure up to the high -9 / low -8 mbar range. Conclusion at the time was that the UHV1400s were still too hot and thus outgassing at such a rate that caused the large pressure increase. Once the valve was opened again, the pressure dropped to the mid -11 range again. Gate valve has been found to have been installed upside down, this may also contribute to the pressure increase. Due to low pressure on the backing line and neg pumps cooling which will increase pumping power we may not have to close the valve to reach the -12 mbar range however.
After speaking with Keith, valve being installed upside down shouldn't pose any significant difference to obtainable pressure, however would be good to install properly at next chance.
11:45 Pressure on the chamber = 5.55e-11mbar. D2000s temparatures are 75C. Ion pumps activated for first flash of 30s pumping.
11:55 Pressure on the chamber =5.44e-11mbar. Ion pumps flashed for the second time. Pressure given inside 3 ion pumps reached the minimum of 8.9e-12mbar, 4th pump registered 1.3e-10mbar.
13:24 Pressure on the chamber = 4.02e-11mbar. Ion pumps flashed for the third time. Pressure inside ion pumps was the same as last flash.
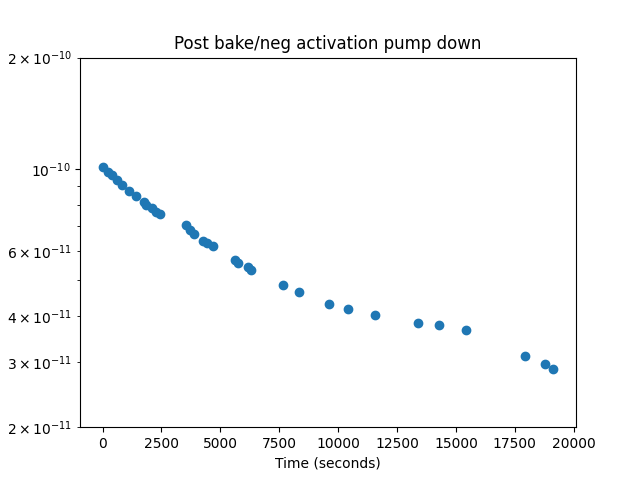
15:40 Pressure on chamber = 2.88e-11mbar
Find attached plot of pressure (mbar) against time for the pump down from 10:11 on 27/10/20. It looks like negs may have cooled enough to begin pumping nearer the end of the day where the rate of pumping speed appears to increase.
|
| Attachment 1: Screenshot_from_2020-10-26_14-10-08.png
|

|
| Attachment 2: 20201027_0803_temps.png
|
|
| Attachment 3: 27102020_pump_down.png
|
|
| Attachment 4: 27102020_pump_down.png
|

|
|
11
|
Mon Sep 14 12:07:40 2020 |
JM, CB (remotely) | Baking status |
Mon 14 Sep 09:50

Jordan moved the TC08 picolog 2 away from the chamber and built a makeshit heatshield.
Picolog 2 was facing a slit in the cloth thorugh which the scroll pump flexible hose is connected.
Baking restarted in automatic mode from 80 C

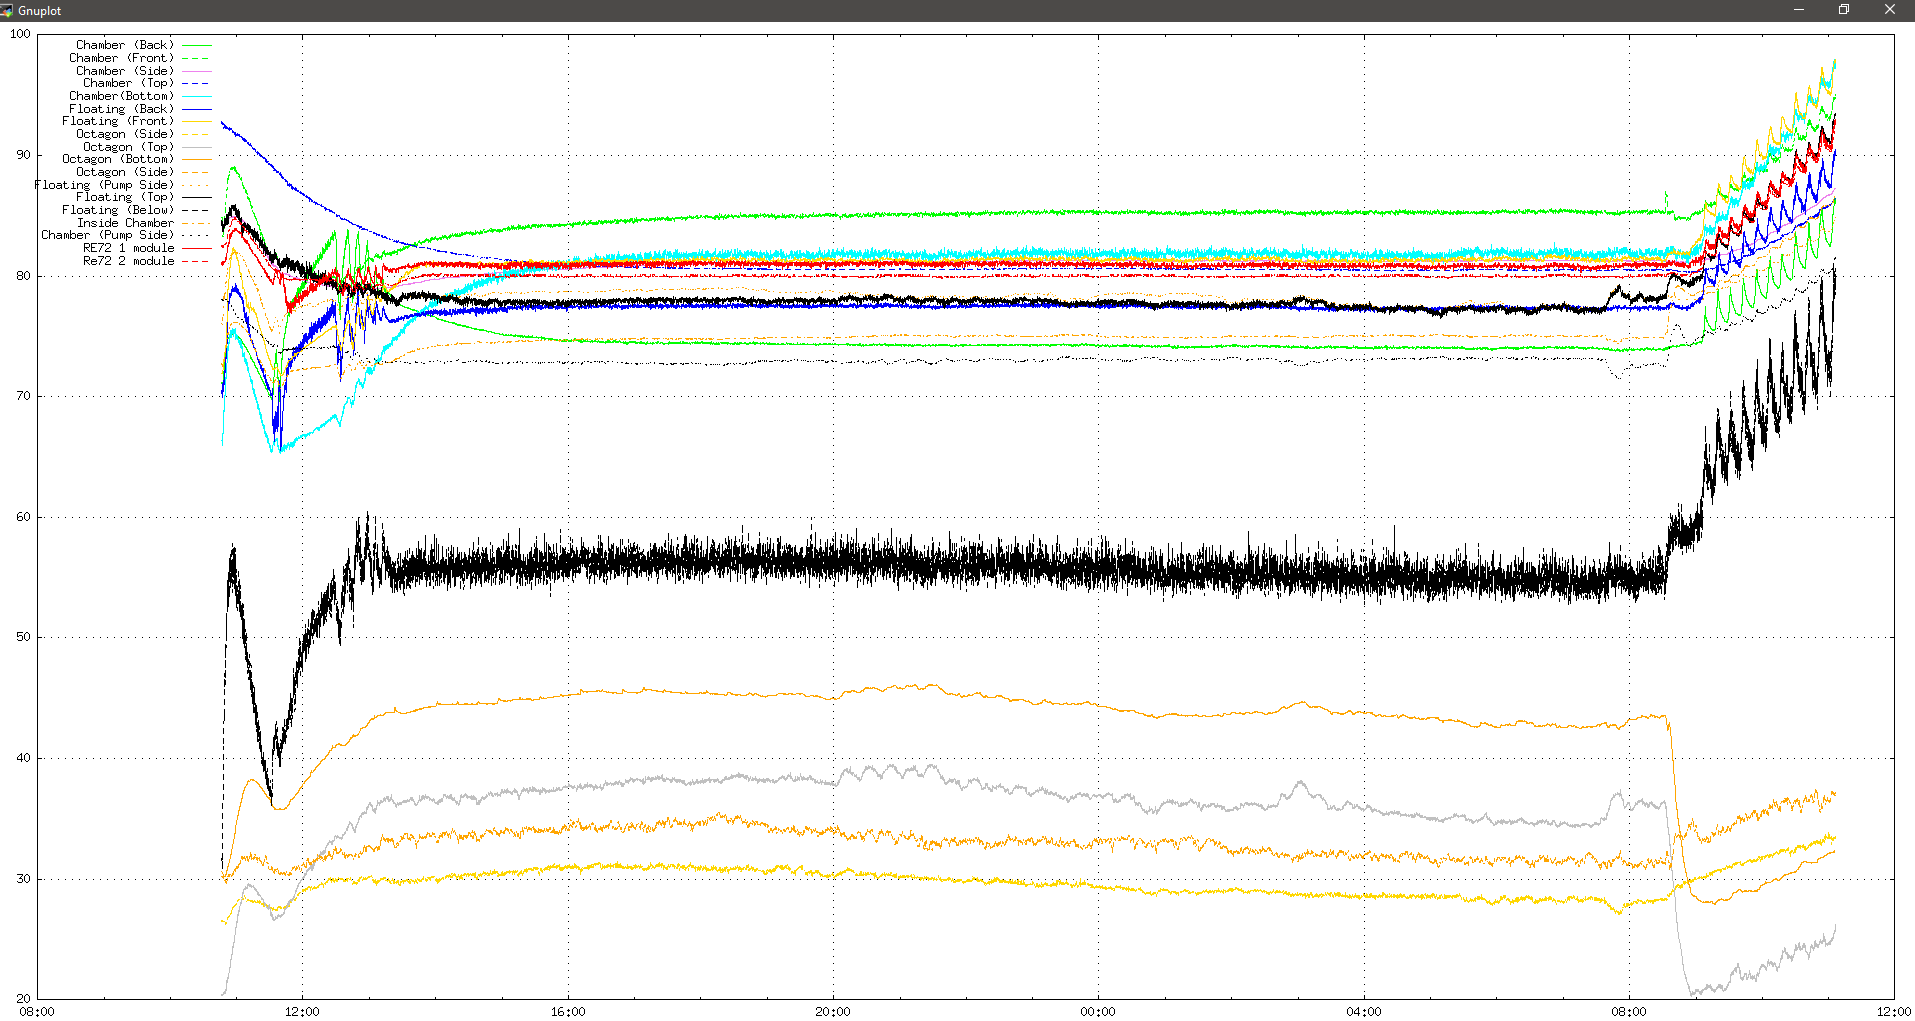
12:09
Baking progressed OK - see attached.

~13:00
CJC 2 getting too high again. Baking went off. Jordan caught it and temporarily set in manual mode.
Moved picolog 2 further away. Increased amount of heatshield. Restarted in auto

17:30
Baking continues OK - see attached.
Will leave overnight.

19:30
Baking continues OK, T=124C , see attached.
However rates shown on Baking.x program appear nonsensical. Too high, too low, sometimes they all go to zero.
Clearly a bug in the code. Should not affect baking for now.
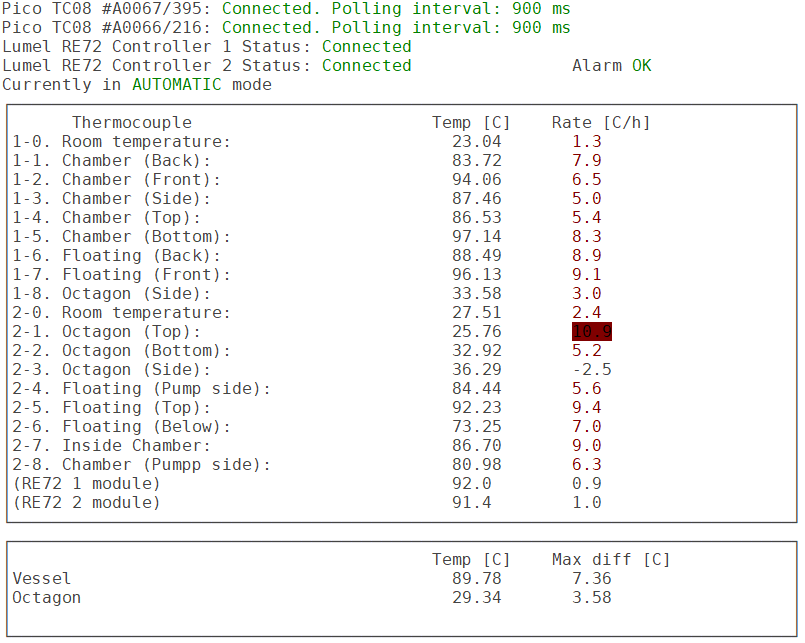
Will try to debug. |
| Attachment 1: 20200914_1207_temps.png
|
|
| Attachment 2: 20200914_1207_ctrl.png
|
|
| Attachment 3: 20200914_1727_temps.png
|
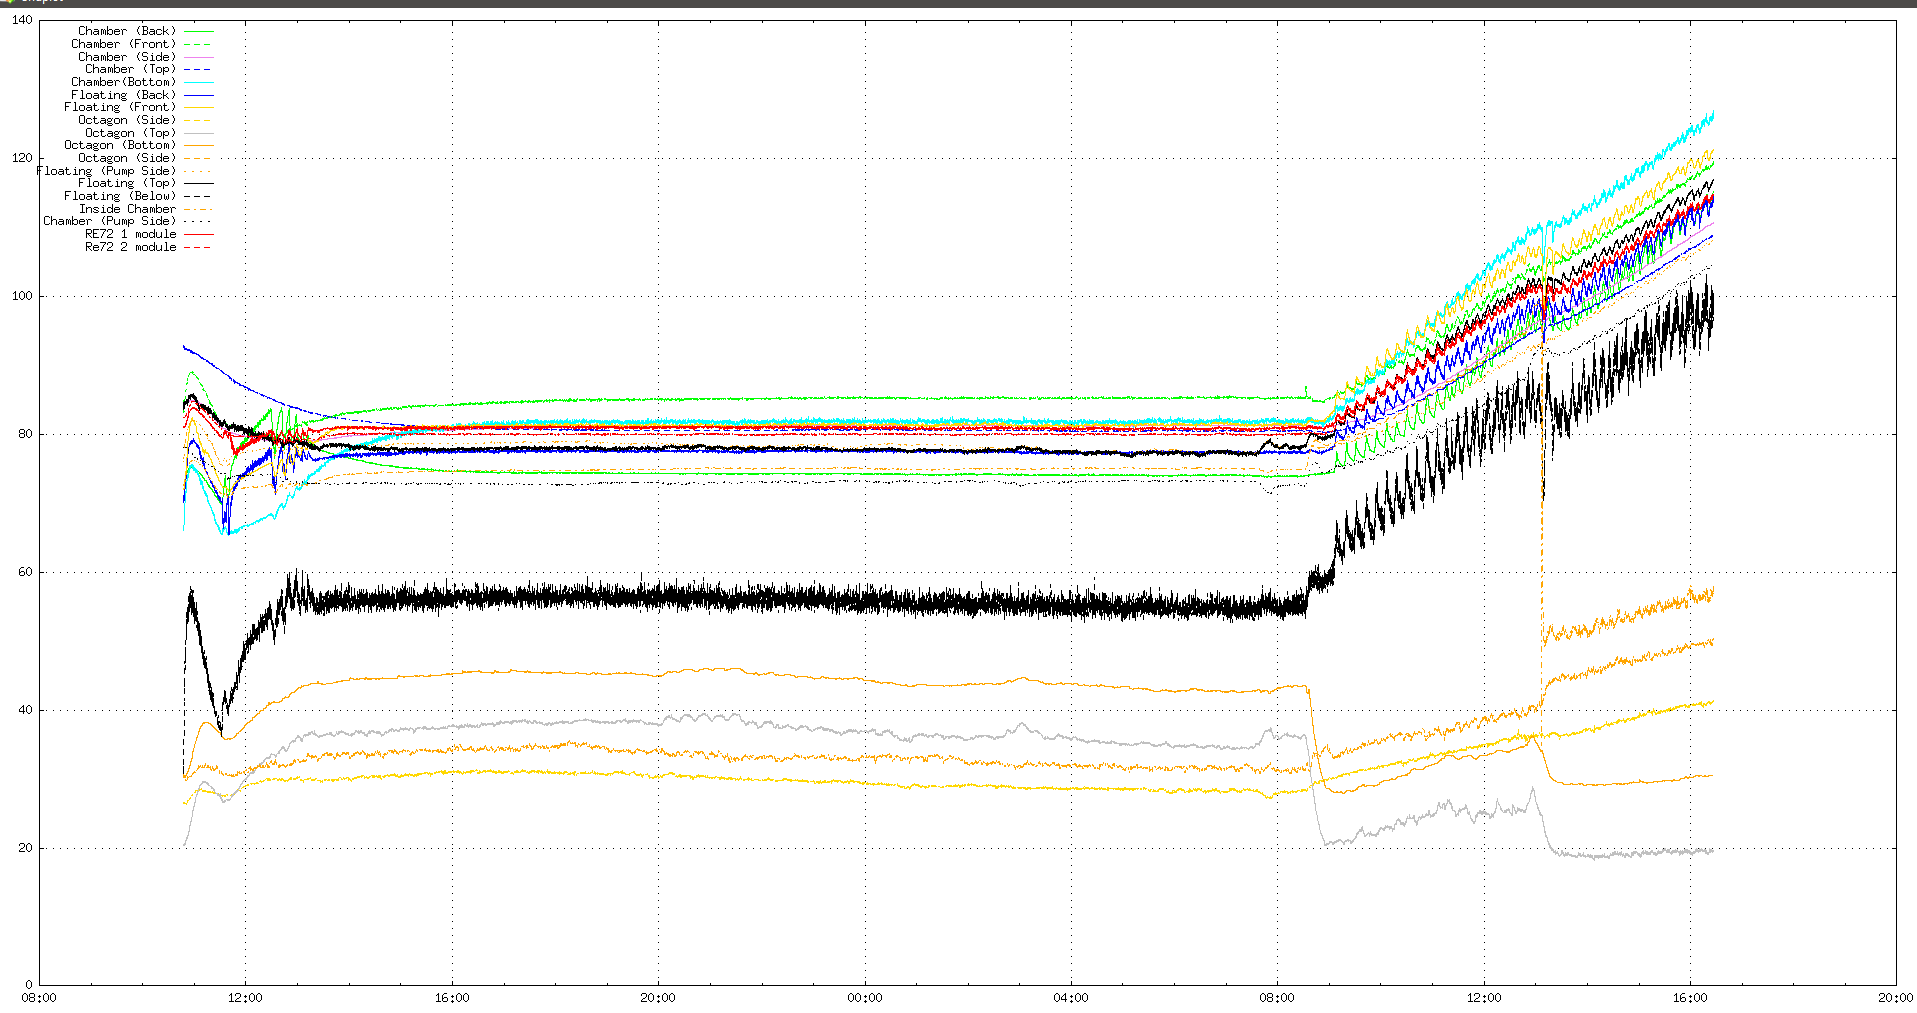
|
| Attachment 4: 20200914_2000_temps.png
|
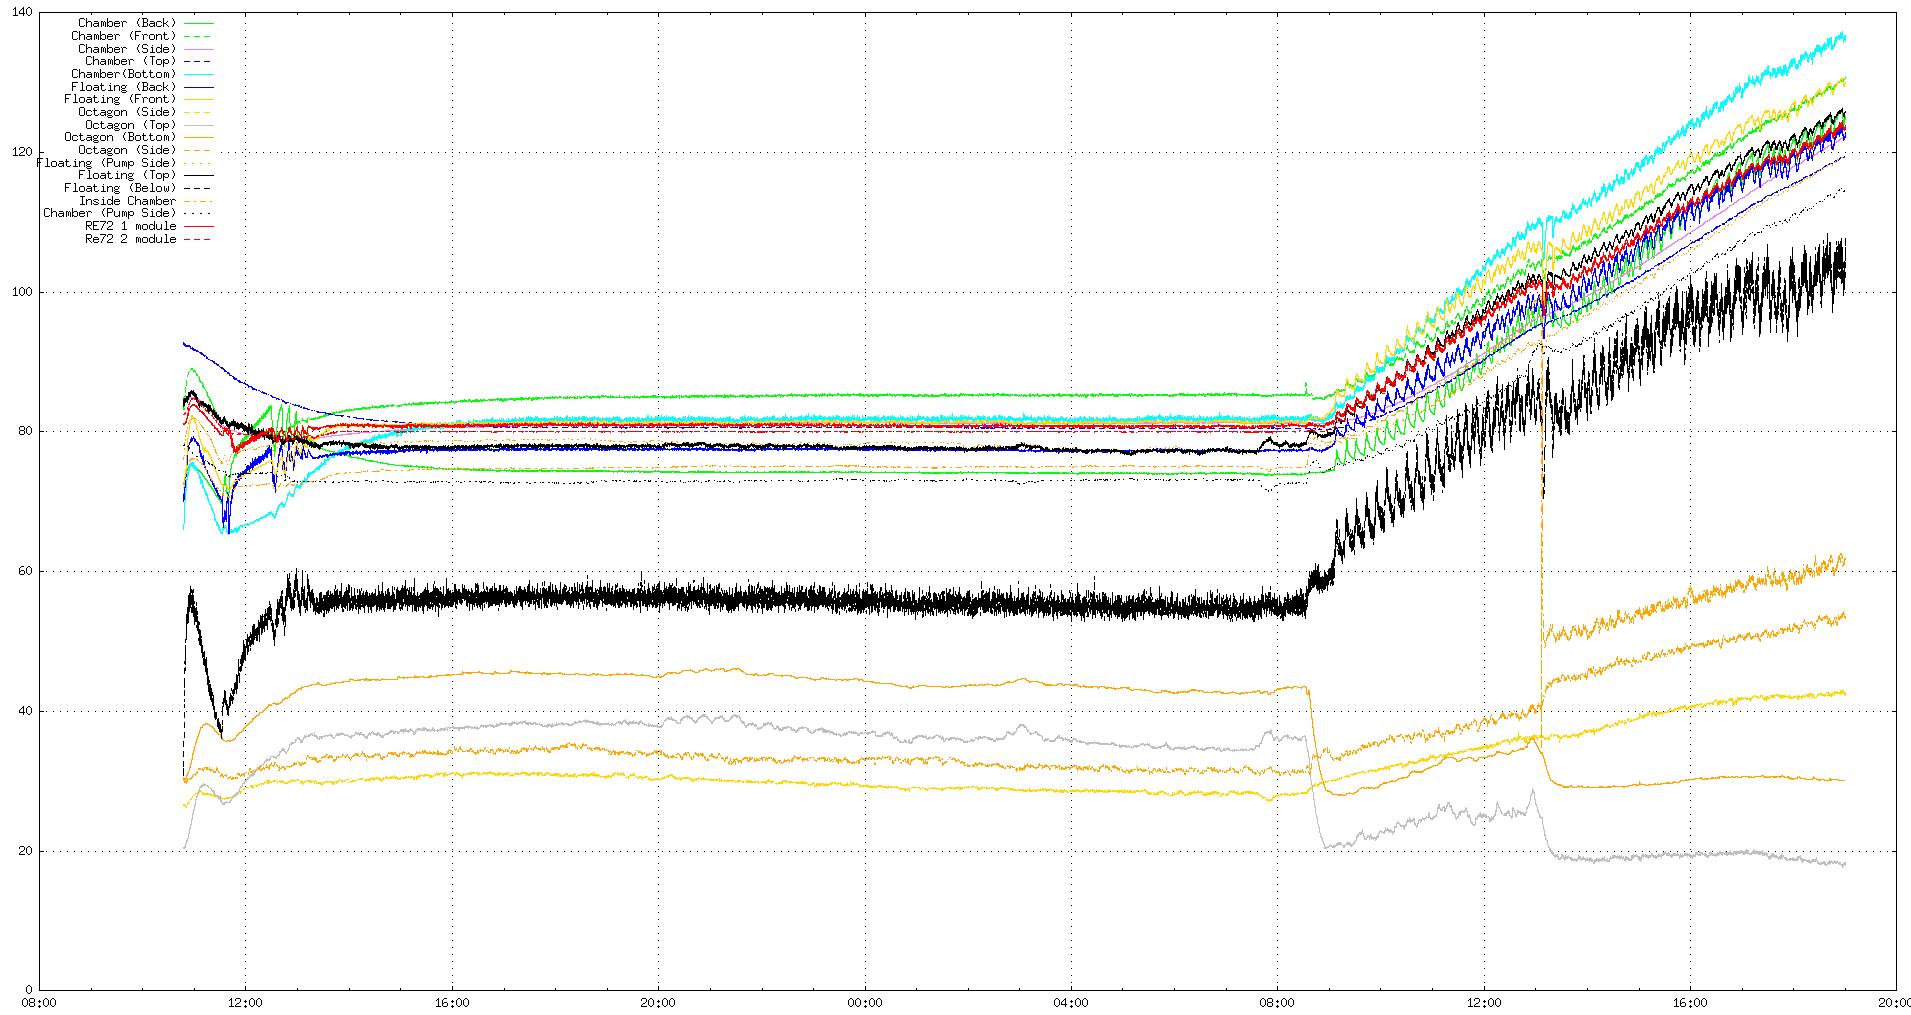
|
|
22
|
Sat Sep 26 09:31:46 2020 |
JM, CB (both remotely) | Baking over weekend |
Sat 26 Sep
09:15 Baking started automatic mode
13:30 Baking continues, heating is slower than expected due to high chamber bottom temperatures
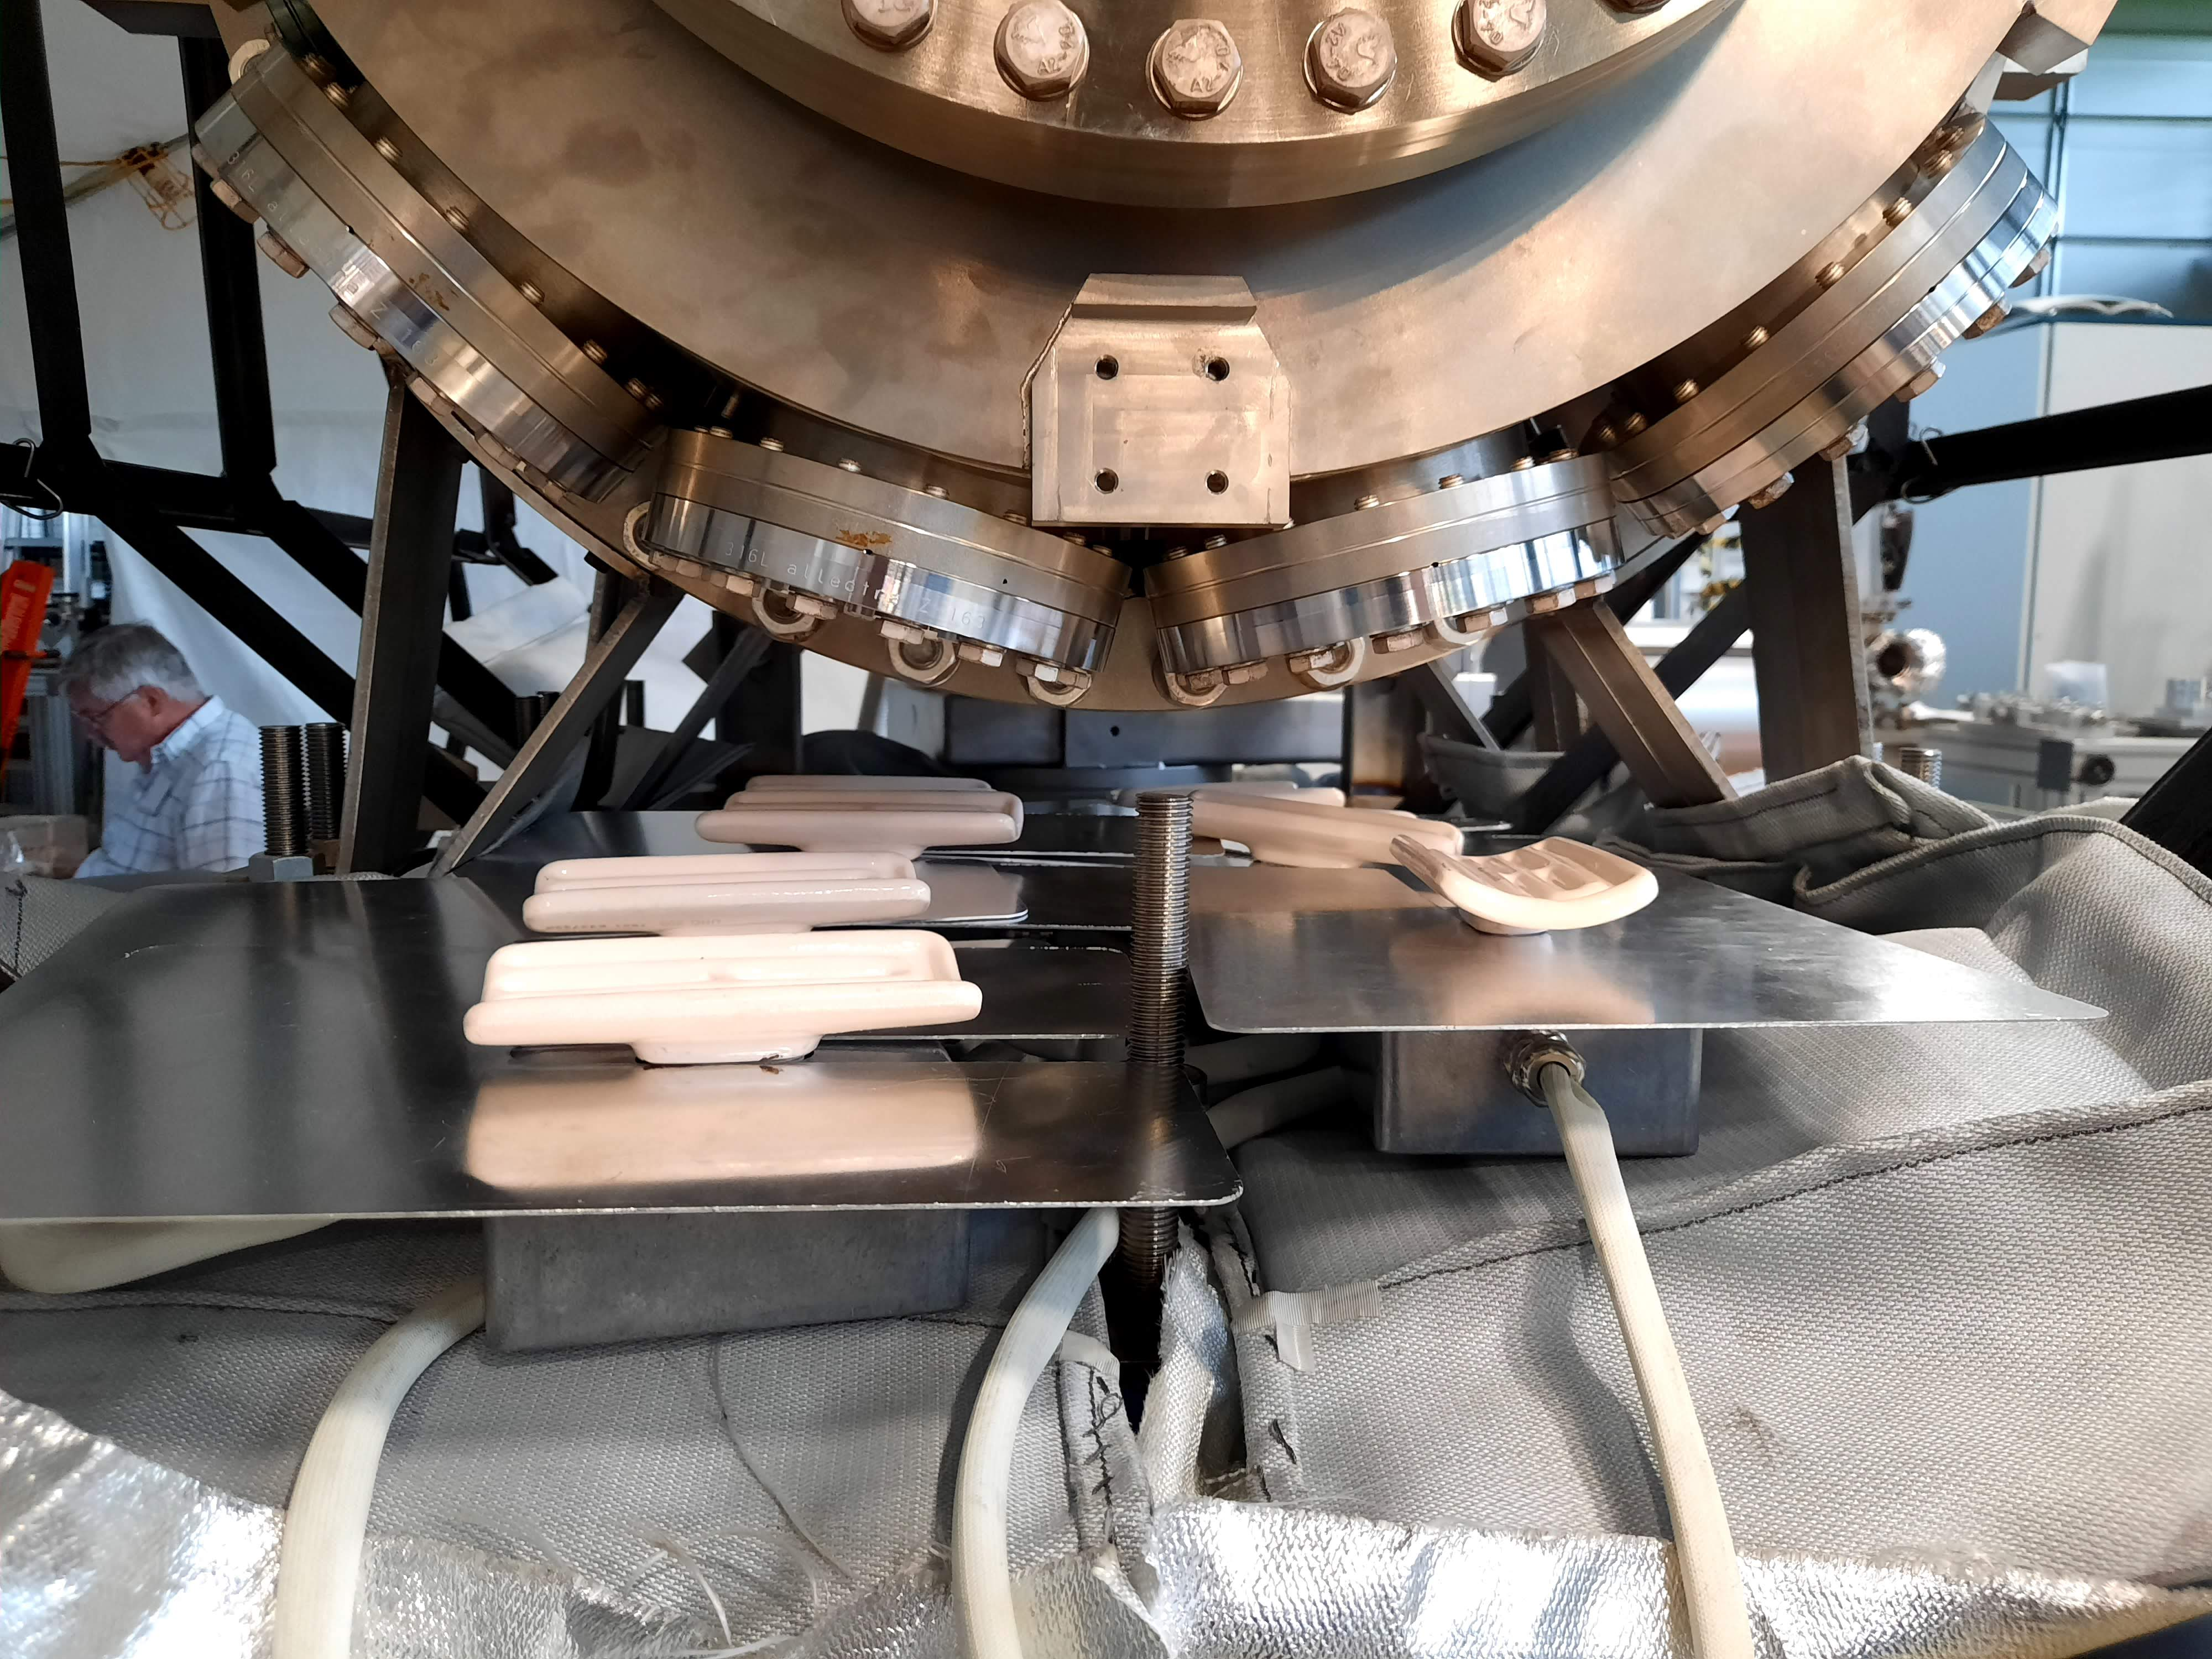
00:00 Baking stopped. Temperatures won't increase due to high temperature of the bottom of the chamber producing thermal gradients that are too high. I believe this is due to heaters being closer to the chamber as tray sits higher up than in previous test (see heaters.png). A shield above the heaters, similar to those we utilised in early tests in Edinburgh, may help to disperse the heat more evenly around the baking volume and not directly at the bottom of the chamber. I can improvise a shield similar to those using pieces of the aluminium outer layer of the baking setup I have spare on Monday and restart baking. This will also allow me to replace the two damaged thermocouples
Sun 27 Sep
11:50 Baking restarted. Manually set temperature to 50 C. Started automatic mode for additional safety checks. Will check again / increase temperature manually in a few hours
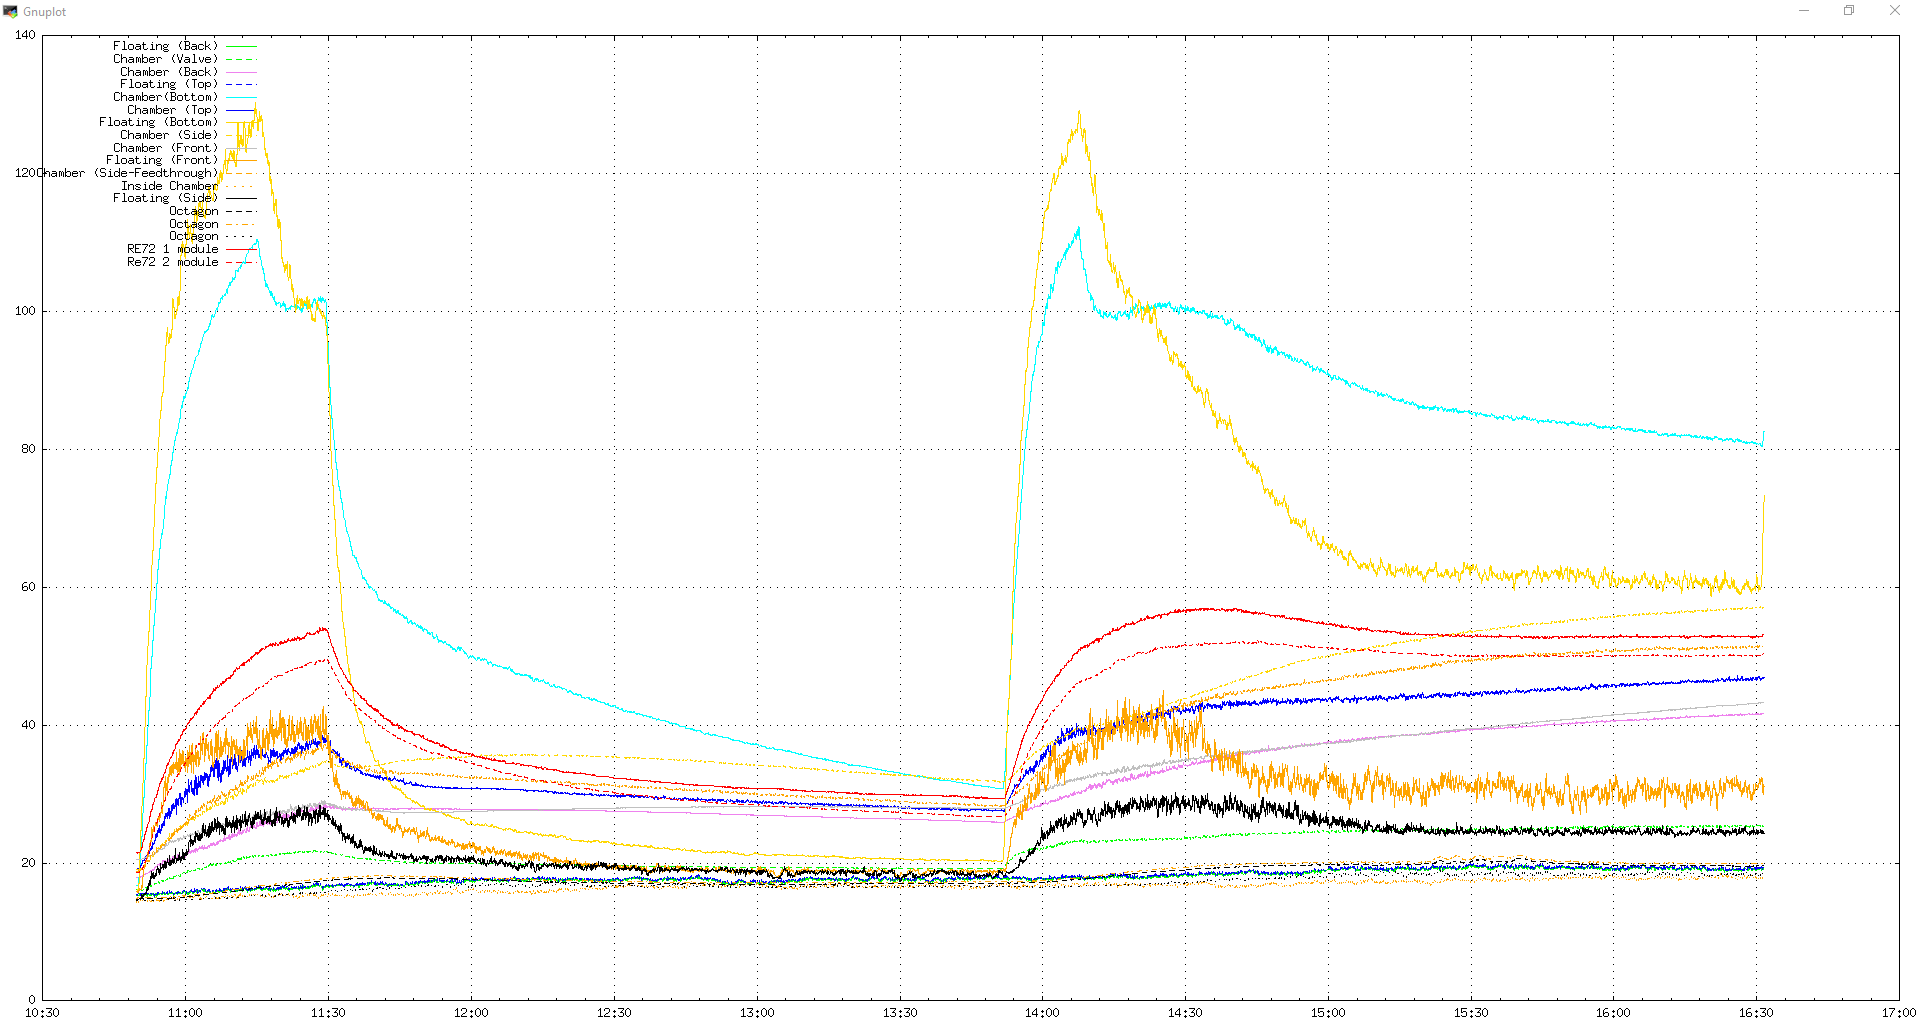
13:45 Found baking had stopped due to automatic mode detecting negative temperature gradient in TC7 Floating (bottom). See plot attached. Restarted baking at 50 C in manual mode
17:30 Found temperatures had stabilised. Increased temperature to 60 C. Issues seems to be that bottom thermocouples run hotter than the reference thermocouples of the RE72. The temperature the RE72 are set to maintain is not the temperature of the chamber. This is the cause of the strong gradients. Swapping the position of the thermocouples may be sufficient. Thermocouples presumed faulty on Friday may be working OK - could just be positioned in hot spot immediately above heaters.
18:00 Baking off to allow cooling down overnight. |
| Attachment 1: temps.png
|
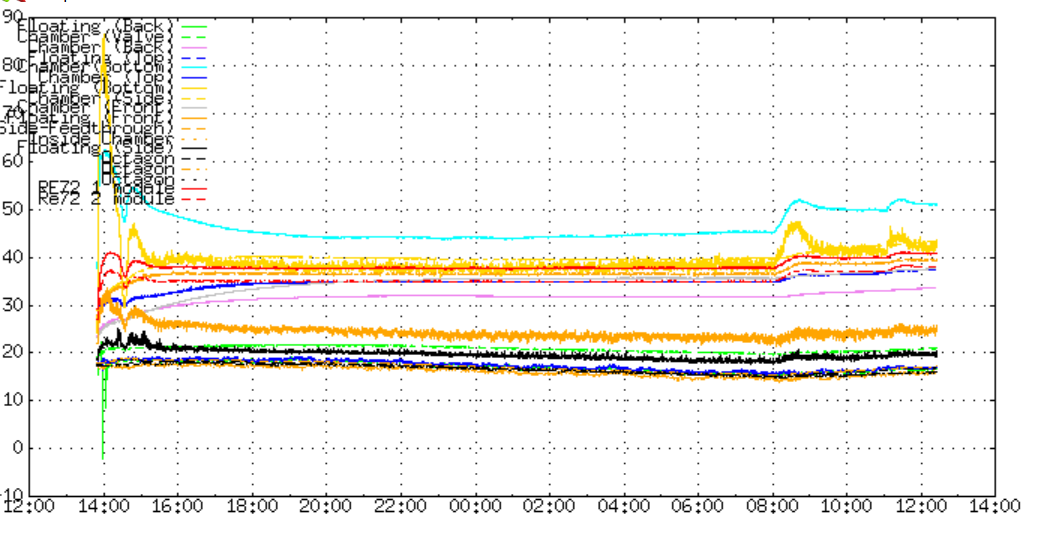
|
| Attachment 2: temps2.png
|
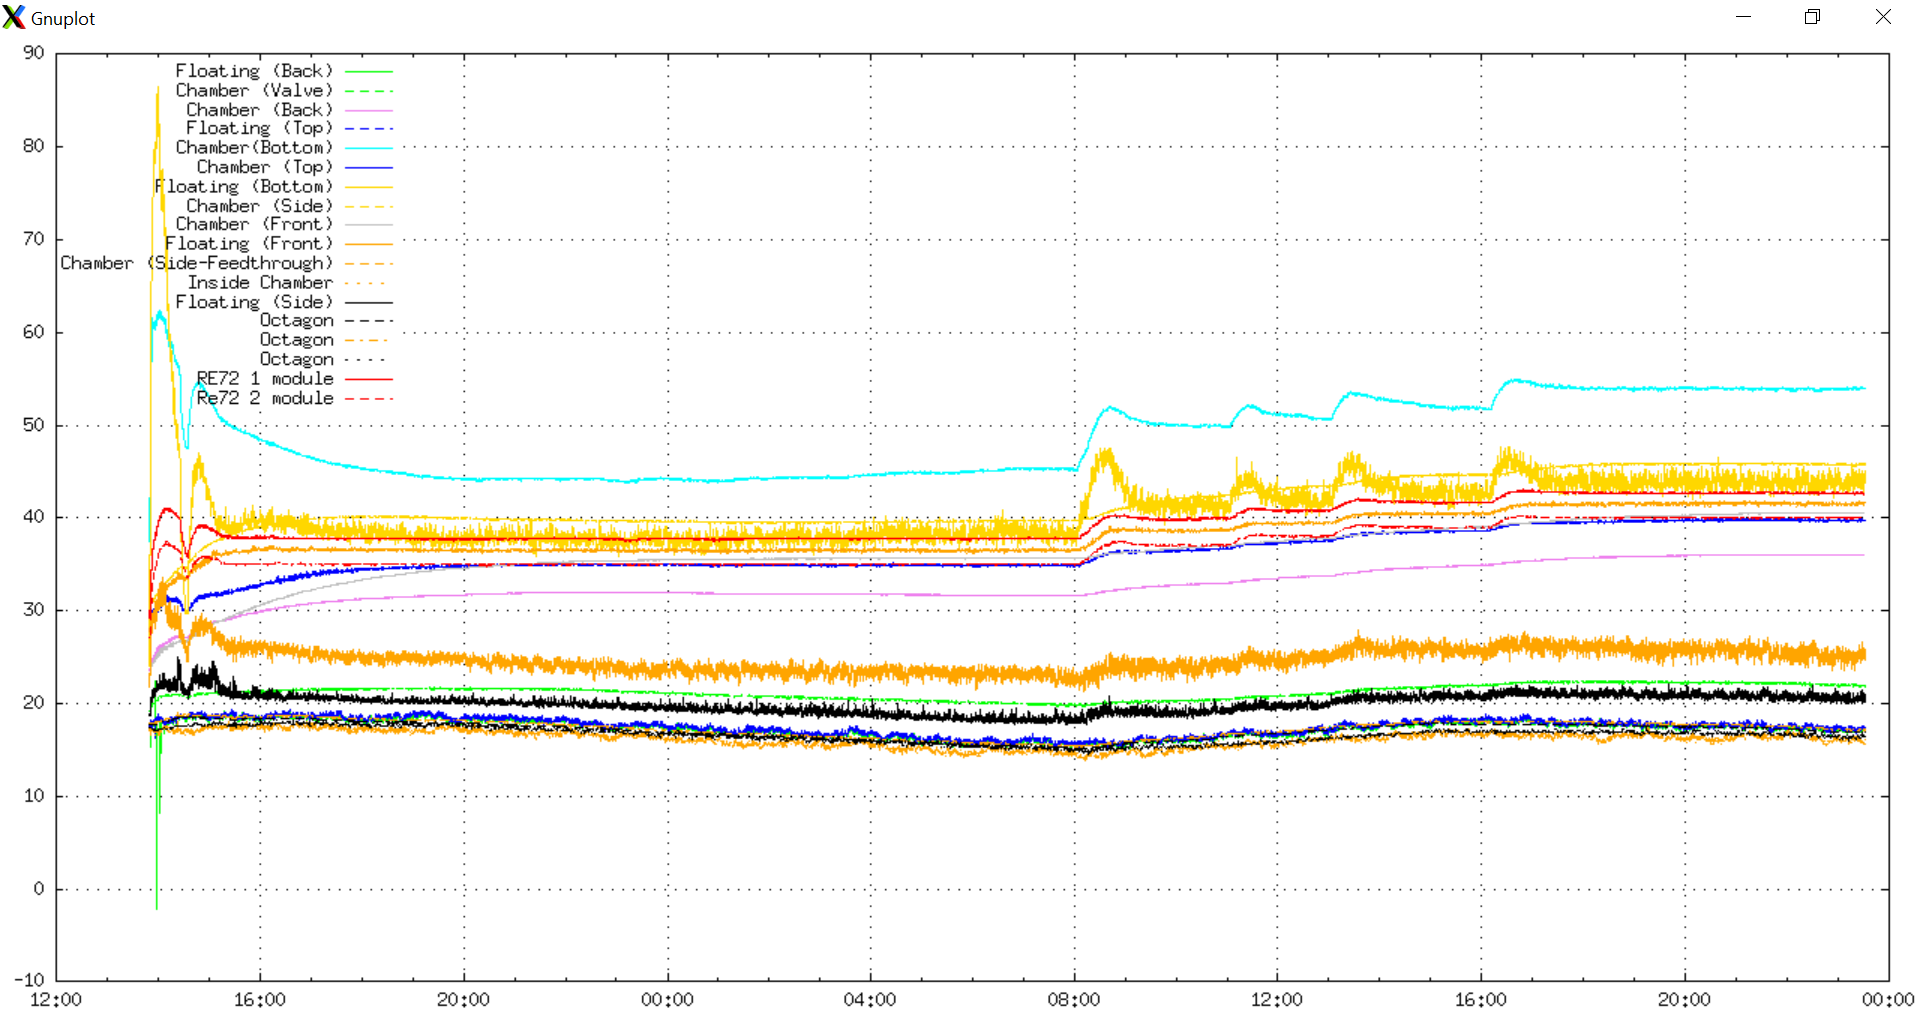
|
| Attachment 3: Heaters.jpg
|
|
| Attachment 4: 20200927_1732_temps.png
|
|
|
192
|
Sat Feb 12 19:48:38 2022 |
JM, CB | Grounding and movement tests |
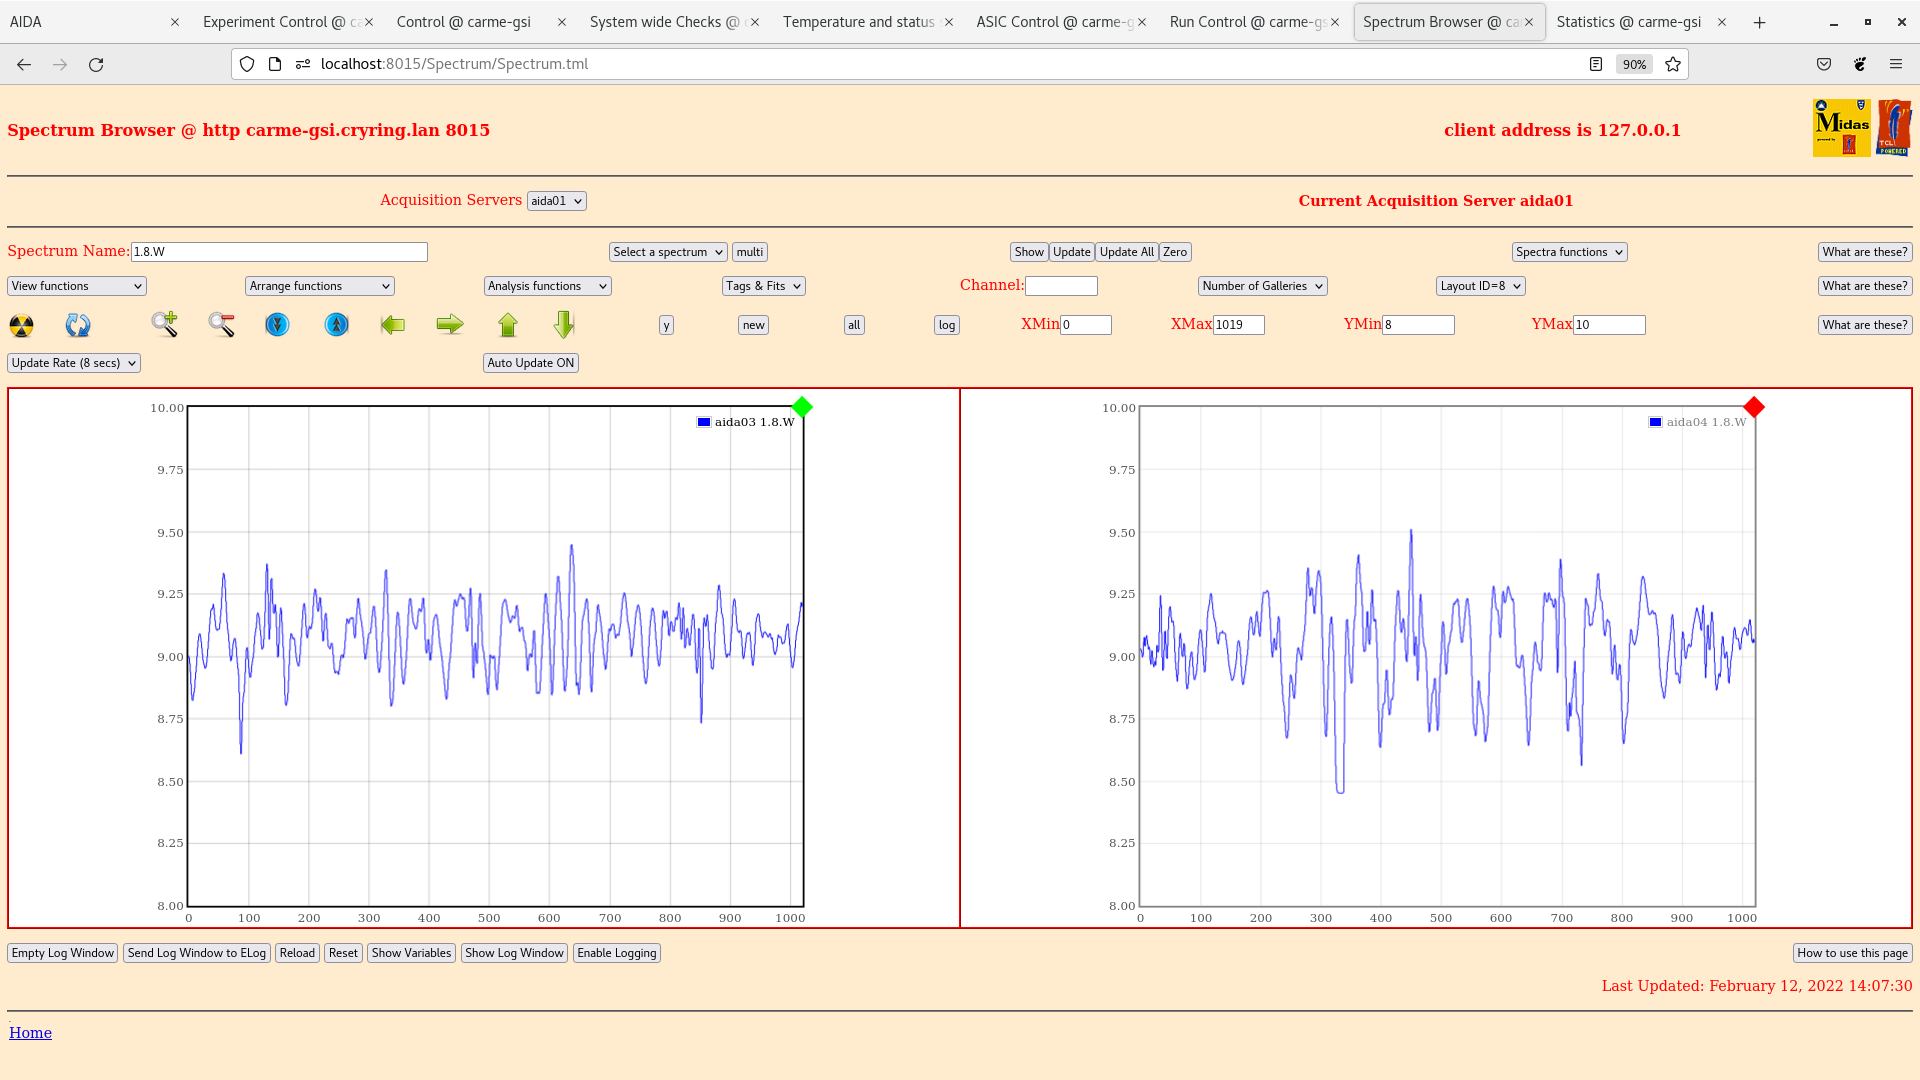
> Initial grounding see final grounding from elog 187. ASIC settings for all - LEC slow comparator 0x64. Note on 11/02/22 1.8*L widths with same settings were aida1-4: 300,240,250,260
ADC data items <10k
Good events fluctuate 10k-20k
1.8*L pulser widths aida1-4: 433,400,375,375(double peak)
Attachments 1-4
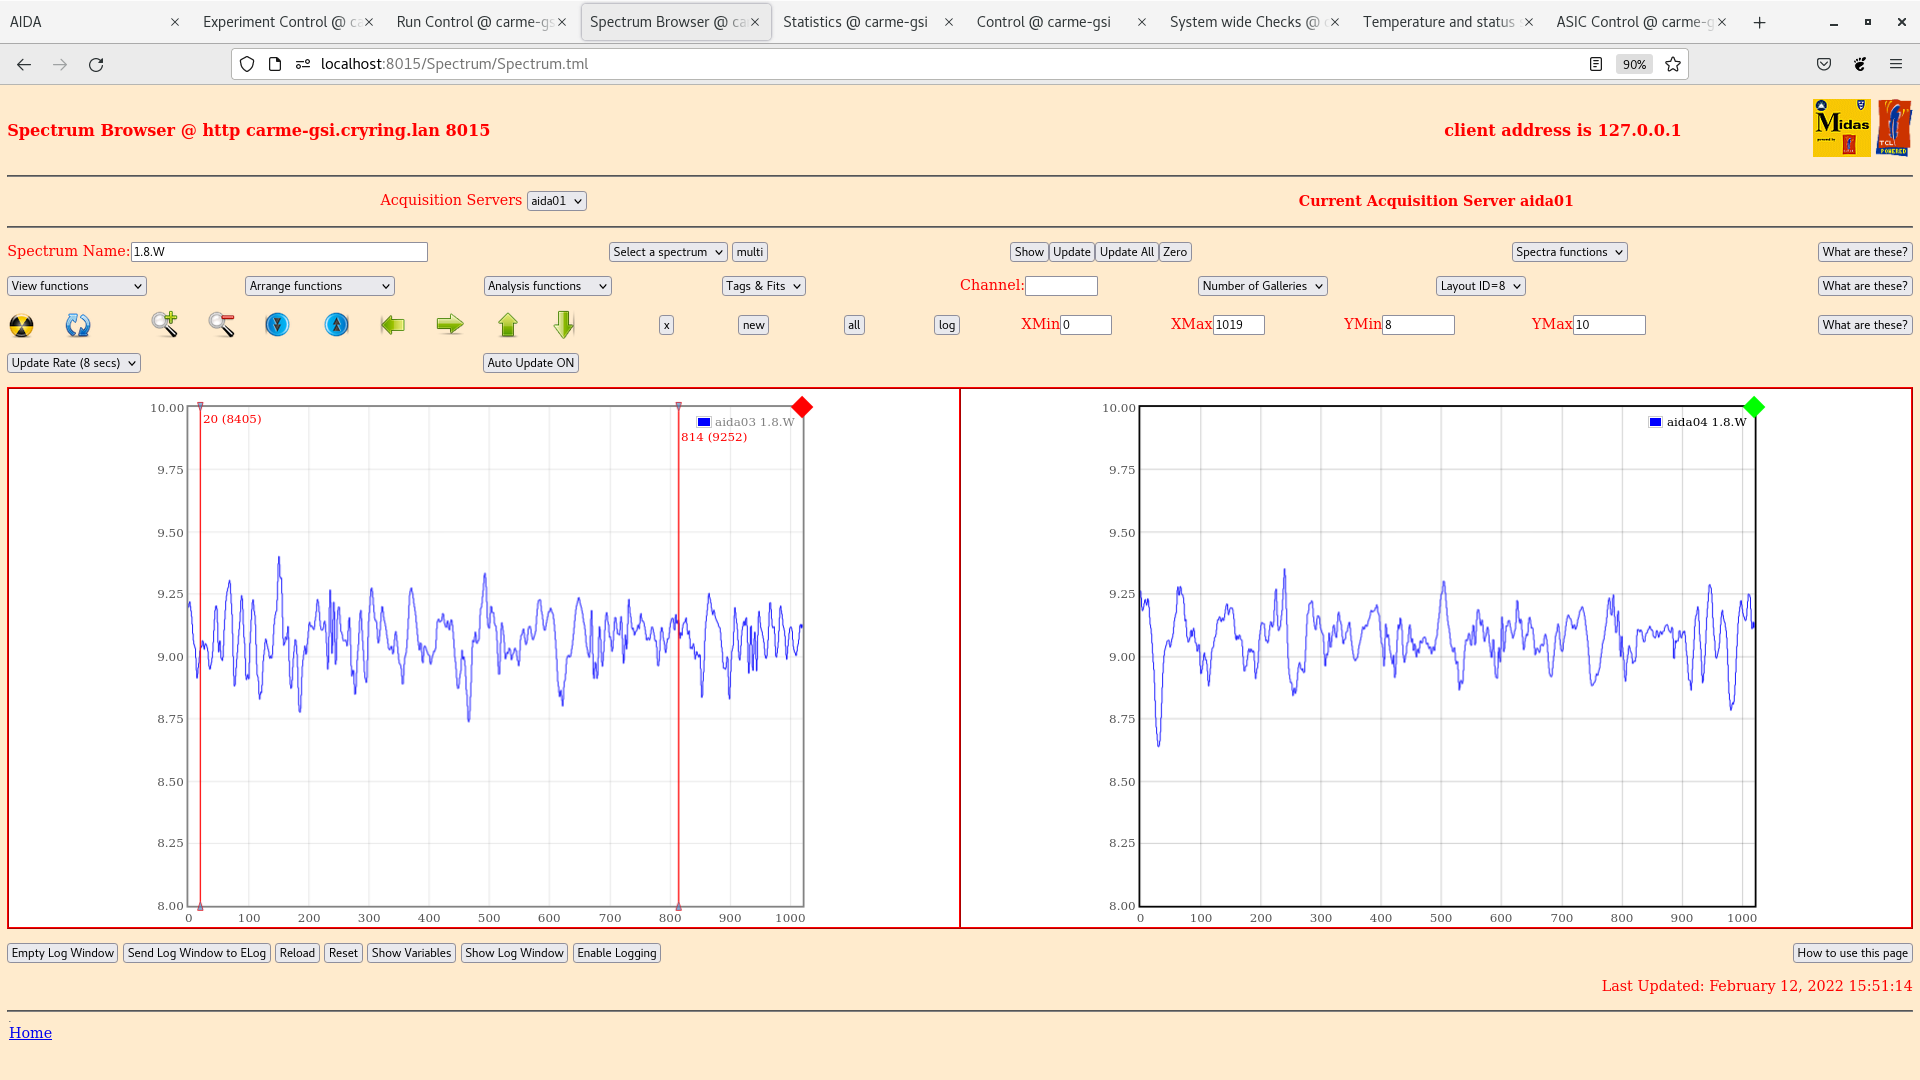
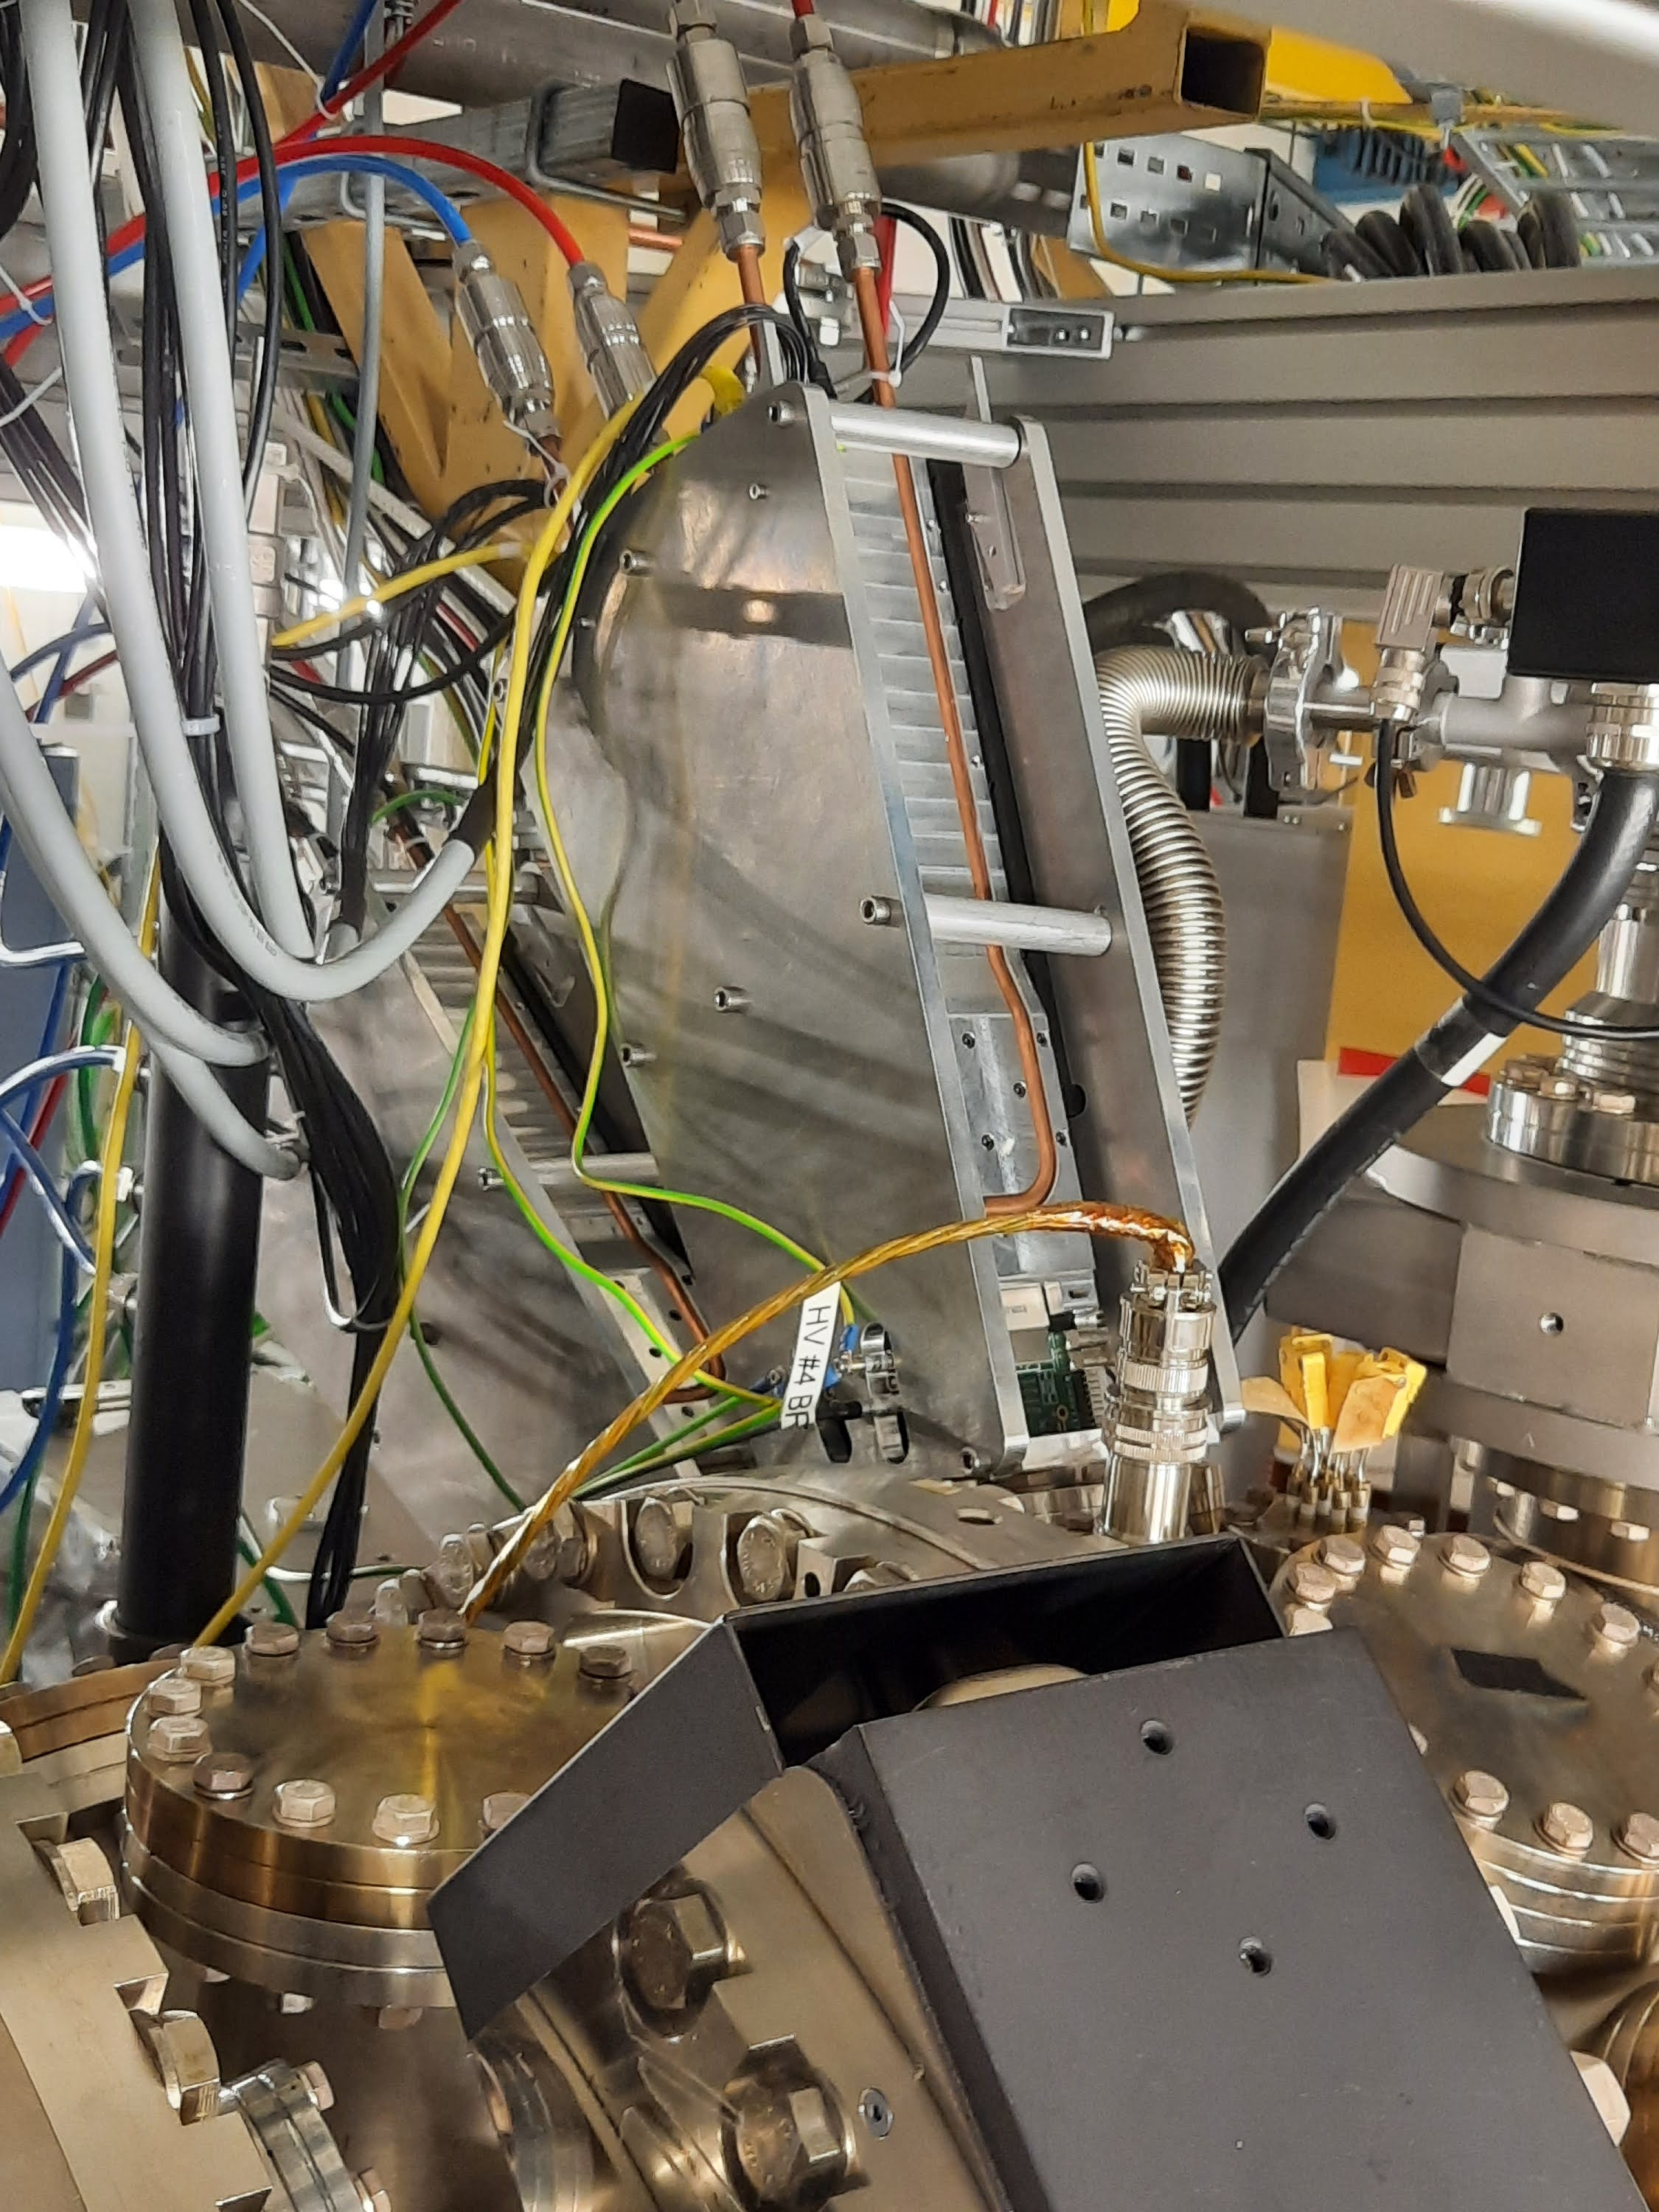
> New grounding implemented. 3mm grounding cable connect fee body to adaptor board. Each adaptor board is then connected directly to the cryring ground. Attachements 10-11
ADC data items <10k
Good events fluctuate 10k-20k
1.8*L pulser widths aida1-4: 340,288,288,295 (reduced double peak)
Noise in the system also seems to have decreaed in zoomed out 1.8*L plots (not attached). Aida1 still shows large noise peak channel 32000 on 1.8*L. 1.8*W no significant change, perhaps slightly reduced.
Attachements 5-9
Screencaps for following movement tests not taken as 1.8*L and 1.8*W spectra appeared the very similar as 5-9 except for slightly different widths.
> Detectors moved in and out (pneumatic). Leakage current dropped by ~0.2 uA, torque now reads +2.8 previously was ~0.
no change to ADC data items or good events. During movement aida3 saw momentary increase in good events to ~40k before returning to normal range. Rest of fees good events stats unaffected by movement.
1.8*L pulser widths aida1-4: 413,313,295,306
> servo motor (only) moved, torque reduced back to ~0
no change in good events stats for any fees during servo movement.
1.8*L pulser widths aida1-4: 425,335,316,288
> Detector moved to IN position (pnuematic and servo). 19.3mm to 81.8mm on potentiometer.
No change to good events. During movements aida3 saw momentary increase in good events to ~41k, all other fees unaffected.
1.8*L pulser widths aida1-4: 302,221,305,293
Noise peak at channel ~32000 on aida 1 (1.8*L) significantly reduced. little noise on other fees
>Detector moved to fully OUT position (pneumatic and servo).
no change in good events, during movement aida3 saw momentary increase to ~35k
1.8*L pulser widths aida1-4: 450,350,316,290
Noise peak at chn 32000 on aida 1 has increased to previous size. little noise on other fees.
> Bias increased to 120V. Leakage current stable however slightly higher ~0.1 uA
no change in good events.
1.8*L pulser widths aida1-4: 447,345,189,301
> Bias increased to 140V, increase in leakage current ~0.2 uA, appears stable. Increase to 150V, fluctuate in leakage current of +/-0.5uA then huge increase to >20uA trip.
> Fee power cycle. Bias 100V, leakage current 9.9 uA ~0.1-0.2 uA higher than previous but stable.
no change to good events
1.8*L pulser widths aida1-4: 468, 350,311, 296
> Some decrease seen with new grounding, however main source of noise still apparent and any decrease seems insignificant compared to changes due to position movement.
> Water pipes have been zipped tied so they no loger touch motors, no change in pulser widths or noise levels however. |
| Attachment 1: 2022-02-12_14-09-31aida1-2-5-1.8*W.png
|

|
| Attachment 2: 2022-02-12_14-08-06aida3-4-1.8*W.png
|
|
| Attachment 3: 2022-02-12_14-14-13aida1-2-1.8*L.png
|

|
| Attachment 4: 2022-02-12_14-15-32aida3-4-1.8*L.png
|

|
| Attachment 5: 2022-02-12_15-53-15aida1-2-1.8*W.png
|

|
| Attachment 6: 2022-02-12_15-51-47aida3-4-1.8*W.png
|
|
| Attachment 7: 2022-02-12_16-02-08aida1-2-1.8*L.png
|

|
| Attachment 8: 2022-02-12_16-05-04aida3-4-1.8*L.png
|

|
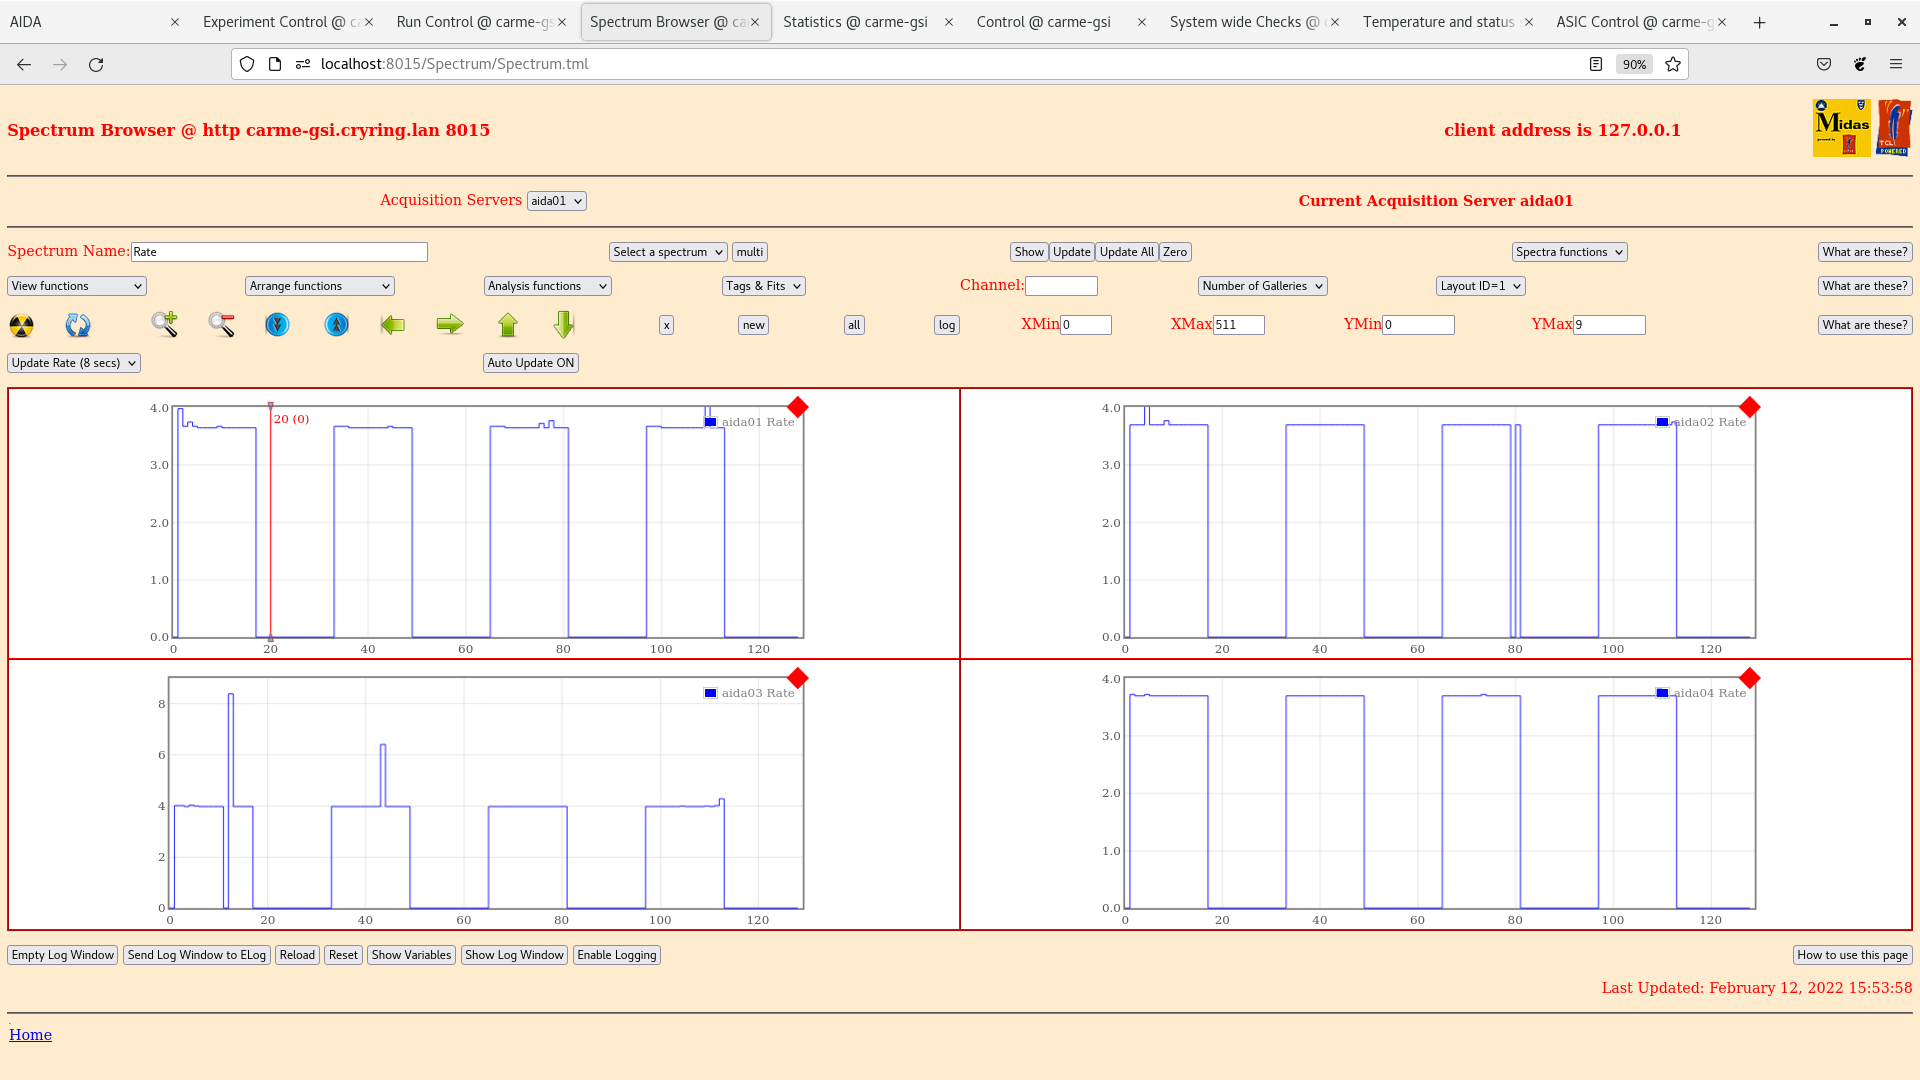
| Attachment 9: 2022-02-12_15-54-34aida1-4-rate.png
|
|
| Attachment 10: 20220212_152215.jpg
|

|
| Attachment 11: 20220212_171240.jpg
|
|
|
193
|
Sun Feb 13 21:28:35 2022 |
JM, CB | Alpha background Run 32, 35 |
Alpha background gathered from 17:35 12/2/22 to 13:44 13/2/22 is run32. Run time ~20 hours. Some alphas visible in aida1 1*L histograms attached.
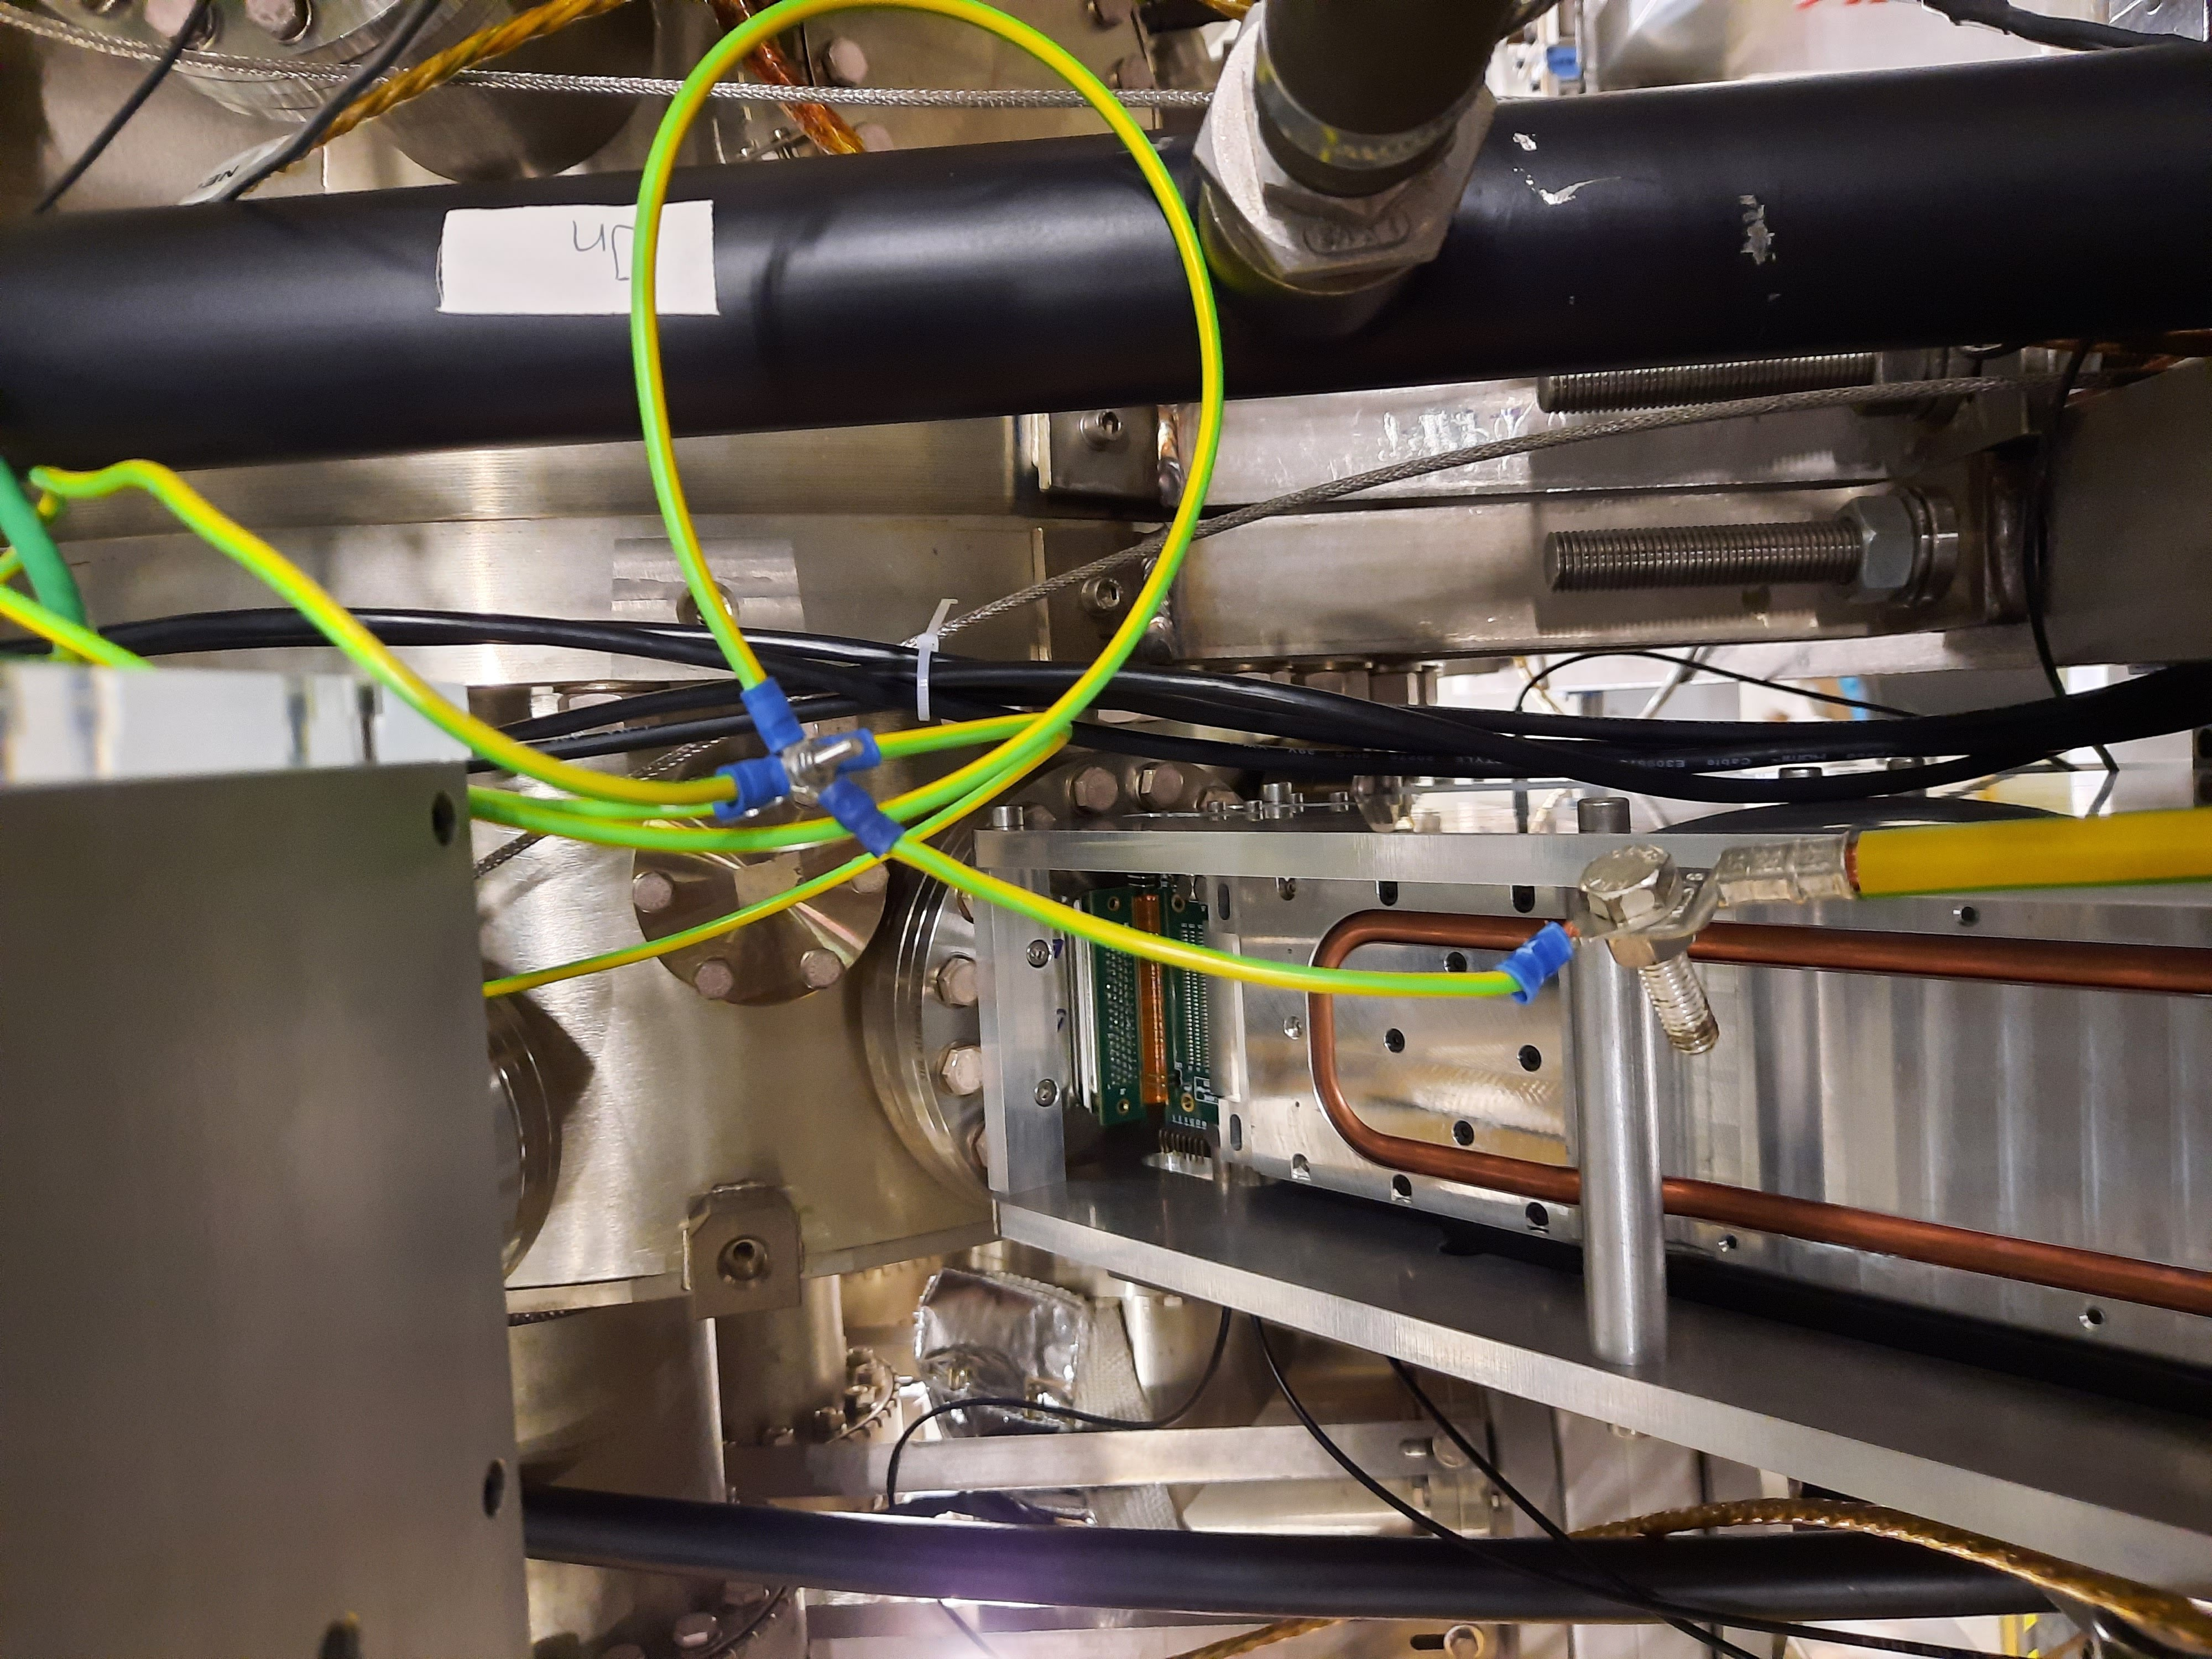
Noticed grounding of crimps that attched to cryring ground has come loose. Those crimps not ideal for our grounding cable so were loose. Grounding cable from each fee now meet at a single grounding cable joined by an m3 nut and bolt. This grounding cable then goes to the cryring ground and is properly secured. See attachment 1. No significant change to pulser widths with new grounding method from previous elog.
Aida5 appeared non-responsive, no good events / data items etc and would not stop when daq was stopped. Fee power cycled. Aida 3 and 5 then showed no data items / good events or any stats. When stopping daq all fees then became non responsive. Full restart initiated, fee power off, all servers incl merger and tape server closed. Restarted system, all fees now responsive, all show full stats and are writing data.
Alpha background started 17:06 13/2/22 to 09:41 14/2/22 is run35. Run time ~16 hours 40 mins.
Ex, Ey 1D histograms for run32 and run35 attached. Bin size 80 keV. |
| Attachment 1: 20220213_145309.jpg
|
|
| Attachment 2: 2022-02-13_13-34-46aida1-1*Lalpha.png
|

|
| Attachment 3: canvasEx-run32.png
|

|
| Attachment 4: canvasEy-run32.png
|

|
| Attachment 5: canvasEx-run35.png
|

|
| Attachment 6: canvasEy-run35.png
|

|
|
211
|
Fri Feb 18 20:31:33 2022 |
JM, CB | Alpha Background run 48 |
Alpha background started with beam ON - run47. Run started 16:49 18/2/22 (beam subsequently found to be OFF)
Beam energy 4 keV, beam lifetime ~ 100 ms
Noticed aida01 and aida02 were showing increased good event rates to ~250,000, effect seen on spectrum browser and data writing rate increased to ~2500 kb/sec from ~20 kb/sec. ASIC check on the affected fees brought rates back to normal range 10-20k good events. Multiple instances occurred in a row on run47 so fees were power cycled. Run ended 17:21
Run 48 started after power cycle
Run start 17:42, beam OFF ~18:30-19:00 for access to the cave to aid allignment of the gas jet target.
Rates remain stable until ~20:00. Aida01 and 02 show increased rates, asic check -> back to normal range.
Beam ON 21:43
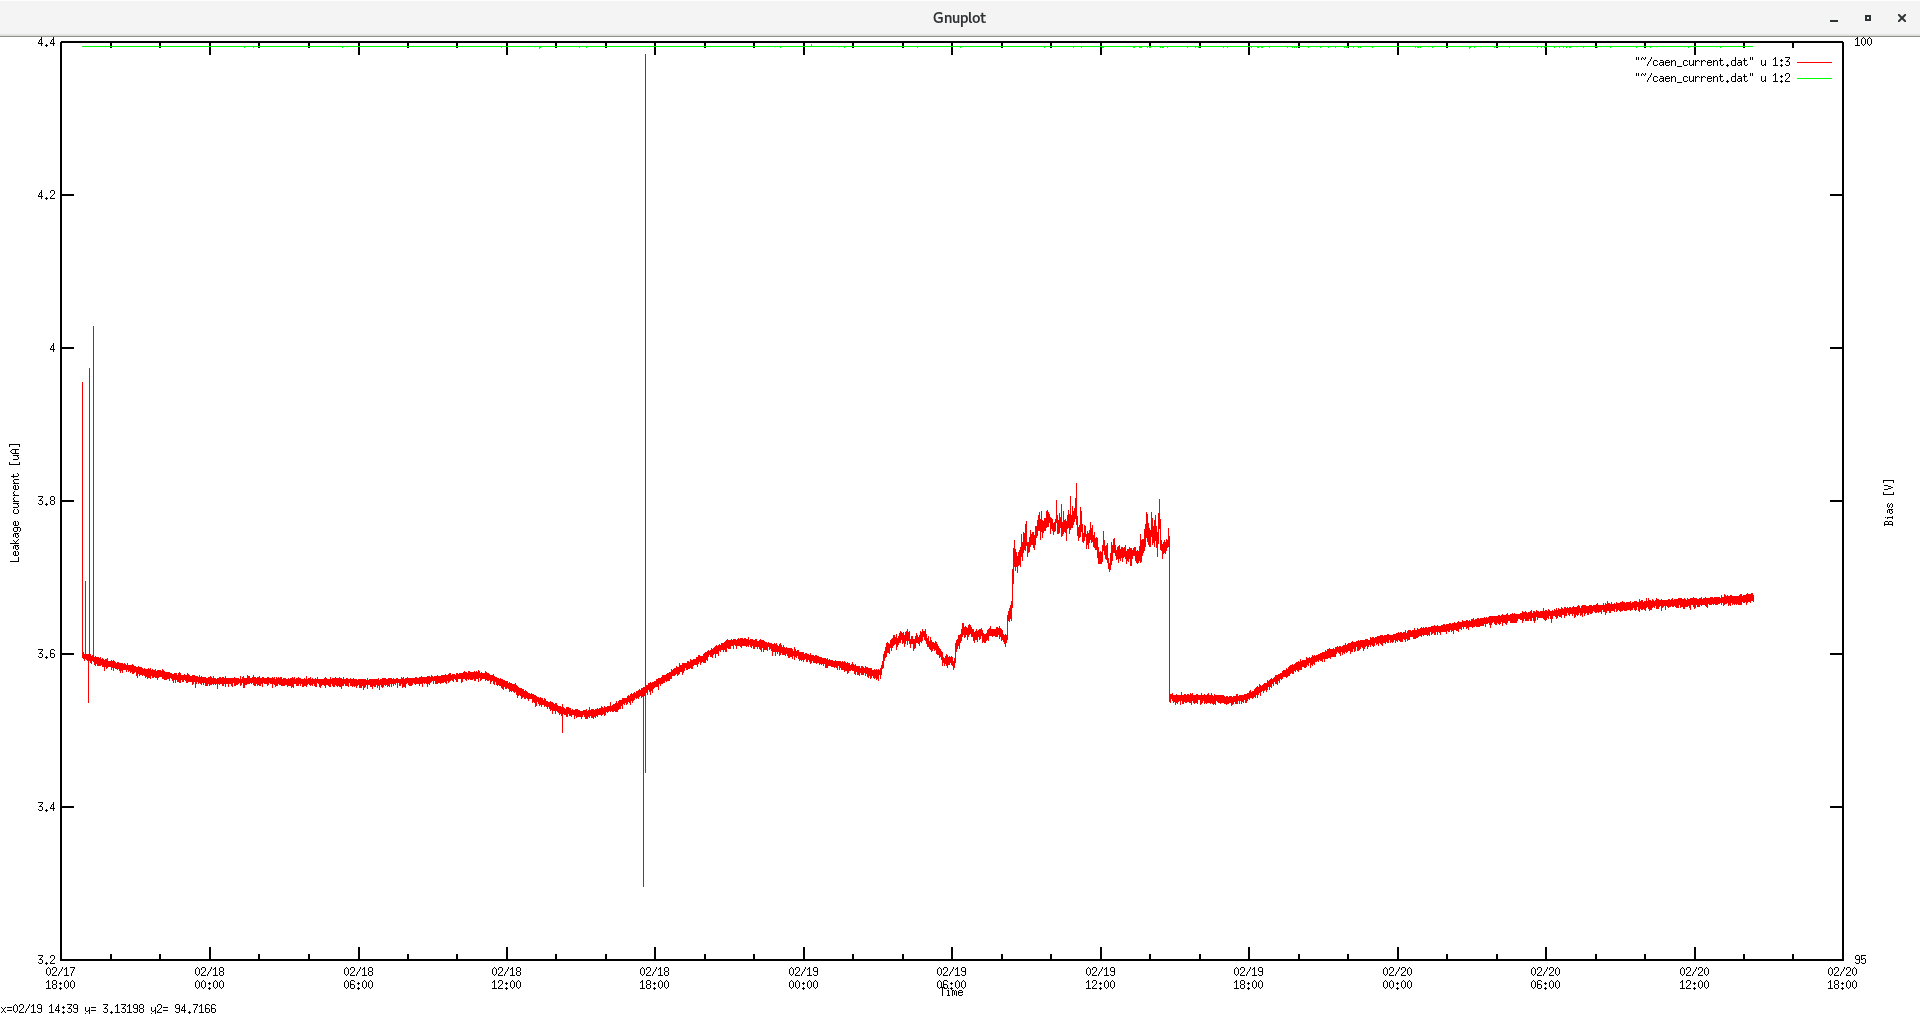
All system checks OK. All rates OK. Leakage current ~3.62 uA.
14:00 19/2/22
Beam OFF during 18/2/22 due to an interlock controlled by main control room unknown to us. Beam has been OFF.
Leakage current plot attached. System checks OK, except white rabbit, all fail.
Motors were at 26mm potentiometer opposed to 20.2mm which was the set point (fully out 19mm). Motors dragged in as pneumatic was not fully out. Likely result of pneumatic out valve being closed. Pneumatic fully out, potentometer back to 20.2mm and leakage current drop from ~3.75 uA to 3.54uA.
Run ended 21:00 |
| Attachment 1: 2022-02-19_14-45-25-leage-current.png
|

|
|
212
|
Sat Feb 19 14:51:58 2022 |
JM, CB | Burst high energy noise |
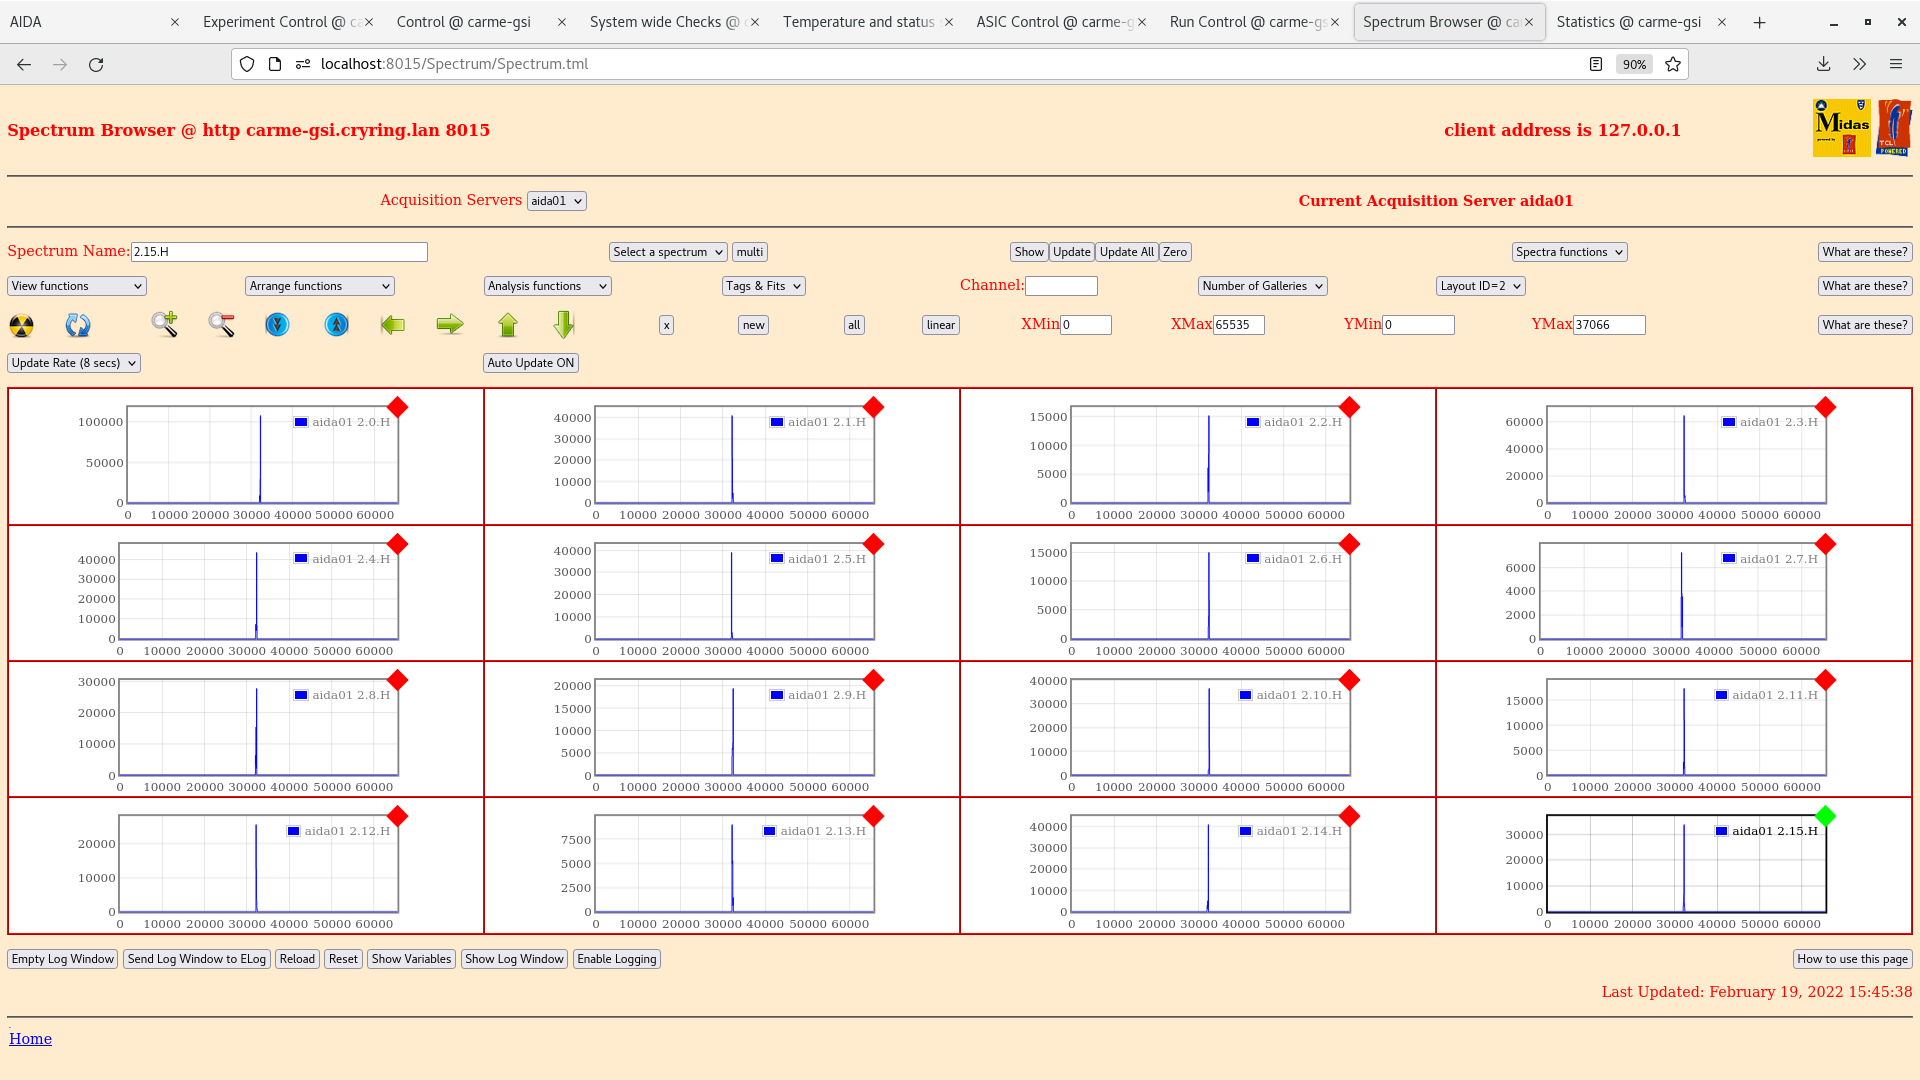
Noticed bursts of high energy noise on aida01 and aida02 during run 47 and 48.
Good events rate jumps from 10-20k range to 250k. ADC data items rate jumps from 0-1 to 2k. Data rate being written increases to ~2500 kb/s from ~20 kb/s
Effect appears short lived ~30s at a time. On 18/2/22 the asic was check loaded which appeared to remove the increased rate but due to the time taken to asic check the burst had already finished.
Asic 2 on aida01 and asic 1 on aida02 are affected. See attached plots.
Fast comparator threshold HEC currently set to 0x2 for all
Zoomed in region of aida 1 asic 2 and the same region for asic 1 to see the difference are attached.
|
| Attachment 1: 2022-02-19_15-50-50-aida1-4-stat-logscale.png
|

|
| Attachment 2: 2022-02-19_15-47-13-aida1-2*H.png
|
|
| Attachment 3: 2022-02-19_15-49-48-aida2-1*H.png
|

|
| Attachment 4: 2022-02-20_14-01-40-aida1-2*H.png
|

|
| Attachment 5: 2022-02-20_14-02-55-aida1-1*H.png
|

|
|
213
|
Sat Feb 19 20:08:43 2022 |
JM, CB | Beam ON run 49 |
Run started 19/2/22 21:05. Beam ON
Temperatures OK
System wide checks OK - white rabbit fails on all.
Statistics are within normal range (10-20K goodevents)
Leakage current 3.6 uA
potentiometer = 20.28 mm
20/2/22
Leakage current ~3.675 uA. Looks stable now motors can not move (attachment 1)
potentiometer = 20.28 mm
Temperatures OK
System wide checks OK - white rabbit fails all
Statistic within normal range (see attachment 2 - ADC data items) Counter for aida 1 and aida 2 much higher due to noise bursts (elog 212)
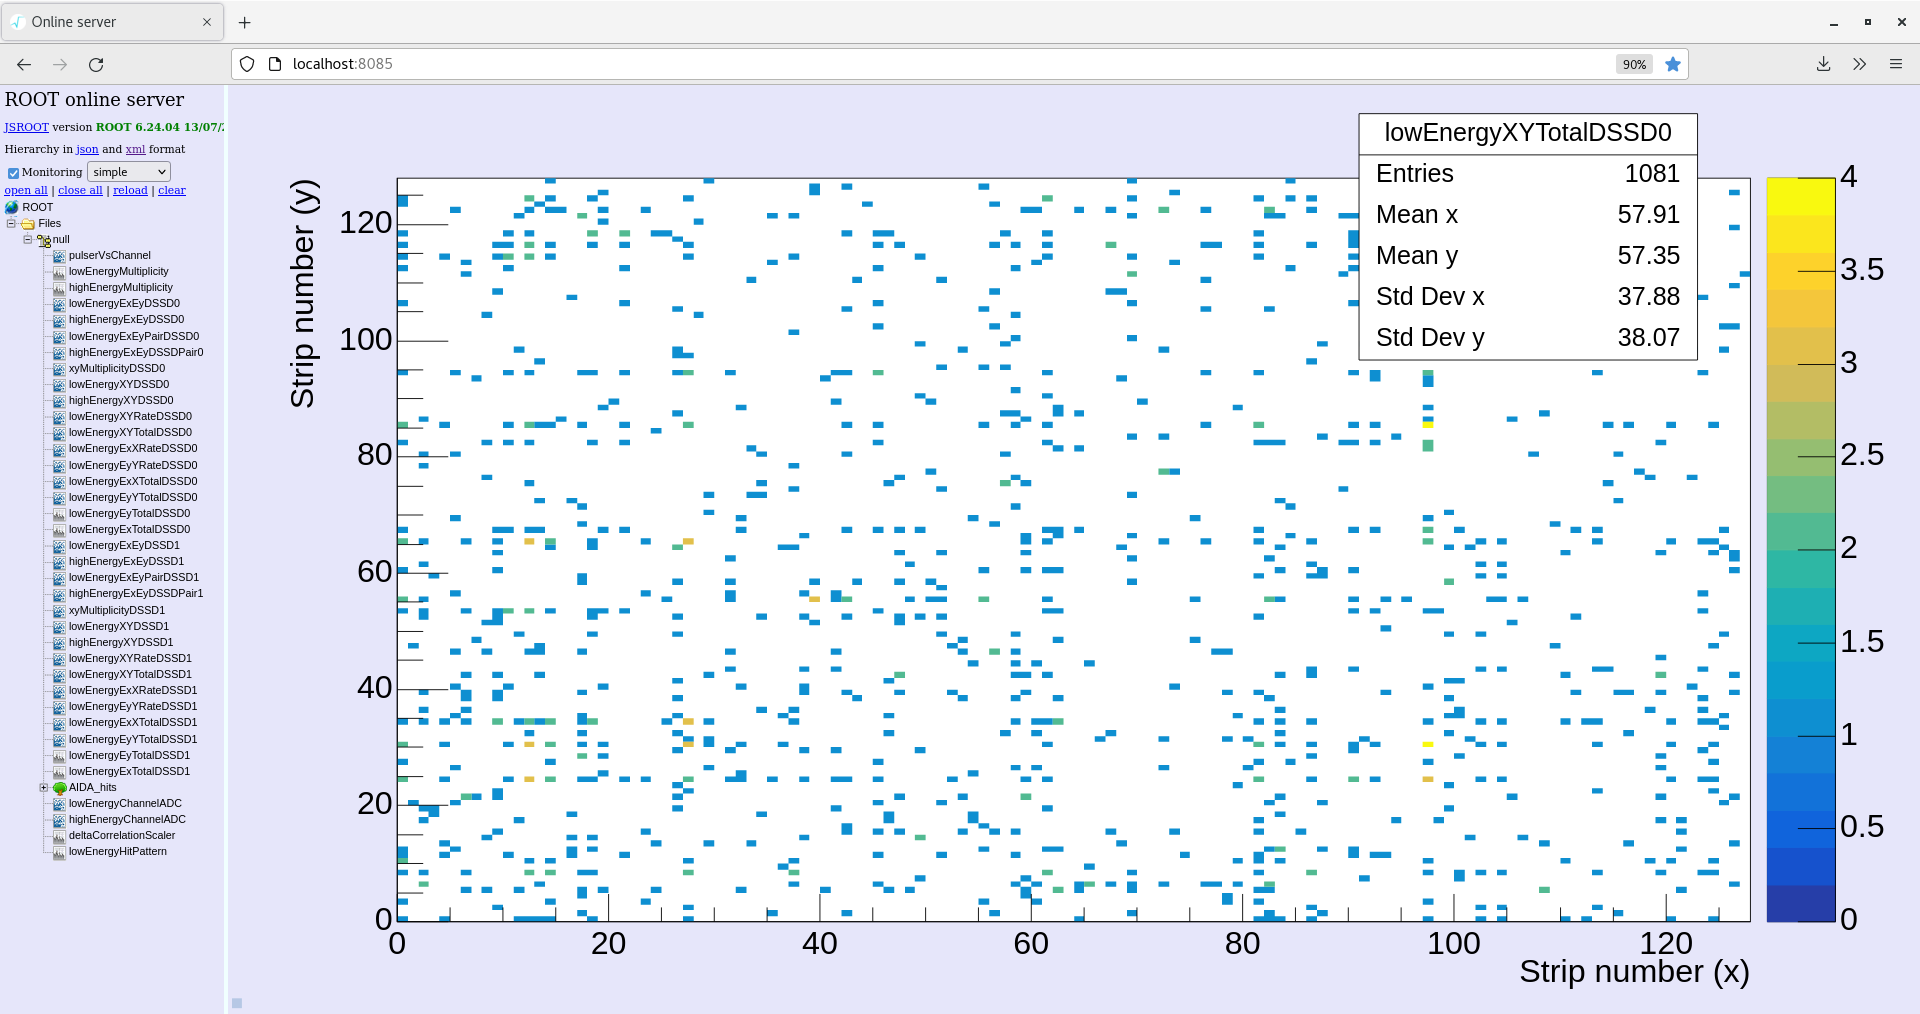
XY total plot (attachment 3)
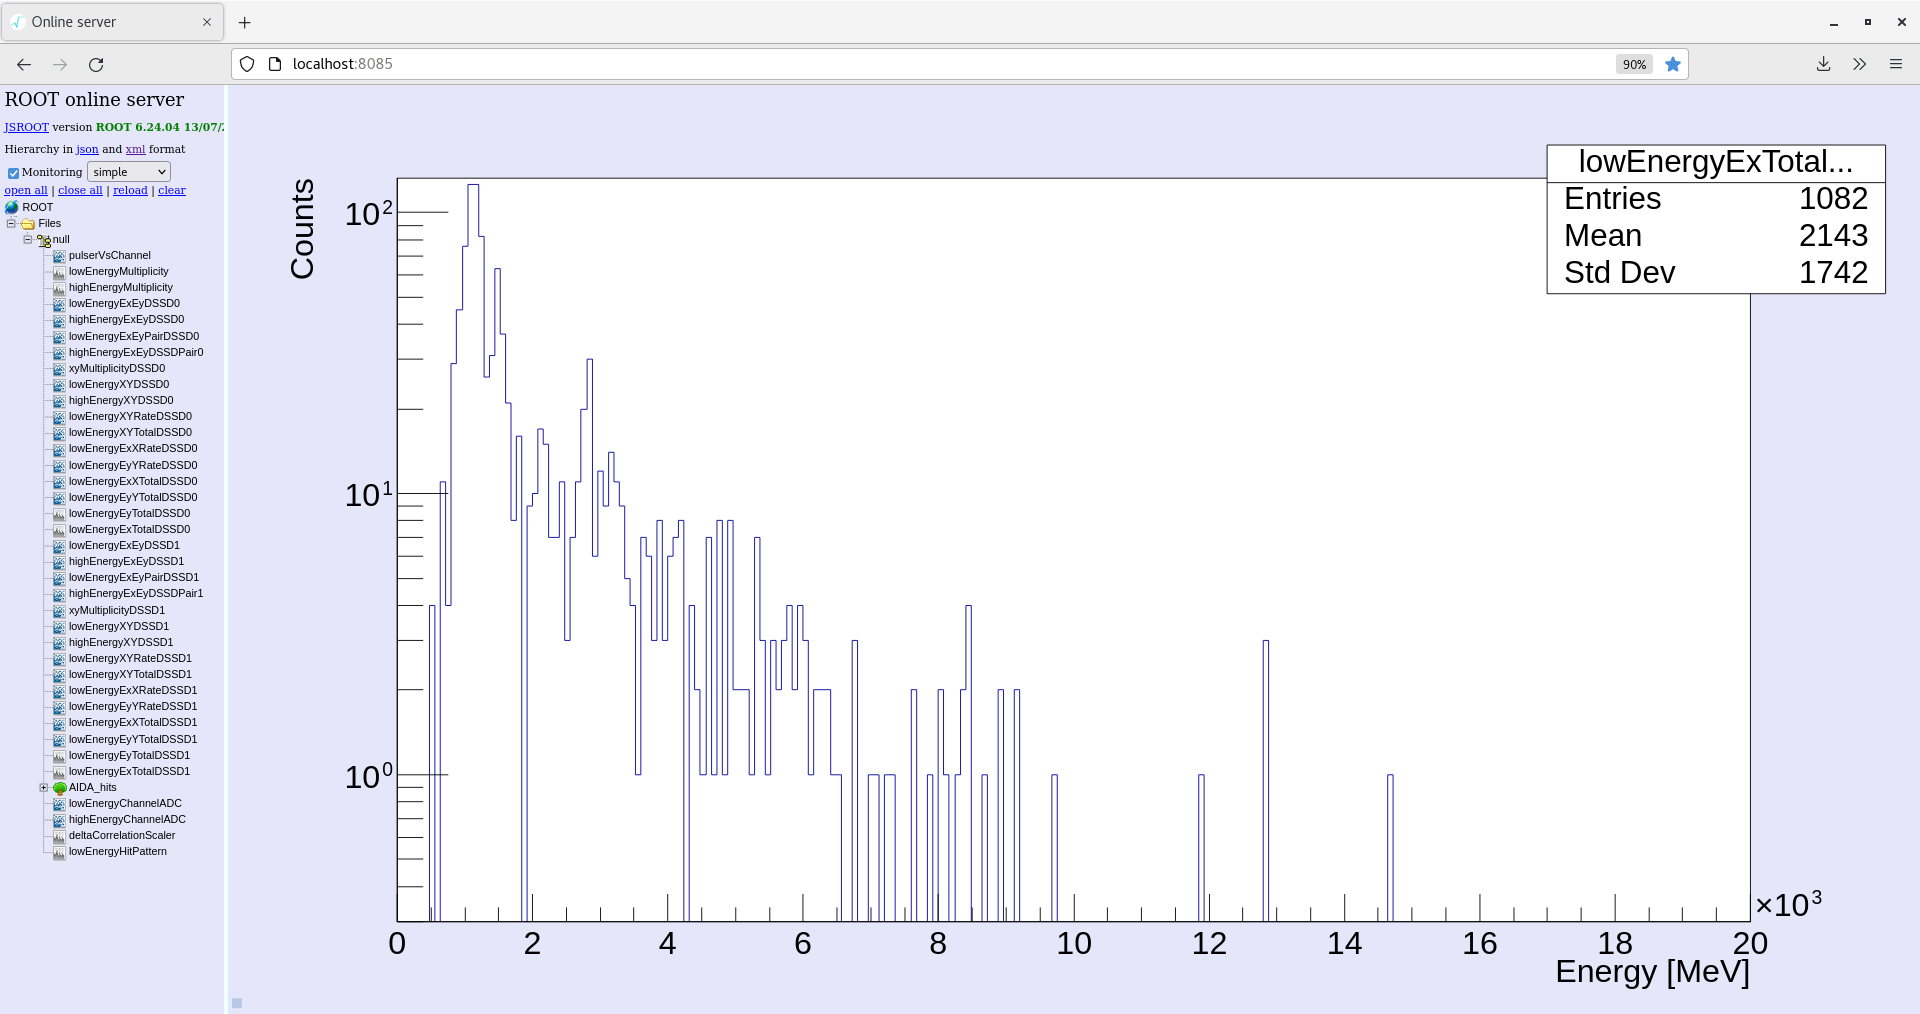
Low energy Ex histogram (attachment 4)
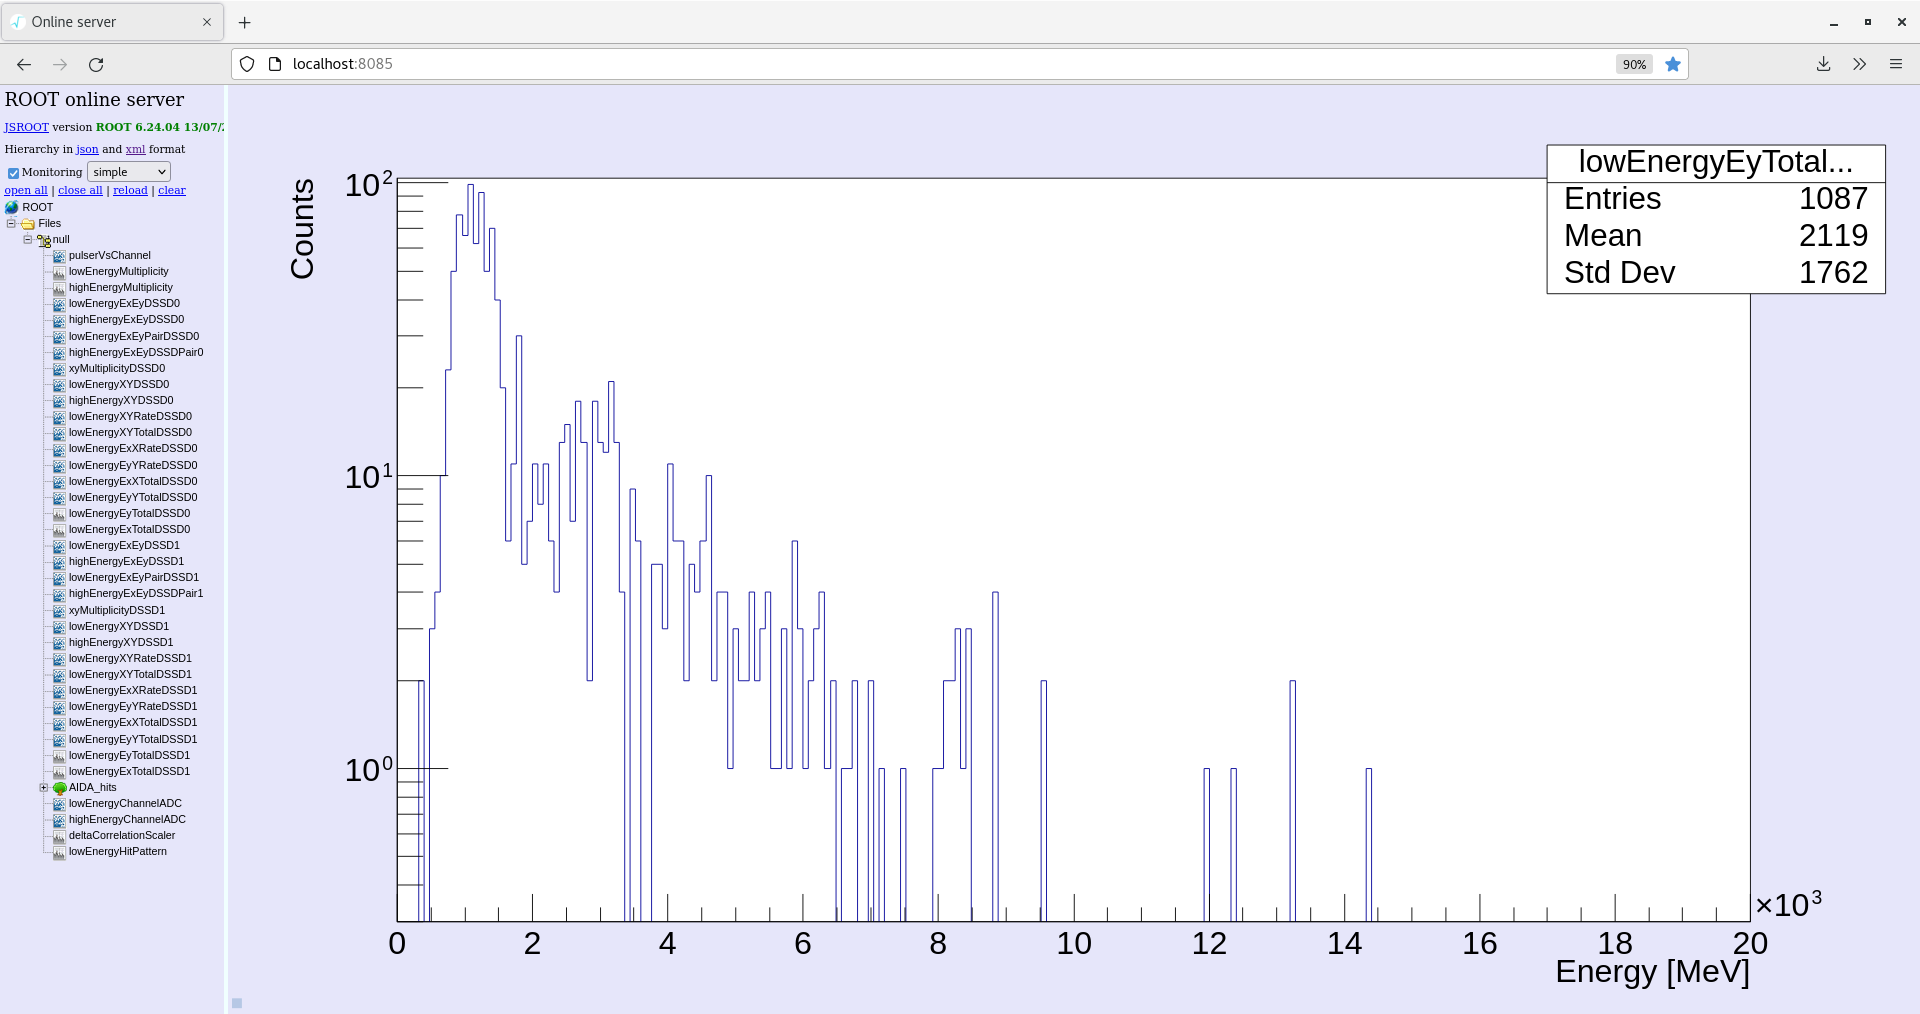
Low energy Ey histogram (attachment 5)
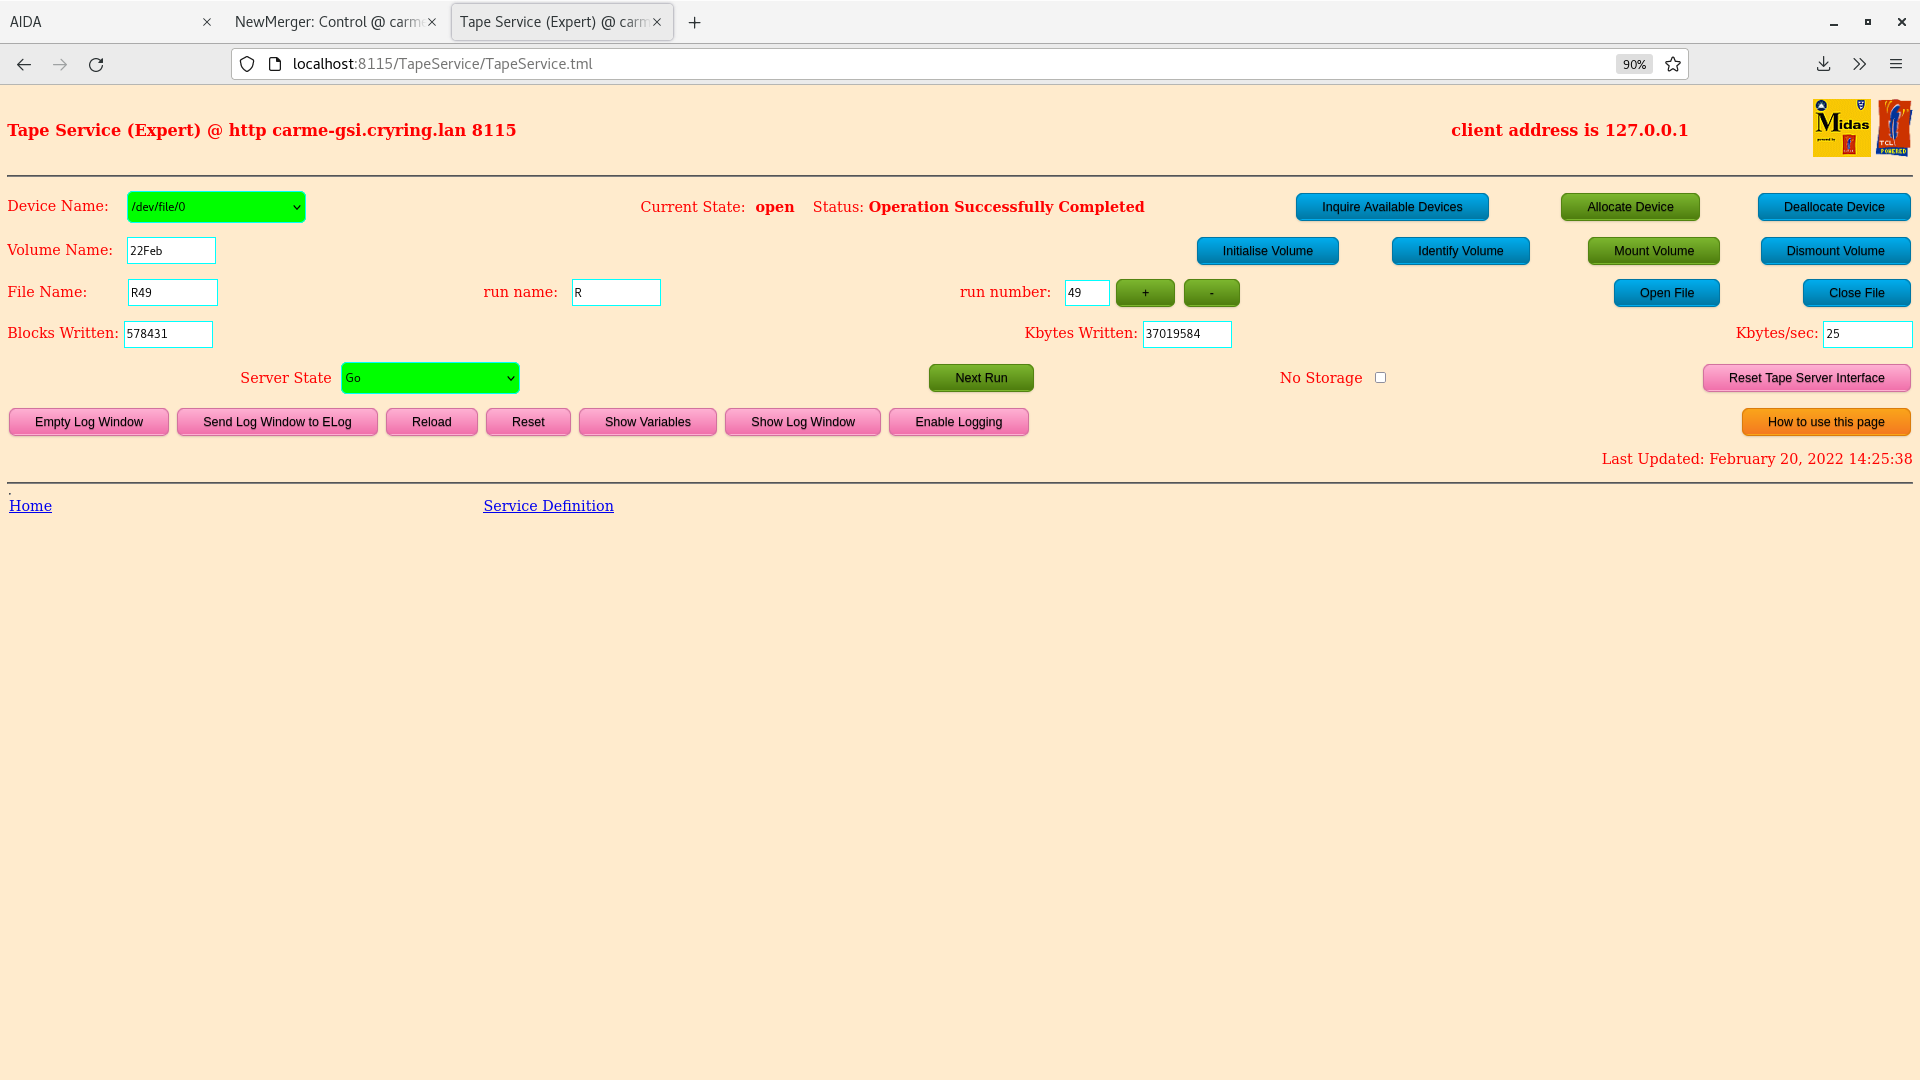
Tape Server data written (attachment 6)
Run end 20/2/22 15:08 |
| Attachment 1: 2022-02-20_14-16-16-leakage-current.png
|
|
| Attachment 2: 2022-02-20_14-18-07-statistic-ADCdata.png
|

|
| Attachment 3: 2022-02-20_14-20-43-xyTotal.png
|
|
| Attachment 4: 2022-02-20_14-24-19-LowEnergy-ExTotal.png
|
|
| Attachment 5: 2022-02-20_14-28-02-LowEnergy-EyTotal.png
|
|
| Attachment 6: 2022-02-20_14-25-45-Tape-server-data-written.png
|
|
|
214
|
Sun Feb 20 22:04:21 2022 |
JM, CB | Alpha Background run 50 |
Beam OFF. Run started 20/2/22 18:42
Fast comparator threshold HEC set to 0xff for all fees and asics to combat high energy noise bursts.
Electron cooler scalar plugged back into aida03 ~3000 per sec.
System checck OK, except white rabbit all fail
Temperatures OK
Leakage current 3.638 uA.
Statistics rates in noraml range, aida03 slightly higher as expected with scalar. |
|
402
|
Wed May 24 08:35:12 2023 |
JM, CB | Strain reliefs (detector side) installed |
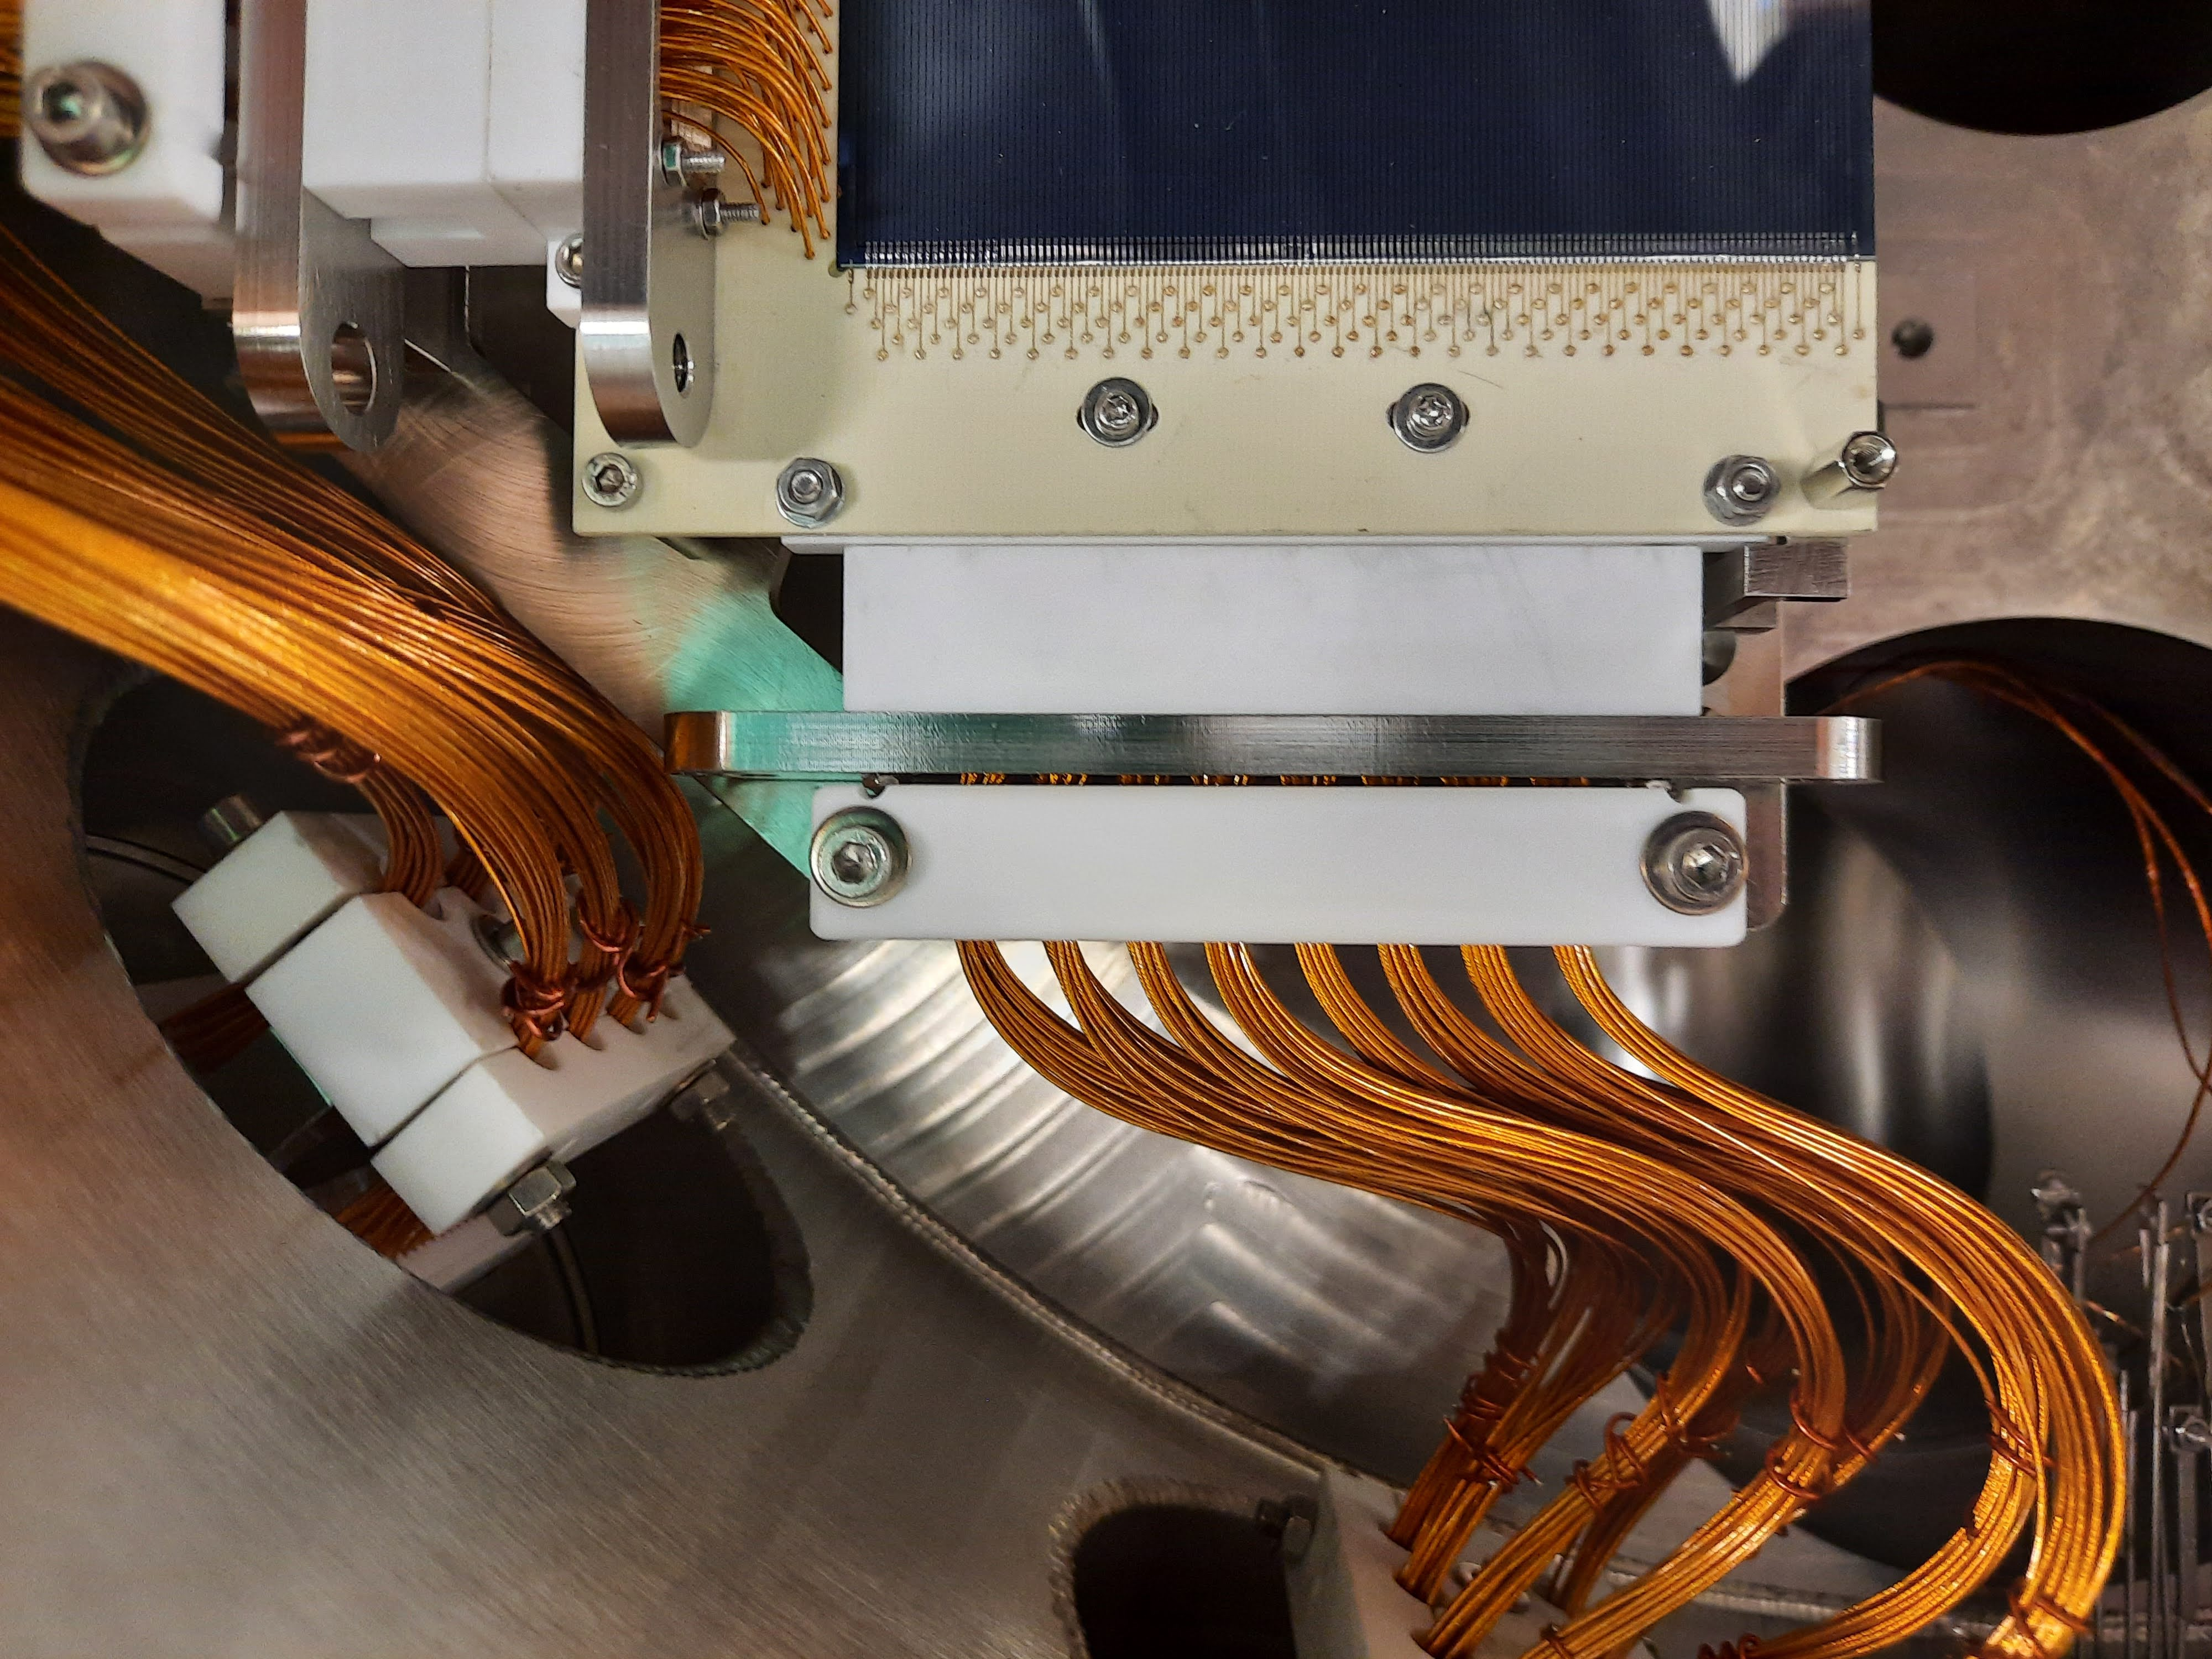
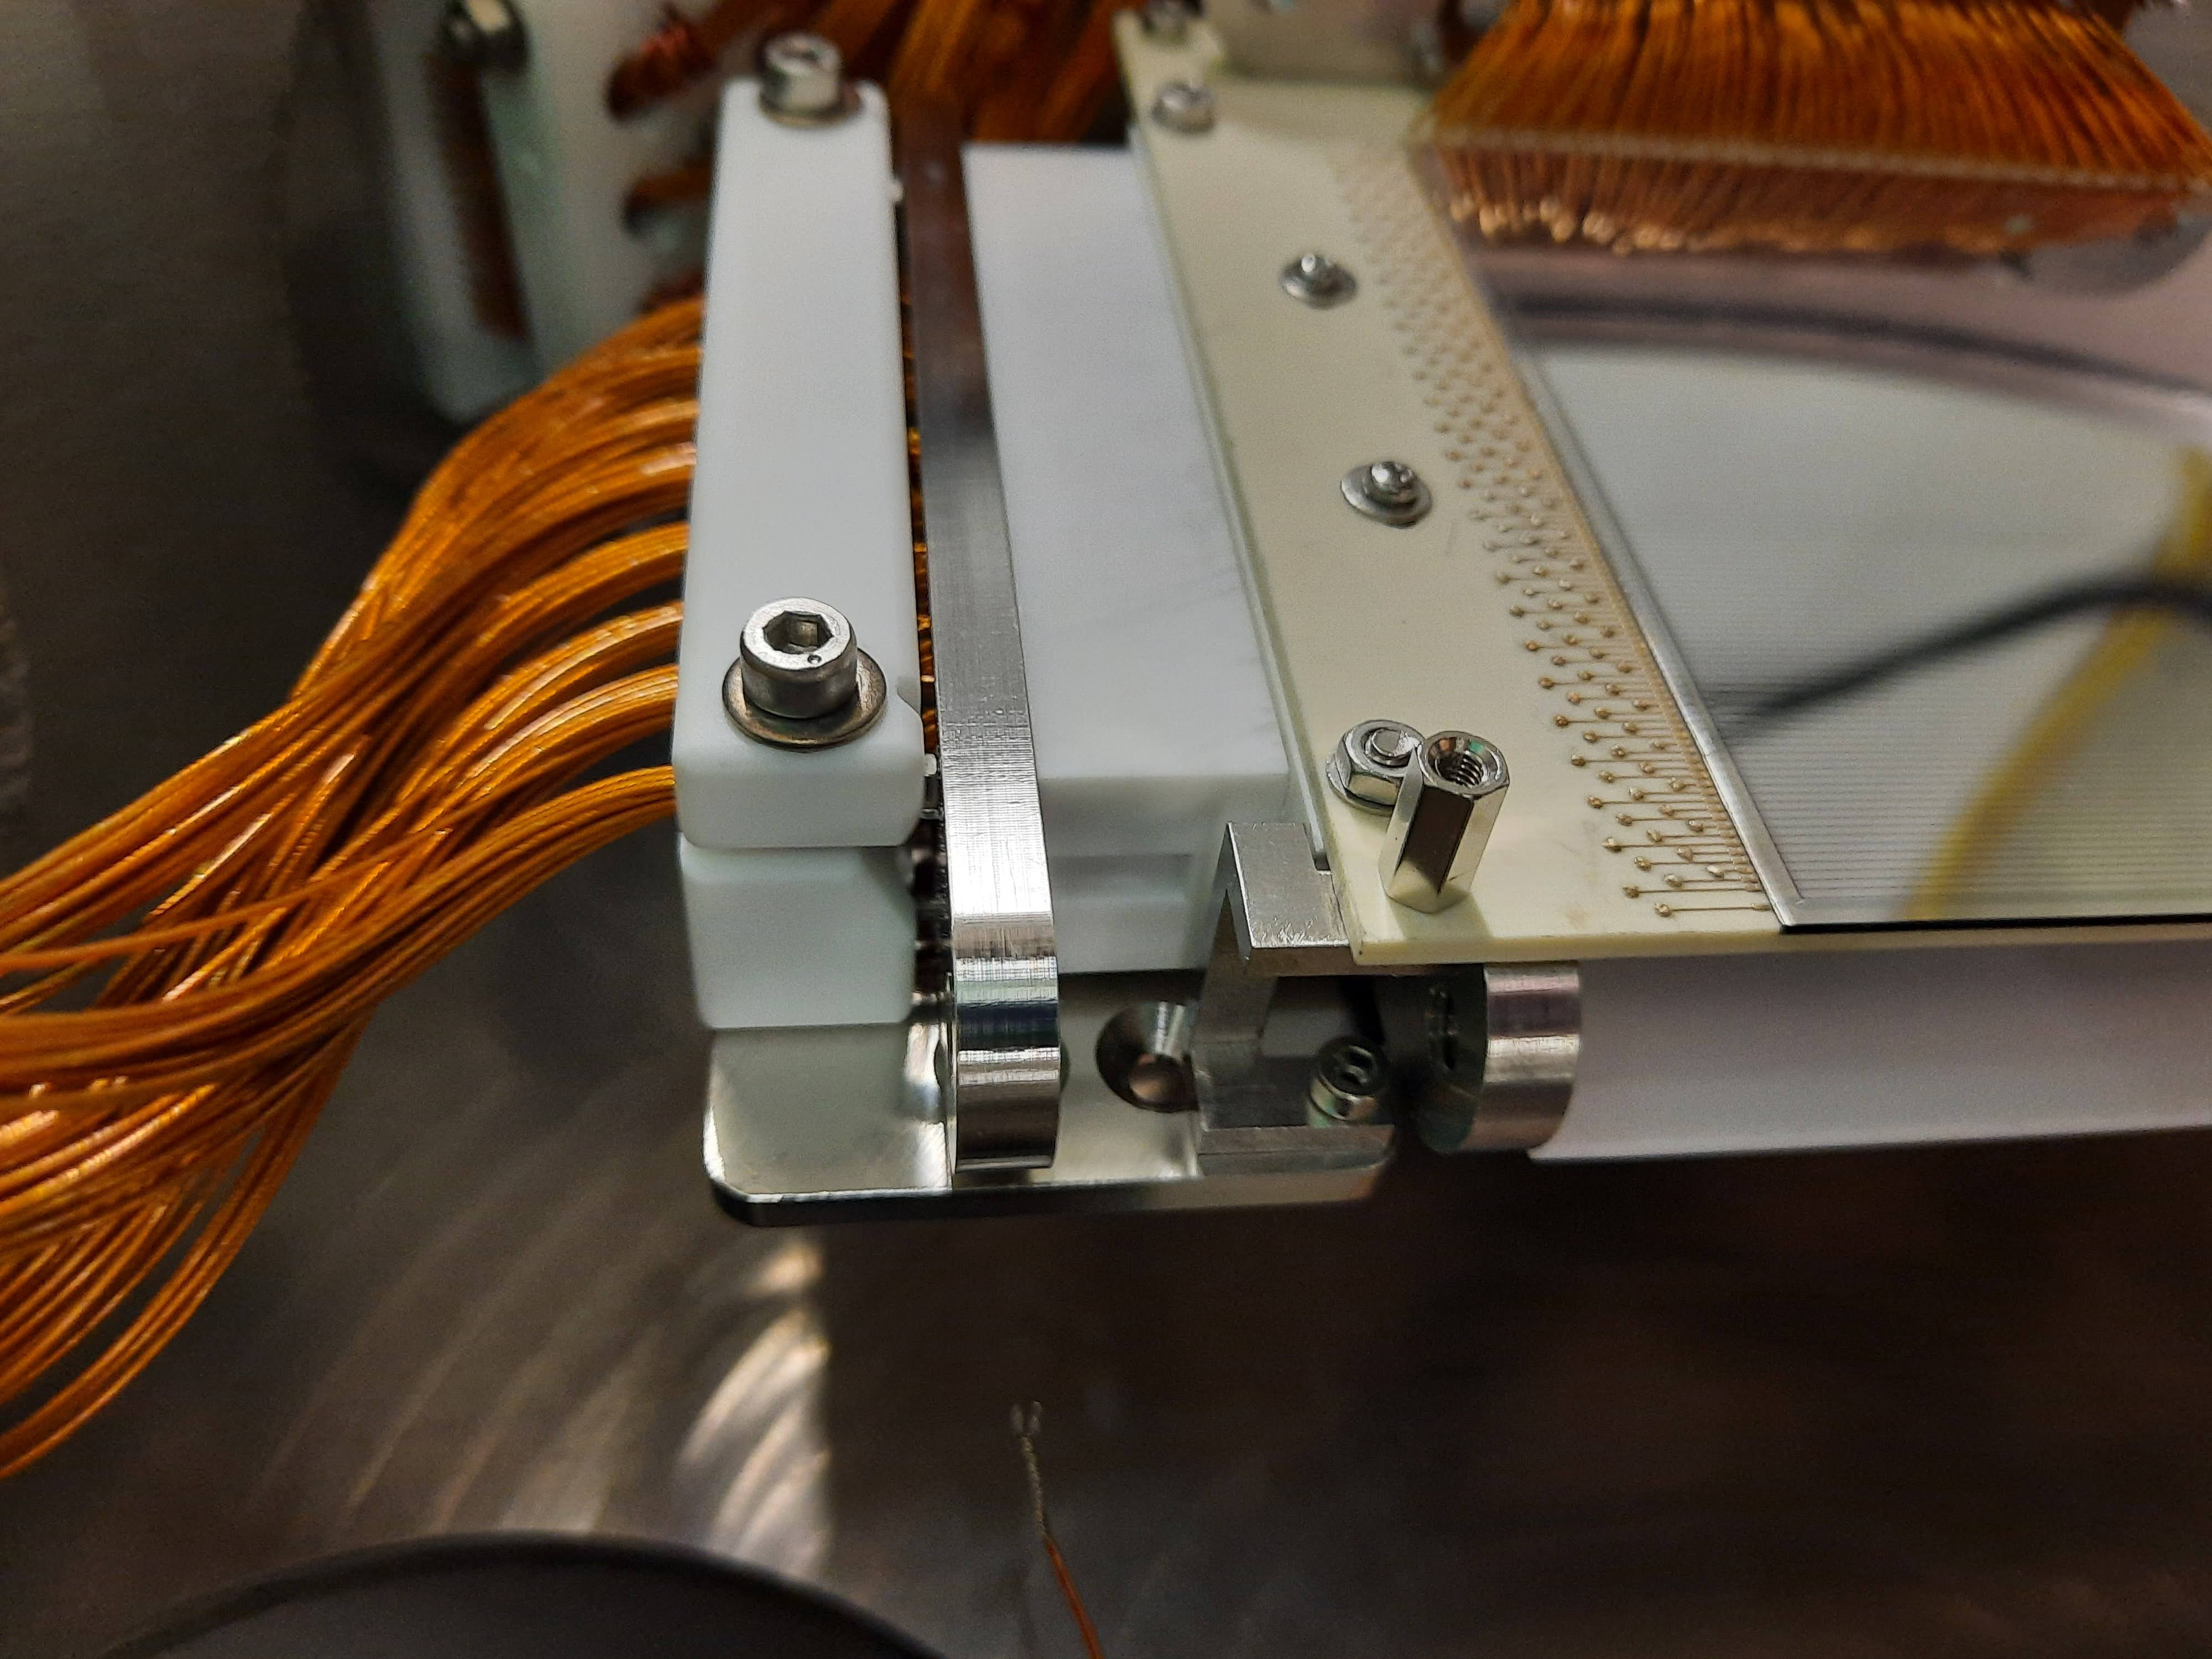
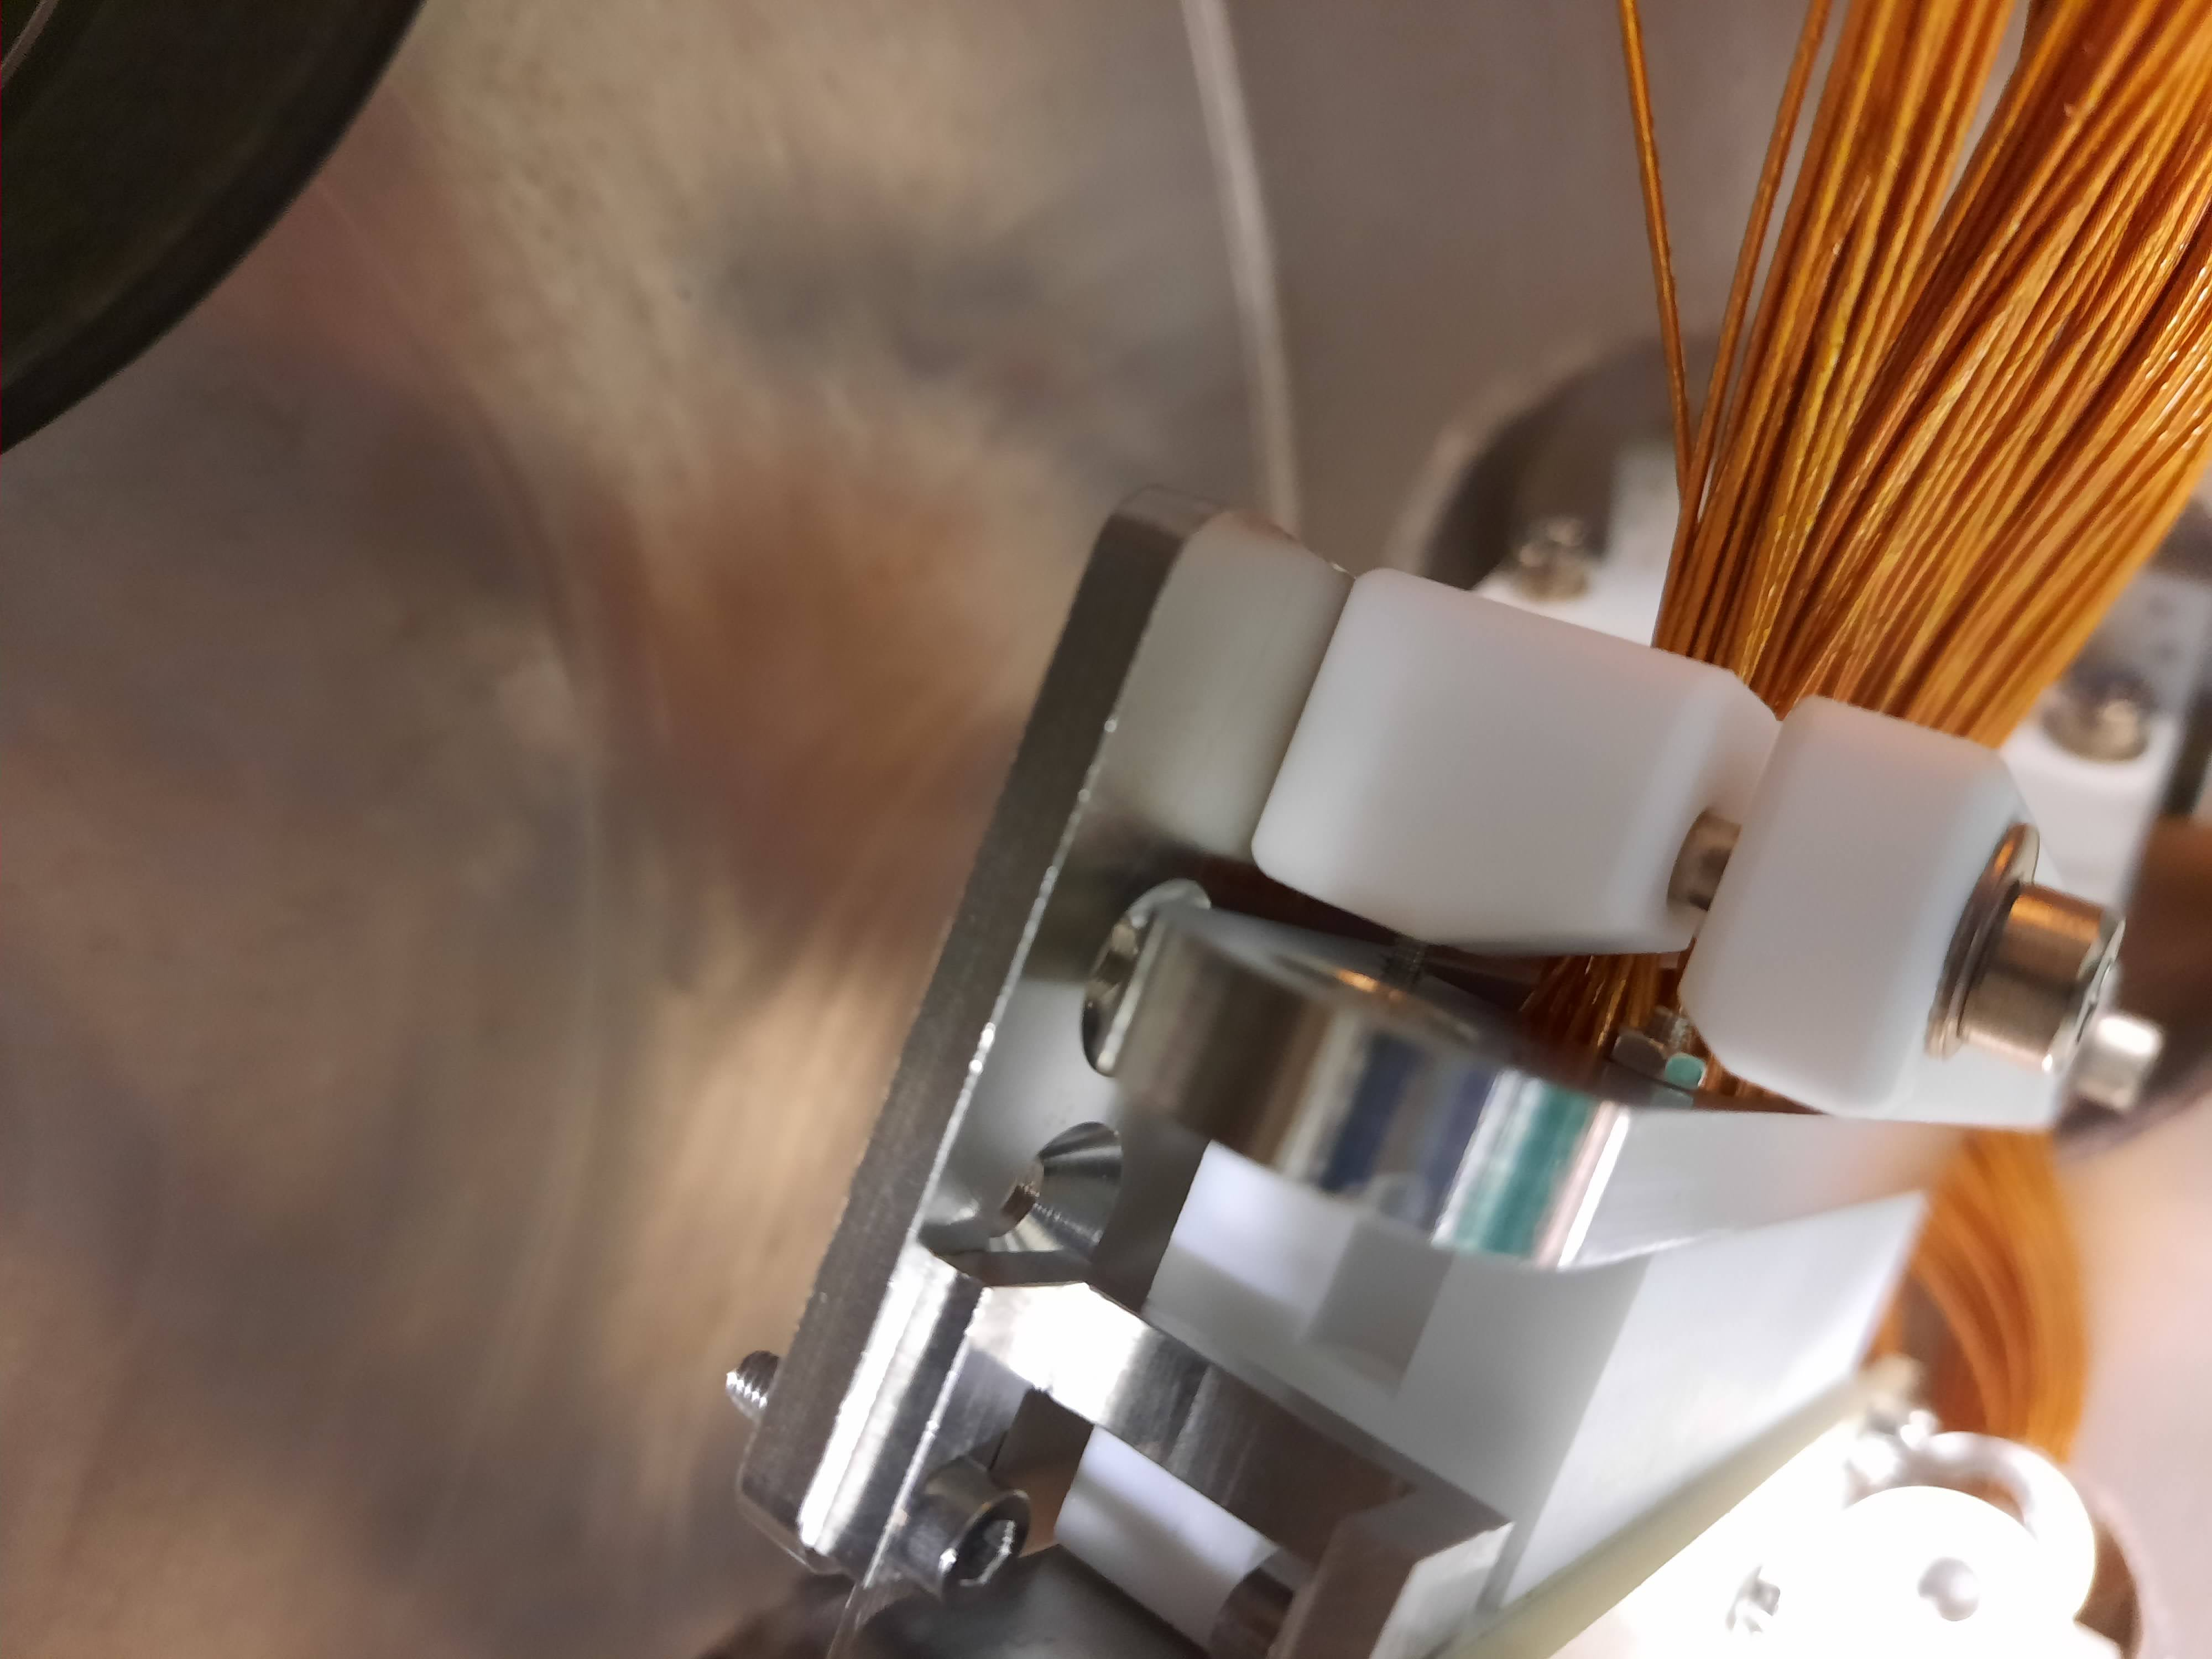
The new MACOR strain reliefs on the (detector side) have been installed. See attached photos
The two pieces of MACOR are not fully closed but we are confident that the kapton wires are sufficiently clamped.
In order for the strain reliefs to be installed in the correct poisition, two nuts on the jacking plate of the cable harness had to be removed. This is as the groove in the strain relief was not deep enough to accomadate the nut.
Attached is also a video of the wires (not) moving with the strain reliefs mounted |
| Attachment 1: 20230524_092010.jpg
|
|
| Attachment 2: 20230524_092017.jpg
|
|
| Attachment 3: 20230524_092101.jpg
|

|
| Attachment 4: 20230524_093000.jpg
|
|
| Attachment 5: 20230524_092159.mp4
|
|
403
|
Wed May 24 09:54:56 2023 |
JM, CB | Maximum detector positions |
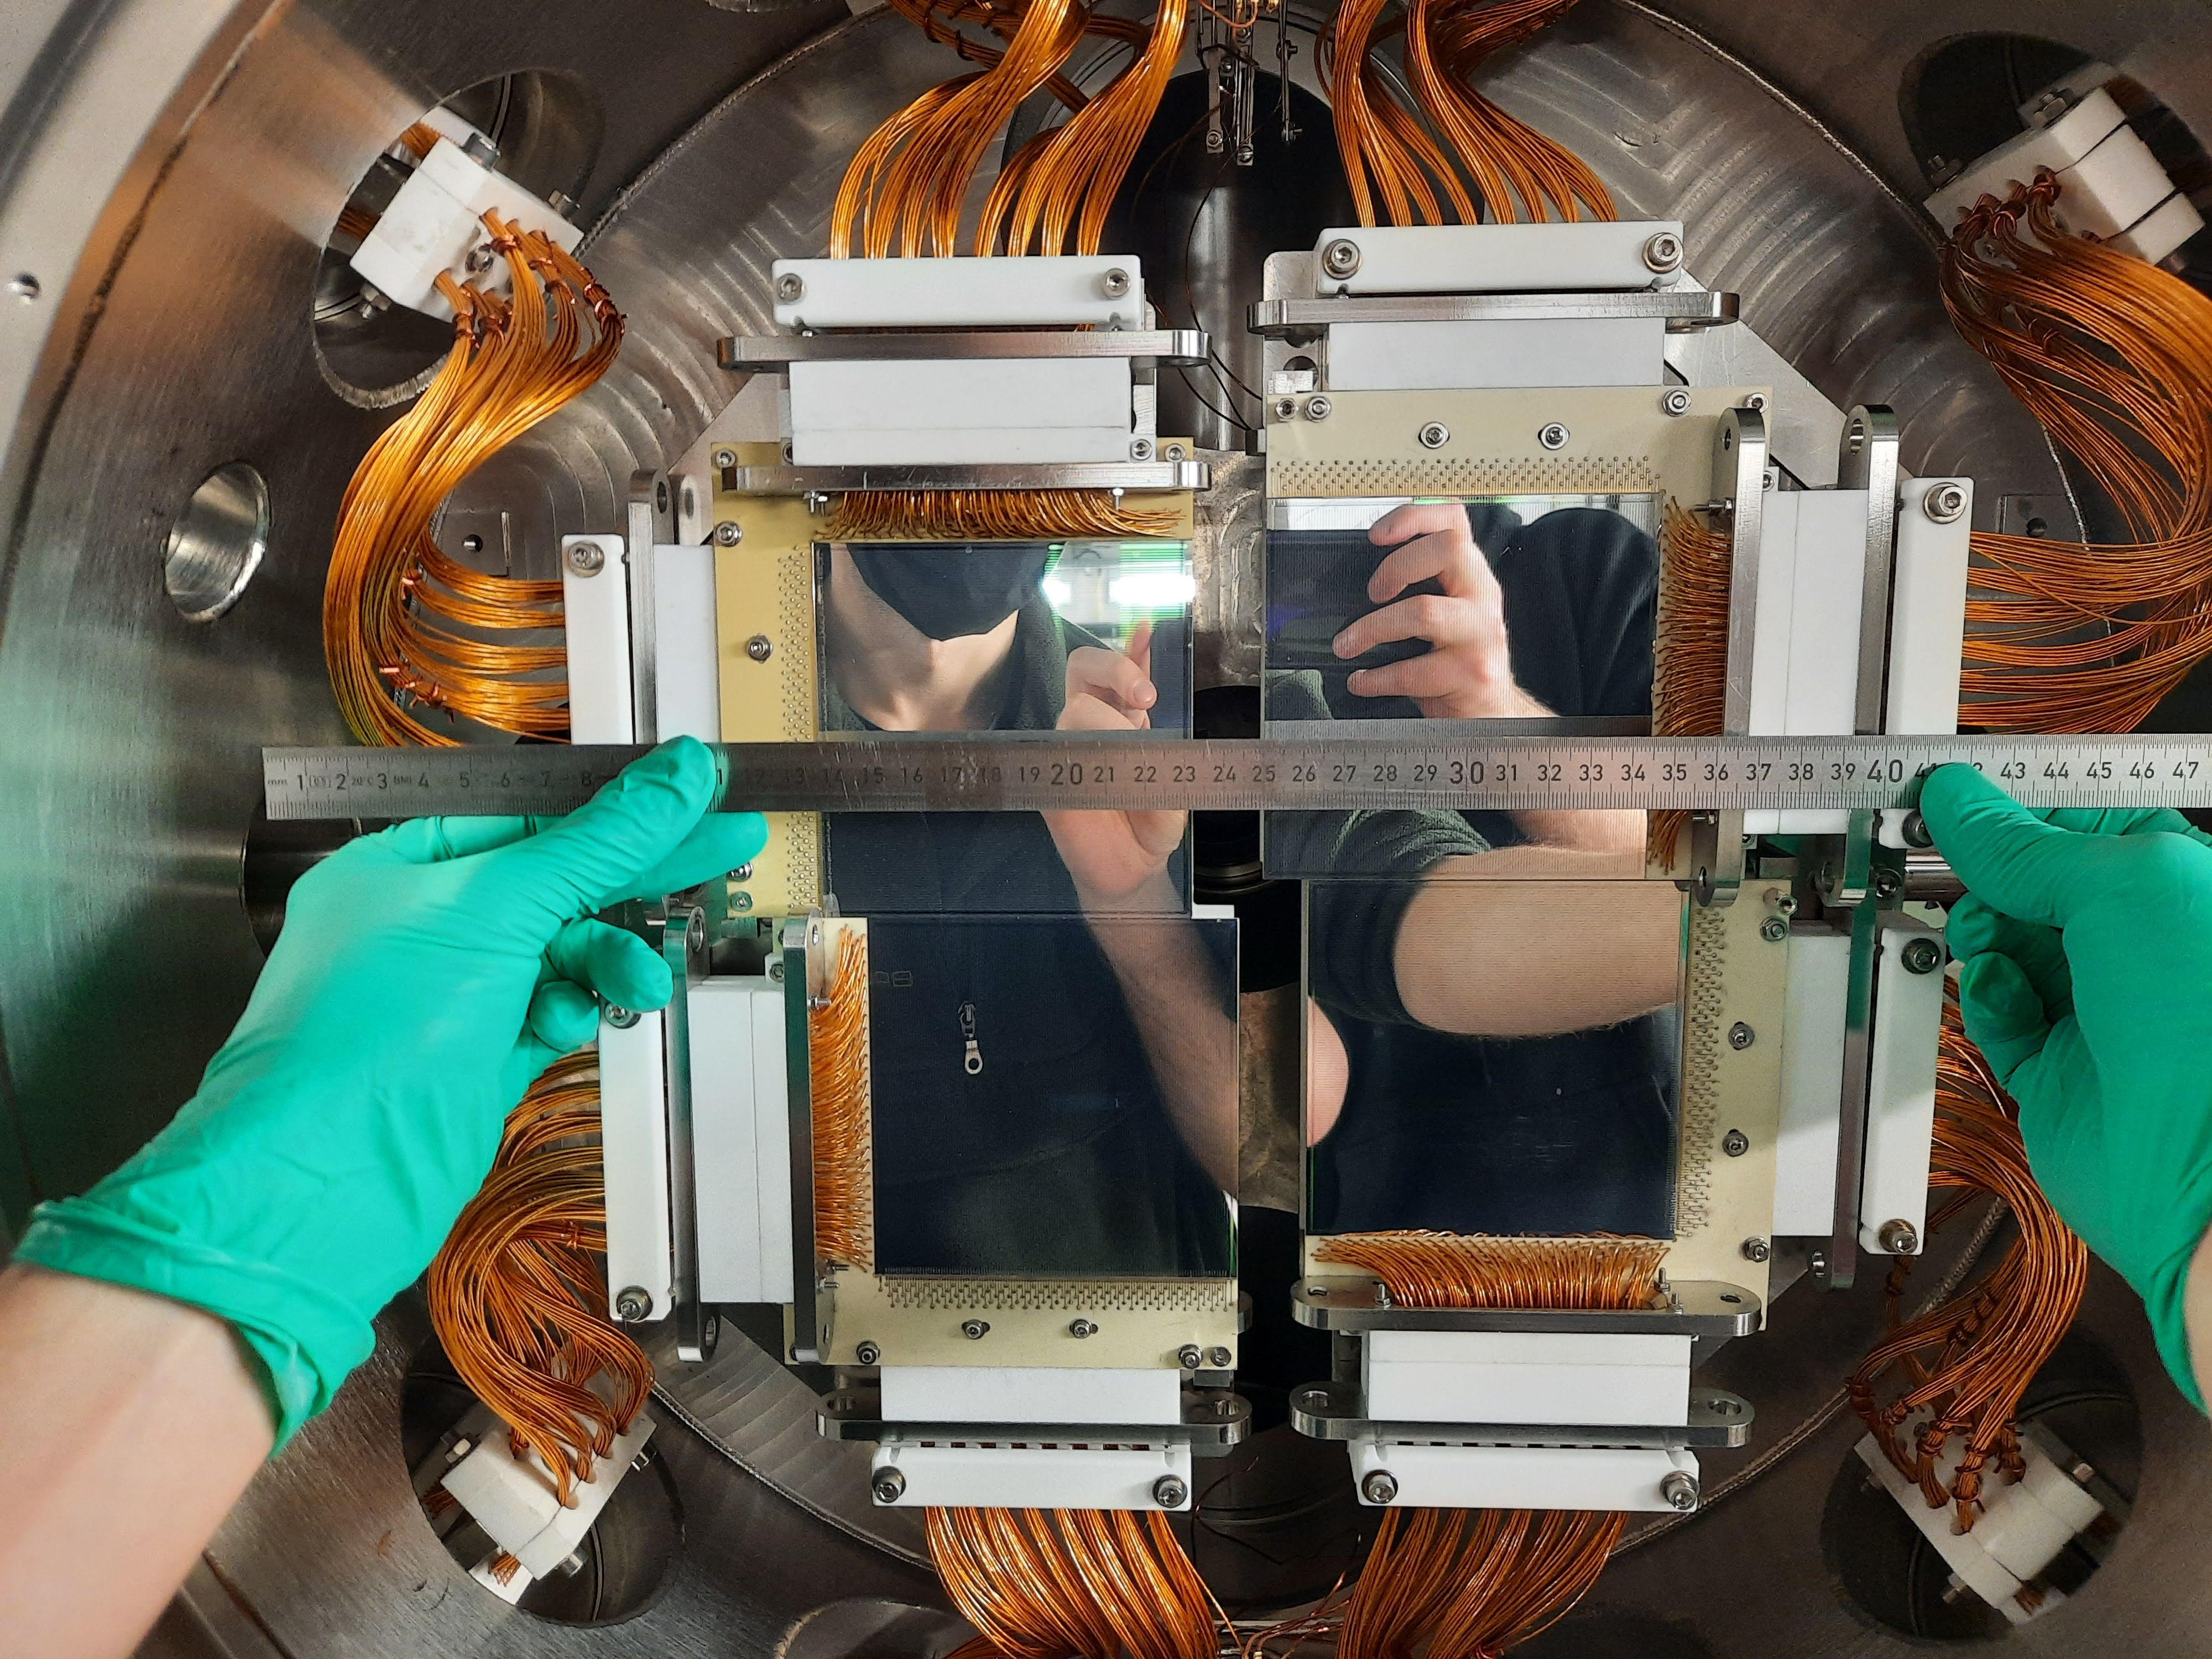
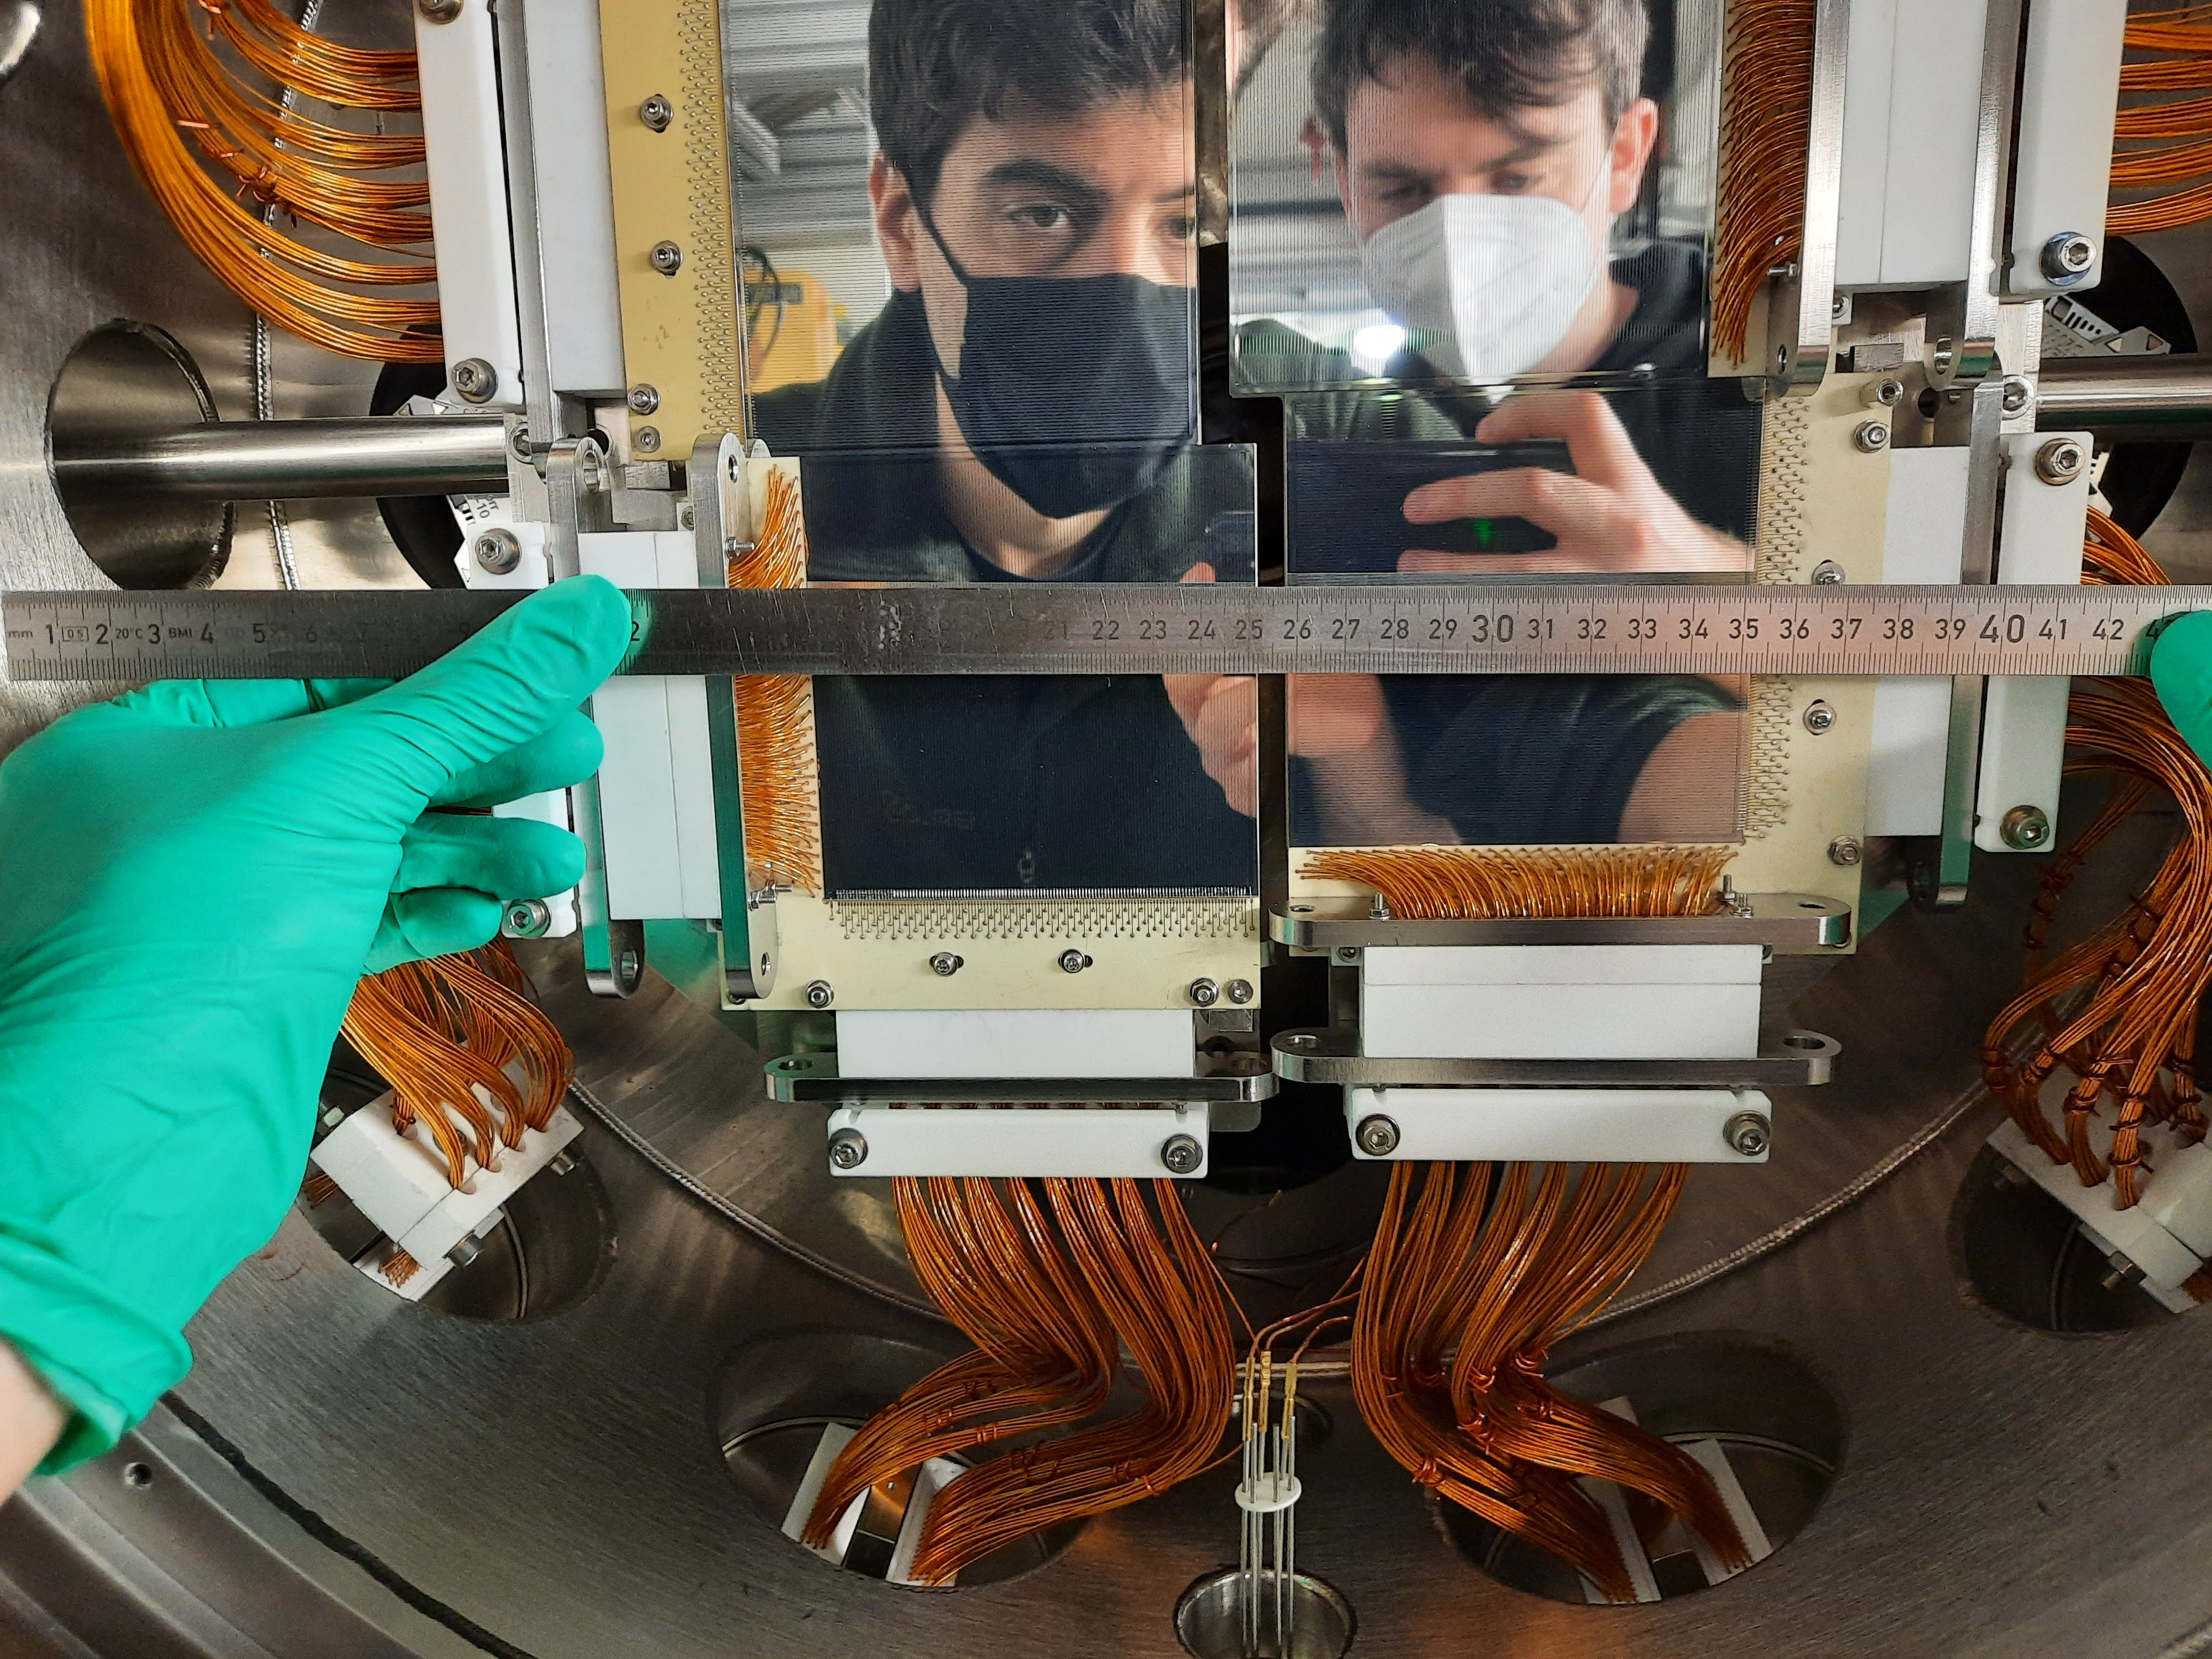
The detectors were moved into the beam axis using the motors to check the maximum distance they can be moved in without collision with one another.
Movement of both pneumatic motors results in a separation of ~ 4 cm between the detectors.
The servo motors for left and right were each moved in by 1 cm -> results in separation of 2 cm between the detectors
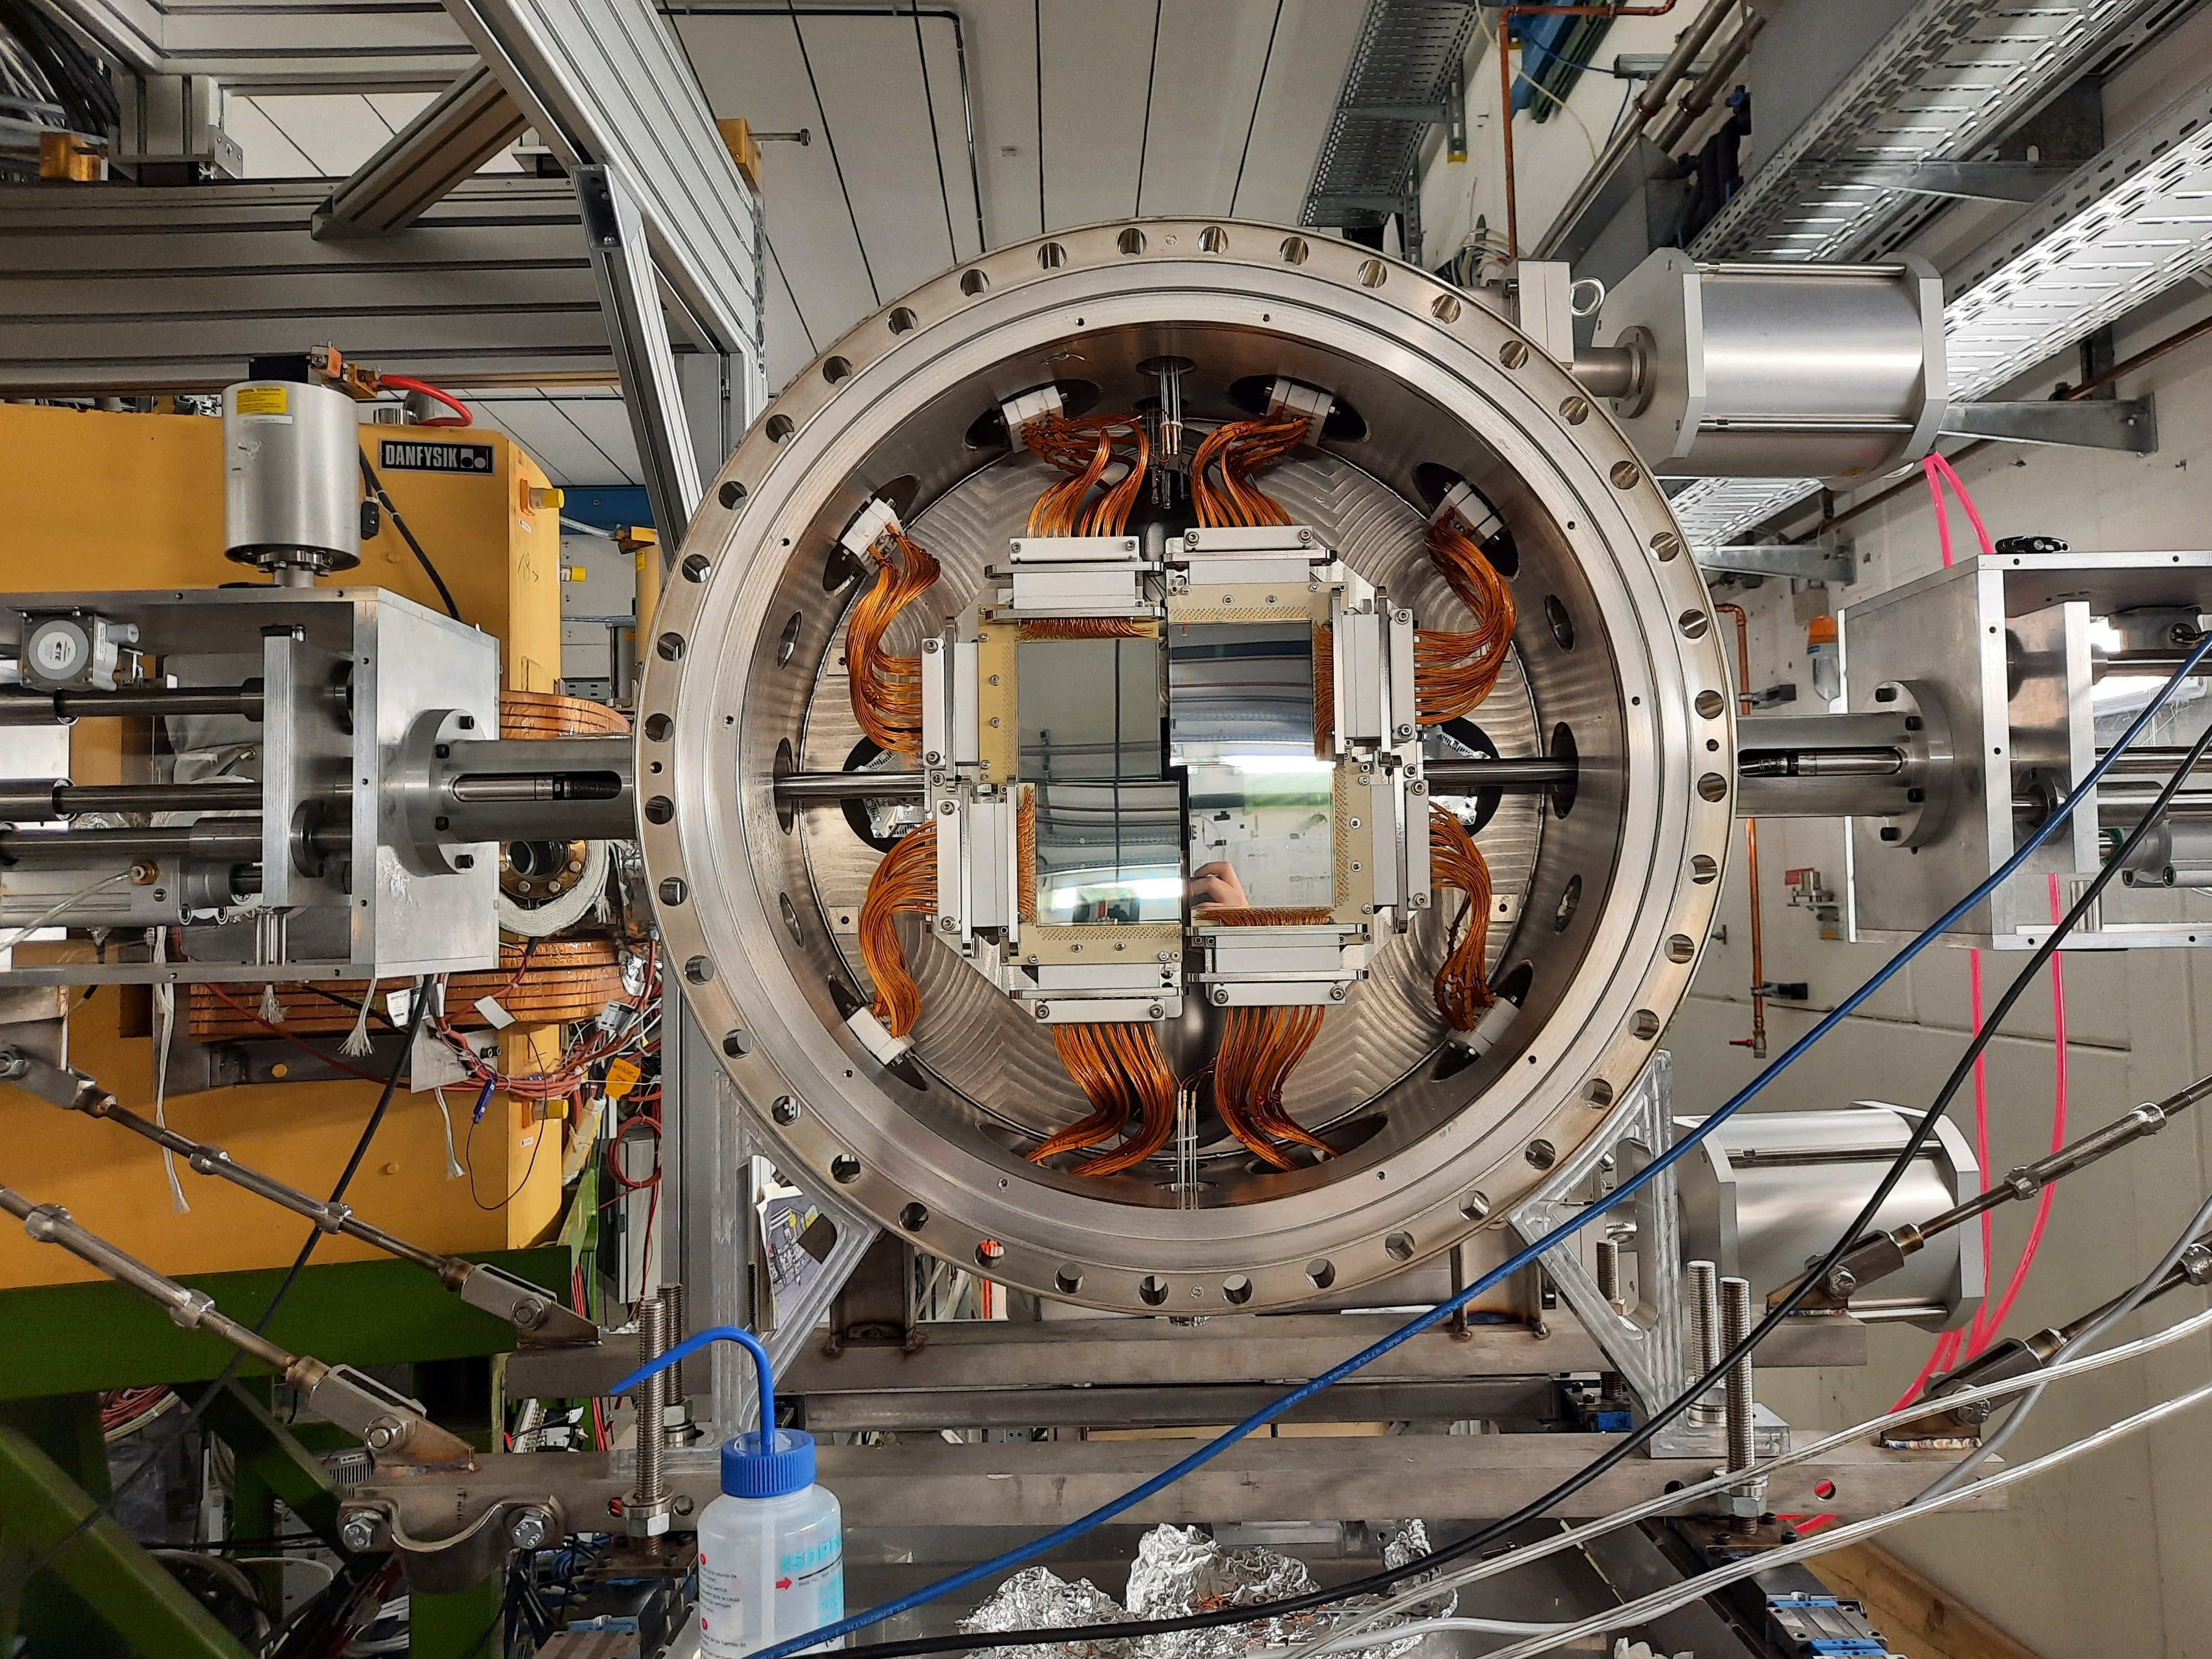
The servo motors for left and right were then each moved in by 5 mm -> results in separation of 1 cm between the detectors
The separation between the jacking plate of one of the detectors and the side of the adjacent detectors is closer than the separation of the detector silicons. The detectors could not be moved in any further than this to avoid collisions from the jacking plate
Attached are photos after movement of the detectors. Parallax may affect the distance on the ruler in the photos.
During beam time -> Maximum distance that can be moved on the servo motors is 30 mm combined for left and right. (15 mm left and right or 10 mm left, 20mm right etc)
|
| Attachment 1: pneumatic-in.jpg
|

|
| Attachment 2: pneumatic-in2.jpg
|

|
| Attachment 3: pneumatic-in-servo-10mm.jpg
|
|
| Attachment 4: pneumatic-in-servo-15mm.jpg
|
|
| Attachment 5: max-in.jpg
|

|
| Attachment 6: max-in2.jpg
|
|
| Attachment 7: max-in-zoom.jpg
|

|
| Attachment 8: max-in-jacking-plate.jpg
|

|
| Attachment 9: max-in-jacking-plate2.jpg
|

|
|
404
|
Fri May 26 08:53:54 2023 |
JM, CB | Strain reliefs (flange side) installed |
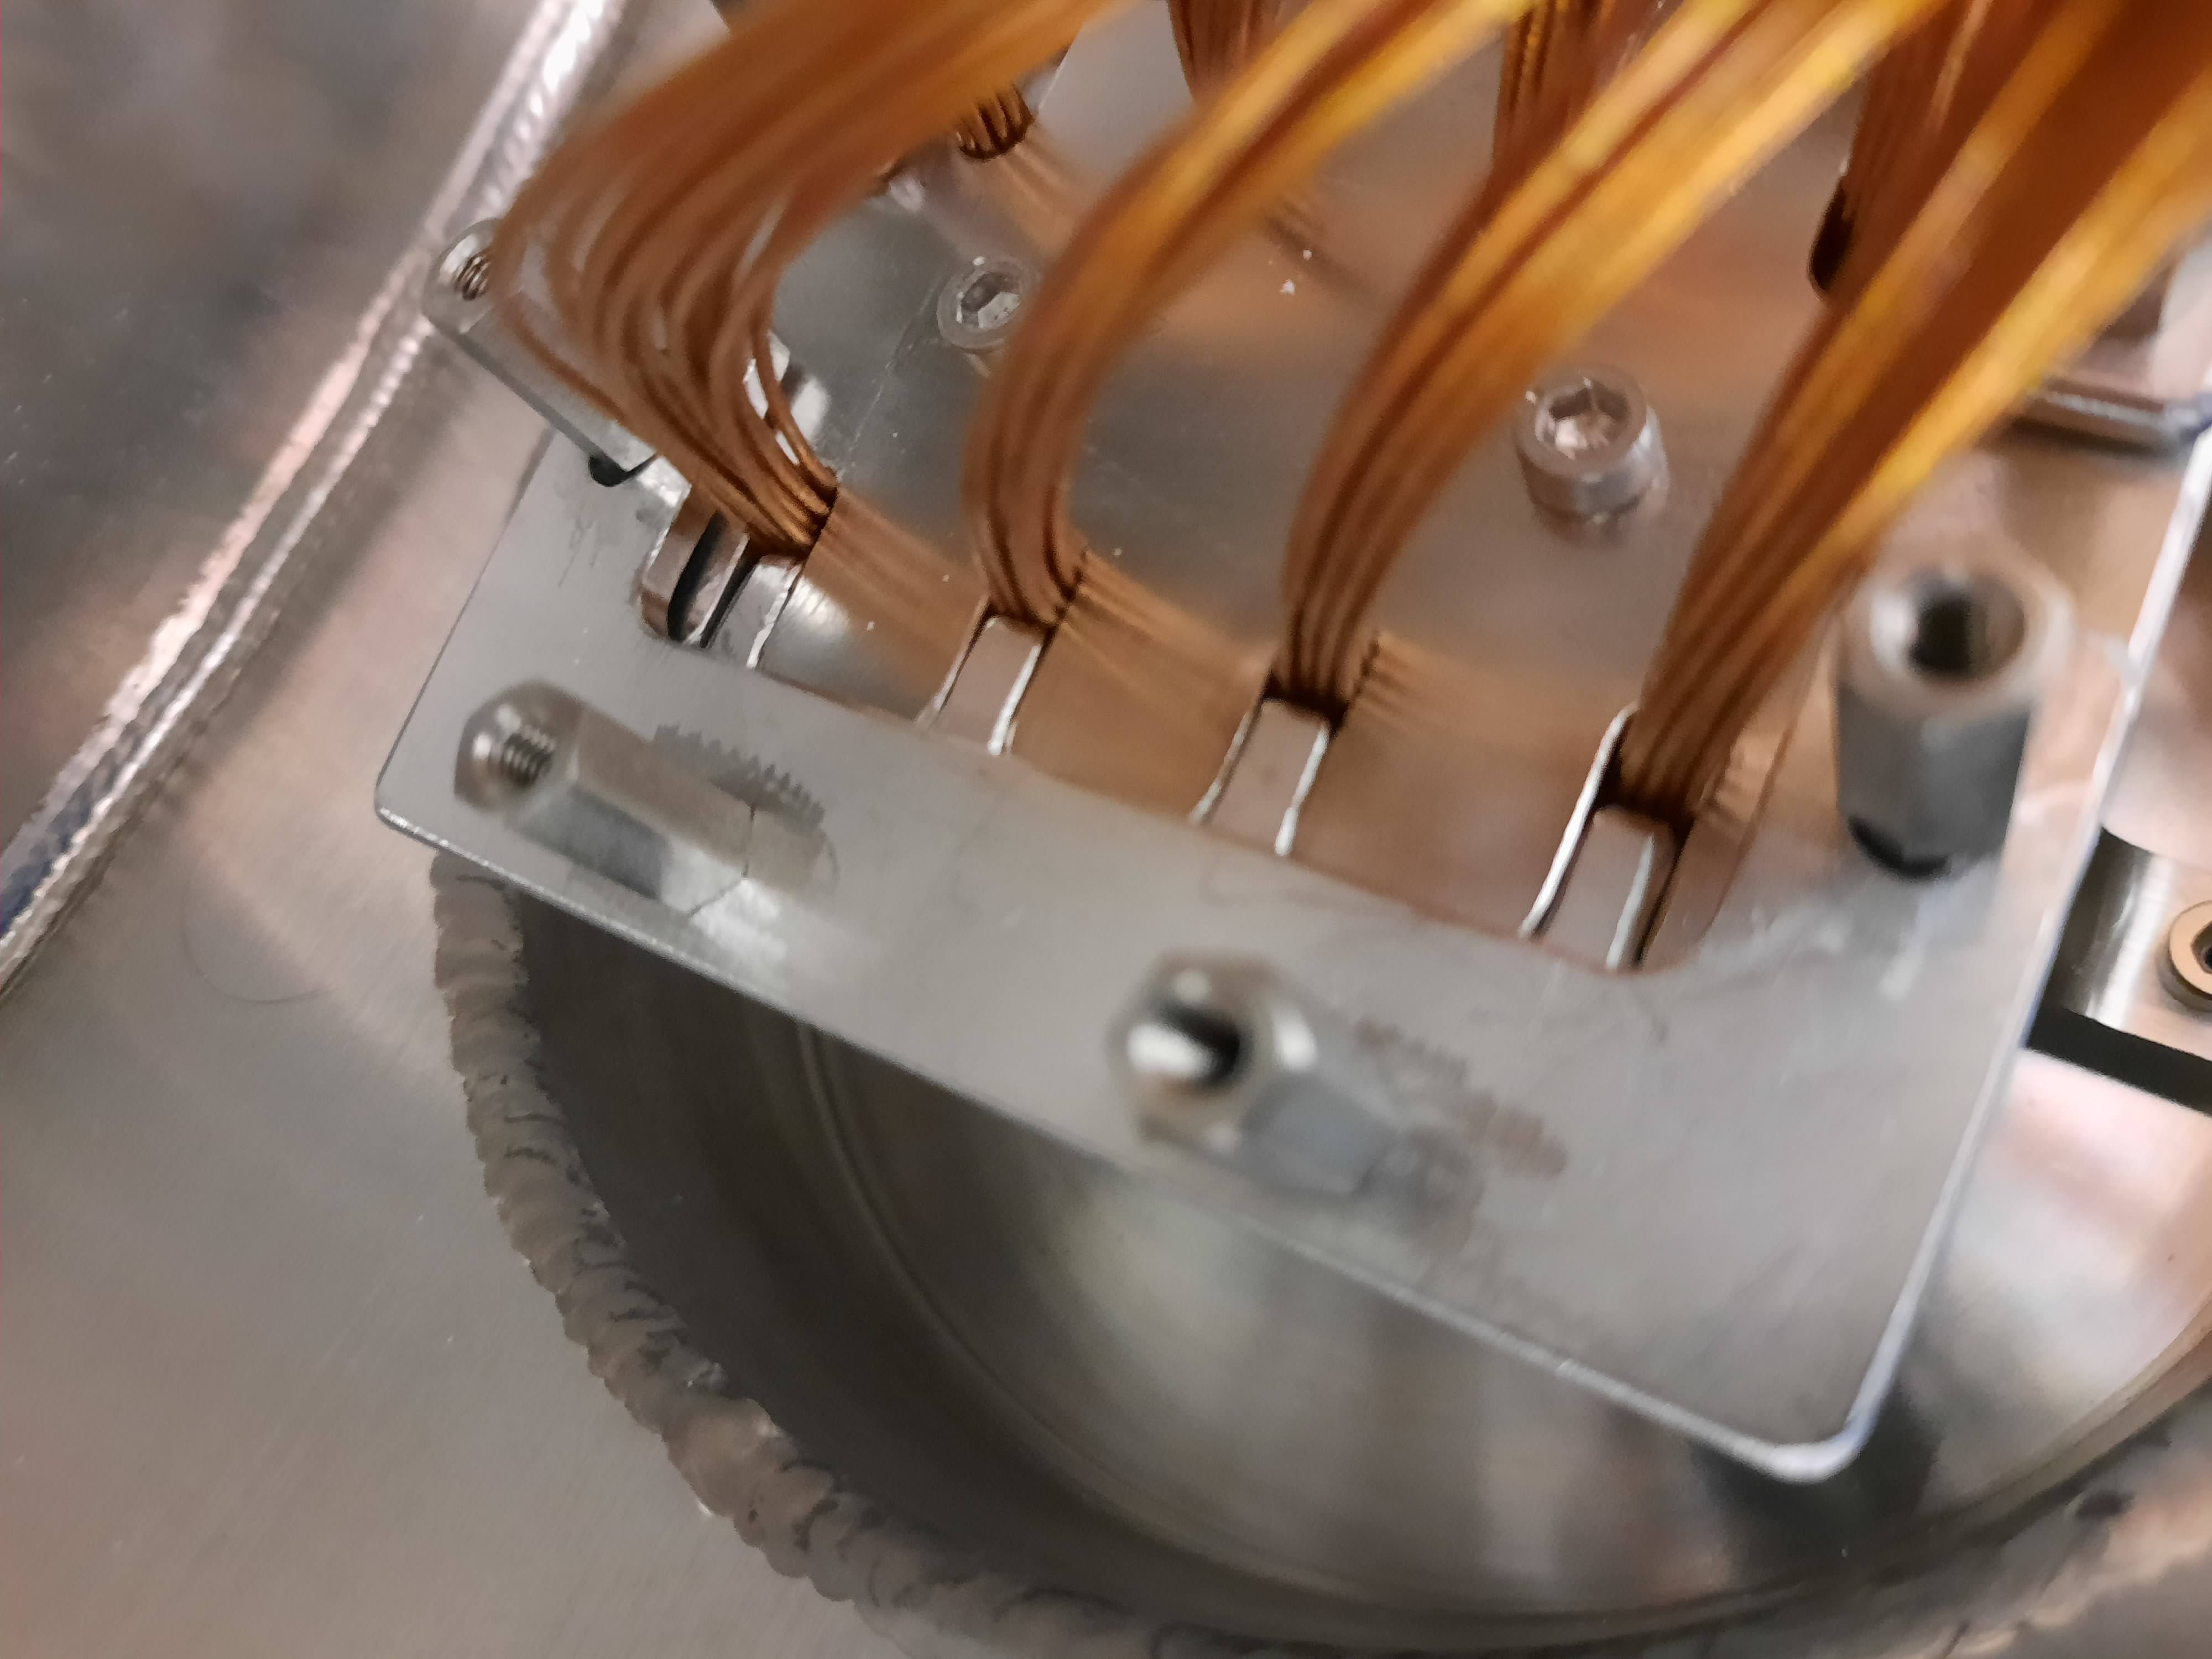
Strain reliefs on the flange side of the cable harness have been installed for two detectors (top right and bottom right detectors).
We require the strain relief parts from edinburgh in order to install strain reliefs for the left two detectors.
Find attached images for the strain relief installed and a video of the clamped cables during a movement cycle.
A V-I test was performed for the two detectors which have all strain reliefs installed (see attachment 4). V-I curve appears similar to the previous test (elog 398). Aluminium foil shield is now a bit battered so may have some small light leaks. Detectors were moved using the motors while bias was applied at 150V. Small change in leakage current observed (~0.01-0.02 uA) |
| Attachment 1: strain-relief-flange-side.jpg
|

|
| Attachment 2: strain-relief1_(1).mp4
|
| Attachment 3: 20230526_140923.jpg
|
|
| Attachment 4: V-I-plot.png
|

|