| ID |
Date |
Author |
Subject |
|
138
|
Sun Oct 31 13:55:13 2021 |
CB OH | Leak tests |
Found CARME at 2E-7.
Closed valve on top of roughing pump. Clamp was not tight. Pressure still good.
Connected to leak cart instead. Brought leak cart to 1E-2. Did not open valve yet. Found CARME pressure at 7.5 mbar. Leak in the backing line? Unclear what happened but moving backing line flexible hose increases pressure. Tightened all clamps. Moving backing flexible hose no longer seems to have effect.
Pumping down again for leak tests. Turbo looks and sounds fine.
Recovered E-6 in few minutes. Reconnected leak cart. Pressure does not increase. Still not sure what happened earlier. Beginning leak tests.
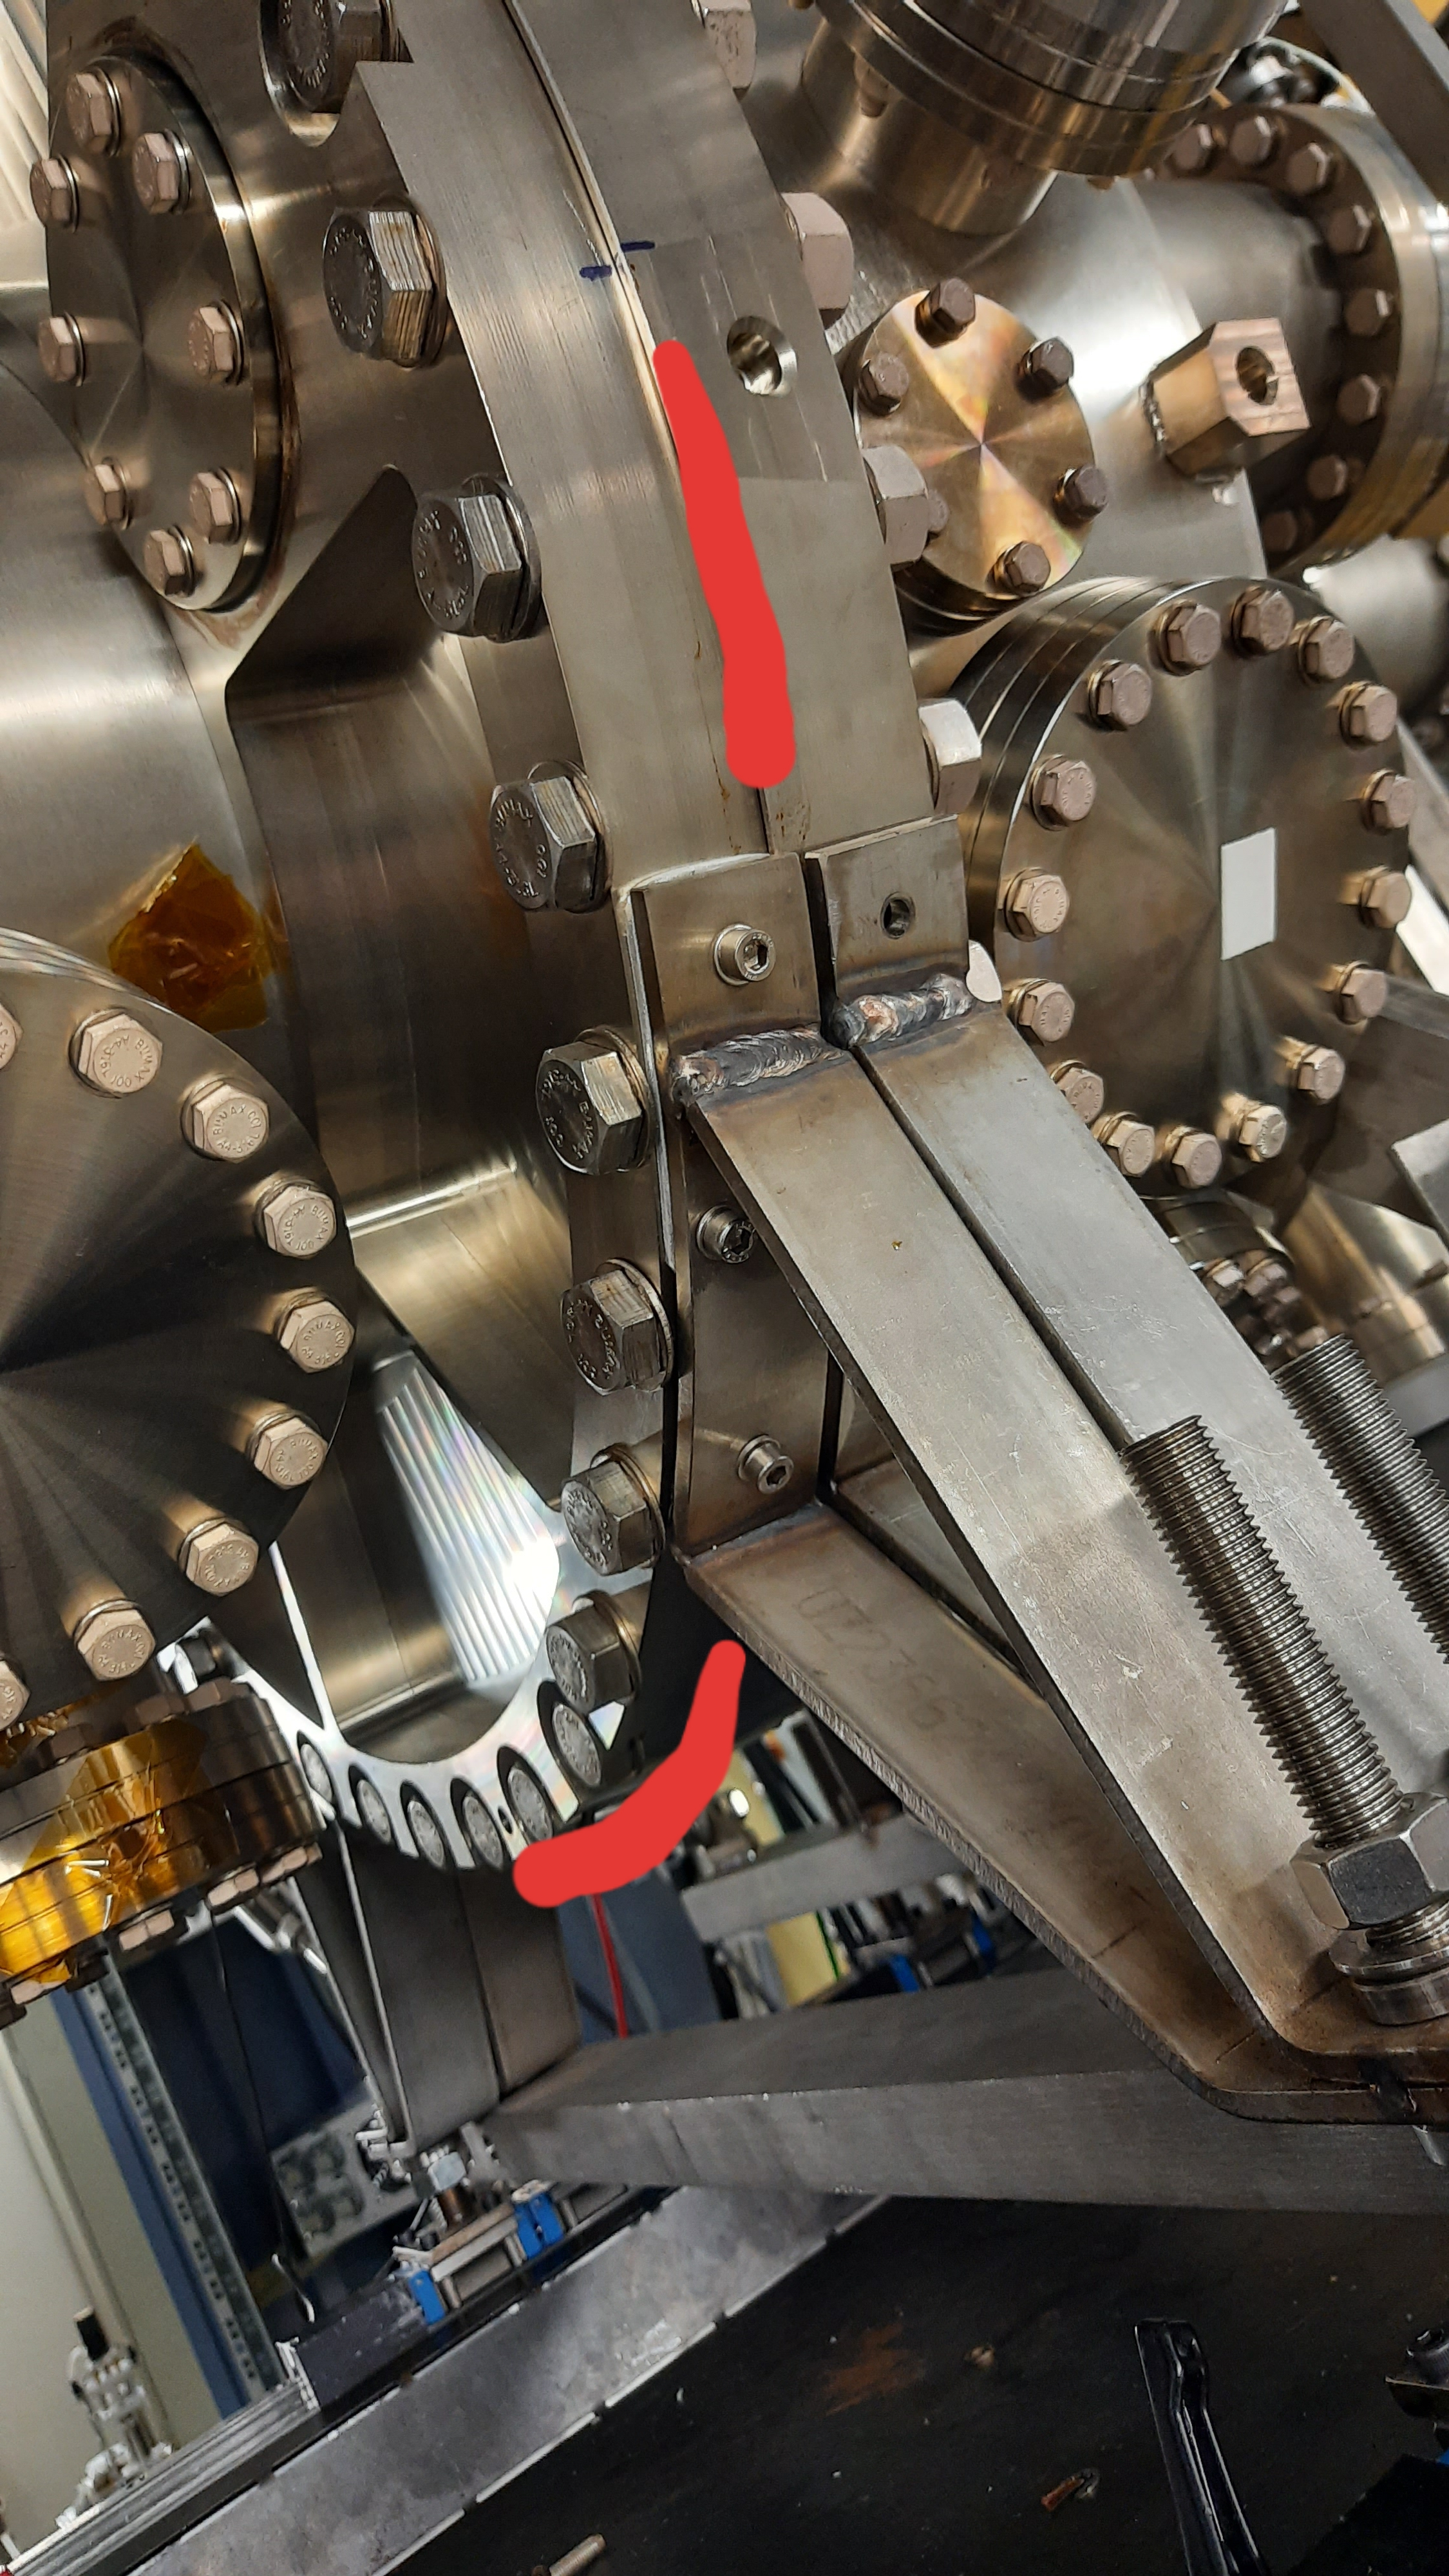
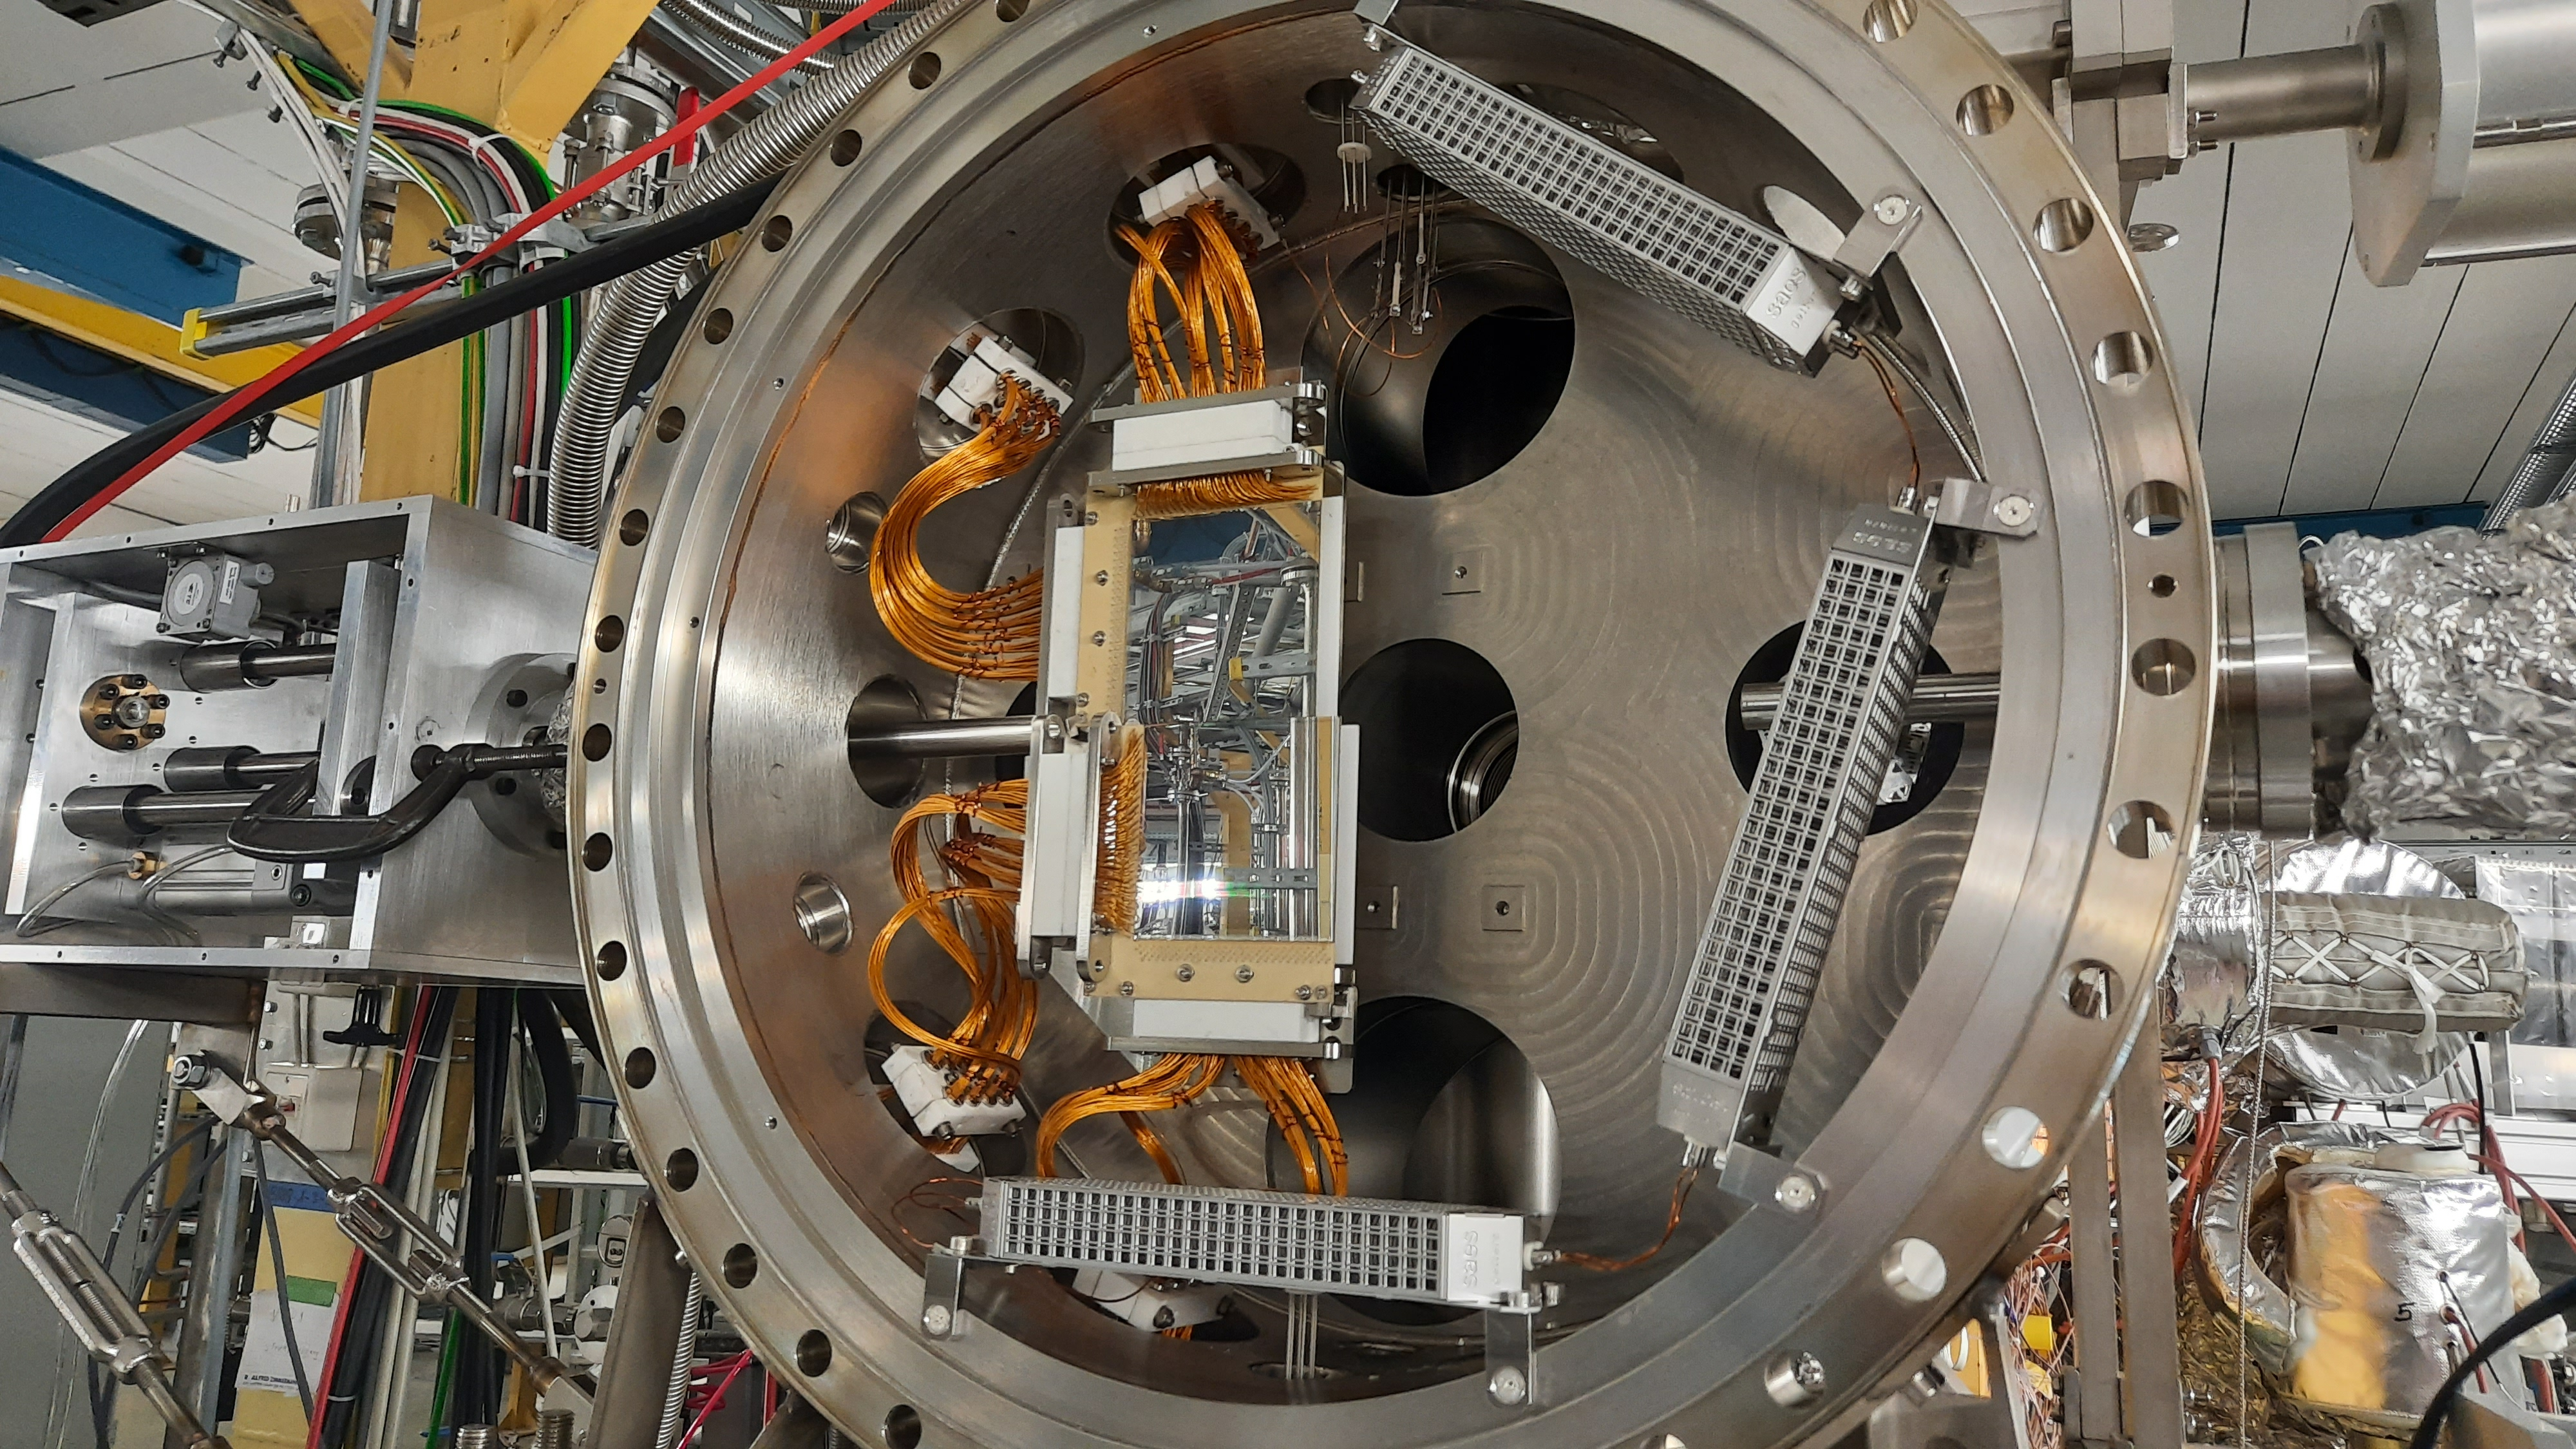
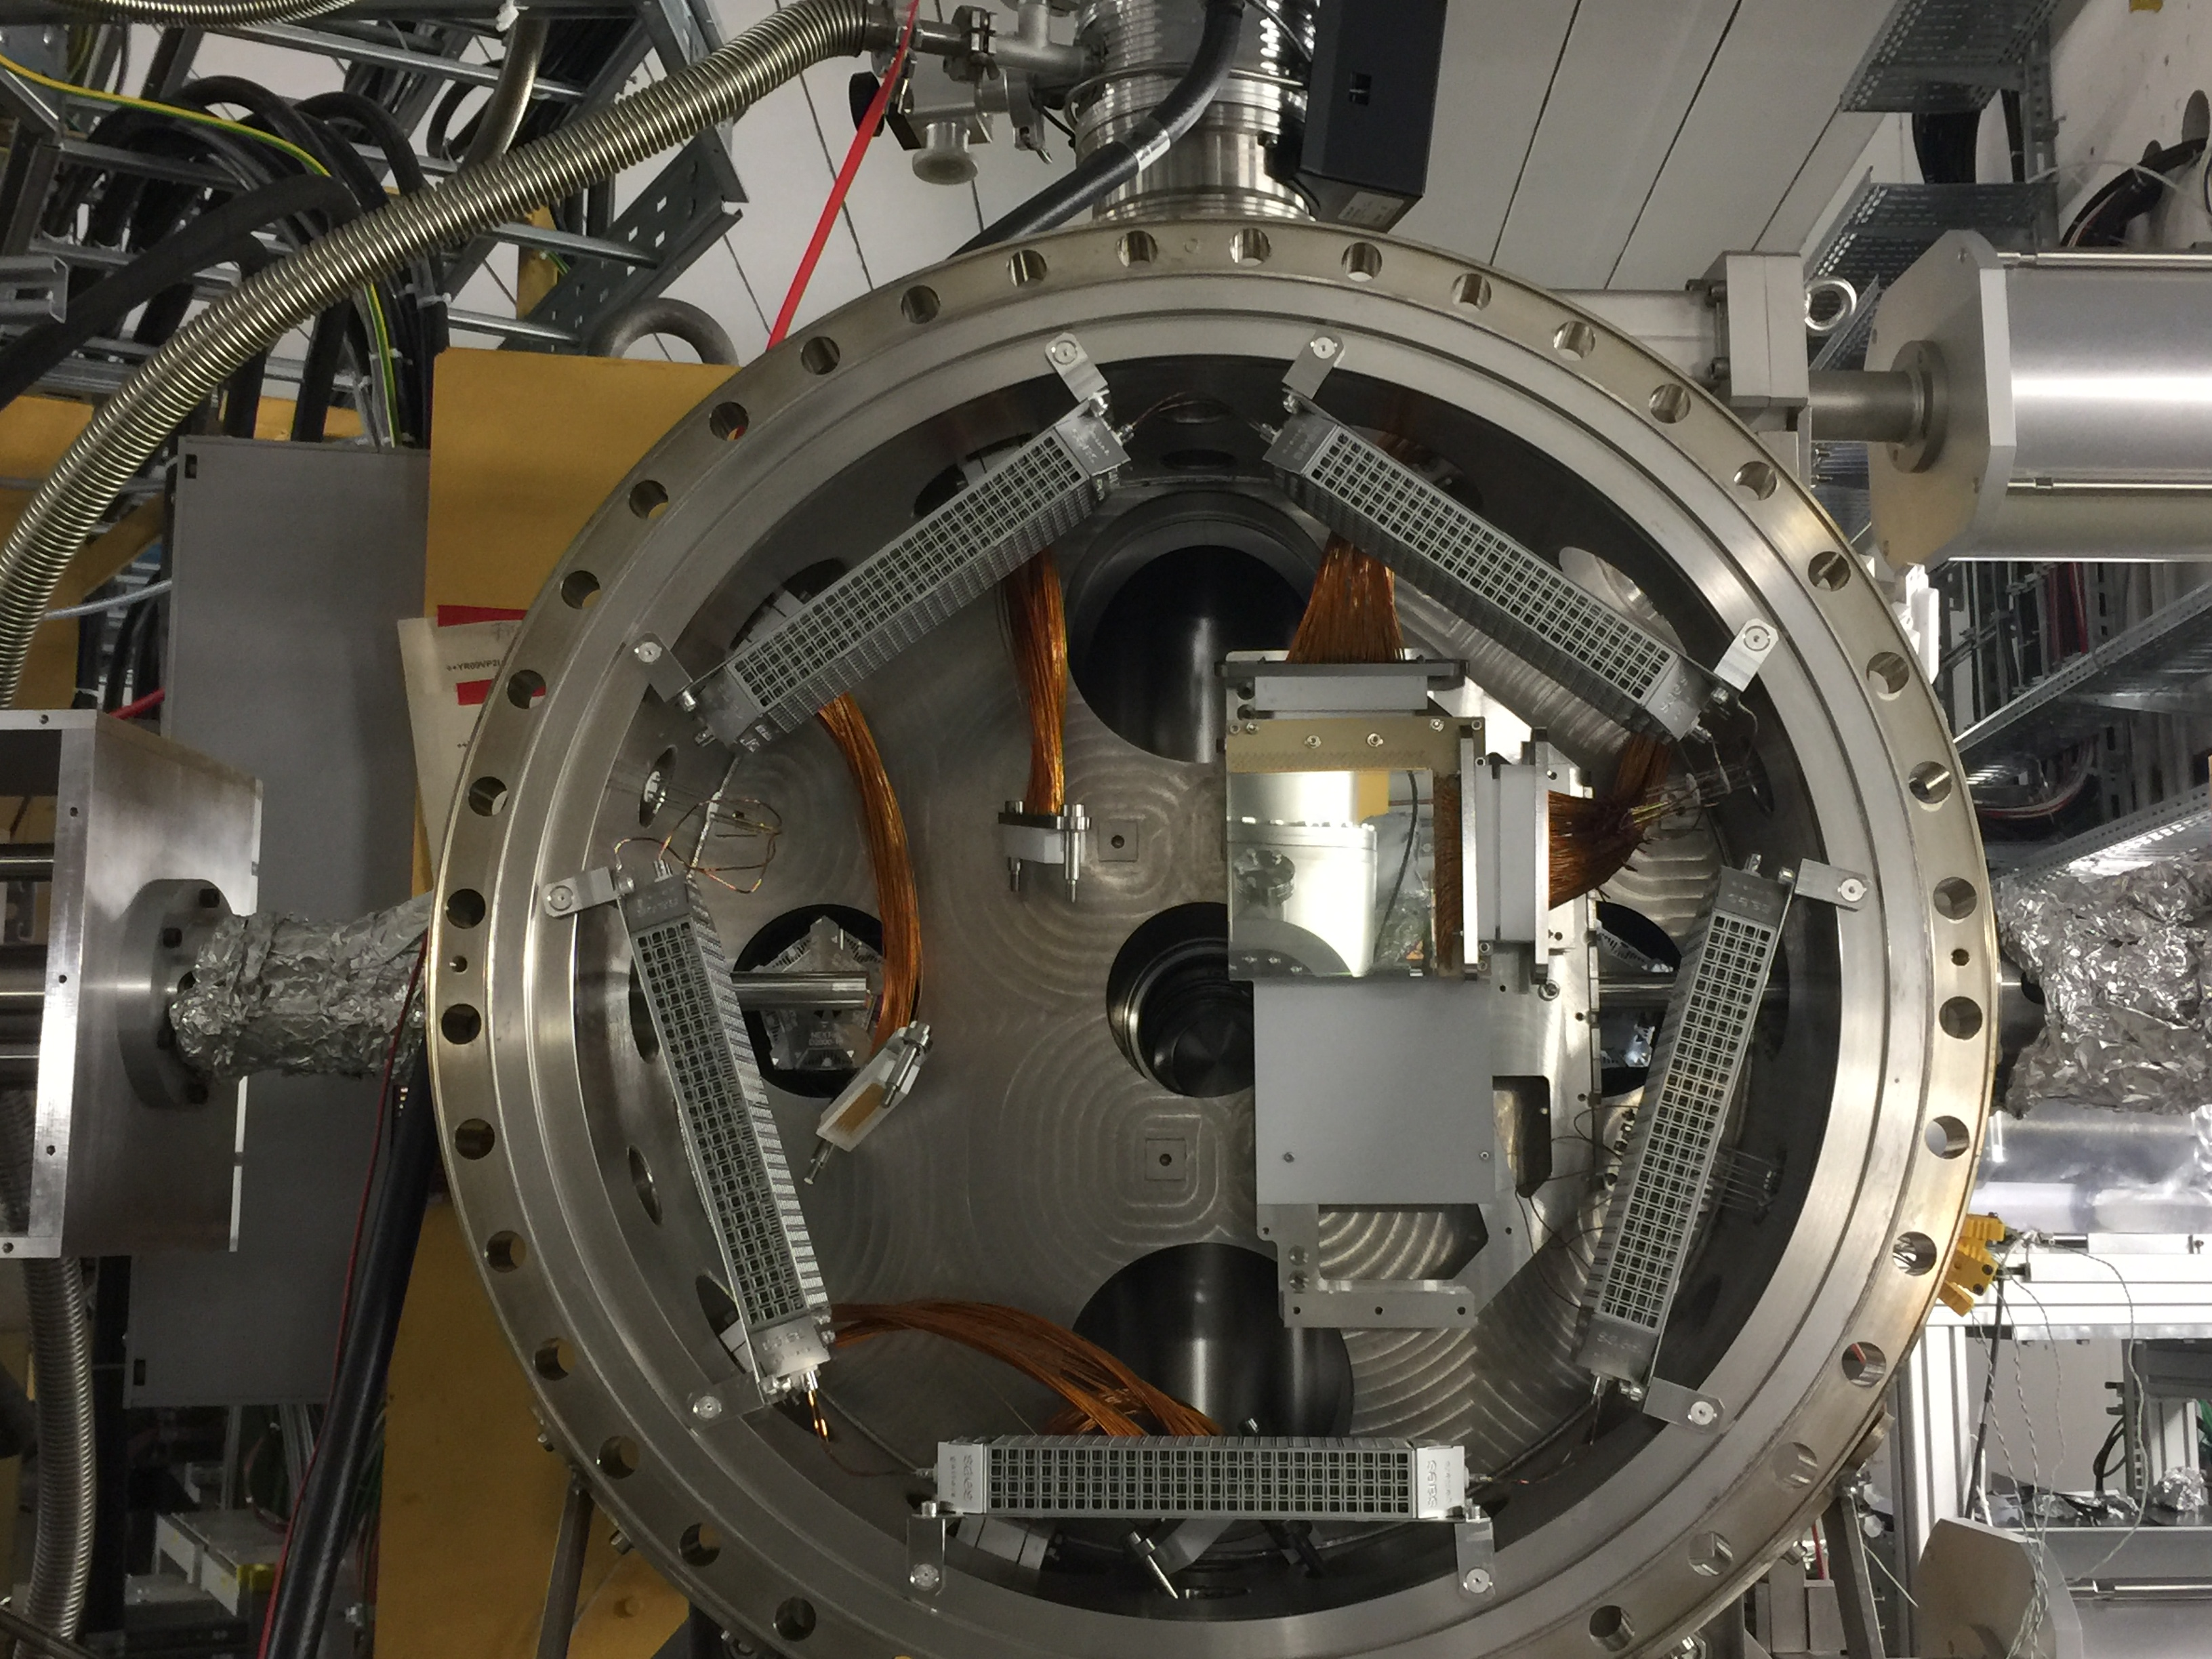
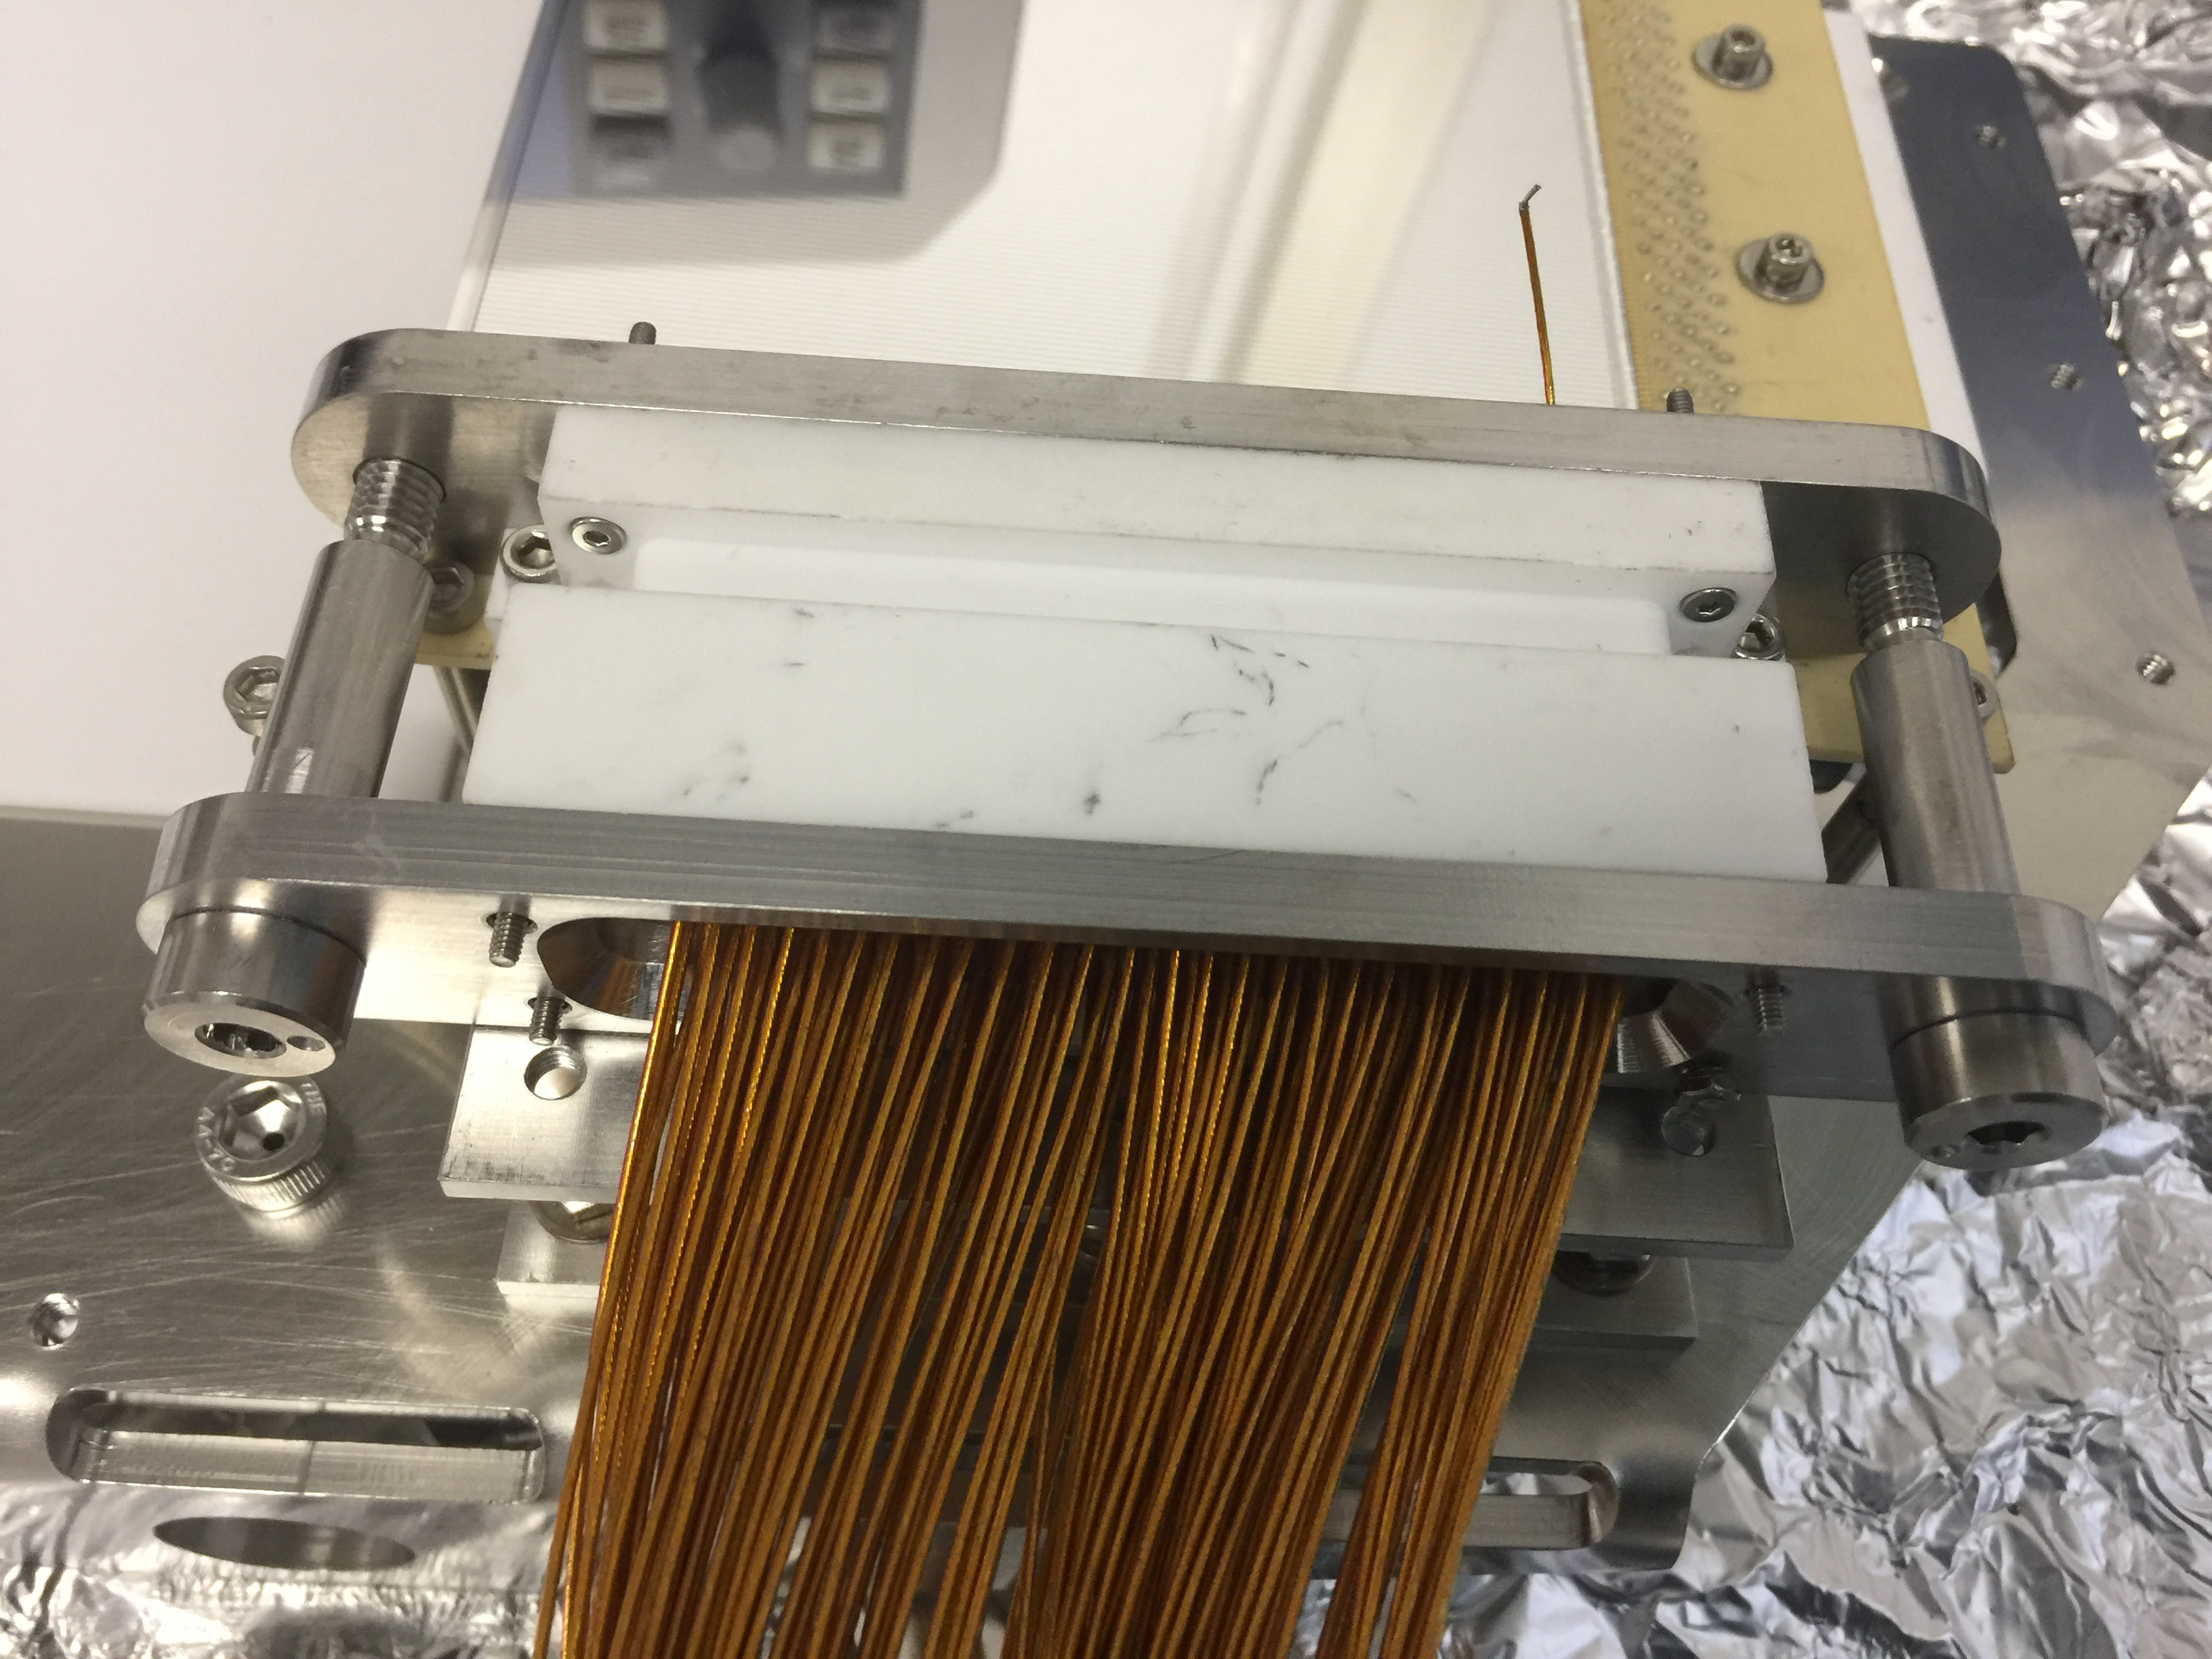
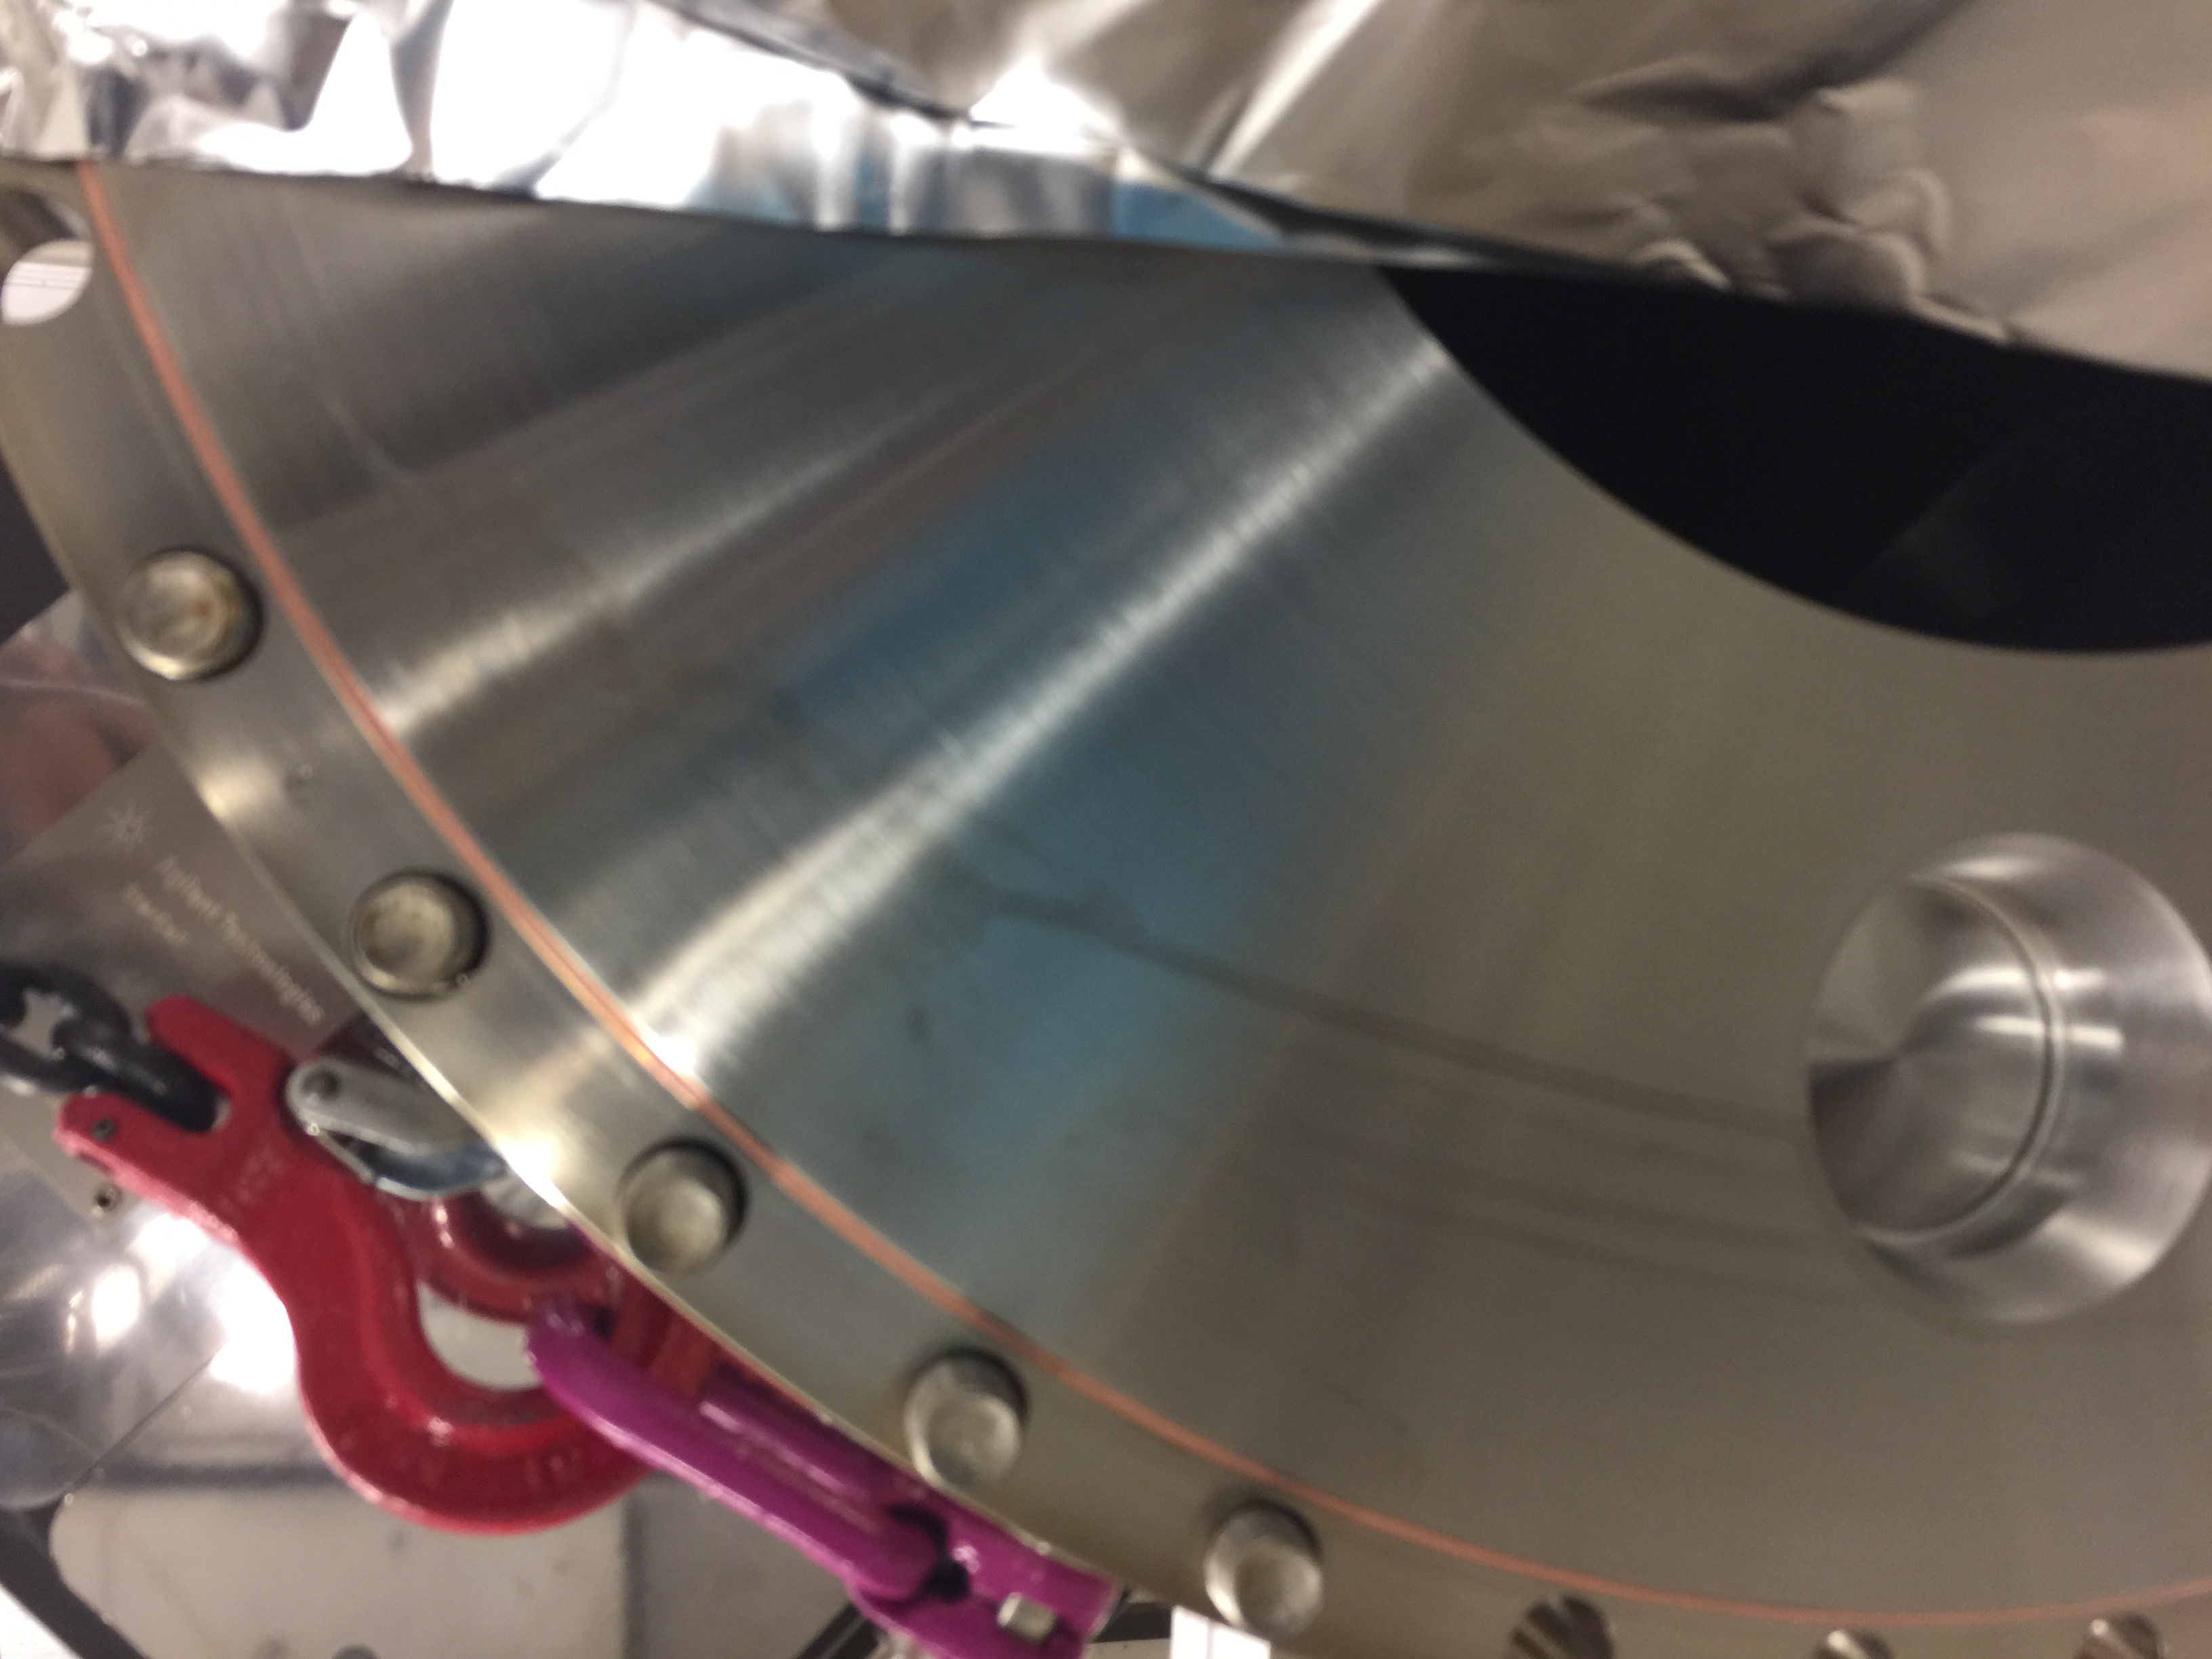
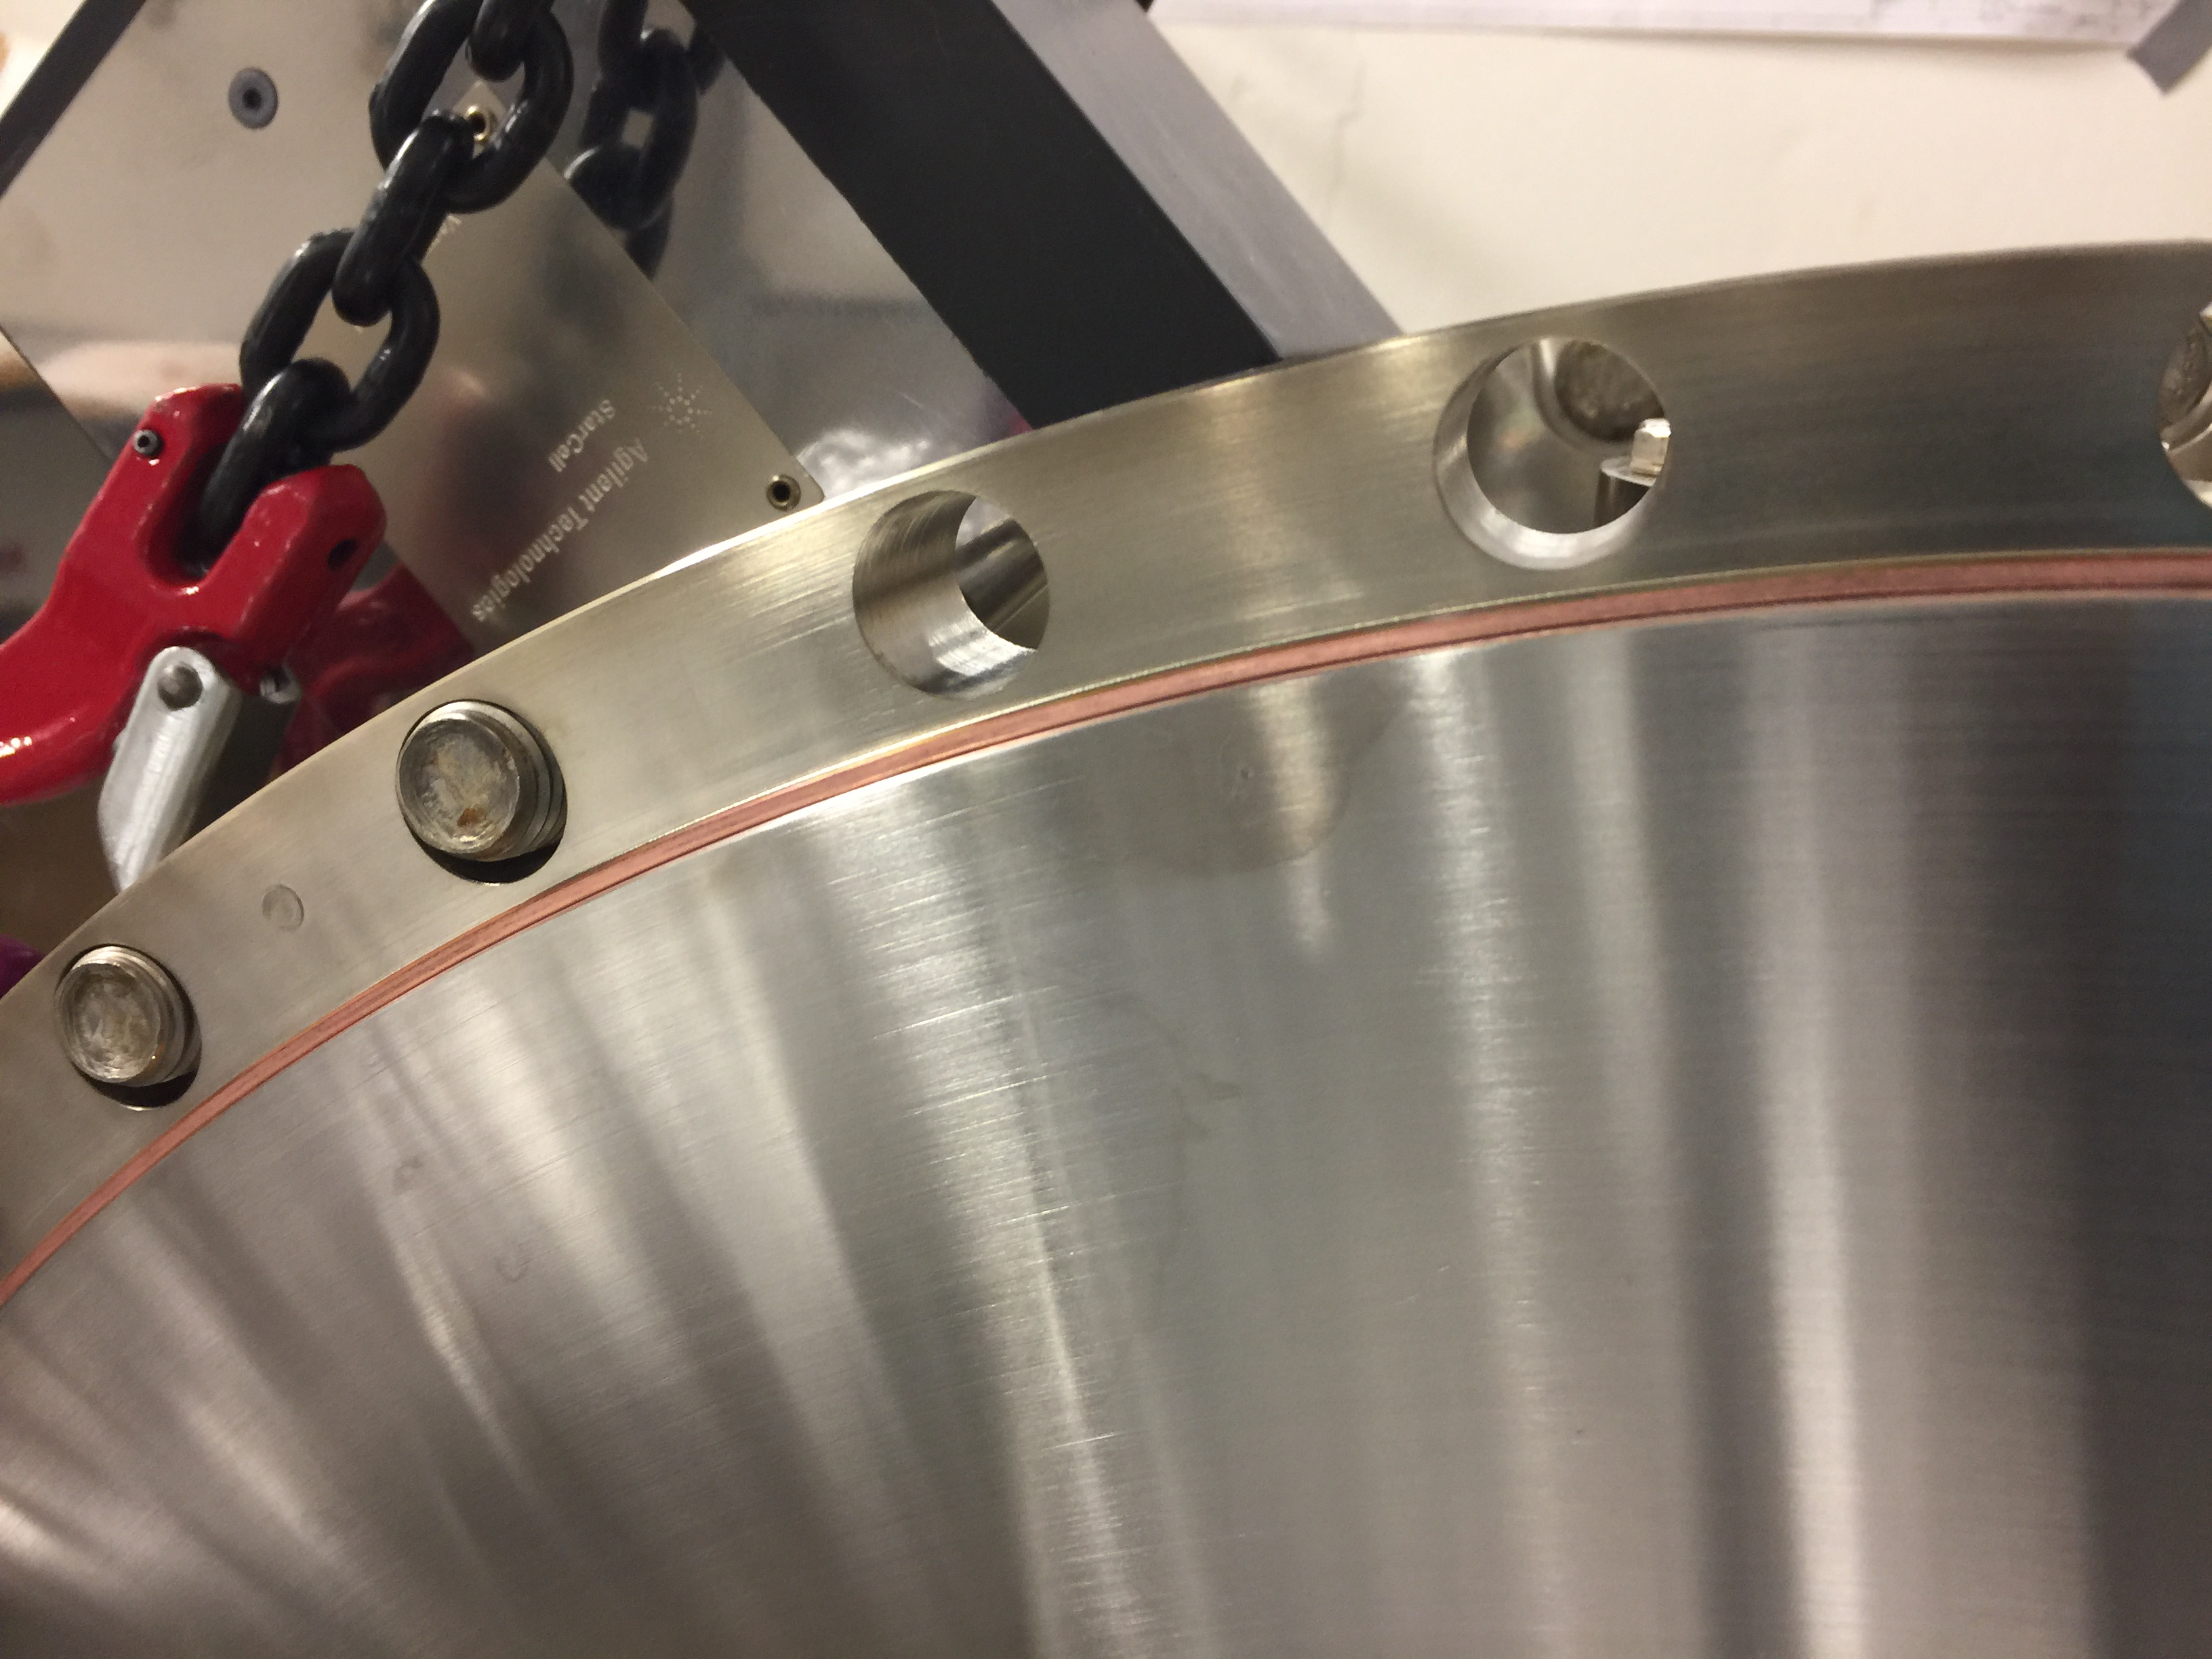
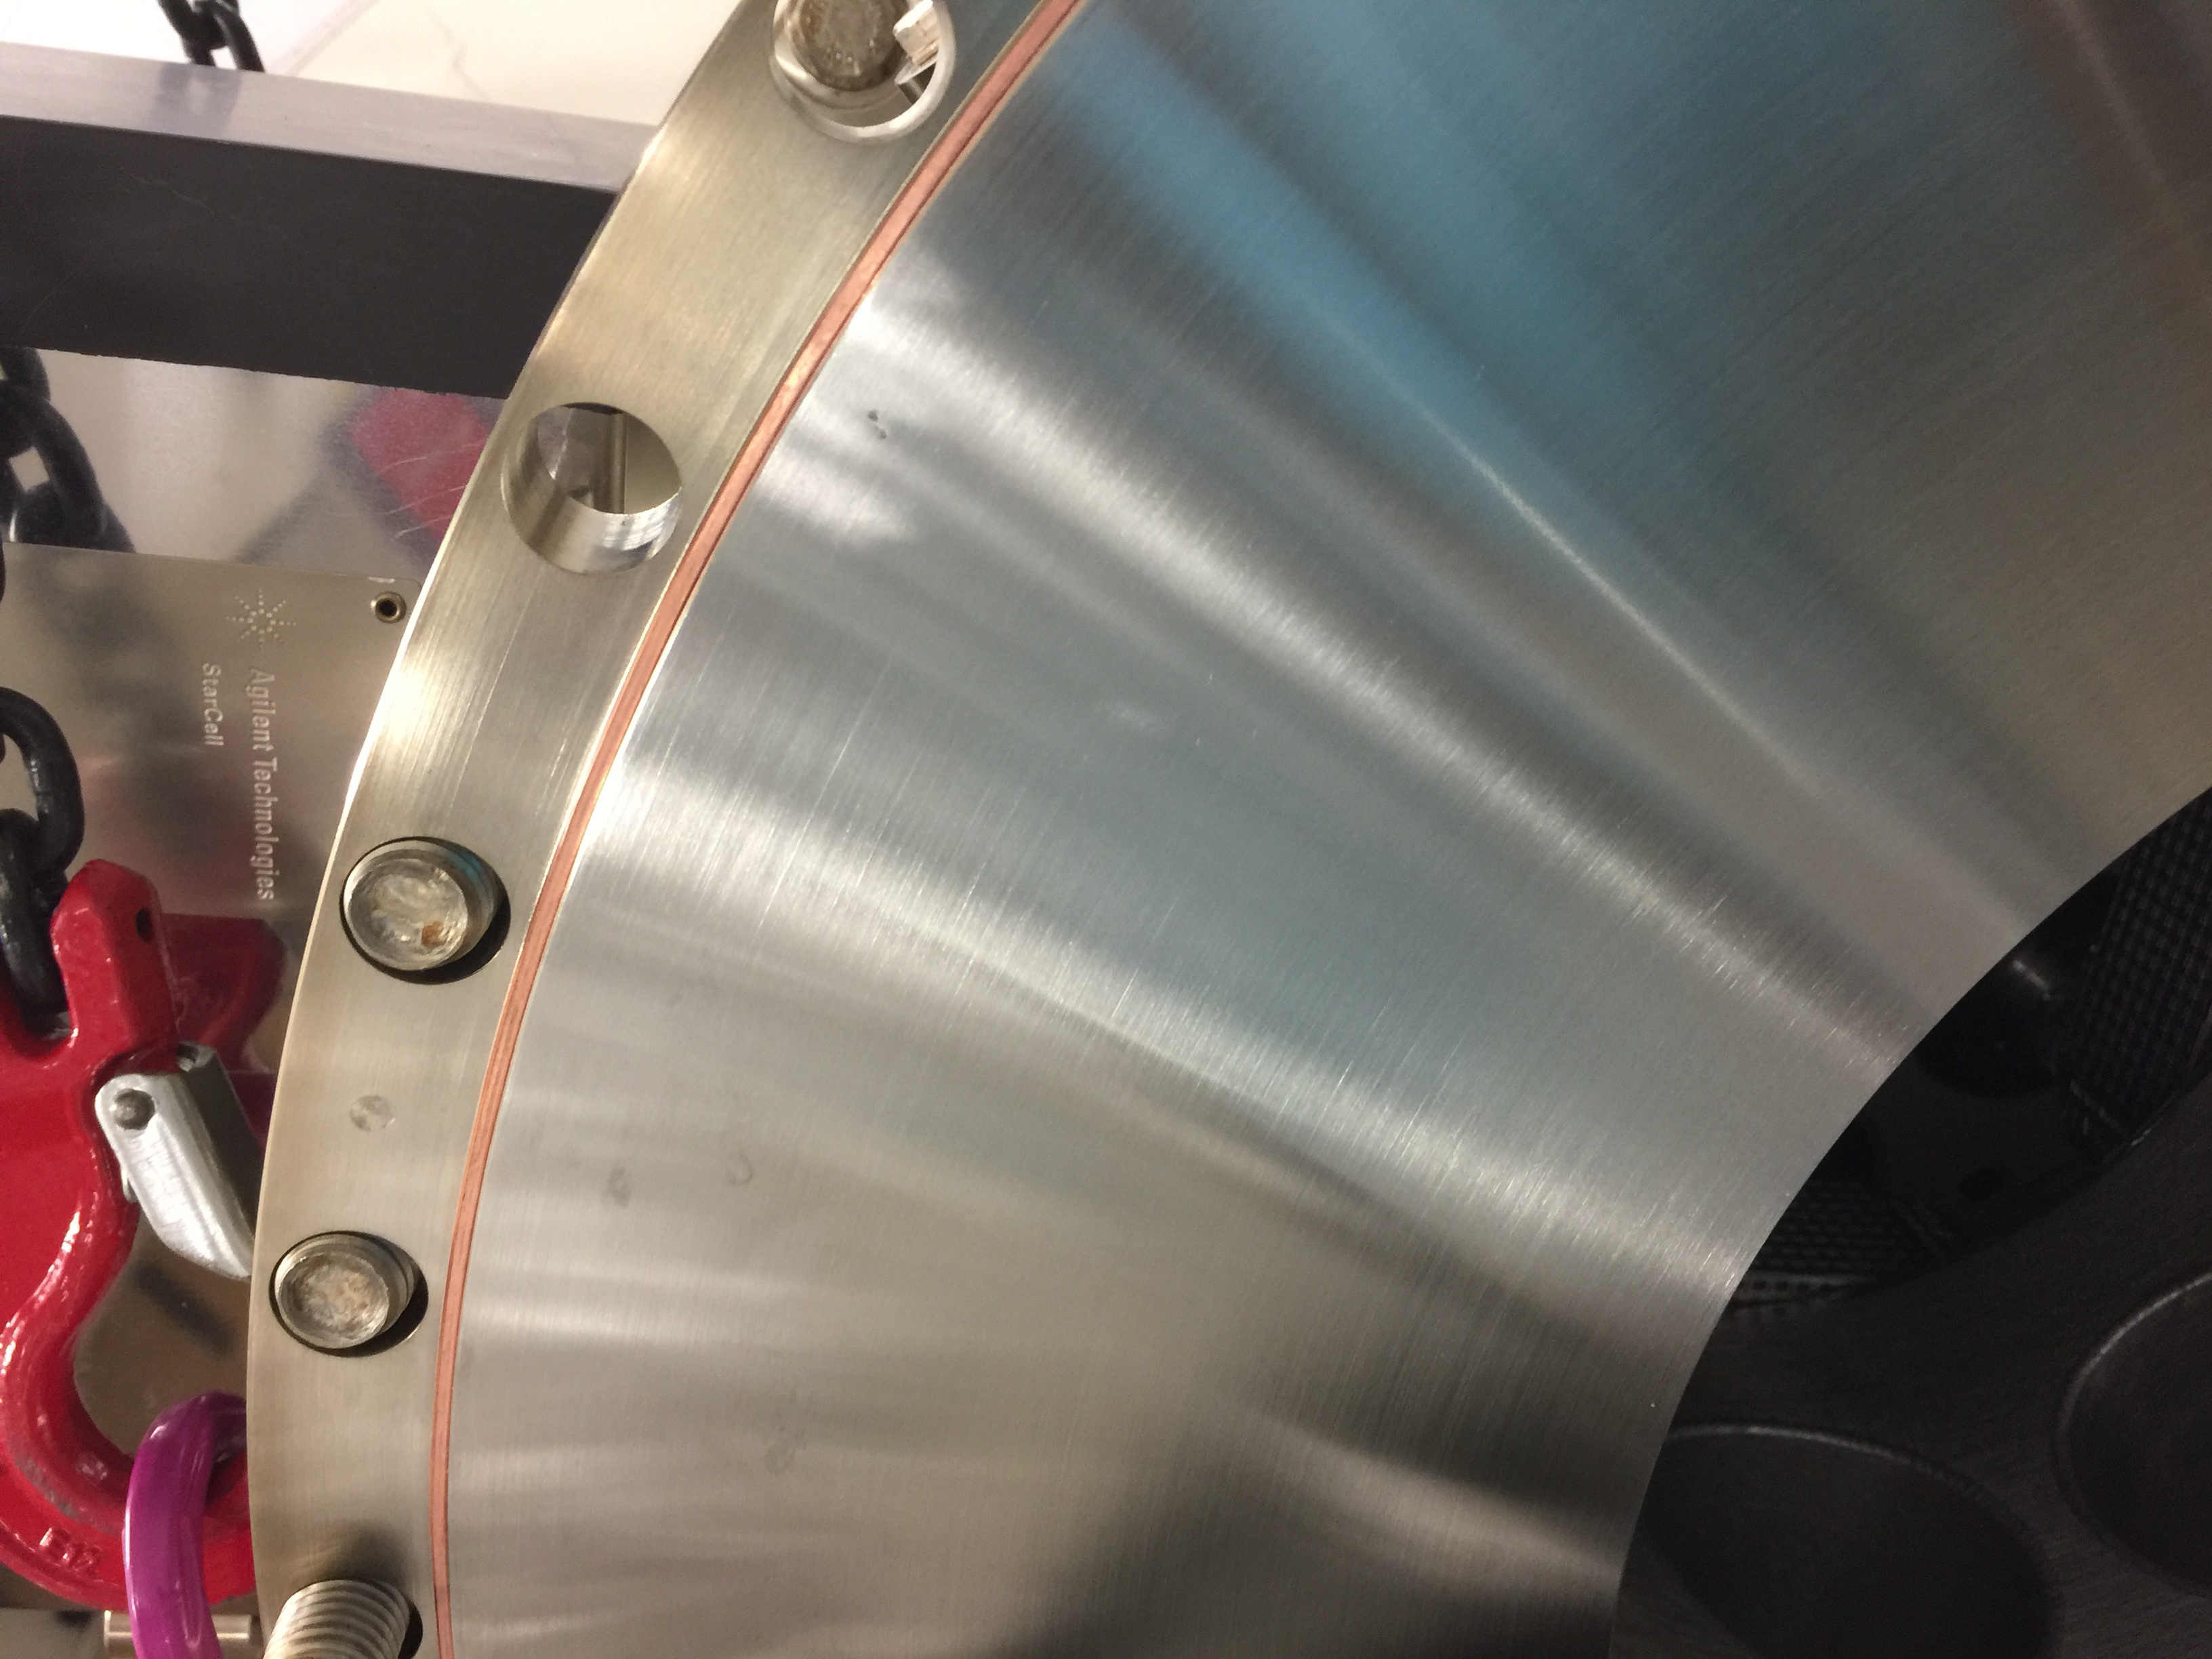
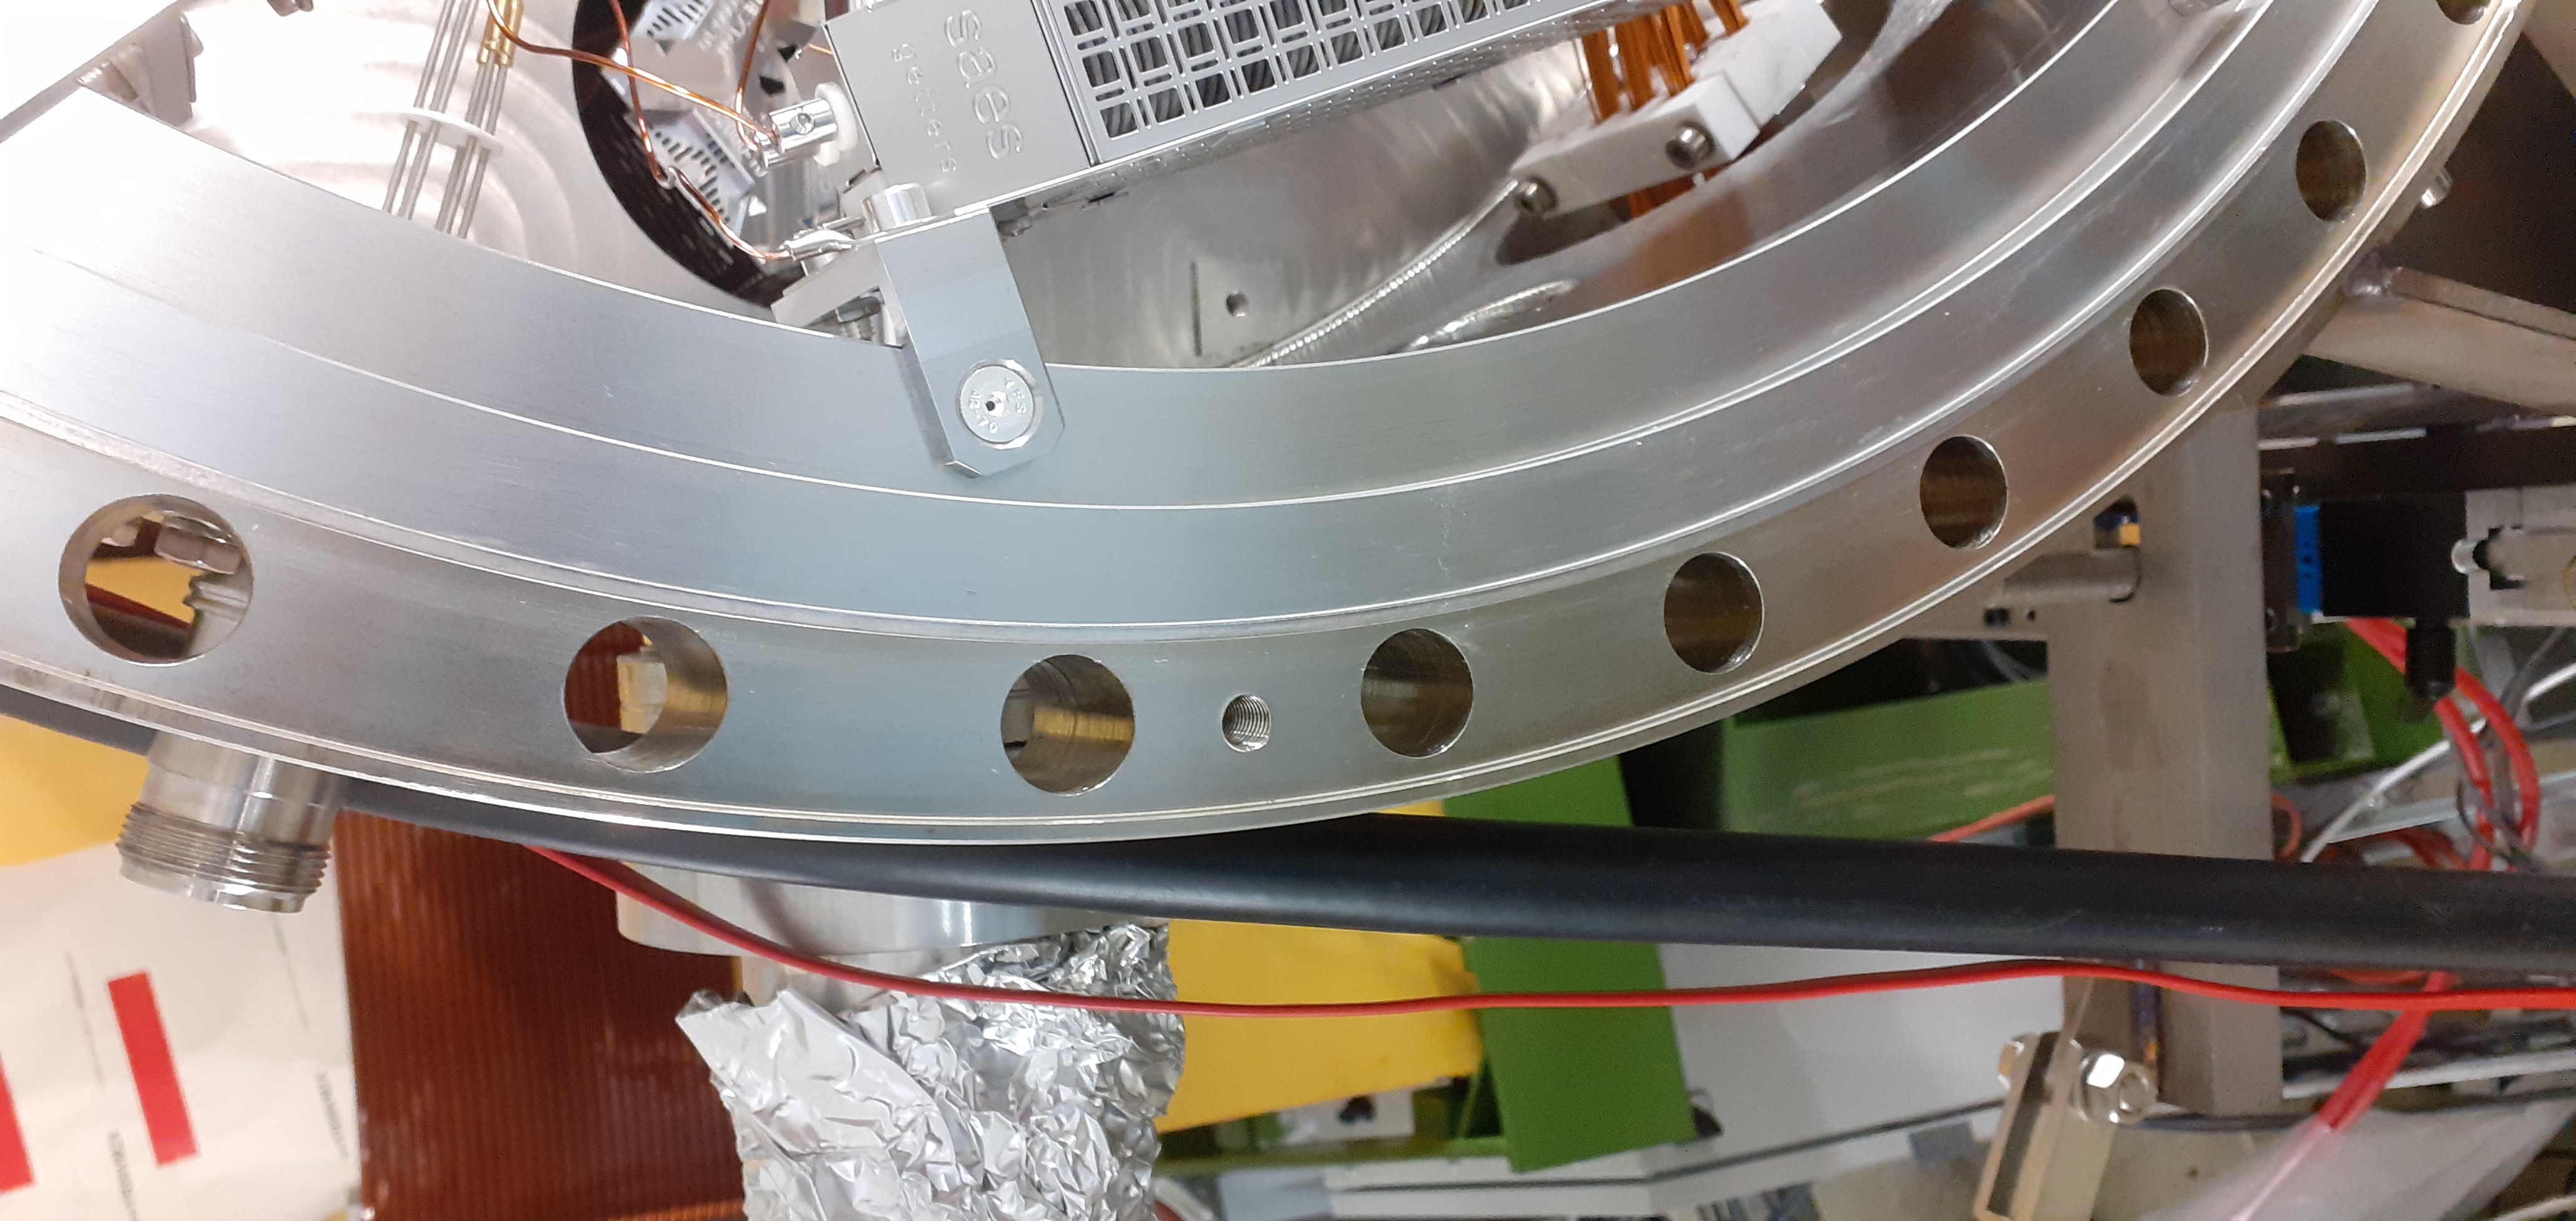
Leaks found in the wire seal around location of picture attached. Would suggest tightening wire seal tomorrow and check again. Leak must be small given base pressure achieved.
|
| Attachment 1: 20211031_155820.jpg
|
|
|
137
|
Sun Oct 31 08:05:15 2021 |
CB OH + DR ML | CARME closed again + feedthroughs labeled |
(Fri 29 October)
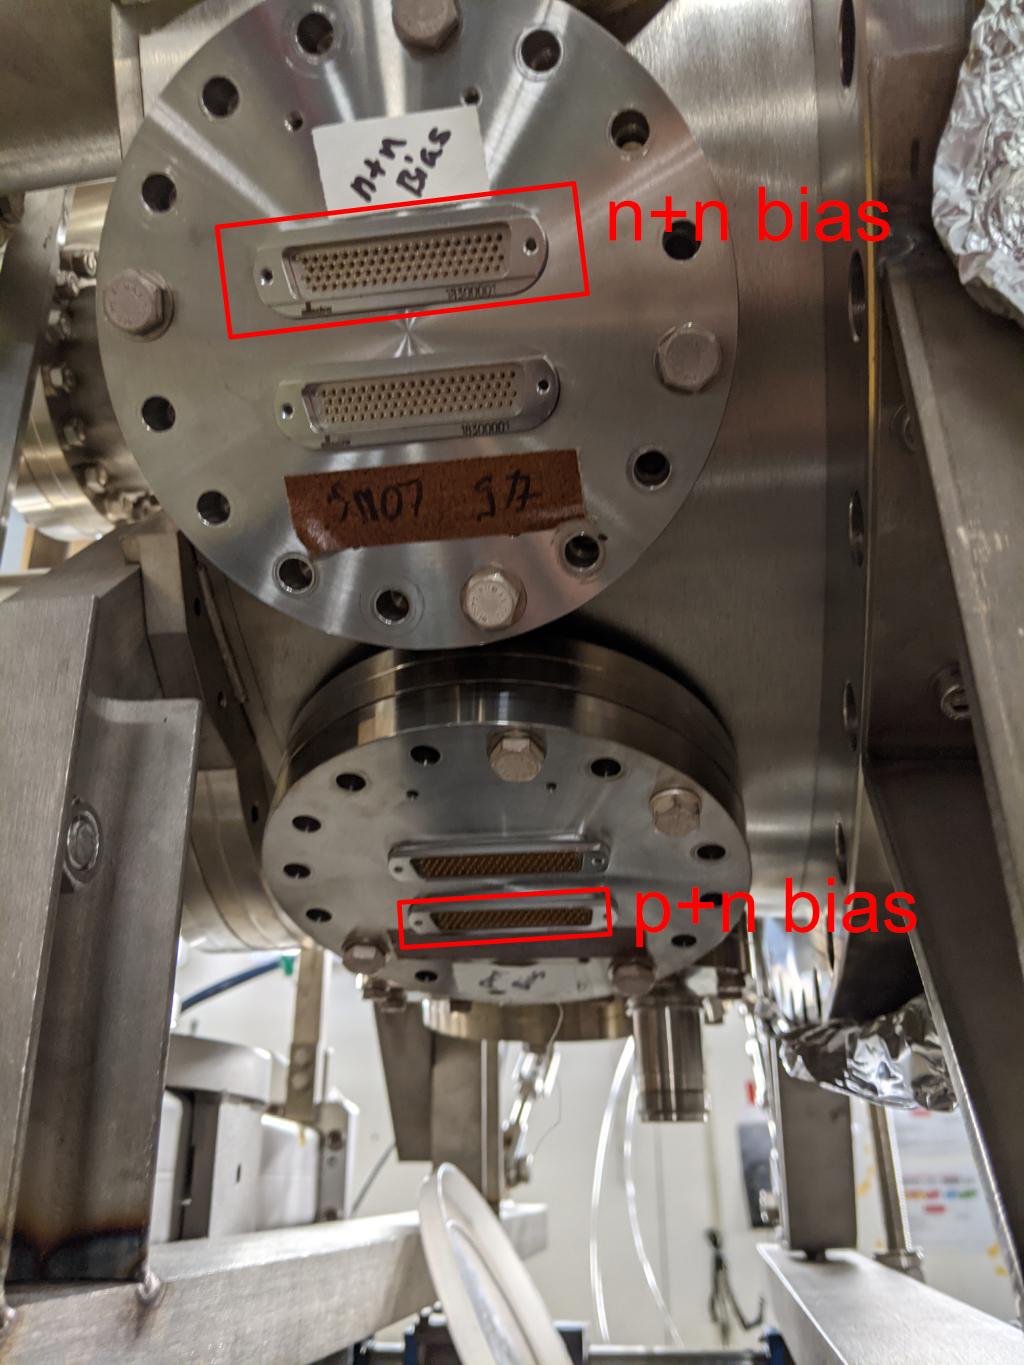
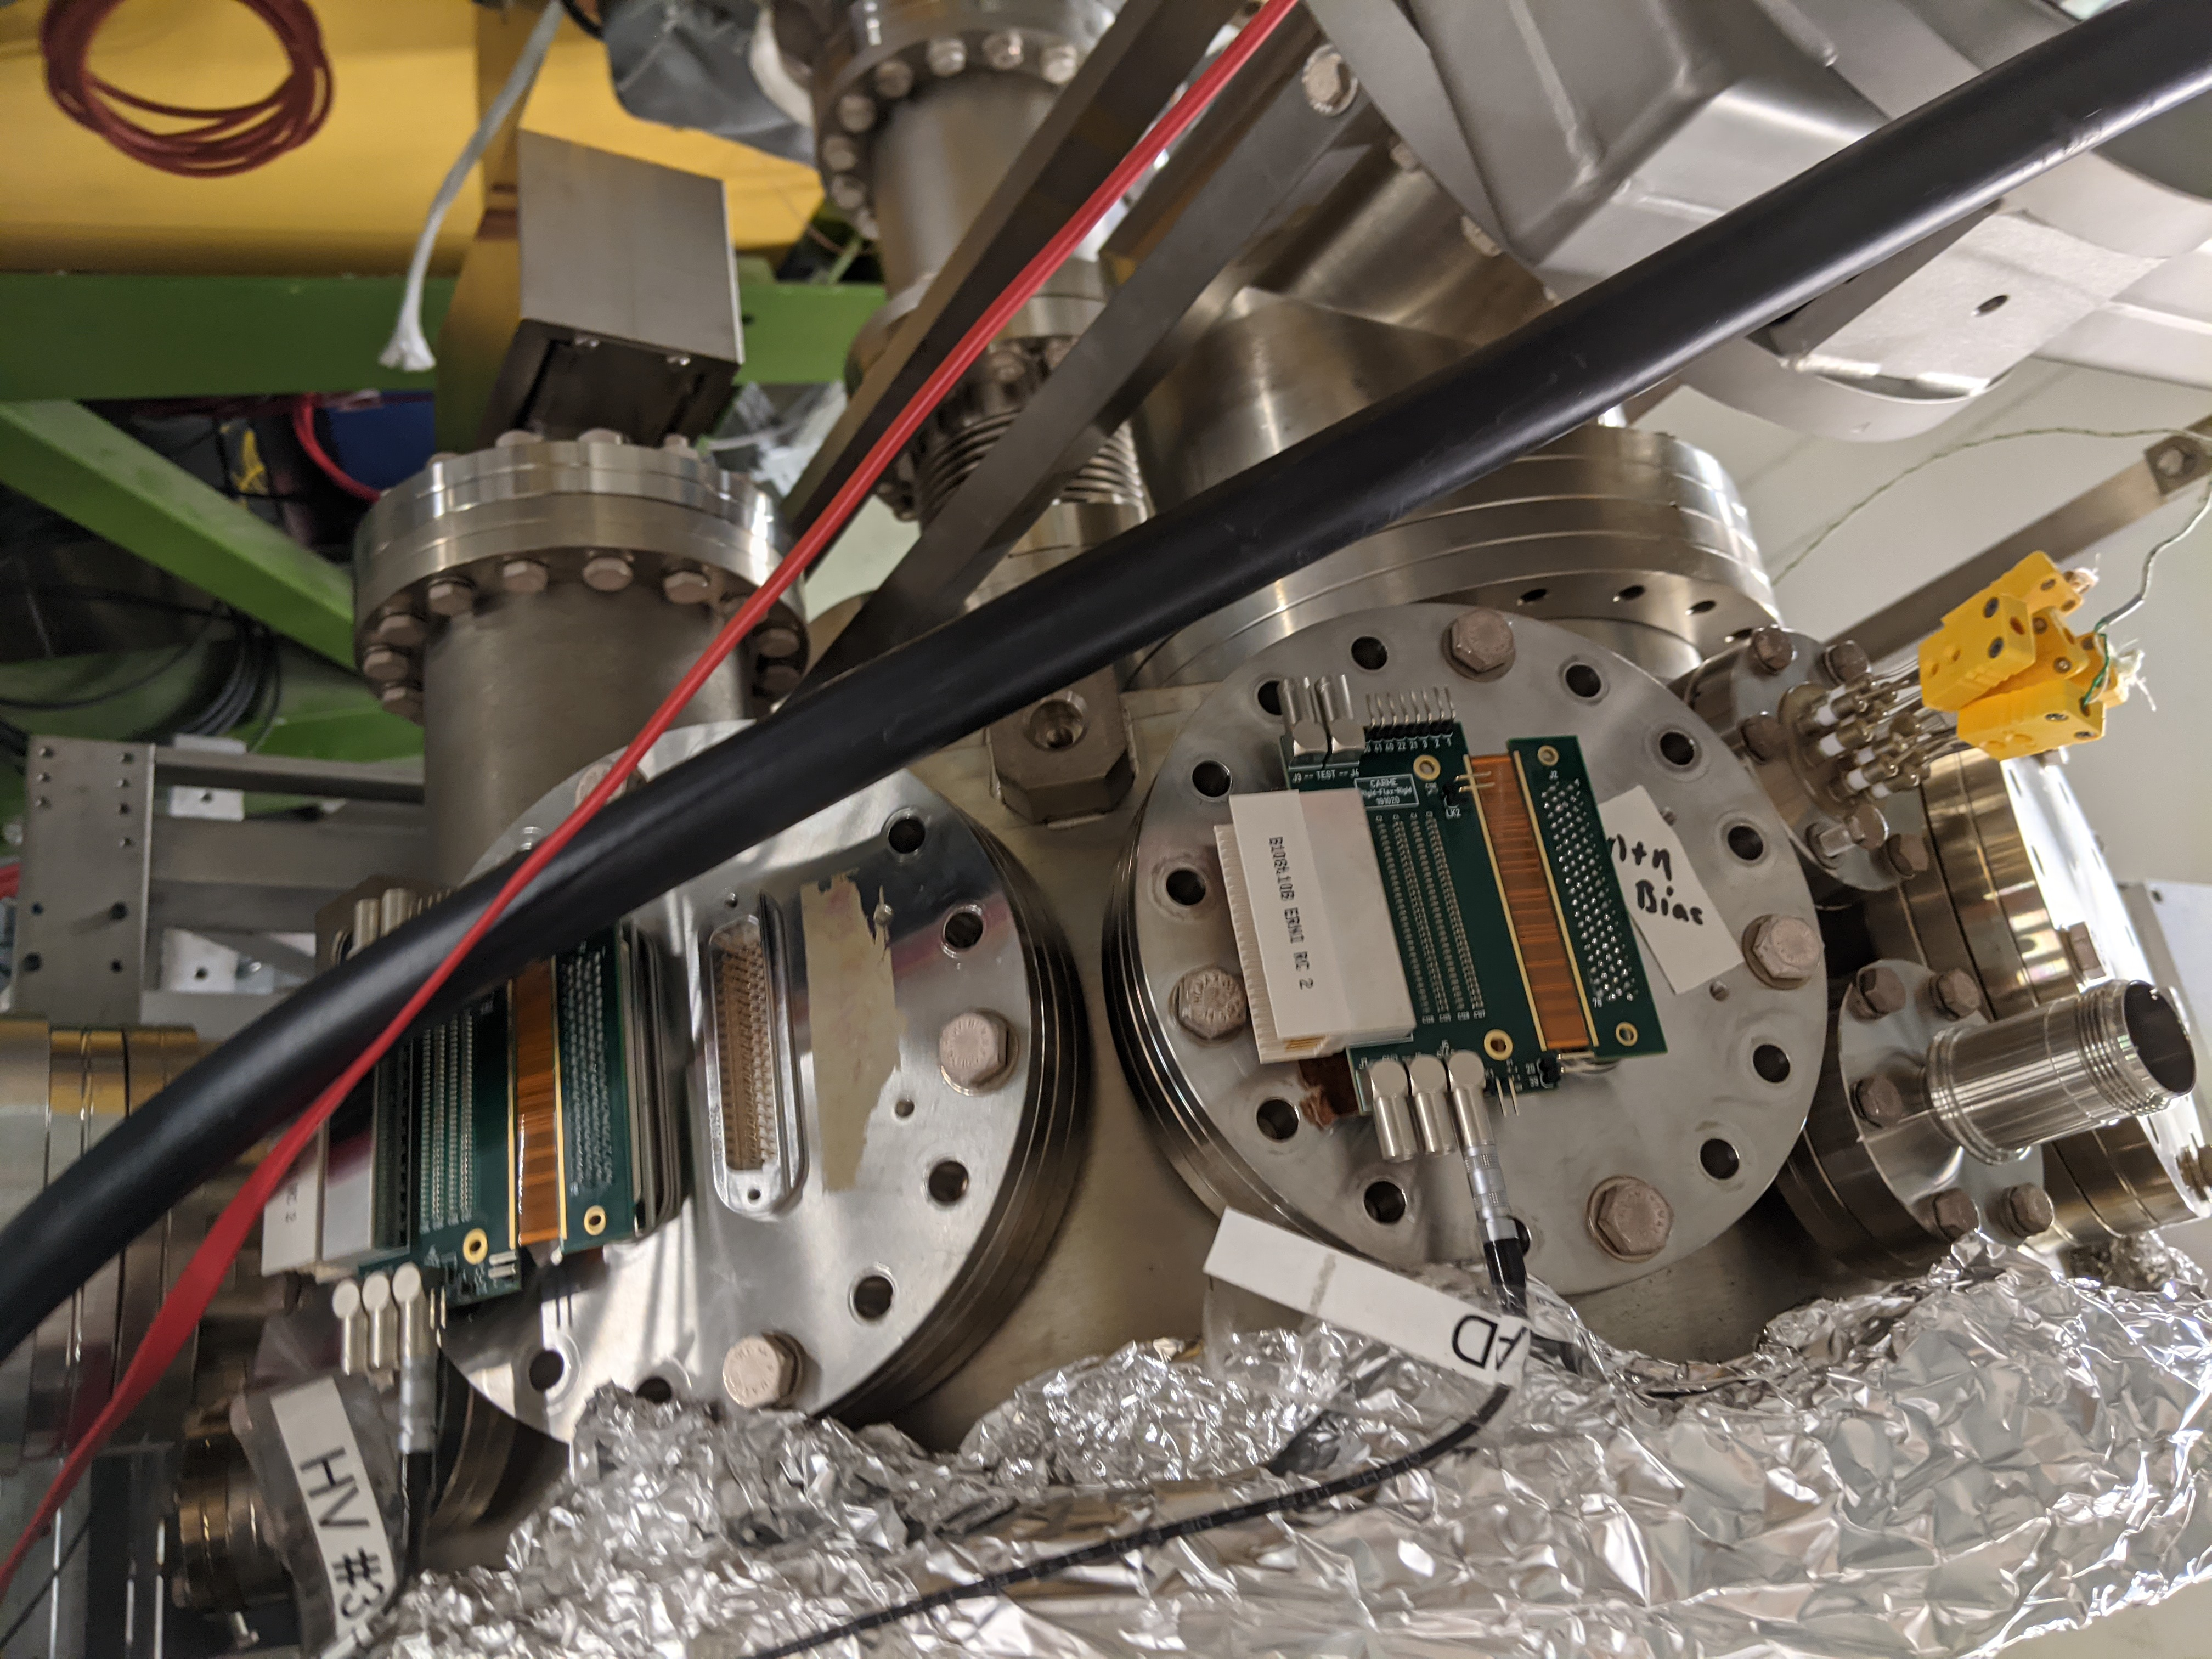
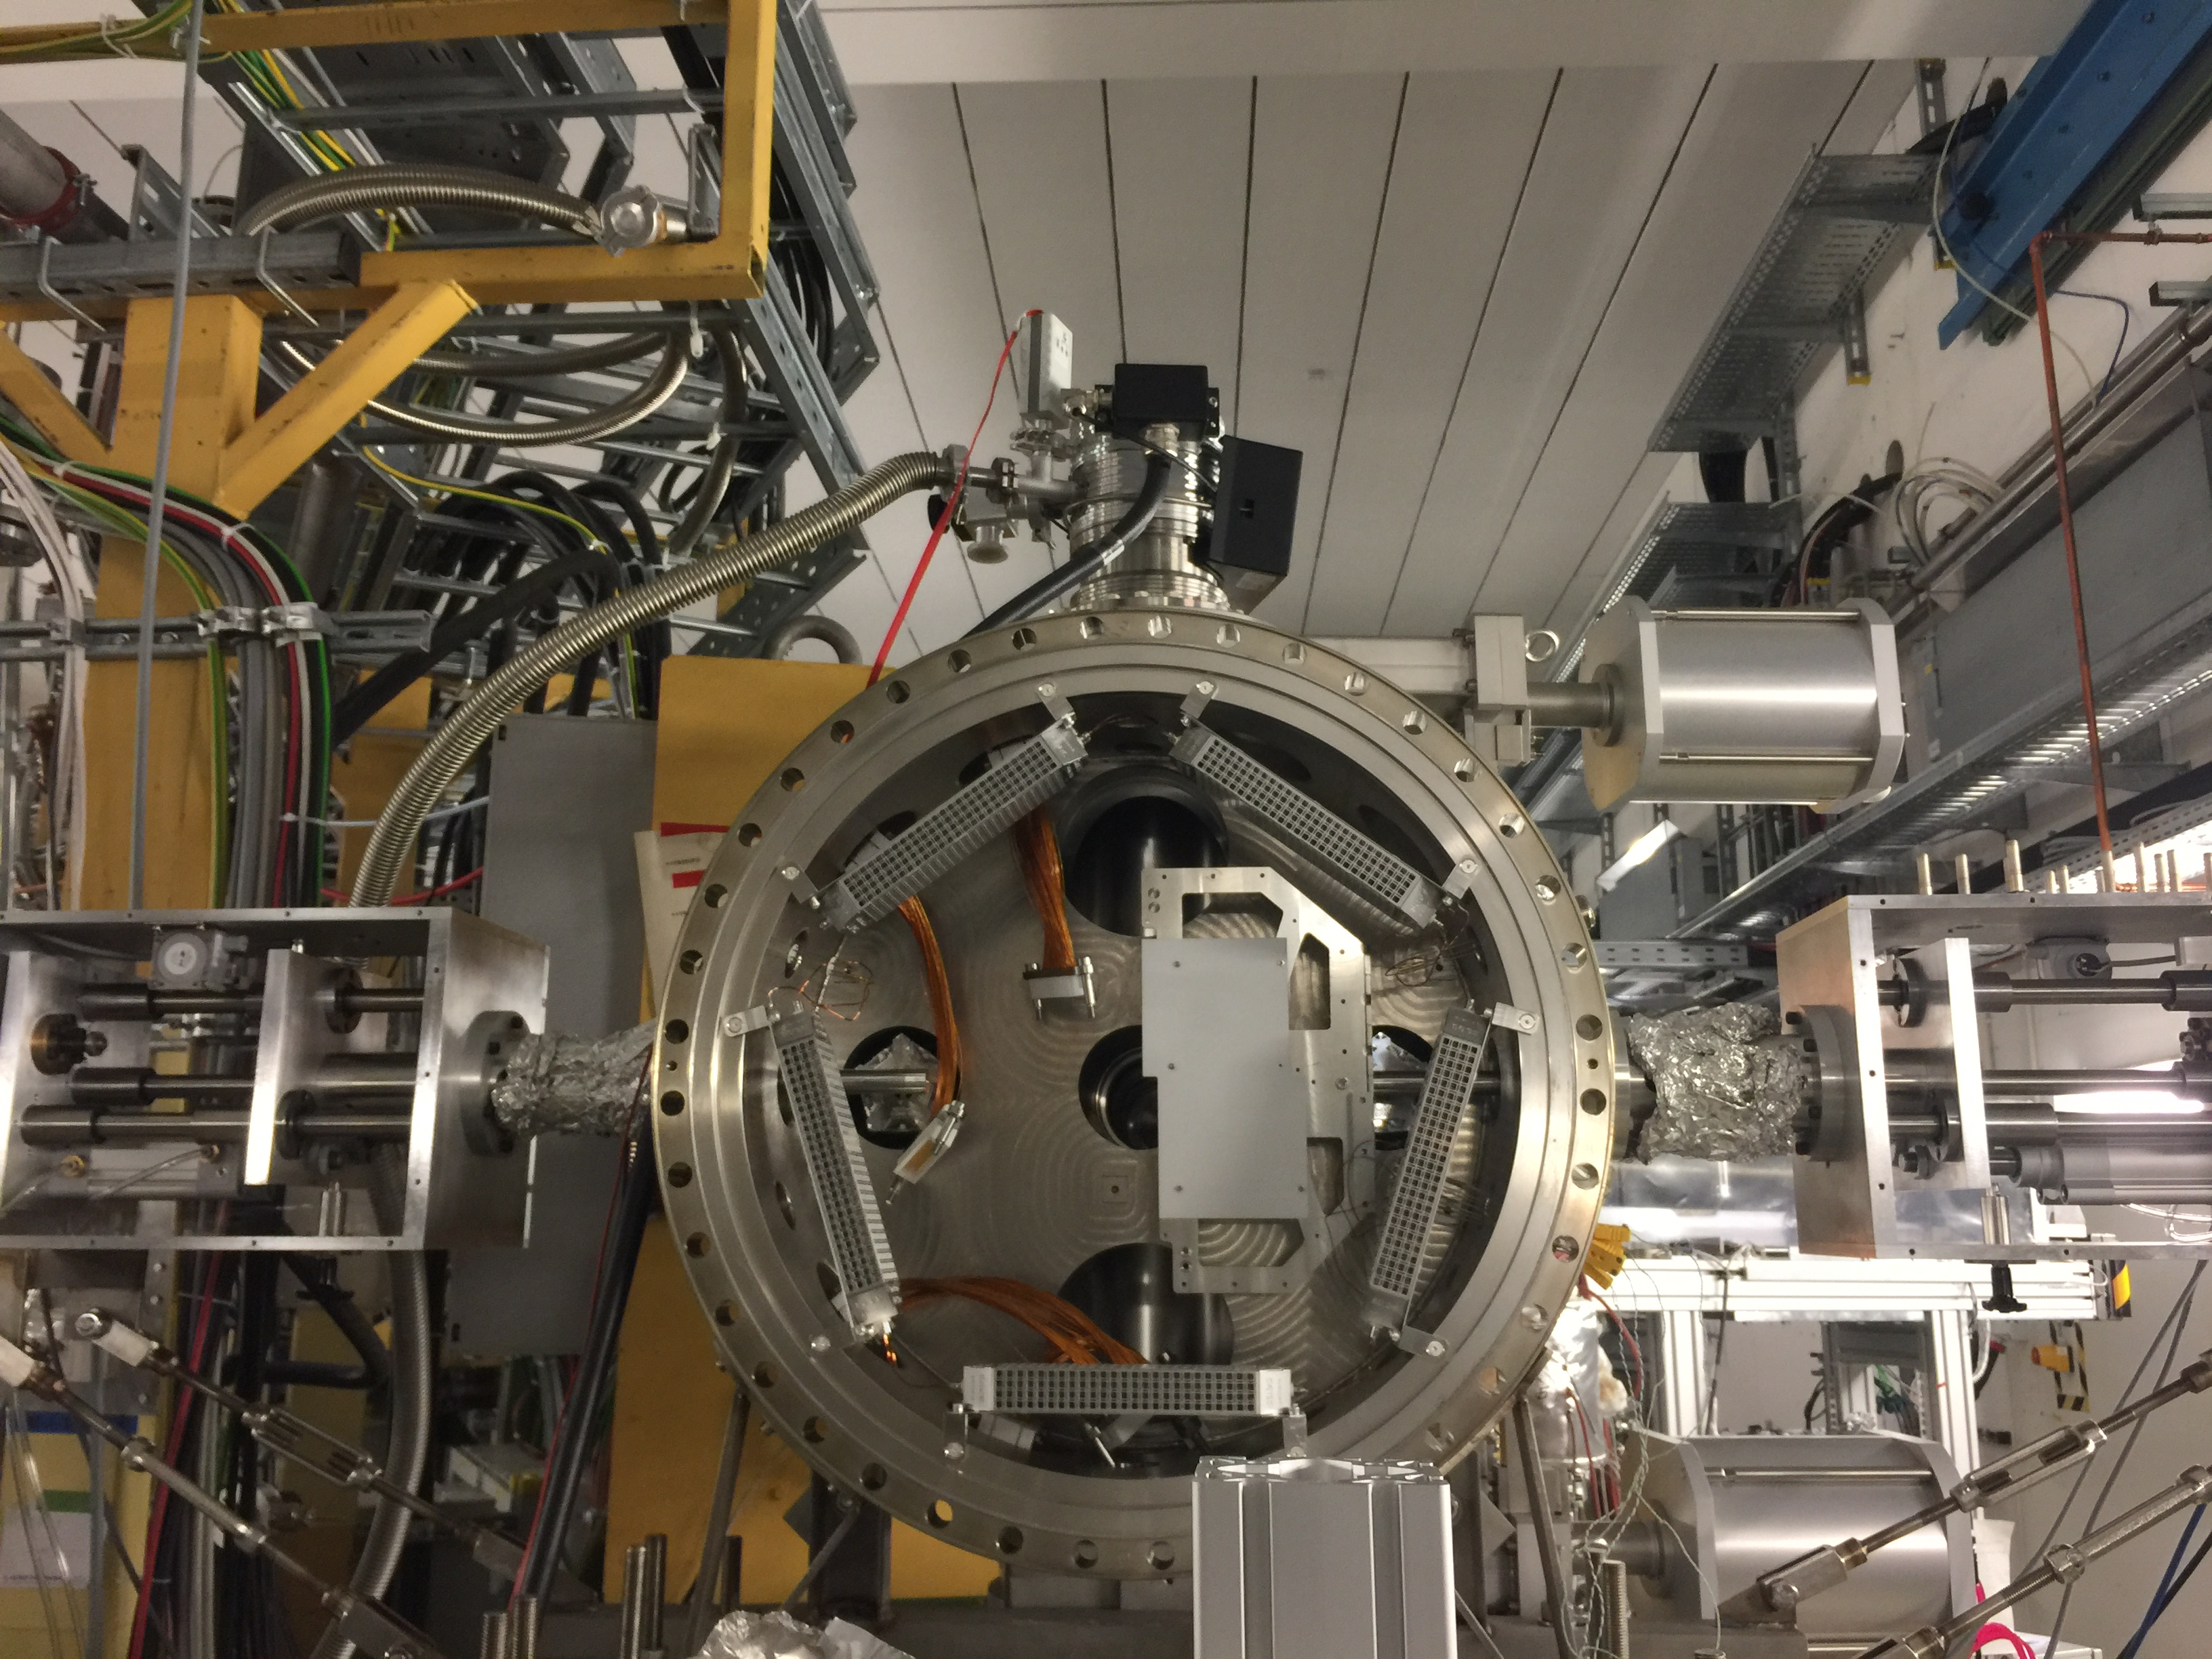
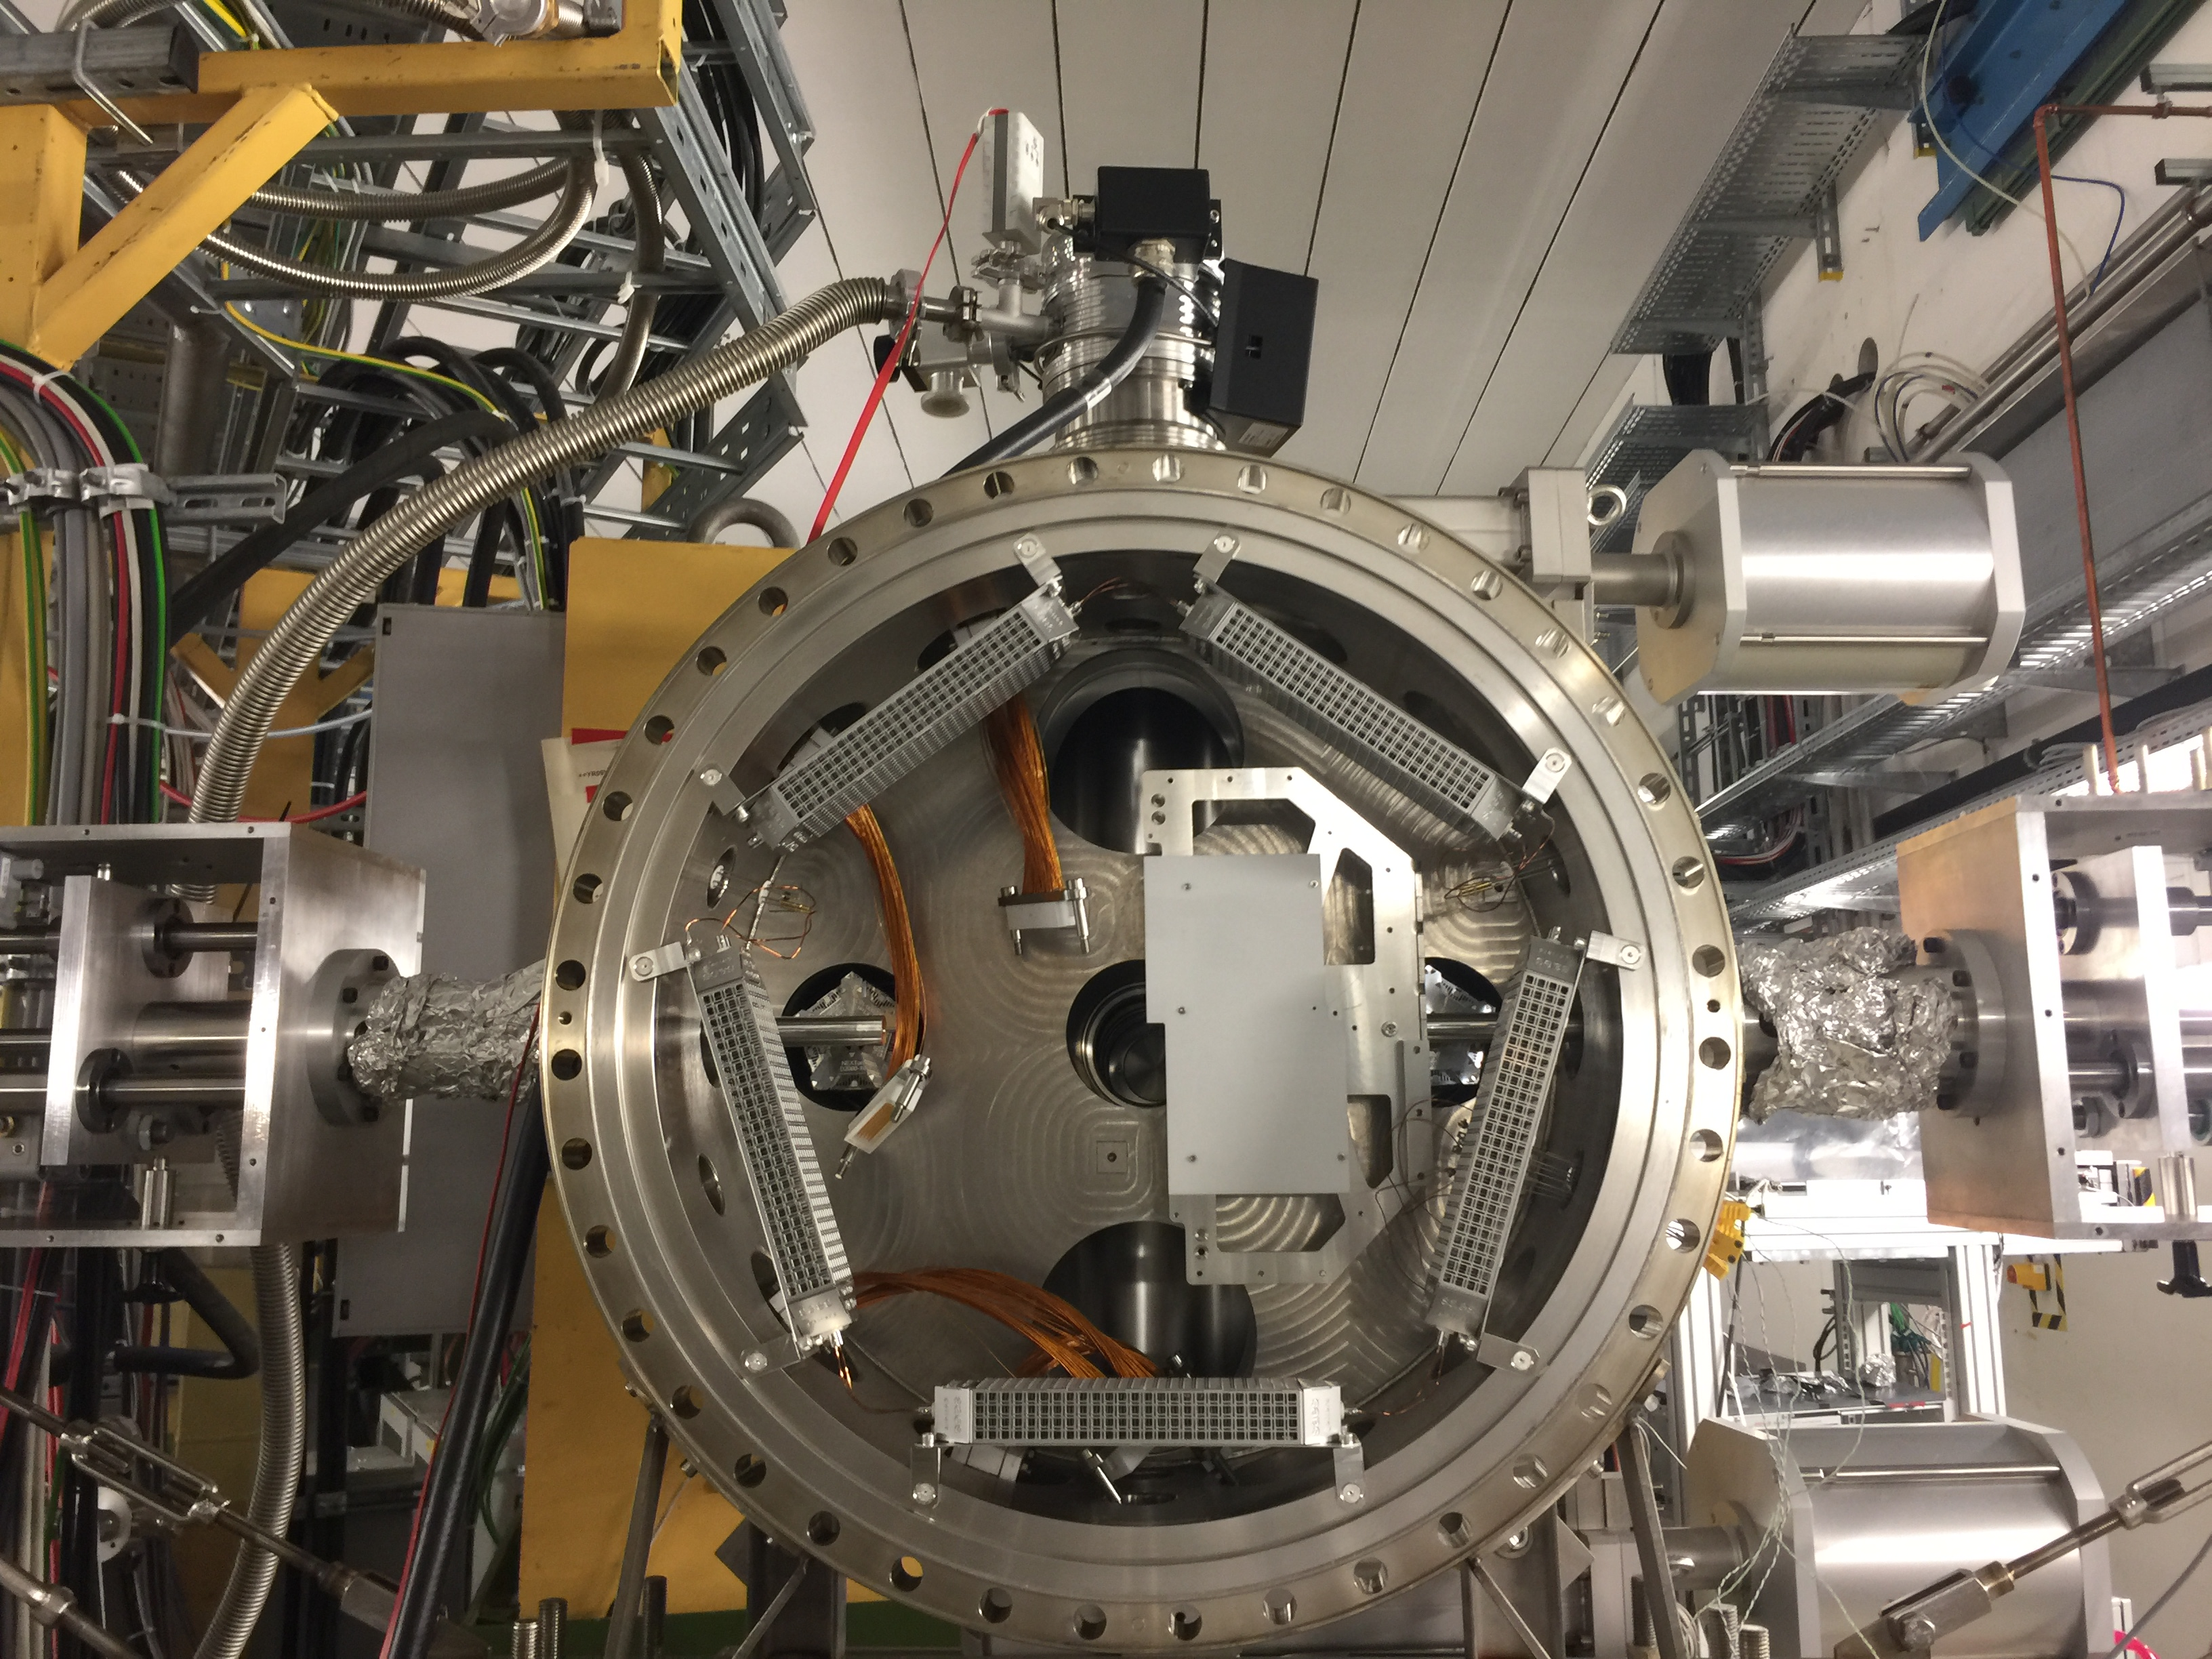
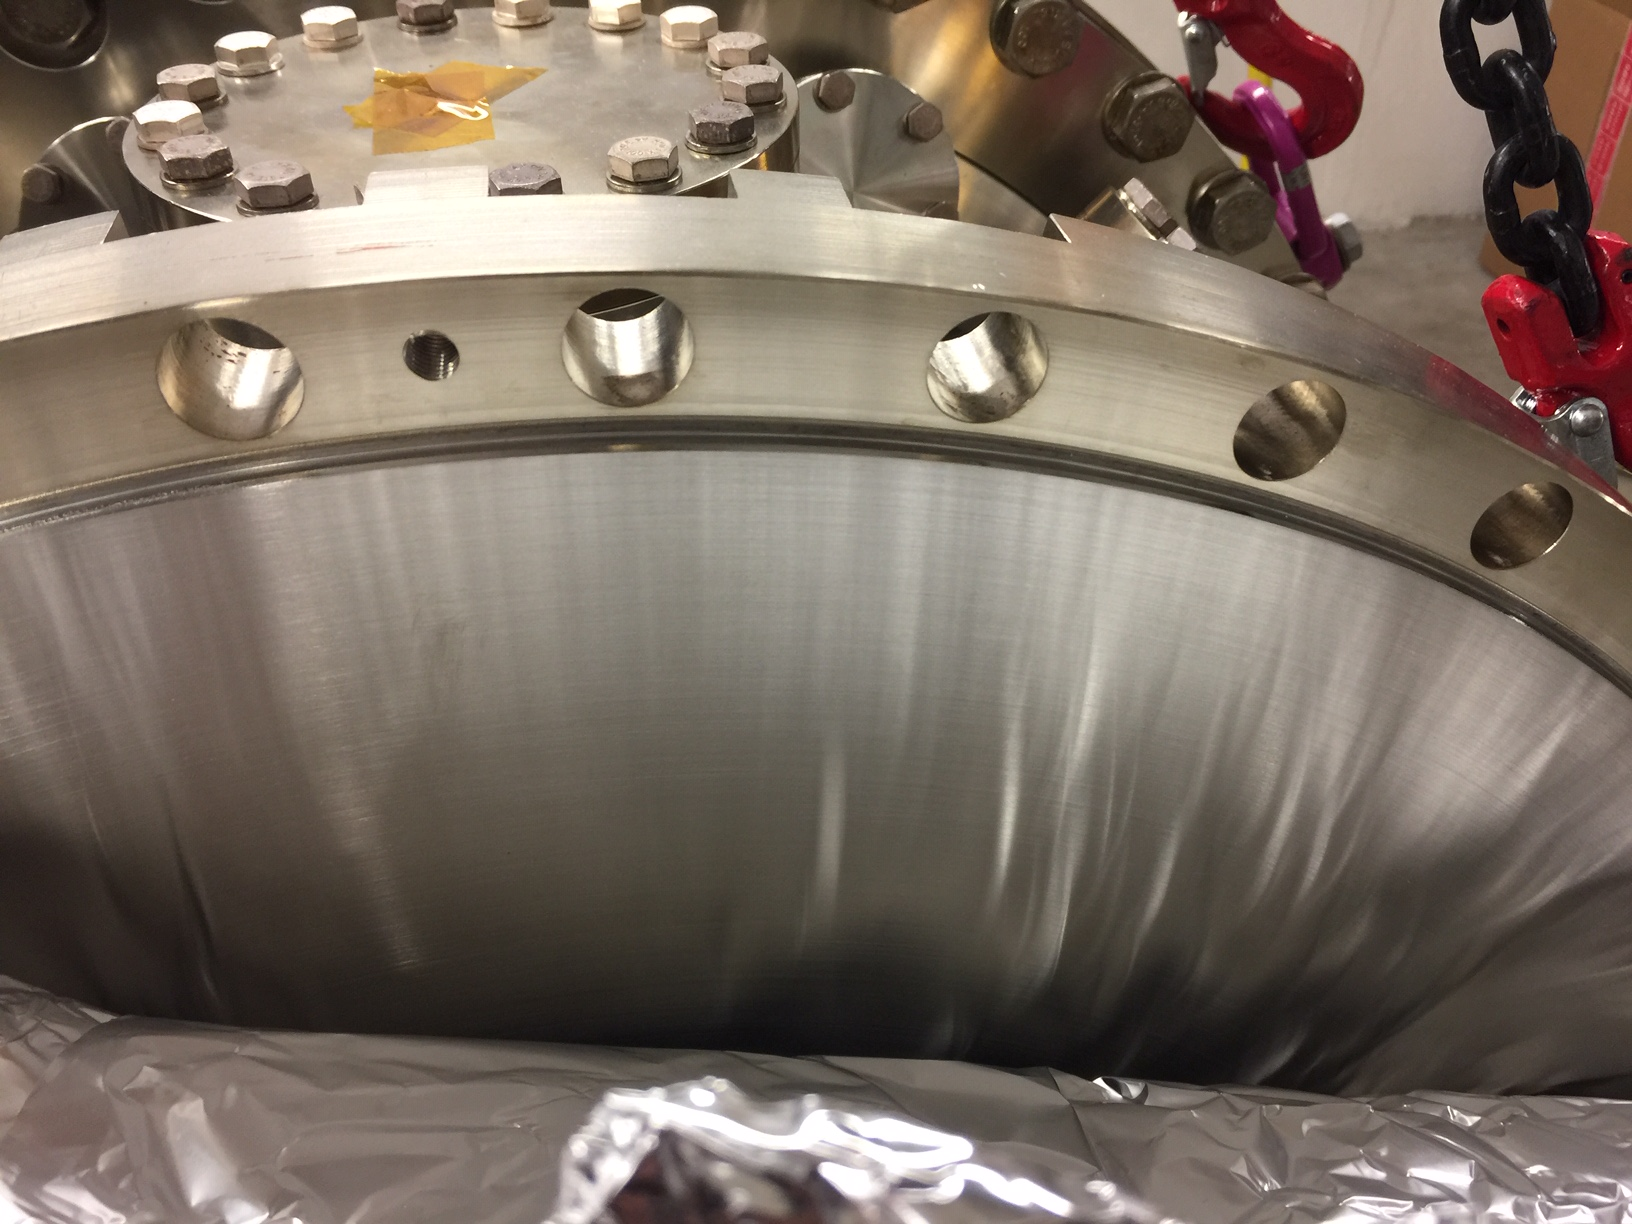
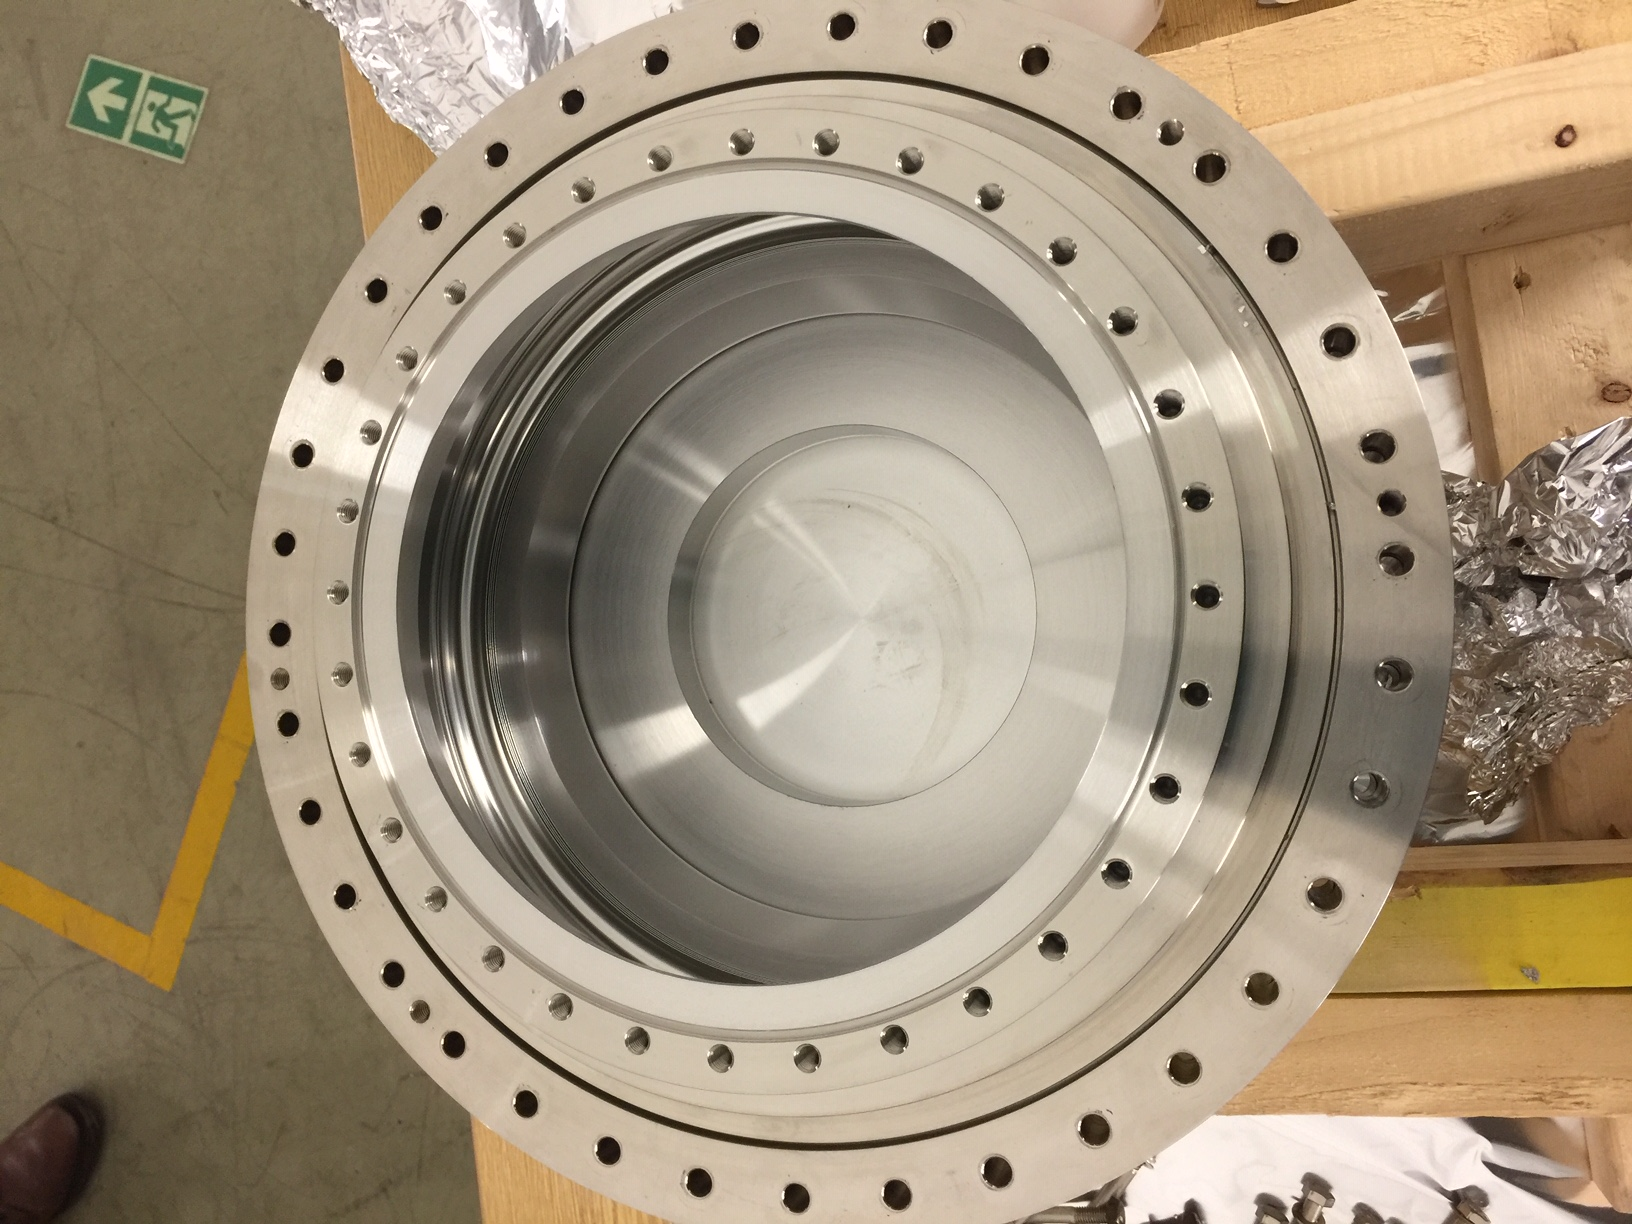
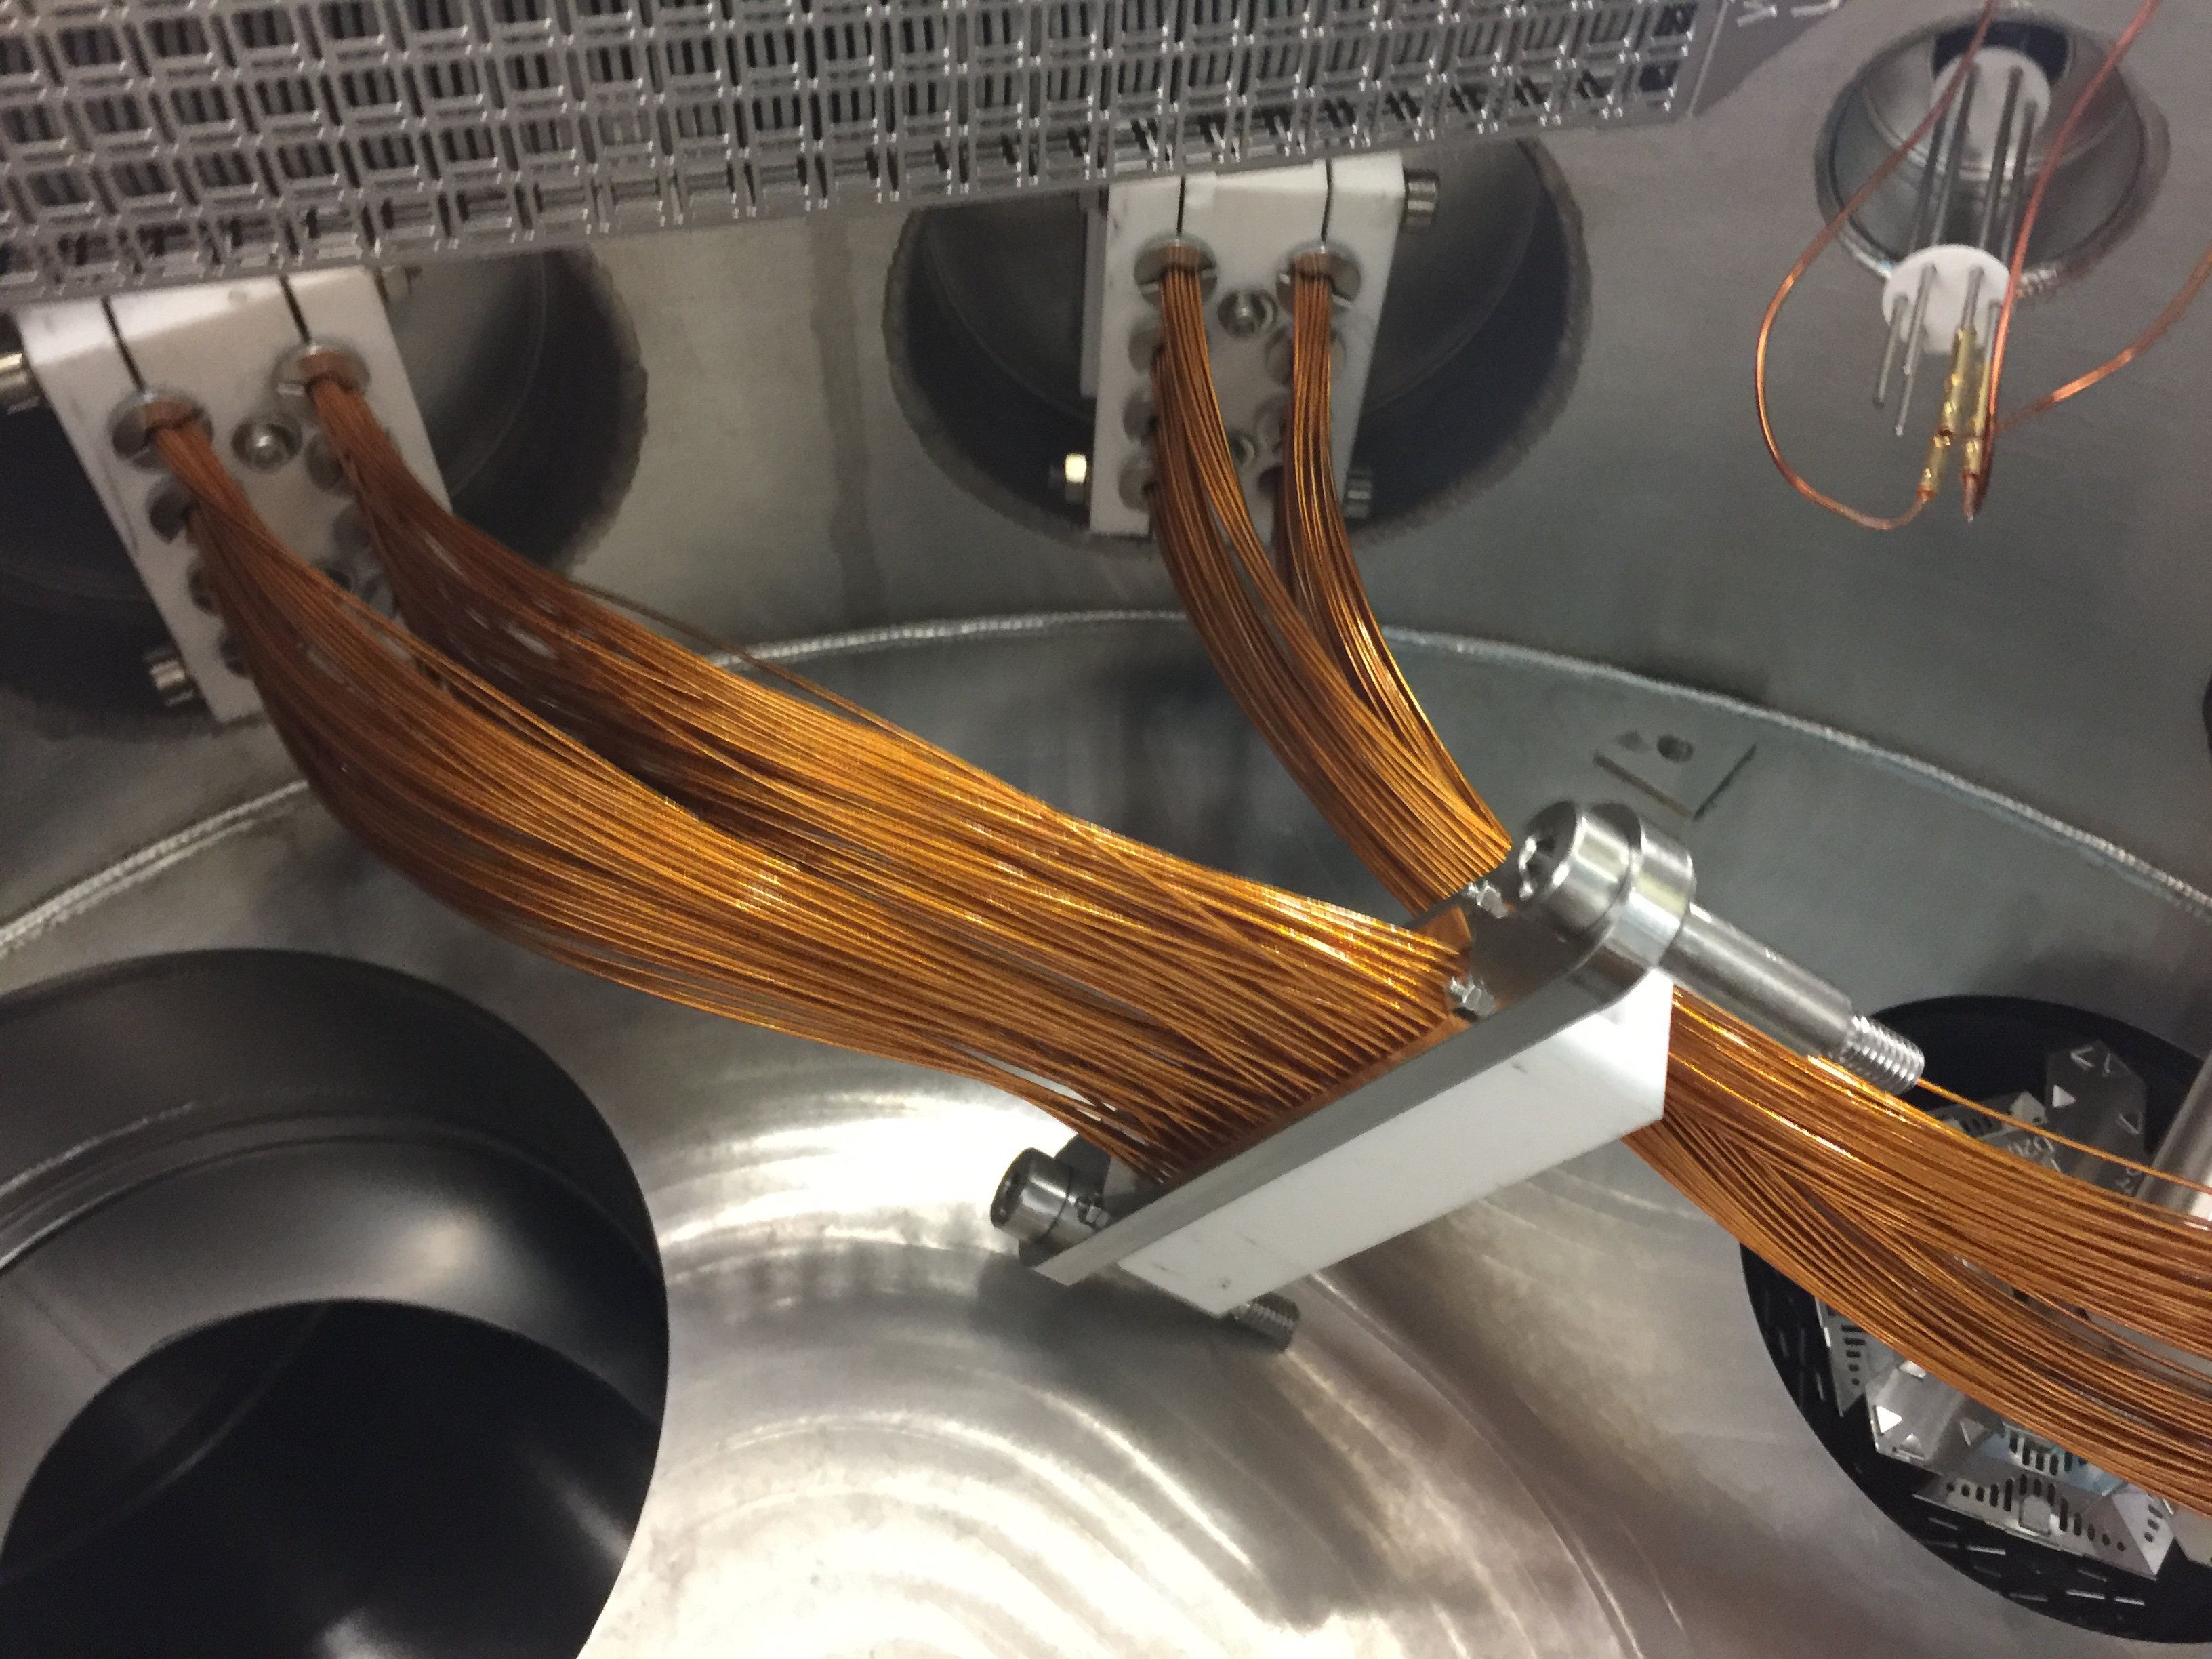
Cleaned wire seal recess and labeled thermocouples and flanges to identify p-n vs. n-n side and ports with bias pin. See attached in case baking damages the label.
Grossmontage insisted to clean wire seal once more to remove black stains noticed when opening. Kapton vapour condensation could be possible cause. They used special cleaning product from XHV (not sure what - acetone mix with something?)
Lifted CARME back. Inserted wire seal. Closed chamber. Step is noted between central CARME section and other two - it's normal. Noted some damage to SS vessel on the outside. Unclear what could have caused it but it's only cosmetic.
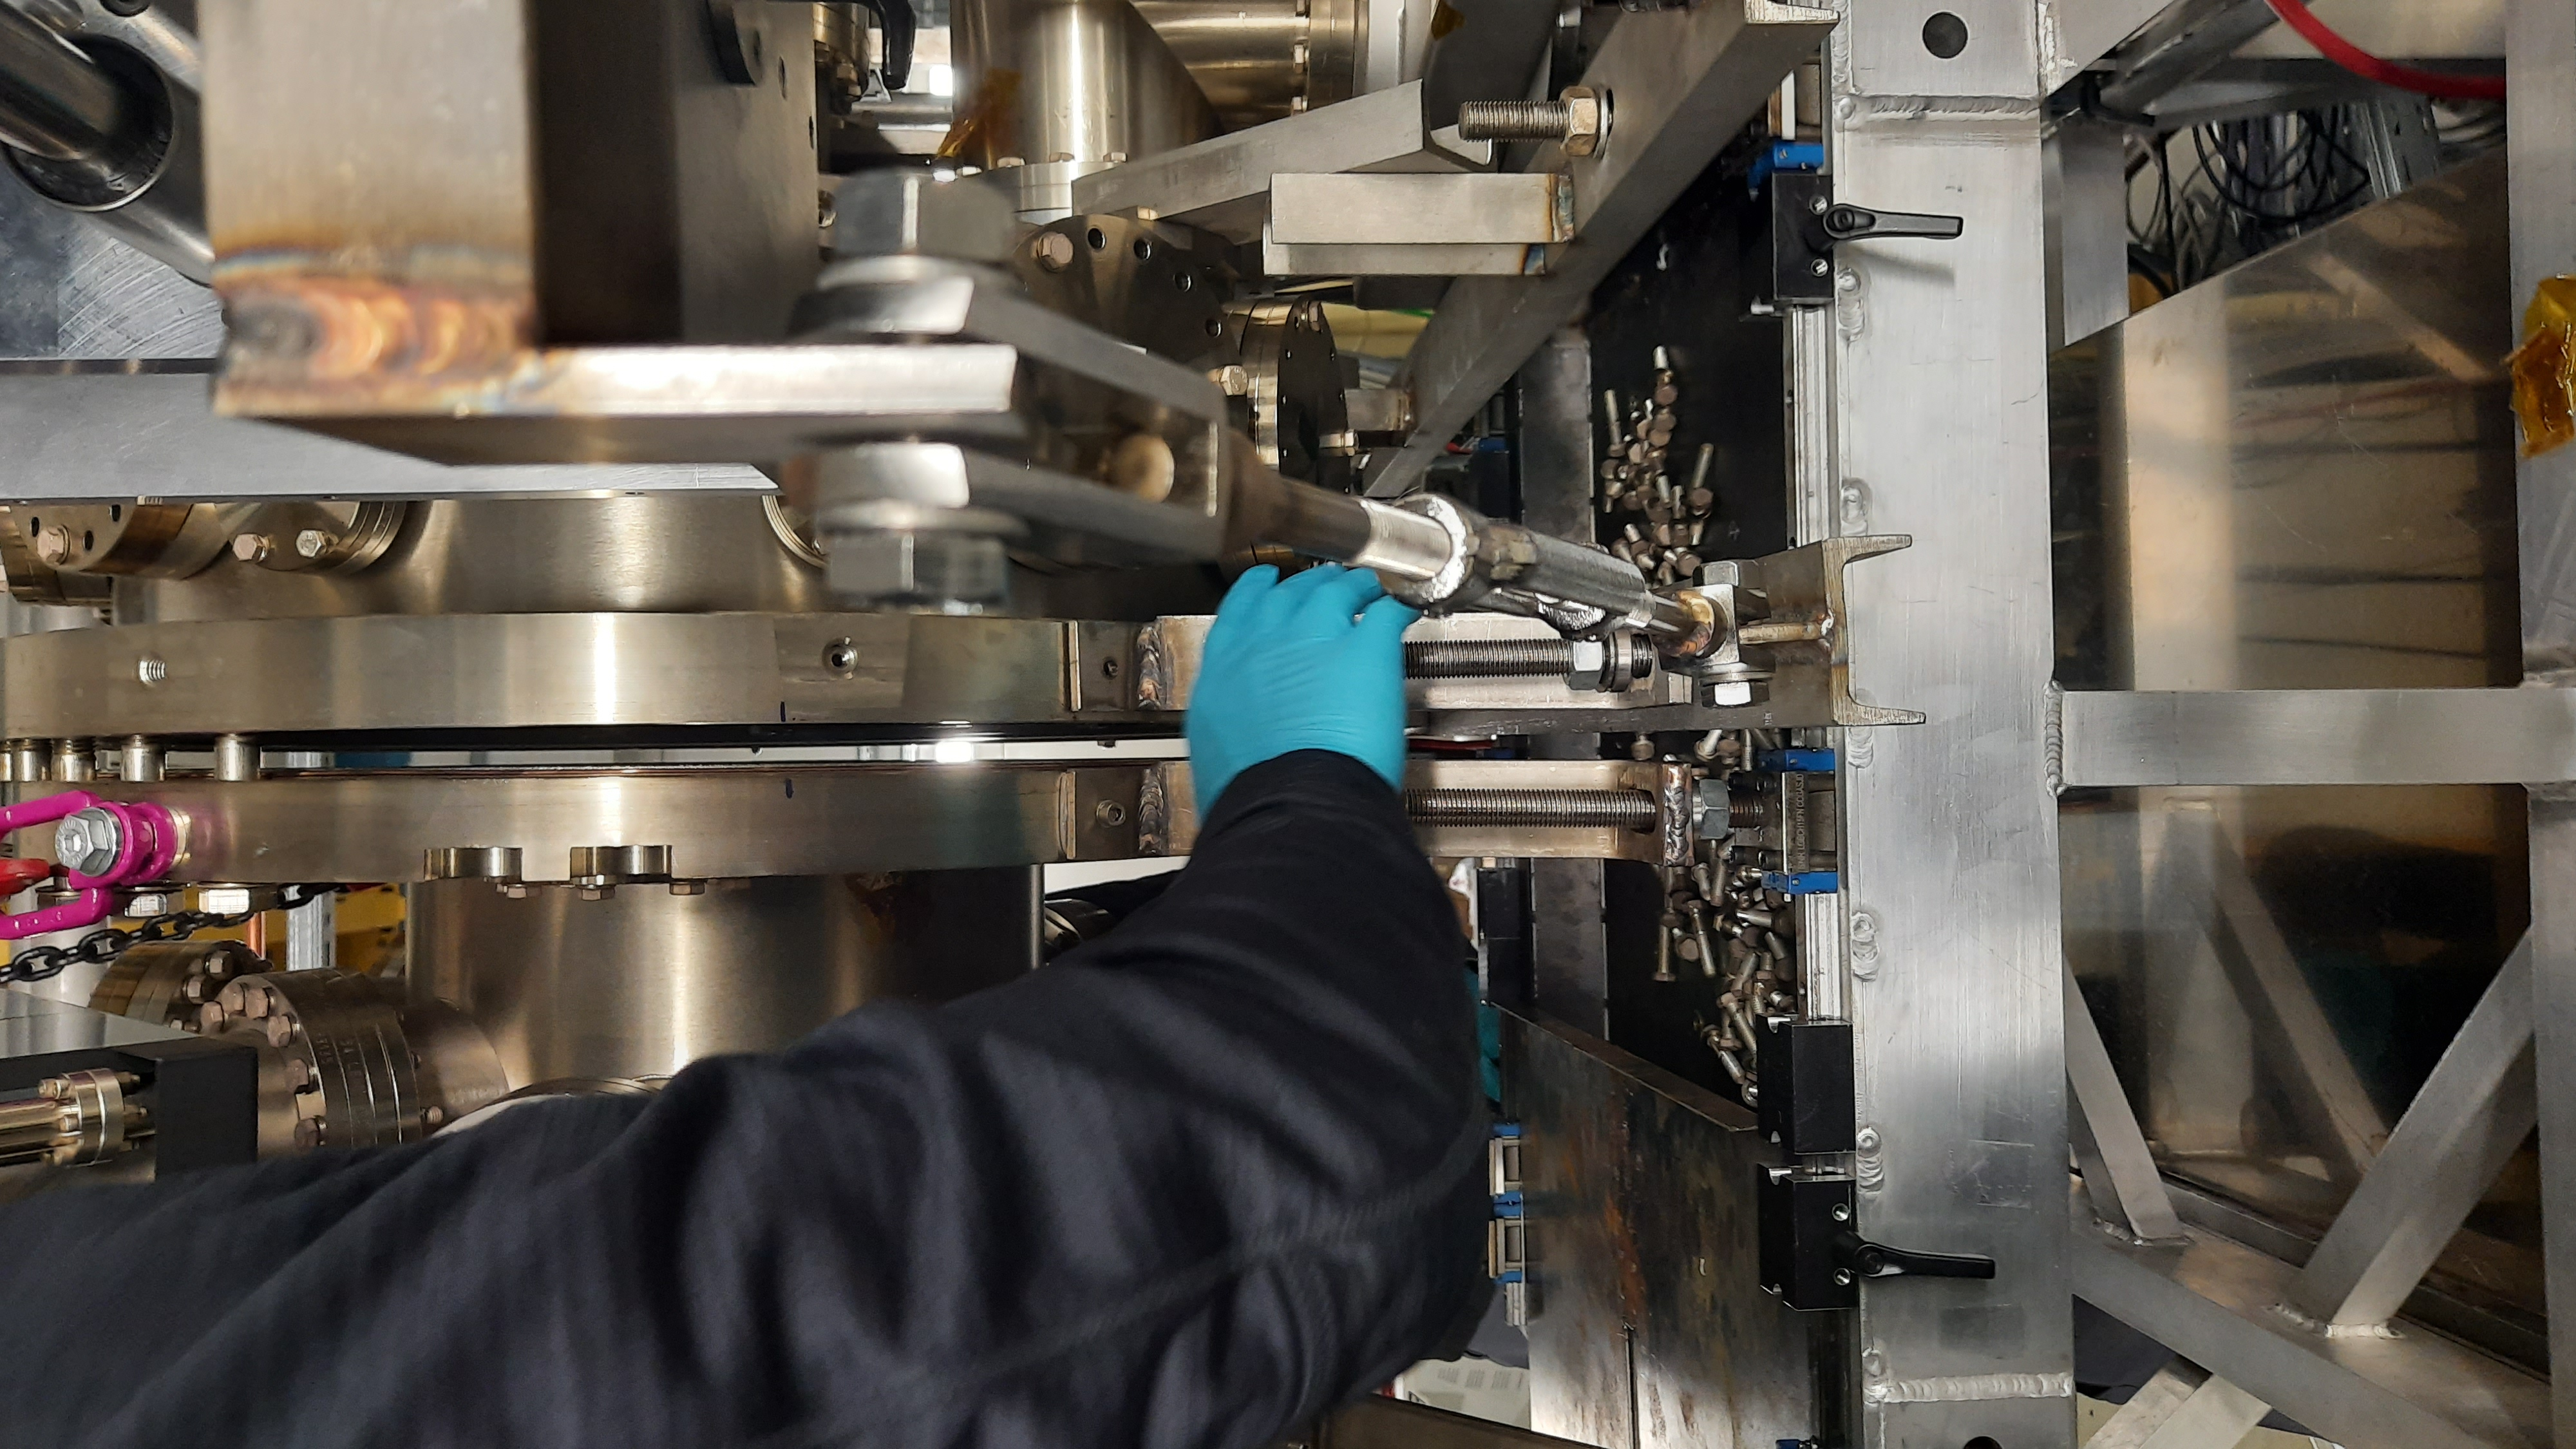
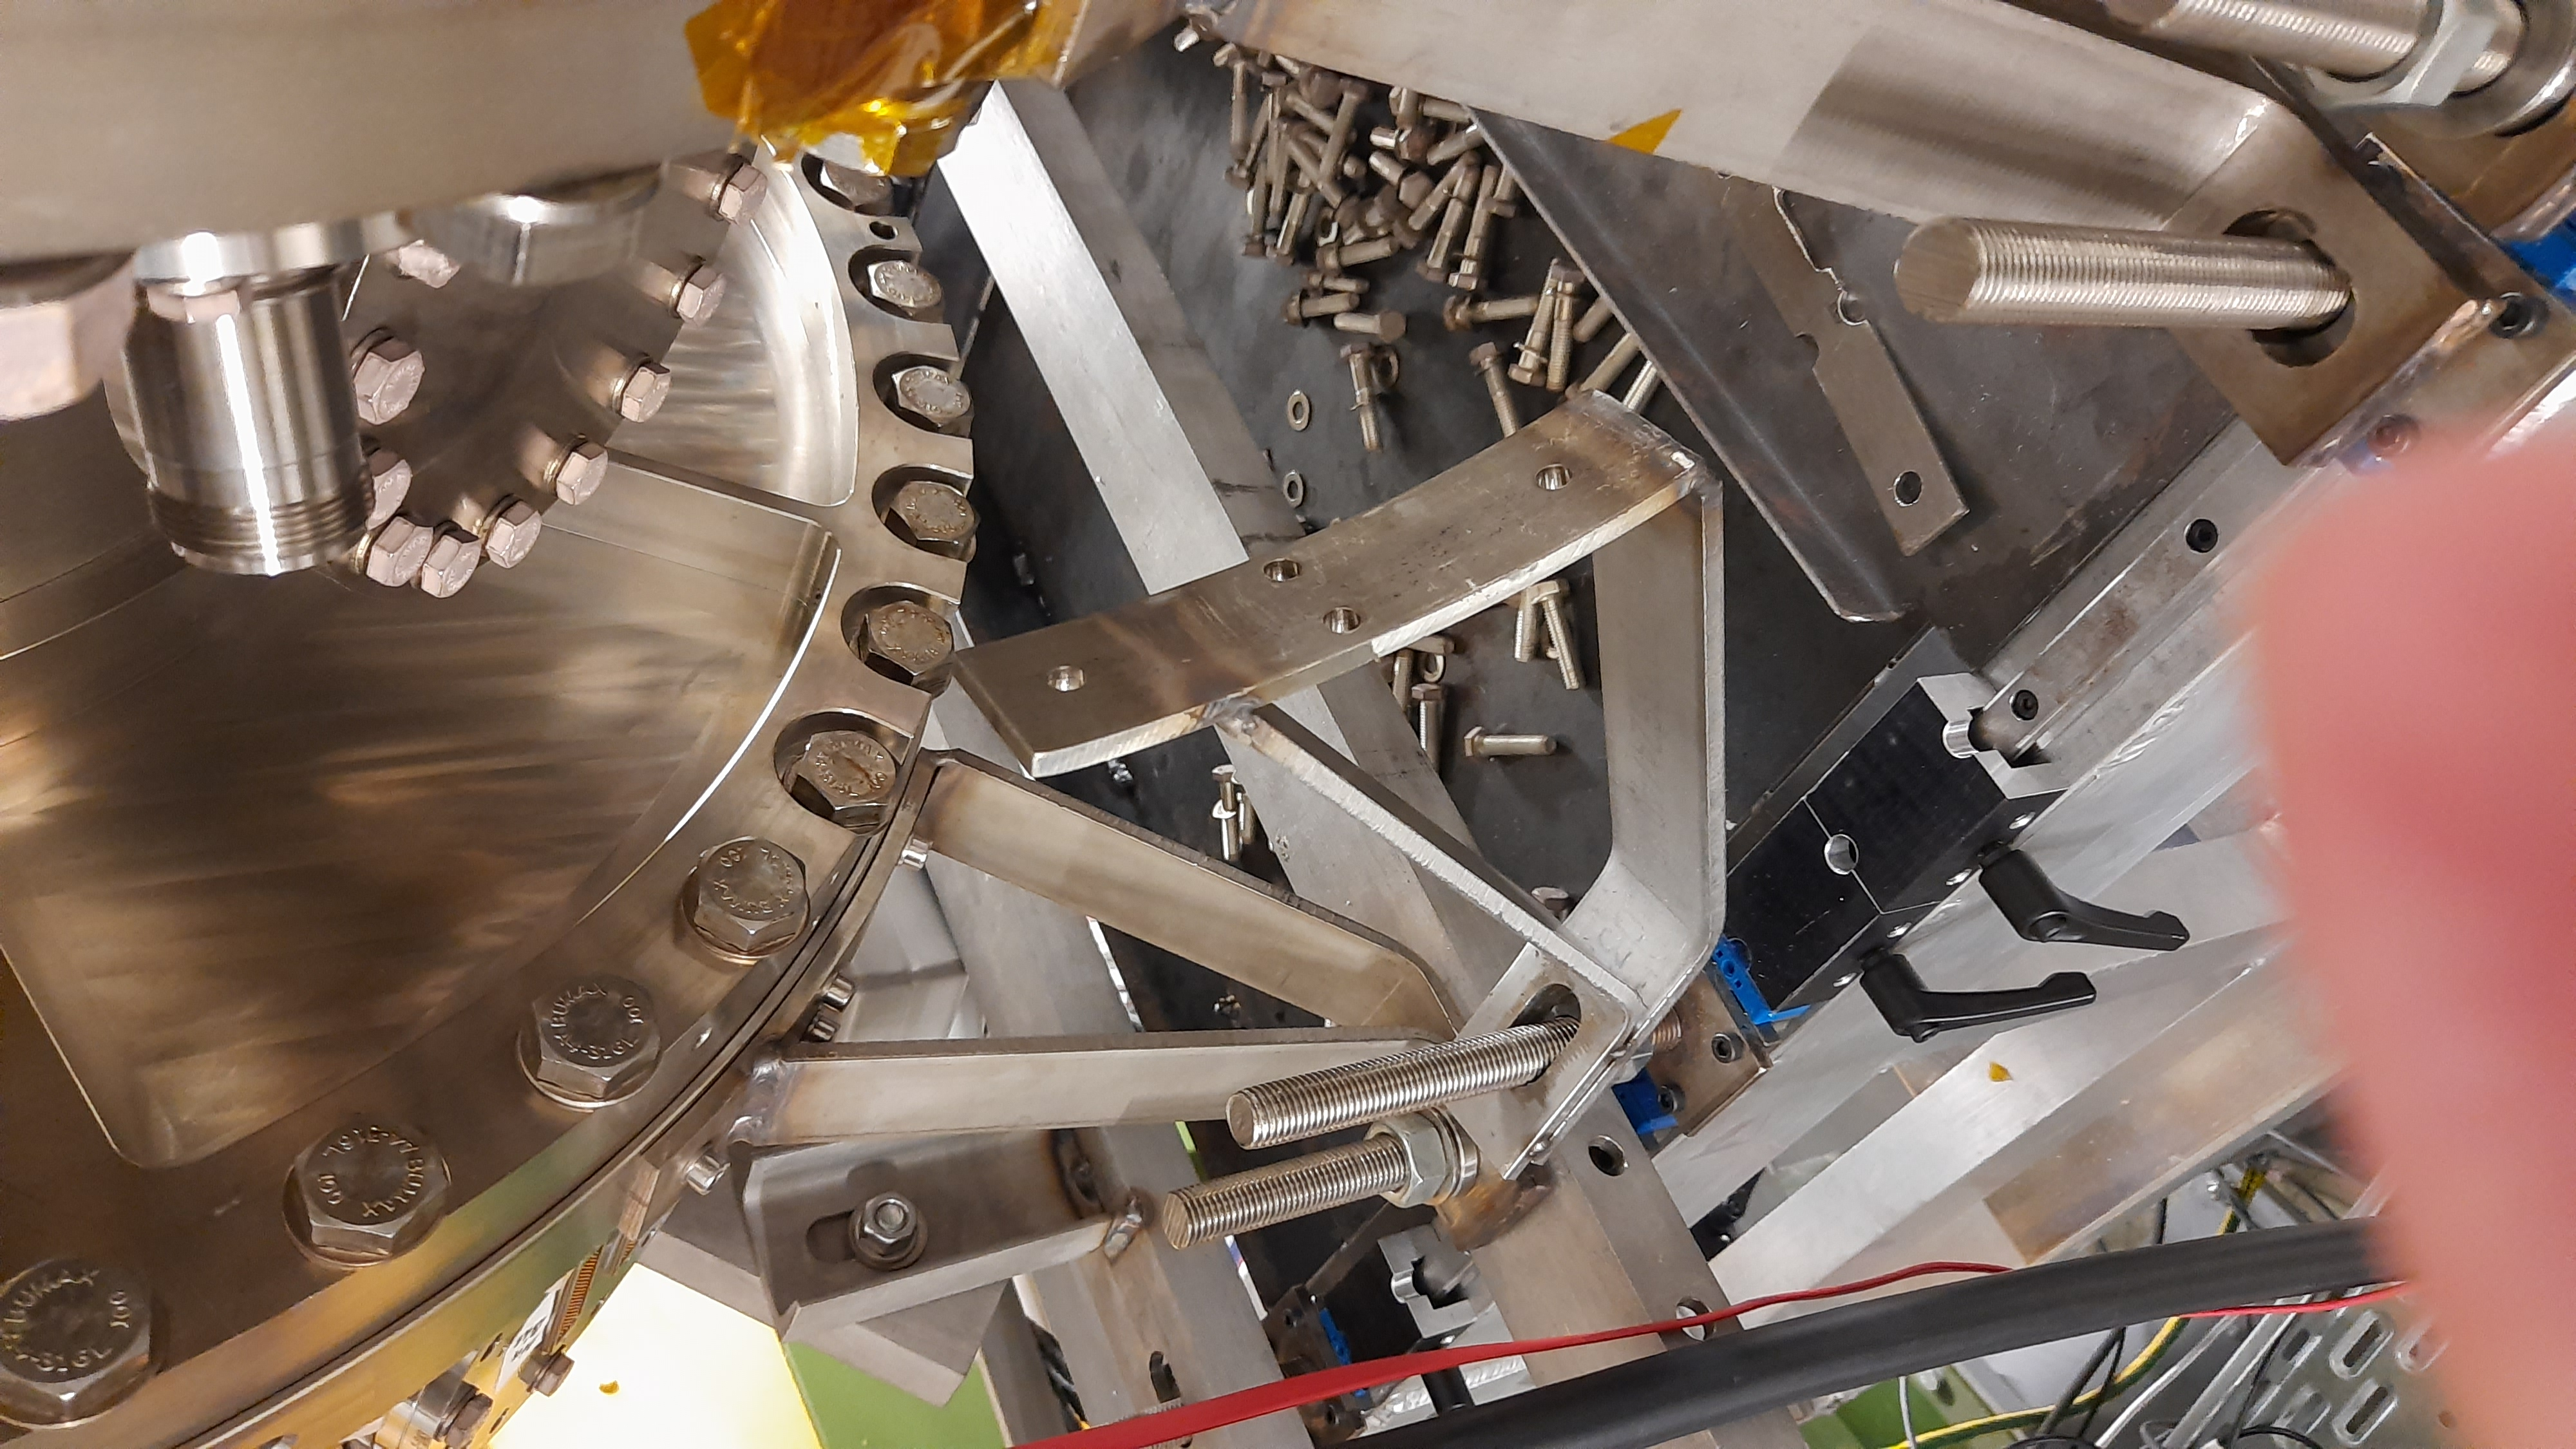
Wire seal tightened with 20 - 40 - 60 - 80 - 80 Nm turns starting from top and proceeding in a circle. Had to temporarily dismount on foot to make space for torque wrench. Also had to saw off front part of ratchet attachmnent to slide wrench between GSI ion pump and flange. All other flanges closed by Grossmontage. Pump down started. |
| Attachment 1: 20211029_110228.jpg
|

|
| Attachment 2: 20211029_110617.jpg
|
|
| Attachment 3: 20211029_115220.jpg
|
|
| Attachment 4: 20211029_130422.jpg
|

|
| Attachment 5: LowerFeedthroughs.png
|
|
| Attachment 6: PXL_20211029_074516697.jpg
|
|
| Attachment 7: PXL_20211029_080123618.jpg
|

|
| Attachment 8: PXL_20211029_080130072.jpg
|

|
| Attachment 9: PXL_20211029_080130885.jpg
|

|
| Attachment 10: PXL_20211029_080136793.jpg
|

|
| Attachment 11: PXL_20211029_080139929.jpg
|

|
|
136
|
Sun Oct 31 07:55:39 2021 |
CB JM + OH | Strain relief mounted |
(Thu 28 October)
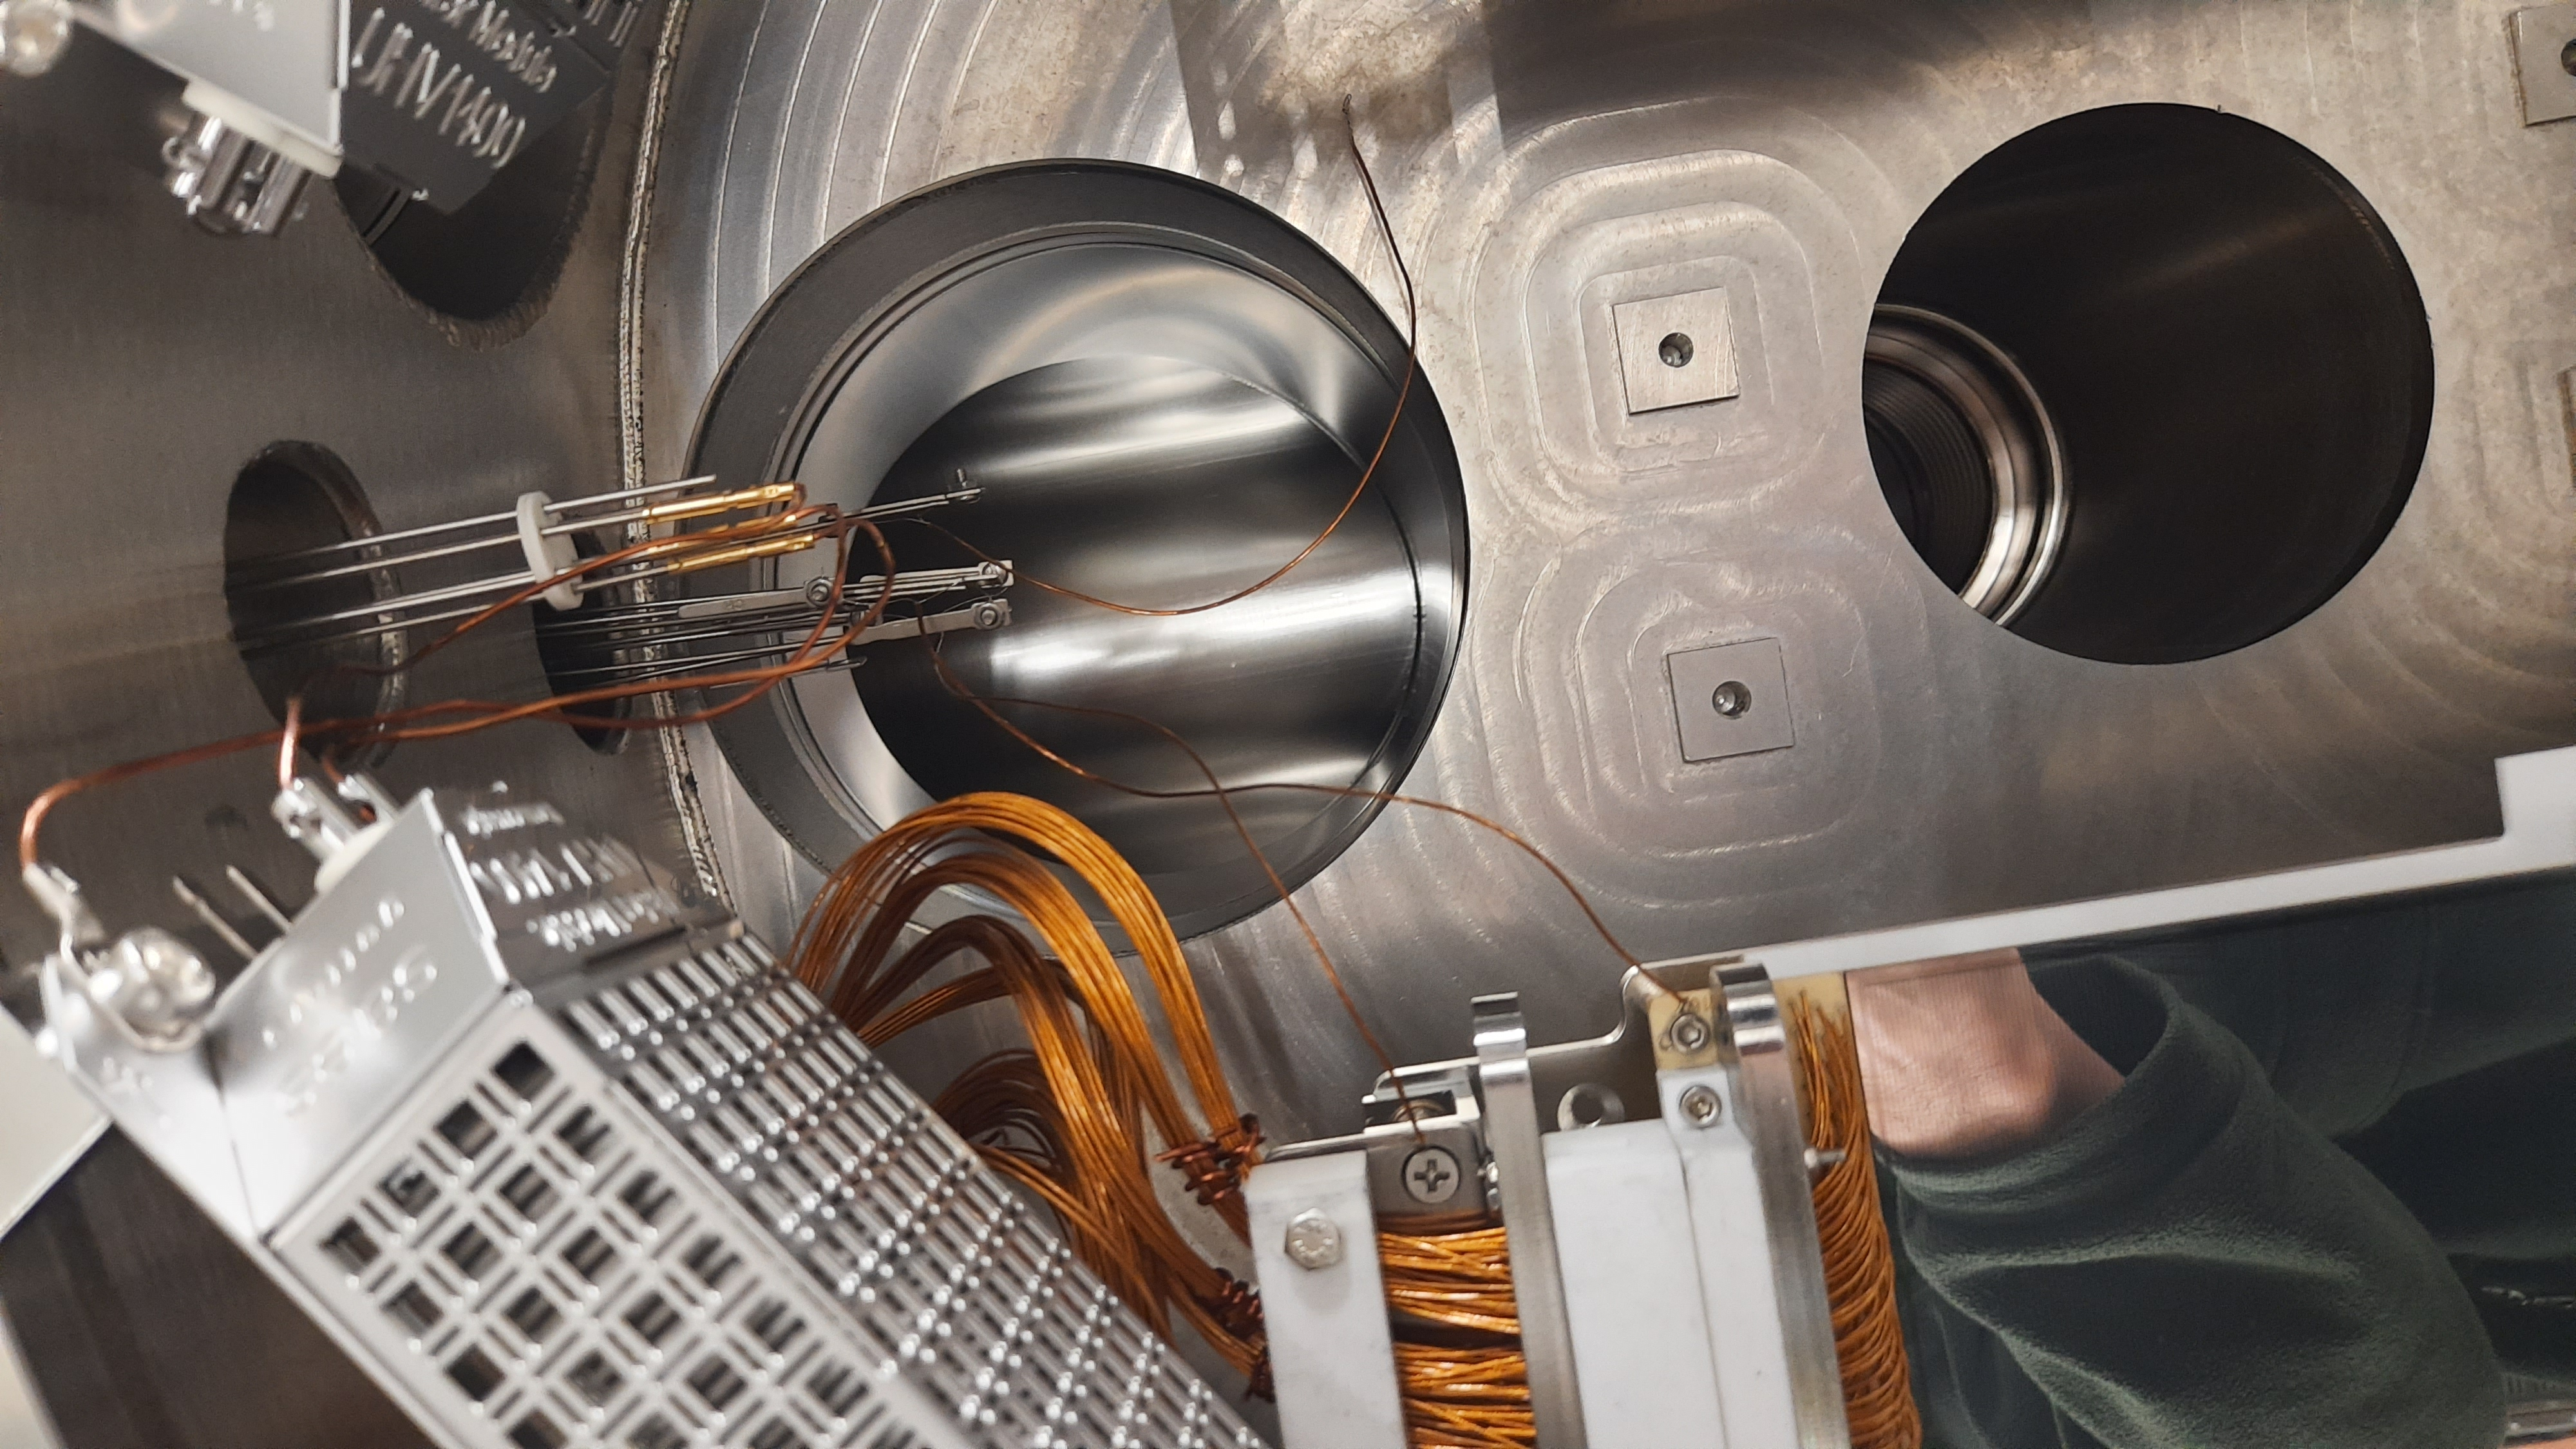
All strain relief extension plates mounted behind the wires, using SS countersunk bolts (not silver plated).
Inserting bottom part of MACOR strain relief causes wires to bend too much with strain placed on DSSD. No reasonable way to proceed like that.
Opted to move hard kapton coated copper wire to line up with holes in top MACOR strain relief, and clamp the wrapped wire bundles between top MACOR strain relief and extension plate on bottom.
Results good. No significant movement when wires are moved or motors actuated. See videos - password abcd1234
https://datasync.ed.ac.uk/index.php/s/5waHTSY9husEgy9
https://datasync.ed.ac.uk/index.php/s/34293z7kQs2Mppd
https://datasync.ed.ac.uk/index.php/s/xmHFVqqIchtixGT
Mounted plate with MACOR shield on other rod. Connected thermocouples. Re-mounted 2x UHV1400 getters.
With help from OH attempted V-I test of detectors. SHV to 2x lemo broken (faulty lemo connector). Had to borrow AID@DESPEC cable.
Diode function OK. VI tests OK but inconclusive. Both DSSDs drain current when voltage is applied, but current not quite stable. Light leak very likely. Will attempt again after closing. |
| Attachment 1: 20211028_190026.jpg
|

|
| Attachment 2: 20211028_192251.jpg
|
|
| Attachment 3: 20211028_192210.jpg
|

|
|
135
|
Sun Oct 31 07:41:20 2021 |
CB JM + RSS | Wires plugged in DSSDs |
(Wed 27 October)
Started with top-most flange. Attemptedto plug in MACOR lead in DSSD plug in preparation for jacking in. Realised that extender plate thickness causes plug to be rasied with respect to nominal position, which results in plug non entering straight. Removed extension plate.
Plugged MACOR lead in. OK. Inserted M6 jacking bolts and gently turned by hand. No resistance until jacking action starts. Jacked plug in with spanner and even 1/4 turns. Removed bolts. All OK.
Attempted same with bottom-most cable harness. Due to strain from top-most wire harness the plate is now rotated on the rod. Rotated back. Jacked in. Removed bolts. No issues.
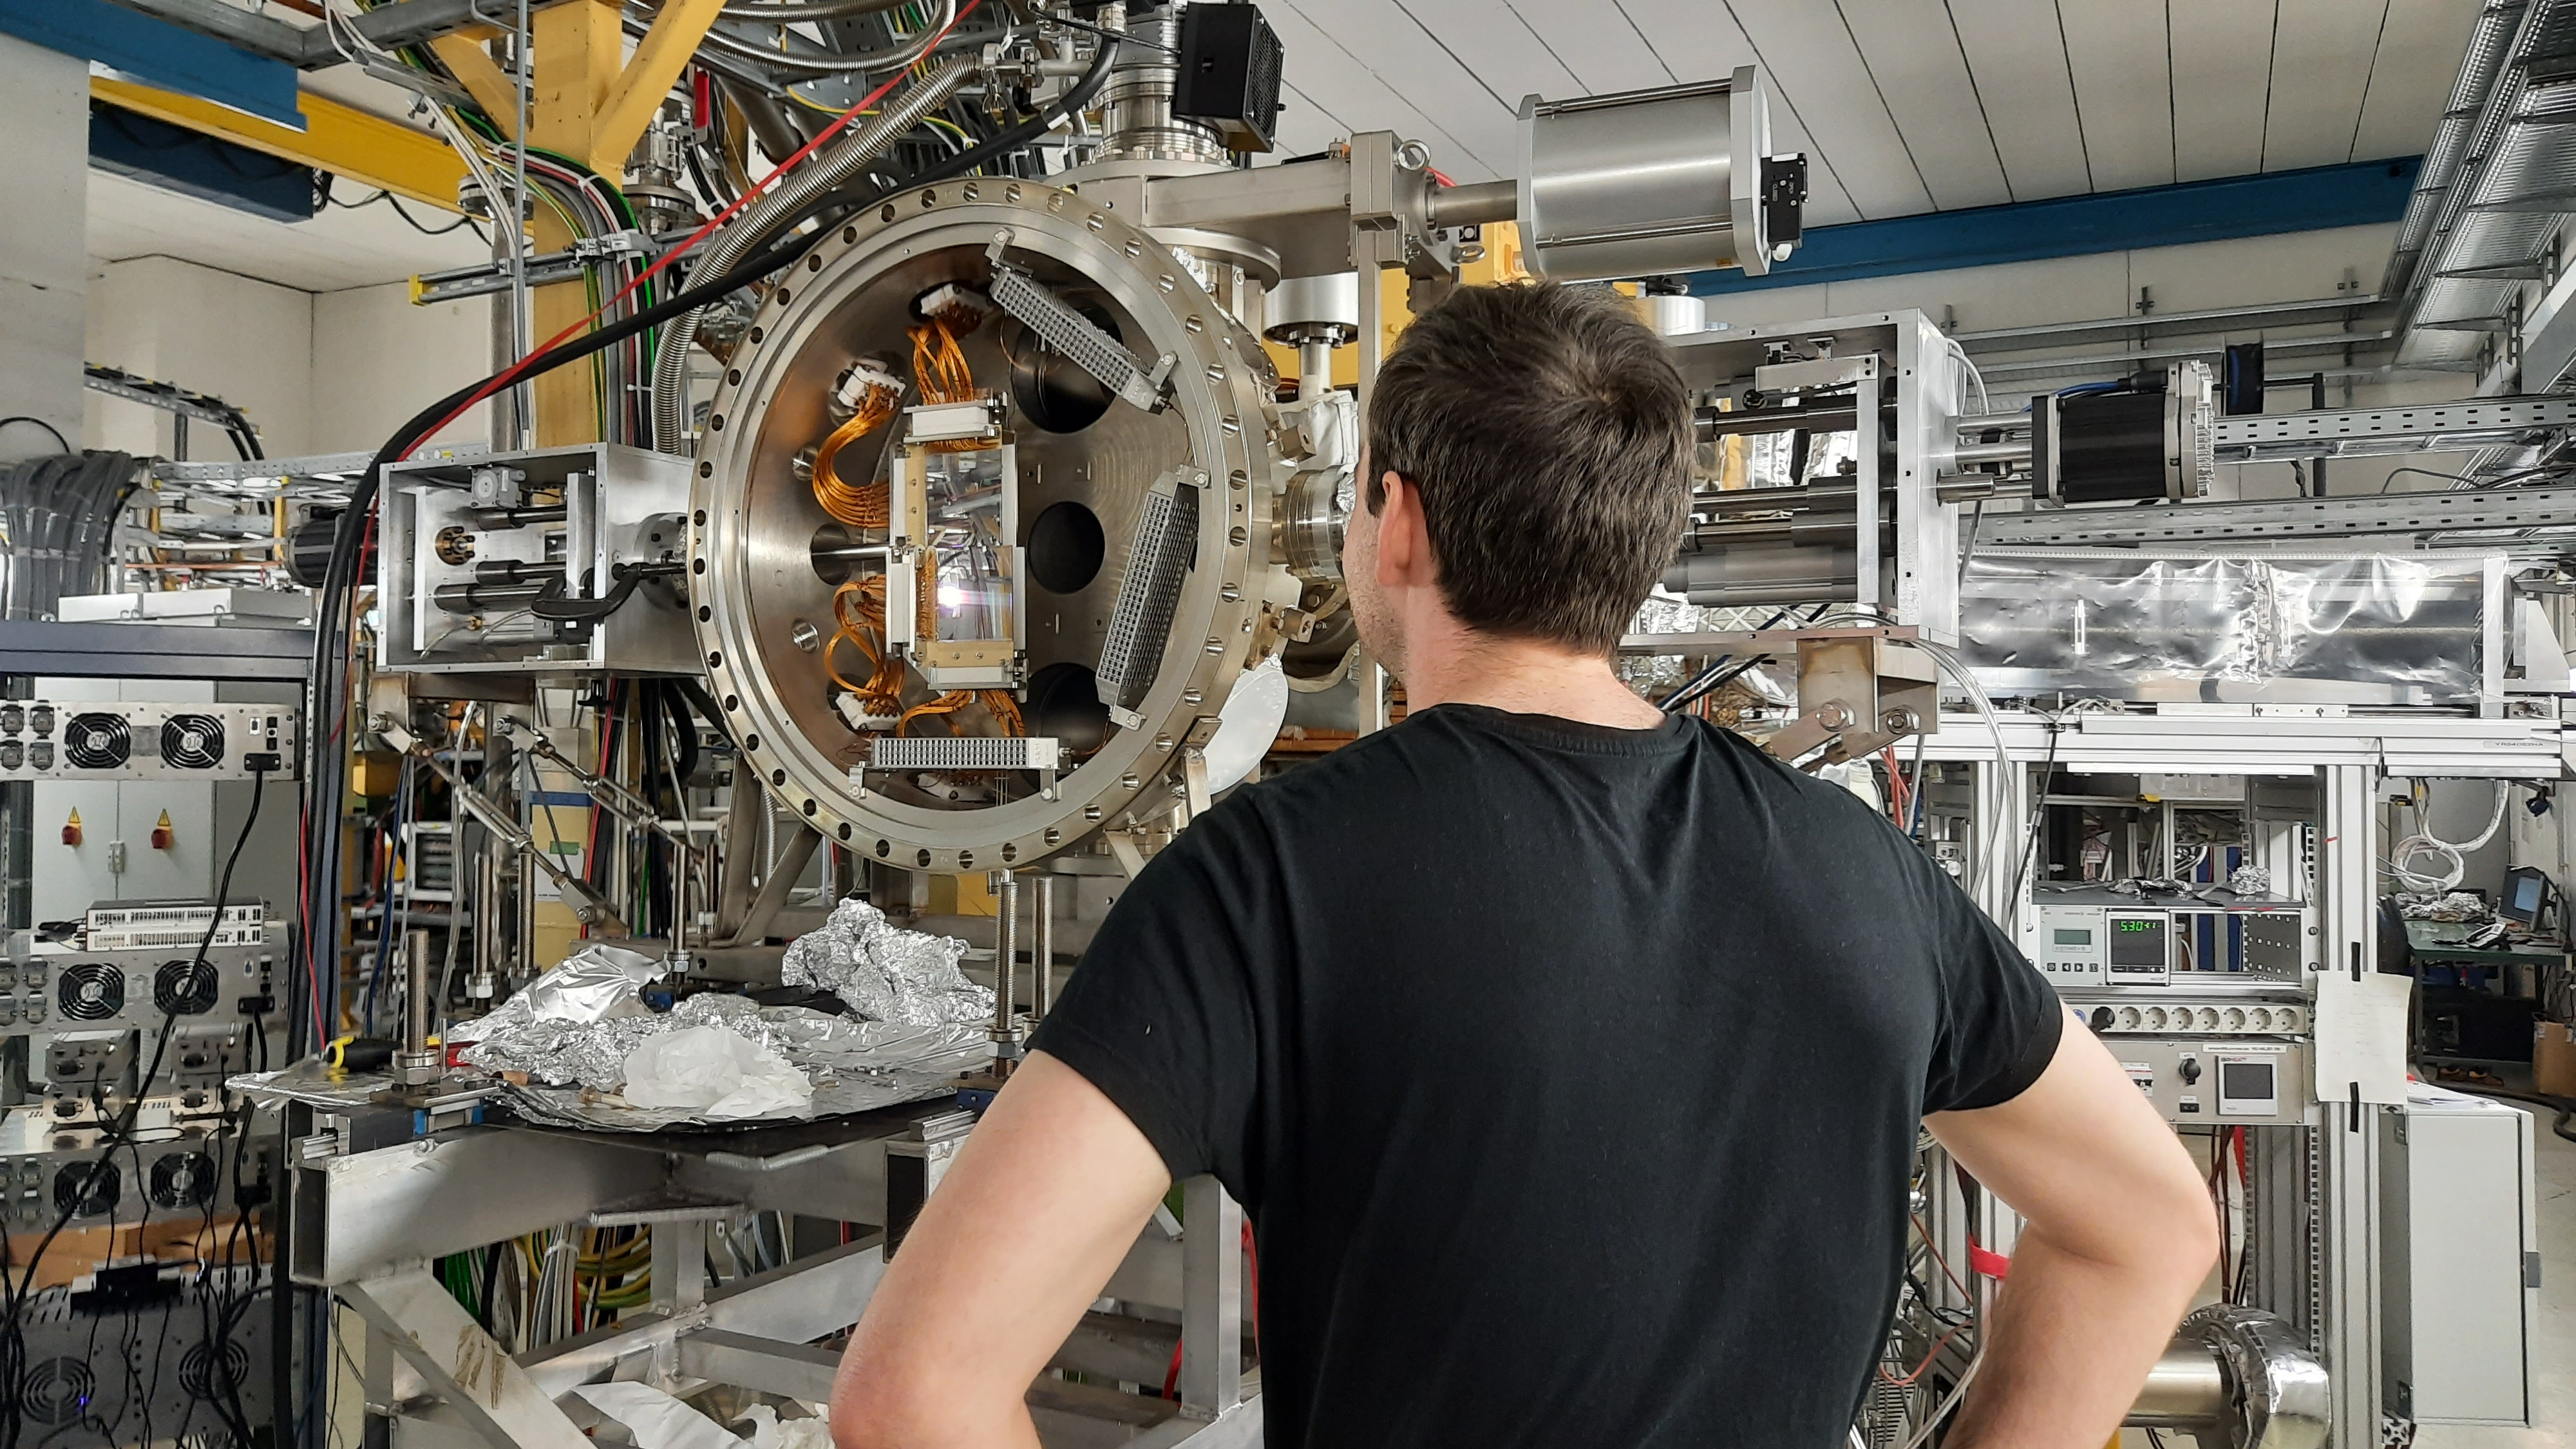
MACOR plugs show small gap in rear part. Gap seems due to harness strain and disappears depending on plate orientation. Will check but pins are obviously connected.
(Thu 28 October)
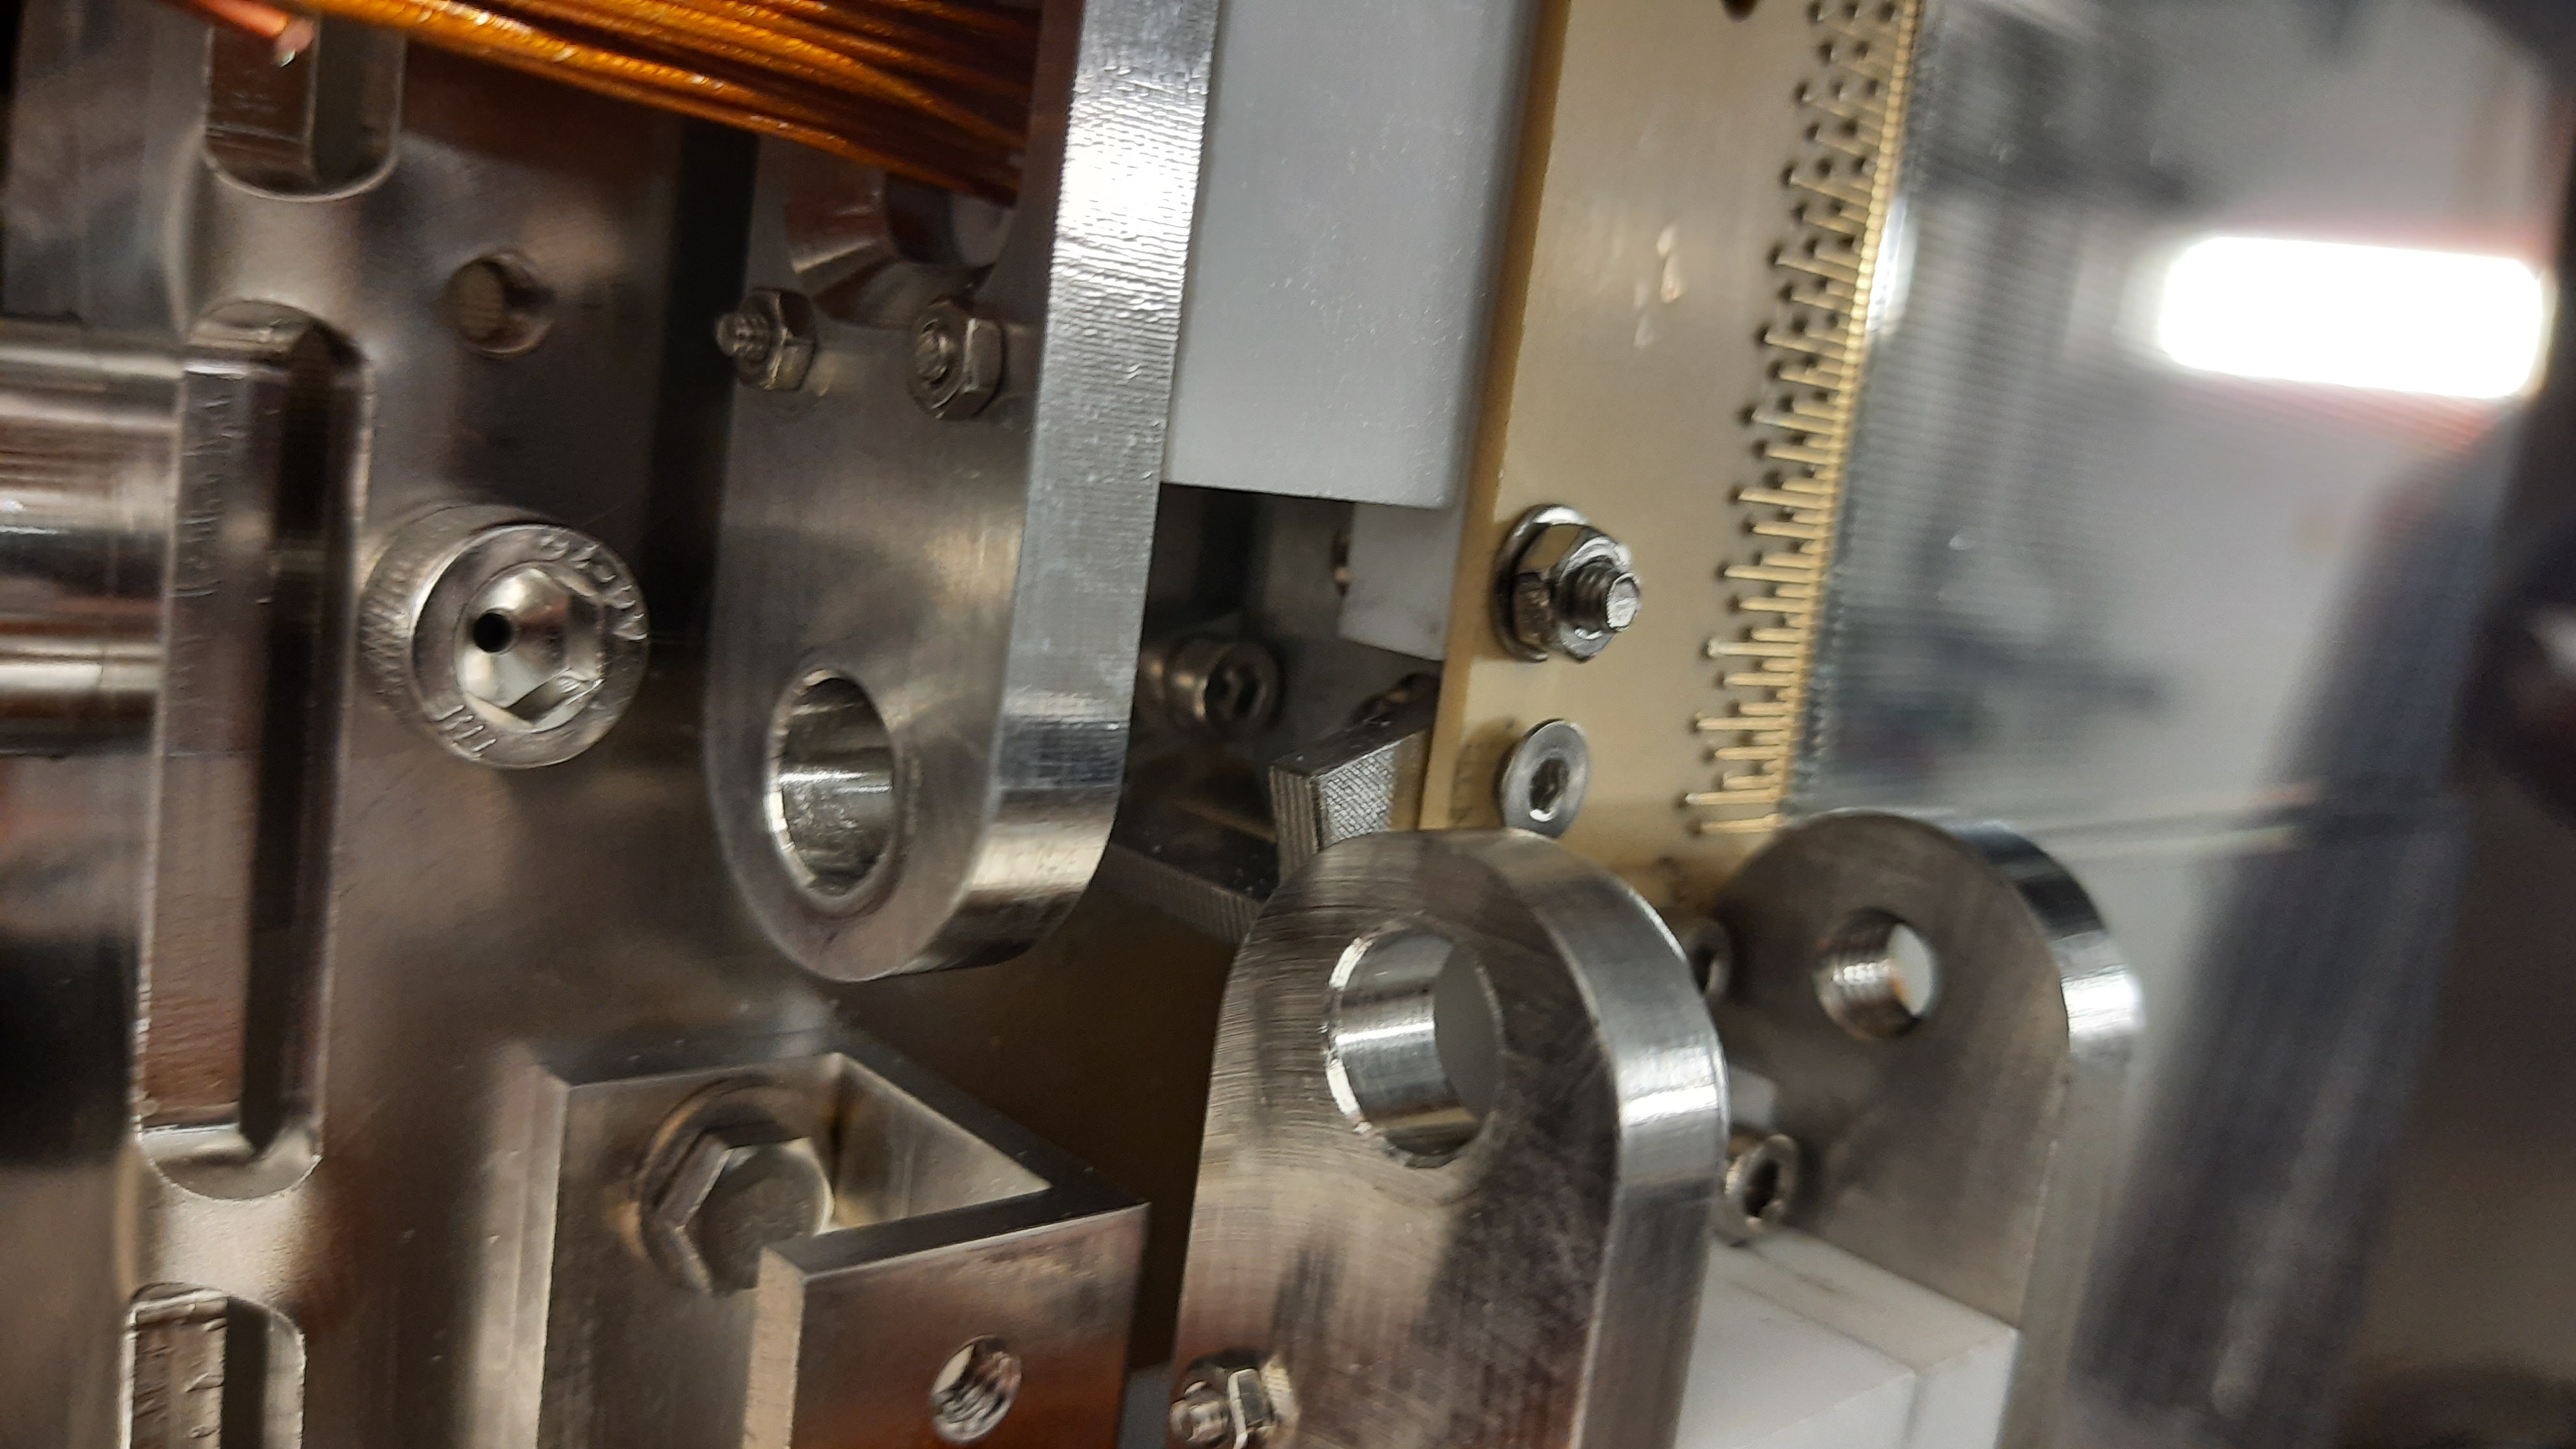
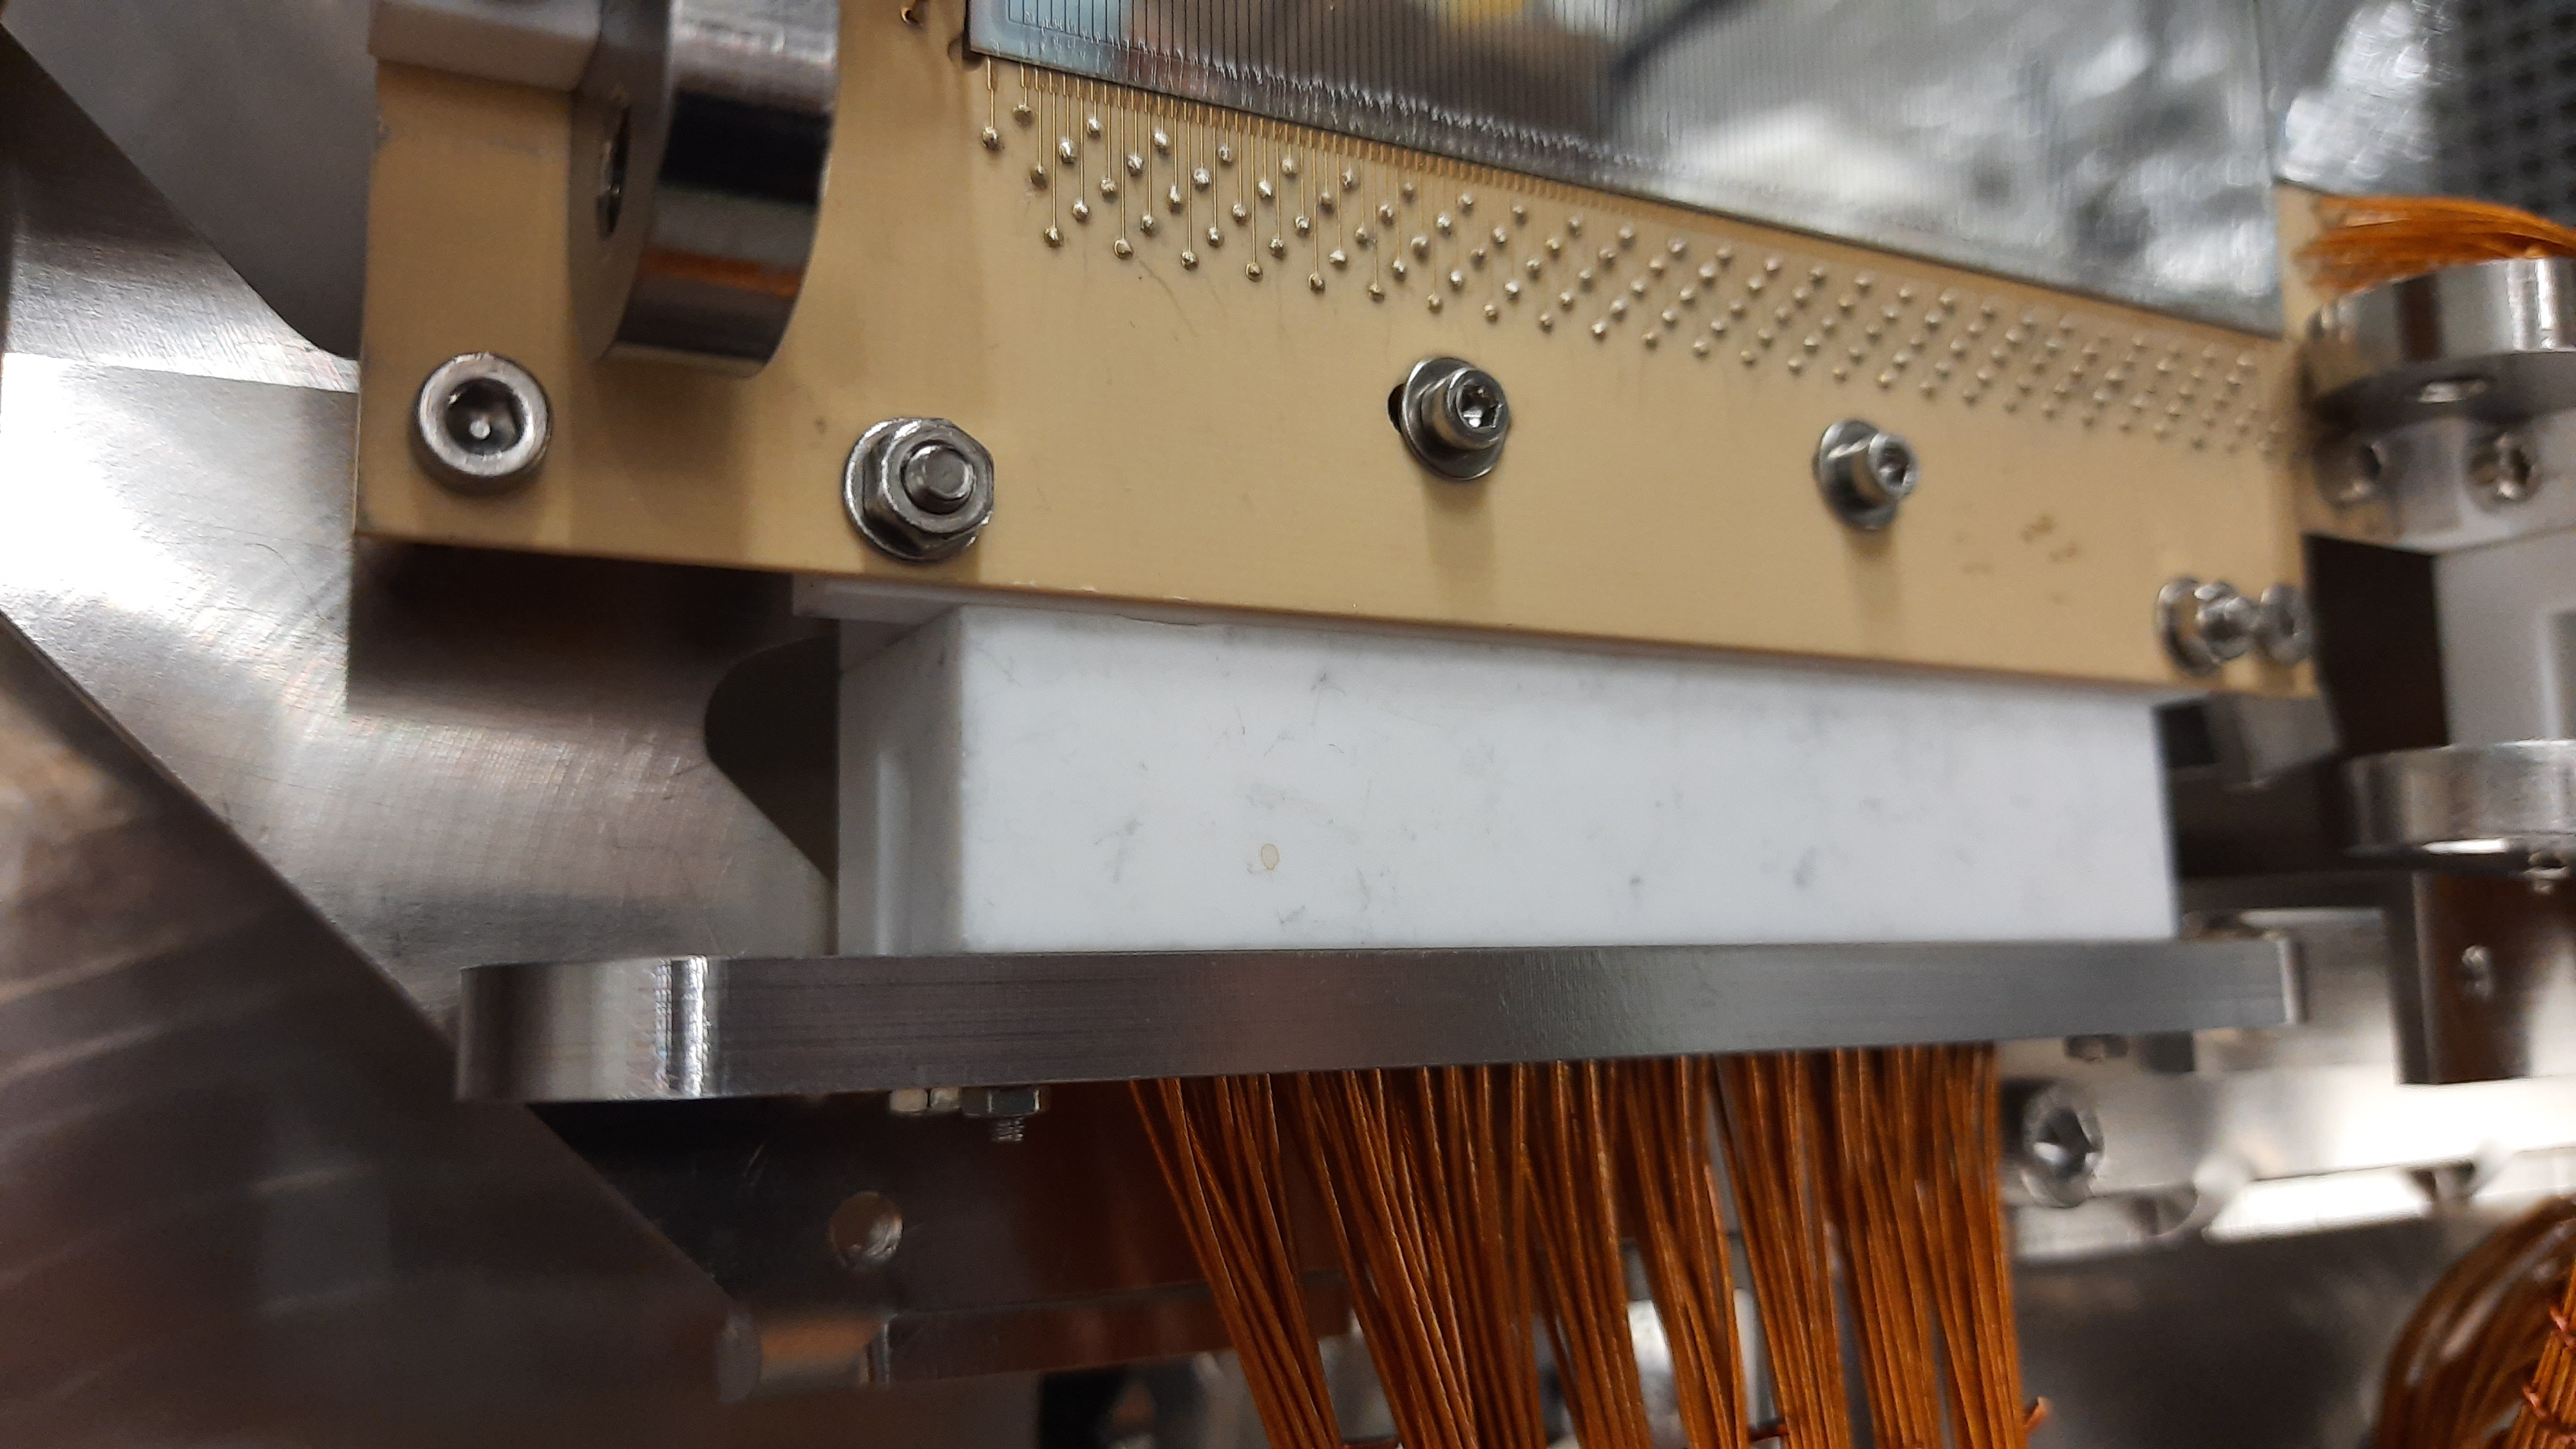
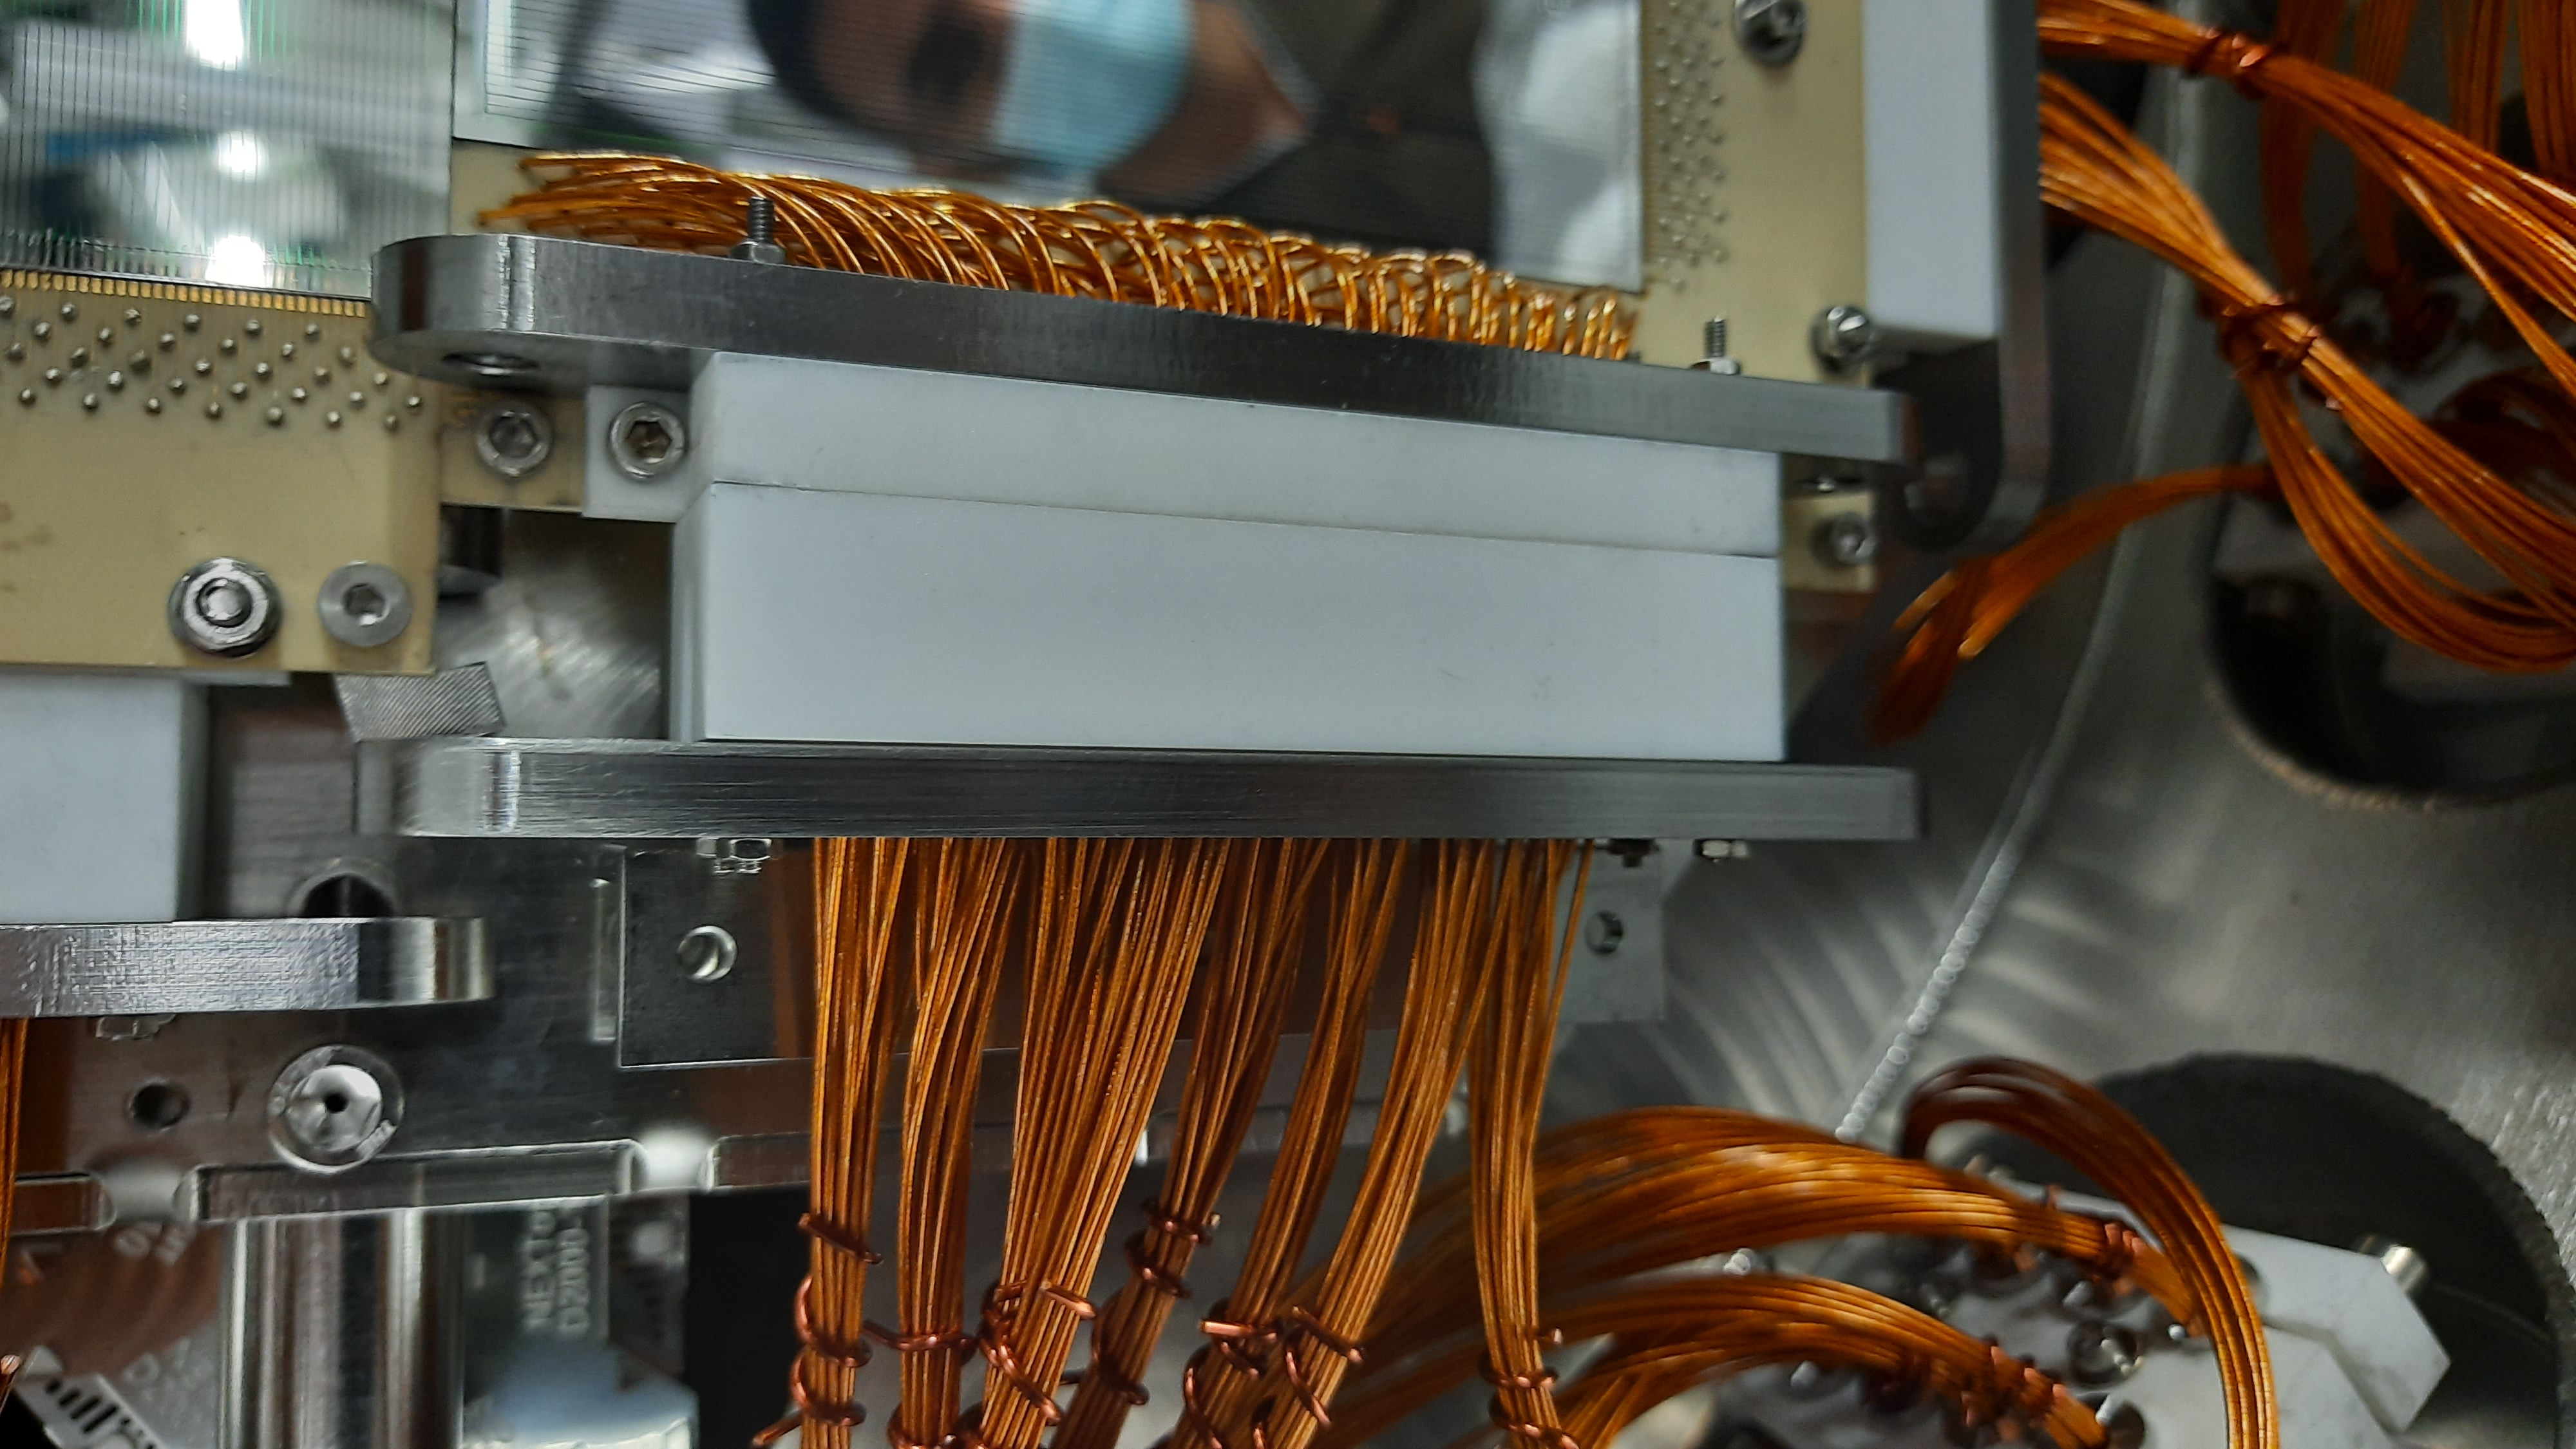
Attempted to plug in top-left MACOR lead. Dog leg conflicts with jacking screw! Only solution is to slacken bolt, rotate strut, fasten again with detectors still on plate. Result attached. No clear if design, manufacturing or mounting oversight.
Had to attemping plugging in a few times before jacking bolts went in straight (i.e. no resistance felt). Jacked in both leads. No further issues.
Gap appears less significant in newly plugged leads. probably as a result of lack of rotational freedom.
|
| Attachment 1: 20211027_184502.jpg
|

|
| Attachment 2: 20211027_184527.jpg
|

|
| Attachment 3: 20211027_184535.jpg
|

|
| Attachment 4: 20211028_105802.jpg
|
|
| Attachment 5: 20211028_105919.jpg
|
|
| Attachment 6: 20211028_105711.jpg
|
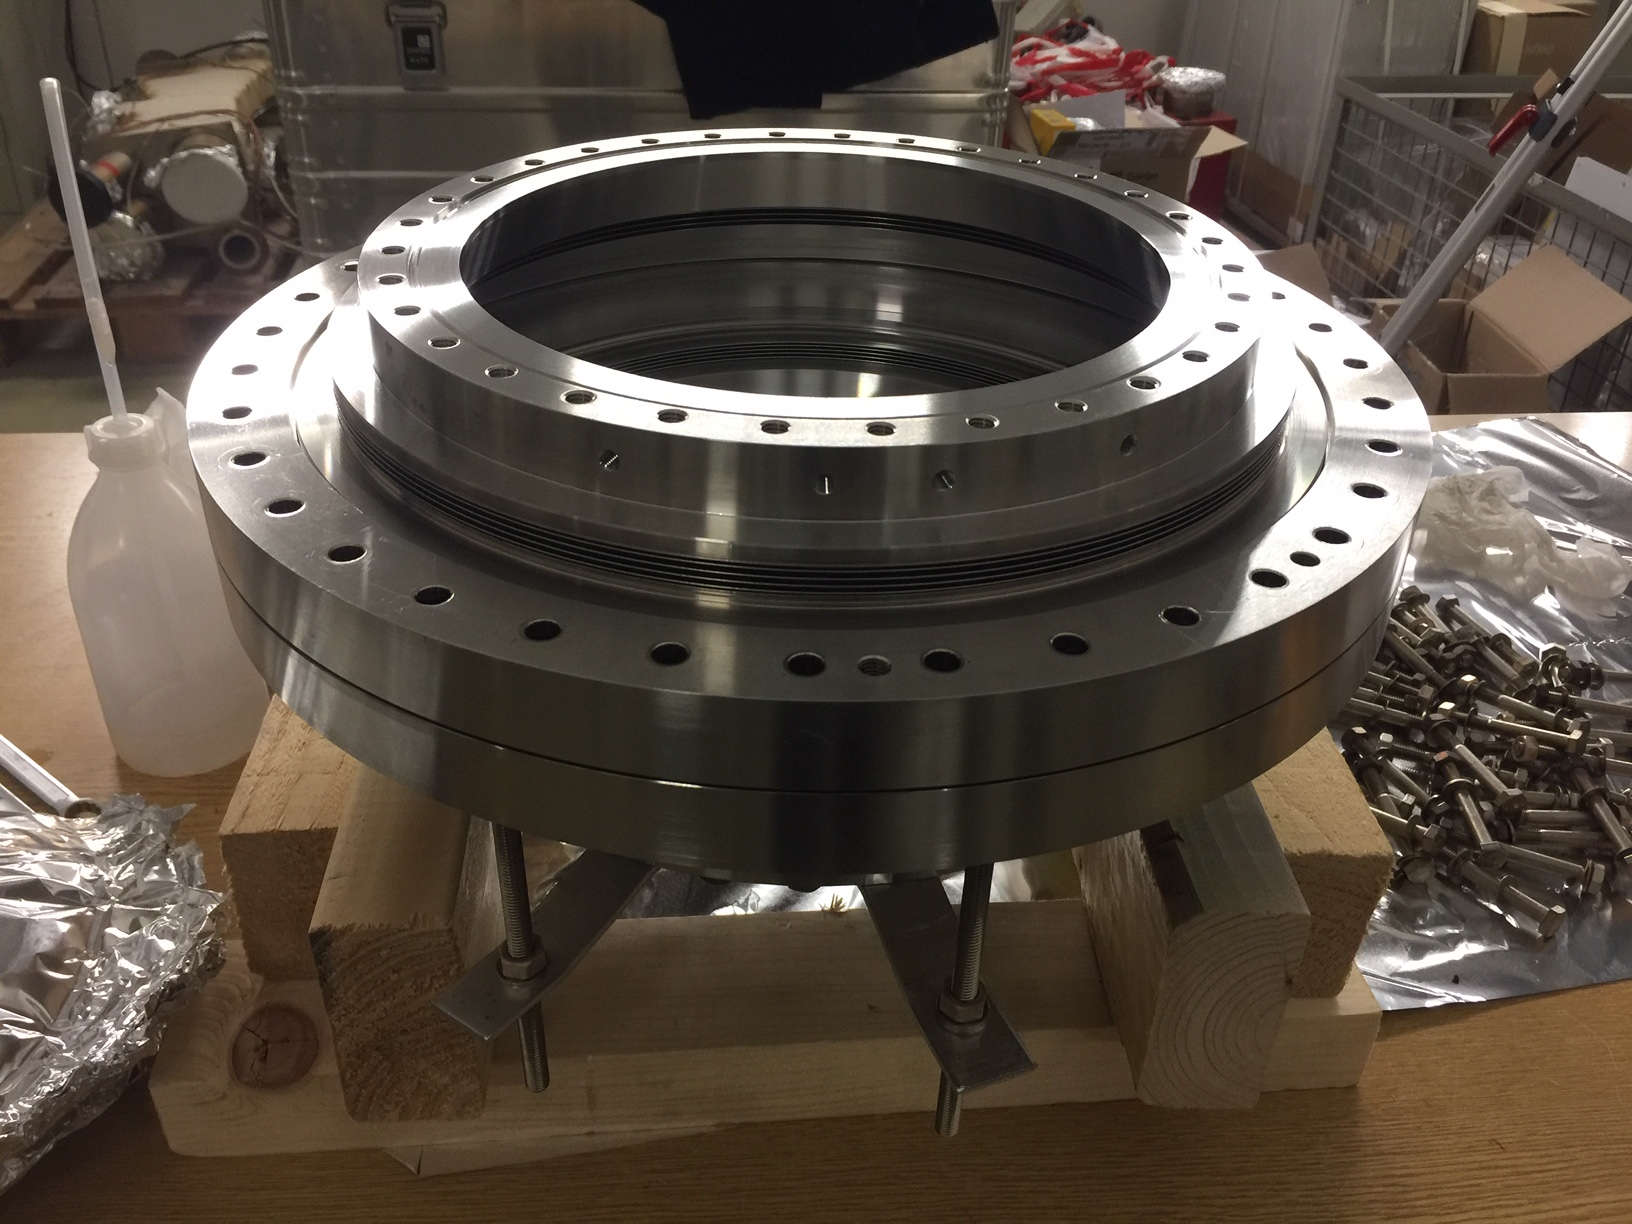
|
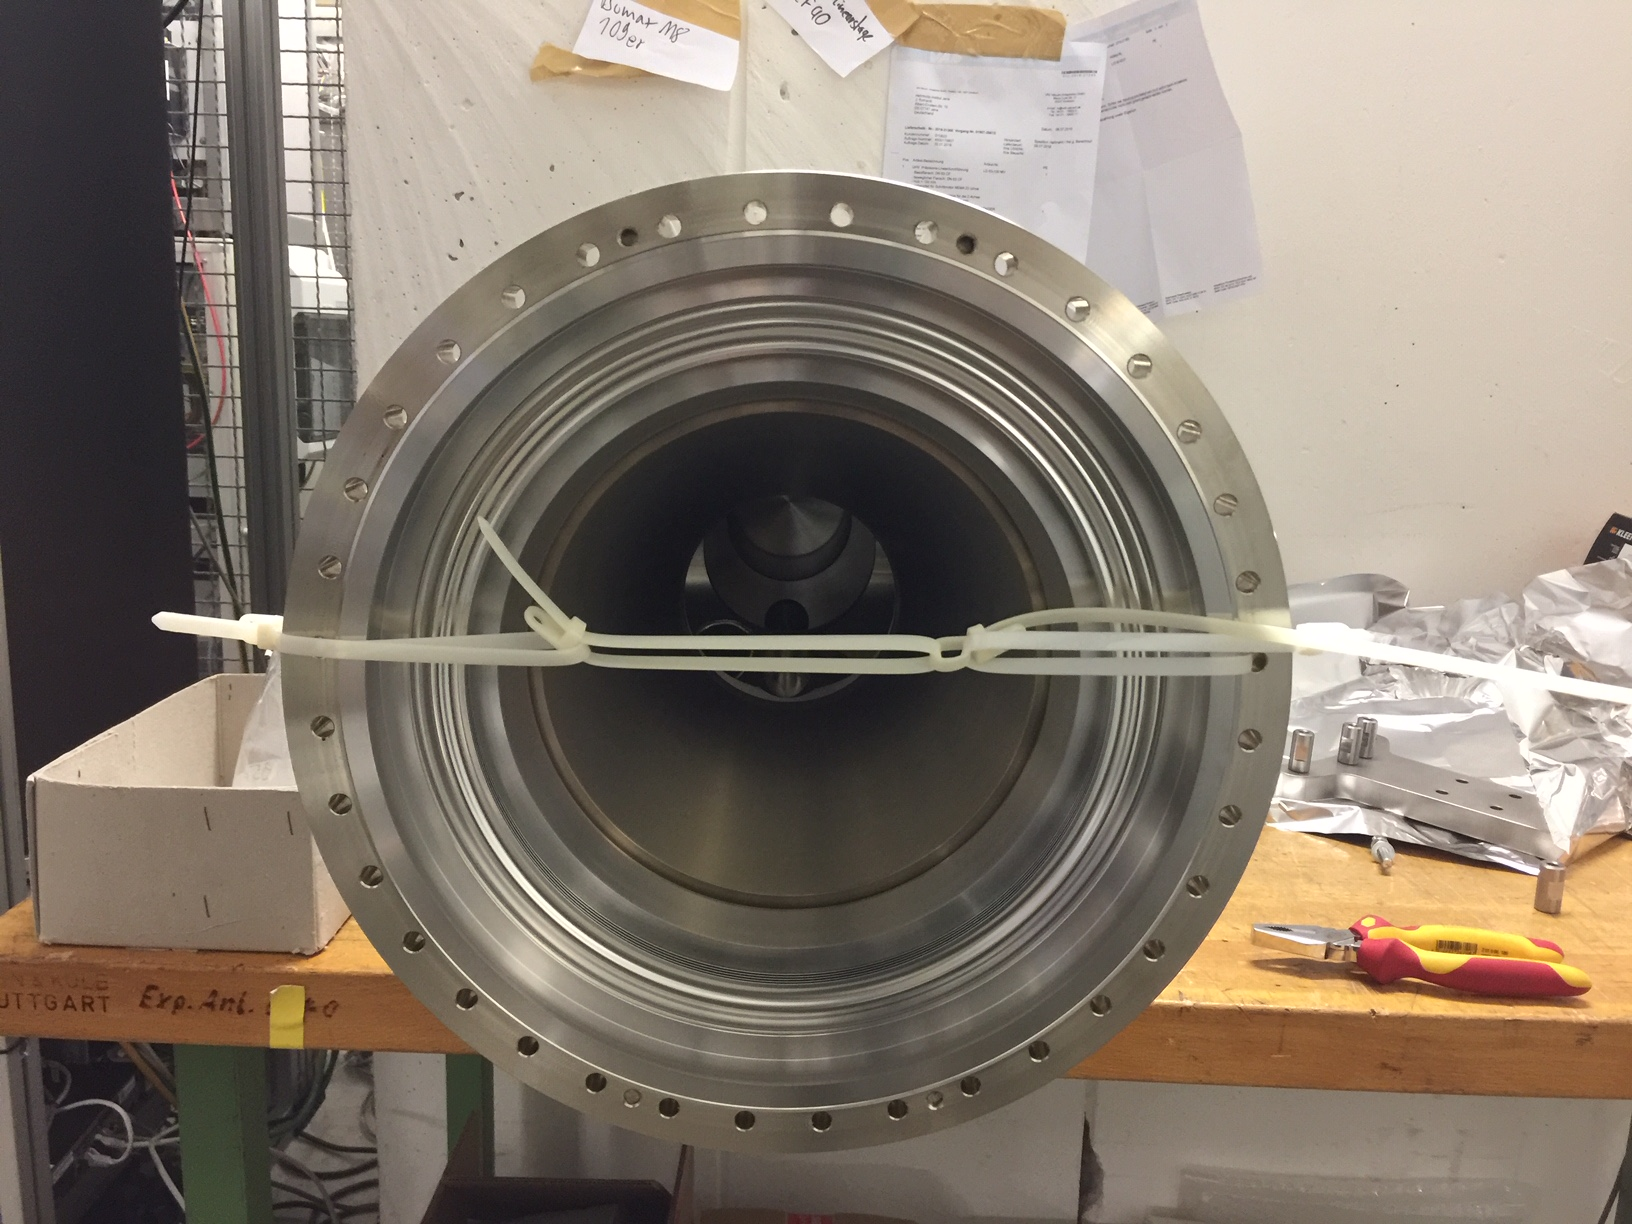
| Attachment 7: 20211028_105728.jpg
|
|
| Attachment 8: 20211028_105734.jpg
|
|
|
134
|
Sun Oct 31 07:29:17 2021 |
CB JM + RSS OG | Detectors mounted on plate in CARME |
(Wed 27 October)
Dismounted plate from rod. Dismounted broken detectors from plate and placed back in box. Dismounted "dog leg" struts and replaced with fully un-threaded struts.
Mounted 3335-13 in bottom position.
Attempted to mount 3335-2 in top position: dog leg strut conflicts with jacking plate. Attempted to remove - bolt stuck in thread. Removed bolt with great difficulty after dousing the bolt and hole in ethanol. M3 vented bolt is completely bent. Thread in hole appears still good. Bad bolt? Mounted strut upside-down with new M3 vented bolt. No issues. Mounted 3335-2 on plate.
Mounted extension plates for strain relief. Note countersunk bolts.
Removed all flanges with wires from CARME. Lubricated rod with ethanol. Slid rod with 2x detectors on. FIxed with bolt in front and back. Plate securely mounted in CARME, but some degree on rotational freedom is left. |
| Attachment 1: 20211027_172114.jpg
|

|
| Attachment 2: 20211027_172114.jpg
|

|
| Attachment 3: 20211027_172124.jpg
|

|
| Attachment 4: 20211027_172132.jpg
|

|
| Attachment 5: 20211027_172138.jpg
|

|
| Attachment 6: 20211027_175255.jpg
|
|
| Attachment 7: 20211027_175308.jpg
|

|
| Attachment 8: 20211027_174610.jpg
|

|
|
133
|
Sun Oct 31 07:21:09 2021 |
CB JM RSS | Detectors arrived in GSI |
(Tue 26 October)
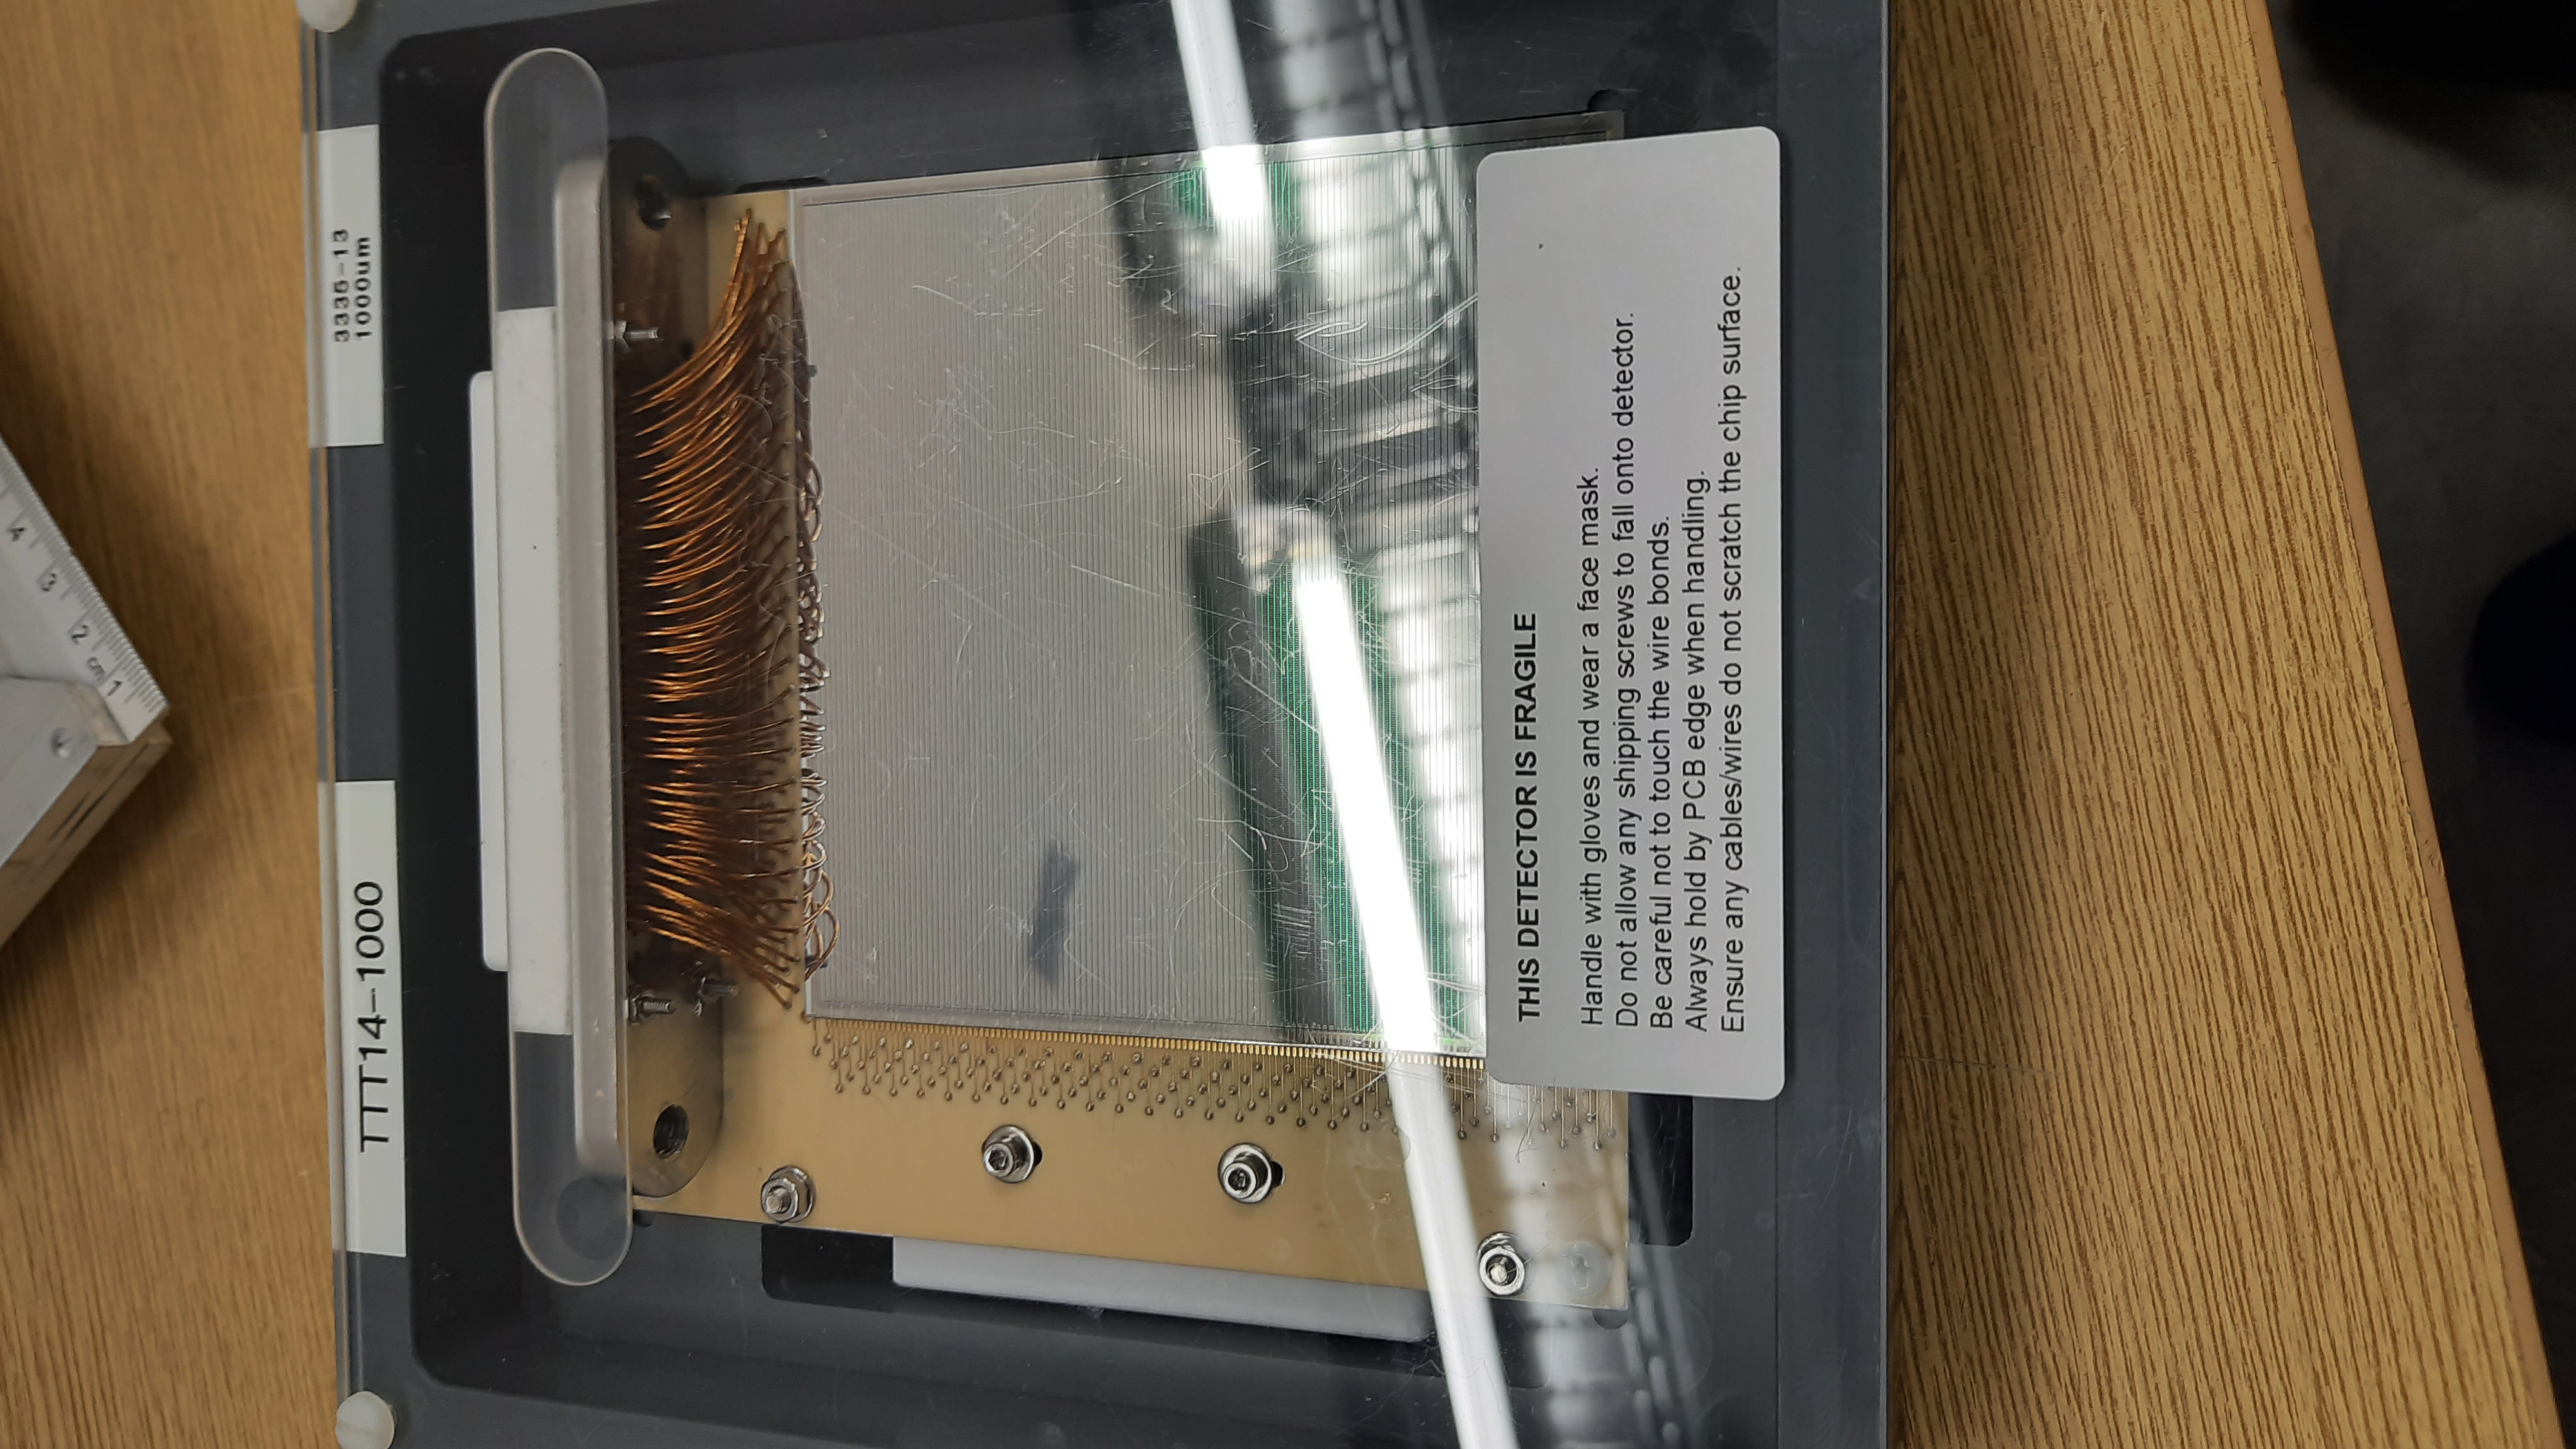
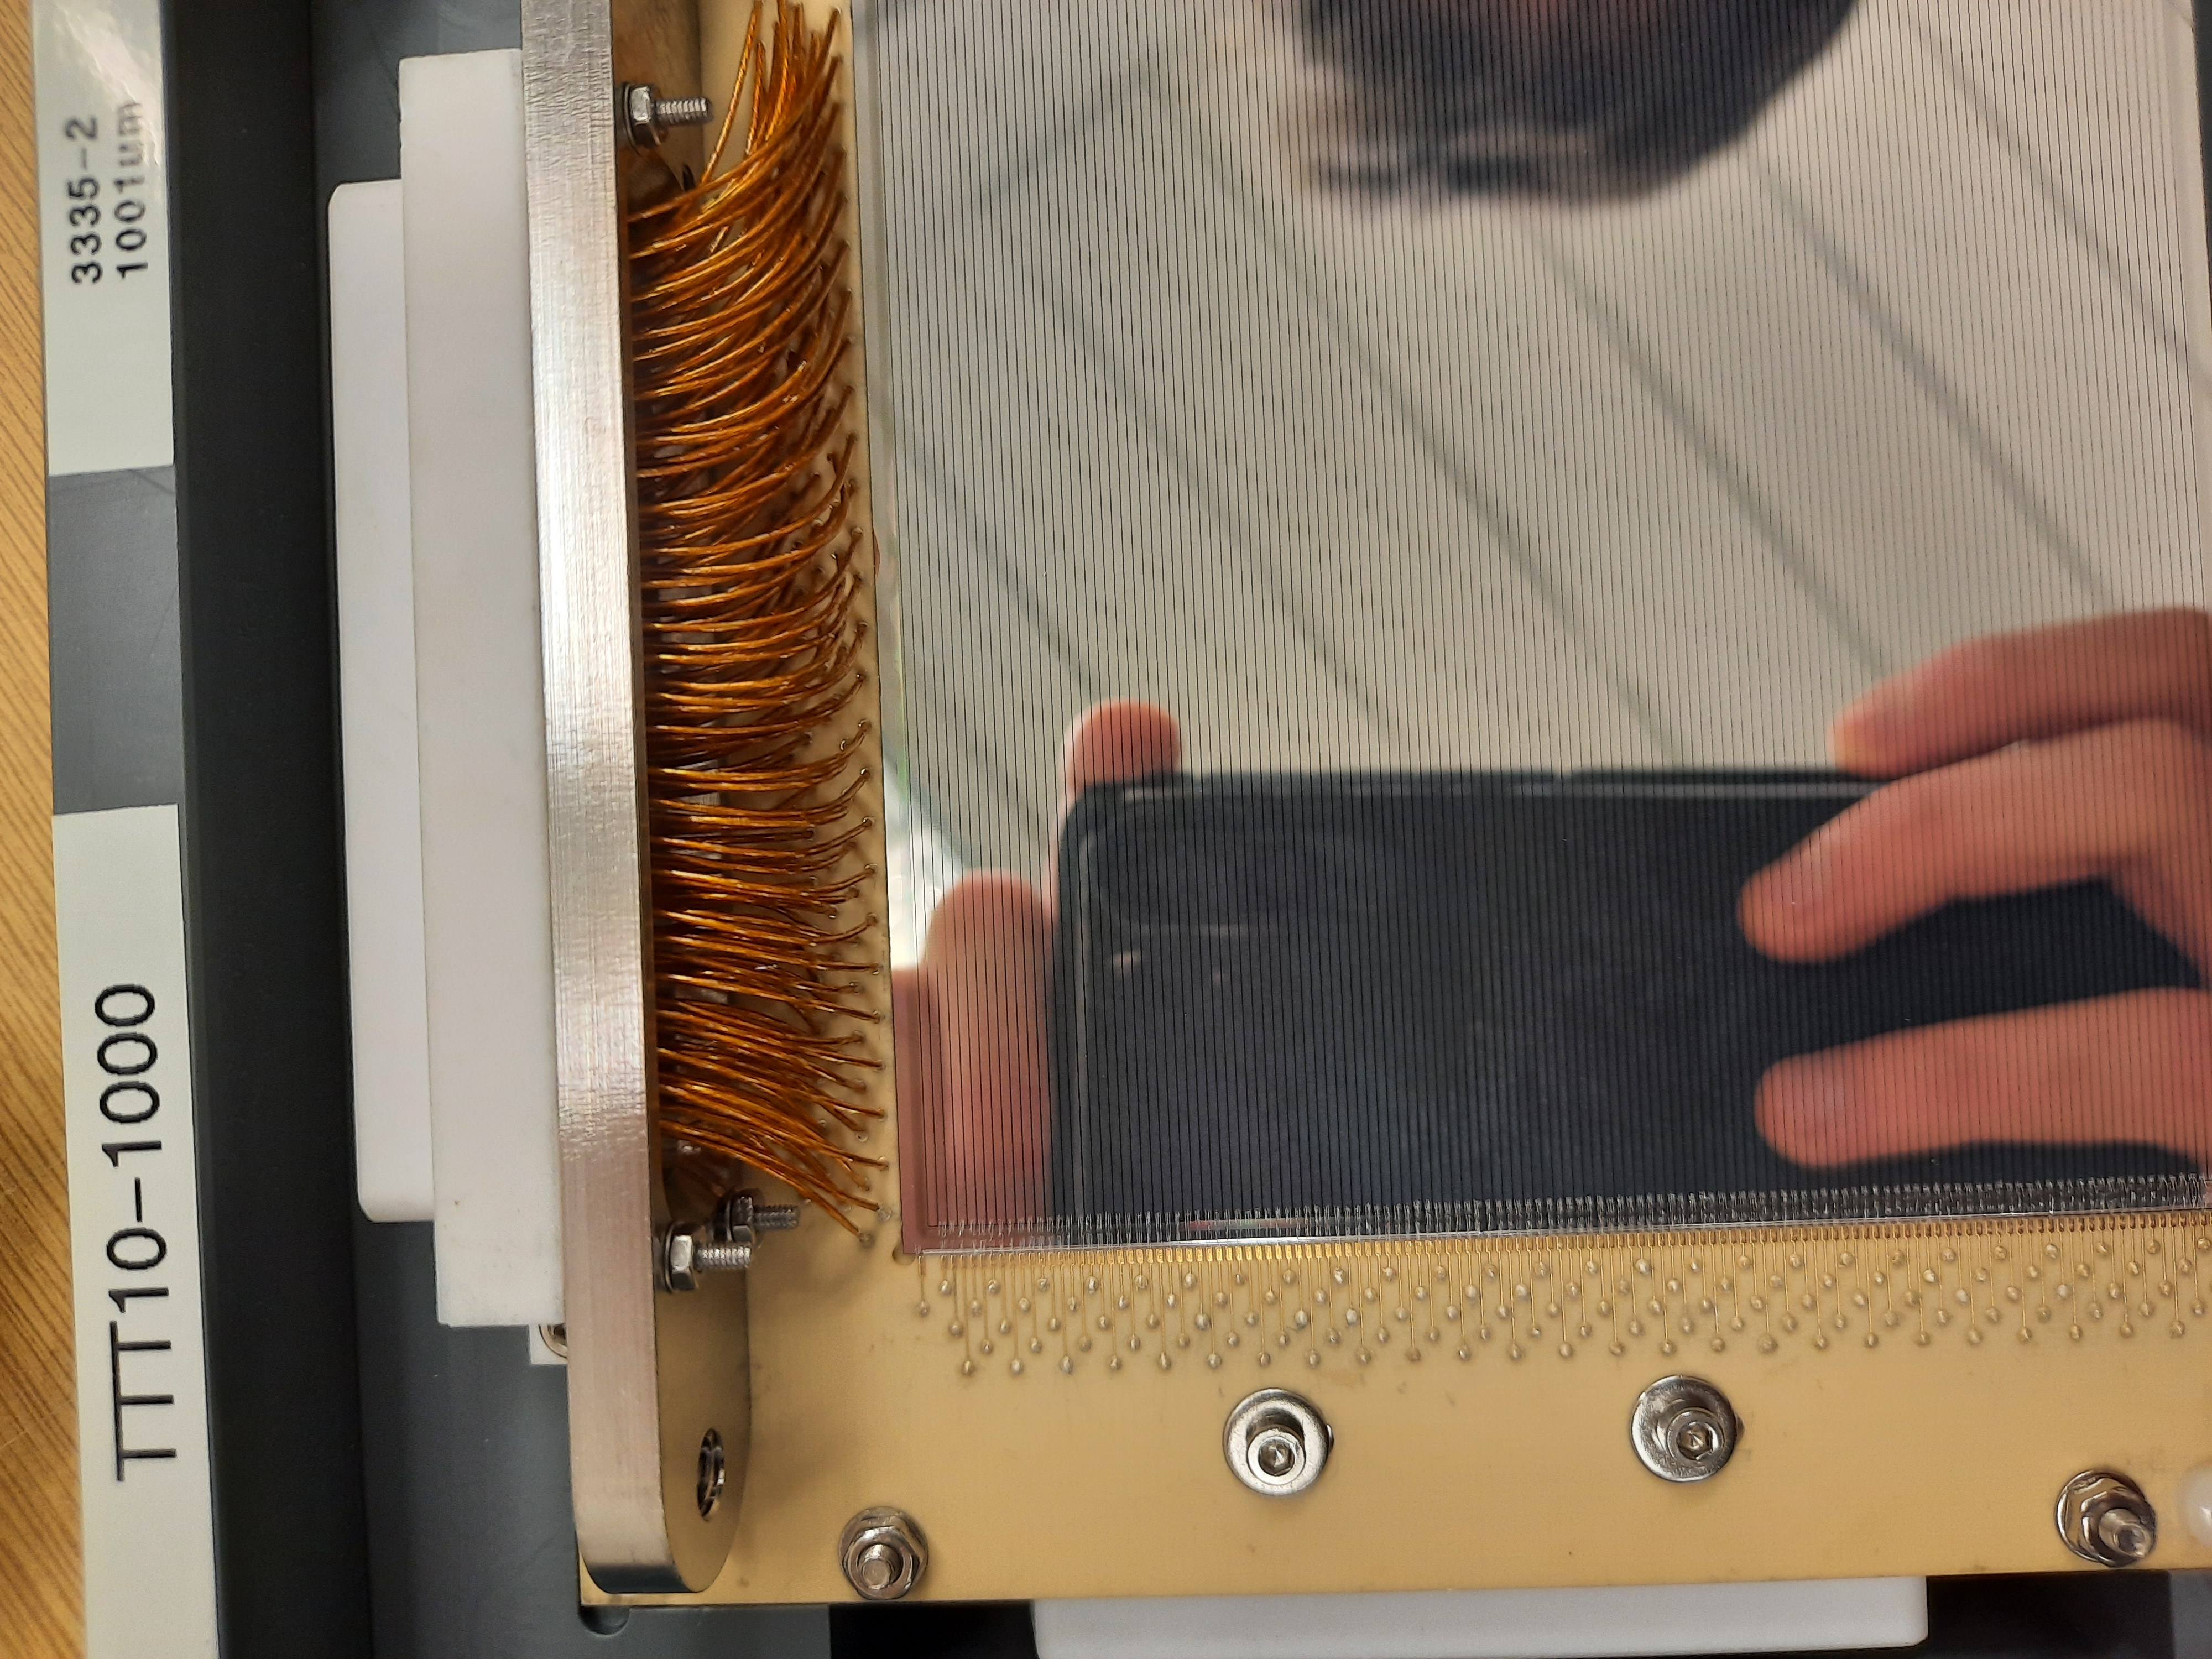
Two new CARME DSSD arrived in GSI and collected. Visually inspected both sides. No obvious damage. Photos attached. Second detector (3335-2) was shipped in upside-down box. Does not seem to have made any difference.
3335-13 will be mounted on bottom of plate. 3335-2 will be mounted on top of plate.
|
| Attachment 1: 20211026_144342.jpg
|
|
| Attachment 2: 20211026_144656.jpg
|

|
| Attachment 3: 20211026_145204.jpg
|

|
| Attachment 4: 20211026_145206.jpg
|

|
| Attachment 5: 20211026_150432.jpg
|
|
| Attachment 6: 20211026_150727.jpg
|

|
|
132
|
Fri Oct 29 15:09:27 2021 |
CB JM + RSS OG DR | Preparation to mount new DSSDs |
(Mon 25 October - Tue 26 October)
Considered different strategies to mount DSSDs inside CARME, while waiting for 2x new DSSD to arrive.
Plan A: Mount DSSDs on plate on the bench, slide plate on rod, then attach cables, then attach strain relief
Plan B: Mount DSSDs on plate, attach cables, attach strain relief, slide plate on rod, connect cables to feedthroughs
Mounted detectors on plate using new "dog leg" connectors. Threaded and unthreaded holes are flipped! Asked DR to unthread hole in two out of four, and clean.
Attempted to proceed with Plan B with stand-in broken detector. Found even a single wire harness attached to the detector was quite hard to insert in the chamber. Temporarily dismounted left-hand 2x UHV1400 to give more space.
Slid plate on rod. New position of rod block makes it easier to mount. Spraying ethanol on the rod to lubricate also helps greatly. Secured plate to rod. Holding flange with cables in left hand, attempted to mount macor plug in feedthrough with right hand. Unable to exert sufficient strength (CB, JM, OG). Pulling on the cable puts strain on the DSSD. Decided to avoid.
Attempted Plan A. Jacked connector in with no issues using M6x40 partly threaded bolts. Unable to unjack due to part threads! Obtained fully threaded rods. Unjacked using washer + two nuts tightened on each other. Jacked and unjacked another connector.
Decided to proceed with A. Having any cable pre-mounted in the chamber is a potential hazard to the detectors while mounting plate. Decided to dismount all flanges, re-organise harnesses and mount one flange+harness at a time after mounting detector on rod.
Used thick Kapton coated Cu from NEG pumps to organise the cables and improve strain relief.
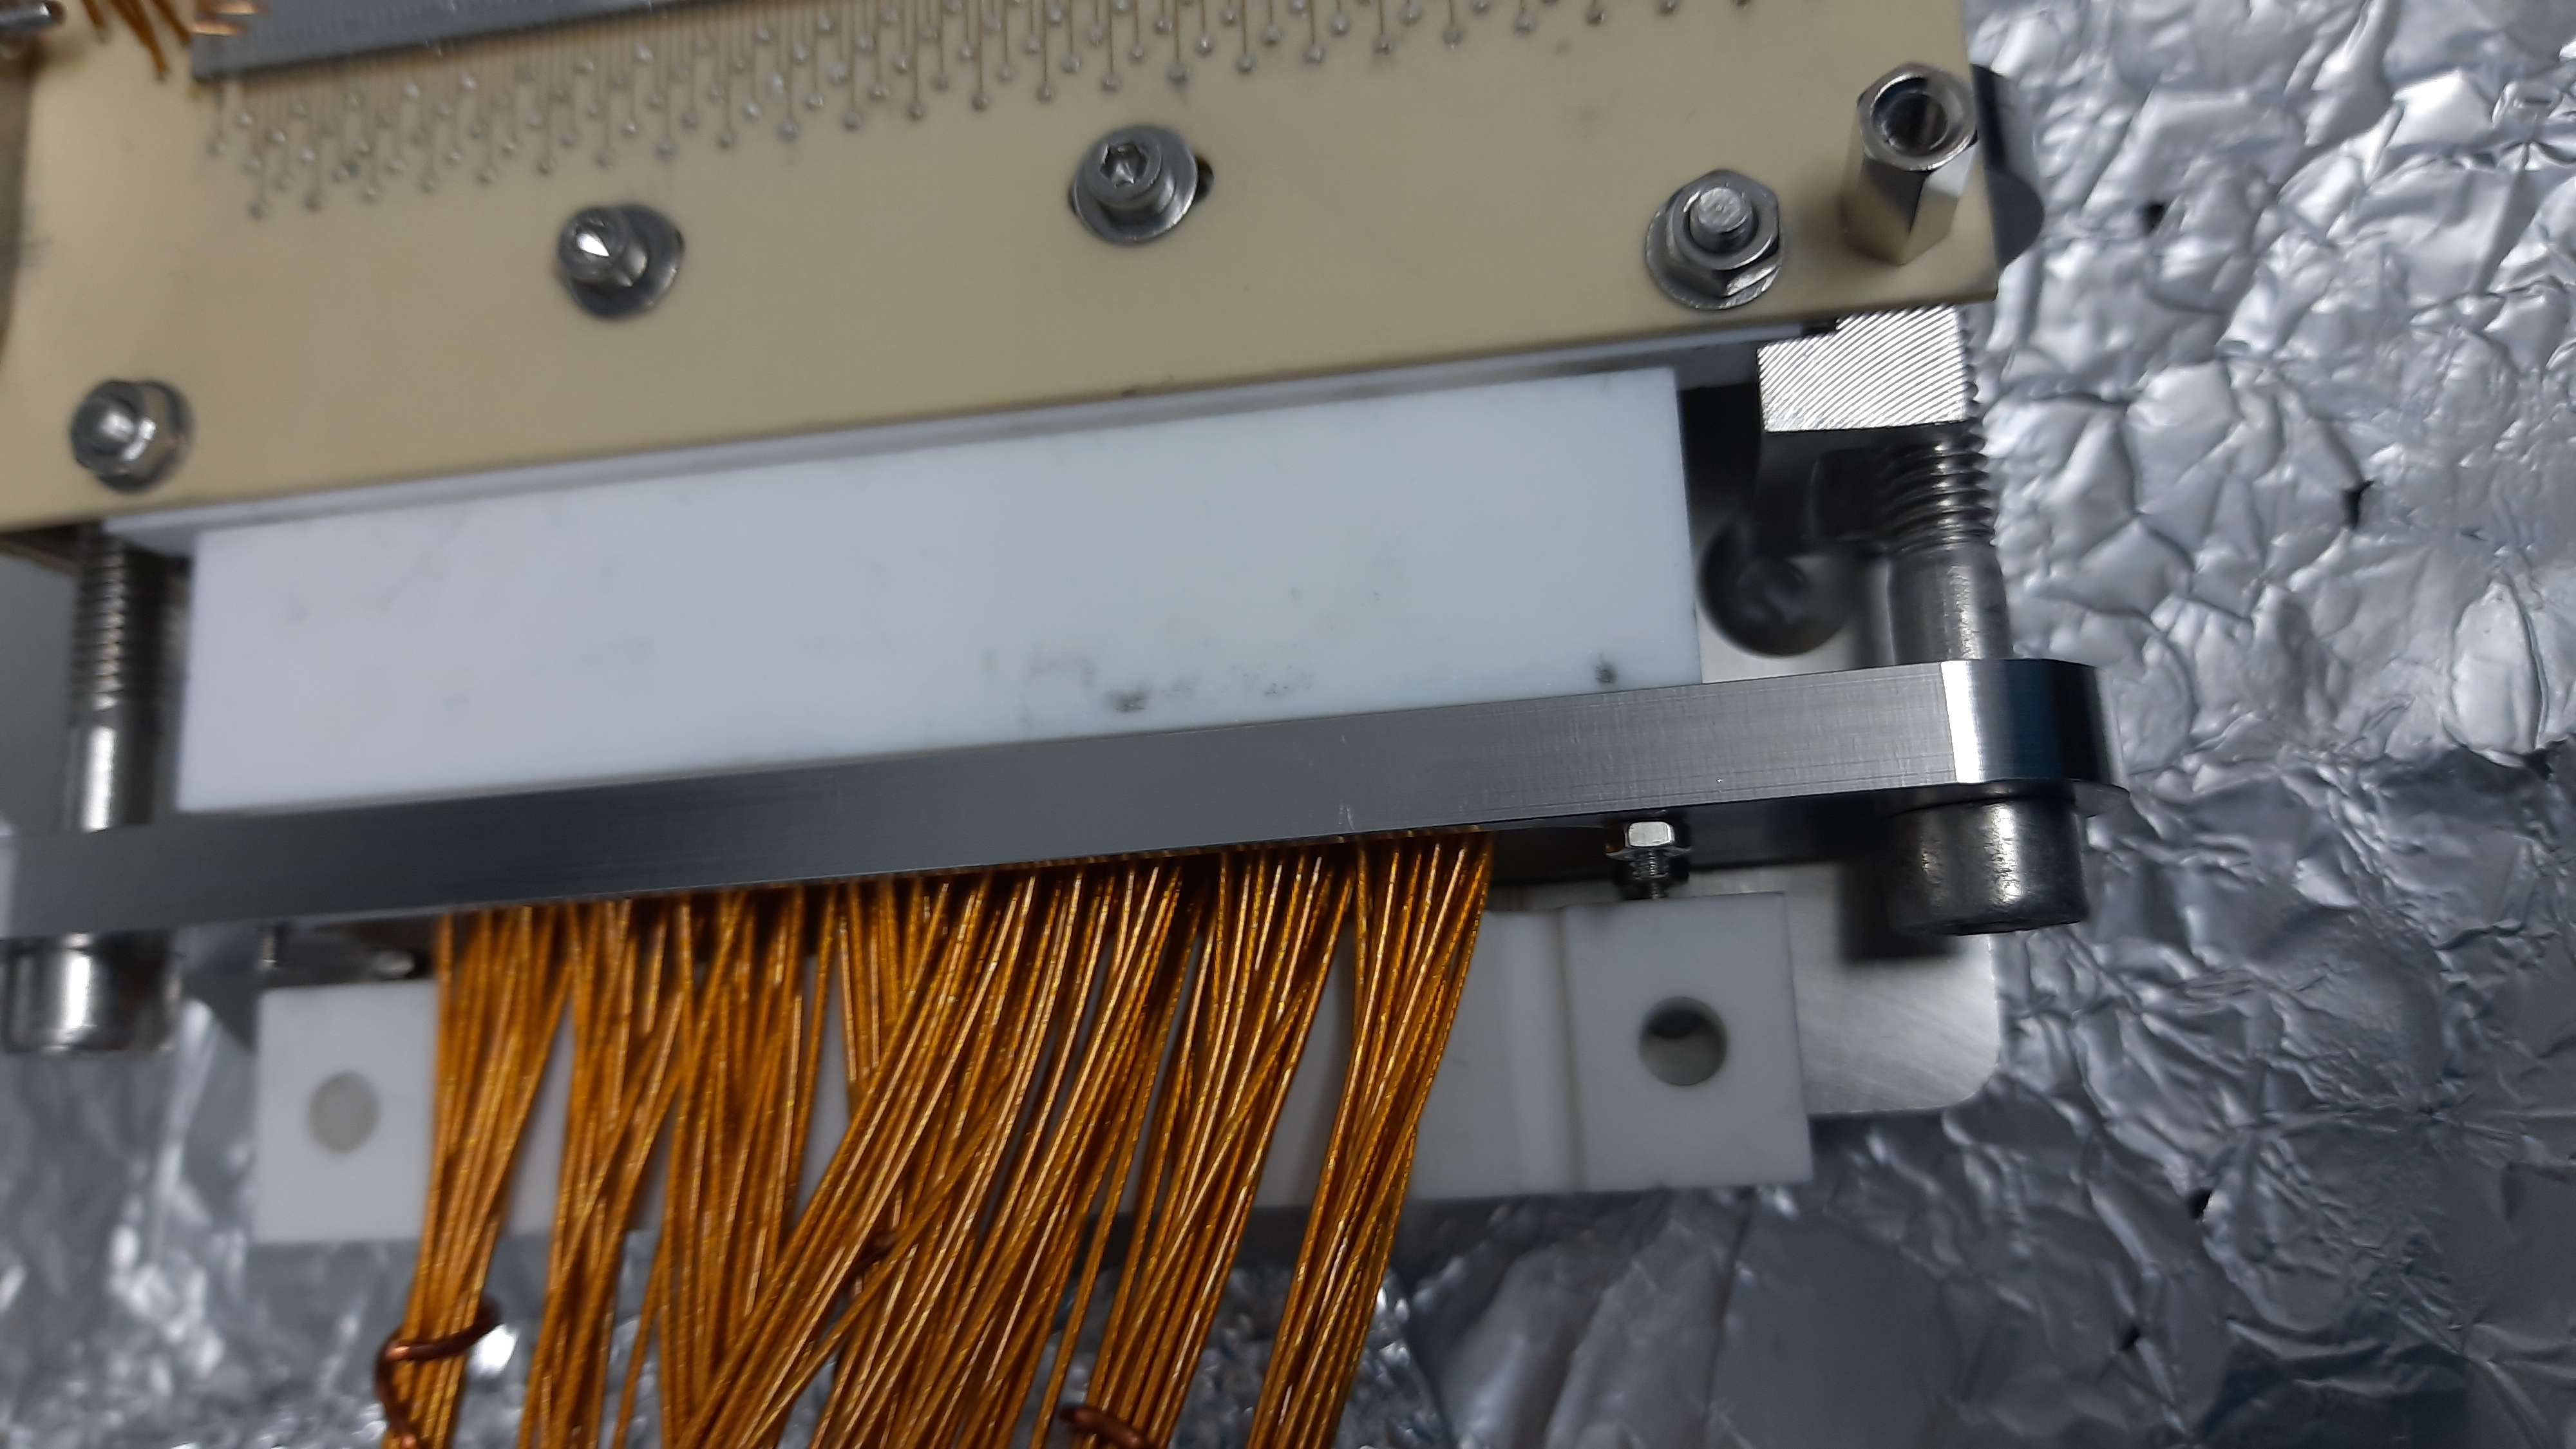
Due to width of MACOR strain relief and nuts on the back of the MACOR plugs, realised strain relief cannot be mounted as intended. Asked DR to produce 90 x 30 x 3 mm extender plates instead. MACOR strain relief are 15 mm wide. Extender plate have 3x M4 unthreaded countersunk to fix to detector plate, 3x M4 threaded holes to hold MACOR strain relief.
Organised cable harnesses.
4 short: all good -> two to be mounted
2 long: all good -> to be mounted
1 long: Broken MACOR backplate and lead. Lead removed. Attempted to mount with backplate in new lead - unable to do so. Removing backplate requires re-crimping. Will have to send back to Edinburgh
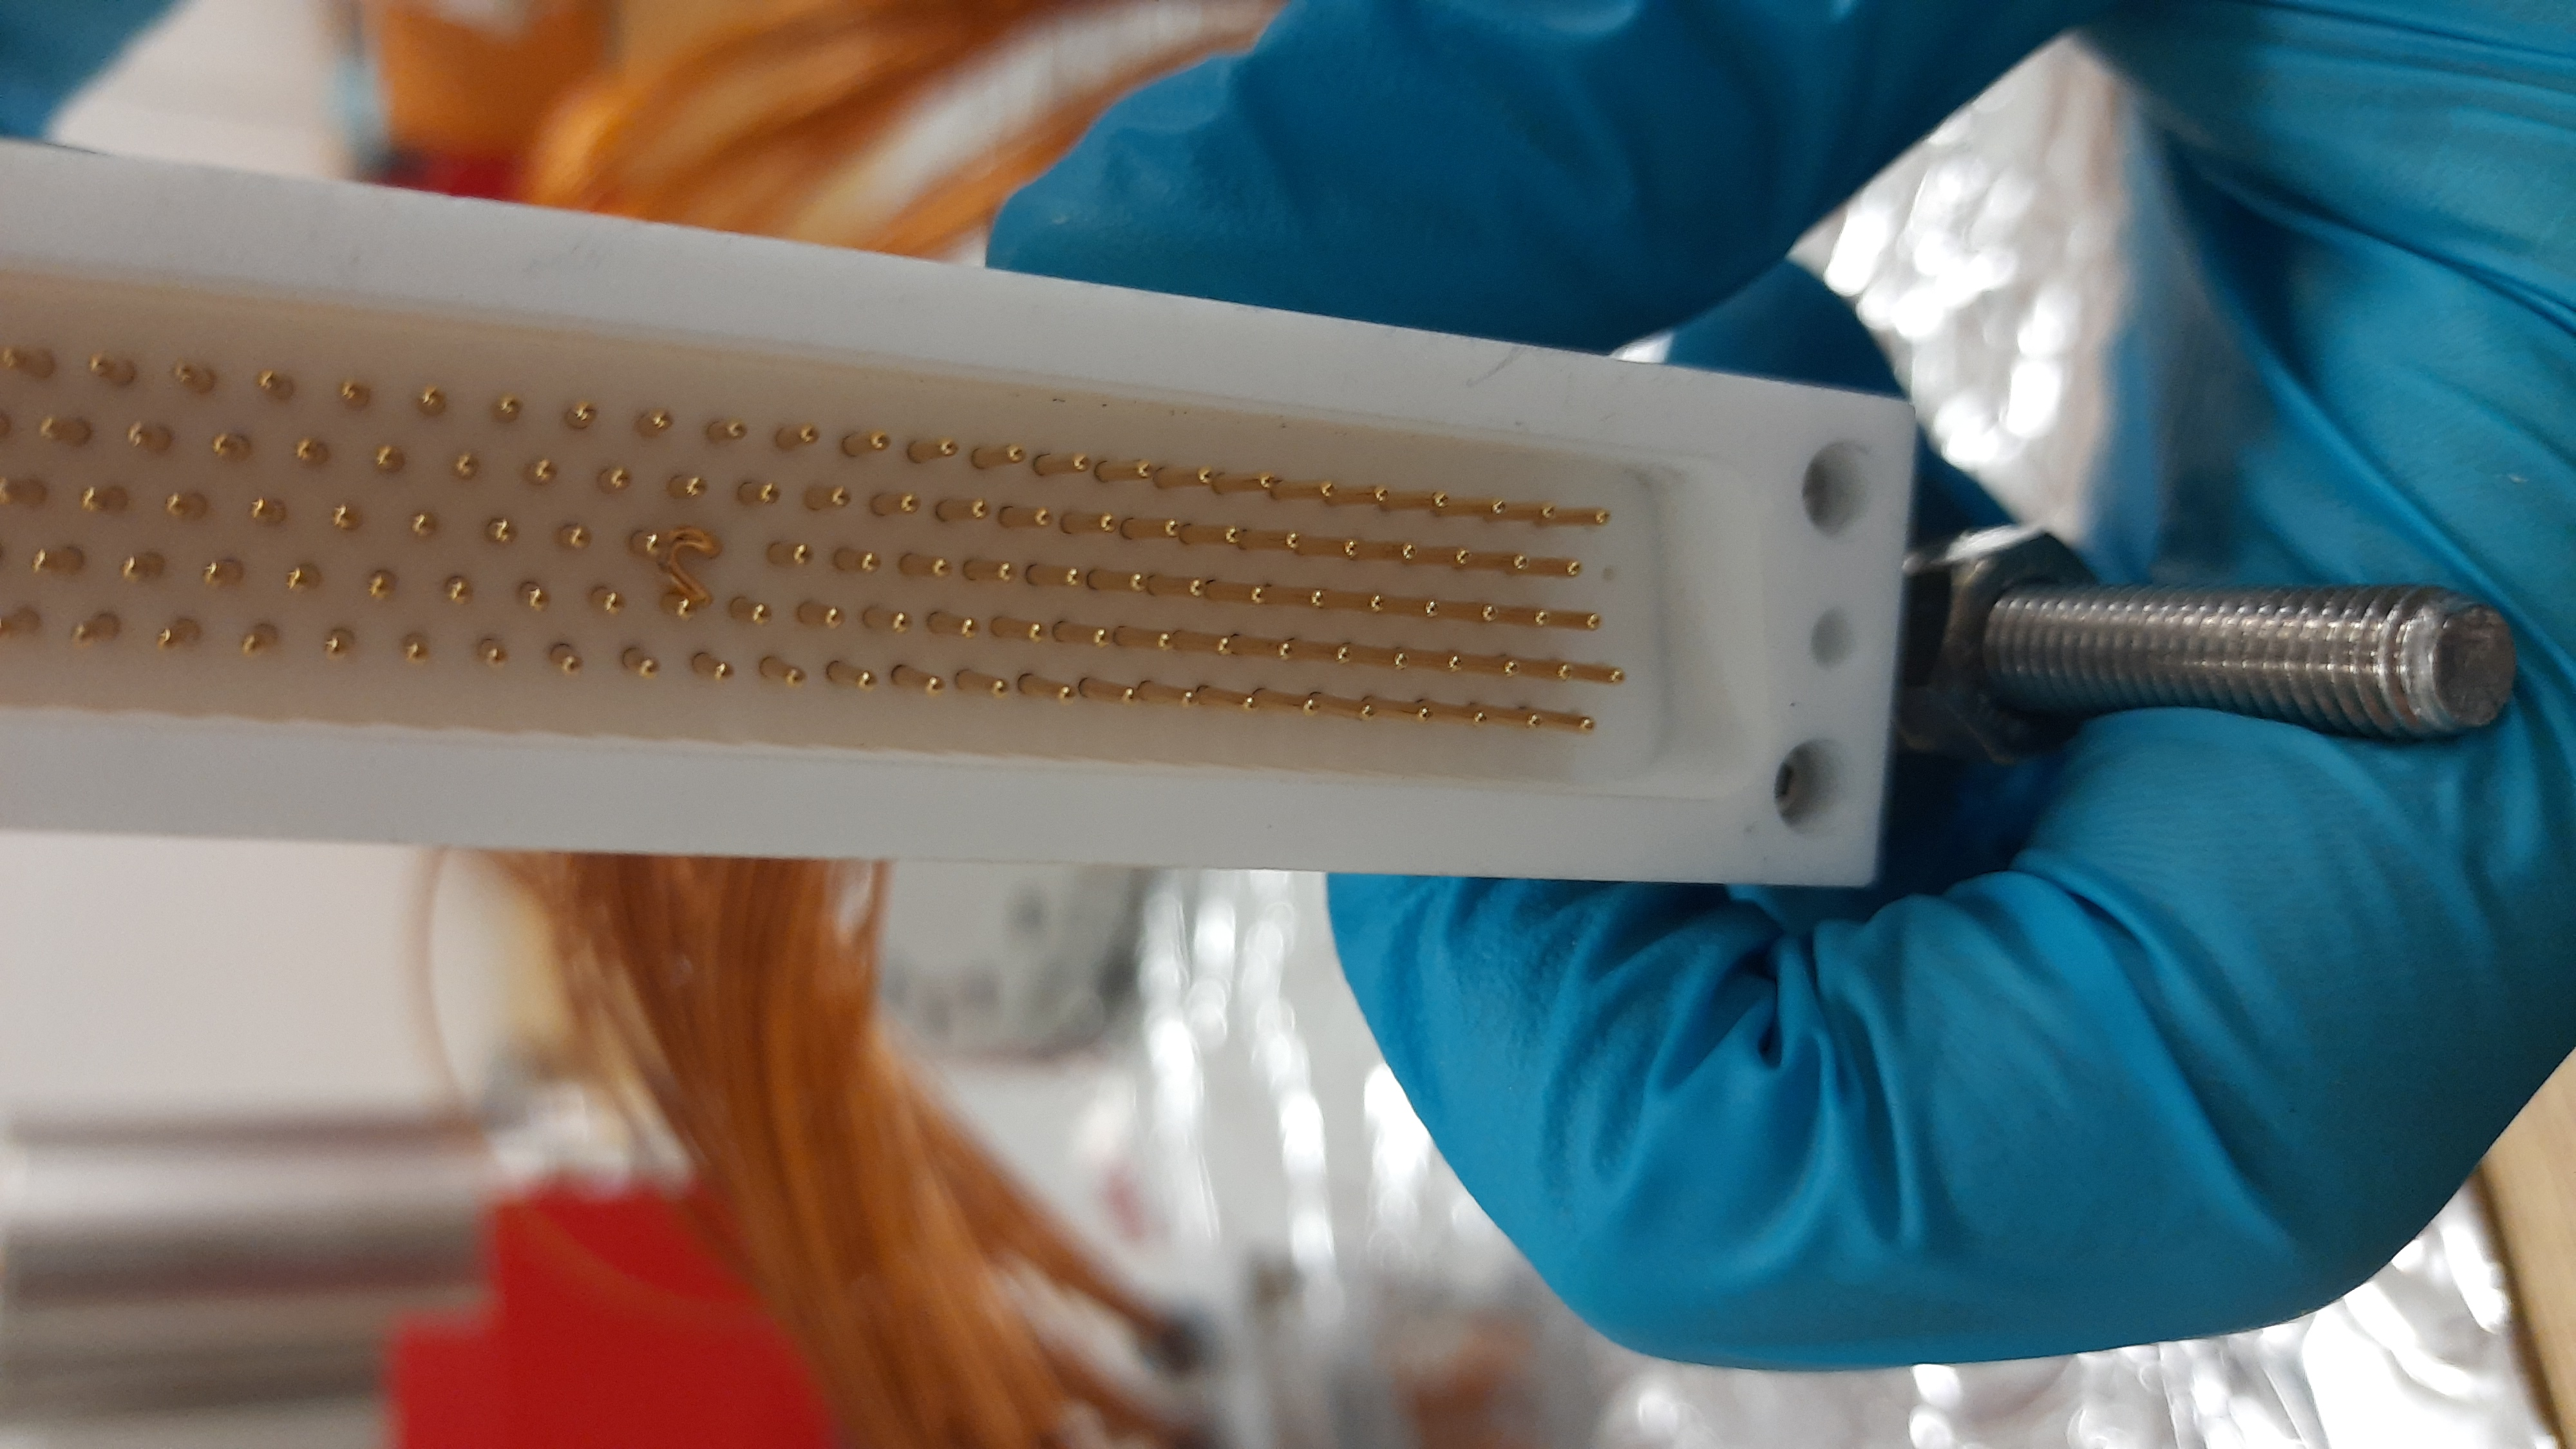
1 long: Wires cross in odd way. Will have to re-organise. Probably requires re-crimping. One pin smashed during jacking. Not sure if rescuable. See attached.
|
| Attachment 1: 20211025_104612.jpg
|

|
| Attachment 2: 20211025_161821.jpg
|

|
| Attachment 3: 20211025_161804.jpg
|
|
| Attachment 4: 20211026_161756.jpg
|
|
| Attachment 5: 20211026_163113.jpg
|

|
| Attachment 6: 20211026_163202.jpg
|

|
|
131
|
Sat Oct 23 12:58:11 2021 |
JM | GSI vacuum and bakeout testing summary |
Attachment 1 shows the pump-down of the CARME chamber at GSI before installation of kapton cabling inside the chamber and mounting of the chamber on the ring. Discontinuity in the plot is from switching between the pirani gauge and IE514 gauge. The pumping of the chamber in the turbo regime follows the power law where P ~ 1/(nt) due to outgassing from the chamber being dominated by water outgassing which has an n ~1 dependence (for first order desorption). This is seen in the pumping of the chamber in the turbo regime (Attachment 2) where pressure falls with an n of 1.03. In red the power law is extended to 10^5 minutes, demonstrating the limitations of pumping the chamber without baking.
Attachment 3 shows the pumpdown pressure and baking temperature (chamber average) of the chamber once mounted on the ring, with all kapton installed in the chamber. Temperature data was lost in the middle of the plot due to the power cut to CRYRING causing temperature data to not be saved to the pi. Some of this data was plotted in elog 87 before beong lost from the pi. Points on the graph correspond to:
Point 1 - Baking started 2pm 23/9/21
Point 2 - Temperature limited to 40C due to high thermal gradients from uneven baking of the volume. Baking stopped 7am 24/9/21 so that heating elements could be repositioned. Baking restarted 10am.
Point 3 - Baking limited to 90C due to tent construction. Negative gradient detected due limitation causing baking to stop around 5pm 25/9/21. Manual mode to 60C. Full power mode restarted 10pm
Point 4 - Temperature of the volume reached 100C. 11am 27/9/21 baking stopped to install new turbo sections. Baking restarted at 3:25 pm Temperature peaks at 130C next morning.
Point 5 - 29/9/21 10am Unexpected power cut at CRYRING, temperature fell to 120C power restored shortly after.
Point 6 - 4/10/21 9am Temperature reduced to 100C and ion pumps outgassed. Activation of NEG pumps
Point 7/8 - Subsequent activation of other NEG pumps.
Point 9 - 7/10/21 CARME reached 9E-12 mbar. Gate valve closed, pressure rises with apparent floor at 1.5E-11 mbar
Some variations in the pressure are seen after reaching the floor, most likely due to sputtering of ion pumps.
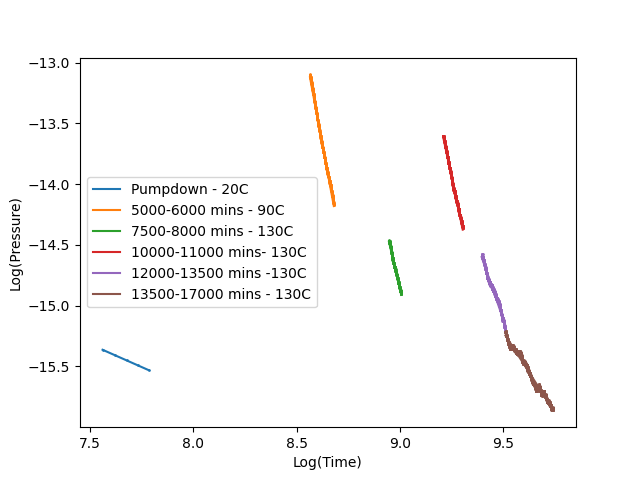
Teething problems with the bakeout such as heater placement and new jacket sections in addition to the power cut prevented continous bakeout for entire period, these issues should not affect the next baking run. As a result of the slightly fractured bakeout the pumpdown power laws have been plotted (logP) against log(T) in sections where temperature was roughly constant with the associated timestamps to gauge the decrease in pressure over time using this power law (Attachment 4).
Room temp n ~ 0.75
90C n ~ 9.15
130C (1) n ~ 8.05
130C (2) n ~ 7.37
130C (3) n ~ 4.89
130C (4) n ~ 2.65
Introduction of kapton cabling likely causes change to scaling as the diffusion of gas from kapton not the desorption from the surface dominates the outgassing rate. Diffusion has an n ~ 0.5, likely contributing to the change between the blank chamber and mounted chamber. As the temperature is increased the outgassing is significantly increased causing an initial increase in the temperature followed by a more rapid decrease in the gradient of the pressure decrease over time than at lower temperatures. As time increases, outgassing from water in the chamber dominates less and less with the kapton cabling representing a more significant portion of the total outgassing load likely causing the decrease in n as time increases despite baking at 130C. After ~12000 minutes n decreases significantly and more variations from the linear decrease in pressure are observed. After 17000 seconds the pressure begins to plateu and reached a floor of ~1E-7 mbar over the weekend at which it was assumed outgassing from water in the chamber was no longer significant. Variations could be due to temperature fluctuations which had a greater impact on the pressure as the pressure began to reach the floor.
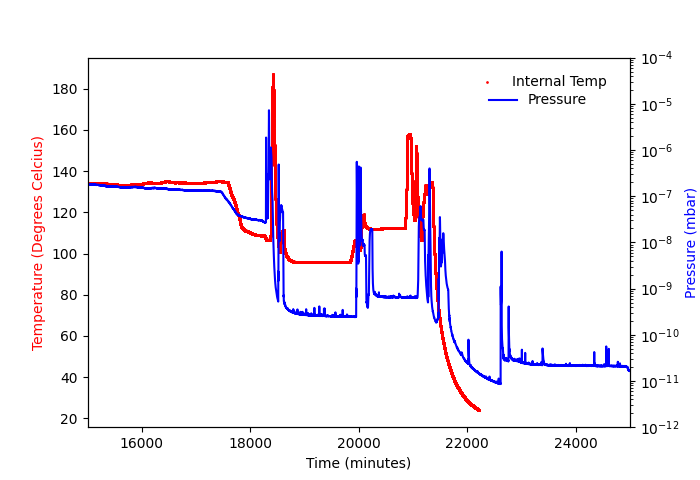
Activation of NEG pumps was conducted after reaching the floor. The average chamber temperature and air temperature inside the tent was unaffected by the activation of NEG pumps, however the internal thermocouples significantly increased during activation (attachment 5). The internal thermocuples were largely unaffected by the NEG activation until the NEG temperatures were themselves above ~300C after the internal temperatures rose rapidly (more detail in elog 105,108,109,110) . Activating so many NEG elements at once is thus not feasible as temperatures would damage the detectors once mounted. Activating one group at a time (typically 2 NEGs) and D2000's which are away from the detectors to start with and then maintaining at low power before slowly activating NEG's close to the detectors perhaps at a lower temperature will be done to keep temperatures below 130C. A full activation procedure will be posted to the elog before activating again. |
| Attachment 1: GSI_fullpumpdown.png
|

|
| Attachment 2: GSI_pumping.png
|

|
| Attachment 3: Bakeout-elog.png
|

|
| Attachment 4: fit-elog.png
|
|
| Attachment 5: Activation-elog.png
|
|
|
130
|
Fri Oct 22 13:22:48 2021 |
TD | CARME FEE64 adaptor PCB |
|
| Attachment 1: 3D.pdf
|

|
| Attachment 2: Bottom_Ground_Pad.pdf
|

|
| Attachment 3: Flex_Layer_1.pdf
|

|
| Attachment 4: Flex_Layer_2.pdf
|

|
| Attachment 5: Flex_Layer_3.pdf
|

|
| Attachment 6: Flex_Layer_4_(1).pdf
|
-0.png)
|
| Attachment 7: PCB_Bottom.pdf
|

|
| Attachment 8: PCB_Top.pdf
|
|
| Attachment 9: Silkscreen_Top.pdf
|
|
| Attachment 10: Top_Ground_Pad.pdf
|

|
|
129
|
Fri Oct 22 13:11:26 2021 |
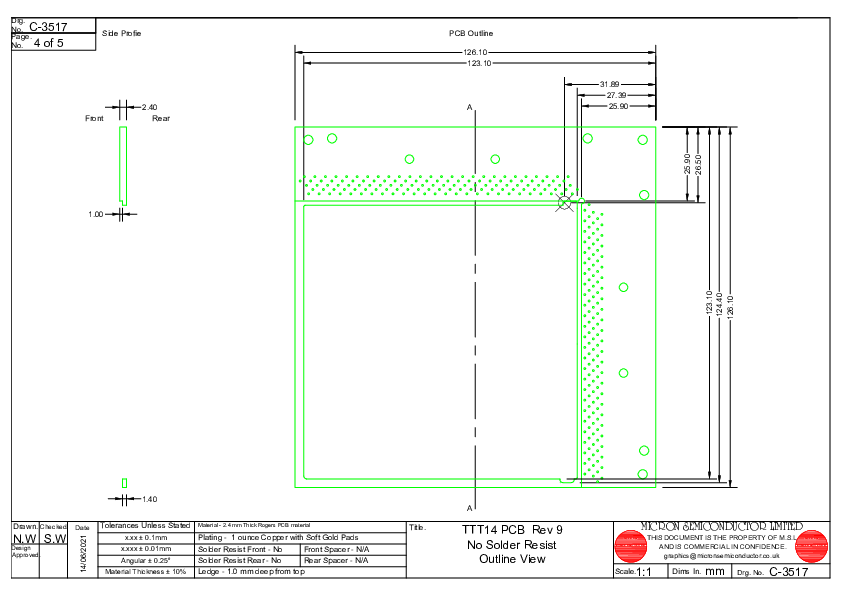
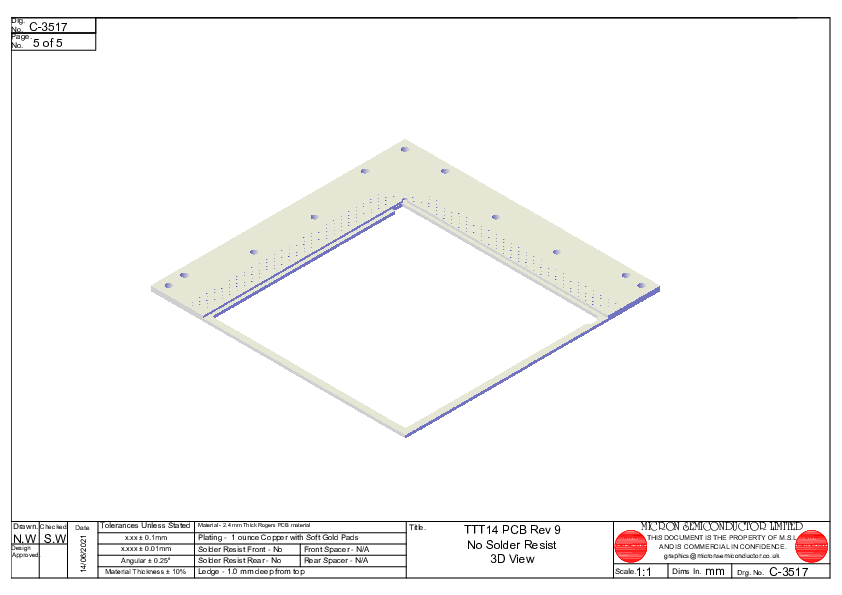
TD | MSL type TTT14 assembly drawings & pin assignments |
|
| Attachment 1: C-3434.pdf
|

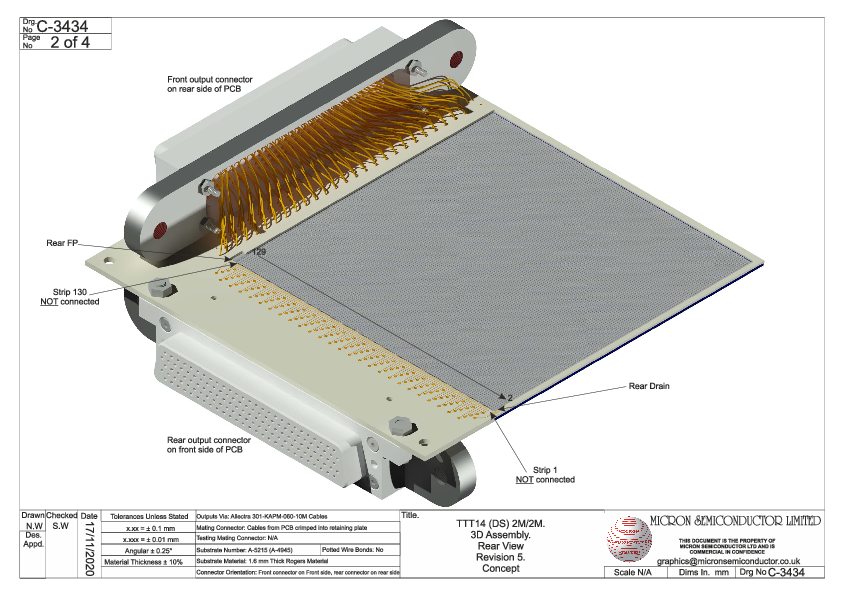
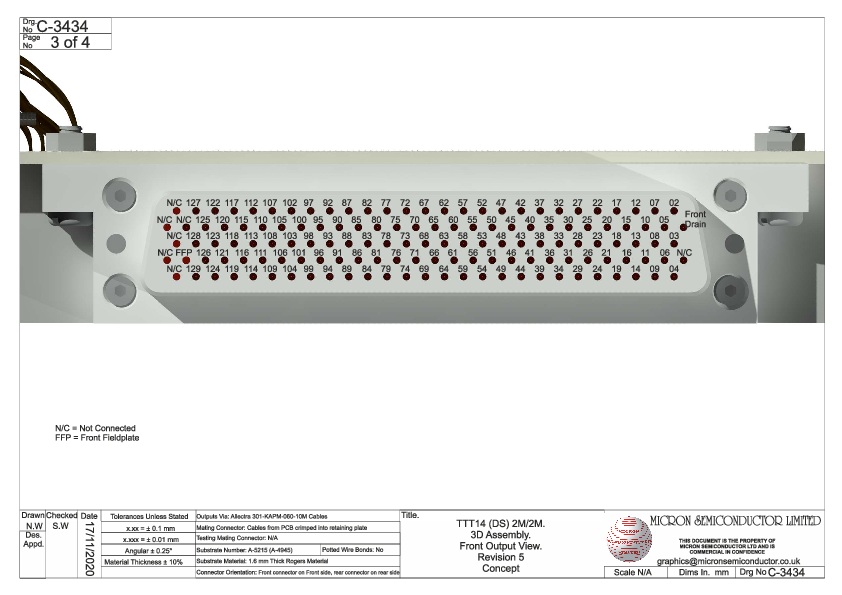

|
| Attachment 2: C-3517.pdf
|
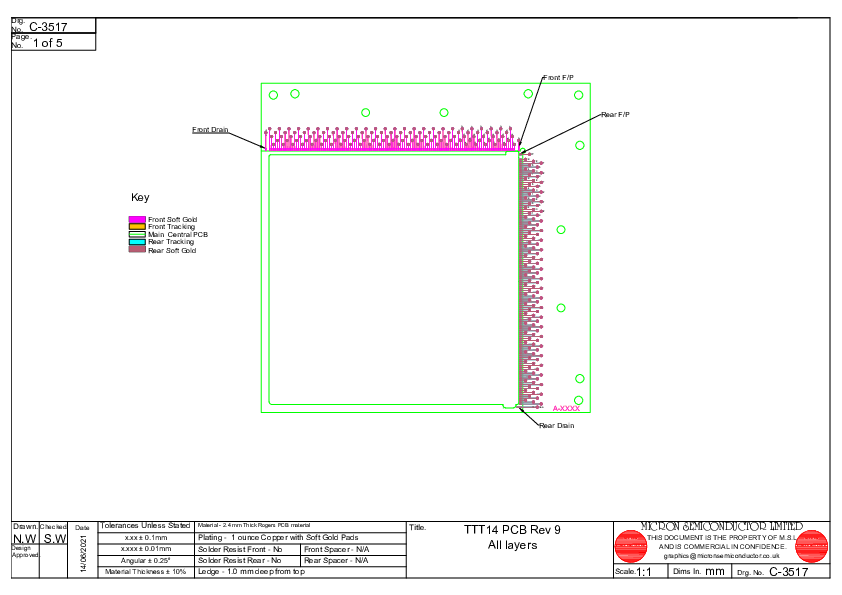

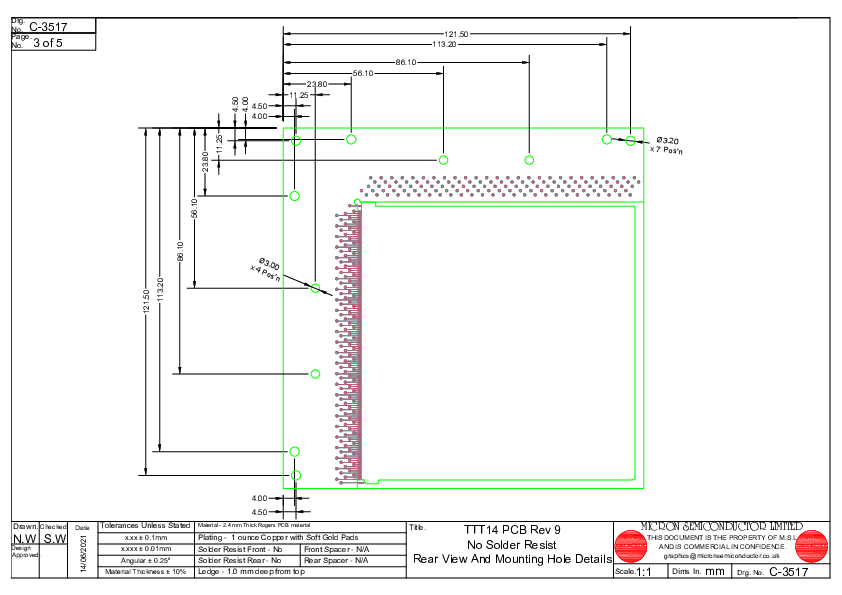
|
|
128
|
Thu Oct 21 20:26:44 2021 |
JM TD | Thermocouple and Connector cables |
NEG pump electrical connections tested - all connections sound.
Detector carriers have been redrilled and are currently being cleaned. Carriers were checked within the chamber, mounting much easier with new hole. Distances to NEG feedthroughs and thermocouple feedthrough from the carrier also checked. NEG feedthroughs have sufficient separation now moved, thermocouple required moving to top flange position to avoid collision with carrier.
Longer external thermocouples required for top position to reach TC08's. 3 Longer thermocouples made up using spare wire and connected to feedthrough. All thermocouples checked using baking code - all appear fine. We have 2 long thermocouples for the interaction chamber, 2 for the RE-72's and one for the top of the chamber left. Bellows can be reached by shorter thermocouple. This should be sufficient for baking.
Standoffs job submitted to workshop for production, may be available end of the week depending on schedules of workshop. Clamp guide and hook tools produced.
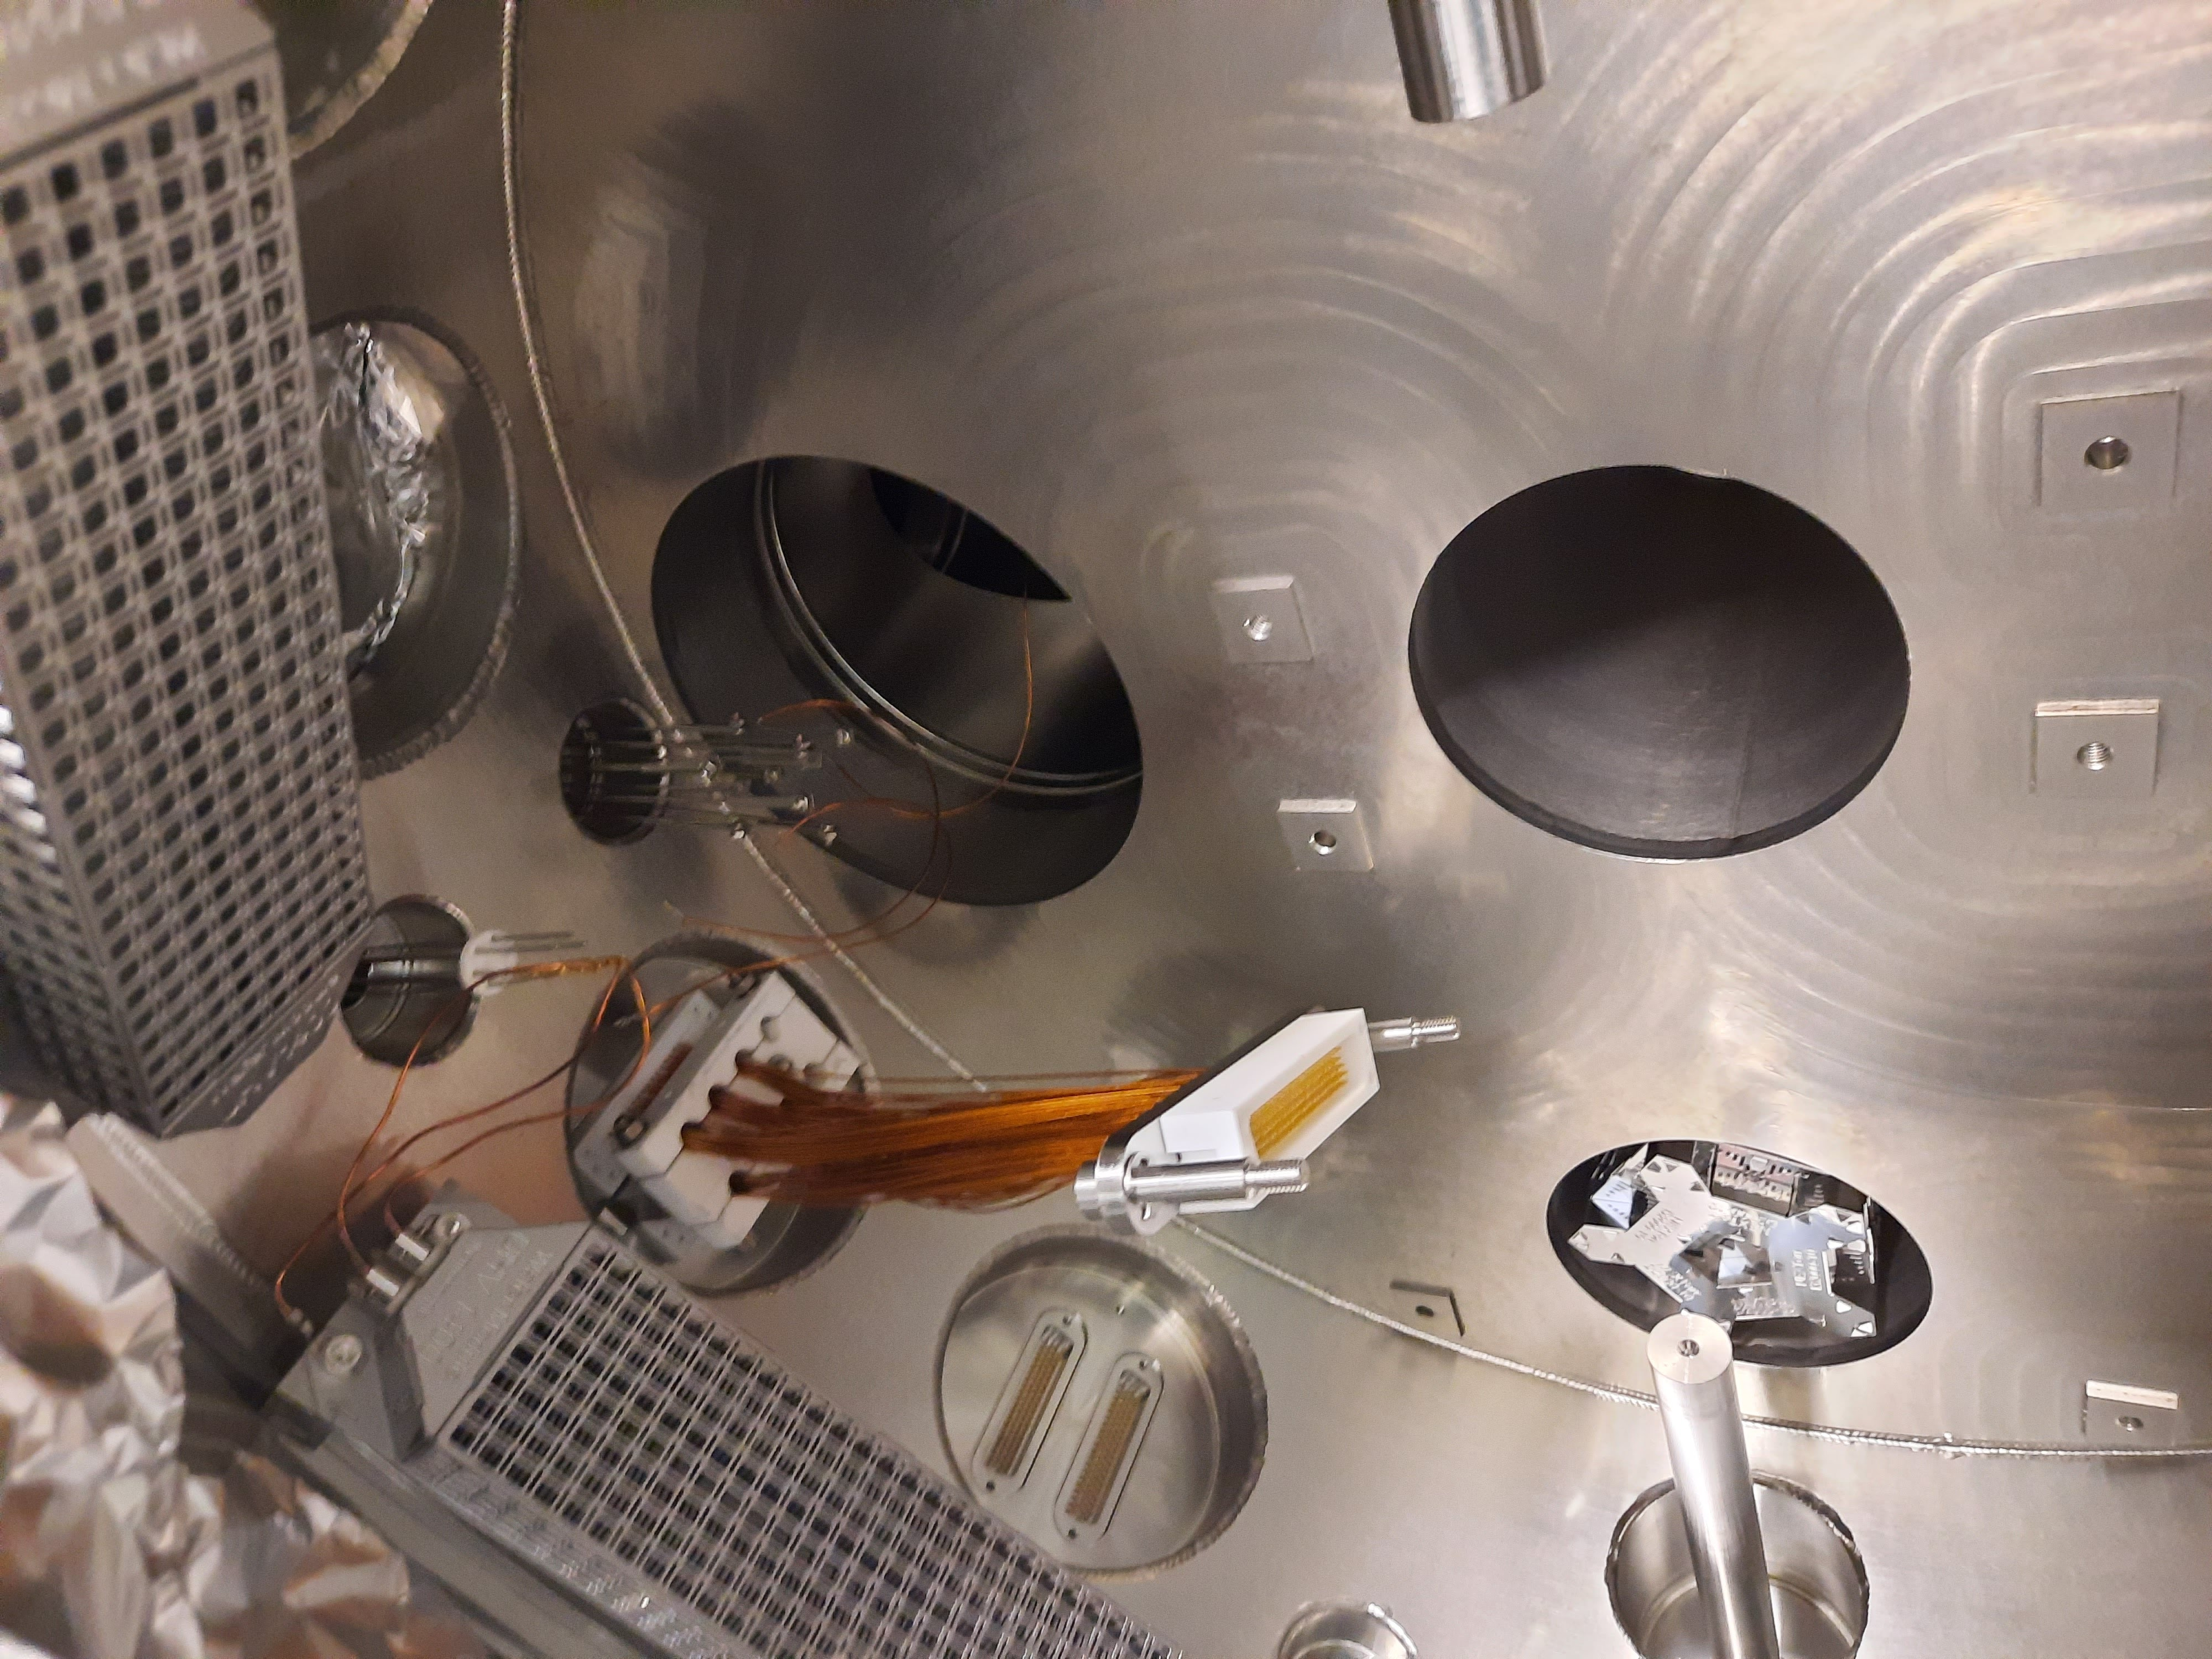
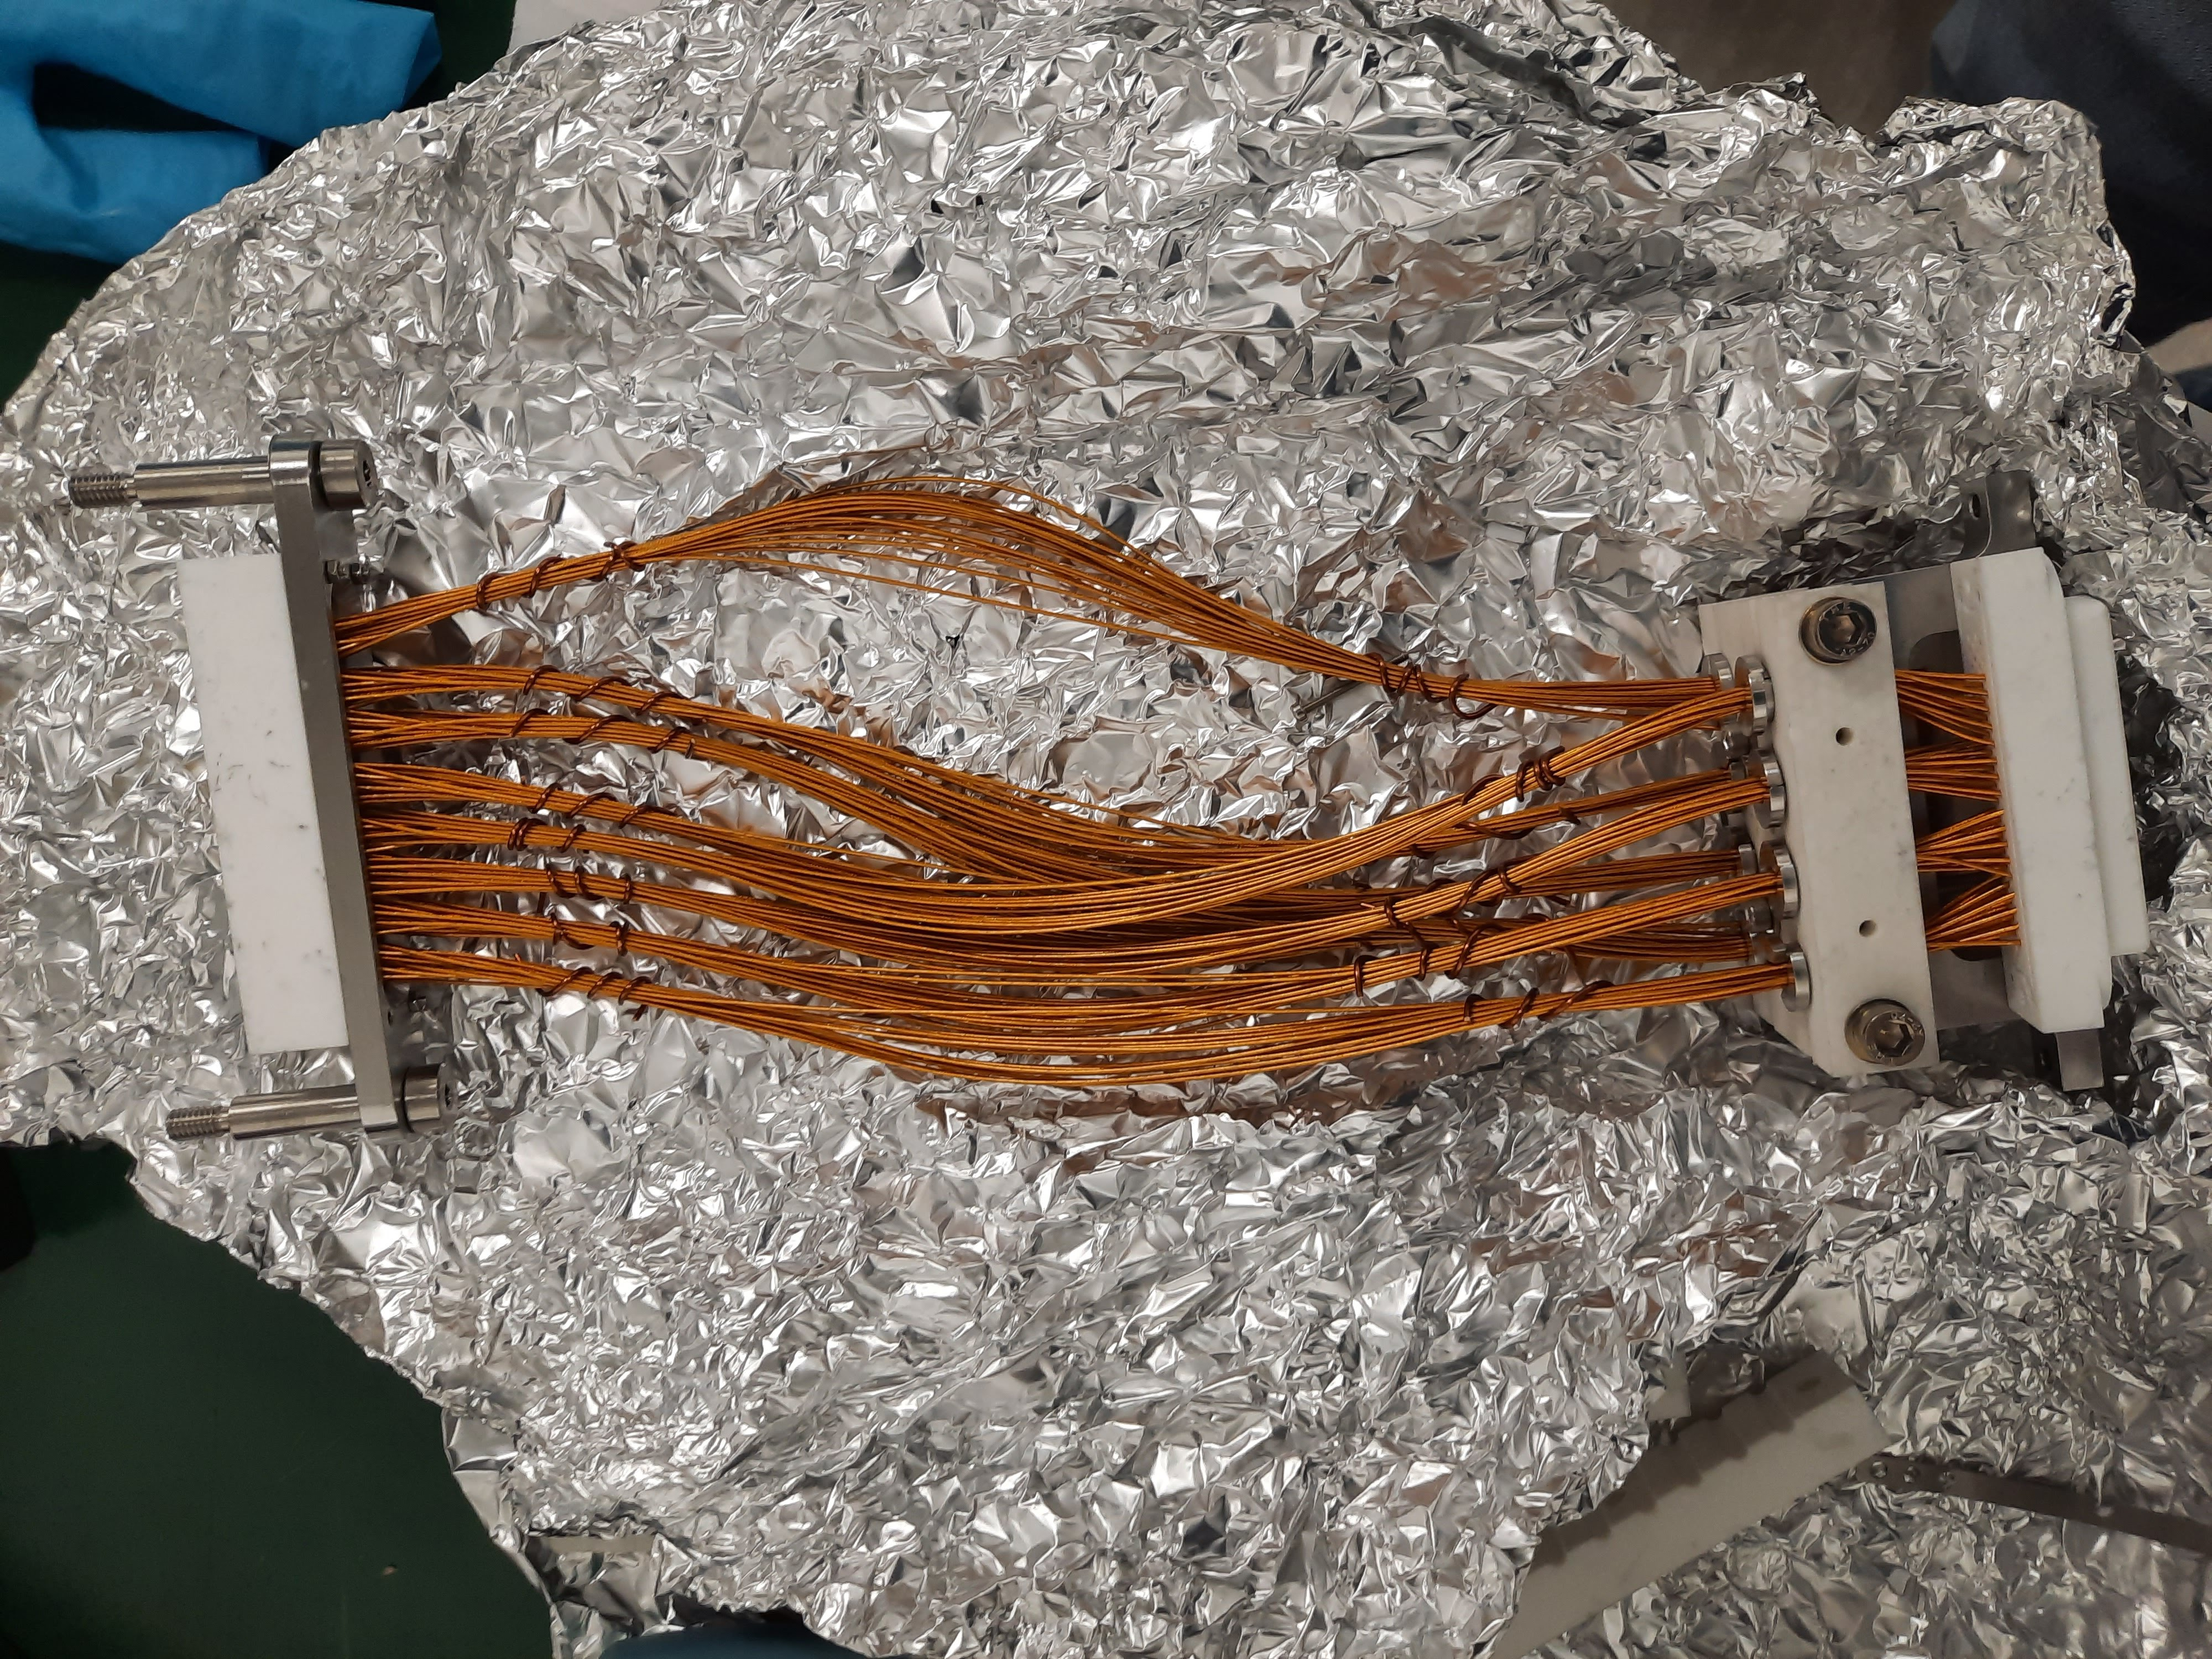
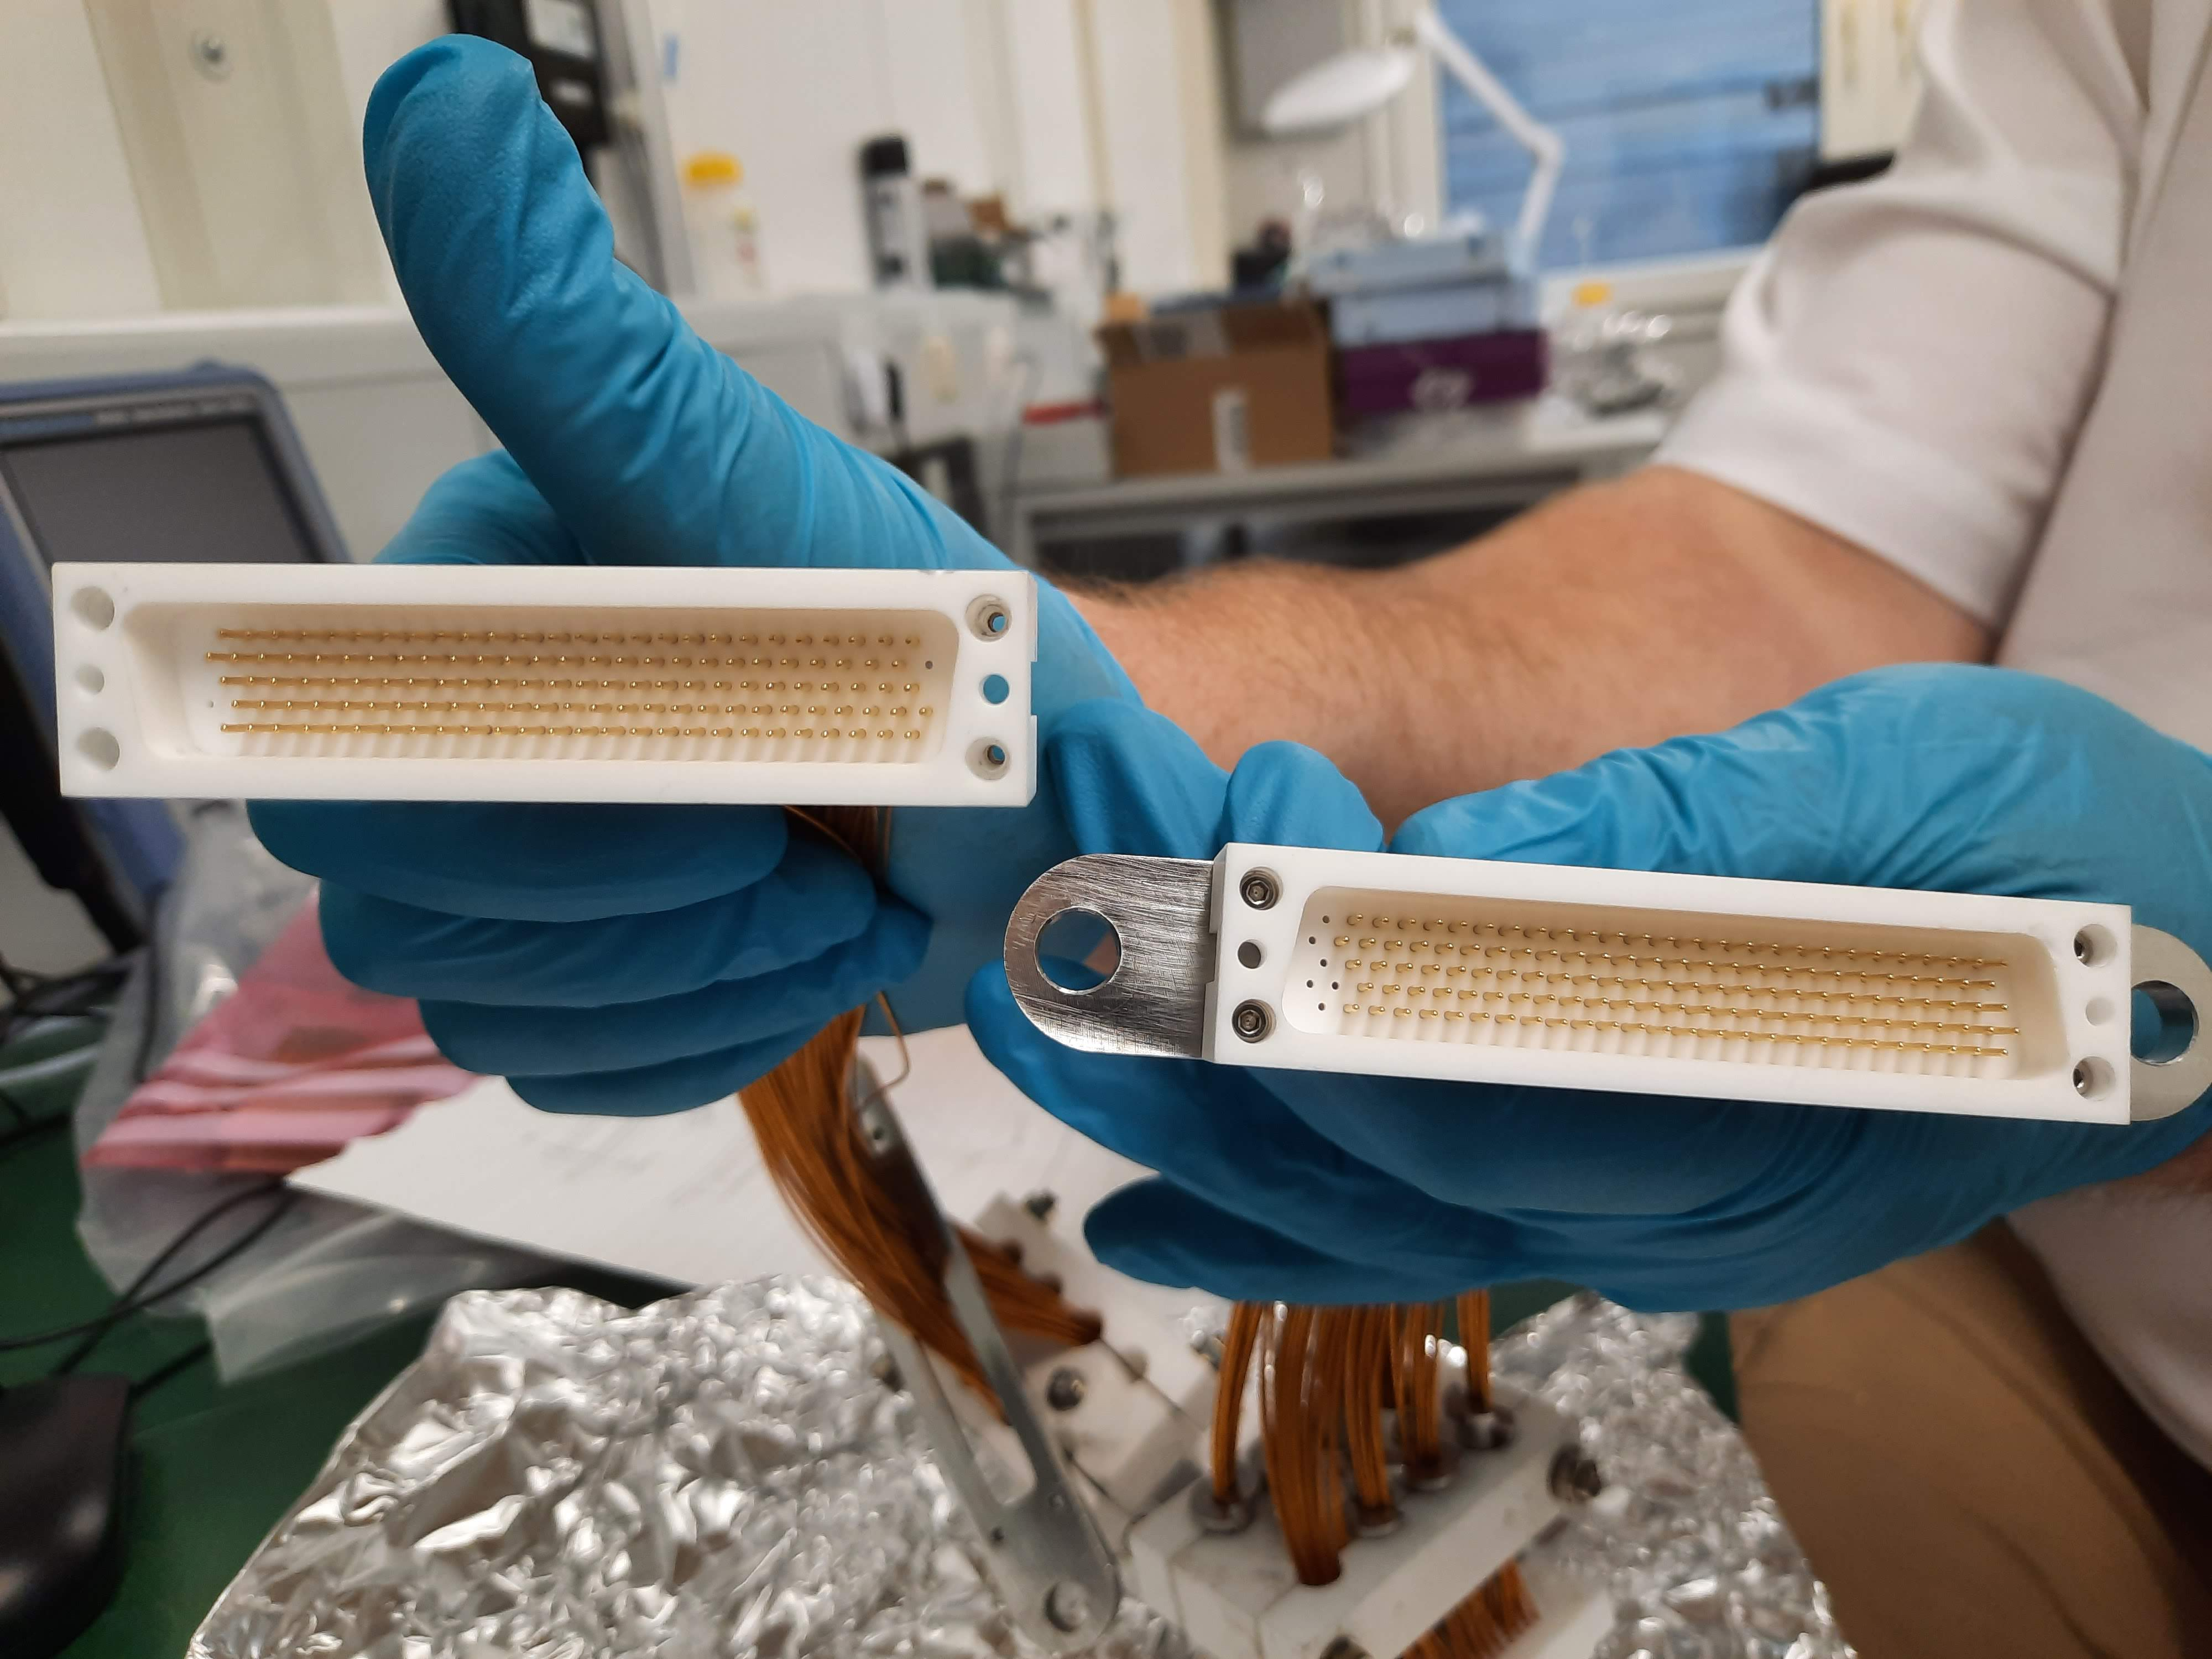
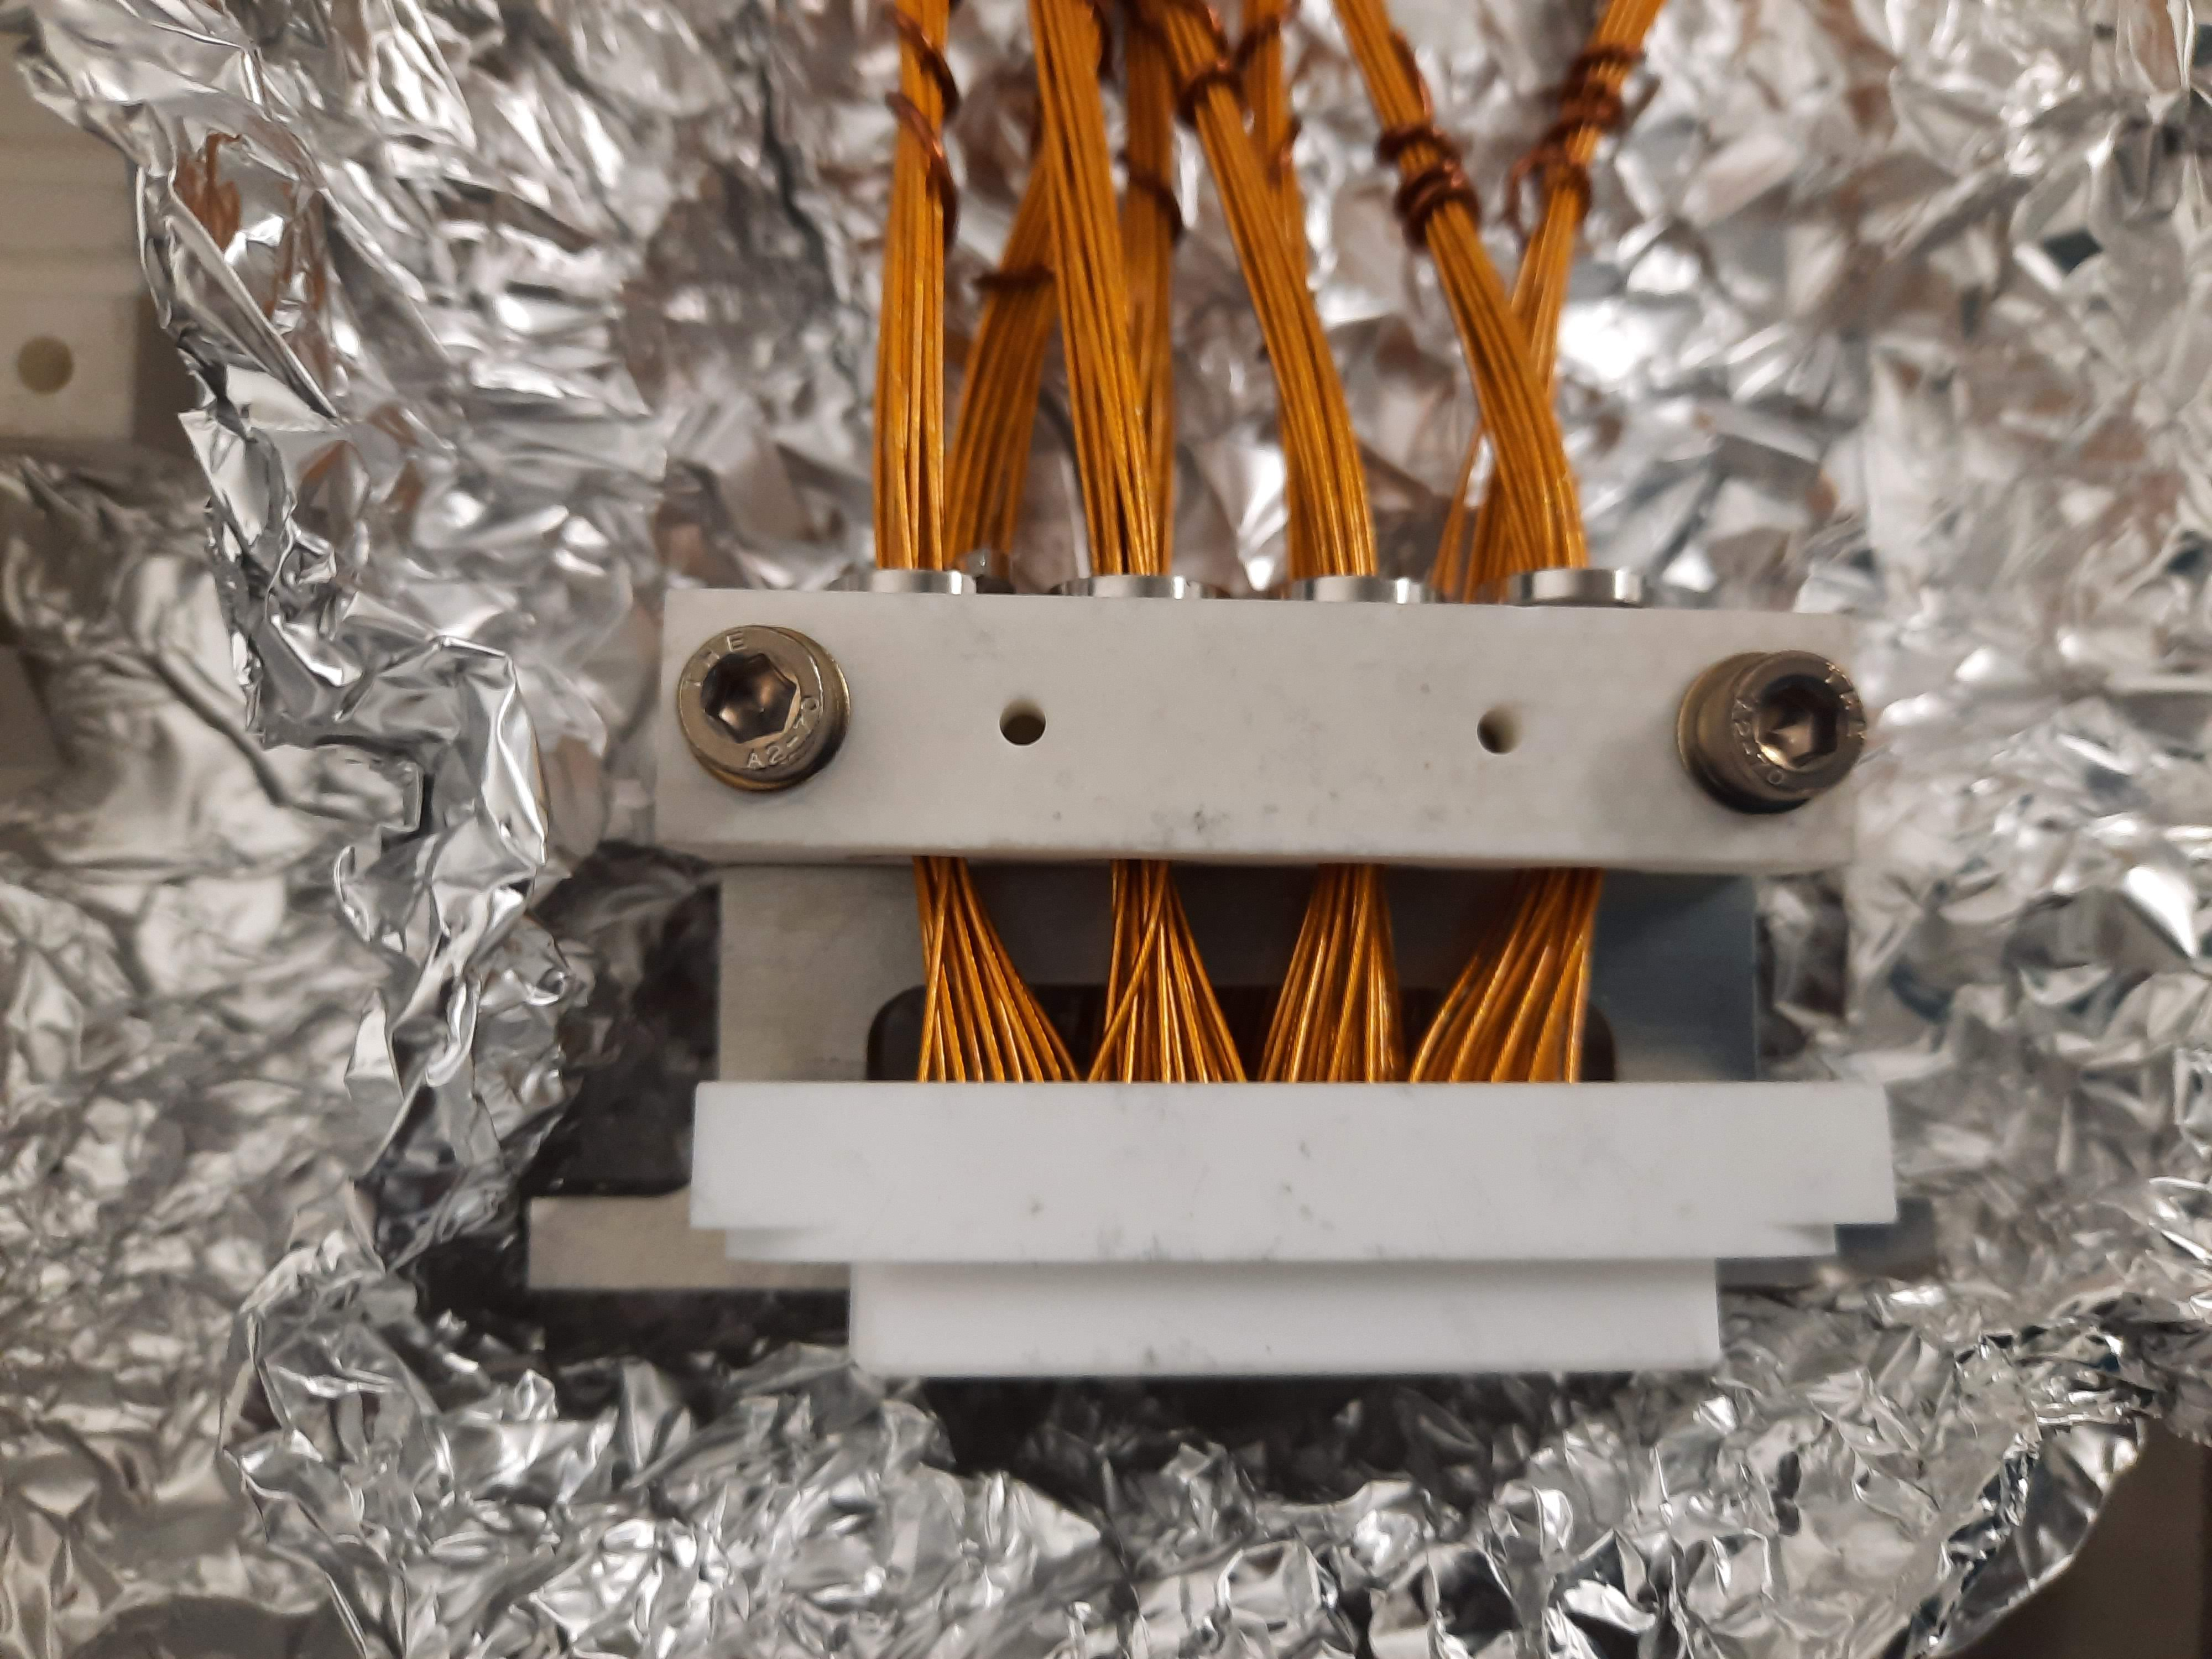
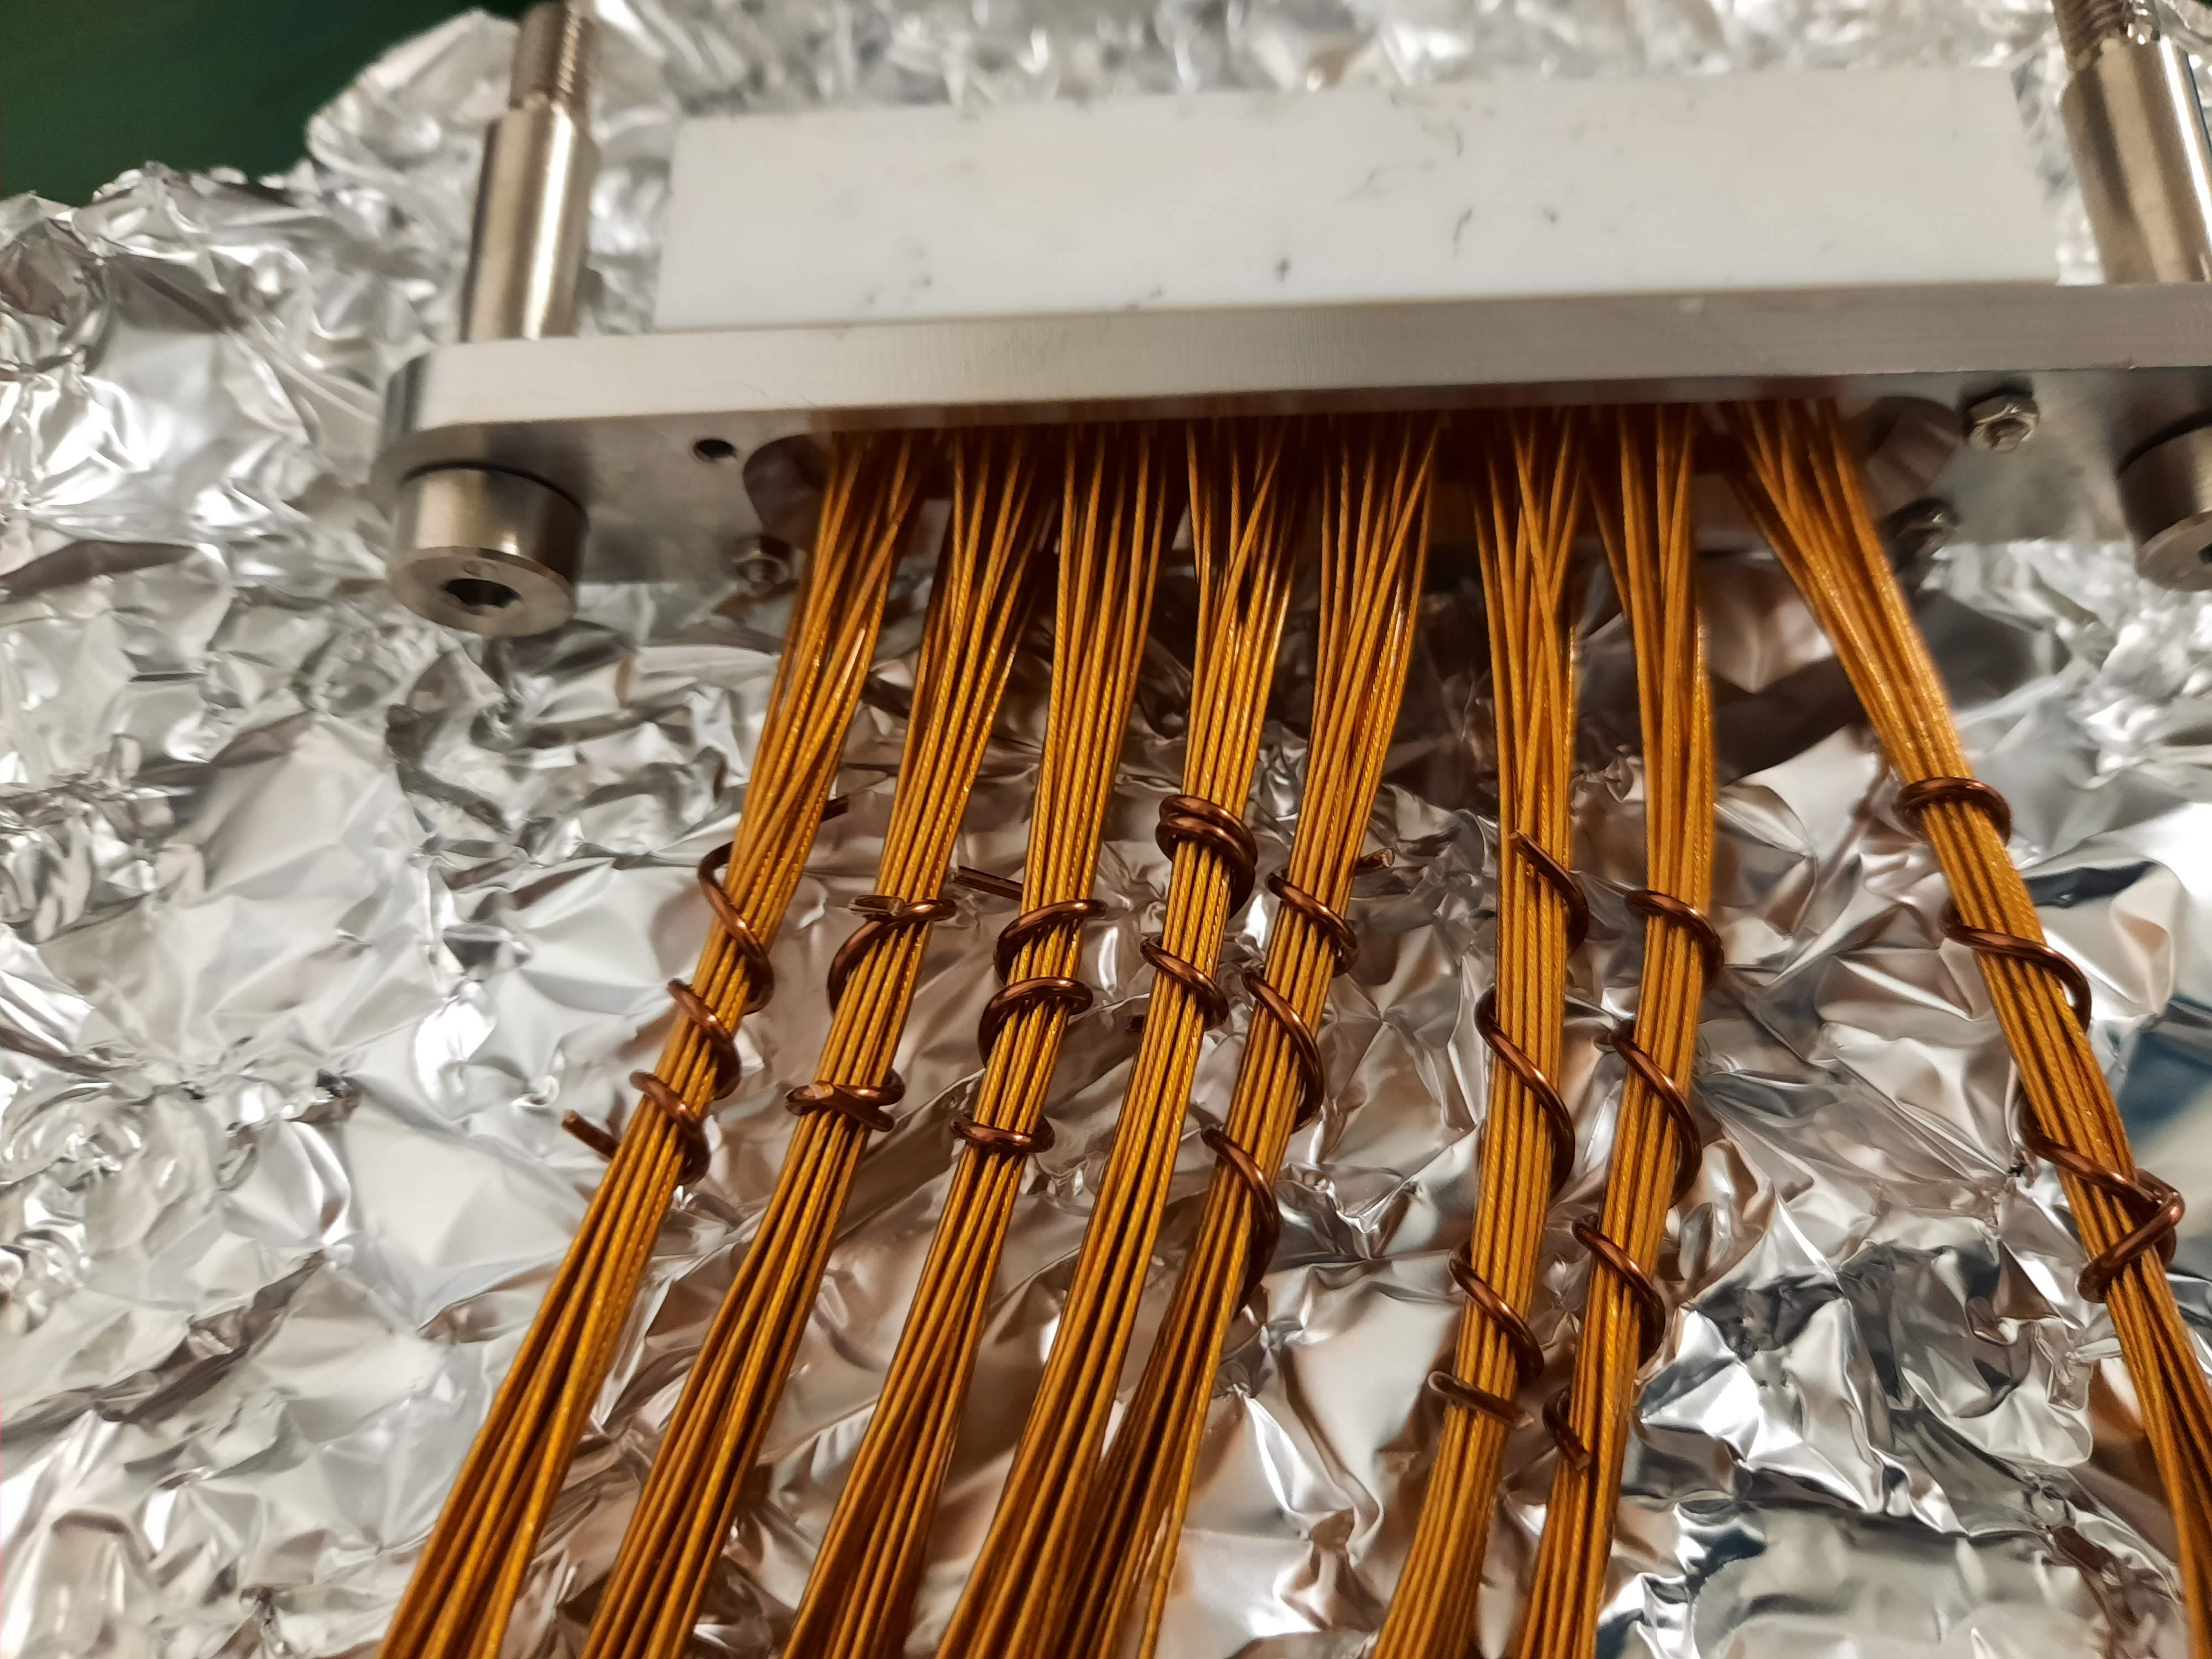
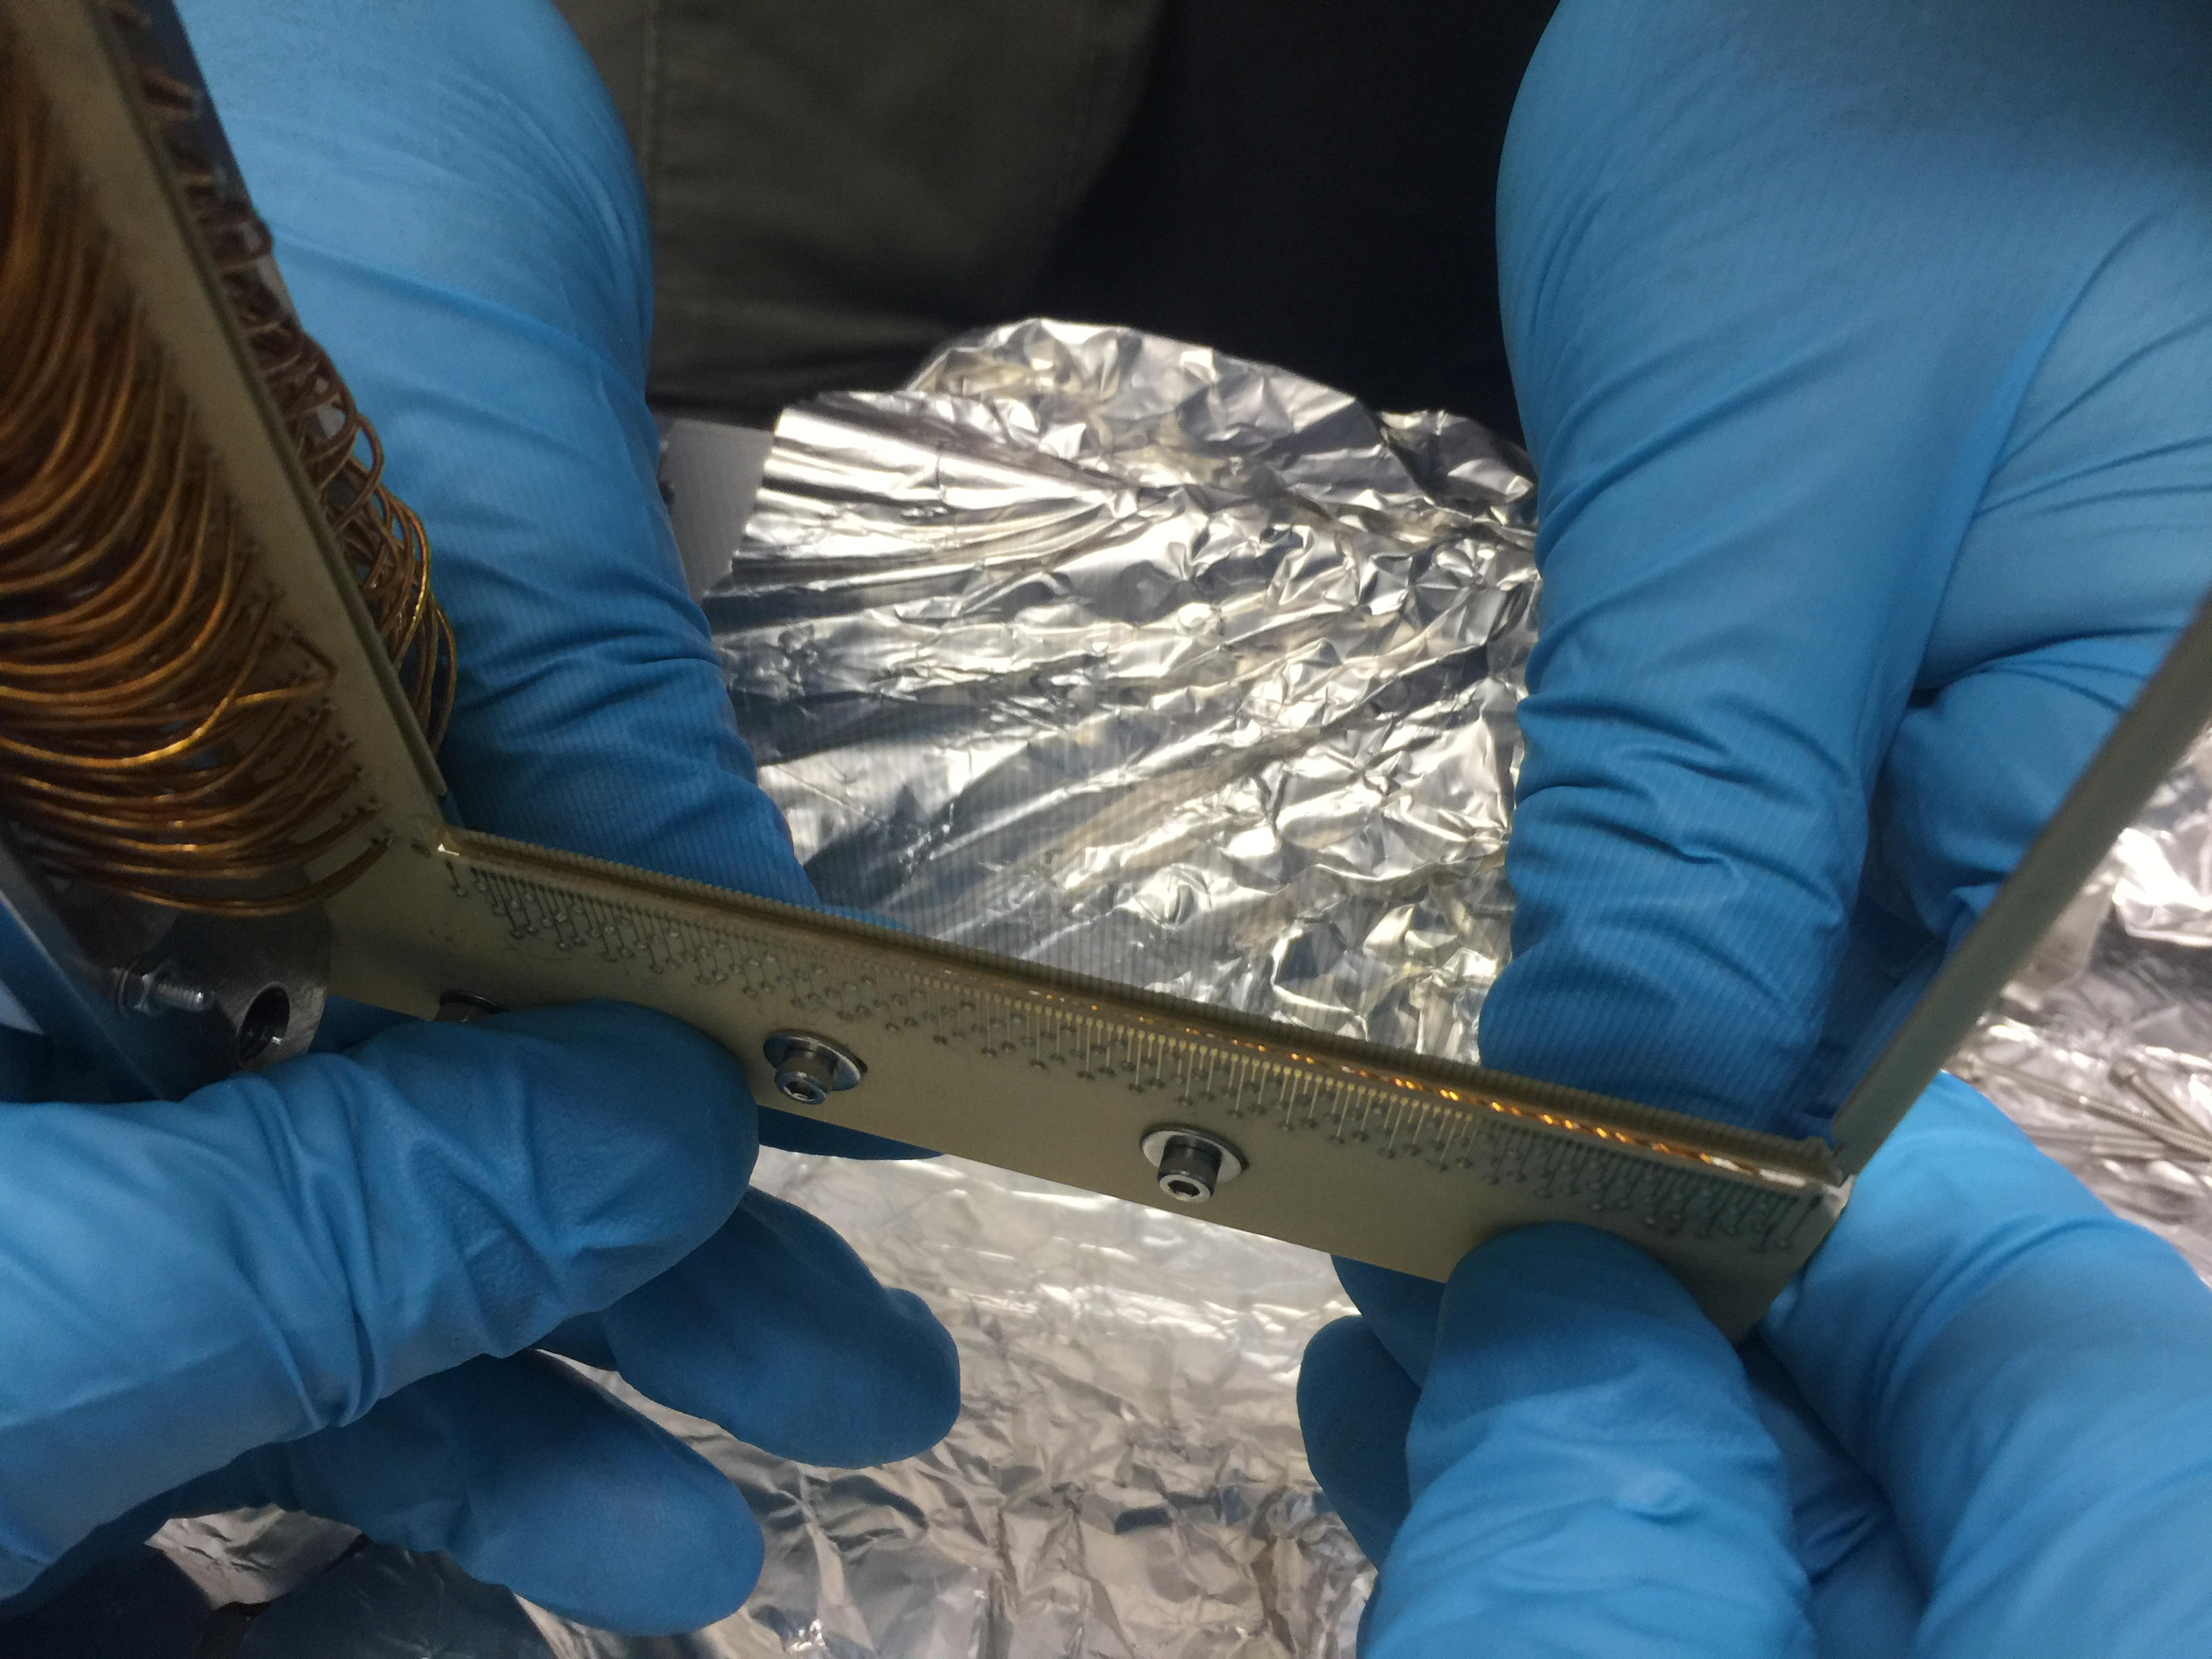
Cable connectors have started to be seperated and bound into 16 and 17 cable bunches to enable a good fit in strain reliefs. Upon inspection D-connectors were attached upside down and required flipping to correct position (see image - thumbs up indicates correct position). Cables fit through funnel strain reliefs well, other strain reliefs look more difficult - may require more hands to complete. One long connector has criss crossed wires which may not fit in strain reliefs and may require re-wiring a few cables and one long has broken D-connector. Broken ceramic can be replaced with new D-connector and other long connectors are available
Damaged detector removed from carrier and is in its box - awaiting delivery of other detectors.
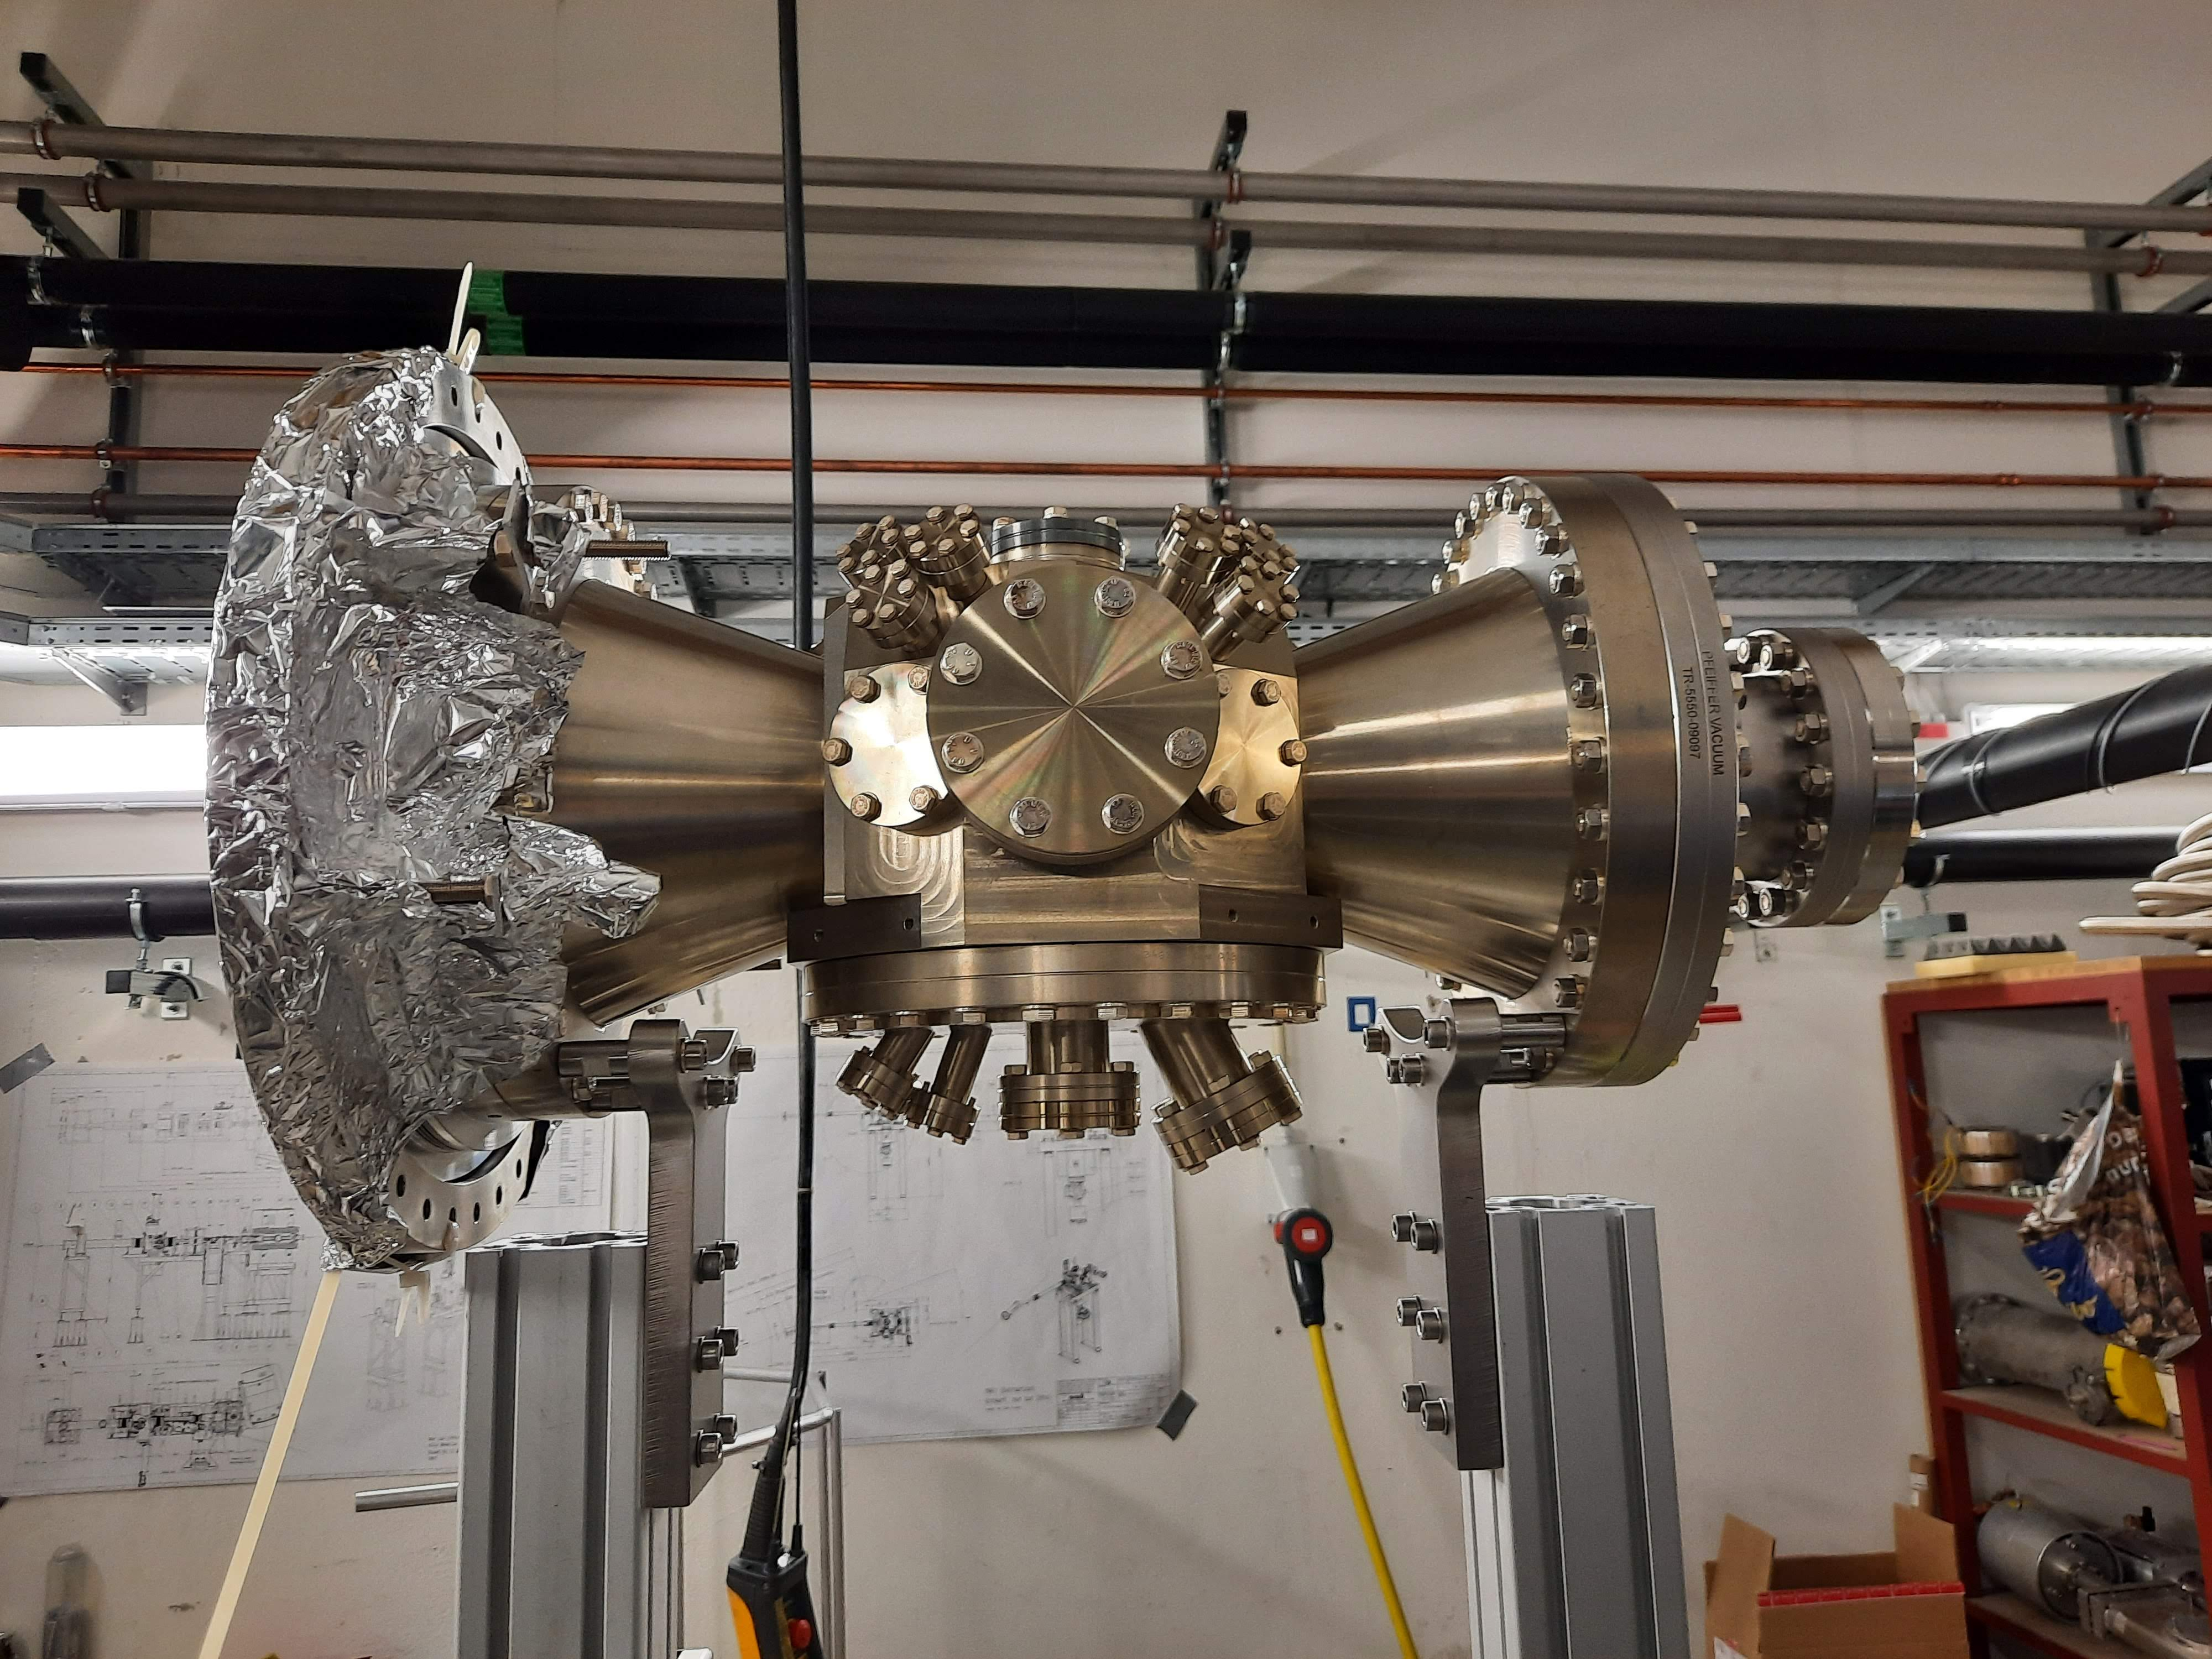
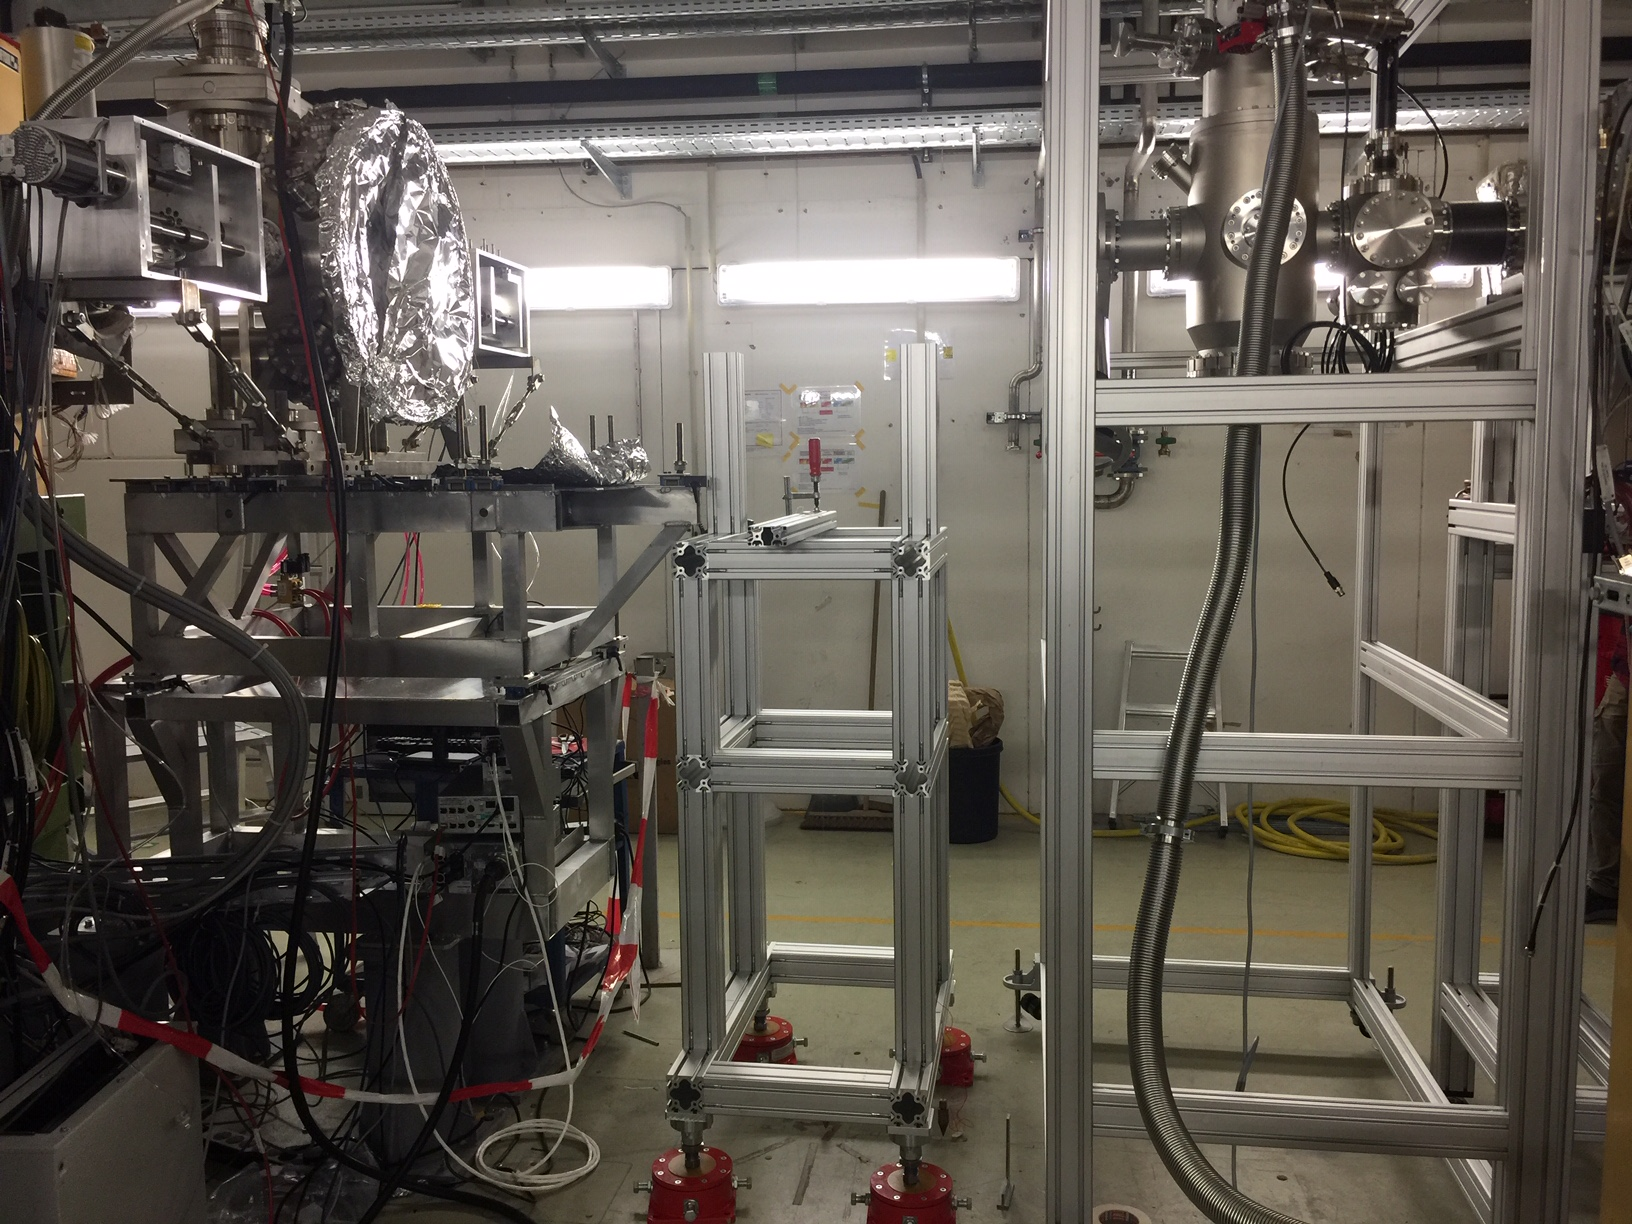
Interaction chamber mounted on its frame in CRYRING as well
|
| Attachment 1: 20211021_111319.jpg
|
|
| Attachment 2: 20211021_173047.jpg
|
|
| Attachment 3: 20211021_142901.jpg
|
|
| Attachment 4: 20211021_173102.jpg
|

|
| Attachment 5: 20211021_173107.jpg
|
|
| Attachment 6: 20211021_173054.jpg
|
|
| Attachment 7: 20211021_173047.jpg
|

|
| Attachment 8: 20211019_114556.jpg
|
|
| Attachment 9: 20211021_100650.jpg
|
|
| Attachment 10: 20211021_111516.jpg
|

|
|
127
|
Mon Oct 18 16:25:11 2021 |
JM RSS TD | NEG rotation + cable removals |
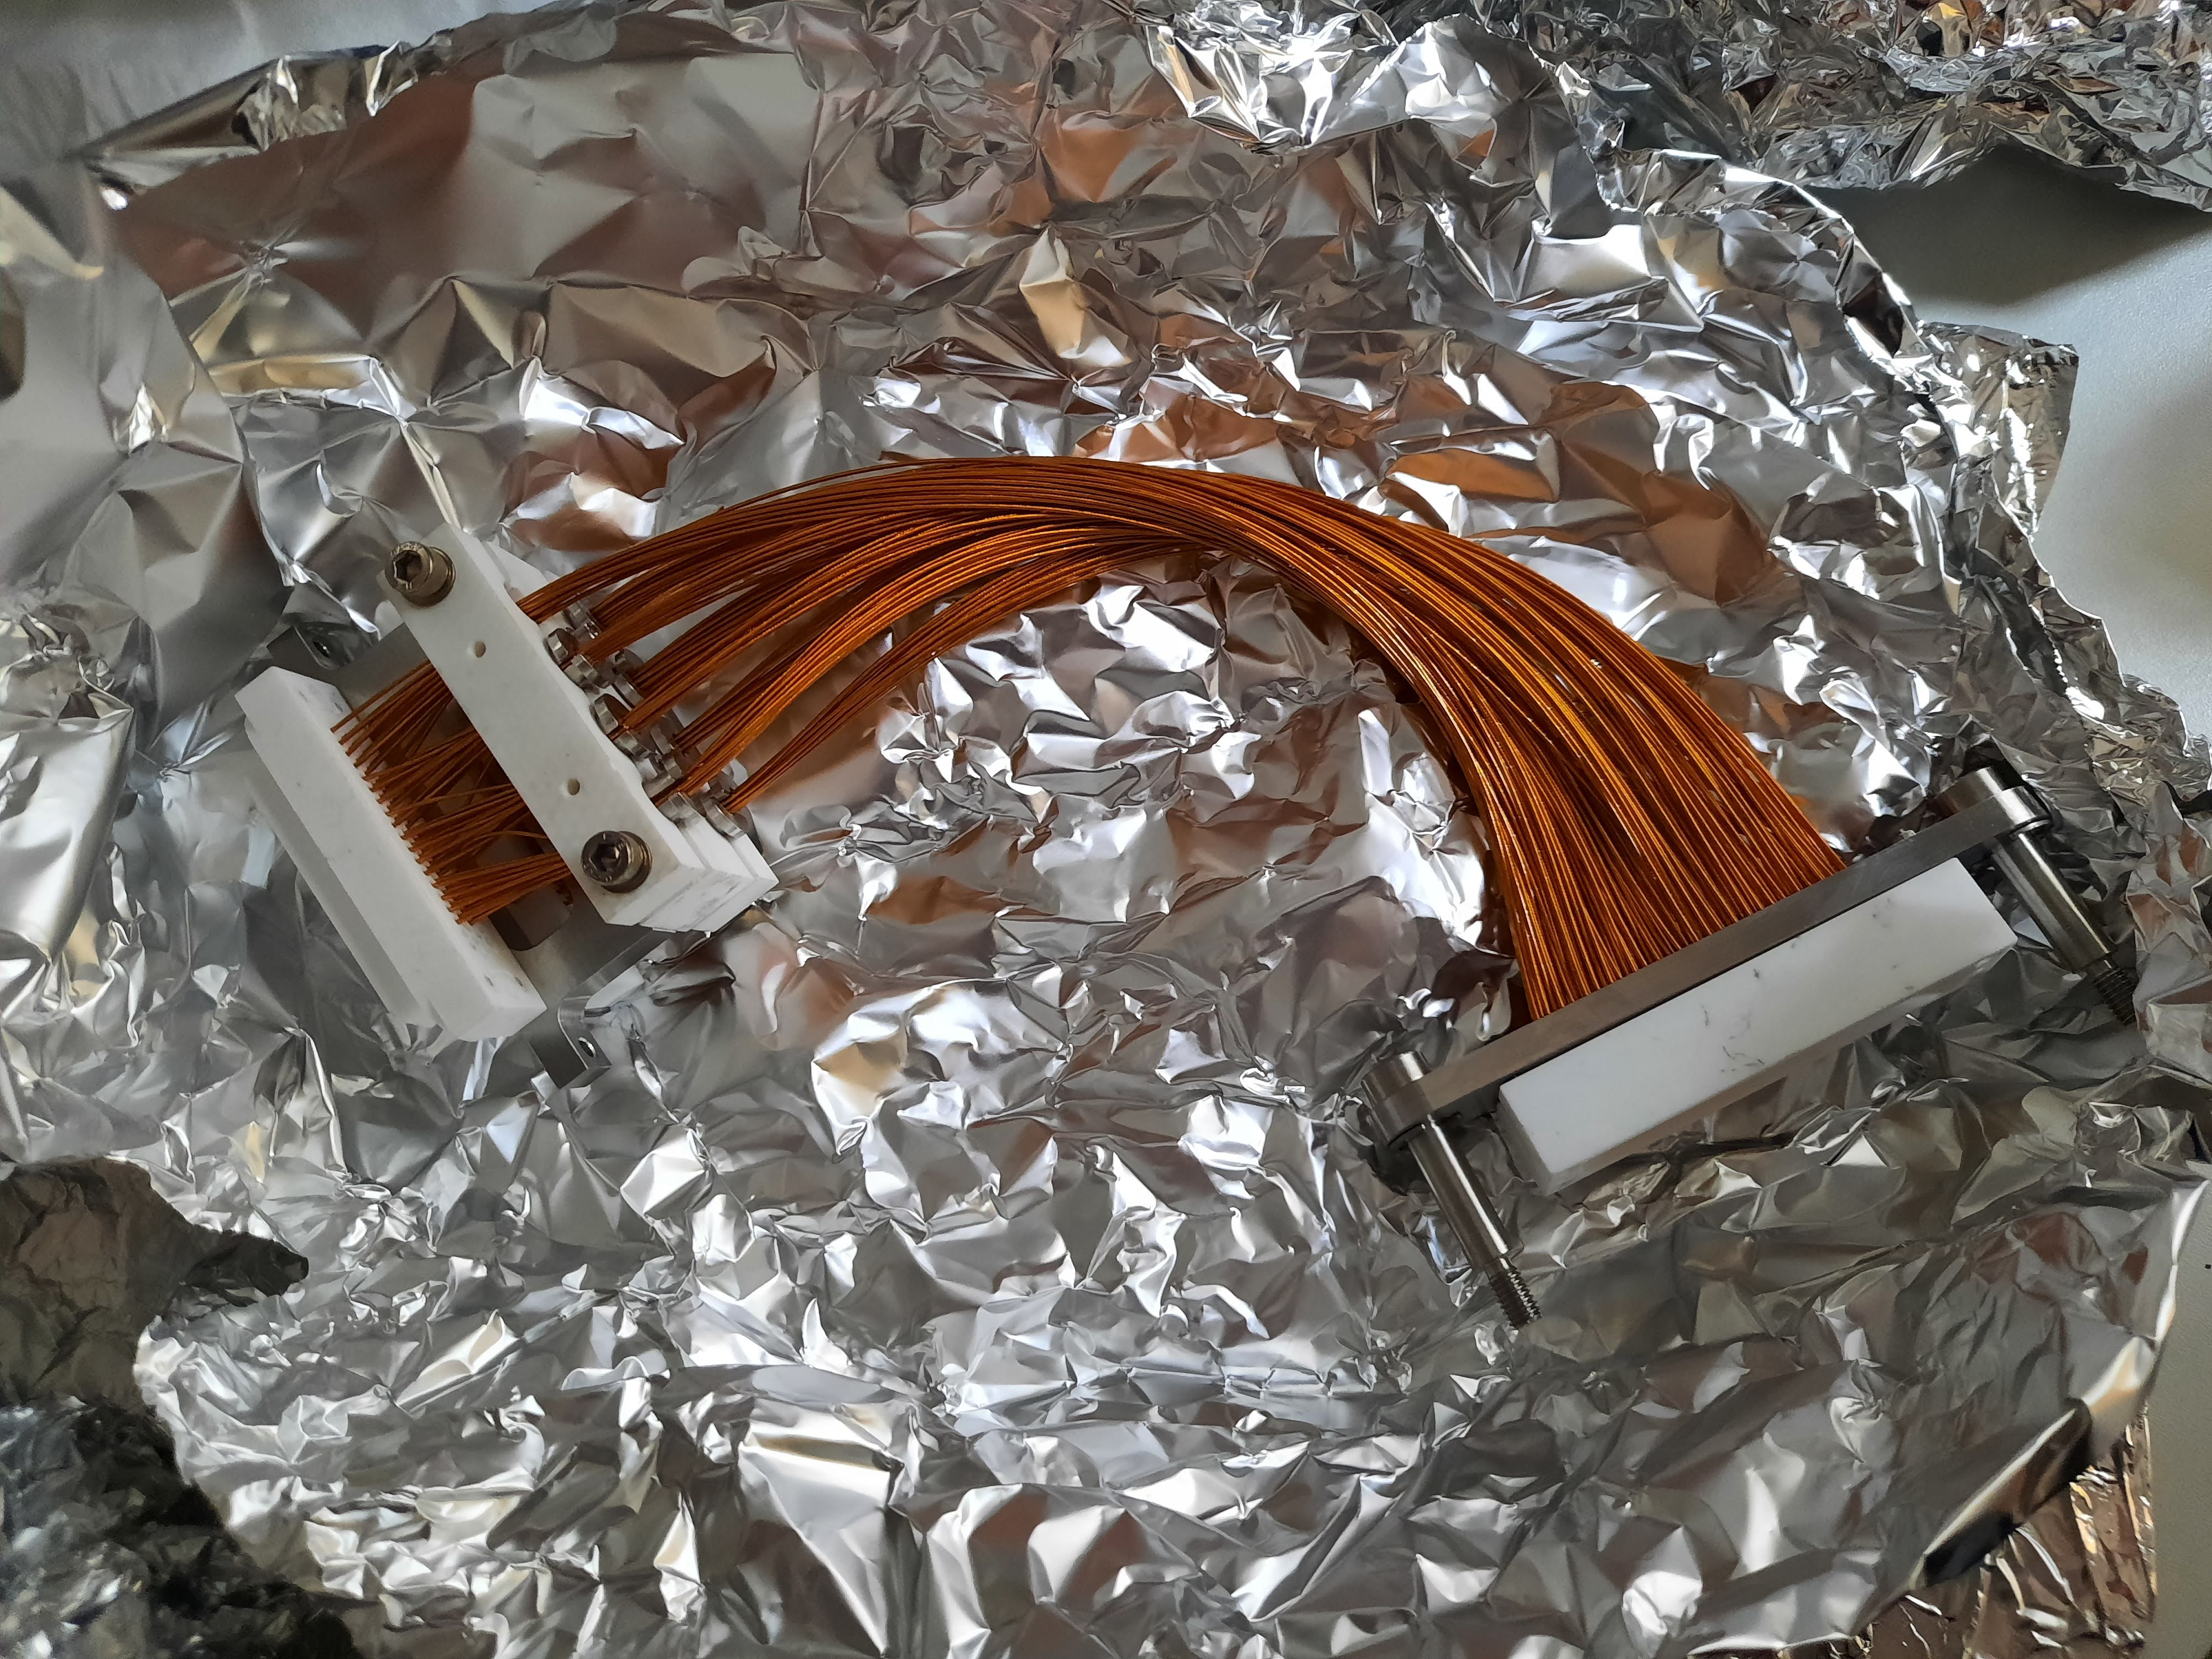
Kapton cabling and the broken ceramic detector holder have been separated. Required holding jacking plate in a vice and using lots of propanol to wet the jacking screw. A long set of kapton cabling has been removed from the other side of the chamber which can be used when mounting the detectors. The feedthrough flange was re-mounted on that side with no kapton cabling.
The wiring for the NEG feedthroughs was in confilct with detectors in previous position. Feedthroughs have been moved to the DN40 flanges at the top and bottom of the chamber section. In order to wire the NEGs to the feedthroughs required rotating the NEGs one position anti-clockwise and re-wiring some of the connections.
Left two Getters are connected in series and are connected to the top feedthrough. The two right and the bottom getter are connected in series and are connected to the bottom feedthrough |
| Attachment 1: Screenshot_20211018-174141_Signal.jpg
|

|
| Attachment 2: 20211018_111130.jpg
|
|
| Attachment 3: 20211018_100015.jpg
|

|
|
126
|
Sun Oct 17 11:48:48 2021 |
TD RSS | Sunday 17 October |
Looking downstream the RHS motor assembly has  loose green/yellow (gnd?) see attachment 1

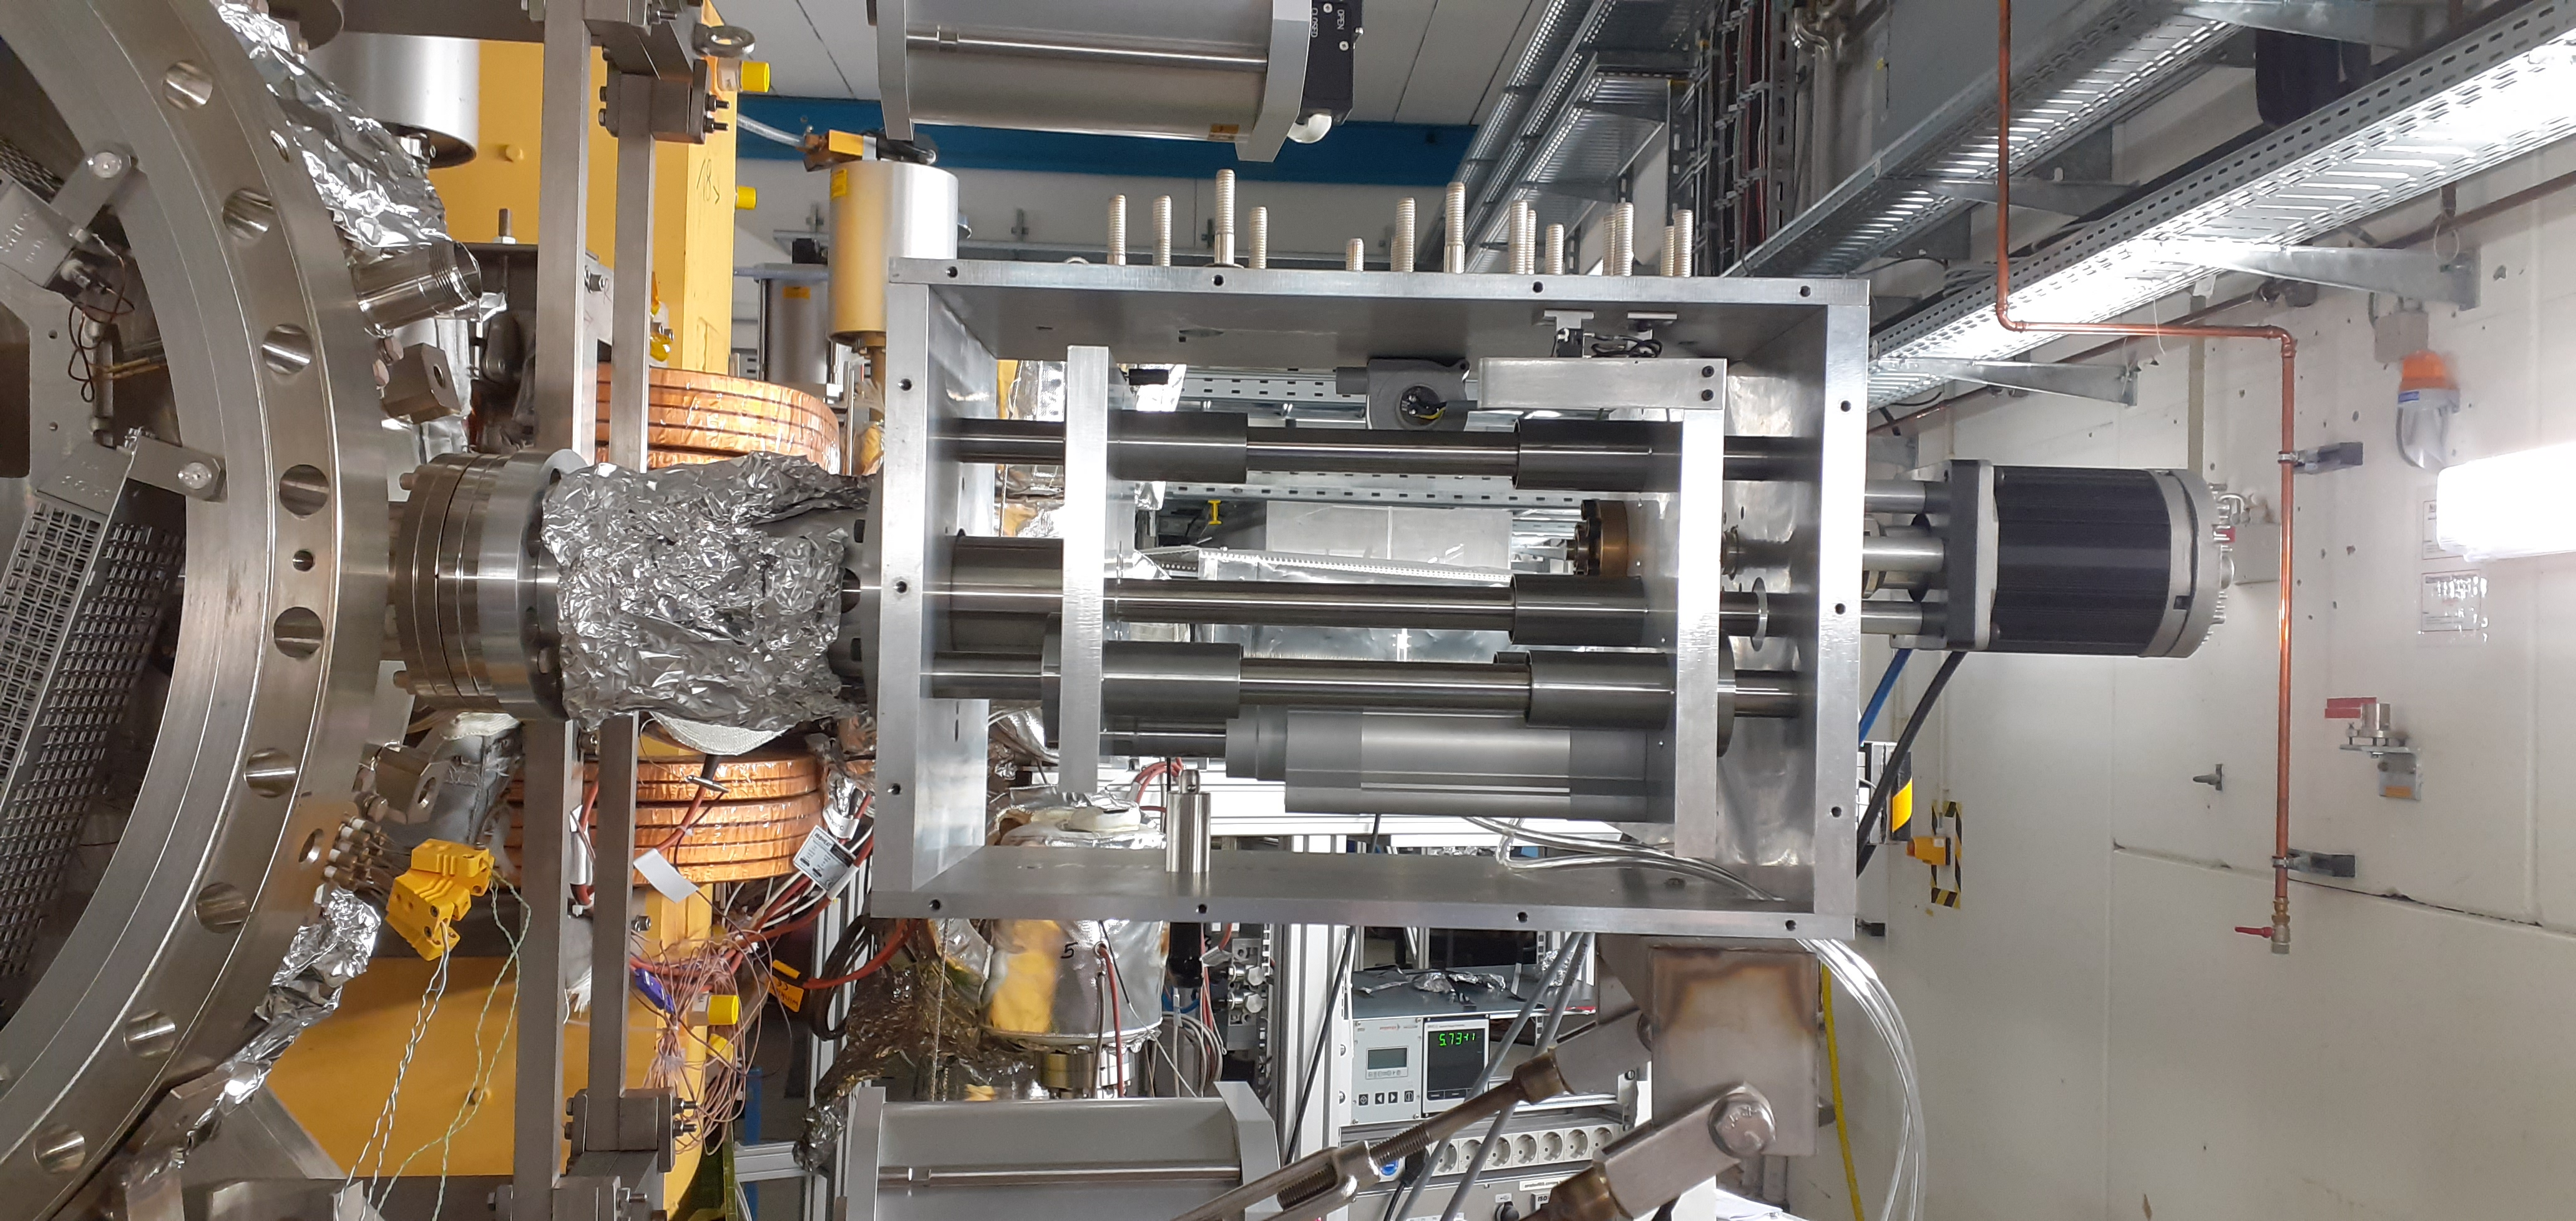
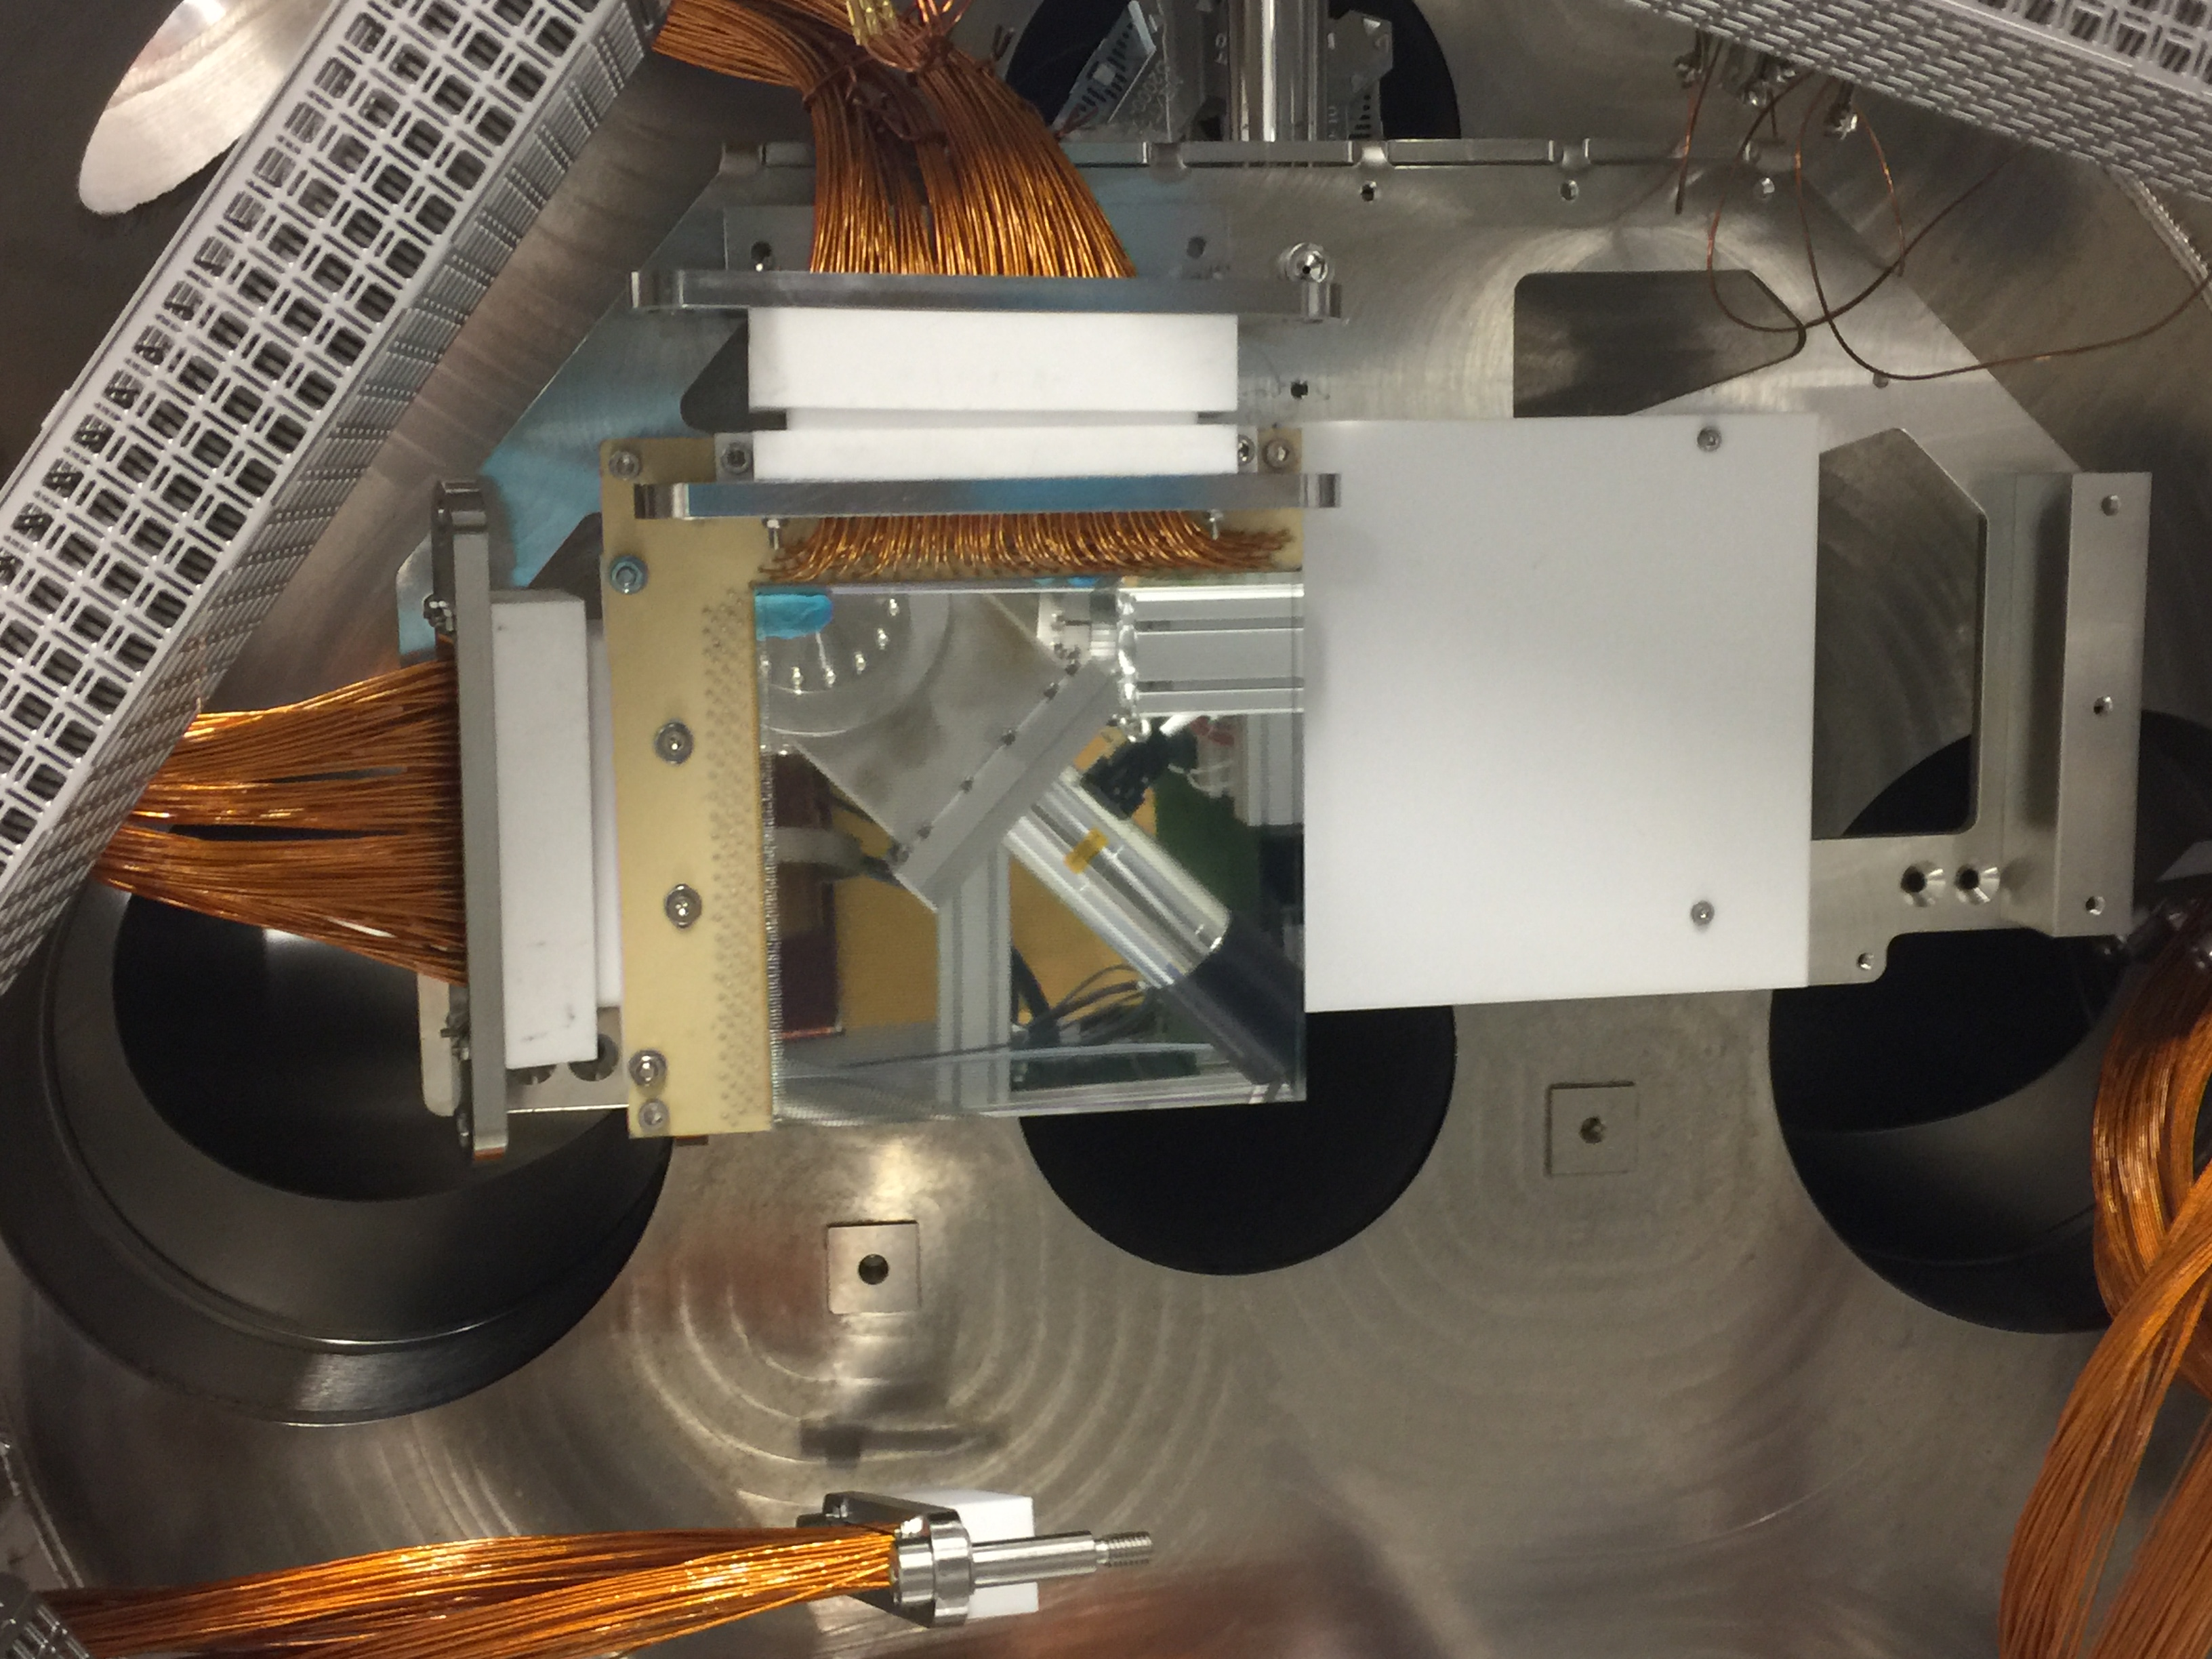
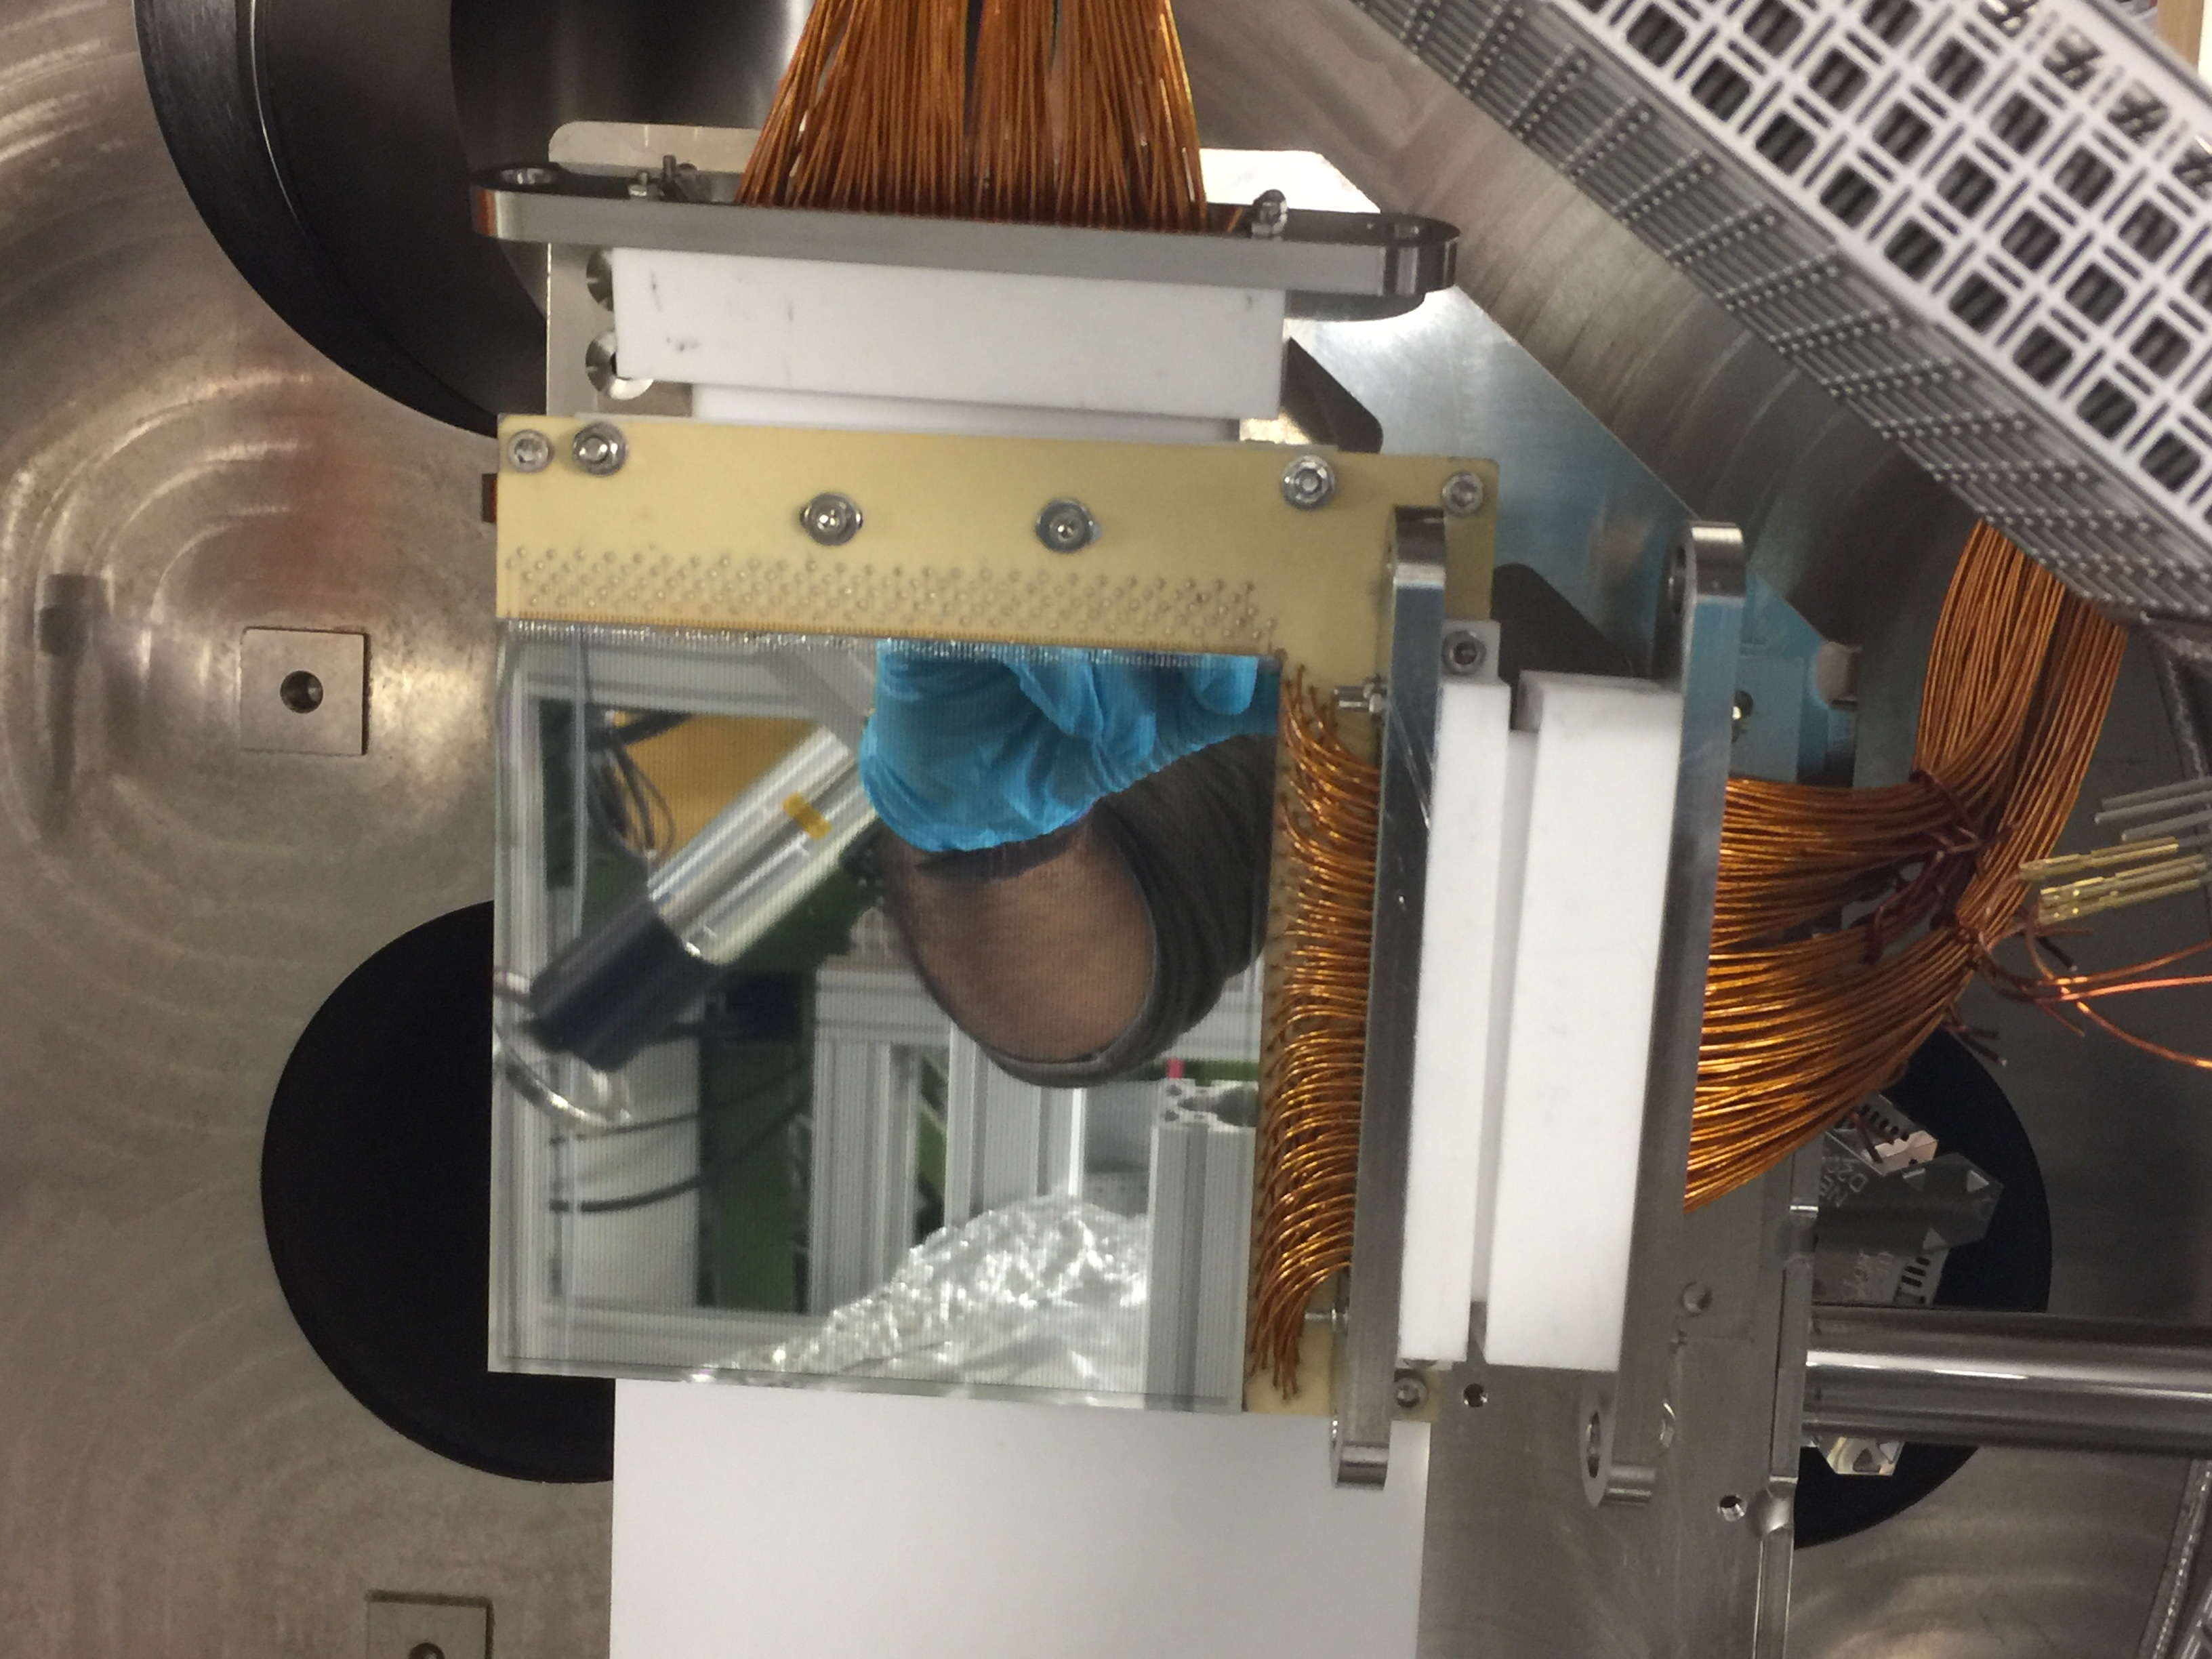
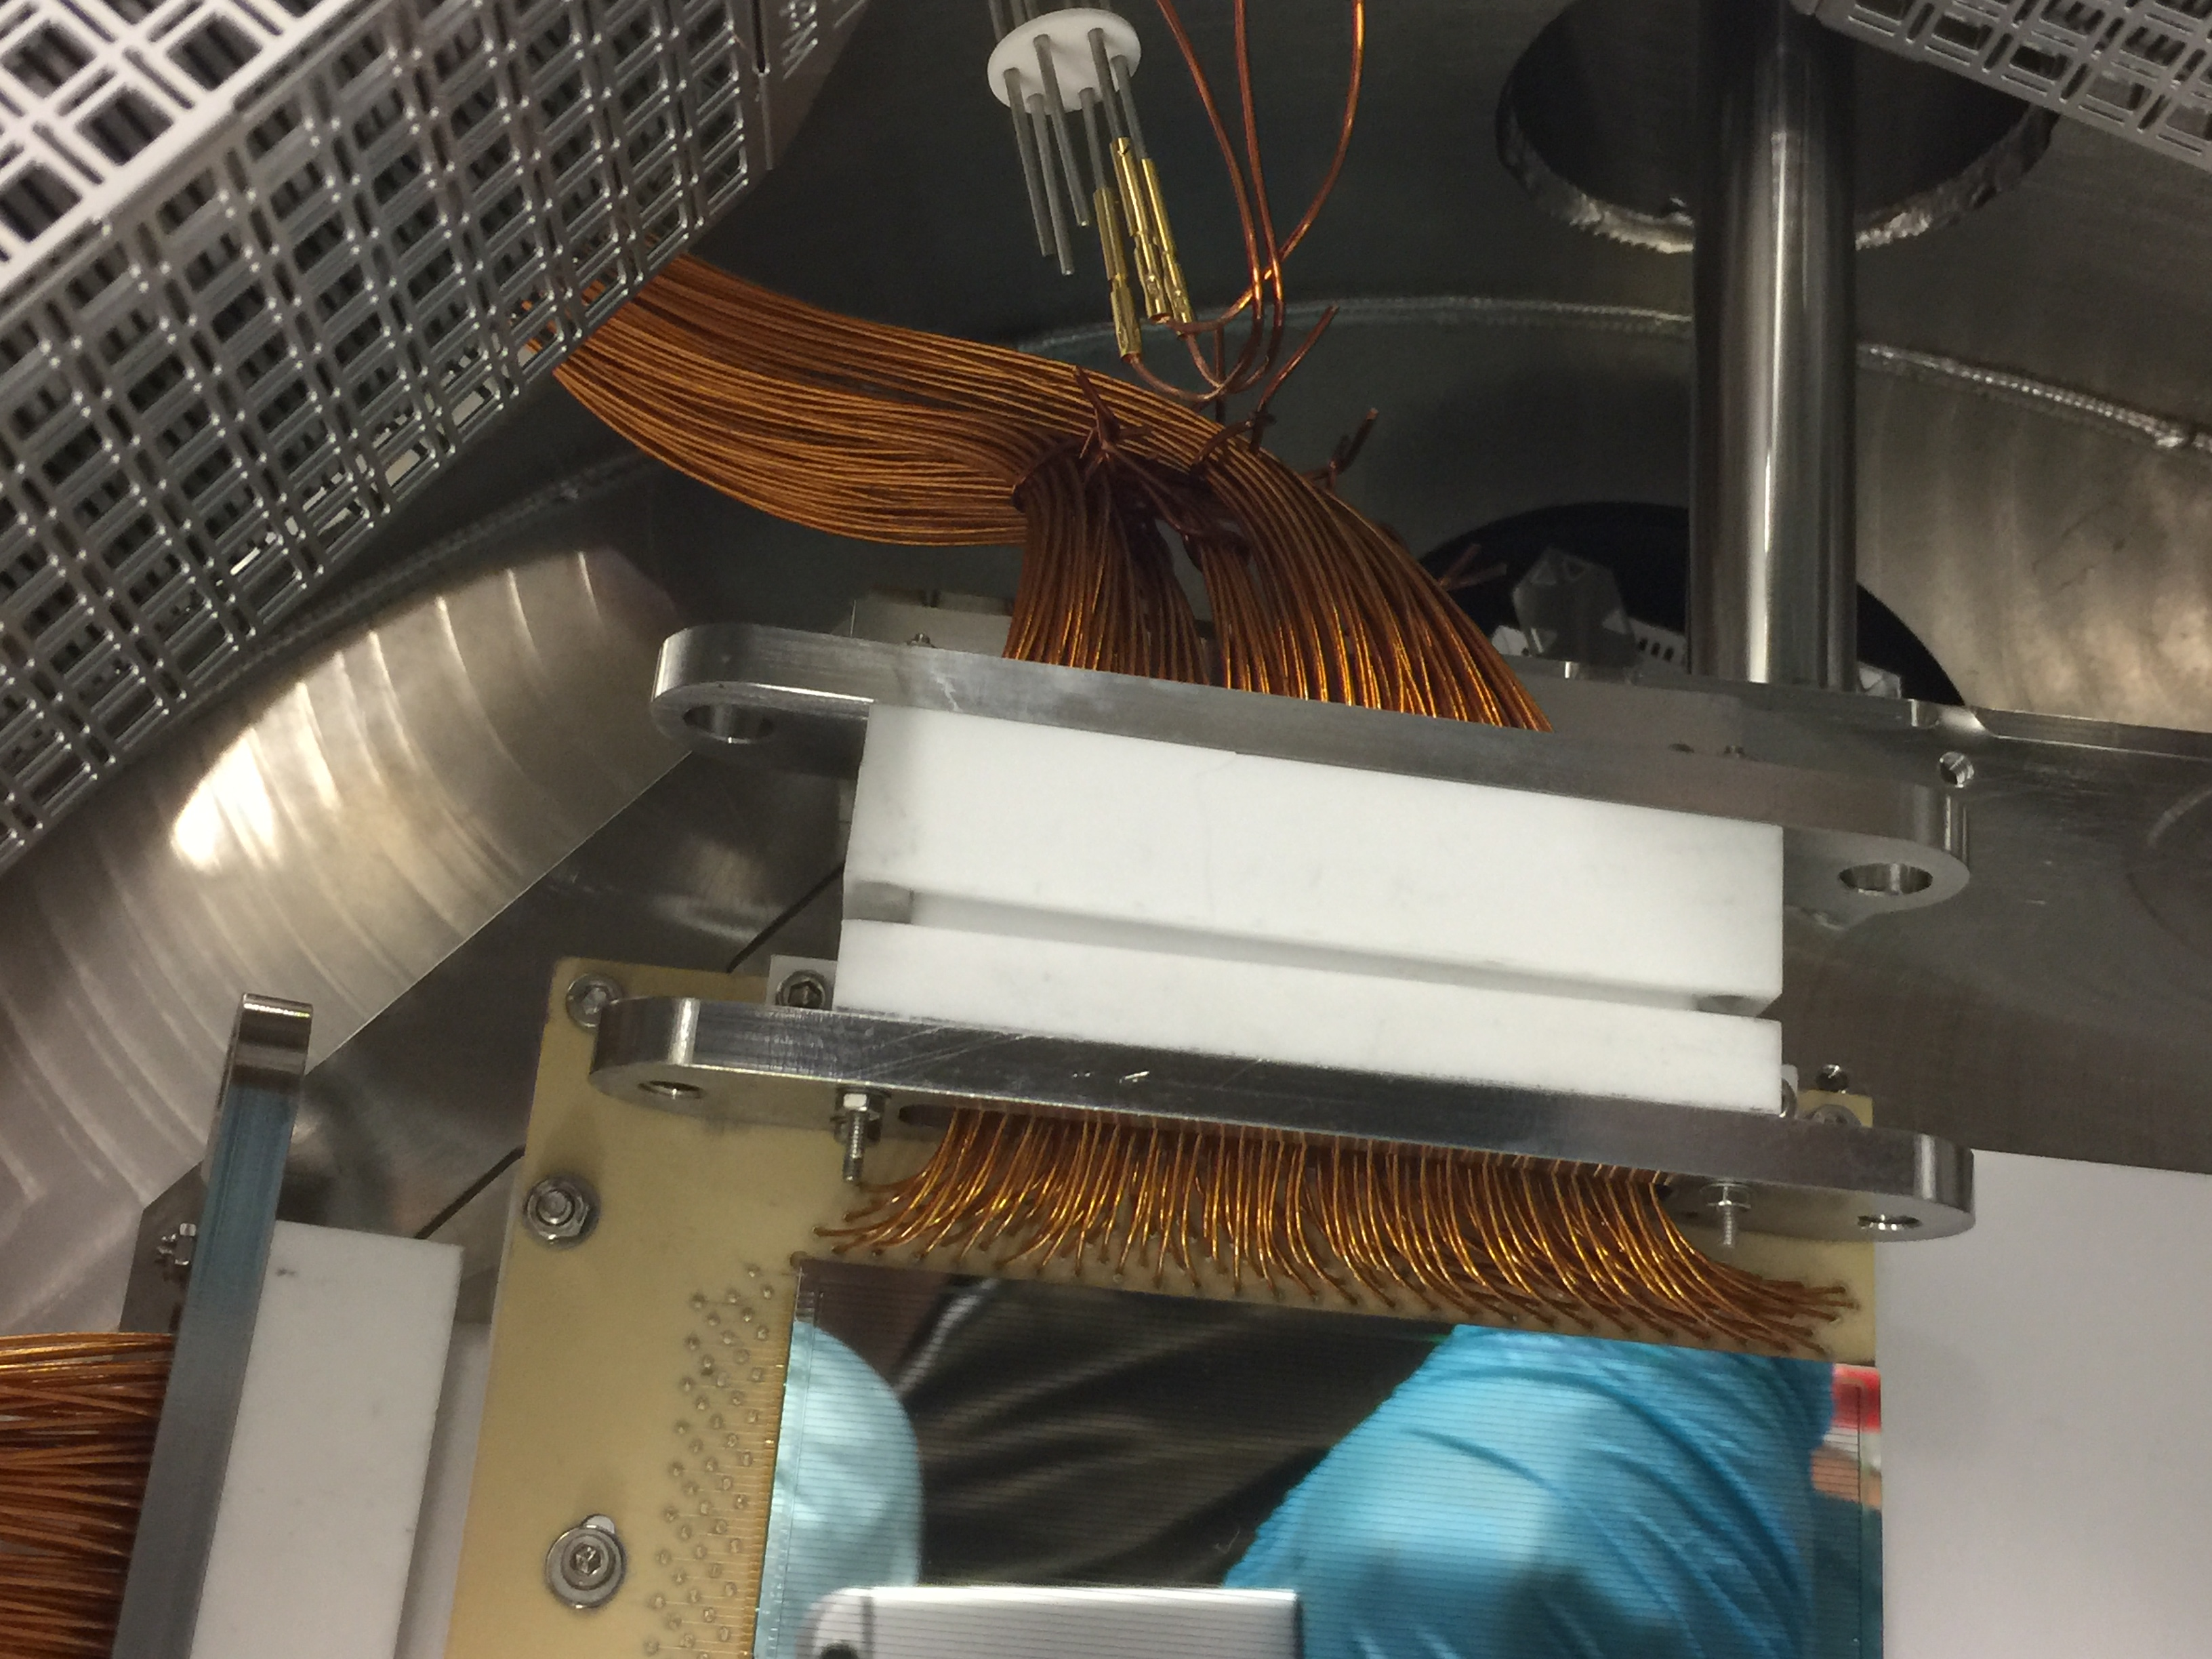
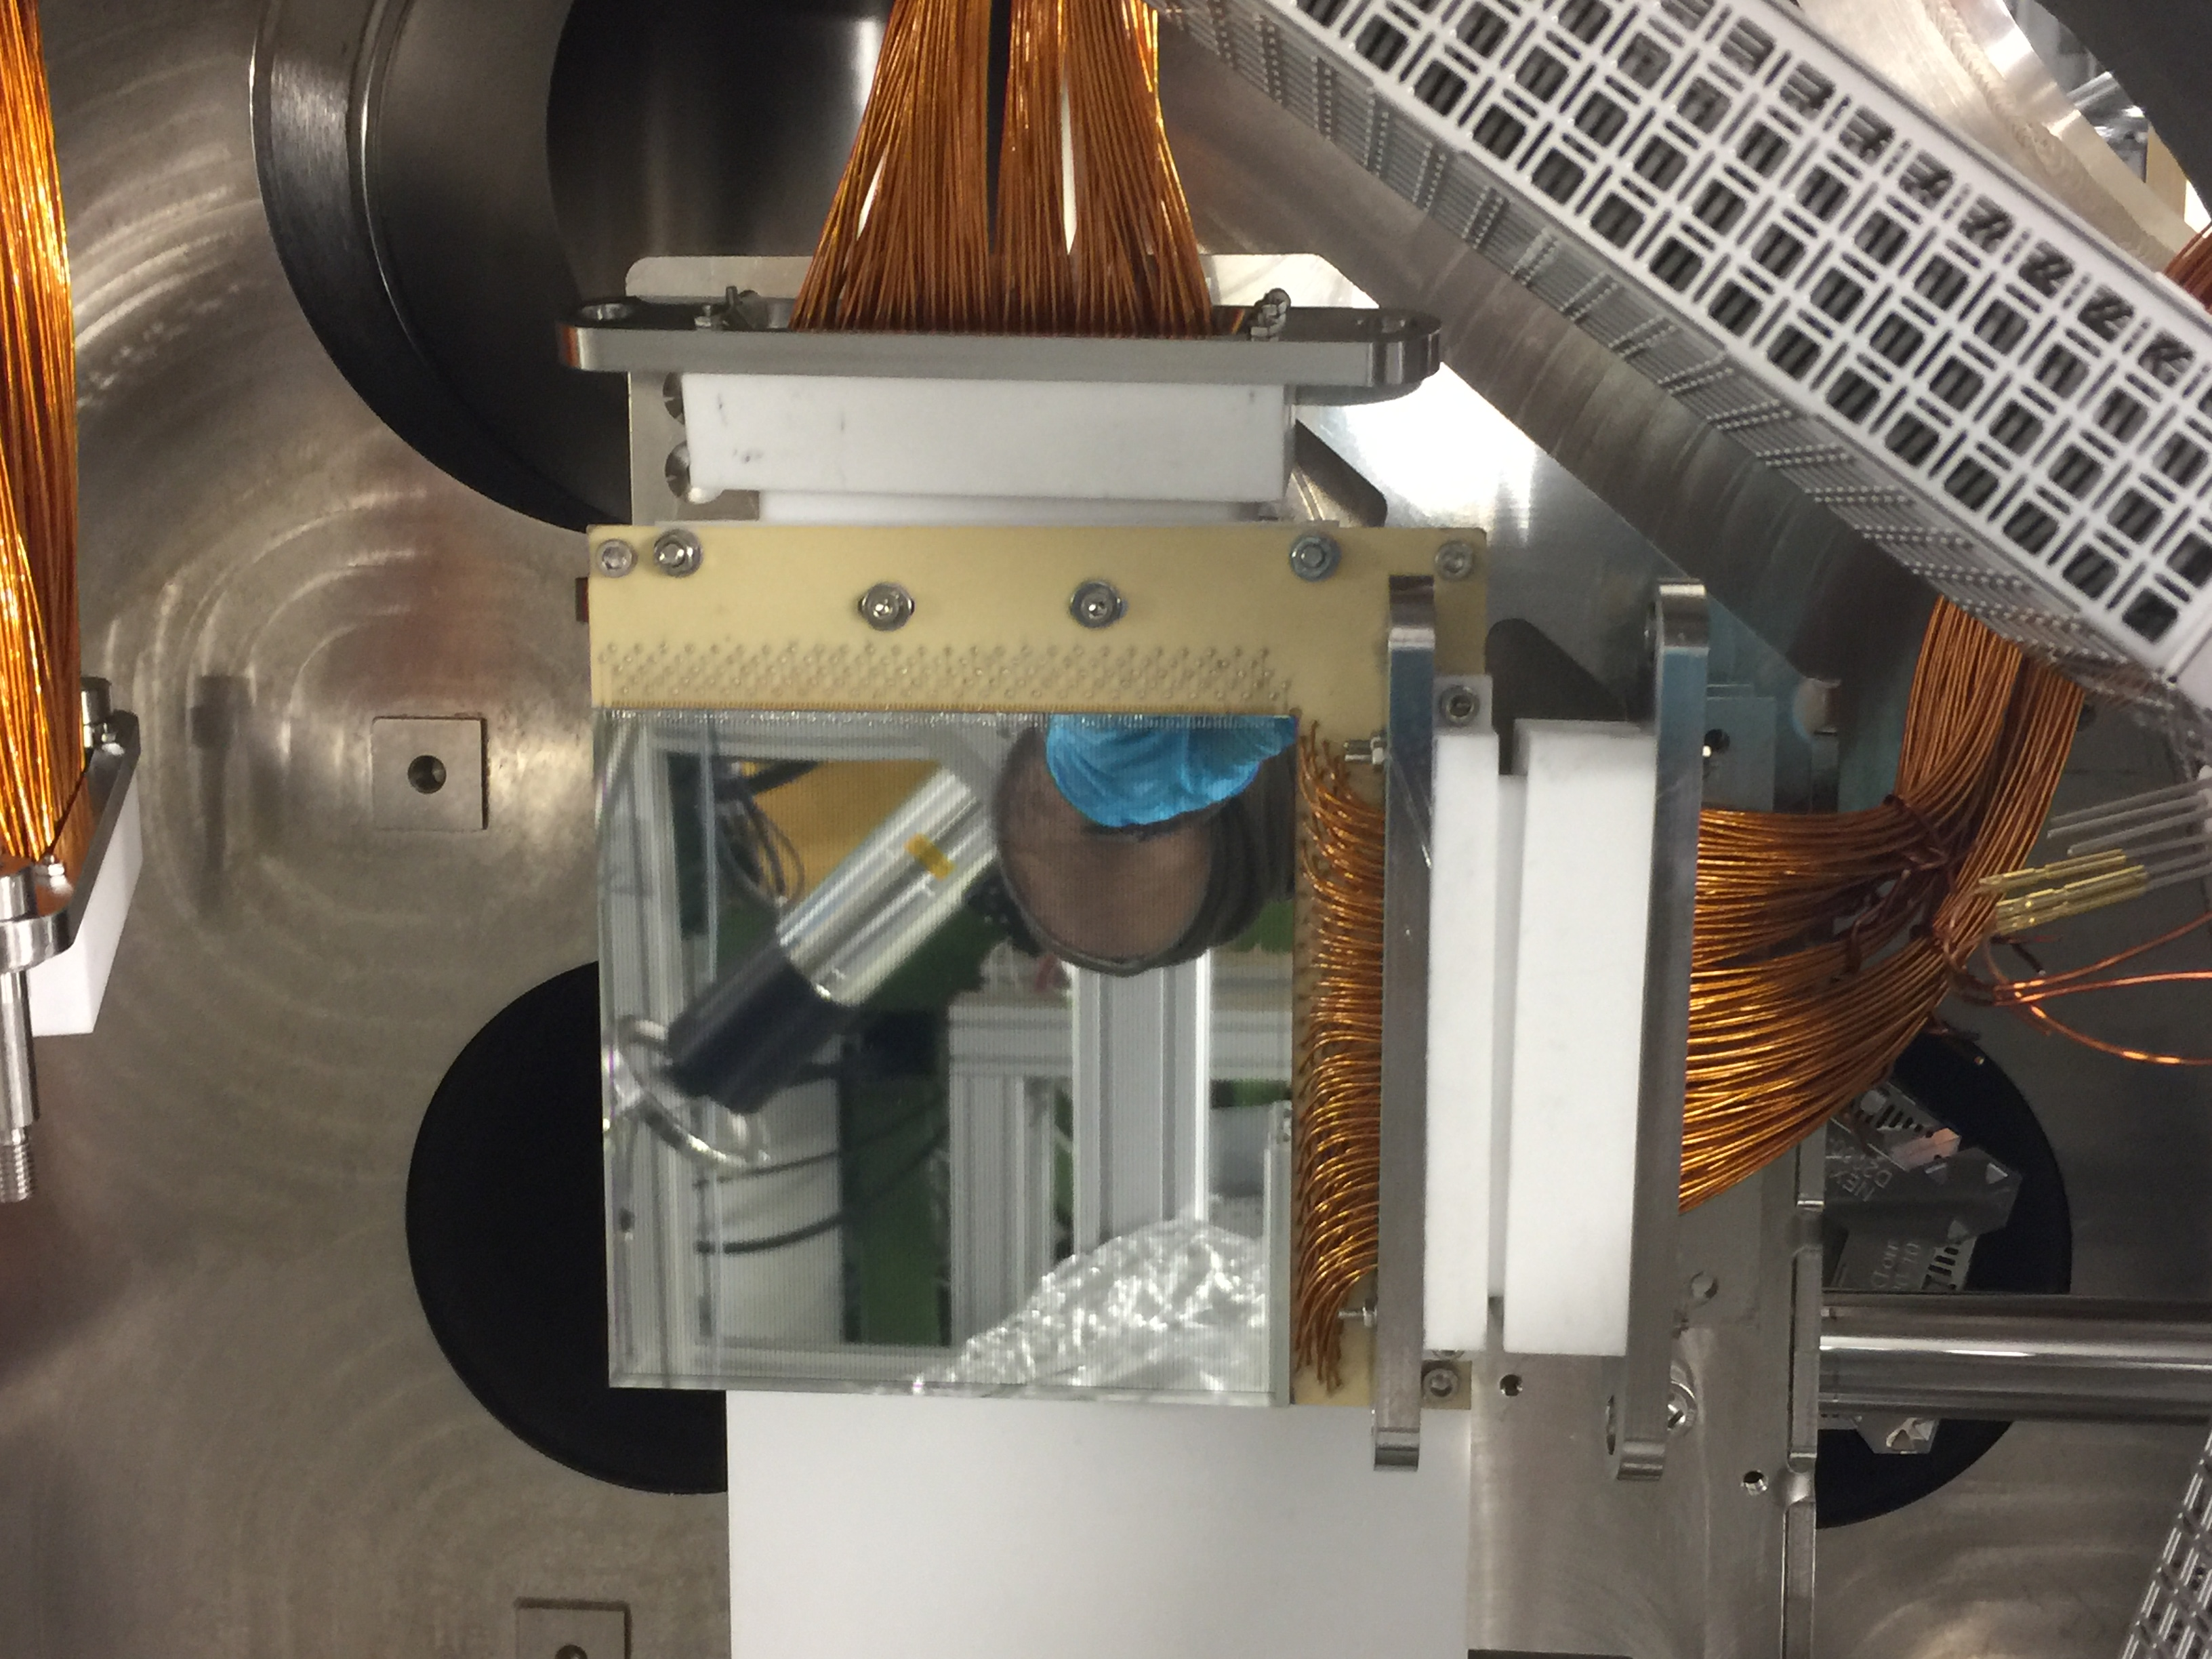
Install blank base plate to trial install in downstream CARME chamber. The rod is just through all of the mounting holes - see attachments 2 & 3

The rod, plate and block are close fitting.

The current position of the TC feedthrough is incompatible wit detector movement- the TC feedthrough should be moved.

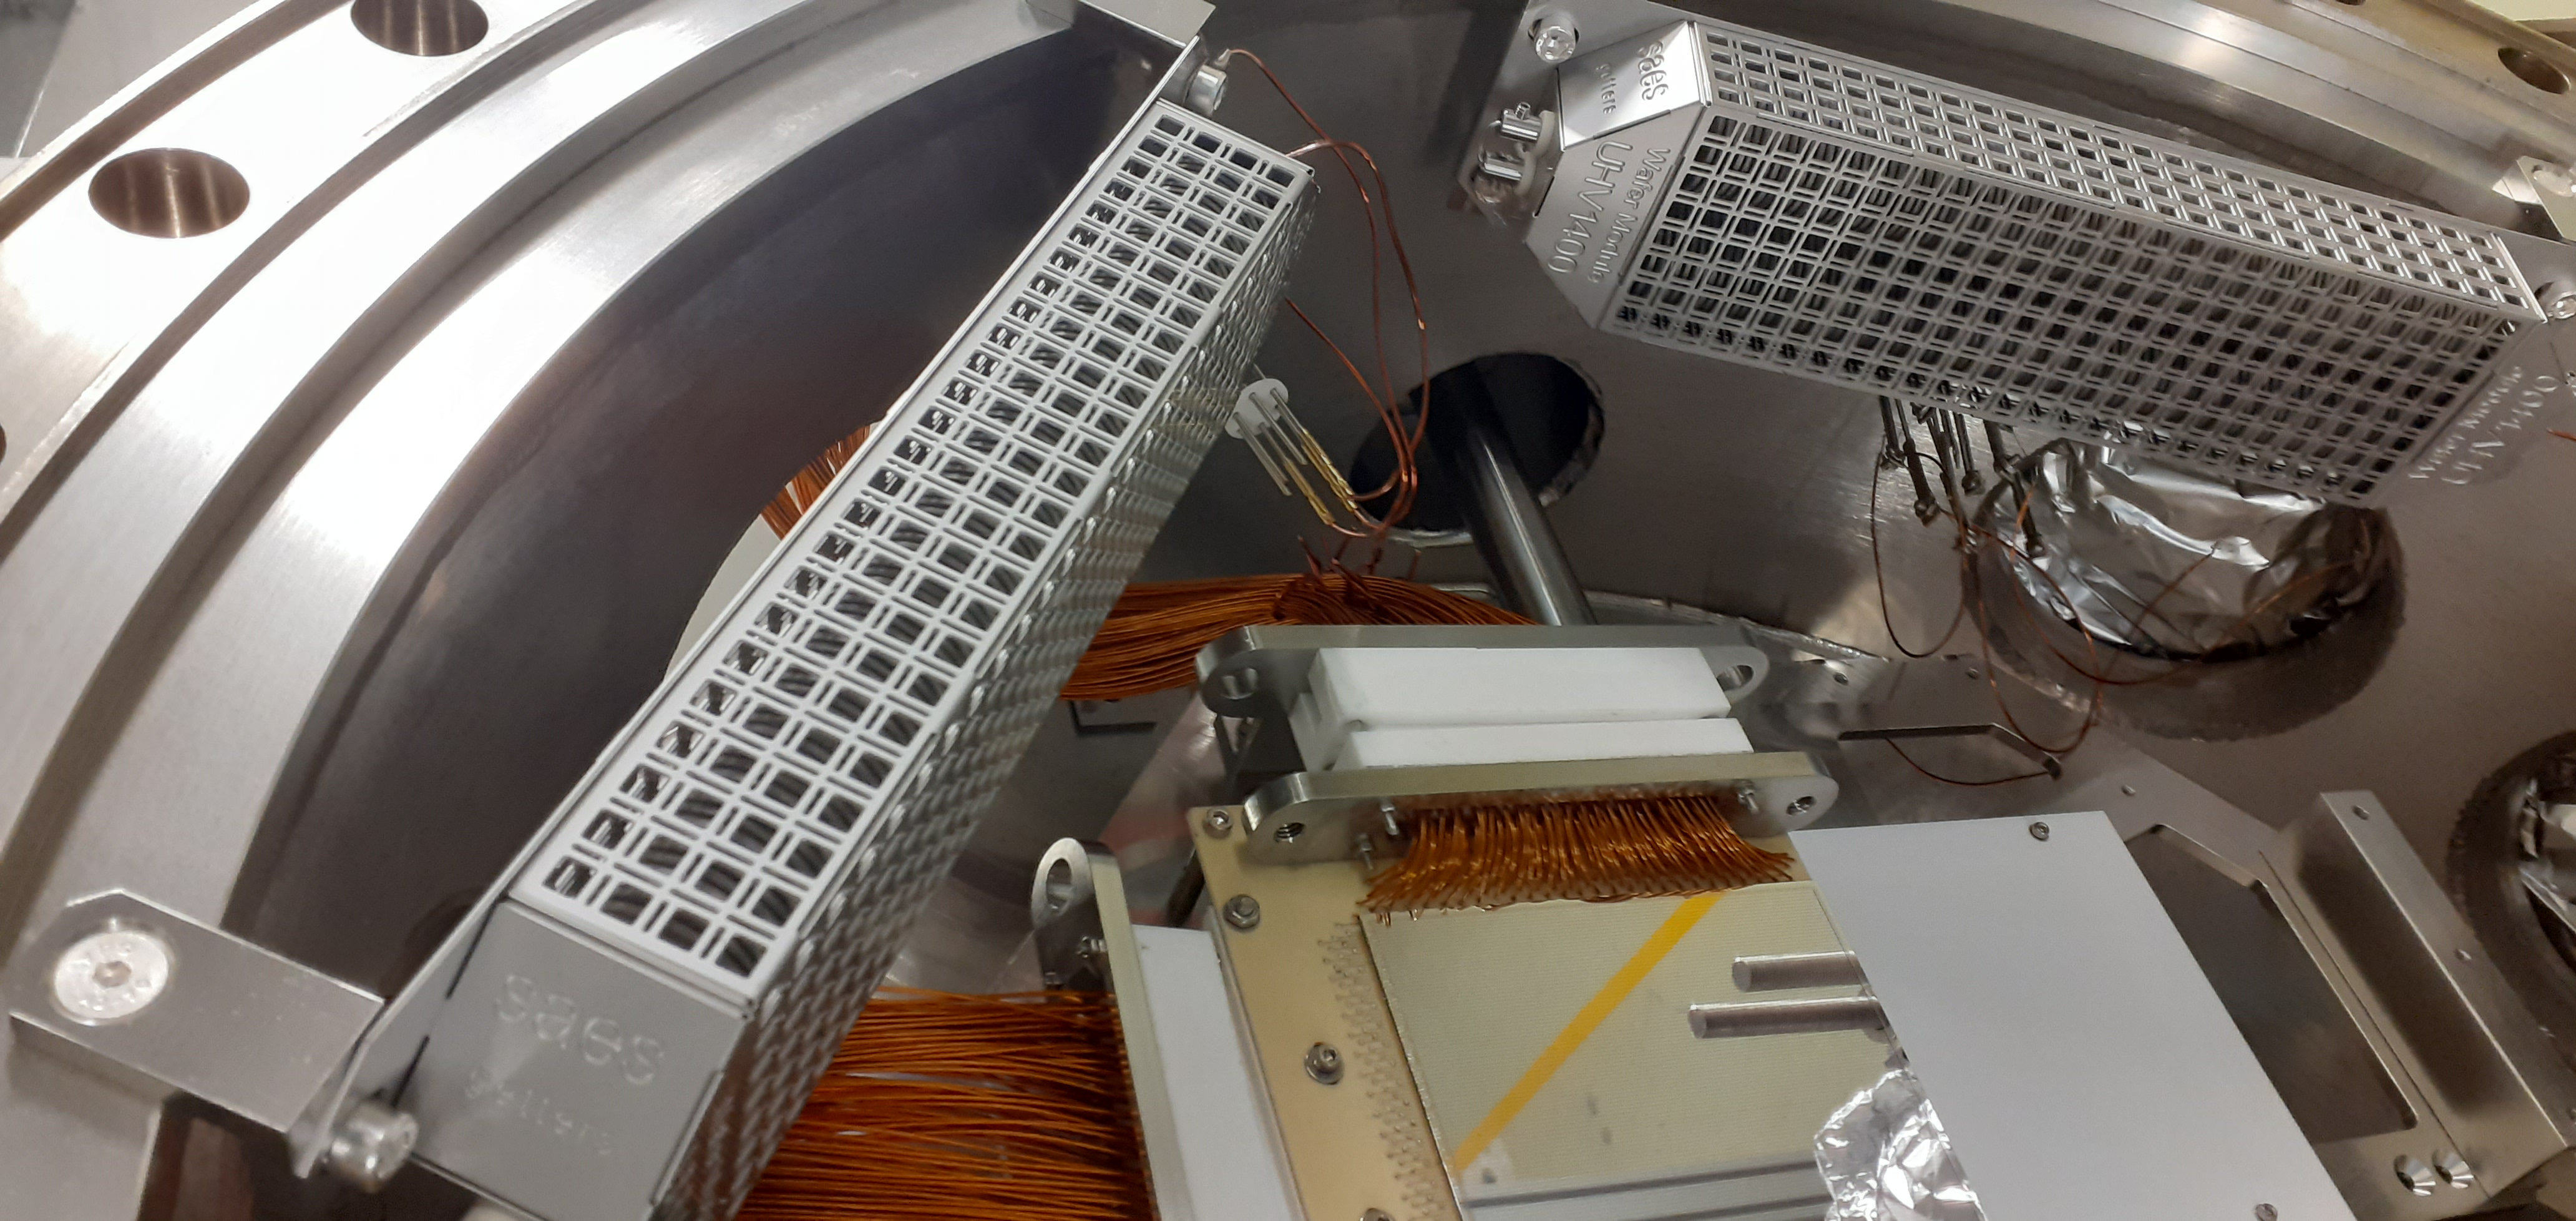
Detector baseplate with 1x DSSSD installed - attachments 4 - 6, Cabling length looks OK.

Should move NEG power and TCs to top & bottom DN40 flanges to avoid conflicts with DSSSDs and cabling. |
| Attachment 1: 20211017_124717.jpg
|

|
| Attachment 2: 20211017_130436.jpg
|
|
| Attachment 3: 20211017_130447.jpg
|

|
| Attachment 4: 20211017_133051.jpg
|

|
| Attachment 5: 20211017_133105.jpg
|

|
| Attachment 6: 20211017_133229.jpg
|
|
| Attachment 7: IMG_5146.JPG
|
|
| Attachment 8: IMG_5145.JPG
|
|
| Attachment 9: IMG_5144.JPG
|
|
| Attachment 10: IMG_5143.JPG
|
|
| Attachment 11: IMG_5142.JPG
|

|
| Attachment 12: IMG_5141.JPG
|
|
| Attachment 13: IMG_5139.JPG
|
|
| Attachment 14: IMG_5140.JPG
|
|
|
125
|
Sat Oct 16 17:25:47 2021 |
RSS TD | Broken detectors |
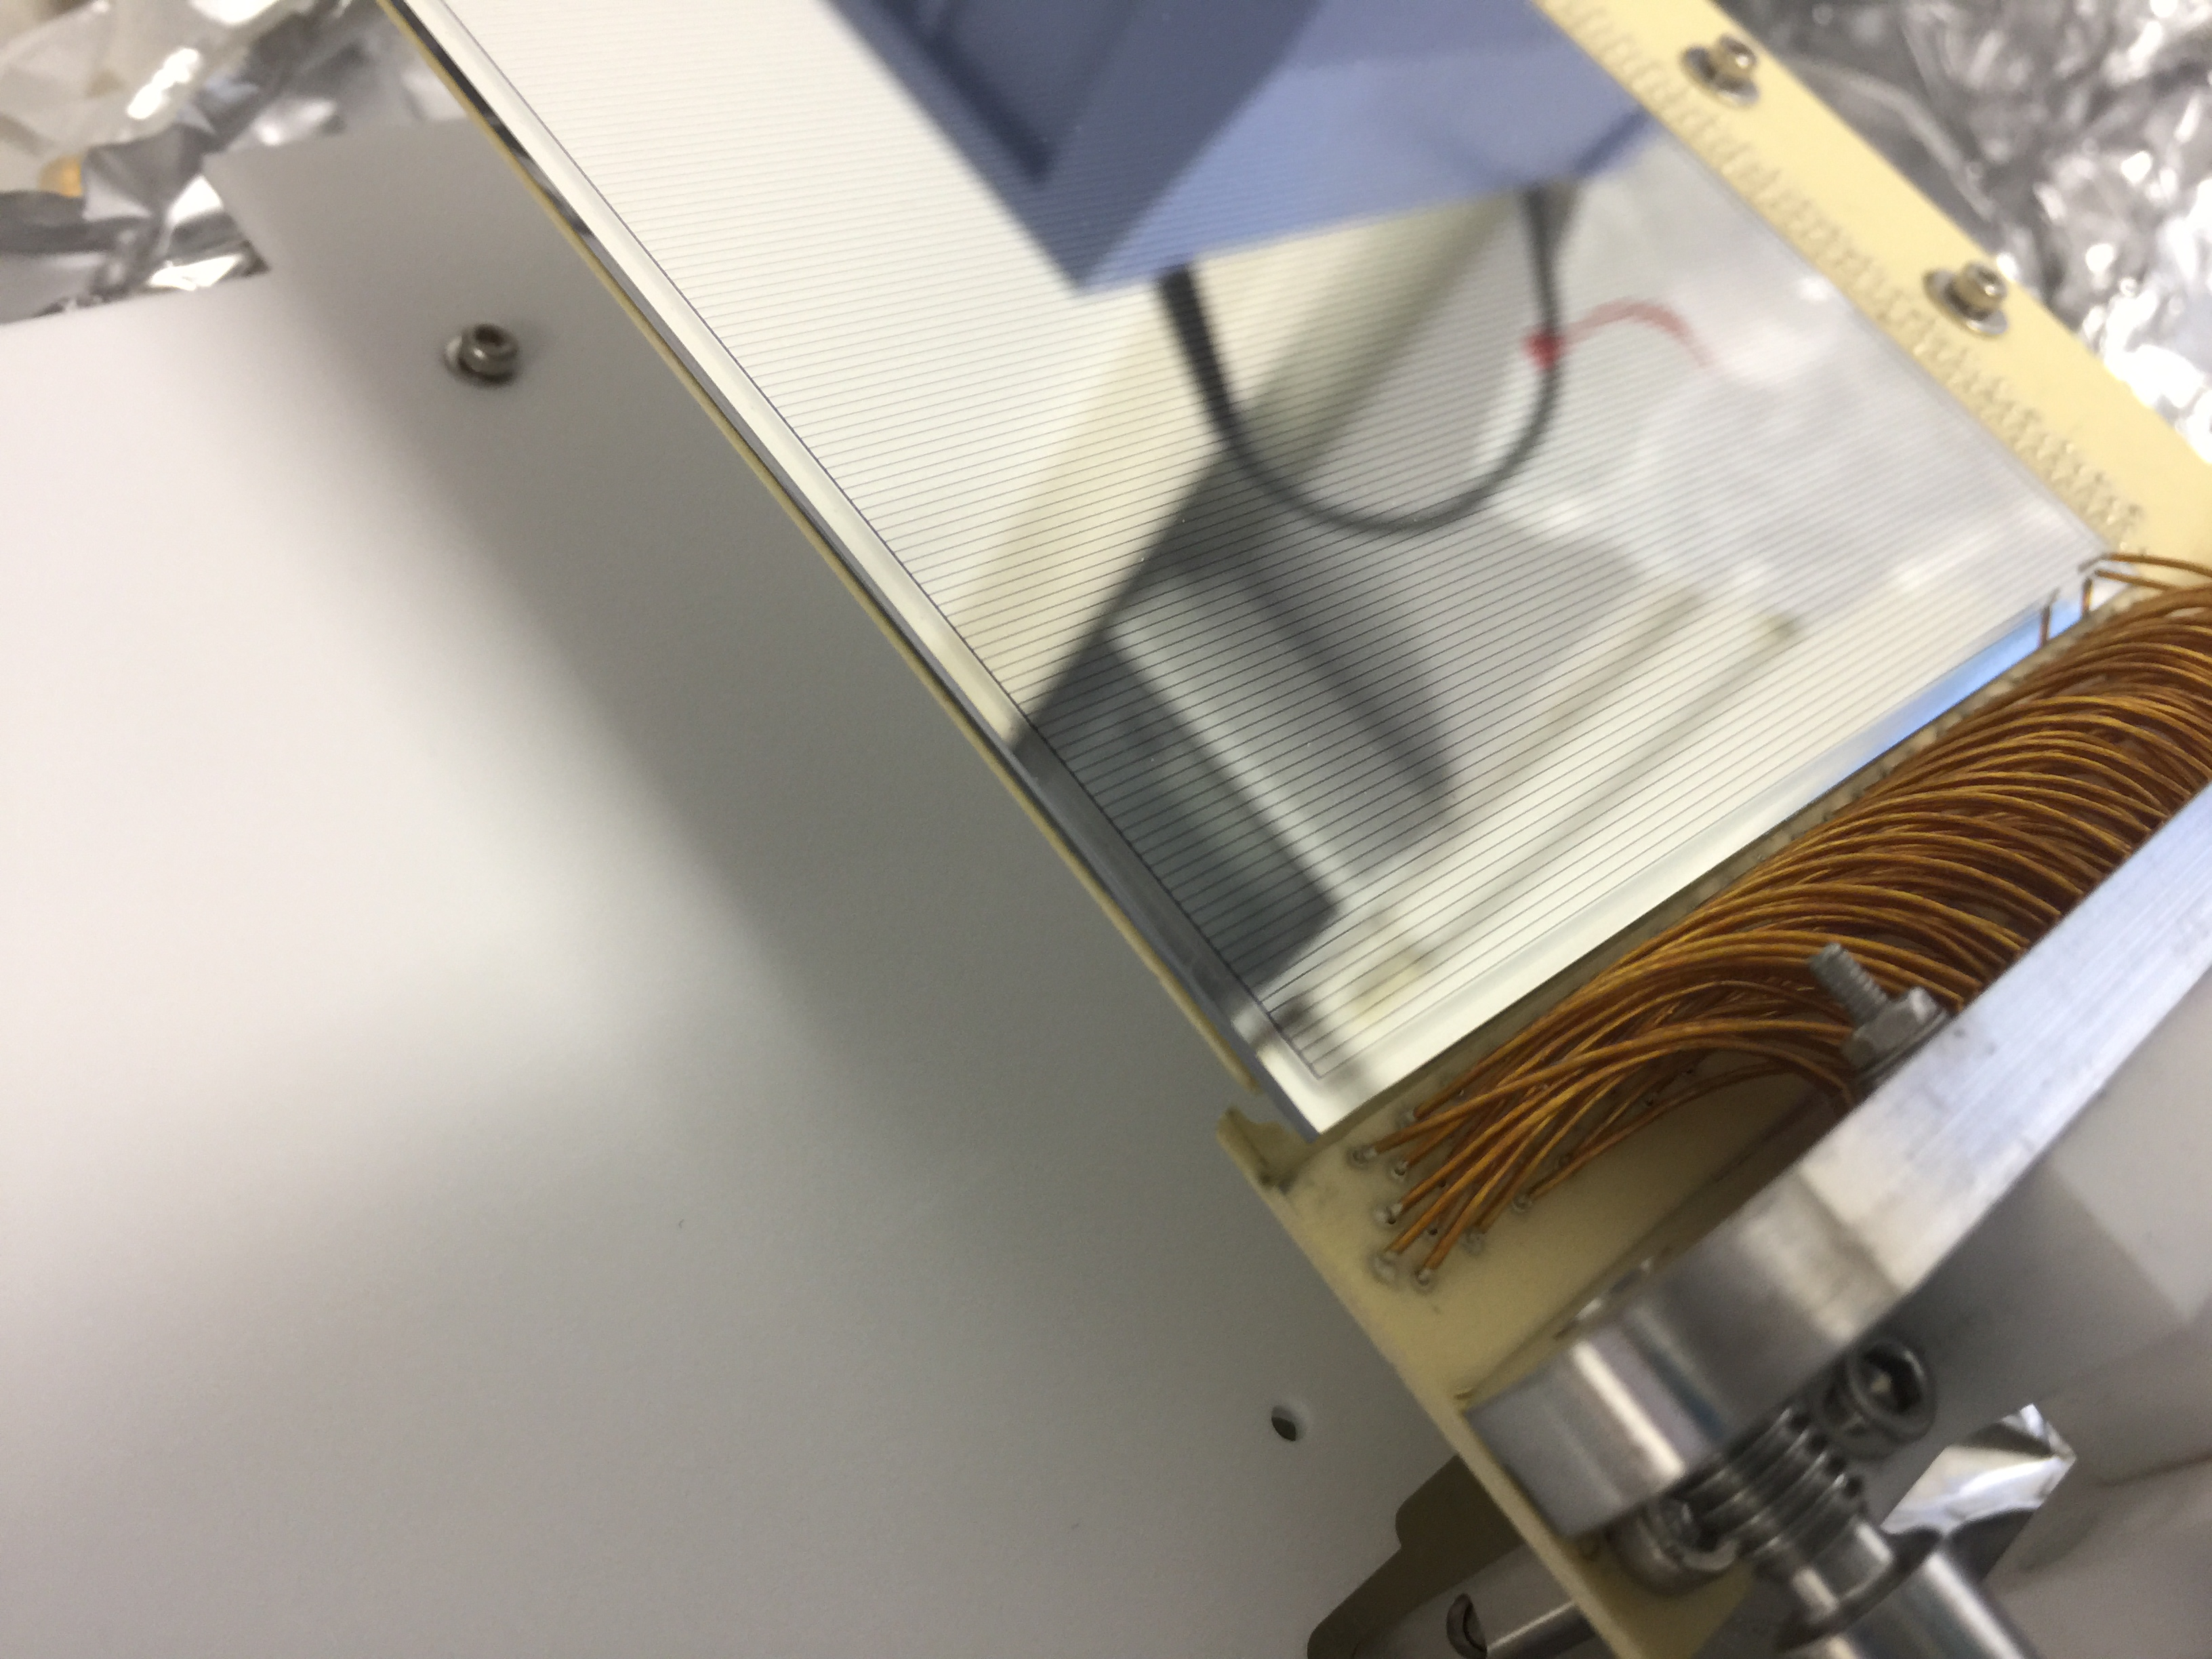
One of the detectors was damaged while mounting (see pictures 1-3).
Second detector was found already damaged when opened (see pictures 4-5). |
| Attachment 1: IMG_5098.JPG
|

|
| Attachment 2: IMG_5097.JPG
|
|
| Attachment 3: IMG_5096.JPG
|
|
| Attachment 4: IMG_5106.JPG
|

|
| Attachment 5: IMG_5105.JPG
|
|
|
124
|
Fri Oct 15 19:37:12 2021 |
RSS TD + DR | Friday 15 October |
Ring seal is out. See picture 1.
Bellow (towards CARME) was installed in the gas jet chamber. Attached are some pictures. |
| Attachment 1: IMG_5059.JPG
|
|
| Attachment 2: IMG_5060.JPG
|
|
| Attachment 3: IMG_5061.JPG
|
|
| Attachment 4: IMG_5062.JPG
|

|
| Attachment 5: IMG_5064.JPG
|

|
| Attachment 6: IMG_5068.JPG
|
|
| Attachment 7: IMG_5071.JPG
|
|
| Attachment 8: IMG_5073.JPG
|
|
|
123
|
Thu Oct 14 15:54:47 2021 |
TD RSS | Thursday 14 October |
Attachment 1 - what is function of the 4x c/s holes indicated?


DSSSD install sequence

1 add 136 - 2x78 way cable harnesses to DSSSD mount via strain relief

2 add DSSSD to mount

3 connect 136 D connector

4 install in CARME chamber

5 connect 2x78 D connectors and strain relief to 2x78 way D connector
feedthroughs

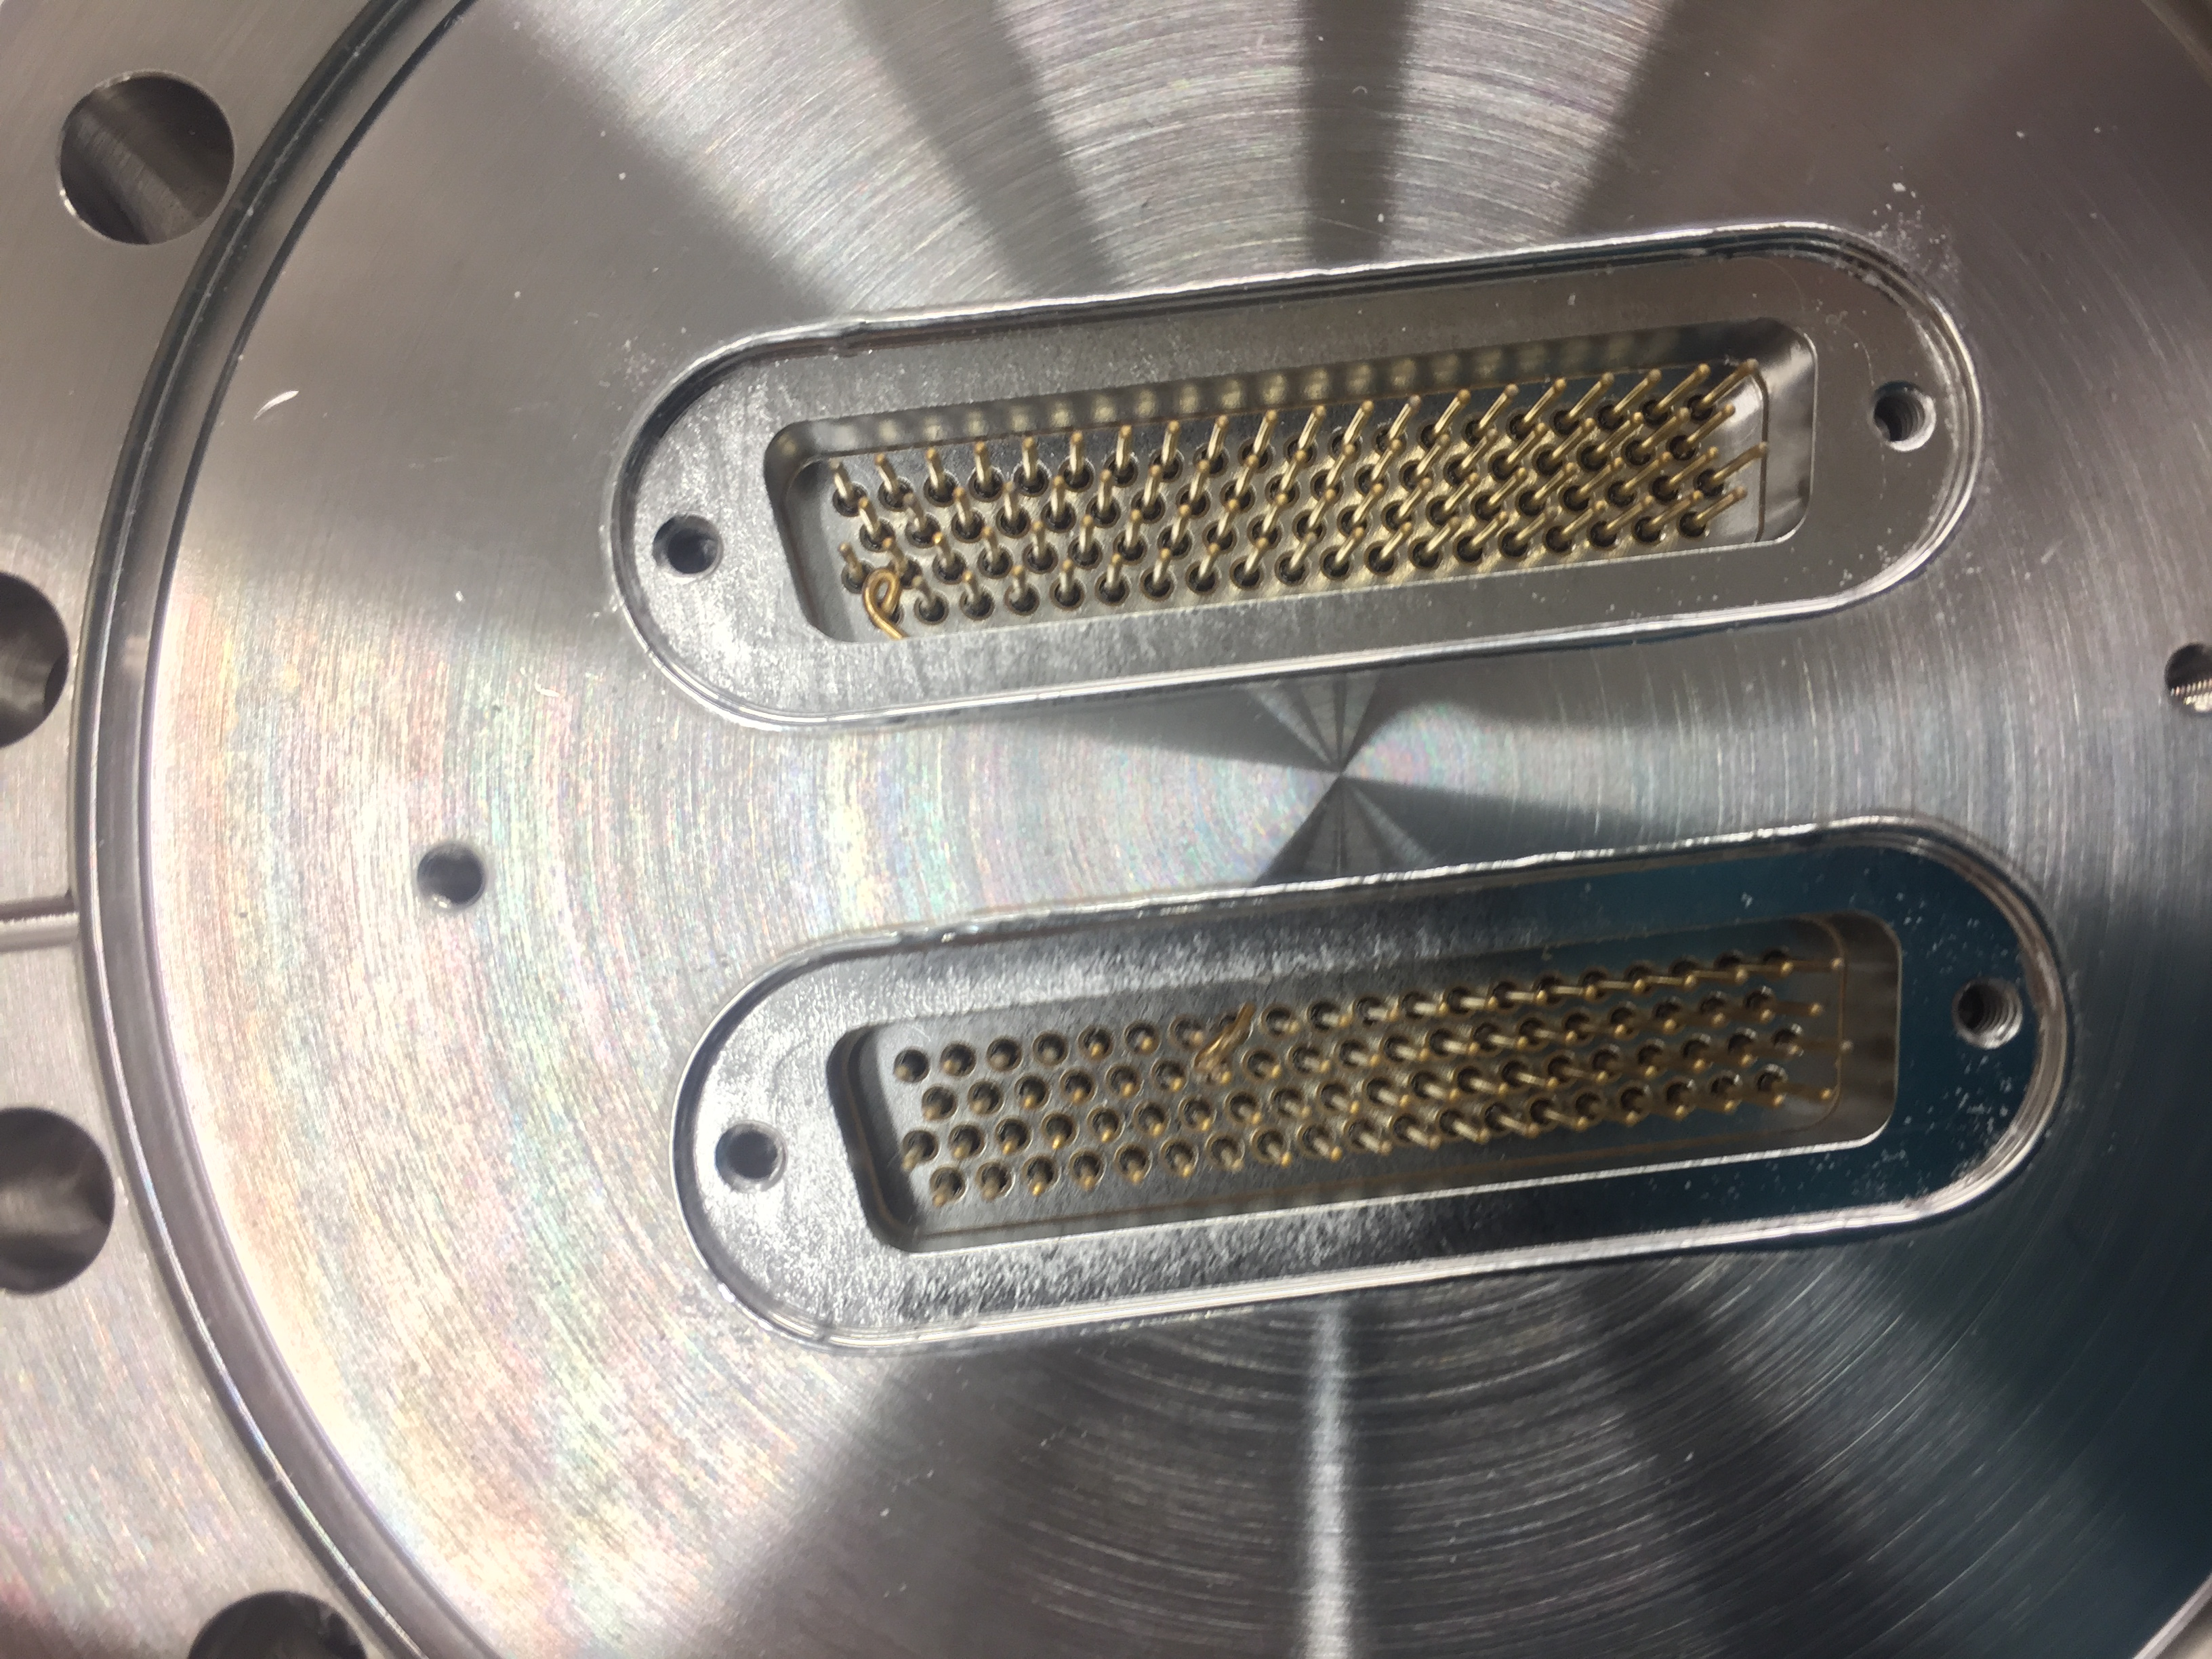
Attachment 2- pins of one of the four feedthroughs were damaged. Needs to be replaced. |
| Attachment 1: IMG_5056.JPG.jpg
|

|
| Attachment 2: IMG_5053.JPG
|
|
|
122
|
Wed Oct 13 15:28:22 2021 |
RSS TD + OG | Split funnels |
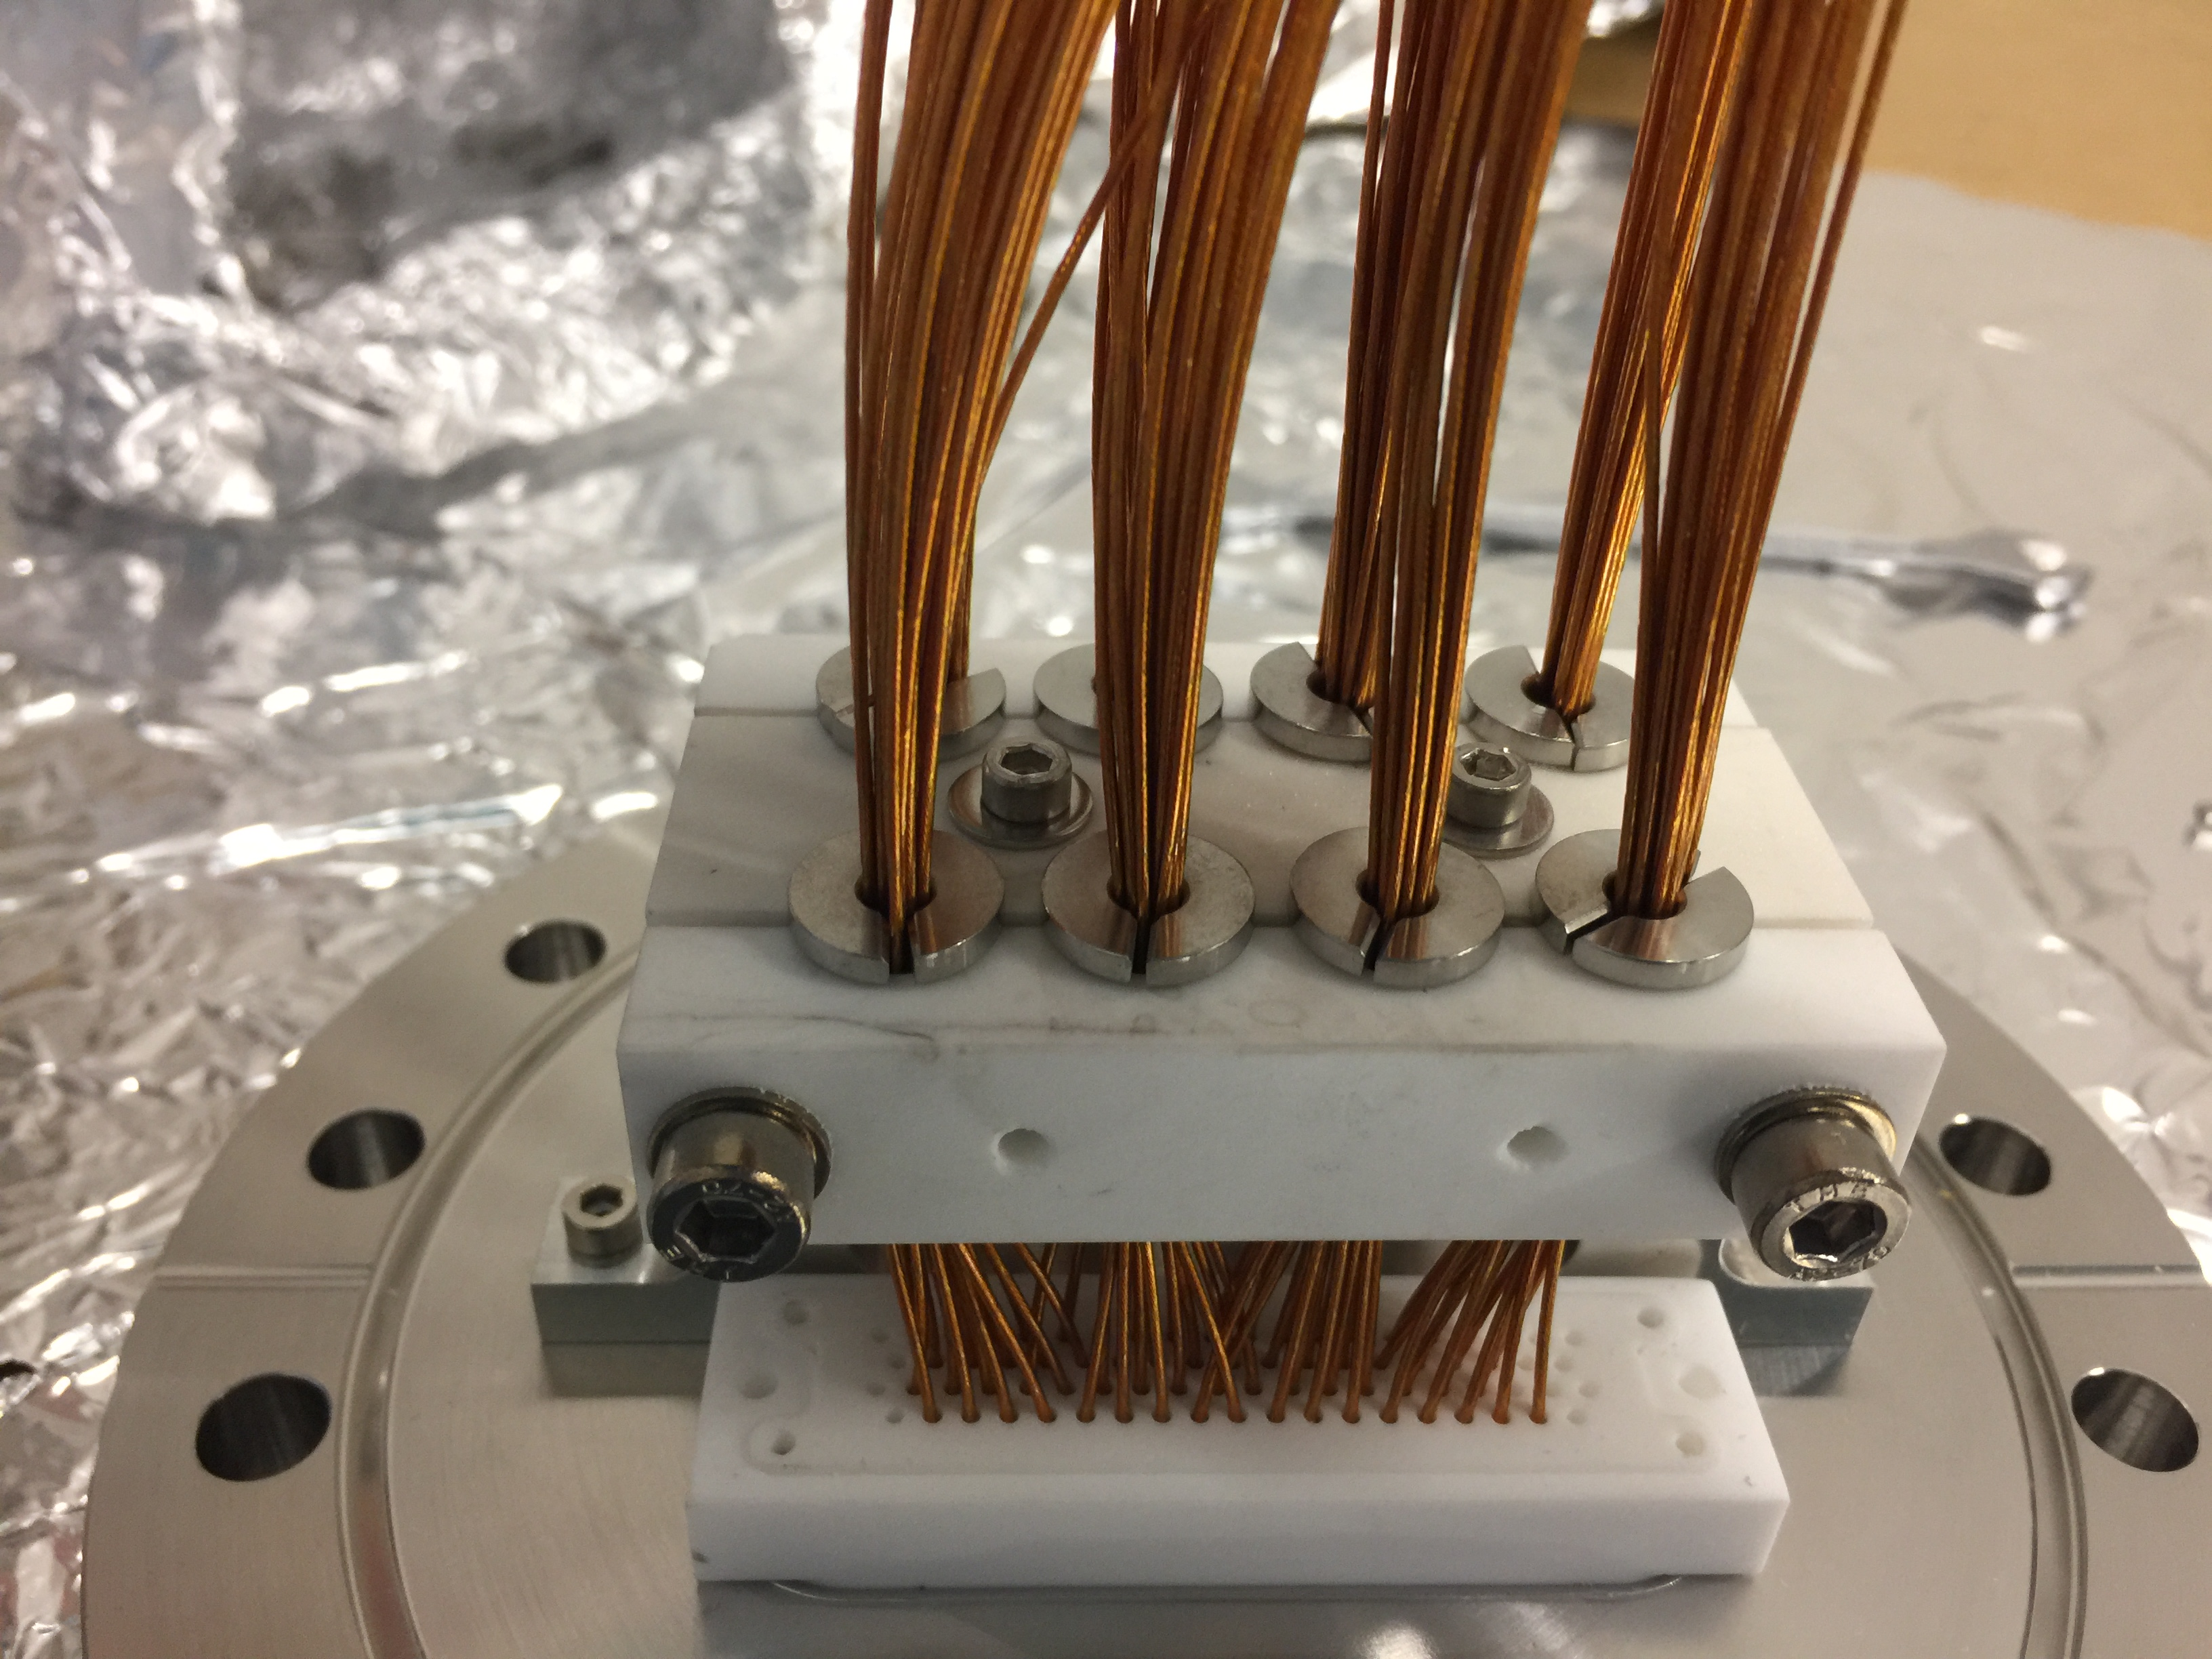
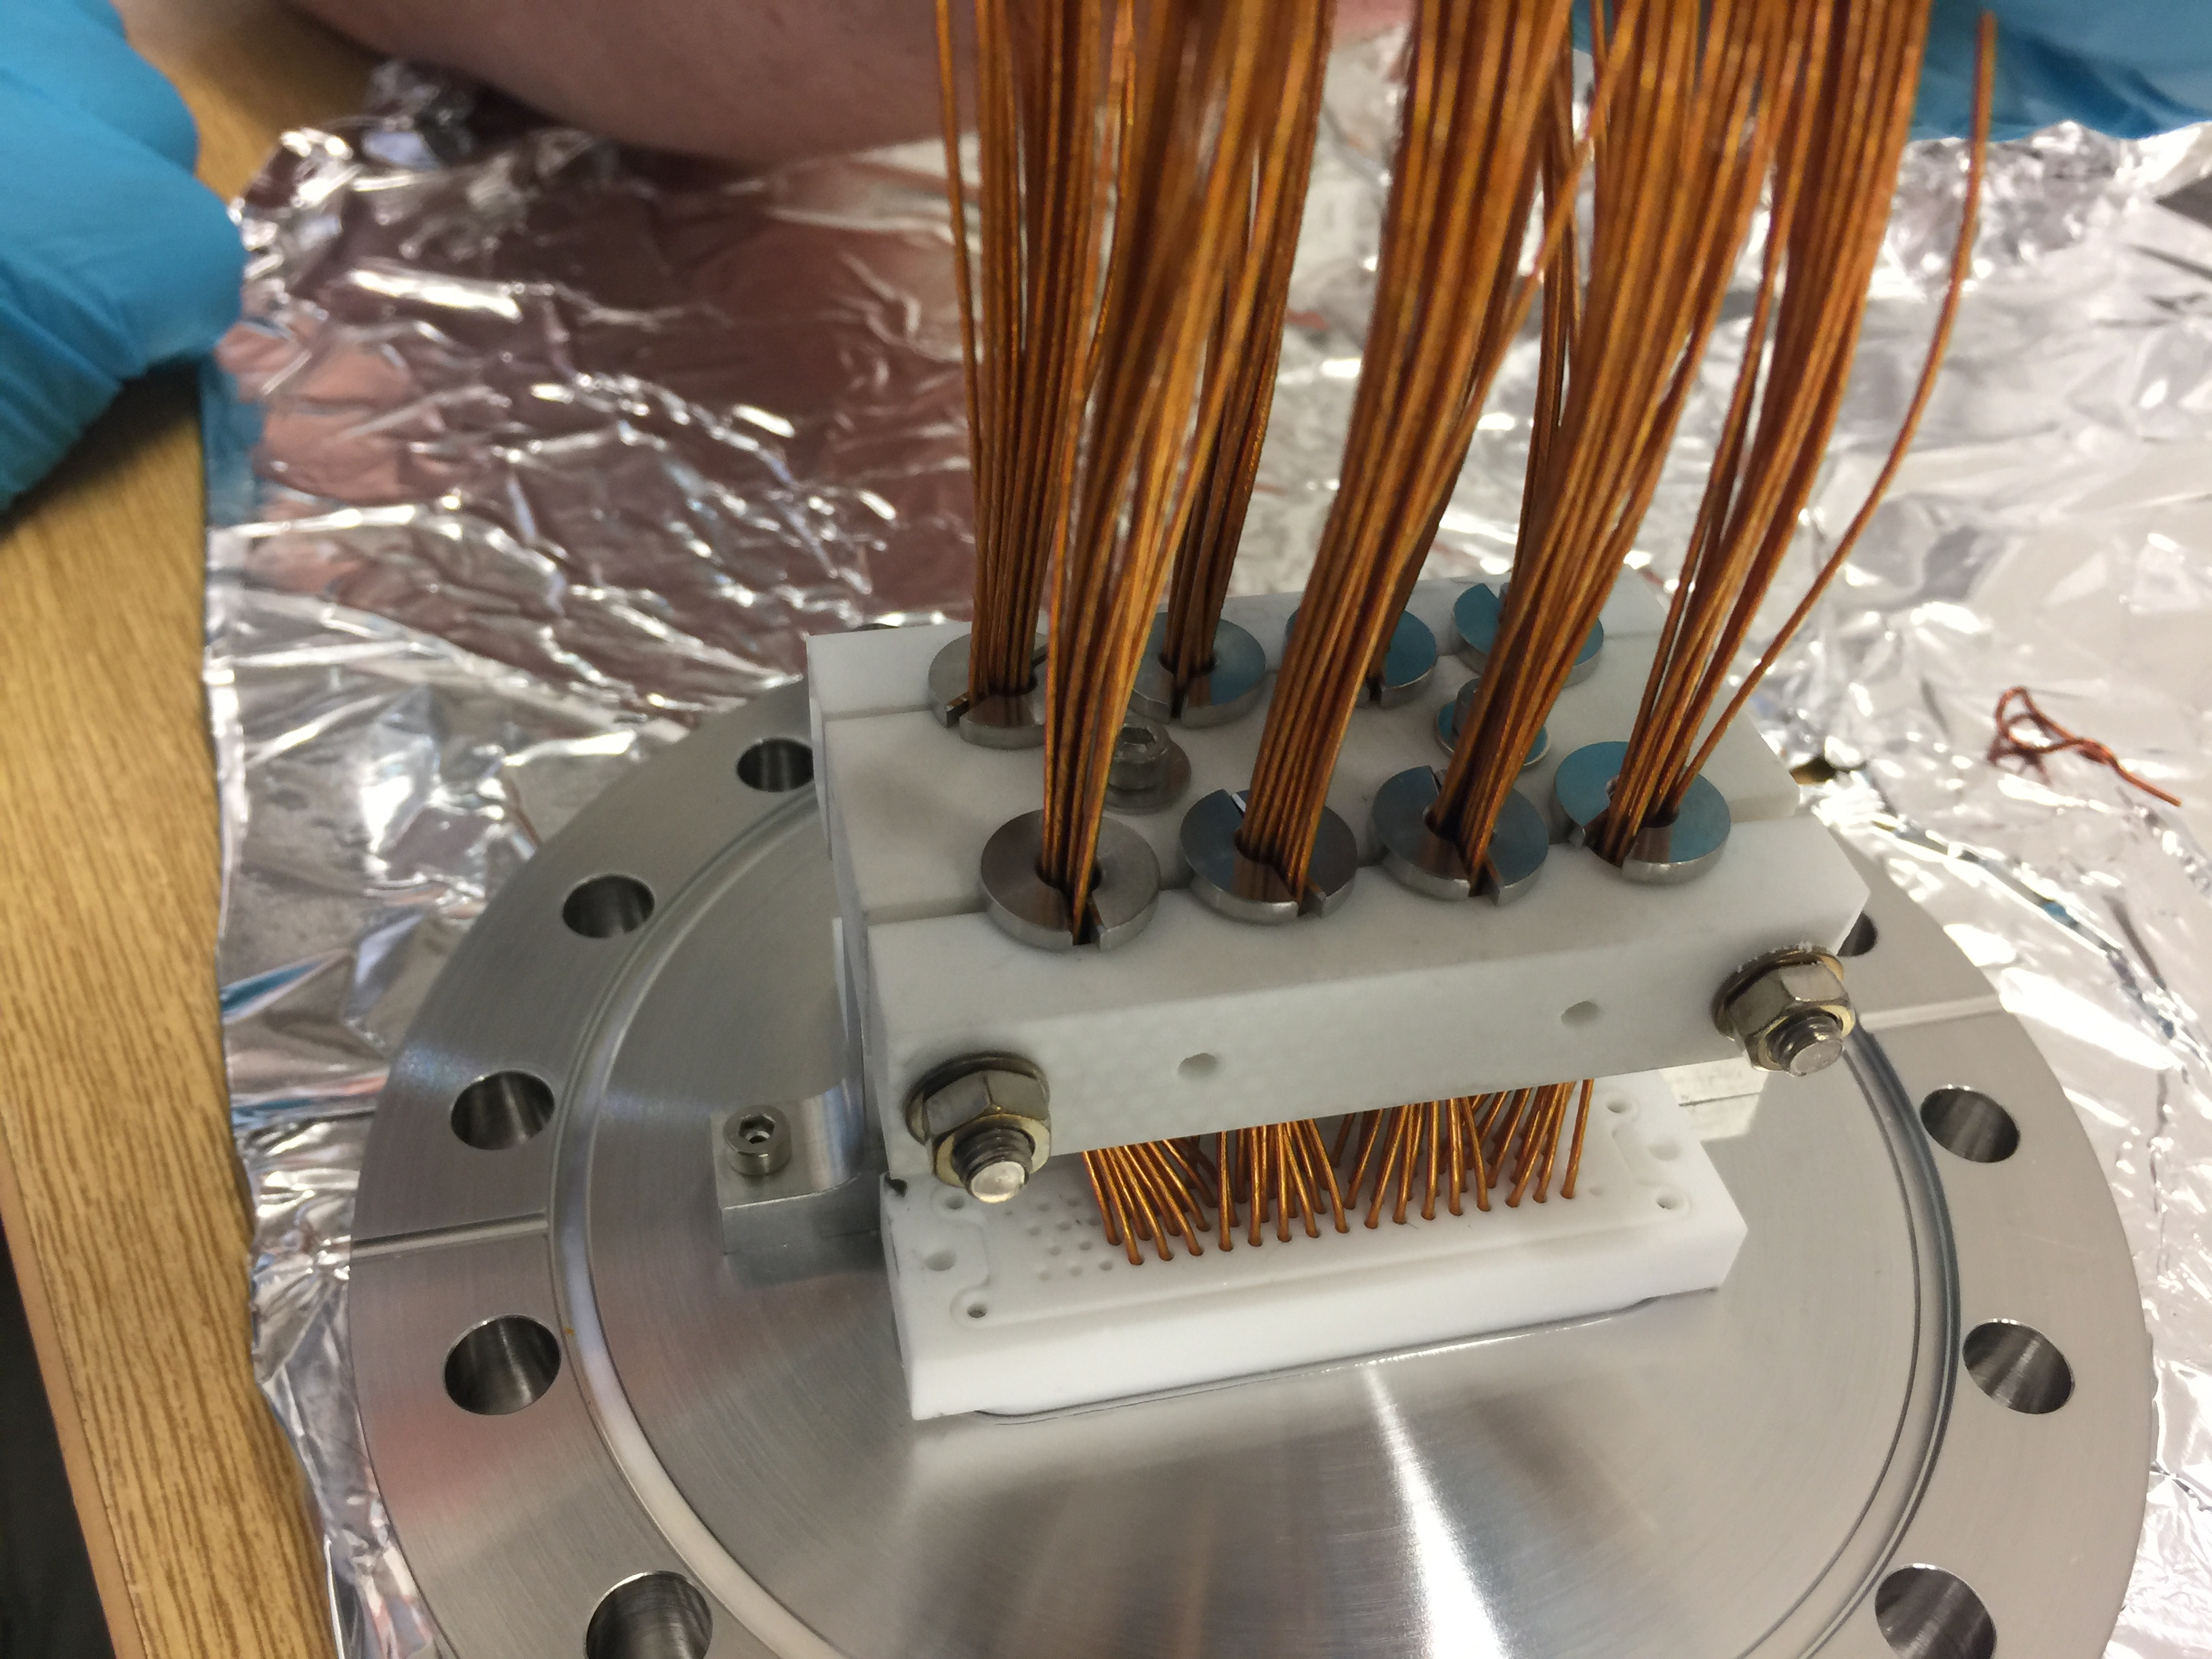
Split funnels installed on 4 (of 8) 2x78 way D connector feed-throughs. |
| Attachment 1: IMG_5038.JPG
|

|
| Attachment 2: IMG_5039.JPG
|

|
| Attachment 3: IMG_5040.JPG
|
|
| Attachment 4: IMG_5041.JPG
|

|
| Attachment 5: IMG_5042.JPG
|
|
| Attachment 6: IMG_5043.JPG
|
|
| Attachment 7: IMG_5044.JPG
|
|
|
121
|
Wed Oct 13 15:16:12 2021 |
TD | Orientation of 2x 78 way D connector feedthroughs |
Looking downstream

Attachment 1 top right pair
           2 bottom right pair
           3 bottom left pair
           4 top left pair

PB "The long sides of the connectors on the 2 lowest flanges should be next to each other
and the short side of the connectors should be towards the motors."

The orientations of the other flanges do not matter.

'Long' cables to L-R connectors, 'short' cables to U-D connectors. |
| Attachment 1: 20211013_152518.jpg
|

|
| Attachment 2: 20211013_152529.jpg
|

|
| Attachment 3: 20211013_152549.jpg
|

|
| Attachment 4: 20211013_152606.jpg
|

|
|
120
|
Wed Oct 13 12:06:09 2021 |
RSS TD | Flanges cleaned |
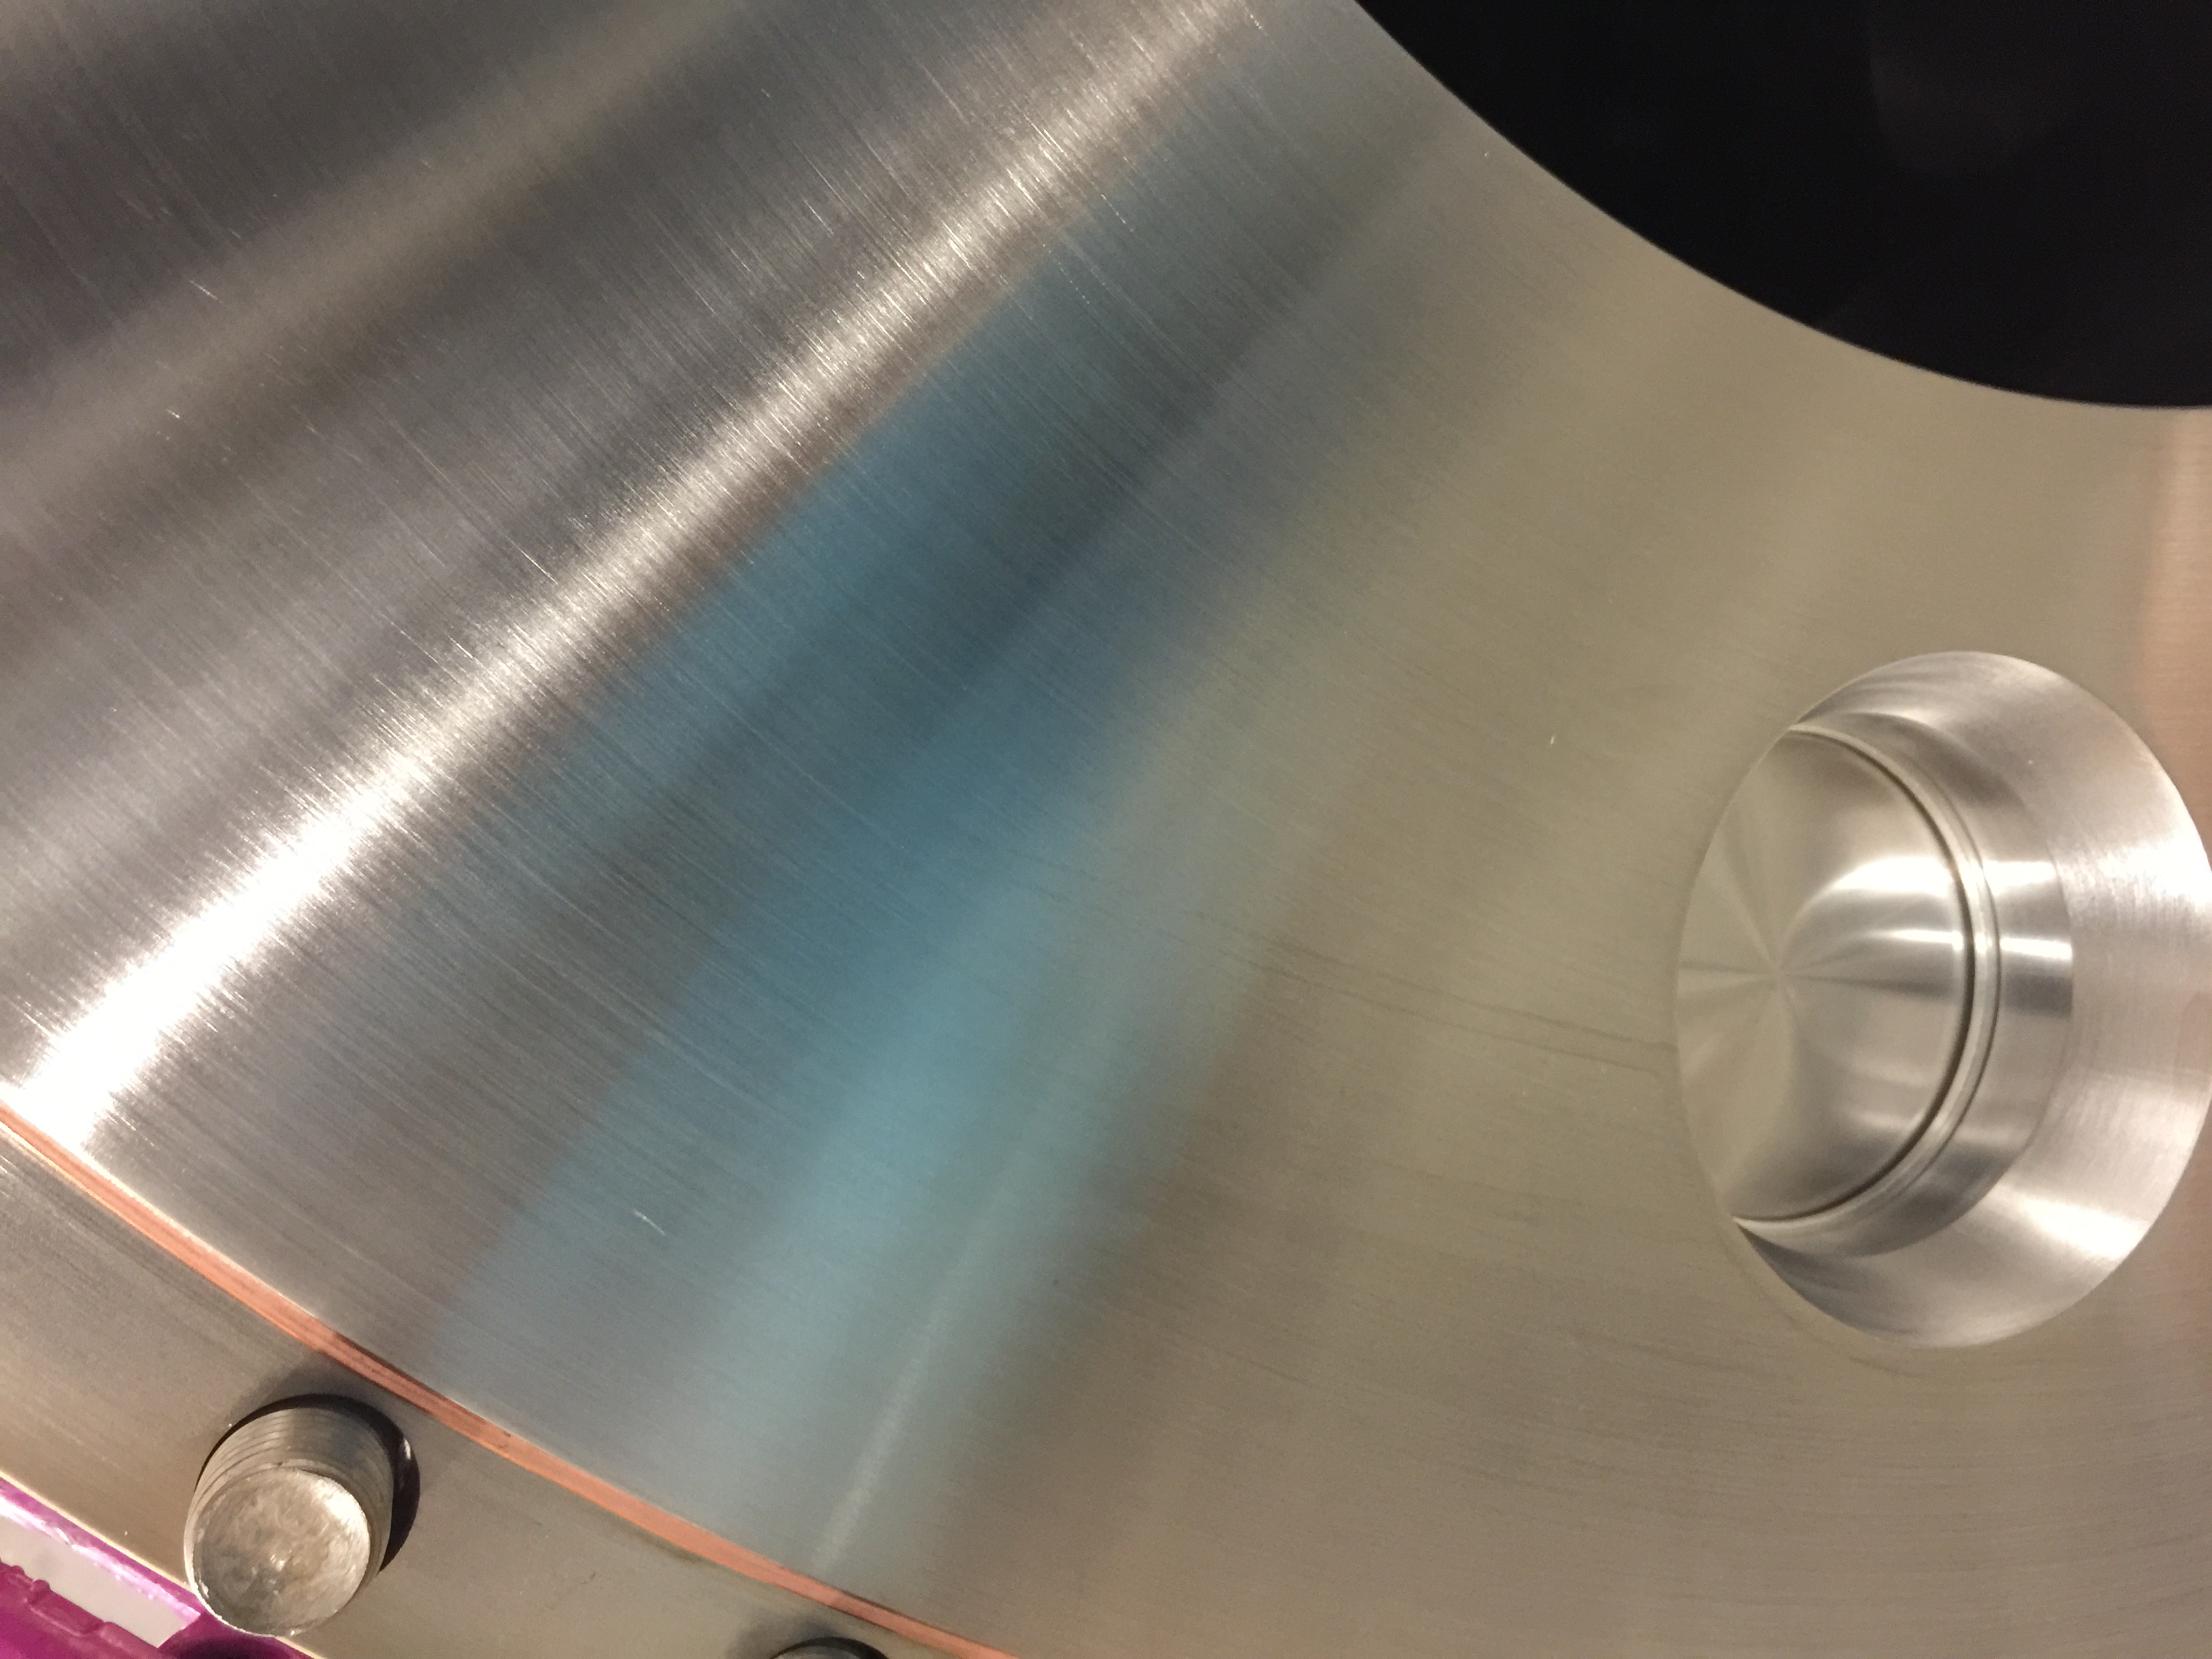
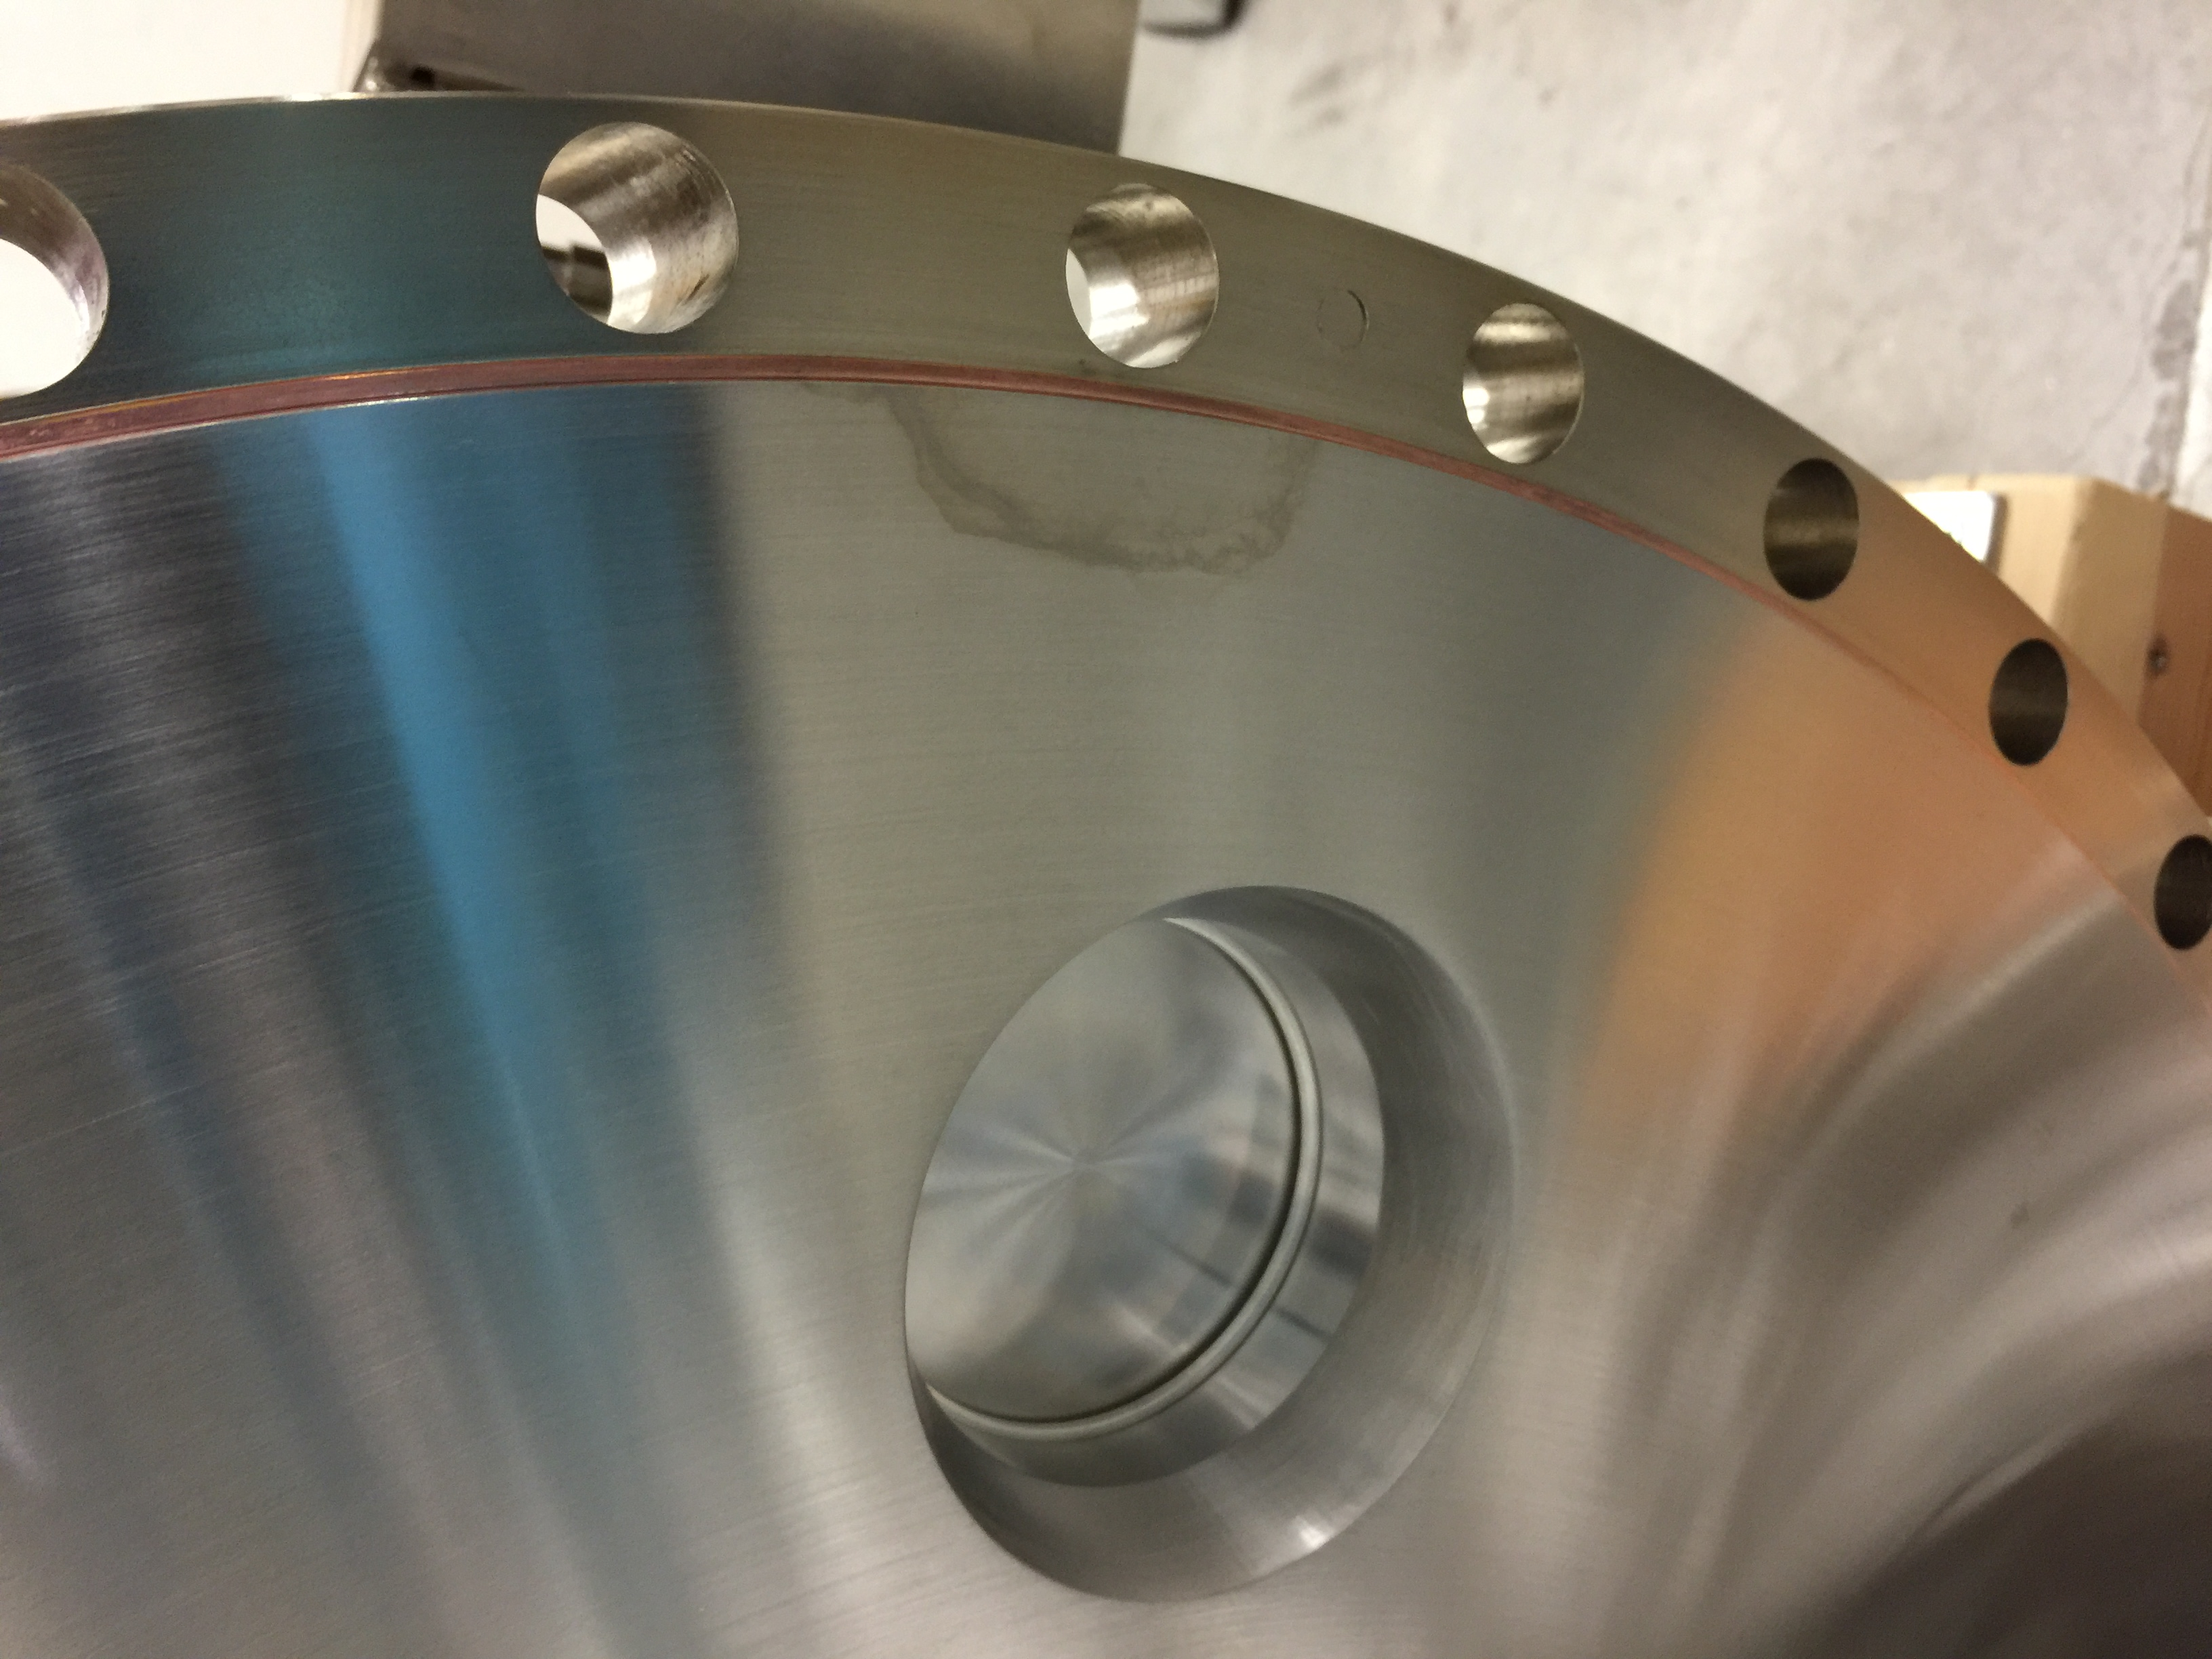
RSS & TD had some success cleaning the COF600 flange surfaces of the staining and residues observed when the downstream COF600 section was opened yesterday
https://elog.ph.ed.ac.uk/CARME/118

Isopropanol and laboratory tissues were used - most but not all of the staining and the residues were removed. |
| Attachment 1: IMG_5011.JPG
|
|
| Attachment 2: IMG_5012.JPG
|
|
| Attachment 3: IMG_5013.JPG
|
|
| Attachment 4: IMG_5014.JPG
|

|
| Attachment 5: IMG_5015.JPG
|
|
| Attachment 6: IMG_5016.JPG
|
|
| Attachment 7: IMG_5018.JPG
|

|
| Attachment 8: IMG_5019.JPG
|
|
| Attachment 9: IMG_5020.JPG
|

|
| Attachment 10: IMG_5021.JPG
|

|
| Attachment 11: IMG_5022.JPG
|
|
| Attachment 12: IMG_5023.JPG
|

|
|
119
|
Wed Oct 13 11:59:23 2021 |
TD | [How to] Open COF600 copper wire seals |
Use the M10 jacking points provided top/bottom and
left/right on the upstream and downstream sides of the
flanges - for example see attachments 1 & 2 |
| Attachment 1: 20211013_103806.jpg
|

|
| Attachment 2: 20211013_103800.jpg
|
|