| ID |
Date |
Author |
Subject |
|
414
|
Fri Apr 8 08:59:42 2022 |
OH, NH | Friday 8th April |
09:59 Noticed that the right hand ribbon cable for aida07 was offset vertically by 1. i.e. Only 1 of the 2 rows of pins in. Unbiassed detectors and reconnected.
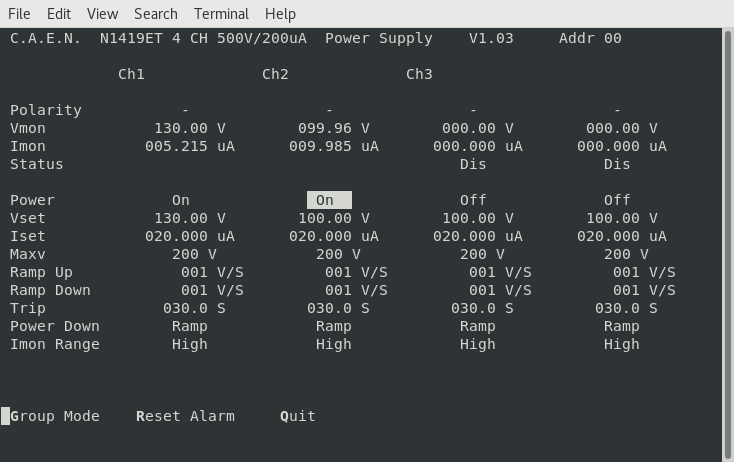
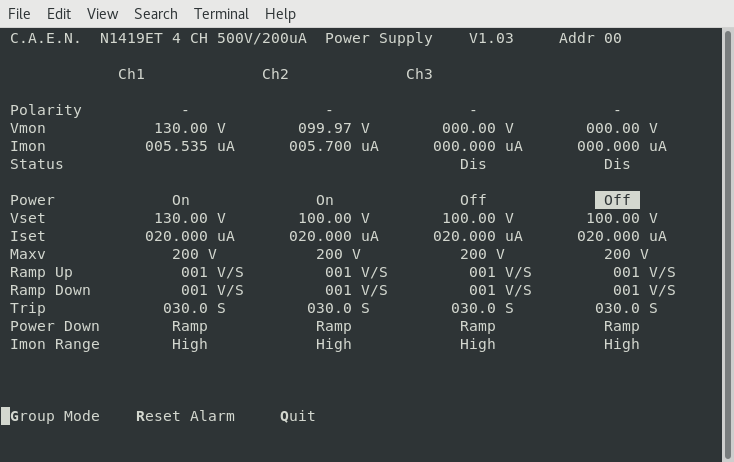
      Rebiassed detectors - leakage current on DSSD2 increased to 9.96uA - Attachment 1

      Power cycling FEEs

      Following restart the FEEs show some improvement in rates - attachment 2
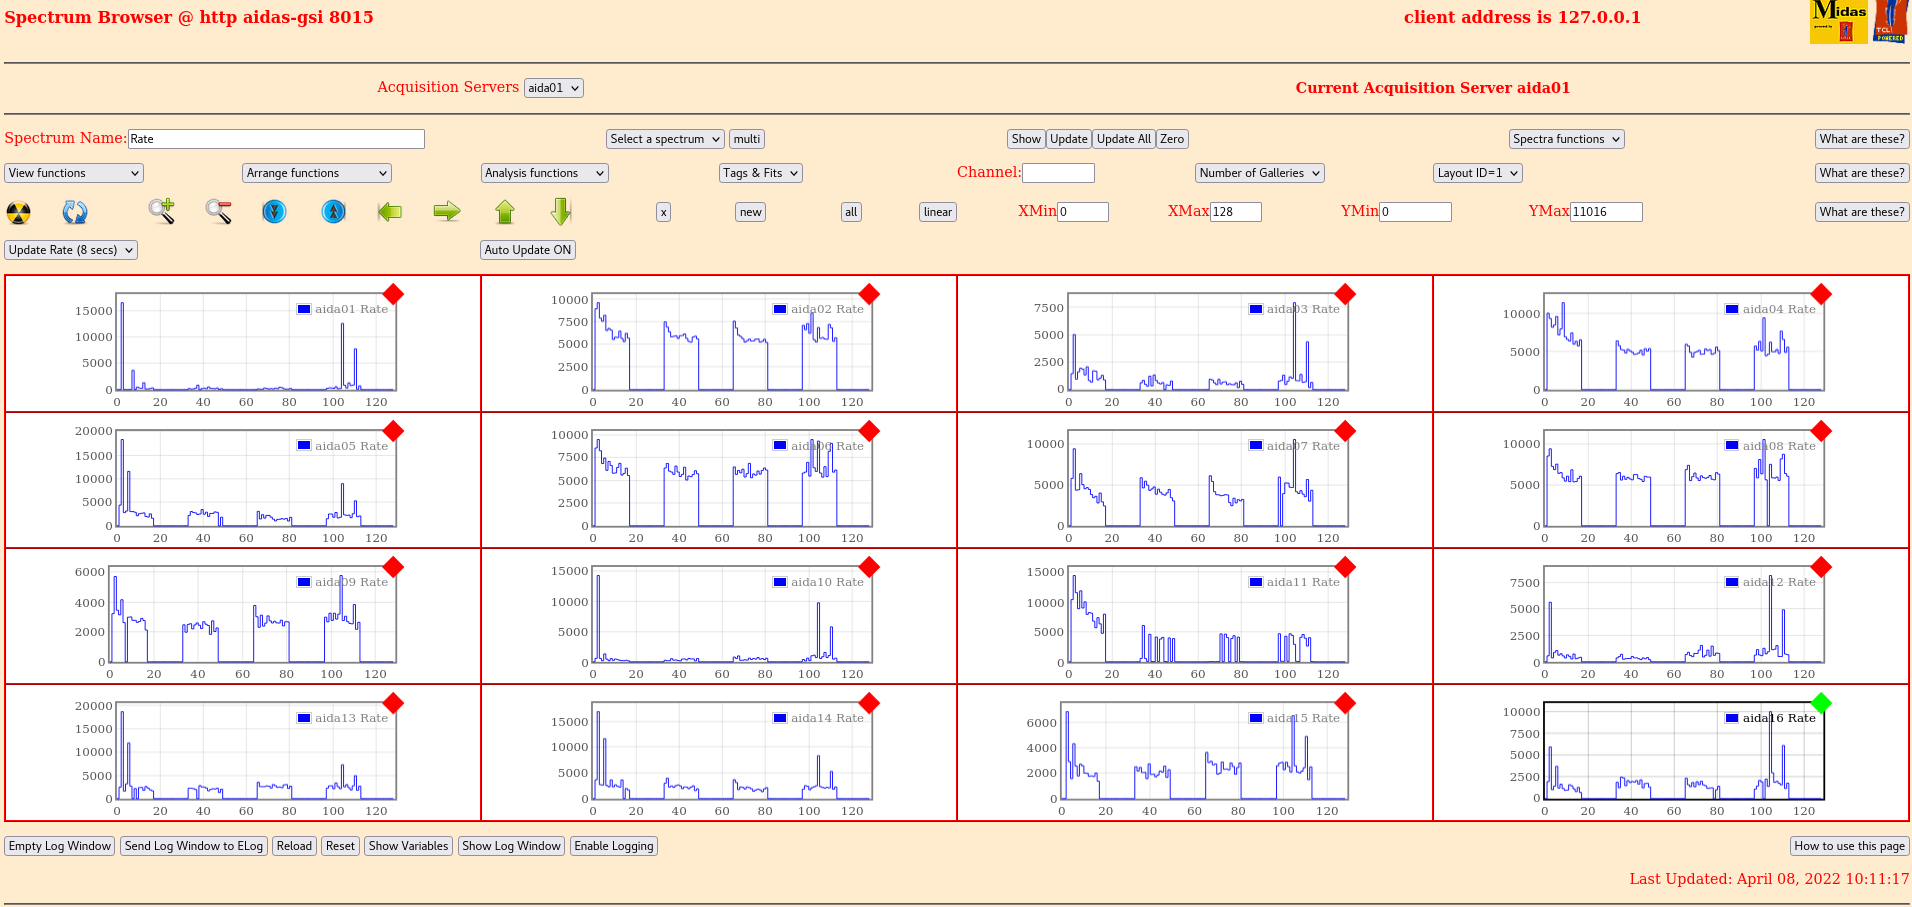
      Rate spectra - attachment 3
      Still issues with aida11 in the rate spectra (Likely a misaligned ERNI connector)


      Pulser on rate spectra - attachment 4
      Pulser off rate spectra - attachment 5
      We can see that with the pulser on there are events in the channels in aida01 and aida11
      With the pulser off these channels disappear.
      ERNI connector is then likely aligned the issue is more likely the DSSD ribbon cable is misaligned.

      Taking bias off to investigate.


10:39 Could not observe anything out of alignement about either the connectors or the adaptor boards
      Note that after pushing on the connector AIDA01 had largely recovered

13:30 Top of snout taken off while mounted in S4. It was observed that one of the ribbon cables for aida11 was off by 1 row.
      This was corrected in situ and the snout was put back together and made light tight again.
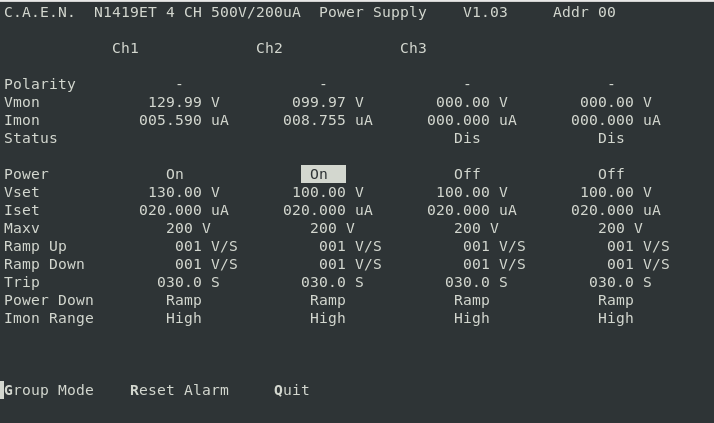
      Oddly leakage current still the same - DSSD2 has come down though - attachment 6
      FEEs powercycled for new tests

      Half the channels in aida11 had appeared again
      Took apart once more and found the other header also off by one row which has been corrected

      FEEs powercycled for new test

      All of aida11 now showing - attachment 7
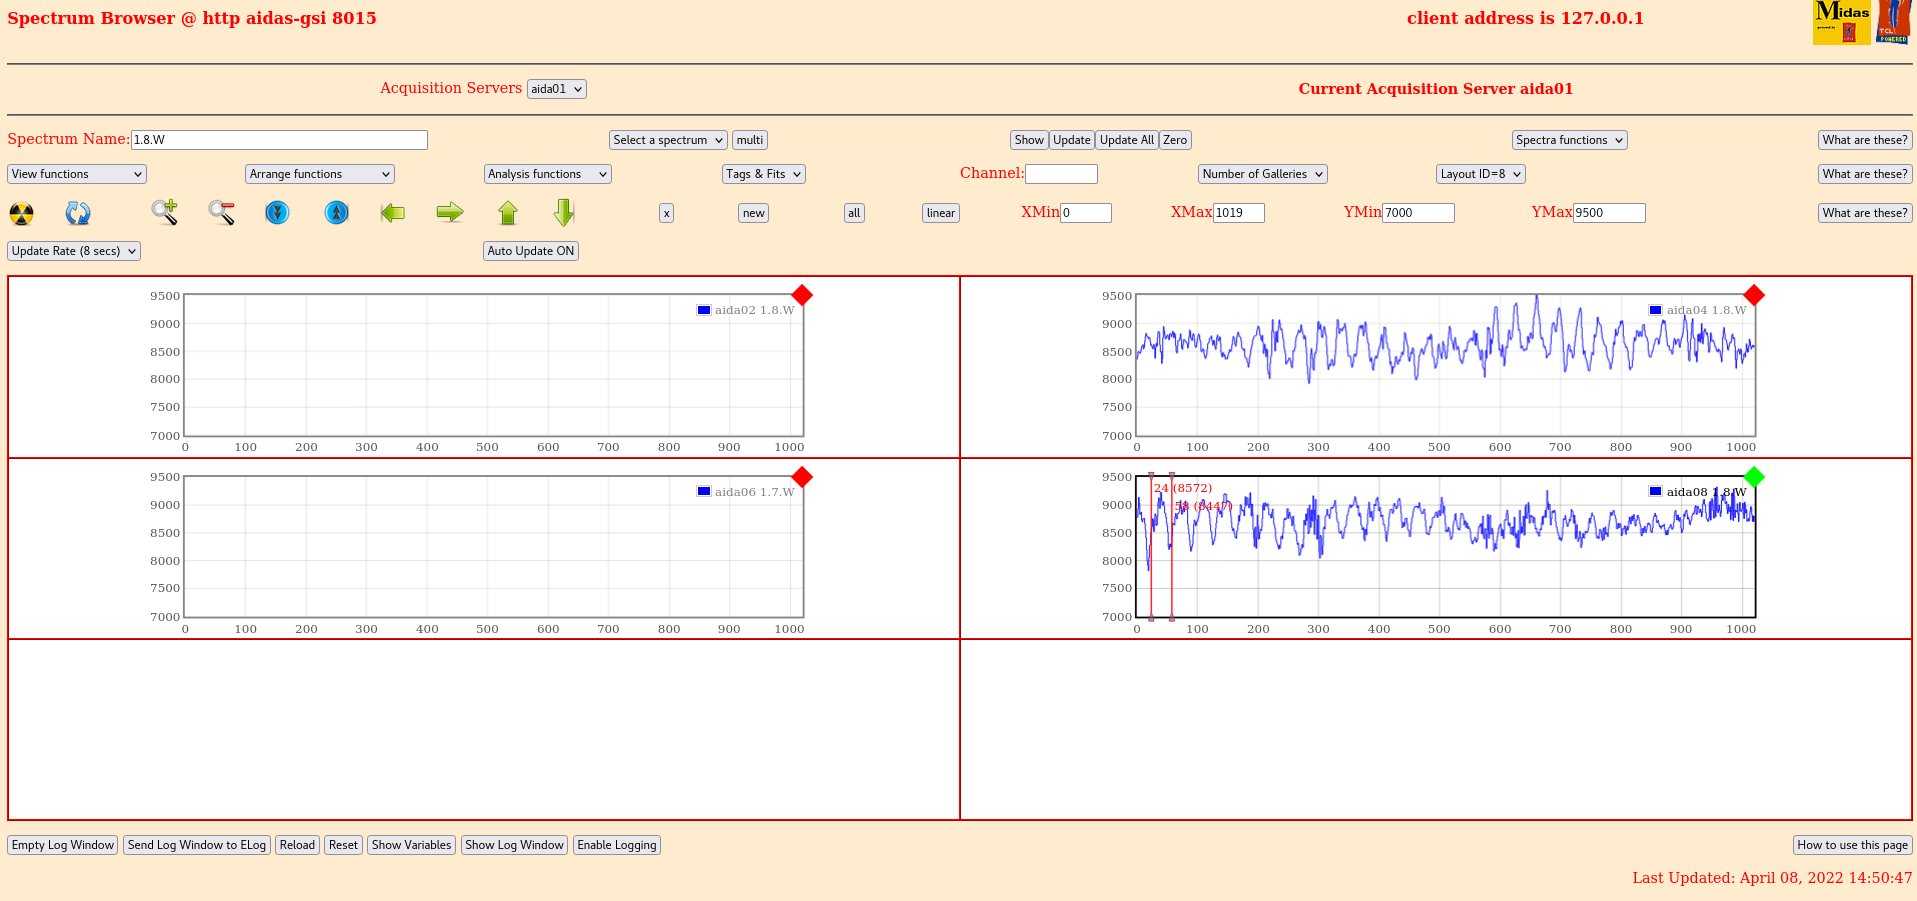
      Statistics at 0xa shown in attachment 8
      All p+n for DSSD1 are good (aida01, 03, 09, 10, 11 and 12)
      p+n for DSSD2 are so so (aida05, 07, 13, 14, 15 and 16)
      All n+n 2, 4, 6 and 8 are poor still


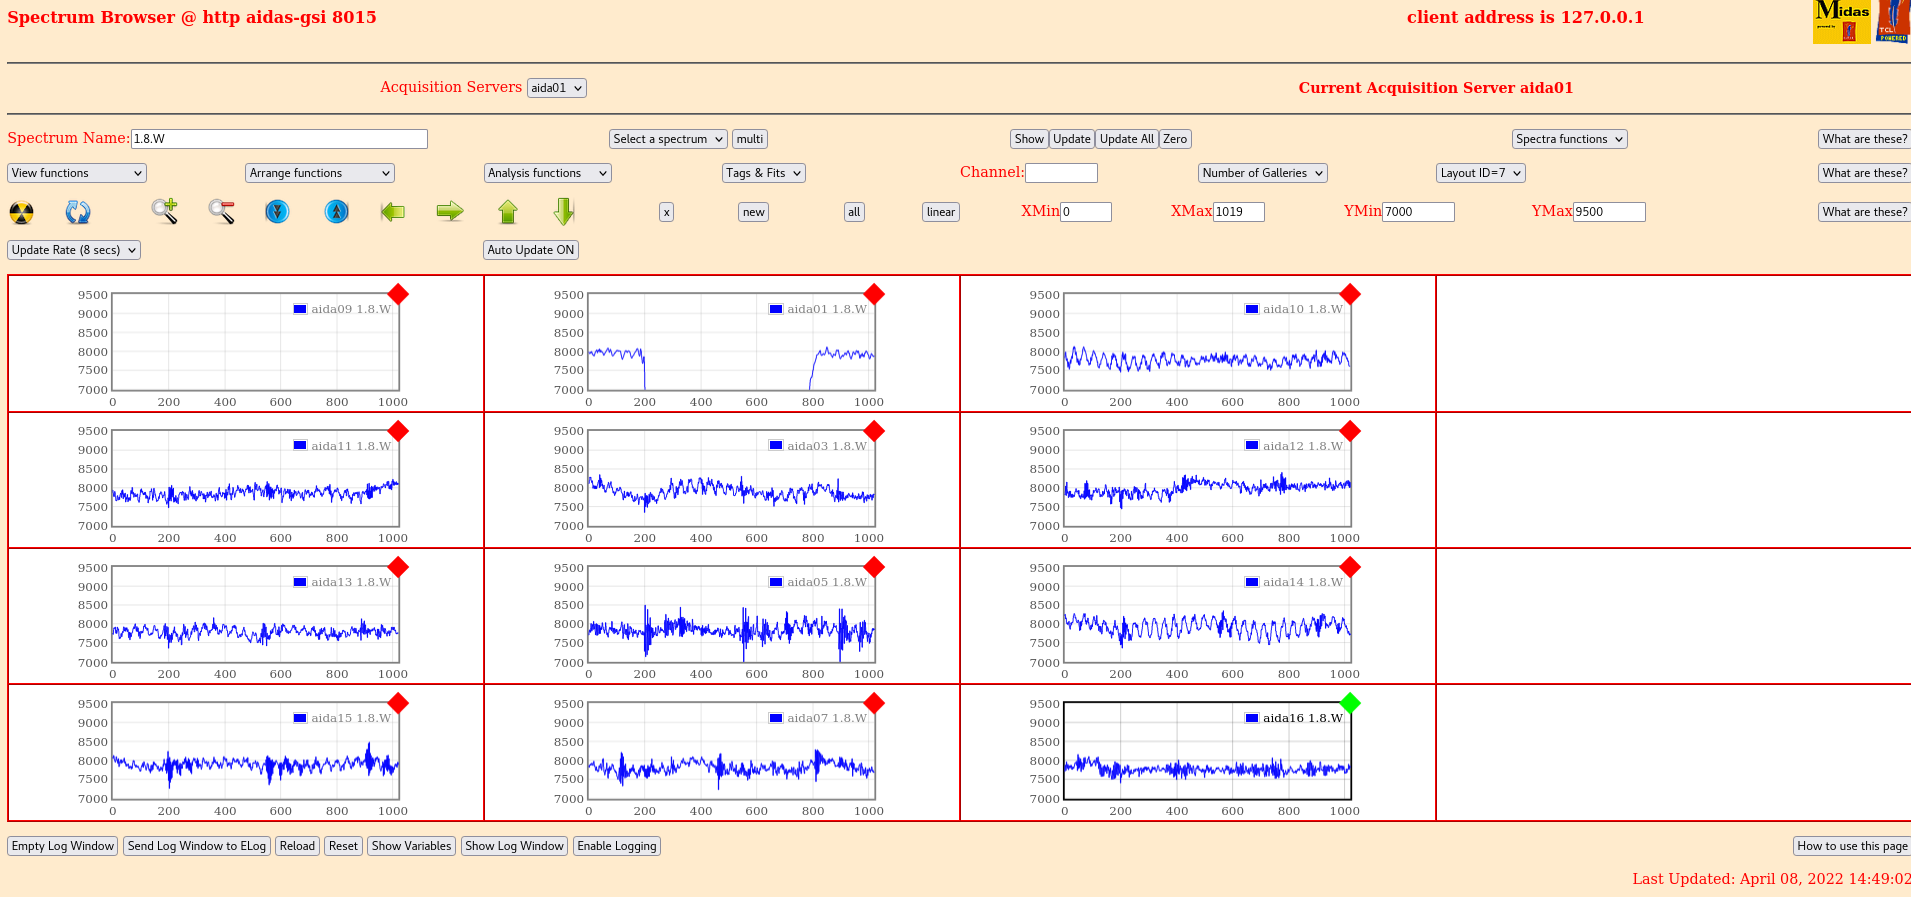
14:50 p+n waveforms - attachment 9
      n+n waveforms - attachment 10

      Current jumper configuration
      LK1 (Bias ground) on FEEs 6 and 8
      LK2&4 on all p+n
      LK3 on aida03 and aida07 (Bottom middle)

15:00 Investigated whether there was a light leak. Placed black material over snout.
      Leakage on DSSD2 dropped to 5.6 - attachment 11
      There was a light leak
      Stats have decreased slightly - attachment 12

16:00 Move raspberry pis atop 5mm alminimum plate to keep away from FEE64 PSUs
      No change

16:30 Remove pulser network from all FEEs
      Rates get noticably worse in many FEEs... why?
      Stats - attachment 13

Possible ideas include braid touching things it shouldn't (Adapter PCBs?) |
| Attachment 1: 220408_1000_bias.png
|
|
| Attachment 2: 220409_1010_Stats.png
|

|
| Attachment 3: 220409_1011_rate.png
|
|
| Attachment 4: 220408_1358_bias.png
|
|
| Attachment 5: 220408_1444_rate.png
|

|
| Attachment 6: 220408_1444_stats.png
|

|
| Attachment 7: 220408_1449_layout7.png
|
|
| Attachment 8: 220408_1451_layout8.png
|
|
| Attachment 9: 220308_1459_bias.png
|
|
| Attachment 10: 220408_1503_stats_post_light.png
|

|
| Attachment 11: 2022-04-08_16-26-30_Stats_No_Pulser.png
|

|
|
482
|
Sat Jun 18 09:46:57 2022 |
OH, NH | Friday 17th June |
Summary of the day:
Small improvements were made throughout the day but by far the biggest change to the rate in the FEEs came from disabling the waveforms
This was done by setting ADC con

Initial jumper configuration:
FEE LK
1   2 4
2   1 2 4
3   2 3 4
4   2 4
5   2 4
6   1 2 4
7   2 3 4
8   1 2 4

13:22 LK2, 3 and 4 on all p+n - attachment 1

14:20 AC mains relay connected to AC voltage stabilisers + on separate mains socket from DESPEC - attachment 2
      Same configuration but waveforms disabled (p+n improvment) - attachment 3
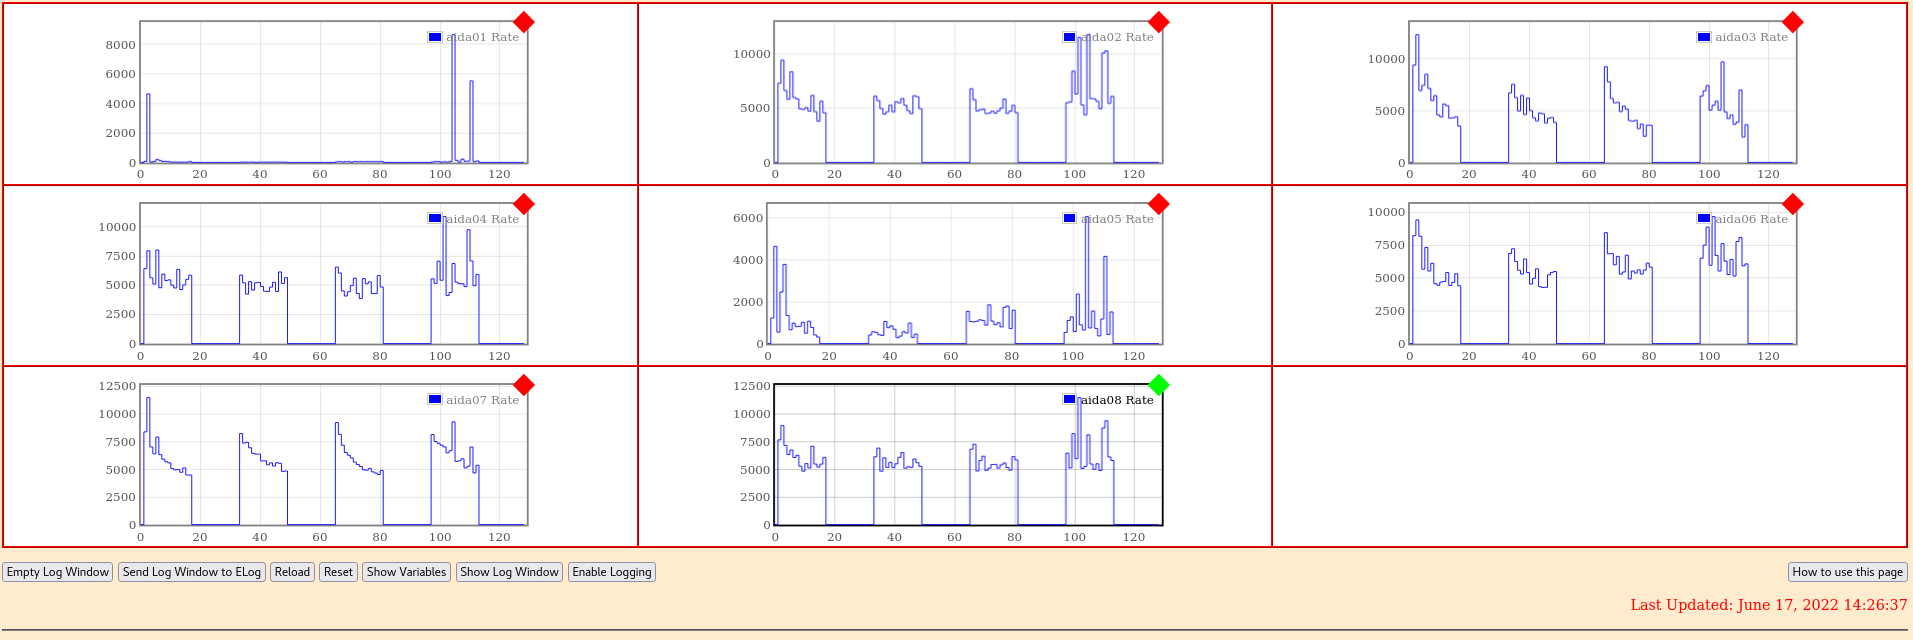
      Layout 1 - attachment 4

14:32 all FEE power cables moved to PSU 2 (Lower one in rack, upper one was slow to start for 1 FEE pair, likely the 5V slow to start)
      Previously all FEEs on their own pair within  a psu
      New order 1,3 2,4 5,7 6,8
      Waveforms on - all bad - attachment 5
      Waveforms off - all p+n better - attachment 6

14:54 interlock removed from AC mains relay
      Also noticed adaptor board on 2 not in fully -> Now in
      p+n generally better - attachment 7
      Without waveforms - p+n better again - attachment 8

16:04 Platform moved into position
      Interlock power cable removed from extension lead
      w/ waveform - p+n slightly worse
      w/o waveform - p+n same as beffore

16:14 LK3 removed from 1 and 5
      w/ waveform -> p+n slightly worse - attachment 9
      w/o waveform -> p+n best yet - attachment 10

16:33 LK1 wasn't on all n+n was only on 2, 6 and 8
      Removed from 6 -> only one LK1 per DSSD
      w/ waveforms - all bad - attachment 11
      w/o waveforms - no change - attachment 12

16:59 LK1 removed from 2->4 This is the FEE with the BIAS braid
      w/ waveform p+n better - attachment 13
      w/0 waveform p+n better, n+n worse? - attachment 14

17:21 Bias filters added to n+n
      w/ waveform - no change - attachment 15
      w/o wwaveofrm - P=n worse - attachment 16
      Stats 0x21 - attachment 17
      Stats 0x14 - attachment 18
      Stats 0x12 - attachment 19

17:42 Bias filter removed and bias floated (LK1 removed)
      w/ waveform all worse - attachment 20
      w/o waveform -> p+n worse, n+n similar

18:29 LK1 back on 4+8
      w/ waveform -> poor
      w/0 waveform - recovered previous - attachment 20


18:32 LK 2 and 4 removed from 2 +6
      Also noticed ground lemo on aida02 not fully inserted which has been corrected
      w/ waveform poor - attachment 21
      Threshold 0xF - attachment 22
w/o waveform - attachment 23 |
| Attachment 1: 220617_1322_stats.png
|

|
| Attachment 2: 220617_1420_stats.png
|

|
| Attachment 3: 220617_11428_stats.png
|

|
| Attachment 4: 220617_1428_layout1.png
|
|
| Attachment 5: 220617_1440_stats_waveform_on.png
|

|
| Attachment 6: 220617_1444_stats_no_waveform.png
|

|
| Attachment 7: 220617_1459_stats_waveform_on.png
|

|
| Attachment 8: 220617_1517_stats_no_waveform.png
|

|
| Attachment 9: 220617_1624_stats_waveform_on.png
|

|
| Attachment 10: 220617_1626_stats_waveform_off.png
|

|
| Attachment 11: 220617_1649_stats_waveform_on.png
|

|
| Attachment 12: 220617_1652_no_waveform.png
|

|
| Attachment 13: 220617_1709_waveform_on.png
|

|
| Attachment 14: 220617_1724_stats_no_waveform.png
|

|
| Attachment 15: 220617_1729_stats_waveform_on.png
|

|
| Attachment 16: 220617_1733_stats_no_waveform.png
|

|
| Attachment 17: 220617_1736_0x21.png
|

|
| Attachment 18: 220617_1738_0x14.png
|

|
| Attachment 19: 220617_1738_0x12.png
|

|
| Attachment 20: 220617_1807_stats_waveform_on.png
|

|
| Attachment 21: 220617_1832_stats_no_waveform.png
|

|
| Attachment 22: 220617_1844_0xf.png
|

|
| Attachment 23: 220617_1845_stats_waveform_on.png
|

|
|
502
|
Sun Jun 26 08:51:20 2022 |
OH, NH | Sunday 26 June 08:00-24:00 |
09:51 Taken over from Tom following the night shift
      Experiment is still running smoothly
      Compression of the files is complete up to the start of R5.
      Have started compression of files in R5 which should run up to R5_499
      Currently on R5_528

      Statistics ok - attachment 1
      Temperatures ok - attachment 2
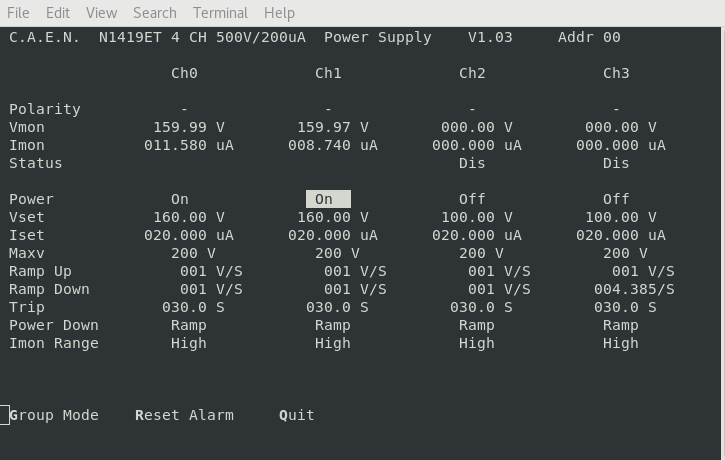
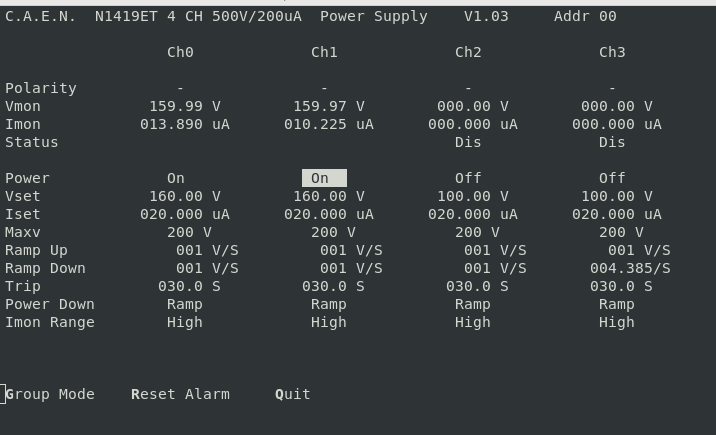
      Bias and leakage currents ok - attachment 3
      System wide checks:
          		 Base 		Current 	Difference
      aida07 fault 	 0xc53d : 	 0xc594 : 	 87
      aida08 fault 	 0xf1be : 	 0xf271 : 	 179
      White Rabbit error counter test result: Passed 6, Failed 2

      			 Base 		Current 	Difference
      aida07 fault 	 0x2a : 	 0x3b : 	 17
      FPGA Timestamp error counter test result: Passed 7, Failed 1

      Current merger rate is 2E6-4E6 events per second
      Current tapeserver rate is 5800 kB/s
      Free HDD space is 1.1 TB
      At current rates will last 54 hours which should see out the experiment
      Experiment currently scheduled to finish at 6am on Tuesday morning (May get until 8am)

      Analysis of R5_528 - attachment 4
      Deadtime of AIDA02 currently around 15%

11:56 Statistics ok - attachment 5
      Temps ok - attachment 6
      Bias and leakage currents ok - attachment 7
      System wide checks:
      Clocks all ok

         		 Base 		Current 	Difference
      aida07 fault 	 0xc53d : 	 0xc59c : 	 95
      aida08 fault 	 0xf1be : 	 0xf27a : 	 188
      White Rabbit error counter test result: Passed 6, Failed 2


			 Base 		Current 		Difference
      aida07 fault 	 0x2a : 	 0x3b : 	 17
      FPGA Timestamp error counter test result: Passed 7, Failed 1

      Analysis of file R5_458 - attachment 8
      Deadtime in AIDA02 only 11.5% in this file
      TapeServer rate still 5.5 MB/s

14:36 Has been no beam for the last while or so.
      With no beam AIDA02 has 0.25% deadtime so the deadtime is almost entirely due to the spill on time
      Stats- attachment 9
      Temp - attachment 10
      Bias and leakage currents ok - attachment 11
      System wide checks:
      Clock ok

        		 Base 		Current 	Difference
      aida07 fault 	 0xc53d : 	 0xc59d : 	 96
      aida08 fault 	 0xf1be : 	 0xf27c : 	 190
      White Rabbit error counter test result: Passed 6, Failed 2

			 Base 		Current 		Difference
      aida07 fault 	 0x2a : 	 0x3c : 	 18
      FPGA Timestamp error counter test result: Passed 7, Failed 1

13:30 Beam taken to change an ion source

14:57 Beam back

16:21 Statistics ok - attachment 12
      Temperatures ok - attachment 13
      Bias and leakage currents ok - attachment 14

      System wide checks - ASIC clocks ok

	        	 Base 		Current 	Difference
      aida07 fault 	 0xc53d : 	 0xc5a3 : 	 102
      aida08 fault 	 0xf1be : 	 0xf285 : 	 199
      White Rabbit error counter test result: Passed 6, Failed 2


			 Base 		Current 		Difference
      aida07 fault 	 0x2a : 	 0x3e : 	 20
      FPGA Timestamp error counter test result: Passed 7, Failed 1

      Currently on file R5_592
      Analysis of R5_591 - Attachment 15
      Deadtime of AIDA02 sitting at 17%

[NH taking over for OH so he can get home]

18:53 - FRS DAQ problems mean we weren't taking DESPEC data for the past hour or so... now all back
        Statitics ok - attachement 16
        Temps ok - attachement 17
        Bias & leakage ok - attachement 18

        System wide checks -
        Clocks OK
        ADC Calibration N/A
	WR Decoder -
        		 Base 		Current 	Difference
        aida07 fault 	 0xc53d : 	 0xc5ac : 	 111
        aida08 fault 	 0xf1be : 	 0xf28c : 	 206
        White Rabbit error counter test result: Passed 6, Failed 2
        FPGA -
         Base 		Current 		Difference
        aida07 fault 	 0x2a : 	 0x3f : 	 21
        PLL OK

        Currently on file R5_621
        Analysis of R5_620 - Attachement 19
        aida02 deadtime only 5%, all others negligible

20:20 Stats ok - attachment 20
      Temps ok - attachment 21
      Bias and leakage currents ok - attachment 22
      System wide checks:
      Clock ok

	        	 Base 		Current 	Difference
      aida07 fault 	 0xc53d : 	 0xc5ad : 	 112
      aida08 fault 	 0xf1be : 	 0xf293 : 	 213
      White Rabbit error counter test result: Passed 6, Failed 2


			 Base 		Current 		Difference
      aida07 fault 	 0x2a : 	 0x3f : 	 21
      FPGA Timestamp error counter test result: Passed 7, Failed 1

      Analysis of R6_637 - attachment 23

22:13 Statistics ok - attachment 24
      Temperatures ok - attachment 25
      Bias and leakage currents ok - attachment 26
      ASIC clock check ok


		         Base 		Current 	Difference
      aida07 fault 	 0xc53d : 	 0xc5ba : 	 125
      aida08 fault 	 0xf1be : 	 0xf2a2 : 	 228
      White Rabbit error counter test result: Passed 6, Failed 2

			 Base 		Current 		Difference
      aida07 fault 	 0x2a : 	 0x40 : 	 22
      FPGA Timestamp error counter test result: Passed 7, Failed 1

Analysis of R5_658 - attachment 27 |
| Attachment 1: 220626_0949_stats.png
|

|
| Attachment 2: 220626_0950_Temps.png
|

|
| Attachment 3: 220626_0951_Bias.png
|
|
| Attachment 4: R5_528_analysis.txt
|
*** TDR format 3.3.0 analyser - TD - May 2021
*** ERROR: READ I/O error: 5002
blocks: 32000
ADC data format: 260639000 ( 776334.1 Hz)
Other data format: 1281002 ( 3815.6 Hz)
Sample trace data format: 0 ( 0.0 Hz)
Undefined format: 0 ( 0.0 Hz)
Other data format type: PAUSE: 1133 ( 3.4 Hz)
RESUME: 1133 ( 3.4 Hz)
SYNC100: 33251 ( 99.0 Hz)
WR48-63: 33251 ( 99.0 Hz)
FEE64 disc: 0 ( 0.0 Hz)
MBS info: 1212234 ( 3610.7 Hz)
Other info: 0 ( 0.0 Hz)
ADC data range bit set: 393457 ( 1171.9 Hz)
Timewarps: ADC: 0 ( 0.0 Hz)
PAUSE: 0 ( 0.0 Hz)
RESUME: 0 ( 0.0 Hz)
SYNC100: 0 ( 0.0 Hz)
WR48-63: 0 ( 0.0 Hz)
FEE64 disc: 0 ( 0.0 Hz)
MBS info: 0 ( 0.0 Hz)
Undefined: 0 ( 0.0 Hz)
Sample trace: 0 ( 0.0 Hz)
*** Timestamp elapsed time: 335.730 s
FEE elapsed dead time(s) elapsed idle time(s)
0 8.363 0.000
1 44.893 0.000
2 0.179 0.000
3 3.779 0.000
4 0.000 44.522
5 0.034 0.000
6 0.166 0.000
7 0.017 0.000
8 0.000 0.000
9 0.000 0.000
10 0.000 0.000
11 0.000 0.000
12 0.000 0.000
13 0.000 0.000
14 0.000 0.000
15 0.000 0.000
16 0.000 0.000
17 0.000 0.000
18 0.000 0.000
19 0.000 0.000
20 0.000 0.000
21 0.000 0.000
22 0.000 0.000
23 0.000 0.000
24 0.000 0.000
25 0.000 0.000
26 0.000 0.000
27 0.000 0.000
28 0.000 0.000
29 0.000 0.000
30 0.000 0.000
31 0.000 0.000
32 0.000 0.000
*** Statistics
FEE ADC Data Other Data Sample Undefined Pause Resume SYNC100 WR48-63 Disc MBS Other HEC Data
0 31317521 31305 0 0 207 207 4035 4035 0 22821 0 98396
1 68454688 19188 0 0 693 693 8901 8901 0 0 0 59818
2 19369571 305849 0 0 35 35 2468 2468 0 300843 0 63063
3 45019317 306201 0 0 130 130 5636 5636 0 294669 0 32623
4 4769649 1252 0 0 0 0 626 626 0 0 0 31000
5 17853070 4600 0 0 15 15 2285 2285 0 0 0 37328
6 42448852 303192 0 0 44 44 5356 5356 0 292392 0 54344
7 31406332 309415 0 0 9 9 3944 3944 0 301509 0 16885
8 0 0 0 0 0 0 0 0 0 0 0 0
9 0 0 0 0 0 0 0 0 0 0 0 0
10 0 0 0 0 0 0 0 0 0 0 0 0
11 0 0 0 0 0 0 0 0 0 0 0 0
12 0 0 0 0 0 0 0 0 0 0 0 0
13 0 0 0 0 0 0 0 0 0 0 0 0
14 0 0 0 0 0 0 0 0 0 0 0 0
15 0 0 0 0 0 0 0 0 0 0 0 0
16 0 0 0 0 0 0 0 0 0 0 0 0
17 0 0 0 0 0 0 0 0 0 0 0 0
18 0 0 0 0 0 0 0 0 0 0 0 0
19 0 0 0 0 0 0 0 0 0 0 0 0
20 0 0 0 0 0 0 0 0 0 0 0 0
21 0 0 0 0 0 0 0 0 0 0 0 0
22 0 0 0 0 0 0 0 0 0 0 0 0
23 0 0 0 0 0 0 0 0 0 0 0 0
24 0 0 0 0 0 0 0 0 0 0 0 0
25 0 0 0 0 0 0 0 0 0 0 0 0
26 0 0 0 0 0 0 0 0 0 0 0 0
27 0 0 0 0 0 0 0 0 0 0 0 0
28 0 0 0 0 0 0 0 0 0 0 0 0
29 0 0 0 0 0 0 0 0 0 0 0 0
30 0 0 0 0 0 0 0 0 0 0 0 0
31 0 0 0 0 0 0 0 0 0 0 0 0
32 0 0 0 0 0 0 0 0 0 0 0 0
*** Timewarps
FEE ADC Pause Resume SYNC100 WR48-63 Disc MBS Undefined Samples
0 0 0 0 0 0 0 0 0 0
1 0 0 0 0 0 0 0 0 0
2 0 0 0 0 0 0 0 0 0
3 0 0 0 0 0 0 0 0 0
4 0 0 0 0 0 0 0 0 0
5 0 0 0 0 0 0 0 0 0
6 0 0 0 0 0 0 0 0 0
7 0 0 0 0 0 0 0 0 0
8 0 0 0 0 0 0 0 0 0
9 0 0 0 0 0 0 0 0 0
10 0 0 0 0 0 0 0 0 0
11 0 0 0 0 0 0 0 0 0
12 0 0 0 0 0 0 0 0 0
13 0 0 0 0 0 0 0 0 0
14 0 0 0 0 0 0 0 0 0
15 0 0 0 0 0 0 0 0 0
16 0 0 0 0 0 0 0 0 0
17 0 0 0 0 0 0 0 0 0
18 0 0 0 0 0 0 0 0 0
19 0 0 0 0 0 0 0 0 0
20 0 0 0 0 0 0 0 0 0
21 0 0 0 0 0 0 0 0 0
22 0 0 0 0 0 0 0 0 0
23 0 0 0 0 0 0 0 0 0
24 0 0 0 0 0 0 0 0 0
25 0 0 0 0 0 0 0 0 0
26 0 0 0 0 0 0 0 0 0
27 0 0 0 0 0 0 0 0 0
28 0 0 0 0 0 0 0 0 0
29 0 0 0 0 0 0 0 0 0
30 0 0 0 0 0 0 0 0 0
31 0 0 0 0 0 0 0 0 0
32 0 0 0 0 0 0 0 0 0
*** Program elapsed time: 41.891s ( 763.894 blocks/s, 47.743 Mb/s)
|
| Attachment 5: 220626_1155_stats.png
|

|
| Attachment 6: 220626_1155_Temp.png
|

|
| Attachment 7: 220626_1156_Bias.png
|

|
| Attachment 8: R5_548_analysis.txt
|
*** TDR format 3.3.0 analyser - TD - May 2021
*** ERROR: READ I/O error: 5002
blocks: 32000
ADC data format: 260758427 ( 740797.4 Hz)
Other data format: 1161573 ( 3300.0 Hz)
Sample trace data format: 0 ( 0.0 Hz)
Undefined format: 0 ( 0.0 Hz)
Other data format type: PAUSE: 1084 ( 3.1 Hz)
RESUME: 1084 ( 3.1 Hz)
SYNC100: 33311 ( 94.6 Hz)
WR48-63: 33311 ( 94.6 Hz)
FEE64 disc: 0 ( 0.0 Hz)
MBS info: 1092783 ( 3104.5 Hz)
Other info: 0 ( 0.0 Hz)
ADC data range bit set: 356241 ( 1012.1 Hz)
Timewarps: ADC: 0 ( 0.0 Hz)
PAUSE: 0 ( 0.0 Hz)
RESUME: 0 ( 0.0 Hz)
SYNC100: 0 ( 0.0 Hz)
WR48-63: 0 ( 0.0 Hz)
FEE64 disc: 0 ( 0.0 Hz)
MBS info: 0 ( 0.0 Hz)
Undefined: 0 ( 0.0 Hz)
Sample trace: 0 ( 0.0 Hz)
*** Timestamp elapsed time: 351.997 s
FEE elapsed dead time(s) elapsed idle time(s)
0 5.340 0.000
1 40.660 0.000
2 0.175 0.000
3 2.385 0.000
4 0.000 67.319
5 0.032 0.000
6 0.142 0.000
7 0.019 0.000
8 0.000 0.000
9 0.000 0.000
10 0.000 0.000
11 0.000 0.000
12 0.000 0.000
13 0.000 0.000
14 0.000 0.000
15 0.000 0.000
16 0.000 0.000
17 0.000 0.000
18 0.000 0.000
19 0.000 0.000
20 0.000 0.000
21 0.000 0.000
22 0.000 0.000
23 0.000 0.000
24 0.000 0.000
25 0.000 0.000
26 0.000 0.000
27 0.000 0.000
28 0.000 0.000
29 0.000 0.000
30 0.000 0.000
31 0.000 0.000
32 0.000 0.000
*** Statistics
FEE ADC Data Other Data Sample Undefined Pause Resume SYNC100 WR48-63 Disc MBS Other HEC Data
0 29258900 32253 0 0 166 166 3875 3875 0 24171 0 88948
1 70599060 19658 0 0 716 716 9113 9113 0 0 0 56350
2 19313501 275533 0 0 28 28 2458 2458 0 270561 0 56248
3 44887469 278330 0 0 112 112 5682 5682 0 266742 0 29387
4 4430708 1118 0 0 0 0 559 559 0 0 0 27825
5 17540711 4456 0 0 11 11 2217 2217 0 0 0 33663
6 43048879 271297 0 0 40 40 5377 5377 0 260463 0 48745
7 31679199 278928 0 0 11 11 4030 4030 0 270846 0 15075
8 0 0 0 0 0 0 0 0 0 0 0 0
9 0 0 0 0 0 0 0 0 0 0 0 0
10 0 0 0 0 0 0 0 0 0 0 0 0
11 0 0 0 0 0 0 0 0 0 0 0 0
12 0 0 0 0 0 0 0 0 0 0 0 0
13 0 0 0 0 0 0 0 0 0 0 0 0
14 0 0 0 0 0 0 0 0 0 0 0 0
15 0 0 0 0 0 0 0 0 0 0 0 0
16 0 0 0 0 0 0 0 0 0 0 0 0
17 0 0 0 0 0 0 0 0 0 0 0 0
18 0 0 0 0 0 0 0 0 0 0 0 0
19 0 0 0 0 0 0 0 0 0 0 0 0
20 0 0 0 0 0 0 0 0 0 0 0 0
21 0 0 0 0 0 0 0 0 0 0 0 0
22 0 0 0 0 0 0 0 0 0 0 0 0
23 0 0 0 0 0 0 0 0 0 0 0 0
24 0 0 0 0 0 0 0 0 0 0 0 0
25 0 0 0 0 0 0 0 0 0 0 0 0
26 0 0 0 0 0 0 0 0 0 0 0 0
27 0 0 0 0 0 0 0 0 0 0 0 0
28 0 0 0 0 0 0 0 0 0 0 0 0
29 0 0 0 0 0 0 0 0 0 0 0 0
30 0 0 0 0 0 0 0 0 0 0 0 0
31 0 0 0 0 0 0 0 0 0 0 0 0
32 0 0 0 0 0 0 0 0 0 0 0 0
*** Timewarps
FEE ADC Pause Resume SYNC100 WR48-63 Disc MBS Undefined Samples
0 0 0 0 0 0 0 0 0 0
1 0 0 0 0 0 0 0 0 0
2 0 0 0 0 0 0 0 0 0
3 0 0 0 0 0 0 0 0 0
4 0 0 0 0 0 0 0 0 0
5 0 0 0 0 0 0 0 0 0
6 0 0 0 0 0 0 0 0 0
7 0 0 0 0 0 0 0 0 0
8 0 0 0 0 0 0 0 0 0
9 0 0 0 0 0 0 0 0 0
10 0 0 0 0 0 0 0 0 0
11 0 0 0 0 0 0 0 0 0
12 0 0 0 0 0 0 0 0 0
13 0 0 0 0 0 0 0 0 0
14 0 0 0 0 0 0 0 0 0
15 0 0 0 0 0 0 0 0 0
16 0 0 0 0 0 0 0 0 0
17 0 0 0 0 0 0 0 0 0
18 0 0 0 0 0 0 0 0 0
19 0 0 0 0 0 0 0 0 0
20 0 0 0 0 0 0 0 0 0
21 0 0 0 0 0 0 0 0 0
22 0 0 0 0 0 0 0 0 0
23 0 0 0 0 0 0 0 0 0
24 0 0 0 0 0 0 0 0 0
25 0 0 0 0 0 0 0 0 0
26 0 0 0 0 0 0 0 0 0
27 0 0 0 0 0 0 0 0 0
28 0 0 0 0 0 0 0 0 0
29 0 0 0 0 0 0 0 0 0
30 0 0 0 0 0 0 0 0 0
31 0 0 0 0 0 0 0 0 0
32 0 0 0 0 0 0 0 0 0
*** Program elapsed time: 40.309s ( 793.875 blocks/s, 49.617 Mb/s)
|
| Attachment 9: 220626_1435_stats.png
|

|
| Attachment 10: 220626_1435_Temp.png
|

|
| Attachment 11: 220626_1436_Bias.png
|
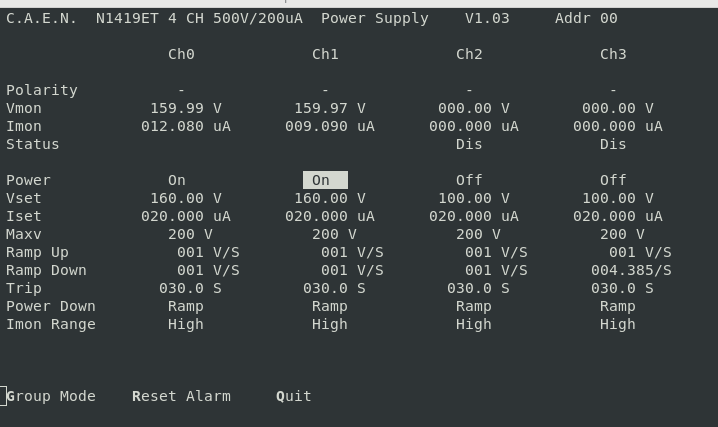
|
| Attachment 12: 220626_1620_Stats.png
|

|
| Attachment 13: 220627_1620_Temp.png
|

|
| Attachment 14: 220626_1621_Bias.png
|
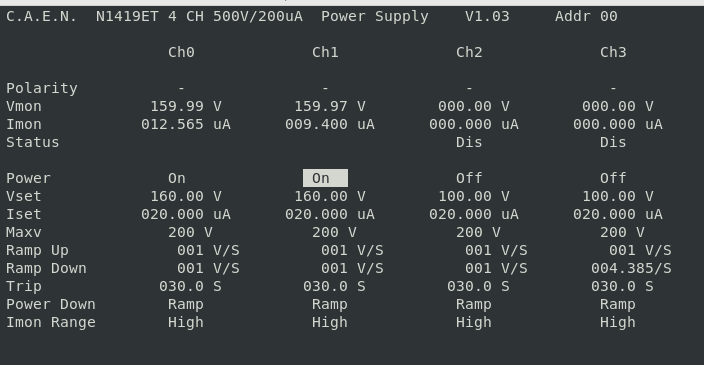
|
| Attachment 15: R5_591_analysis.txt
|
*** TDR format 3.3.0 analyser - TD - May 2021
*** ERROR: READ I/O error: 5002
blocks: 32000
ADC data format: 260421862 ( 840783.5 Hz)
Other data format: 1498138 ( 4836.8 Hz)
Sample trace data format: 0 ( 0.0 Hz)
Undefined format: 0 ( 0.0 Hz)
Other data format type: PAUSE: 1449 ( 4.7 Hz)
RESUME: 1448 ( 4.7 Hz)
SYNC100: 33154 ( 107.0 Hz)
WR48-63: 33154 ( 107.0 Hz)
FEE64 disc: 0 ( 0.0 Hz)
MBS info: 1428933 ( 4613.4 Hz)
Other info: 0 ( 0.0 Hz)
ADC data range bit set: 452287 ( 1460.2 Hz)
Timewarps: ADC: 0 ( 0.0 Hz)
PAUSE: 0 ( 0.0 Hz)
RESUME: 0 ( 0.0 Hz)
SYNC100: 0 ( 0.0 Hz)
WR48-63: 0 ( 0.0 Hz)
FEE64 disc: 0 ( 0.0 Hz)
MBS info: 0 ( 0.0 Hz)
Undefined: 0 ( 0.0 Hz)
Sample trace: 0 ( 0.0 Hz)
*** Timestamp elapsed time: 309.737 s
FEE elapsed dead time(s) elapsed idle time(s)
0 13.828 0.000
1 52.434 0.000
2 0.366 0.000
3 9.346 0.000
4 0.001 63.918
5 0.097 0.000
6 0.290 0.000
7 0.023 0.000
8 0.000 0.000
9 0.000 0.000
10 0.000 0.000
11 0.000 0.000
12 0.000 0.000
13 0.000 0.000
14 0.000 0.000
15 0.000 0.000
16 0.000 0.000
17 0.000 0.000
18 0.000 0.000
19 0.000 0.000
20 0.000 0.000
21 0.000 0.000
22 0.000 0.000
23 0.000 0.000
24 0.000 0.000
25 0.000 0.000
26 0.000 0.000
27 0.000 0.000
28 0.000 0.000
29 0.000 0.000
30 0.000 0.000
31 0.000 0.000
32 0.000 0.000
*** Statistics
FEE ADC Data Other Data Sample Undefined Pause Resume SYNC100 WR48-63 Disc MBS Other HEC Data
0 31248979 29393 0 0 283 282 4085 4085 0 20658 0 112900
1 66285610 18734 0 0 794 794 8573 8573 0 0 0 62107
2 22411069 363765 0 0 53 53 2890 2890 0 357879 0 73563
3 44202913 357046 0 0 221 221 5556 5556 0 345492 0 37941
4 5178577 1284 0 0 1 1 641 641 0 0 0 37680
5 19493707 4858 0 0 26 26 2403 2403 0 0 0 44391
6 39593301 355717 0 0 57 57 5081 5081 0 345441 0 63694
7 32007706 367341 0 0 14 14 3925 3925 0 359463 0 20011
8 0 0 0 0 0 0 0 0 0 0 0 0
9 0 0 0 0 0 0 0 0 0 0 0 0
10 0 0 0 0 0 0 0 0 0 0 0 0
11 0 0 0 0 0 0 0 0 0 0 0 0
12 0 0 0 0 0 0 0 0 0 0 0 0
13 0 0 0 0 0 0 0 0 0 0 0 0
14 0 0 0 0 0 0 0 0 0 0 0 0
15 0 0 0 0 0 0 0 0 0 0 0 0
16 0 0 0 0 0 0 0 0 0 0 0 0
17 0 0 0 0 0 0 0 0 0 0 0 0
18 0 0 0 0 0 0 0 0 0 0 0 0
19 0 0 0 0 0 0 0 0 0 0 0 0
20 0 0 0 0 0 0 0 0 0 0 0 0
21 0 0 0 0 0 0 0 0 0 0 0 0
22 0 0 0 0 0 0 0 0 0 0 0 0
23 0 0 0 0 0 0 0 0 0 0 0 0
24 0 0 0 0 0 0 0 0 0 0 0 0
25 0 0 0 0 0 0 0 0 0 0 0 0
26 0 0 0 0 0 0 0 0 0 0 0 0
27 0 0 0 0 0 0 0 0 0 0 0 0
28 0 0 0 0 0 0 0 0 0 0 0 0
29 0 0 0 0 0 0 0 0 0 0 0 0
30 0 0 0 0 0 0 0 0 0 0 0 0
31 0 0 0 0 0 0 0 0 0 0 0 0
32 0 0 0 0 0 0 0 0 0 0 0 0
*** Timewarps
FEE ADC Pause Resume SYNC100 WR48-63 Disc MBS Undefined Samples
0 0 0 0 0 0 0 0 0 0
1 0 0 0 0 0 0 0 0 0
2 0 0 0 0 0 0 0 0 0
3 0 0 0 0 0 0 0 0 0
4 0 0 0 0 0 0 0 0 0
5 0 0 0 0 0 0 0 0 0
6 0 0 0 0 0 0 0 0 0
7 0 0 0 0 0 0 0 0 0
8 0 0 0 0 0 0 0 0 0
9 0 0 0 0 0 0 0 0 0
10 0 0 0 0 0 0 0 0 0
11 0 0 0 0 0 0 0 0 0
12 0 0 0 0 0 0 0 0 0
13 0 0 0 0 0 0 0 0 0
14 0 0 0 0 0 0 0 0 0
15 0 0 0 0 0 0 0 0 0
16 0 0 0 0 0 0 0 0 0
17 0 0 0 0 0 0 0 0 0
18 0 0 0 0 0 0 0 0 0
19 0 0 0 0 0 0 0 0 0
20 0 0 0 0 0 0 0 0 0
21 0 0 0 0 0 0 0 0 0
22 0 0 0 0 0 0 0 0 0
23 0 0 0 0 0 0 0 0 0
24 0 0 0 0 0 0 0 0 0
25 0 0 0 0 0 0 0 0 0
26 0 0 0 0 0 0 0 0 0
27 0 0 0 0 0 0 0 0 0
28 0 0 0 0 0 0 0 0 0
29 0 0 0 0 0 0 0 0 0
30 0 0 0 0 0 0 0 0 0
31 0 0 0 0 0 0 0 0 0
32 0 0 0 0 0 0 0 0 0
*** Program elapsed time: 41.789s ( 765.751 blocks/s, 47.859 Mb/s)
|
| Attachment 16: tmp_aida_stats.png
|

|
| Attachment 17: tmp_aida_temps.png
|

|
| Attachment 18: tmp_aida_hv.png
|
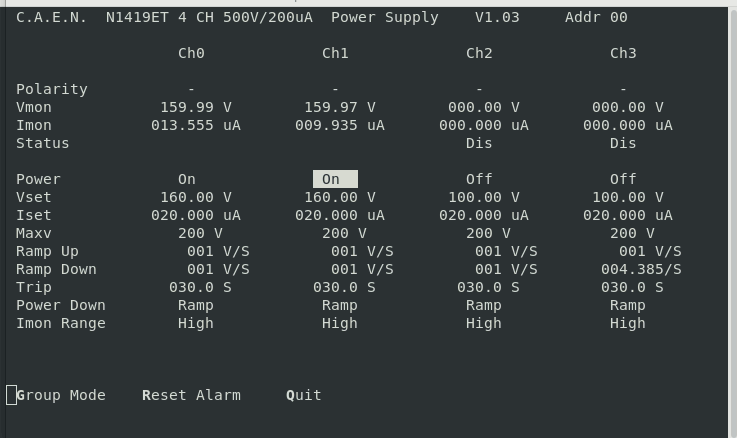
|
| Attachment 19: R5_620
|
*** TDR format 3.3.0 analyser - TD - May 2021
*** ERROR: READ I/O error: 5002
blocks: 32000
ADC data format: 261173934 ( 672570.7 Hz)
Other data format: 746069 ( 1921.3 Hz)
Sample trace data format: 0 ( 0.0 Hz)
Undefined format: 0 ( 0.0 Hz)
Other data format type: PAUSE: 773 ( 2.0 Hz)
RESUME: 773 ( 2.0 Hz)
SYNC100: 33446 ( 86.1 Hz)
WR48-63: 33446 ( 86.1 Hz)
FEE64 disc: 0 ( 0.0 Hz)
MBS info: 677631 ( 1745.0 Hz)
Other info: 0 ( 0.0 Hz)
ADC data range bit set: 225736 ( 581.3 Hz)
Timewarps: ADC: 0 ( 0.0 Hz)
PAUSE: 0 ( 0.0 Hz)
RESUME: 0 ( 0.0 Hz)
SYNC100: 0 ( 0.0 Hz)
WR48-63: 0 ( 0.0 Hz)
FEE64 disc: 0 ( 0.0 Hz)
MBS info: 0 ( 0.0 Hz)
Undefined: 0 ( 0.0 Hz)
Sample trace: 0 ( 0.0 Hz)
*** Timestamp elapsed time: 388.322 s
FEE elapsed dead time(s) elapsed idle time(s)
0 1.039 0.000
1 21.090 0.000
2 0.051 0.000
3 0.148 0.000
4 0.000 87.597
5 0.001 0.000
6 0.083 0.000
7 0.003 0.000
8 0.000 0.000
9 0.000 0.000
10 0.000 0.000
11 0.000 0.000
12 0.000 0.000
13 0.000 0.000
14 0.000 0.000
15 0.000 0.000
16 0.000 0.000
17 0.000 0.000
18 0.000 0.000
19 0.000 0.000
20 0.000 0.000
21 0.000 0.000
22 0.000 0.000
23 0.000 0.000
24 0.000 0.000
25 0.000 0.000
26 0.000 0.000
27 0.000 0.000
28 0.000 0.000
29 0.000 0.000
30 0.000 0.000
31 0.000 0.000
32 0.000 0.000
*** Statistics
FEE ADC Data Other Data Sample Undefined Pause Resume SYNC100 WR48-63 Disc MBS Other HEC Data
0 25216948 33824 0 0 63 63 3334 3334 0 27030 0 55557
1 75946108 20872 0 0 626 626 9810 9810 0 0 0 40146
2 18060200 168976 0 0 23 23 2304 2304 0 164322 0 34386
3 41452092 174351 0 0 26 26 5287 5287 0 163725 0 18377
4 3680704 948 0 0 0 0 474 474 0 0 0 17387
5 16518678 4150 0 0 1 1 2074 2074 0 0 0 20823
6 44456577 169523 0 0 30 30 5686 5686 0 158091 0 29842
7 35842627 173425 0 0 4 4 4477 4477 0 164463 0 9218
8 0 0 0 0 0 0 0 0 0 0 0 0
9 0 0 0 0 0 0 0 0 0 0 0 0
10 0 0 0 0 0 0 0 0 0 0 0 0
11 0 0 0 0 0 0 0 0 0 0 0 0
12 0 0 0 0 0 0 0 0 0 0 0 0
13 0 0 0 0 0 0 0 0 0 0 0 0
14 0 0 0 0 0 0 0 0 0 0 0 0
15 0 0 0 0 0 0 0 0 0 0 0 0
16 0 0 0 0 0 0 0 0 0 0 0 0
17 0 0 0 0 0 0 0 0 0 0 0 0
18 0 0 0 0 0 0 0 0 0 0 0 0
19 0 0 0 0 0 0 0 0 0 0 0 0
20 0 0 0 0 0 0 0 0 0 0 0 0
21 0 0 0 0 0 0 0 0 0 0 0 0
22 0 0 0 0 0 0 0 0 0 0 0 0
23 0 0 0 0 0 0 0 0 0 0 0 0
24 0 0 0 0 0 0 0 0 0 0 0 0
25 0 0 0 0 0 0 0 0 0 0 0 0
26 0 0 0 0 0 0 0 0 0 0 0 0
27 0 0 0 0 0 0 0 0 0 0 0 0
28 0 0 0 0 0 0 0 0 0 0 0 0
29 0 0 0 0 0 0 0 0 0 0 0 0
30 0 0 0 0 0 0 0 0 0 0 0 0
31 0 0 0 0 0 0 0 0 0 0 0 0
32 0 0 0 0 0 0 0 0 0 0 0 0
*** Timewarps
FEE ADC Pause Resume SYNC100 WR48-63 Disc MBS Undefined Samples
0 0 0 0 0 0 0 0 0 0
1 0 0 0 0 0 0 0 0 0
2 0 0 0 0 0 0 0 0 0
3 0 0 0 0 0 0 0 0 0
4 0 0 0 0 0 0 0 0 0
5 0 0 0 0 0 0 0 0 0
6 0 0 0 0 0 0 0 0 0
7 0 0 0 0 0 0 0 0 0
8 0 0 0 0 0 0 0 0 0
9 0 0 0 0 0 0 0 0 0
10 0 0 0 0 0 0 0 0 0
11 0 0 0 0 0 0 0 0 0
12 0 0 0 0 0 0 0 0 0
13 0 0 0 0 0 0 0 0 0
14 0 0 0 0 0 0 0 0 0
15 0 0 0 0 0 0 0 0 0
16 0 0 0 0 0 0 0 0 0
17 0 0 0 0 0 0 0 0 0
18 0 0 0 0 0 0 0 0 0
19 0 0 0 0 0 0 0 0 0
20 0 0 0 0 0 0 0 0 0
21 0 0 0 0 0 0 0 0 0
22 0 0 0 0 0 0 0 0 0
23 0 0 0 0 0 0 0 0 0
24 0 0 0 0 0 0 0 0 0
25 0 0 0 0 0 0 0 0 0
26 0 0 0 0 0 0 0 0 0
27 0 0 0 0 0 0 0 0 0
28 0 0 0 0 0 0 0 0 0
29 0 0 0 0 0 0 0 0 0
30 0 0 0 0 0 0 0 0 0
31 0 0 0 0 0 0 0 0 0
32 0 0 0 0 0 0 0 0 0
*** Program elapsed time: 41.547s ( 770.214 blocks/s, 48.138 Mb/s)
|
| Attachment 20: 220624_2021_Stats.png
|

|
| Attachment 21: 220626_2021_Temp.png
|

|
| Attachment 22: 220626_2022_Bias.png
|
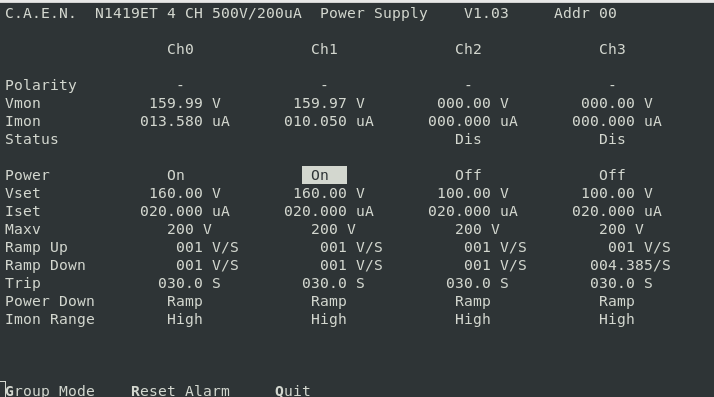
|
| Attachment 23: R5_637_analysis.txt
|
*** TDR format 3.3.0 analyser - TD - May 2021
*** ERROR: READ I/O error: 5002
blocks: 32000
ADC data format: 260438015 ( 849636.0 Hz)
Other data format: 1481985 ( 4834.7 Hz)
Sample trace data format: 0 ( 0.0 Hz)
Undefined format: 0 ( 0.0 Hz)
Other data format type: PAUSE: 1460 ( 4.8 Hz)
RESUME: 1460 ( 4.8 Hz)
SYNC100: 33142 ( 108.1 Hz)
WR48-63: 33142 ( 108.1 Hz)
FEE64 disc: 0 ( 0.0 Hz)
MBS info: 1412781 ( 4609.0 Hz)
Other info: 0 ( 0.0 Hz)
ADC data range bit set: 447675 ( 1460.5 Hz)
Timewarps: ADC: 0 ( 0.0 Hz)
PAUSE: 0 ( 0.0 Hz)
RESUME: 0 ( 0.0 Hz)
SYNC100: 0 ( 0.0 Hz)
WR48-63: 0 ( 0.0 Hz)
FEE64 disc: 0 ( 0.0 Hz)
MBS info: 0 ( 0.0 Hz)
Undefined: 0 ( 0.0 Hz)
Sample trace: 0 ( 0.0 Hz)
*** Timestamp elapsed time: 306.529 s
FEE elapsed dead time(s) elapsed idle time(s)
0 15.951 0.000
1 53.516 0.000
2 0.642 0.000
3 7.248 0.000
4 0.000 53.241
5 0.100 0.000
6 0.344 0.000
7 0.040 0.000
8 0.000 0.000
9 0.000 0.000
10 0.000 0.000
11 0.000 0.000
12 0.000 0.000
13 0.000 0.000
14 0.000 0.000
15 0.000 0.000
16 0.000 0.000
17 0.000 0.000
18 0.000 0.000
19 0.000 0.000
20 0.000 0.000
21 0.000 0.000
22 0.000 0.000
23 0.000 0.000
24 0.000 0.000
25 0.000 0.000
26 0.000 0.000
27 0.000 0.000
28 0.000 0.000
29 0.000 0.000
30 0.000 0.000
31 0.000 0.000
32 0.000 0.000
*** Statistics
FEE ADC Data Other Data Sample Undefined Pause Resume SYNC100 WR48-63 Disc MBS Other HEC Data
0 31824689 29138 0 0 291 291 4129 4129 0 20298 0 110511
1 66116092 18806 0 0 788 788 8615 8615 0 0 0 62706
2 22609638 359670 0 0 68 68 2899 2899 0 353736 0 72536
3 44231727 352857 0 0 199 199 5696 5696 0 341067 0 37873
4 5159378 1270 0 0 0 0 635 635 0 0 0 37425
5 19491876 4836 0 0 27 27 2391 2391 0 0 0 43832
6 39561529 352144 0 0 68 68 4899 4899 0 342210 0 62927
7 31443086 363264 0 0 19 19 3878 3878 0 355470 0 19865
8 0 0 0 0 0 0 0 0 0 0 0 0
9 0 0 0 0 0 0 0 0 0 0 0 0
10 0 0 0 0 0 0 0 0 0 0 0 0
11 0 0 0 0 0 0 0 0 0 0 0 0
12 0 0 0 0 0 0 0 0 0 0 0 0
13 0 0 0 0 0 0 0 0 0 0 0 0
14 0 0 0 0 0 0 0 0 0 0 0 0
15 0 0 0 0 0 0 0 0 0 0 0 0
16 0 0 0 0 0 0 0 0 0 0 0 0
17 0 0 0 0 0 0 0 0 0 0 0 0
18 0 0 0 0 0 0 0 0 0 0 0 0
19 0 0 0 0 0 0 0 0 0 0 0 0
20 0 0 0 0 0 0 0 0 0 0 0 0
21 0 0 0 0 0 0 0 0 0 0 0 0
22 0 0 0 0 0 0 0 0 0 0 0 0
23 0 0 0 0 0 0 0 0 0 0 0 0
24 0 0 0 0 0 0 0 0 0 0 0 0
25 0 0 0 0 0 0 0 0 0 0 0 0
26 0 0 0 0 0 0 0 0 0 0 0 0
27 0 0 0 0 0 0 0 0 0 0 0 0
28 0 0 0 0 0 0 0 0 0 0 0 0
29 0 0 0 0 0 0 0 0 0 0 0 0
30 0 0 0 0 0 0 0 0 0 0 0 0
31 0 0 0 0 0 0 0 0 0 0 0 0
32 0 0 0 0 0 0 0 0 0 0 0 0
*** Timewarps
FEE ADC Pause Resume SYNC100 WR48-63 Disc MBS Undefined Samples
0 0 0 0 0 0 0 0 0 0
1 0 0 0 0 0 0 0 0 0
2 0 0 0 0 0 0 0 0 0
3 0 0 0 0 0 0 0 0 0
4 0 0 0 0 0 0 0 0 0
5 0 0 0 0 0 0 0 0 0
6 0 0 0 0 0 0 0 0 0
7 0 0 0 0 0 0 0 0 0
8 0 0 0 0 0 0 0 0 0
9 0 0 0 0 0 0 0 0 0
10 0 0 0 0 0 0 0 0 0
11 0 0 0 0 0 0 0 0 0
12 0 0 0 0 0 0 0 0 0
13 0 0 0 0 0 0 0 0 0
14 0 0 0 0 0 0 0 0 0
15 0 0 0 0 0 0 0 0 0
16 0 0 0 0 0 0 0 0 0
17 0 0 0 0 0 0 0 0 0
18 0 0 0 0 0 0 0 0 0
19 0 0 0 0 0 0 0 0 0
20 0 0 0 0 0 0 0 0 0
21 0 0 0 0 0 0 0 0 0
22 0 0 0 0 0 0 0 0 0
23 0 0 0 0 0 0 0 0 0
24 0 0 0 0 0 0 0 0 0
25 0 0 0 0 0 0 0 0 0
26 0 0 0 0 0 0 0 0 0
27 0 0 0 0 0 0 0 0 0
28 0 0 0 0 0 0 0 0 0
29 0 0 0 0 0 0 0 0 0
30 0 0 0 0 0 0 0 0 0
31 0 0 0 0 0 0 0 0 0
32 0 0 0 0 0 0 0 0 0
*** Program elapsed time: 42.891s ( 746.084 blocks/s, 46.630 Mb/s)
|
| Attachment 24: 220626_2211_Stats.png
|

|
| Attachment 25: 220626_2211_Temps.png
|

|
| Attachment 26: 220626_2212_Bias.png
|
|
| Attachment 27: R5_658_analysis.txt
|
*** TDR format 3.3.0 analyser - TD - May 2021
*** ERROR: READ I/O error: 5002
blocks: 32000
ADC data format: 260445182 ( 832450.2 Hz)
Other data format: 1474818 ( 4713.9 Hz)
Sample trace data format: 0 ( 0.0 Hz)
Undefined format: 0 ( 0.0 Hz)
Other data format type: PAUSE: 1484 ( 4.7 Hz)
RESUME: 1484 ( 4.7 Hz)
SYNC100: 33166 ( 106.0 Hz)
WR48-63: 33166 ( 106.0 Hz)
FEE64 disc: 0 ( 0.0 Hz)
MBS info: 1405518 ( 4492.4 Hz)
Other info: 0 ( 0.0 Hz)
ADC data range bit set: 448659 ( 1434.0 Hz)
Timewarps: ADC: 0 ( 0.0 Hz)
PAUSE: 0 ( 0.0 Hz)
RESUME: 0 ( 0.0 Hz)
SYNC100: 0 ( 0.0 Hz)
WR48-63: 0 ( 0.0 Hz)
FEE64 disc: 0 ( 0.0 Hz)
MBS info: 0 ( 0.0 Hz)
Undefined: 0 ( 0.0 Hz)
Sample trace: 0 ( 0.0 Hz)
*** Timestamp elapsed time: 312.866 s
FEE elapsed dead time(s) elapsed idle time(s)
0 15.080 0.000
1 57.798 0.000
2 0.343 0.000
3 7.278 0.000
4 0.000 44.445
5 0.093 0.000
6 0.265 0.000
7 0.017 0.000
8 0.000 0.000
9 0.000 0.000
10 0.000 0.000
11 0.000 0.000
12 0.000 0.000
13 0.000 0.000
14 0.000 0.000
15 0.000 0.000
16 0.000 0.000
17 0.000 0.000
18 0.000 0.000
19 0.000 0.000
20 0.000 0.000
21 0.000 0.000
22 0.000 0.000
23 0.000 0.000
24 0.000 0.000
25 0.000 0.000
26 0.000 0.000
27 0.000 0.000
28 0.000 0.000
29 0.000 0.000
30 0.000 0.000
31 0.000 0.000
32 0.000 0.000
*** Statistics
FEE ADC Data Other Data Sample Undefined Pause Resume SYNC100 WR48-63 Disc MBS Other HEC Data
0 32528426 29869 0 0 310 310 4234 4234 0 20781 0 110841
1 66604779 18608 0 0 825 825 8479 8479 0 0 0 61991
2 23919816 357449 0 0 63 63 3136 3136 0 351051 0 72944
3 47288432 353667 0 0 196 196 5939 5939 0 341397 0 38095
4 5032393 1218 0 0 0 0 609 609 0 0 0 37603
5 19089927 4824 0 0 28 28 2384 2384 0 0 0 44213
6 39392581 350027 0 0 52 52 5076 5076 0 339771 0 63206
7 26588828 359156 0 0 10 10 3309 3309 0 352518 0 19766
8 0 0 0 0 0 0 0 0 0 0 0 0
9 0 0 0 0 0 0 0 0 0 0 0 0
10 0 0 0 0 0 0 0 0 0 0 0 0
11 0 0 0 0 0 0 0 0 0 0 0 0
12 0 0 0 0 0 0 0 0 0 0 0 0
13 0 0 0 0 0 0 0 0 0 0 0 0
14 0 0 0 0 0 0 0 0 0 0 0 0
15 0 0 0 0 0 0 0 0 0 0 0 0
16 0 0 0 0 0 0 0 0 0 0 0 0
17 0 0 0 0 0 0 0 0 0 0 0 0
18 0 0 0 0 0 0 0 0 0 0 0 0
19 0 0 0 0 0 0 0 0 0 0 0 0
20 0 0 0 0 0 0 0 0 0 0 0 0
21 0 0 0 0 0 0 0 0 0 0 0 0
22 0 0 0 0 0 0 0 0 0 0 0 0
23 0 0 0 0 0 0 0 0 0 0 0 0
24 0 0 0 0 0 0 0 0 0 0 0 0
25 0 0 0 0 0 0 0 0 0 0 0 0
26 0 0 0 0 0 0 0 0 0 0 0 0
27 0 0 0 0 0 0 0 0 0 0 0 0
28 0 0 0 0 0 0 0 0 0 0 0 0
29 0 0 0 0 0 0 0 0 0 0 0 0
30 0 0 0 0 0 0 0 0 0 0 0 0
31 0 0 0 0 0 0 0 0 0 0 0 0
32 0 0 0 0 0 0 0 0 0 0 0 0
*** Timewarps
FEE ADC Pause Resume SYNC100 WR48-63 Disc MBS Undefined Samples
0 0 0 0 0 0 0 0 0 0
1 0 0 0 0 0 0 0 0 0
2 0 0 0 0 0 0 0 0 0
3 0 0 0 0 0 0 0 0 0
4 0 0 0 0 0 0 0 0 0
5 0 0 0 0 0 0 0 0 0
6 0 0 0 0 0 0 0 0 0
7 0 0 0 0 0 0 0 0 0
8 0 0 0 0 0 0 0 0 0
9 0 0 0 0 0 0 0 0 0
10 0 0 0 0 0 0 0 0 0
11 0 0 0 0 0 0 0 0 0
12 0 0 0 0 0 0 0 0 0
13 0 0 0 0 0 0 0 0 0
14 0 0 0 0 0 0 0 0 0
15 0 0 0 0 0 0 0 0 0
16 0 0 0 0 0 0 0 0 0
17 0 0 0 0 0 0 0 0 0
18 0 0 0 0 0 0 0 0 0
19 0 0 0 0 0 0 0 0 0
20 0 0 0 0 0 0 0 0 0
21 0 0 0 0 0 0 0 0 0
22 0 0 0 0 0 0 0 0 0
23 0 0 0 0 0 0 0 0 0
24 0 0 0 0 0 0 0 0 0
25 0 0 0 0 0 0 0 0 0
26 0 0 0 0 0 0 0 0 0
27 0 0 0 0 0 0 0 0 0
28 0 0 0 0 0 0 0 0 0
29 0 0 0 0 0 0 0 0 0
30 0 0 0 0 0 0 0 0 0
31 0 0 0 0 0 0 0 0 0
32 0 0 0 0 0 0 0 0 0
*** Program elapsed time: 42.102s ( 760.067 blocks/s, 47.504 Mb/s)
|
|
508
|
Tue Jun 28 10:11:35 2022 |
OH, NH | MIDAS Data Aq V10 |
11:11 Rebooted FEEs and changed aidacommon in /MIDAS/linux-ppc_4xx/startup to point to the new V10 DataAq that Patrick produced
      When using V9 the Merger statistics reported WR items at twice the rate of ADC data items.
      i.e for ever data item we were sending and info code 4 and info code 5 item sending 192 bits of data vs 64 for just the data word
      This was causing significant deadtime when FEEs were running in the range of around 200kHz. These WR items were not reported by the MIDAS Acquisition server but were in the Merger statistics

      Patrick has produced V10 which removes these.

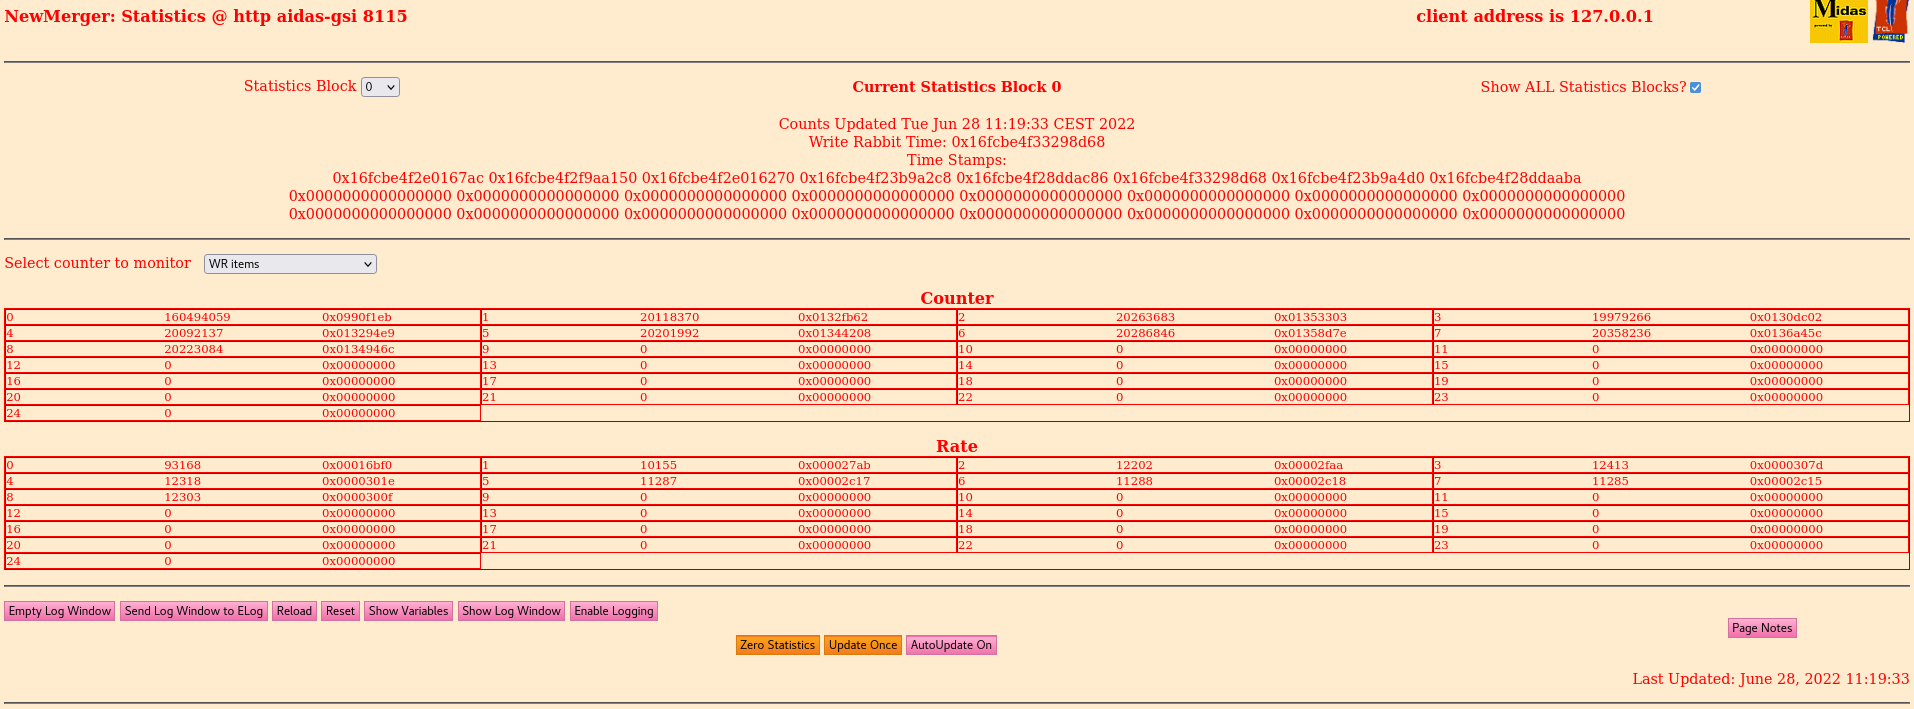
      When running V10 we can confirm in the Merger statistics that this rate is no longer determined by the ADC data rate and instead controlled via Sync Rollover Target in GSI WhiteRabbit Control.
      WR items for 0xE - attachment 1
      WR items for 0x7 - attachment 2

      However we see in the NewMerger terminal the message shown in attachment 3 frequently.
      Also we note that the merger time error counter is also going up.
      Our thoughts for this are we have a rollover issue (Is the merger expecting the rollover of the LSB to be one value when the MSB is updated but MIDAS is happening on another?)
      Are we having dead time issues which is causing time warps?

      Does each buffer from the MIDAS Data Acq start with a full WR timestamp?

aidacommon has been changed back to point to V9 to not cause issues when we run the DAQ and forget we changed it to be this way? |
| Attachment 1: 220628_1117_Rollover0xE.png
|

|
| Attachment 2: 220628_1119_Merger_Stats_0x7.png
|
|
| Attachment 3: NewMerger_Dump.txt
|
MERGE Data Link (17671): block sequence error: ID 2, expected 462; received 0
MERGE Data Link (17669): block sequence error: ID 0, expected 461; received 0
MERGE Data Link (17672): block sequence error: ID 3, expected 462; received 0
MERGE Data Link (17670): block sequence error: ID 1, expected 462; received 0
MERGE Data Link (17674): block sequence error: ID 5, expected 463; received 0
MERGE Data Link (17676): block sequence error: ID 7, expected 462; received 0
MERGE Data Link (17675): block sequence error: ID 6, expected 461; received 0
MERGE Data Link (17673): block sequence error: ID 4, expected 462; received 0
MERGE Actor (17699): Working with 0 from 8 data sources

MERGE Actor (17699): Working with 0 from 8 data sources

MERGE Actor (17699): Working with 0 from 8 data sources

MERGE Actor (17699): Working with 0 from 8 data sources

MERGE Actor (17699): Working with 0 from 8 data sources

MERGE Actor (17699): Working with 0 from 8 data sources

MERGE Actor (17699): Working with 0 from 8 data sources

MERGE Actor (17699): Working with 0 from 8 data sources

MERGE Actor (17699): Working with 0 from 8 data sources

MERGE Actor (17699): Working with 0 from 8 data sources

MERGE Actor (17699): Working with 0 from 8 data sources

MERGE Actor (17699): Working with 0 from 8 data sources

MERGE Actor (17699): Working with 0 from 8 data sources

MERGE Actor (17699): Working with 0 from 8 data sources

MERGE Actor (17699): Working with 0 from 8 data sources

MERGE Actor (17699): Working with 0 from 8 data sources

MERGE Actor (17699): Working with 0 from 8 data sources

MERGE Actor (17699): Working with 0 from 8 data sources

MERGE Actor (17699): Working with 0 from 8 data sources

MERGE Actor (17699): Working with 0 from 8 data sources

MERGE Actor (17699): Working with 0 from 8 data sources

MERGE Actor (17699): Working with 0 from 8 data sources

MERGE Actor (17699): Working with 0 from 8 data sources

MERGE Actor (17699): Working with 0 from 8 data sources

MERGE Actor (17699): Working with 0 from 8 data sources

MERGE Actor (17699): Working with 0 from 8 data sources

MERGE Actor (17699): Working with 0 from 8 data sources

MERGE Actor (17699): Working with 0 from 8 data sources

MERGE Actor (17699): Working with 0 from 8 data sources

MERGE Actor (17699): Working with 0 from 8 data sources

MERGE Actor (17699): Working with 0 from 8 data sources

MERGE Actor (17699): Working with 0 from 8 data sources

MERGE Actor (17699): Working with 0 from 8 data sources

MERGE Actor (17699): Working with 0 from 8 data sources

MERGE Actor (17699): Working with 0 from 8 data sources

MERGE Actor (17699): Working with 0 from 8 data sources

MERGE Actor (17699): Working with 0 from 8 data sources

MERGE Actor (17699): Working with 0 from 8 data sources

MERGE Actor (17699): Working with 0 from 8 data sources

MERGE Actor (17699): Working with 0 from 8 data sources

MERGE Actor (17699): Working with 0 from 8 data sources

MERGE Actor (17699): Working with 0 from 8 data sources

MERGE Actor (17699): Working with 0 from 8 data sources

MERGE Actor (17699): Working with 0 from 8 data sources

MERGE Actor (17699): Working with 0 from 8 data sources

MERGE Actor (17699): Working with 0 from 8 data sources
|
|
229
|
Fri Apr 16 07:19:00 2021 |
OH, MA | Friday 16th April 08:00-16:00 |
08:19 System wide checks all ok
      Baselines reset on WR and FPGA checks for the start of the day

      Statistics ok - attachment 1
      Temperatures ok - attachment 2
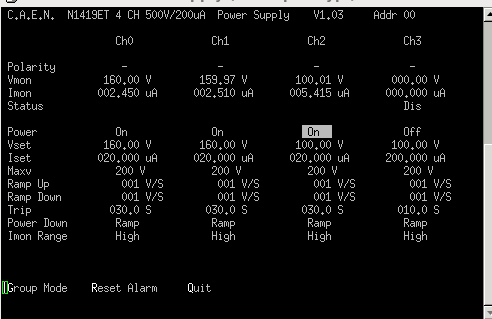
      Bias and leakage currents ok - attachment 3

09:03 During the reset last night I repaired the OptionsDB for aida02 from the Options.Pristine directory.
      No corruptions have been noted since

10:10 System check, clcock and ADC ok

	 Base 		Current 	Difference
aida07 fault 	 0xfb3a : 	 0xfb3d : 	 3
White Rabbit error counter test result: Passed 11, Failed 1

Understand the status reports as follows:-
Status bit 3 : White Rabbit decoder detected an error in the received data
Status bit 2 : Firmware registered WR error, no reload of Timestamp
Status bit 0 : White Rabbit decoder reports uncertain of Timestamp information from WR

FPGA and memory check ok

      Statistics ok - attachment 4
      Temperatures ok - attachment 5
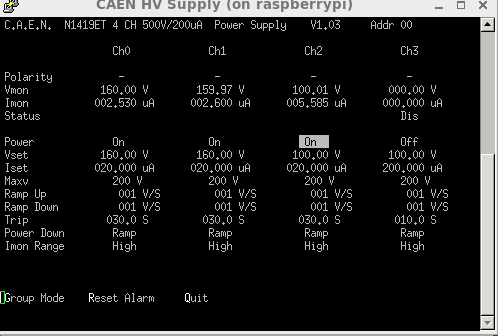
      Bias and leakage currents ok - attachment 6

10:39 Fission fragments were punching through AIDA
      This was even with the maxmimum degraders in place
      They are now placing a thick plate in front of AIDA to block the fragments while they beam tune.

11:38 They have found the issue with the degrader and have corrected it.
      We now see next to no implants in AIDA as expect.
      Histograms reset at around 11:35
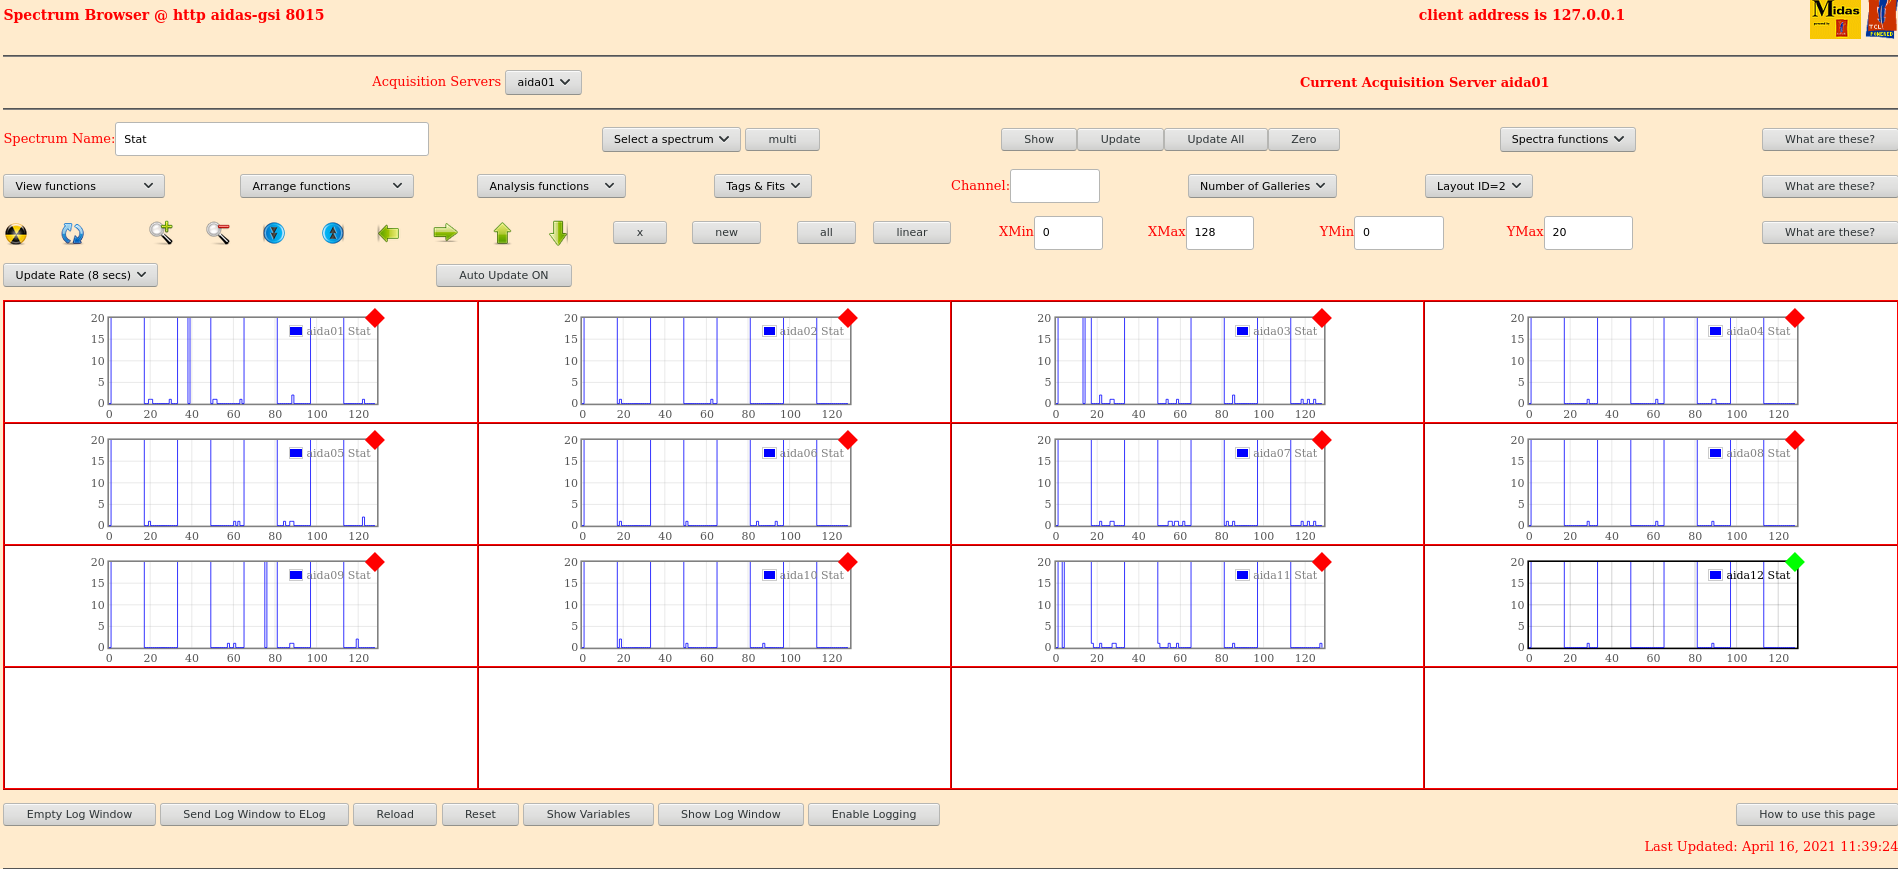
      Layout 2 shows very few implants in 5 minutes - attachment 7

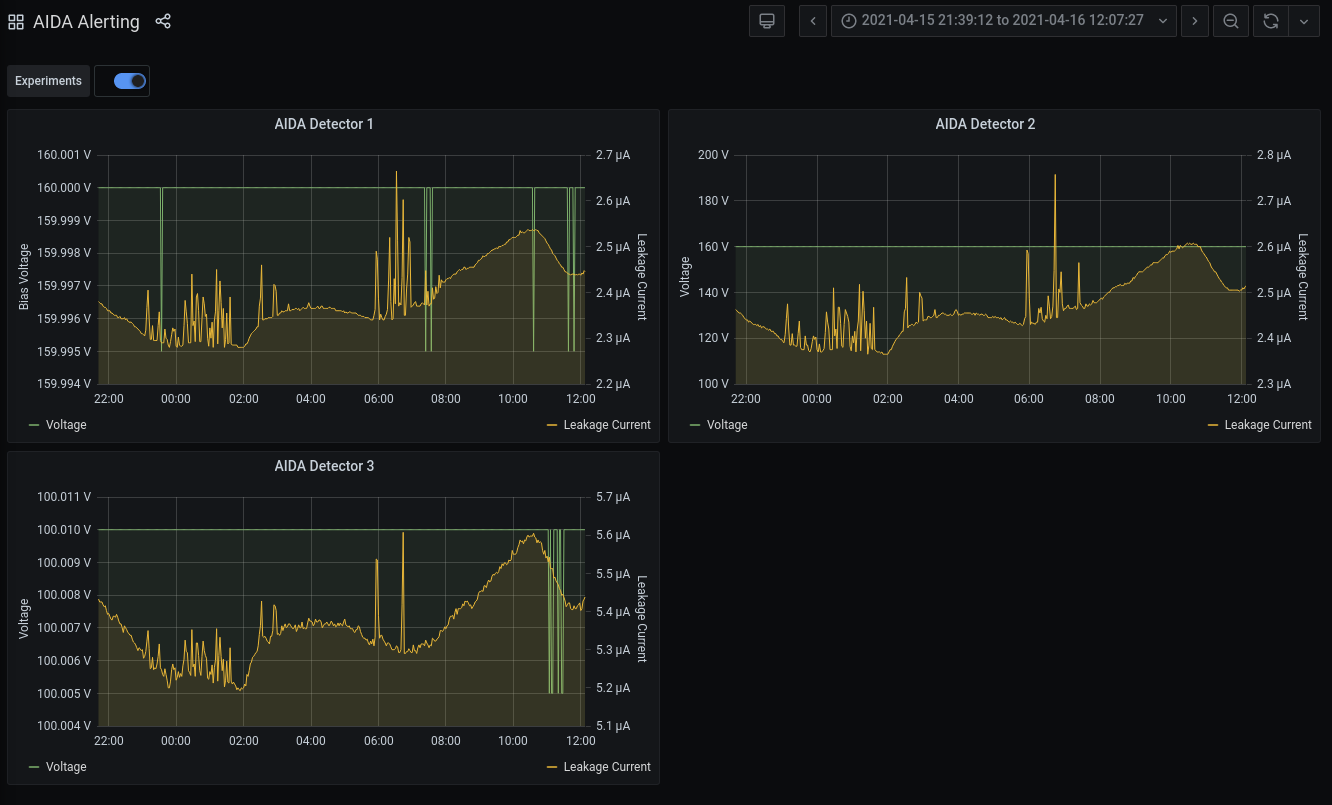
12:08 The high implantation rates of ions into AIDA is clearly seen in the large transients on the leakage currents - attachment 8
      This was a large amount of dose going into the detectors which we should try to avoid

13:25 system check, clock and ADC ok

	 Base 		Current 	Difference
aida05 fault 	 0xc879 : 	 0xc87b : 	 2
aida06 fault 	 0x323c : 	 0x323e : 	 2
aida07 fault 	 0xfb3a : 	 0xfb3f : 	 5
aida08 fault 	 0xd3d6 : 	 0xd3d8 : 	 2
White Rabbit error counter test result: Passed 8, Failed 4

Understand the status reports as follows:-
Status bit 3 : White Rabbit decoder detected an error in the received data
Status bit 2 : Firmware registered WR error, no reload of Timestamp
Status bit 0 : White Rabbit decoder reports uncertain of Timestamp information from WR

      Statistics ok - attachment 9
      Temperatures ok - attachment 10
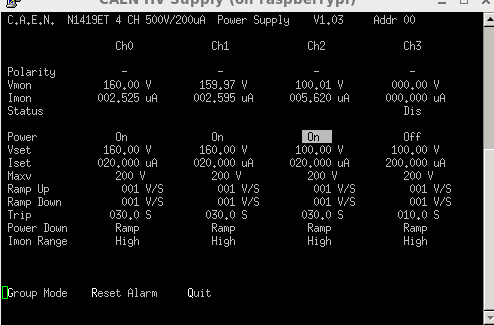
      Bias and leakage currents ok - attachment 11
FPGA and memory check ok


16:10 system check, clock and ADC ok


		 Base 		Current 	Difference
aida05 fault 	 0xc879 : 	 0xc87b : 	 2
aida06 fault 	 0x323c : 	 0x323e : 	 2
aida07 fault 	 0xfb3a : 	 0xfb3f : 	 5
aida08 fault 	 0xd3d6 : 	 0xd3d8 : 	 2
White Rabbit error counter test result: Passed 8, Failed 4

Understand the status reports as follows:-
Status bit 3 : White Rabbit decoder detected an error in the received data
Status bit 2 : Firmware registered WR error, no reload of Timestamp
Status bit 0 : White Rabbit decoder reports uncertain of Timestamp information from WR


      Statistics ok - attachment 12
      Temperatures ok - attachment 13
      Bias and leakage currents ok - attachment 14
FPGA and memory check ok |
| Attachment 1: 210416_0820_Stats.png
|

|
| Attachment 2: 210416_0821_Temp.png
|

|
| Attachment 3: 210416_0824_Bias.png
|
|
| Attachment 4: 210416_1003Stats.png
|

|
| Attachment 5: 210416_1007Temp.png
|

|
| Attachment 6: 210416_1019_voltages.png
|
|
| Attachment 7: 210416_1139_layout2.png
|
|
| Attachment 8: 210416_1207_Leakage.png
|
|
| Attachment 9: 210416_1311_Stats.png
|

|
| Attachment 10: 210416_1312_Temp.png
|

|
| Attachment 11: 210416_1315_Voltages.png
|
|
| Attachment 12: 210416_1412_Voltages.png
|

|
| Attachment 13: 210416_1548_Stats.png
|

|
| Attachment 14: 210416_1553_Temp.png
|

|
|
175
|
Sat Mar 6 06:52:06 2021 |
OH, LS | Saturday 6th March |
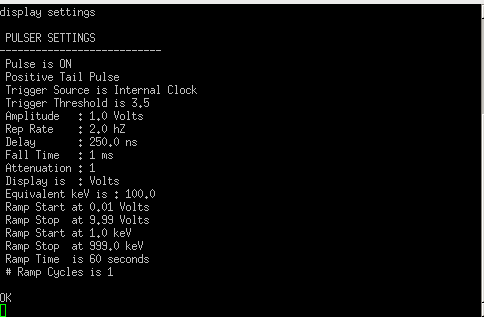
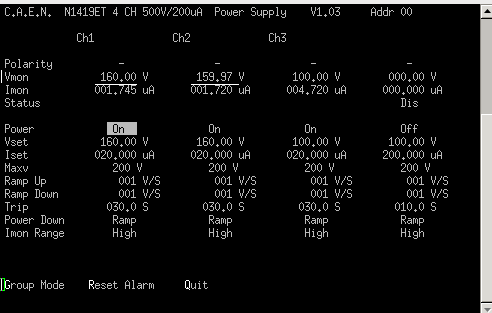
07:50 Pulser settings - attachment 1

07:52 System wide checks all ok
      Statistics ok - attachment 2
      Bias ok - attachment 3

09:30 The intensity of fragments is being increased
      They are trying to do a factor of 10 increase first which should take us to around 100Hz

10:00 System wide checks all ok
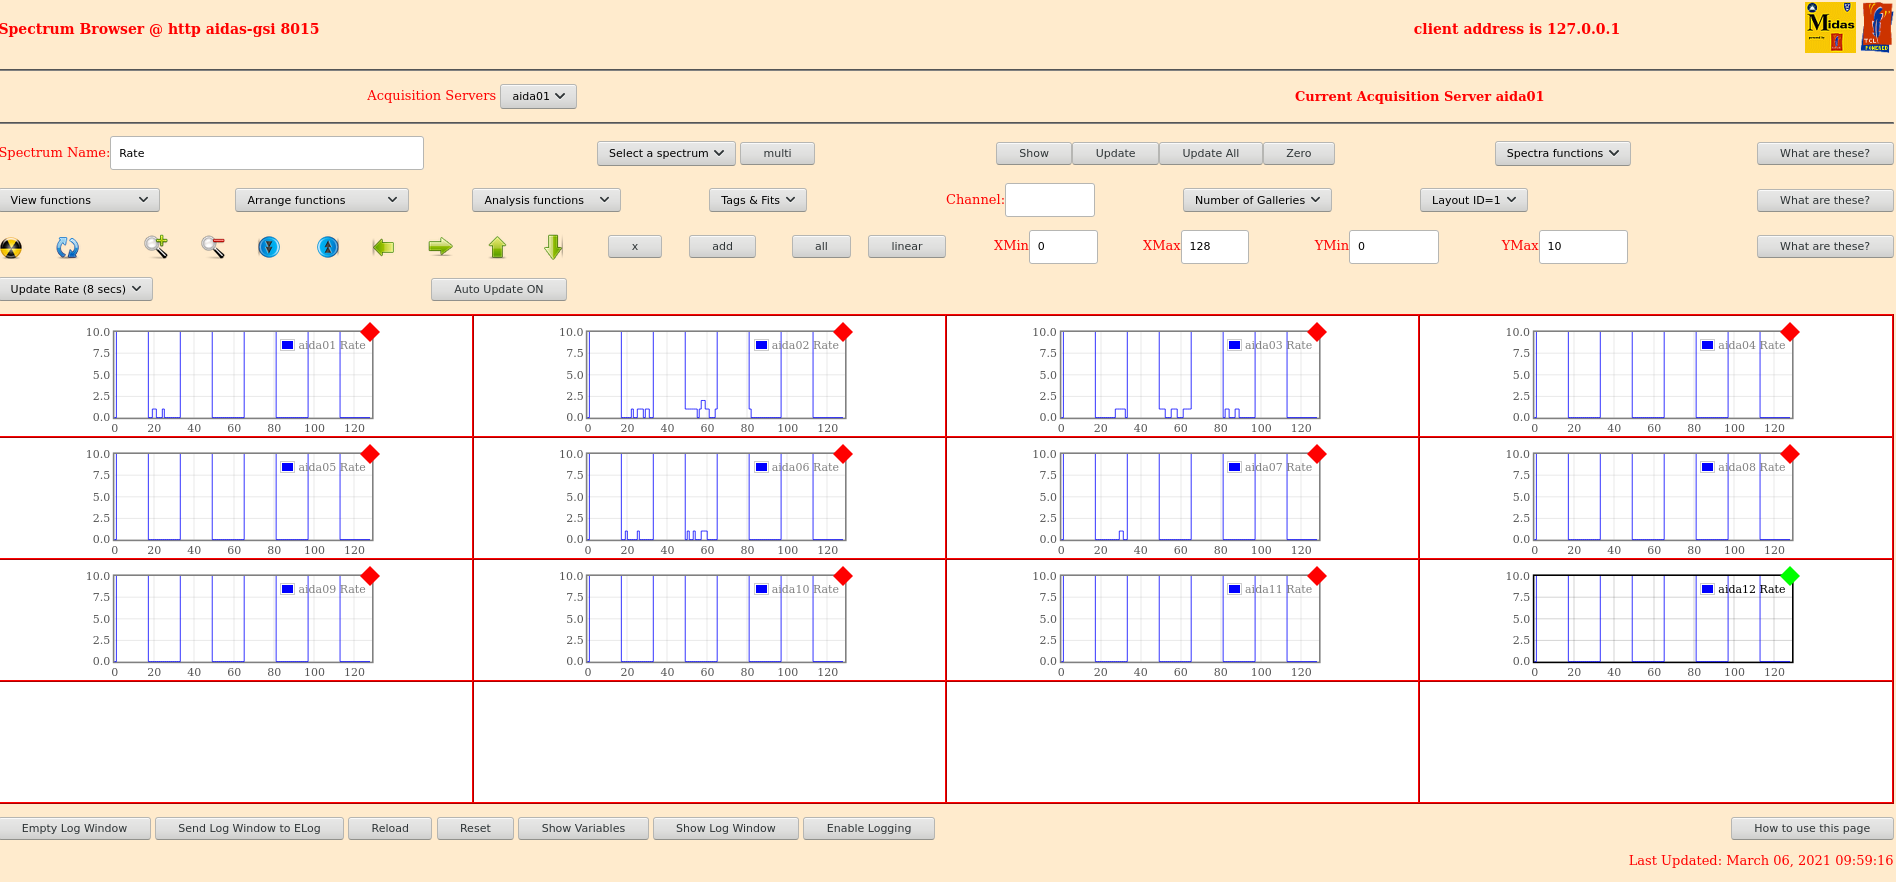
      Statistics - attachment 4
      Layout 1 showing implants - attachment 5
      Fee temperatures ok - attachment 6

12.00 System wide checks all okay, no failures
      Statistics (screenshot7)
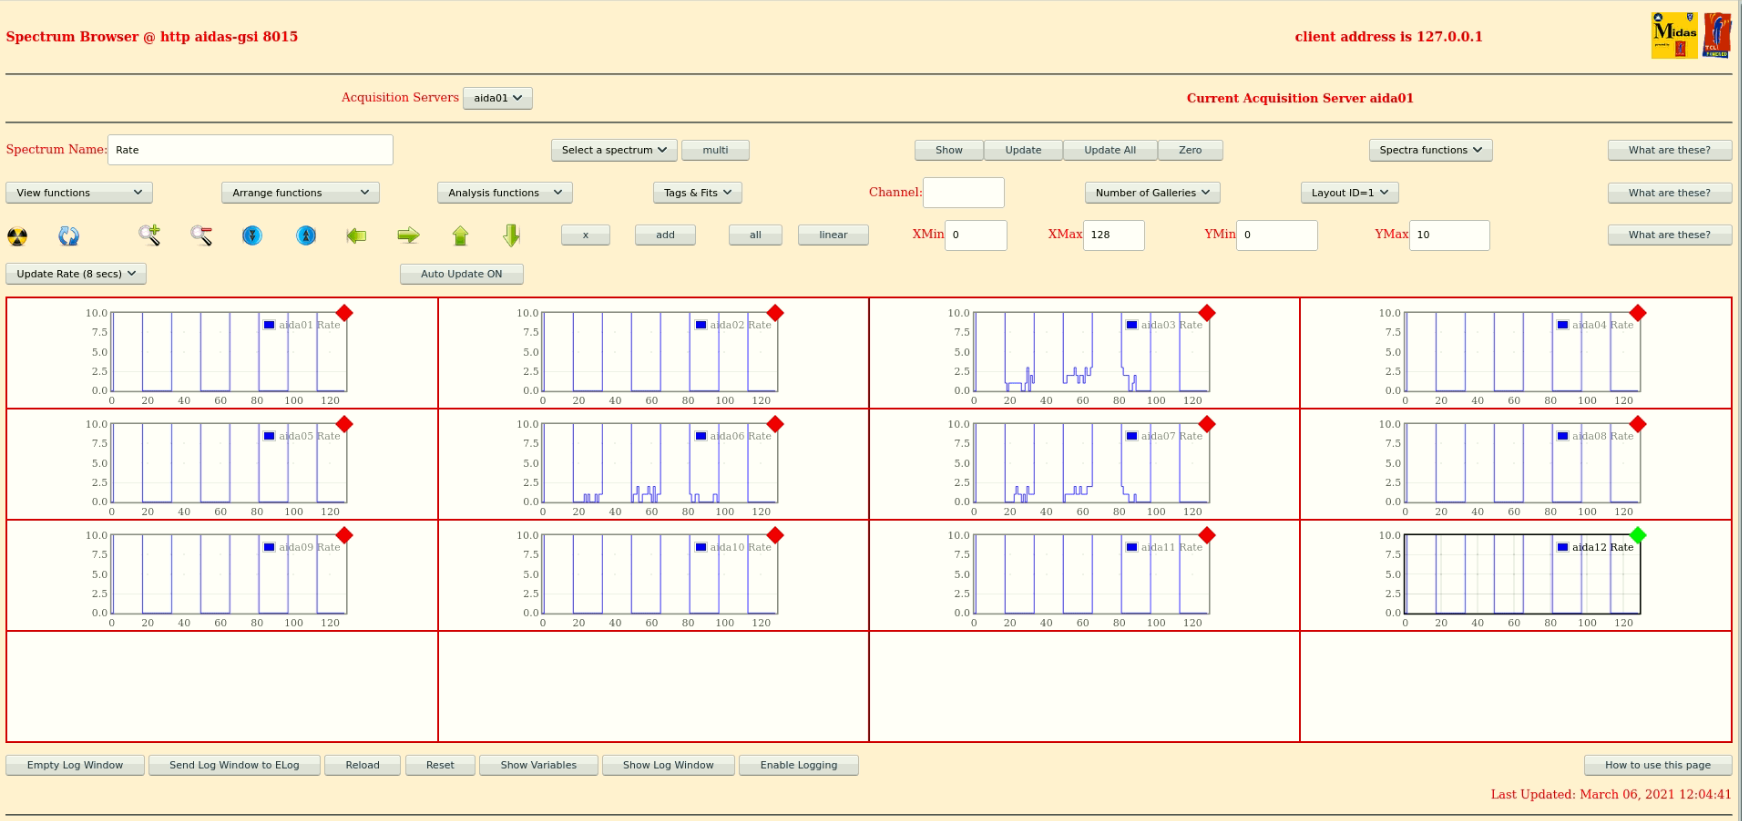
      Spectrum rate (screenshot8)
      FEE temps were normal except AIDA04 had "no response" (screenshot9), reloaded several minutes later seems to read normal
      (screenshot10)
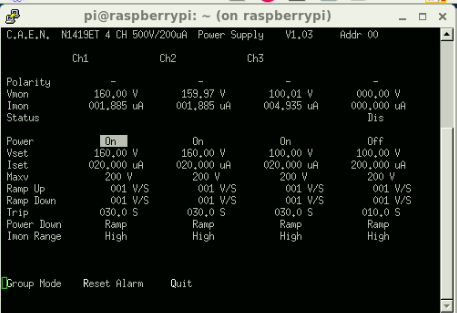
      Leakage currents okay, increase from previous values written to sheets (screenshot12)

      Rechecked FEETemps this time AIDA03 had "no response" (screenshot11), seems this occurs when the reload takes longer
than
      usual, another reload shows all FEE temps as normal.

      Merger and tape server okay

14.00 System wide checks all okay, no failures
      Statistics (screenshot13)
      Spectrum rate (screenshot14)
      FEE temps normal, no issue with reload this time (screenshot15)
      Leakage currents okay still increasing, written to sheets (screenshot16)
      Merger okay ~4.5M items/sec
      Tape server ~4.5Mb/sec

14.50 Beam has been shifted to centre beam more onto AIDA (corresponds to run S452f011)

16.00 System wide checks all okay, no failures
      Statistics (screenshot17)


      Spectrum rate (screenshot18)
      FEE temps normal except AIDA08 "no response" (screenshot19), reload returns to normal (screenshot20)
      Leakage currents added to sheet (screenshot21)
      Merger okay ~4.5M items/sec
      Tape server ~4.5Mb/sec

17.17 no beam, preparing for the 190Ta setting

17:44 OH Takes over
      System wide checks all ok
      Statistics - attachment 22
      Temp ok - Attachment 23
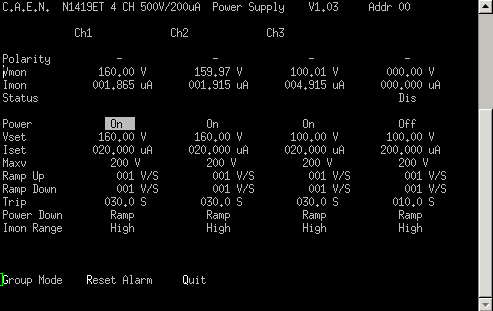
      Bias and leakage currents ok - Attatchment 24

      While MBS was not currently writing data the merger -> tapeserver link was briefly toggle
      The Directory for the experiment was then setup S452
      The merger -> Tapeserver link was then re-enabled and data forwarding to MBS has continued.

      ASIC Check all ok


18:10 Started writing data to file
      File directory S452
      Run number R1_0
      Seems to have skipped a few files First full file R1_10
      Currently writing to /media/SecondDrive/TapeData
      Current free space 4211084180 kB
      Current write speed 46163 kB/s
      Time remaining until full 91222 seconds
      25 hours remaining space

18:34 DESPEC starting new MBS file
      AIDA Currently on file R1_41

19:00 DESPEC Closing file
      AIDA Currently on R1_75

19:05 Comparing last years statistics to this years

FEE	Last year	This year    Factor increase
1	60960	        183111       3.00
2	183494	        201256       1.09
3	91506	        196647       2.15
4	73914	        208290       2.81
5	31979	        63571        1.99
6	54084	        144638       2.67
7	35621	        137605       3.86
8	38626	        95858        2.48
9	264436	        225790       0.85
10	209709	        198896       0.94
11	88443	        133899       1.51
12	183493	        204996       1.12

Sum     1316265	        1994557      1.51

19:22 DESPEC opens a new file (They forgot to mention they were closing the previous file)
      AIDA on R1_104

      Looking int to high write  rate to see if we can do anything to reduce it
      It isn't the correlation scaler as that is coming in at a rate of 16kHz which amounts to around 1.5MB/s - attachment 24

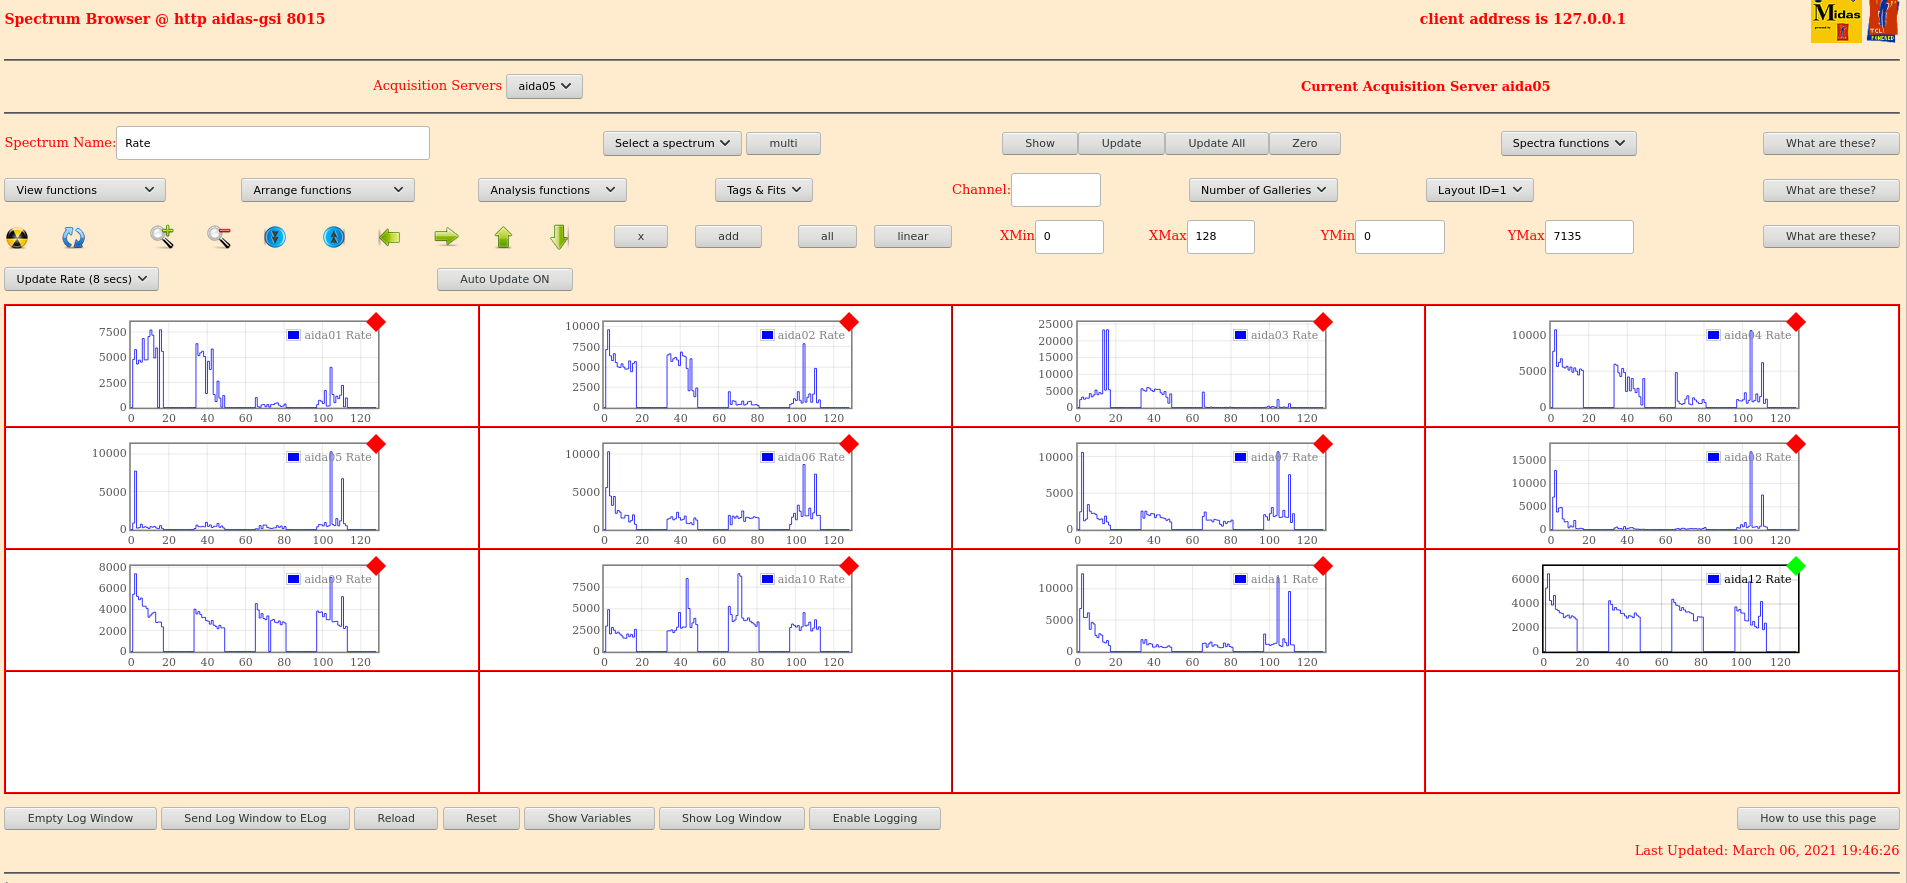
19:46 Much of the rate is coming from a small number of channels - attachment 25

19:17 WR Timestamp error.
      Mentioned to Nic and he said that sometimes small glitches like this are observed
		 Base 		Current 	Difference
aida01 fault 	 0x9e8b : 	 0x9e8d : 	 2
aida02 fault 	 0x9a8f : 	 0x9a91 : 	 2
aida03 fault 	 0x29e9 : 	 0x29eb : 	 2
aida04 fault 	 0x7f66 : 	 0x7f68 : 	 2
aida05 fault 	 0x1f4f : 	 0x1f51 : 	 2
aida06 fault 	 0x8faa : 	 0x8fac : 	 2
aida07 fault 	 0x53f0 : 	 0x53f2 : 	 2
aida08 fault 	 0x7066 : 	 0x7068 : 	 2
White Rabbit error counter test result: Passed 4, Failed 8

Understand the status reports as follows:-
Status bit 3 : White Rabbit decoder detected an error in the received data
Status bit 2 : Firmware registered WR error, no reload of Timestamp
Status bit 0 : White Rabbit decoder reports uncertain of Timestamp information from WR

     All other checks passed

20:52 DESPEC Stopping file
      AIDA on R1_221


20:53 DESPEC Stopped file because UCESB crashed
      AIDA on file R1_237

21:20 All system wide  checks ok
      Statistics DISC info- Attachment 27
      FEE Temp ok - Attachment 28
      Bias and leakage current ok - Attachment 29
      Statistics good events - Attachment 30

20:51 Started compressing data with command nice -n 10 gzip -v R1_*
      Have discussed with Helena and Nic about the potential issues we could run into with the high data rate
      I am not sure if MBS can keep up with this rate
      We are still writing to file though.

23:00 Correlations have been lost with the FRS DAQ and the rest of the DESPEC analysis
23:10 UCESB restarted and correlations have been regained. Verified with the implant-FRS time difference peak at 13us |
| Attachment 1: Pulser.png
|
|
| Attachment 2: 210306_0752_Stats.png
|

|
| Attachment 3: 210306_0754_Bias.png
|
|
| Attachment 4: 210306_0958_Stats.png
|

|
| Attachment 5: 210306_0959_Layout1.png
|
|
| Attachment 6: 210306_1000_Temp.png
|

|
| Attachment 7: 1102_Statistics.PNG
|

|
| Attachment 8: 1102_SpectrumRate.PNG
|
|
| Attachment 9: 1102_FEETemps.PNG
|

|
| Attachment 10: 1102_FEETemps2.PNG
|

|
| Attachment 11: 1102_FEETemps3.PNG
|

|
| Attachment 12: 1102_LeakageCurrents.PNG
|
|
| Attachment 13: 1300_Statistics.PNG
|

|
| Attachment 14: 1300_SpectrumRate.PNG
|

|
| Attachment 15: 1300_FEETemps.PNG
|

|
| Attachment 16: 1300_LeakageCurrents.PNG
|

|
| Attachment 17: 1500_Statistics.PNG
|

|
| Attachment 18: 1500_SpectrumRate.PNG
|

|
| Attachment 19: 1500_FEETemps.PNG
|

|
| Attachment 20: 1500_FEETemps2.PNG
|

|
| Attachment 21: 1500_LeakageCurrents.PNG
|

|
| Attachment 22: 210306_1726_Stats.png
|

|
| Attachment 23: 210306_1747_Temp.png
|

|
| Attachment 24: 210327_1748_Bias.png
|
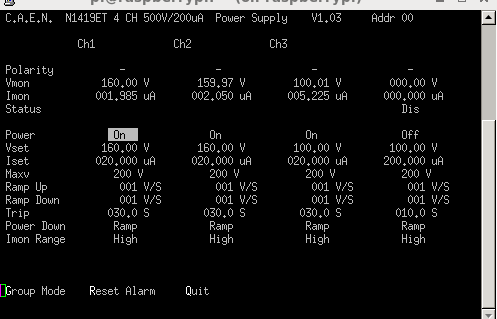
|
| Attachment 25: 210326_1920_MergerStats.png
|

|
| Attachment 26: 210306_1946_Layout1.png
|
|
| Attachment 27: 210306_2120_Stats.png
|

|
| Attachment 28: 210306_2121_Temp.png
|

|
| Attachment 29: 210306_2123_Bias.png
|
|
| Attachment 30: 210326_1920_MergerStats.png
|

|
|
187
|
Wed Mar 10 07:16:02 2021 |
OH, LS | Wednesday 10th March 08:00-24:00 |
08:16 System wide checks all ok
      Statistics - attachment 1
      Temperatures - attachment 2
      bias - attachment 3
      Merger running 4.5e6 events per second
      Tape data writing at 42MB per second

      Currently no beam

09:45 While there is no beam we will perform a longer test of the new merger.
      Run R20 stopped and merger changed to neew version
      Started R21.

      The now usual behaviour of additional files at start of merge observed.
      N.B. That there was no toggling of the merger no storage or tapeserver no storage. Both were running before the DAQ was
set to going
-rw-rw-r--. 1 npg npg  64K Mar 10 09:50 R21_0
-rw-rw-r--. 1 npg npg  64K Mar 10 09:50 R21_1
-rw-rw-r--. 1 npg npg  64K Mar 10 09:50 R21_2
-rw-rw-r--. 1 npg npg  64K Mar 10 09:50 R21_3
-rw-rw-r--. 1 npg npg  64K Mar 10 09:50 R21_4
-rw-rw-r--. 1 npg npg  64K Mar 10 09:50 R21_5
-rw-rw-r--. 1 npg npg  64K Mar 10 09:50 R21_6
-rw-rw-r--. 1 npg npg  64K Mar 10 09:50 R21_7
-rw-rw-r--. 1 npg npg  64K Mar 10 09:50 R21_8
-rw-rw-r--. 1 npg npg  64K Mar 10 09:50 R21_9
-rw-rw-r--. 1 npg npg  64K Mar 10 09:50 R21_10
-rw-rw-r--. 1 npg npg  64K Mar 10 09:50 R21_11
-rw-rw-r--. 1 npg npg  64K Mar 10 09:50 R21_12
-rw-rw-r--. 1 npg npg  64K Mar 10 09:50 R21_13
-rw-rw-r--. 1 npg npg  64K Mar 10 09:50 R21_14
-rw-rw-r--. 1 npg npg  64K Mar 10 09:50 R21_15
-rw-rw-r--. 1 npg npg  64K Mar 10 09:50 R21_16
-rw-rw-r--. 1 npg npg 407M Mar 10 09:50 R21_17
-rw-rw-r--. 1 npg npg 1.6G Mar 10 09:52 R21_18

     TapeData rate of 13280 kB/sec
     No errors observed in ucesb
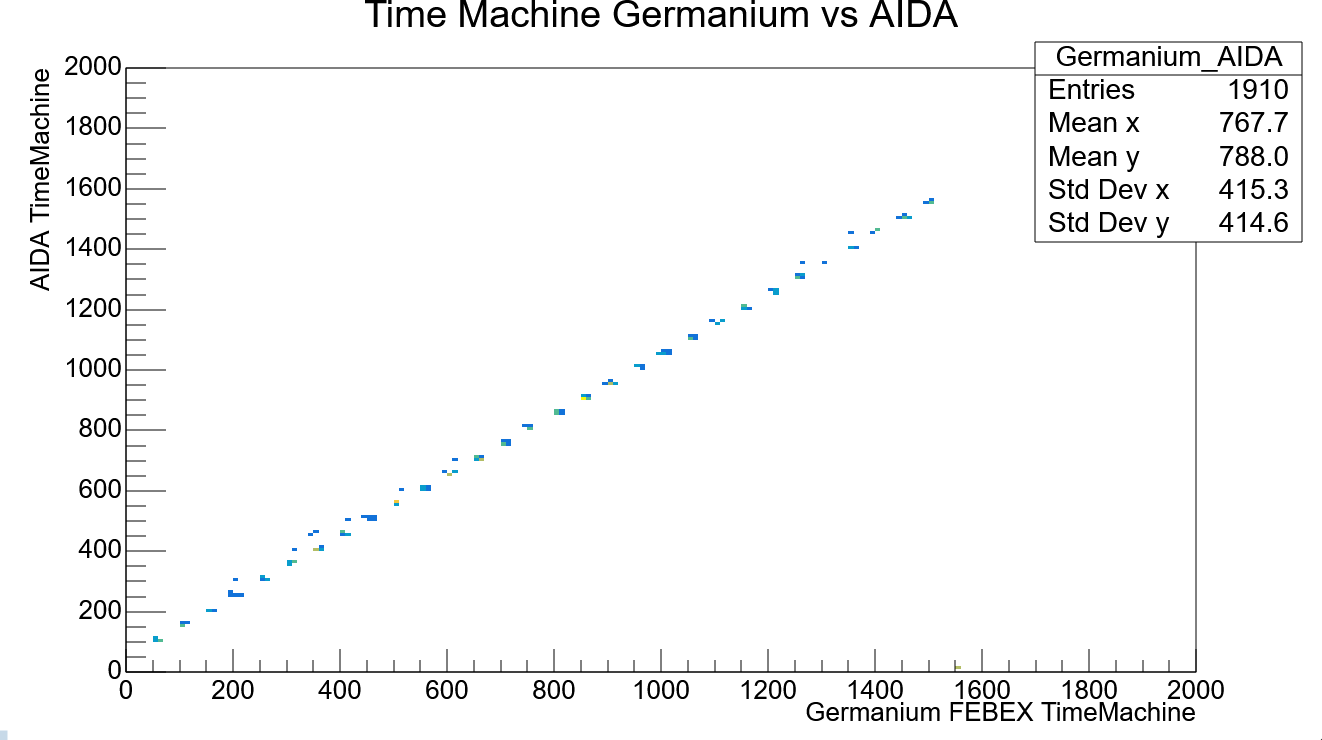
     Correlations seen between time machine in AIDA and Ge in online
     Pulser rate in the online makes sense
     With the current data rate remaining HDD space on current drive will last around 89 hours.

09.20 analysis of file R21_27
      ignore rates/elapsed idle time - timestamp incomplete until first info code 4 & 5 data


10:24 Message while performing system wide checks:
Get returned with an error
error: SOAP http transport timed out after 10000 ms
NONE
error: SOAP http transport timed out after 10000 ms
    while executing
"$transport $procVarName $url $req"
    (procedure "::SOAP::invoke" line 18)
    invoked from within
"::SOAP::invoke ::SOAP::_XAIDAAccessClient__Get 10"
    ("eval" body line 1)
    invoked from within
"eval ::SOAP::invoke ::SOAP::_XAIDAAccessClient__Get $args"
    (procedure "XAIDAAccessClient__Get" line 1)
    invoked from within
"XAIDAAccessClient__Get $Addr"

     aida02 restarted itself during the reset process
     Looking at the log messages on aida02 cannot see any reason for the cause of the restart.
     System wide checks following the restart all ok.
     When restarting the MBS relay errors observed until a timestamp was observed:
     Warning: MBSTimeF = 0; 0x0000000000000000 0x00000000 0x00000000 0x00000000

10:55 Statistics - attachment 5
      Temperature - attachment 6
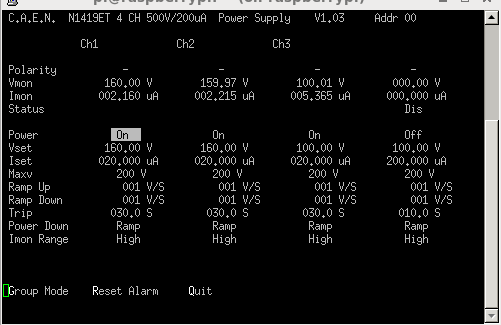
      Bias - attachment 7

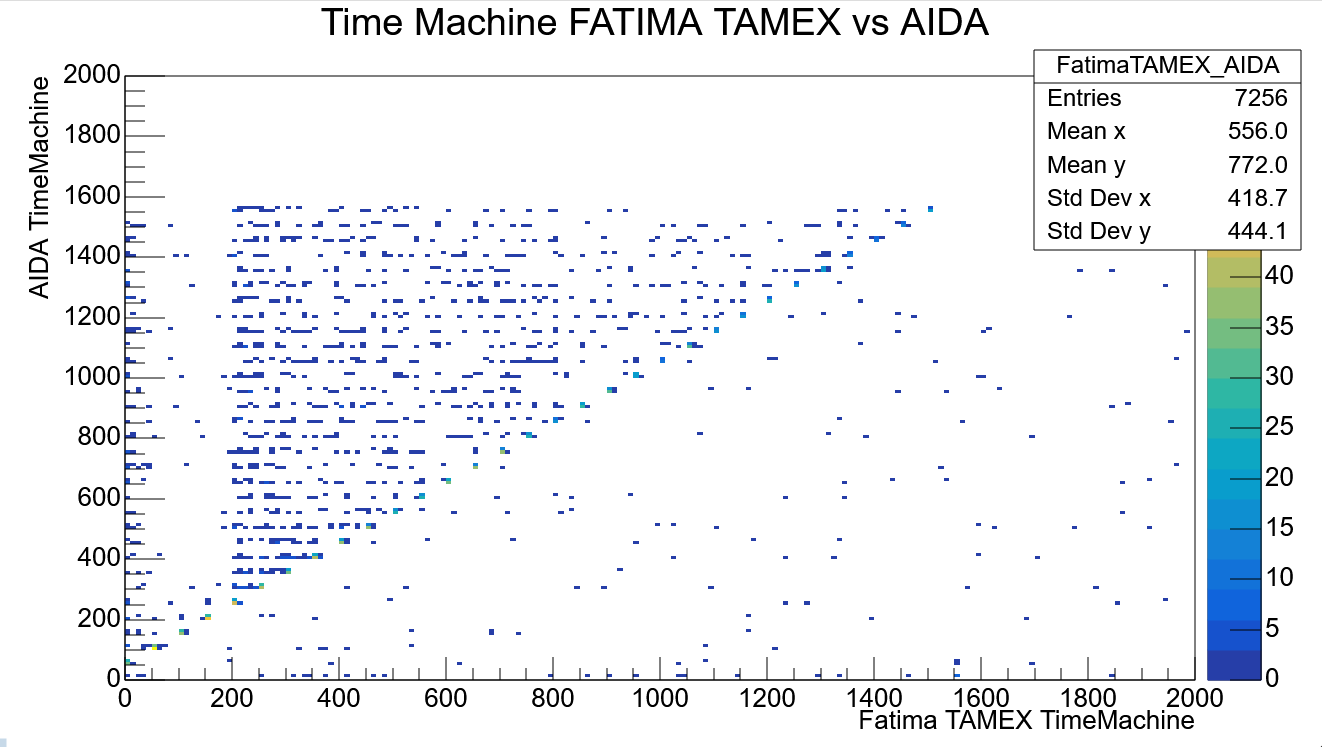
11:03 Time machine correlation spectra with new merger
      AIDA - FATIMA - Attachment 8
      AIDA - Ge - Attachment 9

11:30 An implant rate observed in DSSD2. With no beam. A check of the ASIC control restored the rate to 0. Did not check the
layout to determine which FEE/ASIC caused the events before checking ASIC control

12:12 System wide checks all ok *except adc calibration which is same as before
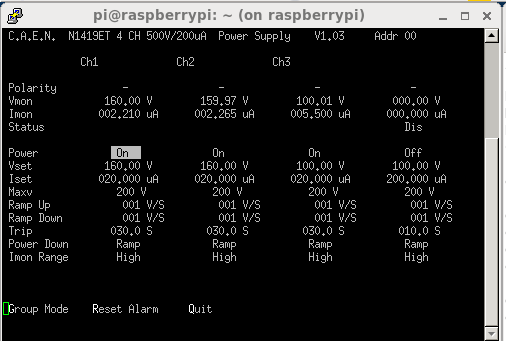
      Statistics - attachment 10
      Temperature - attachment 11
      Bias and leakage currents ok - attachment 12

      A note on the statistics. aida11 has doubled in rate today and aida07 has gone down somewhat.

      After talking with the DESPEC locals. Helena and Juergen entere at S4 at 9:40 German time.
      They stood on the platform but stayed away from the snout, they added two channels to the scope and adjusted the ribbon
cable from the VME scalers.
      Looking at the leakage currents on Grafana at 9:50 German time a fluctuation can be observed in the leakage currents of
DSSD3.

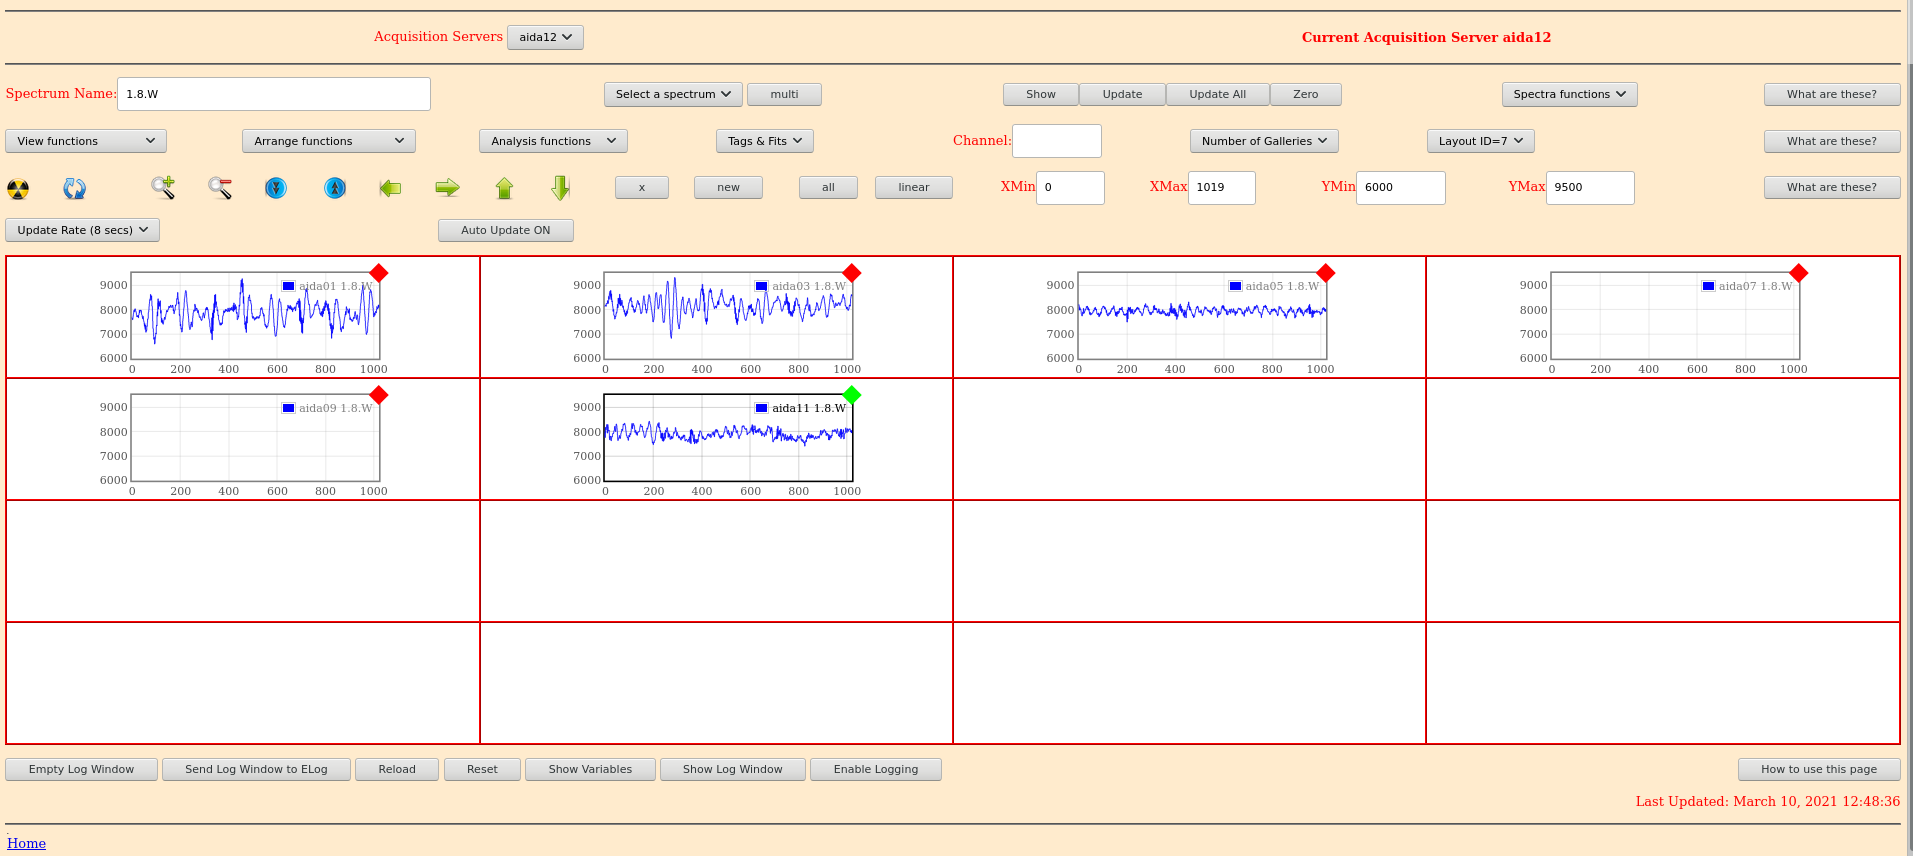
12:50 We have waveforms for some FEES
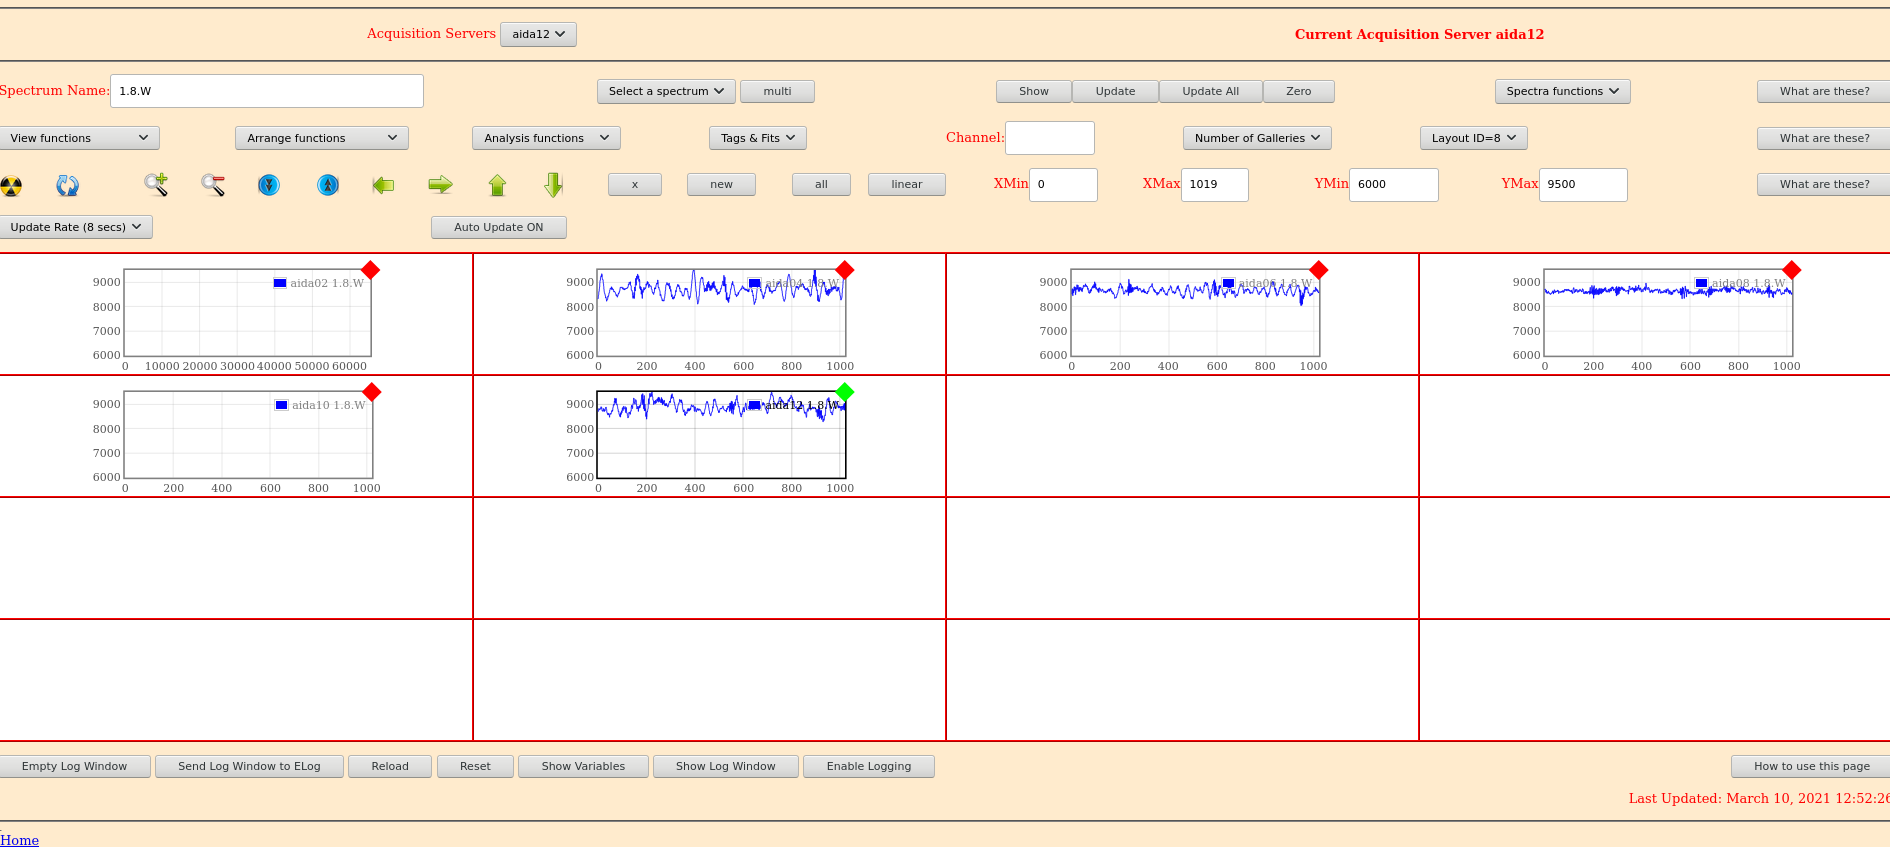
      Layout 7 attachment -14
      Layout 8 - attachment 15

14.00 (LS)
      Still no beam
      System wide checks okay except same as before:
      **FEE64 module aida07 failed
      FEE64 module aida10 failed
      Calibration test result: Passed 10, Failed 2
      If any modules fail calibration , check the clock status and open the FADC Align and Control browser page to rerun
      calibration for that module**

      Statistics (attachment16)
      Checked rate in aida07 and aida11 following Oscars previous comment, last four statistics attachments(1,5,10,16):
      aida07 - 124772, 81773, 95526, 101493 - seems to be increasing back up
      aida11 - 72901, 95942, 176139, 93799 - more than doubled but large drop in rate back below 100k will keep an eye on

      FEE Temps (attachment17)
      Leakage currents written to sheets(attachment18)
      Merger ~ 45M items/s
      TapeServer~ 14MB/s

14.10 While performing checks informed that some beam is back, and they have started a run file (no. S452f113), AIDA on file
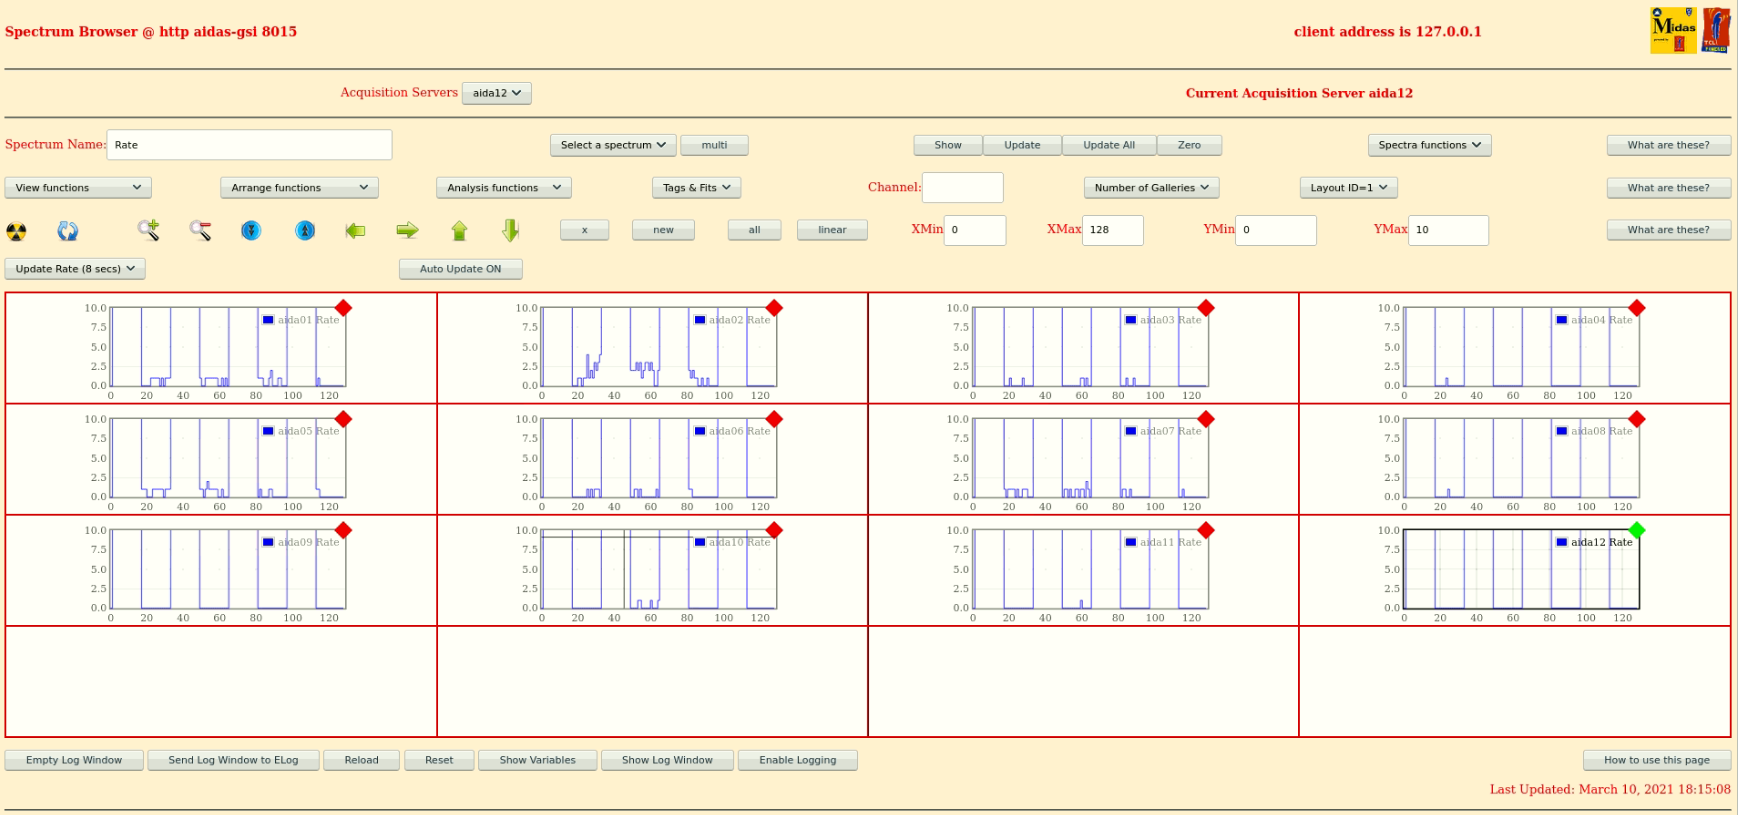
      R22_98, rate spectra attached (attachment19)

14.10 During the meeting errors appeared in ucesb, checked these timestamps with the corresponding AIDA files and saw
      no timewarps so we are not losing anything.
      Restarted MBS relay, errors have not reappeared so far

16.10 System wide checks all okay except aida07 and aida10 fail calibration (same as previous checks)
      Statistics (attachment20)
      Rate spectra (attachment21)
      FEE Temps (attachment22)
      Leakage currents written to sheets(attachment23)
      Merger ~ 4.3M items/s
      TapeServer~ 14MB/s
      Current file R22_148

16.26 Increase rate in AIDA as target slits have been opened wider (attachment24), corresponding to runs starting from
S452f115
      Around R22_150

18.00 Analysis of R22_122 (before slit adjustments think +-3mm) and R22_178 (after slit adjustment to +-5mm)
      Rates of R22_122 (attachment25):
      First DSSSD (fee0-fee3) ~66/s
      Second DSSSD (fee4-fee7) ~49/s
      Third DSSSD (fee8-fee11) ~22/s

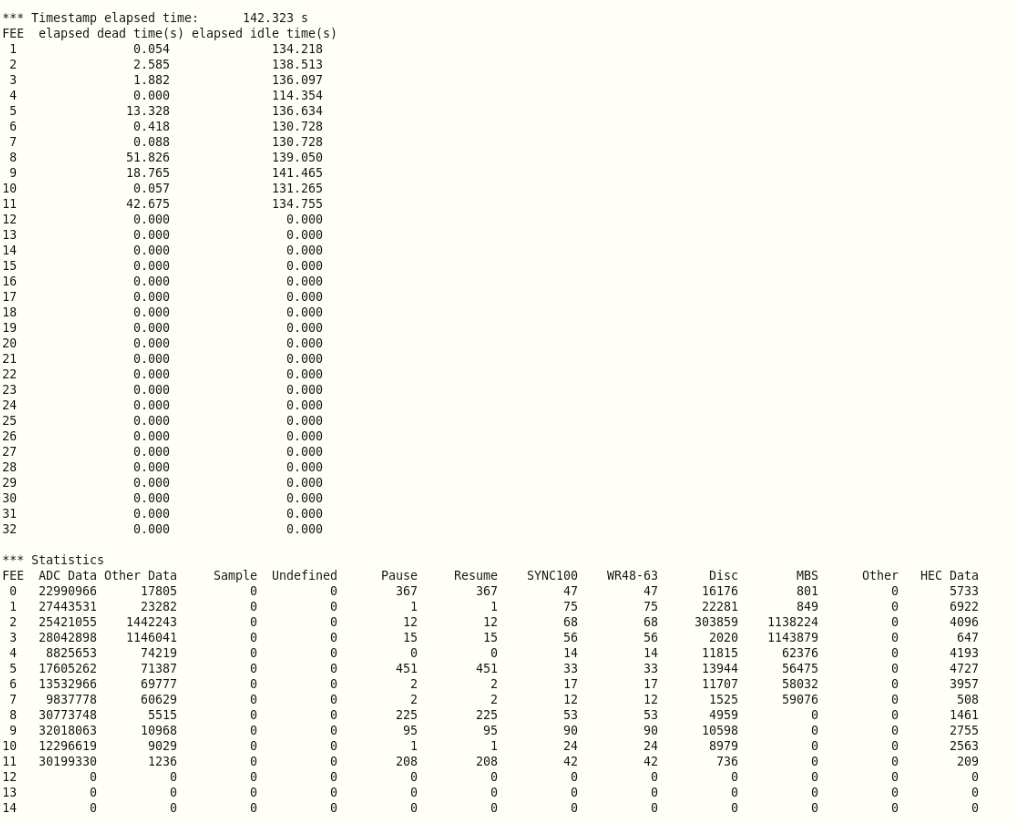
      Rates of R22_178 (attachment26):
      First DSSSD (fee0-fee3) ~122/s
      Second DSSSD (fee4-fee7) ~94/s
      Third DSSSD (fee8-fee11) ~49/s


18.10 System wide checks all okay except aida07 and aida10 fail calibration (same as previous checks)
      Statistics (attachment27)
      Rate spectra (attachment28)
      FEE Temps (attachment29)
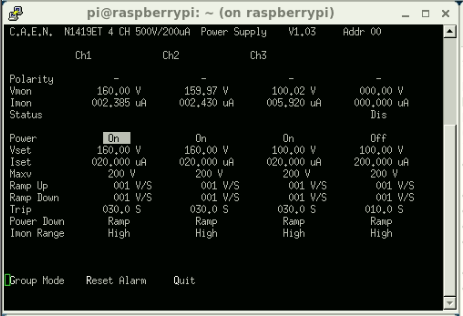
      Leakage currents written to sheets(attachment30), look to be on the way down
      Merger ~ 4.5M items/s
      TapeServer~ 15MB/s

18.24 Several timestamp errors again which also happened earlier (14.10) restarted MBS relay like earlier

19:34 MBS DAQ Crashed
20:00 DAQ is still down. They have Sultan working on it.

20:21 DAQ is back but there are issues with land04 (The raid array data is written to. It was taken out during the lustre
reboot)
      We are borrowing a HDD from the SHIP group

20:30 System wide checks all ok
      Statistics - attachment 31
      Temperature - attachment 32
      Bias - attachment 33

22:10 MBS DAQ has crashed
      Merger terminal is now showing a large number of bad merge events

      It's taken a while but we have managed to get the DAQ back. We had to reset the AIDA MBS.


22:42 System wide checks all ok
      Statistics - attachment 34
      Temperature - Attachment 35
      Bias and leakage currents ok - attachment 36

23:33 System wide checks all ok - attachment 37
      Temperatures - attachment 38
Bias and leakage currents ok - attachment 39 |
| Attachment 1: 210310_0813_Stats.png
|

|
| Attachment 2: 210310_0813_Temp.png
|

|
| Attachment 3: 210310_0714_Bias.png
|

|
| Attachment 4: R21_27
|
*** TDR format 3.3.0 analyser - TD - January 2019
*** ERROR: READ I/O error: 5002
blocks: 32000
ADC data format: 259319480 ( 1687258.2 Hz)
Other data format: 2600520 ( 16920.2 Hz)
Sample trace data format: 0 ( 0.0 Hz)
Undefined format: 0 ( 0.0 Hz)
Other data format type: PAUSE: 1272 ( 8.3 Hz)
RESUME: 1272 ( 8.3 Hz)
SYNC100: 573 ( 3.7 Hz)
WR48-63: 573 ( 3.7 Hz)
FEE64 disc: 302889 ( 1970.7 Hz)
MBS info: 2293941 ( 14925.5 Hz)
Other info: 0 ( 0.0 Hz)
ADC data range bit set: 0 ( 0.0 Hz)
Timewarps: ADC: 0 ( 0.0 Hz)
PAUSE: 0 ( 0.0 Hz)
RESUME: 0 ( 0.0 Hz)
SYNC100: 0 ( 0.0 Hz)
WR48-63: 0 ( 0.0 Hz)
FEE64 disc: 0 ( 0.0 Hz)
MBS info: 0 ( 0.0 Hz)
Undefined: 0 ( 0.0 Hz)
Sample trace: 0 ( 0.0 Hz)
*** Timestamp elapsed time: 153.693 s
FEE elapsed dead time(s) elapsed idle time(s)
1 0.000 150.055
2 0.129 153.277
3 1.695 152.203
4 0.000 97.174
5 15.630 152.471
6 0.533 122.407
7 0.048 144.955
8 17.221 151.934
9 26.571 143.076
10 0.063 148.982
11 11.592 141.197
12 0.000 0.000
13 0.000 0.000
14 0.000 0.000
15 0.000 0.000
16 0.000 0.000
17 0.000 0.000
18 0.000 0.000
19 0.000 0.000
20 0.000 0.000
21 0.000 0.000
22 0.000 0.000
23 0.000 0.000
24 0.000 0.000
25 0.000 0.000
26 0.000 0.000
27 0.000 0.000
28 0.000 0.000
29 0.000 0.000
30 0.000 0.000
31 0.000 0.000
32 0.000 0.000
*** Statistics
FEE ADC Data Other Data Sample Undefined Pause Resume SYNC100 WR48-63 Disc MBS Other HEC Data
0 20482535 1736 0 0 381 381 52 52 0 870 0 0
1 26566394 1030 0 0 0 0 56 56 0 918 0 0
2 26980761 1455064 0 0 2 2 87 87 302889 1151997 0 0
3 26884821 1140284 0 0 5 5 65 65 0 1140144 0 0
4 7516935 23 0 0 0 0 7 7 0 9 0 0
5 16098094 1219 0 0 577 577 31 31 0 3 0 0
6 9441595 40 0 0 2 2 18 18 0 0 0 0
7 8769482 38 0 0 2 2 17 17 0 0 0 0
8 32618578 336 0 0 98 98 70 70 0 0 0 0
9 32790396 426 0 0 136 136 77 77 0 0 0 0
10 16087963 82 0 0 1 1 40 40 0 0 0 0
11 35081926 242 0 0 68 68 53 53 0 0 0 0
12 0 0 0 0 0 0 0 0 0 0 0 0
13 0 0 0 0 0 0 0 0 0 0 0 0
14 0 0 0 0 0 0 0 0 0 0 0 0
15 0 0 0 0 0 0 0 0 0 0 0 0
16 0 0 0 0 0 0 0 0 0 0 0 0
17 0 0 0 0 0 0 0 0 0 0 0 0
18 0 0 0 0 0 0 0 0 0 0 0 0
19 0 0 0 0 0 0 0 0 0 0 0 0
20 0 0 0 0 0 0 0 0 0 0 0 0
21 0 0 0 0 0 0 0 0 0 0 0 0
22 0 0 0 0 0 0 0 0 0 0 0 0
23 0 0 0 0 0 0 0 0 0 0 0 0
24 0 0 0 0 0 0 0 0 0 0 0 0
25 0 0 0 0 0 0 0 0 0 0 0 0
26 0 0 0 0 0 0 0 0 0 0 0 0
27 0 0 0 0 0 0 0 0 0 0 0 0
28 0 0 0 0 0 0 0 0 0 0 0 0
29 0 0 0 0 0 0 0 0 0 0 0 0
30 0 0 0 0 0 0 0 0 0 0 0 0
31 0 0 0 0 0 0 0 0 0 0 0 0
32 0 0 0 0 0 0 0 0 0 0 0 0
*** Timewarps
FEE ADC Pause Resume SYNC100 WR48-63 Disc MBS Undefined Samples
0 0 0 0 0 0 0 0 0 0
1 0 0 0 0 0 0 0 0 0
2 0 0 0 0 0 0 0 0 0
3 0 0 0 0 0 0 0 0 0
4 0 0 0 0 0 0 0 0 0
5 0 0 0 0 0 0 0 0 0
6 0 0 0 0 0 0 0 0 0
7 0 0 0 0 0 0 0 0 0
8 0 0 0 0 0 0 0 0 0
9 0 0 0 0 0 0 0 0 0
10 0 0 0 0 0 0 0 0 0
11 0 0 0 0 0 0 0 0 0
12 0 0 0 0 0 0 0 0 0
13 0 0 0 0 0 0 0 0 0
14 0 0 0 0 0 0 0 0 0
15 0 0 0 0 0 0 0 0 0
16 0 0 0 0 0 0 0 0 0
17 0 0 0 0 0 0 0 0 0
18 0 0 0 0 0 0 0 0 0
19 0 0 0 0 0 0 0 0 0
20 0 0 0 0 0 0 0 0 0
21 0 0 0 0 0 0 0 0 0
22 0 0 0 0 0 0 0 0 0
23 0 0 0 0 0 0 0 0 0
24 0 0 0 0 0 0 0 0 0
25 0 0 0 0 0 0 0 0 0
26 0 0 0 0 0 0 0 0 0
27 0 0 0 0 0 0 0 0 0
28 0 0 0 0 0 0 0 0 0
29 0 0 0 0 0 0 0 0 0
30 0 0 0 0 0 0 0 0 0
31 0 0 0 0 0 0 0 0 0
32 0 0 0 0 0 0 0 0 0
*** Program elapsed time:37059.496s ( 0.863 blocks/s, 0.054 Mb/s)
|
| Attachment 5: 210310_1054_Stats.png
|

|
| Attachment 6: 210310_1055_Temp.png
|

|
| Attachment 7: 210310_1055_Bias.png
|
|
| Attachment 8: AIDA_Fatima_Correlation.PNG
|
|
| Attachment 9: AIDA_Ge_Correlation.PNG
|
|
| Attachment 10: 210310_1210_Stats.png
|

|
| Attachment 11: 210310_1211_Temp.png
|

|
| Attachment 12: 210310_1212_Bias.png
|
|
| Attachment 13: AIDA_leakage.PNG
|

|
| Attachment 14: 210310_1348_Layout7.png
|
|
| Attachment 15: 210310_1252_Layout8.png
|
|
| Attachment 16: 1400_Statistics.PNG
|

|
| Attachment 17: 1400_FEETemps.PNG
|

|
| Attachment 18: 1400_LeakageCurrents.PNG
|

|
| Attachment 19: 1400_SpectraRate.PNG
|

|
| Attachment 20: 1600_Statistics.PNG
|

|
| Attachment 21: 1600_SpectraRate.PNG
|
|
| Attachment 22: 1600_FEETemps.PNG
|

|
| Attachment 23: 1600_LeakageCurrents.PNG
|
|
| Attachment 24: 1640_SpectraRate.PNG
|

|
| Attachment 25: 1700_R22_122_Rates.PNG
|

|
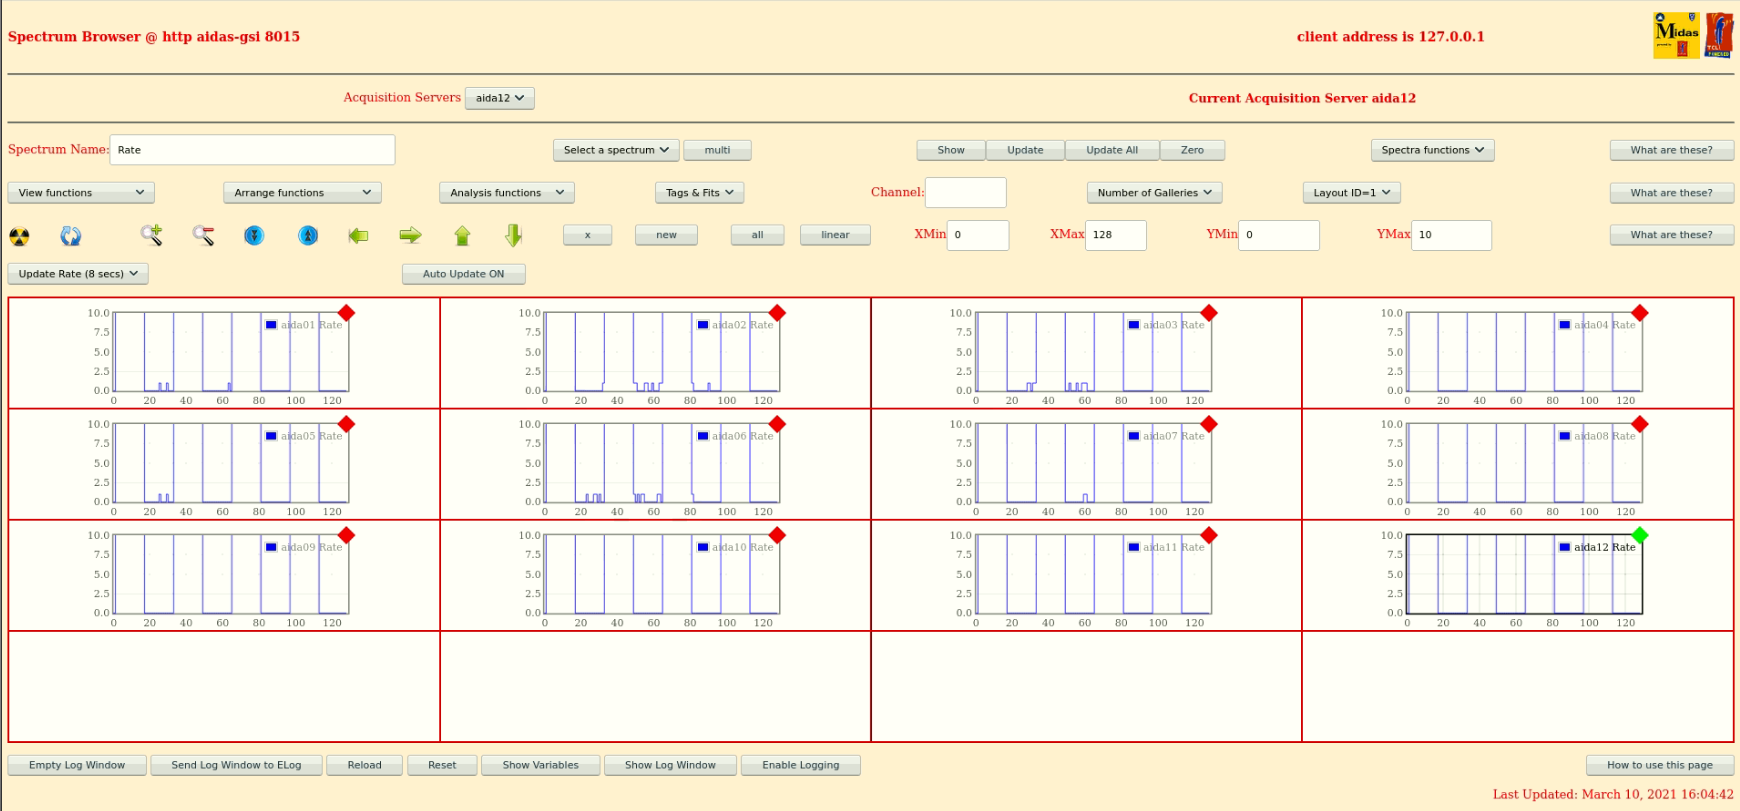
| Attachment 26: 1700_R22_178_Rates.PNG
|
|
| Attachment 27: 1800_Statistics.PNG
|

|
| Attachment 28: 1800_SpectraRate.PNG
|
|
| Attachment 29: 1800_FEETemps.PNG
|

|
| Attachment 30: 1800_LeakageCurrents.PNG
|

|
| Attachment 31: 210310_2039_Stats.png
|

|
| Attachment 32: 210310_2040_Temp.png
|

|
| Attachment 33: 210310_2041_Bias.png
|

|
| Attachment 34: 210310_2241_Stats.png
|

|
| Attachment 35: 210310_2241_Temp.png
|

|
| Attachment 36: 210310_2242_Bias.png
|

|
| Attachment 37: 210310_2331_Stats.png
|

|
| Attachment 38: 210310_2332_Temp.png
|

|
| Attachment 39: 210310_2333_Bias.png
|

|
|
189
|
Thu Mar 11 07:09:25 2021 |
OH, LS | Thursday 11th of March |
08:00 System wide checks all ok *exctept aida07 and 10 on ADC calibration
      N.B. wrong date given to the screenshots by accident (It's early)
      Statistics - attachment 1
      FEE temperatures (AIDA10 unavailable) - attachment 2
      FEE temperature - attachment 3
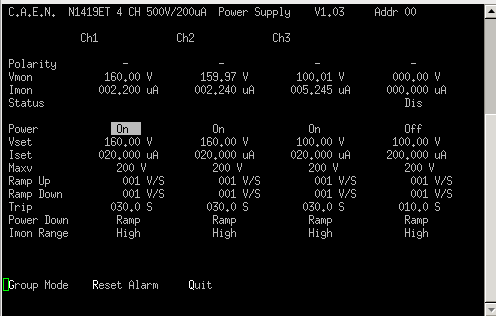
      Bias and leakage currents ok - attachment 4

08:34 The FRS stopped receiving ions. AIDA crashed simultaneously with it.
      Have now recovered AIDA daq - Looking at the messages log AIDA04 restarted itself.
      Restarted but no stats in aida04
      It did not recover from a reset
      Telnet in and did a reboot command

09:10 Finally recovered issue was it was not linking to merger
      There is an options issue with aida12. The ASIC settings had become undefined and there are no histograms
      Manually set the ASIC settings for aida12. Rates look as expected after
      Will try to reset once beam is back


10:12 Problem with the DAQ so stopping AIDA while they work will switch MBS relay out to new version
      Analysis of R30_21 looks fine

10:38 System wide checks ok
      Statistics - attachment 5
      Temperature - attachment 6
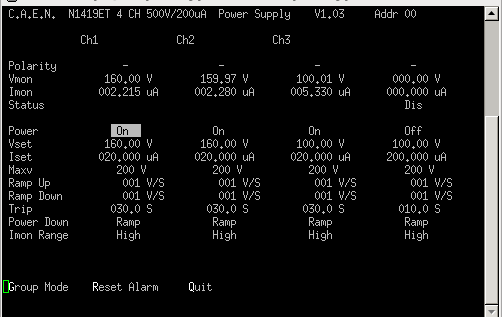
      Bias and leakage - attachment 7

12.10 (LS)
      System wide checks all okay, no fails
      Statistics (attachment8)
      Rate spectra (attachment9)
      FEE temps (attament10)
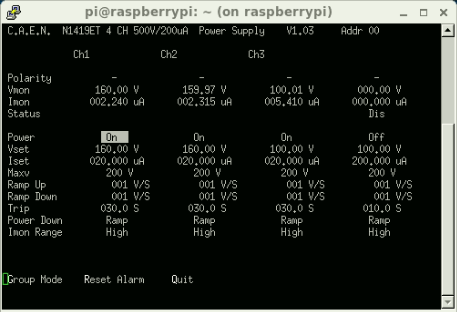
      Leakage currents written to sheet (attachment11)
      Merger ~45M items/s
      Tapeserver ~14MB/s

13.45 no beam (around file R30_98)

14.00 System wide checks all okay, no fails
      Statistics (attachment12)
      FEE temps (attament13)
      Leakage currents written to sheet (attachment14)
      Merger ~44M items/s
      Tapeserver ~14MB/s
      Beam still down

14.11 beam back aida file R30_112

14.13 beam back down,  back at 14.16

14.20 no beam

14.23 notice some timestamp error in ucesb 37 minutes ago (about R30_102) no errors appeared on the MBS relay terminal,
      double by analysing R30_101,102,103 no timewarps
      beam is back but low intensity at the moment

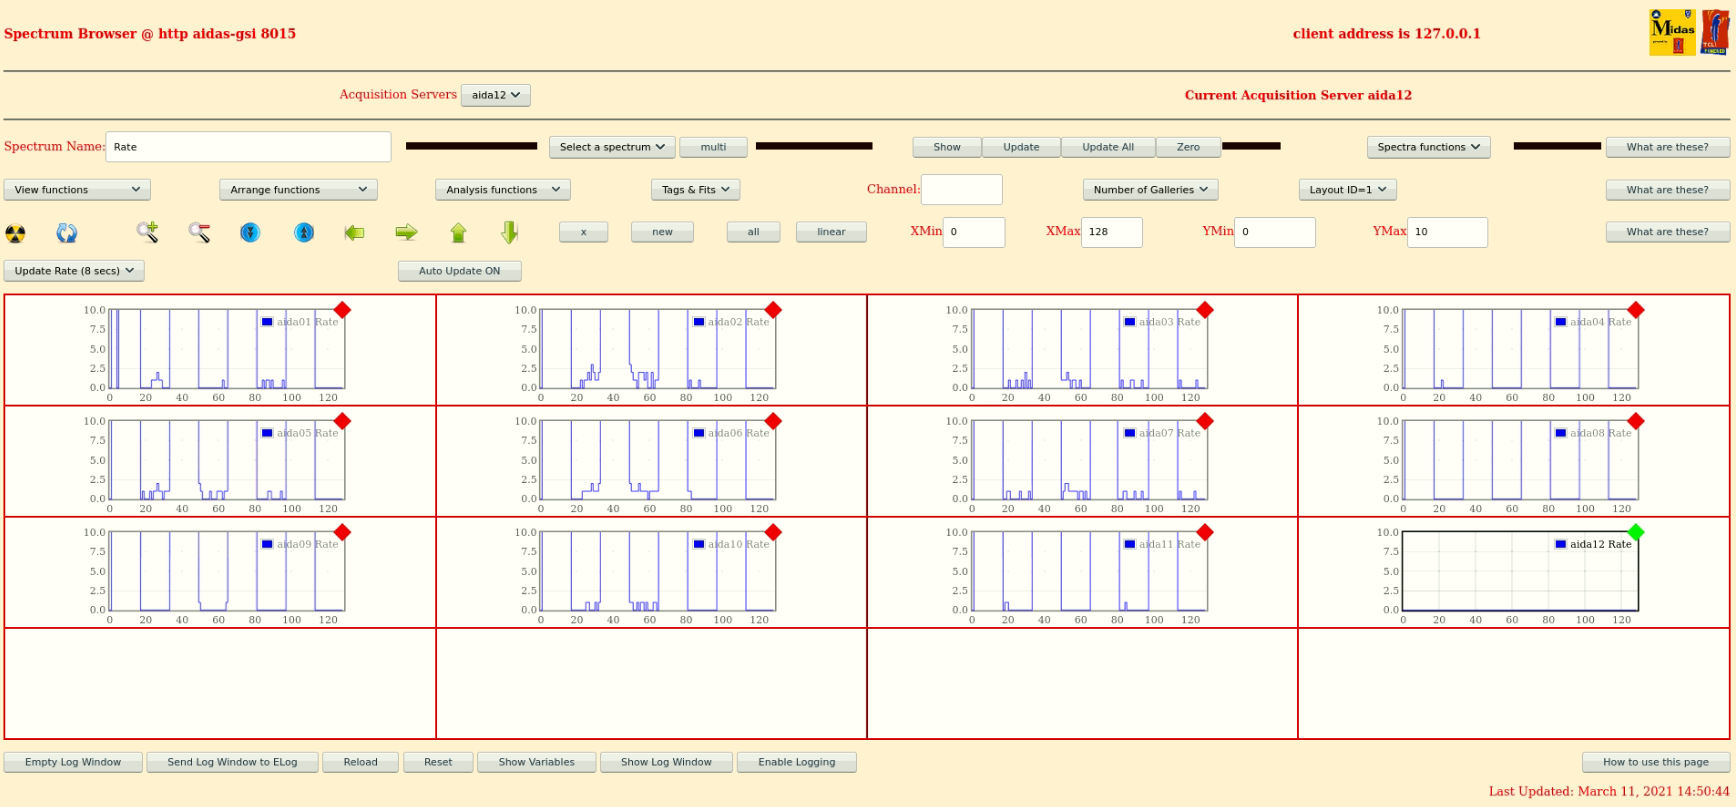
14.46 beam looks to be back at a higher intensity now R30_127 (attachment15)

16.00 System wide checks all okay, no fails
      Statistics (attachment16)
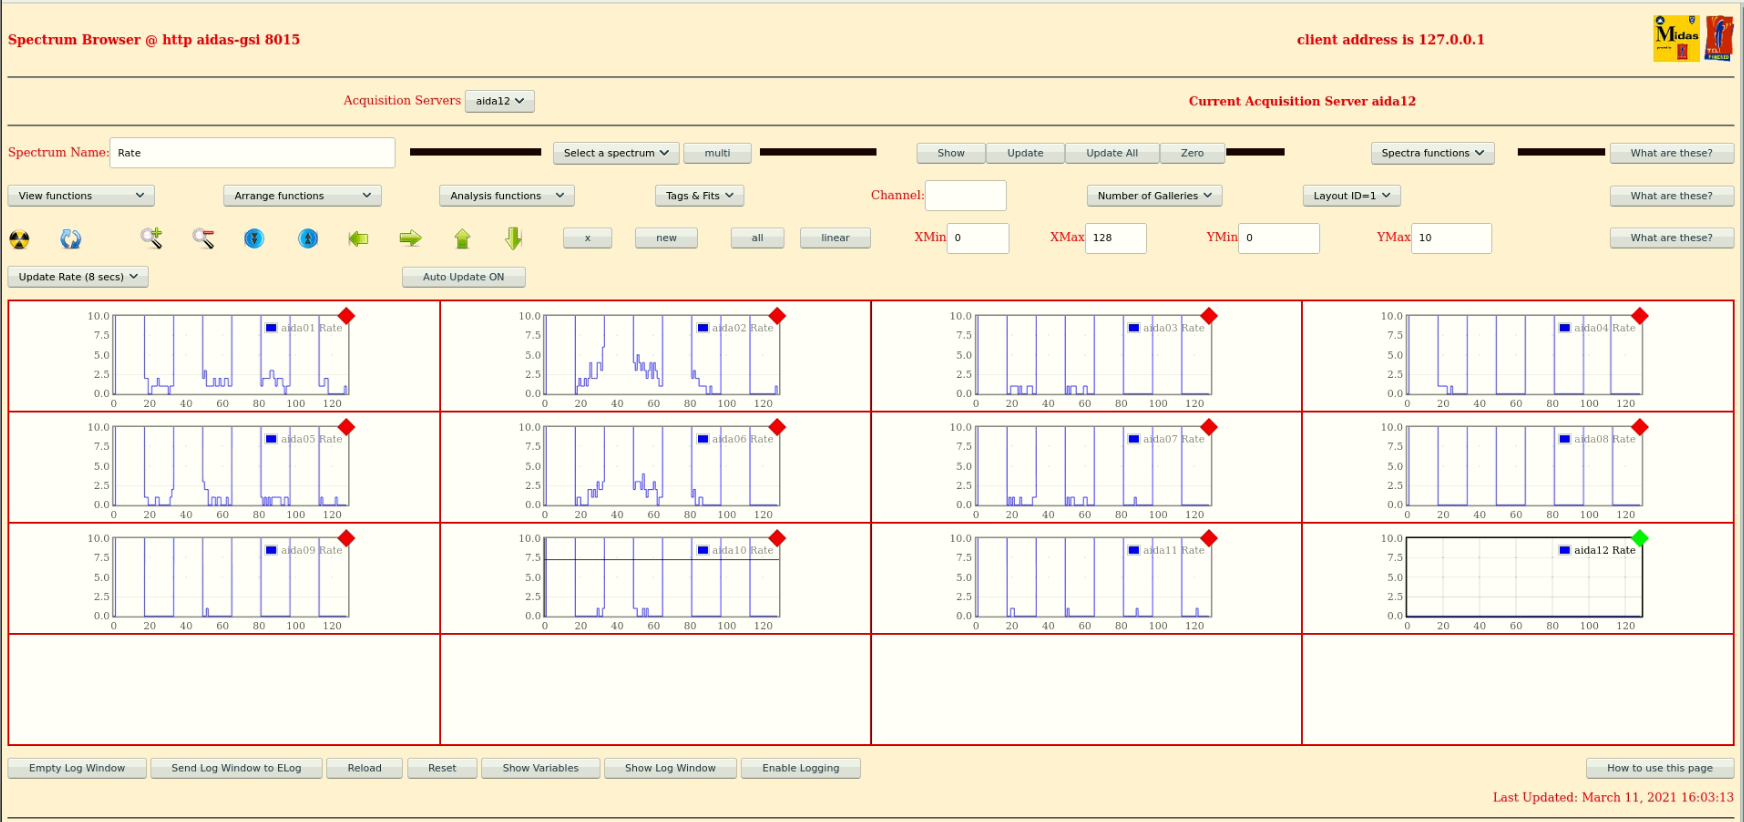
      Rate spectra (attachment17)
      FEE temps (attament18)
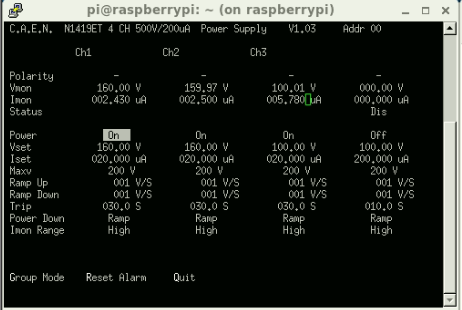
      Leakage currents written to sheet (attachment19)
      Merger ~45M items/s
      Tapeserver ~14MB/s

18.00 System wide checks all okay, no fails
      Statistics (attachment20)
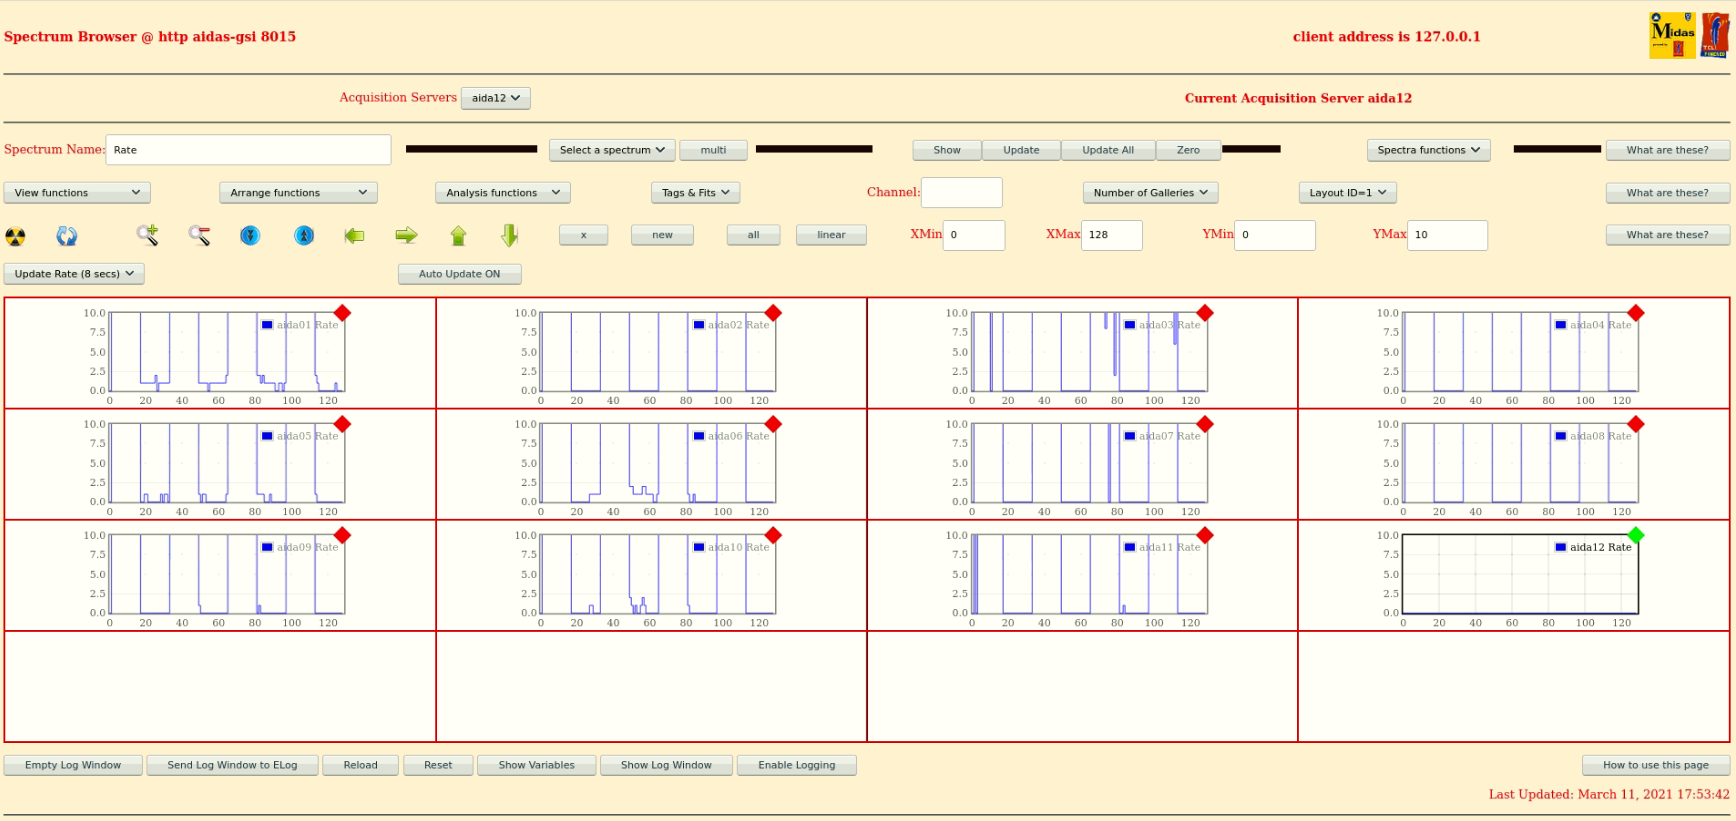
      Rate spectra (attachment21)
      FEE temps (attament22)
      Leakage currents written to sheet (attachment23)
      Merger ~45M items/s
      Tapeserver ~15MB/s

      bunch of timewarp errors in ucesb, no errors in MBS relay terminal though
      now see error in MBS relay!
      "Warning: At least one MIDAS block missed in relay" Warning was set up by NH and OH to detect if the LSB of the first ADC data item in a block is less than the LAST LSB of the previous data block. It then iterates the info code 4 and if needed 5 stored before resetting the LSB stored.
      It triggered 63 times.
      I have checked all the files in the vicinity and there are no timewarps in the MIDAS data visible to TD's analyser

19:10 MBS DAQ stopped to allow FRS tests

19:38 MBS DAQ is back

20:15 Aida07 fails FPGA check
			 Base 		Current 		Difference
aida07 fault 	 0x0 : 	 0x1 : 	 1
FPGA Timestamp error counter test result: Passed 11, Failed 1
If any of these counts are reported as in error
The ASIC readout system has detected a timeslip.
That is the timestamp read from the time FIFO is not younger than the last

      All other system wide checks ok
      Statistics - attachment 24 (Again ignore the year in the filename)
      Temperatures - attachment 25
      Bias and leakage currents - 26

21:36 They are resetting the time sorter due to FATIMA issues

22:38 System wide checks error on WR in addition to the previous FPGA error
		 Base 		Current 	Difference
aida05 fault 	 0x5cc9 : 	 0x5cca : 	 1
aida06 fault 	 0xde76 : 	 0xde77 : 	 1
aida07 fault 	 0xa566 : 	 0xa567 : 	 1
aida08 fault 	 0x6ab0 : 	 0x6ab1 : 	 1
White Rabbit error counter test result: Passed 8, Failed 4
      Statistics - attachment 27
      Temperature - attachment 28
      Bias and leakage current - attachment 29

23:02 We still see timewarp errors in the ucesb. With our changes to the relay we can confirm that the WR headers in the MBS relay are time ordered. The issue must be downstream in the MBS chain. |
| Attachment 1: 210310_0805_Stats.png
|

|
| Attachment 2: 210310_0806_Temp.png
|

|
| Attachment 3: 210310_0806_Temp2.png
|

|
| Attachment 4: 210310_0808_Bias.png
|
|
| Attachment 5: 210311_1039_Stats.png
|

|
| Attachment 6: 210311_1039_Temp.png
|

|
| Attachment 7: 210311_1041_Bias.png
|
|
| Attachment 8: 1200_Statistics.PNG
|

|
| Attachment 9: 1200_SpectraRate.PNG
|

|
| Attachment 10: 1200_FEETemps.PNG
|

|
| Attachment 11: 1200_LeakageCurrents.PNG
|
|
| Attachment 12: 1400_Statistics.PNG
|

|
| Attachment 13: 1400_FEETemps.PNG
|

|
| Attachment 14: 1400_LeakageCurrents.PNG
|

|
| Attachment 15: 1450_SpectraRate.PNG
|
|
| Attachment 16: 1600_Statistics.PNG
|

|
| Attachment 17: 1600_SpectraRate.PNG
|
|
| Attachment 18: 1600_FEETemps.PNG
|

|
| Attachment 19: 1600_LeakageCurrents.PNG
|
|
| Attachment 20: 1800_Statistics.PNG
|

|
| Attachment 21: 1800_SpectraRate.PNG
|
|
| Attachment 22: 1800_FEETemps.PNG
|

|
| Attachment 23: 1800_LeakageCurrents.PNG
|
|
| Attachment 24: 200311_2014_Stats.png
|

|
| Attachment 25: 200311_2014_Temp.png
|

|
| Attachment 26: 210311_2017_Bias.png
|

|
| Attachment 27: 210311_2225_sTATS.png
|

|
| Attachment 28: 210311_2226_Temp.png
|

|
| Attachment 29: 210311_2227_Bias.png
|

|
|
144
|
Thu Mar 12 08:04:24 2020 |
OH, CA, TD | Thursday 12th March 08:00-16:00 |
ASIC settings 2019Oct31-13.24.23
     slow comparator 0xa

BNC PB-5 pulser
     amplitude 1.0V , attenuator x1
     frequency 2Hz
     decay time 1ms

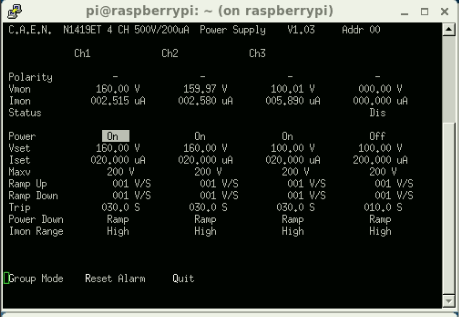
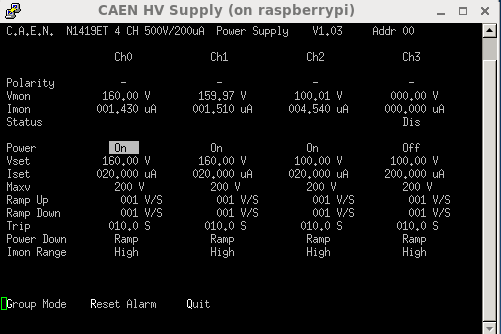
09:00 Bias and leakage currents ok - attachment 1
      Statistics ok - attachment 2
      FEE temperatures ok - attachment 3
      System wide checks all ok

09:08 No beam, not sure exactly how long it has been down.
      FRS team are working on it

09:28 still no beam. issues with SIS.
      DAQ set to NoStorage mode
      most recent file R7_522

10.27 beam is back
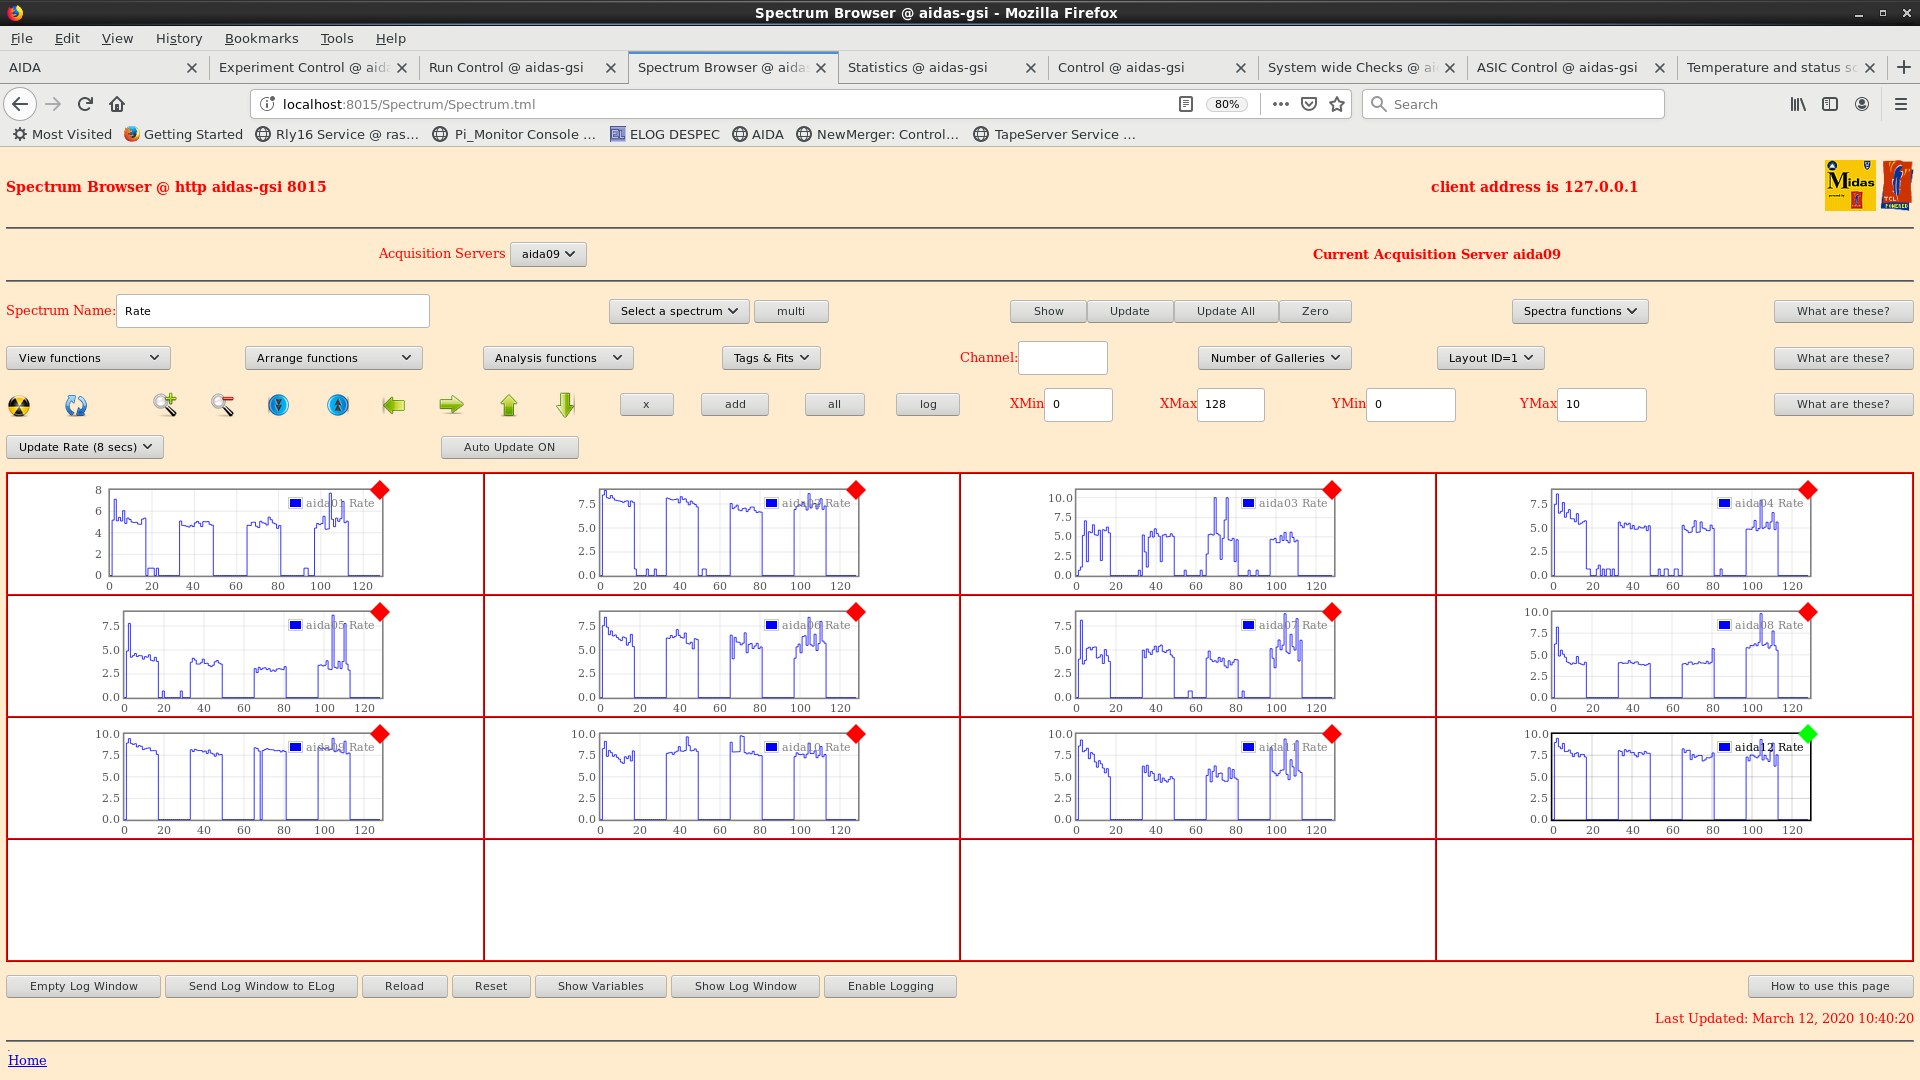
      writing to file R9_0

10.43 attachment 4 - hit rate spectra

11:09 all system wide checks ok
      FEE64 temps ok - attachment 5
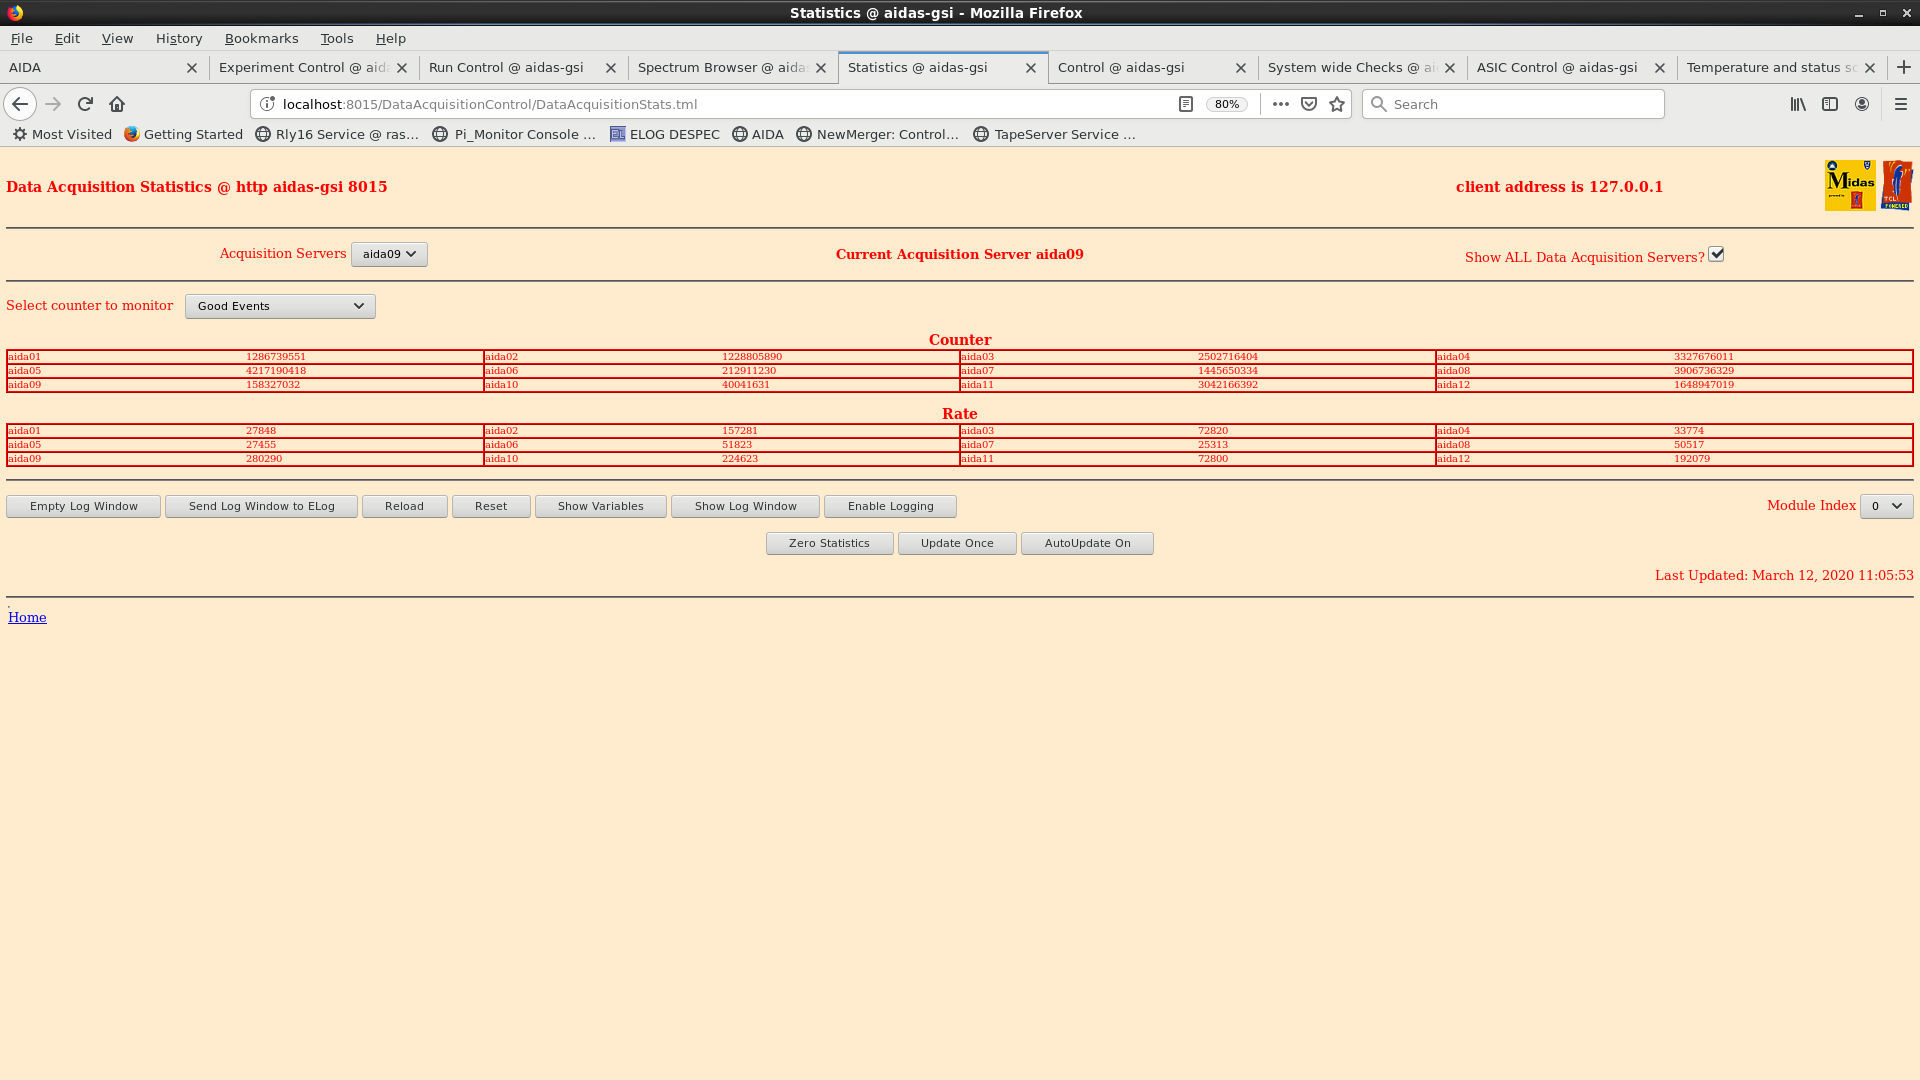
      good event statistics ok - attachment 6
      detector bias and leakage currents - attachment 7

11.18 merger ok, ~ 2.7 million data items per second
      TapeServer ok, ~ 25 Mb/s data rate
      Data forwarding to MBS ok

11.20 writing to file R9_39

11.22 beam off

11.24 beam back online (R9_42)

11.41 FRS has reverted to an older setting

13:04 hit rate spectra - attachment 8

13:19 all system wide checks ok

13:30 FEE64 temps ok - attachment 9

      good event statistics ok - attachment 10

      detector bias and leakage currents ok - attachment 11


15:31 good event statistics ok - attachment 13

      detector bias and leakage currents ok - attachment 14

      FEE64 temps ok - attachment 15

      all system wide checks ok

      beam seems to have stopped during 2pm meeting

15.35 TapeServer ok, data rate ~ 23 Mb/s

      Merger ok, rate of 2.5 - 3 million data items per second

      data forwarding to MBS ok

15.38 AIDA writing to file R9_233

16:02 beam back - AIDA writing to file R9_250
|
| Attachment 1: 200312_0902_bias.png
|
|
| Attachment 2: 200312_0902_stats.png
|

|
| Attachment 3: 200312_0903_temp.png
|

|
| Attachment 4: 200312_1042_rates.png
|
|
| Attachment 5: 200312_1105_temp.png
|

|
| Attachment 6: 200312_1107_stats.png
|
|
| Attachment 7: 200312_1108_stats.png
|

|
| Attachment 8: 200312_1302_rates.png
|

|
| Attachment 9: 200312_1321_temp.png
|

|
| Attachment 10: 200312_1325_stats.png
|

|
| Attachment 11: 200312_1327_bias.png
|

|
| Attachment 12: 200312_1528_stats.png
|

|
| Attachment 13: 200312_1529_bias.png
|

|
| Attachment 14: 300312_1527_temp.png
|
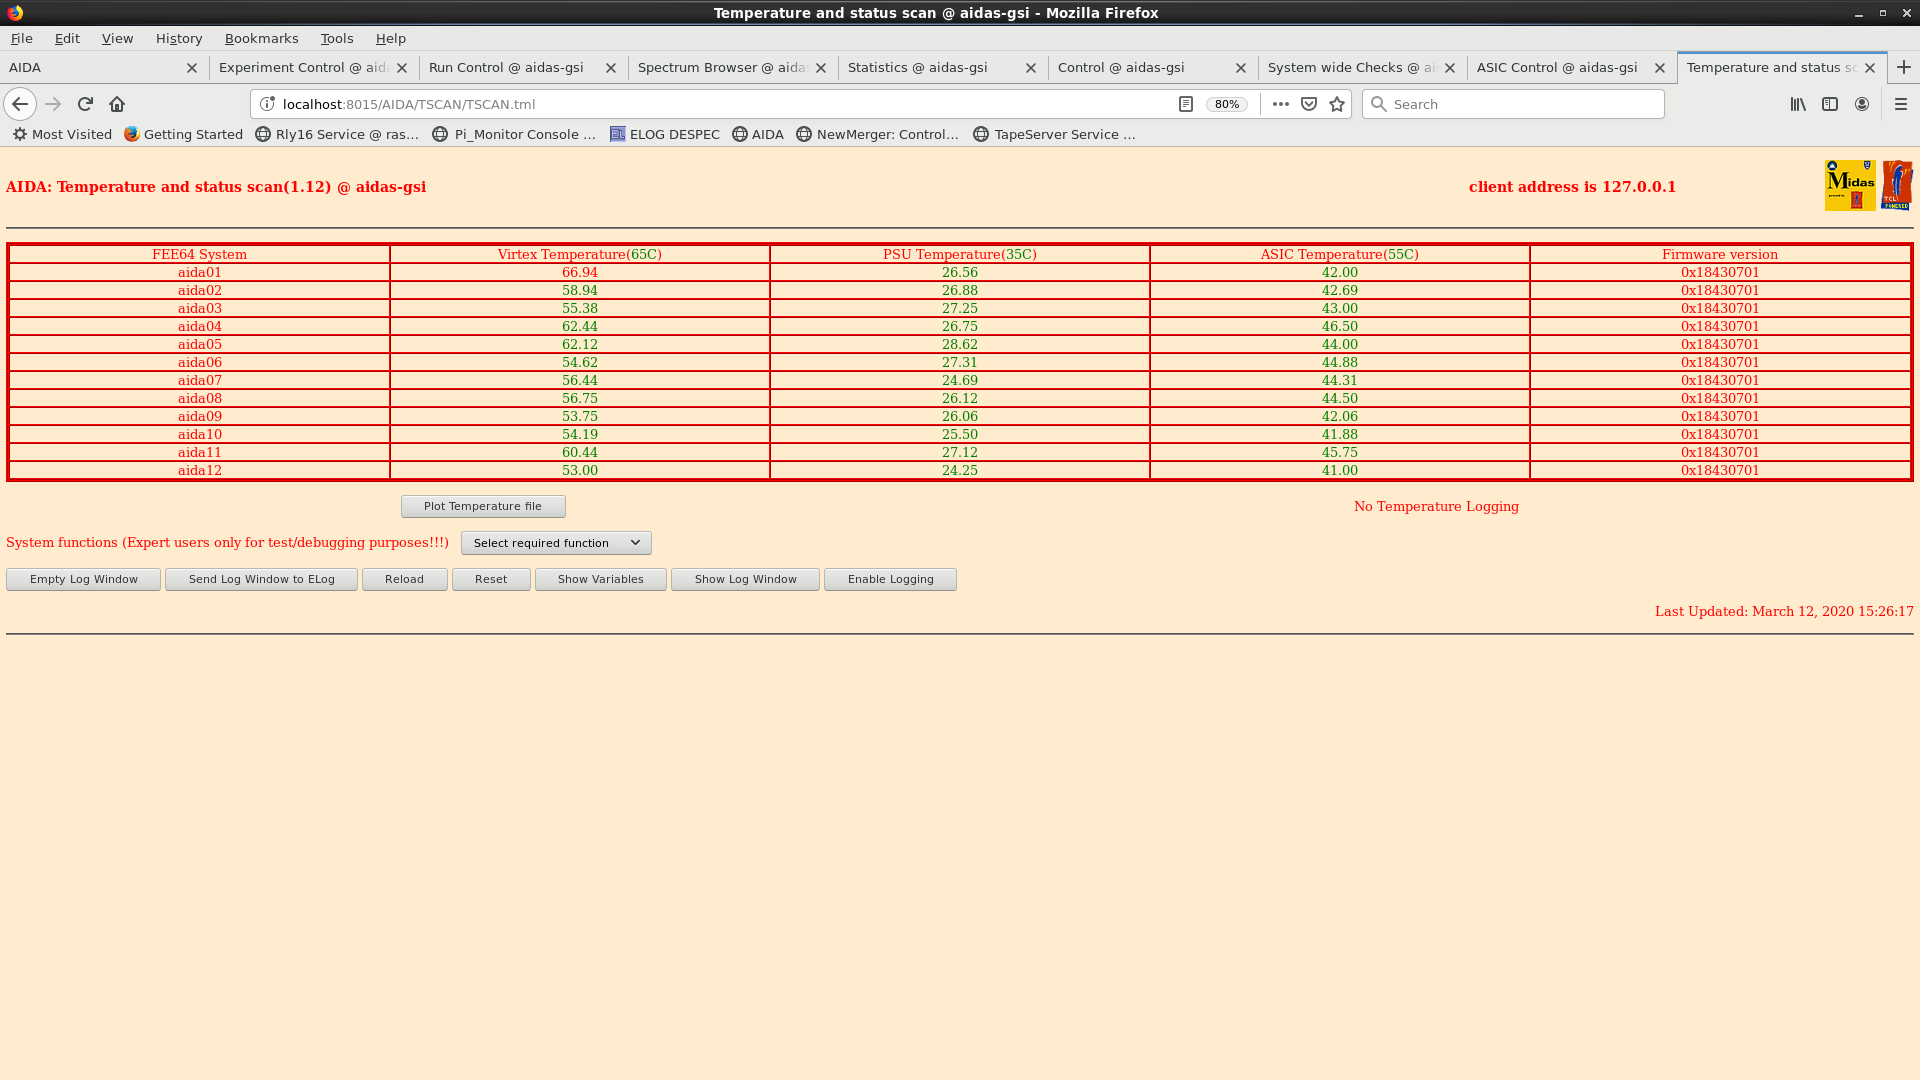
|
|
441
|
Fri May 13 06:56:14 2022 |
OH, BA, MA | Low Rates |
| Quote: |
|
The rate is very low in all aida, not sure .
|
This was because the statistics page had been changed to transfer buffers. The rates were ok |
|
430
|
Thu May 12 00:37:52 2022 |
OH, AM | Thursday 12 May |
01:37 Over the past hour the degrader settings have been checked by impinging 209Pb onto the detectors.
      That is now complete.
      Will find optimum thresholds for n+n side and then leave DAQ running with n+n at optimum and p+n at 0xc

      R16 slow comp 0x19 (250keV) 2 and 4 low deadtime 6 and 8 high deadtime. - attachment1
      Will lower 2 and 4 to 200 and raise 6 and 8 to 300

      R17 2 good, 4 shakey 6 and 8 poor - attachment 2

      R18 2 and 4 at 220 and 6 and 7 at 350
      2 and 8 low deadtime, 4 and 6 could be better. - attachment 3


      Will run with p+n at 0xc 2+4 at 0x16 and 6 and 8 at 0x23
      Statistics at this rate - attachment 4


02:18 Statistics - attachment 7
      Temperatures - attachment 6
      Bias & leakage current - attachment 5

      Clock Status - OK
      White Rabbit - OK
      The other 3 checks currently aren't working


04:11 Statistics - attachment 10
      Temperatures - attachment 9
      Bias & leakage current - attachment 8

      Clock Status - OK
      White Rabbit - OK


06:05 Statistics - attachment 13
      Temperatures - attachment 12
      Bias & leakage current - attachment 11

      Clock Status - OK
White Rabbit - OK |
| Attachment 1: R16_19_analyse.txt
|
*** TDR format 3.3.0 analyser - TD - May 2021
*** ERROR: READ I/O error: 5002
blocks: 18197
ADC data format: 144240941 ( 1037416.0 Hz)
Other data format: 4701506 ( 33814.4 Hz)
Sample trace data format: 0 ( 0.0 Hz)
Undefined format: 0 ( 0.0 Hz)
Other data format type: PAUSE: 651 ( 4.7 Hz)
RESUME: 651 ( 4.7 Hz)
SYNC100: 18715 ( 134.6 Hz)
WR48-63: 18715 ( 134.6 Hz)
FEE64 disc: 0 ( 0.0 Hz)
MBS info: 4662774 ( 33535.8 Hz)
Other info: 0 ( 0.0 Hz)
ADC data range bit set: 9906 ( 71.2 Hz)
Timewarps: ADC: 0 ( 0.0 Hz)
PAUSE: 0 ( 0.0 Hz)
RESUME: 0 ( 0.0 Hz)
SYNC100: 0 ( 0.0 Hz)
WR48-63: 0 ( 0.0 Hz)
FEE64 disc: 0 ( 0.0 Hz)
MBS info: 0 ( 0.0 Hz)
Undefined: 0 ( 0.0 Hz)
Sample trace: 0 ( 0.0 Hz)
*** Timestamp elapsed time: 139.039 s
FEE elapsed dead time(s) elapsed idle time(s)
0 0.000 96.976
1 1.224 0.000
2 0.000 2.784
3 4.445 0.000
4 0.000 108.587
5 78.372 0.000
6 0.000 48.067
7 67.687 0.000
8 0.000 100.043
9 0.000 102.969
10 0.000 122.226
11 0.000 21.170
12 0.000 2.713
13 0.000 116.657
14 0.000 0.000
15 0.000 0.000
16 0.000 0.000
17 0.000 0.000
18 0.000 0.000
19 0.000 0.000
20 0.000 0.000
21 0.000 0.000
22 0.000 0.000
23 0.000 0.000
24 0.000 0.000
25 0.000 0.000
26 0.000 0.000
27 0.000 0.000
28 0.000 0.000
29 0.000 0.000
30 0.000 0.000
31 0.000 0.000
32 0.000 0.000
*** Statistics
FEE ADC Data Other Data Sample Undefined Pause Resume SYNC100 WR48-63 Disc MBS Other HEC Data
0 346857 9766 0 0 0 0 47 47 0 9672 0 2994
1 28465912 7268 0 0 10 10 3624 3624 0 0 0 3890
2 235746 2352664 0 0 0 0 299 299 0 2352066 0 528
3 33196911 2283279 0 0 20 20 4471 4471 0 2274297 0 644
4 346134 72 0 0 0 0 36 36 0 0 0 4
5 37750759 9970 0 0 309 309 4676 4676 0 0 0 836
6 855292 17907 0 0 0 0 114 114 0 17679 0 522
7 38520306 19374 0 0 312 312 4845 4845 0 9060 0 313
8 312768 68 0 0 0 0 34 34 0 0 0 23
9 342945 90 0 0 0 0 45 45 0 0 0 14
10 176833 46 0 0 0 0 23 23 0 0 0 7
11 1559416 390 0 0 0 0 195 195 0 0 0 62
12 1848830 538 0 0 0 0 269 269 0 0 0 19
13 282232 74 0 0 0 0 37 37 0 0 0 50
14 0 0 0 0 0 0 0 0 0 0 0 0
15 0 0 0 0 0 0 0 0 0 0 0 0
16 0 0 0 0 0 0 0 0 0 0 0 0
17 0 0 0 0 0 0 0 0 0 0 0 0
18 0 0 0 0 0 0 0 0 0 0 0 0
19 0 0 0 0 0 0 0 0 0 0 0 0
20 0 0 0 0 0 0 0 0 0 0 0 0
21 0 0 0 0 0 0 0 0 0 0 0 0
22 0 0 0 0 0 0 0 0 0 0 0 0
23 0 0 0 0 0 0 0 0 0 0 0 0
24 0 0 0 0 0 0 0 0 0 0 0 0
25 0 0 0 0 0 0 0 0 0 0 0 0
26 0 0 0 0 0 0 0 0 0 0 0 0
27 0 0 0 0 0 0 0 0 0 0 0 0
28 0 0 0 0 0 0 0 0 0 0 0 0
29 0 0 0 0 0 0 0 0 0 0 0 0
30 0 0 0 0 0 0 0 0 0 0 0 0
31 0 0 0 0 0 0 0 0 0 0 0 0
32 0 0 0 0 0 0 0 0 0 0 0 0
*** Timewarps
FEE ADC Pause Resume SYNC100 WR48-63 Disc MBS Undefined Samples
0 0 0 0 0 0 0 0 0 0
1 0 0 0 0 0 0 0 0 0
2 0 0 0 0 0 0 0 0 0
3 0 0 0 0 0 0 0 0 0
4 0 0 0 0 0 0 0 0 0
5 0 0 0 0 0 0 0 0 0
6 0 0 0 0 0 0 0 0 0
7 0 0 0 0 0 0 0 0 0
8 0 0 0 0 0 0 0 0 0
9 0 0 0 0 0 0 0 0 0
10 0 0 0 0 0 0 0 0 0
11 0 0 0 0 0 0 0 0 0
12 0 0 0 0 0 0 0 0 0
13 0 0 0 0 0 0 0 0 0
14 0 0 0 0 0 0 0 0 0
15 0 0 0 0 0 0 0 0 0
16 0 0 0 0 0 0 0 0 0
17 0 0 0 0 0 0 0 0 0
18 0 0 0 0 0 0 0 0 0
19 0 0 0 0 0 0 0 0 0
20 0 0 0 0 0 0 0 0 0
21 0 0 0 0 0 0 0 0 0
22 0 0 0 0 0 0 0 0 0
23 0 0 0 0 0 0 0 0 0
24 0 0 0 0 0 0 0 0 0
25 0 0 0 0 0 0 0 0 0
26 0 0 0 0 0 0 0 0 0
27 0 0 0 0 0 0 0 0 0
28 0 0 0 0 0 0 0 0 0
29 0 0 0 0 0 0 0 0 0
30 0 0 0 0 0 0 0 0 0
31 0 0 0 0 0 0 0 0 0
32 0 0 0 0 0 0 0 0 0
*** Program elapsed time: 18.576s ( 979.614 blocks/s, 61.226 Mb/s)
|
| Attachment 2: R17_19_analyse.txt
|
*** TDR format 3.3.0 analyser - TD - May 2021
*** ERROR: READ I/O error: 5002
blocks: 9844
ADC data format: 78473161 ( 1119546.3 Hz)
Other data format: 2099979 ( 29959.6 Hz)
Sample trace data format: 0 ( 0.0 Hz)
Undefined format: 0 ( 0.0 Hz)
Other data format type: PAUSE: 470 ( 6.7 Hz)
RESUME: 470 ( 6.7 Hz)
SYNC100: 10105 ( 144.2 Hz)
WR48-63: 10105 ( 144.2 Hz)
FEE64 disc: 0 ( 0.0 Hz)
MBS info: 2078829 ( 29657.8 Hz)
Other info: 0 ( 0.0 Hz)
ADC data range bit set: 0 ( 0.0 Hz)
Timewarps: ADC: 0 ( 0.0 Hz)
PAUSE: 0 ( 0.0 Hz)
RESUME: 0 ( 0.0 Hz)
SYNC100: 0 ( 0.0 Hz)
WR48-63: 0 ( 0.0 Hz)
FEE64 disc: 0 ( 0.0 Hz)
MBS info: 0 ( 0.0 Hz)
Undefined: 0 ( 0.0 Hz)
Sample trace: 0 ( 0.0 Hz)
*** Timestamp elapsed time: 70.094 s
FEE elapsed dead time(s) elapsed idle time(s)
0 0.000 61.805
1 4.886 0.000
2 0.000 0.000
3 17.776 0.000
4 0.000 55.325
5 34.711 0.000
6 0.000 20.226
7 27.353 0.000
8 0.000 57.388
9 0.000 53.302
10 0.000 59.261
11 0.000 7.690
12 0.000 11.252
13 0.000 58.364
14 0.000 0.000
15 0.000 0.000
16 0.000 0.000
17 0.000 0.000
18 0.000 0.000
19 0.000 0.000
20 0.000 0.000
21 0.000 0.000
22 0.000 0.000
23 0.000 0.000
24 0.000 0.000
25 0.000 0.000
26 0.000 0.000
27 0.000 0.000
28 0.000 0.000
29 0.000 0.000
30 0.000 0.000
31 0.000 0.000
32 0.000 0.000
*** Statistics
FEE ADC Data Other Data Sample Undefined Pause Resume SYNC100 WR48-63 Disc MBS Other HEC Data
0 137192 4907 0 0 0 0 16 16 0 4875 0 0
1 18540829 4668 0 0 40 40 2294 2294 0 0 0 0
2 107308 1183296 0 0 0 0 177 177 0 1182942 0 0
3 18083643 896022 0 0 126 126 2379 2379 0 891012 0 0
4 171162 40 0 0 0 0 20 20 0 0 0 0
5 19343787 5154 0 0 155 155 2422 2422 0 0 0 0
6 395908 126 0 0 0 0 63 63 0 0 0 0
7 19401210 5206 0 0 149 149 2454 2454 0 0 0 0
8 159836 40 0 0 0 0 20 20 0 0 0 0
9 172050 38 0 0 0 0 19 19 0 0 0 0
10 94357 20 0 0 0 0 10 10 0 0 0 0
11 792883 200 0 0 0 0 100 100 0 0 0 0
12 933311 234 0 0 0 0 117 117 0 0 0 0
13 139685 28 0 0 0 0 14 14 0 0 0 0
14 0 0 0 0 0 0 0 0 0 0 0 0
15 0 0 0 0 0 0 0 0 0 0 0 0
16 0 0 0 0 0 0 0 0 0 0 0 0
17 0 0 0 0 0 0 0 0 0 0 0 0
18 0 0 0 0 0 0 0 0 0 0 0 0
19 0 0 0 0 0 0 0 0 0 0 0 0
20 0 0 0 0 0 0 0 0 0 0 0 0
21 0 0 0 0 0 0 0 0 0 0 0 0
22 0 0 0 0 0 0 0 0 0 0 0 0
23 0 0 0 0 0 0 0 0 0 0 0 0
24 0 0 0 0 0 0 0 0 0 0 0 0
25 0 0 0 0 0 0 0 0 0 0 0 0
26 0 0 0 0 0 0 0 0 0 0 0 0
27 0 0 0 0 0 0 0 0 0 0 0 0
28 0 0 0 0 0 0 0 0 0 0 0 0
29 0 0 0 0 0 0 0 0 0 0 0 0
30 0 0 0 0 0 0 0 0 0 0 0 0
31 0 0 0 0 0 0 0 0 0 0 0 0
32 0 0 0 0 0 0 0 0 0 0 0 0
*** Timewarps
FEE ADC Pause Resume SYNC100 WR48-63 Disc MBS Undefined Samples
0 0 0 0 0 0 0 0 0 0
1 0 0 0 0 0 0 0 0 0
2 0 0 0 0 0 0 0 0 0
3 0 0 0 0 0 0 0 0 0
4 0 0 0 0 0 0 0 0 0
5 0 0 0 0 0 0 0 0 0
6 0 0 0 0 0 0 0 0 0
7 0 0 0 0 0 0 0 0 0
8 0 0 0 0 0 0 0 0 0
9 0 0 0 0 0 0 0 0 0
10 0 0 0 0 0 0 0 0 0
11 0 0 0 0 0 0 0 0 0
12 0 0 0 0 0 0 0 0 0
13 0 0 0 0 0 0 0 0 0
14 0 0 0 0 0 0 0 0 0
15 0 0 0 0 0 0 0 0 0
16 0 0 0 0 0 0 0 0 0
17 0 0 0 0 0 0 0 0 0
18 0 0 0 0 0 0 0 0 0
19 0 0 0 0 0 0 0 0 0
20 0 0 0 0 0 0 0 0 0
21 0 0 0 0 0 0 0 0 0
22 0 0 0 0 0 0 0 0 0
23 0 0 0 0 0 0 0 0 0
24 0 0 0 0 0 0 0 0 0
25 0 0 0 0 0 0 0 0 0
26 0 0 0 0 0 0 0 0 0
27 0 0 0 0 0 0 0 0 0
28 0 0 0 0 0 0 0 0 0
29 0 0 0 0 0 0 0 0 0
30 0 0 0 0 0 0 0 0 0
31 0 0 0 0 0 0 0 0 0
32 0 0 0 0 0 0 0 0 0
*** Program elapsed time: 10.115s ( 973.186 blocks/s, 60.824 Mb/s)
|
| Attachment 3: R18_19_analyse.txt
|
*** TDR format 3.3.0 analyser - TD - May 2021
*** ERROR: READ I/O error: 5002
blocks: 9700
ADC data format: 70825654 ( 1030660.0 Hz)
Other data format: 8568846 ( 124694.5 Hz)
Sample trace data format: 0 ( 0.0 Hz)
Undefined format: 0 ( 0.0 Hz)
Other data format type: PAUSE: 268 ( 3.9 Hz)
RESUME: 268 ( 3.9 Hz)
SYNC100: 9956 ( 144.9 Hz)
WR48-63: 9956 ( 144.9 Hz)
FEE64 disc: 0 ( 0.0 Hz)
MBS info: 8548398 ( 124396.9 Hz)
Other info: 0 ( 0.0 Hz)
ADC data range bit set: 2 ( 0.0 Hz)
Timewarps: ADC: 0 ( 0.0 Hz)
PAUSE: 0 ( 0.0 Hz)
RESUME: 0 ( 0.0 Hz)
SYNC100: 0 ( 0.0 Hz)
WR48-63: 0 ( 0.0 Hz)
FEE64 disc: 0 ( 0.0 Hz)
MBS info: 0 ( 0.0 Hz)
Undefined: 0 ( 0.0 Hz)
Sample trace: 0 ( 0.0 Hz)
*** Timestamp elapsed time: 68.719 s
FEE elapsed dead time(s) elapsed idle time(s)
0 0.000 40.039
1 0.526 0.000
2 0.044 0.000
3 16.252 0.000
4 0.000 41.343
5 16.542 0.000
6 0.000 37.115
7 4.958 0.000
8 0.000 62.160
9 0.000 48.394
10 0.000 57.328
11 0.000 39.469
12 0.000 0.000
13 0.000 54.952
14 0.000 0.000
15 0.000 0.000
16 0.000 0.000
17 0.000 0.000
18 0.000 0.000
19 0.000 0.000
20 0.000 0.000
21 0.000 0.000
22 0.000 0.000
23 0.000 0.000
24 0.000 0.000
25 0.000 0.000
26 0.000 0.000
27 0.000 0.000
28 0.000 0.000
29 0.000 0.000
30 0.000 0.000
31 0.000 0.000
32 0.000 0.000
*** Statistics
FEE ADC Data Other Data Sample Undefined Pause Resume SYNC100 WR48-63 Disc MBS Other HEC Data
0 123341 4797 0 0 0 0 9 9 0 4779 0 0
1 16458296 4022 0 0 5 5 2006 2006 0 0 0 0
2 67098 4844172 0 0 2 2 649 649 0 4842870 0 2
3 14877427 3705657 0 0 108 108 2346 2346 0 3700749 0 0
4 201730 54 0 0 0 0 27 27 0 0 0 0
5 18757776 4968 0 0 118 118 2366 2366 0 0 0 0
6 275379 62 0 0 0 0 31 31 0 0 0 0
7 18591077 4758 0 0 35 35 2344 2344 0 0 0 0
8 87837 12 0 0 0 0 6 6 0 0 0 0
9 156274 28 0 0 0 0 14 14 0 0 0 0
10 61114 18 0 0 0 0 9 9 0 0 0 0
11 292464 64 0 0 0 0 32 32 0 0 0 0
12 736144 204 0 0 0 0 102 102 0 0 0 0
13 139697 30 0 0 0 0 15 15 0 0 0 0
14 0 0 0 0 0 0 0 0 0 0 0 0
15 0 0 0 0 0 0 0 0 0 0 0 0
16 0 0 0 0 0 0 0 0 0 0 0 0
17 0 0 0 0 0 0 0 0 0 0 0 0
18 0 0 0 0 0 0 0 0 0 0 0 0
19 0 0 0 0 0 0 0 0 0 0 0 0
20 0 0 0 0 0 0 0 0 0 0 0 0
21 0 0 0 0 0 0 0 0 0 0 0 0
22 0 0 0 0 0 0 0 0 0 0 0 0
23 0 0 0 0 0 0 0 0 0 0 0 0
24 0 0 0 0 0 0 0 0 0 0 0 0
25 0 0 0 0 0 0 0 0 0 0 0 0
26 0 0 0 0 0 0 0 0 0 0 0 0
27 0 0 0 0 0 0 0 0 0 0 0 0
28 0 0 0 0 0 0 0 0 0 0 0 0
29 0 0 0 0 0 0 0 0 0 0 0 0
30 0 0 0 0 0 0 0 0 0 0 0 0
31 0 0 0 0 0 0 0 0 0 0 0 0
32 0 0 0 0 0 0 0 0 0 0 0 0
*** Timewarps
FEE ADC Pause Resume SYNC100 WR48-63 Disc MBS Undefined Samples
0 0 0 0 0 0 0 0 0 0
1 0 0 0 0 0 0 0 0 0
2 0 0 0 0 0 0 0 0 0
3 0 0 0 0 0 0 0 0 0
4 0 0 0 0 0 0 0 0 0
5 0 0 0 0 0 0 0 0 0
6 0 0 0 0 0 0 0 0 0
7 0 0 0 0 0 0 0 0 0
8 0 0 0 0 0 0 0 0 0
9 0 0 0 0 0 0 0 0 0
10 0 0 0 0 0 0 0 0 0
11 0 0 0 0 0 0 0 0 0
12 0 0 0 0 0 0 0 0 0
13 0 0 0 0 0 0 0 0 0
14 0 0 0 0 0 0 0 0 0
15 0 0 0 0 0 0 0 0 0
16 0 0 0 0 0 0 0 0 0
17 0 0 0 0 0 0 0 0 0
18 0 0 0 0 0 0 0 0 0
19 0 0 0 0 0 0 0 0 0
20 0 0 0 0 0 0 0 0 0
21 0 0 0 0 0 0 0 0 0
22 0 0 0 0 0 0 0 0 0
23 0 0 0 0 0 0 0 0 0
24 0 0 0 0 0 0 0 0 0
25 0 0 0 0 0 0 0 0 0
26 0 0 0 0 0 0 0 0 0
27 0 0 0 0 0 0 0 0 0
28 0 0 0 0 0 0 0 0 0
29 0 0 0 0 0 0 0 0 0
30 0 0 0 0 0 0 0 0 0
31 0 0 0 0 0 0 0 0 0
32 0 0 0 0 0 0 0 0 0
*** Program elapsed time: 10.125s ( 958.025 blocks/s, 59.877 Mb/s)
|
| Attachment 4: 220512_0155_stats.png
|

|
| Attachment 5: 220512_0217_biasleakage.png
|

|
| Attachment 6: 220512_0215_temps.png
|

|
| Attachment 7: 220512_0214_stats.png
|

|
| Attachment 8: 220512_0410_biasLeak.png
|

|
| Attachment 9: 220512_0410_temps.png
|

|
| Attachment 10: 220512_0408_stats.png
|

|
| Attachment 11: 220512_0604_biasLeakage.png
|
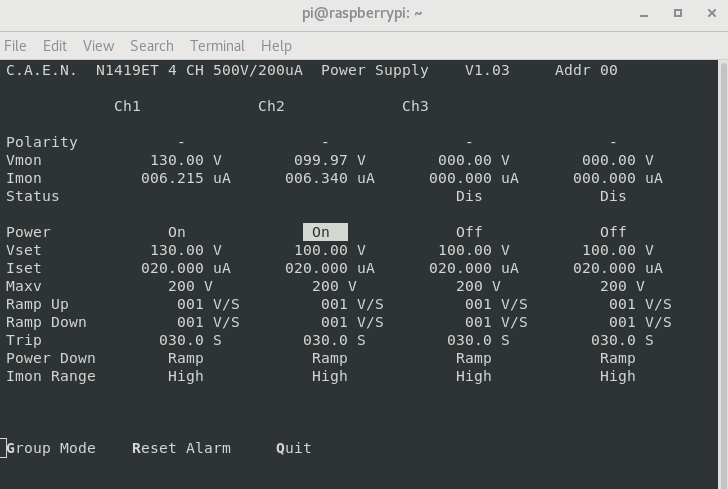
|
| Attachment 12: 220512_0603_temps.png
|

|
| Attachment 13: 220512_0601_stats.png
|

|
|
290
|
Tue May 4 12:11:39 2021 |
OH TD | Bias test of triple |
13:11 System wide checks all ok except *aida02 fails ADC calibration*
 Collecting the file size of each FEE64 Options CONTENTS file to check they are all the same

 FEE : aida01 =>   Options file size is 1025 	 Last changed Tue May 04 10:57:38 CEST 2021
 FEE : aida02 =>   Options file size is 1014 	 Last changed Thu Apr 29 14:43:46 CEST 2021
 FEE : aida03 =>   Options file size is 1014 	 Last changed Thu Apr 29 14:43:50 CEST 2021
 FEE : aida04 =>   Options file size is 1014 	 Last changed Thu Apr 29 14:43:53 CEST 2021
 FEE : aida05 =>   Options file size is 1014 	 Last changed Thu Apr 29 14:43:55 CEST 2021
 FEE : aida06 =>   Options file size is 1014 	 Last changed Thu Apr 29 14:43:59 CEST 2021
 FEE : aida07 =>   Options file size is 1014 	 Last changed Thu Apr 29 14:44:02 CEST 2021
 FEE : aida08 =>   Options file size is 1014 	 Last changed Thu Apr 29 14:44:05 CEST 2021
 FEE : aida09 =>   Options file size is 1014 	 Last changed Thu Apr 29 14:44:08 CEST 2021
 FEE : aida10 =>   Options file size is 1014 	 Last changed Thu Apr 29 14:44:57 CEST 2021
 FEE : aida11 =>   Options file size is 1014 	 Last changed Thu Apr 29 14:44:57 CEST 2021
 FEE : aida12 =>   Options file size is 1014 	 Last changed Thu Apr 29 14:44:57 CEST 2021
 FEE : aida13 =>   Options file size is 1014 	 Last changed Thu Apr 29 14:44:57 CEST 2021
 FEE : aida14 =>   Options file size is 1014 	 Last changed Thu Apr 29 14:44:57 CEST 2021
 FEE : aida15 =>   Options file size is 1014 	 Last changed Thu Apr 29 14:44:57 CEST 2021
 FEE : aida16 =>   Options file size is 1014 	 Last changed Thu Apr 29 14:44:57 CEST 2021

ASIC clocks have been synchronised and ADC re-calibrated

Rate spectra - attachment 1
Layout7 - attachment 2
Layout8 - attachment 3

Detectors at 130V

Statistics - attachment 4

V-I Curve - attachment 5
Voltage	Ch0	Ch1
10	1.345	1.49
20	2.01	2.285
30	2.405	2.8
40	2.635	3.13
50	2.82	3.37
60	2.95	3.57
70	3.08	3.725
80	3.185	3.865
90	3.26	3.98
100	3.33	4.105
110	3.42	4.22
120	3.525	4.35
130	3.64	4.46
140	3.79	4.37
150	3.98	4.37
150+10min 3.9 4.485 |
| Attachment 1: 210504_1325_Rate.png
|
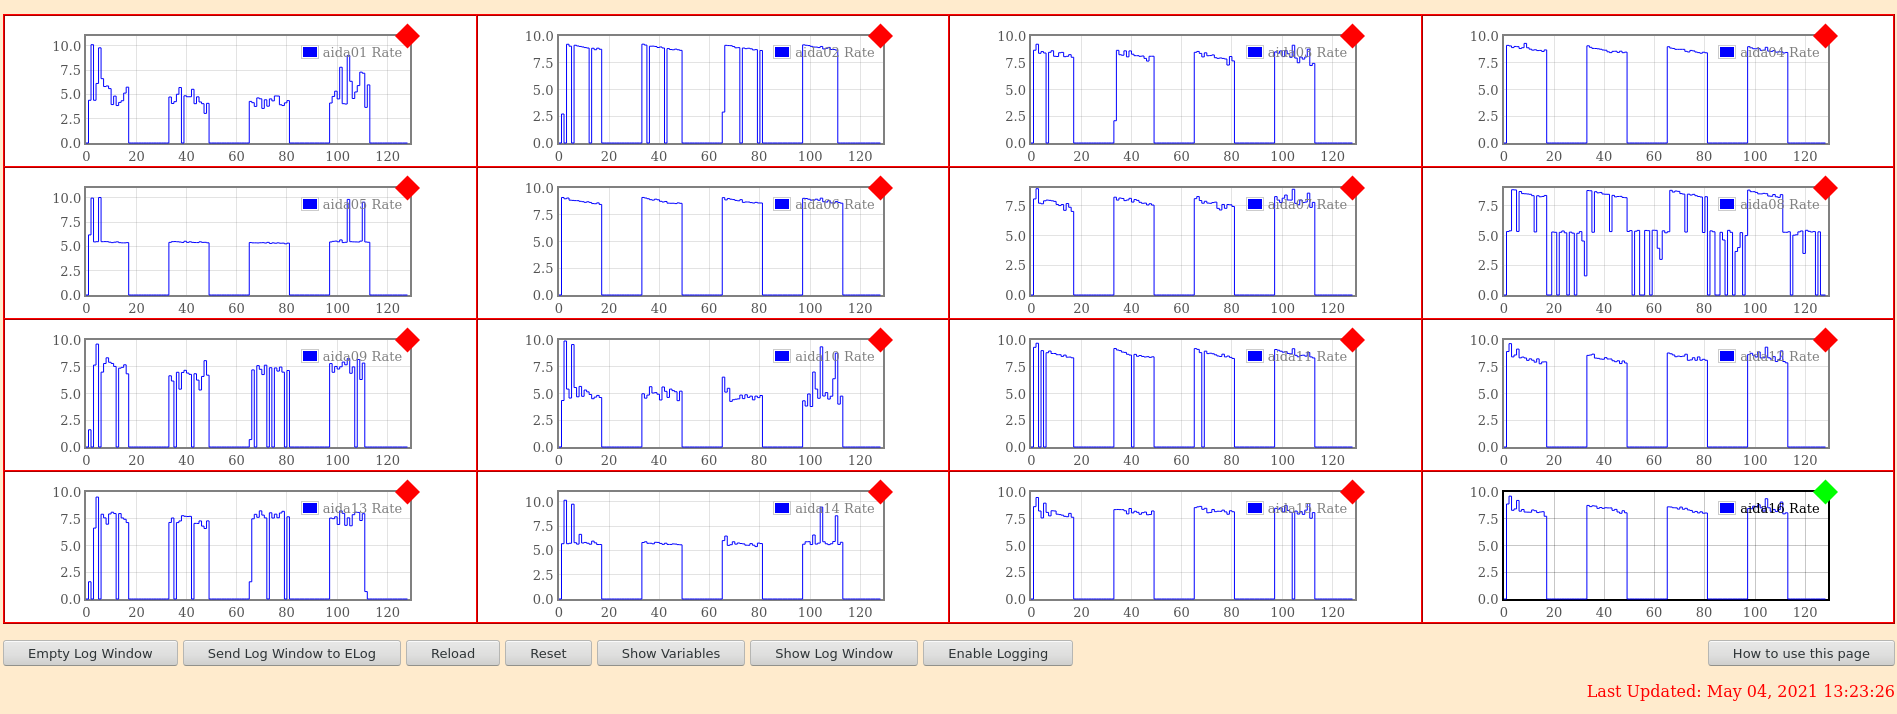
|
| Attachment 2: 210504_1326_Layout7.png
|
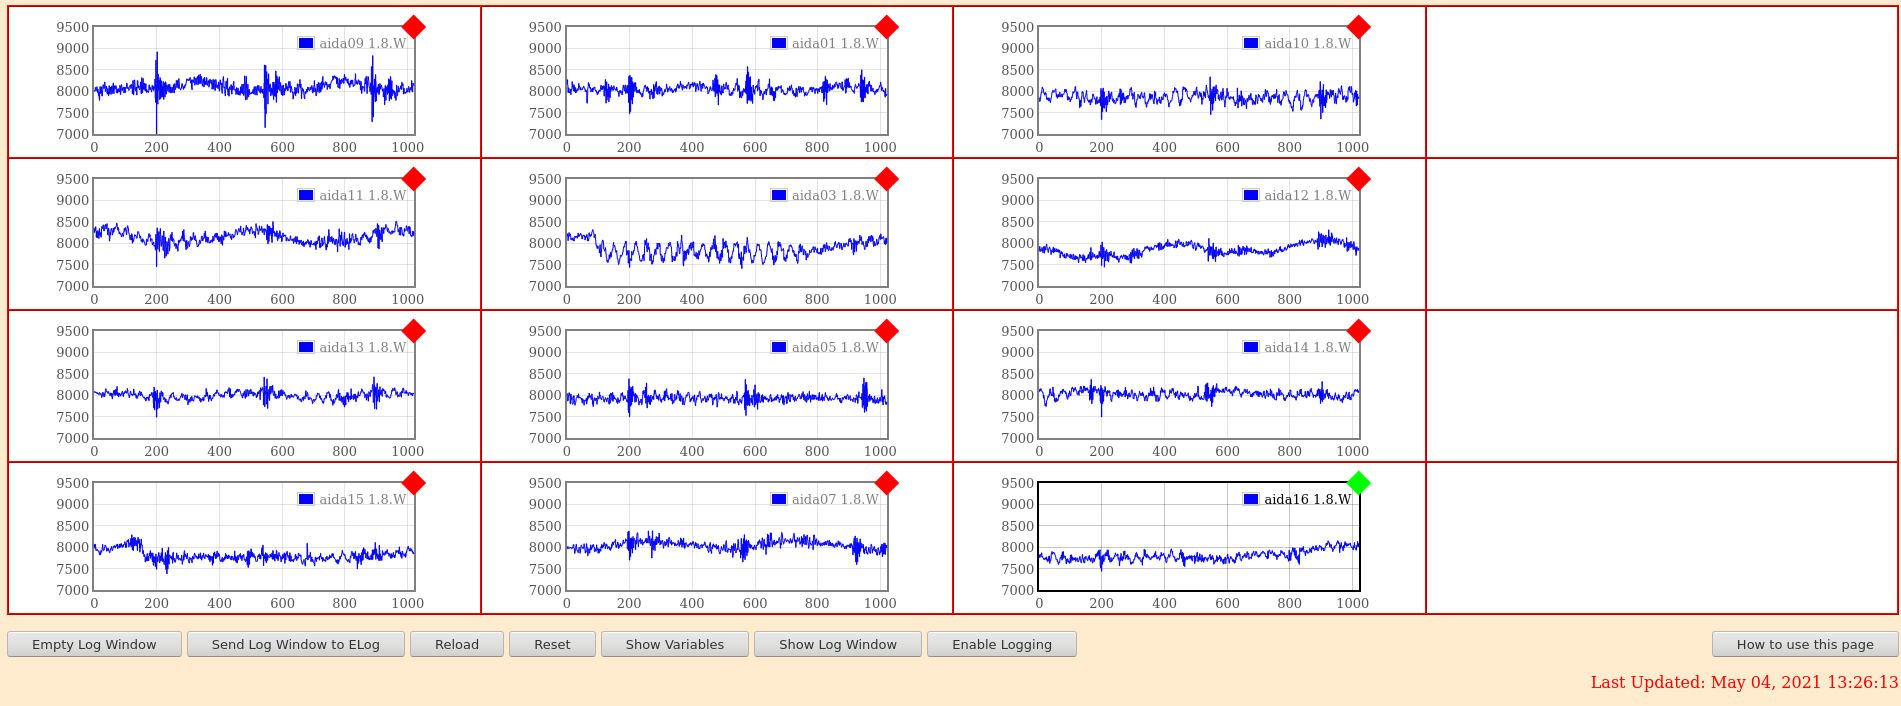
|
| Attachment 3: 210504_1327_Layout08.png
|

|
| Attachment 4: 210504_1334_Stats.png
|

|
| Attachment 5: VICurve.png
|
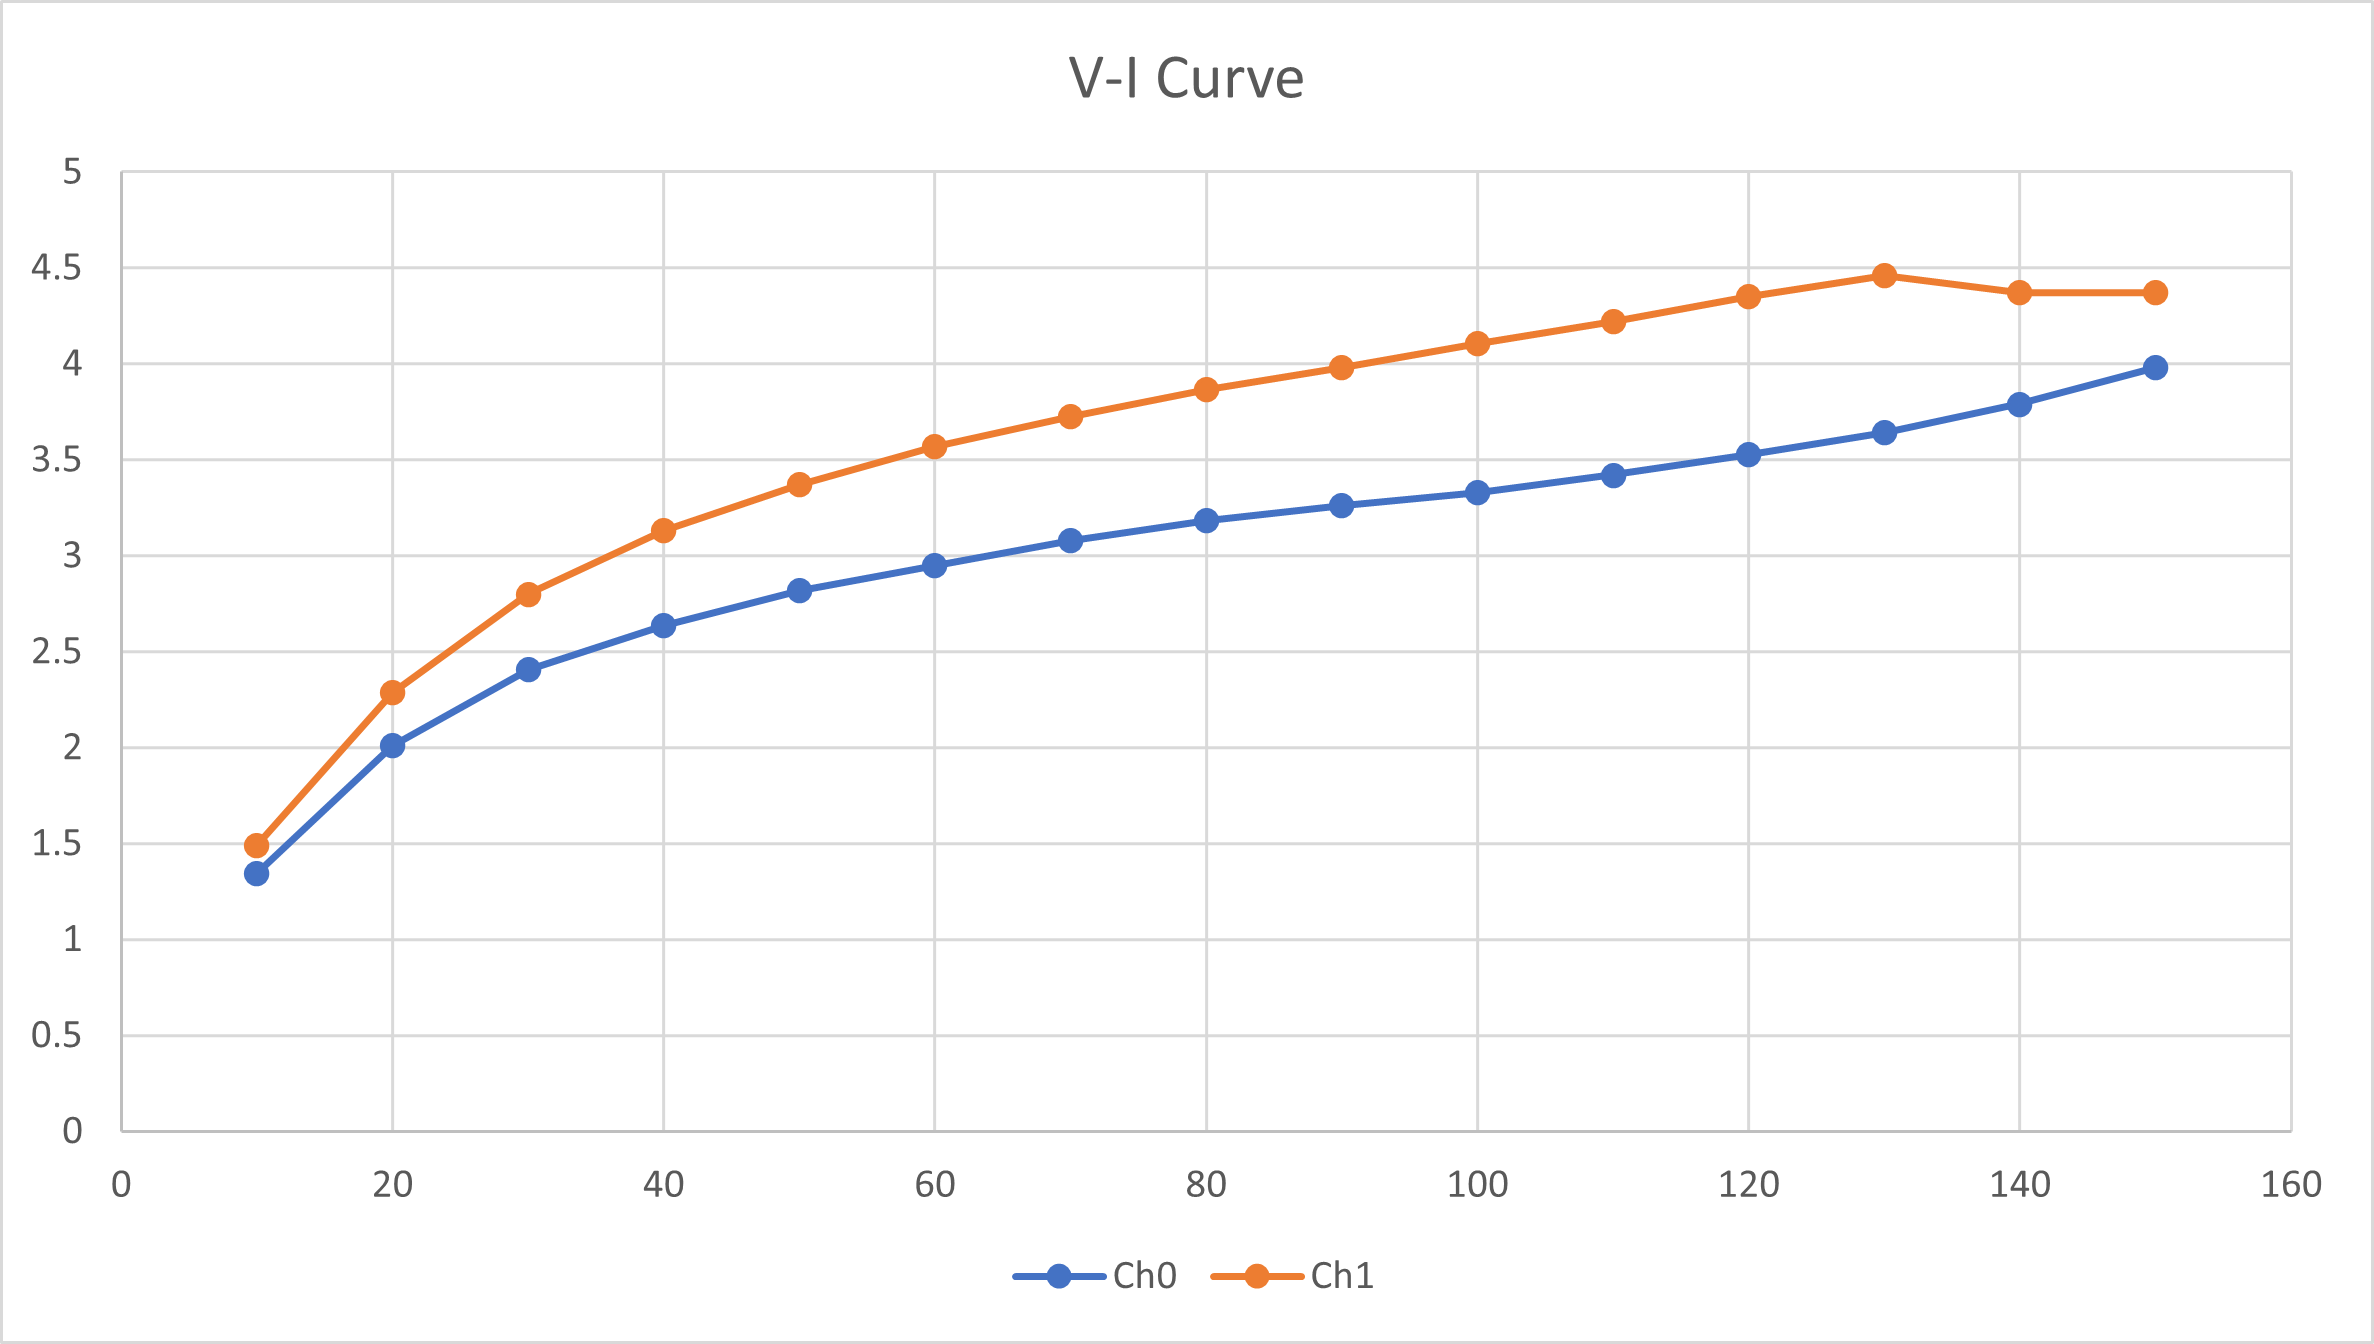
|
|
199
|
Sun Mar 14 08:16:00 2021 |
OH PJCS | Sunday 14th March 2021 |
> 08:07 Realised the correlation scalers hadn't been enabled again. Have enabled them now. R56_151
>
> Looking through the merger messages from the nightshift we see bad timestamps in FEE 11. This FEE does not have any scalers going into it.
> It is also the least noisy FEE in the back DSSD
>
> MERGE Data Link (20510): bad timestamp 10 3 0xc2b77eff 0x037a3b92 0x000017f7f37a3b92 0x166c17f7f37a3b92 0x166c17f7f3877262
> MERGE Data Link (20510): bad timestamp 10 3 0xc2827f3a 0x037aa122 0x000017f7f37aa122 0x166c17f7f37aa122 0x166c17f7f3877262
>
> 09:01 System wide checks
>
> Base Current Difference
> aida07 fault 0x8c74 : 0x8c77 : 3
> White Rabbit error counter test result: Passed 11, Failed 1
>
> Understand the status reports as follows:-
> Status bit 3 : White Rabbit decoder detected an error in the received data
> Status bit 2 : Firmware registered WR error, no reload of Timestamp
> Status bit 0 : White Rabbit decoder reports uncertain of Timestamp information from WR
>
> Base Current Difference
> aida07 fault 0x2 : 0x5 : 3
> FPGA Timestamp error counter test result: Passed 11, Failed 1
> If any of these counts are reported as in error
> The ASIC readout system has detected a timeslip.
> That is the timestamp read from the time FIFO is not younger than the last
>
> Statistics - attachment 1
> Temperature - attachment 2
> Bias and leakage current - attachment 3
It might be worth considering decreasing the time between the flushing of slower FEEs. Is the Merger waiting for the slower data and causing �deadtime� in the faster ones. Perhaps consider this as a
balancing across the system? |
|
487
|
Tue Jun 21 10:19:05 2022 |
OH ML | Tuesday 21st June 08:00-00:00 |
11:19 Stats ok 0xa on all FEE - attachment 1
      Current pulser settings - attachment 2
      FEE Temperatures ok - attachment 3
      Noticed both AIDA03 and AIDA07 had ASICs with missing channels. Did a check ASIC control on them to recover
      Layout 1 after recovering channels - attachment 4
      New stats (Note increased rate on 3 and 7) attachment 5
      Bias and leakage currents ok - attachment 6

      S4 now in closed access. Trying to find out if the beam dump has been put in front of AIDA. Will make sure this is checked before beam to S4.

14:05 Have had it confirmed that the flange beam dump is in position in S4

15:43 Stats ok -attachment 7
      Temp ok - attachment 8
      Bias and Leakage current ok - attachment 9


17:45 Currently the time machine trigger(for correlation) is connected to the DTAS or.
      As the beam is tuning they are triggering at 150k. This is 450k worth of scalers in AIDA
      During the experiment this will be changed to SC1 trigger to solve this.

19:49: Stats ok - attachment 10
       temperatures ok - attachment 11
Bias - Leakage current ok - attachment 12 |
| Attachment 1: 220621_1119_Stats.png
|

|
| Attachment 2: 220621_1120_Pulser.png
|
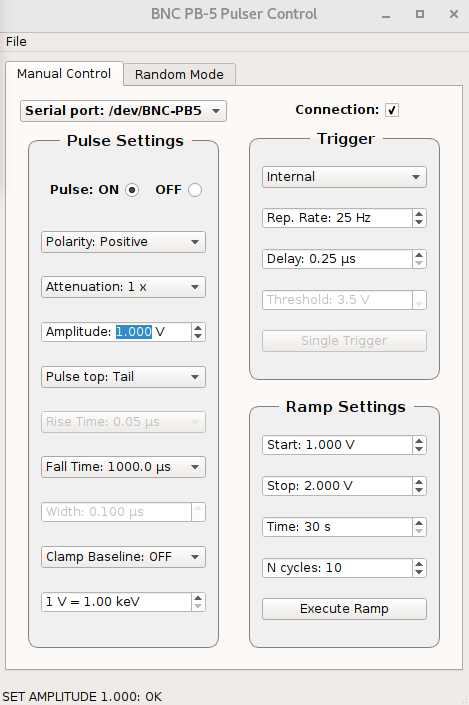
|
| Attachment 3: 220621_1120_Temp.png
|

|
| Attachment 4: 220621_1123_Layout1.png
|
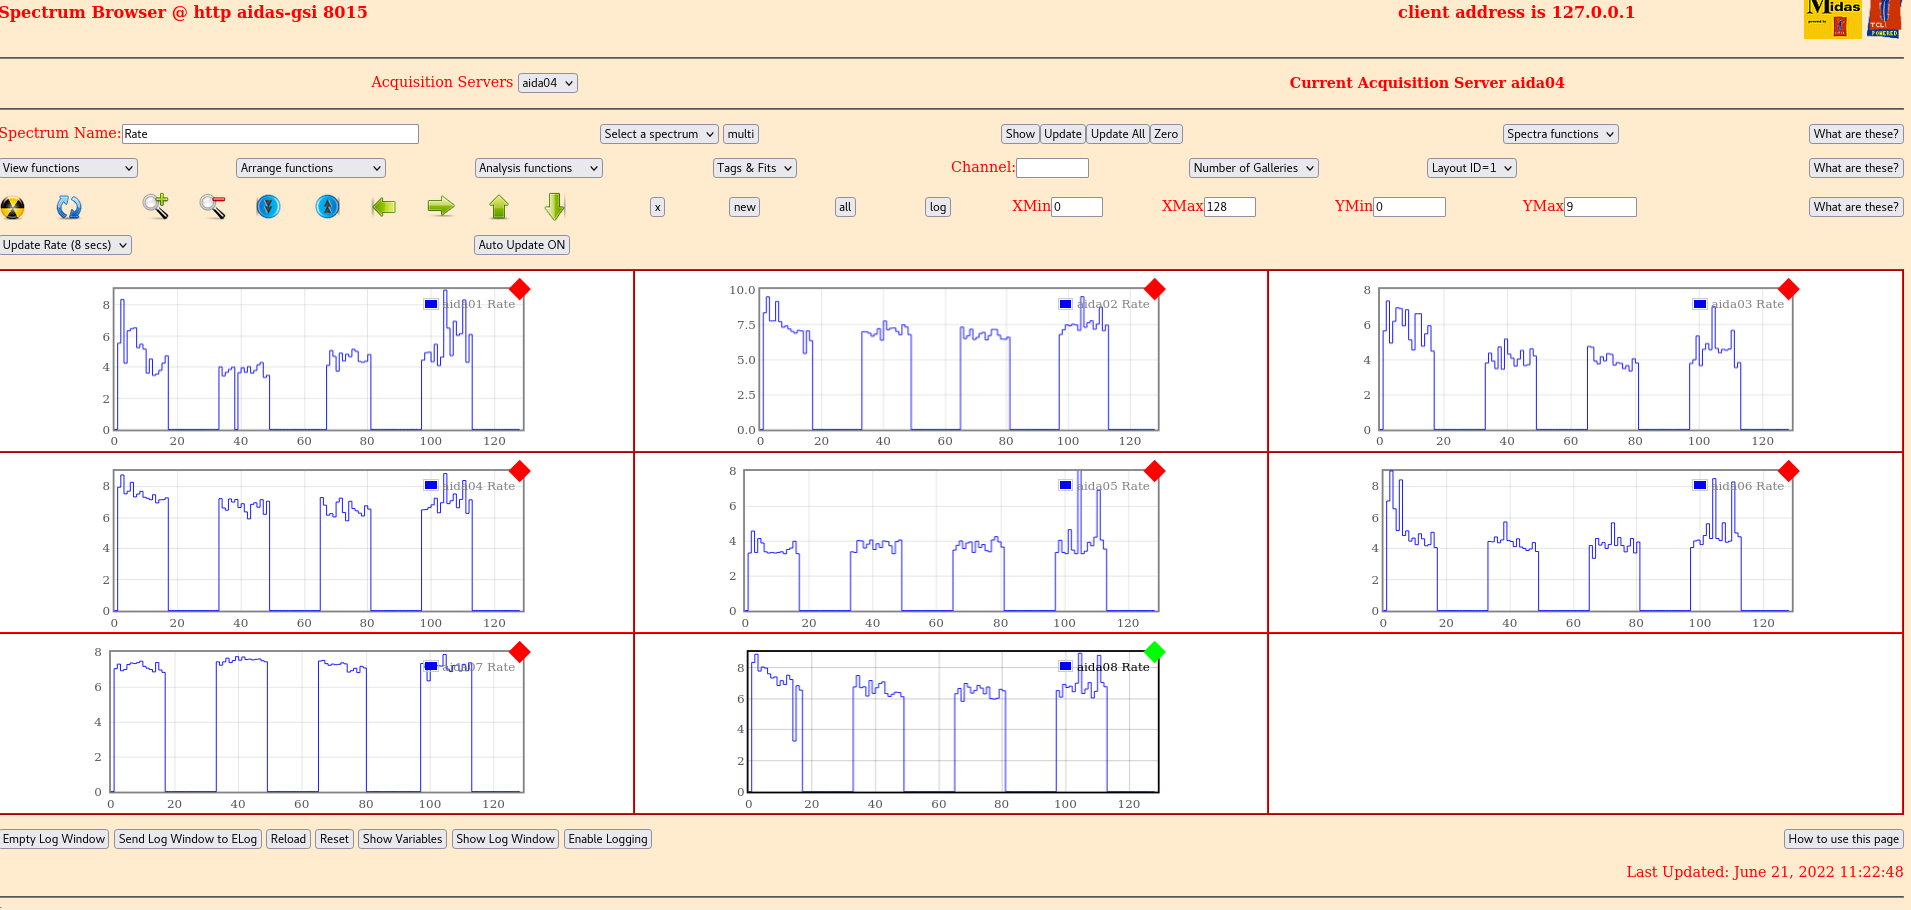
|
| Attachment 5: 220621_1123_Stats.png
|

|
| Attachment 6: 220621_1123_Bias.png
|

|
| Attachment 7: 220621_1542_Stats.png
|

|
| Attachment 8: 220621_1542_Temp.png
|

|
| Attachment 9: 220621_1543_Bias.png
|

|
| Attachment 10: Stats-Screenshot_from_2022-06-21_19-50-19.png
|

|
| Attachment 11: Temp-Screenshot_from_2022-06-21_19-48-56.png
|

|
| Attachment 12: HV_LC-Screenshot_from_2022-06-21_19-47-49.png
|

|
|
6
|
Thu Sep 20 08:57:48 2018 |
OH | Thursday 20th September |
09:57 Alpha run stoppped R2_0 -> R2_2

      Thresholds dropped from 0x64 to 0xa
      Pulser turned on again
      System wide checks ok
      FEE Temp ok - attachment 1
      Bias ok, leakage at 1.485uA at 160V
      Stats in similar place to yesterday - attachment 2

      Low Energy pulser walkthrough
      1.0V to 0.4V in 0.1V steps
      2 minutes per step
      Pulser at 50Hz
10:29 Run started R3_0

10:45 Run stopped R3_2
      1.8.L spectra for low energy pulser walkthrough - attachment 3

11:00
 High Energy pulser walkthrough
      1.8V to 0.V in 0.2V
      2 minutes per step
      Pulser at 50Hz

11:06 Run started R4_0

10:18 Run stopped R4_2
1.8.L spectra for high energy pulser walkthrough - attachment 4 |
| Attachment 1: 180920_0958_Temp.png
|
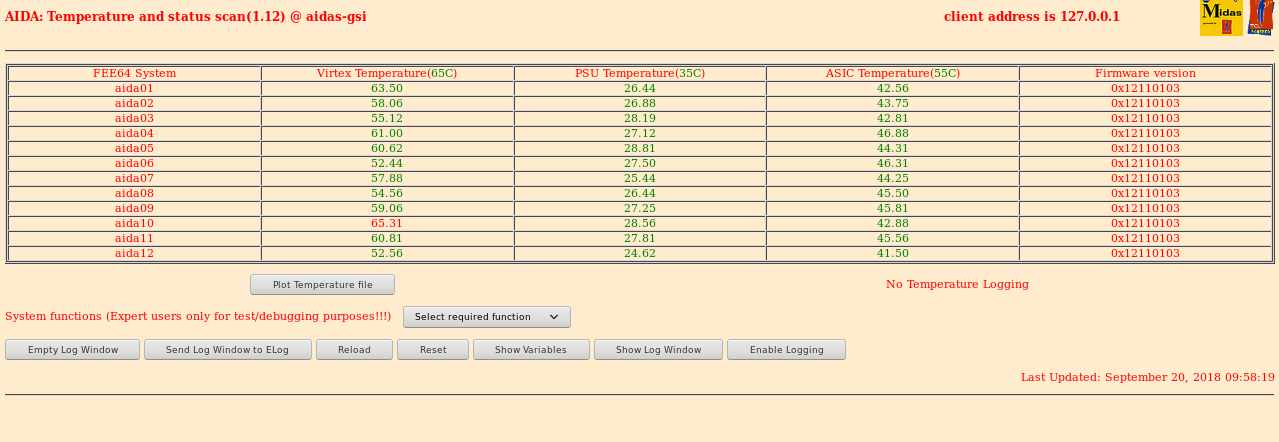
|
| Attachment 2: 180920_1007_Stats.png
|
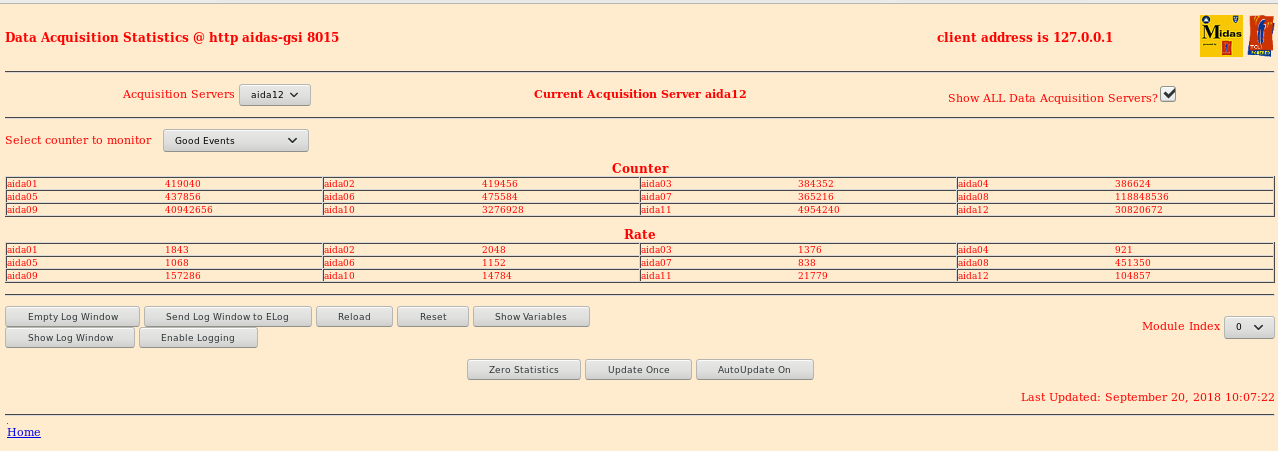
|
| Attachment 3: 180920_1042_LowEPulser.png
|

|
| Attachment 4: 180920_1117_HighEPulser.png
|

|
|
138
|
Tue Mar 10 10:16:56 2020 |
OH | AIDA Implant Range Scan |
A range scan was performed using AIDA.
See the GSI elog: https://elog.gsi.de/despec/S480/19 |
|
143
|
Wed Mar 11 23:44:27 2020 |
OH | Thursday 12th March 00:00-08:000 |
ASIC settings 2019Oct31-13.24.23
     slow comparator 0xa

BNC PB-5 pulser
     amplitude 1.0V , attenuator x1
     frequency 2Hz
     decay time 1ms

00:44 Implantation range in AIDA - attachment 1

01:14 At current rate will run out of space in 35 hours ~ 18:00 hours on Friday 13th March.
      During the day if possible it might be wise to try and obtain a USB3 HDD mount to mount one of the spare drives in
      the AIDA boxes and begin moving files onto that

01:35 System wide checks all ok
      Bias and leakage current ok - attachment 2
      Stats all ok - attachment 3
      FEE temperatures ok - attachment 4

      TapeServer rate around 25-29MB per second
      Merger rate around 2.6-3.2 million items per second

04:11 System wide checks all ok
      Bias and leakage currents ok - attachment 5
      Stats all ok - attachment 6
      FEE temp ok - attachment 7
06:38 System wide checks all ok
      Bias and leakage currents ok - attachment 8
      Stats all ok - attachment 9
FEE temp ok - attachment 10 |
| Attachment 1: 200311_ImpDis.png
|
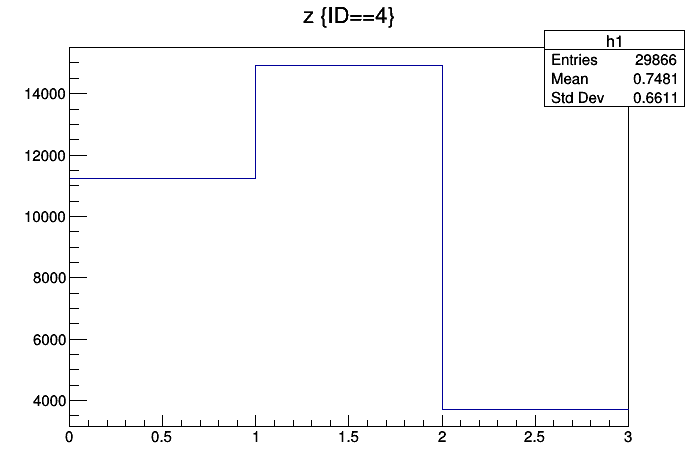
|
| Attachment 2: 200312_0135_Bias.png
|

|
| Attachment 3: 200312_0136_Stats.png
|

|
| Attachment 4: 200312_0139_FEETemp.png
|

|
| Attachment 5: 200312_0405_BIAS.png
|
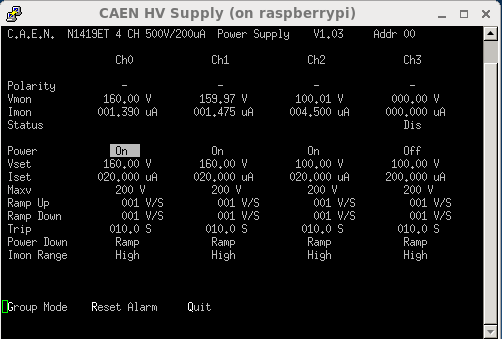
|
| Attachment 6: 200312_0405_stats.png
|

|
| Attachment 7: 200312_0406_Temp.png
|

|
| Attachment 8: 200312_0638_bias.png
|
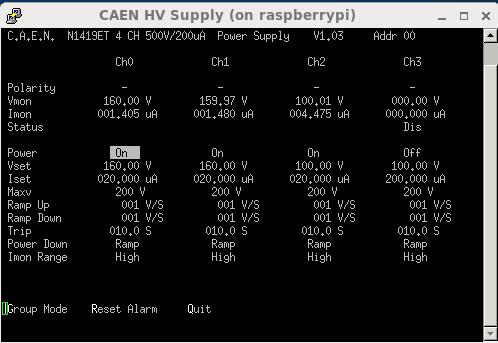
|
| Attachment 9: 200312_0639_stats.png
|

|
| Attachment 10: 200312_0639_temp.png
|

|
|
169
|
Thu Mar 4 10:13:48 2021 |
OH | AnyDesk connection instuction |
|
| Attachment 1: Connecting_to_AnyDesk_at_GSI_for_AIDA.pdf
|
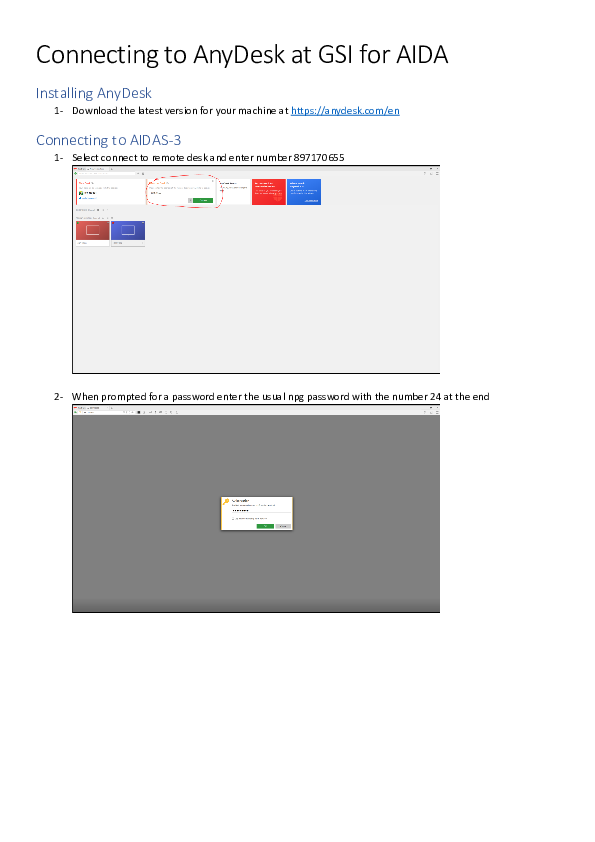

|
|
171
|
Thu Mar 4 11:16:13 2021 |
OH | Further cases of possible database issues |
During testing for the S452 experiment yesterday we were running through the steps of a restart.

The FEEs were not powercycled at this stage but the MIDAS server was restarted.
Initial setup went smoothly and no issues were encountered during setup.
NewMerger and TapeServer were both setup and set to going.
Upon ''Going'' the run control the data transfer for aida09 dropped out.
Going to the NewMerger it could be seen that data was making it through and data items were being merged.
The tapeserver however was seeing no data and neither was the MBS dataspy.
During this time the FEEs became unresponsive likely as their buffers filled. Trying to reset gave the attached errors.

Checking the folder manually it could be seen that the Options file was there.

At this point a powercycle was pewrformed but upong 'Going' the DAQ the same issue was again encountered.

This time we were able to recover control access to the FEEs by running multiple NewMerger sessions which helped clear the buffers.

During our search for the problem we looked at the Options from within MIDAS and could not see anything out of the ordinary.
We also tried restoring the Options from within MIDAS.
We again reached the same issue with the tapeserver.

At this point we restored the Options folder from by copying manually within terminal.
Following this we were able to start the DAQ normally. |
| Attachment 1: ErrorMessage.PNG
|
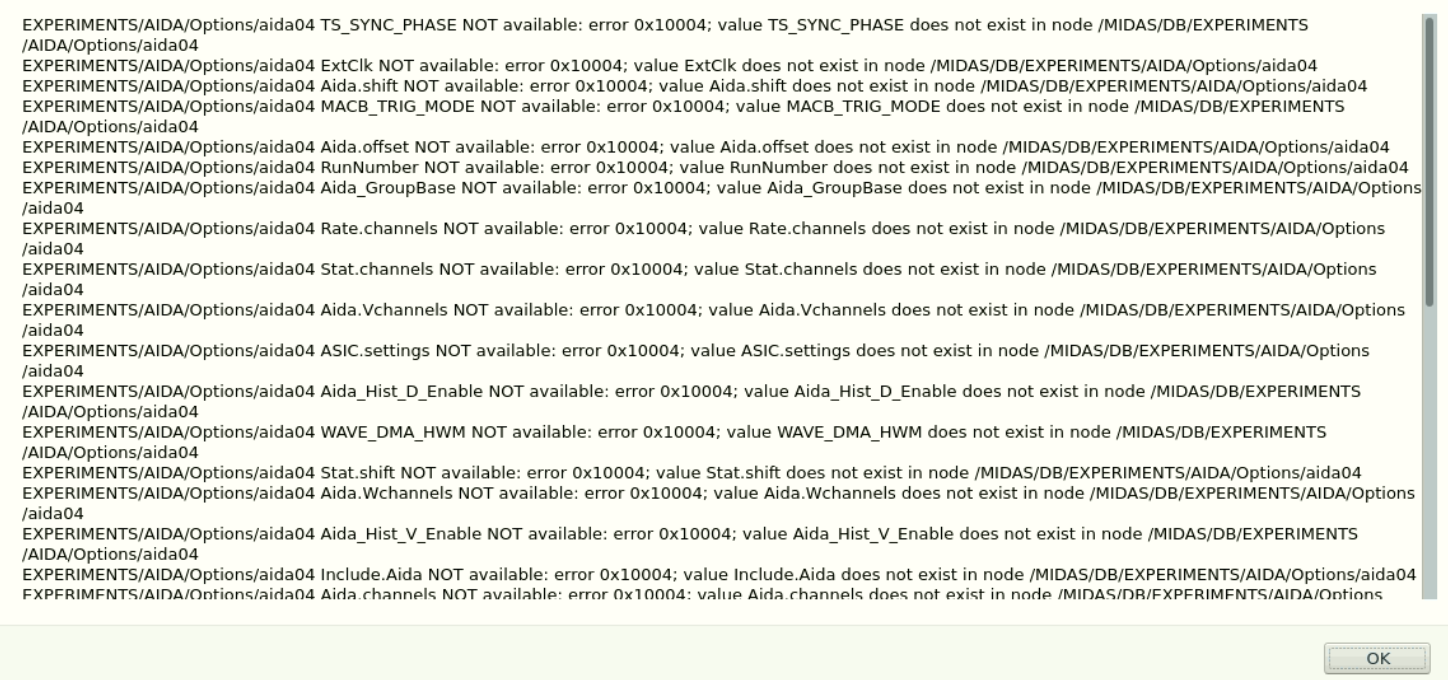
|
| Attachment 2: errorMessage.txt
|
EXPERIMENTS/AIDA/Options/aida04 TS_SYNC_PHASE NOT available: error 0x10004; value TS_SYNC_PHASE does not exist in node /MIDAS/DB/EXPERIMENTS/AIDA/Options/aida04
EXPERIMENTS/AIDA/Options/aida04 ExtClk NOT available: error 0x10004; value ExtClk does not exist in node /MIDAS/DB/EXPERIMENTS/AIDA/Options/aida04
EXPERIMENTS/AIDA/Options/aida04 Aida.shift NOT available: error 0x10004; value Aida.shift does not exist in node /MIDAS/DB/EXPERIMENTS/AIDA/Options/aida04
EXPERIMENTS/AIDA/Options/aida04 MACB_TRIG_MODE NOT available: error 0x10004; value MACB_TRIG_MODE does not exist in node /MIDAS/DB/EXPERIMENTS/AIDA/Options/aida04
EXPERIMENTS/AIDA/Options/aida04 Aida.offset NOT available: error 0x10004; value Aida.offset does not exist in node /MIDAS/DB/EXPERIMENTS/AIDA/Options/aida04
EXPERIMENTS/AIDA/Options/aida04 RunNumber NOT available: error 0x10004; value RunNumber does not exist in node /MIDAS/DB/EXPERIMENTS/AIDA/Options/aida04
EXPERIMENTS/AIDA/Options/aida04 Aida_GroupBase NOT available: error 0x10004; value Aida_GroupBase does not exist in node /MIDAS/DB/EXPERIMENTS/AIDA/Options/aida04
EXPERIMENTS/AIDA/Options/aida04 Rate.channels NOT available: error 0x10004; value Rate.channels does not exist in node /MIDAS/DB/EXPERIMENTS/AIDA/Options/aida04
EXPERIMENTS/AIDA/Options/aida04 Stat.channels NOT available: error 0x10004; value Stat.channels does not exist in node /MIDAS/DB/EXPERIMENTS/AIDA/Options/aida04
EXPERIMENTS/AIDA/Options/aida04 Aida.Vchannels NOT available: error 0x10004; value Aida.Vchannels does not exist in node /MIDAS/DB/EXPERIMENTS/AIDA/Options/aida04
EXPERIMENTS/AIDA/Options/aida04 ASIC.settings NOT available: error 0x10004; value ASIC.settings does not exist in node /MIDAS/DB/EXPERIMENTS/AIDA/Options/aida04
EXPERIMENTS/AIDA/Options/aida04 Aida_Hist_D_Enable NOT available: error 0x10004; value Aida_Hist_D_Enable does not exist in node /MIDAS/DB/EXPERIMENTS/AIDA/Options/aida04
EXPERIMENTS/AIDA/Options/aida04 WAVE_DMA_HWM NOT available: error 0x10004; value WAVE_DMA_HWM does not exist in node /MIDAS/DB/EXPERIMENTS/AIDA/Options/aida04
EXPERIMENTS/AIDA/Options/aida04 Stat.shift NOT available: error 0x10004; value Stat.shift does not exist in node /MIDAS/DB/EXPERIMENTS/AIDA/Options/aida04
EXPERIMENTS/AIDA/Options/aida04 Aida.Wchannels NOT available: error 0x10004; value Aida.Wchannels does not exist in node /MIDAS/DB/EXPERIMENTS/AIDA/Options/aida04
EXPERIMENTS/AIDA/Options/aida04 Aida_Hist_V_Enable NOT available: error 0x10004; value Aida_Hist_V_Enable does not exist in node /MIDAS/DB/EXPERIMENTS/AIDA/Options/aida04
EXPERIMENTS/AIDA/Options/aida04 Include.Aida NOT available: error 0x10004; value Include.Aida does not exist in node /MIDAS/DB/EXPERIMENTS/AIDA/Options/aida04
EXPERIMENTS/AIDA/Options/aida04 Aida.channels NOT available: error 0x10004; value Aida.channels does not exist in node /MIDAS/DB/EXPERIMENTS/AIDA/Options/aida04
EXPERIMENTS/AIDA/Options/aida04 DataAcqPgm NOT available: error 0x10004; value DataAcqPgm does not exist in node /MIDAS/DB/EXPERIMENTS/AIDA/Options/aida04
EXPERIMENTS/AIDA/Options/aida04 Aida_Hist_H_Enable NOT available: error 0x10004; value Aida_Hist_H_Enable does not exist in node /MIDAS/DB/EXPERIMENTS/AIDA/Options/aida04
EXPERIMENTS/AIDA/Options/aida04 DataFormat NOT available: error 0x10004; value DataFormat does not exist in node /MIDAS/DB/EXPERIMENTS/AIDA/Options/aida04
EXPERIMENTS/AIDA/Options/aida04 ASIC_DMA_HWM NOT available: error 0x10004; value ASIC_DMA_HWM does not exist in node /MIDAS/DB/EXPERIMENTS/AIDA/Options/aida04
EXPERIMENTS/AIDA/Options/aida04 Aida_Hist_L_Enable NOT available: error 0x10004; value Aida_Hist_L_Enable does not exist in node /MIDAS/DB/EXPERIMENTS/AIDA/Options/aida04
STATE for aida01 returned with an error
error: SOAP http transport timed out after 20000 ms
NONE
error: SOAP http transport timed out after 20000 ms
    while executing
"$transport $procVarName $url $req"
    (procedure "::SOAP::invoke" line 18)
    invoked from within
"::SOAP::invoke ::SOAP::_DataAcquisitionControlClient__GetState"
    ("eval" body line 1)
    invoked from within
"eval ::SOAP::invoke ::SOAP::_DataAcquisitionControlClient__GetState $args"
    (procedure "DataAcquisitionControlClient__GetState" line 1)
    invoked from within
"DataAcquisitionControlClient__GetState"
|
|
172
|
Fri Mar 5 22:53:05 2021 |
OH | Thursday 5th of March |
There has been no beam for much of the day. It was lost at 13:00 and not regained until 22:00 German time.
At some point during the day the White Rabbit timestamp cable was unplugged from AIDA. This caused it lose correlation with the rest of the system.
At first a reset and setup was performed to try and regain correlation but that did not prove successful.
A full powercycle was then performed at ~22:30 German time which upon restarting the DAQ solved the issue.

The plan is to overnight run some fragments, for the purposes of observing the isomers. This data is not essential and as such we will not be writing to disk.

Beam plug is in front of AIDA. This is causing a huge spike in the Ge. |