AIDA GELINA BRIKEN nToF CRIB ISOLDE CIRCE nTOFCapture DESPEC DTAS EDI_PSA 179Ta CARME StellarModelling DCF K40
  DESPEC, Page 19 of 35  ELOG logo
IDdown Date Author Subject
  341   Fri May 21 07:03:50 2021 OH, TDFriday 21 May 08:00-16:00
08:00 OH and TD take over
      Current settings p+n sides at 0xc
      DSSD1 n+n sides 0x20 on ASICs 1-3 and 0x64 on ASIC 4
      DSSD2 n+n sides 0x1b on ASICs 1-3 and 0x64 on ASIC 4

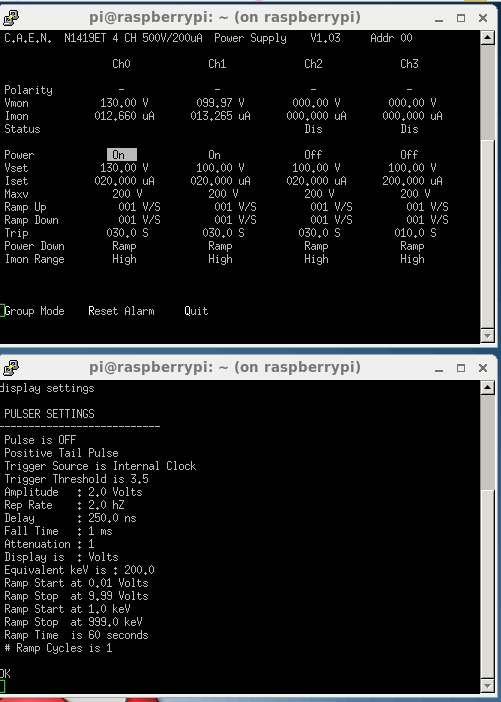
       PULSER SETTINGS
      ---------------------------
       Pulse is ON
       Positive Tail Pulse
       Trigger Source is Internal Clock
       Trigger Threshold is 3.5
       Amplitude   : 2.0 Volts
       Rep Rate    : 2.0 hZ
       Delay       : 250.0 ns
       Fall Time   : 1 ms
       Attenuation : 1
       Display is  : Volts
       Equivalent keV is : 200.0
       Ramp Start at 0.01 Volts
       Ramp Stop  at 9.99 Volts
       Ramp Start at 1.0 keV
       Ramp Stop  at 999.0 keV
       Ramp Time  is 60 seconds
       # Ramp Cycles is 1

08:29 System wide checks ok - WR difference at 111
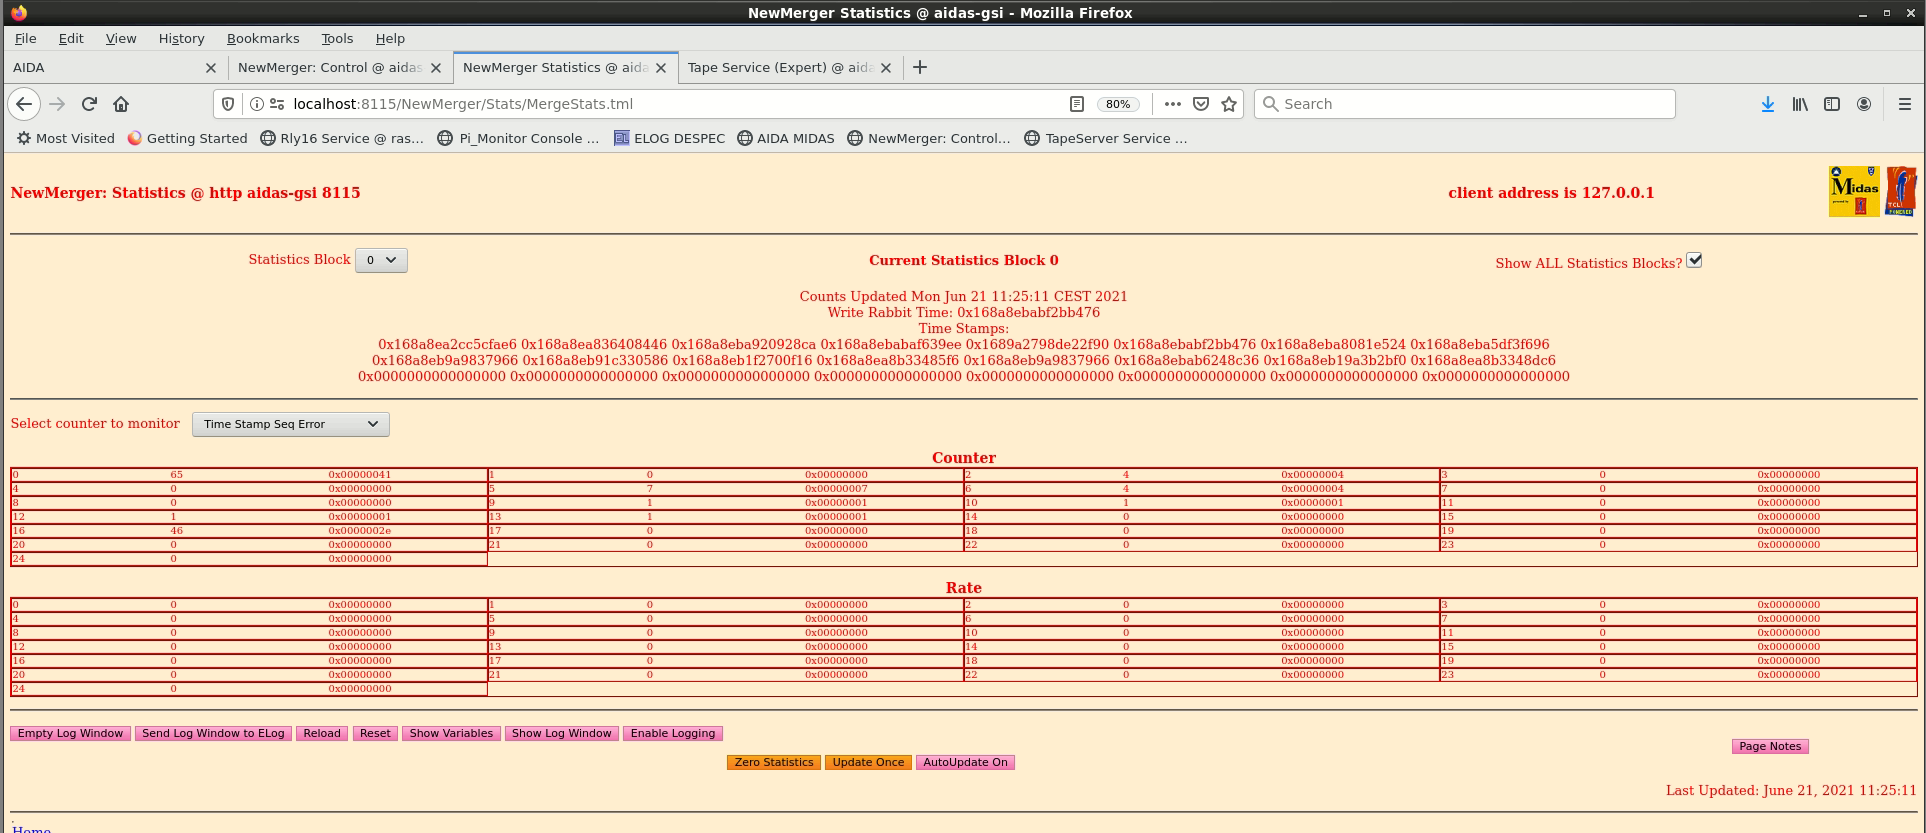
      Statistics ok (Still high following the sharp rise at 18:30 yesterday) - attachment 1
      Temperature ok - attachment 2
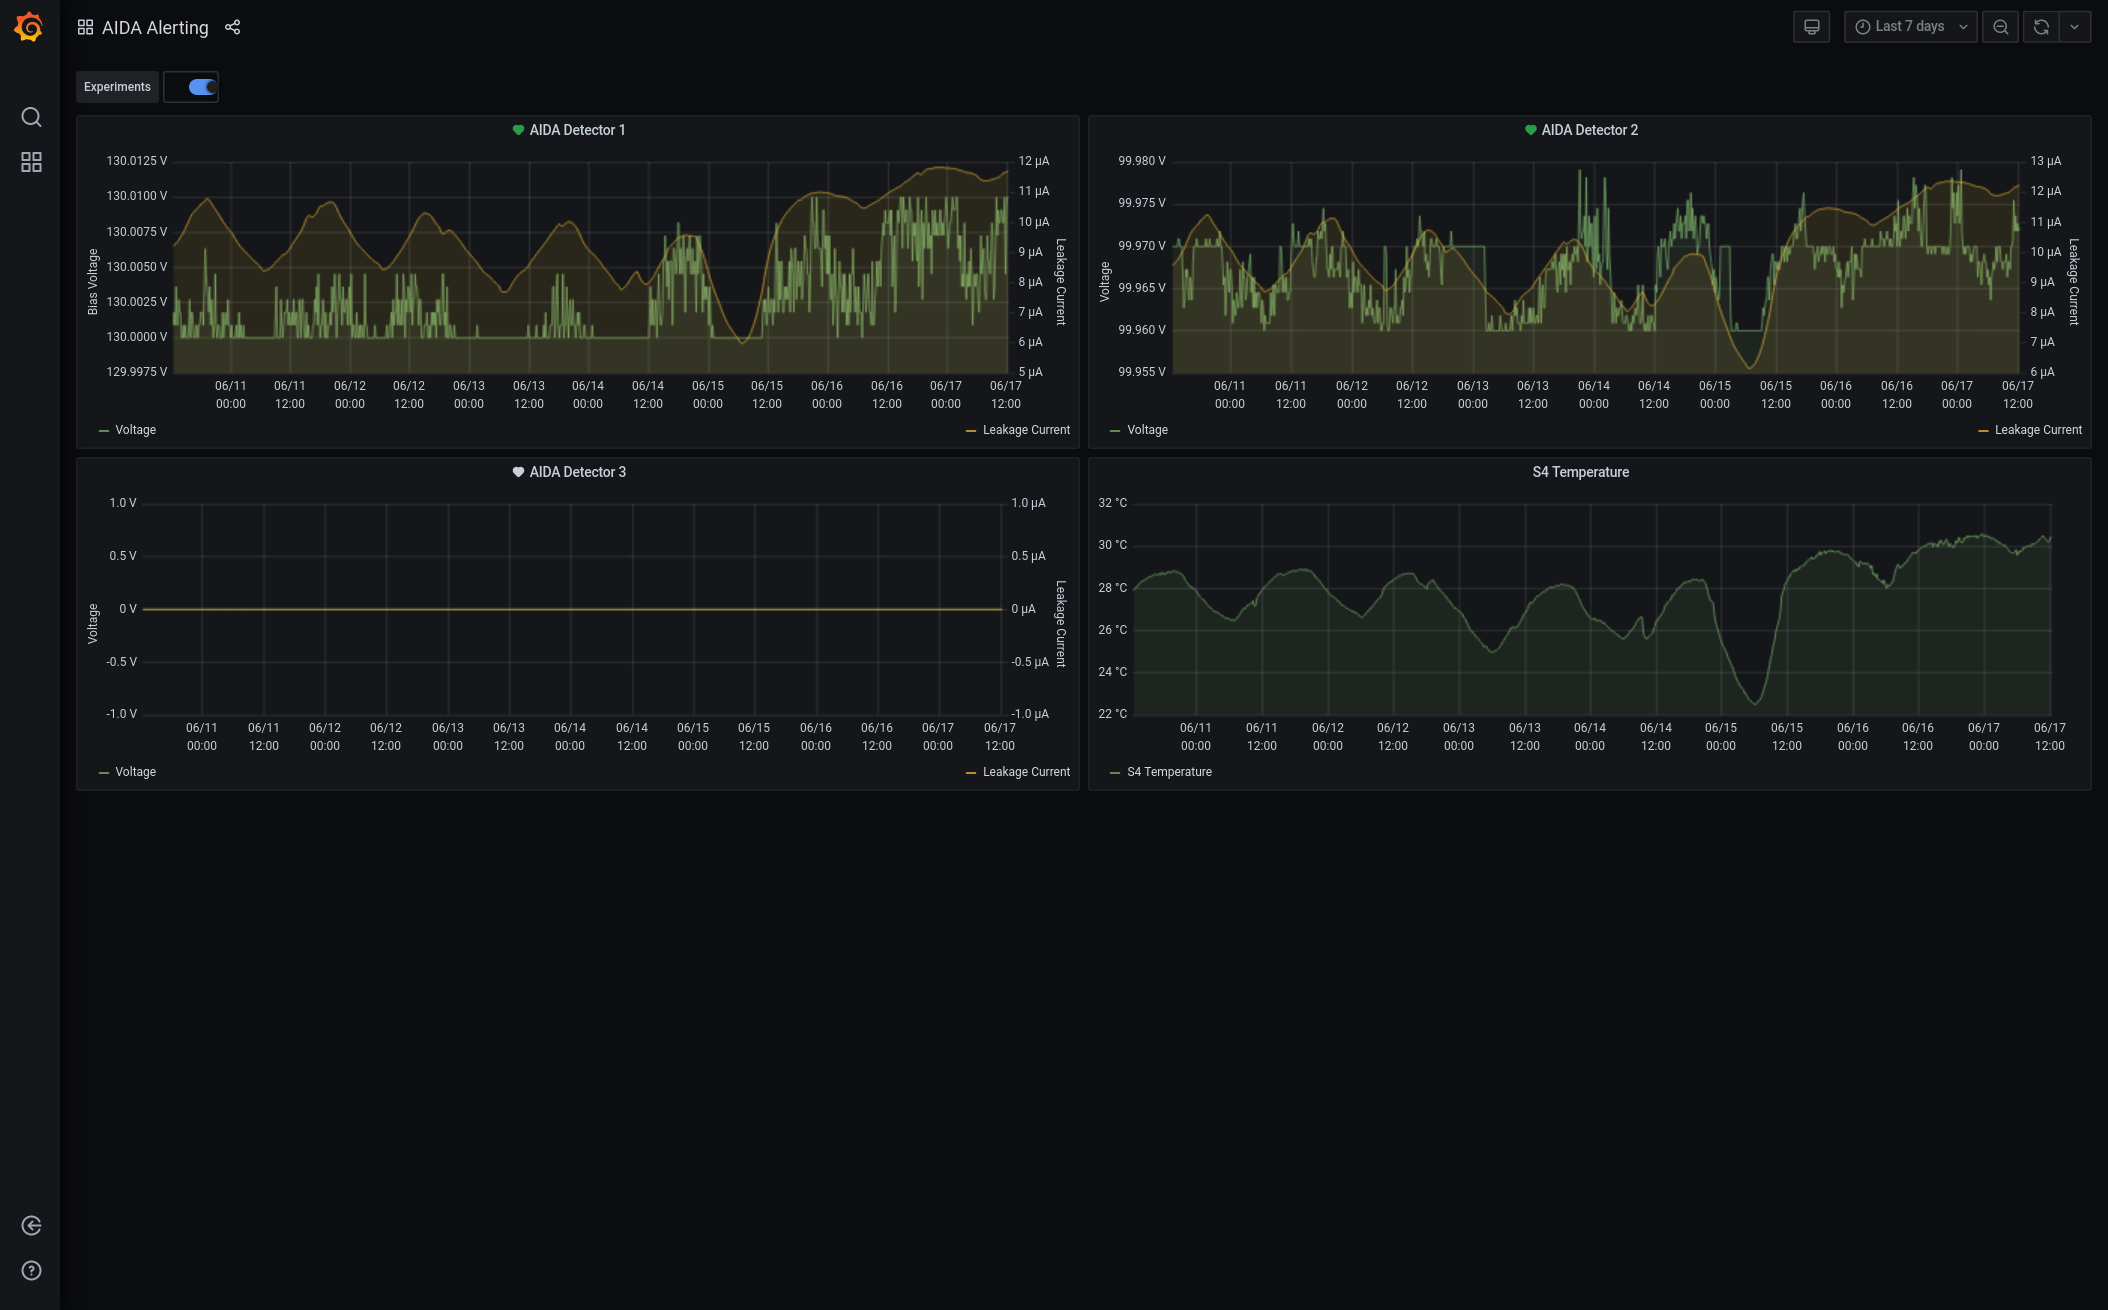
      Bias and leakage current ok - attachment 3

09:58 System wide checks ok - WR difference at 111
      Statistics ok - attachment 4
      Temperature ok - attachment 5
      Bias and leakage current ok - attachment 6

      Max deadtime this morning has been around 5.5% on FEE8

12:32 System wide checks ok - WR difference at 111
      Statistics ok - attachment 7
      Temperature ok - attachment 9
      Bias and leakage current ok - attachment 8
Attachment 1: 210521_0829_Stats.png
210521_0829_Stats.png
Attachment 2: 210521_0829_Temp.png
210521_0829_Temp.png
Attachment 3: 210521_0830_Bias.png
210521_0830_Bias.png
Attachment 4: 210521_0957.png
210521_0957.png
Attachment 5: 210521_0957_Temp.png
210521_0957_Temp.png
Attachment 6: 210521_0958_Bias.png
210521_0958_Bias.png
Attachment 7: 210521_1232_Stats.png
210521_1232_Stats.png
Attachment 8: 210521_1233_Bias.png
210521_1233_Bias.png
Attachment 9: 210521_1233_Temp.png
210521_1233_Temp.png
  340   Fri May 21 06:09:28 2021 MLsystem wide checks

System  wide checks at 7am CET

All seems fine, nothing significant to report

Slight increase of dead time noted in FEE 3, 5 and 7.

-----
Clock status test result: Passed 16, Failed 0

Understand status as follows
Status bit 3 : firmware PLL that creates clocks from external clock not locked
Status bit 2 : always logic '1'
Status bit 1 : LMK3200(2) PLL and clock distribution chip not locked to external clock
Status bit 0 : LMK3200(1) PLL and clock distribution chip not locked to external clock
If all these bits are not set then the operation of the firmware is unreliable

-----

ADC calibration

FEE64 module aida01 failed
FEE64 module aida02 failed
FEE64 module aida03 failed
FEE64 module aida04 failed
FEE64 module aida05 failed
FEE64 module aida06 failed
FEE64 module aida07 failed
FEE64 module aida08 failed
FEE64 module aida09 failed
FEE64 module aida10 failed
FEE64 module aida11 failed
FEE64 module aida12 failed
FEE64 module aida13 failed
FEE64 module aida14 failed
FEE64 module aida15 failed
FEE64 module aida16 failed
Calibration test result: Passed 0, Failed 16

If any modules fail calibration , check the clock status and open the FADC Align and Control browser page to rerun calibration for that module


-----

White Rabbit:

         Base         Current     Difference
aida05 fault      0x500 :      0x56e :      110  
White Rabbit error counter test result: Passed 15, Failed 1

Understand the status reports as follows:-
Status bit 3 : White Rabbit decoder detected an error in the received data
Status bit 2 : Firmware registered WR error, no reload of Timestamp
Status bit 0 : White Rabbit decoder reports uncertain of Timestamp information from WR

-----

FPGA Timestamp error counter test result: Passed 16, Failed 0
If any of these counts are reported as in error
The ASIC readout system has detected a timeslip.
That is the timestamp read from the time FIFO is not younger than the last

-----

Returned 0 0 0 0 0 0 0 0 0 0 0 0 0 0 0 0  
Mem(KB) :    4    8    16    32    64    128    256    512    1k    2k    4k
aida01 :     23      5      6      5      0      4      1      3      3      3      6   : 36484
aida02 :     10      3      3      2      3      2      2      2      3      3      6   : 35952
aida03 :      2      5      1      4      5      2      2      3      3      3      6   : 36608
aida04 :      1      3      4      0      4      3      2      3      3      3      6   : 36572
aida05 :     19      9      3      2      2      3      1      3      4      3      6   : 37380
aida06 :     13     11      1      5      3      4      4      2      3      3      6   : 36860
aida07 :     12      2      4      3      3      2      1      3      2      2      7   : 37280
aida08 :     25      5      7      1      1      3      3      3      3      3      6   : 36828
aida09 :     22      5      6      4      1      3      2      3      3      3      6   : 36640
aida10 :     23      8      6      3      2      3      2      2      2      4      6   : 37212
aida11 :     24     14      7      3      3      2      3      3      3      3      6   : 36960
aida12 :     16     10      5      3      1      2      1      2      4      3      6   : 36736
aida13 :     23      6      4      2      2      3      2      3      3      3      6   : 36620
aida14 :     22      7      8      4      3      4      1      2      2      4      6   : 37200
aida15 :     10     12      9      2      1      3      1      3      3      3      6   : 36376
aida16 :     18      5      6      2      0      3      2      4      3      3      6   : 37008


Attachment 1: 2021-05-21_7h00_LeakCurrent.png
2021-05-21_7h00_LeakCurrent.png
Attachment 2: 2021-05-21_7h00_Stats_GoodEvents.png
2021-05-21_7h00_Stats_GoodEvents.png
Attachment 3: 2021-05-21_7h00_Stats_ADCitems.png
2021-05-21_7h00_Stats_ADCitems.png
Attachment 4: 2021-05-21_7h00_stats_Correlation.png
2021-05-21_7h00_stats_Correlation.png
Attachment 5: 2021-05-21_7h00_Stats_PAUSE.png
2021-05-21_7h00_Stats_PAUSE.png
Attachment 6: 2021-05-21_7h00_Stats_RESUME.png
2021-05-21_7h00_Stats_RESUME.png
Attachment 7: 2021-05-21_7h00_temperature.png
2021-05-21_7h00_temperature.png
Attachment 8: 2021-05-21_7h00_ucesb.png
2021-05-21_7h00_ucesb.png
  339   Fri May 21 02:17:47 2021 MLsystem wide checks

Wide check at 3am -

All fine.

Same output as at the beginning of the shift (see my previous entry) and attachments.


Attachment 1: 2021-05-21_3h05_Leakcurrent.png
2021-05-21_3h05_Leakcurrent.png
Attachment 2: 2021-05-21_3h05_stats_adcItem.png
2021-05-21_3h05_stats_adcItem.png
Attachment 3: 2021-05-21_3h05_stats_Correlation.png
2021-05-21_3h05_stats_Correlation.png
Attachment 4: 2021-05-21_3h05_stats_GoodEvents.png
2021-05-21_3h05_stats_GoodEvents.png
Attachment 5: 2021-05-21_3h05_stats_PAUSE.png
2021-05-21_3h05_stats_PAUSE.png
Attachment 6: 2021-05-21_3h05_stats_RESUME.png
2021-05-21_3h05_stats_RESUME.png
Attachment 7: 2021-05-21_3h05_temperature.png
2021-05-21_3h05_temperature.png
Attachment 8: 2021-05-21_3h05_ucesb.png
2021-05-21_3h05_ucesb.png
Attachment 9: 2021-05-21_3h05_aidaGrafana.png
2021-05-21_3h05_aidaGrafana.png
  338   Thu May 20 23:26:11 2021 Marc Labiche (ML)system wide checks

System Wide check at begining of the night shift:

-----

Clock status test result: Passed 16, Failed 0

Understand status as follows
Status bit 3 : firmware PLL that creates clocks from external clock not locked
Status bit 2 : always logic '1'
Status bit 1 : LMK3200(2) PLL and clock distribution chip not locked to external clock
Status bit 0 : LMK3200(1) PLL and clock distribution chip not locked to external clock
If all these bits are not set then the operation of the firmware is unreliable

-----

ADC calibration:
FEE64 module aida01 failed
FEE64 module aida02 failed
FEE64 module aida03 failed
FEE64 module aida04 failed
FEE64 module aida05 failed
FEE64 module aida06 failed
FEE64 module aida07 failed
FEE64 module aida08 failed
FEE64 module aida09 failed
FEE64 module aida10 failed
FEE64 module aida11 failed
FEE64 module aida12 failed
FEE64 module aida13 failed
FEE64 module aida14 failed
FEE64 module aida15 failed
FEE64 module aida16 failed
Calibration test result: Passed 0, Failed 16

If any modules fail calibration , check the clock status and open the FADC Align and Control browser page to rerun calibration for that module

-----

White rabbit status:

         Base         Current     Difference
aida05 fault      0x500 :      0x56d :      109  
White Rabbit error counter test result: Passed 15, Failed 1

Understand the status reports as follows:-
Status bit 3 : White Rabbit decoder detected an error in the received data
Status bit 2 : Firmware registered WR error, no reload of Timestamp
Status bit 0 : White Rabbit decoder reports uncertain of Timestamp information from WR

-----

FPGA Timestamp error counter test result: Passed 16, Failed 0
If any of these counts are reported as in error
The ASIC readout system has detected a timeslip.
That is the timestamp read from the time FIFO is not younger than the last

-----

Memory info from FEE cards

Returned 0 0 0 0 0 0 0 0 0 0 0 0 0 0 0 0  
Mem(KB) :    4    8    16    32    64    128    256    512    1k    2k    4k
aida01 :     20      7      7      6      1      5      2      2      3      3      6   : 36472
aida02 :     19      5      4      4      4      3      3      3      2      3      6   : 36020
aida03 :     22     10      2      2      5      2      2      3      3      3      6   : 36680
aida04 :     12      7      1      0      4      3      1      4      3      3      6   : 36856
aida05 :     16      7      5      3      1      3      2      3      3      3      6   : 36584
aida06 :     20      7      5      6      2      4      4      2      3      3      6   : 36888
aida07 :     13      7      5      2      3      2      1      3      2      2      7   : 37308
aida08 :     18      7      5      3      0      2      3      3      3      3      6   : 36656
aida09 :     21      6      4      4      1      4      2      3      3      3      6   : 36740
aida10 :     21     10      2      3      2      3      2      2      2      4      6   : 37156
aida11 :     23      2      4      4      3      2      2      3      2      4      6   : 37612
aida12 :     24      1      4      3      2      2      1      2      4      3      6   : 36744
aida13 :     26      9      4      2      1      4      3      2      3      3      6   : 36464
aida14 :     19      9      9      2      3      4      1      2      2      4      6   : 37156
aida15 :     10      7     10      0      1      3      1      3      3      3      6   : 36288
aida16 :     28      7      3      2      1      3      3      3      3      3      6   : 36824

Attachment 1: 2021-05-21_0h20_ucesb.png
2021-05-21_0h20_ucesb.png
Attachment 2: 2021-05-21_0h10_Leakcurrent.png
2021-05-21_0h10_Leakcurrent.png
Attachment 3: 2021-05-21_0h10_Stat_adcItem.png
2021-05-21_0h10_Stat_adcItem.png
Attachment 4: 2021-05-21_0h10_Stats_Correlation.png
2021-05-21_0h10_Stats_Correlation.png
Attachment 5: 2021-05-21_0h10_Stats_GoodEvents.png
2021-05-21_0h10_Stats_GoodEvents.png
Attachment 6: 2021-05-21_0h10_Stats_PAUSE.png
2021-05-21_0h10_Stats_PAUSE.png
Attachment 7: 2021-05-21_0h10_stats_RESUME.png
2021-05-21_0h10_stats_RESUME.png
Attachment 8: 2021-05-21_0h10_temperature.png
2021-05-21_0h10_temperature.png
Attachment 9: 2021-05-21_0h30_AIDAgrafana.png
2021-05-21_0h30_AIDAgrafana.png
  337   Thu May 20 14:56:33 2021 OHThursday 20th May 16:00 - 24:00
16:00 p+n threshold 0xc (120keV)
      n+n threshold DSSD2 0x20 (250keV) ASICS 1-3, 0x64 ASIC4
      n+n threshold DSSD2 0x19 (250keV) ASICS 1-3, 0x64 ASIC4

      Dead time has increased from yesterday. From the elog this appears to coincide with their changing of the spill structure.

17:30 Grafana informs us we have hit 10uA on DSSD2. This is fine with the size of the detector

18:12 Gregor noticed that at 18:02 the rate in AIDA increased. This could be related to the autofill starting around now.
      The deadtimes in FEE6 and 8 have risen to around 6.25%.
      Looking at this mornings and yesterday evenings fill times this behavior isn't observed

18:30 The rates still seem to be increased so is unlikely to be due to the filling which finished at least 10 minutes ago

18:49 Have tried raising the thresholds to 0x1a for the y side strips of DSSD2
      This has brought the deadtime of AIDA06 down to 5.53% (This seems to have just been a statistical fluctuation and the rate went back up again in the next file)

18:12 Raised threshold to 0x1b for ASIC1-3 of FEE6 and 8

18:15 System wide checks ok except WR as usual
	
		 Base 		Current 	Difference
aida05 fault 	 0x500 : 	 0x56d : 	 109  
White Rabbit error counter test result: Passed 15, Failed 1

Understand the status reports as follows:-
Status bit 3 : White Rabbit decoder detected an error in the received data
Status bit 2 : Firmware registered WR error, no reload of Timestamp
Status bit 0 : White Rabbit decoder reports uncertain of Timestamp information from WR

      Statistics increased at 18:02 still working on - attachment 2
      FEE temp - attachment 3
      Bias and leakage current - attachment 4


20:51 System wide checks ok - WR same as before
      Statistics still high - attachment 5
      Temperatures ok - attachment 6
      Bias and leakage currents ok - attachment 7 

22:52 Statistics still high - attachment 8
      Temp ok - attachment 9
      Bias and leakage current ok - attachment 10
      System wide checks ok - WR difference still 109
Attachment 1: 210520_18002_MBSRate.png
210520_18002_MBSRate.png
Attachment 2: 210520_1916_Stats.png
210520_1916_Stats.png
Attachment 3: 210520_1916_Temp.png
210520_1916_Temp.png
Attachment 4: 210520_1917_Bias.png
210520_1917_Bias.png
Attachment 5: 21050_2052_Stats.png
21050_2052_Stats.png
Attachment 6: 210520_2052_Temp.png
210520_2052_Temp.png
Attachment 7: 210520_2053_Bias.png
210520_2053_Bias.png
Attachment 8: 210520_2251_Stats.png
210520_2251_Stats.png
Attachment 9: 210520_2251_Temp.png
210520_2251_Temp.png
Attachment 10: 210520_2254_Bias.png
210520_2254_Bias.png
  336   Thu May 20 07:03:02 2021 CAThursday May 20th 08:00 - 16:00 shift
08:00 CA takes over

08:04 DAQ continues ok - writing to file R14_989

09:30 all system wide checks ok *except* WR decoder status;

      
		 Base 		Current 	Difference
aida05 fault 	 0x500 : 	 0x56a : 	 106  
White Rabbit error counter test result: Passed 15, Failed 1

Understand the status reports as follows:-
Status bit 3 : White Rabbit decoder detected an error in the received data
Status bit 2 : Firmware registered WR error, no reload of Timestamp
Status bit 0 : White Rabbit decoder reports uncertain of Timestamp information from WR

09:34 temperatures ok - attachment 1
      stats ok - attachment 2
      bias/leakage currents ok - attachment 3
      R14_1016 analysis - max deadtime ~4.3% - attachment 4

11:30 all system wide checks ok *except* WR decoder status;

		 Base 		Current 	Difference
aida05 fault 	 0x500 : 	 0x56b : 	 107  
White Rabbit error counter test result: Passed 15, Failed 1

Understand the status reports as follows:-
Status bit 3 : White Rabbit decoder detected an error in the received data
Status bit 2 : Firmware registered WR error, no reload of Timestamp
Status bit 0 : White Rabbit decoder reports uncertain of Timestamp information from WR

11:34 temperatures ok - attachment 5
      stats ok - attachment 6
      bias/leakage currents ok - attachment 7
      R14_1052 analysis - max deadtime ~3.6% - attachment 8

13:05 beam optimisation currently taking place
      DAQ continues ok and writing to file R14_1085

13:17 no beam

13:28 all system wide checks ok, WR decoder status difference same as entry at 11:30.

13:31 temperatures ok - attachment 9
      stats ok - attachment 10
      bias/leakage currents ok - attachment 11
      R14_1085 analysis (beam off) - max deadtime ~1.34% - attachment 12

13:37 beam is back - rate spectra - attachment 13
      DAQ ok - writing to file R14_1088

13:43 analysis of R14_1088 - max deadtime back up to ~4.5% - attachment 14

14:21 beam off - issue with UNILAC
      DESPEC also report issues with their DAQ
      AIDA continues to forward data to MBS ok - lower rates while beam off

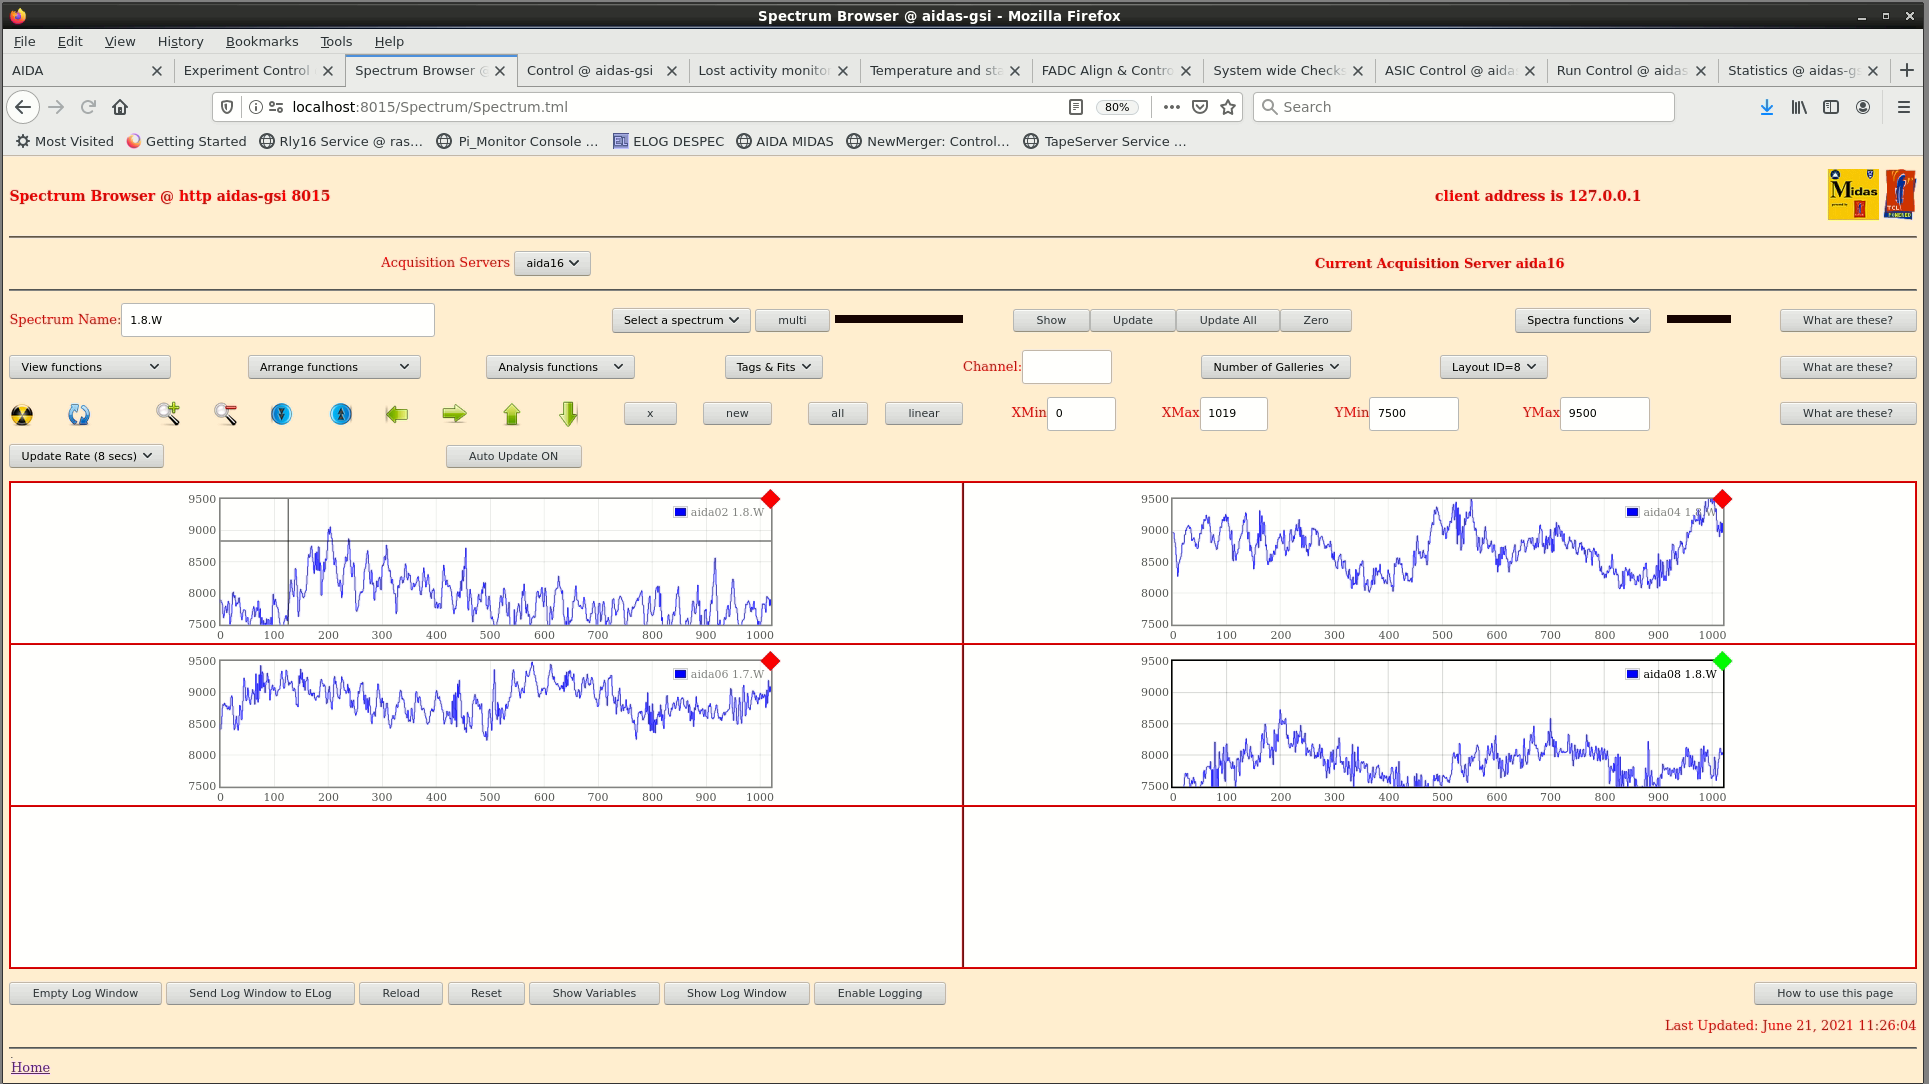
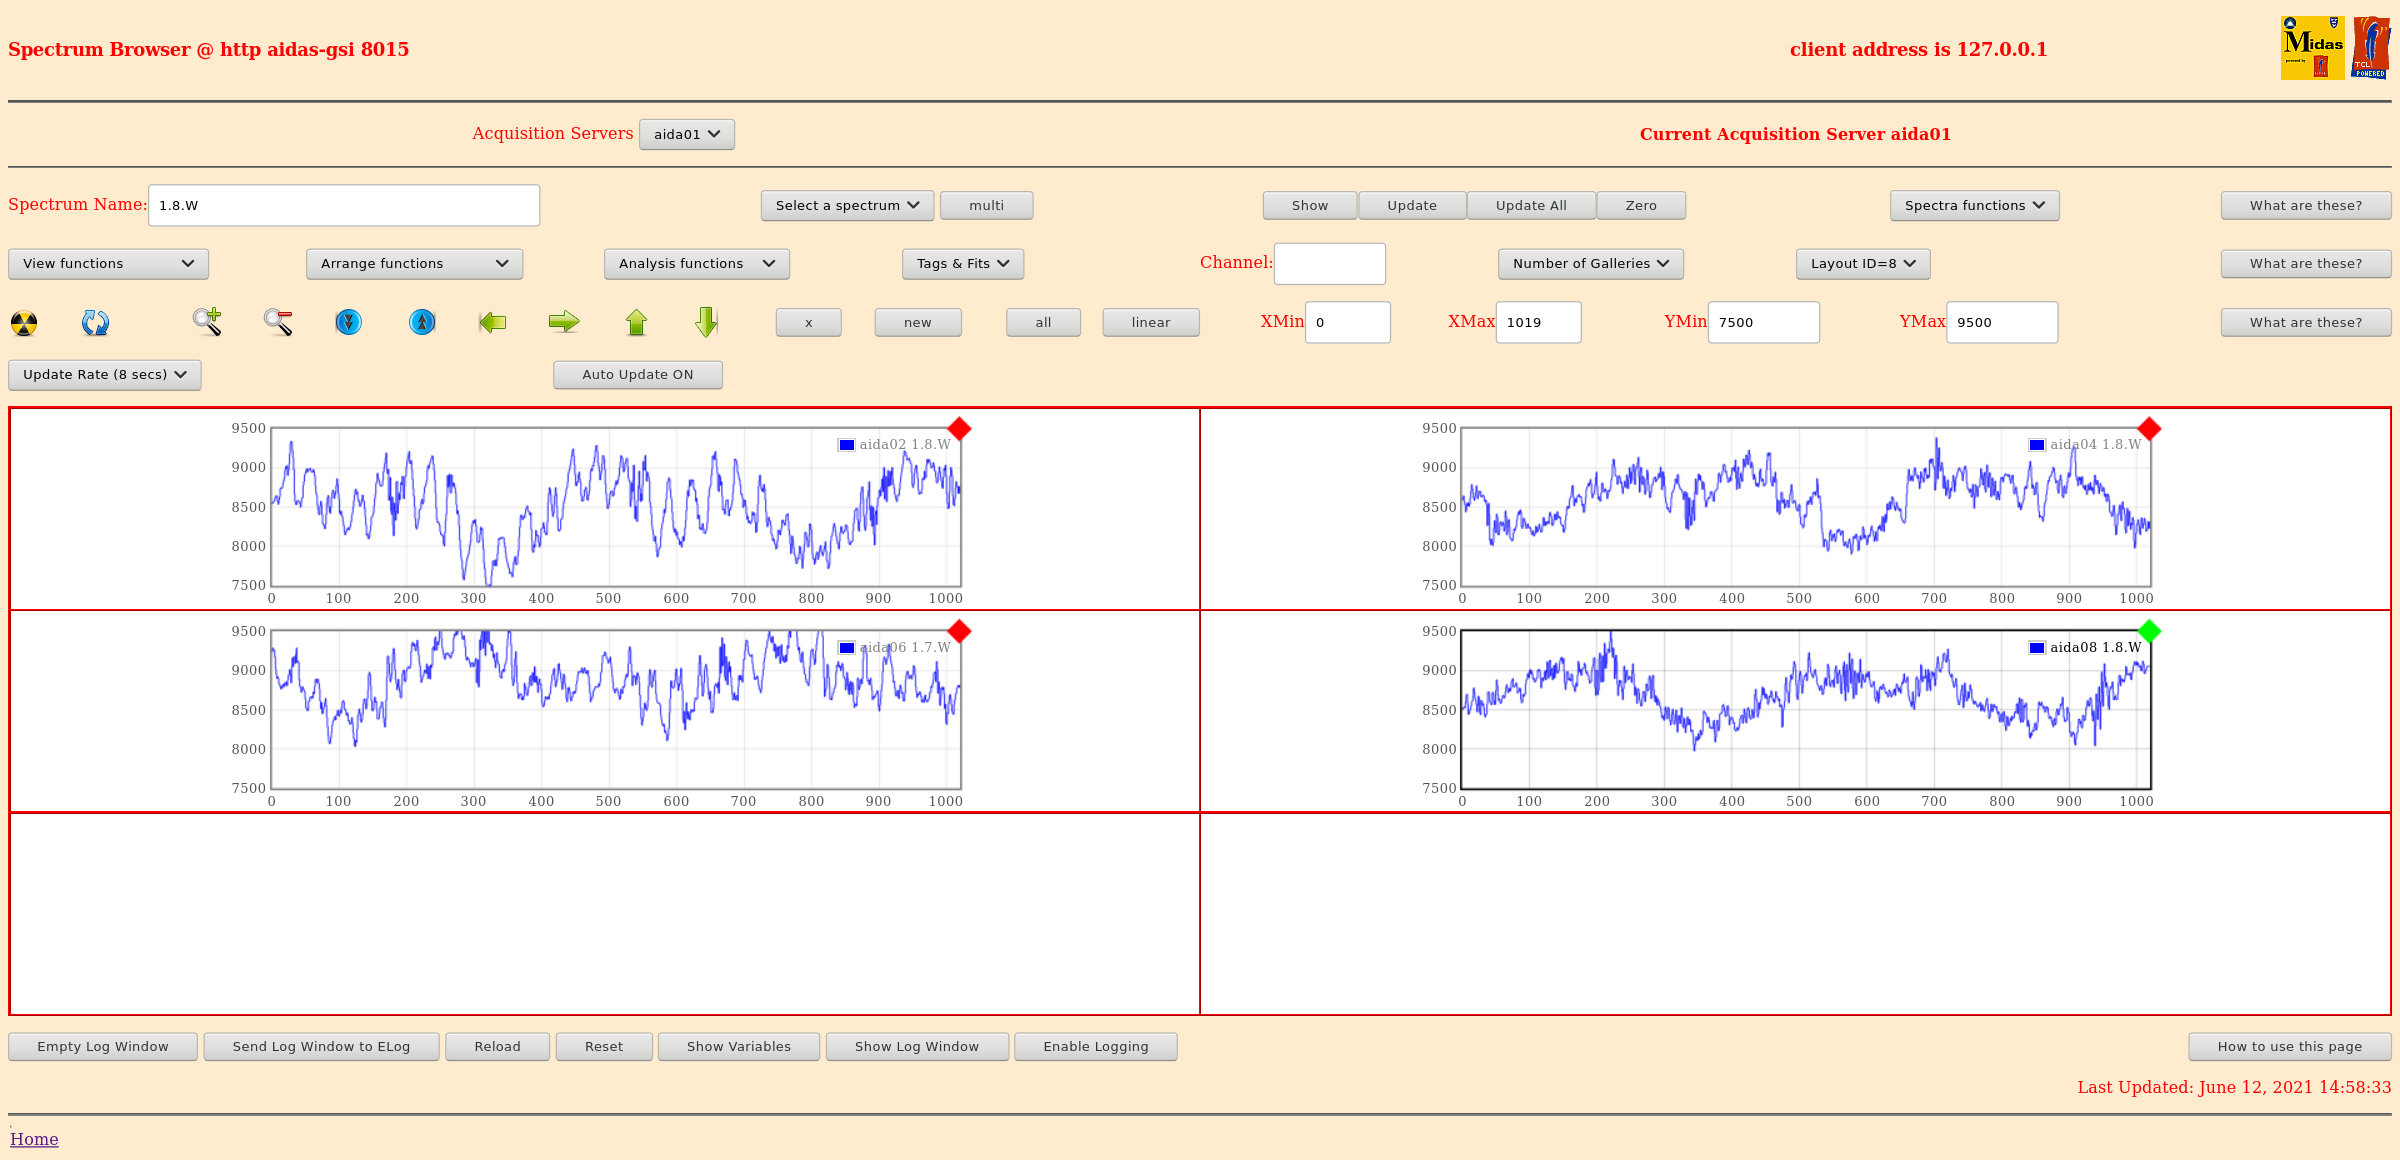
14.30 1.8.H spectra - attachments 16-18
      1.8.L spectra - attachments 19-22
       aida01 pulser peak width 99 ch FWHM
      Rate spectra - attachment 23
      Grafana - DSSSD bias & leakage currents past 7 days - attachment 24
      DSSSD bias & leakage currents - attachment 25
      Merger/Tape Server/Merger stats - attachment 26


14.41 All histograms & stats zero'd

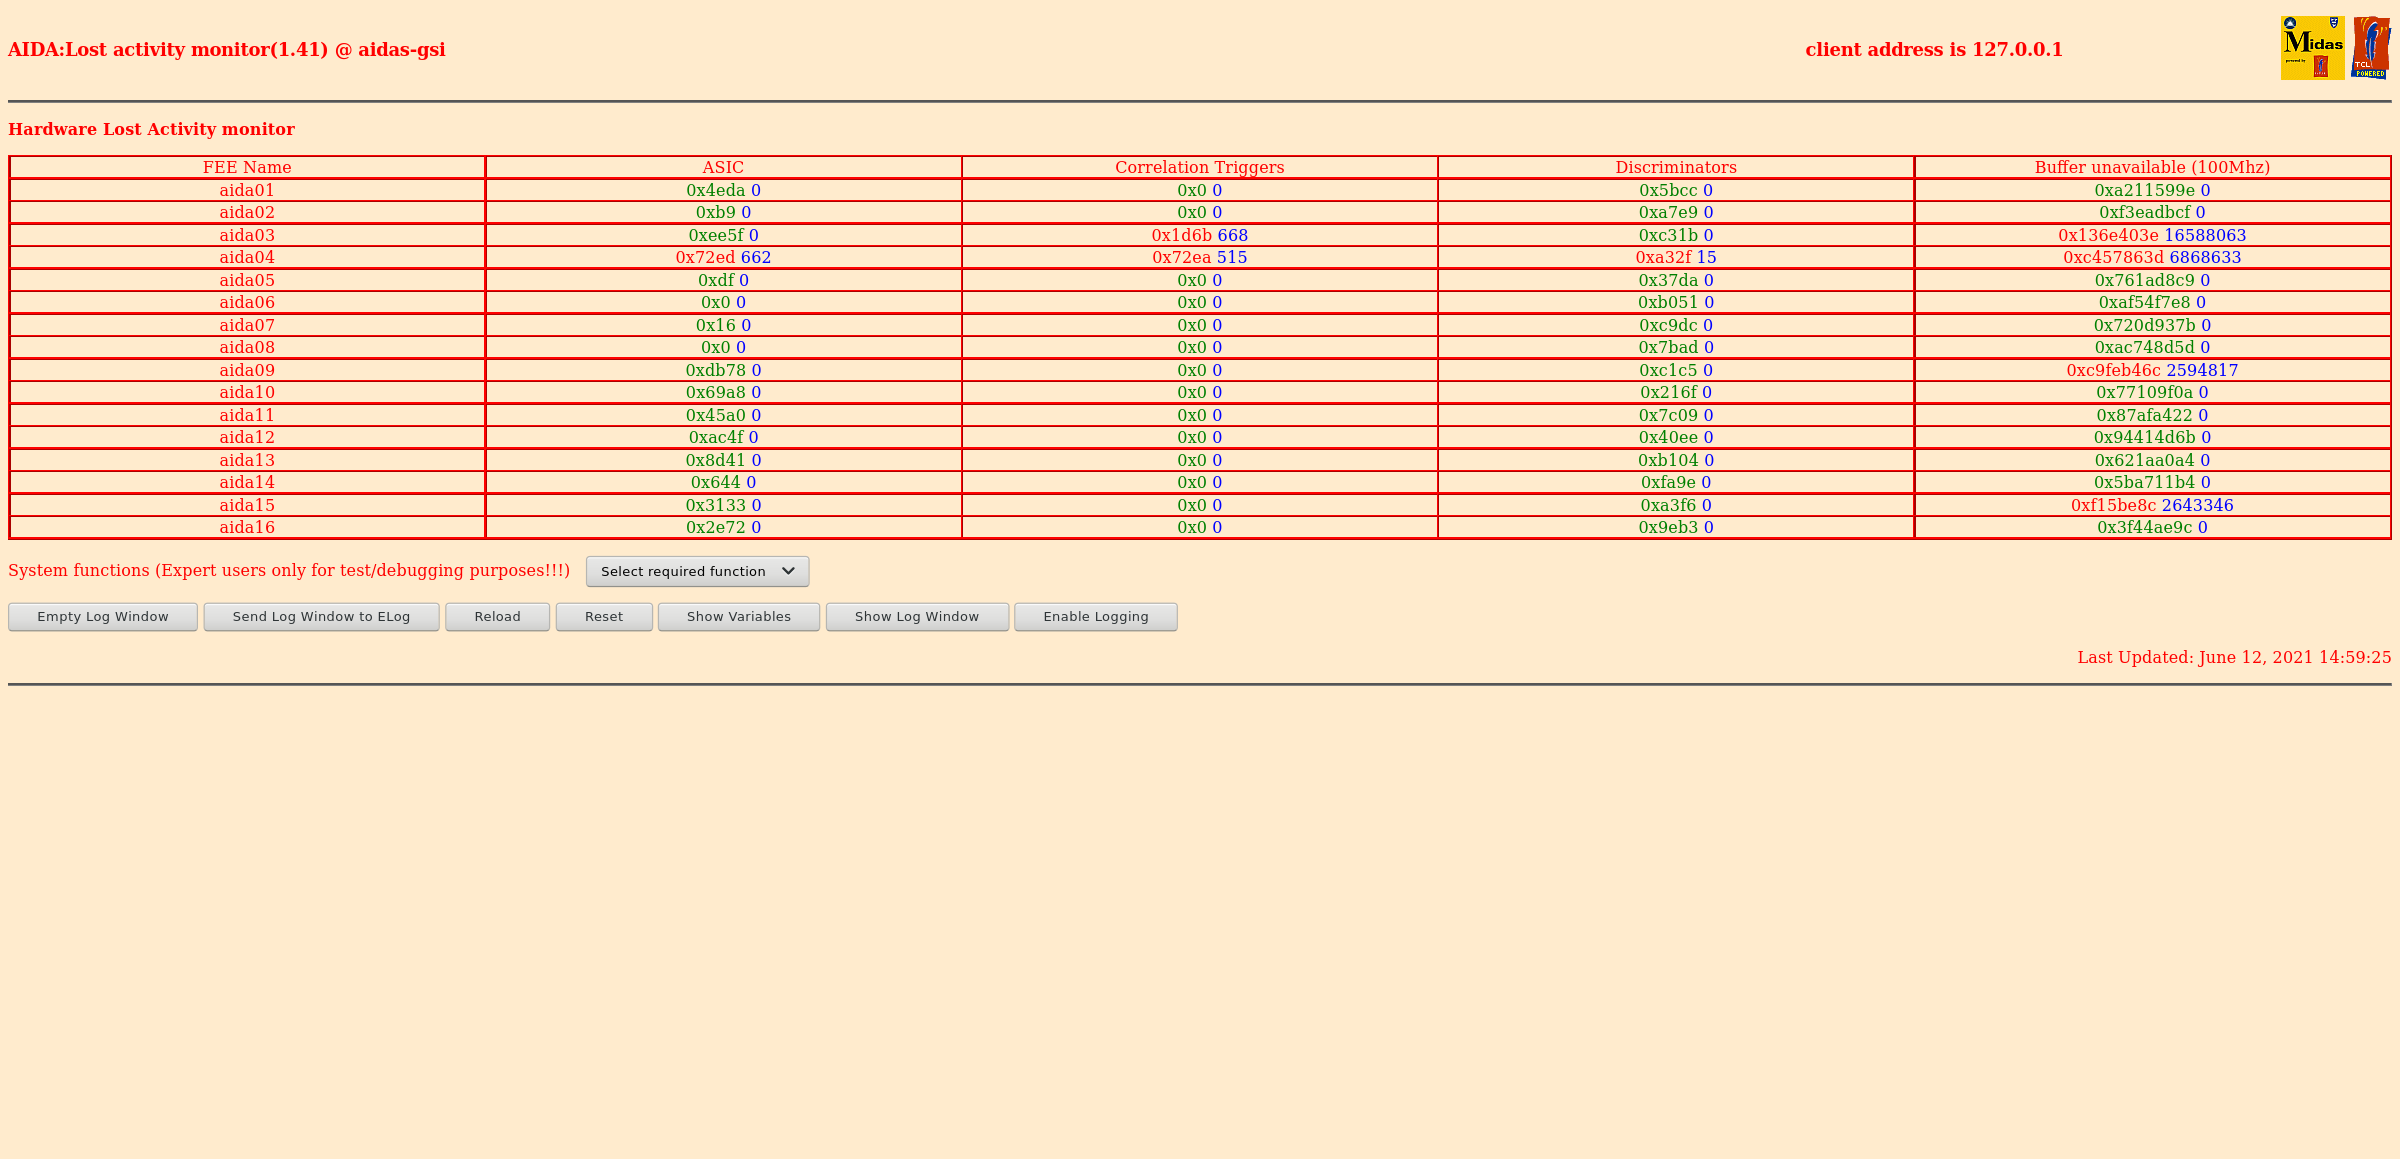
14.55 Lost Activity Monitors - attachments 27, 28 & 35
      Stats - ADC data items, disc, good wave, WR 28-47, pause, correlation scaler

15:00 beam is back

15:05 AIDA writing to file R14_1108
      ADC data items - attachment 36

15:27 system wide checks ok *except* WR decoder status

      		 Base 		Current 	Difference
aida05 fault 	 0x500 : 	 0x56c : 	 108  
White Rabbit error counter test result: Passed 15, Failed 1

Understand the status reports as follows:-
Status bit 3 : White Rabbit decoder detected an error in the received data
Status bit 2 : Firmware registered WR error, no reload of Timestamp
Status bit 0 : White Rabbit decoder reports uncertain of Timestamp information from WR

15:30 temperatures ok - attachment 37
      stats ok - attachment 38
      bias/leakage currents ok - attachment 39
      R14_1113 analysis (beam off) - max deadtime ~4% - attachment 40
Attachment 1: Screenshot_from_2021-05-20_08-33-49.png
Screenshot_from_2021-05-20_08-33-49.png
Attachment 2: Screenshot_from_2021-05-20_08-34-10.png
Screenshot_from_2021-05-20_08-34-10.png
Attachment 3: Screenshot_from_2021-05-20_08-34-44.png
Screenshot_from_2021-05-20_08-34-44.png
Attachment 4: Screenshot_from_2021-05-20_08-37-13.png
Screenshot_from_2021-05-20_08-37-13.png
Attachment 5: Screenshot_from_2021-05-20_10-32-22.png
Screenshot_from_2021-05-20_10-32-22.png
Attachment 6: Screenshot_from_2021-05-20_10-32-47.png
Screenshot_from_2021-05-20_10-32-47.png
Attachment 7: Screenshot_from_2021-05-20_10-33-04.png
Screenshot_from_2021-05-20_10-33-04.png
Attachment 8: Screenshot_from_2021-05-20_10-36-31.png
Screenshot_from_2021-05-20_10-36-31.png
Attachment 9: Screenshot_from_2021-05-20_12-29-26.png
Screenshot_from_2021-05-20_12-29-26.png
Attachment 10: Screenshot_from_2021-05-20_12-29-49.png
Screenshot_from_2021-05-20_12-29-49.png
Attachment 11: Screenshot_from_2021-05-20_12-30-20.png
Screenshot_from_2021-05-20_12-30-20.png
Attachment 12: Screenshot_from_2021-05-20_12-33-48.png
Screenshot_from_2021-05-20_12-33-48.png
Attachment 13: Screenshot_from_2021-05-20_12-38-42.png
Screenshot_from_2021-05-20_12-38-42.png
Attachment 14: Screenshot_from_2021-05-20_12-38-42.png
Screenshot_from_2021-05-20_12-38-42.png
Attachment 15: Screenshot_from_2021-05-20_12-43-18.png
Screenshot_from_2021-05-20_12-43-18.png
Attachment 16: Screenshot_2021-05-20_Spectrum_Browser_aidas-gsi(7).png
Screenshot_2021-05-20_Spectrum_Browser_aidas-gsi(7).png
Attachment 17: Screenshot_2021-05-20_Spectrum_Browser_aidas-gsi(6).png
Screenshot_2021-05-20_Spectrum_Browser_aidas-gsi(6).png
Attachment 18: Screenshot_2021-05-20_Spectrum_Browser_aidas-gsi(5).png
Screenshot_2021-05-20_Spectrum_Browser_aidas-gsi(5).png
Attachment 19: Screenshot_2021-05-20_Spectrum_Browser_aidas-gsi(4).png
Screenshot_2021-05-20_Spectrum_Browser_aidas-gsi(4).png
Attachment 20: Screenshot_2021-05-20_Spectrum_Browser_aidas-gsi(3).png
Screenshot_2021-05-20_Spectrum_Browser_aidas-gsi(3).png
Attachment 21: Screenshot_2021-05-20_Spectrum_Browser_aidas-gsi(2).png
Screenshot_2021-05-20_Spectrum_Browser_aidas-gsi(2).png
Attachment 22: Screenshot_2021-05-20_Spectrum_Browser_aidas-gsi(1).png
Screenshot_2021-05-20_Spectrum_Browser_aidas-gsi(1).png
Attachment 23: Screenshot_2021-05-20_Spectrum_Browser_aidas-gsi.png
Screenshot_2021-05-20_Spectrum_Browser_aidas-gsi.png
Attachment 24: Screenshot_2021-05-20_AIDA_Alerting_-_Grafana.png
Screenshot_2021-05-20_AIDA_Alerting_-_Grafana.png
Attachment 25: 710.png
710.png
Attachment 26: 711.png
711.png
Attachment 27: Screenshot_2021-05-20_Lost_activity_monitor_aidas-gsi(2).png
Screenshot_2021-05-20_Lost_activity_monitor_aidas-gsi(2).png
Attachment 28: Screenshot_2021-05-20_Lost_activity_monitor_aidas-gsi(1).png
Screenshot_2021-05-20_Lost_activity_monitor_aidas-gsi(1).png
Attachment 29: Screenshot_2021-05-20_Statistics_aidas-gsi(5).png
Screenshot_2021-05-20_Statistics_aidas-gsi(5).png
Attachment 30: Screenshot_2021-05-20_Statistics_aidas-gsi(4).png
Screenshot_2021-05-20_Statistics_aidas-gsi(4).png
Attachment 31: Screenshot_2021-05-20_Statistics_aidas-gsi(3).png
Screenshot_2021-05-20_Statistics_aidas-gsi(3).png
Attachment 32: Screenshot_2021-05-20_Statistics_aidas-gsi(2).png
Screenshot_2021-05-20_Statistics_aidas-gsi(2).png
Attachment 33: Screenshot_2021-05-20_Statistics_aidas-gsi(1).png
Screenshot_2021-05-20_Statistics_aidas-gsi(1).png
Attachment 34: Screenshot_2021-05-20_Statistics_aidas-gsi.png
Screenshot_2021-05-20_Statistics_aidas-gsi.png
Attachment 35: Screenshot_2021-05-20_Lost_activity_monitor_aidas-gsi.png
Screenshot_2021-05-20_Lost_activity_monitor_aidas-gsi.png
Attachment 36: Screenshot_from_2021-05-20_14-07-22.png
Screenshot_from_2021-05-20_14-07-22.png
Attachment 37: Screenshot_from_2021-05-20_14-28-33.png
Screenshot_from_2021-05-20_14-28-33.png
Attachment 38: Screenshot_from_2021-05-20_14-29-04.png
Screenshot_from_2021-05-20_14-29-04.png
Attachment 39: Screenshot_from_2021-05-20_14-29-18.png
Screenshot_from_2021-05-20_14-29-18.png
Attachment 40: Screenshot_from_2021-05-20_14-31-50.png
Screenshot_from_2021-05-20_14-31-50.png
  335   Thu May 20 01:00:30 2021 MuneerahThu May 20 00:00-08:00

02:00 System check

The ucesb has stopped around 00:26, the team in the lab ask us to restart AIDA! Called OH for this but the team in the lab figured out thats no need to restart AIDA!

The rates on ucesb got back to work by around 01:12

Deat Time check ok R14_870, attachment 1

Statistics are ok attachment 2

Temperatures are ok attacment 3

Voltages are ok attachment 4


system wide check

All ok except

ADC calibration all failed

   
FEE64 module aida01 failed
FEE64 module aida02 failed
FEE64 module aida03 failed
FEE64 module aida04 failed
FEE64 module aida05 failed
FEE64 module aida06 failed
FEE64 module aida07 failed
FEE64 module aida08 failed
FEE64 module aida09 failed
FEE64 module aida10 failed
FEE64 module aida11 failed
FEE64 module aida12 failed
FEE64 module aida13 failed
FEE64 module aida14 failed
FEE64 module aida15 failed
FEE64 module aida16 failed
Calibration test result: Passed 0, Failed 16

If any modules fail calibration , check the clock status and open the FADC Align and Control browser page to rerun calibration for that module


White rabbite

1 failed

   
         Base         Current     Difference
aida05 fault      0x500 :      0x569 :      105  
White Rabbit error counter test result: Passed 15, Failed 1

Understand the status reports as follows:-
Status bit 3 : White Rabbit decoder detected an error in the received data
Status bit 2 : Firmware registered WR error, no reload of Timestamp
Status bit 0 : White Rabbit decoder reports uncertain of Timestamp information from WR


memory information

   
Returned 0 0 0 0 0 0 0 0 0 0 0 0 0 0 0 0  
Mem(KB) :    4    8    16    32    64    128    256    512    1k    2k    4k
aida01 :     20      8      8      5      0      6      1      2      2      2      7   : 37296
aida02 :     19      8     11      2      3      4      2      2      3      3      6   : 36412
aida03 :     14      6      3      4      1      3      1      3      3      3      6   : 36312
aida04 :     25     12     12      4      3      4      1      4      3      3      6   : 37316
aida05 :      4      8      3      4      1      2      2      4      3      3      6   : 36928
aida06 :     42     12      8      7      2      3      3      4      3      3      6   : 37736
aida07 :     24      6      7      3      3      3      1      3      2      2      7   : 37536
aida08 :     10     15      7      2      1      4      2      3      3      3      6   : 36752
aida09 :     29     13      6      6      4      3      3      3      3      3      6   : 37244
aida10 :     18     12      7      2      2      3      3      2      2      4      6   : 37464
aida11 :     20      8      0      5      5      4      2      3      3      3      6   : 36976
aida12 :      7      2      4      3      2      3      2      2      4      3      6   : 37068
aida13 :      2      5      5      4      2      3      2      3      3      3      6   : 36608
aida14 :      9     13      8      2      2      2      3      3      2      4      6   : 37836
aida15 :     24     12     12      1      0      3      2      3      3      3      6   : 36640
aida16 :     12      9      9      2      1      3      2      4      3      3      6   : 37128

6:45 System check

Temperatures, Voltages, Histograms, Statistics, dead time are all ok attachments 5, 6, 7, 8, 9

System wide check are all ok except:

ADC calibration all failed

   
FEE64 module aida01 failed
FEE64 module aida02 failed
FEE64 module aida03 failed
FEE64 module aida04 failed
FEE64 module aida05 failed
FEE64 module aida06 failed
FEE64 module aida07 failed
FEE64 module aida08 failed
FEE64 module aida09 failed
FEE64 module aida10 failed
FEE64 module aida11 failed
FEE64 module aida12 failed
FEE64 module aida13 failed
FEE64 module aida14 failed
FEE64 module aida15 failed
FEE64 module aida16 failed
Calibration test result: Passed 0, Failed 16

If any modules fail calibration , check the clock status and open the FADC Align and Control browser page to rerun calibration for that module

White rabbit 1 failed

   
         Base         Current     Difference
aida05 fault      0x500 :      0x569 :      105  
White Rabbit error counter test result: Passed 15, Failed 1

Understand the status reports as follows:-
Status bit 3 : White Rabbit decoder detected an error in the received data
Status bit 2 : Firmware registered WR error, no reload of Timestamp
Status bit 0 : White Rabbit decoder reports uncertain of Timestamp information from WR

memory information

   
Returned 0 0 0 0 0 0 0 0 0 0 0 0 0 0 0 0  
Mem(KB) :    4    8    16    32    64    128    256    512    1k    2k    4k
aida01 :     20     11      3      5      0      6      1      2      3      2      7   : 38264
aida02 :     14      9      9      2      3      3      3      2      3      3      6   : 36496
aida03 :     13      7      3      5      2      3      2      3      3      3      6   : 36668
aida04 :     30     15     13      4      3      4      1      3      4      3      6   : 37888
aida05 :     17      9      3      3      1      2      2      4      3      3      6   : 36956
aida06 :     40     16      5      6      2      3      2      3      2      4      6   : 37936
aida07 :      3      2      3      2      3      4      2      2      2      2      7   : 37196
aida08 :     17     10      6      2      1      3      3      3      3      3      6   : 36852
aida09 :     29     11      7      6      3      3      2      4      3      3      6   : 37436
aida10 :      1     10      5      1      1      3      3      2      2      4      6   : 37252
aida11 :     30      9      0      5      4      4      2      3      3      3      6   : 36960
aida12 :     19     10      5      3      2      3      2      2      4      3      6   : 37196
aida13 :     22      9      6      3      2      3      3      3      3      3      6   : 36960
aida14 :     19      6      9      2      2      3      3      2      2      4      6   : 37452
aida15 :      6      8     11      2      1      3      2      3      3      3      6   : 36616
aida16 :     19     14      5      3      1      3      1      4      3      3      6   : 36908


07:33 system check

Deat time, voltages, statistics, temeratuers are all ok, attachment 10, 11, 12, 13

System wide check

all ok except

ADC all failed

White rabbit

1 failed

   
         Base         Current     Difference
aida05 fault      0x500 :      0x569 :      105  
White Rabbit error counter test result: Passed 15, Failed 1

Understand the status reports as follows:-
Status bit 3 : White Rabbit decoder detected an error in the received data
Status bit 2 : Firmware registered WR error, no reload of Timestamp
Status bit 0 : White Rabbit decoder reports uncertain of Timestamp information from WR


memory information

   
Returned 0 0 0 0 0 0 0 0 0 0 0 0 0 0 0 0  
Mem(KB) :    4    8    16    32    64    128    256    512    1k    2k    4k
aida01 :     22      9      4      6      0      5      1      2      2      2      7   : 37152
aida02 :     19      6     13      1      3      3      4      2      3      3      6   : 36780
aida03 :     23      5      6      4      2      3      1      3      3      3      6   : 36452
aida04 :     24     11     14      3      3      4      2      3      3      3      6   : 37048
aida05 :     17      3      6      3      1      2      2      3      3      3      6   : 36444
aida06 :     36     15      4      9      2      4      2      4      3      3      6   : 37608
aida07 :     20      8      5      3      3      4      2      2      2      2      7   : 37376
aida08 :     21     11     10      2      1      4      2      2      2      4      6   : 37324
aida09 :     27     14      7      6      3      3      2      4      3      3      6   : 37452
aida10 :     25      9      5      2      2      3      3      2      2      4      6   : 37436
aida11 :     30     14      2      4      5      3      2      3      3      3      6   : 36936
aida12 :     22      3      5      3      2      3      2      3      3      3      6   : 36640
aida13 :     10      7      1      4      2      3      3      2      3      3      6   : 36336
aida14 :     13      9     12      2      3      3      2      3      2      4      6   : 37820
aida15 :     20      8     11      3      0      3      2      3      3      3      6   : 36640
aida16 :     23      6      6      2      0      2      1      3      4      3      6   : 37164


Attachment 1: 210520_0156_DT.png
210520_0156_DT.png
Attachment 2: 210520_0157_Stats.png
210520_0157_Stats.png
Attachment 3: 210520_0157_Temps.png
210520_0157_Temps.png
Attachment 4: 210520_0157_Voltages.png
210520_0157_Voltages.png
Attachment 5: 210520_0537_Temps.png
210520_0537_Temps.png
Attachment 6: 210520_0539_VOltages.png
210520_0539_VOltages.png
Attachment 7: 210520_0540_Histo.png
210520_0540_Histo.png
Attachment 8: 210520_0541_Rates.png
210520_0541_Rates.png
Attachment 9: 210520_0542_DT.png
210520_0542_DT.png
Attachment 10: 210520_0730_DT.png
210520_0730_DT.png
Attachment 11: 210520_0730_Voltages.png
210520_0730_Voltages.png
Attachment 12: 210520_0731_Stats.png
210520_0731_Stats.png
Attachment 13: 210520_0731_Tems.png
210520_0731_Tems.png
  334   Wed May 19 20:02:27 2021 NHAIDA Dead Time Analysis
Some plots of AIDA dead time (From PAUSE/RESUME data items) against time.

The histograms are binned in intervals of 100 ms, with the blue bars corresponding to dead time in the FEE - the y-value is the percent of the 100ms interval the card was dead.

Beam spills are indicated by the red bars (1 = on spill)

Dead time is mostly dominant in the n+n FEES: fee2, fee4, fee6, fee8 and a 30 second snapshot is shown
Can see deadtime largely seems to occur at the end of a spill - this suggests buffers/queues filling up from the high on-spill rates .

The much quieter p+n strips show a similar pattern but much less frequently.

Deadtime does not always sync up between FEE64s it seems.

IN all case the pause/resume interval seems to only last for less than 100 ms.
Attachment 1: dt_fee2.png
dt_fee2.png
Attachment 2: dt_fee4.png
dt_fee4.png
Attachment 3: dt_fee6.png
dt_fee6.png
Attachment 4: dt_fee8.png
dt_fee8.png
Attachment 5: dt_fee9.png
dt_fee9.png
Attachment 6: dt_fee9_lr.png
dt_fee9_lr.png
  333   Wed May 19 18:50:01 2021 LSWednesday 19th May 20:00 to 24:00
20.00
Stats okay (Fig 1)
Analysed R14_762 deadtimes are okay (Fig 2)

20.30
Stats okay (Fig 3)
Analysed R14_771 deadtimes are okay (Fig 4)

21.00
Stats okay (Fig 5)
FEE temps okay (Fig 6)
Bias (Fig 7)
Rate spectra (Fig 8)

System wide checks okay except white rabbit 1 fail:
		 Base 		Current 	Difference
aida05 fault 	 0x500 : 	 0x569 : 	 105  
White Rabbit error counter test result: Passed 15, Failed 1

Understand the status reports as follows:-
Status bit 3 : White Rabbit decoder detected an error in the received data
Status bit 2 : Firmware registered WR error, no reload of Timestamp
Status bit 0 : White Rabbit decoder reports uncertain of Timestamp information from WR

Merger rate ~2.8M items/s
Tape server ~10MB/s

Analysed R14_781 deadtimes are okay (Fig 9)

21.30
Stats okay (Fig 10)
Analysed R14_789 deadtimes are okay (Fig 11)

22.00
Stats okay (Fig 12)
Analysed R14_799 deadtimes are okay (Fig 13)

22.30
Stats okay (Fig 14)
Analysed R14_807 deadtimes are okay (Fig 15)

23.00
Stats okay (Fig 16)
FEE temps okay (Fig 17)
Bias (Fig 18)

System wide checks okay except white rabbit 1 fail:
		 Base 		Current 	Difference
aida05 fault 	 0x500 : 	 0x569 : 	 105  
White Rabbit error counter test result: Passed 15, Failed 1

Understand the status reports as follows:-
Status bit 3 : White Rabbit decoder detected an error in the received data
Status bit 2 : Firmware registered WR error, no reload of Timestamp
Status bit 0 : White Rabbit decoder reports uncertain of Timestamp information from WR

Merger rate ~3M items/s
Tape server ~10MB/s

Analysed R14_819 deadtimes are okay (Fig 19)

23.30
Stats okay (Fig 20)
Analysed R14_827 deadtimes are okay (Fig 21)
Attachment 1: 210519_Stats_2000.png
210519_Stats_2000.png
Attachment 2: Deadtimes_R14_762.png
Deadtimes_R14_762.png
Attachment 3: 210519_Stats_2030.png
210519_Stats_2030.png
Attachment 4: Deadtimes_R14_771.png
Deadtimes_R14_771.png
Attachment 5: 210519_Stats_2100.png
210519_Stats_2100.png
Attachment 6: 210519_FEEtemps_2100.png
210519_FEEtemps_2100.png
Attachment 7: 210519_BIAS_2100.png
210519_BIAS_2100.png
Attachment 8: 210519_Spectra_2100.png
210519_Spectra_2100.png
Attachment 9: deadtimes_R14_781.png
deadtimes_R14_781.png
Attachment 10: 210519_Stats_2130.png
210519_Stats_2130.png
Attachment 11: deadtimes_R14_789.png
deadtimes_R14_789.png
Attachment 12: 210519_Stats_2200.png
210519_Stats_2200.png
Attachment 13: deadtimes_R14_799.png
deadtimes_R14_799.png
Attachment 14: 210519_Stats_2230.png
210519_Stats_2230.png
Attachment 15: deatimes_R14_807.png
deatimes_R14_807.png
Attachment 16: 210519_Stats_2300.png
210519_Stats_2300.png
Attachment 17: 210519_FEEtemps_2300.png
210519_FEEtemps_2300.png
Attachment 18: 210519_bias_2300.png
210519_bias_2300.png
Attachment 19: deatimes_R14_819.png
deatimes_R14_819.png
Attachment 20: 210519_Stats_2330.png
210519_Stats_2330.png
Attachment 21: deadtimes_R14_827.png
deadtimes_R14_827.png
  332   Wed May 19 14:54:36 2021 CBWednesday 19 May 16:00 - 20:00
15:55 Took over from OH

16:00
Stats OK - attach 1
Temps OK - attach 2
Bias  OK - attach 3

System wide checks
All OK, except ADC all fail (as before) and WR

		 Base 		Current 	Difference
aida05 fault 	 0x500 : 	 0x567 : 	 103  
White Rabbit error counter test result: Passed 15, Failed 1

Understand the status reports as follows:-
Status bit 3 : White Rabbit decoder detected an error in the received data
Status bit 2 : Firmware registered WR error, no reload of Timestamp
Status bit 0 : White Rabbit decoder reports uncertain of Timestamp information from WR

Analysed R14_691. Attach 4. Dead time <5%

16:34 MBS changes file.


17:00
Stats OK - attach 5
Temps OK - as before
System wide checks as before
	
 Collecting the file size of each FEE64 Options CONTENTS file to check they are all the same

 FEE : aida01 =>   Options file size is 1026 	 Last changed Mon May 17 11:43:04 CEST 2021
 FEE : aida02 =>   Options file size is 1014 	 Last changed Thu Apr 29 14:43:46 CEST 2021
 FEE : aida03 =>   Options file size is 1014 	 Last changed Thu Apr 29 14:43:50 CEST 2021
 FEE : aida04 =>   Options file size is 1025 	 Last changed Fri May 14 16:54:56 CEST 2021
 FEE : aida05 =>   Options file size is 1025 	 Last changed Mon May 17 06:25:41 CEST 2021
 FEE : aida06 =>   Options file size is 1014 	 Last changed Thu Apr 29 14:43:59 CEST 2021
 FEE : aida07 =>   Options file size is 1014 	 Last changed Thu Apr 29 14:44:02 CEST 2021
 FEE : aida08 =>   Options file size is 1025 	 Last changed Wed May 05 12:15:54 CEST 2021
 FEE : aida09 =>   Options file size is 1014 	 Last changed Thu Apr 29 14:44:08 CEST 2021
 FEE : aida10 =>   Options file size is 1014 	 Last changed Thu Apr 29 14:44:57 CEST 2021
 FEE : aida11 =>   Options file size is 1014 	 Last changed Thu Apr 29 14:44:57 CEST 2021
 FEE : aida12 =>   Options file size is 1014 	 Last changed Thu Apr 29 14:44:57 CEST 2021
 FEE : aida13 =>   Options file size is 1025 	 Last changed Fri May 07 19:40:34 CEST 2021
 FEE : aida14 =>   Options file size is 1014 	 Last changed Thu Apr 29 14:44:57 CEST 2021
 FEE : aida15 =>   Options file size is 1014 	 Last changed Thu Apr 29 14:44:57 CEST 2021
 FEE : aida16 =>   Options file size is 1014 	 Last changed Thu Apr 29 14:44:57 CEST 2021


17:55
Stats OK - attach 6
Temps OK - as before

Leakage current approaching 10 uA - attach 7

System-wide checks - as before except
		 Base 		Current 	Difference
aida05 fault 	 0x500 : 	 0x568 : 	 104  
White Rabbit error counter test result: Passed 15, Failed 1

Understand the status reports as follows:-
Status bit 3 : White Rabbit decoder detected an error in the received data
Status bit 2 : Firmware registered WR error, no reload of Timestamp
Status bit 0 : White Rabbit decoder reports uncertain of Timestamp information from WR


18:01 MBS switches to new file


18:52
Stats OK - attach 8
Temps OK - as before

System-wide checks as before

Analysed R14_741. Avg. dead time slightly increased to 5.1%. Attach 9

19:36 Stats OK - attach 10
Bias - attach 11

19:48 Shift handed over to LS
Attachment 1: Stats1.png
Stats1.png
Attachment 2: Temps1.png
Temps1.png
Attachment 3: Bias1.png
Bias1.png
Attachment 4: Analysis_R14_691
 *** TDR format 3.3.0 analyser - TD - May 2021
 *** ERROR: READ I/O error:       5002
                   blocks:      32000
          ADC data format:  251761346 (  995725.1 Hz)
        Other data format:   10158654 (   40177.8 Hz)
 Sample trace data format:          0 (       0.0 Hz)
         Undefined format:          0 (       0.0 Hz)
   Other data format type:      PAUSE:        199 (       0.8 Hz)
                               RESUME:        199 (       0.8 Hz)
                              SYNC100:      32942 (     130.3 Hz)
                              WR48-63:      32942 (     130.3 Hz)
                           FEE64 disc:          0 (       0.0 Hz)
                             MBS info:   10092372 (   39915.7 Hz)
                           Other info:          0 (       0.0 Hz)

   ADC data range bit set:     503210 (    1990.2 Hz)

                Timewarps:        ADC:          0 (       0.0 Hz)
                                PAUSE:          0 (       0.0 Hz)
                               RESUME:          0 (       0.0 Hz)
                              SYNC100:          0 (       0.0 Hz)
                              WR48-63:          0 (       0.0 Hz)
                           FEE64 disc:          0 (       0.0 Hz)
                             MBS info:          0 (       0.0 Hz)
                            Undefined:          0 (       0.0 Hz)
                         Sample trace:          0 (       0.0 Hz)

 *** Timestamp elapsed time:      252.842 s
 FEE  elapsed dead time(s) elapsed idle time(s)
  0                0.053               17.526
  1                1.803                0.000
  2                0.604                2.918
  3                3.773                0.000
  4                0.070               17.512
  5                9.601                0.000
  6                0.278                0.000
  7                9.149                0.000
  8                0.114                0.000
  9                0.000               64.964
 10                0.536                0.000
 11                0.070                0.000
 12                0.024                6.415
 13                0.000               66.391
 14                0.036                7.395
 15                0.097                0.000
 16                0.000                0.000
 17                0.000                0.000
 18                0.000                0.000
 19                0.000                0.000
 20                0.000                0.000
 21                0.000                0.000
 22                0.000                0.000
 23                0.000                0.000
 24                0.000                0.000
 25                0.000                0.000
 26                0.000                0.000
 27                0.000                0.000
 28                0.000                0.000
 29                0.000                0.000
 30                0.000                0.000
 31                0.000                0.000
 32                0.000                0.000

 *** Statistics
 FEE  ADC Data Other Data     Sample  Undefined      Pause     Resume    SYNC100    WR48-63       Disc        MBS      Other   HEC Data
  0    6023981       3019          0          0          3          3        749        749          0       1515          0      26768
  1   22620294       5924          0          0         14         14       2948       2948          0          0          0      55394
  2   11082857    2607083          0          0          5          5       1799       1799          0    2603475          0      43681
  3   30564809    2580290          0          0         26         26       4295       4295          0    2571648          0      65104
  4    3958862    1393424          0          0          7          7        678        678          0    1392054          0      11940
  5   37388332     780379          0          0         62         62       4752       4752          0     770751          0      33878
  6   10191568    1631763          0          0          8          8       1480       1480          0    1628787          0      23955
  7   39960208    1134610          0          0         55         55       5179       5179          0    1124142          0      42303
  8   17144158       4230          0          0          3          3       2112       2112          0          0          0      56568
  9    2458065        662          0          0          0          0        331        331          0          0          0       4321
 10   20331742       4810          0          0          6          6       2399       2399          0          0          0      34970
 11   11809904       2968          0          0          4          4       1480       1480          0          0          0      10406
 12    9134013       2250          0          0          1          1       1124       1124          0          0          0      49240
 13    2508032        620          0          0          0          0        310        310          0          0          0       3587
 14    8541585       2182          0          0          2          2       1089       1089          0          0          0      33394
 15   18042936       4440          0          0          3          3       2217       2217          0          0          0       7701
 16          0          0          0          0          0          0          0          0          0          0          0          0
 17          0          0          0          0          0          0          0          0          0          0          0          0
 18          0          0          0          0          0          0          0          0          0          0          0          0
 19          0          0          0          0          0          0          0          0          0          0          0          0
 20          0          0          0          0          0          0          0          0          0          0          0          0
 21          0          0          0          0          0          0          0          0          0          0          0          0
 22          0          0          0          0          0          0          0          0          0          0          0          0
 23          0          0          0          0          0          0          0          0          0          0          0          0
 24          0          0          0          0          0          0          0          0          0          0          0          0
 25          0          0          0          0          0          0          0          0          0          0          0          0
 26          0          0          0          0          0          0          0          0          0          0          0          0
 27          0          0          0          0          0          0          0          0          0          0          0          0
 28          0          0          0          0          0          0          0          0          0          0          0          0
 29          0          0          0          0          0          0          0          0          0          0          0          0
 30          0          0          0          0          0          0          0          0          0          0          0          0
 31          0          0          0          0          0          0          0          0          0          0          0          0
 32          0          0          0          0          0          0          0          0          0          0          0          0

 *** Timewarps
 FEE       ADC      Pause     Resume    SYNC100    WR48-63       Disc        MBS  Undefined    Samples
  0          0          0          0          0          0          0          0          0          0
  1          0          0          0          0          0          0          0          0          0
  2          0          0          0          0          0          0          0          0          0
  3          0          0          0          0          0          0          0          0          0
  4          0          0          0          0          0          0          0          0          0
  5          0          0          0          0          0          0          0          0          0
  6          0          0          0          0          0          0          0          0          0
  7          0          0          0          0          0          0          0          0          0
  8          0          0          0          0          0          0          0          0          0
  9          0          0          0          0          0          0          0          0          0
 10          0          0          0          0          0          0          0          0          0
 11          0          0          0          0          0          0          0          0          0
 12          0          0          0          0          0          0          0          0          0
 13          0          0          0          0          0          0          0          0          0
 14          0          0          0          0          0          0          0          0          0
 15          0          0          0          0          0          0          0          0          0
 16          0          0          0          0          0          0          0          0          0
 17          0          0          0          0          0          0          0          0          0
 18          0          0          0          0          0          0          0          0          0
 19          0          0          0          0          0          0          0          0          0
 20          0          0          0          0          0          0          0          0          0
 21          0          0          0          0          0          0          0          0          0
 22          0          0          0          0          0          0          0          0          0
 23          0          0          0          0          0          0          0          0          0
 24          0          0          0          0          0          0          0          0          0
 25          0          0          0          0          0          0          0          0          0
 26          0          0          0          0          0          0          0          0          0
 27          0          0          0          0          0          0          0          0          0
 28          0          0          0          0          0          0          0          0          0
 29          0          0          0          0          0          0          0          0          0
 30          0          0          0          0          0          0          0          0          0
 31          0          0          0          0          0          0          0          0          0
 32          0          0          0          0          0          0          0          0          0

 *** Program elapsed time:   33.672s (  950.348 blocks/s,  59.397 Mb/s)
Attachment 5: Stats2.png
Stats2.png
Attachment 6: Stats3.png
Stats3.png
Attachment 7: Bias3.png
Bias3.png
Attachment 8: Analysis_R14_741
 *** TDR format 3.3.0 analyser - TD - May 2021
 *** ERROR: READ I/O error:       5002
                   blocks:      32000
          ADC data format:  253670855 ( 1280798.3 Hz)
        Other data format:    8249145 (   41650.4 Hz)
 Sample trace data format:          0 (       0.0 Hz)
         Undefined format:          0 (       0.0 Hz)
   Other data format type:      PAUSE:        236 (       1.2 Hz)
                               RESUME:        236 (       1.2 Hz)
                              SYNC100:      32737 (     165.3 Hz)
                              WR48-63:      32737 (     165.3 Hz)
                           FEE64 disc:          0 (       0.0 Hz)
                             MBS info:    8183199 (   41317.4 Hz)
                           Other info:          0 (       0.0 Hz)

   ADC data range bit set:     413031 (    2085.4 Hz)

                Timewarps:        ADC:          0 (       0.0 Hz)
                                PAUSE:          0 (       0.0 Hz)
                               RESUME:          0 (       0.0 Hz)
                              SYNC100:          0 (       0.0 Hz)
                              WR48-63:          0 (       0.0 Hz)
                           FEE64 disc:          0 (       0.0 Hz)
                             MBS info:          0 (       0.0 Hz)
                            Undefined:          0 (       0.0 Hz)
                         Sample trace:          0 (       0.0 Hz)

 *** Timestamp elapsed time:      198.057 s
 FEE  elapsed dead time(s) elapsed idle time(s)
  0                0.011                2.771
  1                4.649                0.000
  2                0.028                0.000
  3                4.808                0.000
  4                0.111                7.488
  5                7.093                0.000
  6                0.128                0.000
  7               10.340                0.000
  8                0.971                0.000
  9                0.000               24.260
 10                0.713                0.000
 11                0.245                0.000
 12                0.122                0.000
 13                0.000               21.524
 14                0.232                0.000
 15                1.605                0.000
 16                0.000                0.000
 17                0.000                0.000
 18                0.000                0.000
 19                0.000                0.000
 20                0.000                0.000
 21                0.000                0.000
 22                0.000                0.000
 23                0.000                0.000
 24                0.000                0.000
 25                0.000                0.000
 26                0.000                0.000
 27                0.000                0.000
 28                0.000                0.000
 29                0.000                0.000
 30                0.000                0.000
 31                0.000                0.000
 32                0.000                0.000

 *** Statistics
 FEE  ADC Data Other Data     Sample  Undefined      Pause     Resume    SYNC100    WR48-63       Disc        MBS      Other   HEC Data
  0    5709345       2725          0          0          1          1        769        769          0       1185          0      22625
  1   23799538       6034          0          0         27         27       2990       2990          0          0          0      44162
  2   11722022    2092139          0          0          1          1       1767       1767          0    2088603          0      36240
  3   29654318    2044332          0          0         38         38       3940       3940          0    2036376          0      53125
  4    3438629    1158241          0          0          8          8        579        579          0    1157067          0       9655
  5   33876189     636041          0          0         60         60       4396       4396          0     627129          0      27488
  6   10663472    1364583          0          0          5          5       1426       1426          0    1361721          0      20341
  7   38937063     921272          0          0         54         54       5023       5023          0     911118          0      34159
  8   16044621       3966          0          0          9          9       1974       1974          0          0          0      46740
  9    2236927        610          0          0          0          0        305        305          0          0          0       3583
 10   23087850       5792          0          0          6          6       2890       2890          0          0          0      28946
 11   13996775       3362          0          0          8          8       1673       1673          0          0          0       8557
 12    9568717       2316          0          0          4          4       1154       1154          0          0          0      40620
 13    2488330        626          0          0          0          0        313        313          0          0          0       2902
 14    9604847       2392          0          0          6          6       1190       1190          0          0          0      27522
 15   18842212       4714          0          0          9          9       2348       2348          0          0          0       6366
 16          0          0          0          0          0          0          0          0          0          0          0          0
 17          0          0          0          0          0          0          0          0          0          0          0          0
 18          0          0          0          0          0          0          0          0          0          0          0          0
 19          0          0          0          0          0          0          0          0          0          0          0          0
 20          0          0          0          0          0          0          0          0          0          0          0          0
 21          0          0          0          0          0          0          0          0          0          0          0          0
 22          0          0          0          0          0          0          0          0          0          0          0          0
 23          0          0          0          0          0          0          0          0          0          0          0          0
 24          0          0          0          0          0          0          0          0          0          0          0          0
 25          0          0          0          0          0          0          0          0          0          0          0          0
 26          0          0          0          0          0          0          0          0          0          0          0          0
 27          0          0          0          0          0          0          0          0          0          0          0          0
 28          0          0          0          0          0          0          0          0          0          0          0          0
 29          0          0          0          0          0          0          0          0          0          0          0          0
 30          0          0          0          0          0          0          0          0          0          0          0          0
 31          0          0          0          0          0          0          0          0          0          0          0          0
 32          0          0          0          0          0          0          0          0          0          0          0          0

 *** Timewarps
 FEE       ADC      Pause     Resume    SYNC100    WR48-63       Disc        MBS  Undefined    Samples
  0          0          0          0          0          0          0          0          0          0
  1          0          0          0          0          0          0          0          0          0
  2          0          0          0          0          0          0          0          0          0
  3          0          0          0          0          0          0          0          0          0
  4          0          0          0          0          0          0          0          0          0
  5          0          0          0          0          0          0          0          0          0
  6          0          0          0          0          0          0          0          0          0
  7          0          0          0          0          0          0          0          0          0
  8          0          0          0          0          0          0          0          0          0
  9          0          0          0          0          0          0          0          0          0
 10          0          0          0          0          0          0          0          0          0
 11          0          0          0          0          0          0          0          0          0
 12          0          0          0          0          0          0          0          0          0
 13          0          0          0          0          0          0          0          0          0
 14          0          0          0          0          0          0          0          0          0
 15          0          0          0          0          0          0          0          0          0
 16          0          0          0          0          0          0          0          0          0
 17          0          0          0          0          0          0          0          0          0
 18          0          0          0          0          0          0          0          0          0
 19          0          0          0          0          0          0          0          0          0
 20          0          0          0          0          0          0          0          0          0
 21          0          0          0          0          0          0          0          0          0
 22          0          0          0          0          0          0          0          0          0
 23          0          0          0          0          0          0          0          0          0
 24          0          0          0          0          0          0          0          0          0
 25          0          0          0          0          0          0          0          0          0
 26          0          0          0          0          0          0          0          0          0
 27          0          0          0          0          0          0          0          0          0
 28          0          0          0          0          0          0          0          0          0
 29          0          0          0          0          0          0          0          0          0
 30          0          0          0          0          0          0          0          0          0
 31          0          0          0          0          0          0          0          0          0
 32          0          0          0          0          0          0          0          0          0

 *** Program elapsed time:   34.094s (  938.588 blocks/s,  58.662 Mb/s)
Attachment 9: Stats4.png
Stats4.png
Attachment 10: Stats6.png
Stats6.png
Attachment 11: Bias6.png
Bias6.png
  331   Wed May 19 11:24:55 2021 RDPMonday 19 April 12 noon shift
System checks gave 11 passed/1 failed, except for ADC timimgs: 10 passed/2 failed.

FEE64 module aida09 global clocks failed, 6
 Clock status test result: Passed 11, Failed 1

Understand status as follows
Status bit 3 : firmware PLL that creates clocks from external clock not locked
Status bit 2 : always logic '1' 
Status bit 1 : LMK3200(2) PLL and clock distribution chip not locked to external clock
Status bit 0 : LMK3200(1) PLL and clock distribution chip not locked to external clock
If all these bits are not set then the operation of the firmware is unreliable

FEE64 module aida07 failed
FEE64 module aida09 failed
Calibration test result: Passed 10, Failed 2


		 Base 		Current 	Difference
aida07 fault 	 0xd052 : 	 0xd056 : 	 4  
White Rabbit error counter test result: Passed 11, Failed 1

Understand the status reports as follows:-
Status bit 3 : White Rabbit decoder detected an error in the received data
Status bit 2 : Firmware registered WR error, no reload of Timestamp
Status bit 0 : White Rabbit decoder reports uncertain of Timestamp information from WR


			 Base 		Current 		Difference
aida12 fault 	 0x0 : 	 0x16 : 	 22  
FPGA Timestamp error counter test result: Passed 11, Failed 1
If any of these counts are reported as in error
The ASIC readout system has detected a timeslip.
That is the timestamp read from the time FIFO is not younger than the last

If any modules fail calibration , check the clock status and open the FADC Align and Control browser page to rerun calibration for that module


Returned 0 0 0 0 0 0 0 0 0 0 0 0  
Mem(KB) :	4	8	16	32	64	128	256	512	1k	2k	4k
aida01 :      2      6      2      0      5      5      1      2      3      3      6   : 36120
aida02 :     25     10      0      4      3      5      2      3      3      3      6   : 36980
aida03 :     22     12      5      2      1      3      2      3      3      3      6   : 36616
aida04 :     16      3      3      3      4      4      4      2      3      3      6   : 36840
aida05 :     14      5      6      2      3      4      4      2      3      3      6   : 36800
aida06 :     30     10      6      3      3      4      2      3      3      3      6   : 36936
aida07 :     27     11      1      0      0      3      2      3      3      3      6   : 36436
aida08 :     38      7      7      3      3      2      2      3      3      3      6   : 36704
aida09 :      4      6      4      2      4      4      1      4      3      3      6   : 37056
aida10 :     21     10      3      3      1      5      1      3      3      3      6   : 36596
aida11 :     24      8      2      1      4      3      2      4      2      3      6   : 36192
aida12 :     31     12      4      3      5      5      2      2      3      3      6   : 36668

Collecting the file size of each FEE64 Options CONTENTS file to check they are all the same

 FEE : aida01 =>   Options file size is 1025 	 Last changed Mon Apr 19 10:32:22 CEST 2021
 FEE : aida02 =>   Options file size is 1014 	 Last changed Fri Apr 16 00:56:20 CEST 2021
 FEE : aida03 =>   Options file size is 1014 	 Last changed Wed Apr 14 21:52:04 CEST 2021
 FEE : aida04 =>   Options file size is 1025 	 Last changed Sat Apr 17 06:07:36 CEST 2021
 FEE : aida05 =>   Options file size is 1025 	 Last changed Fri Apr 16 00:53:25 CEST 2021
 FEE : aida06 =>   Options file size is 1014 	 Last changed Wed Apr 14 21:52:04 CEST 2021
 FEE : aida07 =>   Options file size is 1014 	 Last changed Wed Apr 14 21:52:04 CEST 2021
 FEE : aida08 =>   Options file size is 1014 	 Last changed Wed Apr 14 21:52:04 CEST 2021
 FEE : aida09 =>   Options file size is 1014 	 Last changed Wed Apr 14 21:52:05 CEST 2021
 FEE : aida10 =>   Options file size is 1014 	 Last changed Wed Apr 14 21:52:06 CEST 2021
 FEE : aida11 =>   Options file size is 1014 	 Last changed Wed Apr 14 21:52:05 CEST 2021
 FEE : aida12 =>   Options file size is 1025 	 Last changed Mon Apr 19 09:05:25 CEST 2021

There should be a separate elog note about changing one of the bias voltages.

All histograms zeroed at 16:13.

16.20 DAQ continues file NULL/R33_156
      aida09 HEC fast comparator 0x2->0x1
      DSSSD#3 bias -100->-120V
Attachment 1: Screenshot_2021-04-19_Temperature_and_status_scan_aidas-gsi(3).png
Screenshot_2021-04-19_Temperature_and_status_scan_aidas-gsi(3).png
Attachment 2: Screenshot_2021-04-19_Tape_Service_(Expert)_aidas-gsi.png
Screenshot_2021-04-19_Tape_Service_(Expert)_aidas-gsi.png
Attachment 3: 62.png
62.png
  330   Wed May 19 09:12:52 2021 Muneerah, Betool, LS17th May 00:00-12:00
Auther: Muneerah and Betool
02:00 The dead time have been checked every 30 min from the start of the shift, it seemes Ok
      Statistics ok - 210517_0202_Stats
      Temperatures ok - 210517_0202_Temp
      Bias and leakage ok - 210517_0200_Bias 
02:05 System wide checks:
Clock status test result: Passed 16, Failed 0

Understand status as follows
Status bit 3 : firmware PLL that creates clocks from external clock not locked
Status bit 2 : always logic '1' 
Status bit 1 : LMK3200(2) PLL and clock distribution chip not locked to external clock
Status bit 0 : LMK3200(1) PLL and clock distribution chip not locked to external clock
If all these bits are not set then the operation of the firmware is unreliable

FEE64 module aida02 failed
FEE64 module aida03 failed
FEE64 module aida06 failed
FEE64 module aida10 failed
Calibration test result: Passed 12, Failed 4

If any modules fail calibration , check the clock status and open the FADC Align and Control browser page to rerun calibration for that module

		 Base 		Current 	Difference
aida05 fault 	 0x1552 : 	 0x155d : 	 11  
White Rabbit error counter test result: Passed 15, Failed 1

Understand the status reports as follows:-
Status bit 3 : White Rabbit decoder detected an error in the received data
Status bit 2 : Firmware registered WR error, no reload of Timestamp
Status bit 0 : White Rabbit decoder reports uncertain of Timestamp information from WR

	
			 Base 		Current 		Difference
aida05 fault 	 0x0 : 	 0x2 : 	 2  
FPGA Timestamp error counter test result: Passed 15, Failed 1
If any of these counts are reported as in error
The ASIC readout system has detected a timeslip.
That is the timestamp read from the time FIFO is not younger than the last

Returned 0 0 0 0 0 0 0 0 0 0 0 0 0 0 0 0  
Mem(KB) :	4	8	16	32	64	128	256	512	1k	2k	4k
aida01 :      5      8      3      3      3      5      2      2      2      3      7   : 39460
aida02 :     22      4      5      0      3      2      2      3      2      3      7   : 39560
aida03 :     21     10      2      1      1      3      2      4      2      3      7   : 40100
aida04 :     18      7      2      0      3      3      3      2      2      3      7   : 39392
aida05 :     16      6      5      1      2      4      3      2      2      3      7   : 39520
aida06 :     18      6      6      2      2      2      2      3      2      3      7   : 39576
aida07 :     12      8      6      1      2      3      1      3      2      3      7   : 39408
aida08 :     13     11      4      0      1      3      3      2      2      3      7   : 39308
aida09 :     10      8      4      2      3      4      2      3      2      3      7   : 39848
aida10 :     16      8      2      1      2      4      2      3      1      4      7   : 40768
aida11 :     26     10      2      2      1      2      2      3      2      3      7   : 39512
aida12 :     16      9      2      1      2      4      2      2      2      3      7   : 39240
aida13 :     15      9      3      2      2      4      2      2      2      3      7   : 39284
aida14 :     25     10      2      3      3      3      2      3      2      3      7   : 39796
aida15 :      4      2      2      1      1      3      2      2      2      3      7   : 38944
aida16 :     16      7      3      3      1      3      3      2      2      3      7   : 39368

04:00   Statistics ok - 210517_0403_Stats
        Temperatures ok - 210517_0403_Temp
        Bias and leakage ok - 210517_0400_Bias 
04:05 System wide checks:
      Clock status test result: Passed 16, Failed 0

Understand status as follows
Status bit 3 : firmware PLL that creates clocks from external clock not locked
Status bit 2 : always logic '1' 
Status bit 1 : LMK3200(2) PLL and clock distribution chip not locked to external clock
Status bit 0 : LMK3200(1) PLL and clock distribution chip not locked to external clock
If all these bits are not set then the operation of the firmware is unreliable

FEE64 module aida02 failed
FEE64 module aida03 failed
FEE64 module aida06 failed
FEE64 module aida10 failed
Calibration test result: Passed 12, Failed 4

If any modules fail calibration , check the clock status and open the FADC Align and Control browser page to rerun calibration for that module


		 Base 		Current 	Difference
aida05 fault 	 0x1552 : 	 0x1560 : 	 14  
White Rabbit error counter test result: Passed 15, Failed 1

Understand the status reports as follows:-
Status bit 3 : White Rabbit decoder detected an error in the received data
Status bit 2 : Firmware registered WR error, no reload of Timestamp
Status bit 0 : White Rabbit decoder reports uncertain of Timestamp information from WR

	
			 Base 		Current 		Difference
aida05 fault 	 0x0 : 	 0x2 : 	 2  
FPGA Timestamp error counter test result: Passed 15, Failed 1
If any of these counts are reported as in error
The ASIC readout system has detected a timeslip.
That is the timestamp read from the time FIFO is not younger than the last

	
Returned 0 0 0 0 0 0 0 0 0 0 0 0 0 0 0 0  
Mem(KB) :	4	8	16	32	64	128	256	512	1k	2k	4k
aida01 :     15      7      5      2      3      5      2      2      2      3      7   : 39492
aida02 :     23      6      7      2      1      3      2      3      2      3      7   : 39676
aida03 :     17      9      3      2      0      3      2      3      2      3      7   : 39548
aida04 :     16      4      1      2      1      3      3      3      2      3      7   : 39792
aida05 :     22      7      3      3      1      4      3      3      2      3      7   : 40032
aida06 :     18      6      7      3      1      3      2      3      2      3      7   : 39688
aida07 :     18      7      4      1      2      4      1      4      2      3      7   : 40032
aida08 :     19      5      4      1      1      3      3      3      2      3      7   : 39828
aida09 :     10      6      7      1      3      4      2      2      2      3      7   : 39336
aida10 :     12     10      2      3      1      4      2      3      1      4      7   : 40768
aida11 :     10      9      4      3      2      1      2      3      2      3      7   : 39440
aida12 :      8      7      6      1      2      4      2      3      2      3      7   : 39768
aida13 :     11      2      6      1      2      3      2      3      2      3      7   : 39612
aida14 :     27      7      4      2      3      3      2      3      2      3      7   : 39780
aida15 :      4      2      3      1      1      3      2      2      2      3      7   : 38960
aida16 :     18      8      4      2      1      4      2      2      2      3      7   : 39240


06:27 aida07 has dropped out and lost connection with the merger. Powercycling AIDA
06:48 Restarted system but the noise was extremely high. Equivalent to yesterday 15:00. Restarting again.
07:01 it is working fine.
07:40 Screen shots after the restart
 	Statistics ok - 210517_0742_Stats
        Temperatures ok - 210517_0743_Temp
        Bias and leakage ok - 210517_0740_Bias 

System wide checks

	
FEE64 module aida06 global clocks failed, 6
 Clock status test result: Passed 15, Failed 1

Understand status as follows
Status bit 3 : firmware PLL that creates clocks from external clock not locked
Status bit 2 : always logic '1' 
Status bit 1 : LMK3200(2) PLL and clock distribution chip not locked to external clock
Status bit 0 : LMK3200(1) PLL and clock distribution chip not locked to external clock
If all these bits are not set then the operation of the firmware is unreliable

	
FEE64 module aida01 failed
FEE64 module aida02 failed
FEE64 module aida03 failed
FEE64 module aida04 failed
FEE64 module aida05 failed
FEE64 module aida06 failed
FEE64 module aida07 failed
FEE64 module aida08 failed
FEE64 module aida09 failed
FEE64 module aida10 failed
FEE64 module aida11 failed
FEE64 module aida12 failed
FEE64 module aida13 failed
FEE64 module aida14 failed
FEE64 module aida15 failed
FEE64 module aida16 failed
Calibration test result: Passed 0, Failed 16

If any modules fail calibration , check the clock status and open the FADC Align and Control browser page to rerun calibration for that module

	
		 Base 		Current 	Difference
aida05 fault 	 0x61da : 	 0x61dd : 	 3  
White Rabbit error counter test result: Passed 15, Failed 1

Understand the status reports as follows:-
Status bit 3 : White Rabbit decoder detected an error in the received data
Status bit 2 : Firmware registered WR error, no reload of Timestamp
Status bit 0 : White Rabbit decoder reports uncertain of Timestamp information from WR


FPGA Timestamp error counter test result: Passed 16, Failed 0
If any of these counts are reported as in error
The ASIC readout system has detected a timeslip.
That is the timestamp read from the time FIFO is not younger than the last


Returned 0 0 0 0 0 0 0 0 0 0 0 0 0 0 0 0  
Mem(KB) :	4	8	16	32	64	128	256	512	1k	2k	4k
aida01 :     20      6      3      1      1      3      1      3      3      3      7   : 40336
aida02 :     11      6      0      1      1      5      2      4      2      3      7   : 40252
aida03 :      0      5      2      3      3      3      3      4      2      3      7   : 40424
aida04 :      2      4      2      1      2      4      3      3      2      3      7   : 39912
aida05 :     11      7      5      1      2      2      4      2      3      3      7   : 40532
aida06 :     20      6      0      2      3      2      1      3      3      3      7   : 40320
aida07 :     15      5      1      2      2      3      2      2      3      3      7   : 40116
aida08 :      2      3      4      1      3      3      2      2      3      3      7   : 40128
aida09 :     18      5      1      3      2      4      2      2      3      3      7   : 40288
aida10 :     11      6      3      4      2      3      3      2      2      4      7   : 41484
aida11 :      4      4      5      2      2      2      3      3      2      3      7   : 39744
aida12 :     18      7      2      3      2      2      4      3      2      3      7   : 40064
aida13 :      2      2      1      3      0      3      2      4      2      3      7   : 39944
aida14 :     16      4      5      3      3      3      3      2      2      4      7   : 41552
aida15 :      9      3      1      1      2      3      2      3      3      3      7   : 40556
aida16 :     16      5      1      2      1      2      3      4      2      3      7   : 40184

Date:17/05/2021
Elog for shift: 08.00 to 12.00
Author: Lewis Sexton
Screenshots saved to: /tmp/Elog_210517_0800_1200

*****	08.30	*****

Checked R12_34 through analyser, dead time seems okay:

*** Timestamp elapsed time:      232.154 s
 FEE  elapsed dead time(s) elapsed idle time(s)
  0                0.021                0.000
  1                2.781                0.000
  2                0.849                0.000
  3                5.686                0.000
  4                0.000               25.816
  5                0.017                0.000
  6                0.177                0.000
  7                1.349                0.000
  8                1.791                0.000
  9                0.000               91.660
 10                6.194                0.000
 11                0.320                0.000
 12                1.425                0.000
 13                0.000               72.999
 14                0.052                0.000
 15                1.729                0.000
 16                0.000                0.000
 17                0.000                0.000
 18                0.000                0.000
 19                0.000                0.000
 20                0.000                0.000
 21                0.000                0.000
 22                0.000                0.000
 23                0.000                0.000
 24                0.000                0.000
 25                0.000                0.000
 26                0.000                0.000
 27                0.000                0.000
 28                0.000                0.000
 29                0.000                0.000
 30                0.000                0.000
 31                0.000                0.000
 32                0.000                0.000

Stats checked seem okay (0833_Stats.png)
Merger rate ~3M items/s
Tape server ~12 MB/s

*****	09.00	*****

Checked R12_48 through analyser, dead time seems okay:

*** Timestamp elapsed time:      170.459 s
 FEE  elapsed dead time(s) elapsed idle time(s)
  0                0.196                0.000
  1                6.294                0.000
  2                0.992                0.000
  3                8.944                0.000
  4                0.024                0.000
  5                0.001                0.000
  6                0.605                0.000
  7                2.096                0.000
  8                1.654                0.000
  9                0.000               31.395
 10                6.175                0.000
 11                2.524                0.000
 12                2.076                0.000
 13                0.000               10.337
 14                0.103                0.000
 15                2.203                0.000
 16                0.000                0.000
 17                0.000                0.000
 18                0.000                0.000
 19                0.000                0.000
 20                0.000                0.000
 21                0.000                0.000
 22                0.000                0.000
 23                0.000                0.000
 24                0.000                0.000
 25                0.000                0.000
 26                0.000                0.000
 27                0.000                0.000
 28                0.000                0.000
 29                0.000                0.000
 30                0.000                0.000
 31                0.000                0.000
 32                0.000                0.000

Stats checked seem okay (0902_Stats.png)

*****	09.30	*****

AIDA crash aida05 displaying 0 in stats
Power cycle performed with help of TD
Writing to R13 now
MBS relay restared
AIDA back up at 10.20

Ran analyser for R13_16

 *** Timestamp elapsed time:      168.059 s
 FEE  elapsed dead time(s) elapsed idle time(s)
  0                0.047                0.000
  1                2.282                0.000
  2                0.080                0.000
  3                0.806                0.000
  4                0.000                0.000
  5                0.260                0.000
  6                0.030                0.000
  7                1.471                0.000
  8               67.467                0.000
  9               80.552                0.000
 10                0.057                0.000
 11                0.000               11.671
 12                1.191                0.000
 13                0.080                0.000
 14                0.091                0.000
 15                0.202                0.000
 16                0.000                0.000
 17                0.000                0.000
 18                0.000                0.000
 19                0.000                0.000
 20                0.000                0.000
 21                0.000                0.000
 22                0.000                0.000
 23                0.000                0.000
 24                0.000                0.000
 25                0.000                0.000
 26                0.000                0.000
 27                0.000                0.000
 28                0.000                0.000
 29                0.000                0.000
 30                0.000                0.000
 31                0.000                0.000
 32                0.000                0.000

High deadtime in aida09 and aida10, changed slow comparator threshold to 0xe (previously 0xc)
Ran analyser for R13_21 for comparision

 *** Timestamp elapsed time:      149.082 s
 FEE  elapsed dead time(s) elapsed idle time(s)
  0                0.000                0.000
  1                3.580                0.000
  2                0.000                0.000
  3                2.800                0.000
  4                0.000                0.000
  5                0.514                0.000
  6                0.140                0.000
  7                1.372                0.000
  8               55.544                0.000
  9               66.588                0.000
 10                1.065                0.000
 11                0.000               10.010
 12                0.681                0.000
 13                0.044                0.000
 14                0.070                0.000
 15                0.400                0.000
 16                0.000                0.000
 17                0.000                0.000
 18                0.000                0.000
 19                0.000                0.000
 20                0.000                0.000
 21                0.000                0.000
 22                0.000                0.000
 23                0.000                0.000
 24                0.000                0.000
 25                0.000                0.000
 26                0.000                0.000
 27                0.000                0.000
 28                0.000                0.000
 29                0.000                0.000
 30                0.000                0.000
 31                0.000                0.000
 32                0.000                0.000

FEE temp slightly high in aida04, 0.44 above limit of 65 (FEETemps_1042.png)

Merger rate ~5M items/s
Tape server ~17 MB/s

Raised slow comparator in aida09 and aida10 to 0xf, analyse R13_26 for comparision

*** Timestamp elapsed time:      122.147 s
 FEE  elapsed dead time(s) elapsed idle time(s)
  0                0.027                0.000
  1               19.945                0.000
  2                0.601                0.000
  3               21.555                0.000
  4                0.042                0.000
  5                3.226                0.000
  6                1.211                0.000
  7                9.674                0.000
  8               52.817                0.000
  9               54.972                0.000
 10                1.848                0.000
 11                0.008                0.000
 12                2.034                0.000
 13                0.278                0.000
 14                0.018                0.000
 15                0.634                0.000
 16                0.000                0.000
 17                0.000                0.000
 18                0.000                0.000
 19                0.000                0.000
 20                0.000                0.000
 21                0.000                0.000
 22                0.000                0.000
 23                0.000                0.000
 24                0.000                0.000
 25                0.000                0.000
 26                0.000                0.000
 27                0.000                0.000
 28                0.000                0.000
 29                0.000                0.000
 30                0.000                0.000
 31                0.000                0.000
 32                0.000                0.000

high deatime now also seen in aida02 and aida04

Several powercycles performed as high rates after restart, analysis of R14_13 showed low deadtime for all FEEs
Back running as of 10.45
Analyser of R14_15 to double check

 *** Timestamp elapsed time:      205.006 s
 FEE  elapsed dead time(s) elapsed idle time(s)
  0                0.000               40.176
  1                0.438                0.000
  2                0.199                0.000
  3                2.927                0.000
  4                0.000              140.347
  5                1.282                0.000
  6                0.150                0.000
  7                2.097                0.000
  8                1.673                0.000
  9                0.000               87.749
 10                1.150                0.000
 11                0.489                0.000
 12                0.374                0.000
 13                0.048               20.995
 14                0.251                0.000
 15                2.441                0.000
 16                0.000                0.000
 17                0.000                0.000
 18                0.000                0.000
 19                0.000                0.000
 20                0.000                0.000
 21                0.000                0.000
 22                0.000                0.000
 23                0.000                0.000
 24                0.000                0.000
 25                0.000                0.000
 26                0.000                0.000
 27                0.000                0.000
 28                0.000                0.000
 29                0.000                0.000
 30                0.000                0.000
 31                0.000                0.000
 32                0.000                0.000


12:04 During access Sultan added an additional ground cable and also noted the bias cable going into FEE12 was loose. He pushed it in solidly and the rates appear to have dropped across the FEEs


12:52 Check FPGA Timestamp errors gives following error message:

Got the error Server Internal Error
while trying to obtain /AIDA/Check/Check.tml.
can't read "TS_Base_Collected": no such variable while executing "if { $TS_Base_Collected == 0 } { collect_TS_Base }" (procedure "do_TS_errors" line 8) invoked from within "do_TS_errors " ("TSERRORS" arm line 1) invoked from within "switch -glob $w { RESET {set started 0} CLEAR {EmptyLog} ELOG {PrintLog} ..." (procedure "do_click" line 23) invoked from within "do_click" invoked from within "if {$started != 0} { variable JS "" variable LogFlag if {$LogFlag == 1} {InsertLog "Last Updated: [clock format [clock seconds] -form..." (file "Check.tcl" line 8) invoked from within "source Check.tcl" (in namespace eval "::Check" script line 6) invoked from within "namespace eval Check { global env source [file join $env(MIDASBASE) TclHttpd tcl Common common.tcl] source [file join $env(MIDASB..." invoked from within "subst { [Doc_Dynamic] <! [global Httpd; upvar #0 Httpd[set Httpd(currentSocket)] data; set ClientIPAddress $data(ipaddr); set MyInfo $data(self)] >..." ("uplevel" body line 1) invoked from within "uplevel #0 [list subst $script]" (procedure "SubstFile" line 12) invoked from within "SubstFile /home/npg/MIDAS_Releases/23Jan19/MIDAS_200119/TclHttpd/Html/AIDA/Check/Check.tml {}" ("uplevel" body line 1) invoked from within "uplevel 1 [list SubstFile $path $interp]" (procedure "Subst_File" line 7) invoked from within "Subst_File $template $interp" invoked from within "TemplateInstantiate $sock $path {} $suffix {} $Template(templateInterp)" (procedure "Doc_application/x-tcl-template" line 9) invoked from within "$cmd $path $suffix $sock" (procedure "Doc_Handle" line 20) invoked from within "Doc_Handle $prefix $path $suffix $sock" (procedure "DocDomain" line 44) invoked from within "DocDomain / /MIDAS/TclHttpd/Html sock8 AIDA/Check/Check.tml" ("eval" body line 1) invoked from within "eval $Url(command,$prefix) [list $sock $suffix]"
Tcl Call Trace
6: DocSubstSystemFile sock8 error 500 can't\ read\ &quot\;TS_Base_Collected&quot\;:\ no\ such\ variable\n\ \ \ \ while\ executing\n&quot\;if\ \{\ \$TS_Base_Collected\ ==\ 0\ \}\ \{\ collect_TS_Base\ \}&quot\;\n\ \ \ \ (procedure\ &quot\;do_TS_errors&quot\;\ line\ 8)\n\ \ \ \ invoked\ from\ within\n&quot\;do_TS_errors\ &quot\;\n\ \ \ \ (&quot\;TSERRORS&quot\;\ arm\ line\ 1)\n\ \ \ \ invoked\ from\ within\n&quot\;switch\ -glob\ \$w\ \{\n\n\ \ \ \ \ \ \ \ \ \ \ \ \ \ \ \ \ \ \ RESET\ \ \ \ \{set\ started\ 0\}\n\ \ \ \ \ \ \ \ \ \ \ \ \ \ \ \ \ \ \ CLEAR\ \ \ \ \{EmptyLog\}\n\ \ \ \ \ \ \ \ \ \ \ \ \ \ \ \ \ \ \ ELOG\ \ \ \ \ \{PrintLog\}\n\ \ \ \ \ \ \ \ \ ...&quot\;\n\ \ \ \ (procedure\ &quot\;do_click&quot\;\ line\ 23)\n\ \ \ \ invoked\ from\ within\n&quot\;do_click&quot\;\n\ \ \ \ invoked\ from\ within\n&quot\;if\ \{\$started\ !=\ 0\}\ \{\n\n\ \ \ \ \ variable\ JS\ &quot\;&quot\;\n\ \ \ \ \ variable\ LogFlag\n\n\ \ \ \ \ if\ \{\$LogFlag\ ==\ 1\}\ \{InsertLog\ &quot\;Last\ Updated:\ [clock\ format\ [clock\ seconds\]\ -form...&quot\;\n\ \ \ \ (file\ &quot\;Check.tcl&quot\;\ line\ 8)\n\ \ \ \ invoked\ from\ within\n&quot\;source\ Check.tcl&quot\;\n\ \ \ \ (in\ namespace\ eval\ &quot\;::Check&quot\;\ script\ line\ 6)\n\ \ \ \ invoked\ from\ within\n&quot\;namespace\ eval\ Check\ \{\n\ \ \ \ \ \ \ global\ env\n\ \ \ \ \ \ \ source\ [file\ join\ \$env(MIDASBASE)\ TclHttpd\ tcl\ Common\ common.tcl\]\n\ \ \ \ \ \ \ source\ [file\ join\ \$env(MIDASB...&quot\;\n\ \ \ \ invoked\ from\ within\n&quot\;subst\ \{\n\n[Doc_Dynamic\]\n\n\n&lt\;!\n[global\ Httpd\;\ upvar\ #0\ Httpd[set\ Httpd(currentSocket)\]\ data\;\ set\ ClientIPAddress\ \$data(ipaddr)\;\ set\ MyInfo\ \$data(self)\]\n&gt\;...&quot\;\n\ \ \ \ (&quot\;uplevel&quot\;\ body\ line\ 1)\n\ \ \ \ invoked\ from\ within\n&quot\;uplevel\ #0\ [list\ subst\ \$script\]&quot\;\n\ \ \ \ (procedure\ &quot\;SubstFile&quot\;\ line\ 12)\n\ \ \ \ invoked\ from\ within\n&quot\;SubstFile\ /home/npg/MIDAS_Releases/23Jan19/MIDAS_200119/TclHttpd/Html/AIDA/Check/Check.tml\ \{\}&quot\;\n\ \ \ \ (&quot\;uplevel&quot\;\ body\ line\ 1)\n\ \ \ \ invoked\ from\ within\n&quot\;uplevel\ 1\ [list\ SubstFile\ \$path\ \$interp\]&quot\;\n\ \ \ \ (procedure\ &quot\;Subst_File&quot\;\ line\ 7)\n\ \ \ \ invoked\ from\ within\n&quot\;Subst_File\ \$template\ \$interp&quot\;\n\ \ \ \ invoked\ from\ within\n&quot\;TemplateInstantiate\ \$sock\ \$path\ \{\}\ \$suffix\ \{\}\ \$Template(templateInterp)&quot\;\n\ \ \ \ (procedure\ &quot\;Doc_application/x-tcl-template&quot\;\ line\ 9)\n\ \ \ \ invoked\ from\ within\n&quot\;\$cmd\ \$path\ \$suffix\ \$sock&quot\;\n\ \ \ \ (procedure\ &quot\;Doc_Handle&quot\;\ line\ 20)\n\ \ \ \ invoked\ from\ within\n&quot\;Doc_Handle\ \$prefix\ \$path\ \$suffix\ \$sock&quot\;\n\ \ \ \ (procedure\ &quot\;DocDomain&quot\;\ line\ 44)\n\ \ \ \ invoked\ from\ within\n&quot\;DocDomain\ /\ /MIDAS/TclHttpd/Html\ sock8\ AIDA/Check/Check.tml&quot\;\n\ \ \ \ (&quot\;eval&quot\;\ body\ line\ 1)\n\ \ \ \ invoked\ from\ within\n&quot\;eval\ \$Url(command,\$prefix)\ [list\ \$sock\ \$suffix\]&quot\;
5: Doc_Error sock8 can't\ read\ \"TS_Base_Collected\":\ no\ such\ variable\n\ \ \ \ while\ executing\n\"if\ \{\ \$TS_Base_Collected\ ==\ 0\ \}\ \{\ collect_TS_Base\ \}\"\n\ \ \ \ (procedure\ \"do_TS_errors\"\ line\ 8)\n\ \ \ \ invoked\ from\ within\n\"do_TS_errors\ \"\n\ \ \ \ (\"TSERRORS\"\ arm\ line\ 1)\n\ \ \ \ invoked\ from\ within\n\"switch\ -glob\ \$w\ \{\n\n\ \ \ \ \ \ \ \ \ \ \ \ \ \ \ \ \ \ \ RESET\ \ \ \ \{set\ started\ 0\}\n\ \ \ \ \ \ \ \ \ \ \ \ \ \ \ \ \ \ \ CLEAR\ \ \ \ \{EmptyLog\}\n\ \ \ \ \ \ \ \ \ \ \ \ \ \ \ \ \ \ \ ELOG\ \ \ \ \ \{PrintLog\}\n\ \ \ \ \ \ \ \ \ ...\"\n\ \ \ \ (procedure\ \"do_click\"\ line\ 23)\n\ \ \ \ invoked\ from\ within\n\"do_click\"\n\ \ \ \ invoked\ from\ within\n\"if\ \{\$started\ !=\ 0\}\ \{\n\n\ \ \ \ \ variable\ JS\ \"\"\n\ \ \ \ \ variable\ LogFlag\n\n\ \ \ \ \ if\ \{\$LogFlag\ ==\ 1\}\ \{InsertLog\ \"Last\ Updated:\ [clock\ format\ [clock\ seconds\]\ -form...\"\n\ \ \ \ (file\ \"Check.tcl\"\ line\ 8)\n\ \ \ \ invoked\ from\ within\n\"source\ Check.tcl\"\n\ \ \ \ (in\ namespace\ eval\ \"::Check\"\ script\ line\ 6)\n\ \ \ \ invoked\ from\ within\n\"namespace\ eval\ Check\ \{\n\ \ \ \ \ \ \ global\ env\n\ \ \ \ \ \ \ source\ [file\ join\ \$env(MIDASBASE)\ TclHttpd\ tcl\ Common\ common.tcl\]\n\ \ \ \ \ \ \ source\ [file\ join\ \$env(MIDASB...\"\n\ \ \ \ invoked\ from\ within\n\"subst\ \{\n\n[Doc_Dynamic\]\n\n\n<!\n[global\ Httpd\;\ upvar\ #0\ Httpd[set\ Httpd(currentSocket)\]\ data\;\ set\ ClientIPAddress\ \$data(ipaddr)\;\ set\ MyInfo\ \$data(self)\]\n>...\"\n\ \ \ \ (\"uplevel\"\ body\ line\ 1)\n\ \ \ \ invoked\ from\ within\n\"uplevel\ #0\ [list\ subst\ \$script\]\"\n\ \ \ \ (procedure\ \"SubstFile\"\ line\ 12)\n\ \ \ \ invoked\ from\ within\n\"SubstFile\ /home/npg/MIDAS_Releases/23Jan19/MIDAS_200119/TclHttpd/Html/AIDA/Check/Check.tml\ \{\}\"\n\ \ \ \ (\"uplevel\"\ body\ line\ 1)\n\ \ \ \ invoked\ from\ within\n\"uplevel\ 1\ [list\ SubstFile\ \$path\ \$interp\]\"\n\ \ \ \ (procedure\ \"Subst_File\"\ line\ 7)\n\ \ \ \ invoked\ from\ within\n\"Subst_File\ \$template\ \$interp\"\n\ \ \ \ invoked\ from\ within\n\"TemplateInstantiate\ \$sock\ \$path\ \{\}\ \$suffix\ \{\}\ \$Template(templateInterp)\"\n\ \ \ \ (procedure\ \"Doc_application/x-tcl-template\"\ line\ 9)\n\ \ \ \ invoked\ from\ within\n\"\$cmd\ \$path\ \$suffix\ \$sock\"\n\ \ \ \ (procedure\ \"Doc_Handle\"\ line\ 20)\n\ \ \ \ invoked\ from\ within\n\"Doc_Handle\ \$prefix\ \$path\ \$suffix\ \$sock\"\n\ \ \ \ (procedure\ \"DocDomain\"\ line\ 44)\n\ \ \ \ invoked\ from\ within\n\"DocDomain\ /\ /MIDAS/TclHttpd/Html\ sock8\ AIDA/Check/Check.tml\"\n\ \ \ \ (\"eval\"\ body\ line\ 1)\n\ \ \ \ invoked\ from\ within\n\"eval\ \$Url(command,\$prefix)\ [list\ \$sock\ \$suffix\]\"
4: Url_Unwind sock8 can't\ read\ \"TS_Base_Collected\":\ no\ such\ variable\n\ \ \ \ while\ executing\n\"if\ \{\ \$TS_Base_Collected\ ==\ 0\ \}\ \{\ collect_TS_Base\ \}\"\n\ \ \ \ (procedure\ \"do_TS_errors\"\ line\ 8)\n\ \ \ \ invoked\ from\ within\n\"do_TS_errors\ \"\n\ \ \ \ (\"TSERRORS\"\ arm\ line\ 1)\n\ \ \ \ invoked\ from\ within\n\"switch\ -glob\ \$w\ \{\n\n\ \ \ \ \ \ \ \ \ \ \ \ \ \ \ \ \ \ \ RESET\ \ \ \ \{set\ started\ 0\}\n\ \ \ \ \ \ \ \ \ \ \ \ \ \ \ \ \ \ \ CLEAR\ \ \ \ \{EmptyLog\}\n\ \ \ \ \ \ \ \ \ \ \ \ \ \ \ \ \ \ \ ELOG\ \ \ \ \ \{PrintLog\}\n\ \ \ \ \ \ \ \ \ ...\"\n\ \ \ \ (procedure\ \"do_click\"\ line\ 23)\n\ \ \ \ invoked\ from\ within\n\"do_click\"\n\ \ \ \ invoked\ from\ within\n\"if\ \{\$started\ !=\ 0\}\ \{\n\n\ \ \ \ \ variable\ JS\ \"\"\n\ \ \ \ \ variable\ LogFlag\n\n\ \ \ \ \ if\ \{\$LogFlag\ ==\ 1\}\ \{InsertLog\ \"Last\ Updated:\ [clock\ format\ [clock\ seconds\]\ -form...\"\n\ \ \ \ (file\ \"Check.tcl\"\ line\ 8)\n\ \ \ \ invoked\ from\ within\n\"source\ Check.tcl\"\n\ \ \ \ (in\ namespace\ eval\ \"::Check\"\ script\ line\ 6)\n\ \ \ \ invoked\ from\ within\n\"namespace\ eval\ Check\ \{\n\ \ \ \ \ \ \ global\ env\n\ \ \ \ \ \ \ source\ [file\ join\ \$env(MIDASBASE)\ TclHttpd\ tcl\ Common\ common.tcl\]\n\ \ \ \ \ \ \ source\ [file\ join\ \$env(MIDASB...\"\n\ \ \ \ invoked\ from\ within\n\"subst\ \{\n\n[Doc_Dynamic\]\n\n\n<!\n[global\ Httpd\;\ upvar\ #0\ Httpd[set\ Httpd(currentSocket)\]\ data\;\ set\ ClientIPAddress\ \$data(ipaddr)\;\ set\ MyInfo\ \$data(self)\]\n>...\"\n\ \ \ \ (\"uplevel\"\ body\ line\ 1)\n\ \ \ \ invoked\ from\ within\n\"uplevel\ #0\ [list\ subst\ \$script\]\"\n\ \ \ \ (procedure\ \"SubstFile\"\ line\ 12)\n\ \ \ \ invoked\ from\ within\n\"SubstFile\ /home/npg/MIDAS_Releases/23Jan19/MIDAS_200119/TclHttpd/Html/AIDA/Check/Check.tml\ \{\}\"\n\ \ \ \ (\"uplevel\"\ body\ line\ 1)\n\ \ \ \ invoked\ from\ within\n\"uplevel\ 1\ [list\ SubstFile\ \$path\ \$interp\]\"\n\ \ \ \ (procedure\ \"Subst_File\"\ line\ 7)\n\ \ \ \ invoked\ from\ within\n\"Subst_File\ \$template\ \$interp\"\n\ \ \ \ invoked\ from\ within\n\"TemplateInstantiate\ \$sock\ \$path\ \{\}\ \$suffix\ \{\}\ \$Template(templateInterp)\"\n\ \ \ \ (procedure\ \"Doc_application/x-tcl-template\"\ line\ 9)\n\ \ \ \ invoked\ from\ within\n\"\$cmd\ \$path\ \$suffix\ \$sock\"\n\ \ \ \ (procedure\ \"Doc_Handle\"\ line\ 20)\n\ \ \ \ invoked\ from\ within\n\"Doc_Handle\ \$prefix\ \$path\ \$suffix\ \$sock\"\n\ \ \ \ (procedure\ \"DocDomain\"\ line\ 44)\n\ \ \ \ invoked\ from\ within\n\"DocDomain\ /\ /MIDAS/TclHttpd/Html\ sock8\ AIDA/Check/Check.tml\"\n\ \ \ \ (\"eval\"\ body\ line\ 1)\n\ \ \ \ invoked\ from\ within\n\"eval\ \$Url(command,\$prefix)\ [list\ \$sock\ \$suffix\]\" NONE
3: Url_DeferredDispatch / AIDA/Check/Check.tml sock8 buffer {}
2: HttpdReadPost sock8 buffer 16384 {Url_DeferredDispatch / AIDA/Check/Check.tml}
1: HttpdReadPostGlobal sock8 Httpds

Dead time check:

[npg@aidas-gsi S496]$ ~/analyser/analyser R14_24
 *** TDR format 3.3.0 analyser - TD - May 2021
 *** ERROR: READ I/O error:       5002
                   blocks:      32000
          ADC data format:  252995858 (  451517.9 Hz)
        Other data format:    8924143 (   15926.8 Hz)
 Sample trace data format:          0 (       0.0 Hz)
         Undefined format:          0 (       0.0 Hz)
   Other data format type:      PAUSE:         85 (       0.2 Hz)
                               RESUME:         85 (       0.2 Hz)
                              SYNC100:      34087 (      60.8 Hz)
                              WR48-63:      34087 (      60.8 Hz)
                           FEE64 disc:          0 (       0.0 Hz)
                             MBS info:    8855799 (   15804.8 Hz)
                           Other info:          0 (       0.0 Hz)

   ADC data range bit set:          0 (       0.0 Hz)

                Timewarps:        ADC:          0 (       0.0 Hz)
                                PAUSE:          0 (       0.0 Hz)
                               RESUME:          0 (       0.0 Hz)
                              SYNC100:          0 (       0.0 Hz)
                              WR48-63:          0 (       0.0 Hz)
                           FEE64 disc:          0 (       0.0 Hz)
                             MBS info:          0 (       0.0 Hz)
                            Undefined:          0 (       0.0 Hz)
                         Sample trace:          0 (       0.0 Hz)

 *** Timestamp elapsed time:      560.323 s
 FEE  elapsed dead time(s) elapsed idle time(s)
  0                0.000              349.960
  1                0.002                0.000
  2                0.000                5.974
  3                1.105                0.000
  4                0.000              447.454
  5                0.000                2.809
  6                0.000               16.727
  7                0.137                0.000
  8                0.090                0.000
  9                0.000              429.897
 10                0.461                0.000
 11                0.018                0.000
 12                0.000                8.985
 13                0.000              466.311
 14                0.000               15.095
 15                0.346                0.000

13:24 Beam is off at the moment...

13:43 Changing spill structure from 1.5s/3.5s to 1s. 

13:50

[npg@aidas-gsi S496]$ ~/analyser/analyser R14_29
 *** TDR format 3.3.0 analyser - TD - May 2021
 *** ERROR: READ I/O error:       5002
                   blocks:      32000
          ADC data format:  251763810 (  930342.1 Hz)
        Other data format:   10156190 (   37530.1 Hz)
 Sample trace data format:          0 (       0.0 Hz)
         Undefined format:          0 (       0.0 Hz)
   Other data format type:      PAUSE:        205 (       0.8 Hz)
                               RESUME:        205 (       0.8 Hz)
                              SYNC100:      33009 (     122.0 Hz)
                              WR48-63:      33009 (     122.0 Hz)
                           FEE64 disc:          0 (       0.0 Hz)
                             MBS info:   10089762 (   37284.7 Hz)
                           Other info:          0 (       0.0 Hz)

   ADC data range bit set:     527077 (    1947.7 Hz)

                Timewarps:        ADC:          0 (       0.0 Hz)
                                PAUSE:          0 (       0.0 Hz)
                               RESUME:          0 (       0.0 Hz)
                              SYNC100:          0 (       0.0 Hz)
                              WR48-63:          0 (       0.0 Hz)
                           FEE64 disc:          0 (       0.0 Hz)
                             MBS info:          0 (       0.0 Hz)
                            Undefined:          0 (       0.0 Hz)
                         Sample trace:          0 (       0.0 Hz)

 *** Timestamp elapsed time:      270.614 s
 FEE  elapsed dead time(s) elapsed idle time(s)
  0                0.034                6.803
  1                8.461                0.000
  2                0.569                0.000
  3               11.664                0.000
  4                0.024               26.416
  5                0.854                0.000
  6                0.069                0.000
  7                0.741                0.000
  8                1.336                0.000
  9                0.000               75.926
 10                0.353                0.000
 11                0.105                0.000
 12                0.070                0.000
 13                0.000               93.585
 14                0.017                0.000
 15                0.121                0.000

15:06 Spill structure back to 1.5 on 2s off.
Attachment 1: 210517_0200_Bias.png
210517_0200_Bias.png
Attachment 2: 210517_0202_stats.png
210517_0202_stats.png
Attachment 3: 210517_0202_temp.png
210517_0202_temp.png
Attachment 4: 210517_0400_Bias.png
210517_0400_Bias.png
Attachment 5: 210517_0403_stats.png
210517_0403_stats.png
Attachment 6: 210517_0403_temp.png
210517_0403_temp.png
Attachment 7: 210517_0740_Bias.png
210517_0740_Bias.png
Attachment 8: 210517_0742_Stats.png
210517_0742_Stats.png
Attachment 9: 210517_0743_Temp.png
210517_0743_Temp.png
Attachment 10: 0833_Stats.png
0833_Stats.png
Attachment 11: 0902_Stats.png
0902_Stats.png
Attachment 12: 1241_Stats.png
1241_Stats.png
Attachment 13: 1347_Stats.png
1347_Stats.png
Attachment 14: FEETemps_1042.png
FEETemps_1042.png
Attachment 15: FEETemps_1246.png
FEETemps_1246.png
Attachment 16: FEETemps_1350.png
FEETemps_1350.png
Attachment 17: leakage_currents_1302.png
leakage_currents_1302.png
  329   Wed May 19 09:09:27 2021 MS, JS, OHMay 16 08:00-24:00
16th May 08:00 - 12:00 shift
Author: MS


08:00


FEE64 module aida09 global clocks failed, 6
 Clock status test result: Passed 15, Failed 1

Understand status as follows
Status bit 3 : firmware PLL that creates clocks from external clock not locked
Status bit 2 : always logic '1' 
Status bit 1 : LMK3200(2) PLL and clock distribution chip not locked to external clock
Status bit 0 : LMK3200(1) PLL and clock distribution chip not locked to external clock
If all these bits are not set then the operation of the firmware is unreliable


FEE64 module aida09 failed
Calibration test result: Passed 15, Failed 1

If any modules fail calibration , check the clock status and open the FADC Align and Control browser page to rerun calibration for that module


		 Base 		Current 	Difference
aida01 fault 	 0xf294 : 	 0xf296 : 	 2  
aida02 fault 	 0xd8ec : 	 0xd8ee : 	 2  
aida03 fault 	 0xf001 : 	 0xf003 : 	 2  
aida04 fault 	 0xd992 : 	 0xd994 : 	 2  
aida05 fault 	 0x714c : 	 0x7163 : 	 23  
aida06 fault 	 0x5a49 : 	 0x5a4a : 	 1  
aida07 fault 	 0x5aca : 	 0x5acb : 	 1  
aida08 fault 	 0xb92e : 	 0xb92f : 	 1  
White Rabbit error counter test result: Passed 8, Failed 8

Understand the status reports as follows:-
Status bit 3 : White Rabbit decoder detected an error in the received data
Status bit 2 : Firmware registered WR error, no reload of Timestamp
Status bit 0 : White Rabbit decoder reports uncertain of Timestamp information from WR


			 Base 		Current 		Difference
aida05 fault 	 0x0 : 	 0xa : 	 10  
aida12 fault 	 0x0 : 	 0x3 : 	 3  
aida13 fault 	 0x0 : 	 0x4d : 	 77  
FPGA Timestamp error counter test result: Passed 13, Failed 3
If any of these counts are reported as in error
The ASIC readout system has detected a timeslip.
That is the timestamp read from the time FIFO is not younger than the last


Returned 0 0 0 0 0 0 0 0 0 0 0 0 0 0 0 0  
Mem(KB) :	4	8	16	32	64	128	256	512	1k	2k	4k
aida01 :     27      7      2      3      2      3      2      4      2      3      7   : 40228
aida02 :      3      8      3      2      2      2      2      4      2      3      7   : 39996
aida03 :     23      9      6      1      0      3      2      4      2      3      7   : 40100
aida04 :     34     27     17      7      2      4      3      3      2      2      7   : 38608
aida05 :     19      9      5      2      2      2      3      3      2      3      7   : 39844
aida06 :      5      5      2      1      0      4      2      4      2      3      7   : 40060
aida07 :     28      2     10      3      2      4      1      4      2      3      7   : 40192
aida08 :     19      5      5      1      2      5      1      3      2      3      7   : 39652
aida09 :     20      8      3      3      1      3      2      3      2      3      7   : 39648
aida10 :     27     10      0      2      2      2      2      3      1      4      7   : 40572
aida11 :      3      3      2      1      2      4      2      3      2      3      7   : 39652
aida12 :     16      7     11      2      3      4      2      2      2      3      7   : 39464
aida13 :     14     10      4      3      1      5      2      2      2      3      7   : 39400
aida14 :     21      9     10      1      1      2      2      3      1      4      7   : 40604
aida15 :     19      8      2      3      0      4      3      2      2      3      7   : 39436
aida16 :     24      5      8      3      3      4      2      2      2      3      7   : 39464


 *** Timestamp elapsed time:      225.065 s
 FEE  elapsed dead time(s) elapsed idle time(s)
  0                0.038                0.000
  1                9.479                0.000
  2                0.195                0.000
  3                5.921                0.000
  4                0.000               11.742
  5                0.036                0.000
  6                0.013                0.000
  7                0.498                0.000
  8                0.436                0.000
  9                0.000              107.300
 10                2.787                0.000
 11                0.905                0.000
 12                0.831                0.000
 13                0.000               55.939
 14                0.080                0.000
 15                0.267                0.000
 16                0.000                0.000
 17                0.000                0.000
 18                0.000                0.000
 19                0.000                0.000
 20                0.000                0.000
 21                0.000                0.000
 22                0.000                0.000
 23                0.000                0.000
 24                0.000                0.000
 25                0.000                0.000
 26                0.000                0.000
 27                0.000                0.000
 28                0.000                0.000
 29                0.000                0.000
 30                0.000                0.000
 31                0.000                0.000
 32                0.000                0.000


10:00


FEE64 module aida06 global clocks failed, 6
 FEE64 module aida09 global clocks failed, 6
 Clock status test result: Passed 14, Failed 2

Understand status as follows
Status bit 3 : firmware PLL that creates clocks from external clock not locked
Status bit 2 : always logic '1' 
Status bit 1 : LMK3200(2) PLL and clock distribution chip not locked to external clock
Status bit 0 : LMK3200(1) PLL and clock distribution chip not locked to external clock
If all these bits are not set then the operation of the firmware is unreliable


FEE64 module aida09 failed
Calibration test result: Passed 15, Failed 1

If any modules fail calibration , check the clock status and open the FADC Align and Control browser page to rerun calibration for that module


		 Base 		Current 	Difference
aida01 fault 	 0xf294 : 	 0xf296 : 	 2  
aida02 fault 	 0xd8ec : 	 0xd8ee : 	 2  
aida03 fault 	 0xf001 : 	 0xf003 : 	 2  
aida04 fault 	 0xd992 : 	 0xd994 : 	 2  
aida05 fault 	 0x714c : 	 0x7166 : 	 26  
aida06 fault 	 0x5a49 : 	 0x5a4a : 	 1  
aida07 fault 	 0x5aca : 	 0x5acb : 	 1  
aida08 fault 	 0xb92e : 	 0xb92f : 	 1  
White Rabbit error counter test result: Passed 8, Failed 8

Understand the status reports as follows:-
Status bit 3 : White Rabbit decoder detected an error in the received data
Status bit 2 : Firmware registered WR error, no reload of Timestamp
Status bit 0 : White Rabbit decoder reports uncertain of Timestamp information from WR


			 Base 		Current 		Difference
aida05 fault 	 0x0 : 	 0xa : 	 10  
aida12 fault 	 0x0 : 	 0x3 : 	 3  
aida13 fault 	 0x0 : 	 0x4d : 	 77  
FPGA Timestamp error counter test result: Passed 13, Failed 3
If any of these counts are reported as in error
The ASIC readout system has detected a timeslip.
That is the timestamp read from the time FIFO is not younger than the last


Returned 0 0 0 0 0 0 0 0 0 0 0 0 0 0 0 0  
Mem(KB) :	4	8	16	32	64	128	256	512	1k	2k	4k
aida01 :     19      7      6      2      2      3      2      3      2      3      7   : 39716
aida02 :      8      4      3      2      2      3      2      3      2      3      7   : 39600
aida03 :     23     11      5      1      0      4      2      3      1      4      7   : 40740
aida04 :     42     25     16      7      2      4      4      3      2      2      7   : 38864
aida05 :     24      5      5      1      2      2      3      3      1      4      7   : 40824
aida06 :     11      4      4      1      1      4      2      4      2      3      7   : 40172
aida07 :     21      8      5      1      2      3      2      4      2      3      7   : 40196
aida08 :     15      5      6      1      1      4      2      4      2      3      7   : 40228
aida09 :     15     10      4      1      2      3      2      3      2      3      7   : 39660
aida10 :     23      8      2      2      2      2      2      3      1      4      7   : 40572
aida11 :      6      4      4      2      2      4      2      3      2      3      7   : 39736
aida12 :     18      8      8      1      4      4      3      2      2      3      7   : 39720
aida13 :     23      6      2      3      2      5      2      2      2      3      7   : 39436
aida14 :     29      3     11      1      1      2      2      3      1      4      7   : 40604
aida15 :     29      7      2      2      0      4      3      3      2      3      7   : 39948
aida16 :      2      3      6      2      3      4      2      2      2      3      7   : 39296


*** Timestamp elapsed time:      225.065 s
 FEE  elapsed dead time(s) elapsed idle time(s)
  0                0.038                0.000
  1                9.479                0.000
  2                0.195                0.000
  3                5.921                0.000
  4                0.000               11.742
  5                0.036                0.000
  6                0.013                0.000
  7                0.498                0.000
  8                0.436                0.000
  9                0.000              107.300
 10                2.787                0.000
 11                0.905                0.000
 12                0.831                0.000
 13                0.000               55.939
 14                0.080                0.000
 15                0.267                0.000
 16                0.000                0.000
 17                0.000                0.000
 18                0.000                0.000
 19                0.000                0.000
 20                0.000                0.000
 21                0.000                0.000
 22                0.000                0.000
 23                0.000                0.000
 24                0.000                0.000
 25                0.000                0.000
 26                0.000                0.000
 27                0.000                0.000
 28                0.000                0.000
 29                0.000                0.000
 30                0.000                0.000
 31                0.000                0.000
 32                0.000                0.000

12:00-16:00
16th May 12:00 - 16:00 shift
Author: JS

11:57 Taking over from Magda. Running full checks.
usbec ok. Max ~1700 Hz 1MHz on DSSD1, DSSD ~ 75%
Current ok  06.410 uA      006.835 uA
Stats good 1Statistics aidas-gsi(6).png
Temps ok 1Temperature and status scan aidas-gsi(6).png
Analysis ok R7_385. Dead time FEE1 a little hight 6%

PAUSE: 166  RESUME: 166

 *** Timestamp elapsed time:      196.305 s
 FEE  elapsed dead time(s) elapsed idle time(s)
  0                0.044                0.000
  1               12.405                0.000
  2                0.807                0.000
  3                7.260                0.000
  4                0.014                0.000
  5                0.458                0.000
  6                0.027                0.000
  7                0.497                0.000
  8                0.723                0.000
  9                0.000               88.857
 10                6.189                0.000
 11                1.443                0.000
 12                0.474                0.000
 13                0.000               35.565
 14                0.000                0.000
 15                0.147                0.000
 16                0.000                0.000
 17                0.000                0.000
 18                0.000                0.000
 19                0.000                0.000
 20                0.000                0.000
 21                0.000                0.000
 22                0.000                0.000
 23                0.000                0.000
 24                0.000                0.000
 25                0.000                0.000
 26                0.000                0.000
 27                0.000                0.000
 28                0.000                0.000
 29                0.000                0.000
 30                0.000                0.000
 31                0.000                0.000
 32                0.000                0.000

FEE64 module aida09 global clocks failed, 6
 Clock status test result: Passed 15, Failed 1

FEE64 module aida09 failed
Calibration test result: Passed 15, Failed 1

		 Base 		Current 	Difference
aida01 fault 	 0xf294 : 	 0xf296 : 	 2  
aida02 fault 	 0xd8ec : 	 0xd8ee : 	 2  
aida03 fault 	 0xf001 : 	 0xf003 : 	 2  
aida04 fault 	 0xd992 : 	 0xd994 : 	 2  
aida05 fault 	 0x714c : 	 0x716e : 	 34  
aida06 fault 	 0x5a49 : 	 0x5a4a : 	 1  
aida07 fault 	 0x5aca : 	 0x5acb : 	 1  
aida08 fault 	 0xb92e : 	 0xb92f : 	 1  
White Rabbit error counter test result: Passed 8, Failed 8

			 Base 		Current 		Difference
aida05 fault 	 0x0 : 	 0xa : 	 10  
aida12 fault 	 0x0 : 	 0x3 : 	 3  
aida13 fault 	 0x0 : 	 0x4d : 	 77  
FPGA Timestamp error counter test result: Passed 13, Failed 3
	
Returned 0 0 0 0 0 0 0 0 0 0 0 0 0 0 0 0  
Mem(KB) :	4	8	16	32	64	128	256	512	1k	2k	4k
aida01 :     20      7      4      2      2      3      2      3      1      4      7   : 40712
aida02 :     25     10      7      1      1      4      1      3      2      3      7   : 39556
aida03 :     22     10      5      1      0      4      2      4      2      3      7   : 40216
aida04 :     40     24     17      7      2      5      3      3      2      2      7   : 38736
aida05 :      4      8      3      0      1      3      3      3      1      4      7   : 40768
aida06 :     21      6      6      2      2      3      2      4      2      3      7   : 40228
aida07 :     25      4      6      3      2      3      2      4      2      3      7   : 40260
aida08 :     19      9      4      1      1      4      2      4      2      3      7   : 40244
aida09 :     16      9      4      2      2      3      2      3      2      3      7   : 39688
aida10 :     19     10      5      1      2      2      2      4      1      4      7   : 41100
aida11 :     21     10      2      1      2      3      3      3      2      3      7   : 39908
aida12 :     25      7      7      2      2      3      2      3      2      3      7   : 39756
aida13 :     13      7      3      4      2      5      2      3      2      3      7   : 39964
aida14 :     21      7      9      2      1      2      2      4      1      4      7   : 41116
aida15 :     23      6      2      3      0      4      3      3      2      3      7   : 39948
aida16 :      9     11     10      2      3      4      2      2      2      3      7   : 39452

Tom says Aida09 clock fail is ok as its status bit is "6".
The large white difference for FEE5 is known and has been determined to be ok, a post run investigation will be undertaken.

12:35 -
usbec ok.
Current ok 
Stats good 
Temps ok 
Analysis ok R7_395. Dead time FEE1 still high 6.6%

13:33 -
usbec ok. Max implants ~ 1.8kHz
Current ok    006.850 uA      007.250 uA 
Stats - Aida11 runing low < 5k was ~20k overnight
Temps ok 
Analysis R7_415. Dead time FEE1 & FEE10 high 10%

14:00
usbec ok - ucesb1.png
Current ok - bias1.png
Stast -  Aida11 low - 

14:20 aida fee rebooted itself. A powercycle was performed. Upon reboot we are seeing extremely large amounts of noise in the FEEs. Looking at the waveforms we have very large 100kHz pick up in the FEEs. This has resulted in 50% deadtime in many FEEs including the p+n.

15:28 Because of extremely high rates across all FEEs have decided to do a powercycle. Before restarting the FEEs will give them a couple of minutes to cool.

18:00 Since the start of the shift we have been trying to recover the system froma large increase in noise following the crash at ~14:00.
      During this time NH has entered the area and inspected the system and also grounded the AIDA snout. This provided us with some improvement on the noise.
      The rates are still slightly above where we were before the crash but now appear stable. To counteract the dead time in the n+n strips we have raised the threshold to 0x64 for ASIC4 in all FEEs.
      We are now running with around 10% deadtime on FEE4 and less elsewhere for n+n. For p+n most have zero dead time apart from FEE11 which is still noisy.
      During the time we were trying to recover the system screenshots were taken of the waveforms. He it could be seen that the 100kHz noise was very apparent. Particularly in the n+n strips.

18:08 System wide checks all ok - bar some ADC but waveforms disabled
      Statistics ok - 210516_1809_Stats
      Temperatures ok - 210516_1809_Temp
      Bias and leakage ok - 210516_1810_Bias

18:37 Performed an ASIC check and now the rates have dropped in all n+n strips. Currently very small amounts of dead time
18:40 Realised this was because it raised the threshold of all strips to 0x64 on the n+n side.

19:25 Removed S452 from 1e2.... drive. Before removing checked with Nic backed up to Lustre. Also verified four ourselves.
      Now have around 4.2TB left which will provide around 80 hours of writing

20:16 We noticed iptraf was using around 30% CPU usage. We investigated whether it had any effect on the dead time but from what we have seen it has not.

20:57 System wide checks. Clock ok
	
		 Base 		Current 	Difference
aida05 fault 	 0x1552 : 	 0x1556 : 	 4  
White Rabbit error counter test result: Passed 15, Failed 1

Understand the status reports as follows:-
Status bit 3 : White Rabbit decoder detected an error in the received data
Status bit 2 : Firmware registered WR error, no reload of Timestamp
Status bit 0 : White Rabbit decoder reports uncertain of Timestamp information from WR

	
			 Base 		Current 		Difference
aida05 fault 	 0x0 : 	 0x1 : 	 1  
FPGA Timestamp error counter test result: Passed 15, Failed 1
If any of these counts are reported as in error
The ASIC readout system has detected a timeslip.
That is the timestamp read from the time FIFO is not younger than the last

      Statistics ok - 210516_2056_Stats
      Temp ok -  210516_2058_Temp
      Bias and leakage current ok -  210516_2058_Bias

23:16 System wide checks:
      Clock still ok 
	
		 Base 		Current 	Difference
aida05 fault 	 0x1552 : 	 0x155a : 	 8  
White Rabbit error counter test result: Passed 15, Failed 1

Understand the status reports as follows:-
Status bit 3 : White Rabbit decoder detected an error in the received data
Status bit 2 : Firmware registered WR error, no reload of Timestamp
Status bit 0 : White Rabbit decoder reports uncertain of Timestamp information from WR

	
			 Base 		Current 		Difference
aida05 fault 	 0x0 : 	 0x2 : 	 2  
FPGA Timestamp error counter test result: Passed 15, Failed 1
If any of these counts are reported as in error
The ASIC readout system has detected a timeslip.
That is the timestamp read from the time FIFO is not younger than the last

       Statistics - 210516_2315_Stats
       Temperature - 210516_2316_Temp
       Bias and leakage current ok - 210516_231
Attachment 1: Screenshot_2021-05-16_Statistics_aidas-gsi(4).png
Screenshot_2021-05-16_Statistics_aidas-gsi(4).png
Attachment 2: Screenshot_2021-05-16_Statistics_aidas-gsi(5).png
Screenshot_2021-05-16_Statistics_aidas-gsi(5).png
Attachment 3: Screenshot_2021-05-16_Temperature_and_status_scan_aidas-gsi(4).png
Screenshot_2021-05-16_Temperature_and_status_scan_aidas-gsi(4).png
Attachment 4: Screenshot_2021-05-16_Temperature_and_status_scan_aidas-gsi(5).png
Screenshot_2021-05-16_Temperature_and_status_scan_aidas-gsi(5).png
Attachment 5: 1Statistics_aidas-gsi(6).png
1Statistics_aidas-gsi(6).png
Attachment 6: 1Temperature_and_status_scan_aidas-gsi(6).png
1Temperature_and_status_scan_aidas-gsi(6).png
Attachment 7: Bias1.png
Bias1.png
Attachment 8: 210516_0857_Temp.png
210516_0857_Temp.png
Attachment 9: 210516_1554_Layout8.png
210516_1554_Layout8.png
Attachment 10: 210516_1555_Layout7.png
210516_1555_Layout7.png
Attachment 11: 210516_1600_Layout1.png
210516_1600_Layout1.png
Attachment 12: 210516_1601_Stats.png
210516_1601_Stats.png
Attachment 13: 210516_1605_1606.png
210516_1605_1606.png
Attachment 14: 210516_1808_Stats.png
210516_1808_Stats.png
Attachment 15: 210516_1809_Temp.png
210516_1809_Temp.png
Attachment 16: 210516_1810_Bias.png
210516_1810_Bias.png
Attachment 17: 210516_2056_Stats.png
210516_2056_Stats.png
Attachment 18: 210516_2058_Bias.png
210516_2058_Bias.png
Attachment 19: 210516_2313_Stats.png
210516_2313_Stats.png
Attachment 20: 210516_2315_Temp.png
210516_2315_Temp.png
Attachment 21: 210516_2316_Bias.png
210516_2316_Bias.png
  328   Wed May 19 09:06:58 2021 CAMay 16th 00:00 - 08:00
16th May 2021 - 00:00 - 08:00 Shift
Author: CA

00:15 System wide checks;

FEE64 module aida06 global clocks failed, 6
FEE64 module aida09 global clocks failed, 6
Clock status test result: Passed 14, Failed 2

Understand status as follows
Status bit 3 : firmware PLL that creates clocks from external clock not locked
Status bit 2 : always logic '1' 
Status bit 1 : LMK3200(2) PLL and clock distribution chip not locked to external clock
Status bit 0 : LMK3200(1) PLL and clock distribution chip not locked to external clock
If all these bits are not set then the operation of the firmware is unreliable

FEE64 module aida09 failed
Calibration test result: Passed 15, Failed 1

If any modules fail calibration , check the clock status and open the FADC Align and Control browser page to rerun calibration for that module

		 Base 		Current 	Difference
aida05 fault 	 0x714c : 	 0x7154 : 	 8  
White Rabbit error counter test result: Passed 15, Failed 1

Understand the status reports as follows:-
Status bit 3 : White Rabbit decoder detected an error in the received data
Status bit 2 : Firmware registered WR error, no reload of Timestamp
Status bit 0 : White Rabbit decoder reports uncertain of Timestamp information from WR

Base 		Current 		Difference
aida05 fault 	 0x0 : 	 0x3 : 	 3  
aida12 fault 	 0x0 : 	 0x3 : 	 3  
aida13 fault 	 0x0 : 	 0x4d : 	 77  
FPGA Timestamp error counter test result: Passed 13, Failed 3
If any of these counts are reported as in error
The ASIC readout system has detected a timeslip.
That is the timestamp read from the time FIFO is not younger than the last

Returned 0 0 0 0 0 0 0 0 0 0 0 0 0 0 0 0  
Mem(KB) :	4	8	16	32	64	128	256	512	1k	2k	4k
aida01 :     19     10      3      1      2      3      2      3      2      3      7   : 39660
aida02 :     29      5      3      1      1      3      2      3      2      3      7   : 39596
aida03 :     15      7      1      1      2      3      2      3      2      3      7   : 39588
aida04 :     44     26     19      5      2      4      3      3      2      2      7   : 38608
aida05 :     20     10      3      0      1      4      2      2      3      3      7   : 40208
aida06 :     27      6      2      1      2      4      2      4      2      3      7   : 40284
aida07 :     25      5      3      1      2      3      2      3      2      3      7   : 39644
aida08 :     23      8      2      3      1      4      2      3      2      3      7   : 39772
aida09 :     23     10      3      2      3      4      1      3      2      3      7   : 39644
aida10 :     18     10      3      2      3      2      2      2      2      4      7   : 41160
aida11 :     16      7      3      2      1      2      2      3      2      3      7   : 39464
aida12 :     21      4      7      1      3      3      3      3      2      3      7   : 40004
aida13 :     25      6      3      2      1      3      1      4      2      3      7   : 39876
aida14 :     20      8     10      1      1      2      2      2      2      4      7   : 41104
aida15 :     26      6      3      3      0      4      3      2      2      3      7   : 39464
aida16 :      9      8      2      4      1      3      1      4      2      3      7   : 39876

00:30 Stats ok - 210516_0030_stats.png
      Temps ok - 210516_0030_temps.png
      Bias ok - 210516_0030_bias.png

00:38 analyzer output R7_178 - Deadtime at 7.3% - 210516_R7_178_analysis.txt

02:21 system wide checks as above, except;

      		 Base 		Current 	Difference
aida05 fault 	 0x714c : 	 0x7159 : 	 13  
White Rabbit error counter test result: Passed 15, Failed 1

Understand the status reports as follows:-
Status bit 3 : White Rabbit decoder detected an error in the received data
Status bit 2 : Firmware registered WR error, no reload of Timestamp
Status bit 0 : White Rabbit decoder reports uncertain of Timestamp information from WR

			 Base 		Current 		Difference
aida05 fault 	 0x0 : 	 0x7 : 	 7  
aida12 fault 	 0x0 : 	 0x3 : 	 3  
aida13 fault 	 0x0 : 	 0x4d : 	 77  
FPGA Timestamp error counter test result: Passed 13, Failed 3
If any of these counts are reported as in error
The ASIC readout system has detected a timeslip.
That is the timestamp read from the time FIFO is not younger than the last

02:28 Stats ok - 210516_0230_stats.png
      Temps ok - 210516_0230_temps.png
      Bias ok - 210516_0230_bias.png

02:33 analyzer output R7_216 - Deadtime at 6.5% - 210516_R7_216_analysis.txt

04:36 system wide checks same as above, except;

		 Base 		Current 	Difference
aida05 fault 	 0x714c : 	 0x715c : 	 16  
White Rabbit error counter test result: Passed 15, Failed 1

Understand the status reports as follows:-
Status bit 3 : White Rabbit decoder detected an error in the received data
Status bit 2 : Firmware registered WR error, no reload of Timestamp
Status bit 0 : White Rabbit decoder reports uncertain of Timestamp information from WR

			 Base 		Current 		Difference
aida05 fault 	 0x0 : 	 0x9 : 	 9  
aida12 fault 	 0x0 : 	 0x3 : 	 3  
aida13 fault 	 0x0 : 	 0x4d : 	 77  
FPGA Timestamp error counter test result: Passed 13, Failed 3
If any of these counts are reported as in error
The ASIC readout system has detected a timeslip.
That is the timestamp read from the time FIFO is not younger than the last

04:37 Stats ok - 210516_0430_stats.png
      Temps ok - 210516_0430_temps.png
      Bias ok - 210516_0430_bias.png

04:44 analyzer output R7_260 - Deadtime at 6.9% - 210516_R7_260_analysis.txt

06:38 system wide checks same as before, except;

		 Base 		Current 	Difference
aida01 fault 	 0xf294 : 	 0xf296 : 	 2  
aida02 fault 	 0xd8ec : 	 0xd8ee : 	 2  
aida03 fault 	 0xf001 : 	 0xf003 : 	 2  
aida04 fault 	 0xd992 : 	 0xd994 : 	 2  
aida05 fault 	 0x714c : 	 0x7161 : 	 21  
aida06 fault 	 0x5a49 : 	 0x5a4a : 	 1  
aida07 fault 	 0x5aca : 	 0x5acb : 	 1  
aida08 fault 	 0xb92e : 	 0xb92f : 	 1  
White Rabbit error counter test result: Passed 8, Failed 8

Understand the status reports as follows:-
Status bit 3 : White Rabbit decoder detected an error in the received data
Status bit 2 : Firmware registered WR error, no reload of Timestamp
Status bit 0 : White Rabbit decoder reports uncertain of Timestamp information from WR

06:40 Stats ok - 210516_0640_stats.png
      Temps ok - 210516_0640_temps.png
      Bias ok - 210516_0640_bias.png

06:45 analyzer output R7_298 - Deadtime at 5.8% - 210516_R7_298_analysis.txt
Attachment 1: 210516_0030_bias.png
210516_0030_bias.png
Attachment 2: 210516_0030_stats.png
210516_0030_stats.png
Attachment 3: 210516_0030_temps.png
210516_0030_temps.png
Attachment 4: 210516_0230_bias.png
210516_0230_bias.png
Attachment 5: 210516_0230_stats.png
210516_0230_stats.png
Attachment 6: 210516_0230_temps.png
210516_0230_temps.png
Attachment 7: 210516_0430_bias.png
210516_0430_bias.png
Attachment 8: 210516_0430_stats.png
210516_0430_stats.png
Attachment 9: 210516_0430_temps.png
210516_0430_temps.png
Attachment 10: 210516_0640_bias.png
210516_0640_bias.png
Attachment 11: 210516_0640_stats.png
210516_0640_stats.png
Attachment 12: 210516_0640_temps.png.png
210516_0640_temps.png.png
Attachment 13: analysis.txt
 *** TDR format 3.3.0 analyser - TD - May 2021
 *** ERROR: READ I/O error:       5002
                   blocks:      32000
          ADC data format:  255660963 ( 1413413.6 Hz)
        Other data format:    6259037 (   34602.9 Hz)
 Sample trace data format:          0 (       0.0 Hz)
         Undefined format:          0 (       0.0 Hz)
   Other data format type:      PAUSE:        192 (       1.1 Hz)
                               RESUME:        192 (       1.1 Hz)
                              SYNC100:      32674 (     180.6 Hz)
                              WR48-63:      32674 (     180.6 Hz)
                           FEE64 disc:          0 (       0.0 Hz)
                             MBS info:    6193305 (   34239.5 Hz)
                           Other info:          0 (       0.0 Hz)

   ADC data range bit set:     287054 (    1587.0 Hz)

                Timewarps:        ADC:          0 (       0.0 Hz)
                                PAUSE:          0 (       0.0 Hz)
                               RESUME:          0 (       0.0 Hz)
                              SYNC100:          0 (       0.0 Hz)
                              WR48-63:          0 (       0.0 Hz)
                           FEE64 disc:          0 (       0.0 Hz)
                             MBS info:          0 (       0.0 Hz)
                            Undefined:          0 (       0.0 Hz)
                         Sample trace:          0 (       0.0 Hz)

 *** Timestamp elapsed time:      180.882 s
 FEE  elapsed dead time(s) elapsed idle time(s)
  0                0.117                0.000
  1                8.836                0.000
  2                1.027                0.000
  3                5.545                0.000
  4                0.000                5.604
  5                0.873                0.000
  6                0.370                0.000
  7                0.861                0.000
  8                0.767                0.000
  9                0.000               63.434
 10               13.201                0.000
 11                3.930                0.000
 12                0.813                0.000
 13                0.000               30.131
 14                0.448                0.000
 15                1.895                0.000
 16                0.000                0.000
 17                0.000                0.000
 18                0.000                0.000
 19                0.000                0.000
 20                0.000                0.000
 21                0.000                0.000
 22                0.000                0.000
 23                0.000                0.000
 24                0.000                0.000
 25                0.000                0.000
 26                0.000                0.000
 27                0.000                0.000
 28                0.000                0.000
 29                0.000                0.000
 30                0.000                0.000
 31                0.000                0.000
 32                0.000                0.000

 *** Statistics
 FEE  ADC Data Other Data     Sample  Undefined      Pause     Resume    SYNC100    WR48-63       Disc        MBS      Other   HEC Data
  0    9469697       3614          0          0          3          3       1264       1264          0       1080          0      15256
  1   23268933       6078          0          0         41         41       2998       2998          0          0          0      31257
  2   14135373    1756135          0          0          5          5       1968       1968          0    1752189          0      25654
  3   26646926    1718468          0          0         28         28       3507       3507          0    1711398          0      36818
  4    2828773     749772          0          0          0          0        426        426          0     748920          0       7104
  5   14183721     453202          0          0          5          5       1830       1830          0     449532          0      20813
  6   11921192     886700          0          0          5          5       1583       1583          0     883524          0      13410
  7   19791515     651950          0          0          5          5       2639       2639          0     646662          0      25026
  8   22244739       5464          0          0          4          4       2728       2728          0          0          0      32840
  9    1601175        378          0          0          0          0        189        189          0          0          0       2522
 10   41869813      10332          0          0         63         63       5103       5103          0          0          0      18083
 11   18332381       4602          0          0         16         16       2285       2285          0          0          0       5732
 12   14937821       3786          0          0          7          7       1886       1886          0          0          0      28026
 13    2220427        536          0          0          0          0        268        268          0          0          0       2121
 14   11574320       2908          0          0          3          3       1451       1451          0          0          0      17899
 15   20634157       5112          0          0          7          7       2549       2549          0          0          0       4493
 16          0          0          0          0          0          0          0          0          0          0          0          0
 17          0          0          0          0          0          0          0          0          0          0          0          0
 18          0          0          0          0          0          0          0          0          0          0          0          0
 19          0          0          0          0          0          0          0          0          0          0          0          0
 20          0          0          0          0          0          0          0          0          0          0          0          0
 21          0          0          0          0          0          0          0          0          0          0          0          0
 22          0          0          0          0          0          0          0          0          0          0          0          0
 23          0          0          0          0          0          0          0          0          0          0          0          0
 24          0          0          0          0          0          0          0          0          0          0          0          0
 25          0          0          0          0          0          0          0          0          0          0          0          0
 26          0          0          0          0          0          0          0          0          0          0          0          0
 27          0          0          0          0          0          0          0          0          0          0          0          0
 28          0          0          0          0          0          0          0          0          0          0          0          0
 29          0          0          0          0          0          0          0          0          0          0          0          0
 30          0          0          0          0          0          0          0          0          0          0          0          0
 31          0          0          0          0          0          0          0          0          0          0          0          0
 32          0          0          0          0          0          0          0          0          0          0          0          0

 *** Timewarps
 FEE       ADC      Pause     Resume    SYNC100    WR48-63       Disc        MBS  Undefined    Samples
  0          0          0          0          0          0          0          0          0          0
  1          0          0          0          0          0          0          0          0          0
  2          0          0          0          0          0          0          0          0          0
  3          0          0          0          0          0          0          0          0          0
  4          0          0          0          0          0          0          0          0          0
  5          0          0          0          0          0          0          0          0          0
  6          0          0          0          0          0          0          0          0          0
  7          0          0          0          0          0          0          0          0          0
  8          0          0          0          0          0          0          0          0          0
  9          0          0          0          0          0          0          0          0          0
 10          0          0          0          0          0          0          0          0          0
 11          0          0          0          0          0          0          0          0          0
 12          0          0          0          0          0          0          0          0          0
 13          0          0          0          0          0          0          0          0          0
 14          0          0          0          0          0          0          0          0          0
 15          0          0          0          0          0          0          0          0          0
 16          0          0          0          0          0          0          0          0          0
 17          0          0          0          0          0          0          0          0          0
 18          0          0          0          0          0          0          0          0          0
 19          0          0          0          0          0          0          0          0          0
 20          0          0          0          0          0          0          0          0          0
 21          0          0          0          0          0          0          0          0          0
 22          0          0          0          0          0          0          0          0          0
 23          0          0          0          0          0          0          0          0          0
 24          0          0          0          0          0          0          0          0          0
 25          0          0          0          0          0          0          0          0          0
 26          0          0          0          0          0          0          0          0          0
 27          0          0          0          0          0          0          0          0          0
 28          0          0          0          0          0          0          0          0          0
 29          0          0          0          0          0          0          0          0          0
 30          0          0          0          0          0          0          0          0          0
 31          0          0          0          0          0          0          0          0          0
 32          0          0          0          0          0          0          0          0          0

 *** Program elapsed time:   47.672s (  671.255 blocks/s,  41.953 Mb/s)
Attachment 14: analysis.txt
 *** TDR format 3.3.0 analyser - TD - May 2021
 *** ERROR: READ I/O error:       5002
                   blocks:      32000
          ADC data format:  255713262 ( 1398395.0 Hz)
        Other data format:    6206738 (   33942.2 Hz)
 Sample trace data format:          0 (       0.0 Hz)
         Undefined format:          0 (       0.0 Hz)
   Other data format type:      PAUSE:        185 (       1.0 Hz)
                               RESUME:        185 (       1.0 Hz)
                              SYNC100:      32681 (     178.7 Hz)
                              WR48-63:      32681 (     178.7 Hz)
                           FEE64 disc:          0 (       0.0 Hz)
                             MBS info:    6141006 (   33582.7 Hz)
                           Other info:          0 (       0.0 Hz)

   ADC data range bit set:     279005 (    1525.8 Hz)

                Timewarps:        ADC:          0 (       0.0 Hz)
                                PAUSE:          0 (       0.0 Hz)
                               RESUME:          0 (       0.0 Hz)
                              SYNC100:          0 (       0.0 Hz)
                              WR48-63:          0 (       0.0 Hz)
                           FEE64 disc:          0 (       0.0 Hz)
                             MBS info:          0 (       0.0 Hz)
                            Undefined:          0 (       0.0 Hz)
                         Sample trace:          0 (       0.0 Hz)

 *** Timestamp elapsed time:      182.862 s
 FEE  elapsed dead time(s) elapsed idle time(s)
  0                0.488                0.000
  1                8.465                0.000
  2                0.216                0.000
  3                7.120                0.000
  4                0.011                8.896
  5                0.764                0.000
  6                0.401                0.000
  7                1.395                0.000
  8                0.721                0.000
  9                0.000               86.292
 10               11.881                0.000
 11                1.912                0.000
 12                0.187                0.000
 13                0.000               15.181
 14                0.528                0.000
 15                0.095                0.000
 16                0.000                0.000
 17                0.000                0.000
 18                0.000                0.000
 19                0.000                0.000
 20                0.000                0.000
 21                0.000                0.000
 22                0.000                0.000
 23                0.000                0.000
 24                0.000                0.000
 25                0.000                0.000
 26                0.000                0.000
 27                0.000                0.000
 28                0.000                0.000
 29                0.000                0.000
 30                0.000                0.000
 31                0.000                0.000
 32                0.000                0.000

 *** Statistics
 FEE  ADC Data Other Data     Sample  Undefined      Pause     Resume    SYNC100    WR48-63       Disc        MBS      Other   HEC Data
  0    9424415       3624          0          0          2          2       1264       1264          0       1092          0      14964
  1   23109905       5922          0          0         39         39       2922       2922          0          0          0      29876
  2   14322958    1782809          0          0          3          3       2029       2029          0    1778745          0      25108
  3   26234410    1716299          0          0         35         35       3458       3458          0    1709313          0      35100
  4    2817740     734656          0          0          1          1        433        433          0     733788          0       6814
  5   13978921     443934          0          0          4          4       1871       1871          0     440184          0      20242
  6   11924553     862150          0          0          4          4       1621       1621          0     858900          0      13000
  7   19324336     623898          0          0         11         11       2446       2446          0     618984          0      24043
  8   21963572       5366          0          0          5          5       2678       2678          0          0          0      32304
  9    1580877        372          0          0          0          0        186        186          0          0          0       2567
 10   42874488      10618          0          0         59         59       5250       5250          0          0          0      17549
 11   18504188       4566          0          0         14         14       2269       2269          0          0          0       5838
 12   14580871       3684          0          0          2          2       1840       1840          0          0          0      27687
 13    2240991        612          0          0          0          0        306        306          0          0          0       2138
 14   11530867       2858          0          0          4          4       1425       1425          0          0          0      17152
 15   21300170       5370          0          0          2          2       2683       2683          0          0          0       4623
 16          0          0          0          0          0          0          0          0          0          0          0          0
 17          0          0          0          0          0          0          0          0          0          0          0          0
 18          0          0          0          0          0          0          0          0          0          0          0          0
 19          0          0          0          0          0          0          0          0          0          0          0          0
 20          0          0          0          0          0          0          0          0          0          0          0          0
 21          0          0          0          0          0          0          0          0          0          0          0          0
 22          0          0          0          0          0          0          0          0          0          0          0          0
 23          0          0          0          0          0          0          0          0          0          0          0          0
 24          0          0          0          0          0          0          0          0          0          0          0          0
 25          0          0          0          0          0          0          0          0          0          0          0          0
 26          0          0          0          0          0          0          0          0          0          0          0          0
 27          0          0          0          0          0          0          0          0          0          0          0          0
 28          0          0          0          0          0          0          0          0          0          0          0          0
 29          0          0          0          0          0          0          0          0          0          0          0          0
 30          0          0          0          0          0          0          0          0          0          0          0          0
 31          0          0          0          0          0          0          0          0          0          0          0          0
 32          0          0          0          0          0          0          0          0          0          0          0          0

 *** Timewarps
 FEE       ADC      Pause     Resume    SYNC100    WR48-63       Disc        MBS  Undefined    Samples
  0          0          0          0          0          0          0          0          0          0
  1          0          0          0          0          0          0          0          0          0
  2          0          0          0          0          0          0          0          0          0
  3          0          0          0          0          0          0          0          0          0
  4          0          0          0          0          0          0          0          0          0
  5          0          0          0          0          0          0          0          0          0
  6          0          0          0          0          0          0          0          0          0
  7          0          0          0          0          0          0          0          0          0
  8          0          0          0          0          0          0          0          0          0
  9          0          0          0          0          0          0          0          0          0
 10          0          0          0          0          0          0          0          0          0
 11          0          0          0          0          0          0          0          0          0
 12          0          0          0          0          0          0          0          0          0
 13          0          0          0          0          0          0          0          0          0
 14          0          0          0          0          0          0          0          0          0
 15          0          0          0          0          0          0          0          0          0
 16          0          0          0          0          0          0          0          0          0
 17          0          0          0          0          0          0          0          0          0
 18          0          0          0          0          0          0          0          0          0
 19          0          0          0          0          0          0          0          0          0
 20          0          0          0          0          0          0          0          0          0
 21          0          0          0          0          0          0          0          0          0
 22          0          0          0          0          0          0          0          0          0
 23          0          0          0          0          0          0          0          0          0
 24          0          0          0          0          0          0          0          0          0
 25          0          0          0          0          0          0          0          0          0
 26          0          0          0          0          0          0          0          0          0
 27          0          0          0          0          0          0          0          0          0
 28          0          0          0          0          0          0          0          0          0
 29          0          0          0          0          0          0          0          0          0
 30          0          0          0          0          0          0          0          0          0
 31          0          0          0          0          0          0          0          0          0
 32          0          0          0          0          0          0          0          0          0

 *** Program elapsed time:   45.405s (  704.764 blocks/s,  44.048 Mb/s)
Attachment 15: analysis.txt
 *** TDR format 3.3.0 analyser - TD - May 2021
 *** ERROR: READ I/O error:       5002
                   blocks:      32000
          ADC data format:  255591110 ( 1400708.0 Hz)
        Other data format:    6328890 (   34684.0 Hz)
 Sample trace data format:          0 (       0.0 Hz)
         Undefined format:          0 (       0.0 Hz)
   Other data format type:      PAUSE:        179 (       1.0 Hz)
                               RESUME:        179 (       1.0 Hz)
                              SYNC100:      32680 (     179.1 Hz)
                              WR48-63:      32680 (     179.1 Hz)
                           FEE64 disc:          0 (       0.0 Hz)
                             MBS info:    6263172 (   34323.9 Hz)
                           Other info:          0 (       0.0 Hz)

   ADC data range bit set:     288458 (    1580.8 Hz)

                Timewarps:        ADC:          0 (       0.0 Hz)
                                PAUSE:          0 (       0.0 Hz)
                               RESUME:          0 (       0.0 Hz)
                              SYNC100:          0 (       0.0 Hz)
                              WR48-63:          0 (       0.0 Hz)
                           FEE64 disc:          0 (       0.0 Hz)
                             MBS info:          0 (       0.0 Hz)
                            Undefined:          0 (       0.0 Hz)
                         Sample trace:          0 (       0.0 Hz)

 *** Timestamp elapsed time:      182.473 s
 FEE  elapsed dead time(s) elapsed idle time(s)
  0                0.000                0.000
  1                7.649                0.000
  2                0.265                0.000
  3                5.929                0.000
  4                0.000               21.293
  5                1.614                0.000
  6                0.390                0.000
  7                0.004                0.000
  8                1.749                0.000
  9                0.000               75.748
 10               12.608                0.000
 11                1.662                0.000
 12                0.334                0.000
 13                0.000               39.700
 14                0.092                0.000
 15                1.009                0.000
 16                0.000                0.000
 17                0.000                0.000
 18                0.000                0.000
 19                0.000                0.000
 20                0.000                0.000
 21                0.000                0.000
 22                0.000                0.000
 23                0.000                0.000
 24                0.000                0.000
 25                0.000                0.000
 26                0.000                0.000
 27                0.000                0.000
 28                0.000                0.000
 29                0.000                0.000
 30                0.000                0.000
 31                0.000                0.000
 32                0.000                0.000

 *** Statistics
 FEE  ADC Data Other Data     Sample  Undefined      Pause     Resume    SYNC100    WR48-63       Disc        MBS      Other   HEC Data
  0    9481493       3580          0          0          0          0       1244       1244          0       1092          0      15504
  1   23234003       5924          0          0         42         42       2920       2920          0          0          0      30950
  2   14360490    1787895          0          0          2          2       2026       2026          0    1783839          0      26238
  3   26580599    1734745          0          0         32         32       3537       3537          0    1727607          0      36830
  4    2867864     759325          0          0          0          0        449        449          0     758427          0       7075
  5   13998560     454755          0          0          6          6       1806       1806          0     451131          0      20732
  6   12019427     893028          0          0          3          3       1644       1644          0     889734          0      13550
  7   19745451     656494          0          0          1          1       2575       2575          0     651342          0      25286
  8   21649633       5478          0          0          7          7       2732       2732          0          0          0      32719
  9    1602793        374          0          0          0          0        187        187          0          0          0       2586
 10   42457575      10646          0          0         62         62       5261       5261          0          0          0      18276
 11   18423606       4634          0          0         16         16       2301       2301          0          0          0       6050
 12   14493303       3540          0          0          2          2       1768       1768          0          0          0      27878
 13    2240564        512          0          0          0          0        256        256          0          0          0       2153
 14   11446056       2794          0          0          2          2       1395       1395          0          0          0      17997
 15   20989693       5166          0          0          4          4       2579       2579          0          0          0       4634
 16          0          0          0          0          0          0          0          0          0          0          0          0
 17          0          0          0          0          0          0          0          0          0          0          0          0
 18          0          0          0          0          0          0          0          0          0          0          0          0
 19          0          0          0          0          0          0          0          0          0          0          0          0
 20          0          0          0          0          0          0          0          0          0          0          0          0
 21          0          0          0          0          0          0          0          0          0          0          0          0
 22          0          0          0          0          0          0          0          0          0          0          0          0
 23          0          0          0          0          0          0          0          0          0          0          0          0
 24          0          0          0          0          0          0          0          0          0          0          0          0
 25          0          0          0          0          0          0          0          0          0          0          0          0
 26          0          0          0          0          0          0          0          0          0          0          0          0
 27          0          0          0          0          0          0          0          0          0          0          0          0
 28          0          0          0          0          0          0          0          0          0          0          0          0
 29          0          0          0          0          0          0          0          0          0          0          0          0
 30          0          0          0          0          0          0          0          0          0          0          0          0
 31          0          0          0          0          0          0          0          0          0          0          0          0
 32          0          0          0          0          0          0          0          0          0          0          0          0

 *** Timewarps
 FEE       ADC      Pause     Resume    SYNC100    WR48-63       Disc        MBS  Undefined    Samples
  0          0          0          0          0          0          0          0          0          0
  1          0          0          0          0          0          0          0          0          0
  2          0          0          0          0          0          0          0          0          0
  3          0          0          0          0          0          0          0          0          0
  4          0          0          0          0          0          0          0          0          0
  5          0          0          0          0          0          0          0          0          0
  6          0          0          0          0          0          0          0          0          0
  7          0          0          0          0          0          0          0          0          0
  8          0          0          0          0          0          0          0          0          0
  9          0          0          0          0          0          0          0          0          0
 10          0          0          0          0          0          0          0          0          0
 11          0          0          0          0          0          0          0          0          0
 12          0          0          0          0          0          0          0          0          0
 13          0          0          0          0          0          0          0          0          0
 14          0          0          0          0          0          0          0          0          0
 15          0          0          0          0          0          0          0          0          0
 16          0          0          0          0          0          0          0          0          0
 17          0          0          0          0          0          0          0          0          0
 18          0          0          0          0          0          0          0          0          0
 19          0          0          0          0          0          0          0          0          0
 20          0          0          0          0          0          0          0          0          0
 21          0          0          0          0          0          0          0          0          0
 22          0          0          0          0          0          0          0          0          0
 23          0          0          0          0          0          0          0          0          0
 24          0          0          0          0          0          0          0          0          0
 25          0          0          0          0          0          0          0          0          0
 26          0          0          0          0          0          0          0          0          0
 27          0          0          0          0          0          0          0          0          0
 28          0          0          0          0          0          0          0          0          0
 29          0          0          0          0          0          0          0          0          0
 30          0          0          0          0          0          0          0          0          0
 31          0          0          0          0          0          0          0          0          0
 32          0          0          0          0          0          0          0          0          0

 *** Program elapsed time:   52.041s (  614.900 blocks/s,  38.431 Mb/s)
Attachment 16: analysis.txt
 *** TDR format 3.3.0 analyser - TD - May 2021
 *** ERROR: READ I/O error:       5002
                   blocks:      32000
          ADC data format:  254484788 ( 1267953.1 Hz)
        Other data format:    7435212 (   37045.4 Hz)
 Sample trace data format:          0 (       0.0 Hz)
         Undefined format:          0 (       0.0 Hz)
   Other data format type:      PAUSE:        166 (       0.8 Hz)
                               RESUME:        166 (       0.8 Hz)
                              SYNC100:      32747 (     163.2 Hz)
                              WR48-63:      32747 (     163.2 Hz)
                           FEE64 disc:          0 (       0.0 Hz)
                             MBS info:    7369386 (   36717.5 Hz)
                           Other info:          0 (       0.0 Hz)

   ADC data range bit set:     359272 (    1790.0 Hz)

                Timewarps:        ADC:          0 (       0.0 Hz)
                                PAUSE:          0 (       0.0 Hz)
                               RESUME:          0 (       0.0 Hz)
                              SYNC100:          0 (       0.0 Hz)
                              WR48-63:          0 (       0.0 Hz)
                           FEE64 disc:          0 (       0.0 Hz)
                             MBS info:          0 (       0.0 Hz)
                            Undefined:          0 (       0.0 Hz)
                         Sample trace:          0 (       0.0 Hz)

 *** Timestamp elapsed time:      200.705 s
 FEE  elapsed dead time(s) elapsed idle time(s)
  0                0.411                0.000
  1               11.545                0.000
  2                1.046                0.000
  3                6.943                0.000
  4                0.008                8.993
  5                0.438                0.000
  6                0.000                0.000
  7                1.702                0.000
  8                0.655                0.000
  9                0.000               75.734
 10                6.237                0.000
 11                1.119                0.000
 12                0.217                0.000
 13                0.000               28.278
 14                0.250                0.000
 15                0.105                0.000
 16                0.000                0.000
 17                0.000                0.000
 18                0.000                0.000
 19                0.000                0.000
 20                0.000                0.000
 21                0.000                0.000
 22                0.000                0.000
 23                0.000                0.000
 24                0.000                0.000
 25                0.000                0.000
 26                0.000                0.000
 27                0.000                0.000
 28                0.000                0.000
 29                0.000                0.000
 30                0.000                0.000
 31                0.000                0.000
 32                0.000                0.000

 *** Statistics
 FEE  ADC Data Other Data     Sample  Undefined      Pause     Resume    SYNC100    WR48-63       Disc        MBS      Other   HEC Data
  0    8401665       3348          0          0          2          2       1072       1072          0       1200          0      19564
  1   26165949       6958          0          0         57         57       3422       3422          0          0          0      37826
  2   13624578    2004081          0          0          4          4       1973       1973          0    2000127          0      32349
  3   29939387    1947767          0          0         35         35       4004       4004          0    1939689          0      45332
  4    3232848     946545          0          0          1          1        548        548          0     945447          0       8745
  5   15270389     573894          0          0          6          6       1986       1986          0     569910          0      26107
  6   10372112    1114231          0          0          0          0       1457       1457          0    1111317          0      17063
  7   19130864     806574          0          0          8          8       2431       2431          0     801696          0      31336
  8   24018310       5808          0          0          5          5       2899       2899          0          0          0      41117
  9    1787485        418          0          0          0          0        209        209          0          0          0       3357
 10   42125761      10654          0          0         29         29       5298       5298          0          0          0      22828
 11   16187533       3960          0          0         11         11       1969       1969          0          0          0       7397
 12   14311704       3490          0          0          1          1       1744       1744          0          0          0      35224
 13    2388212        620          0          0          0          0        310        310          0          0          0       2664
 14    9736084       2414          0          0          1          1       1206       1206          0          0          0      22553
 15   17791907       4450          0          0          6          6       2219       2219          0          0          0       5810
 16          0          0          0          0          0          0          0          0          0          0          0          0
 17          0          0          0          0          0          0          0          0          0          0          0          0
 18          0          0          0          0          0          0          0          0          0          0          0          0
 19          0          0          0          0          0          0          0          0          0          0          0          0
 20          0          0          0          0          0          0          0          0          0          0          0          0
 21          0          0          0          0          0          0          0          0          0          0          0          0
 22          0          0          0          0          0          0          0          0          0          0          0          0
 23          0          0          0          0          0          0          0          0          0          0          0          0
 24          0          0          0          0          0          0          0          0          0          0          0          0
 25          0          0          0          0          0          0          0          0          0          0          0          0
 26          0          0          0          0          0          0          0          0          0          0          0          0
 27          0          0          0          0          0          0          0          0          0          0          0          0
 28          0          0          0          0          0          0          0          0          0          0          0          0
 29          0          0          0          0          0          0          0          0          0          0          0          0
 30          0          0          0          0          0          0          0          0          0          0          0          0
 31          0          0          0          0          0          0          0          0          0          0          0          0
 32          0          0          0          0          0          0          0          0          0          0          0          0

 *** Timewarps
 FEE       ADC      Pause     Resume    SYNC100    WR48-63       Disc        MBS  Undefined    Samples
  0          0          0          0          0          0          0          0          0          0
  1          0          0          0          0          0          0          0          0          0
  2          0          0          0          0          0          0          0          0          0
  3          0          0          0          0          0          0          0          0          0
  4          0          0          0          0          0          0          0          0          0
  5          0          0          0          0          0          0          0          0          0
  6          0          0          0          0          0          0          0          0          0
  7          0          0          0          0          0          0          0          0          0
  8          0          0          0          0          0          0          0          0          0
  9          0          0          0          0          0          0          0          0          0
 10          0          0          0          0          0          0          0          0          0
 11          0          0          0          0          0          0          0          0          0
 12          0          0          0          0          0          0          0          0          0
 13          0          0          0          0          0          0          0          0          0
 14          0          0          0          0          0          0          0          0          0
 15          0          0          0          0          0          0          0          0          0
 16          0          0          0          0          0          0          0          0          0
 17          0          0          0          0          0          0          0          0          0
 18          0          0          0          0          0          0          0          0          0
 19          0          0          0          0          0          0          0          0          0
 20          0          0          0          0          0          0          0          0          0
 21          0          0          0          0          0          0          0          0          0
 22          0          0          0          0          0          0          0          0          0
 23          0          0          0          0          0          0          0          0          0
 24          0          0          0          0          0          0          0          0          0
 25          0          0          0          0          0          0          0          0          0
 26          0          0          0          0          0          0          0          0          0
 27          0          0          0          0          0          0          0          0          0
 28          0          0          0          0          0          0          0          0          0
 29          0          0          0          0          0          0          0          0          0
 30          0          0          0          0          0          0          0          0          0
 31          0          0          0          0          0          0          0          0          0
 32          0          0          0          0          0          0          0          0          0

 *** Program elapsed time:   43.287s (  739.250 blocks/s,  46.203 Mb/s)
  327   Wed May 19 06:59:33 2021 OHWednesday 19th May 08:00 - 16:00
08:00 OH Takes over for CA
      Thresholds 0xc for p+n and 0x19 for n+n ASICs 1-3 and 0x64 for n+nASIC4

 PULSER SETTINGS
---------------------------
 Pulse is ON
 Positive Tail Pulse
 Trigger Source is Internal Clock
 Trigger Threshold is 3.5
 Amplitude   : 2.0 Volts
 Rep Rate    : 2.0 hZ
 Delay       : 250.0 ns
 Fall Time   : 1 ms
 Attenuation : 1
 Display is  : Volts
 Equivalent keV is : 200.0
 Ramp Start at 0.01 Volts
 Ramp Stop  at 9.99 Volts
 Ramp Start at 1.0 keV
 Ramp Stop  at 999.0 keV
 Ramp Time  is 60 seconds
 # Ramp Cycles is 1

       Max average dead time in R14_586 3.2% which is 9.6% on spill
       Stable from yesterday

10:02 System wide checks. All ok expect WR
	
		 Base 		Current 	Difference
aida05 fault 	 0x500 : 	 0x554 : 	 84  
White Rabbit error counter test result: Passed 15, Failed 1

Understand the status reports as follows:-
Status bit 3 : White Rabbit decoder detected an error in the received data
Status bit 2 : Firmware registered WR error, no reload of Timestamp
Status bit 0 : White Rabbit decoder reports uncertain of Timestamp information from WR

      Statistics - Attachment 1
      Temp - attachment 2
      Bias and leakage currents ok - Attachment 3


11:17 A new run was started as the microspill has been changed. I believe to optimise FRS deadtime.
11:45 They are still working on it

12:05 Beam off for a bit while they optimise spill

12:15 System wide checks ok expect WR
	
		 Base 		Current 	Difference
aida05 fault 	 0x500 : 	 0x567 : 	 103  
White Rabbit error counter test result: Passed 15, Failed 1

Understand the status reports as follows:-
Status bit 3 : White Rabbit decoder detected an error in the received data
Status bit 2 : Firmware registered WR error, no reload of Timestamp
Status bit 0 : White Rabbit decoder reports uncertain of Timestamp information from WR

     Statistics - Attachment 4
     Temp - Attachment 5
     Bias - Attachment 6

13:11 Magda has said that the changes to the spill structure only gained them a few percent in dead time
      Further changes could be done, but would take at least two hours

13:19 Dead time following the current spill changes
	R14_648	R14_649	R14_650	R14_651	Sum DT (S)   Avergage DT (%)   On Spill DT (%)
FEE	244.823	252.168	247.155	240.421	984.567		
0	0.063	0.025	0.105	0.096	0.289	     0.029353005	0.088059015
1	3.981	4.907	4.17	2.484	15.542	     1.578561947	4.73568584
2	0.01	0	0.121	0.779	0.91	     0.092426417	0.277279251
3	3.625	2.972	2.766	3.335	12.698	     1.289704002	3.869112006
4	0.088	0.1	0.12	0.136	0.444	     0.045095966	0.135287898
5	9.392	5.798	9.835	8.01	33.035	     3.355282068	10.0658462
6	0.153	0.075	0.01	0.517	0.755	     0.076683456	0.230050367
7	7.4	7.565	7.703	6.415	29.083	     2.953887343	8.86166203
8	0.221	0.606	1.321	0.539	2.687	     0.272911849	0.818735546
9	0	0	0	0	0	     0          	0
10	1.381	0.368	1.196	1.091	4.036	     0.409926394	1.229779182
11	0.066	0.025	0.039	0.017	0.147	     0.014930421	0.044791264
12	0.166	0.041	0.062	0.024	0.293	     0.029759275	0.089277825
13	0	0	0	0	0	     0          	0
14	0.71	0	0.005	0.074	0.789	     0.08013675	        0.240410251
15	0.239	0.17	0.208	0.286	0.903	     0.091715444	0.275146333
16	0	0	0	0	0	     0          	0

14:03 System wide checks ok - WR same difference as before
      Statistics - attachment 7
      Temperatures - attachment 8
      Bias and leakage currents - attachment 9
Attachment 1: 210519_1002_Stats.png
210519_1002_Stats.png
Attachment 2: 210519_1002_Temp.png
210519_1002_Temp.png
Attachment 3: 210519_1003_Bias.png
210519_1003_Bias.png
Attachment 4: 210519_1213_Stats.png
210519_1213_Stats.png
Attachment 5: 210519_1214_Temp.png
210519_1214_Temp.png
Attachment 6: 210519_1215_Bioas.png
210519_1215_Bioas.png
Attachment 7: 210519_1403_Stats.png
210519_1403_Stats.png
Attachment 8: 210519_1404_Temp.png
210519_1404_Temp.png
Attachment 9: 210519_1405_bias.png
210519_1405_bias.png
  326   Tue May 18 23:11:40 2021 CAWednesday May 19th 00:00 - 08:00
00:00 CA takes over
      LS has performed usual checks, see previous Elog entry - all ok

00:30 stats ok
      R14_470 deadtime at 4.4%

02:10 system wide checks ok except:

      all ADC fail calibration (expected, no waveforms)

      WR decoder status

      		 Base 		Current 	Difference
aida05 fault 	 0x500 : 	 0x52f : 	 47  
White Rabbit error counter test result: Passed 15, Failed 1

Understand the status reports as follows:-
Status bit 3 : White Rabbit decoder detected an error in the received data
Status bit 2 : Firmware registered WR error, no reload of Timestamp
Status bit 0 : White Rabbit decoder reports uncertain of Timestamp information from WR

02:12 FEE64 Temps ok - attachment 1
      Stats ok - attachment 2
      detector bias / leakage currents ok - attachment 3
      dead-times ok - R14_497 max 4% - attachment 4

03:27 DAQ continues ok - writing to file R14_517

04:07 system wide checks ok except:

      all ADC fail calibration (expected, no waveforms)

      WR decoder status

 Base 		Current 	Difference
aida05 fault 	 0x500 : 	 0x537 : 	 55  
White Rabbit error counter test result: Passed 15, Failed 1

Understand the status reports as follows:-
Status bit 3 : White Rabbit decoder detected an error in the received data
Status bit 2 : Firmware registered WR error, no reload of Timestamp
Status bit 0 : White Rabbit decoder reports uncertain of Timestamp information from WR

      FEE64 Temps ok - attachment 6
      Stats ok - attachment 5
      detector bias / leakage currents ok - attachment 7
      dead-times ok - R14_526 max 4% - attachment 8

05:27 bad timestamp error in merger terminal - attachment 9

06:05 all system wide checks ok except;

      all ADC fail calibration (expected, no waveforms)

      WR decoder status

      		 Base 		Current 	Difference
aida05 fault 	 0x500 : 	 0x53d : 	 61  
White Rabbit error counter test result: Passed 15, Failed 1

Understand the status reports as follows:-
Status bit 3 : White Rabbit decoder detected an error in the received data
Status bit 2 : Firmware registered WR error, no reload of Timestamp
Status bit 0 : White Rabbit decoder reports uncertain of Timestamp information from WR

06:07 FEE64 Temps ok - attachment 10
      Stats ok - attachment 11
      detector bias / leakage currents ok - attachment 12
      dead-times ok - R14_558 max 3.6% - attachment 13

07:01 another bad timestamp error in merger terminal - attachment 14
Attachment 1: Screenshot_from_2021-05-19_01-13-48.png
Screenshot_from_2021-05-19_01-13-48.png
Attachment 2: Screenshot_from_2021-05-19_01-14-09.png
Screenshot_from_2021-05-19_01-14-09.png
Attachment 3: Screenshot_from_2021-05-19_01-14-24.png
Screenshot_from_2021-05-19_01-14-24.png
Attachment 4: Screenshot_from_2021-05-19_01-19-37.png
Screenshot_from_2021-05-19_01-19-37.png
Attachment 5: Screenshot_from_2021-05-19_03-04-39.png
Screenshot_from_2021-05-19_03-04-39.png
Attachment 6: Screenshot_from_2021-05-19_03-05-33.png
Screenshot_from_2021-05-19_03-05-33.png
Attachment 7: Screenshot_from_2021-05-19_03-05-53.png
Screenshot_from_2021-05-19_03-05-53.png
Attachment 8: Screenshot_from_2021-05-19_03-09-03.png
Screenshot_from_2021-05-19_03-09-03.png
Attachment 9: Screenshot_from_2021-05-19_04-26-09.png
Screenshot_from_2021-05-19_04-26-09.png
Attachment 10: Screenshot_from_2021-05-19_05-08-01.png
Screenshot_from_2021-05-19_05-08-01.png
Attachment 11: Screenshot_from_2021-05-19_05-08-23.png
Screenshot_from_2021-05-19_05-08-23.png
Attachment 12: Screenshot_from_2021-05-19_05-08-46.png
Screenshot_from_2021-05-19_05-08-46.png
Attachment 13: Screenshot_from_2021-05-19_05-11-33.png
Screenshot_from_2021-05-19_05-11-33.png
Attachment 14: Screenshot_from_2021-05-19_06-12-29.png
Screenshot_from_2021-05-19_06-12-29.png
  325   Tue May 18 18:47:25 2021 LSTuesday 18th May 20:00 - 24:00
19.50
Stats okay (Fig 1)
FEE temps okay (Fig 2)
Bias okay (Fig 3)

System wide checks okay except:

		 Base 		Current 	Difference
aida05 fault 	 0x500 : 	 0x520 : 	 32  
White Rabbit error counter test result: Passed 15, Failed 1

Understand the status reports as follows:-
Status bit 3 : White Rabbit decoder detected an error in the received data
Status bit 2 : Firmware registered WR error, no reload of Timestamp
Status bit 0 : White Rabbit decoder reports uncertain of Timestamp information from WR

Merger rate ~1.8M items/s
Tape server ~7MB/s

Analysed R14_399, deadtimes are okay (Fig 4)

20.30
Stats okay (Fig 5)
Analysed R14_407, deadtimes are okay (Fig 6)

21.00
Stats okay (Fig 7)
Analysed R14_415, deadtimes are okay (Fig 8)

21.30
Stats okay (Fig 9)
Analysed R14_422, deadtimes are okay (Fig 10)

22.00
Stats okay (Fig 11)
FEE temps okay (Fig 12)
Bias okay (Fig 13)

System wide checks okay except:

		 Base 		Current 	Difference
aida05 fault 	 0x500 : 	 0x524 : 	 36  
White Rabbit error counter test result: Passed 15, Failed 1

Understand the status reports as follows:-
Status bit 3 : White Rabbit decoder detected an error in the received data
Status bit 2 : Firmware registered WR error, no reload of Timestamp
Status bit 0 : White Rabbit decoder reports uncertain of Timestamp information from WR

Merger rate ~2.3M items/s
Tape server ~8MB/s

Analysed R14_430, deadtimes are okay (Fig 14)

22.30
Stats okay (Fig 15)
Analysed R14_438, deadtimes are okay (Fig 16)
FEE8 deadtime seems to be abit higher (7s previous now 11s, total elapsed time both 232s) but still within 5%

23.00
Stats okay (Fig 17)
Analysed R14_445, deadtimes are okay (Fig 18)

23.30
Stats okay (Fig 19)
Analysed R14_454, deadtimes are okay (Fig 20)

24.00
Stats okay (Fig 21)
FEE temps okay (Fig 22)
Bias okay (Fig 23)

System wide checks okay except:

		 Base 		Current 	Difference
aida05 fault 	 0x500 : 	 0x529 : 	 41  
White Rabbit error counter test result: Passed 15, Failed 1

Understand the status reports as follows:-
Status bit 3 : White Rabbit decoder detected an error in the received data
Status bit 2 : Firmware registered WR error, no reload of Timestamp
Status bit 0 : White Rabbit decoder reports uncertain of Timestamp information from WR

The difference has increased over time (not sure if an issue)

Merger rate ~3M items/s
Tape server ~8MB/s

Analysed R14_462, deadtimes are okay (Fig 24)
Attachment 1: 210518_Stats_1950.png
210518_Stats_1950.png
Attachment 2: 210518_FEEtemps_1950.png
210518_FEEtemps_1950.png
Attachment 3: 210518_Bias_1950.png
210518_Bias_1950.png
Attachment 4: 210518_Deadtimes_R14_399.png
210518_Deadtimes_R14_399.png
Attachment 5: 210518_Stats_2028.png
210518_Stats_2028.png
Attachment 6: 210518_Deadtimes_R14_407.png
210518_Deadtimes_R14_407.png
Attachment 7: 210518_Stats_2059.png
210518_Stats_2059.png
Attachment 8: 210518_Deadtimes_R14_415.png
210518_Deadtimes_R14_415.png
Attachment 9: 210518_Stats_2130.png
210518_Stats_2130.png
Attachment 10: 210518_Deadtimes_R14_422.png
210518_Deadtimes_R14_422.png
Attachment 11: 210518_Stats_2158.png
210518_Stats_2158.png
Attachment 12: 210518_FEEtemps_2158.png
210518_FEEtemps_2158.png
Attachment 13: 210518_bias_2158.png
210518_bias_2158.png
Attachment 14: 210518_Deadtimes_R14_430.png
210518_Deadtimes_R14_430.png
Attachment 15: 210518_Stats_2230.png
210518_Stats_2230.png
Attachment 16: 210518_deadtimes_R14_438.png
210518_deadtimes_R14_438.png
Attachment 17: 210518_Stats_2300.png
210518_Stats_2300.png
Attachment 18: 210518_Deadtimes_R14_445.png
210518_Deadtimes_R14_445.png
Attachment 19: 210518_Stats_2330.png
210518_Stats_2330.png
Attachment 20: 210518_Deadtimes_R14_454.png
210518_Deadtimes_R14_454.png
Attachment 21: 210518_Stats_2400.png
210518_Stats_2400.png
Attachment 22: 210518_FEEtemps_2400.png
210518_FEEtemps_2400.png
Attachment 23: 210518_bias_2400.png
210518_bias_2400.png
Attachment 24: 210518_Deadtimes_R14_462.png
210518_Deadtimes_R14_462.png
  324   Tue May 18 14:57:43 2021 CBTuesday 18th May 16:00 - 20:00
15:58 Took shift over from OH and PP

Stats OK - attach 1
Temps OK - attach 2
Bias  OK - attach 3

System-wide checks
Clock - all pass
ADC - all fail (as before)
	
		 Base 		Current 	Difference
aida05 fault 	 0x500 : 	 0x510 : 	 16  
White Rabbit error counter test result: Passed 15, Failed 1

Understand the status reports as follows:-
Status bit 3 : White Rabbit decoder detected an error in the received data
Status bit 2 : Firmware registered WR error, no reload of Timestamp
Status bit 0 : White Rabbit decoder reports uncertain of Timestamp information from WR

FPGA - all pass

Returned 0 0 0 0 0 0 0 0 0 0 0 0 0 0 0 0  
Mem(KB) :	4	8	16	32	64	128	256	512	1k	2k	4k
aida01 :     22      8      7      4      1      4      2      2      2      2      7   : 37320
aida02 :     12      9      4      2      4      2      3      3      3      3      6   : 36856
aida03 :     19      6      7      2      2      2      2      4      3      3      6   : 37036
aida04 :     18      9     10      6      1      4      1      4      3      3      6   : 37168
aida05 :     17     12      2      1      2      3      3      3      3      3      6   : 36836
aida06 :     19      8      7      7      2      4      2      4      3      3      6   : 37468
aida07 :     28      5      4      1      2      4      2      3      2      2      7   : 37752
aida08 :     17      5      4      2      1      2      2      3      3      3      6   : 36396
aida09 :     21     10      4      5      4      4      3      3      3      3      6   : 37252
aida10 :     15     13      4      2      2      2      3      2      2      4      6   : 37284
aida11 :     22     13      3      3      4      3      1      4      3      3      6   : 37072
aida12 :      2      8      1      3      1      3      2      3      3      3      6   : 36472
aida13 :     23      5      4      4      1      4      3      2      3      3      6   : 36484
aida14 :     19      7      4      3      1      3      2      4      2      4      6   : 38116
aida15 :     20     10      2      2      3      2      3      2      3      3      6   : 36288
aida16 :     29      6      1      2      0      3      1      4      3      3      6   : 36724

	
 Collecting the file size of each FEE64 Options CONTENTS file to check they are all the same

 FEE : aida01 =>   Options file size is 1026 	 Last changed Mon May 17 11:43:04 CEST 2021
 FEE : aida02 =>   Options file size is 1014 	 Last changed Thu Apr 29 14:43:46 CEST 2021
 FEE : aida03 =>   Options file size is 1014 	 Last changed Thu Apr 29 14:43:50 CEST 2021
 FEE : aida04 =>   Options file size is 1025 	 Last changed Fri May 14 16:54:56 CEST 2021
 FEE : aida05 =>   Options file size is 1025 	 Last changed Mon May 17 06:25:41 CEST 2021
 FEE : aida06 =>   Options file size is 1014 	 Last changed Thu Apr 29 14:43:59 CEST 2021
 FEE : aida07 =>   Options file size is 1014 	 Last changed Thu Apr 29 14:44:02 CEST 2021
 FEE : aida08 =>   Options file size is 1025 	 Last changed Wed May 05 12:15:54 CEST 2021
 FEE : aida09 =>   Options file size is 1014 	 Last changed Thu Apr 29 14:44:08 CEST 2021
 FEE : aida10 =>   Options file size is 1014 	 Last changed Thu Apr 29 14:44:57 CEST 2021
 FEE : aida11 =>   Options file size is 1014 	 Last changed Thu Apr 29 14:44:57 CEST 2021
 FEE : aida12 =>   Options file size is 1014 	 Last changed Thu Apr 29 14:44:57 CEST 2021
 FEE : aida13 =>   Options file size is 1025 	 Last changed Fri May 07 19:40:34 CEST 2021
 FEE : aida14 =>   Options file size is 1014 	 Last changed Thu Apr 29 14:44:57 CEST 2021
 FEE : aida15 =>   Options file size is 1014 	 Last changed Thu Apr 29 14:44:57 CEST 2021
 FEE : aida16 =>   Options file size is 1014 	 Last changed Thu Apr 29 14:44:57 CEST 2021

Analysed R14_342. Attach 4. Dead time <5%


17:00

Stats OK - attach 5
Temps OK - as before
Bias  increasing quite quickly - attach 6

System-wide checks

System-wide checks
Clock - all pass
ADC - all fail (as before)
	
		 Base 		Current 	Difference
aida05 fault 	 0x500 : 	 0x512 : 	 18  
White Rabbit error counter test result: Passed 15, Failed 1

Understand the status reports as follows:-
Status bit 3 : White Rabbit decoder detected an error in the received data
Status bit 2 : Firmware registered WR error, no reload of Timestamp
Status bit 0 : White Rabbit decoder reports uncertain of Timestamp information from WR

FPGA - all pass

Returned 0 0 0 0 0 0 0 0 0 0 0 0 0 0 0 0  
Mem(KB) :	4	8	16	32	64	128	256	512	1k	2k	4k
aida01 :     28      7      8      4      1      4      2      2      2      2      7   : 37352
aida02 :     24     11      6      4      3      2      3      2      3      3      6   : 36440
aida03 :     17     11      5      2      1      2      2      3      3      3      6   : 36460
aida04 :     25     13     10      6      2      4      2      3      3      3      6   : 37036
aida05 :     23      7      3      2      2      3      3      3      3      3      6   : 36868
aida06 :      1     12      3      8      2      4      3      3      3      3      6   : 37140
aida07 :     22     12      1      1      2      4      2      2      2      2      7   : 37224
aida08 :     21      8      7      2      1      3      3      2      3      3      6   : 36356
aida09 :     23      7      4      6      4      3      2      4      3      3      6   : 37396
aida10 :     27      7      2      2      2      2      3      3      2      4      6   : 37764
aida11 :     12      5      3      5      4      3      1      4      3      3      6   : 37032
aida12 :     23      9      4      1      2      3      2      3      3      3      6   : 36612
aida13 :     10     12      6      3      1      4      3      2      3      3      6   : 36488
aida14 :     23      7      3      3      1      3      2      3      2      4      6   : 37604
aida15 :     22      6      6      4      2      2      3      2      3      3      6   : 36328
aida16 :     27      7      3      1      0      3      1      4      3      3      6   : 36724


18:00

Stats OK - attach 7
Temps OK - as before
Bias - attach 8

System-wide checks - as before except
	
		 Base 		Current 	Difference
aida05 fault 	 0x500 : 	 0x517 : 	 23  
White Rabbit error counter test result: Passed 15, Failed 1

Understand the status reports as follows:-
Status bit 3 : White Rabbit decoder detected an error in the received data
Status bit 2 : Firmware registered WR error, no reload of Timestamp
Status bit 0 : White Rabbit decoder reports uncertain of Timestamp information from WR

Analysed R14_371. Attach 9. Dead time below 5%.


18:35 MBS DAQ crashed


18:40
Stats OK - attach 9
Temps OK - as before
Bias - attach 10

System-wide checks - as before except
	
		 Base 		Current 	Difference
aida05 fault 	 0x500 : 	 0x51a : 	 26  
White Rabbit error counter test result: Passed 15, Failed 1

Understand the status reports as follows:-
Status bit 3 : White Rabbit decoder detected an error in the received data
Status bit 2 : Firmware registered WR error, no reload of Timestamp
Status bit 0 : White Rabbit decoder reports uncertain of Timestamp information from WR

18:42 MBS DAQ restarted - new file being opened.


19:36
Stats OK - attach 11
Temps OK - attach 12
Bias - attach 13

System-wide checks
Clock OK
ADC all fail

	
		 Base 		Current 	Difference
aida05 fault 	 0x500 : 	 0x51e : 	 30  
White Rabbit error counter test result: Passed 15, Failed 1

Understand the status reports as follows:-
Status bit 3 : White Rabbit decoder detected an error in the received data
Status bit 2 : Firmware registered WR error, no reload of Timestamp
Status bit 0 : White Rabbit decoder reports uncertain of Timestamp information from WR

FPGA OK

	
Returned 0 0 0 0 0 0 0 0 0 0 0 0 0 0 0 0  
Mem(KB) :	4	8	16	32	64	128	256	512	1k	2k	4k
aida01 :     24     11      5      4      1      4      2      3      2      2      7   : 37832
aida02 :      0      5      6      3      4      2      3      2      3      3      6   : 36328
aida03 :     15      8      5      3      2      2      1      3      4      3      6   : 37292
aida04 :     14      8      7      5      3      4      2      3      3      3      6   : 36936
aida05 :     31      6      1      1      2      3      3      3      2      4      6   : 37852
aida06 :      9      8      3      8      2      4      3      3      3      3      6   : 37140
aida07 :     21      7      2      1      2      4      1      3      2      2      7   : 37452
aida08 :      8      4      5      3      1      3      2      3      3      3      6   : 36528
aida09 :     24      7      3      5      4      3      2      4      3      3      6   : 37352
aida10 :     19      9      7      1      2      2      3      2      2      4      6   : 37284
aida11 :     27      5      0      5      4      3      1      4      3      3      6   : 37044
aida12 :     31      9      2      1      2      3      2      3      3      3      6   : 36612
aida13 :     21     10      4      3      1      4      3      2      3      3      6   : 36484
aida14 :     22      6      4      2      1      3      2      4      2      4      6   : 38088
aida15 :     21      9      3      4      2      2      3      2      3      3      6   : 36300
aida16 :     23     11      4      2      1      4      2      3      3      3      6   : 36724


19:43 Shift handed over to LS
Attachment 1: Stats1.png
Stats1.png
Attachment 2: Temps1.png
Temps1.png
Attachment 3: Bias1.png
Bias1.png
Attachment 4: Analysis_R14_342
 *** TDR format 3.3.0 analyser - TD - May 2021
 *** ERROR: READ I/O error:       5002
                   blocks:      32000
          ADC data format:  252065796 ( 1015168.3 Hz)
        Other data format:    9854206 (   39686.8 Hz)
 Sample trace data format:          0 (       0.0 Hz)
         Undefined format:          0 (       0.0 Hz)
   Other data format type:      PAUSE:        242 (       1.0 Hz)
                               RESUME:        241 (       1.0 Hz)
                              SYNC100:      32924 (     132.6 Hz)
                              WR48-63:      32924 (     132.6 Hz)
                           FEE64 disc:          0 (       0.0 Hz)
                             MBS info:    9787875 (   39419.6 Hz)
                           Other info:          0 (       0.0 Hz)

   ADC data range bit set:     499592 (    2012.1 Hz)

                Timewarps:        ADC:          0 (       0.0 Hz)
                                PAUSE:          0 (       0.0 Hz)
                               RESUME:          0 (       0.0 Hz)
                              SYNC100:          0 (       0.0 Hz)
                              WR48-63:          0 (       0.0 Hz)
                           FEE64 disc:          0 (       0.0 Hz)
                             MBS info:          0 (       0.0 Hz)
                            Undefined:          0 (       0.0 Hz)
                         Sample trace:          0 (       0.0 Hz)

 *** Timestamp elapsed time:      248.300 s
 FEE  elapsed dead time(s) elapsed idle time(s)
  0                0.028               16.674
  1                4.476                0.000
  2                0.095                0.000
  3                4.784                0.000
  4                0.046               31.798
  5                8.905                0.000
  6                0.093                3.062
  7                8.121                0.000
  8                0.937                0.000
  9                0.000               59.989
 10                0.965                0.000
 11                0.025                0.000
 12                0.042                0.000
 13                0.000               63.078
 14                0.061                0.000
 15                0.217                0.000
 16                0.000                0.000
 17                0.000                0.000
 18                0.000                0.000
 19                0.000                0.000
 20                0.000                0.000
 21                0.000                0.000
 22                0.000                0.000
 23                0.000                0.000
 24                0.000                0.000
 25                0.000                0.000
 26                0.000                0.000
 27                0.000                0.000
 28                0.000                0.000
 29                0.000                0.000
 30                0.000                0.000
 31                0.000                0.000
 32                0.000                0.000

 *** Statistics
 FEE  ADC Data Other Data     Sample  Undefined      Pause     Resume    SYNC100    WR48-63       Disc        MBS      Other   HEC Data
  0    5702434       2900          0          0          3          3        703        703          0       1488          0      26833
  1   25200522       6341          0          0         31         30       3140       3140          0          0          0      55809
  2   10737118    2562866          0          0          3          3       1687       1687          0    2559486          0      44132
  3   32448674    2519917          0          0         37         37       4558       4558          0    2510727          0      63444
  4    3679860    1335111          0          0          5          5        577        577          0    1333947          0      11808
  5   37244520     759044          0          0         62         62       4940       4940          0     749040          0      34314
  6    9560033    1568630          0          0          3          3       1348       1348          0    1565928          0      23903
  7   40864979    1077667          0          0         66         66       5138       5138          0    1067259          0      40193
  8   17664728       4388          0          0          6          6       2188       2188          0          0          0      56741
  9    2360528        644          0          0          0          0        322        322          0          0          0       4285
 10   20213561       5020          0          0         12         12       2498       2498          0          0          0      34696
 11   11474187       2786          0          0          1          1       1392       1392          0          0          0      10298
 12    8797735       2188          0          0          1          1       1093       1093          0          0          0      49042
 13    2441760        604          0          0          0          0        302        302          0          0          0       3463
 14    7875814       1932          0          0          4          4        962        962          0          0          0      33004
 15   15799343       4168          0          0          8          8       2076       2076          0          0          0       7627
 16          0          0          0          0          0          0          0          0          0          0          0          0
 17          0          0          0          0          0          0          0          0          0          0          0          0
 18          0          0          0          0          0          0          0          0          0          0          0          0
 19          0          0          0          0          0          0          0          0          0          0          0          0
 20          0          0          0          0          0          0          0          0          0          0          0          0
 21          0          0          0          0          0          0          0          0          0          0          0          0
 22          0          0          0          0          0          0          0          0          0          0          0          0
 23          0          0          0          0          0          0          0          0          0          0          0          0
 24          0          0          0          0          0          0          0          0          0          0          0          0
 25          0          0          0          0          0          0          0          0          0          0          0          0
 26          0          0          0          0          0          0          0          0          0          0          0          0
 27          0          0          0          0          0          0          0          0          0          0          0          0
 28          0          0          0          0          0          0          0          0          0          0          0          0
 29          0          0          0          0          0          0          0          0          0          0          0          0
 30          0          0          0          0          0          0          0          0          0          0          0          0
 31          0          0          0          0          0          0          0          0          0          0          0          0
 32          0          0          0          0          0          0          0          0          0          0          0          0

 *** Timewarps
 FEE       ADC      Pause     Resume    SYNC100    WR48-63       Disc        MBS  Undefined    Samples
  0          0          0          0          0          0          0          0          0          0
  1          0          0          0          0          0          0          0          0          0
  2          0          0          0          0          0          0          0          0          0
  3          0          0          0          0          0          0          0          0          0
  4          0          0          0          0          0          0          0          0          0
  5          0          0          0          0          0          0          0          0          0
  6          0          0          0          0          0          0          0          0          0
  7          0          0          0          0          0          0          0          0          0
  8          0          0          0          0          0          0          0          0          0
  9          0          0          0          0          0          0          0          0          0
 10          0          0          0          0          0          0          0          0          0
 11          0          0          0          0          0          0          0          0          0
 12          0          0          0          0          0          0          0          0          0
 13          0          0          0          0          0          0          0          0          0
 14          0          0          0          0          0          0          0          0          0
 15          0          0          0          0          0          0          0          0          0
 16          0          0          0          0          0          0          0          0          0
 17          0          0          0          0          0          0          0          0          0
 18          0          0          0          0          0          0          0          0          0
 19          0          0          0          0          0          0          0          0          0
 20          0          0          0          0          0          0          0          0          0
 21          0          0          0          0          0          0          0          0          0
 22          0          0          0          0          0          0          0          0          0
 23          0          0          0          0          0          0          0          0          0
 24          0          0          0          0          0          0          0          0          0
 25          0          0          0          0          0          0          0          0          0
 26          0          0          0          0          0          0          0          0          0
 27          0          0          0          0          0          0          0          0          0
 28          0          0          0          0          0          0          0          0          0
 29          0          0          0          0          0          0          0          0          0
 30          0          0          0          0          0          0          0          0          0
 31          0          0          0          0          0          0          0          0          0
 32          0          0          0          0          0          0          0          0          0

 *** Program elapsed time:   34.352s (  931.544 blocks/s,  58.222 Mb/s)
Attachment 5: Stats2.png
Stats2.png
Attachment 6: Bias2.png
Bias2.png
Attachment 7: Stats3.png
Stats3.png
Attachment 8: Bias3.png
Bias3.png
Attachment 9: Analysis_R14_371
 *** TDR format 3.3.0 analyser - TD - May 2021
 *** ERROR: READ I/O error:       5002
                   blocks:      32000
          ADC data format:  252182561 ( 1038396.9 Hz)
        Other data format:    9737439 (   40095.3 Hz)
 Sample trace data format:          0 (       0.0 Hz)
         Undefined format:          0 (       0.0 Hz)
   Other data format type:      PAUSE:        234 (       1.0 Hz)
                               RESUME:        234 (       1.0 Hz)
                              SYNC100:      32904 (     135.5 Hz)
                              WR48-63:      32904 (     135.5 Hz)
                           FEE64 disc:          0 (       0.0 Hz)
                             MBS info:    9671163 (   39822.4 Hz)
                           Other info:          0 (       0.0 Hz)

   ADC data range bit set:     493534 (    2032.2 Hz)

                Timewarps:        ADC:          0 (       0.0 Hz)
                                PAUSE:          0 (       0.0 Hz)
                               RESUME:          0 (       0.0 Hz)
                              SYNC100:          0 (       0.0 Hz)
                              WR48-63:          0 (       0.0 Hz)
                           FEE64 disc:          0 (       0.0 Hz)
                             MBS info:          0 (       0.0 Hz)
                            Undefined:          0 (       0.0 Hz)
                         Sample trace:          0 (       0.0 Hz)

 *** Timestamp elapsed time:      242.858 s
 FEE  elapsed dead time(s) elapsed idle time(s)
  0                0.060               15.876
  1                5.312                0.000
  2                0.091                0.000
  3                3.590                0.000
  4                0.163               29.634
  5                9.407                0.000
  6                0.049                0.000
  7                6.820                0.000
  8                2.387                0.000
  9                0.000               29.724
 10                0.676                0.000
 11                0.043                0.000
 12                0.046                0.000
 13                0.000               57.696
 14                0.016                3.102
 15                0.214                0.000
 16                0.000                0.000
 17                0.000                0.000
 18                0.000                0.000
 19                0.000                0.000
 20                0.000                0.000
 21                0.000                0.000
 22                0.000                0.000
 23                0.000                0.000
 24                0.000                0.000
 25                0.000                0.000
 26                0.000                0.000
 27                0.000                0.000
 28                0.000                0.000
 29                0.000                0.000
 30                0.000                0.000
 31                0.000                0.000
 32                0.000                0.000

 *** Statistics
 FEE  ADC Data Other Data     Sample  Undefined      Pause     Resume    SYNC100    WR48-63       Disc        MBS      Other   HEC Data
  0    5708701       2832          0          0          4          4        686        686          0       1452          0      26548
  1   24896226       6554          0          0         36         36       3241       3241          0          0          0      54251
  2   10734245    2512200          0          0          3          3       1683       1683          0    2508828          0      43373
  3   32202526    2481239          0          0         32         32       4391       4391          0    2472393          0      63125
  4    3649395    1322612          0          0         11         11        611        611          0    1321368          0      11610
  5   36874871     743171          0          0         64         64       4722       4722          0     733599          0      33565
  6    9551266    1557362          0          0          1          1       1434       1434          0    1554492          0      23558
  7   41439213    1089893          0          0         57         57       5374       5374          0    1079031          0      40478
  8   17460031       4238          0          0          7          7       2112       2112          0          0          0      55845
  9    2360192        582          0          0          0          0        291        291          0          0          0       4290
 10   20593873       5182          0          0          6          6       2585       2585          0          0          0      34440
 11   11697470       2942          0          0          2          2       1469       1469          0          0          0      10244
 12    8815559       2192          0          0          1          1       1095       1095          0          0          0      48502
 13    2454200        586          0          0          0          0        293        293          0          0          0       3481
 14    7942567       1924          0          0          2          2        960        960          0          0          0      32639
 15   15802226       3930          0          0          8          8       1957       1957          0          0          0       7585
 16          0          0          0          0          0          0          0          0          0          0          0          0
 17          0          0          0          0          0          0          0          0          0          0          0          0
 18          0          0          0          0          0          0          0          0          0          0          0          0
 19          0          0          0          0          0          0          0          0          0          0          0          0
 20          0          0          0          0          0          0          0          0          0          0          0          0
 21          0          0          0          0          0          0          0          0          0          0          0          0
 22          0          0          0          0          0          0          0          0          0          0          0          0
 23          0          0          0          0          0          0          0          0          0          0          0          0
 24          0          0          0          0          0          0          0          0          0          0          0          0
 25          0          0          0          0          0          0          0          0          0          0          0          0
 26          0          0          0          0          0          0          0          0          0          0          0          0
 27          0          0          0          0          0          0          0          0          0          0          0          0
 28          0          0          0          0          0          0          0          0          0          0          0          0
 29          0          0          0          0          0          0          0          0          0          0          0          0
 30          0          0          0          0          0          0          0          0          0          0          0          0
 31          0          0          0          0          0          0          0          0          0          0          0          0
 32          0          0          0          0          0          0          0          0          0          0          0          0

 *** Timewarps
 FEE       ADC      Pause     Resume    SYNC100    WR48-63       Disc        MBS  Undefined    Samples
  0          0          0          0          0          0          0          0          0          0
  1          0          0          0          0          0          0          0          0          0
  2          0          0          0          0          0          0          0          0          0
  3          0          0          0          0          0          0          0          0          0
  4          0          0          0          0          0          0          0          0          0
  5          0          0          0          0          0          0          0          0          0
  6          0          0          0          0          0          0          0          0          0
  7          0          0          0          0          0          0          0          0          0
  8          0          0          0          0          0          0          0          0          0
  9          0          0          0          0          0          0          0          0          0
 10          0          0          0          0          0          0          0          0          0
 11          0          0          0          0          0          0          0          0          0
 12          0          0          0          0          0          0          0          0          0
 13          0          0          0          0          0          0          0          0          0
 14          0          0          0          0          0          0          0          0          0
 15          0          0          0          0          0          0          0          0          0
 16          0          0          0          0          0          0          0          0          0
 17          0          0          0          0          0          0          0          0          0
 18          0          0          0          0          0          0          0          0          0
 19          0          0          0          0          0          0          0          0          0
 20          0          0          0          0          0          0          0          0          0
 21          0          0          0          0          0          0          0          0          0
 22          0          0          0          0          0          0          0          0          0
 23          0          0          0          0          0          0          0          0          0
 24          0          0          0          0          0          0          0          0          0
 25          0          0          0          0          0          0          0          0          0
 26          0          0          0          0          0          0          0          0          0
 27          0          0          0          0          0          0          0          0          0
 28          0          0          0          0          0          0          0          0          0
 29          0          0          0          0          0          0          0          0          0
 30          0          0          0          0          0          0          0          0          0
 31          0          0          0          0          0          0          0          0          0
 32          0          0          0          0          0          0          0          0          0

 *** Program elapsed time:   33.879s (  944.541 blocks/s,  59.034 Mb/s)
Attachment 10: Stats4.png
Stats4.png
Attachment 11: Bias4.png
Bias4.png
  323   Tue May 18 06:50:53 2021 OH, PPTuesday 18th May 08:00 - 16:00
08:00 OH Takes over

      Statistics still look good from yesterday. Rate is still down.
      Dead time in FEEs 2 and 4 is 2.04%

      System wide checks clock ok
	
		 Base 		Current 	Difference
aida05 fault 	 0x4da : 	 0x500 : 	 38  
White Rabbit error counter test result: Passed 15, Failed 1

Understand the status reports as follows:-
Status bit 3 : White Rabbit decoder detected an error in the received data
Status bit 2 : Firmware registered WR error, no reload of Timestamp
Status bit 0 : White Rabbit decoder reports uncertain of Timestamp information from WR

      *Baseline reset*
      FPGA check ok
      Stats - attachment 1
      Temp - attachment 2
      Bias - attachment 3
      

08:11 With the decreased noise I am investigating whether we can lower the thresholds on DSSD2 y strips.
      I have set them to 0x19 on ASICS 1-3 and 0x64 on ASIC4
      The results of the test appear to indicate that it is the network link that we are saturating causing dead time
***	Before		                  After	
FEE	DT (s)  Dead time %	           DT (s)	Dead time %
0	0.013	0.004184451	           0.026	0.010025681
1	6.352	2.04458693	           4.097	1.57981599
2	0.295	0.09495484	           0.292	0.112596112
3	6.349	2.043621288	           8.255	3.183153771
4	0.021	0.006759497	           0.03	        0.011568094
5	0.285	0.091736032	           3.388	1.306423377
6	0.02	0.006437616	           0.149	0.057454865
7	1.219	0.392372712	           2.133	0.822491459
8	1.137	0.365978485	           0.457	0.176220627
9	0	0	                       0	0
10	1.633	0.525631369	           1.545	0.595756823
11	0.061	0.01963473	           0.166	0.064010118
12	0.059	0.018990968	           0.085	0.032776265
13	0	0	                       0	0
14	0.016	0.005150093	           0.023	0.008868872
15	0.282	0.09077039	           0.168	0.064781324


      Note that the dead time for FEE6 and 8 remains fairly low but the dead time for FEE4 has increased

09:00 They are stopping the run to decrease the bias on the bPlast detector
09:25 No noticable change in AIDA
      They will now begin to change the spill structure.

09:46 While they are optimising the 1s spill structure raised the thresholds of FEE6 and 8 back to 0x20. Will start from here when optimising the thresholds post spill change

10:21 Beam is back on AIDA

10:39 System wide checks. 
- ADC calibration check failed (this is anticipated because waveforms are off). 
- 1 Failed test in White Rabbit:
		 Base 		Current 	Difference
aida05 fault 	 0x500 : 	 0x506 : 	 6  
White Rabbit error counter test result: Passed 15, Failed 1

Understand the status reports as follows:-
Status bit 3 : White Rabbit decoder detected an error in the received data
Status bit 2 : Firmware registered WR error, no reload of Timestamp
Status bit 0 : White Rabbit decoder reports uncertain of Timestamp information from WR
- All other systems passed

11:00 
      Stats - attachment 4
      Temp - attachment 5
      Bias - attachment 6

12:46 System wide checks
- ADC calibration check failed (this is anticipated because waveforms are off). 
- 1 Failed test in White Rabbit:
		 Base 		Current 	Difference
aida05 fault 	 0x500 : 	 0x50b : 	 11  
White Rabbit error counter test result: Passed 15, Failed 1

Understand the status reports as follows:-
Status bit 3 : White Rabbit decoder detected an error in the received data
Status bit 2 : Firmware registered WR error, no reload of Timestamp
Status bit 0 : White Rabbit decoder reports uncertain of Timestamp information from WR
- All other systems passed

14:36 System wide checks
- ADC calibration check failed (this is anticipated because waveforms are off). 
- 1 Failed test in White Rabbit:
		 Base 		Current 	Difference
aida05 fault 	 0x500 : 	 0x50f : 	 15  
White Rabbit error counter test result: Passed 15, Failed 1

Understand the status reports as follows:-
Status bit 3 : White Rabbit decoder detected an error in the received data
Status bit 2 : Firmware registered WR error, no reload of Timestamp
Status bit 0 : White Rabbit decoder reports uncertain of Timestamp information from WR
- All other systems passed
Attachment 1: 210518_0757_Stats.png
210518_0757_Stats.png
Attachment 2: 210518_0758_Temp.png
210518_0758_Temp.png
Attachment 3: 210518_0759_Bias.png
210518_0759_Bias.png
Attachment 4: 210518_1059_Stats.png
210518_1059_Stats.png
Attachment 5: 210518_1100_Temp.png
210518_1100_Temp.png
Attachment 6: 210518_1101_Bias.png
210518_1101_Bias.png
  322   Mon May 17 23:17:16 2021 DSJTuesday 18 May 0.00-8.00 shift

0.00 - Taking over from Lewis 

00.30 - Rates look ok (fig1), Ran R14_147 through analyser, dead times all good (fig2)

01.00 - Rates look ok (Fig3), Ran R14_153 through analyser, dead times all good (fig4)

01.30 - Rates look ok (Fig5), Ran R14_158 through analyser, dead times all good (fig6)

02.00 - Rates look ok (Fig7), Ran R14_164 through analyser, dead times all good (fig8)

Leakage current ok (fig 9), Temps OK (fig10), UCESB looks ok (fig11)

System Wide Checks:

Clock status test result: Passed 16, Failed 0

Calibration test result: Passed 0, Failed 16

         Base         Current     Difference
aida05 fault      0x4da :      0x4ee :      20  
White Rabbit error counter test result: Passed 15, Failed 1

FPGA Timestamp error counter test result: Passed 16, Failed 0

Returned 0 0 0 0 0 0 0 0 0 0 0 0 0 0 0 0  
Mem(KB) :    4    8    16    32    64    128    256    512    1k    2k    4k
aida01 :     43     12      6      4      1      4      2      2      1      3      7   : 38444
aida02 :     21     12      4      4      2      3      3      3      3      3      6   : 36980
aida03 :     23      8      4      2      2      4      2      3      3      3      6   : 36764
aida04 :     34     12     10      5      1      4      1      4      3      3      6   : 37224
aida05 :     18      5      5      1      2      3      2      2      1      3      7   : 38112
aida06 :     40     12      5      7      2      4      2      4      3      3      6   : 37552
aida07 :     40     10      6      2      2      4      2      2      2      2      7   : 37392
aida08 :     19     11      3      3      1      4      3      3      3      3      6   : 36980
aida09 :     43      6      2      4      3      4      3      3      3      3      6   : 37180
aida10 :     32     14     10      3      4      1      2      4      1      3      7   : 39280
aida11 :     40      7      2      5      4      3      1      4      3      3      6   : 37144
aida12 :     37     14     13      2      2      3      2      4      3      3      6   : 37396
aida13 :     18      9      3      1      1      5      3      3      3      3      6   : 37024
aida14 :     36     13      6      4      2      3      2      3      1      3      7   : 38872
aida15 :     32     11      7      4      3      4      2      3      2      4      6   : 38024
aida16 :     26      9      4      1      0      3      1      4      3      3      6   : 36752


02.30 - rates ok (fig 12), Ran R14_170 through analyser, dead times all good (fig13)

03.00 - rates ok (fig 14), Ran R14_175 through analyser, dead times all good (fig15)

03.05 - No beam, problem with SIS, don't know how long will be off

03.14 - Beam is back

03.30 - rates ok (fig 16), Ran R14_180 through analyser, dead times all good (fig17)

04.00 - rates ok (fig 18), Ran R14_186 through analyser, dead times all good (fig19)

Leakage current ok (fig 20), Temps OK (fig21), UCESB looks ok (fig22)

System Wide Checks:

Clock status test result: Passed 16, Failed 0

Calibration test result: Passed 0, Failed 16


         Base         Current     Difference
aida05 fault      0x4da :      0x4f2 :      24  
White Rabbit error counter test result: Passed 15, Failed 1

FPGA Timestamp error counter test result: Passed 16, Failed 0

   
Returned 0 0 0 0 0 0 0 0 0 0 0 0 0 0 0 0  
Mem(KB) :    4    8    16    32    64    128    256    512    1k    2k    4k
aida01 :     26     11      5      6      1      4      2      2      1      3      7   : 38416
aida02 :     16      9      5      4      2      4      2      2      3      3      6   : 36312
aida03 :      9      7      4      4      2      4      2      3      3      3      6   : 36764
aida04 :     36     11      8      4      3      4      1      3      4      3      6   : 37800
aida05 :     20      4      3      2      2      3      2      2      1      3      7   : 38112
aida06 :     22     13     10      7      2      4      3      3      4      3      6   : 38336
aida07 :     28      7      7      2      2      4      2      2      2      2      7   : 37336
aida08 :      2      3      4      4      1      3      2      3      3      3      6   : 36512
aida09 :     40      7      1      4      4      3      3      3      3      3      6   : 37096
aida10 :     26      9     12      2      3      2      2      4      1      3      7   : 39280
aida11 :     30      7      1      5      4      3      1      3      2      4      6   : 37600
aida12 :     15     10      6      4      2      3      2      4      3      3      6   : 37228
aida13 :      1      3      2      1      2      4      3      2      3      3      6   : 36316
aida14 :     34     12      7      4      2      3      2      3      1      3      7   : 38872
aida15 :     18     11      5      3      4      4      2      3      2      4      6   : 37968
aida16 :     22      7      4      2      0      3      1      4      3      3      6   : 36752

04.30 - rates ok (fig23), Ran R14_192 through analyser, dead times all good (fig24)

05.00 - rates ok (fig25), Ran R14_198 through analyser, dead times all good (fig26)

05.30 - Rates ok (Fig27), Ran R14_203 through analyser, dead times all good (fig28)

06.00 - Rates ok (Fig29), Ran R14_203 through analyser, dead times all good (fig30)

Leakage current ok (fig 31), Temps OK (fig32), UCESB looks ok (fig33)

System Wide Checks:

Clock status test result: Passed 16, Failed 0

Calibration test result: Passed 0, Failed 16

         Base         Current     Difference
aida05 fault      0x4da :      0x4f9 :      31  
White Rabbit error counter test result: Passed 15, Failed 1

FPGA Timestamp error counter test result: Passed 16, Failed 0


Returned 0 0 0 0 0 0 0 0 0 0 0 0 0 0 0 0  
Mem(KB) :    4    8    16    32    64    128    256    512    1k    2k    4k
aida01 :     16      9      3      7      1      5      1      3      1      3      7   : 38744
aida02 :     18      3      5      2      3      3      3      2      3      3      6   : 36400
aida03 :     21      9      4      2      2      4      2      4      3      3      6   : 37276
aida04 :     32     12      7      3      3      4      1      3      4      3      6   : 37744
aida05 :     12      8      3      2      2      4      2      2      1      3      7   : 38240
aida06 :     28     14      4      8      2      4      3      3      3      3      6   : 37280
aida07 :     40     12      5      2      2      4      1      3      2      2      7   : 37648
aida08 :     13      8      4      4      1      3      2      3      3      3      6   : 36596
aida09 :     35      5      2      4      3      4      2      4      3      3      6   : 37396
aida10 :      6     10      4      1      1      3      2      2      1      3      7   : 38024
aida11 :     41      9      1      4      4      3      2      4      3      3      6   : 37372
aida12 :     29     11      9      4      2      3      2      4      3      3      6   : 37340
aida13 :     24     10      5      1      2      4      3      2      3      3      6   : 36512
aida14 :     34     16      5      4      2      3      2      3      1      3      7   : 38872
aida15 :     42      8      6      2      4      4      2      3      2      4      6   : 38024
aida16 :      8      9      6      1      0      3      1      4      3      3      6   : 36712

06.30 - Rates look ok (Fig34), Ran R14_215 through analyser, dead times all good (fig35)

07.00 - Rates look ok (Fig36), Ran R14_221 through analyser, dead times all good (fig 37)

07.25 - Rates look ok (Fig38), Ran R14_226 through analyser, dead times all good (fig 39)

Attachment 1: Screenshot_2021-05-18_Statistics_aidas-gsi(1).png
Screenshot_2021-05-18_Statistics_aidas-gsi(1).png
Attachment 2: R14_147_deadtime_23.41.06.png
R14_147_deadtime_23.41.06.png
Attachment 3: Screenshot_2021-05-18_Statistics_aidas-gsi(2).png
Screenshot_2021-05-18_Statistics_aidas-gsi(2).png
Attachment 4: R14_153_deadtime_00.07.12.png
R14_153_deadtime_00.07.12.png
Attachment 5: Screenshot_2021-05-18_Statistics_aidas-gsi(3).png
Screenshot_2021-05-18_Statistics_aidas-gsi(3).png
Attachment 6: R14_158_deadtime_00.32.42.png
R14_158_deadtime_00.32.42.png
Attachment 7: Screenshot_2021-05-18_Statistics_aidas-gsi(4).png
Screenshot_2021-05-18_Statistics_aidas-gsi(4).png
Attachment 8: R14_164_deadtime_01.02.32.png
R14_164_deadtime_01.02.32.png
Attachment 9: TMP.png
TMP.png
Attachment 10: Screenshot_2021-05-18_Temperature_and_status_scan_aidas-gsi.png
Screenshot_2021-05-18_Temperature_and_status_scan_aidas-gsi.png
Attachment 11: Screenshot_2021-05-18_ucesb.png
Screenshot_2021-05-18_ucesb.png
Attachment 12: Screenshot_2021-05-18_Statistics_aidas-gsi(5).png
Screenshot_2021-05-18_Statistics_aidas-gsi(5).png
Attachment 13: R14_170_deadtime_01.35.24.png
R14_170_deadtime_01.35.24.png
Attachment 14: Screenshot_2021-05-18_Statistics_aidas-gsi(6).png
Screenshot_2021-05-18_Statistics_aidas-gsi(6).png
Attachment 15: R14_175_deadtime_01.59.37.png
R14_175_deadtime_01.59.37.png
Attachment 16: Screenshot_2021-05-18_Statistics_aidas-gsi(7).png
Screenshot_2021-05-18_Statistics_aidas-gsi(7).png
Attachment 17: R14_180_deadtime_02.31.32.png
R14_180_deadtime_02.31.32.png
Attachment 18: Screenshot_2021-05-18_Statistics_aidas-gsi(8).png
Screenshot_2021-05-18_Statistics_aidas-gsi(8).png
Attachment 19: R14_186_deadtime_03.00.27.png
R14_186_deadtime_03.00.27.png
Attachment 20: TMP.png
TMP.png
Attachment 21: Screenshot_2021-05-18_Temperature_and_status_scan_aidas-gsi(1).png
Screenshot_2021-05-18_Temperature_and_status_scan_aidas-gsi(1).png
Attachment 22: Screenshot_2021-05-18_ucesb(1).png
Screenshot_2021-05-18_ucesb(1).png
Attachment 23: Screenshot_2021-05-18_Statistics_aidas-gsi(9).png
Screenshot_2021-05-18_Statistics_aidas-gsi(9).png
Attachment 24: R14_192_deadtime_03.31.26.png
R14_192_deadtime_03.31.26.png
Attachment 25: Screenshot_2021-05-18_Statistics_aidas-gsi(10).png
Screenshot_2021-05-18_Statistics_aidas-gsi(10).png
Attachment 26: R14_198_deadtime_04.00.21.png
R14_198_deadtime_04.00.21.png
Attachment 27: Screenshot_2021-05-18_Statistics_aidas-gsi(11).png
Screenshot_2021-05-18_Statistics_aidas-gsi(11).png
Attachment 28: R14_198_deadtime_04.27.46.png
R14_198_deadtime_04.27.46.png
Attachment 29: Screenshot_2021-05-18_Statistics_aidas-gsi(12).png
Screenshot_2021-05-18_Statistics_aidas-gsi(12).png
Attachment 30: R14_203_deadtime_05.png
R14_203_deadtime_05.png
Attachment 31: TMP.png
TMP.png
Attachment 32: Screenshot_2021-05-18_Temperature_and_status_scan_aidas-gsi(2).png
Screenshot_2021-05-18_Temperature_and_status_scan_aidas-gsi(2).png
Attachment 33: Screenshot_2021-05-18_ucesb(3).png
Screenshot_2021-05-18_ucesb(3).png
Attachment 34: Screenshot_2021-05-18_Statistics_aidas-gsi(13).png
Screenshot_2021-05-18_Statistics_aidas-gsi(13).png
Attachment 35: R14_215_deadtime_05.30.26.png
R14_215_deadtime_05.30.26.png
Attachment 36: Screenshot_2021-05-18_Statistics_aidas-gsi(14).png
Screenshot_2021-05-18_Statistics_aidas-gsi(14).png
Attachment 37: R14__221_DEADTIME_06.00.35.png
R14__221_DEADTIME_06.00.35.png
Attachment 38: Screenshot_2021-05-18_Statistics_aidas-gsi(15).png
Screenshot_2021-05-18_Statistics_aidas-gsi(15).png
Attachment 39: R14_226_deadtime_06.25.32.png
R14_226_deadtime_06.25.32.png
ELOG V3.1.4-unknown