| ID |
Date |
Author |
Subject |
|
656
|
Wed Jun 12 11:06:55 2024 |
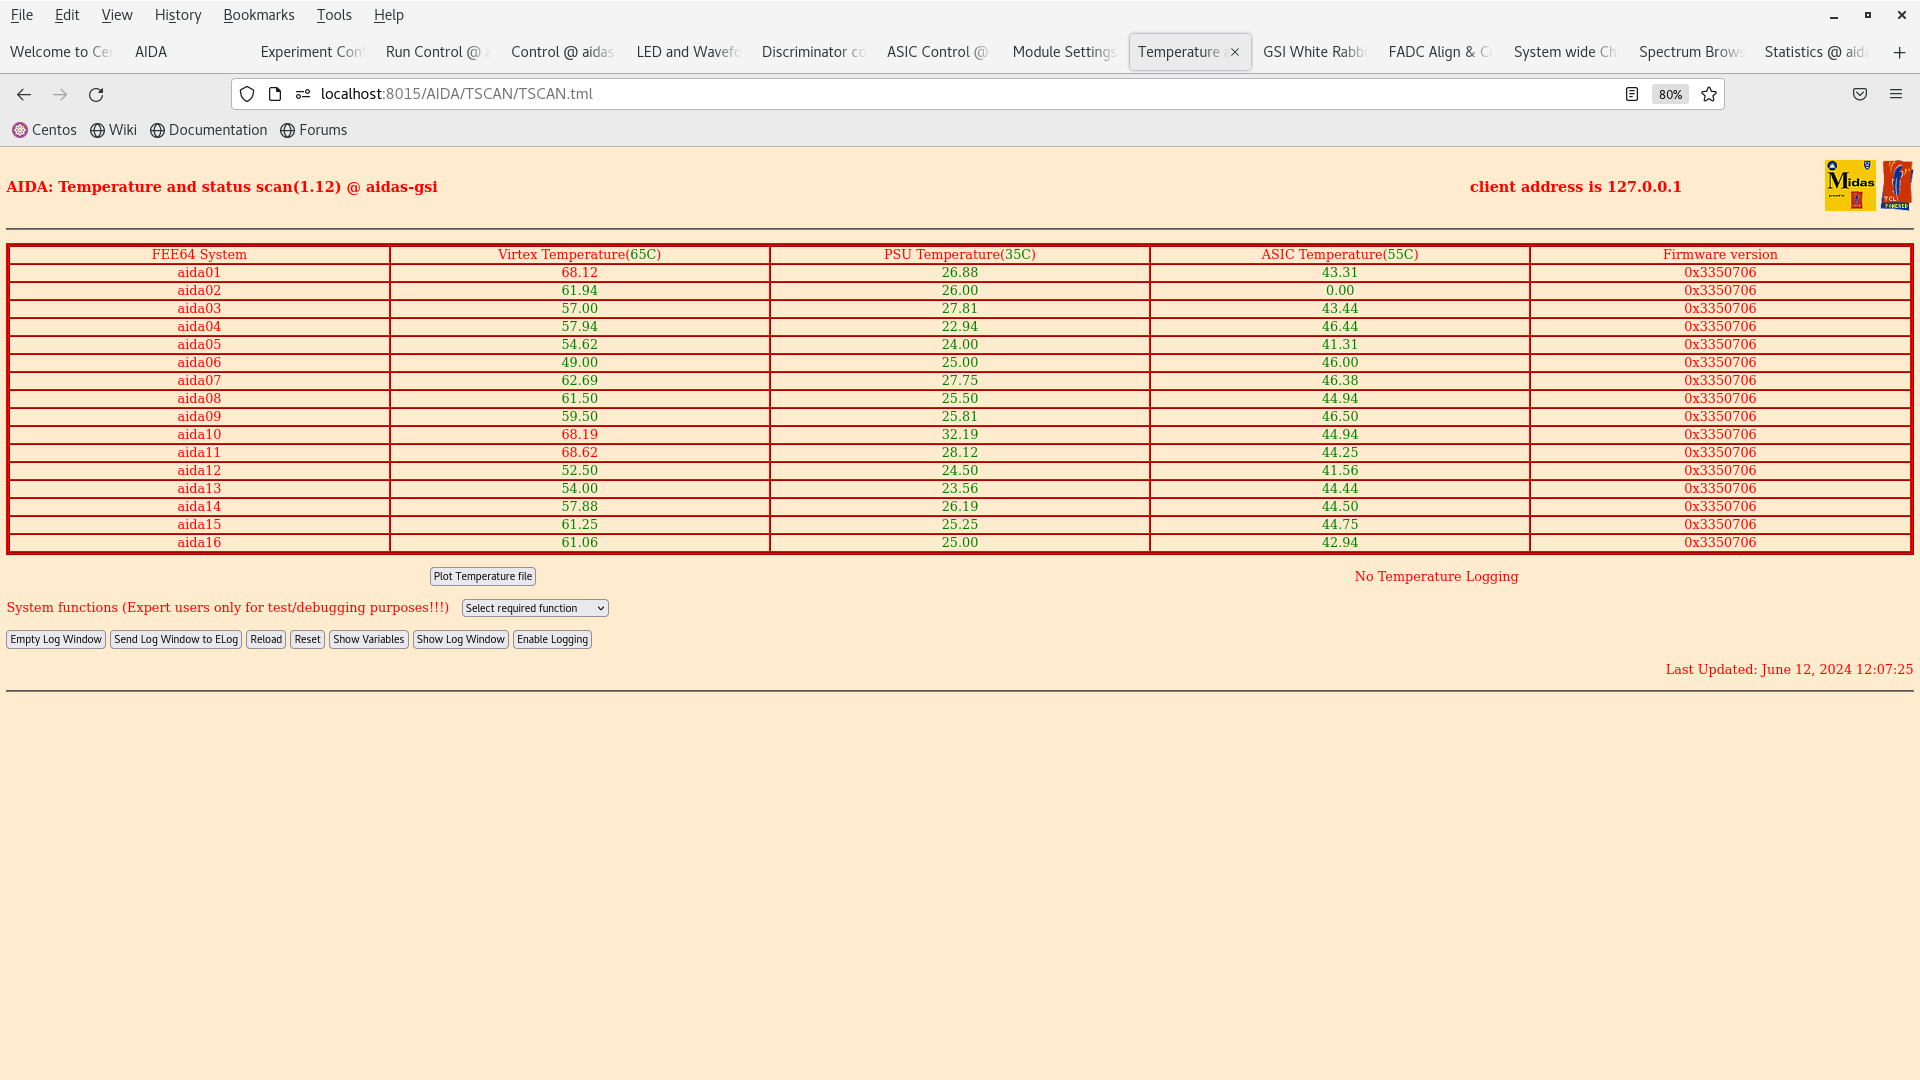
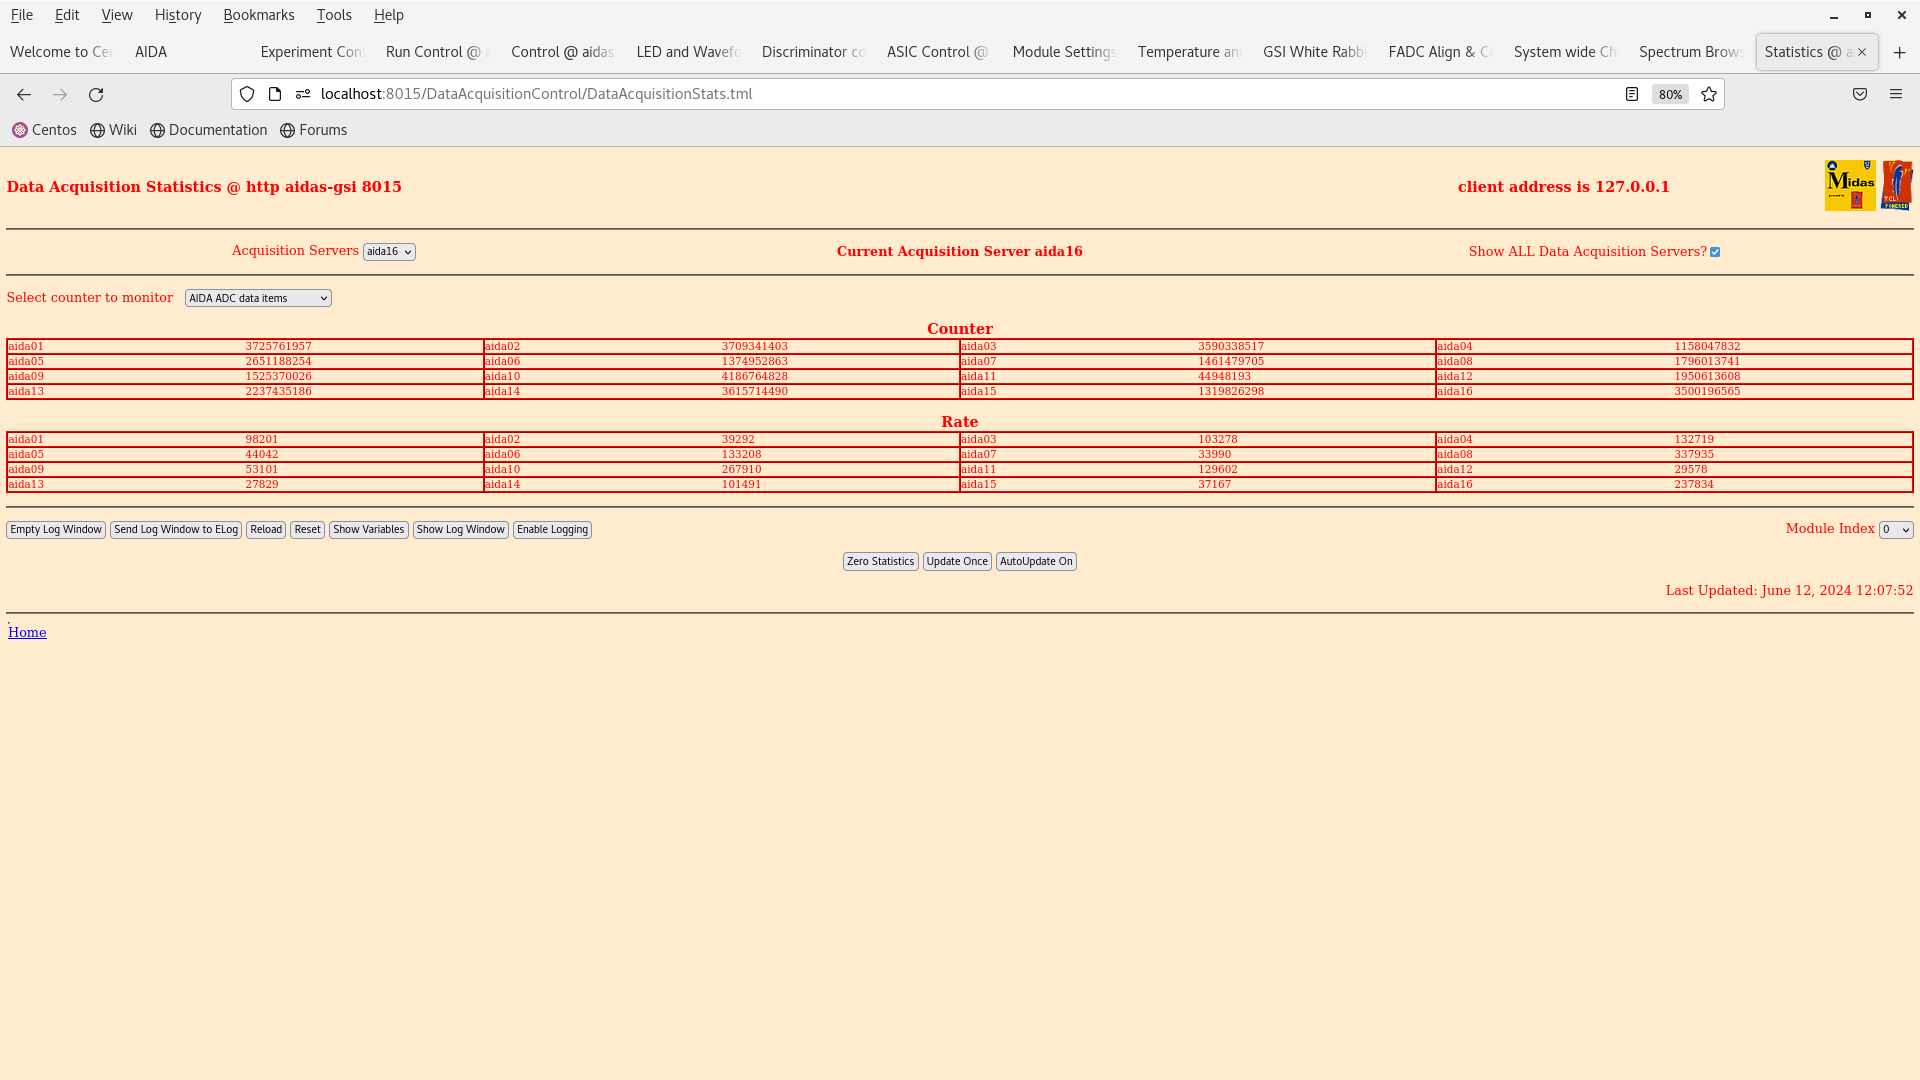
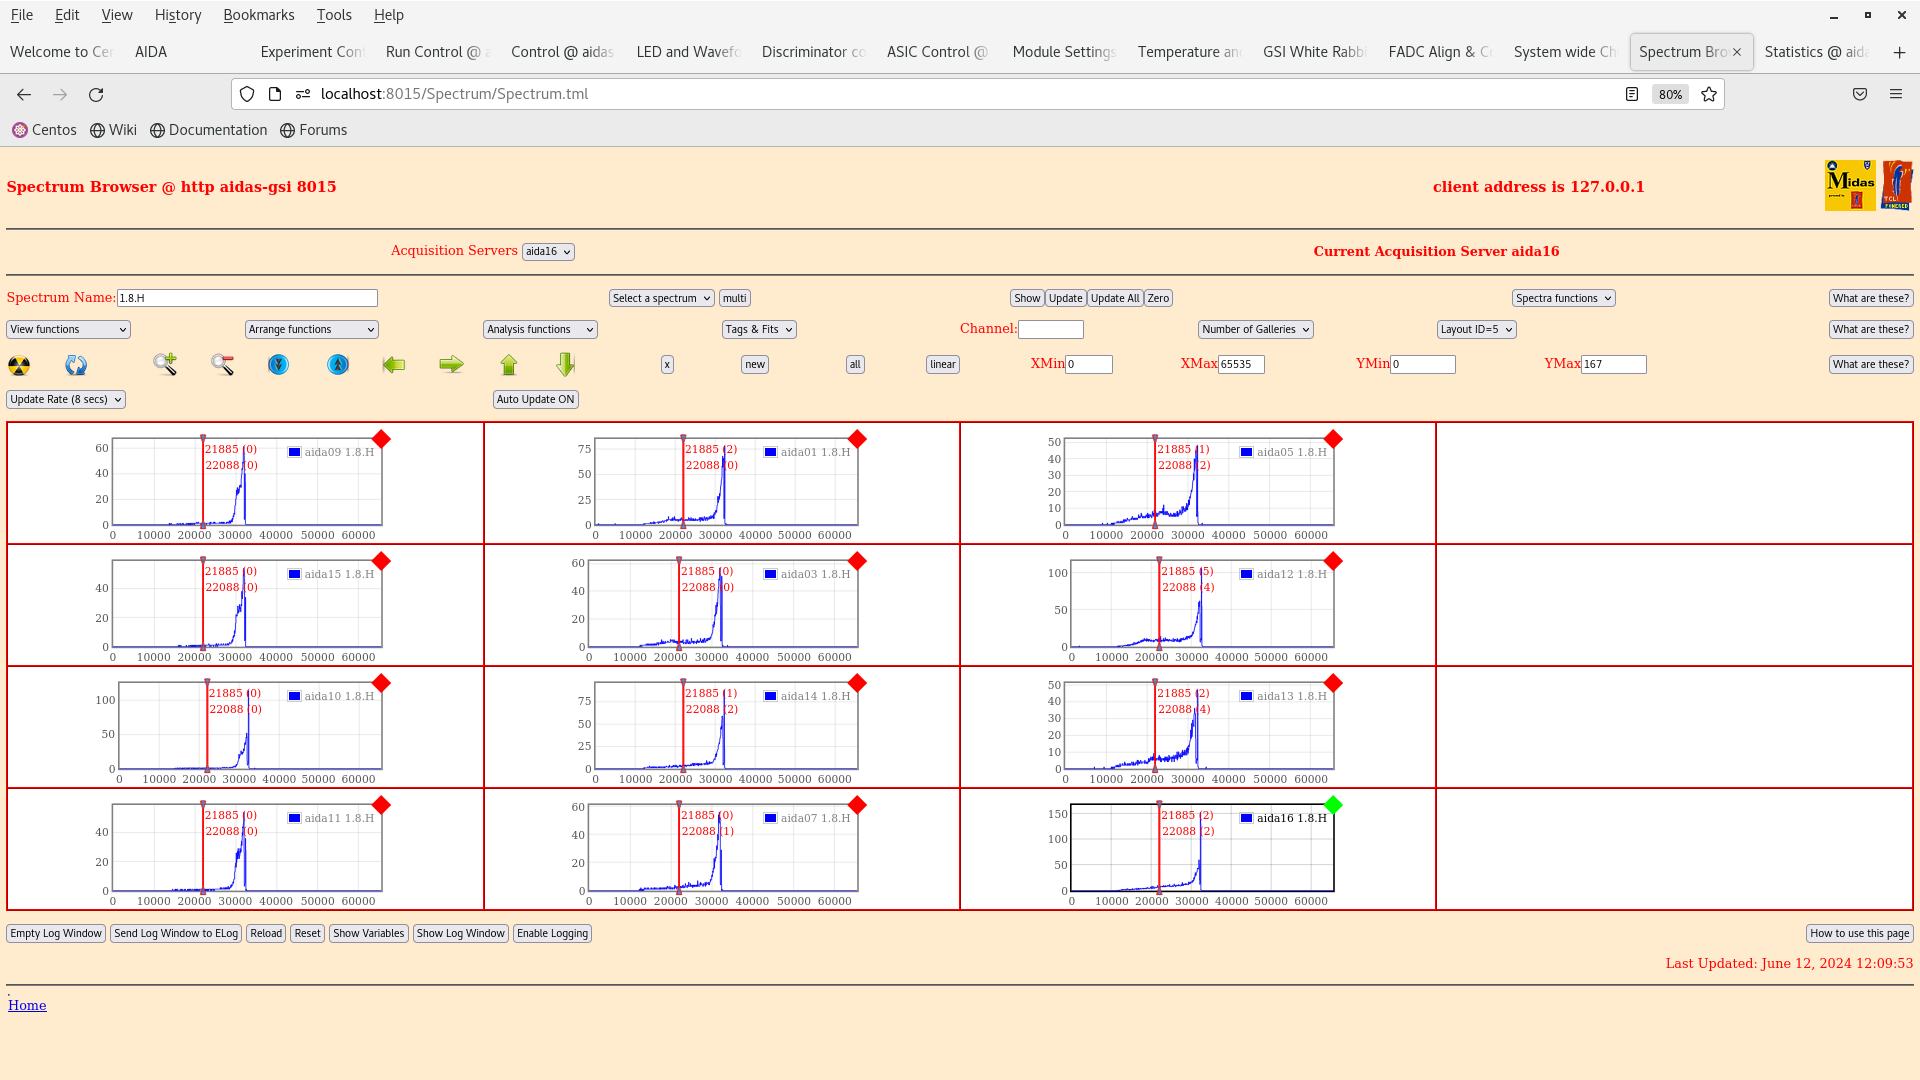
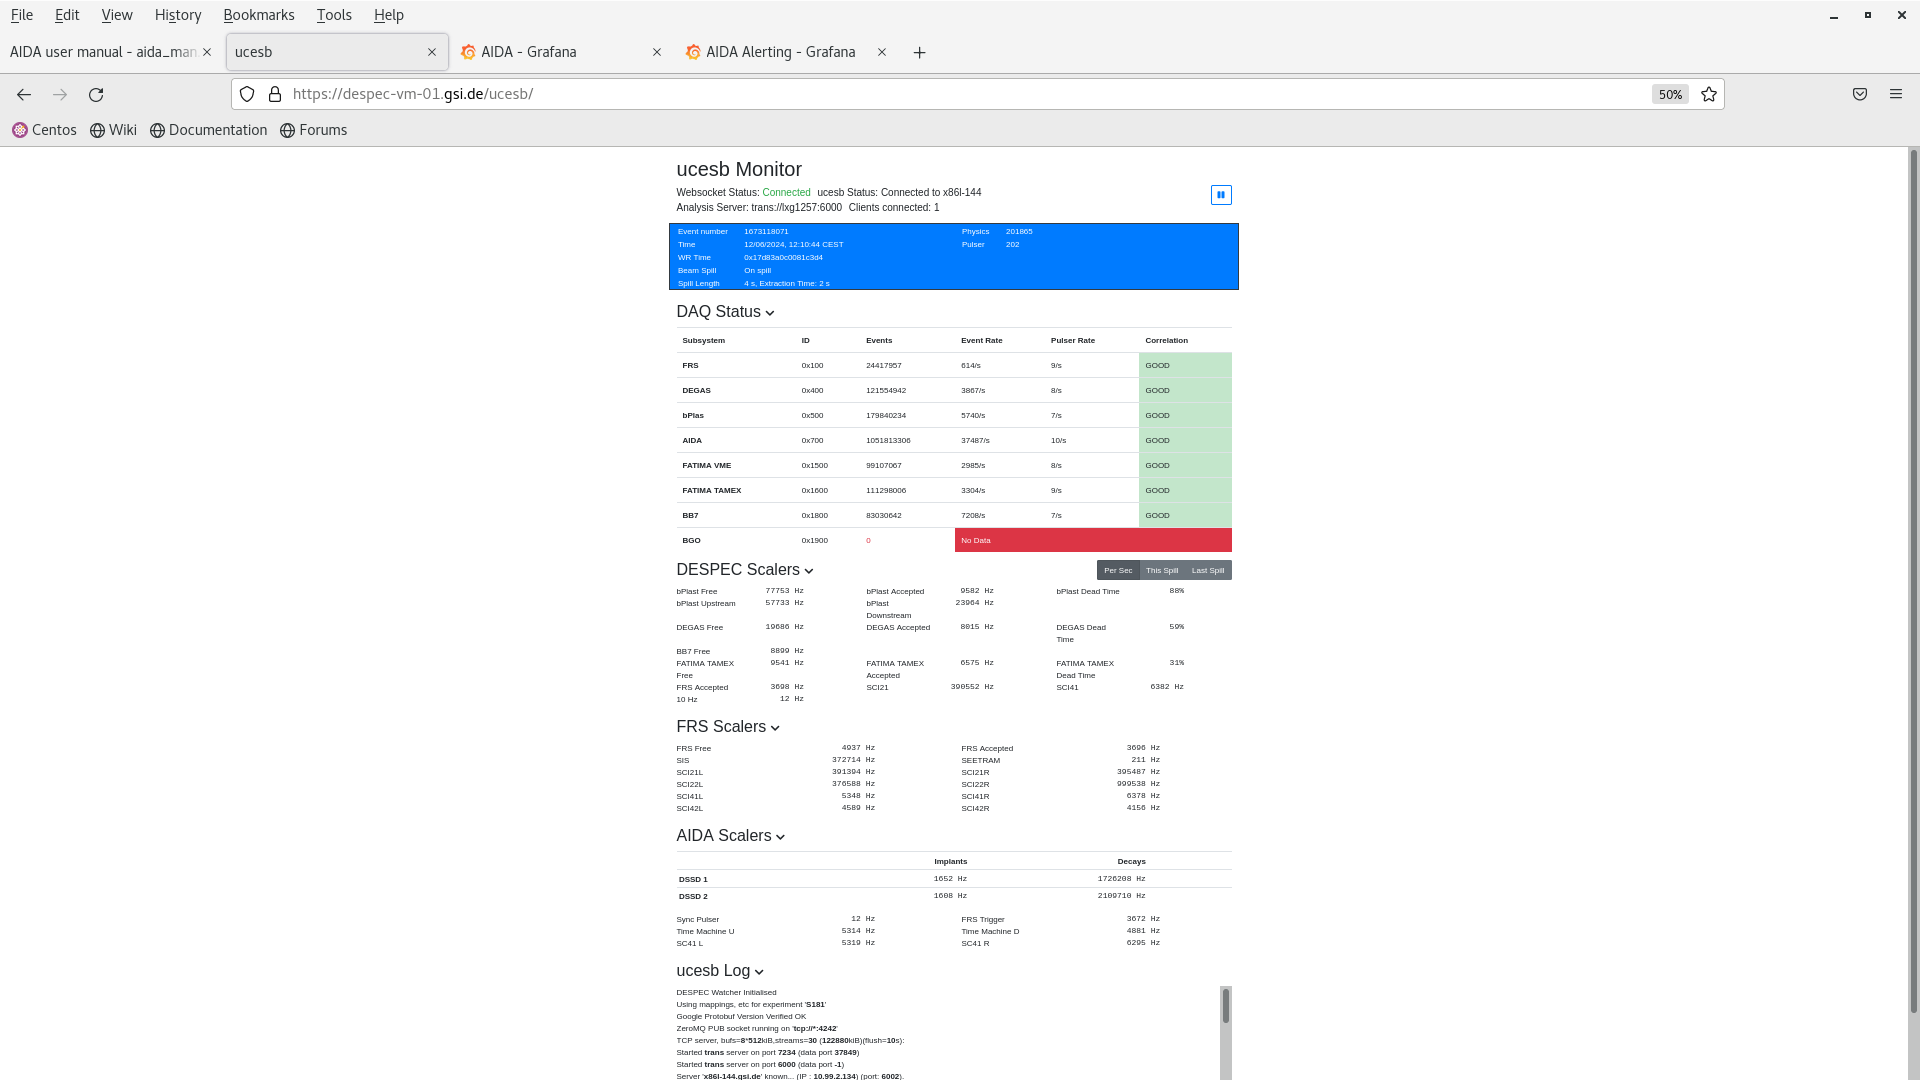
PP | Mid-shift checks, 12:00 |
All seems normal.
Screenshots attached. |
| Attachment 1: Screenshot_from_2024-06-12_12-07-32.png
|
|
| Attachment 2: Screenshot_from_2024-06-12_12-07-59.png
|
|
| Attachment 3: Screenshot_from_2024-06-12_12-08-24.png
|

|
| Attachment 4: Screenshot_from_2024-06-12_12-09-09.png
|

|
| Attachment 5: Screenshot_from_2024-06-12_12-10-02.png
|
|
| Attachment 6: Screenshot_from_2024-06-12_12-10-30.png
|

|
| Attachment 7: Screenshot_from_2024-06-12_12-10-46.png
|
|
| Attachment 8: Screenshot_from_2024-06-12_12-11-41.png
|

|
|
353
|
Wed Jun 2 14:53:05 2021 |
OH, TD | Merger/Tapeserver issues after reboot of aida-3 |
On 01/06/21 aida-3 was rebooted as the graphical user interface had frozen.
We were also unable to connected to MIDAS via ssh port forwarding.

Since the restart we have been unable to write to file.

The tapeserver will allocate/mount/open a file but nothing will be written to it.
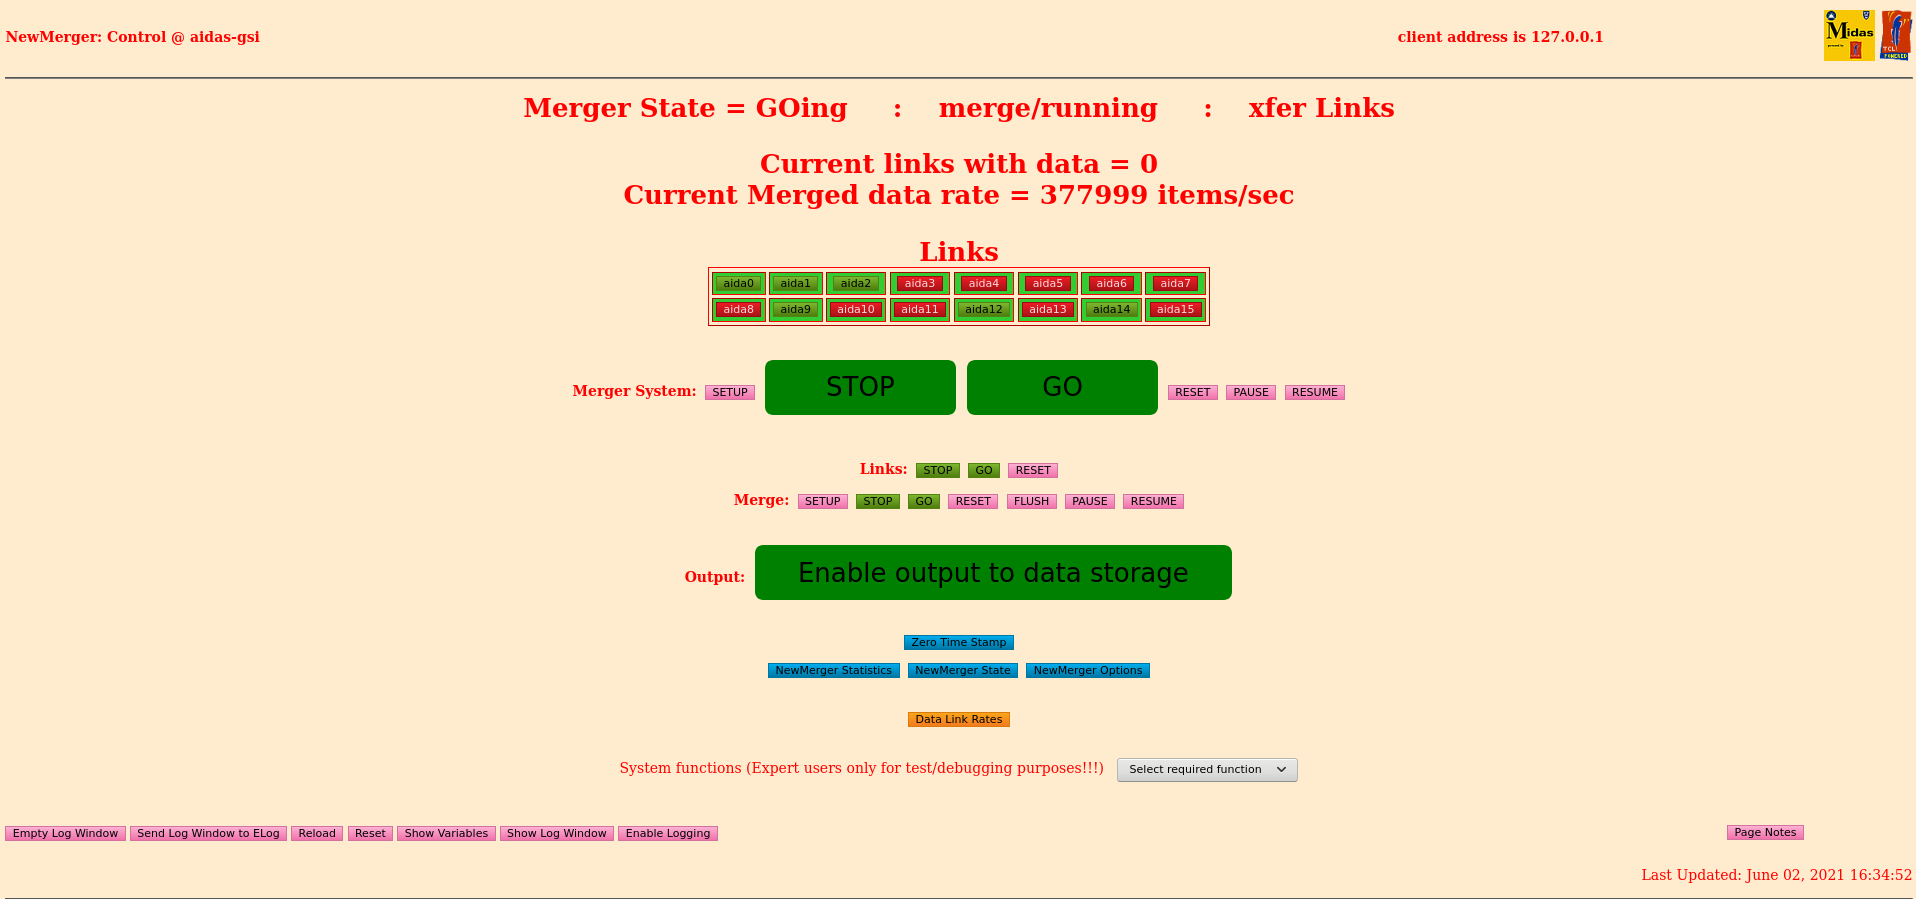
The merger will be receiving data but never shows as having any "Current links with data".

/MIDAS currently points to lrwxrwxrwx. 1 root root 45 Jan 23  2019 /MIDAS -> /home/npg/MIDAS_Releases/23Jan19/MIDAS_200119

The current disk structure is:
[npg@aidas-gsi npg]$ lsblk
NAME   MAJ:MIN RM   SIZE RO TYPE MOUNTPOINT
sr0     11:0    1  1024M  0 rom
sdb      8:16   0   7.3T  0 disk
├─sdb1   8:17   0   200M  0 part
├─sdb2   8:18   0   500M  0 part
└─sdb3   8:19   0   7.3T  0 part
  ├─vg_aidas2-lv_root (dm-2)
       253:2    0    50G  0 lvm
  ├─vg_aidas2-lv_home (dm-3)
       253:3    0   7.2T  0 lvm  /media/1e121361-83d3-4825-b6ae-8700b07e0ca7
  └─vg_aidas2-lv_swap (dm-4)
       253:4    0   7.8G  0 lvm
sdc      8:32   0   7.3T  0 disk
└─sdc1   8:33   0   7.3T  0 part /media/ThirdDrive
sdd      8:48   0   7.3T  0 disk
└─sdd1   8:49   0   7.3T  0 part /media/SecondDrive
sda      8:0    0 465.8G  0 disk
├─sda1   8:1    0   200M  0 part /boot/efi
├─sda2   8:2    0   500M  0 part /boot
└─sda3   8:3    0 465.1G  0 part
  ├─vg_aidasgsi-lv_root (dm-0)
       253:0    0    50G  0 lvm  /
  ├─vg_aidasgsi-lv_swap (dm-1)
       253:1    0   7.8G  0 lvm  [SWAP]
  └─vg_aidasgsi-lv_home (dm-5)
       253:5    0 407.3G  0 lvm  /home


Terminal outputs for the HTTPd, Merger and TapeServer terminals - attachments 1-3

TapeServer config file - attachment 4
Merger options - attachment 5

Note in the merger window the top bar is different to what we have seen previously - Attachment 6 and https://elog.ph.ed.ac.uk/DESPEC/210418_124830/51.png |
| Attachment 1: 210602_MergerTape_HTTPd_Startup
|
tidy up
tclsh8.5_copy2: no process killed

System identified is CPU x86_64; Platform is unix; OS is Linux and Version is 2.6.32-696.el6.x86_64
Environment selected is CPU x64_64; Platform unix; OS Linux64 and Operating System Linux64
MIDASBASE = /MIDAS and MIDAS_LIBRARY = /MIDAS/TclHttpd/Linux64
PATH = /MIDAS/bin_Linux64:/MIDAS/TclHttpd/Linux64:/MIDAS/Linux/bin64:/usr/lib64/qt-3.3/bin:/usr/local/bin:/usr/bin:/bin:/usr/local/sbin:/usr/sbin:/sbin:/home/npg/bin
Computer Name = aidas-gsi; Temp Directory = /tmp/tcl25624
package limit is not available: can't find package limit
Running with default file descriptor limit
package setuid is not available: can't find package setuid
Could not change to user 50 group 50: not owner
/debug user "debug" password "z5y30nlwy2e4"
httpd started on port 8115

Custom startup from /MIDAS/config/TclHttpd/aidas-gsi@8115/startup.tcl
/DataBaseAccessServer
/NetVarService
/SigTaskService
Loaded MemSasAccess
/SpectrumService
/TapeServer
loading tcl/NewMergerControl.tcl for namespace ::
/DataAcquisitionControlServer
DefineMessage unknown
Run Control Server Implementation for MERGE
RunControlServer loaded
loading Html/RunControl/implementation.tcl
/MIDAS/TclHttpd/Html/RunControl/common.tcl returned z=1 and couldn't read file "/MIDAS/TclHttpd/Html/RunControl/common.tcl": no such file or directory
ReadRegister failed: Name=NetVar.EXEC.ID; Code= 0x10004; Info= Register name does not exist
Created UI registers
RunControl loaded
loading Html/NewMerger/RunControl/implementation.tcl for namespace ::
ReadRegister failed: Name=NetVar.MERGE.ID; Code= 0x10004; Info= Register name does not exist
Created UI registers
NewMerge Control loaded
Completed custom startup from /MIDAS/TclHttpd/Html/NewMerger/RunControl/stats.defn.tcl
Shared memory area located at 0x7f34d3028000
Tape Server comms table located at 0x7f34d3028000
MERGE command  30
setup MERGER
Stop Merge
Halt (1)
Action has completed: MergeCommand 2 Halt
Setup Merge
Setup (1)
Action has completed: MergeCommand 1 Setup
MERGE command  32
go MERGER
Go Merge
Go (1)
Action has completed: MergeCommand 3 Go
link 0 GO (1)
Action has completed: MergeCommand 22 {link 0 GO} 0 2
link 1 GO (1)
Action has completed: MergeCommand 22 {link 1 GO} 1 2
link 2 GO (1)
Action has completed: MergeCommand 22 {link 2 GO} 2 2
link 3 GO (1)
Action has completed: MergeCommand 22 {link 3 GO} 3 2
link 4 GO (1)
Action has completed: MergeCommand 22 {link 4 GO} 4 2
link 5 GO (1)
Action has completed: MergeCommand 22 {link 5 GO} 5 2
link 6 GO (1)
Action has completed: MergeCommand 22 {link 6 GO} 6 2
link 7 GO (1)
Action has completed: MergeCommand 22 {link 7 GO} 7 2
link 8 GO (1)
Action has completed: MergeCommand 22 {link 8 GO} 8 2
link 9 GO (1)
Action has completed: MergeCommand 22 {link 9 GO} 9 2
link 10 GO (1)
Action has completed: MergeCommand 22 {link 10 GO} 10 2
link 11 GO (1)
Action has completed: MergeCommand 22 {link 11 GO} 11 2
link 12 GO (1)
Action has completed: MergeCommand 22 {link 12 GO} 12 2
link 13 GO (1)
Action has completed: MergeCommand 22 {link 13 GO} 13 2
link 14 GO (1)
Action has completed: MergeCommand 22 {link 14 GO} 14 2
link 15 GO (1)
Action has completed: MergeCommand 22 {link 15 GO} 15 2
Resume MERGER
|
| Attachment 2: 210602_NewMerger_Startup
|
Tidy up
MERGE: no process killed
merge64.AD: no process killed
Starting New Merger

[1] 25659
MERGE Master (25659): Message logger not contacted.
MERGE Master (25659): MIDAS MERGE Server 64 bit Build May 11 2021  20:32:01
Creating NetVars
Creating NetVars complete
MERGE Master (25659): MIDAS MERGE Server 64 bit Build May 11 2021  20:32:01
MERGE Master (25659): Configuration: TCP port base=11001 ; SHM key=11000; ids=16; links=16; Hardware=0
MERGE Master (25659): File mapped object /SHM_11000 of size 536628 created
MERGE Master (25659): Memory mapping 536628 bytes
MERGE Master (25659): Shared memory segment located at address 0x7fc0a99b8000.
MERGE Master (25659): File mapped object /SHM_11001 of size 100669480 created
MERGE Master (25659): Memory mapping 100669480 bytes
MERGE Master (25659): Shared memory segment located at address 0x7fc0a39b6000.
MERGE Master (25659): File mapped object /SHM_11002 of size 100669480 created
MERGE Master (25659): Memory mapping 100669480 bytes
MERGE Master (25659): Shared memory segment located at address 0x7fc09d9b4000.
MERGE Master (25659): File mapped object /SHM_11003 of size 100669480 created
MERGE Master (25659): Memory mapping 100669480 bytes
MERGE Master (25659): Shared memory segment located at address 0x7fc0979b2000.
MERGE Master (25659): File mapped object /SHM_11004 of size 100669480 created
MERGE Master (25659): Memory mapping 100669480 bytes
MERGE Master (25659): Shared memory segment located at address 0x7fc0919b0000.
MERGE Master (25659): File mapped object /SHM_11005 of size 100669480 created
MERGE Master (25659): Memory mapping 100669480 bytes
MERGE Master (25659): Shared memory segment located at address 0x7fc08b9ae000.
MERGE Master (25659): File mapped object /SHM_11006 of size 100669480 created
MERGE Master (25659): Memory mapping 100669480 bytes
MERGE Master (25659): Shared memory segment located at address 0x7fc0859ac000.
MERGE Master (25659): File mapped object /SHM_11007 of size 100669480 created
MERGE Master (25659): Memory mapping 100669480 bytes
MERGE Master (25659): Shared memory segment located at address 0x7fc07f9aa000.
MERGE Master (25659): File mapped object /SHM_11008 of size 100669480 created
MERGE Master (25659): Memory mapping 100669480 bytes
MERGE Master (25659): Shared memory segment located at address 0x7fc0799a8000.
MERGE Master (25659): File mapped object /SHM_11009 of size 100669480 created
MERGE Master (25659): Memory mapping 100669480 bytes
MERGE Master (25659): Shared memory segment located at address 0x7fc0739a6000.
MERGE Master (25659): File mapped object /SHM_11010 of size 100669480 created
MERGE Master (25659): Memory mapping 100669480 bytes
MERGE Master (25659): Shared memory segment located at address 0x7fc06d9a4000.
MERGE Master (25659): File mapped object /SHM_11011 of size 100669480 created
MERGE Master (25659): Memory mapping 100669480 bytes
MERGE Master (25659): Shared memory segment located at address 0x7fc0679a2000.
MERGE Master (25659): File mapped object /SHM_11012 of size 100669480 created
MERGE Master (25659): Memory mapping 100669480 bytes
MERGE Master (25659): Shared memory segment located at address 0x7fc0619a0000.
MERGE Master (25659): File mapped object /SHM_11013 of size 100669480 created
MERGE Master (25659): Memory mapping 100669480 bytes
MERGE Master (25659): Shared memory segment located at address 0x7fc05b99e000.
MERGE Master (25659): File mapped object /SHM_11014 of size 100669480 created
MERGE Master (25659): Memory mapping 100669480 bytes
MERGE Master (25659): Shared memory segment located at address 0x7fc05599c000.
MERGE Master (25659): File mapped object /SHM_11015 of size 100669480 created
MERGE Master (25659): Memory mapping 100669480 bytes
MERGE Master (25659): Shared memory segment located at address 0x7fc04f99a000.
MERGE Master (25659): File mapped object /SHM_11016 of size 100669480 created
MERGE Master (25659): Memory mapping 100669480 bytes
MERGE Master (25659): Shared memory segment located at address 0x7fc049998000.
MERGE Master (25659): Shared memory segment located at address 0x7fc049998000.
MERGE Master (25659): Starting stats/rates task
MERGE Master (25659): Stats/Rates task has pid 25661
MERGE Master (25659): Starting 16 link tasks
MERGE Master (25659): Link task has pid 25662
MERGE Master (25659): Link task has pid 25663
MERGE Statistics/Rates (25661): Message logger not contacted.
MERGE Statistics/Rates (25661): MIDAS MERGE Statistics 64 bit Build May 11 2021  20:32:03
Creating NetVars
Creating NetVars complete
MERGE Master (25659): Link task has pid 25664
MERGE Data Link (25662): Message logger not contacted.
MERGE Data Link (25662): MIDAS MERGE Data Link 64 bit Build May 11 2021  20:32:02
Creating NetVars
Creating NetVars complete
MERGE Data Link (25662): Configuration: index = 0, SHM key=11000, TCP port base = 11001, module = -1, hardware = 0
MERGE Data Link (25662): File mapped object /SHM_11000 accessed
MERGE Data Link (25662): Memory mapping 536628 bytes
MERGE Data Link (25662): Shared memory segment located at address 0x7f198ee7a000.
MERGE Data Link (25662): Allocated 71720 bytes for local input buffer
MERGE Data Link (25662): File mapped object /SHM_11001 accessed
MERGE Data Link (25662): Memory mapping 100669480 bytes
MERGE Data Link (25662): Shared memory segment located at address 0x7f1988e78000.
MERGE Master (25659): Link task has pid 25665
MERGE Data Link (25663): Message logger not contacted.
MERGE Data Link (25663): MIDAS MERGE Data Link 64 bit Build May 11 2021  20:32:02
Creating NetVars
Creating NetVars complete
MERGE Data Link (25663): Configuration: index = 1, SHM key=11000, TCP port base = 11002, module = 0, hardware = 0
MERGE Data Link (25663): File mapped object /SHM_11000 accessed
MERGE Data Link (25663): Memory mapping 536628 bytes
MERGE Data Link (25663): Shared memory segment located at address 0x7f3bee603000.
MERGE Data Link (25663): Allocated 71720 bytes for local input buffer
MERGE Data Link (25663): File mapped object /SHM_11002 accessed
MERGE Data Link (25663): Memory mapping 100669480 bytes
MERGE Data Link (25663): Shared memory segment located at address 0x7f3be8601000.
MERGE Master (25659): Link task has pid 25666
MERGE Data Link (25664): Message logger not contacted.
MERGE Data Link (25665): Message logger not contacted.
MERGE Data Link (25664): MIDAS MERGE Data Link 64 bit Build May 11 2021  20:32:02
MERGE Data Link (25665): MIDAS MERGE Data Link 64 bit Build May 11 2021  20:32:02
Creating NetVars
Creating NetVars
Creating NetVars complete
MERGE Data Link (25665): Configuration: index = 3, SHM key=11000, TCP port base = 11004, module = 2, hardware = 0
MERGE Data Link (25665): File mapped object /SHM_11000 accessed
MERGE Data Link (25665): Memory mapping 536628 bytes
MERGE Data Link (25665): Shared memory segment located at address 0x7f7418ae6000.
MERGE Data Link (25665): Allocated 71720 bytes for local input buffer
MERGE Data Link (25665): File mapped object /SHM_11004 accessed
MERGE Data Link (25665): Memory mapping 100669480 bytes
MERGE Data Link (25665): Shared memory segment located at address 0x7f7412ae4000.
Creating NetVars complete
MERGE Data Link (25664): Configuration: index = 2, SHM key=11000, TCP port base = 11003, module = 1, hardware = 0
MERGE Data Link (25664): File mapped object /SHM_11000 accessed
MERGE Data Link (25664): Memory mapping 536628 bytes
MERGE Data Link (25664): Shared memory segment located at address 0x7f0da72c8000.
MERGE Data Link (25664): Allocated 71720 bytes for local input buffer
MERGE Data Link (25664): File mapped object /SHM_11003 accessed
MERGE Data Link (25664): Memory mapping 100669480 bytes
MERGE Data Link (25664): Shared memory segment located at address 0x7f0da12c6000.
MERGE Master (25659): Link task has pid 25667
MERGE Master (25659): Link task has pid 25668
MERGE Data Link (25666): Message logger not contacted.
MERGE Data Link (25666): MIDAS MERGE Data Link 64 bit Build May 11 2021  20:32:02
Creating NetVars
Creating NetVars complete
MERGE Data Link (25666): Configuration: index = 4, SHM key=11000, TCP port base = 11005, module = 3, hardware = 0
MERGE Data Link (25666): File mapped object /SHM_11000 accessed
MERGE Data Link (25666): Memory mapping 536628 bytes
MERGE Data Link (25666): Shared memory segment located at address 0x7fb7f4ec2000.
MERGE Data Link (25666): Allocated 71720 bytes for local input buffer
MERGE Data Link (25666): File mapped object /SHM_11005 accessed
MERGE Data Link (25666): Memory mapping 100669480 bytes
MERGE Data Link (25666): Shared memory segment located at address 0x7fb7eeec0000.
MERGE Master (25659): Link task has pid 25669
MERGE Data Link (25667): Message logger not contacted.
MERGE Data Link (25667): MIDAS MERGE Data Link 64 bit Build May 11 2021  20:32:02
Creating NetVars
Creating NetVars complete
MERGE Data Link (25667): Configuration: index = 5, SHM key=11000, TCP port base = 11006, module = 4, hardware = 0
MERGE Data Link (25667): File mapped object /SHM_11000 accessed
MERGE Data Link (25667): Memory mapping 536628 bytes
MERGE Data Link (25667): Shared memory segment located at address 0x7f8b878c9000.
MERGE Data Link (25667): Allocated 71720 bytes for local input buffer
MERGE Data Link (25667): File mapped object /SHM_11006 accessed
MERGE Data Link (25667): Memory mapping 100669480 bytes
MERGE Data Link (25667): Shared memory segment located at address 0x7f8b818c7000.
MERGE Master (25659): Link task has pid 25670
MERGE Data Link (25668): Message logger not contacted.
MERGE Data Link (25668): MIDAS MERGE Data Link 64 bit Build May 11 2021  20:32:02
Creating NetVars
MERGE Master (25659): Link task has pid 25671
Creating NetVars complete
MERGE Data Link (25668): Configuration: index = 6, SHM key=11000, TCP port base = 11007, module = 5, hardware = 0
MERGE Data Link (25668): File mapped object /SHM_11000 accessed
MERGE Data Link (25668): Memory mapping 536628 bytes
MERGE Data Link (25668): Shared memory segment located at address 0x7f88c7c9a000.
MERGE Data Link (25668): Allocated 71720 bytes for local input buffer
MERGE Data Link (25668): File mapped object /SHM_11007 accessed
MERGE Data Link (25668): Memory mapping 100669480 bytes
MERGE Data Link (25668): Shared memory segment located at address 0x7f88c1c98000.
MERGE Data Link (25669): Message logger not contacted.
MERGE Data Link (25669): MIDAS MERGE Data Link 64 bit Build May 11 2021  20:32:02
Creating NetVars
MERGE Master (25659): Link task has pid 25672
Creating NetVars complete
MERGE Data Link (25669): Configuration: index = 7, SHM key=11000, TCP port base = 11008, module = 6, hardware = 0
MERGE Data Link (25669): File mapped object /SHM_11000 accessed
MERGE Data Link (25669): Memory mapping 536628 bytes
MERGE Data Link (25669): Shared memory segment located at address 0x7f87e7704000.
MERGE Data Link (25669): Allocated 71720 bytes for local input buffer
MERGE Data Link (25669): File mapped object /SHM_11008 accessed
MERGE Data Link (25669): Memory mapping 100669480 bytes
MERGE Data Link (25669): Shared memory segment located at address 0x7f87e1702000.
MERGE Data Link (25671): Message logger not contacted.
MERGE Data Link (25671): MIDAS MERGE Data Link 64 bit Build May 11 2021  20:32:02
Creating NetVars
Creating NetVars complete
MERGE Data Link (25671): Configuration: index = 9, SHM key=11000, TCP port base = 11010, module = 8, hardware = 0
MERGE Data Link (25671): File mapped object /SHM_11000 accessed
MERGE Data Link (25671): Memory mapping 536628 bytes
MERGE Data Link (25671): Shared memory segment located at address 0x7f38b4f59000.
MERGE Data Link (25671): Allocated 71720 bytes for local input buffer
MERGE Data Link (25671): File mapped object /SHM_11010 accessed
MERGE Data Link (25671): Memory mapping 100669480 bytes
MERGE Data Link (25671): Shared memory segment located at address 0x7f38aef57000.
MERGE Data Link (25670): Message logger not contacted.
MERGE Data Link (25670): MIDAS MERGE Data Link 64 bit Build May 11 2021  20:32:02
Creating NetVars
MERGE Master (25659): Link task has pid 25673
Creating NetVars complete
MERGE Data Link (25670): Configuration: index = 8, SHM key=11000, TCP port base = 11009, module = 7, hardware = 0
MERGE Data Link (25670): File mapped object /SHM_11000 accessed
MERGE Data Link (25670): Memory mapping 536628 bytes
MERGE Data Link (25672): Message logger not contacted.
MERGE Data Link (25670): Shared memory segment located at address 0x7ff7744ce000.
MERGE Data Link (25672): MIDAS MERGE Data Link 64 bit Build May 11 2021  20:32:02
Creating NetVars
MERGE Data Link (25670): Allocated 71720 bytes for local input buffer
MERGE Data Link (25670): File mapped object /SHM_11009 accessed
MERGE Data Link (25670): Memory mapping 100669480 bytes
MERGE Data Link (25670): Shared memory segment located at address 0x7ff76e4cc000.
Creating NetVars complete
MERGE Data Link (25672): Configuration: index = 10, SHM key=11000, TCP port base = 11011, module = 9, hardware = 0
MERGE Data Link (25672): File mapped object /SHM_11000 accessed
MERGE Data Link (25672): Memory mapping 536628 bytes
MERGE Data Link (25672): Shared memory segment located at address 0x7f4bb287e000.
MERGE Data Link (25672): Allocated 71720 bytes for local input buffer
MERGE Data Link (25672): File mapped object /SHM_11011 accessed
MERGE Data Link (25672): Memory mapping 100669480 bytes
MERGE Data Link (25672): Shared memory segment located at address 0x7f4bac87c000.
MERGE Master (25659): Link task has pid 25674
MERGE Data Link (25673): Message logger not contacted.
MERGE Data Link (25673): MIDAS MERGE Data Link 64 bit Build May 11 2021  20:32:02
Creating NetVars
Creating NetVars complete
MERGE Data Link (25673): Configuration: index = 11, SHM key=11000, TCP port base = 11012, module = 10, hardware = 0
MERGE Data Link (25673): File mapped object /SHM_11000 accessed
MERGE Data Link (25673): Memory mapping 536628 bytes
MERGE Data Link (25673): Shared memory segment located at address 0x7fe3cd54a000.
MERGE Data Link (25673): Allocated 71720 bytes for local input buffer
MERGE Data Link (25673): File mapped object /SHM_11012 accessed
MERGE Data Link (25673): Memory mapping 100669480 bytes
MERGE Data Link (25673): Shared memory segment located at address 0x7fe3c7548000.
MERGE Master (25659): Link task has pid 25675
MERGE Data Link (25674): Message logger not contacted.
MERGE Data Link (25674): MIDAS MERGE Data Link 64 bit Build May 11 2021  20:32:02
Creating NetVars
Creating NetVars complete
MERGE Data Link (25674): Configuration: index = 12, SHM key=11000, TCP port base = 11013, module = 11, hardware = 0
MERGE Data Link (25674): File mapped object /SHM_11000 accessed
MERGE Data Link (25674): Memory mapping 536628 bytes
MERGE Data Link (25674): Shared memory segment located at address 0x7faec5dbd000.
MERGE Data Link (25674): Allocated 71720 bytes for local input buffer
MERGE Data Link (25674): File mapped object /SHM_11013 accessed
MERGE Data Link (25674): Memory mapping 100669480 bytes
MERGE Data Link (25674): Shared memory segment located at address 0x7faebfdbb000.
MERGE Master (25659): Link task has pid 25676
MERGE Master (25659): Link task has pid 25677
MERGE Data Link (25675): Message logger not contacted.
MERGE Data Link (25675): MIDAS MERGE Data Link 64 bit Build May 11 2021  20:32:02
Creating NetVars
Creating NetVars complete
MERGE Data Link (25675): Configuration: index = 13, SHM key=11000, TCP port base = 11014, module = 12, hardware = 0
MERGE Data Link (25675): File mapped object /SHM_11000 accessed
MERGE Data Link (25675): Memory mapping 536628 bytes
MERGE Data Link (25675): Shared memory segment located at address 0x7fef43120000.
MERGE Data Link (25675): Allocated 71720 bytes for local input buffer
MERGE Data Link (25675): File mapped object /SHM_11014 accessed
MERGE Data Link (25675): Memory mapping 100669480 bytes
MERGE Data Link (25675): Shared memory segment located at address 0x7fef3d11e000.
MERGE Data Link (25676): Message logger not contacted.
MERGE Data Link (25676): MIDAS MERGE Data Link 64 bit Build May 11 2021  20:32:02
Creating NetVars
Creating NetVars complete
MERGE Data Link (25676): Configuration: index = 14, SHM key=11000, TCP port base = 11015, module = 13, hardware = 0
MERGE Data Link (25676): File mapped object /SHM_11000 accessed
MERGE Data Link (25676): Memory mapping 536628 bytes
MERGE Data Link (25676): Shared memory segment located at address 0x7f6aea271000.
MERGE Data Link (25676): Allocated 71720 bytes for local input buffer
MERGE Data Link (25676): File mapped object /SHM_11015 accessed
MERGE Data Link (25676): Memory mapping 100669480 bytes
MERGE Data Link (25676): Shared memory segment located at address 0x7f6ae426f000.
MERGE Data Link (25677): Message logger not contacted.
MERGE Data Link (25677): MIDAS MERGE Data Link 64 bit Build May 11 2021  20:32:02
Creating NetVars
Creating NetVars complete
MERGE Data Link (25677): Configuration: index = 15, SHM key=11000, TCP port base = 11016, module = 14, hardware = 0
MERGE Data Link (25677): File mapped object /SHM_11000 accessed
MERGE Data Link (25677): Memory mapping 536628 bytes
MERGE Data Link (25677): Shared memory segment located at address 0x7fc4281e9000.
MERGE Data Link (25677): Allocated 71720 bytes for local input buffer
MERGE Data Link (25677): File mapped object /SHM_11016 accessed
MERGE Data Link (25677): Memory mapping 100669480 bytes
MERGE Data Link (25677): Shared memory segment located at address 0x7fc4221e7000.
MERGE Statistics/Rates (25661): MIDAS MERGE Statistics 64 bit Build May 11 2021  20:32:03
MERGE Statistics thread starting
MERGE Data Link (25665): Shared memory segment located at address 0x7f7412ae4000.
MERGE Data Link (25665): Shared memory segment located at address 0x7f7412ae4000.
MERGE Data Link (25663): Shared memory segment located at address 0x7f3be8601000.
MERGE Data Link (25663): Shared memory segment located at address 0x7f3be8601000.
MERGE Data Link (25662): Shared memory segment located at address 0x7f1988e78000.
MERGE Data Link (25662): Shared memory segment located at address 0x7f1988e78000.
MERGE Data Link (25667): Shared memory segment located at address 0x7f8b818c7000.
MERGE Data Link (25667): Shared memory segment located at address 0x7f8b818c7000.
MERGE Data Link (25668): Shared memory segment located at address 0x7f88c1c98000.
MERGE Data Link (25668): Shared memory segment located at address 0x7f88c1c98000.
MERGE Data Link (25664): Shared memory segment located at address 0x7f0da12c6000.
MERGE Data Link (25664): Shared memory segment located at address 0x7f0da12c6000.
MERGE Data Link (25666): Shared memory segment located at address 0x7fb7eeec0000.
MERGE Data Link (25666): Shared memory segment located at address 0x7fb7eeec0000.
MERGE Data Link (25670): Shared memory segment located at address 0x7ff76e4cc000.
MERGE Data Link (25670): Shared memory segment located at address 0x7ff76e4cc000.
MERGE Data Link (25673): Shared memory segment located at address 0x7fe3c7548000.
MERGE Data Link (25673): Shared memory segment located at address 0x7fe3c7548000.
MERGE Data Link (25672): Shared memory segment located at address 0x7f4bac87c000.
... 201 more lines ...
|
| Attachment 3: 210602_TapeServerStartup
|
Tidy up
master(4596): Operation not permitted
Starting Tape Server

[1] 25639
MIDAS Tape Server: Message logger not contacted.
MIDAS Tape Server: MIDAS Tape Server Build Mar 16 2021  12:22:14
MIDAS Tape Server: Unable to change scheduling priority - Permission denied
MIDAS Tape Server: Using default startup
MIDAS Tape Server: Configuration: UDP port = 10205, SHM key=10205.
MIDAS Tape Server: File mapped object /SHM_10205 of size 1331104 created
MIDAS Tape Server: Shared memory ID is 3
MIDAS Tape Server: Shared memory segment located at address 7fdf19721000.
MIDAS Tape Server: Configuration file used - /MIDAS/config/TS_10205/TS_configuration
MIDAS Tape Server: Stats task /MIDAS/TapeServer/Linux64/stats
MIDAS Tape Server: Using device file /dev/file/0 /MIDAS/TapeServer/Linux64/driver
MIDAS Tape Server: Using device file /dev/file/1 /MIDAS/TapeServer/Linux64/driver
MIDAS Tape Server: Using device sink /dev/null/0 /MIDAS/TapeServer/Linux64/driver
MIDAS Tape Server: Data link /MIDAS/TapeServer/Linux64/linkTCP 10305
MIDAS Tape Server: Data link /MIDAS/TapeServer/Linux64/linkTCP 21001 21002
MIDAS Tape Server: Message reporting level = 0x180fff8
MIDAS Tape Server: Message logging level = 0xfff8
MIDAS Tape Server: Tape Server Options = 0x0
MIDAS Tape Server: File device path base = /TapeData
MIDAS Tape Server: Data buffer size = 65536
MIDAS Tape Server: Tape block size = 65536
MIDAS Tape Server: File mapped object /SHM_110205 of size 4195880 created
MIDAS Tape Server: Shared memory ID is 3
MIDAS Tape Server: Shared memory segment located at address 7fdf19320000.
MIDAS Tape Server: File mapped object /SHM_210205 of size 3100 created
MIDAS Tape Server: Shared memory ID is 3
MIDAS Tape Server: Shared memory segment located at address 7fdf19881000.
MIDAS Tape Server: Capabilities restored.
MIDAS Tape Server: Master global area initialised.
MIDAS Tape Server: Stats task has pid 25641
MIDAS Tape Server: Driver process for /dev/file/0 has pid 25642
MIDAS Tape Server: Driver process for /dev/file/1 has pid 25643
MIDAS Tape Server: Driver process for /dev/null/0 has pid 25644
MIDAS Tape Server: Link task 0 has pid 25645
MIDAS Tape Server: Link task 1 has pid 25646
MIDAS Tape Server: Starting the RPC interface
MIDAS Tape Statistics: Message logger not contacted.
MIDAS Tape Statistics: MIDAS Tape Statistics Build Mar 16 2021  12:22:20
MIDAS Tape Statistics: Started with args 10205
MIDAS Tape Statistics: Configuration: SHM key=10205
MIDAS Tape Statistics: File mapped object /SHM_10205 of size 1331104 created
MIDAS Tape Statistics: Shared memory ID is 3
MIDAS Tape Statistics: Shared memory segment located at address 7f9c551f7000.
MIDAS Data Link (25645): Message logger not contacted.
MIDAS Data Link (25645): MIDAS Tape Data Link Build Mar 16 2021  12:22:19
MIDAS Data Link (25645): Started with args 10205 10305
MIDAS Data Link (25645): Configuration: SHM key=10205, TCP port = 10305, Data Stream = 1
MIDAS Tape Driver (25644): Message logger not contacted.
MIDAS Tape Driver (25644): Message logger not contacted.
MIDAS Data Link (25646): Message logger not contacted.
MIDAS Tape Driver (25644): Started with args 2 10205
MIDAS Data Link (25645): File mapped object /SHM_10205 of size 1331104 created
MIDAS Data Link (25645): Shared memory ID is 3
MIDAS Data Link (25645): Shared memory segment located at address 7f6ba30ef000.
MIDAS Data Link (25646): MIDAS Tape Data Link Build Mar 16 2021  12:22:19
MIDAS Tape Driver (25644): Configuration: driver=2, key=10205.
MIDAS Data Link (25646): Started with args 10205 21001 21002
MIDAS Data Link (25645): Starting the network interface
MIDAS Tape Driver (25644): File mapped object /SHM_10205 of size 1331104 created
MIDAS Data Link (25646): Configuration: SHM key=10205, TCP port = 21001, Data Stream = 2
MIDAS Tape Driver (25644): Shared memory ID is 3
MIDAS Tape Driver (25644): Shared memory segment located at address 7f09d718d000.
MIDAS Tape Driver (25644): Using device /dev/null/0 of type sink.
MIDAS Data Link (25646): File mapped object /SHM_10205 of size 1331104 created
MIDAS Data Link (25646): Shared memory ID is 3
MIDAS Data Link (25646): Shared memory segment located at address 7fa75ae3c000.
MIDAS Data Link (25646): Starting the network interface
MIDAS Tape Driver (25642): Message logger not contacted.
MIDAS Data Link (25645): TCP socket receive buffer was 87380 - now 249856
MIDAS Tape Driver (25642): Message logger not contacted.
MIDAS Tape Driver (25642): Started with args 0 10205
MIDAS Tape Driver (25642): Configuration: driver=0, key=10205.
MIDAS Tape Driver (25643): Message logger not contacted.
MIDAS Tape Driver (25642): File mapped object /SHM_10205 of size 1331104 created
MIDAS Tape Driver (25643): Message logger not contacted.
MIDAS Tape Driver (25642): Shared memory ID is 3
MIDAS Data Link (25646): TCP socket receive buffer was 87380 - now 249856
MIDAS Data Link (25645): TCP socket send buffer was 16384 - now 249856
MIDAS Tape Driver (25643): Started with args 1 10205
MIDAS Tape Driver (25642): Shared memory segment located at address 7f48b1ea4000.
MIDAS Tape Driver (25642): Using device /dev/file/0 of type file.
MIDAS Data Link (25645): MIDAS Data Link thread 0 using TCP port 10305.
MIDAS Data Link (25645): Entering server loop
MIDAS Tape Driver (25643): Configuration: driver=1, key=10205.
MIDAS Data Link (25645): thread 0 listening on port 10305
MIDAS Tape Driver (25643): File mapped object /SHM_10205 of size 1331104 created
MIDAS Tape Driver (25643): Shared memory ID is 3
MIDAS Tape Driver (25643): Shared memory segment located at address 7f6044052000.
MIDAS Data Link (25646): TCP socket send buffer was 16384 - now 249856
MIDAS Tape Driver (25643): Using device /dev/file/1 of type file.
MIDAS Data Link (25646): MIDAS Data Link thread 0 using TCP port 21001.
MIDAS Data Link (25646): TCP socket receive buffer was 87380 - now 249856
MIDAS Data Link (25646): TCP socket send buffer was 16384 - now 249856
MIDAS Data Link (25646): MIDAS Data Link thread 1 using TCP port 21002.
MIDAS Data Link (25646): Entering server loop
MIDAS Data Link (25646): thread 0 listening on port 21001
MIDAS Data Link (25646): thread 1 listening on port 21002
MIDAS Tape Server: Created RPC Program 28000205 Version 4 on UDP port 10205.
MIDAS Tape Server: Entering server loop
MIDAS Tape Server: MIDAS Tape Server now available on UDP port 10205.
MIDAS Data Link (25645): thread 0 accepted connection from 127.0.0.1, port 37330
MIDAS Data Link (25645): buffer size changed to 65536
MIDAS Tape Server: device /dev/file/0 allocated.
MIDAS Tape Server: Mounting volume S496 on device /dev/file/0.
MIDAS Tape Server: Opening file R31 on device /dev/file/0.
2222 64 0 31056336
3333 31056336 2048000 1 15
|
| Attachment 4: TS_configuration
|
#device configuration information
#    any line starting with a # is a comment and is ignored
stats /MIDAS/TapeServer/Linux64/stats
#    devices available   -   list ends with a null line
#    format       class_name     device_name    driver_task_path_name
#       class_name MUST be one of dlt, exabyte, scsitape, sink
file          /dev/file/0    /MIDAS/TapeServer/Linux64/driver
file          /dev/file/1    /MIDAS/TapeServer/Linux64/driver
sink          /dev/null/0     /MIDAS/TapeServer/Linux64/driver

#data link configuration information  - list end with a null line
#    format   link_task_path_name
/MIDAS/TapeServer/Linux64/linkTCP 10305
/MIDAS/TapeServer/Linux64/linkTCP 21001 21002

#program options - list end with a null line
#tapeserver_options 0x2
tapeserver_options 0x0
msg_reporting_level 0x0180fff8
#   use 0x0080fff8 to enable msg logging
msg_logging_level 0xfff8
#    default for following is 16Kbytes - both MUST be the same at present
data_buffer_size 64
tape_block_size 64
disc_file_size 2000
#
file_path_base  /TapeData

#end of information
|
| Attachment 5: CONTENTS
|
Index string MERGE.LinksAvailable&&RunNumber&&MERGE.LinksInUse&&MERGE.RunOptions
Stat.shift string 0
0x0006dead string 0x0000
MERGE.LinksAvailable string 16
Stat.offset string 0
RunNumber string 0
Rate.channels string 1024
Stat.channels string 1024
MERGE.RunOptions string 3
MERGE.LinksInUse string 1%1%1%1%1%1%1%1%1%1%1%1%1%1%1%1%
Merge.LinksInUse string 1%1%1%1%1%1%1%1%1%1%1%1%0%0%0%0%0%0%0%0%0%0%0%0%0%0%0%0%0%0%0%0%0%0%0%0%0%0%0%0%0%0%0%0%0%0%0%0%0%0%0%0%0%0%0%0%0%0%0%0%0%0%0%0%
|
| Attachment 6: 210602_merger.png
|
|
|
35
|
Mon Mar 25 14:44:33 2019 |
NH | Merger issues |
Plastic electronics have now been installed.
Water is not leaking still.
FEE64s powered on at 15:00 to test MBS connection (fig1: temperatures)
MBS relay connects to MBS server OK...
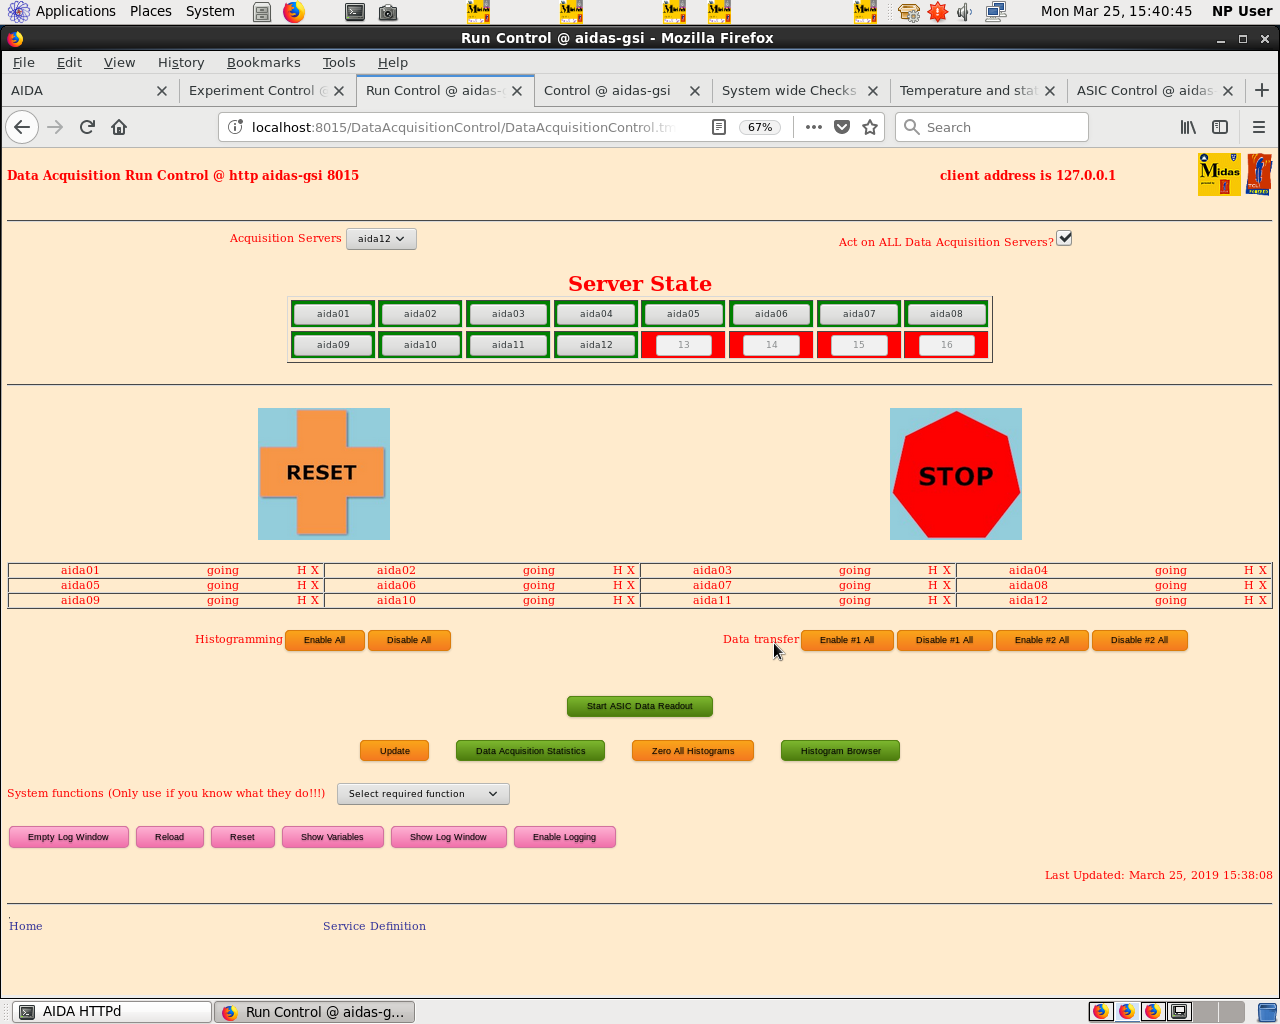
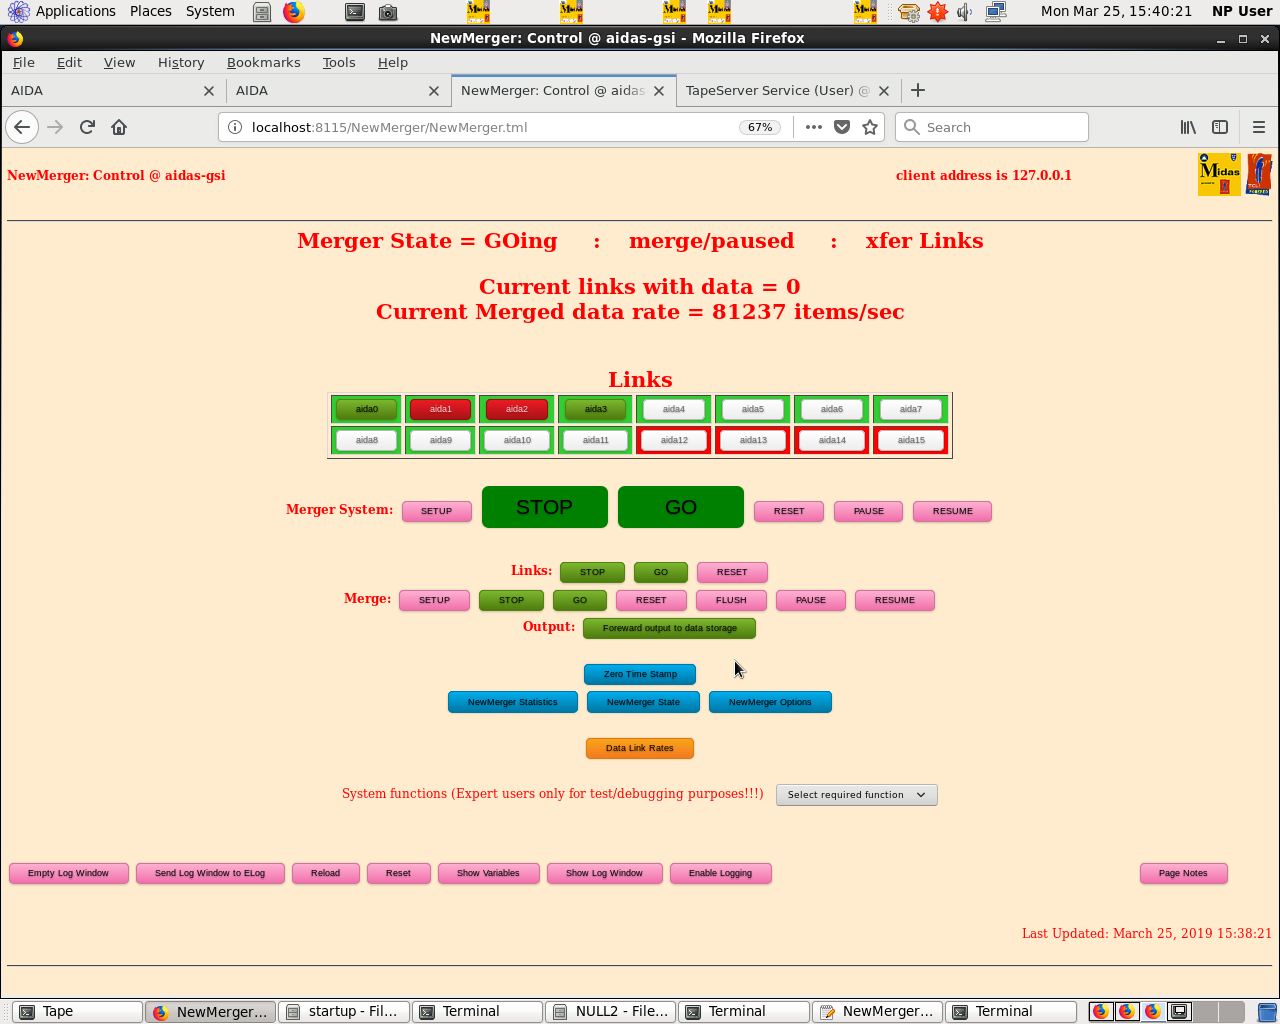
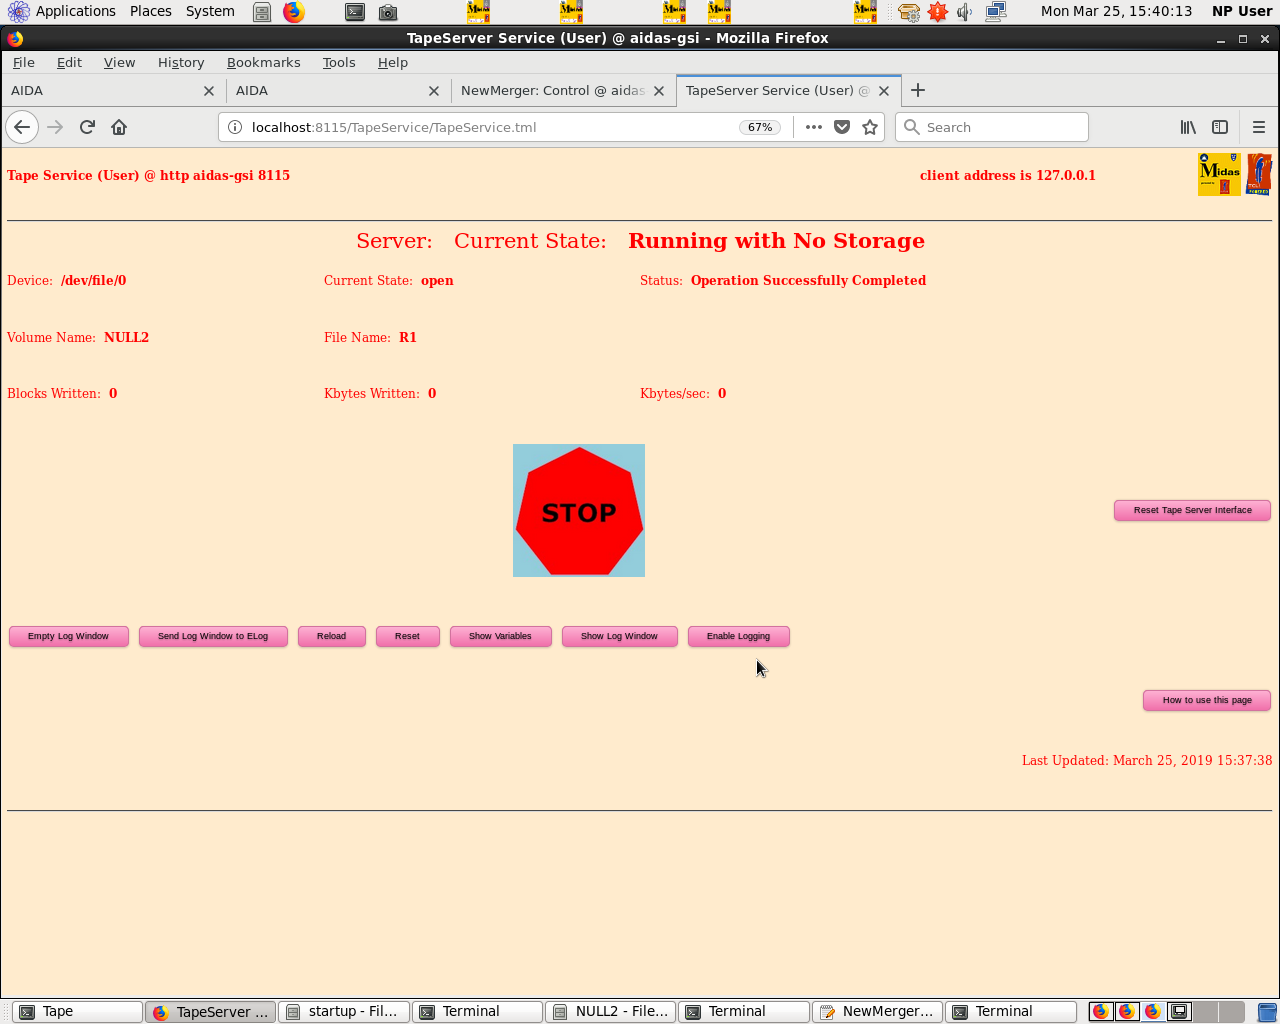
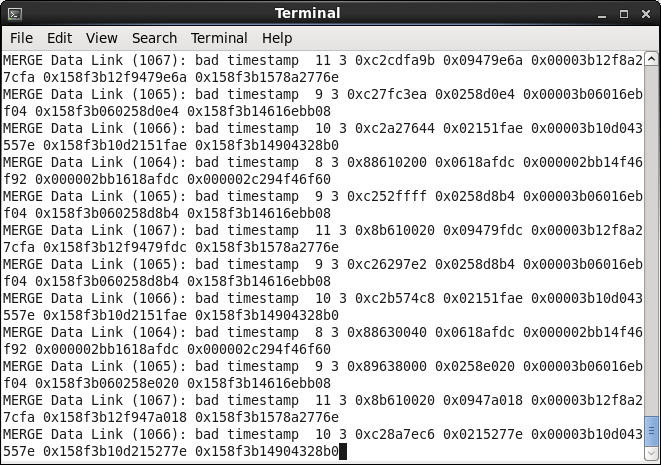
AIDA Merger does not accept any data... (links with data reads 0) and lots of timestamp errors in log? (Figs 2-4)
Startup procedure incorrect?
Otherwise things still OK. |
| Attachment 1: Temps.png
|

|
| Attachment 2: AIDARUNv2.png
|
|
| Attachment 3: Mergerv2.png
|
|
| Attachment 4: Tapev2.png
|
|
| Attachment 5: MergerConsolev2.png
|
|
|
559
|
Wed Apr 3 13:02:19 2024 |
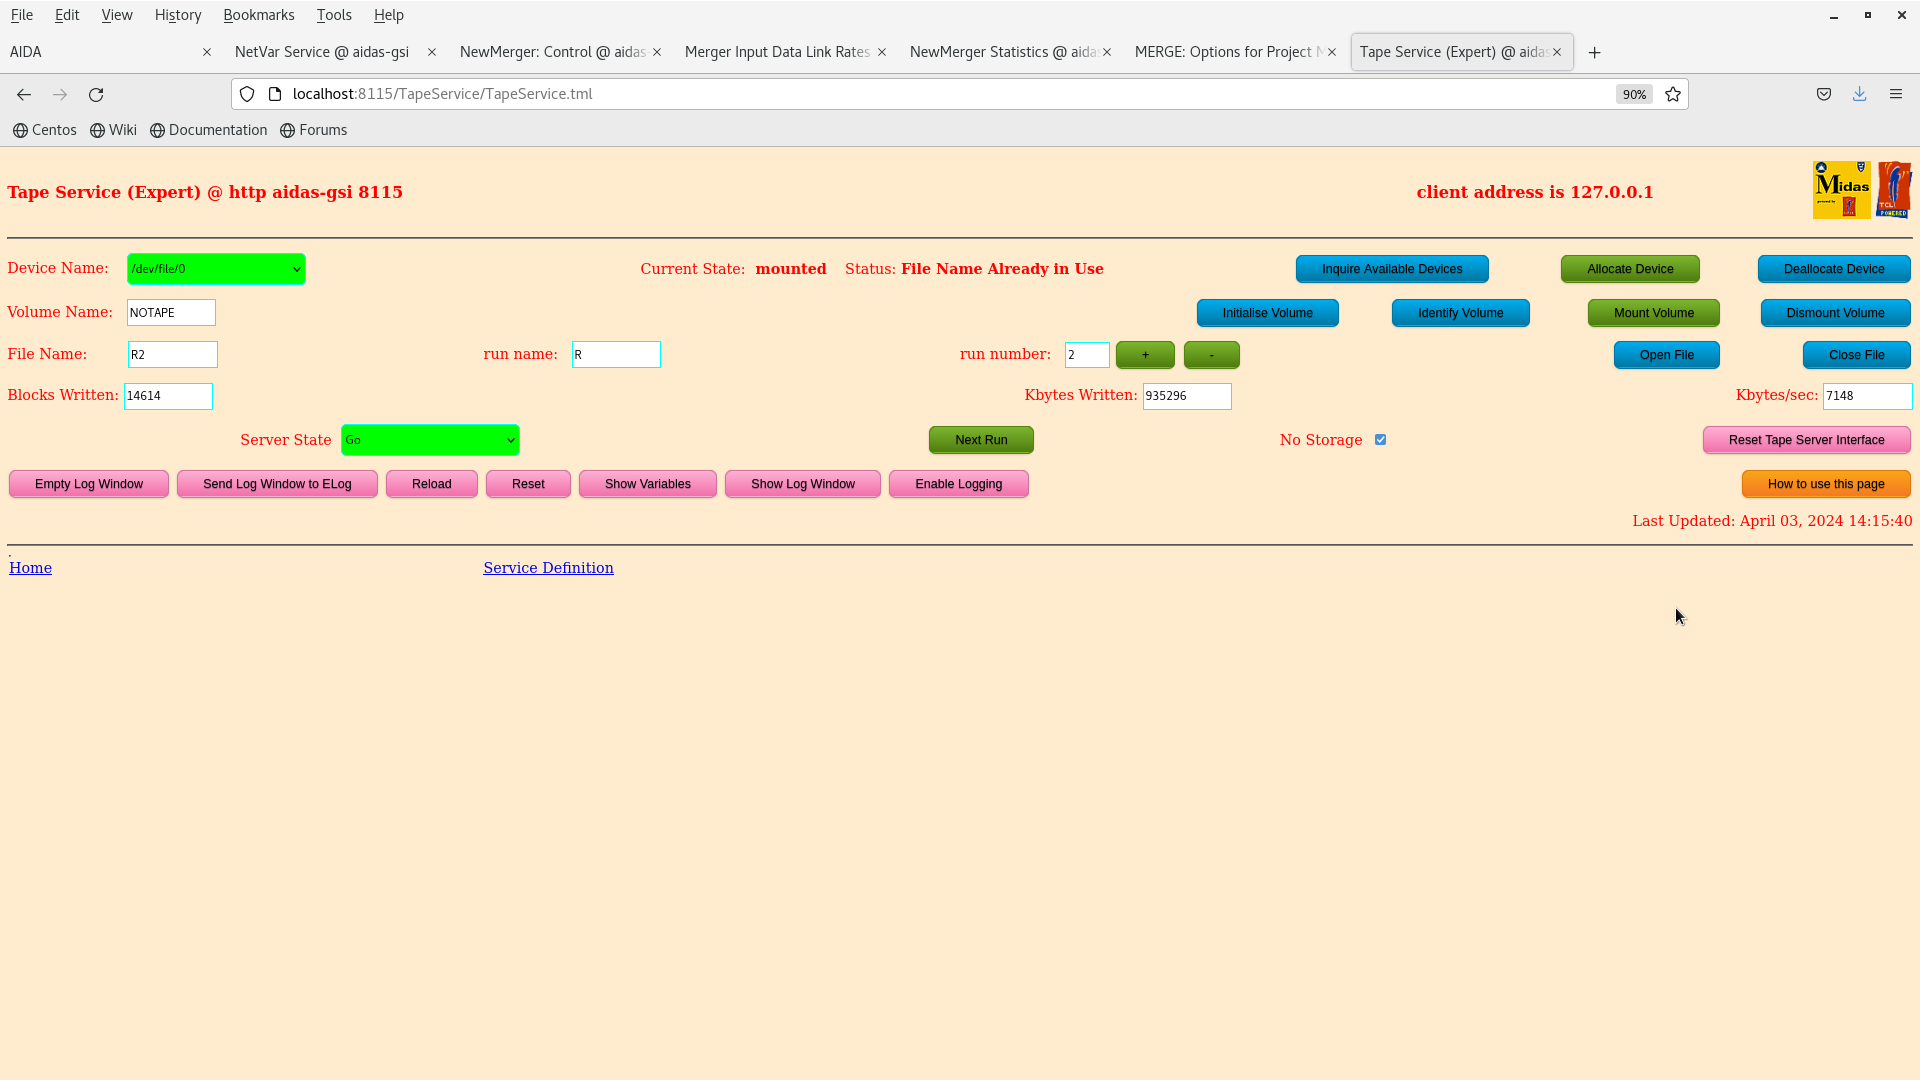
NH | Merger for 16 FEEs |
Changed /MIDAS/Linux/startup/NewMerger

Change parameters -i and -l in master64 to 16 for 16 FEEs
Update NewMerger Options LinksAvailable to 16, LinksInUse to 1%1%1%1%1%1%1%1%1%1%1%1%1%1%1%1%
Fix NetVar RunOptions 1 (was 0)

Restart Merger HTTPd, Tape, Merger, MBS Spy

Reset/Setup/Go

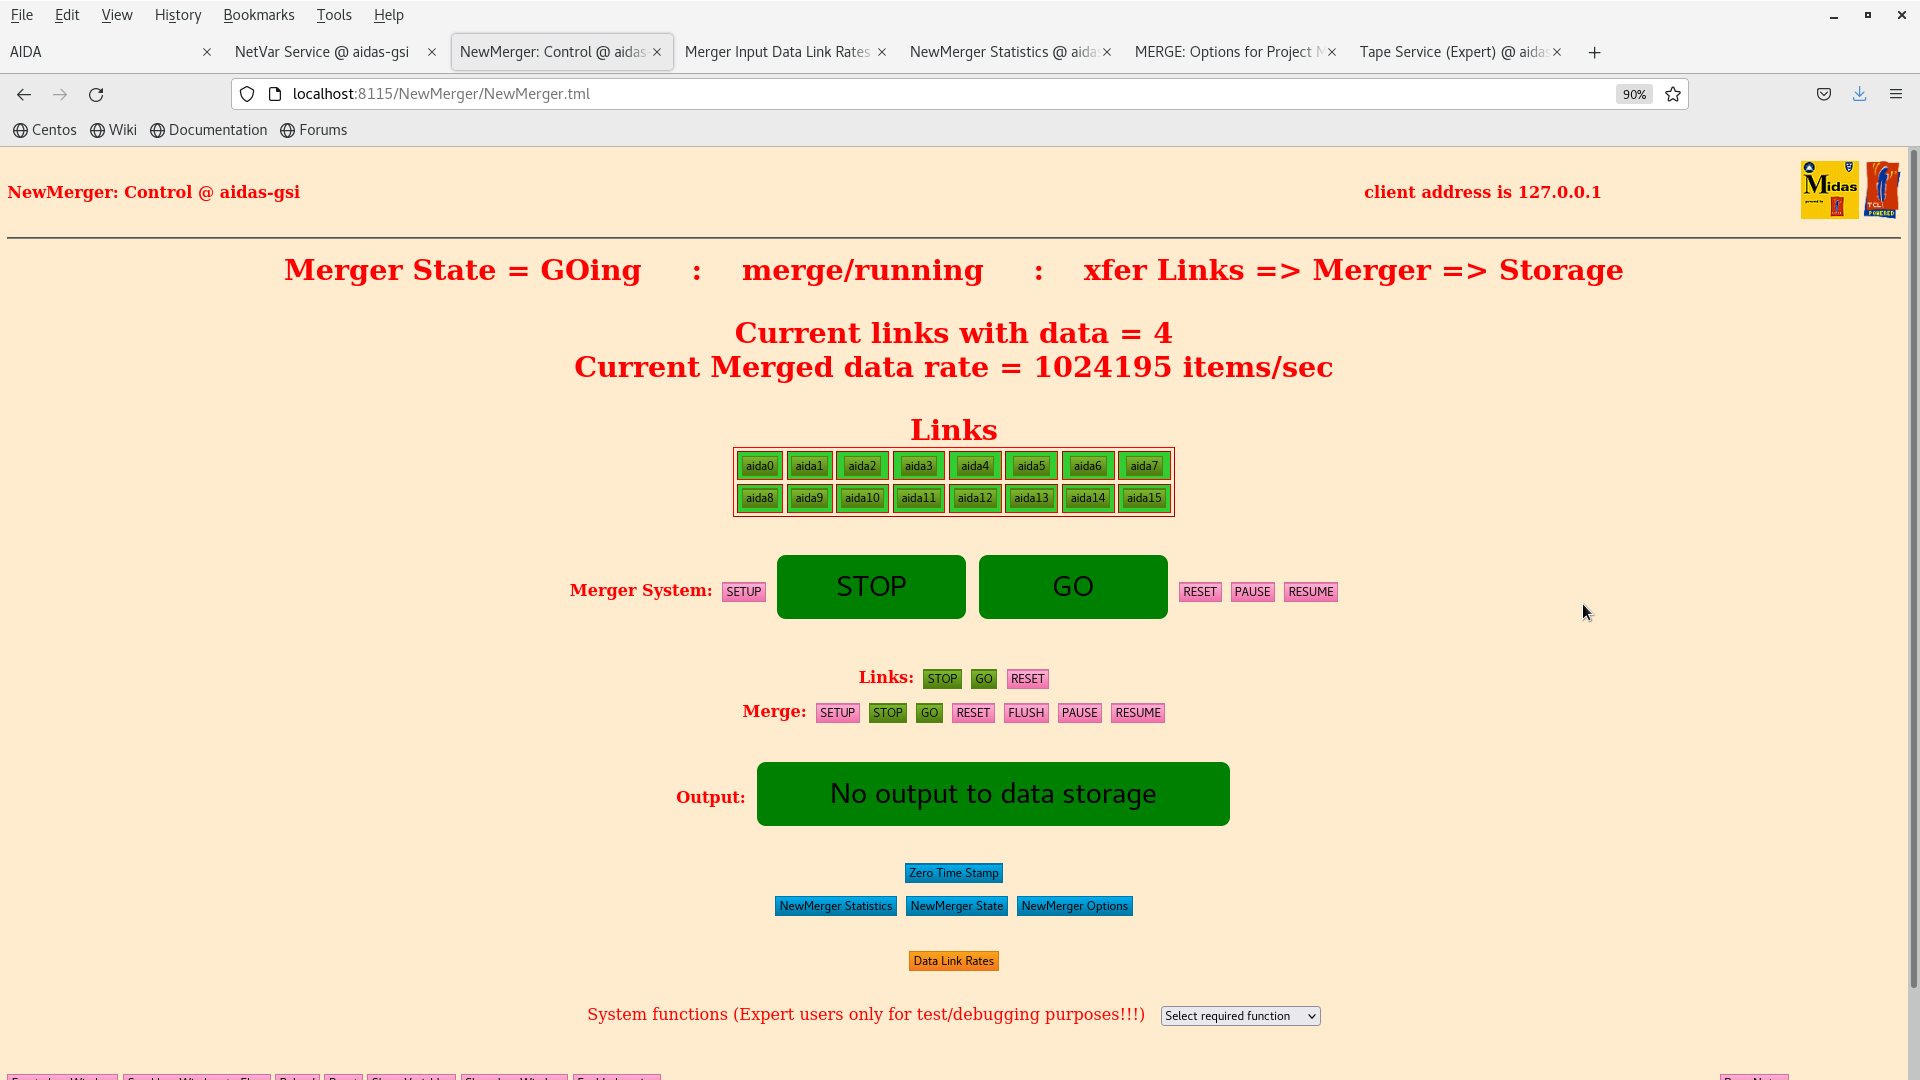
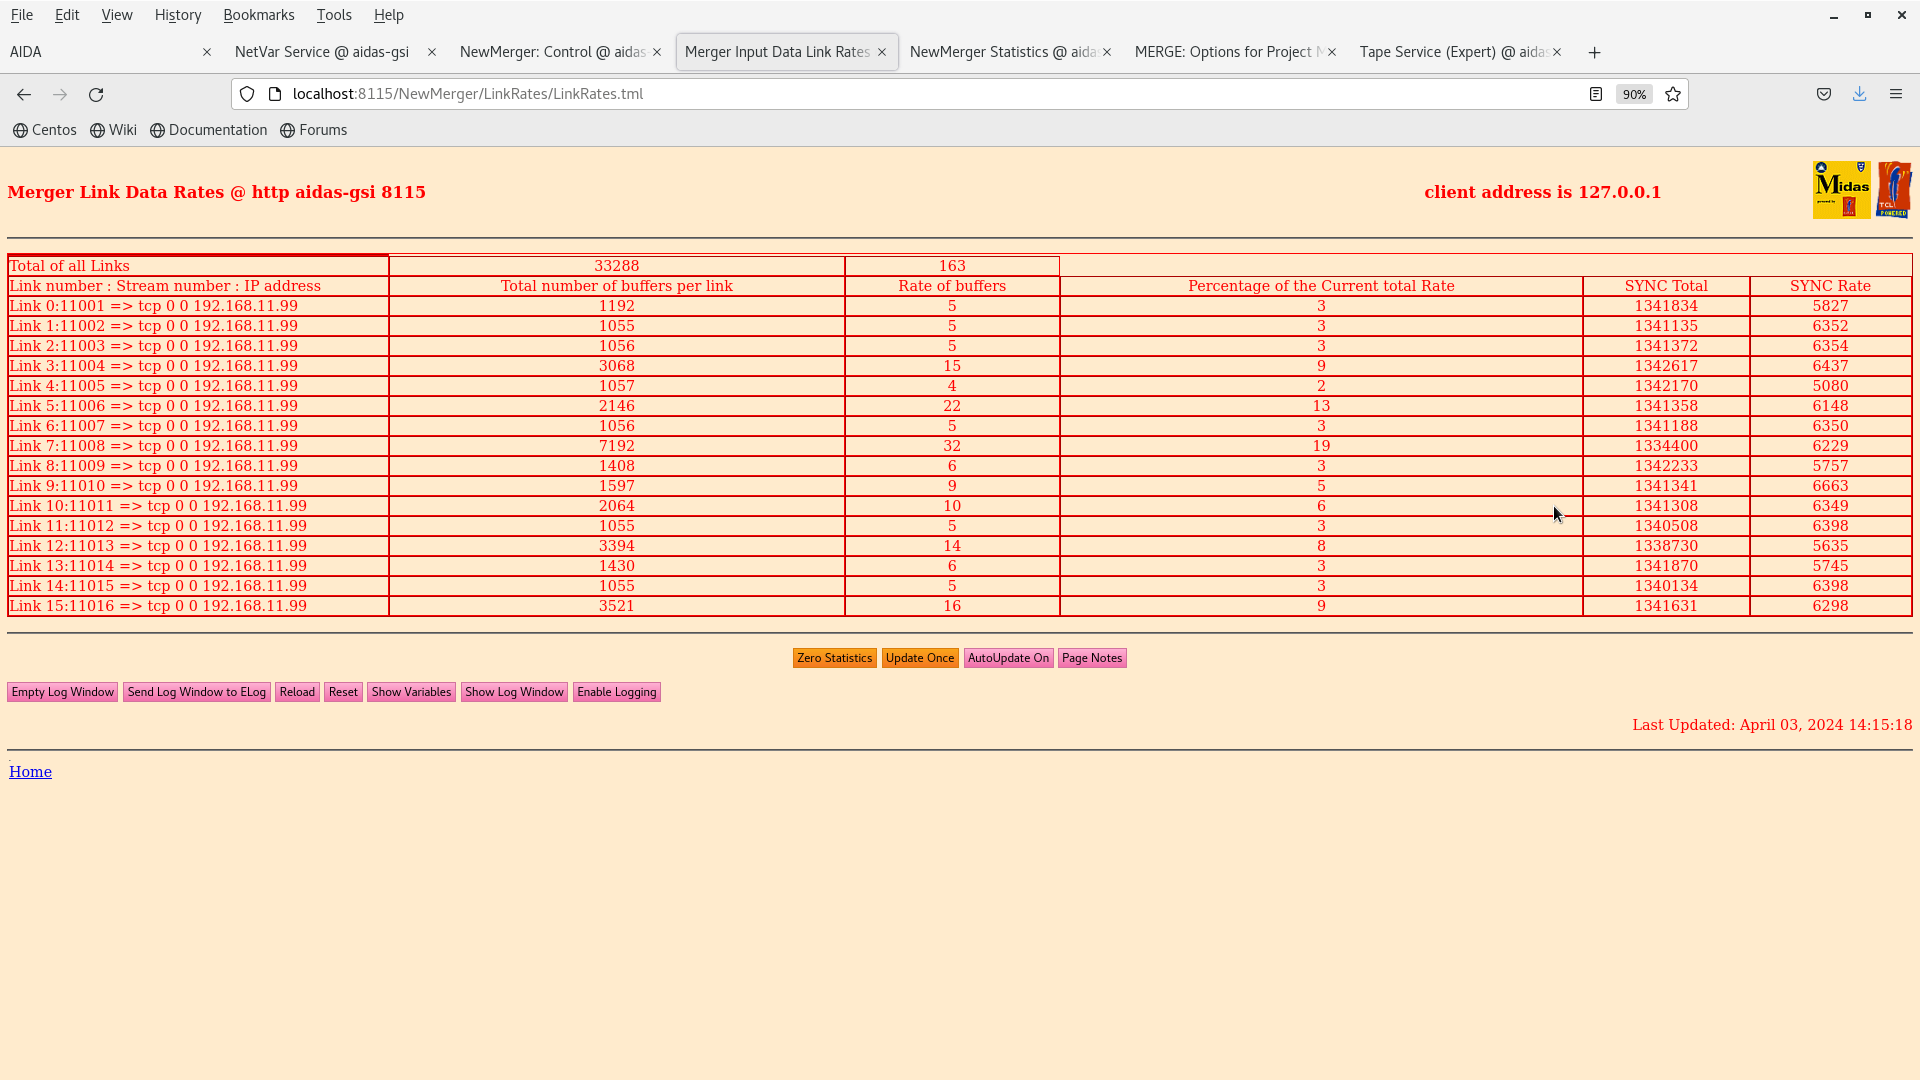
16 Links green and status going, all good?

Bias DSSSDs and turn data transfer on

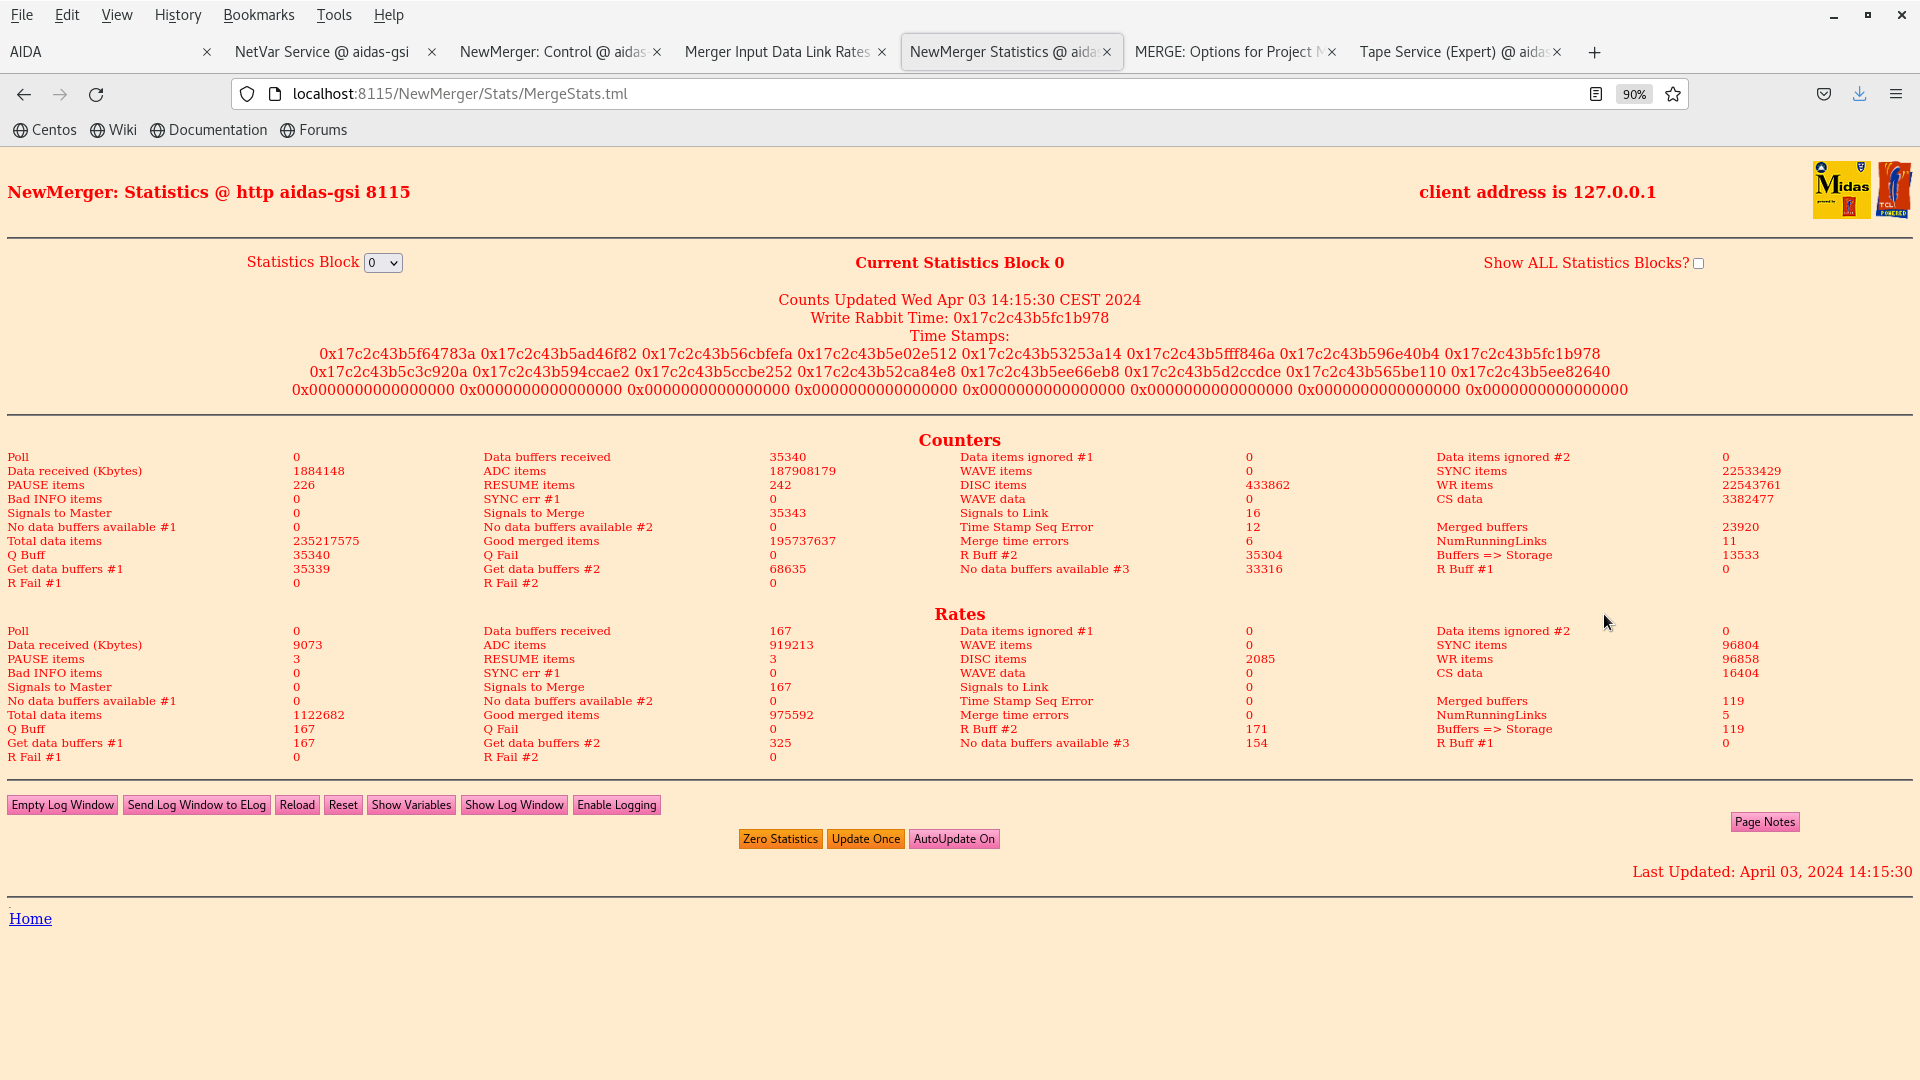
Merger connected, shows rate and updates... no rate in Tape Server?

.. Oops forget to turn on Output to data storage in merger!

Rate in tape server and to MBS: 7 MB/s

Merger, Tape and MBS working with 16 FEEs |
| Attachment 1: Screenshot_from_2024-04-03_14-15-02.png
|
|
| Attachment 2: Screenshot_from_2024-04-03_14-15-25.png
|
|
| Attachment 3: Screenshot_from_2024-04-03_14-15-36.png
|
|
| Attachment 4: Screenshot_from_2024-04-03_14-15-45.png
|
|
| Attachment 5: Screenshot_from_2024-04-03_14-15-52.png
|

|
|
76
|
Thu Oct 31 16:43:03 2019 |
NH CA TD | Merger & MBS Performance |
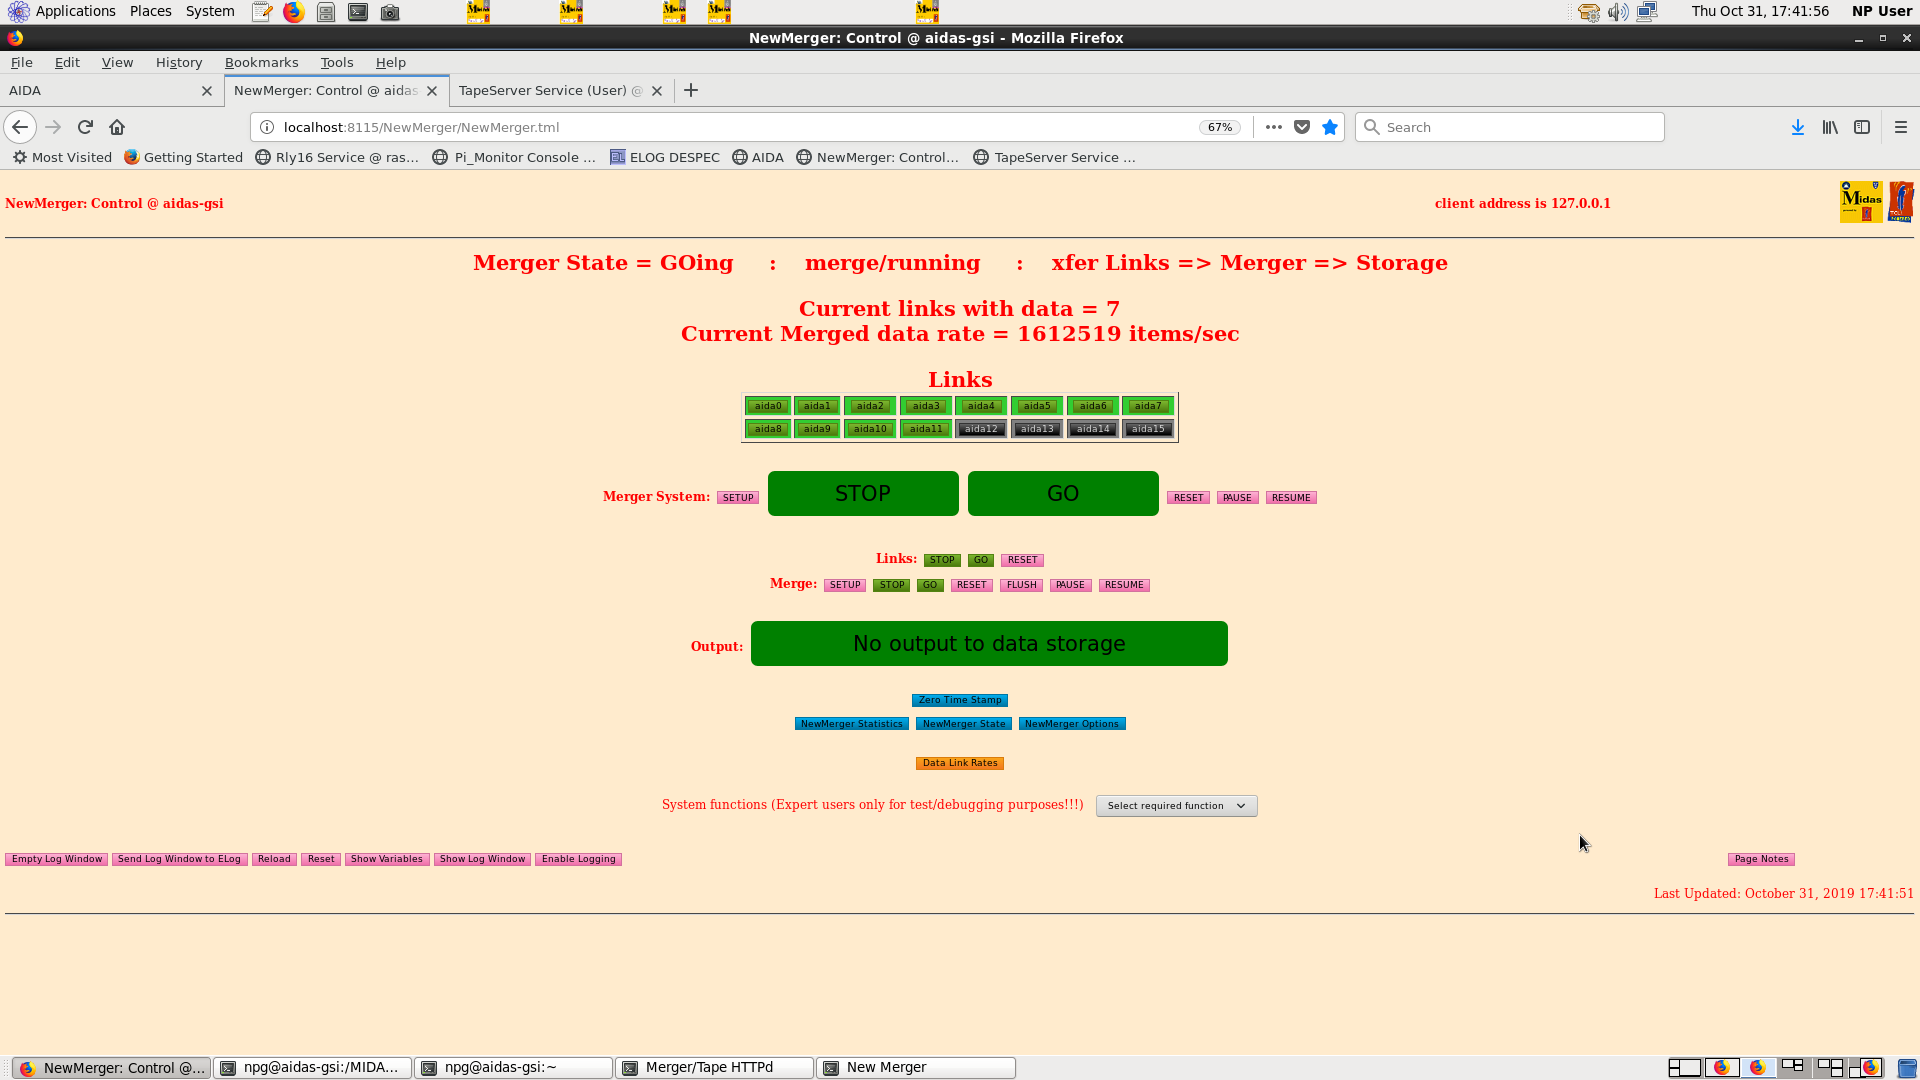
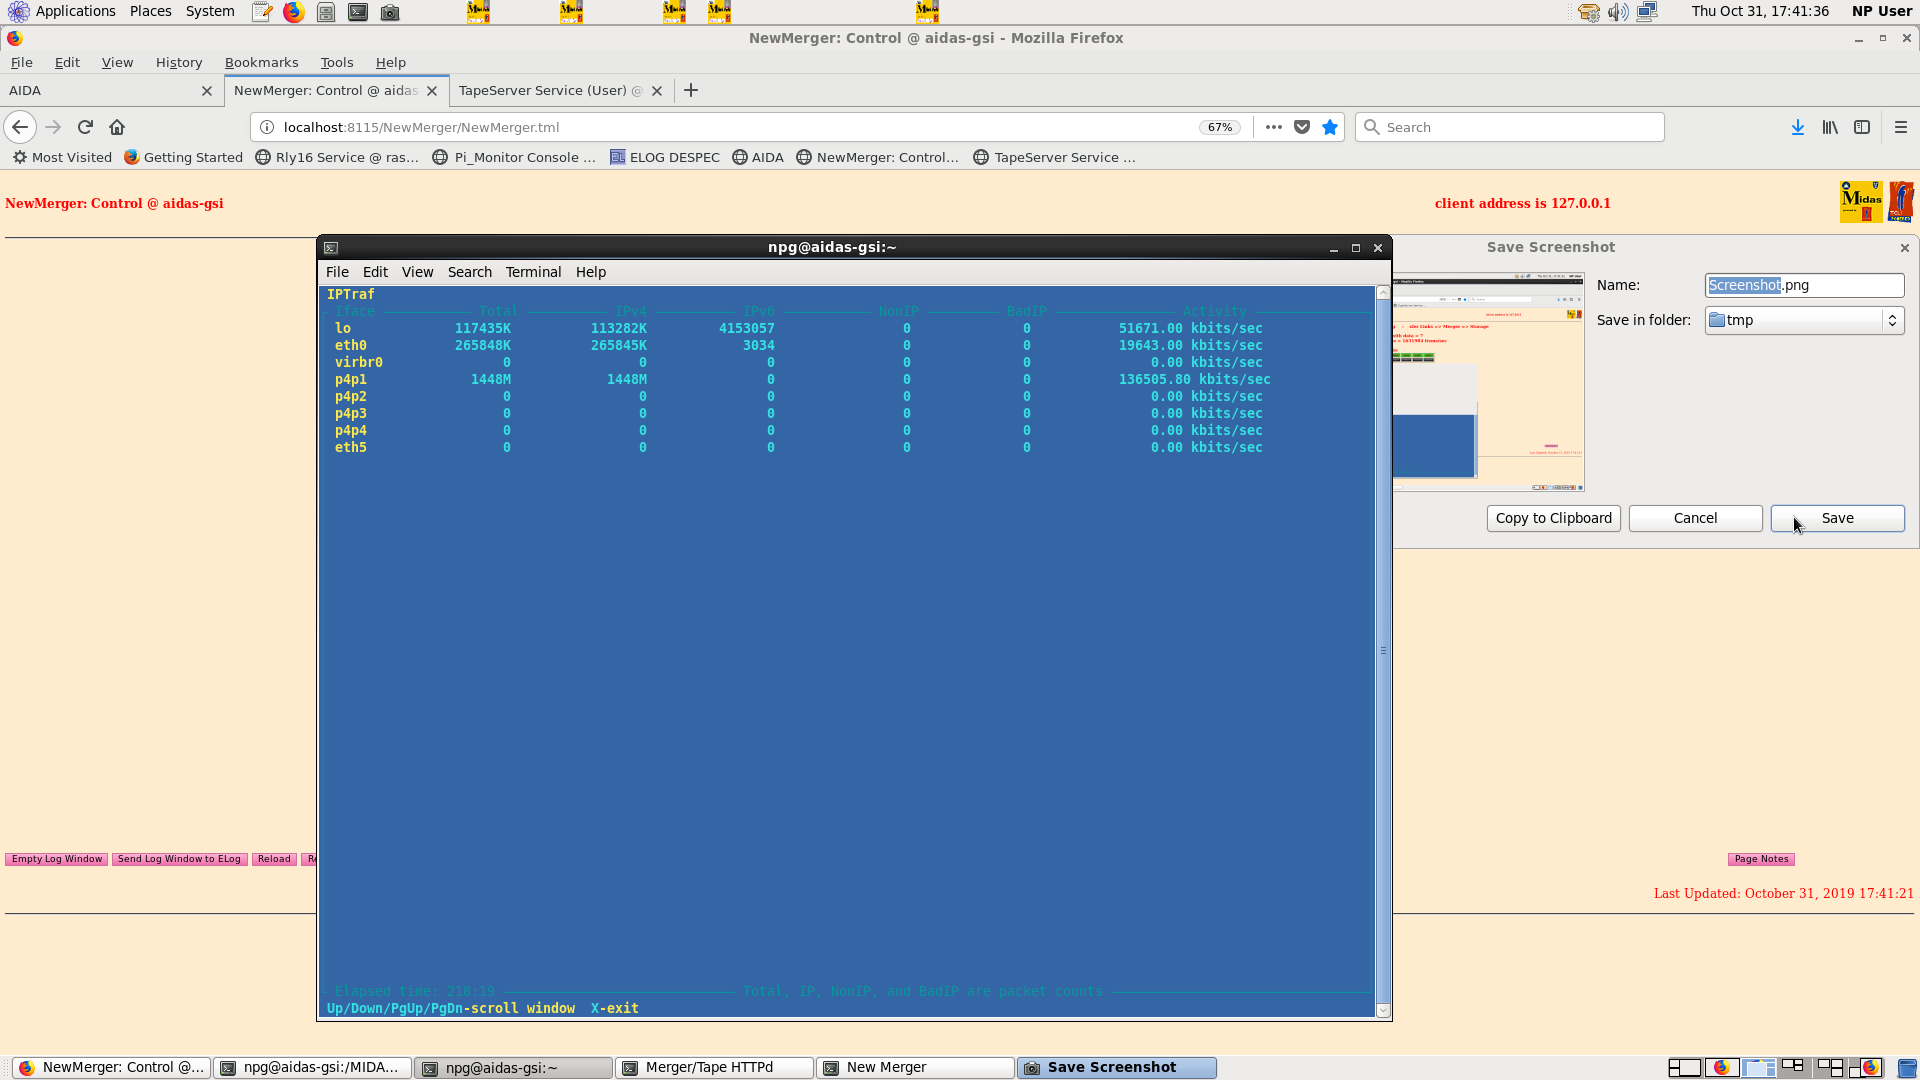
Testing merger with 3 DSSDs connected, with thresholds of 10 (slow comparator), 2 (HEC) and 255 (fast discriminator)

Merger handling rate of 1.6 million events per second comfortably. Forwarding to MBS fine.

Network usage: 130 Mbps (AIDA network) and 20 Mbps (MBS network) |
| Attachment 1: MergerStats.png
|
|
| Attachment 2: MBSRates.png
|

|
| Attachment 3: Mergernetworking.png
|
|
| Attachment 4: MergerStatistics.png
|

|
|
328
|
Wed May 19 09:06:58 2021 |
CA | May 16th 00:00 - 08:00 |
16th May 2021 - 00:00 - 08:00 Shift
Author: CA

00:15 System wide checks;

FEE64 module aida06 global clocks failed, 6
FEE64 module aida09 global clocks failed, 6
Clock status test result: Passed 14, Failed 2

Understand status as follows
Status bit 3 : firmware PLL that creates clocks from external clock not locked
Status bit 2 : always logic '1'
Status bit 1 : LMK3200(2) PLL and clock distribution chip not locked to external clock
Status bit 0 : LMK3200(1) PLL and clock distribution chip not locked to external clock
If all these bits are not set then the operation of the firmware is unreliable

FEE64 module aida09 failed
Calibration test result: Passed 15, Failed 1

If any modules fail calibration , check the clock status and open the FADC Align and Control browser page to rerun calibration for that module

		 Base 		Current 	Difference
aida05 fault 	 0x714c : 	 0x7154 : 	 8
White Rabbit error counter test result: Passed 15, Failed 1

Understand the status reports as follows:-
Status bit 3 : White Rabbit decoder detected an error in the received data
Status bit 2 : Firmware registered WR error, no reload of Timestamp
Status bit 0 : White Rabbit decoder reports uncertain of Timestamp information from WR

Base 		Current 		Difference
aida05 fault 	 0x0 : 	 0x3 : 	 3
aida12 fault 	 0x0 : 	 0x3 : 	 3
aida13 fault 	 0x0 : 	 0x4d : 	 77
FPGA Timestamp error counter test result: Passed 13, Failed 3
If any of these counts are reported as in error
The ASIC readout system has detected a timeslip.
That is the timestamp read from the time FIFO is not younger than the last

Returned 0 0 0 0 0 0 0 0 0 0 0 0 0 0 0 0
Mem(KB) :	4	8	16	32	64	128	256	512	1k	2k	4k
aida01 :     19     10      3      1      2      3      2      3      2      3      7   : 39660
aida02 :     29      5      3      1      1      3      2      3      2      3      7   : 39596
aida03 :     15      7      1      1      2      3      2      3      2      3      7   : 39588
aida04 :     44     26     19      5      2      4      3      3      2      2      7   : 38608
aida05 :     20     10      3      0      1      4      2      2      3      3      7   : 40208
aida06 :     27      6      2      1      2      4      2      4      2      3      7   : 40284
aida07 :     25      5      3      1      2      3      2      3      2      3      7   : 39644
aida08 :     23      8      2      3      1      4      2      3      2      3      7   : 39772
aida09 :     23     10      3      2      3      4      1      3      2      3      7   : 39644
aida10 :     18     10      3      2      3      2      2      2      2      4      7   : 41160
aida11 :     16      7      3      2      1      2      2      3      2      3      7   : 39464
aida12 :     21      4      7      1      3      3      3      3      2      3      7   : 40004
aida13 :     25      6      3      2      1      3      1      4      2      3      7   : 39876
aida14 :     20      8     10      1      1      2      2      2      2      4      7   : 41104
aida15 :     26      6      3      3      0      4      3      2      2      3      7   : 39464
aida16 :      9      8      2      4      1      3      1      4      2      3      7   : 39876

00:30 Stats ok - 210516_0030_stats.png
      Temps ok - 210516_0030_temps.png
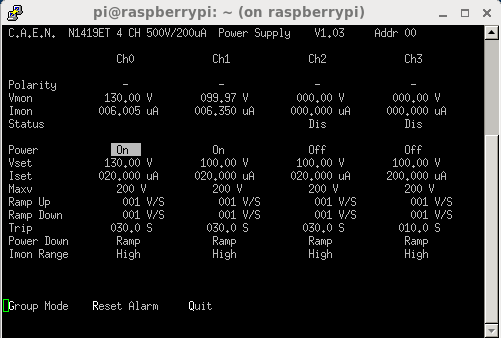
      Bias ok - 210516_0030_bias.png

00:38 analyzer output R7_178 - Deadtime at 7.3% - 210516_R7_178_analysis.txt

02:21 system wide checks as above, except;

      		 Base 		Current 	Difference
aida05 fault 	 0x714c : 	 0x7159 : 	 13
White Rabbit error counter test result: Passed 15, Failed 1

Understand the status reports as follows:-
Status bit 3 : White Rabbit decoder detected an error in the received data
Status bit 2 : Firmware registered WR error, no reload of Timestamp
Status bit 0 : White Rabbit decoder reports uncertain of Timestamp information from WR

			 Base 		Current 		Difference
aida05 fault 	 0x0 : 	 0x7 : 	 7
aida12 fault 	 0x0 : 	 0x3 : 	 3
aida13 fault 	 0x0 : 	 0x4d : 	 77
FPGA Timestamp error counter test result: Passed 13, Failed 3
If any of these counts are reported as in error
The ASIC readout system has detected a timeslip.
That is the timestamp read from the time FIFO is not younger than the last

02:28 Stats ok - 210516_0230_stats.png
      Temps ok - 210516_0230_temps.png
      Bias ok - 210516_0230_bias.png

02:33 analyzer output R7_216 - Deadtime at 6.5% - 210516_R7_216_analysis.txt

04:36 system wide checks same as above, except;

		 Base 		Current 	Difference
aida05 fault 	 0x714c : 	 0x715c : 	 16
White Rabbit error counter test result: Passed 15, Failed 1

Understand the status reports as follows:-
Status bit 3 : White Rabbit decoder detected an error in the received data
Status bit 2 : Firmware registered WR error, no reload of Timestamp
Status bit 0 : White Rabbit decoder reports uncertain of Timestamp information from WR

			 Base 		Current 		Difference
aida05 fault 	 0x0 : 	 0x9 : 	 9
aida12 fault 	 0x0 : 	 0x3 : 	 3
aida13 fault 	 0x0 : 	 0x4d : 	 77
FPGA Timestamp error counter test result: Passed 13, Failed 3
If any of these counts are reported as in error
The ASIC readout system has detected a timeslip.
That is the timestamp read from the time FIFO is not younger than the last

04:37 Stats ok - 210516_0430_stats.png
      Temps ok - 210516_0430_temps.png
      Bias ok - 210516_0430_bias.png

04:44 analyzer output R7_260 - Deadtime at 6.9% - 210516_R7_260_analysis.txt

06:38 system wide checks same as before, except;

		 Base 		Current 	Difference
aida01 fault 	 0xf294 : 	 0xf296 : 	 2
aida02 fault 	 0xd8ec : 	 0xd8ee : 	 2
aida03 fault 	 0xf001 : 	 0xf003 : 	 2
aida04 fault 	 0xd992 : 	 0xd994 : 	 2
aida05 fault 	 0x714c : 	 0x7161 : 	 21
aida06 fault 	 0x5a49 : 	 0x5a4a : 	 1
aida07 fault 	 0x5aca : 	 0x5acb : 	 1
aida08 fault 	 0xb92e : 	 0xb92f : 	 1
White Rabbit error counter test result: Passed 8, Failed 8

Understand the status reports as follows:-
Status bit 3 : White Rabbit decoder detected an error in the received data
Status bit 2 : Firmware registered WR error, no reload of Timestamp
Status bit 0 : White Rabbit decoder reports uncertain of Timestamp information from WR

06:40 Stats ok - 210516_0640_stats.png
      Temps ok - 210516_0640_temps.png
      Bias ok - 210516_0640_bias.png

06:45 analyzer output R7_298 - Deadtime at 5.8% - 210516_R7_298_analysis.txt |
| Attachment 1: 210516_0030_bias.png
|

|
| Attachment 2: 210516_0030_stats.png
|

|
| Attachment 3: 210516_0030_temps.png
|

|
| Attachment 4: 210516_0230_bias.png
|

|
| Attachment 5: 210516_0230_stats.png
|

|
| Attachment 6: 210516_0230_temps.png
|

|
| Attachment 7: 210516_0430_bias.png
|

|
| Attachment 8: 210516_0430_stats.png
|

|
| Attachment 9: 210516_0430_temps.png
|

|
| Attachment 10: 210516_0640_bias.png
|
|
| Attachment 11: 210516_0640_stats.png
|

|
| Attachment 12: 210516_0640_temps.png.png
|

|
| Attachment 13: analysis.txt
|
*** TDR format 3.3.0 analyser - TD - May 2021
*** ERROR: READ I/O error: 5002
blocks: 32000
ADC data format: 255660963 ( 1413413.6 Hz)
Other data format: 6259037 ( 34602.9 Hz)
Sample trace data format: 0 ( 0.0 Hz)
Undefined format: 0 ( 0.0 Hz)
Other data format type: PAUSE: 192 ( 1.1 Hz)
RESUME: 192 ( 1.1 Hz)
SYNC100: 32674 ( 180.6 Hz)
WR48-63: 32674 ( 180.6 Hz)
FEE64 disc: 0 ( 0.0 Hz)
MBS info: 6193305 ( 34239.5 Hz)
Other info: 0 ( 0.0 Hz)
ADC data range bit set: 287054 ( 1587.0 Hz)
Timewarps: ADC: 0 ( 0.0 Hz)
PAUSE: 0 ( 0.0 Hz)
RESUME: 0 ( 0.0 Hz)
SYNC100: 0 ( 0.0 Hz)
WR48-63: 0 ( 0.0 Hz)
FEE64 disc: 0 ( 0.0 Hz)
MBS info: 0 ( 0.0 Hz)
Undefined: 0 ( 0.0 Hz)
Sample trace: 0 ( 0.0 Hz)
*** Timestamp elapsed time: 180.882 s
FEE elapsed dead time(s) elapsed idle time(s)
0 0.117 0.000
1 8.836 0.000
2 1.027 0.000
3 5.545 0.000
4 0.000 5.604
5 0.873 0.000
6 0.370 0.000
7 0.861 0.000
8 0.767 0.000
9 0.000 63.434
10 13.201 0.000
11 3.930 0.000
12 0.813 0.000
13 0.000 30.131
14 0.448 0.000
15 1.895 0.000
16 0.000 0.000
17 0.000 0.000
18 0.000 0.000
19 0.000 0.000
20 0.000 0.000
21 0.000 0.000
22 0.000 0.000
23 0.000 0.000
24 0.000 0.000
25 0.000 0.000
26 0.000 0.000
27 0.000 0.000
28 0.000 0.000
29 0.000 0.000
30 0.000 0.000
31 0.000 0.000
32 0.000 0.000
*** Statistics
FEE ADC Data Other Data Sample Undefined Pause Resume SYNC100 WR48-63 Disc MBS Other HEC Data
0 9469697 3614 0 0 3 3 1264 1264 0 1080 0 15256
1 23268933 6078 0 0 41 41 2998 2998 0 0 0 31257
2 14135373 1756135 0 0 5 5 1968 1968 0 1752189 0 25654
3 26646926 1718468 0 0 28 28 3507 3507 0 1711398 0 36818
4 2828773 749772 0 0 0 0 426 426 0 748920 0 7104
5 14183721 453202 0 0 5 5 1830 1830 0 449532 0 20813
6 11921192 886700 0 0 5 5 1583 1583 0 883524 0 13410
7 19791515 651950 0 0 5 5 2639 2639 0 646662 0 25026
8 22244739 5464 0 0 4 4 2728 2728 0 0 0 32840
9 1601175 378 0 0 0 0 189 189 0 0 0 2522
10 41869813 10332 0 0 63 63 5103 5103 0 0 0 18083
11 18332381 4602 0 0 16 16 2285 2285 0 0 0 5732
12 14937821 3786 0 0 7 7 1886 1886 0 0 0 28026
13 2220427 536 0 0 0 0 268 268 0 0 0 2121
14 11574320 2908 0 0 3 3 1451 1451 0 0 0 17899
15 20634157 5112 0 0 7 7 2549 2549 0 0 0 4493
16 0 0 0 0 0 0 0 0 0 0 0 0
17 0 0 0 0 0 0 0 0 0 0 0 0
18 0 0 0 0 0 0 0 0 0 0 0 0
19 0 0 0 0 0 0 0 0 0 0 0 0
20 0 0 0 0 0 0 0 0 0 0 0 0
21 0 0 0 0 0 0 0 0 0 0 0 0
22 0 0 0 0 0 0 0 0 0 0 0 0
23 0 0 0 0 0 0 0 0 0 0 0 0
24 0 0 0 0 0 0 0 0 0 0 0 0
25 0 0 0 0 0 0 0 0 0 0 0 0
26 0 0 0 0 0 0 0 0 0 0 0 0
27 0 0 0 0 0 0 0 0 0 0 0 0
28 0 0 0 0 0 0 0 0 0 0 0 0
29 0 0 0 0 0 0 0 0 0 0 0 0
30 0 0 0 0 0 0 0 0 0 0 0 0
31 0 0 0 0 0 0 0 0 0 0 0 0
32 0 0 0 0 0 0 0 0 0 0 0 0
*** Timewarps
FEE ADC Pause Resume SYNC100 WR48-63 Disc MBS Undefined Samples
0 0 0 0 0 0 0 0 0 0
1 0 0 0 0 0 0 0 0 0
2 0 0 0 0 0 0 0 0 0
3 0 0 0 0 0 0 0 0 0
4 0 0 0 0 0 0 0 0 0
5 0 0 0 0 0 0 0 0 0
6 0 0 0 0 0 0 0 0 0
7 0 0 0 0 0 0 0 0 0
8 0 0 0 0 0 0 0 0 0
9 0 0 0 0 0 0 0 0 0
10 0 0 0 0 0 0 0 0 0
11 0 0 0 0 0 0 0 0 0
12 0 0 0 0 0 0 0 0 0
13 0 0 0 0 0 0 0 0 0
14 0 0 0 0 0 0 0 0 0
15 0 0 0 0 0 0 0 0 0
16 0 0 0 0 0 0 0 0 0
17 0 0 0 0 0 0 0 0 0
18 0 0 0 0 0 0 0 0 0
19 0 0 0 0 0 0 0 0 0
20 0 0 0 0 0 0 0 0 0
21 0 0 0 0 0 0 0 0 0
22 0 0 0 0 0 0 0 0 0
23 0 0 0 0 0 0 0 0 0
24 0 0 0 0 0 0 0 0 0
25 0 0 0 0 0 0 0 0 0
26 0 0 0 0 0 0 0 0 0
27 0 0 0 0 0 0 0 0 0
28 0 0 0 0 0 0 0 0 0
29 0 0 0 0 0 0 0 0 0
30 0 0 0 0 0 0 0 0 0
31 0 0 0 0 0 0 0 0 0
32 0 0 0 0 0 0 0 0 0
*** Program elapsed time: 47.672s ( 671.255 blocks/s, 41.953 Mb/s)
|
| Attachment 14: analysis.txt
|
*** TDR format 3.3.0 analyser - TD - May 2021
*** ERROR: READ I/O error: 5002
blocks: 32000
ADC data format: 255713262 ( 1398395.0 Hz)
Other data format: 6206738 ( 33942.2 Hz)
Sample trace data format: 0 ( 0.0 Hz)
Undefined format: 0 ( 0.0 Hz)
Other data format type: PAUSE: 185 ( 1.0 Hz)
RESUME: 185 ( 1.0 Hz)
SYNC100: 32681 ( 178.7 Hz)
WR48-63: 32681 ( 178.7 Hz)
FEE64 disc: 0 ( 0.0 Hz)
MBS info: 6141006 ( 33582.7 Hz)
Other info: 0 ( 0.0 Hz)
ADC data range bit set: 279005 ( 1525.8 Hz)
Timewarps: ADC: 0 ( 0.0 Hz)
PAUSE: 0 ( 0.0 Hz)
RESUME: 0 ( 0.0 Hz)
SYNC100: 0 ( 0.0 Hz)
WR48-63: 0 ( 0.0 Hz)
FEE64 disc: 0 ( 0.0 Hz)
MBS info: 0 ( 0.0 Hz)
Undefined: 0 ( 0.0 Hz)
Sample trace: 0 ( 0.0 Hz)
*** Timestamp elapsed time: 182.862 s
FEE elapsed dead time(s) elapsed idle time(s)
0 0.488 0.000
1 8.465 0.000
2 0.216 0.000
3 7.120 0.000
4 0.011 8.896
5 0.764 0.000
6 0.401 0.000
7 1.395 0.000
8 0.721 0.000
9 0.000 86.292
10 11.881 0.000
11 1.912 0.000
12 0.187 0.000
13 0.000 15.181
14 0.528 0.000
15 0.095 0.000
16 0.000 0.000
17 0.000 0.000
18 0.000 0.000
19 0.000 0.000
20 0.000 0.000
21 0.000 0.000
22 0.000 0.000
23 0.000 0.000
24 0.000 0.000
25 0.000 0.000
26 0.000 0.000
27 0.000 0.000
28 0.000 0.000
29 0.000 0.000
30 0.000 0.000
31 0.000 0.000
32 0.000 0.000
*** Statistics
FEE ADC Data Other Data Sample Undefined Pause Resume SYNC100 WR48-63 Disc MBS Other HEC Data
0 9424415 3624 0 0 2 2 1264 1264 0 1092 0 14964
1 23109905 5922 0 0 39 39 2922 2922 0 0 0 29876
2 14322958 1782809 0 0 3 3 2029 2029 0 1778745 0 25108
3 26234410 1716299 0 0 35 35 3458 3458 0 1709313 0 35100
4 2817740 734656 0 0 1 1 433 433 0 733788 0 6814
5 13978921 443934 0 0 4 4 1871 1871 0 440184 0 20242
6 11924553 862150 0 0 4 4 1621 1621 0 858900 0 13000
7 19324336 623898 0 0 11 11 2446 2446 0 618984 0 24043
8 21963572 5366 0 0 5 5 2678 2678 0 0 0 32304
9 1580877 372 0 0 0 0 186 186 0 0 0 2567
10 42874488 10618 0 0 59 59 5250 5250 0 0 0 17549
11 18504188 4566 0 0 14 14 2269 2269 0 0 0 5838
12 14580871 3684 0 0 2 2 1840 1840 0 0 0 27687
13 2240991 612 0 0 0 0 306 306 0 0 0 2138
14 11530867 2858 0 0 4 4 1425 1425 0 0 0 17152
15 21300170 5370 0 0 2 2 2683 2683 0 0 0 4623
16 0 0 0 0 0 0 0 0 0 0 0 0
17 0 0 0 0 0 0 0 0 0 0 0 0
18 0 0 0 0 0 0 0 0 0 0 0 0
19 0 0 0 0 0 0 0 0 0 0 0 0
20 0 0 0 0 0 0 0 0 0 0 0 0
21 0 0 0 0 0 0 0 0 0 0 0 0
22 0 0 0 0 0 0 0 0 0 0 0 0
23 0 0 0 0 0 0 0 0 0 0 0 0
24 0 0 0 0 0 0 0 0 0 0 0 0
25 0 0 0 0 0 0 0 0 0 0 0 0
26 0 0 0 0 0 0 0 0 0 0 0 0
27 0 0 0 0 0 0 0 0 0 0 0 0
28 0 0 0 0 0 0 0 0 0 0 0 0
29 0 0 0 0 0 0 0 0 0 0 0 0
30 0 0 0 0 0 0 0 0 0 0 0 0
31 0 0 0 0 0 0 0 0 0 0 0 0
32 0 0 0 0 0 0 0 0 0 0 0 0
*** Timewarps
FEE ADC Pause Resume SYNC100 WR48-63 Disc MBS Undefined Samples
0 0 0 0 0 0 0 0 0 0
1 0 0 0 0 0 0 0 0 0
2 0 0 0 0 0 0 0 0 0
3 0 0 0 0 0 0 0 0 0
4 0 0 0 0 0 0 0 0 0
5 0 0 0 0 0 0 0 0 0
6 0 0 0 0 0 0 0 0 0
7 0 0 0 0 0 0 0 0 0
8 0 0 0 0 0 0 0 0 0
9 0 0 0 0 0 0 0 0 0
10 0 0 0 0 0 0 0 0 0
11 0 0 0 0 0 0 0 0 0
12 0 0 0 0 0 0 0 0 0
13 0 0 0 0 0 0 0 0 0
14 0 0 0 0 0 0 0 0 0
15 0 0 0 0 0 0 0 0 0
16 0 0 0 0 0 0 0 0 0
17 0 0 0 0 0 0 0 0 0
18 0 0 0 0 0 0 0 0 0
19 0 0 0 0 0 0 0 0 0
20 0 0 0 0 0 0 0 0 0
21 0 0 0 0 0 0 0 0 0
22 0 0 0 0 0 0 0 0 0
23 0 0 0 0 0 0 0 0 0
24 0 0 0 0 0 0 0 0 0
25 0 0 0 0 0 0 0 0 0
26 0 0 0 0 0 0 0 0 0
27 0 0 0 0 0 0 0 0 0
28 0 0 0 0 0 0 0 0 0
29 0 0 0 0 0 0 0 0 0
30 0 0 0 0 0 0 0 0 0
31 0 0 0 0 0 0 0 0 0
32 0 0 0 0 0 0 0 0 0
*** Program elapsed time: 45.405s ( 704.764 blocks/s, 44.048 Mb/s)
|
| Attachment 15: analysis.txt
|
*** TDR format 3.3.0 analyser - TD - May 2021
*** ERROR: READ I/O error: 5002
blocks: 32000
ADC data format: 255591110 ( 1400708.0 Hz)
Other data format: 6328890 ( 34684.0 Hz)
Sample trace data format: 0 ( 0.0 Hz)
Undefined format: 0 ( 0.0 Hz)
Other data format type: PAUSE: 179 ( 1.0 Hz)
RESUME: 179 ( 1.0 Hz)
SYNC100: 32680 ( 179.1 Hz)
WR48-63: 32680 ( 179.1 Hz)
FEE64 disc: 0 ( 0.0 Hz)
MBS info: 6263172 ( 34323.9 Hz)
Other info: 0 ( 0.0 Hz)
ADC data range bit set: 288458 ( 1580.8 Hz)
Timewarps: ADC: 0 ( 0.0 Hz)
PAUSE: 0 ( 0.0 Hz)
RESUME: 0 ( 0.0 Hz)
SYNC100: 0 ( 0.0 Hz)
WR48-63: 0 ( 0.0 Hz)
FEE64 disc: 0 ( 0.0 Hz)
MBS info: 0 ( 0.0 Hz)
Undefined: 0 ( 0.0 Hz)
Sample trace: 0 ( 0.0 Hz)
*** Timestamp elapsed time: 182.473 s
FEE elapsed dead time(s) elapsed idle time(s)
0 0.000 0.000
1 7.649 0.000
2 0.265 0.000
3 5.929 0.000
4 0.000 21.293
5 1.614 0.000
6 0.390 0.000
7 0.004 0.000
8 1.749 0.000
9 0.000 75.748
10 12.608 0.000
11 1.662 0.000
12 0.334 0.000
13 0.000 39.700
14 0.092 0.000
15 1.009 0.000
16 0.000 0.000
17 0.000 0.000
18 0.000 0.000
19 0.000 0.000
20 0.000 0.000
21 0.000 0.000
22 0.000 0.000
23 0.000 0.000
24 0.000 0.000
25 0.000 0.000
26 0.000 0.000
27 0.000 0.000
28 0.000 0.000
29 0.000 0.000
30 0.000 0.000
31 0.000 0.000
32 0.000 0.000
*** Statistics
FEE ADC Data Other Data Sample Undefined Pause Resume SYNC100 WR48-63 Disc MBS Other HEC Data
0 9481493 3580 0 0 0 0 1244 1244 0 1092 0 15504
1 23234003 5924 0 0 42 42 2920 2920 0 0 0 30950
2 14360490 1787895 0 0 2 2 2026 2026 0 1783839 0 26238
3 26580599 1734745 0 0 32 32 3537 3537 0 1727607 0 36830
4 2867864 759325 0 0 0 0 449 449 0 758427 0 7075
5 13998560 454755 0 0 6 6 1806 1806 0 451131 0 20732
6 12019427 893028 0 0 3 3 1644 1644 0 889734 0 13550
7 19745451 656494 0 0 1 1 2575 2575 0 651342 0 25286
8 21649633 5478 0 0 7 7 2732 2732 0 0 0 32719
9 1602793 374 0 0 0 0 187 187 0 0 0 2586
10 42457575 10646 0 0 62 62 5261 5261 0 0 0 18276
11 18423606 4634 0 0 16 16 2301 2301 0 0 0 6050
12 14493303 3540 0 0 2 2 1768 1768 0 0 0 27878
13 2240564 512 0 0 0 0 256 256 0 0 0 2153
14 11446056 2794 0 0 2 2 1395 1395 0 0 0 17997
15 20989693 5166 0 0 4 4 2579 2579 0 0 0 4634
16 0 0 0 0 0 0 0 0 0 0 0 0
17 0 0 0 0 0 0 0 0 0 0 0 0
18 0 0 0 0 0 0 0 0 0 0 0 0
19 0 0 0 0 0 0 0 0 0 0 0 0
20 0 0 0 0 0 0 0 0 0 0 0 0
21 0 0 0 0 0 0 0 0 0 0 0 0
22 0 0 0 0 0 0 0 0 0 0 0 0
23 0 0 0 0 0 0 0 0 0 0 0 0
24 0 0 0 0 0 0 0 0 0 0 0 0
25 0 0 0 0 0 0 0 0 0 0 0 0
26 0 0 0 0 0 0 0 0 0 0 0 0
27 0 0 0 0 0 0 0 0 0 0 0 0
28 0 0 0 0 0 0 0 0 0 0 0 0
29 0 0 0 0 0 0 0 0 0 0 0 0
30 0 0 0 0 0 0 0 0 0 0 0 0
31 0 0 0 0 0 0 0 0 0 0 0 0
32 0 0 0 0 0 0 0 0 0 0 0 0
*** Timewarps
FEE ADC Pause Resume SYNC100 WR48-63 Disc MBS Undefined Samples
0 0 0 0 0 0 0 0 0 0
1 0 0 0 0 0 0 0 0 0
2 0 0 0 0 0 0 0 0 0
3 0 0 0 0 0 0 0 0 0
4 0 0 0 0 0 0 0 0 0
5 0 0 0 0 0 0 0 0 0
6 0 0 0 0 0 0 0 0 0
7 0 0 0 0 0 0 0 0 0
8 0 0 0 0 0 0 0 0 0
9 0 0 0 0 0 0 0 0 0
10 0 0 0 0 0 0 0 0 0
11 0 0 0 0 0 0 0 0 0
12 0 0 0 0 0 0 0 0 0
13 0 0 0 0 0 0 0 0 0
14 0 0 0 0 0 0 0 0 0
15 0 0 0 0 0 0 0 0 0
16 0 0 0 0 0 0 0 0 0
17 0 0 0 0 0 0 0 0 0
18 0 0 0 0 0 0 0 0 0
19 0 0 0 0 0 0 0 0 0
20 0 0 0 0 0 0 0 0 0
21 0 0 0 0 0 0 0 0 0
22 0 0 0 0 0 0 0 0 0
23 0 0 0 0 0 0 0 0 0
24 0 0 0 0 0 0 0 0 0
25 0 0 0 0 0 0 0 0 0
26 0 0 0 0 0 0 0 0 0
27 0 0 0 0 0 0 0 0 0
28 0 0 0 0 0 0 0 0 0
29 0 0 0 0 0 0 0 0 0
30 0 0 0 0 0 0 0 0 0
31 0 0 0 0 0 0 0 0 0
32 0 0 0 0 0 0 0 0 0
*** Program elapsed time: 52.041s ( 614.900 blocks/s, 38.431 Mb/s)
|
| Attachment 16: analysis.txt
|
*** TDR format 3.3.0 analyser - TD - May 2021
*** ERROR: READ I/O error: 5002
blocks: 32000
ADC data format: 254484788 ( 1267953.1 Hz)
Other data format: 7435212 ( 37045.4 Hz)
Sample trace data format: 0 ( 0.0 Hz)
Undefined format: 0 ( 0.0 Hz)
Other data format type: PAUSE: 166 ( 0.8 Hz)
RESUME: 166 ( 0.8 Hz)
SYNC100: 32747 ( 163.2 Hz)
WR48-63: 32747 ( 163.2 Hz)
FEE64 disc: 0 ( 0.0 Hz)
MBS info: 7369386 ( 36717.5 Hz)
Other info: 0 ( 0.0 Hz)
ADC data range bit set: 359272 ( 1790.0 Hz)
Timewarps: ADC: 0 ( 0.0 Hz)
PAUSE: 0 ( 0.0 Hz)
RESUME: 0 ( 0.0 Hz)
SYNC100: 0 ( 0.0 Hz)
WR48-63: 0 ( 0.0 Hz)
FEE64 disc: 0 ( 0.0 Hz)
MBS info: 0 ( 0.0 Hz)
Undefined: 0 ( 0.0 Hz)
Sample trace: 0 ( 0.0 Hz)
*** Timestamp elapsed time: 200.705 s
FEE elapsed dead time(s) elapsed idle time(s)
0 0.411 0.000
1 11.545 0.000
2 1.046 0.000
3 6.943 0.000
4 0.008 8.993
5 0.438 0.000
6 0.000 0.000
7 1.702 0.000
8 0.655 0.000
9 0.000 75.734
10 6.237 0.000
11 1.119 0.000
12 0.217 0.000
13 0.000 28.278
14 0.250 0.000
15 0.105 0.000
16 0.000 0.000
17 0.000 0.000
18 0.000 0.000
19 0.000 0.000
20 0.000 0.000
21 0.000 0.000
22 0.000 0.000
23 0.000 0.000
24 0.000 0.000
25 0.000 0.000
26 0.000 0.000
27 0.000 0.000
28 0.000 0.000
29 0.000 0.000
30 0.000 0.000
31 0.000 0.000
32 0.000 0.000
*** Statistics
FEE ADC Data Other Data Sample Undefined Pause Resume SYNC100 WR48-63 Disc MBS Other HEC Data
0 8401665 3348 0 0 2 2 1072 1072 0 1200 0 19564
1 26165949 6958 0 0 57 57 3422 3422 0 0 0 37826
2 13624578 2004081 0 0 4 4 1973 1973 0 2000127 0 32349
3 29939387 1947767 0 0 35 35 4004 4004 0 1939689 0 45332
4 3232848 946545 0 0 1 1 548 548 0 945447 0 8745
5 15270389 573894 0 0 6 6 1986 1986 0 569910 0 26107
6 10372112 1114231 0 0 0 0 1457 1457 0 1111317 0 17063
7 19130864 806574 0 0 8 8 2431 2431 0 801696 0 31336
8 24018310 5808 0 0 5 5 2899 2899 0 0 0 41117
9 1787485 418 0 0 0 0 209 209 0 0 0 3357
10 42125761 10654 0 0 29 29 5298 5298 0 0 0 22828
11 16187533 3960 0 0 11 11 1969 1969 0 0 0 7397
12 14311704 3490 0 0 1 1 1744 1744 0 0 0 35224
13 2388212 620 0 0 0 0 310 310 0 0 0 2664
14 9736084 2414 0 0 1 1 1206 1206 0 0 0 22553
15 17791907 4450 0 0 6 6 2219 2219 0 0 0 5810
16 0 0 0 0 0 0 0 0 0 0 0 0
17 0 0 0 0 0 0 0 0 0 0 0 0
18 0 0 0 0 0 0 0 0 0 0 0 0
19 0 0 0 0 0 0 0 0 0 0 0 0
20 0 0 0 0 0 0 0 0 0 0 0 0
21 0 0 0 0 0 0 0 0 0 0 0 0
22 0 0 0 0 0 0 0 0 0 0 0 0
23 0 0 0 0 0 0 0 0 0 0 0 0
24 0 0 0 0 0 0 0 0 0 0 0 0
25 0 0 0 0 0 0 0 0 0 0 0 0
26 0 0 0 0 0 0 0 0 0 0 0 0
27 0 0 0 0 0 0 0 0 0 0 0 0
28 0 0 0 0 0 0 0 0 0 0 0 0
29 0 0 0 0 0 0 0 0 0 0 0 0
30 0 0 0 0 0 0 0 0 0 0 0 0
31 0 0 0 0 0 0 0 0 0 0 0 0
32 0 0 0 0 0 0 0 0 0 0 0 0
*** Timewarps
FEE ADC Pause Resume SYNC100 WR48-63 Disc MBS Undefined Samples
0 0 0 0 0 0 0 0 0 0
1 0 0 0 0 0 0 0 0 0
2 0 0 0 0 0 0 0 0 0
3 0 0 0 0 0 0 0 0 0
4 0 0 0 0 0 0 0 0 0
5 0 0 0 0 0 0 0 0 0
6 0 0 0 0 0 0 0 0 0
7 0 0 0 0 0 0 0 0 0
8 0 0 0 0 0 0 0 0 0
9 0 0 0 0 0 0 0 0 0
10 0 0 0 0 0 0 0 0 0
11 0 0 0 0 0 0 0 0 0
12 0 0 0 0 0 0 0 0 0
13 0 0 0 0 0 0 0 0 0
14 0 0 0 0 0 0 0 0 0
15 0 0 0 0 0 0 0 0 0
16 0 0 0 0 0 0 0 0 0
17 0 0 0 0 0 0 0 0 0
18 0 0 0 0 0 0 0 0 0
19 0 0 0 0 0 0 0 0 0
20 0 0 0 0 0 0 0 0 0
21 0 0 0 0 0 0 0 0 0
22 0 0 0 0 0 0 0 0 0
23 0 0 0 0 0 0 0 0 0
24 0 0 0 0 0 0 0 0 0
25 0 0 0 0 0 0 0 0 0
26 0 0 0 0 0 0 0 0 0
27 0 0 0 0 0 0 0 0 0
28 0 0 0 0 0 0 0 0 0
29 0 0 0 0 0 0 0 0 0
30 0 0 0 0 0 0 0 0 0
31 0 0 0 0 0 0 0 0 0
32 0 0 0 0 0 0 0 0 0
*** Program elapsed time: 43.287s ( 739.250 blocks/s, 46.203 Mb/s)
|
|
329
|
Wed May 19 09:09:27 2021 |
MS, JS, OH | May 16 08:00-24:00 |
16th May 08:00 - 12:00 shift
Author: MS
08:00
FEE64 module aida09 global clocks failed, 6
Clock status test result: Passed 15, Failed 1
Understand status as follows
Status bit 3 : firmware PLL that creates clocks from external clock not locked
Status bit 2 : always logic '1'
Status bit 1 : LMK3200(2) PLL and clock distribution chip not locked to external clock
Status bit 0 : LMK3200(1) PLL and clock distribution chip not locked to external clock
If all these bits are not set then the operation of the firmware is unreliable
FEE64 module aida09 failed
Calibration test result: Passed 15, Failed 1
If any modules fail calibration , check the clock status and open the FADC Align and Control browser page to rerun calibration for that module
Base Current Difference
aida01 fault 0xf294 : 0xf296 : 2
aida02 fault 0xd8ec : 0xd8ee : 2
aida03 fault 0xf001 : 0xf003 : 2
aida04 fault 0xd992 : 0xd994 : 2
aida05 fault 0x714c : 0x7163 : 23
aida06 fault 0x5a49 : 0x5a4a : 1
aida07 fault 0x5aca : 0x5acb : 1
aida08 fault 0xb92e : 0xb92f : 1
White Rabbit error counter test result: Passed 8, Failed 8
Understand the status reports as follows:-
Status bit 3 : White Rabbit decoder detected an error in the received data
Status bit 2 : Firmware registered WR error, no reload of Timestamp
Status bit 0 : White Rabbit decoder reports uncertain of Timestamp information from WR
Base Current Difference
aida05 fault 0x0 : 0xa : 10
aida12 fault 0x0 : 0x3 : 3
aida13 fault 0x0 : 0x4d : 77
FPGA Timestamp error counter test result: Passed 13, Failed 3
If any of these counts are reported as in error
The ASIC readout system has detected a timeslip.
That is the timestamp read from the time FIFO is not younger than the last
Returned 0 0 0 0 0 0 0 0 0 0 0 0 0 0 0 0
Mem(KB) : 4 8 16 32 64 128 256 512 1k 2k 4k
aida01 : 27 7 2 3 2 3 2 4 2 3 7 : 40228
aida02 : 3 8 3 2 2 2 2 4 2 3 7 : 39996
aida03 : 23 9 6 1 0 3 2 4 2 3 7 : 40100
aida04 : 34 27 17 7 2 4 3 3 2 2 7 : 38608
aida05 : 19 9 5 2 2 2 3 3 2 3 7 : 39844
aida06 : 5 5 2 1 0 4 2 4 2 3 7 : 40060
aida07 : 28 2 10 3 2 4 1 4 2 3 7 : 40192
aida08 : 19 5 5 1 2 5 1 3 2 3 7 : 39652
aida09 : 20 8 3 3 1 3 2 3 2 3 7 : 39648
aida10 : 27 10 0 2 2 2 2 3 1 4 7 : 40572
aida11 : 3 3 2 1 2 4 2 3 2 3 7 : 39652
aida12 : 16 7 11 2 3 4 2 2 2 3 7 : 39464
aida13 : 14 10 4 3 1 5 2 2 2 3 7 : 39400
aida14 : 21 9 10 1 1 2 2 3 1 4 7 : 40604
aida15 : 19 8 2 3 0 4 3 2 2 3 7 : 39436
aida16 : 24 5 8 3 3 4 2 2 2 3 7 : 39464
*** Timestamp elapsed time: 225.065 s
FEE elapsed dead time(s) elapsed idle time(s)
0 0.038 0.000
1 9.479 0.000
2 0.195 0.000
3 5.921 0.000
4 0.000 11.742
5 0.036 0.000
6 0.013 0.000
7 0.498 0.000
8 0.436 0.000
9 0.000 107.300
10 2.787 0.000
11 0.905 0.000
12 0.831 0.000
13 0.000 55.939
14 0.080 0.000
15 0.267 0.000
16 0.000 0.000
17 0.000 0.000
18 0.000 0.000
19 0.000 0.000
20 0.000 0.000
21 0.000 0.000
22 0.000 0.000
23 0.000 0.000
24 0.000 0.000
25 0.000 0.000
26 0.000 0.000
27 0.000 0.000
28 0.000 0.000
29 0.000 0.000
30 0.000 0.000
31 0.000 0.000
32 0.000 0.000
10:00
FEE64 module aida06 global clocks failed, 6
FEE64 module aida09 global clocks failed, 6
Clock status test result: Passed 14, Failed 2
Understand status as follows
Status bit 3 : firmware PLL that creates clocks from external clock not locked
Status bit 2 : always logic '1'
Status bit 1 : LMK3200(2) PLL and clock distribution chip not locked to external clock
Status bit 0 : LMK3200(1) PLL and clock distribution chip not locked to external clock
If all these bits are not set then the operation of the firmware is unreliable
FEE64 module aida09 failed
Calibration test result: Passed 15, Failed 1
If any modules fail calibration , check the clock status and open the FADC Align and Control browser page to rerun calibration for that module
Base Current Difference
aida01 fault 0xf294 : 0xf296 : 2
aida02 fault 0xd8ec : 0xd8ee : 2
aida03 fault 0xf001 : 0xf003 : 2
aida04 fault 0xd992 : 0xd994 : 2
aida05 fault 0x714c : 0x7166 : 26
aida06 fault 0x5a49 : 0x5a4a : 1
aida07 fault 0x5aca : 0x5acb : 1
aida08 fault 0xb92e : 0xb92f : 1
White Rabbit error counter test result: Passed 8, Failed 8
Understand the status reports as follows:-
Status bit 3 : White Rabbit decoder detected an error in the received data
Status bit 2 : Firmware registered WR error, no reload of Timestamp
Status bit 0 : White Rabbit decoder reports uncertain of Timestamp information from WR
Base Current Difference
aida05 fault 0x0 : 0xa : 10
aida12 fault 0x0 : 0x3 : 3
aida13 fault 0x0 : 0x4d : 77
FPGA Timestamp error counter test result: Passed 13, Failed 3
If any of these counts are reported as in error
The ASIC readout system has detected a timeslip.
That is the timestamp read from the time FIFO is not younger than the last
Returned 0 0 0 0 0 0 0 0 0 0 0 0 0 0 0 0
Mem(KB) : 4 8 16 32 64 128 256 512 1k 2k 4k
aida01 : 19 7 6 2 2 3 2 3 2 3 7 : 39716
aida02 : 8 4 3 2 2 3 2 3 2 3 7 : 39600
aida03 : 23 11 5 1 0 4 2 3 1 4 7 : 40740
aida04 : 42 25 16 7 2 4 4 3 2 2 7 : 38864
aida05 : 24 5 5 1 2 2 3 3 1 4 7 : 40824
aida06 : 11 4 4 1 1 4 2 4 2 3 7 : 40172
aida07 : 21 8 5 1 2 3 2 4 2 3 7 : 40196
aida08 : 15 5 6 1 1 4 2 4 2 3 7 : 40228
aida09 : 15 10 4 1 2 3 2 3 2 3 7 : 39660
aida10 : 23 8 2 2 2 2 2 3 1 4 7 : 40572
aida11 : 6 4 4 2 2 4 2 3 2 3 7 : 39736
aida12 : 18 8 8 1 4 4 3 2 2 3 7 : 39720
aida13 : 23 6 2 3 2 5 2 2 2 3 7 : 39436
aida14 : 29 3 11 1 1 2 2 3 1 4 7 : 40604
aida15 : 29 7 2 2 0 4 3 3 2 3 7 : 39948
aida16 : 2 3 6 2 3 4 2 2 2 3 7 : 39296
*** Timestamp elapsed time: 225.065 s
FEE elapsed dead time(s) elapsed idle time(s)
0 0.038 0.000
1 9.479 0.000
2 0.195 0.000
3 5.921 0.000
4 0.000 11.742
5 0.036 0.000
6 0.013 0.000
7 0.498 0.000
8 0.436 0.000
9 0.000 107.300
10 2.787 0.000
11 0.905 0.000
12 0.831 0.000
13 0.000 55.939
14 0.080 0.000
15 0.267 0.000
16 0.000 0.000
17 0.000 0.000
18 0.000 0.000
19 0.000 0.000
20 0.000 0.000
21 0.000 0.000
22 0.000 0.000
23 0.000 0.000
24 0.000 0.000
25 0.000 0.000
26 0.000 0.000
27 0.000 0.000
28 0.000 0.000
29 0.000 0.000
30 0.000 0.000
31 0.000 0.000
32 0.000 0.000
12:00-16:00
16th May 12:00 - 16:00 shift
Author: JS
11:57 Taking over from Magda. Running full checks.
usbec ok. Max ~1700 Hz 1MHz on DSSD1, DSSD ~ 75%
Current ok 06.410 uA 006.835 uA
Stats good 1Statistics aidas-gsi(6).png
Temps ok 1Temperature and status scan aidas-gsi(6).png
Analysis ok R7_385. Dead time FEE1 a little hight 6%
PAUSE: 166 RESUME: 166
*** Timestamp elapsed time: 196.305 s
FEE elapsed dead time(s) elapsed idle time(s)
0 0.044 0.000
1 12.405 0.000
2 0.807 0.000
3 7.260 0.000
4 0.014 0.000
5 0.458 0.000
6 0.027 0.000
7 0.497 0.000
8 0.723 0.000
9 0.000 88.857
10 6.189 0.000
11 1.443 0.000
12 0.474 0.000
13 0.000 35.565
14 0.000 0.000
15 0.147 0.000
16 0.000 0.000
17 0.000 0.000
18 0.000 0.000
19 0.000 0.000
20 0.000 0.000
21 0.000 0.000
22 0.000 0.000
23 0.000 0.000
24 0.000 0.000
25 0.000 0.000
26 0.000 0.000
27 0.000 0.000
28 0.000 0.000
29 0.000 0.000
30 0.000 0.000
31 0.000 0.000
32 0.000 0.000
FEE64 module aida09 global clocks failed, 6
Clock status test result: Passed 15, Failed 1
FEE64 module aida09 failed
Calibration test result: Passed 15, Failed 1
Base Current Difference
aida01 fault 0xf294 : 0xf296 : 2
aida02 fault 0xd8ec : 0xd8ee : 2
aida03 fault 0xf001 : 0xf003 : 2
aida04 fault 0xd992 : 0xd994 : 2
aida05 fault 0x714c : 0x716e : 34
aida06 fault 0x5a49 : 0x5a4a : 1
aida07 fault 0x5aca : 0x5acb : 1
aida08 fault 0xb92e : 0xb92f : 1
White Rabbit error counter test result: Passed 8, Failed 8
Base Current Difference
aida05 fault 0x0 : 0xa : 10
aida12 fault 0x0 : 0x3 : 3
aida13 fault 0x0 : 0x4d : 77
FPGA Timestamp error counter test result: Passed 13, Failed 3
Returned 0 0 0 0 0 0 0 0 0 0 0 0 0 0 0 0
Mem(KB) : 4 8 16 32 64 128 256 512 1k 2k 4k
aida01 : 20 7 4 2 2 3 2 3 1 4 7 : 40712
aida02 : 25 10 7 1 1 4 1 3 2 3 7 : 39556
aida03 : 22 10 5 1 0 4 2 4 2 3 7 : 40216
aida04 : 40 24 17 7 2 5 3 3 2 2 7 : 38736
aida05 : 4 8 3 0 1 3 3 3 1 4 7 : 40768
aida06 : 21 6 6 2 2 3 2 4 2 3 7 : 40228
aida07 : 25 4 6 3 2 3 2 4 2 3 7 : 40260
aida08 : 19 9 4 1 1 4 2 4 2 3 7 : 40244
aida09 : 16 9 4 2 2 3 2 3 2 3 7 : 39688
aida10 : 19 10 5 1 2 2 2 4 1 4 7 : 41100
aida11 : 21 10 2 1 2 3 3 3 2 3 7 : 39908
aida12 : 25 7 7 2 2 3 2 3 2 3 7 : 39756
aida13 : 13 7 3 4 2 5 2 3 2 3 7 : 39964
aida14 : 21 7 9 2 1 2 2 4 1 4 7 : 41116
aida15 : 23 6 2 3 0 4 3 3 2 3 7 : 39948
aida16 : 9 11 10 2 3 4 2 2 2 3 7 : 39452
Tom says Aida09 clock fail is ok as its status bit is "6".
The large white difference for FEE5 is known and has been determined to be ok, a post run investigation will be undertaken.
12:35 -
usbec ok.
Current ok
Stats good
Temps ok
Analysis ok R7_395. Dead time FEE1 still high 6.6%
13:33 -
usbec ok. Max implants ~ 1.8kHz
Current ok 006.850 uA 007.250 uA
Stats - Aida11 runing low < 5k was ~20k overnight
Temps ok
Analysis R7_415. Dead time FEE1 & FEE10 high 10%
14:00
usbec ok - ucesb1.png
Current ok - bias1.png
Stast - Aida11 low -
14:20 aida fee rebooted itself. A powercycle was performed. Upon reboot we are seeing extremely large amounts of noise in the FEEs. Looking at the waveforms we have very large 100kHz pick up in the FEEs. This has resulted in 50% deadtime in many FEEs including the p+n.
15:28 Because of extremely high rates across all FEEs have decided to do a powercycle. Before restarting the FEEs will give them a couple of minutes to cool.
18:00 Since the start of the shift we have been trying to recover the system froma large increase in noise following the crash at ~14:00.
During this time NH has entered the area and inspected the system and also grounded the AIDA snout. This provided us with some improvement on the noise.
The rates are still slightly above where we were before the crash but now appear stable. To counteract the dead time in the n+n strips we have raised the threshold to 0x64 for ASIC4 in all FEEs.
We are now running with around 10% deadtime on FEE4 and less elsewhere for n+n. For p+n most have zero dead time apart from FEE11 which is still noisy.
During the time we were trying to recover the system screenshots were taken of the waveforms. He it could be seen that the 100kHz noise was very apparent. Particularly in the n+n strips.
18:08 System wide checks all ok - bar some ADC but waveforms disabled
Statistics ok - 210516_1809_Stats
Temperatures ok - 210516_1809_Temp
Bias and leakage ok - 210516_1810_Bias
18:37 Performed an ASIC check and now the rates have dropped in all n+n strips. Currently very small amounts of dead time
18:40 Realised this was because it raised the threshold of all strips to 0x64 on the n+n side.
19:25 Removed S452 from 1e2.... drive. Before removing checked with Nic backed up to Lustre. Also verified four ourselves.
Now have around 4.2TB left which will provide around 80 hours of writing
20:16 We noticed iptraf was using around 30% CPU usage. We investigated whether it had any effect on the dead time but from what we have seen it has not.
20:57 System wide checks. Clock ok
Base Current Difference
aida05 fault 0x1552 : 0x1556 : 4
White Rabbit error counter test result: Passed 15, Failed 1
Understand the status reports as follows:-
Status bit 3 : White Rabbit decoder detected an error in the received data
Status bit 2 : Firmware registered WR error, no reload of Timestamp
Status bit 0 : White Rabbit decoder reports uncertain of Timestamp information from WR
Base Current Difference
aida05 fault 0x0 : 0x1 : 1
FPGA Timestamp error counter test result: Passed 15, Failed 1
If any of these counts are reported as in error
The ASIC readout system has detected a timeslip.
That is the timestamp read from the time FIFO is not younger than the last
Statistics ok - 210516_2056_Stats
Temp ok - 210516_2058_Temp
Bias and leakage current ok - 210516_2058_Bias
23:16 System wide checks:
Clock still ok
Base Current Difference
aida05 fault 0x1552 : 0x155a : 8
White Rabbit error counter test result: Passed 15, Failed 1
Understand the status reports as follows:-
Status bit 3 : White Rabbit decoder detected an error in the received data
Status bit 2 : Firmware registered WR error, no reload of Timestamp
Status bit 0 : White Rabbit decoder reports uncertain of Timestamp information from WR
Base Current Difference
aida05 fault 0x0 : 0x2 : 2
FPGA Timestamp error counter test result: Passed 15, Failed 1
If any of these counts are reported as in error
The ASIC readout system has detected a timeslip.
That is the timestamp read from the time FIFO is not younger than the last
Statistics - 210516_2315_Stats
Temperature - 210516_2316_Temp
Bias and leakage current ok - 210516_231 |
| Attachment 1: Screenshot_2021-05-16_Statistics_aidas-gsi(4).png
|
.png.png)
|
| Attachment 2: Screenshot_2021-05-16_Statistics_aidas-gsi(5).png
|
.png.png)
|
| Attachment 3: Screenshot_2021-05-16_Temperature_and_status_scan_aidas-gsi(4).png
|
.png.png)
|
| Attachment 4: Screenshot_2021-05-16_Temperature_and_status_scan_aidas-gsi(5).png
|
.png.png)
|
| Attachment 5: 1Statistics_aidas-gsi(6).png
|
.png.png)
|
| Attachment 6: 1Temperature_and_status_scan_aidas-gsi(6).png
|
.png.png)
|
| Attachment 7: Bias1.png
|
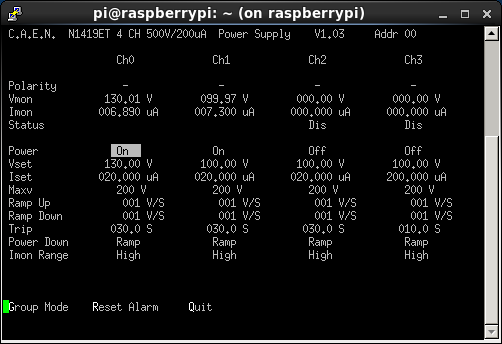
|
| Attachment 8: 210516_0857_Temp.png
|

|
| Attachment 9: 210516_1554_Layout8.png
|
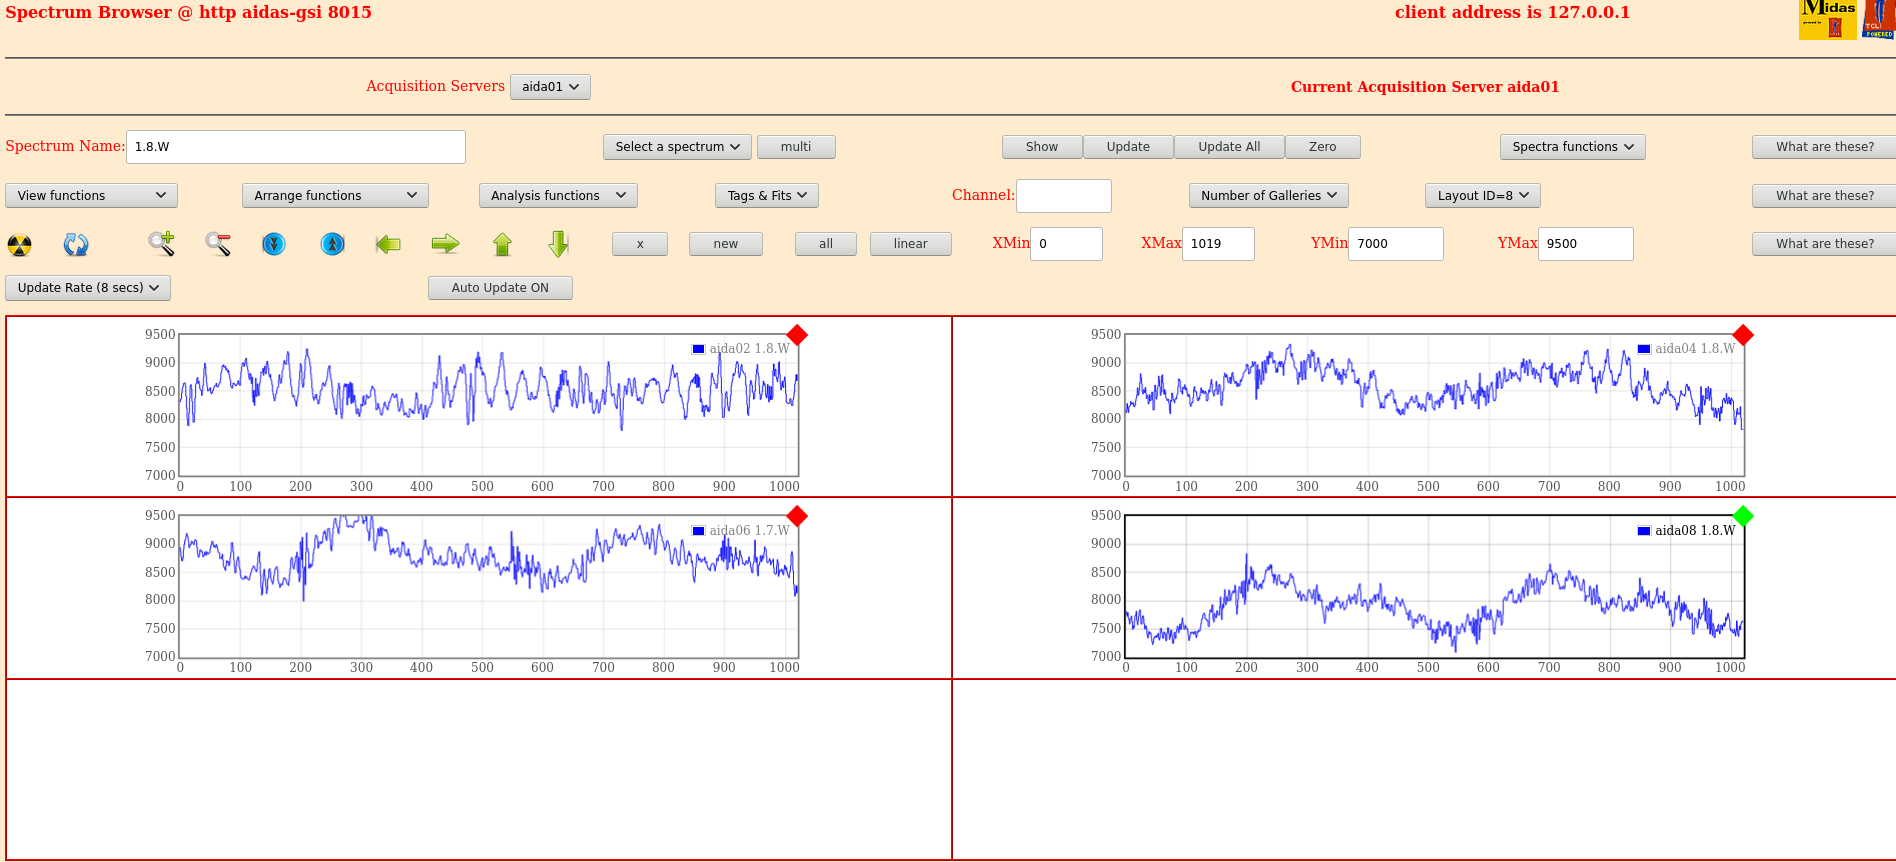
|
| Attachment 10: 210516_1555_Layout7.png
|
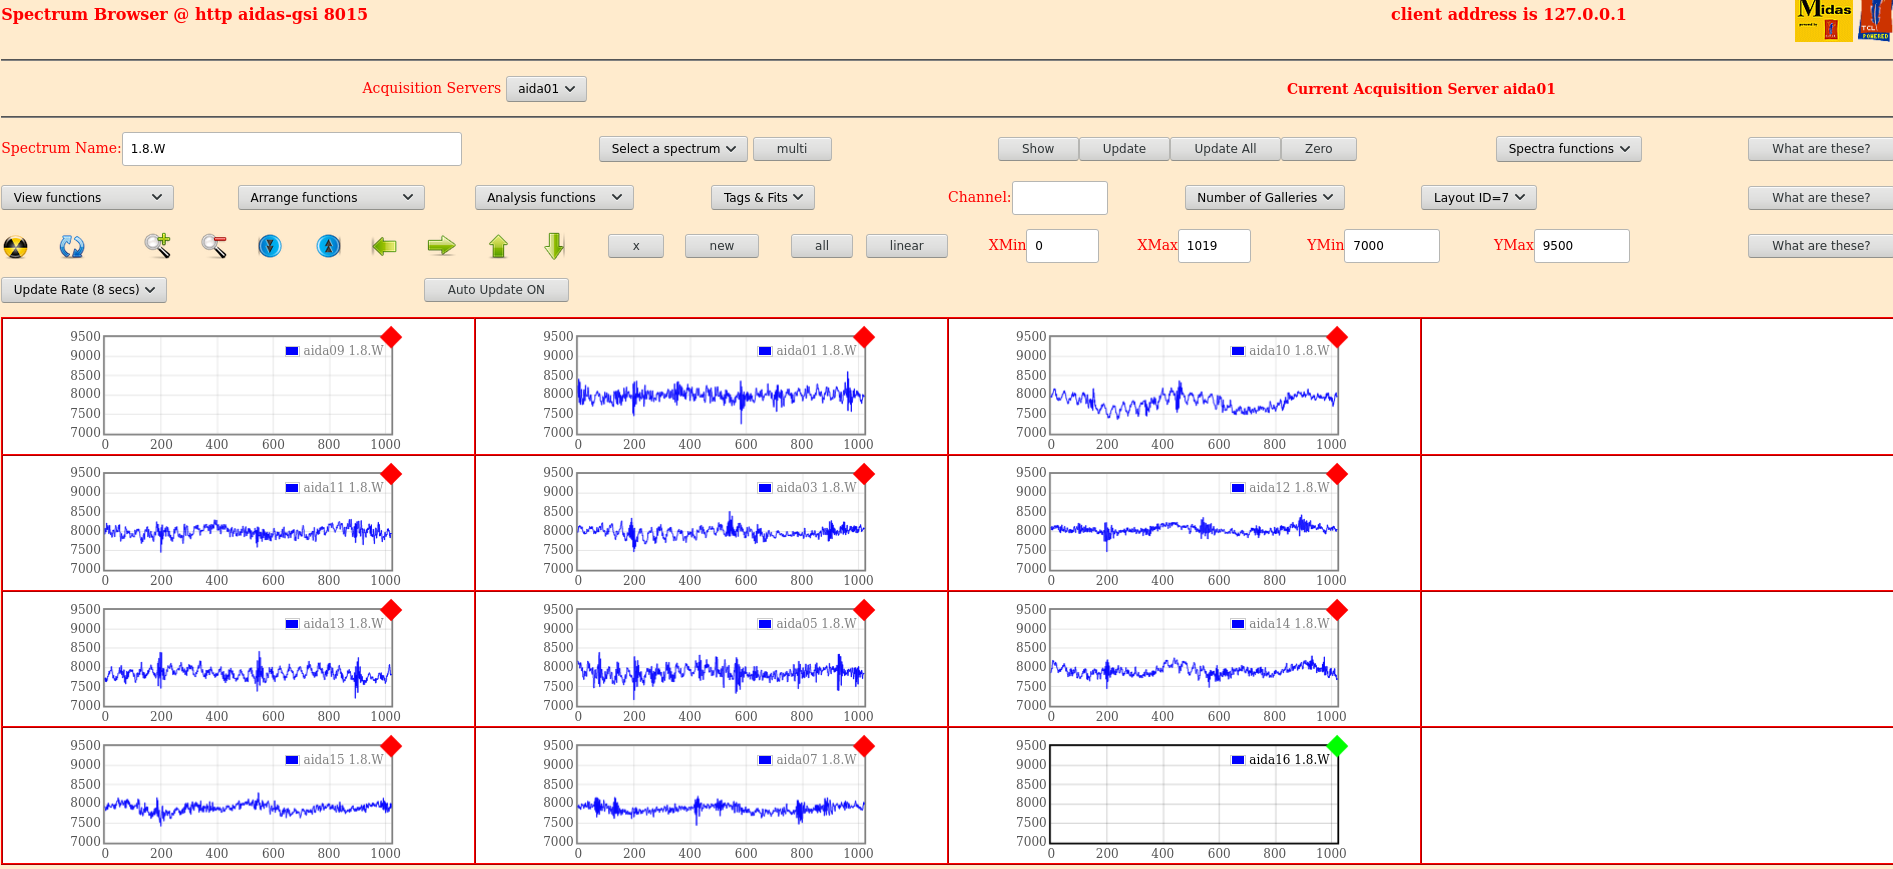
|
| Attachment 11: 210516_1600_Layout1.png
|

|
| Attachment 12: 210516_1601_Stats.png
|

|
| Attachment 13: 210516_1605_1606.png
|

|
| Attachment 14: 210516_1808_Stats.png
|

|
| Attachment 15: 210516_1809_Temp.png
|

|
| Attachment 16: 210516_1810_Bias.png
|
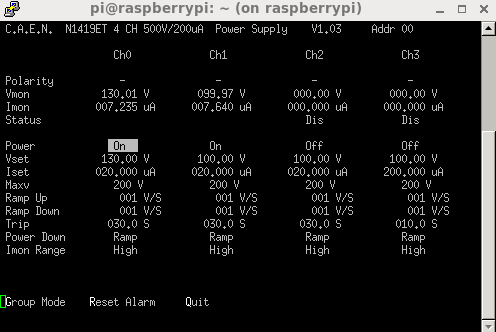
|
| Attachment 17: 210516_2056_Stats.png
|

|
| Attachment 18: 210516_2058_Bias.png
|
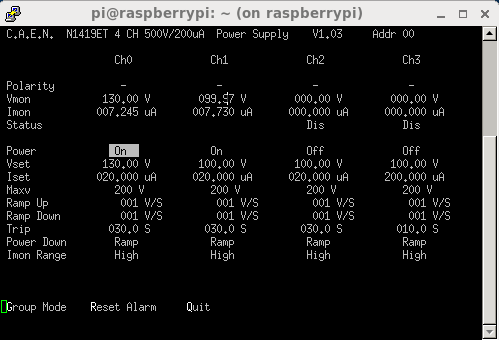
|
| Attachment 19: 210516_2313_Stats.png
|

|
| Attachment 20: 210516_2315_Temp.png
|

|
| Attachment 21: 210516_2316_Bias.png
|
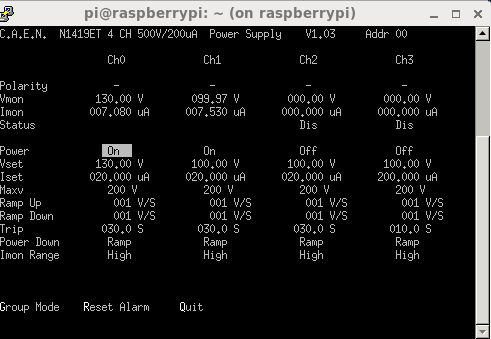
|
|
311
|
Thu May 13 07:10:17 2021 |
CA, TD | May 13th 08:00 - 16:00 shift |
08:10 all system wide checks ok *except*

      all FEE64 modules fail ADC calibration

      WR decoder status:

      Base 		Current 	Difference
aida01 fault 	 0xf932 : 	 0xf933 : 	 1
aida02 fault 	 0x62ec : 	 0x62ed : 	 1
aida03 fault 	 0x8679 : 	 0x867a : 	 1
aida04 fault 	 0xf0e4 : 	 0xf0e5 : 	 1
aida05 fault 	 0x9db8 : 	 0x9db9 : 	 1
aida06 fault 	 0x7f18 : 	 0x7f19 : 	 1
aida07 fault 	 0xdd2c : 	 0xdd2d : 	 1
aida08 fault 	 0x1557 : 	 0x1558 : 	 1
White Rabbit error counter test result: Passed 8, Failed 8

Understand the status reports as follows:-
Status bit 3 : White Rabbit decoder detected an error in the received data
Status bit 2 : Firmware registered WR error, no reload of Timestamp
Status bit 0 : White Rabbit decoder reports uncertain of Timestamp information from WR

08:16 attempt to recalibrate ADCs using FADC align and control - unsuccessful on all

08:18 FEE64 temps ok - attachment 1

      bias/leakage currents ok - attachment 2

      statistics - attachments 3-8

10:13 all system wide checks ok *except*

      all FEE64 modules fail ADC calibration

      WR decoder status:

		 Base 		Current 	Difference
aida01 fault 	 0xf932 : 	 0xf933 : 	 1
aida02 fault 	 0x62ec : 	 0x62ed : 	 1
aida03 fault 	 0x8679 : 	 0x867a : 	 1
aida04 fault 	 0xf0e4 : 	 0xf0e5 : 	 1
aida05 fault 	 0x9db8 : 	 0x9db9 : 	 1
aida06 fault 	 0x7f18 : 	 0x7f19 : 	 1
aida07 fault 	 0xdd2c : 	 0xdd2d : 	 1
aida08 fault 	 0x1557 : 	 0x1558 : 	 1
White Rabbit error counter test result: Passed 8, Failed 8

Understand the status reports as follows:-
Status bit 3 : White Rabbit decoder detected an error in the received data
Status bit 2 : Firmware registered WR error, no reload of Timestamp
Status bit 0 : White Rabbit decoder reports uncertain of Timestamp information from WR

10:16 FEE64 temps ok - attachment 9

      bias/leakage currents ok - attachment 10

      statistics - attachments 11-16

12:16 all system wide checks ok *except*

      all FEE64 modules fail ADC calibration

      WR decoder status:

		 Base 		Current 	Difference
aida01 fault 	 0xf932 : 	 0xf933 : 	 1
aida02 fault 	 0x62ec : 	 0x62ed : 	 1
aida03 fault 	 0x8679 : 	 0x867a : 	 1
aida04 fault 	 0xf0e4 : 	 0xf0e5 : 	 1
aida05 fault 	 0x9db8 : 	 0x9dba : 	 2
aida06 fault 	 0x7f18 : 	 0x7f19 : 	 1
aida07 fault 	 0xdd2c : 	 0xdd2d : 	 1
aida08 fault 	 0x1557 : 	 0x1558 : 	 1
White Rabbit error counter test result: Passed 8, Failed 8

Understand the status reports as follows:-
Status bit 3 : White Rabbit decoder detected an error in the received data
Status bit 2 : Firmware registered WR error, no reload of Timestamp
Status bit 0 : White Rabbit decoder reports uncertain of Timestamp information from WR

12:16 FEE64 temps ok - attachment 17

      bias/leakage currents ok - attachment 18

      statistics - attachments 19-25

14:08 all system wide checks ok *except*

      all FEE64 modules fail ADC calibration

      WR decoder status:

		 Base 		Current 	Difference
aida01 fault 	 0xf932 : 	 0xf933 : 	 1
aida02 fault 	 0x62ec : 	 0x62ed : 	 1
aida03 fault 	 0x8679 : 	 0x867a : 	 1
aida04 fault 	 0xf0e4 : 	 0xf0e5 : 	 1
aida05 fault 	 0x9db8 : 	 0x9dba : 	 2
aida06 fault 	 0x7f18 : 	 0x7f19 : 	 1
aida07 fault 	 0xdd2c : 	 0xdd2d : 	 1
aida08 fault 	 0x1557 : 	 0x1558 : 	 1
White Rabbit error counter test result: Passed 8, Failed 8

Understand the status reports as follows:-
Status bit 3 : White Rabbit decoder detected an error in the received data
Status bit 2 : Firmware registered WR error, no reload of Timestamp
Status bit 0 : White Rabbit decoder reports uncertain of Timestamp information from WR

FEE64 temps ok - attachment 16

      bias/leakage currents ok - attachment 27

statistics - attachments 28-35 |
| Attachment 1: Screenshot_from_2021-05-13_07-17-47.png
|

|
| Attachment 2: Screenshot_from_2021-05-13_07-18-57.png
|

|
| Attachment 3: Screenshot_from_2021-05-13_07-19-42.png
|

|
| Attachment 4: Screenshot_from_2021-05-13_07-20-45.png
|

|
| Attachment 5: Screenshot_from_2021-05-13_07-23-01.png
|

|
| Attachment 6: Screenshot_from_2021-05-13_07-23-35.png
|

|
| Attachment 7: Screenshot_from_2021-05-13_07-24-02.png
|

|
| Attachment 8: Screenshot_from_2021-05-13_07-25-15.png
|

|
| Attachment 9: Screenshot_from_2021-05-13_09-17-57.png
|

|
| Attachment 10: Screenshot_from_2021-05-13_09-18-21.png
|
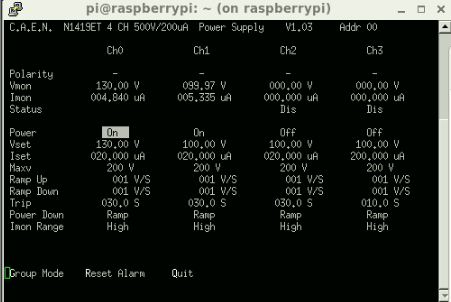
|
| Attachment 11: Screenshot_from_2021-05-13_09-18-58.png
|

|
| Attachment 12: Screenshot_from_2021-05-13_09-19-32.png
|

|
| Attachment 13: Screenshot_from_2021-05-13_09-20-23.png
|

|
| Attachment 14: Screenshot_from_2021-05-13_09-21-05.png
|

|
| Attachment 15: Screenshot_from_2021-05-13_09-21-53.png
|

|
| Attachment 16: Screenshot_from_2021-05-13_09-22-18.png
|

|
| Attachment 17: Screenshot_from_2021-05-13_11-19-16.png
|

|
| Attachment 18: Screenshot_from_2021-05-13_11-19-30.png
|
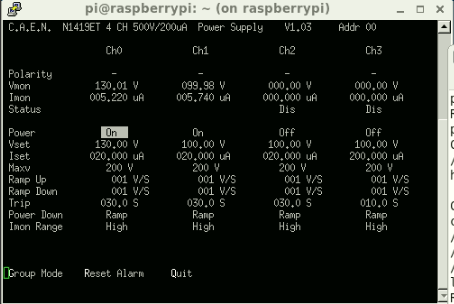
|
| Attachment 19: Screenshot_from_2021-05-13_11-20-09.png
|

|
| Attachment 20: Screenshot_from_2021-05-13_11-20-33.png
|

|
| Attachment 21: Screenshot_from_2021-05-13_11-20-59.png
|

|
| Attachment 22: Screenshot_from_2021-05-13_11-21-29.png
|

|
| Attachment 23: Screenshot_from_2021-05-13_11-21-53.png
|

|
| Attachment 24: Screenshot_from_2021-05-13_11-22-30.png
|

|
| Attachment 25: Screenshot_from_2021-05-13_11-24-36.png
|

|
| Attachment 26: Screenshot_from_2021-05-13_13-09-43.png
|

|
| Attachment 27: Screenshot_from_2021-05-13_13-10-03.png
|
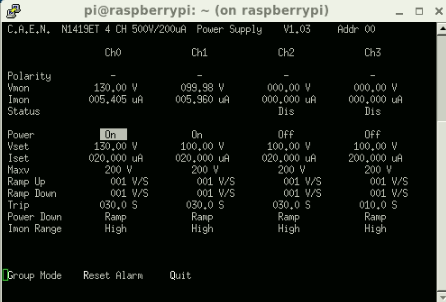
|
| Attachment 28: Screenshot_from_2021-05-13_13-10-28.png
|

|
| Attachment 29: Screenshot_from_2021-05-13_13-10-52.png
|

|
| Attachment 30: Screenshot_from_2021-05-13_13-11-22.png
|

|
| Attachment 31: Screenshot_from_2021-05-13_13-11-51.png
|

|
| Attachment 32: Screenshot_from_2021-05-13_13-12-24.png
|

|
| Attachment 33: Screenshot_from_2021-05-13_13-13-34.png
|

|
| Attachment 34: Screenshot_from_2021-05-13_13-14-16.png
|

|
|
183
|
Tue Mar 9 06:58:14 2021 |
CA, LS | March 9th 08:00-11:00 shift |
08:00 DAQ continues ok - writing to file R13_120

      Merger ok - 4.6M data items/s

      TapeServer ok - 43 MB/s

08:03 - all system wide checks ok

      - Temperatures ok - attachment 1

      - good event statistics ok - attachment 2

      - detector bias/leakage currents ok - attachment 3

08:08 ASIC settings 2019Dec19-16.19.51
      DSSSD#1 slow comparator 0xa
      DSSSD#2 slow comparator 0xa
      DSSSD#3 slow comparator 0xd

      BNC PB-5 Pulser
      Amplitude1.0V
      Attenuation x1
      Frequency 2Hz
      tau_d 1ms
      - polarity
      Delay 250ns, tail pulse

08:32 CA briefly lost network connection - back now

08:42 DESPEC on file 102

09:24 Rate spectra - attachment 4

09:32 HEC spectra - attachment 5/6

      beam off - writing to file R13_243

09:42 merger bad timestamp errors - attachment 7

      all system wide checks ok

10:30 NH - Beam was down, I try the new merger from Vic again (R14)
           I made a mistake and had to powercycle fees as they got stuck! aida10 seemed to reboot itslef
           After fixing my mistakes, all running with new merger and rate 15 MB/s (R14)
           It all looked OK even going to MBS/Go4
           I reverted back to original hot merger, R15 and look at the data.
           Beam is now back and I return AIDA to shifters :)

11.30  System wide checks okay except ADC calibration:

       FEE64 module aida07 failed
       FEE64 module aida10 failed
       Calibration test result: Passed 10, Failed 2
       If any modules fail calibration , check the clock status and open the FADC Align and Control browser page to rerun
       calibration for that module

       Reran calibration for both FEEs  but still fail
       Statistics (attachment8)
       Rate spectra (attachment9)
       FEE temps (attachment10)
       Leakage currents written to sheet (attachment11)
       Tapeserver ~33MB/s
       Merger ~ 3.4M items/s
       AIDA file R15_92

11.55 Beam off for a couple minutes but back now

12.00 New Merge terminal disappeared so stopped daq and restarted, and also restarted MBS back working
      Now writing to R16
      Merger ~ 4.5M items/s
      Tapeserver ~44MB/s

12.41 no beam

13.00 DAQ crashed (aida03 no responding), AIDA recovered from power cycle while beam is down
      Beam is back now, forwarding to MBS
      Merger ~ 45M items/s
      Tapeserver ~44MB/s
      Writing to R17

13.20 System wide checks okay except ADC calibration:

       FEE64 module aida07 failed
       FEE64 module aida10 failed
       Calibration test result: Passed 10, Failed 2
       If any modules fail calibration , check the clock status and open the FADC Align and Control browser page to rerun
       calibration for that module

       Statistics (attachment12)
       Rate spectra (attachment13)
       FEE temps (attachment14)
       Leakage currents written to sheet (attachment15)
       Tapeserver ~45MB/s
       Merger ~ 4.4M items/s

14.27 beam off
      file R17_115
      back a couple minutes later

14.40 no beam again back at 14.46

15.40 System wide checks okay except ADC calibration:

       FEE64 module aida07 failed
       FEE64 module aida10 failed
       Calibration test result: Passed 10, Failed 2
       If any modules fail calibration , check the clock status and open the FADC Align and Control browser page to rerun
       calibration for that module

       Statistics (attachment16)
       Rate spectra (attachment17)
       FEE temps (attachment18)
       Leakage currents written to sheet (attachment19)
       Tapeserver ~44MB/s
       Merger ~ 4.4M items/s

15.52 beam down R17_221, back at 15.58 R17_229

16.07 Beam down

16:20 Removed S480 files from /media/1e... and /media/SecondDrive
      Set merger to no output and stopped tapedata.
      Changed symbolic link of /TapeData to /media/1e.....
      Restarted tapedata and the merger with outputting to file R20
      Local DESPEC was made aware of this before carrying out and stopped the run.
      Beam back

17.12 beam down for a couple of minutes R20_90

17.40 System wide checks okay except ADC calibration:

       FEE64 module aida07 failed
       FEE64 module aida10 failed
       Calibration test result: Passed 10, Failed 2
       If any modules fail calibration , check the clock status and open the FADC Align and Control browser page to rerun
       calibration for that module

       Statistics (attachment20)
       Rate spectra (attachment21)
       FEE temps (attachment22)
       Leakage currents written to sheet (attachment23)
       Tapeserver ~45MB/s
       Merger ~ 4.5M items/s
|
| Attachment 1: Screenshot_from_2021-03-09_07-05-35.png
|

|
| Attachment 2: Screenshot_from_2021-03-09_07-06-17.png
|

|
| Attachment 3: Screenshot_from_2021-03-09_07-06-53.png
|
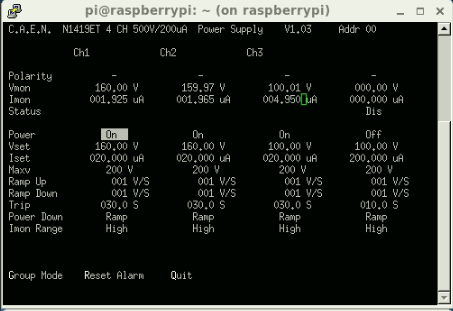
|
| Attachment 4: Screenshot_from_2021-03-09_08-08-45_-_1.png
|
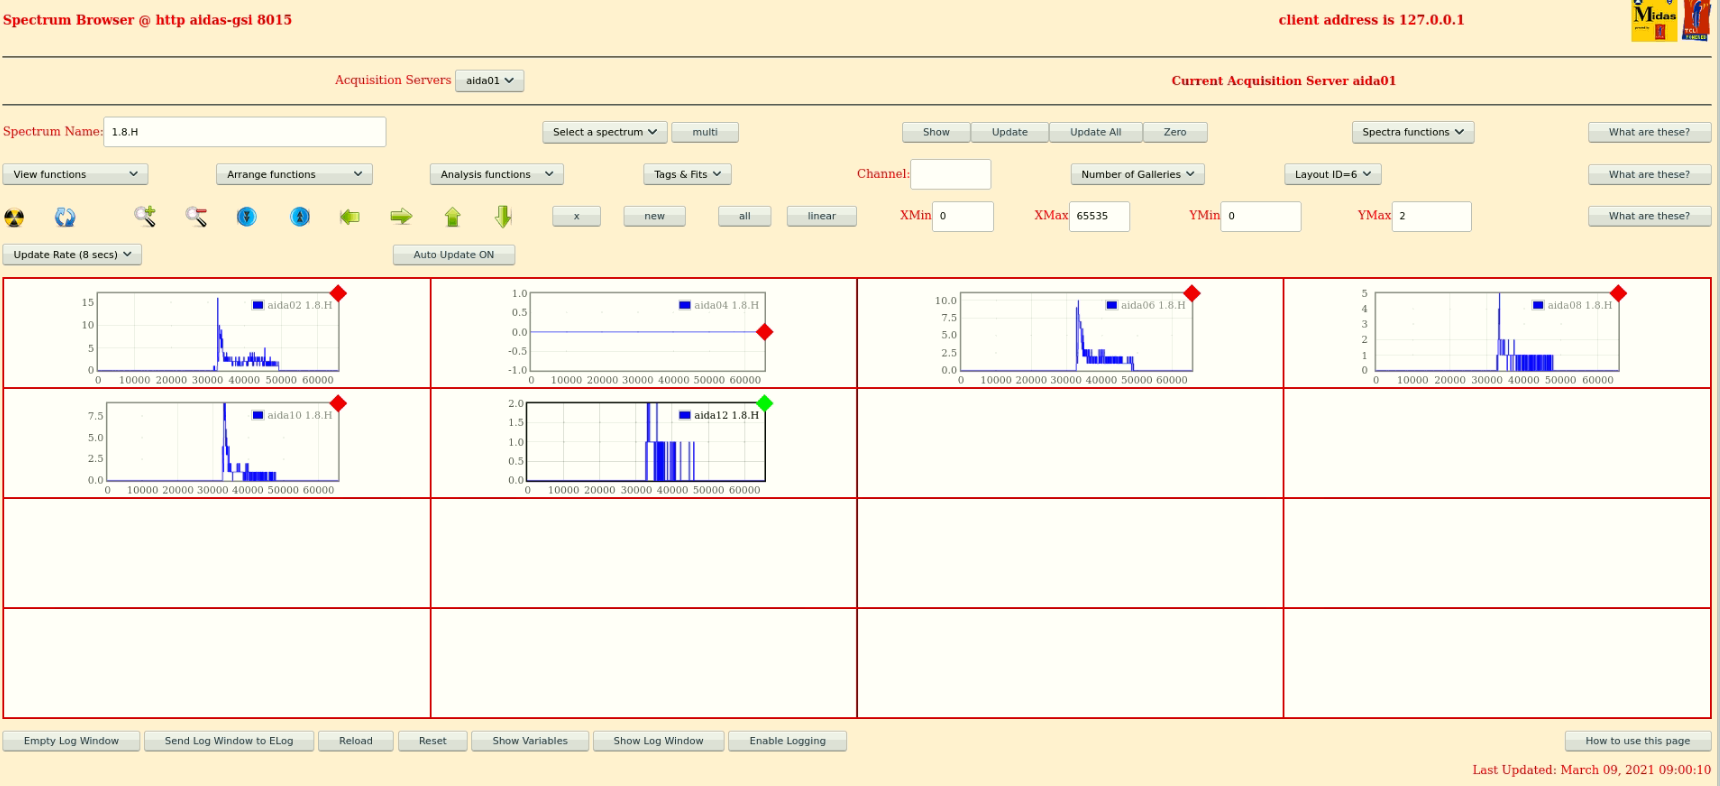
|
| Attachment 5: Screenshot_from_2021-03-09_08-24-06.png
|
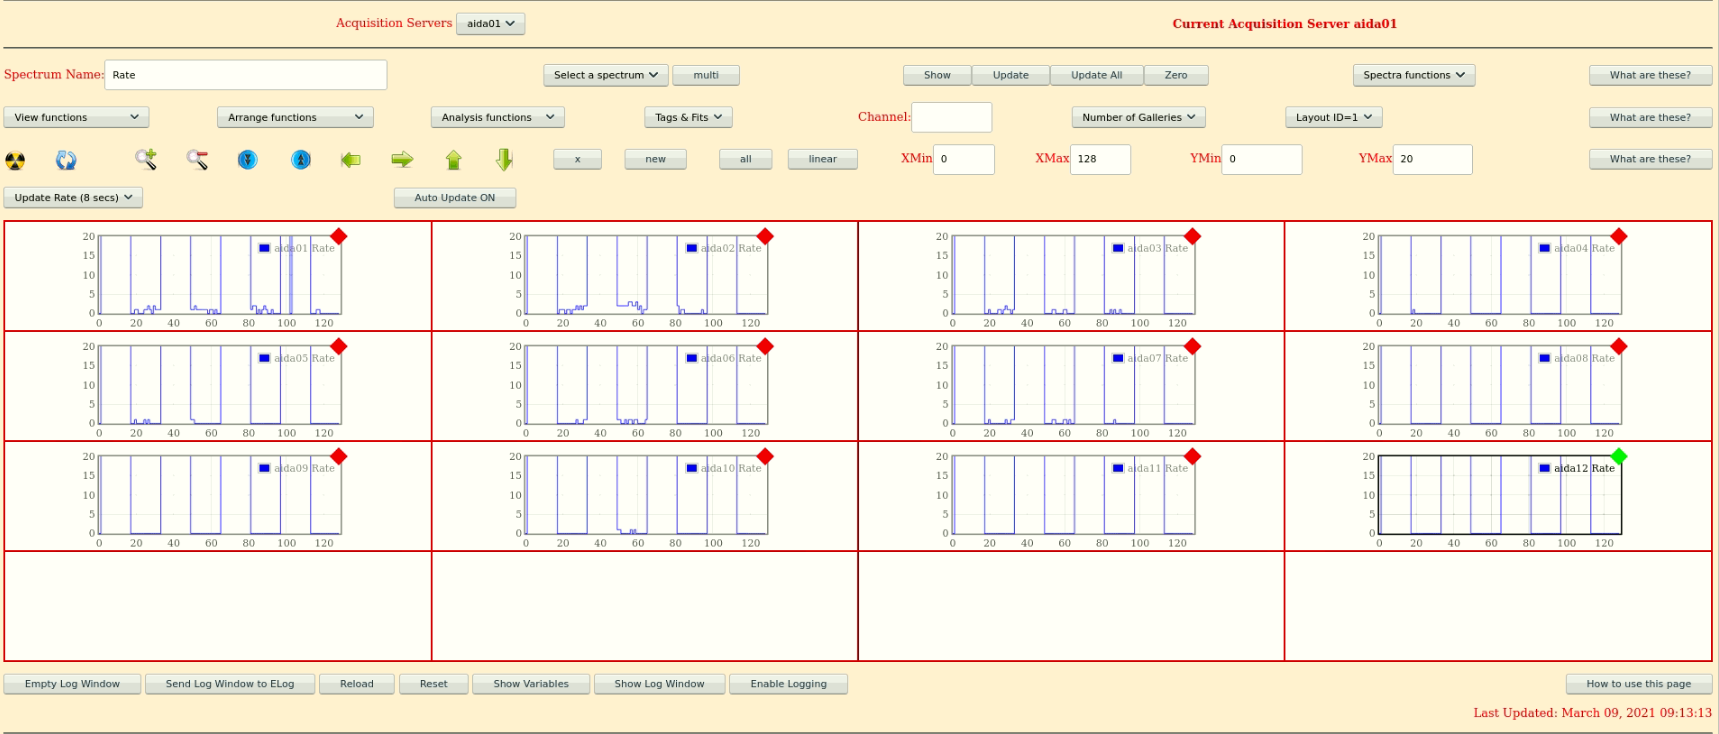
|
| Attachment 6: Screenshot_from_2021-03-09_08-26-47.png
|
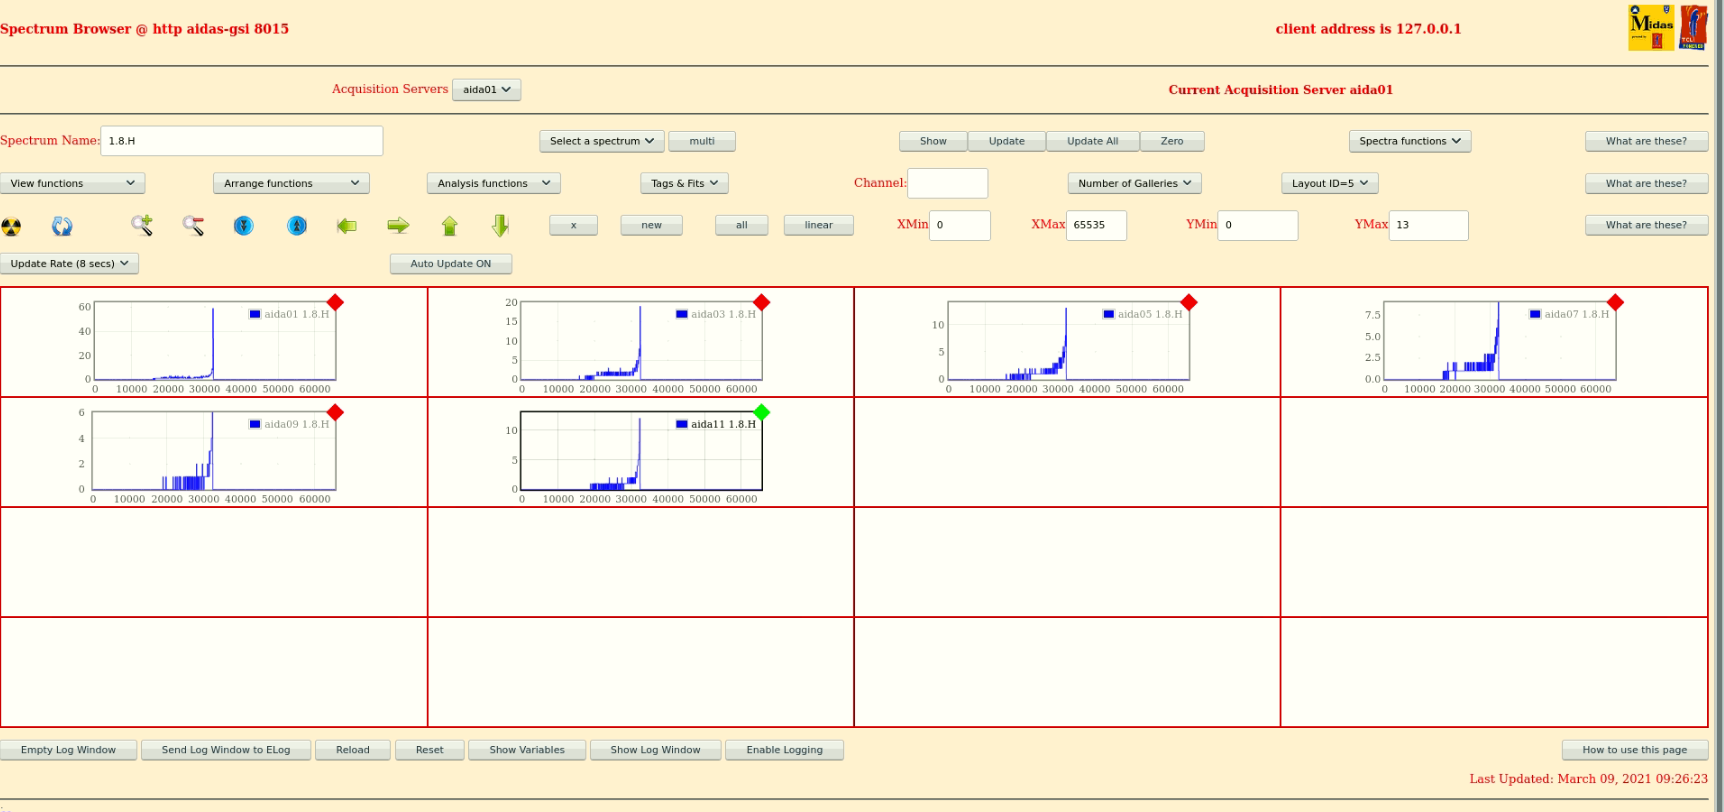
|
| Attachment 7: Screenshot_from_2021-03-09_08-44-17.png
|
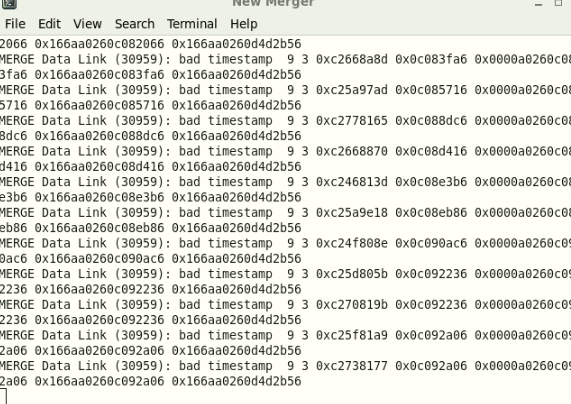
|
| Attachment 8: 1130_Statistics.PNG
|

|
| Attachment 9: 1130_SpectraRates.PNG
|

|
| Attachment 10: 1130_FEETemps.PNG
|

|
| Attachment 11: 1130_LeakageCurrents.PNG
|

|
| Attachment 12: 1330_Statistics.PNG
|

|
| Attachment 13: 1330_SpectraRates.PNG
|

|
| Attachment 14: 1330_FEETemps.PNG
|

|
| Attachment 15: 1330_LeakageCurrents.PNG
|
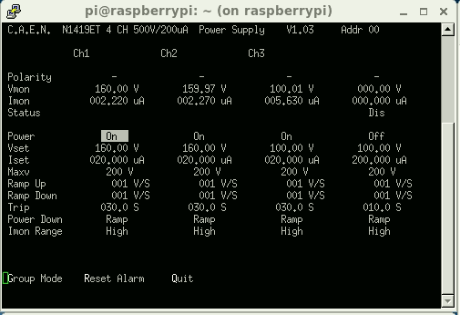
|
| Attachment 16: 1540_Statistics.PNG
|

|
| Attachment 17: 1540_SpectraRates.PNG
|

|
| Attachment 18: 1540_FEETemps.PNG
|

|
| Attachment 19: 1540_LeakageCurrents.PNG
|
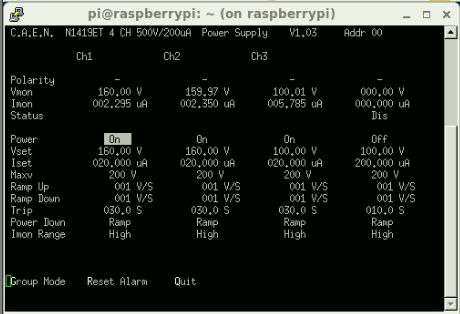
|
| Attachment 20: 1730_Statistics.PNG
|

|
| Attachment 21: 1730_SpectraRates.PNG
|
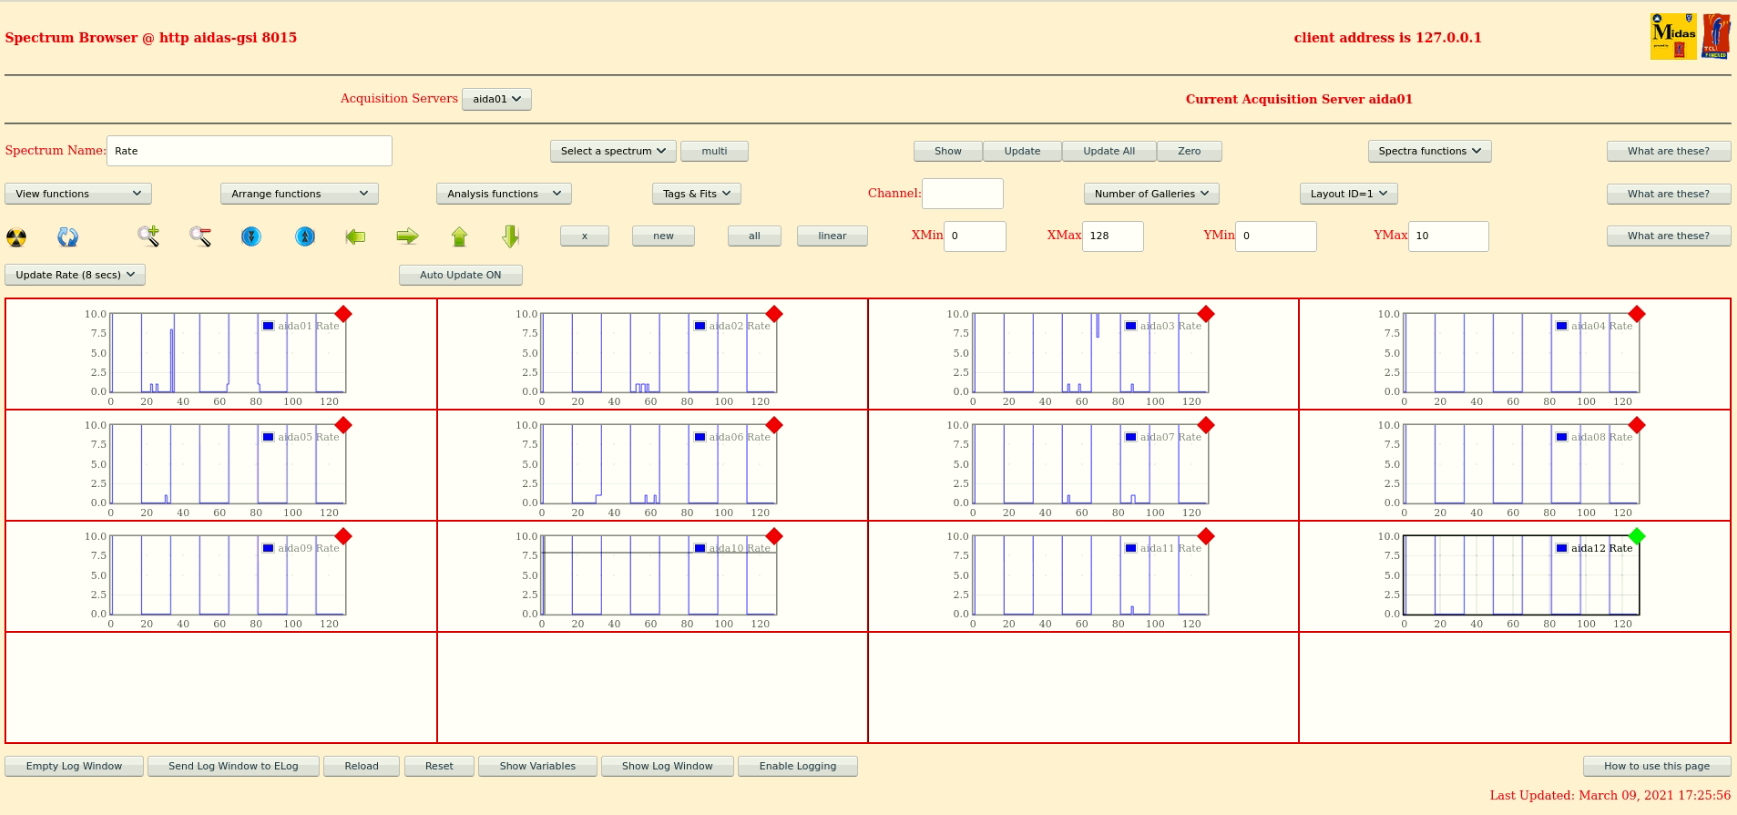
|
| Attachment 22: 1730_FEETemps.PNG
|

|
| Attachment 23: 1730_LeakageCurrents.PNG
|

|
|
177
|
Sun Mar 7 07:23:26 2021 |
CA, LS | March 7th |
08:00 ASIC settings 2019Dec19-16.19.51
      DSSSD#1 slow comparator 0xa
      DSSSD#2 slow comparator 0xa
      DSSSD#3 slow comparator 0xa

      BNC PB-5 Pulser
      Amplitude1.0V
      Attenuation x1
      Frequency 2Hz
      tau_d 1ms
      - polarity
      Delay 250ns, tail pulse


08:30 - all system wide checks ok

      - Temperatures ok - attachment 1

      - good event statistics ok - attachment 2

      - detector bias/leakage currents ok - attachment 3

      DAQ continues to run - R1_1148

      Merger ok - 4.6M data items/s

      TapeServer ok - 43MB/s

08:55 Giovanna Benzoni - confirms contribution of light ions - attachment 4 see AOQ plots

09:19 zeroed all histograms

      writing to file R1_1204

      FRS on file 72

      DESPEC to add AIDA XY hit patterns to online analysis histograms

09:35 beam stop

09:56 beam back

      writing to file R1_1249

      rate spectra - attachment 5

09:30 AIDA DAQ crashed - lost connection to aida05

      power cycle and reset

09:40 AIDA ok now, writing to file R2

09:50 LS takes over

11.10 (German time)
      System wide checks produces some fails:
      FEE64 module aida06 global clocks failed, 6 (screenshot6)
      This error is seen in RIKEN too, tried a RESYNC from master timestamp tab but error still there

      FEE64 module aida06 failed
      FEE64 module aida07 failed
      Calibration test result: Passed 10, Failed 2 (screenshot7)
      Tried a recalibration for the two FEEs in FADC align & control tab but error still there

      Rest of the checks pass
      Statistics (screenshot8)
      FEE temps okay (screenshot9)
      Leakage currents written to sheets (screenshot10)
      Merger ~4.5M data items/s
      TapeServer ~ 45MB/s

13.00 System wide checks produces same fails as last time:
      FEE64 module aida06 global clocks failed, 6
      FEE64 module aida06 failed
      FEE64 module aida07 failed
      Calibration test result: Passed 10, Failed 2
      Rest of the checks are okay

      Statistics (screenshot11)
      Spectra rate (screenshot12)
      FEE temps okay (screenshot13)
      Leakage currents written to sheets (screenshot14)
      Merger ~4.5M data items/s
      TapeServer ~ 45MB/s
      There is 1.5TB left on current drive

14.00 beam stopped to look at bPlast, have use the time to change slow comparator threshold
      Slow comparators in FEE9-12 raised to 0xd
|
| Attachment 1: Screenshot_from_2021-03-07_07-30-28.png
|

|
| Attachment 2: Screenshot_from_2021-03-07_07-31-27.png
|

|
| Attachment 3: Screenshot_from_2021-03-07_07-31-55.png
|
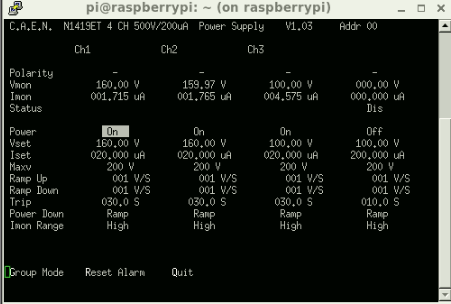
|
| Attachment 4: Screenshot_from_2021-03-07_07-53-05.png
|
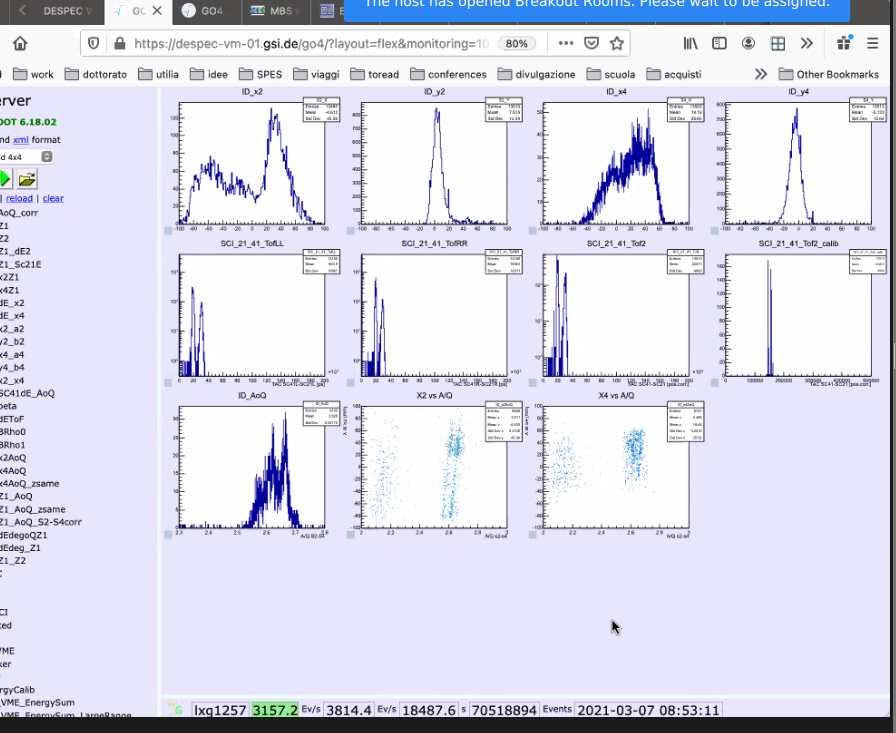
|
| Attachment 5: Screenshot_from_2021-03-07_08-59-23.png
|
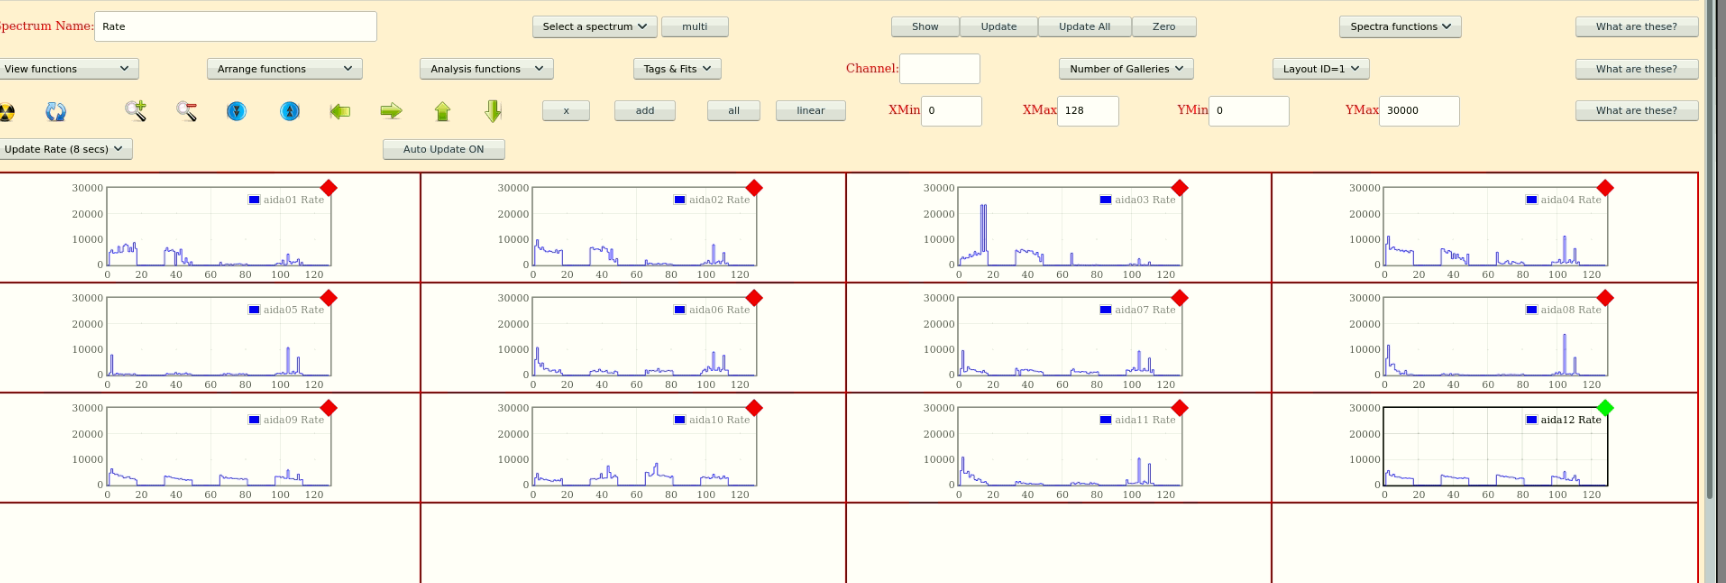
|
| Attachment 6: 1110_Systemchecks.PNG
|

|
| Attachment 7: 1110_Systemchecks2.PNG
|

|
| Attachment 8: 1110_Statistics.PNG
|

|
| Attachment 9: 1110_FEEtemps.PNG
|

|
| Attachment 10: 1110_Leakagecurrents.PNG
|

|
| Attachment 11: 1300_Statistics.PNG
|

|
| Attachment 12: 1300_Spectrumrate.PNG
|

|
| Attachment 13: 1300_FEEtemps.PNG
|

|
| Attachment 14: 1300_Leakagecurrents.PNG
|

|
|
173
|
Fri Mar 5 23:21:59 2021 |
CA, OH | March 6th 2021 00:00 - 08:00 shift |
00:23 206Hg setting - No beam in AIDA yet

      AIDA not writing to file

      Data being forwarded to MBS

      Fragments expected tonight (?)

00:45 GSI DAQ restart

      FEE64 Temps ok - attachment 1

      All system wide checks ok

01:00 Good event statistics - attachment 2

01:48 detector biases/ leakage currents - ok - attachment 3

02:10 beam on, plug removed

      beam delivered to AIDA

      rates spectra - attachment 4

      peaks at ~ 10 counts/channel in DSSD1 c.2000Hz

02:20 beam stop

02:26 beam restart - rate spectra - attachment 5

02:43 high energy channel spectra - attachment 6

      saved the high energy spectra to layout 2 in spectrum browser

03:00 beam stop

03:08 temperatures ok - attachment 7

      statistics ok - attachment 8

      bias/leakage currents ok - attachment 9

      NewMerger ok - ~4.5M data items merge rate

      Tape service ok - ~46MB/s, NoStorage

      Data forwarding to MBS ok

      all system wide checks ok

04:24 beam is back

      rate spectra - attachment 10

04:51 206Hg implanting in DSSD2

      Rate spectra - attachment 11

      HEC spectra - attachment 12

05:08 temperatures ok - attachment 13

      statistics ok - attachment 14

      detector bias/leakage currents ok - attachment 15

      All system wide checks ok

      NewMerger ok - ~4.5M data items merge rate

      Tape service ok - ~46MB/s, NoStorage

      Data forwarding to MBS ok

05:45 beam stopped

05:50 beam back

06:45 beam running, but no implants in AIDA

      possible issues with beam delivery to S4

      NewMerger ok - ~4.5M data items merge rate

      Tape service ok - ~46MB/s, NoStorage

      Data forwarding to MBS ok

07:10 temperatures ok - attachment 16

      statistics ok - attachment 17

      detector bias/leakage currents ok - attachment 18

      all system wide checks OK
|
| Attachment 1: Screenshot_from_2021-03-06_00-00-27.png
|

|
| Attachment 2: Screenshot_from_2021-03-06_00-05-18.png
|

|
| Attachment 3: Screenshot_from_2021-03-06_00-47-41.png
|
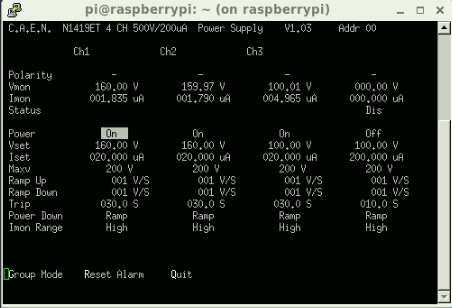
|
| Attachment 4: Screenshot_from_2021-03-06_01-17-12.png
|
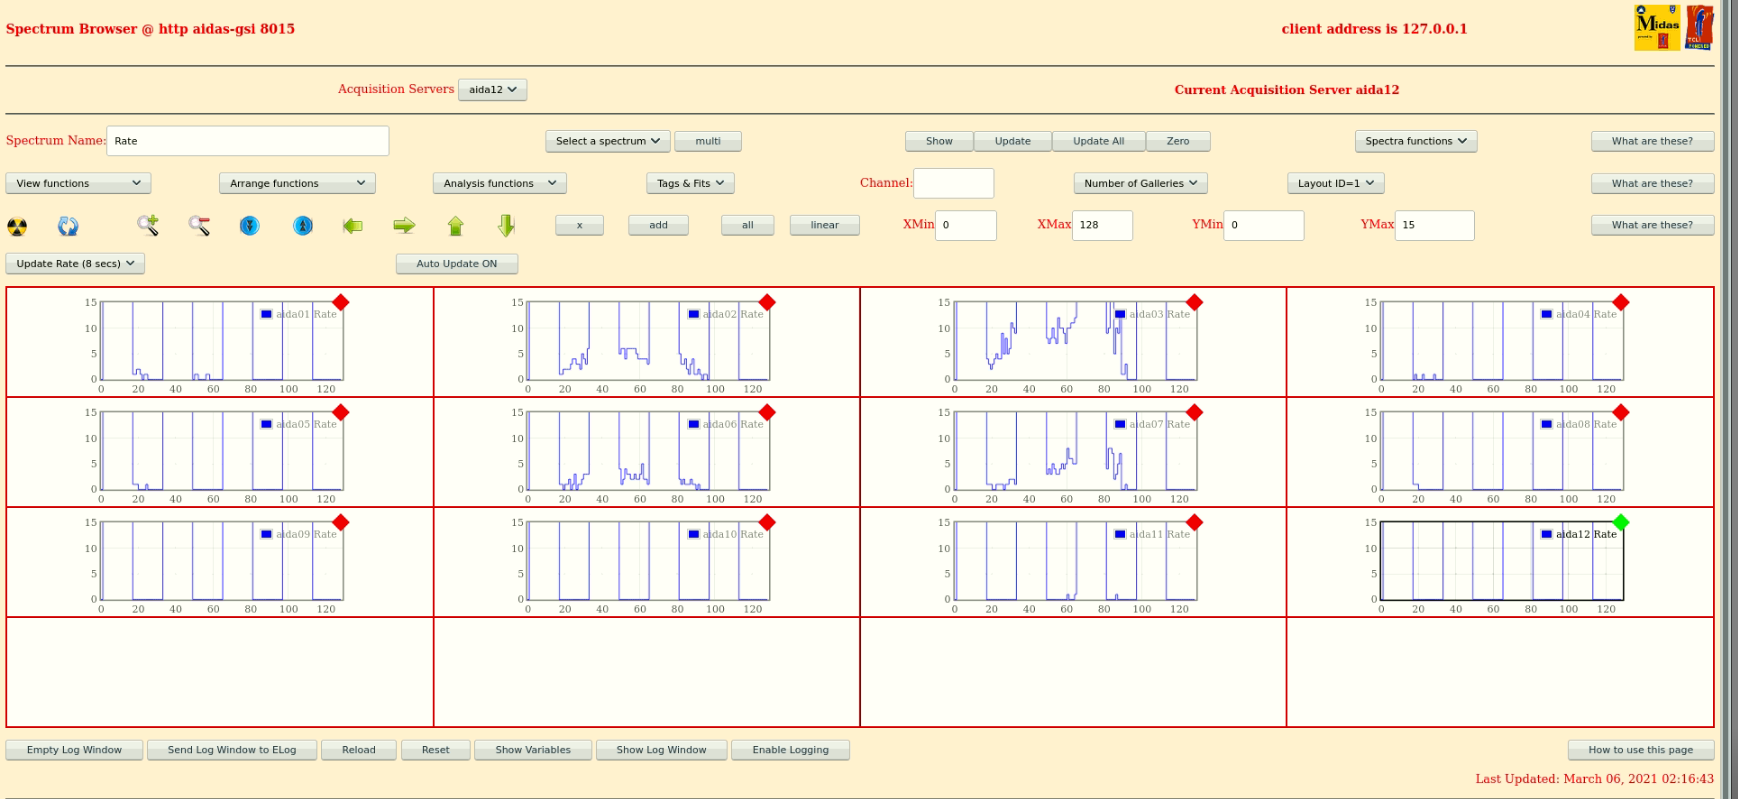
|
| Attachment 5: Screenshot_from_2021-03-06_01-25-51.png
|
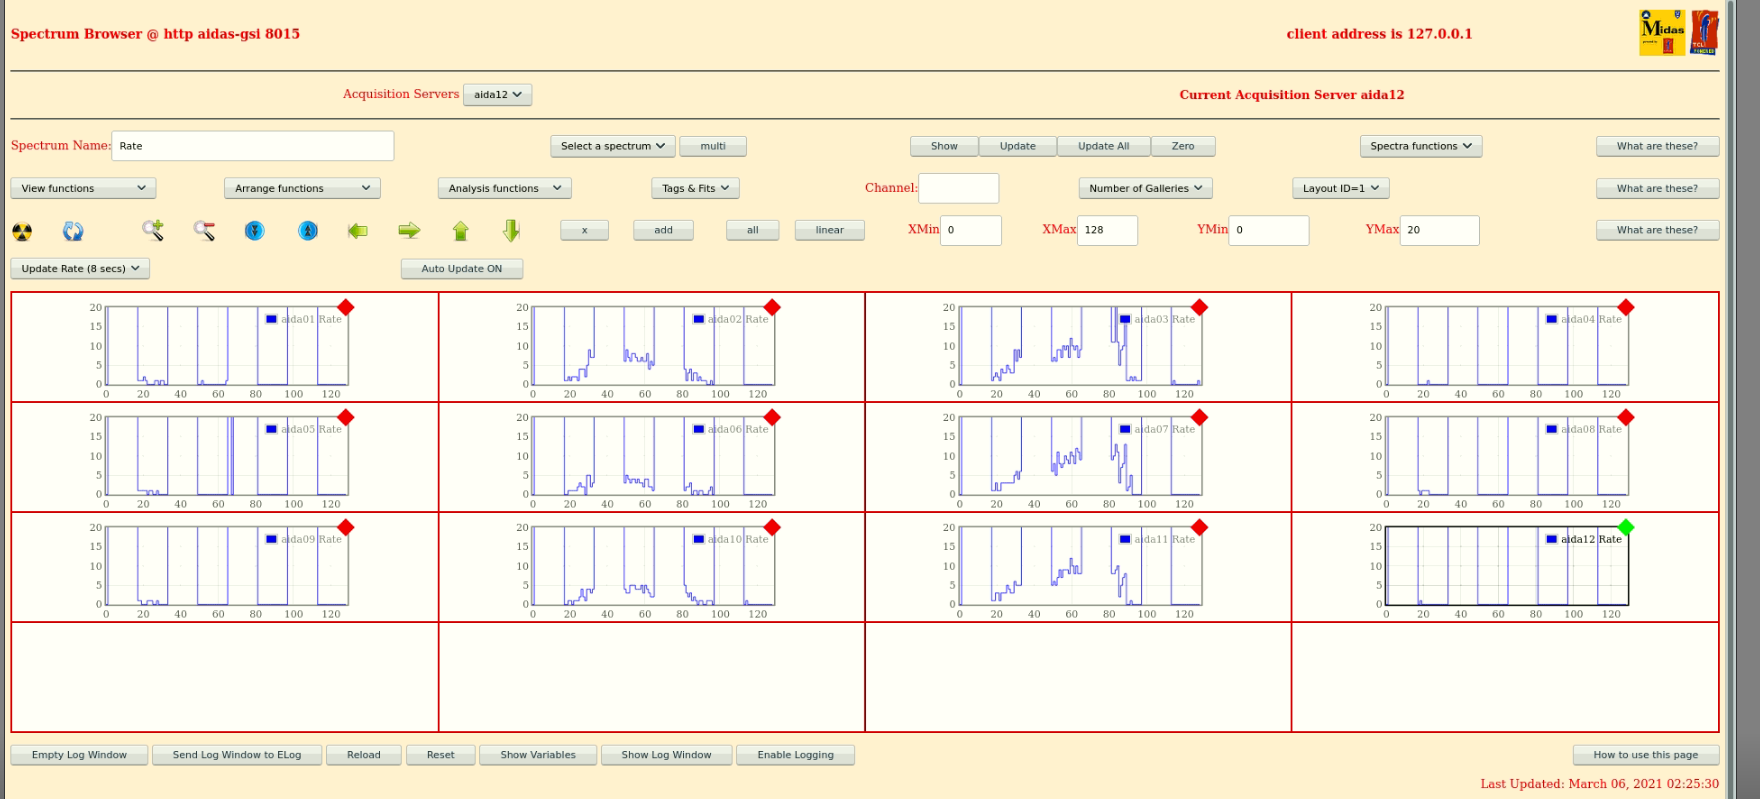
|
| Attachment 6: Screenshot_from_2021-03-06_01-42-58.png
|
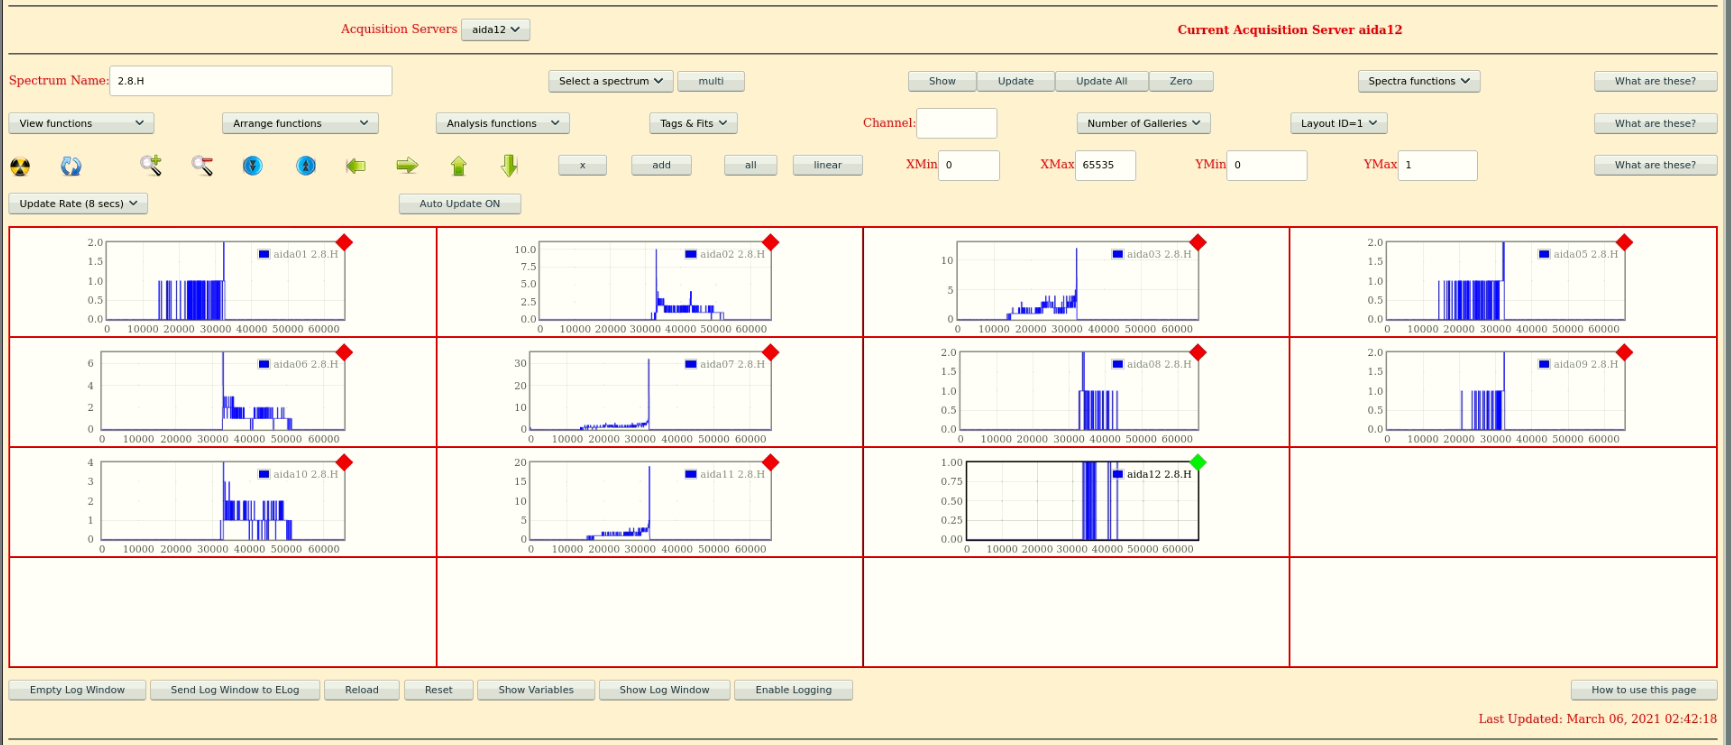
|
| Attachment 7: Screenshot_from_2021-03-06_02-05-46.png
|

|
| Attachment 8: Screenshot_from_2021-03-06_02-06-32.png
|

|
| Attachment 9: Screenshot_from_2021-03-06_02-07-47.png
|

|
| Attachment 10: Screenshot_from_2021-03-06_03-24-28.png
|
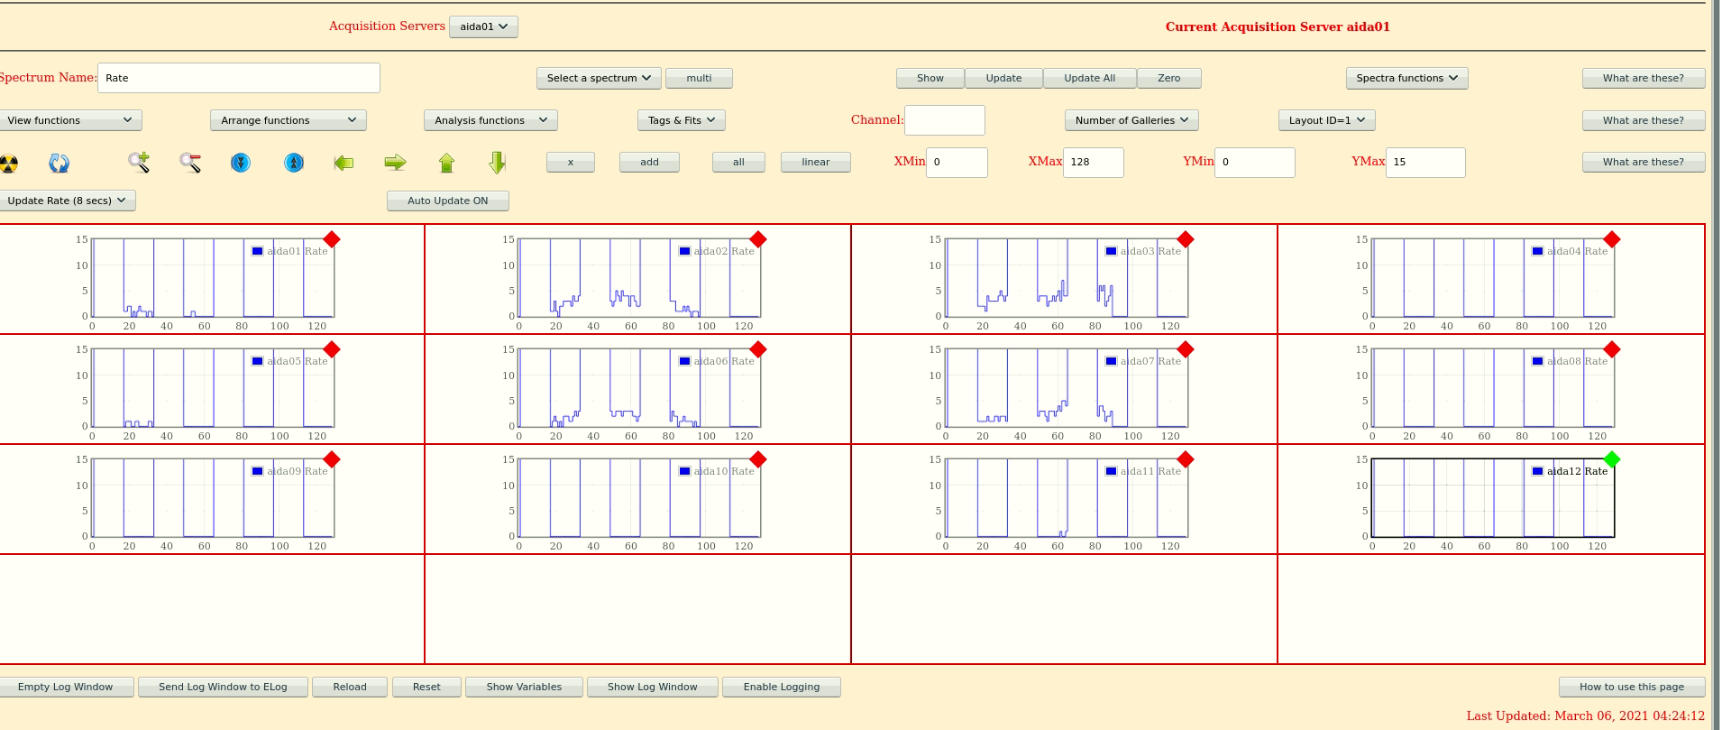
|
| Attachment 11: Screenshot_from_2021-03-06_03-53-35.png
|

|
| Attachment 12: Screenshot_from_2021-03-06_03-54-17_-_1.png
|
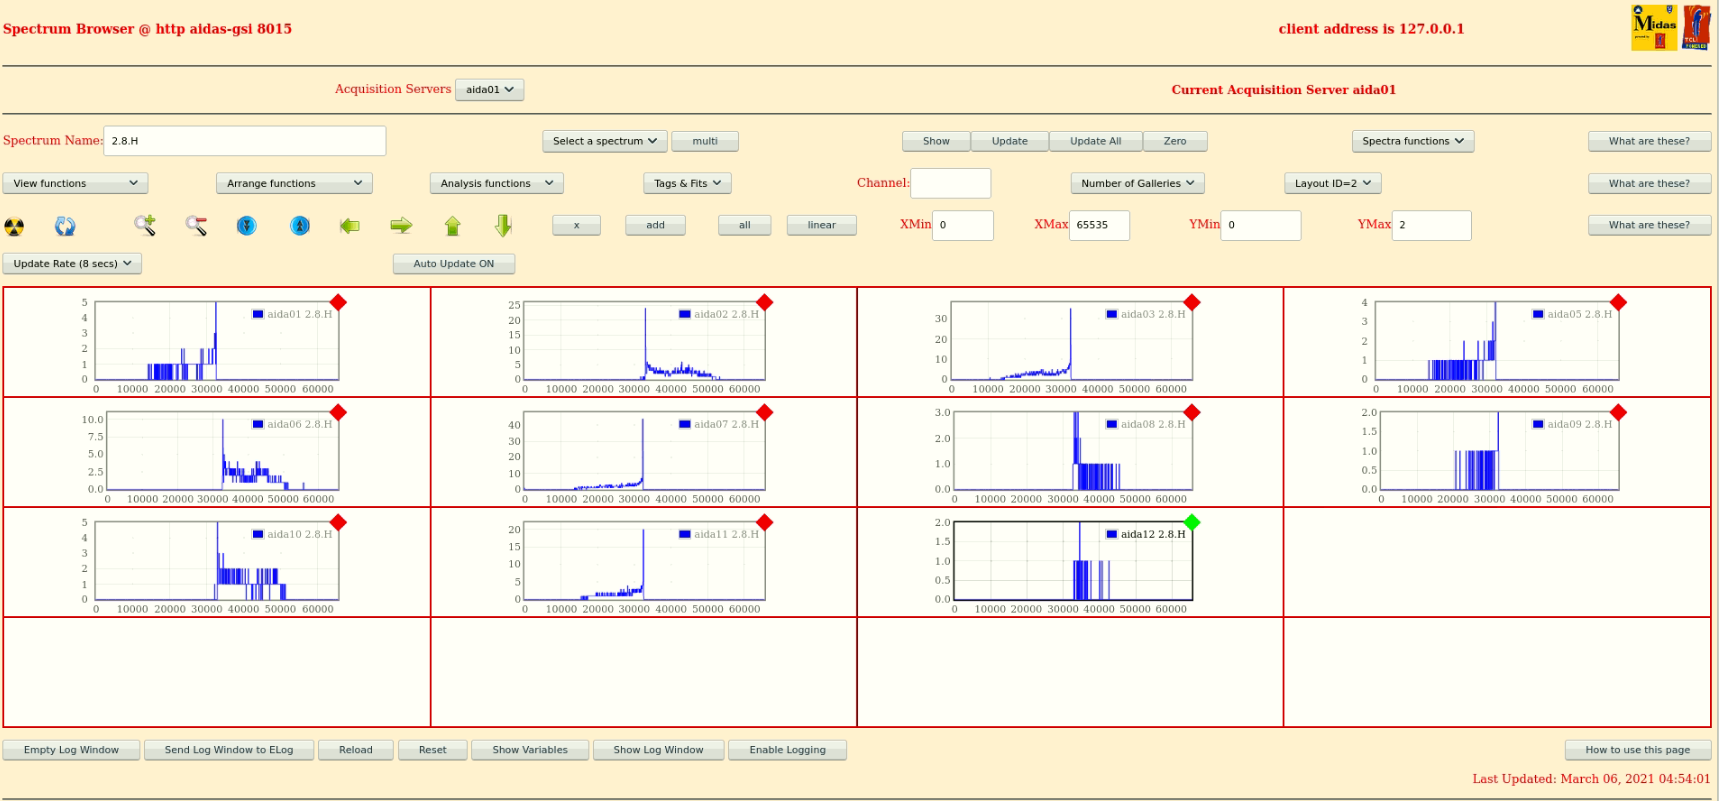
|
| Attachment 13: Screenshot_from_2021-03-06_04-09-25.png
|

|
| Attachment 14: Screenshot_from_2021-03-06_04-10-07.png
|

|
| Attachment 15: Screenshot_from_2021-03-06_04-10-32.png
|
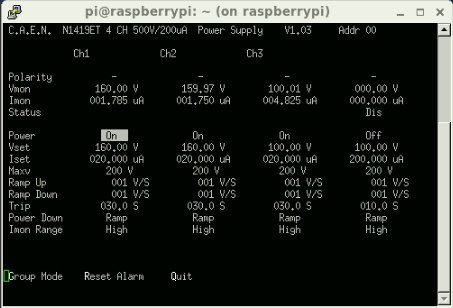
|
| Attachment 16: Screenshot_from_2021-03-06_06-07-19.png
|

|
| Attachment 17: Screenshot_from_2021-03-06_06-08-16.png
|

|
| Attachment 18: Screenshot_from_2021-03-06_06-08-44.png
|
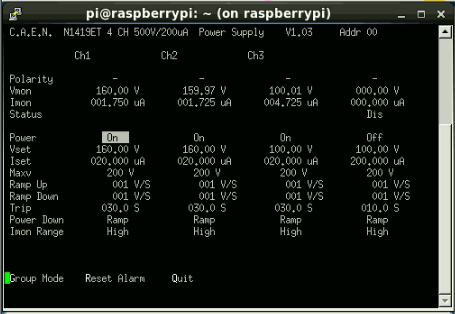
|
|
195
|
Sat Mar 13 07:08:52 2021 |
CA, TD, LS | March 13th 08:00 - 17:00 |
ASIC settings 2019Dec19-16.19.51
      DSSSD#1 slow comparator 0xa
      DSSSD#2 slow comparator 0xa
      DSSSD#3 slow comparator 0xd

      BNC PB-5 Pulser
      Amplitude1.0V
      Attenuation x1
      Frequency 2Hz
      tau_d 1ms
      - polarity
      Delay 250ns, tail pulse


08:09 System wide checks ok *except*

      aida09 fails clock check

      aida09 calibration failed

08:14 FEE64 temperatures ok - attachment 1

      good event statistics ok - attachment 2

      detector bias/leakage current ok - attachment 3

08:22 Merger 4.3M items/s

      Tapeserver 14 MB/s

08:24 DAQ ok, writing to file R43_45

08:39 rate spectra - attachment 4

      aida09 spectrum not showing, however continues to collect statistics ok

10:03 System wide checks ok *except*

      aida09 fails clock check

      aida09 calibration failed

      FEE64 temperatures ok - attachment 5

      good event statistics ok - attachment 6

      detector bias/leakage current ok - attachment 7

10:10 Merger 4.5M items/s

      Tapeserver 14 MB/s

      data forwarding to MBS ok

10:11 writing to file R43_91

12.00 (LS)
      System wide checks:
      FEE64 module aida09 global clocks failed, 6
      Clock status test result: Passed 11, Failed 1
      Understand status as follows
      Status bit 3 : firmware PLL that creates clocks from external clock not locked
      Status bit 2 : always logic '1'
      Status bit 1 : LMK3200(2) PLL and clock distribution chip not locked to external clock
      Status bit 0 : LMK3200(1) PLL and clock distribution chip not locked to external clock
      If all these bits are not set then the operation of the firmware is unreliable


      FEE64 module aida09 failed
      Calibration test result: Passed 11, Failed 1
      If any modules fail calibration , check the clock status and open the FADC Align and Control browser page to rerun
      calibration for that module

      		         Base 		Current 	Difference
      aida07 fault 	 0x829e : 	 0x829f : 	 1
      White Rabbit error counter test result: Passed 11, Failed 1
      Understand the status reports as follows:-
      Status bit 3 : White Rabbit decoder detected an error in the received data
      Status bit 2 : Firmware registered WR error, no reload of Timestamp
      Status bit 0 : White Rabbit decoder reports uncertain of Timestamp information from WR

      no FGPA timestamp errors all passed

      Statistics (attachment8)
      Spectra rate (attachment9), aida09 still does not show histogram, but on run control are enabled for all fees. still
      showing good events and other information (temperatures etc)
      FEE temps (attachment10)
      Leakage currents written to sheets (attachment11)
      Merger~4.6M items/s
      Tapeserver~14MB/s

12.36 bunch of bad timestamp errors in the new merger terminal (attachment 12) around file R43_152
      this error is still occurring at 12.45 will continue to monitor, all other system checks are reporting as normal


13.50 beam down file R43_183
      beam back a couple of minutes later

14.00 System wide checks:
      FEE64 module aida09 global clocks failed, 6
      Clock status test result: Passed 11, Failed 1
      Understand status as follows
      Status bit 3 : firmware PLL that creates clocks from external clock not locked
      Status bit 2 : always logic '1'
      Status bit 1 : LMK3200(2) PLL and clock distribution chip not locked to external clock
      Status bit 0 : LMK3200(1) PLL and clock distribution chip not locked to external clock
      If all these bits are not set then the operation of the firmware is unreliable


      FEE64 module aida09 failed
      Calibration test result: Passed 11, Failed 1
      If any modules fail calibration , check the clock status and open the FADC Align and Control browser page to rerun
      calibration for that module

      no white rabbit or FPGA errors all passed

      Statistics (attachment13)
      Spectra rate (attachment14)
      FEE temps (attachment15)
      Leakage currents written to sheets (attachment16)
      Merger~4.6M items/s
      Tapeserver~14MB/s
      Writing to MBS okay, still seeing bad timestamp errors in the new merger terminal continuing to monitor and update
      statistics tab every 20 to 30 minutes

14.12 Analysed files R43_185,186,187 from timestamp error in ucesb, but see no timewarps

14.30 have not seen any bad timestamp errors in new merger terminal for a while, unsure if something has been changed which
      has stopped them

15.25 beam down
15.53 beam back

16.00 moved back to writing to /media/SecondDrive which should last until the end of the experiment
      now writing R46

16.10 System wide checks okay except:
      FEE64 module aida09 global clocks failed, 6
      Clock status test result: Passed 11, Failed 1
      Understand status as follows
      Status bit 3 : firmware PLL that creates clocks from external clock not locked
      Status bit 2 : always logic '1'
      Status bit 1 : LMK3200(2) PLL and clock distribution chip not locked to external clock
      Status bit 0 : LMK3200(1) PLL and clock distribution chip not locked to external clock
      If all these bits are not set then the operation of the firmware is unreliable


      FEE64 module aida09 failed
      Calibration test result: Passed 11, Failed 1
      If any modules fail calibration , check the clock status and open the FADC Align and Control browser page to rerun
      calibration for that module

      Statistics (attachment17)
      Spectra rate (attachment18)
      FEE temps (attachment19)
      Leakage currents written to sheets (attachment20)
      Merger~4.7M items/s
      Tapeserver~14MB/s
Writing to MBS okay |
| Attachment 1: Screenshot_from_2021-03-13_07-12-39.png
|

|
| Attachment 2: Screenshot_from_2021-03-13_07-13-15.png
|

|
| Attachment 3: Screenshot_from_2021-03-13_07-13-46.png
|

|
| Attachment 4: Screenshot_from_2021-03-13_07-38-52.png
|
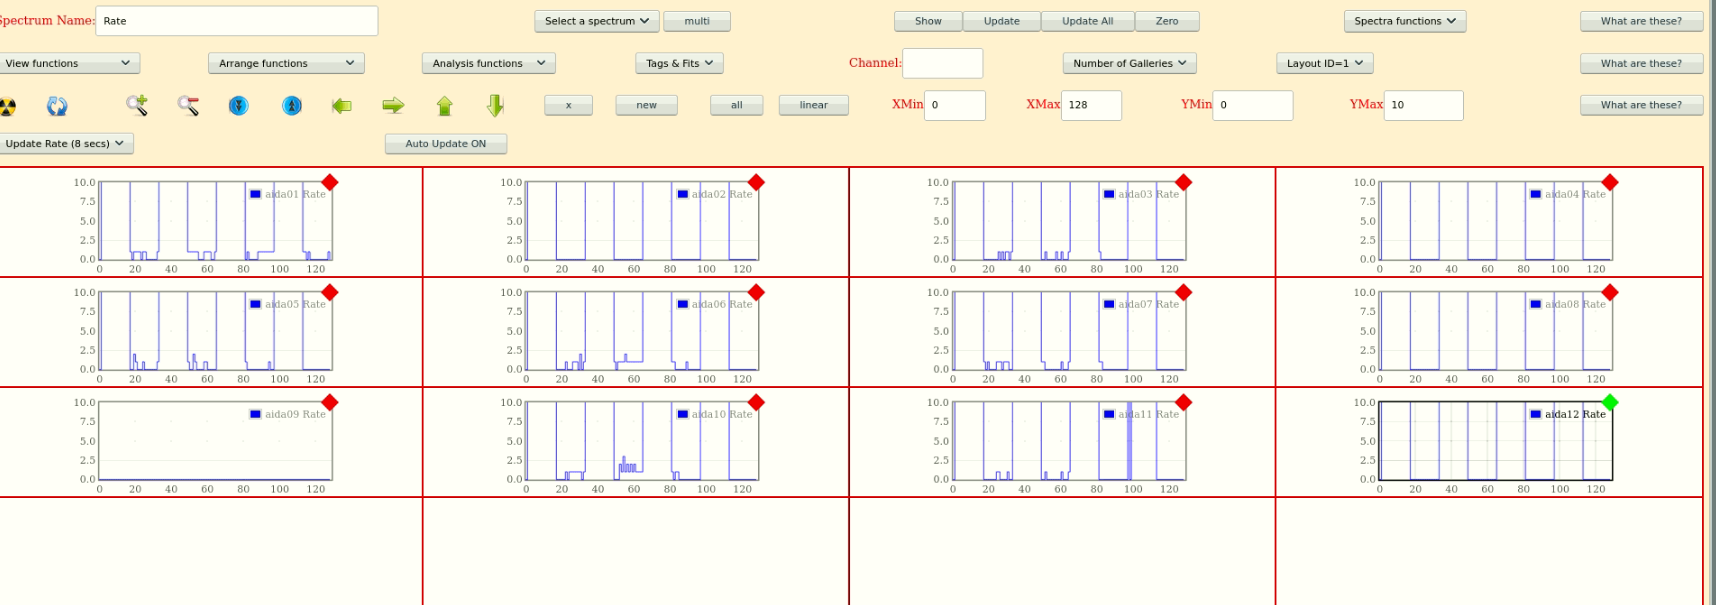
|
| Attachment 5: Screenshot_from_2021-03-13_09-04-04.png
|

|
| Attachment 6: Screenshot_from_2021-03-13_09-04-28.png
|

|
| Attachment 7: Screenshot_from_2021-03-13_09-04-50.png
|
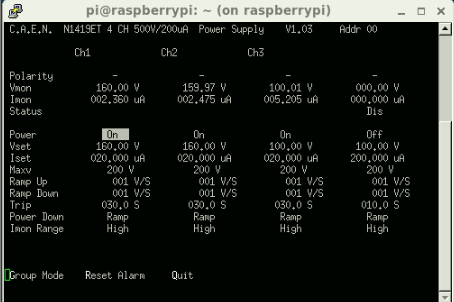
|
| Attachment 8: 1200_Statistics.PNG
|

|
| Attachment 9: 1200_SpectraRate.PNG
|

|
| Attachment 10: 1200_FEETemps.PNG
|

|
| Attachment 11: 1200_LeakageCurrents.PNG
|
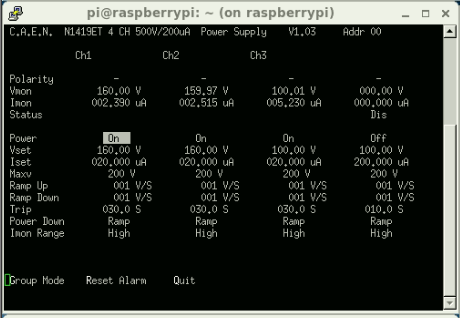
|
| Attachment 12: 1200_NewMerger.PNG
|
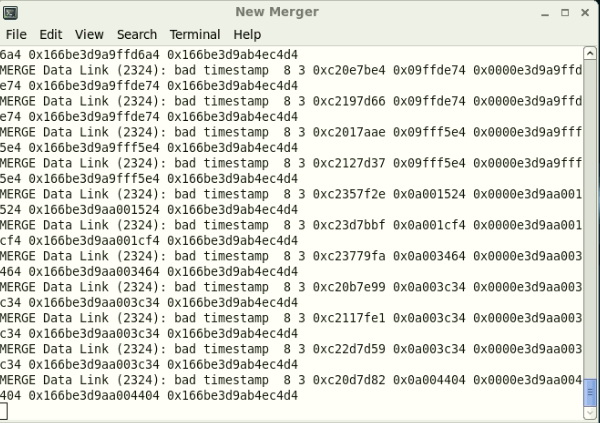
|
| Attachment 13: 1400_Statistics.PNG
|

|
| Attachment 14: 1400_SpectraRate.PNG
|

|
| Attachment 15: 1400_FEETemps.PNG
|

|
| Attachment 16: 1400_LeakageCurrents.PNG
|
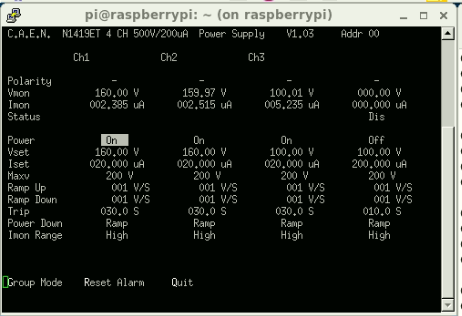
|
| Attachment 17: 1600_Statistics.PNG
|

|
| Attachment 18: 1600_SpectraRate.PNG
|
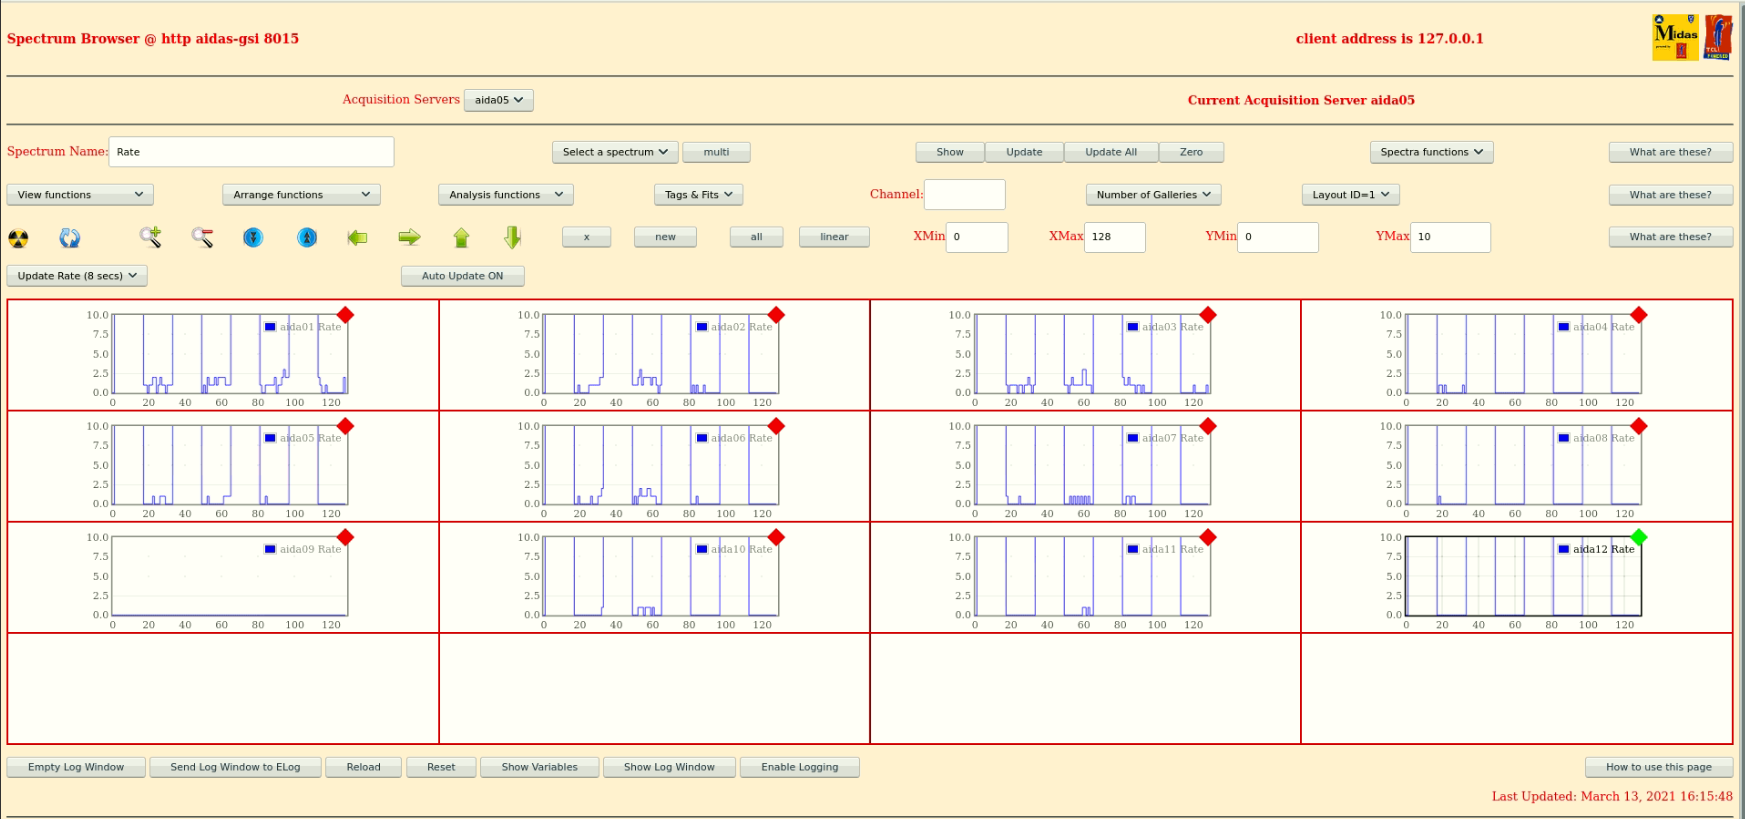
|
| Attachment 19: 1600_FEETemps.PNG
|

|
| Attachment 20: 1600_LeakageCurrents.PNG
|
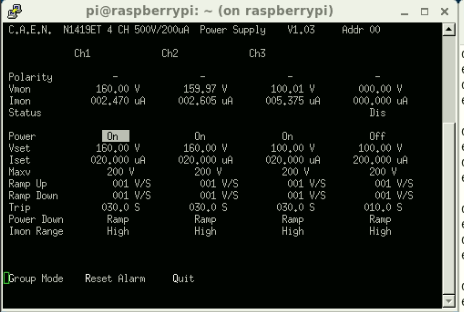
|
|
190
|
Thu Mar 11 23:07:23 2021 |
CA | March 12th 00:00 - 08:00 shift |
00:10 DAQ continues OK - file R30_372

      ASIC settings 2019Dec19-16.19.51
      DSSSD#1 slow comparator 0xa
      DSSSD#2 slow comparator 0xa
      DSSSD#3 slow comparator 0xd

      BNC PB-5 Pulser
      Amplitude1.0V
      Attenuation x1
      Frequency 2Hz
      tau_d 1ms
      - polarity
      Delay 250ns, tail pulse

00:17 System wide checks all OK

      FEE64 Temperatures ok - attachment 1

      Good event statistics ok - attachment 2

      detector bias and leakage currents ok - attachment 3

00:20 DESPEC on run 145

00:24 Merger ok ~45M items/s
      Tapeserver ok ~15MB/s

01:00 aida07 crashed

      recovered, but all FEE64 crash shortly after

      called OH - stop DAQ, TapeService, Merger

01:20 all FEE64 powercycled, AIDA restart

01:30 AIDA recovered, DAQ now running - writing to R33

      system wide checks ok *except*

      FEE64 module aida09 global clocks failed, 6
      Clock status test result: Passed 11, Failed 1

      Understand status as follows
      Status bit 3 : firmware PLL that creates clocks from external clock not locked
      Status bit 2 : always logic '1'
      Status bit 1 : LMK3200(2) PLL and clock distribution chip not locked to external clock
      Status bit 0 : LMK3200(1) PLL and clock distribution chip not locked to external clock
      If all these bits are not set then the operation of the firmware is unreliable

      FEE64 module aida07 failed
      FEE64 module aida09 failed
      Calibration test result: Passed 10, Failed 2

      If any modules fail calibration , check the clock status and open the FADC Align and Control browser page to rerun calibration for that module

01:52 FEE64 Temperatures ok - attachment 4

      -had to reload a few times to work, but otherwise ok

      Good event statistics - attachment 5

      -aida05 and aida08 running faster than before

      detector bias and leakage currents ok - attachment 6

02:04 writing to file R33_34

      Data forwarding to MBS ok

      AIDA ASIC settings ok

02:11 beam off

02:13 attempted to recalibrate aida07 and aida09 in FADC Align and Control - calibration still fails

02:32 beam back - writing to file R33_48

04:30 DESPEC having issues with Go4 crashing

      ucesb reports AIDA/FATIMA/bplast timewarp events

      System wide checks:

      Clock error:
      FEE64 module aida09 global clocks failed, 6
      Clock status test result: Passed 11, Failed 1

      Calibration:
      FEE64 module aida07 failed
      FEE64 module aida09 failed
      Calibration test result: Passed 10, Failed 2

      White Rabbit:
       Base 		Current 	Difference
       aida07 fault 	 0xcdd1 : 	 0xcdd2 : 	 1
      White Rabbit error counter test result: Passed 11, Failed 1

      Understand the status reports as follows:-
      Status bit 3 : White Rabbit decoder detected an error in the received data
      Status bit 2 : Firmware registered WR error, no reload of Timestamp
      Status bit 0 : White Rabbit decoder reports uncertain of Timestamp information from WR

      FEE64 Temperatures ok - attachment 7

      Good event statistics ok - attachment 8

      detector bias and leakage currents ok - attachment 9

04:52 analyzer output for R33_113 - attachment 10

      no timewarps

      aida06 dead time? (ignore idle time and rates)

05:02 Merger 5M data items/s

      TapeServer 17 MB/s

05:15 DESPEC believe issue with bplast TAMEX causing ucesb issues/Go4 crash

      They disable bplast and FATIMA TAMEX histograms in their online analysis - ucesb/go4 much more stable now

05:25 rates spectra - attachment 11

05:29 error message in MBS relay terminal - otherwise data forwarding to MBS ok - attachment 12

06:29 system wide checks:

      Clock error:
      FEE64 module aida09 global clocks failed, 6
      Clock status test result: Passed 11, Failed 1

      Calibration:
      FEE64 module aida07 failed
      FEE64 module aida09 failed
      Calibration test result: Passed 10, Failed 2

      White Rabbit:
                         Base 		Current 	Difference
      aida05 fault 	 0x7a56 : 	 0x7a58 : 	 2
      aida06 fault 	 0x65bb : 	 0x65bd : 	 2
      aida07 fault 	 0xcdd1 : 	 0xcdd4 : 	 3
      aida08 fault 	 0x2ab3 : 	 0x2ab5 : 	 2
      White Rabbit error counter test result: Passed 8, Failed 4

      Understand the status reports as follows:-
      Status bit 3 : White Rabbit decoder detected an error in the received data
      Status bit 2 : Firmware registered WR error, no reload of Timestamp
      Status bit 0 : White Rabbit decoder reports uncertain of Timestamp information from WR

      rest ok

06:32 FEE64 Temperatures ok - attachment 13

      Good event statistics ok - attachment 14

      detector bias and leakage currents ok - attachment 15

06:41 Merger 5.1M data items/s

      TapeServer 17 MB/s

      Data forwarding to MBS ok

08:54 restart MBS relay, requested by NH
|
| Attachment 1: Screenshot_from_2021-03-11_23-14-57_-_1.png
|

|
| Attachment 2: Screenshot_from_2021-03-11_23-15-31.png
|

|
| Attachment 3: Screenshot_from_2021-03-11_23-16-08.png
|

|
| Attachment 4: Screenshot_from_2021-03-12_00-55-09.png
|

|
| Attachment 5: Screenshot_from_2021-03-12_00-55-35.png
|

|
| Attachment 6: Screenshot_from_2021-03-12_00-58-59.png
|
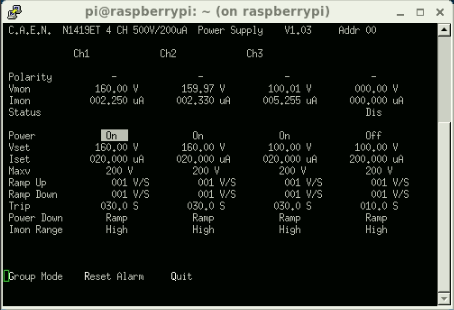
|
| Attachment 7: Screenshot_from_2021-03-12_03-35-47.png
|

|
| Attachment 8: Screenshot_from_2021-03-12_03-36-35.png
|

|
| Attachment 9: Screenshot_from_2021-03-12_03-37-20.png
|
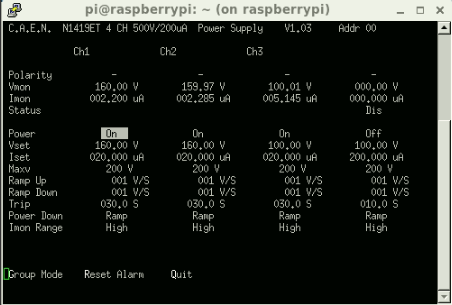
|
| Attachment 10: R33_113
|
*** TDR format 3.3.0 analyser - TD - January 2019
*** ERROR: READ I/O error: 5002
blocks: 32000
ADC data format: 260049813 ( 2219319.2 Hz)
Other data format: 1870189 ( 15960.6 Hz)
Sample trace data format: 0 ( 0.0 Hz)
Undefined format: 0 ( 0.0 Hz)
Other data format type: PAUSE: 20863 ( 178.0 Hz)
RESUME: 20864 ( 178.1 Hz)
SYNC100: 437 ( 3.7 Hz)
WR48-63: 437 ( 3.7 Hz)
FEE64 disc: 442392 ( 3775.5 Hz)
MBS info: 1385196 ( 11821.6 Hz)
Other info: 0 ( 0.0 Hz)
ADC data range bit set: 32687 ( 279.0 Hz)
Timewarps: ADC: 0 ( 0.0 Hz)
PAUSE: 0 ( 0.0 Hz)
RESUME: 0 ( 0.0 Hz)
SYNC100: 0 ( 0.0 Hz)
WR48-63: 0 ( 0.0 Hz)
FEE64 disc: 0 ( 0.0 Hz)
MBS info: 0 ( 0.0 Hz)
Undefined: 0 ( 0.0 Hz)
Sample trace: 0 ( 0.0 Hz)
*** Timestamp elapsed time: 117.175 s
FEE elapsed dead time(s) elapsed idle time(s)
1 49.525 113.280
2 56.916 110.595
3 47.492 115.964
4 57.911 115.427
5 7.968 116.501
6 1615384952.728 108.448
7 42.814 114.622
8 80.186 113.011
9 88.924 96.905
10 21.378 111.132
11 73.040 114.354
12 0.000 0.000
13 0.000 0.000
14 0.000 0.000
15 0.000 0.000
16 0.000 0.000
17 0.000 0.000
18 0.000 0.000
19 0.000 0.000
20 0.000 0.000
21 0.000 0.000
22 0.000 0.000
23 0.000 0.000
24 0.000 0.000
25 0.000 0.000
26 0.000 0.000
27 0.000 0.000
28 0.000 0.000
29 0.000 0.000
30 0.000 0.000
31 0.000 0.000
32 0.000 0.000
*** Statistics
FEE ADC Data Other Data Sample Undefined Pause Resume SYNC100 WR48-63 Disc MBS Other HEC Data
0 22118772 49791 0 0 18934 18933 32 32 11506 354 0 4012
1 22984048 20152 0 0 166 167 43 43 19337 396 0 5880
2 20394651 783427 0 0 163 164 37 37 255035 527991 0 3363
3 22242991 614086 0 0 167 167 40 40 2080 611592 0 620
4 21439332 55343 0 0 169 170 49 49 8463 46443 0 2902
5 16079204 115814 0 0 279 279 29 29 22786 92412 0 7566
6 22040349 143536 0 0 183 183 31 31 102212 40896 0 2700
7 22240015 67179 0 0 150 150 58 58 1651 65112 0 545
8 21453279 3177 0 0 179 179 23 23 2773 0 0 850
9 22650021 4350 0 0 185 184 20 20 3941 0 0 1026
10 24195088 12236 0 0 107 107 38 38 11946 0 0 3047
11 22212063 1098 0 0 181 181 37 37 662 0 0 176
12 0 0 0 0 0 0 0 0 0 0 0 0
13 0 0 0 0 0 0 0 0 0 0 0 0
14 0 0 0 0 0 0 0 0 0 0 0 0
15 0 0 0 0 0 0 0 0 0 0 0 0
16 0 0 0 0 0 0 0 0 0 0 0 0
17 0 0 0 0 0 0 0 0 0 0 0 0
18 0 0 0 0 0 0 0 0 0 0 0 0
19 0 0 0 0 0 0 0 0 0 0 0 0
20 0 0 0 0 0 0 0 0 0 0 0 0
21 0 0 0 0 0 0 0 0 0 0 0 0
22 0 0 0 0 0 0 0 0 0 0 0 0
23 0 0 0 0 0 0 0 0 0 0 0 0
24 0 0 0 0 0 0 0 0 0 0 0 0
25 0 0 0 0 0 0 0 0 0 0 0 0
26 0 0 0 0 0 0 0 0 0 0 0 0
27 0 0 0 0 0 0 0 0 0 0 0 0
28 0 0 0 0 0 0 0 0 0 0 0 0
29 0 0 0 0 0 0 0 0 0 0 0 0
30 0 0 0 0 0 0 0 0 0 0 0 0
31 0 0 0 0 0 0 0 0 0 0 0 0
32 0 0 0 0 0 0 0 0 0 0 0 0
*** Timewarps
FEE ADC Pause Resume SYNC100 WR48-63 Disc MBS Undefined Samples
0 0 0 0 0 0 0 0 0 0
1 0 0 0 0 0 0 0 0 0
2 0 0 0 0 0 0 0 0 0
3 0 0 0 0 0 0 0 0 0
4 0 0 0 0 0 0 0 0 0
5 0 0 0 0 0 0 0 0 0
6 0 0 0 0 0 0 0 0 0
7 0 0 0 0 0 0 0 0 0
8 0 0 0 0 0 0 0 0 0
9 0 0 0 0 0 0 0 0 0
10 0 0 0 0 0 0 0 0 0
11 0 0 0 0 0 0 0 0 0
12 0 0 0 0 0 0 0 0 0
13 0 0 0 0 0 0 0 0 0
14 0 0 0 0 0 0 0 0 0
15 0 0 0 0 0 0 0 0 0
16 0 0 0 0 0 0 0 0 0
17 0 0 0 0 0 0 0 0 0
18 0 0 0 0 0 0 0 0 0
19 0 0 0 0 0 0 0 0 0
20 0 0 0 0 0 0 0 0 0
21 0 0 0 0 0 0 0 0 0
22 0 0 0 0 0 0 0 0 0
23 0 0 0 0 0 0 0 0 0
24 0 0 0 0 0 0 0 0 0
25 0 0 0 0 0 0 0 0 0
26 0 0 0 0 0 0 0 0 0
27 0 0 0 0 0 0 0 0 0
28 0 0 0 0 0 0 0 0 0
29 0 0 0 0 0 0 0 0 0
30 0 0 0 0 0 0 0 0 0
31 0 0 0 0 0 0 0 0 0
32 0 0 0 0 0 0 0 0 0
*** Program elapsed time:17230.426s ( 1.857 blocks/s, 0.116 Mb/s)
|
| Attachment 11: Screenshot_from_2021-03-12_04-23-51.png
|
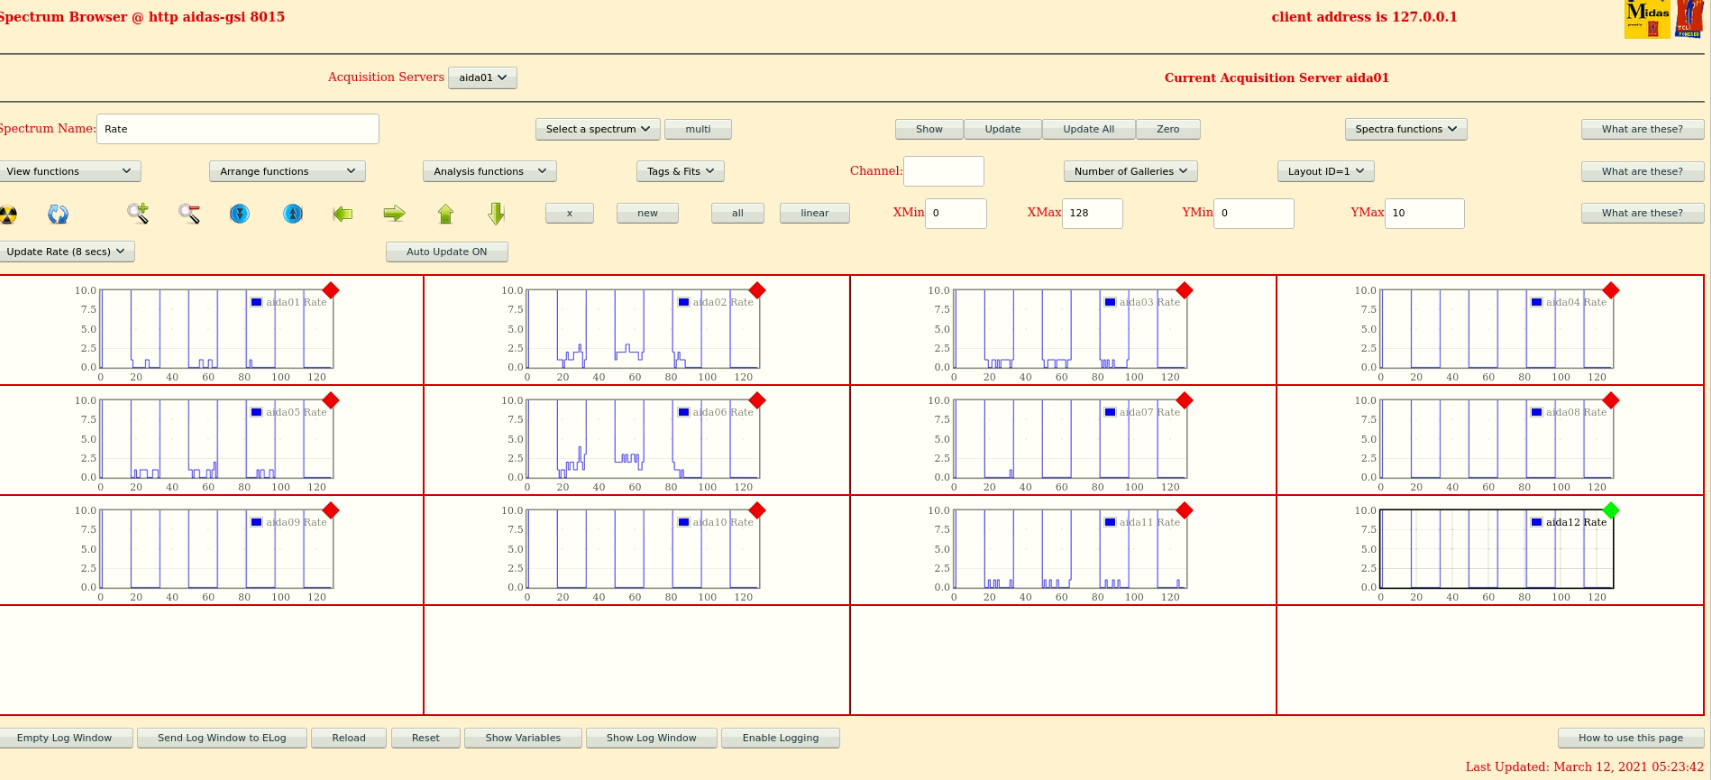
|
| Attachment 12: Screenshot_from_2021-03-12_04-29-06.png
|
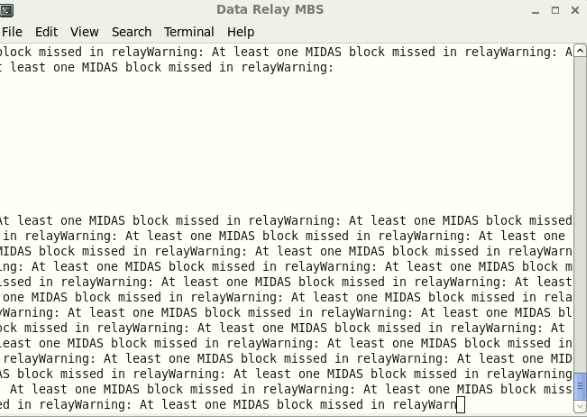
|
| Attachment 13: Screenshot_from_2021-03-12_05-34-02.png
|

|
| Attachment 14: Screenshot_from_2021-03-12_05-34-28_-_1.png
|

|
| Attachment 15: Screenshot_from_2021-03-12_05-34-51.png
|

|
|
186
|
Tue Mar 9 23:12:17 2021 |
CA | March 10th 00:00 - 08:00 |
00:13 beam back, but some spills 'missing'

      DESPEC keeping beam as is, but may stop later if it worsens

00:15 DAQ continues OK - file R20_622

      ASIC settings 2019Dec19-16.19.51
      DSSSD#1 slow comparator 0xa
      DSSSD#2 slow comparator 0xa
      DSSSD#3 slow comparator 0xd

      BNC PB-5 Pulser
      Amplitude1.0V
      Attenuation x1
      Frequency 2Hz
      tau_d 1ms
      - polarity
      Delay 250ns, tail pulse

00:20 System wide checks all OK *except*

      ADC Calibration
      FEE64 module aida07 failed
      FEE64 module aida10 failed
      Calibration test result: Passed 10, Failed 2

      If any modules fail calibration , check the clock status and open the FADC Align and Control browser page to rerun calibration for that module

      Check FPGA Timestamp Errors
      Base 		Current 		Difference
      aida12 fault 	 0x0 : 	 0x1 : 	 1
      FPGA Timestamp error counter test result: Passed 11, Failed 1

     If any of these counts are reported as in error
     The ASIC readout system has detected a timeslip.
     That is the timestamp read from the time FIFO is not younger than the last

00:24 still no bad timestamp errors in NewMerger since 16:30 UTC

00:30 FEE64 Temperatures OK - attachment 1
      Good event statistics OK - attachment 2
      Detector bias & leakage currents OK - attachment 3

      Merger OK - 4.2M data items/s
      TapeServer OK - 45 Mb/s

01:30 rate spectra - attachment 4

      HEC spectra - attachment 5 & 6

      note aida04 spectrum still not showing

02:07 beam off - file R20_760

02:11 beam back - file R20_764

02:44 System wide checks all OK *except*

      ADC Calibration
      FEE64 module aida07 failed
      FEE64 module aida10 failed
      Calibration test result: Passed 10, Failed 2


      Check FPGA Timestamp Errors
      Base 		Current 		Difference
      aida12 fault 	 0x0 : 	 0x1 : 	 1
      FPGA Timestamp error counter test result: Passed 11, Failed 1


      still no bad timestamp errors in NewMerger since 16:30 UTC

      FEE64 Temperatures OK - attachment 7
      Good event statistics OK - attachment 8
      Detector bias & leakage currents OK - attachment 9

      Merger OK - 4.2M data items/s
      TapeServer OK - 44 Mb/s

04:16 bad timestamp errors in NewMerger terminal, first since 16:30 UTC - attachment 10

      System wide checks all OK *except*

      ADC Calibration
      FEE64 module aida07 failed
      FEE64 module aida10 failed
      Calibration test result: Passed 10, Failed 2


      Check FPGA Timestamp Errors
      Base 		Current 		Difference
      aida12 fault 	 0x0 : 	 0x1 : 	 1
      FPGA Timestamp error counter test result: Passed 11, Failed 1


      FEE64 Temperatures OK - attachment 11
      Good event statistics OK - attachment 12
      Detector bias & leakage currents OK - attachment 13

05:03 Merger OK - 4.5M data items/s
      TapeServer OK - 43 Mb/s

      no bad timestamp errors for ~40 mins, data forwarding to MBS ok at usual rate

06:11 rates spectra - attachment 14

06:14 System wide checks

      ADC Calibration
      FEE64 module aida07 failed
      FEE64 module aida10 failed
      Calibration test result: Passed 10, Failed 2

      Check WR decoder status
      Base 		Current 	Difference
      aida05 fault 	 0x1591 : 	 0x1593 : 	 2
      aida06 fault 	 0xe23c : 	 0xe23e : 	 2
      aida07 fault 	 0x743 : 	 0x745 : 	 2
      aida08 fault 	 0xf84e : 	 0xf850 : 	 2
      aida09 fault 	 0x5449 : 	 0x544a : 	 1
      White Rabbit error counter test result: Passed 7, Failed 5

      Understand the status reports as follows:-
      Status bit 3 : White Rabbit decoder detected an error in the received data
      Status bit 2 : Firmware registered WR error, no reload of Timestamp
      Status bit 0 : White Rabbit decoder reports uncertain of Timestamp information from WR


      Check FPGA Timestamp Errors
      Base 		Current 		Difference
      aida12 fault 	 0x0 : 	 0x1 : 	 1
      FPGA Timestamp error counter test result: Passed 11, Failed 1

      still no further bad timestamp errors in NewMerger terminal

      collected all WR and FPGA errors from baseline, system wide checks ok

      FEE64 Temperatures OK - attachment 15
      Good event statistics OK - attachment 16
      Detector bias & leakage currents OK - attachment 17

06:24 AIDA writing to file R20_1080

      Merger OK - 4.5M data items/s
      TapeServer OK - 46 Mb/s

06:26 another burst of bad timestamp errors - attachment 18

      performed system wide checks again - all ok aside from aida07/aida10 calibration

07:32 HEC spectra - attachments 19/20

07:35 no beam
|
| Attachment 1: Screenshot_from_2021-03-09_23-27-20.png
|

|
| Attachment 2: Screenshot_from_2021-03-09_23-29-22.png
|

|
| Attachment 3: Screenshot_from_2021-03-09_23-29-39.png
|
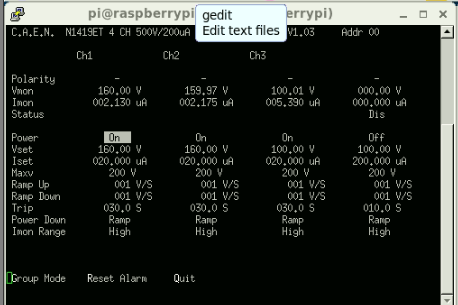
|
| Attachment 4: Screenshot_from_2021-03-10_00-27-45.png
|

|
| Attachment 5: Screenshot_from_2021-03-10_00-28-39.png
|

|
| Attachment 6: Screenshot_from_2021-03-10_00-29-25.png
|
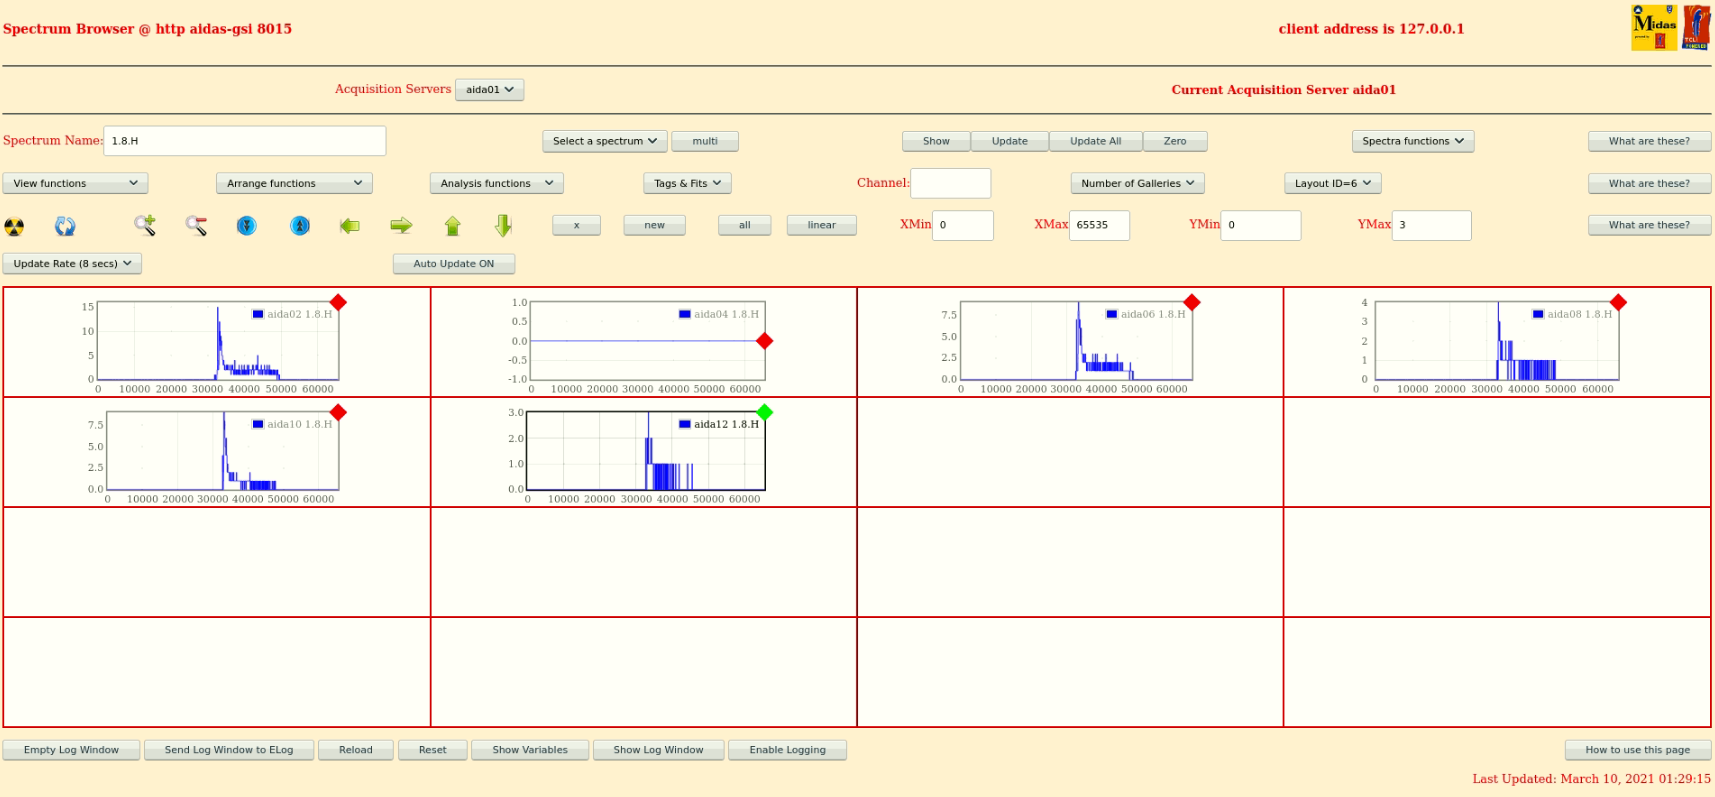
|
| Attachment 7: Screenshot_from_2021-03-10_01-40-24.png
|

|
| Attachment 8: Screenshot_from_2021-03-10_01-42-57.png
|

|
| Attachment 9: Screenshot_from_2021-03-10_01-43-39_-_1.png
|

|
| Attachment 10: Screenshot_from_2021-03-10_03-17-56.png
|
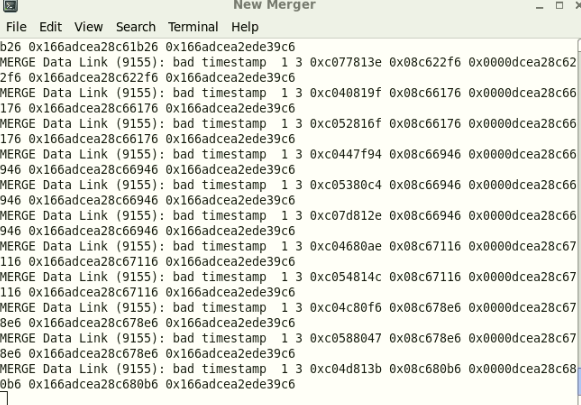
|
| Attachment 11: Screenshot_from_2021-03-10_03-23-03.png
|

|
| Attachment 12: Screenshot_from_2021-03-10_03-23-26.png
|

|
| Attachment 13: Screenshot_from_2021-03-10_03-23-43.png
|
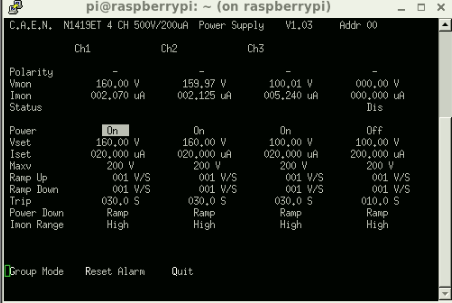
|
| Attachment 14: Screenshot_from_2021-03-10_05-10-19.png
|

|
| Attachment 15: Screenshot_from_2021-03-10_05-17-39.png
|

|
| Attachment 16: Screenshot_from_2021-03-10_05-18-04.png
|

|
| Attachment 17: Screenshot_from_2021-03-10_05-21-47.png
|

|
| Attachment 18: Screenshot_from_2021-03-10_05-27-03.png
|

|
| Attachment 19: Screenshot_from_2021-03-10_06-31-51.png
|

|
| Attachment 20: Screenshot_from_2021-03-10_06-32-18.png
|
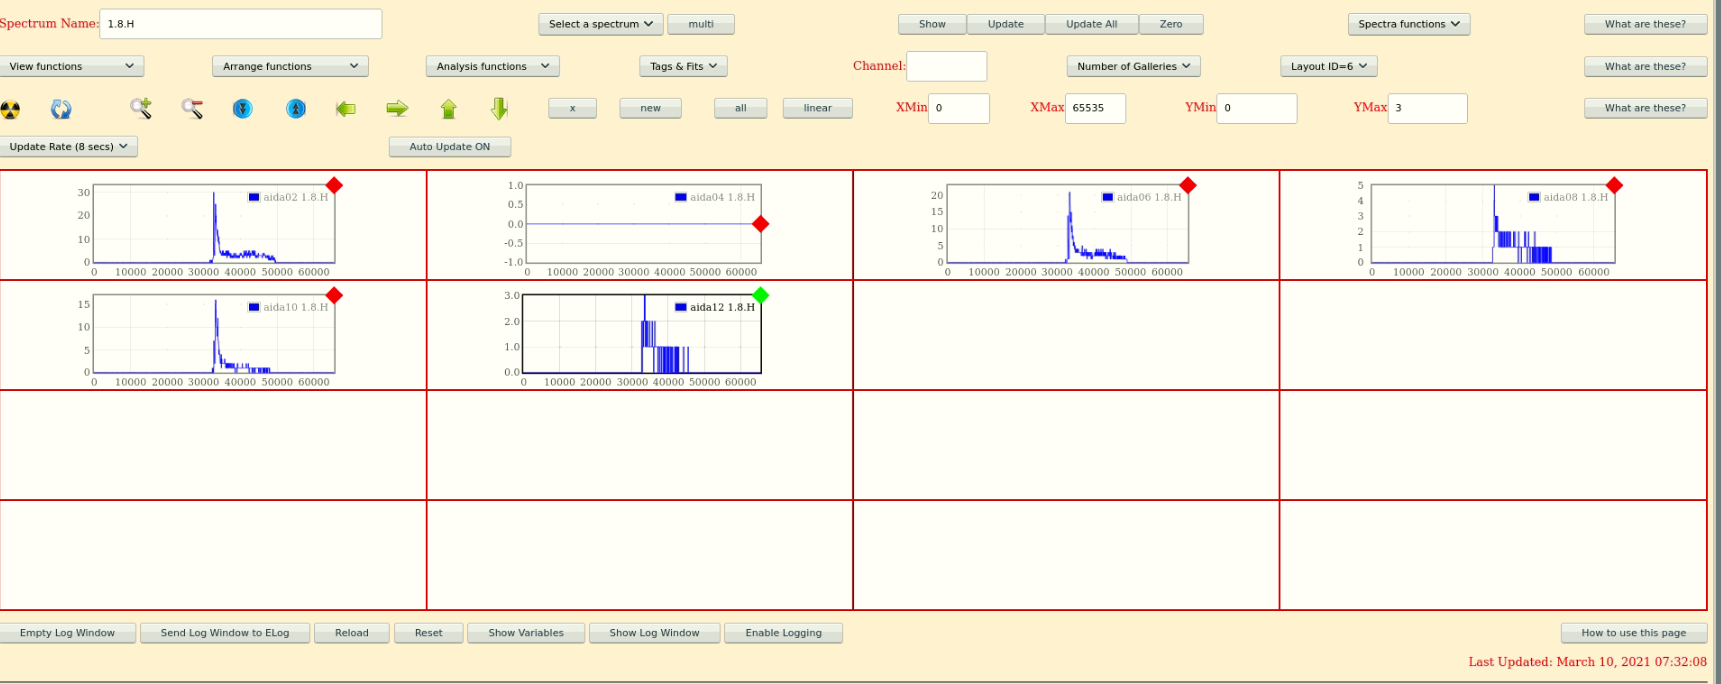
|
|
411
|
Tue Apr 5 12:46:52 2022 |
TD | MSL type BB18(DS)-1000 triple - cable lengths |
OH/NH disassembling current AIDA triple snout and DSSSD stack.

Length of ribbon cables (including connector) outside snout as follows

p+n junction side 9cm & 15cm
n+n ohmic side 10.5cm & 16cm


Update
p+n junction side: 6.5cm, 10.5 cm (used  7.5, 11.5 for 1cm slack)
n+n ohmic side:  11.0 cm, 15.0 cm (used 12.0, 16.0 for 1cm slack)
Measurement from SAMTEC connector to exit from the rubber seals in AIDA snout. |
|
207
|
Thu Mar 25 18:04:51 2021 |
TD | MSL type BB18(DS) 24cm x 8cm cabling & bias configuration |
|
| Attachment 1: MSL_type_BB18(DS)_24cm_x_8cm_configuration.pdf
|
_24cm_x_8cm_configuration-0.png)
_24cm_x_8cm_configuration-1.png)
_24cm_x_8cm_configuration-2.png)
_24cm_x_8cm_configuration-3.png)
|
|
522
|
Thu Oct 12 14:01:43 2023 |
TD | MSL type BB18 24cm x 8cm DSSSD test - update |
DSSSD MSL type BB18 24cm x 8cm 3208-3/3208-21/3208-22

FEE64 configuration see https://elog.ph.ed.ac.uk/AIDA/872 attachment 2

Bias -150V -6.590uA ambient temperature +24.7 deg C d.p. +13.7 deg C RH 50.3%

BNC PB-5
amplitude 10.0V
attenuation x10
decay time 1ms
tail pulse
frequency 25Hz

PB-5 output direct to p+n junction side FEE64 aida01 or aida12, or n+n Ohmic side FEE64 aida02


aida01 1.8.L pulser peak width  61 ch FWHM ~  46keV FWHM => 5s threshold 98keV
aida12 1.8.L pulser peak width  56 ch FWHM ~  42keV FWHM => 5s threshold 89keV
aida02 1.8.L pulser peak width 102 ch FWHM ~  77keV FWHM => 5s threshold 163keV


slow comparator  0xa 100keV ( all p+n junction FEE64s )
                 0xf 150keV ( all n+n Ohmic FEE64s )

per FEE64 Rate spectra - attachment 1
 p+n FEE64s ( aida010, aida01, aida09, aida12, aida03, aida11 ) rates dominated by hot channels, other channels typically <1Hz ( 25Hz pulser to aida12 )
 n+n FEE64s ( aida02, aida04 ) rates ~ 10-20Hz/channel
 Note aida06 and aida08 are not connected to anything and should be ignored


ADC data item stats - attachment 2


For further information see https://elog.ph.ed.ac.uk/AIDA/906 and https://elog.ph.ed.ac.uk/AIDA/907


To Do

- repair/replace Honeywell HSS-DPS dew point sensor
   USB-controlled ac mains relay interlock currently overrriden
   do NOT operate AIDA unattended

- aida04 asic #1 u/s - replace ASIC mezzanine

- electrically isolated test signal distribution box req'd

- aida10 asic #4
   v. high rates observed and large signal transients
   cause unclear ... ASIC/adaptor PCB/cabling/Si wafer ?

- extended background alpha run to check all DSSSD bond wires
   pulser OFF
   slow comparator 0x64

- bPlas + 2x triple DSSSD + bPlas stack assembly and test

- all up, in beam test |
| Attachment 1: Screenshot_from_2023-10-12_15-13-30.png
|
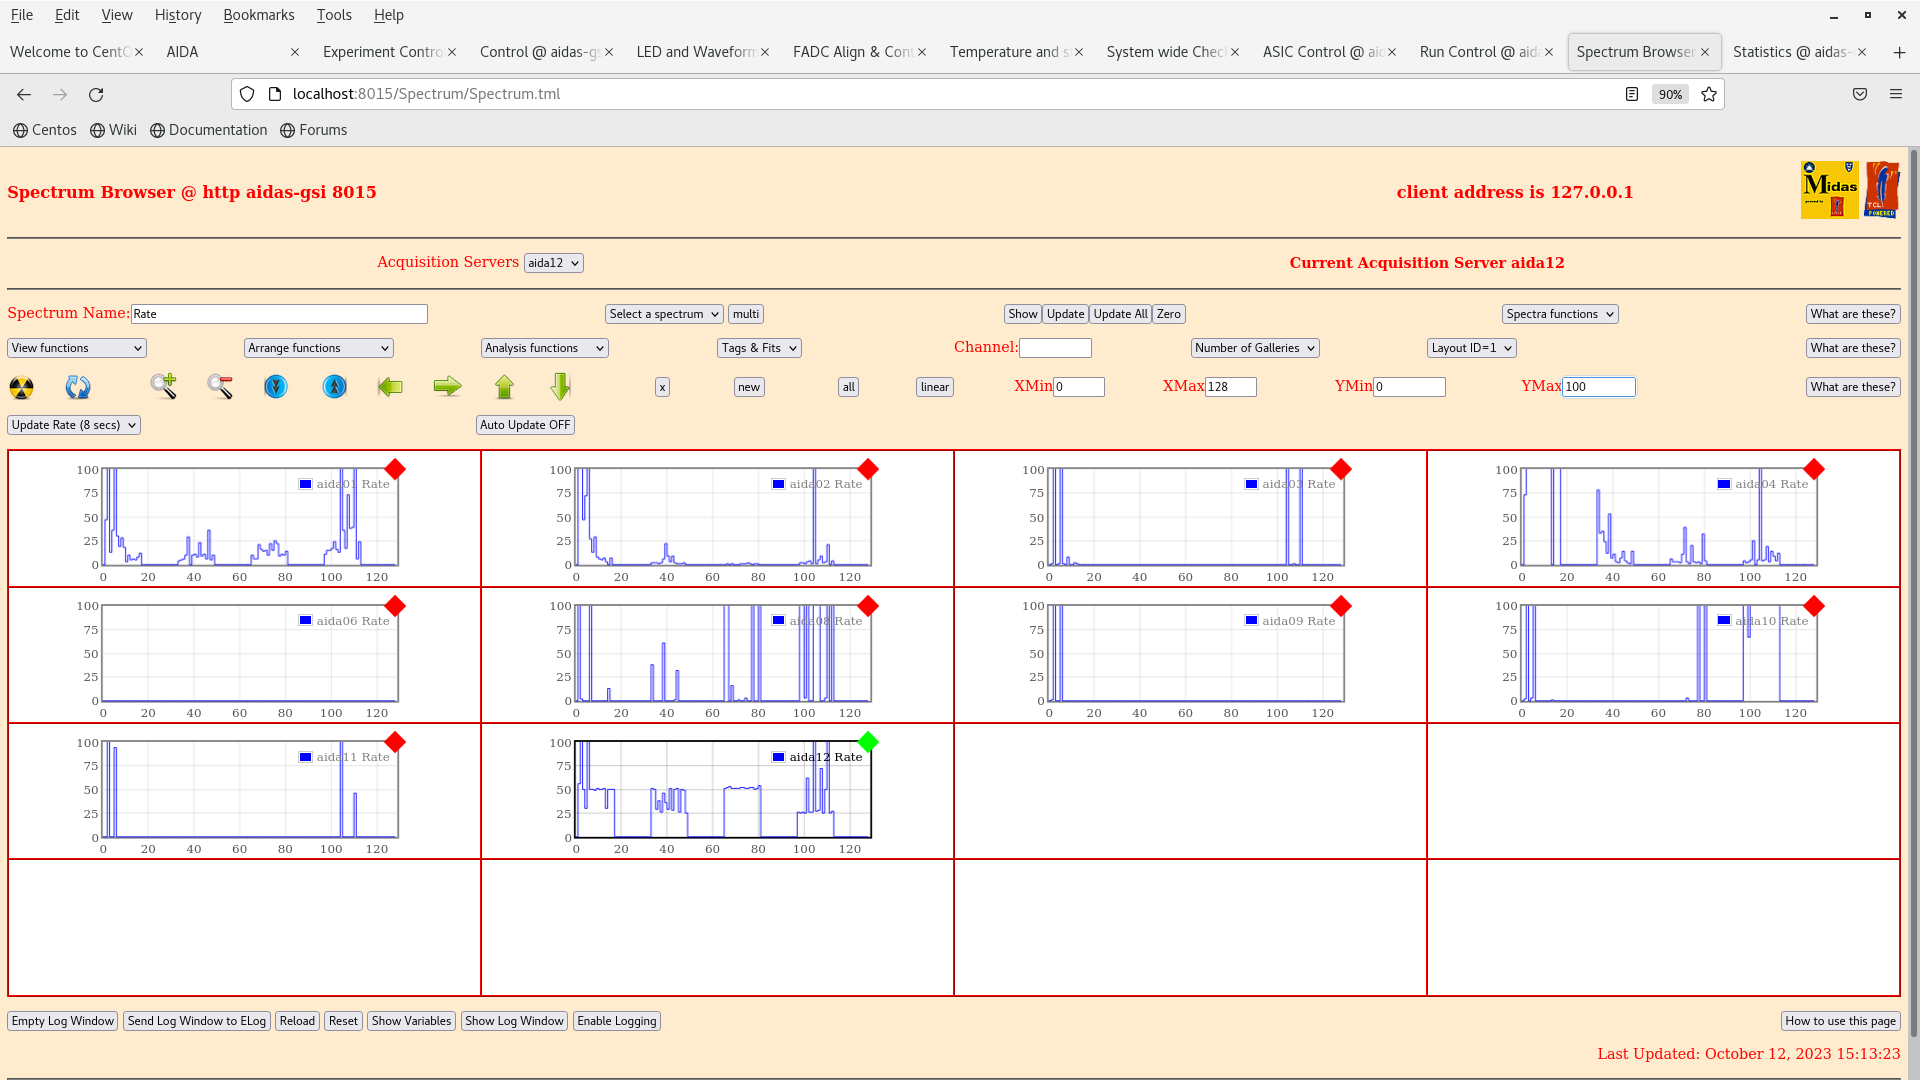
|
| Attachment 2: Screenshot_from_2023-10-12_15-17-05.png
|
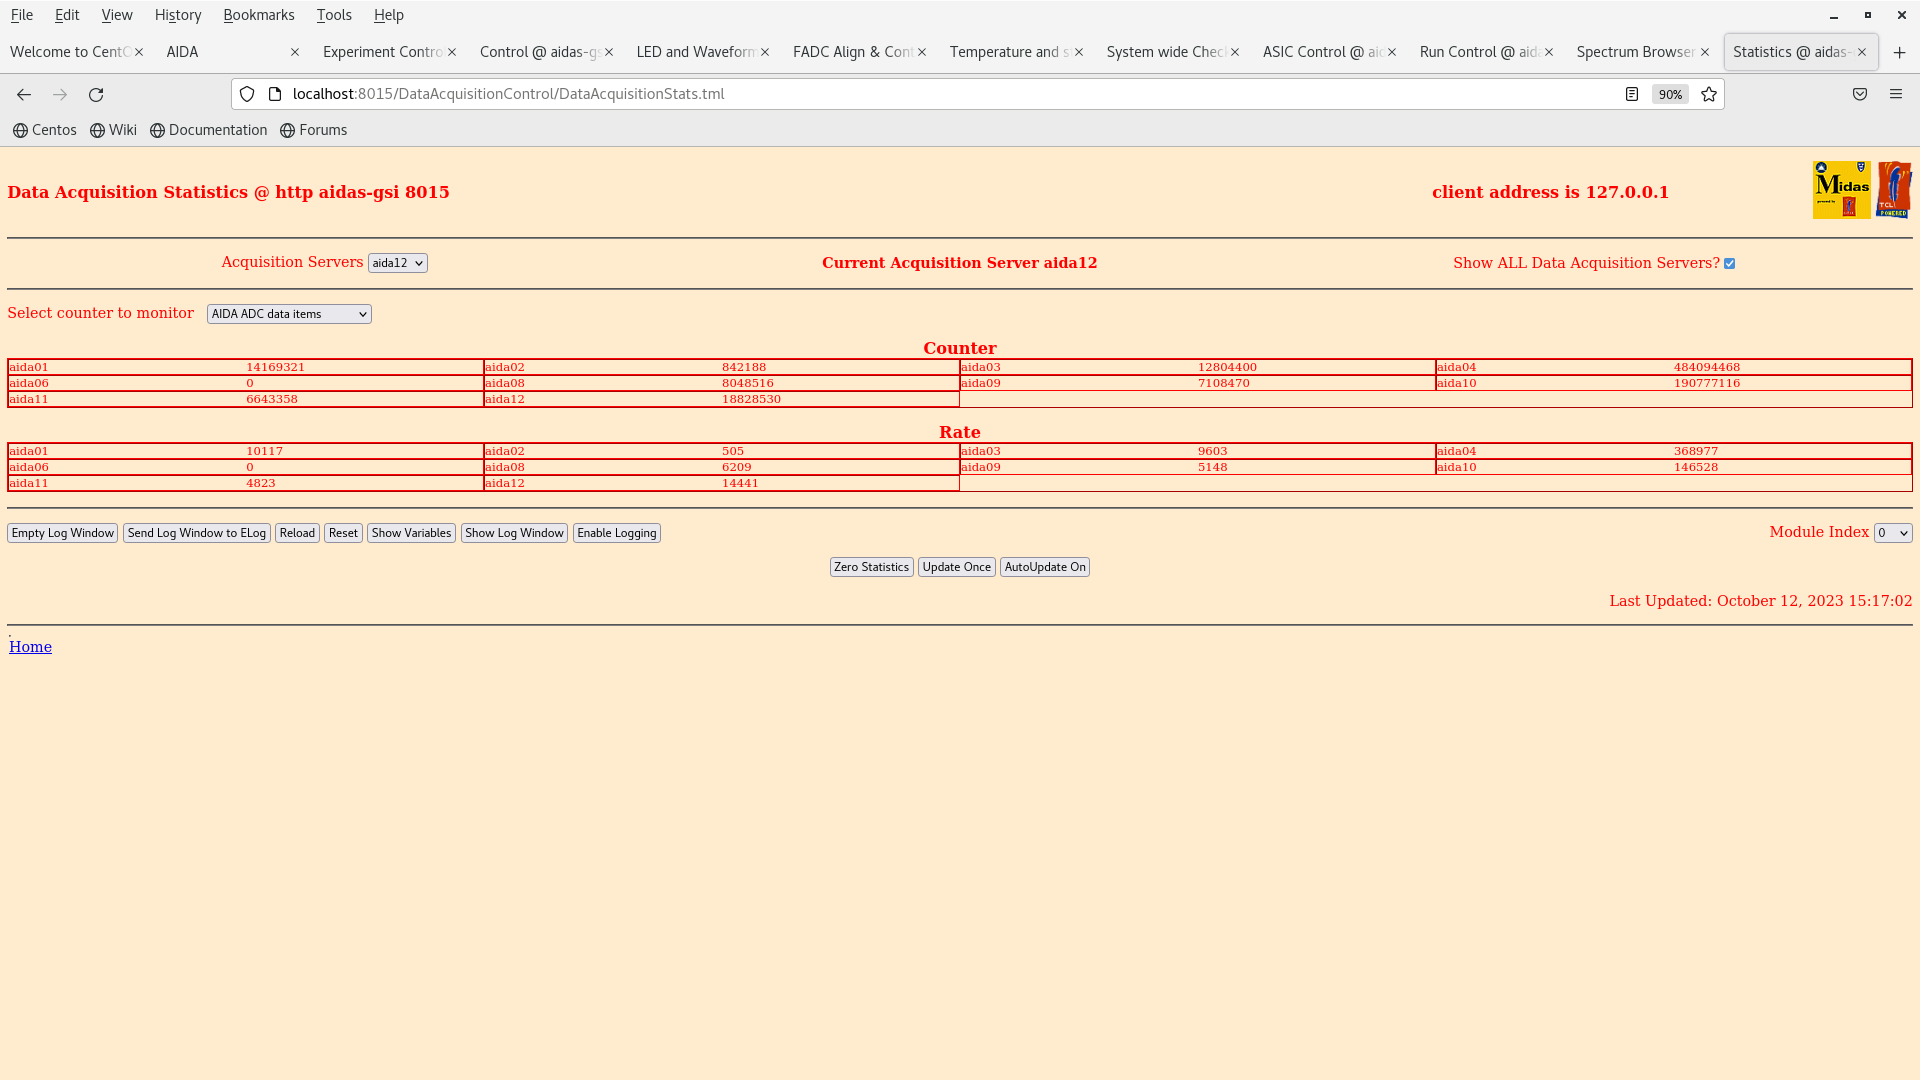
|
|
386
|
Thu Oct 21 09:08:41 2021 |
OH | MIDAS start up messages |
|
| Attachment 1: 8015Startup.txt
|
tidy up
tclsh8.5: no process killed

System identified is CPU x86_64; Platform is unix; OS is Linux and Version is 2.6.32-696.el6.x86_64
Environment selected is CPU x64_64; Platform unix; OS Linux64 and Operating System Linux64
MIDASBASE = /MIDAS and MIDAS_LIBRARY = /MIDAS/TclHttpd/Linux64
PATH = /MIDAS/bin_Linux64:/MIDAS/TclHttpd/Linux64:/MIDAS/Linux/bin64:/usr/lib64/qt-3.3/bin:/usr/local/bin:/usr/bin:/bin:/usr/local/sbin:/usr/sbin:/sbin:/home/npg/bin
Computer Name = aidas-gsi; Temp Directory = /tmp/tcl6376
package limit is not available: can't find package limit
Running with default file descriptor limit
package setuid is not available: can't find package setuid
Could not change to user 50 group 50: not owner
/debug user "debug" password "kr.j1xicijsz"
httpd started on port 8015

Custom startup from /MIDAS/config/TclHttpd/aidas-gsi@8015/startup.tcl
created namespace ::AIDA
/DataBaseAccessServer
/NetVarService
/SigTaskService
loading tcl/AIDARunControl.tcl for namespace ::
RunControlClient provided
DataAcquisitionControlClient
RunControlClient loaded
Completed custom startup from /MIDAS/TclHttpd/Html/AIDA/RunControl/stats.defn.tcl
|
| Attachment 2: 8115startup
|
tidy up
tclsh8.5_copy2: no process killed

System identified is CPU x86_64; Platform is unix; OS is Linux and Version is 2.6.32-696.el6.x86_64
Environment selected is CPU x64_64; Platform unix; OS Linux64 and Operating System Linux64
MIDASBASE = /MIDAS and MIDAS_LIBRARY = /MIDAS/TclHttpd/Linux64
PATH = /MIDAS/bin_Linux64:/MIDAS/TclHttpd/Linux64:/MIDAS/Linux/bin64:/usr/lib64/qt-3.3/bin:/usr/local/bin:/usr/bin:/bin:/usr/local/sbin:/usr/sbin:/sbin:/home/npg/bin
Computer Name = aidas-gsi; Temp Directory = /tmp/tcl24260
package limit is not available: can't find package limit
Running with default file descriptor limit
package setuid is not available: can't find package setuid
Could not change to user 50 group 50: not owner
/debug user "debug" password "qhsbwphtgqqo"
httpd started on port 8115

Custom startup from /MIDAS/config/TclHttpd/aidas-gsi@8115/startup.tcl
/DataBaseAccessServer
/NetVarService
/SigTaskService
Loaded MemSasAccess
/SpectrumService
/TapeServer
loading tcl/NewMergerControl.tcl for namespace ::
/DataAcquisitionControlServer
DefineMessage unknown
Run Control Server Implementation for MERGE
RunControlServer loaded
loading Html/RunControl/implementation.tcl
/MIDAS/TclHttpd/Html/RunControl/common.tcl returned z=1 and couldn't read file "/MIDAS/TclHttpd/Html/RunControl/common.tcl": no such file or directory
ReadRegister failed: Name=NetVar.EXEC.ID; Code= 0x10004; Info= Register name does not exist
Created UI registers
RunControl loaded
loading Html/NewMerger/RunControl/implementation.tcl for namespace ::
ReadRegister failed: Name=NetVar.MERGE.ID; Code= 0x10004; Info= Register name does not exist
Created UI registers
NewMerge Control loaded
Completed custom startup from /MIDAS/TclHttpd/Html/NewMerger/RunControl/stats.defn.tcl
|
| Attachment 3: tapestart.txt
|
Tidy up
master(4653): Operation not permitted
master: no process killed
stats: no process killed
driver: no process killed
linkTCP: no process killed
Starting Tape Server

[1] 24297
MIDAS Tape Server: Message logger not contacted.
MIDAS Tape Server: MIDAS Tape Server Build Mar 16 2021  12:22:14
MIDAS Tape Server: Unable to change scheduling priority - Permission denied
MIDAS Tape Server: Using default startup
MIDAS Tape Server: Configuration: UDP port = 10205, SHM key=10205.
MIDAS Tape Server: File mapped object /SHM_10205 of size 1331104 created
MIDAS Tape Server: Shared memory ID is 3
MIDAS Tape Server: Shared memory segment located at address 7f7081936000.
MIDAS Tape Server: Configuration file used - /MIDAS/config/TS_10205/TS_configuration
MIDAS Tape Server: Stats task /MIDAS/TapeServer/Linux64/stats
MIDAS Tape Server: Using device file /dev/file/0 /MIDAS/TapeServer/Linux64/driver
MIDAS Tape Server: Using device file /dev/file/1 /MIDAS/TapeServer/Linux64/driver
MIDAS Tape Server: Using device sink /dev/null/0 /MIDAS/TapeServer/Linux64/driver
MIDAS Tape Server: Data link /MIDAS/TapeServer/Linux64/linkTCP 10305
MIDAS Tape Server: Data link /MIDAS/TapeServer/Linux64/linkTCP 21001 21002
MIDAS Tape Server: Message reporting level = 0x180fff8
MIDAS Tape Server: Message logging level = 0xfff8
MIDAS Tape Server: Tape Server Options = 0x0
MIDAS Tape Server: File device path base = /TapeData
MIDAS Tape Server: Data buffer size = 65536
MIDAS Tape Server: Tape block size = 65536
MIDAS Tape Server: File mapped object /SHM_110205 of size 4195880 created
MIDAS Tape Server: Shared memory ID is 3
MIDAS Tape Server: Shared memory segment located at address 7f7081535000.
MIDAS Tape Server: File mapped object /SHM_210205 of size 3100 created
MIDAS Tape Server: Shared memory ID is 3
MIDAS Tape Server: Shared memory segment located at address 7f7081a96000.
MIDAS Tape Server: Capabilities restored.
MIDAS Tape Server: Master global area initialised.
MIDAS Tape Server: Stats task has pid 24299
MIDAS Tape Server: Driver process for /dev/file/0 has pid 24300
MIDAS Tape Server: Driver process for /dev/file/1 has pid 24301
MIDAS Tape Server: Driver process for /dev/null/0 has pid 24302
MIDAS Tape Server: Link task 0 has pid 24303
MIDAS Tape Server: Link task 1 has pid 24304
MIDAS Tape Server: Starting the RPC interface
MIDAS Tape Server: Created RPC Program 28000205 Version 4 on UDP port 10205.
MIDAS Tape Server: Entering server loop
MIDAS Tape Server: MIDAS Tape Server now available on UDP port 10205.
MIDAS Tape Statistics: Message logger not contacted.
MIDAS Tape Statistics: MIDAS Tape Statistics Build Mar 16 2021  12:22:20
MIDAS Tape Statistics: Started with args 10205
MIDAS Tape Statistics: Configuration: SHM key=10205
MIDAS Tape Statistics: File mapped object /SHM_10205 of size 1331104 created
MIDAS Tape Statistics: Shared memory ID is 3
MIDAS Tape Statistics: Shared memory segment located at address 7fb07f300000.
MIDAS Tape Driver (24302): Message logger not contacted.
MIDAS Tape Driver (24302): Message logger not contacted.
MIDAS Tape Driver (24302): Started with args 2 10205
MIDAS Tape Driver (24302): Configuration: driver=2, key=10205.
MIDAS Tape Driver (24302): File mapped object /SHM_10205 of size 1331104 created
MIDAS Tape Driver (24302): Shared memory ID is 3
MIDAS Tape Driver (24302): Shared memory segment located at address 7f183708f000.
MIDAS Tape Driver (24302): Using device /dev/null/0 of type sink.
MIDAS Tape Driver (24300): Message logger not contacted.
MIDAS Tape Driver (24301): Message logger not contacted.
MIDAS Tape Driver (24300): Message logger not contacted.
MIDAS Tape Driver (24301): Message logger not contacted.
MIDAS Tape Driver (24300): Started with args 0 10205
MIDAS Tape Driver (24301): Started with args 1 10205
MIDAS Tape Driver (24301): Configuration: driver=1, key=10205.
MIDAS Tape Driver (24300): Configuration: driver=0, key=10205.
MIDAS Tape Driver (24301): File mapped object /SHM_10205 of size 1331104 created
MIDAS Tape Driver (24300): File mapped object /SHM_10205 of size 1331104 created
MIDAS Tape Driver (24301): Shared memory ID is 3
MIDAS Tape Driver (24300): Shared memory ID is 3
MIDAS Tape Driver (24300): Shared memory segment located at address 7f3b2d8cd000.
MIDAS Tape Driver (24301): Shared memory segment located at address 7ffb5e9ba000.
MIDAS Tape Driver (24300): Using device /dev/file/0 of type file.
MIDAS Tape Driver (24301): Using device /dev/file/1 of type file.
MIDAS Data Link (24304): Message logger not contacted.
MIDAS Data Link (24304): MIDAS Tape Data Link Build Mar 16 2021  12:22:19
MIDAS Data Link (24304): Started with args 10205 21001 21002
MIDAS Data Link (24304): Configuration: SHM key=10205, TCP port = 21001, Data Stream = 2
MIDAS Data Link (24304): File mapped object /SHM_10205 of size 1331104 created
MIDAS Data Link (24304): Shared memory ID is 3
MIDAS Data Link (24304): Shared memory segment located at address 7f7452b59000.
MIDAS Data Link (24303): Message logger not contacted.
MIDAS Data Link (24304): Starting the network interface
MIDAS Data Link (24303): MIDAS Tape Data Link Build Mar 16 2021  12:22:19
MIDAS Data Link (24303): Started with args 10205 10305
MIDAS Data Link (24303): Configuration: SHM key=10205, TCP port = 10305, Data Stream = 1
MIDAS Data Link (24303): File mapped object /SHM_10205 of size 1331104 created
MIDAS Data Link (24303): Shared memory ID is 3
MIDAS Data Link (24303): Shared memory segment located at address 7f754106b000.
MIDAS Data Link (24303): Starting the network interface
MIDAS Data Link (24303): TCP socket receive buffer was 87380 - now 249856
MIDAS Data Link (24303): TCP socket send buffer was 16384 - now 249856
MIDAS Data Link (24303): MIDAS Data Link thread 0 using TCP port 10305.
MIDAS Data Link (24303): Entering server loop
MIDAS Data Link (24303): thread 0 listening on port 10305
MIDAS Data Link (24304): TCP socket receive buffer was 87380 - now 249856
MIDAS Data Link (24304): TCP socket send buffer was 16384 - now 249856
MIDAS Data Link (24304): MIDAS Data Link thread 0 using TCP port 21001.
MIDAS Data Link (24304): TCP socket receive buffer was 87380 - now 249856
MIDAS Data Link (24304): TCP socket send buffer was 16384 - now 249856
MIDAS Data Link (24304): MIDAS Data Link thread 1 using TCP port 21002.
MIDAS Data Link (24304): Entering server loop
MIDAS Data Link (24304): thread 0 listening on port 21001
MIDAS Data Link (24304): thread 1 listening on port 21002
|
| Attachment 4: mergerstart.txt
|
Tidy up
MERGE: no process killed
merge64.AD: no process killed
master64: no process killed
link64: no process killed
merge64: no process killed
statrate64: no process killed
Starting New Merger

[1] 24325
MERGE Master (24325): Message logger not contacted.
MERGE Master (24325): MIDAS MERGE Server 64 bit Build May 11 2021  20:32:01
Creating NetVars
Creating NetVars complete
MERGE Master (24325): MIDAS MERGE Server 64 bit Build May 11 2021  20:32:01
MERGE Master (24325): Configuration: TCP port base=11001 ; SHM key=11000; ids=16; links=16; Hardware=0
MERGE Master (24325): File mapped object /SHM_11000 of size 536628 created
MERGE Master (24325): Memory mapping 536628 bytes
MERGE Master (24325): Shared memory segment located at address 0x7f5efe67a000.
MERGE Master (24325): File mapped object /SHM_11001 of size 100669480 created
MERGE Master (24325): Memory mapping 100669480 bytes
MERGE Master (24325): Shared memory segment located at address 0x7f5ef8678000.
MERGE Master (24325): File mapped object /SHM_11002 of size 100669480 created
MERGE Master (24325): Memory mapping 100669480 bytes
MERGE Master (24325): Shared memory segment located at address 0x7f5ef2676000.
MERGE Master (24325): File mapped object /SHM_11003 of size 100669480 created
MERGE Master (24325): Memory mapping 100669480 bytes
MERGE Master (24325): Shared memory segment located at address 0x7f5eec674000.
MERGE Master (24325): File mapped object /SHM_11004 of size 100669480 created
MERGE Master (24325): Memory mapping 100669480 bytes
MERGE Master (24325): Shared memory segment located at address 0x7f5ee6672000.
MERGE Master (24325): File mapped object /SHM_11005 of size 100669480 created
MERGE Master (24325): Memory mapping 100669480 bytes
MERGE Master (24325): Shared memory segment located at address 0x7f5ee0670000.
MERGE Master (24325): File mapped object /SHM_11006 of size 100669480 created
MERGE Master (24325): Memory mapping 100669480 bytes
MERGE Master (24325): Shared memory segment located at address 0x7f5eda66e000.
MERGE Master (24325): File mapped object /SHM_11007 of size 100669480 created
MERGE Master (24325): Memory mapping 100669480 bytes
MERGE Master (24325): Shared memory segment located at address 0x7f5ed466c000.
MERGE Master (24325): File mapped object /SHM_11008 of size 100669480 created
MERGE Master (24325): Memory mapping 100669480 bytes
MERGE Master (24325): Shared memory segment located at address 0x7f5ece66a000.
MERGE Master (24325): File mapped object /SHM_11009 of size 100669480 created
MERGE Master (24325): Memory mapping 100669480 bytes
MERGE Master (24325): Shared memory segment located at address 0x7f5ec8668000.
MERGE Master (24325): File mapped object /SHM_11010 of size 100669480 created
MERGE Master (24325): Memory mapping 100669480 bytes
MERGE Master (24325): Shared memory segment located at address 0x7f5ec2666000.
MERGE Master (24325): File mapped object /SHM_11011 of size 100669480 created
MERGE Master (24325): Memory mapping 100669480 bytes
MERGE Master (24325): Shared memory segment located at address 0x7f5ebc664000.
MERGE Master (24325): File mapped object /SHM_11012 of size 100669480 created
MERGE Master (24325): Memory mapping 100669480 bytes
MERGE Master (24325): Shared memory segment located at address 0x7f5eb6662000.
MERGE Master (24325): File mapped object /SHM_11013 of size 100669480 created
MERGE Master (24325): Memory mapping 100669480 bytes
MERGE Master (24325): Shared memory segment located at address 0x7f5eb0660000.
MERGE Master (24325): File mapped object /SHM_11014 of size 100669480 created
MERGE Master (24325): Memory mapping 100669480 bytes
MERGE Master (24325): Shared memory segment located at address 0x7f5eaa65e000.
MERGE Master (24325): File mapped object /SHM_11015 of size 100669480 created
MERGE Master (24325): Memory mapping 100669480 bytes
MERGE Master (24325): Shared memory segment located at address 0x7f5ea465c000.
MERGE Master (24325): File mapped object /SHM_11016 of size 100669480 created
MERGE Master (24325): Memory mapping 100669480 bytes
MERGE Master (24325): Shared memory segment located at address 0x7f5e9e65a000.
MERGE Master (24325): Shared memory segment located at address 0x7f5e9e65a000.
MERGE Master (24325): Starting stats/rates task
MERGE Master (24325): Stats/Rates task has pid 24327
MERGE Master (24325): Starting 16 link tasks
MERGE Master (24325): Link task has pid 24328
MERGE Master (24325): Link task has pid 24329
MERGE Master (24325): Link task has pid 24330
MERGE Master (24325): Link task has pid 24331
MERGE Master (24325): Link task has pid 24332
MERGE Master (24325): Link task has pid 24333
MERGE Master (24325): Link task has pid 24334
MERGE Master (24325): Link task has pid 24335
MERGE Master (24325): Link task has pid 24336
MERGE Master (24325): Link task has pid 24337
MERGE Statistics/Rates (24327): Message logger not contacted.
MERGE Statistics/Rates (24327): MIDAS MERGE Statistics 64 bit Build May 11 2021  20:32:03
Creating NetVars
Creating NetVars complete
MERGE Master (24325): Link task has pid 24338
MERGE Master (24325): Link task has pid 24339
MERGE Master (24325): Link task has pid 24340
MERGE Master (24325): Link task has pid 24341
MERGE Master (24325): Link task has pid 24342
MERGE Master (24325): Link task has pid 24343
MERGE Data Link (24329): Message logger not contacted.
MERGE Data Link (24330): Message logger not contacted.
MERGE Data Link (24330): MIDAS MERGE Data Link 64 bit Build May 11 2021  20:32:02
MERGE Data Link (24329): MIDAS MERGE Data Link 64 bit Build May 11 2021  20:32:02
Creating NetVars
Creating NetVars
Creating NetVars complete
MERGE Data Link (24330): Configuration: index = 2, SHM key=11000, TCP port base = 11003, module = 1, hardware = 0
MERGE Data Link (24330): File mapped object /SHM_11000 accessed
MERGE Data Link (24330): Memory mapping 536628 bytes
MERGE Data Link (24330): Shared memory segment located at address 0x7f6556fb6000.
MERGE Data Link (24330): Allocated 71720 bytes for local input buffer
MERGE Data Link (24330): File mapped object /SHM_11003 accessed
MERGE Data Link (24330): Memory mapping 100669480 bytes
MERGE Data Link (24330): Shared memory segment located at address 0x7f6550fb4000.
MERGE Data Link (24328): Message logger not contacted.
MERGE Data Link (24328): MIDAS MERGE Data Link 64 bit Build May 11 2021  20:32:02
Creating NetVars
Creating NetVars complete
MERGE Data Link (24328): Configuration: index = 0, SHM key=11000, TCP port base = 11001, module = -1, hardware = 0
MERGE Data Link (24328): File mapped object /SHM_11000 accessed
MERGE Data Link (24328): Memory mapping 536628 bytes
MERGE Data Link (24328): Shared memory segment located at address 0x7efe94f4e000.
MERGE Data Link (24328): Allocated 71720 bytes for local input buffer
MERGE Data Link (24328): File mapped object /SHM_11001 accessed
MERGE Data Link (24328): Memory mapping 100669480 bytes
MERGE Data Link (24328): Shared memory segment located at address 0x7efe8ef4c000.
MERGE Data Link (24336): Message logger not contacted.
MERGE Data Link (24336): MIDAS MERGE Data Link 64 bit Build May 11 2021  20:32:02
Creating NetVars
Creating NetVars complete
MERGE Data Link (24336): Configuration: index = 8, SHM key=11000, TCP port base = 11009, module = 7, hardware = 0
MERGE Data Link (24336): File mapped object /SHM_11000 accessed
MERGE Data Link (24336): Memory mapping 536628 bytes
MERGE Data Link (24336): Shared memory segment located at address 0x7f020eeee000.
MERGE Data Link (24336): Allocated 71720 bytes for local input buffer
MERGE Data Link (24336): File mapped object /SHM_11009 accessed
MERGE Data Link (24336): Memory mapping 100669480 bytes
MERGE Data Link (24336): Shared memory segment located at address 0x7f0208eec000.
MERGE Data Link (24331): Message logger not contacted.
MERGE Data Link (24331): MIDAS MERGE Data Link 64 bit Build May 11 2021  20:32:02
Creating NetVars
Creating NetVars complete
MERGE Data Link (24331): Configuration: index = 3, SHM key=11000, TCP port base = 11004, module = 2, hardware = 0
MERGE Data Link (24331): File mapped object /SHM_11000 accessed
MERGE Data Link (24331): Memory mapping 536628 bytes
MERGE Data Link (24331): Shared memory segment located at address 0x7f44daa69000.
MERGE Data Link (24331): Allocated 71720 bytes for local input buffer
MERGE Data Link (24331): File mapped object /SHM_11004 accessed
MERGE Data Link (24331): Memory mapping 100669480 bytes
MERGE Data Link (24331): Shared memory segment located at address 0x7f44d4a67000.
MERGE Data Link (24337): Message logger not contacted.
MERGE Data Link (24337): MIDAS MERGE Data Link 64 bit Build May 11 2021  20:32:02
Creating NetVars
MERGE Data Link (24334): Message logger not contacted.
MERGE Data Link (24334): MIDAS MERGE Data Link 64 bit Build May 11 2021  20:32:02
MERGE Data Link (24343): Message logger not contacted.
Creating NetVars
MERGE Data Link (24343): MIDAS MERGE Data Link 64 bit Build May 11 2021  20:32:02
Creating NetVars
MERGE Data Link (24333): Message logger not contacted.
MERGE Data Link (24333): MIDAS MERGE Data Link 64 bit Build May 11 2021  20:32:02
Creating NetVars
MERGE Data Link (24335): Message logger not contacted.
MERGE Data Link (24342): Message logger not contacted.
MERGE Data Link (24342): MIDAS MERGE Data Link 64 bit Build May 11 2021  20:32:02
MERGE Data Link (24335): MIDAS MERGE Data Link 64 bit Build May 11 2021  20:32:02
Creating NetVars
Creating NetVars
MERGE Data Link (24341): Message logger not contacted.
Creating NetVars complete
MERGE Data Link (24337): Configuration: index = 9, SHM key=11000, TCP port base = 11010, module = 8, hardware = 0
MERGE Data Link (24337): File mapped object /SHM_11000 accessed
MERGE Data Link (24341): MIDAS MERGE Data Link 64 bit Build May 11 2021  20:32:02
MERGE Data Link (24337): Memory mapping 536628 bytes
MERGE Data Link (24337): Shared memory segment located at address 0x7f12856cb000.
Creating NetVars
Creating NetVars complete
MERGE Data Link (24334): Configuration: index = 6, SHM key=11000, TCP port base = 11007, module = 5, hardware = 0
MERGE Data Link (24334): File mapped object /SHM_11000 accessed
MERGE Data Link (24334): Memory mapping 536628 bytes
MERGE Data Link (24332): Message logger not contacted.
MERGE Data Link (24334): Shared memory segment located at address 0x7fb1348e4000.
MERGE Data Link (24337): Allocated 71720 bytes for local input buffer
MERGE Data Link (24337): File mapped object /SHM_11010 accessed
MERGE Data Link (24332): MIDAS MERGE Data Link 64 bit Build May 11 2021  20:32:02
MERGE Data Link (24337): Memory mapping 100669480 bytes
MERGE Data Link (24340): Message logger not contacted.
MERGE Data Link (24337): Shared memory segment located at address 0x7f127f6c9000.
Creating NetVars
MERGE Data Link (24340): MIDAS MERGE Data Link 64 bit Build May 11 2021  20:32:02
MERGE Data Link (24334): Allocated 71720 bytes for local input buffer
Creating NetVars
MERGE Data Link (24334): File mapped object /SHM_11007 accessed
MERGE Data Link (24334): Memory mapping 100669480 bytes
MERGE Data Link (24334): Shared memory segment located at address 0x7fb12e8e2000.
MERGE Data Link (24339): Message logger not contacted.
MERGE Data Link (24339): MIDAS MERGE Data Link 64 bit Build May 11 2021  20:32:02
Creating NetVars
Creating NetVars complete
MERGE Data Link (24333): Configuration: index = 5, SHM key=11000, TCP port base = 11006, module = 4, hardware = 0
Creating NetVars complete
MERGE Data Link (24333): File mapped object /SHM_11000 accessed
MERGE Data Link (24333): Memory mapping 536628 bytes
MERGE Data Link (24335): Configuration: index = 7, SHM key=11000, TCP port base = 11008, module = 6, hardware = 0
MERGE Data Link (24333): Shared memory segment located at address 0x7f3a30878000.
MERGE Data Link (24335): File mapped object /SHM_11000 accessed
MERGE Data Link (24335): Memory mapping 536628 bytes
MERGE Data Link (24335): Shared memory segment located at address 0x7fd567c53000.
MERGE Data Link (24333): Allocated 71720 bytes for local input buffer
MERGE Data Link (24335): Allocated 71720 bytes for local input buffer
MERGE Data Link (24335): File mapped object /SHM_11008 accessed
MERGE Data Link (24335): Memory mapping 100669480 bytes
MERGE Data Link (24335): Shared memory segment located at address 0x7fd561c51000.
MERGE Data Link (24333): File mapped object /SHM_11006 accessed
MERGE Data Link (24333): Memory mapping 100669480 bytes
MERGE Data Link (24333): Shared memory segment located at address 0x7f3a2a876000.
Creating NetVars complete
MERGE Data Link (24341): Configuration: index = 13, SHM key=11000, TCP port base = 11014, module = 12, hardware = 0
MERGE Data Link (24341): File mapped object /SHM_11000 accessed
MERGE Data Link (24341): Memory mapping 536628 bytes
MERGE Data Link (24341): Shared memory segment located at address 0x7f84b1fef000.
MERGE Data Link (24341): Allocated 71720 bytes for local input buffer
MERGE Data Link (24341): File mapped object /SHM_11014 accessed
MERGE Data Link (24341): Memory mapping 100669480 bytes
MERGE Data Link (24341): Shared memory segment located at address 0x7f84abfed000.
Creating NetVars complete
Creating NetVars complete
MERGE Data Link (24332): Configuration: index = 4, SHM key=11000, TCP port base = 11005, module = 3, hardware = 0
MERGE Data Link (24340): Configuration: index = 12, SHM key=11000, TCP port base = 11013, module = 11, hardware = 0
MERGE Data Link (24332): File mapped object /SHM_11000 accessed
MERGE Data Link (24332): Memory mapping 536628 bytes
MERGE Data Link (24332): Shared memory segment located at address 0x7fc8787db000.
MERGE Data Link (24340): File mapped object /SHM_11000 accessed
MERGE Data Link (24340): Memory mapping 536628 bytes
MERGE Data Link (24340): Shared memory segment located at address 0x7f9523835000.
Creating NetVars complete
MERGE Data Link (24339): Configuration: index = 11, SHM key=11000, TCP port base = 11012, module = 10, hardware = 0
MERGE Data Link (24332): Allocated 71720 bytes for local input buffer
MERGE Data Link (24340): Allocated 71720 bytes for local input buffer
MERGE Data Link (24339): File mapped object /SHM_11000 accessed
MERGE Data Link (24332): File mapped object /SHM_11005 accessed
MERGE Data Link (24339): Memory mapping 536628 bytes
MERGE Data Link (24332): Memory mapping 100669480 bytes
MERGE Data Link (24339): Shared memory segment located at address 0x7ff8a2e8c000.
MERGE Data Link (24332): Shared memory segment located at address 0x7fc8727d9000.
MERGE Data Link (24340): File mapped object /SHM_11013 accessed
MERGE Data Link (24340): Memory mapping 100669480 bytes
MERGE Data Link (24340): Shared memory segment located at address 0x7f951d833000.
MERGE Data Link (24339): Allocated 71720 bytes for local input buffer
MERGE Data Link (24339): File mapped object /SHM_11012 accessed
MERGE Data Link (24339): Memory mapping 100669480 bytes
MERGE Data Link (24339): Shared memory segment located at address 0x7ff89ce8a000.
MERGE Data Link (24338): Message logger not contacted.
MERGE Data Link (24338): MIDAS MERGE Data Link 64 bit Build May 11 2021  20:32:02
Creating NetVars
Creating NetVars complete
MERGE Data Link (24338): Configuration: index = 10, SHM key=11000, TCP port base = 11011, module = 9, hardware = 0
MERGE Data Link (24338): File mapped object /SHM_11000 accessed
MERGE Data Link (24338): Memory mapping 536628 bytes
MERGE Data Link (24338): Shared memory segment located at address 0x7f62f5191000.
MERGE Data Link (24338): Allocated 71720 bytes for local input buffer
MERGE Data Link (24338): File mapped object /SHM_11011 accessed
MERGE Data Link (24338): Memory mapping 100669480 bytes
MERGE Data Link (24338): Shared memory segment located at address 0x7f62ef18f000.
MERGE Statistics/Rates (24327): MIDAS MERGE Statistics 64 bit Build May 11 2021  20:32:03
MERGE Statistics thread starting
MERGE Data Link (24330): Shared memory segment located at address 0x7f6550fb4000.
MERGE Data Link (24330): Shared memory segment located at address 0x7f6550fb4000.
MERGE Data Link (24335): Shared memory segment located at address 0x7fd561c51000.
MERGE Data Link (24335): Shared memory segment located at address 0x7fd561c51000.
MERGE Data Link (24338): Shared memory segment located at address 0x7f62ef18f000.
MERGE Data Link (24338): Shared memory segment located at address 0x7f62ef18f000.
MERGE Data Link (24336): Shared memory segment located at address 0x7f0208eec000.
MERGE Data Link (24336): Shared memory segment located at address 0x7f0208eec000.
MERGE Data Link (24328): Shared memory segment located at address 0x7efe8ef4c000.
MERGE Data Link (24328): Shared memory segment located at address 0x7efe8ef4c000.
MERGE Data Link (24331): Shared memory segment located at address 0x7f44d4a67000.
MERGE Data Link (24331): Shared memory segment located at address 0x7f44d4a67000.
MERGE Data Link (24341): Shared memory segment located at address 0x7f84abfed000.
MERGE Data Link (24341): Shared memory segment located at address 0x7f84abfed000.
MERGE Data Link (24334): Shared memory segment located at address 0x7fb12e8e2000.
MERGE Data Link (24334): Shared memory segment located at address 0x7fb12e8e2000.
MERGE Data Link (24339): Shared memory segment located at address 0x7ff89ce8a000.
MERGE Data Link (24339): Shared memory segment located at address 0x7ff89ce8a000.
MERGE Data Link (24332): Shared memory segment located at address 0x7fc8727d9000.
MERGE Data Link (24332): Shared memory segment located at address 0x7fc8727d9000.
MERGE Data Link (24337): Shared memory segment located at address 0x7f127f6c9000.
MERGE Data Link (24337): Shared memory segment located at address 0x7f127f6c9000.
MERGE Data Link (24340): Shared memory segment located at address 0x7f951d833000.
MERGE Data Link (24340): Shared memory segment located at address 0x7f951d833000.
MERGE Data Link (24333): Shared memory segment located at address 0x7f3a2a876000.
MERGE Data Link (24333): Shared memory segment located at address 0x7f3a2a876000.
|
| Attachment 5: datarelay.txt
|
Tidy up
DataRelayMBS: no process killed
Starting Data Relay to MBS

Setting Overlap Mode 0
Setting Blocking Mode 0
Setting nice 1
Setting Endian 1
Setting Transfer Mode 4
Setting Transfer Block Size 65536
TCP transfer library version 4.0
0: TCP socket send buffer was 16384 - now 249856
0: TCP socket receive buffer was 87380 - now 249856
0: TCP socket created OK - now connecting to x86l-94 port 6500
Transfer Error - : Connection refused
Error 111
0: connect() failed:
Installing signal handlers for MBS connection
Unable to set signal handler for 9
Unable to set signal handler for 19
Unable to set signal handler for 32
Unable to set signal handler for 33
sigtrap 0
sigtrap 0
TCP transfer library version 4.0
0: TCP socket send buffer was 16384 - now 249856
0: TCP socket receive buffer was 87380 - now 249856
0: TCP socket created OK - now connecting to x86l-94 port 6500
Transfer Error - : Connection refused
Error 111
0: connect() failed:
Sent Start to MBS with code=-1
sigtrap 0
dataSpy Shared buffer area 0 (/SHM_110205) located at 0x6a586000
dataSpy Current age 0 index 0
Spy open = 0
|
|
377
|
Thu Aug 19 10:47:13 2021 |
TD | MIDAS spectra |
|
| Attachment 1: AIDA_spectra_190821.tar.gz
|
|
113
|
Thu Dec 19 13:09:32 2019 |
TD | MIDAS app launcher command lines |
App                          Path

TclHttpd @ 8015 for AIDA     /MIDAS/Linux/startup/HTTPD
TclHttpd @ 8115 for AIDA     /MIDAS/Linux/startup/HTTPD@8115

TapeServer                   /MIDAS/Linux/startup/TapeServer
New Merger for AIDA          /MIDAS/Linux/startup/NewMerger

MBS Relay /MIDAS/Linux/startup/datarelaymbs |