AIDA GELINA BRIKEN nToF CRIB ISOLDE CIRCE nTOFCapture DESPEC DTAS EDI_PSA 179Ta CARME StellarModelling DCF K40
  DESPEC, Page 34 of 37  ELOG logo
ID Date Author Subjectdown
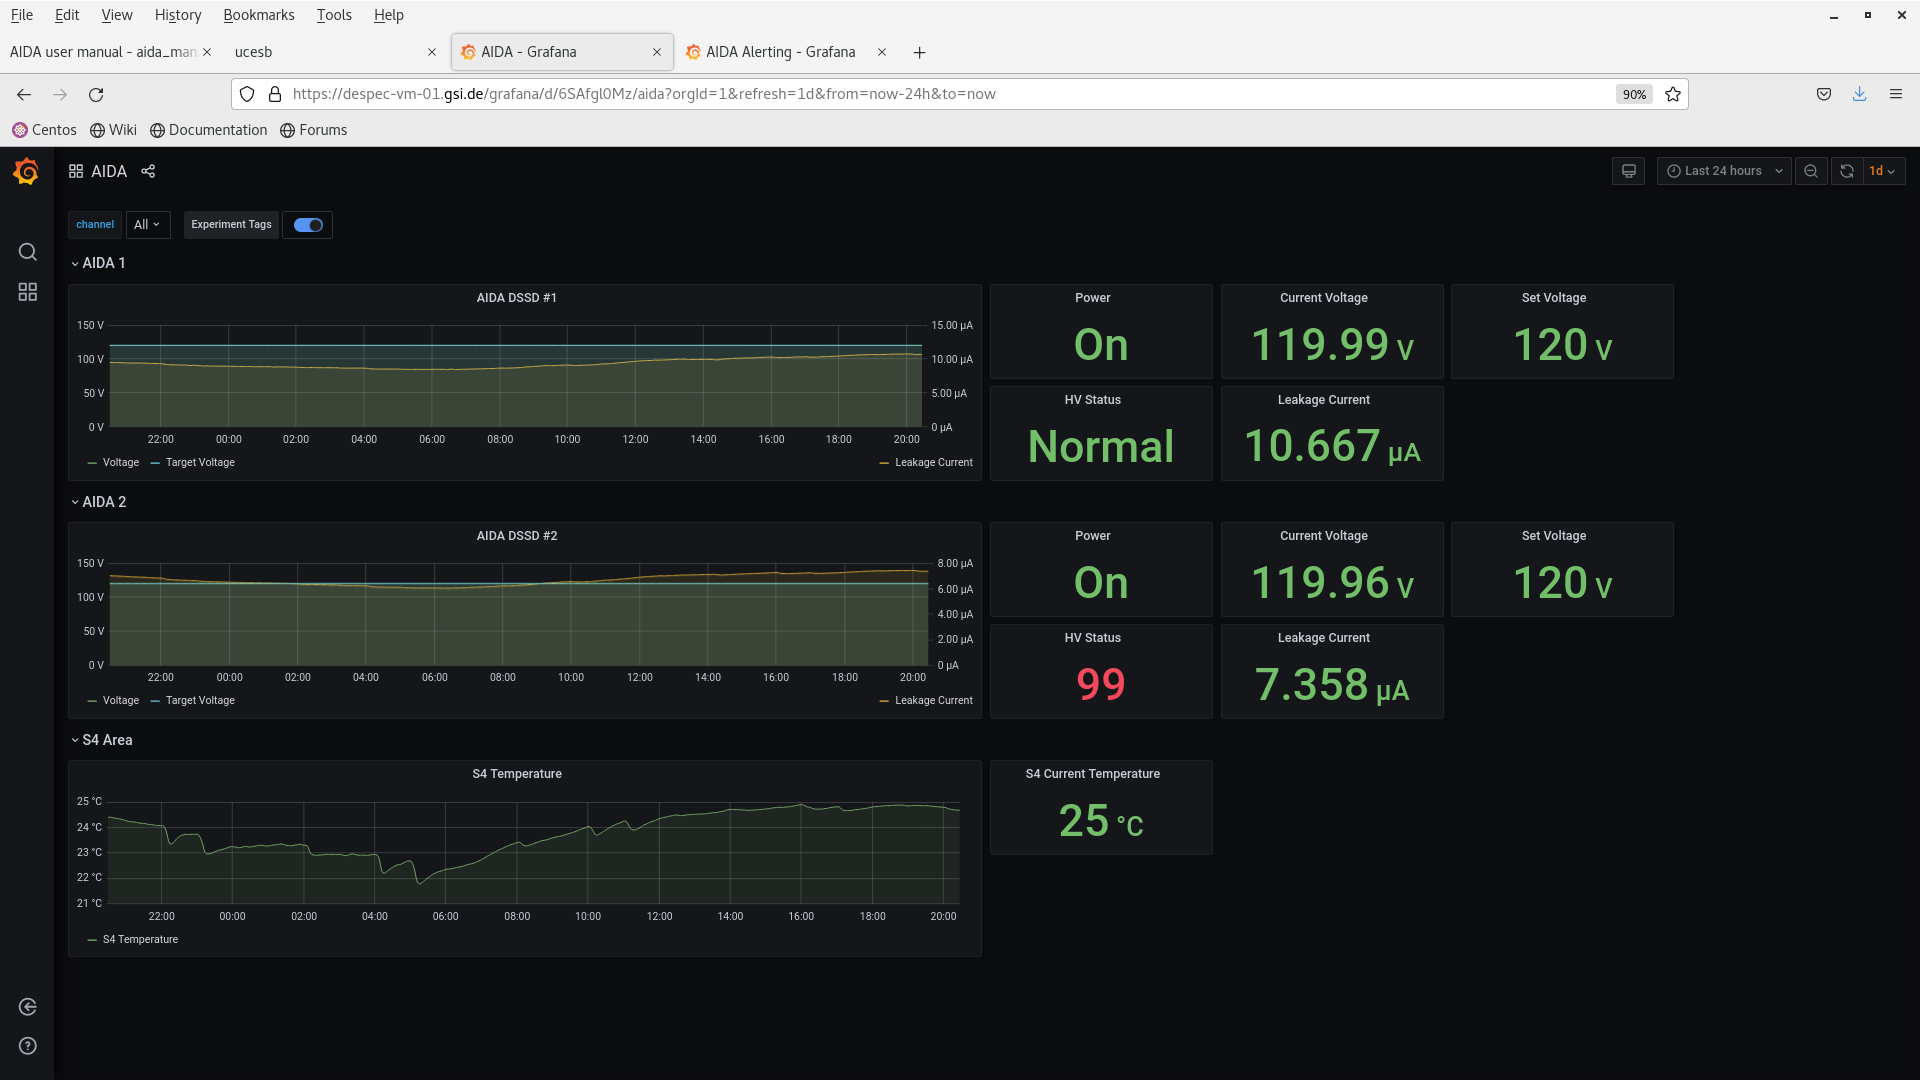
  646   Sun Jun 9 22:49:56 2024 TD23:00-07:00 Monday 9 June
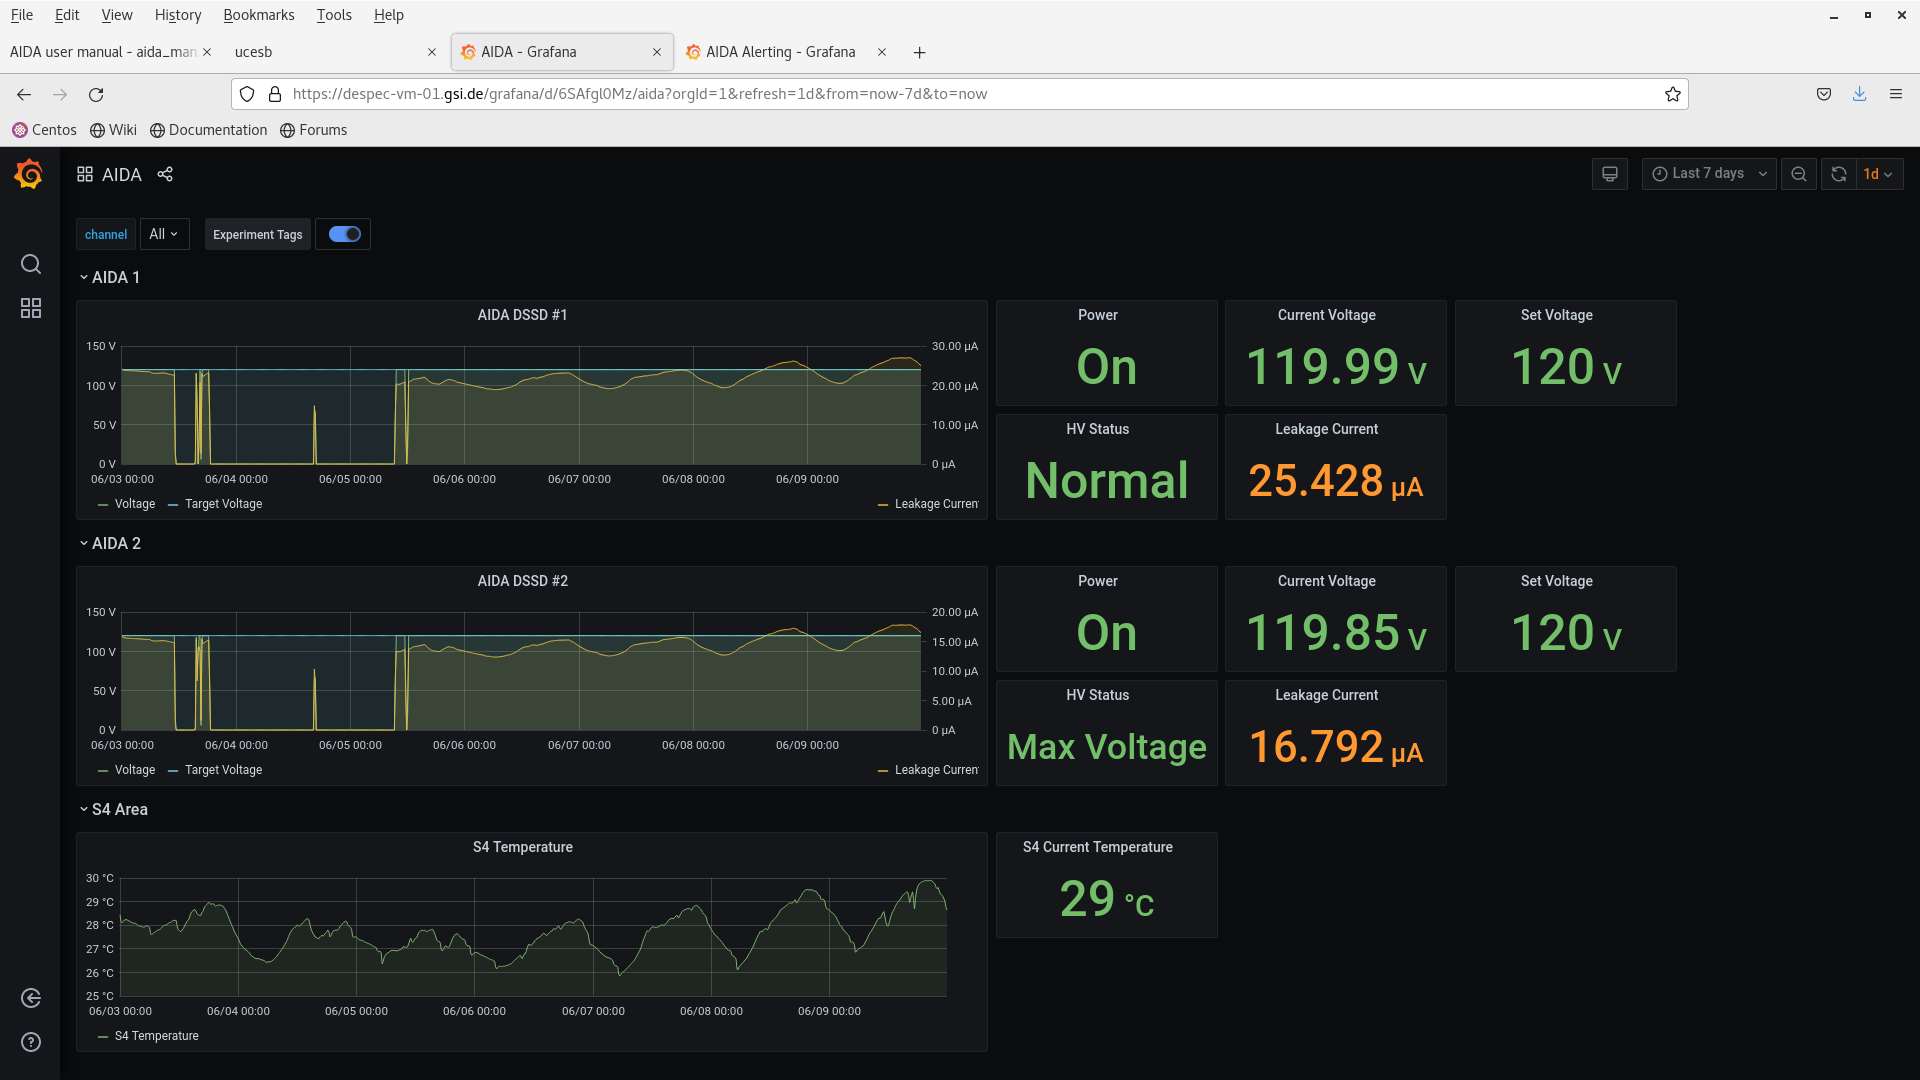
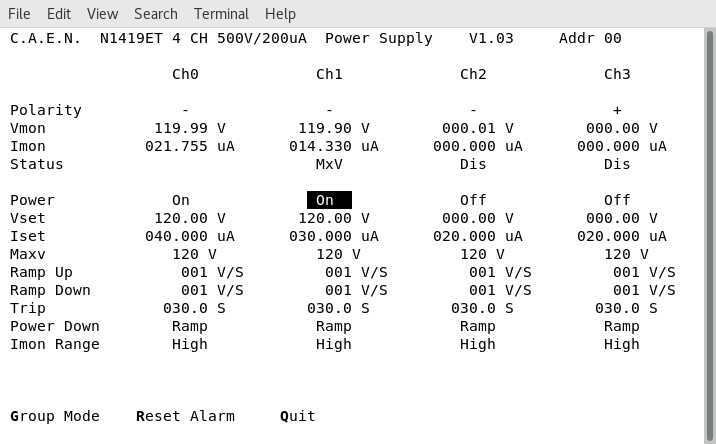
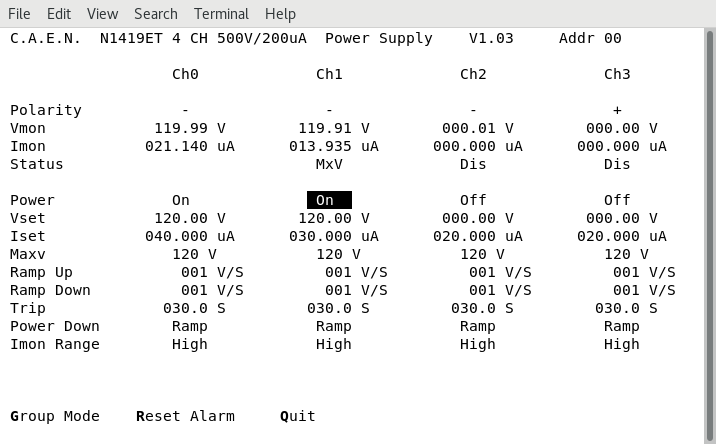
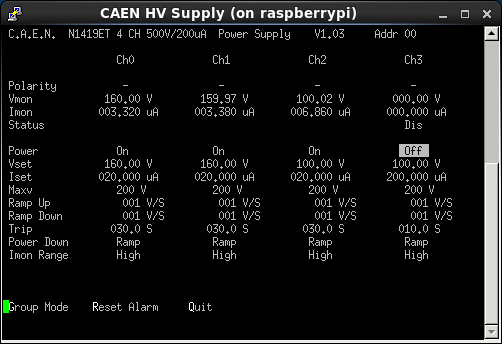
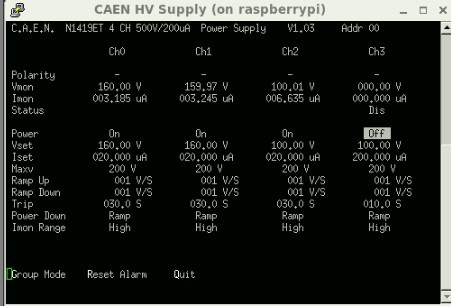
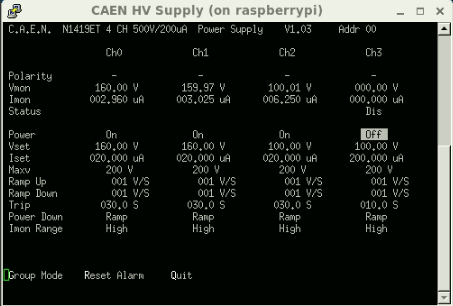
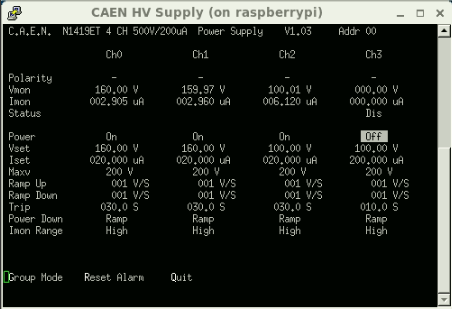
23.47 DSSSD bias & leakage current OK - attachments 1-2

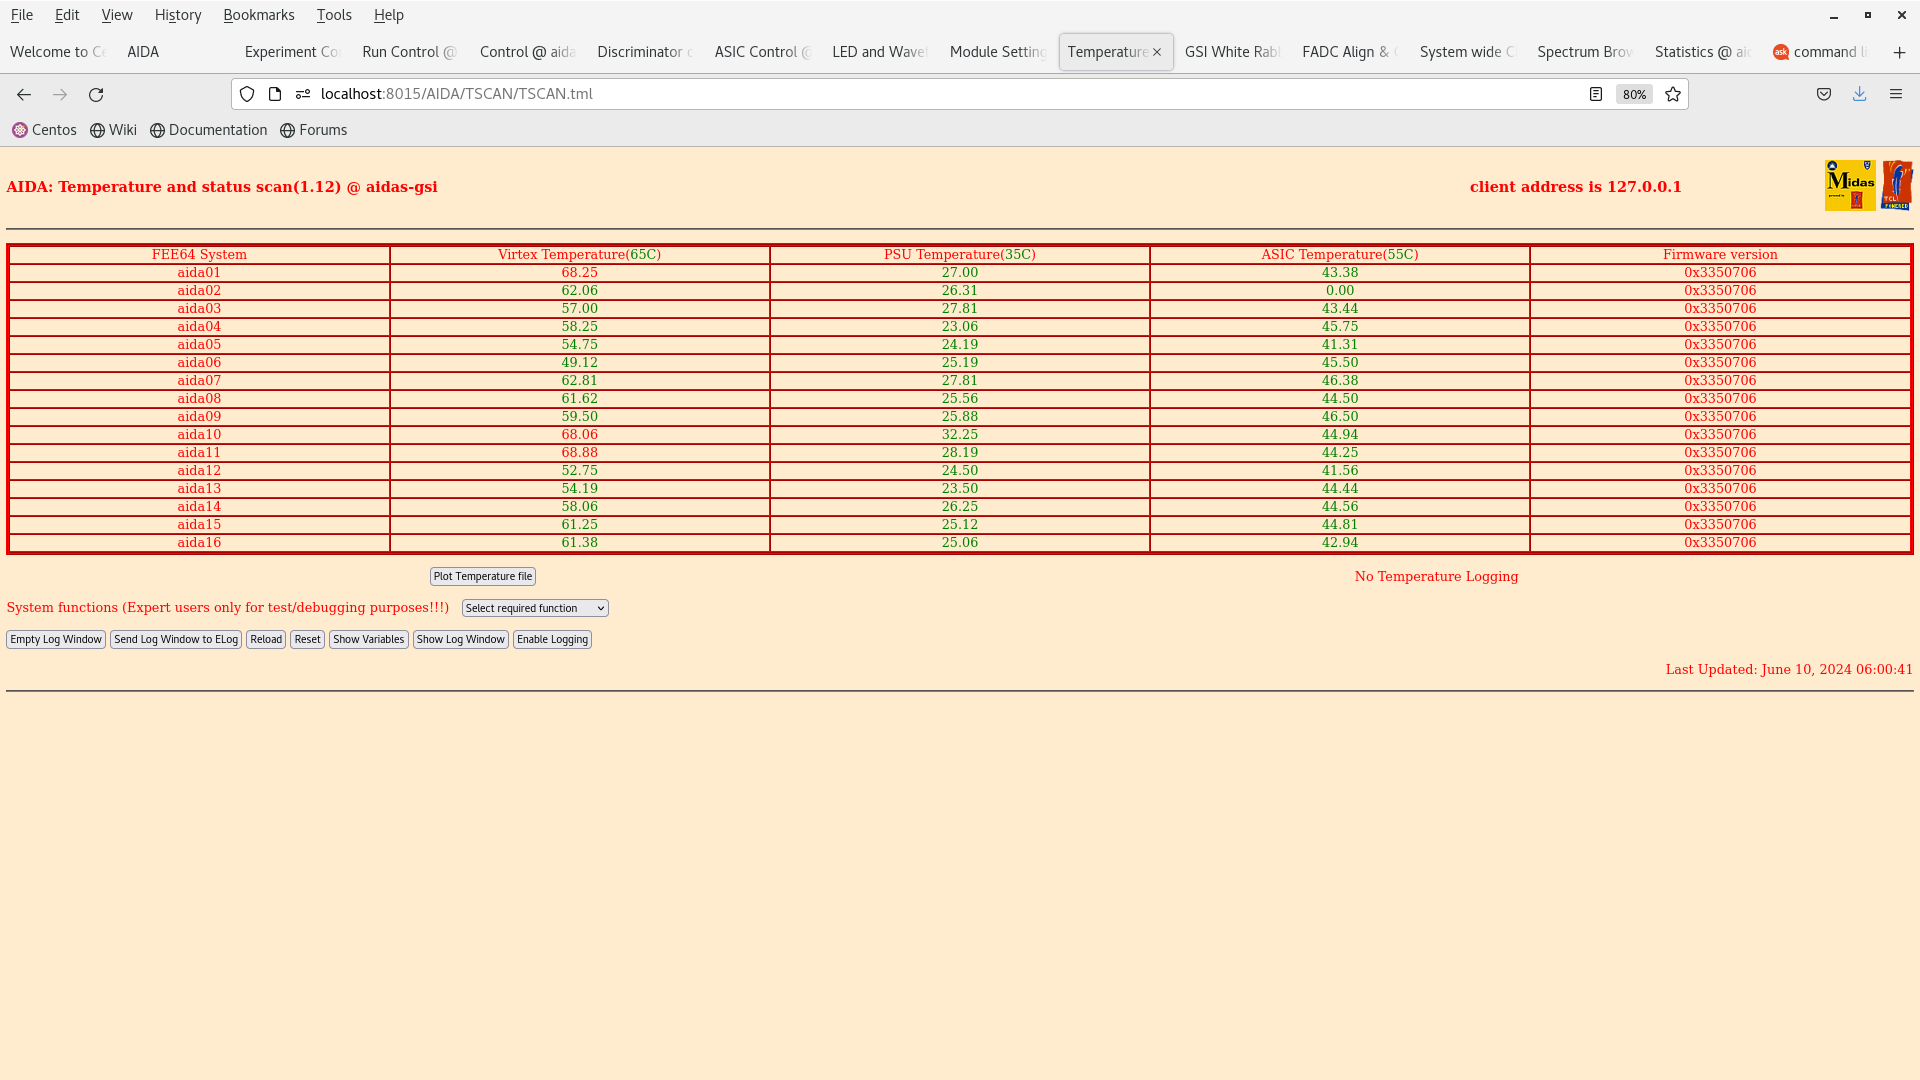
      FEE64 temperatures OK - attachment 3

      ADC, PAUSE and MBS correlation scaler data item stats - attachments 4-5 & 9

      WR timestamp - attachment 7

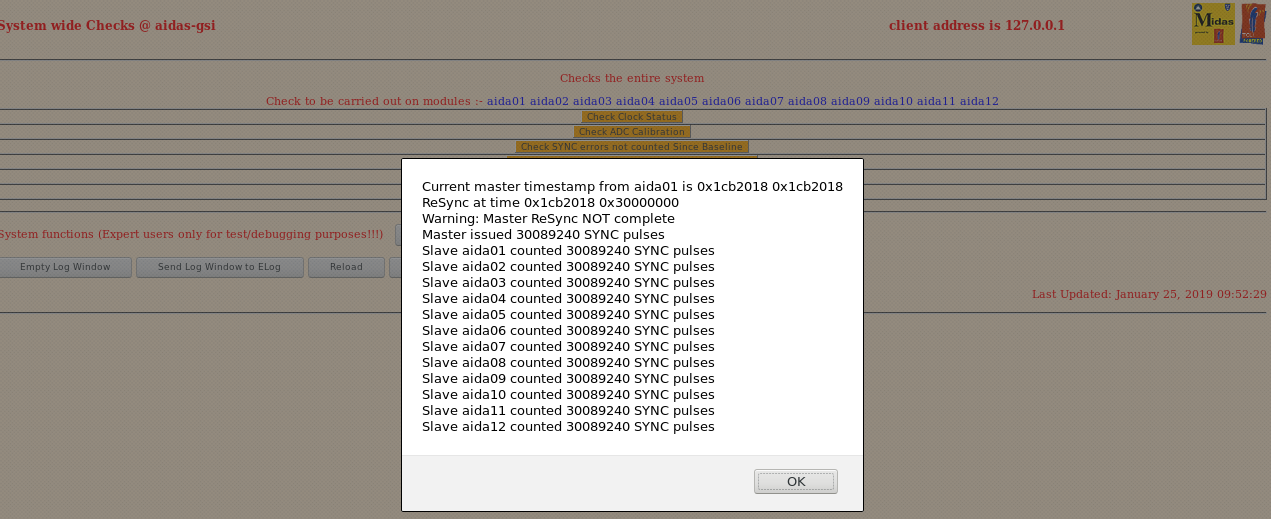
      all system wide checks OK *except* attachments 6 & 10

      per FEE64 Rate spectra - attachment 8

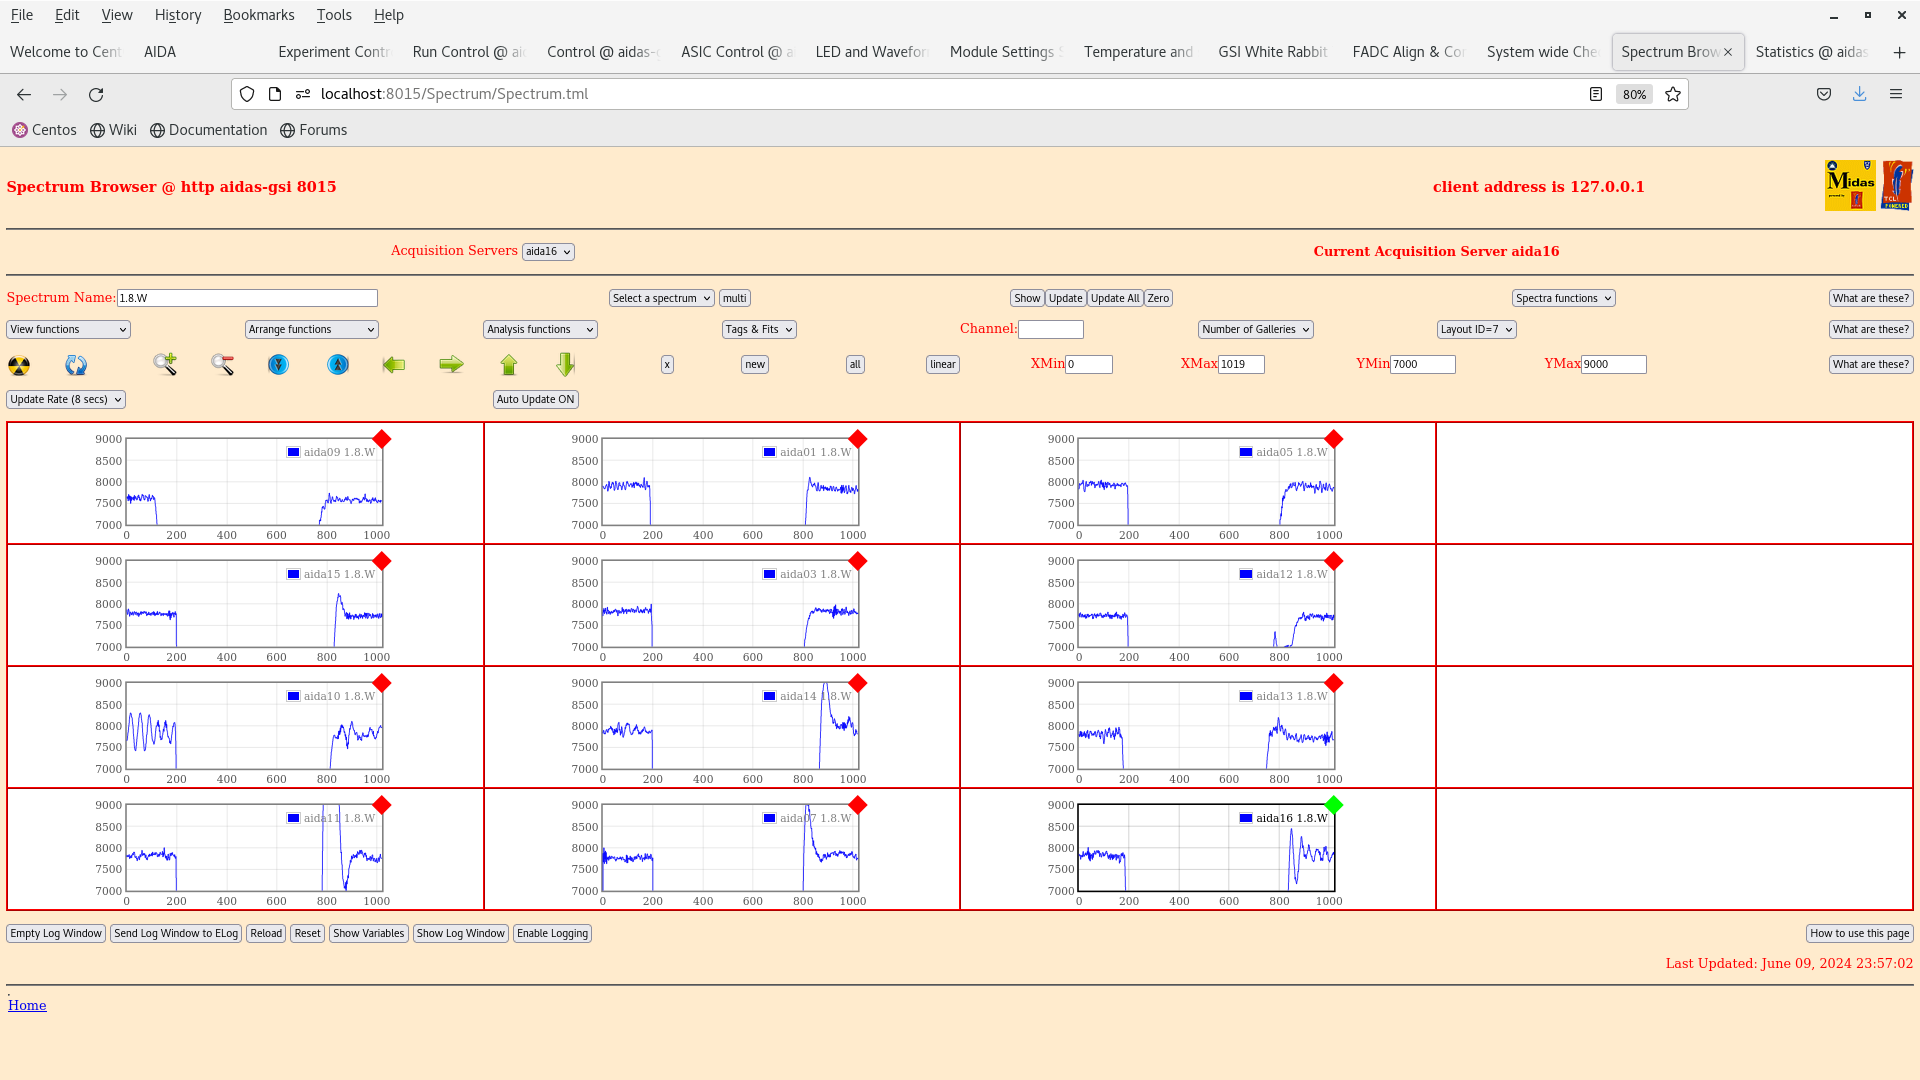
      per FEE64 1.8.W spectra - 20us FSR - attachments 11-13

      Merger, TapeServer etc - attachments 14-15
       data file S181/R4, TapeServer No Storage mode

00.00 Beam ON 3s spill on, 2s spill off
      99%+ fission fragments
      ADC data item stats - attachment 16


02.03 Data storage enabled
 
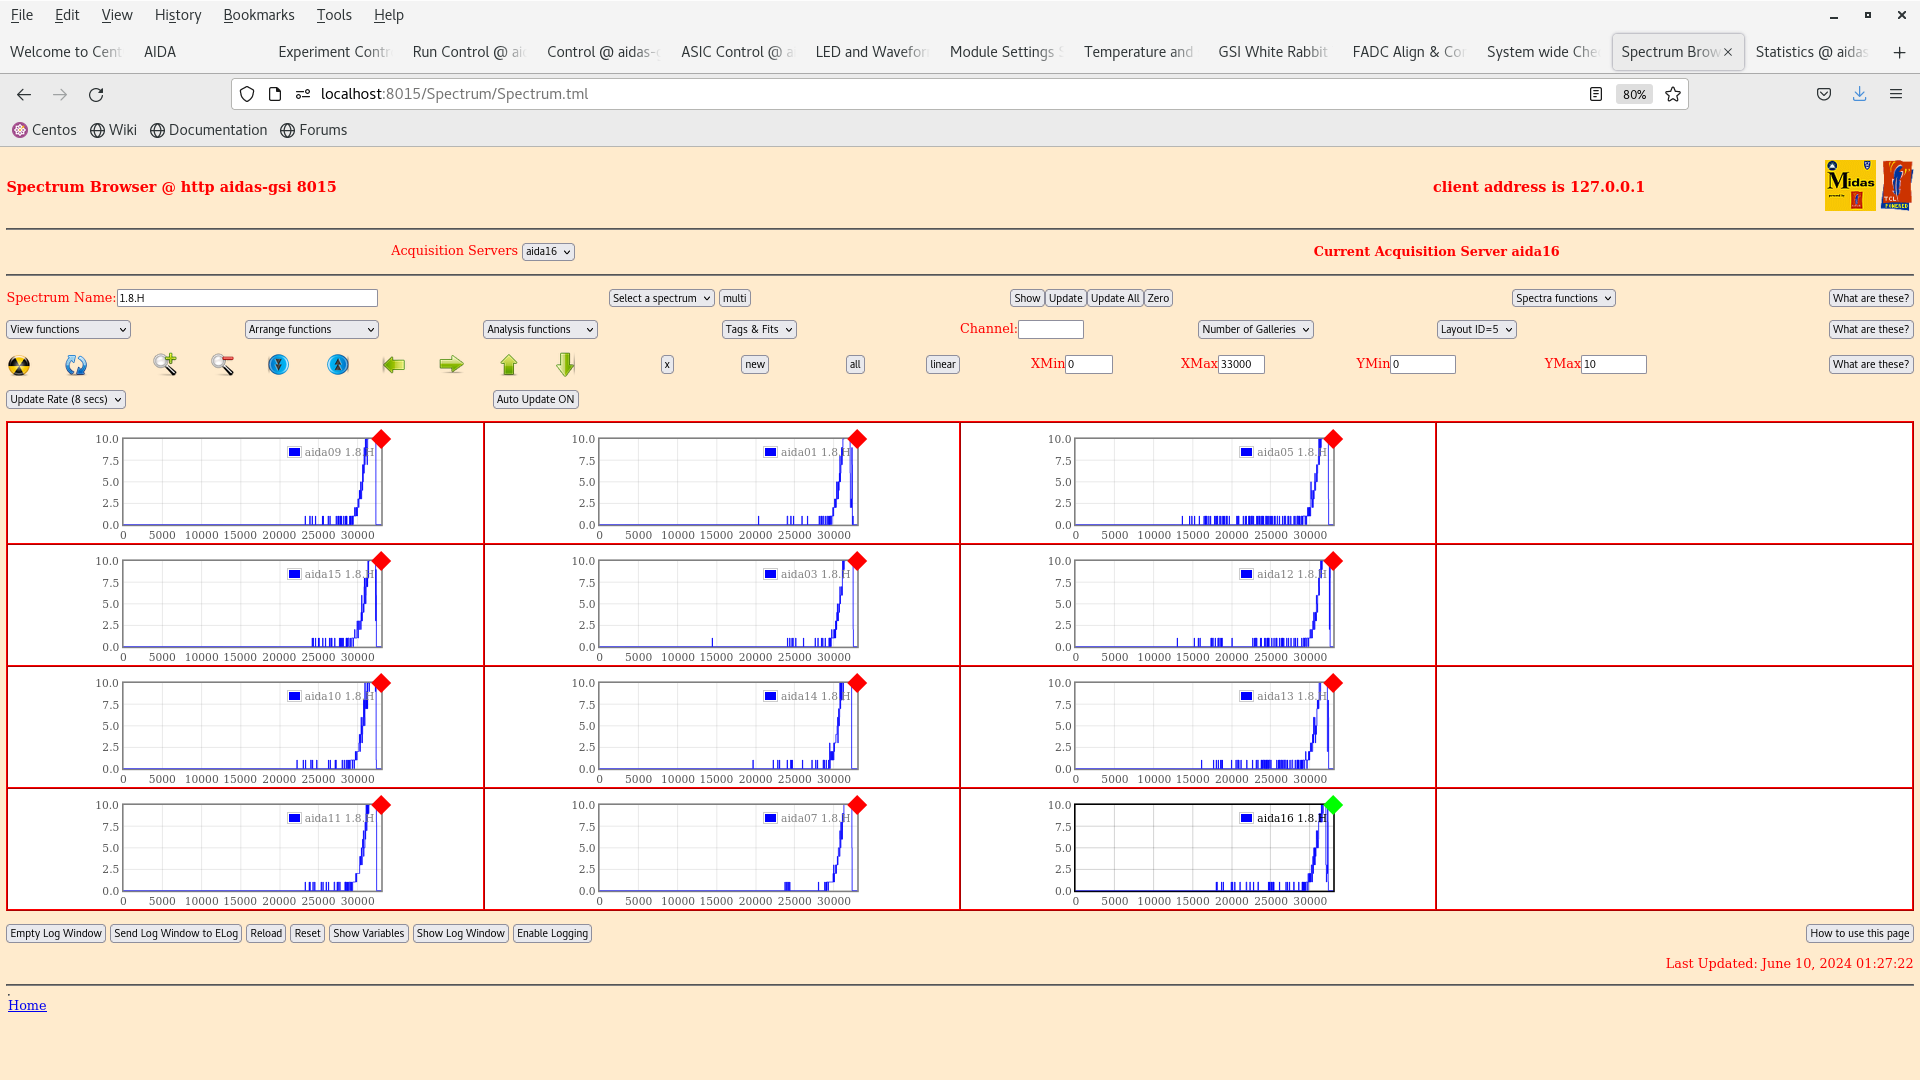
      per FEE64 1.8.H spectra - attachments 17-18

02.35 analysis data file S181/R4_28 - attachment 19
      data file S181/R4
      max deadtime aida08 18%
      n+n FEE64s 12-18%, all p+n FEE64s < 2%

02.41 Noted that there is disc data written to disk - all disc data now disabled for all FEE64s

04.08 DSSSD bias & leakage current OK - attachment 20

      FEE64 temperatures OK - attachment 21

      ADC data item stats - attachment 22

      per FEE64 Rate spectra - attachment 23

04.15 aida02 no data
      restarted merger per https://elog.ph.ed.ac.uk/DESPEC/644

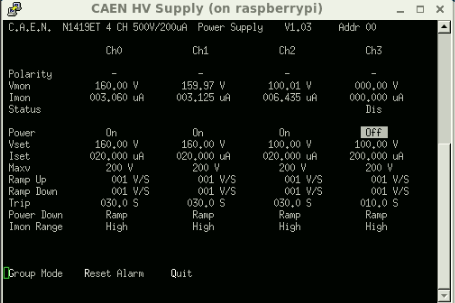
06.00 DSSSD bias & leakage current OK - attachment 24

      FEE64 temperatures OK - attachment 25

      ADC data item stats - attachment 26

      per FEE64 Rate spectra - attachment 27
Attachment 1: Screenshot_from_2024-06-09_23-47-24.png
Screenshot_from_2024-06-09_23-47-24.png
Attachment 2: Screenshot_from_2024-06-09_23-47-42.png
Screenshot_from_2024-06-09_23-47-42.png
Attachment 3: Screenshot_from_2024-06-09_23-48-00.png
Screenshot_from_2024-06-09_23-48-00.png
Attachment 4: Screenshot_from_2024-06-09_23-48-04.png
Screenshot_from_2024-06-09_23-48-04.png
Attachment 5: Screenshot_from_2024-06-09_23-48-16.png
Screenshot_from_2024-06-09_23-48-16.png
Attachment 6: Screenshot_from_2024-06-09_23-48-41.png
Screenshot_from_2024-06-09_23-48-41.png
Attachment 7: Screenshot_from_2024-06-09_23-49-10.png
Screenshot_from_2024-06-09_23-49-10.png
Attachment 8: Screenshot_from_2024-06-09_23-49-18.png
Screenshot_from_2024-06-09_23-49-18.png
Attachment 9: Screenshot_from_2024-06-09_23-55-16.png
Screenshot_from_2024-06-09_23-55-16.png
Attachment 10: Screenshot_from_2024-06-09_23-55-48.png
Screenshot_from_2024-06-09_23-55-48.png
Attachment 11: Screenshot_from_2024-06-09_23-56-49.png
Screenshot_from_2024-06-09_23-56-49.png
Attachment 12: Screenshot_from_2024-06-09_23-57-05.png
Screenshot_from_2024-06-09_23-57-05.png
Attachment 13: Screenshot_from_2024-06-09_23-57-28.png
Screenshot_from_2024-06-09_23-57-28.png
Attachment 14: Screenshot_from_2024-06-09_23-58-23.png
Screenshot_from_2024-06-09_23-58-23.png
Attachment 15: Screenshot_from_2024-06-09_23-58-29.png
Screenshot_from_2024-06-09_23-58-29.png
Attachment 16: Screenshot_from_2024-06-10_00-11-59.png
Screenshot_from_2024-06-10_00-11-59.png
Attachment 17: Screenshot_from_2024-06-10_01-27-52.png
Screenshot_from_2024-06-10_01-27-52.png
Attachment 18: Screenshot_from_2024-06-10_02-01-38.png
Screenshot_from_2024-06-10_02-01-38.png
Attachment 19: R4_28
 *** TDR format 3.3.0 analyser - TD - May 2021
 *** ERROR: READ I/O error:       5002
                   blocks:      32000
          ADC data format:  253194077 ( 1696553.0 Hz)
        Other data format:    8725923 (   58468.9 Hz)
 Sample trace data format:          0 (       0.0 Hz)
         Undefined format:          0 (       0.0 Hz)
   Other data format type:      PAUSE:       1564 (      10.5 Hz)
                               RESUME:       1562 (      10.5 Hz)
                              SYNC100:      32556 (     218.1 Hz)
                              WR48-63:      32556 (     218.1 Hz)
                           FEE64 disc:    3047502 (   20420.1 Hz)
                             MBS info:    5610183 (   37591.6 Hz)
                           Other info:          0 (       0.0 Hz)

   ADC data range bit set:     916603 (    6141.8 Hz)

                Timewarps:        ADC:          0 (       0.0 Hz)
                                PAUSE:          0 (       0.0 Hz)
                               RESUME:          0 (       0.0 Hz)
                              SYNC100:          0 (       0.0 Hz)
                              WR48-63:          0 (       0.0 Hz)
                           FEE64 disc:          0 (       0.0 Hz)
                             MBS info:          0 (       0.0 Hz)
                            Undefined:          0 (       0.0 Hz)
                         Sample trace:          0 (       0.0 Hz)

 *** Timestamp elapsed time:      149.240 s
 FEE  elapsed dead time(s) elapsed idle time(s)
  0                0.269                0.000
  1               18.572                0.000
  2                0.203                0.000
  3               23.804                0.000
  4                0.695                0.000
  5               26.433                0.000
  6                0.080                0.000
  7               27.735                0.000
  8                0.165                0.000
  9                3.128                0.000
 10                0.210                0.000
 11                0.060                0.000
 12                0.056                0.000
 13                0.214                0.000
 14                0.073                0.000
 15                1.249                0.000
 16                0.000                0.000
 17                0.000                0.000
 18                0.000                0.000
 19                0.000                0.000
 20                0.000                0.000
 21                0.000                0.000
 22                0.000                0.000
 23                0.000                0.000
 24                0.000                0.000
 25                0.000                0.000
 26                0.000                0.000
 27                0.000                0.000
 28                0.000                0.000
 29                0.000                0.000
 30                0.000                0.000
 31                0.000                0.000
 32                0.000                0.000

 *** Statistics
 FEE  ADC Data Other Data     Sample  Undefined      Pause     Resume    SYNC100    WR48-63       Disc        MBS      Other   HEC Data
  0    8063714     229134          0          0         29         29       1100       1100     222403       4473          0      40546
  1   19451828     341670          0          0        189        189       2480       2480     336332          0          0      50938
  2    9906047    1695573          0          0         32         32       1474       1474     189984    1502577          0      57685
  3   25485973     434336          0          0        375        375       3209       3209     427168          0          0      33926
  4    5225989    1088546          0          0         26         25        750        750      83786    1003209          0      36956
  5   23827850     287577          0          0        303        303       2970       2970     281031          0          0      42461
  6    7632945     803643          0          0         10         10       1067       1067     163557     637932          0      57385
  7   43365063     397279          0          0        289        288       5505       5505     385692          0          0     246600
  8    9556580     143268          0          0         16         16       1175       1175     140886          0          0      58513
  9   31955982    1616616          0          0        155        155       4212       4212     145847    1462035          0      55475
 10   13350940      89761          0          0         23         23       1645       1645      86425          0          0      31430
 11    5509660    1131598          0          0          8          8        744        744     130137     999957          0      52425
 12    7108103     102578          0          0          8          8        887        887     100788          0          0      34624
 13   10337974     150173          0          0         26         26       1313       1313     147495          0          0      56686
 14    5578272     207359          0          0          7          7        687        687     205971          0          0      33046
 15   26837157       6812          0          0         68         68       3338       3338          0          0          0      27907
 16          0          0          0          0          0          0          0          0          0          0          0          0
 17          0          0          0          0          0          0          0          0          0          0          0          0
 18          0          0          0          0          0          0          0          0          0          0          0          0
 19          0          0          0          0          0          0          0          0          0          0          0          0
 20          0          0          0          0          0          0          0          0          0          0          0          0
 21          0          0          0          0          0          0          0          0          0          0          0          0
 22          0          0          0          0          0          0          0          0          0          0          0          0
 23          0          0          0          0          0          0          0          0          0          0          0          0
 24          0          0          0          0          0          0          0          0          0          0          0          0
 25          0          0          0          0          0          0          0          0          0          0          0          0
 26          0          0          0          0          0          0          0          0          0          0          0          0
 27          0          0          0          0          0          0          0          0          0          0          0          0
 28          0          0          0          0          0          0          0          0          0          0          0          0
 29          0          0          0          0          0          0          0          0          0          0          0          0
 30          0          0          0          0          0          0          0          0          0          0          0          0
 31          0          0          0          0          0          0          0          0          0          0          0          0
 32          0          0          0          0          0          0          0          0          0          0          0          0

 *** Timewarps
 FEE       ADC      Pause     Resume    SYNC100    WR48-63       Disc        MBS  Undefined    Samples
  0          0          0          0          0          0          0          0          0          0
  1          0          0          0          0          0          0          0          0          0
  2          0          0          0          0          0          0          0          0          0
  3          0          0          0          0          0          0          0          0          0
  4          0          0          0          0          0          0          0          0          0
  5          0          0          0          0          0          0          0          0          0
  6          0          0          0          0          0          0          0          0          0
  7          0          0          0          0          0          0          0          0          0
  8          0          0          0          0          0          0          0          0          0
  9          0          0          0          0          0          0          0          0          0
 10          0          0          0          0          0          0          0          0          0
 11          0          0          0          0          0          0          0          0          0
 12          0          0          0          0          0          0          0          0          0
 13          0          0          0          0          0          0          0          0          0
 14          0          0          0          0          0          0          0          0          0
 15          0          0          0          0          0          0          0          0          0
 16          0          0          0          0          0          0          0          0          0
 17          0          0          0          0          0          0          0          0          0
 18          0          0          0          0          0          0          0          0          0
 19          0          0          0          0          0          0          0          0          0
 20          0          0          0          0          0          0          0          0          0
 21          0          0          0          0          0          0          0          0          0
 22          0          0          0          0          0          0          0          0          0
 23          0          0          0          0          0          0          0          0          0
 24          0          0          0          0          0          0          0          0          0
 25          0          0          0          0          0          0          0          0          0
 26          0          0          0          0          0          0          0          0          0
 27          0          0          0          0          0          0          0          0          0
 28          0          0          0          0          0          0          0          0          0
 29          0          0          0          0          0          0          0          0          0
 30          0          0          0          0          0          0          0          0          0
 31          0          0          0          0          0          0          0          0          0
 32          0          0          0          0          0          0          0          0          0

 *** Program elapsed time:   38.183s (  838.078 blocks/s,  52.380 Mb/s)
Attachment 20: Screenshot_from_2024-06-10_04-08-10.png
Screenshot_from_2024-06-10_04-08-10.png
Attachment 21: Screenshot_from_2024-06-10_04-08-44.png
Screenshot_from_2024-06-10_04-08-44.png
Attachment 22: Screenshot_from_2024-06-10_04-10-54.png
Screenshot_from_2024-06-10_04-10-54.png
Attachment 23: Screenshot_from_2024-06-10_04-11-33.png
Screenshot_from_2024-06-10_04-11-33.png
Attachment 24: Screenshot_from_2024-06-10_06-00-15.png
Screenshot_from_2024-06-10_06-00-15.png
Attachment 25: Screenshot_from_2024-06-10_06-00-52.png
Screenshot_from_2024-06-10_06-00-52.png
Attachment 26: Screenshot_from_2024-06-10_06-01-18.png
Screenshot_from_2024-06-10_06-01-18.png
Attachment 27: Screenshot_from_2024-06-10_06-01-43.png
Screenshot_from_2024-06-10_06-01-43.png
  267   Fri Apr 23 15:13:28 2021 DSJ23 April 16.00-20.00 shift

16:00 taking over from Muneerah

16:15 - temp, ucesb, database, stats etc. look ok.

16:41 - Nic restarting MBS

17:05 - temp, ucesb, database, stats etc. look ok.

17:43 - temp, ucesb, database, stats etc. look ok.


18.10 - system wide checks.  All same as previous checks - eg elog 264 + 266

FEE64 module aida06 global clocks failed, 6
 Clock status test result: Passed 11, Failed 1

Understand status as follows
Status bit 3 : firmware PLL that creates clocks from external clock not locked
Status bit 2 : always logic '1' 
Status bit 1 : LMK3200(2) PLL and clock distribution chip not locked to external clock
Status bit 0 : LMK3200(1) PLL and clock distribution chip not locked to external clock
If all these bits are not set then the operation of the firmware is unreliable


FEE64 module aida06 failed
FEE64 module aida07 failed
FEE64 module aida12 failed
Calibration test result: Passed 9, Failed 3

If any modules fail calibration , check the clock status and open the FADC Align and Control browser page to rerun calibration for that module


         Base         Current     Difference
aida06 fault      0x679f :      0x67a2 :      3  
White Rabbit error counter test result: Passed 11, Failed 1

Understand the status reports as follows:-
Status bit 3 : White Rabbit decoder detected an error in the received data
Status bit 2 : Firmware registered WR error, no reload of Timestamp
Status bit 0 : White Rabbit decoder reports uncertain of Timestamp information from WR
 

Check FPGA Timestamp Error - HTML errors

    
Returned 0 0 0 0 0 0 0 0 0 0 0 0  
Mem(KB) :    4    8    16    32    64    128    256    512    1k    2k    4k
aida01 :     19      7      4      7      4      3      2      4      2      3      6   : 36388
aida02 :      1      2      5      2      0      4      3      4      3      4      3   : 27044
aida03 :     28      4      4      4      4      4      2      2      3      3      6   : 36432
aida04 :      5      5      2      6      2      3      3      3      3      3      6   : 36892
aida05 :     24      4      7      3      3      3      2      2      3      3      6   : 36240
aida06 :     21      6      6      3      3      4      2      2      3      3      6   : 36356
aida07 :     15      7      4      3      3      4      2      2      3      3      6   : 36308
aida08 :     23      6      7      1      3      4      1      3      3      3      6   : 36572
aida09 :      1      8      2      1      1      2      4      2      3      3      6   : 36292
aida10 :      3      4      6      2      2      2      3      3      2      3      6   : 35660
aida11 :     15      7      4      1      2      3      2      4      2      3      6   : 36052
aida12 :     25     13      5      2      2      3      2      3      3      3      6   : 36700
 

18:45 - temp, ucesb, database, stats etc. look ok.

19:03 - temp, ucesb, database, stats etc. look ok.

19:26  - temp, ucesb, database, stats etc. look ok.

TapeData (df -h) - 7.2T  3.9T  2.9T  58% /media/1e121361-83d3-4825-b6ae-8700b07e0ca7


19:30 - beam being shared with R3B, implantation rates fluctuation by~  50% back to normal 19:40


19:50 system checks - all as previous


FEE64 module aida06 global clocks failed, 6
 Clock status test result: Passed 11, Failed 1

Understand status as follows
Status bit 3 : firmware PLL that creates clocks from external clock not locked
Status bit 2 : always logic '1' 
Status bit 1 : LMK3200(2) PLL and clock distribution chip not locked to external clock
Status bit 0 : LMK3200(1) PLL and clock distribution chip not locked to external clock
If all these bits are not set then the operation of the firmware is unreliable
 

FEE64 module aida06 failed
FEE64 module aida07 failed
FEE64 module aida12 failed
Calibration test result: Passed 9, Failed 3

If any modules fail calibration , check the clock status and open the FADC Align and Control browser page to rerun calibration for that module

    
         Base         Current     Difference
aida06 fault      0x679f :      0x67a2 :      3  
White Rabbit error counter test result: Passed 11, Failed 1

Understand the status reports as follows:-
Status bit 3 : White Rabbit decoder detected an error in the received data
Status bit 2 : Firmware registered WR error, no reload of Timestamp
Status bit 0 : White Rabbit decoder reports uncertain of Timestamp information from WR

Check FPGA Timestamp Error - HTML errors


Returned 0 0 0 0 0 0 0 0 0 0 0 0  
Mem(KB) :    4    8    16    32    64    128    256    512    1k    2k    4k
aida01 :     25      6      4      7      4      3      2      4      2      3      6   : 36404
aida02 :     20      7      5      1      0      4      2      3      2      3      4   : 27384
aida03 :     28      6      3      5      3      5      2      2      3      3      6   : 36528
aida04 :     19      8      4      6      2      4      4      2      3      3      6   : 36876
aida05 :      7      3      8      3      4      3      1      3      3      3      6   : 36500
aida06 :     25      8      4      3      3      4      2      3      3      3      6   : 36868
aida07 :     18      7      3      4      3      4      2      2      3      3      6   : 36336
aida08 :     16     10      6      2      3      3      1      3      3      3      6   : 36464
aida09 :      0      3      1      1      1      3      4      2      3      3      6   : 36360
aida10 :      8      1     10      0      2      2      2      4      2      3      6   : 35912
aida11 :      2      2      2      3      3      4      3      3      2      3      6   : 35928
aida12 :     12      7      4      1      3      3      2      3      3      3      6   : 36616
 

Attachment 1: Screenshot_2021-04-23_Statistics_aidas-gsi(5).png
Screenshot_2021-04-23_Statistics_aidas-gsi(5).png
Attachment 2: Screenshot_2021-04-23_Temperature_and_status_scan_aidas-gsi(5).png
Screenshot_2021-04-23_Temperature_and_status_scan_aidas-gsi(5).png
Attachment 3: 555.png
555.png
Attachment 4: Screenshot_2021-04-23_Temperature_and_status_scan_aidas-gsi(6).png
Screenshot_2021-04-23_Temperature_and_status_scan_aidas-gsi(6).png
Attachment 5: Screenshot_2021-04-23_Statistics_aidas-gsi(6).png
Screenshot_2021-04-23_Statistics_aidas-gsi(6).png
Attachment 6: 556.png
556.png
  259   Wed Apr 21 23:05:39 2021 CA22nd April 00:00 - 08:00
00:07 stats/ucesb/DB checks all ok

00:30 all system wide checks ok *except* fpga errors

      			 Base 		Current 		Difference
aida12 fault 	 0x0 : 	 0x1f : 	 31  
FPGA Timestamp error counter test result: Passed 11, Failed 1
If any of these counts are reported as in error
The ASIC readout system has detected a timeslip.
That is the timestamp read from the time FIFO is not younger than the last

     statistics ok - attachment 1

     temperatures ok - attachment 2

     detector bias / leakage currents ok - attachment 3

     no error messages in DB terminal & ucesb ok - attachment 4

01:00 stats/ucesb/DB checks all ok

01:30 stats/ucesb/DB checks all ok

01:53 issues with beam dropping in and out - ESR working to stabilise this

02:00 stats/ucesb/DB checks all ok

02:09 beam back in a stable state

02:30 all system wide checks ok *except* fpga errors

Base 		Current 		Difference
aida12 fault 	 0x0 : 	 0x29 : 	 41  
FPGA Timestamp error counter test result: Passed 11, Failed 1
If any of these counts are reported as in error
The ASIC readout system has detected a timeslip.
That is the timestamp read from the time FIFO is not younger than the last

02:33 statistics ok - attachment 5

      temperatures ok - attachment 6

      detector bias / leakage currents ok - attachment 7

      no error messages in DB terminal & ucesb ok - attachment 8

02:45 beam off - potentially serious issue, awaiting update from FRS

03:00 significant issues with UNILAC, beam not expected back for a while

03:05 stats/ucesb/DB checks all ok

03:32 stats/ucesb/DB checks all ok

03:55 beam is back

04:00 stats/ucesb/DB checks all ok

04:30 all system wide checks ok *except* fpga errors

			 Base 		Current 		Difference
aida12 fault 	 0x0 : 	 0x2b : 	 43  
FPGA Timestamp error counter test result: Passed 11, Failed 1
If any of these counts are reported as in error
The ASIC readout system has detected a timeslip.
That is the timestamp read from the time FIFO is not younger than the last

04:32 statistics ok - attachment 9

      temperatures ok - attachment 10

      detector bias / leakage currents ok - attachment 11

      no error messages in DB terminal & ucesb ok - attachment 12

05:00 stats/ucesb/DB checks all ok

05:30 stats/ucesb/DB checks all ok

06:00 stats/ucesb/DB checks all ok

06:30 all system wide checks ok *except* fpga errors

			 Base 		Current 		Difference
aida12 fault 	 0x0 : 	 0x34 : 	 52  
FPGA Timestamp error counter test result: Passed 11, Failed 1
If any of these counts are reported as in error
The ASIC readout system has detected a timeslip.
That is the timestamp read from the time FIFO is not younger than the last

06:32 temperatures ok - attachment 13

      statistics ok - attachment 14

      detector bias / leakage currents ok - attachment 15

      no error messages in DB terminal & ucesb ok - attachment 16

07:00 stats/ucesb/DB checks all ok

07:30 stats/ucesb/DB checks all ok

07:59 stats/ucesb/DB checks all ok


Attachment 1: Screenshot_from_2021-04-21_23-31-22.png
Screenshot_from_2021-04-21_23-31-22.png
Attachment 2: Screenshot_from_2021-04-21_23-31-44.png
Screenshot_from_2021-04-21_23-31-44.png
Attachment 3: Screenshot_from_2021-04-21_23-32-03.png
Screenshot_from_2021-04-21_23-32-03.png
Attachment 4: Screenshot_from_2021-04-21_23-34-46.png
Screenshot_from_2021-04-21_23-34-46.png
Attachment 5: Screenshot_from_2021-04-22_01-31-14.png
Screenshot_from_2021-04-22_01-31-14.png
Attachment 6: Screenshot_from_2021-04-22_01-31-37.png
Screenshot_from_2021-04-22_01-31-37.png
Attachment 7: Screenshot_from_2021-04-22_01-34-03.png
Screenshot_from_2021-04-22_01-34-03.png
Attachment 8: Screenshot_from_2021-04-22_01-34-31.png
Screenshot_from_2021-04-22_01-34-31.png
Attachment 9: Screenshot_from_2021-04-22_03-32-36.png
Screenshot_from_2021-04-22_03-32-36.png
Attachment 10: Screenshot_from_2021-04-22_03-32-57.png
Screenshot_from_2021-04-22_03-32-57.png
Attachment 11: Screenshot_from_2021-04-22_03-33-11.png
Screenshot_from_2021-04-22_03-33-11.png
Attachment 12: Screenshot_from_2021-04-22_03-33-57.png
Screenshot_from_2021-04-22_03-33-57.png
Attachment 13: Screenshot_from_2021-04-22_05-33-01.png
Screenshot_from_2021-04-22_05-33-01.png
Attachment 14: Screenshot_from_2021-04-22_05-33-19.png
Screenshot_from_2021-04-22_05-33-19.png
Attachment 15: Screenshot_from_2021-04-22_05-33-30.png
Screenshot_from_2021-04-22_05-33-30.png
Attachment 16: Screenshot_from_2021-04-22_05-33-43.png
Screenshot_from_2021-04-22_05-33-43.png
  587   Mon Apr 22 11:43:55 2024 TD21-22.4.24 overnight MIDASsort online sort
Attachment 1 - per DSSSD LEC e_p versus e_n (20keV/channel)

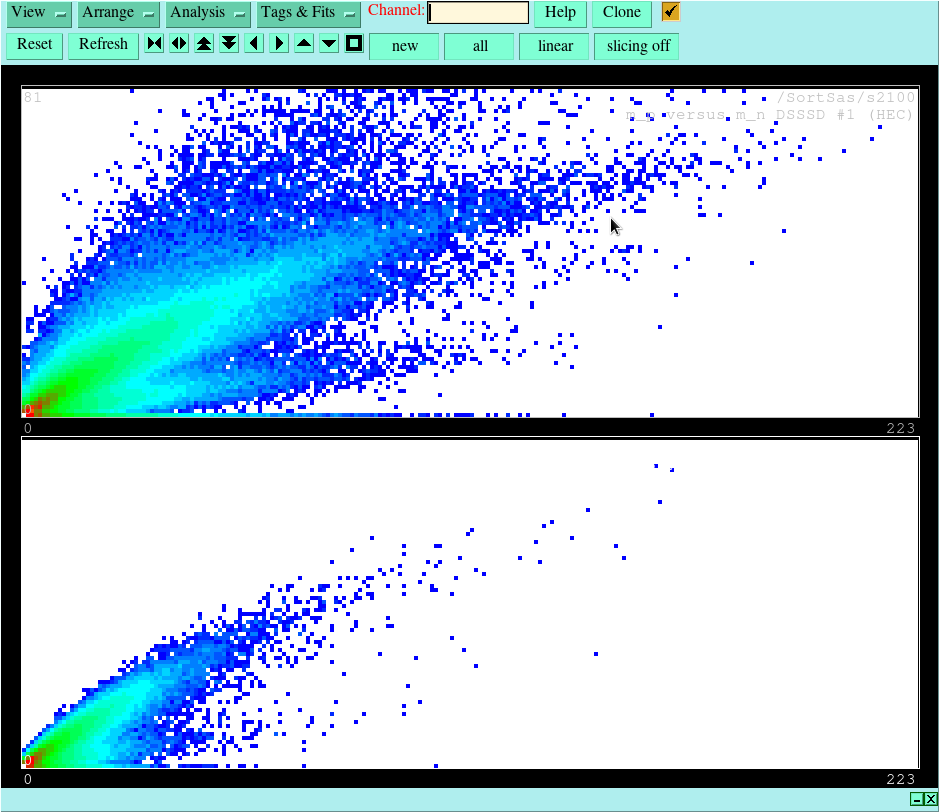
Attachment 2 - per DSSSD HEC m_p versus m_n 

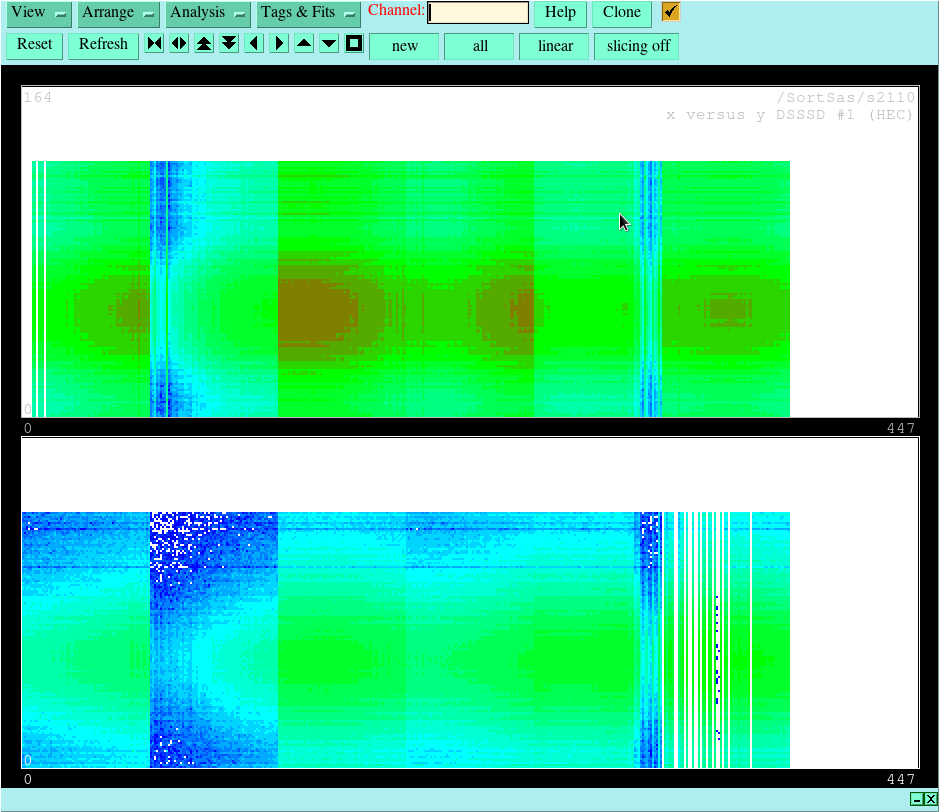
Attachment 3 - per DSSSD HEC x versus y (I really do need to sort out the mapping!)

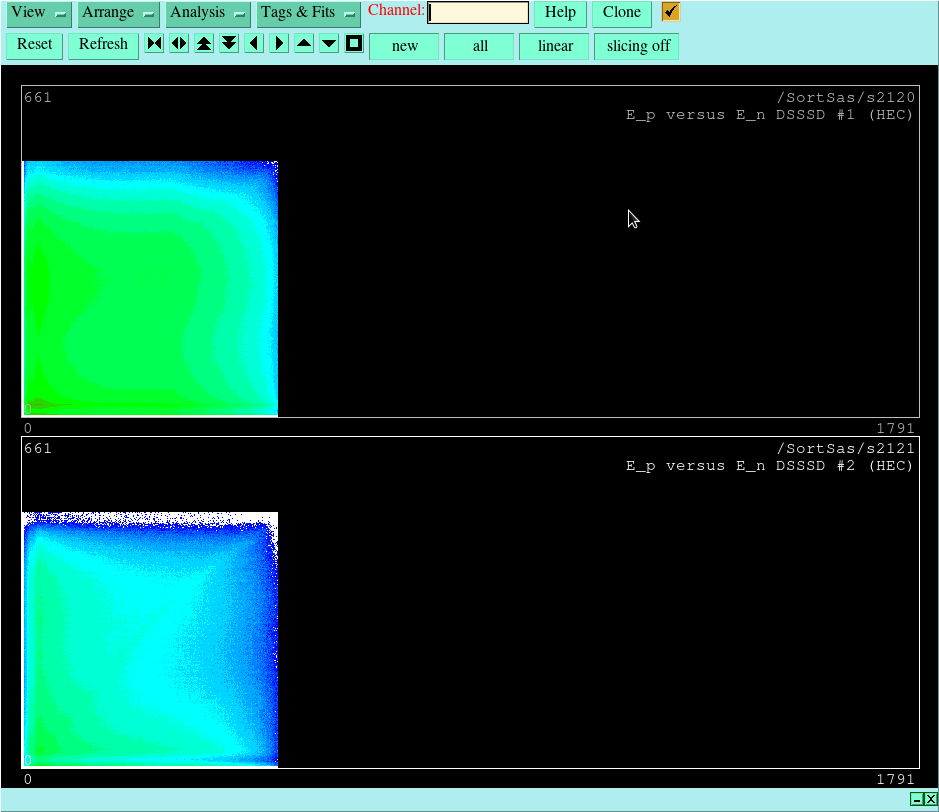
Attachment 4 - per DSSSD HEC e_p versus e_n (20MeV/channel)

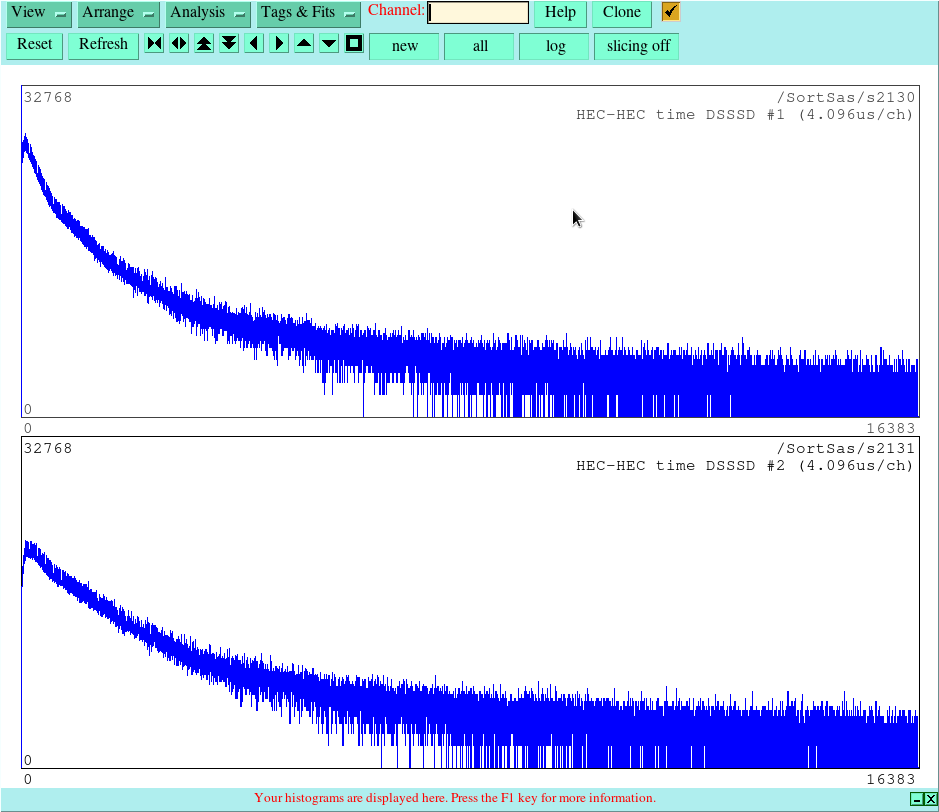
Attachment 5 - per DSSSD per pixel HEC-HEC time (4.096us/channel)

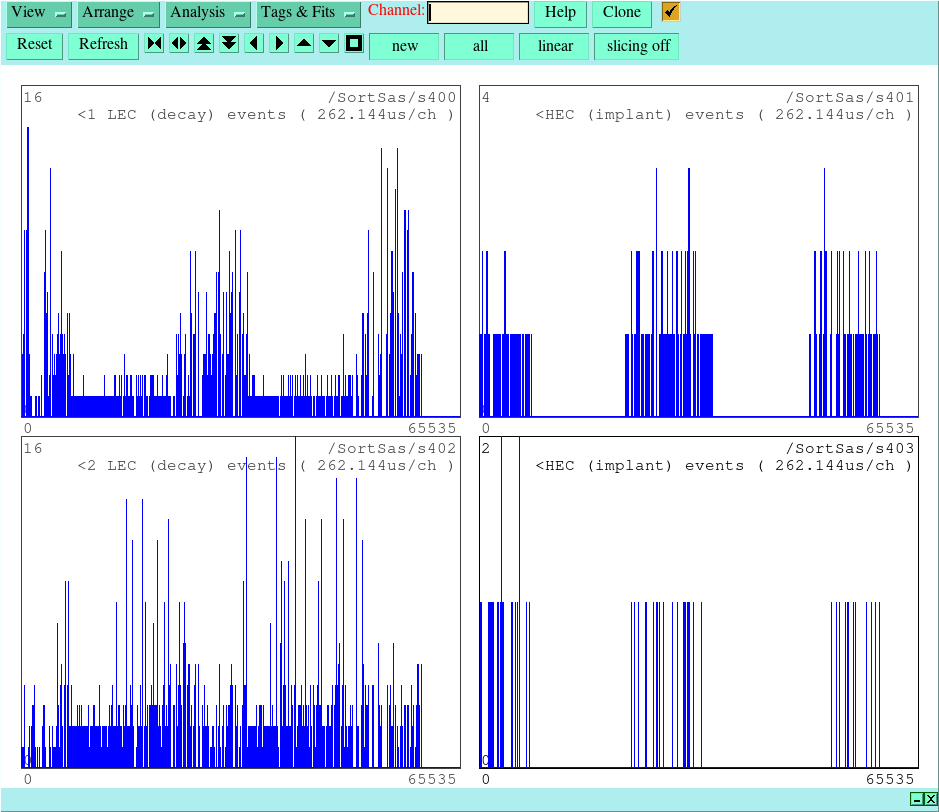
Attachment 6 - per DSSSD implant/decay event rates (262.144us/channel)
               showing beam spill cycle

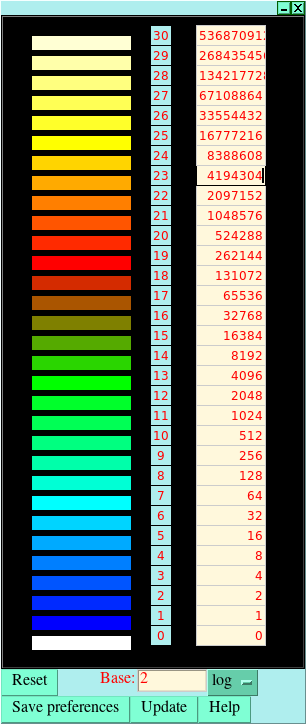
Attachment 7 - colours/contour levels for all 2D spectra
Attachment 1: Screenshot_from_2024-04-22_07-58-12.png
Screenshot_from_2024-04-22_07-58-12.png
Attachment 2: Screenshot_from_2024-04-22_07-59-15.png
Screenshot_from_2024-04-22_07-59-15.png
Attachment 3: Screenshot_from_2024-04-22_08-00-37.png
Screenshot_from_2024-04-22_08-00-37.png
Attachment 4: Screenshot_from_2024-04-22_08-01-08.png
Screenshot_from_2024-04-22_08-01-08.png
Attachment 5: Screenshot_from_2024-04-22_08-02-03.png
Screenshot_from_2024-04-22_08-02-03.png
Attachment 6: Screenshot_from_2024-04-22_08-03-25.png
Screenshot_from_2024-04-22_08-03-25.png
Attachment 7: Screenshot_from_2024-04-22_12-48-18.png
Screenshot_from_2024-04-22_12-48-18.png
  250   Mon Apr 19 23:01:02 2021 OH20th April 00:00-08:00
23:52 Noticed AIDA07 has dropped out of the merger and is producing no statistics
      Powercycling to recover

00:14 All FEEs recovered from powercycle
      aida09 running again at HEC threshold of 0x2 (Was set to 0x1 earlier in the day while testing the HEC event disparity in DSSD3)
      Now writing to R34
      Following the powercycle the rates in the FEEs are much improved and back to where they were before the 08:30 crash on the 19th. - Attachment 1
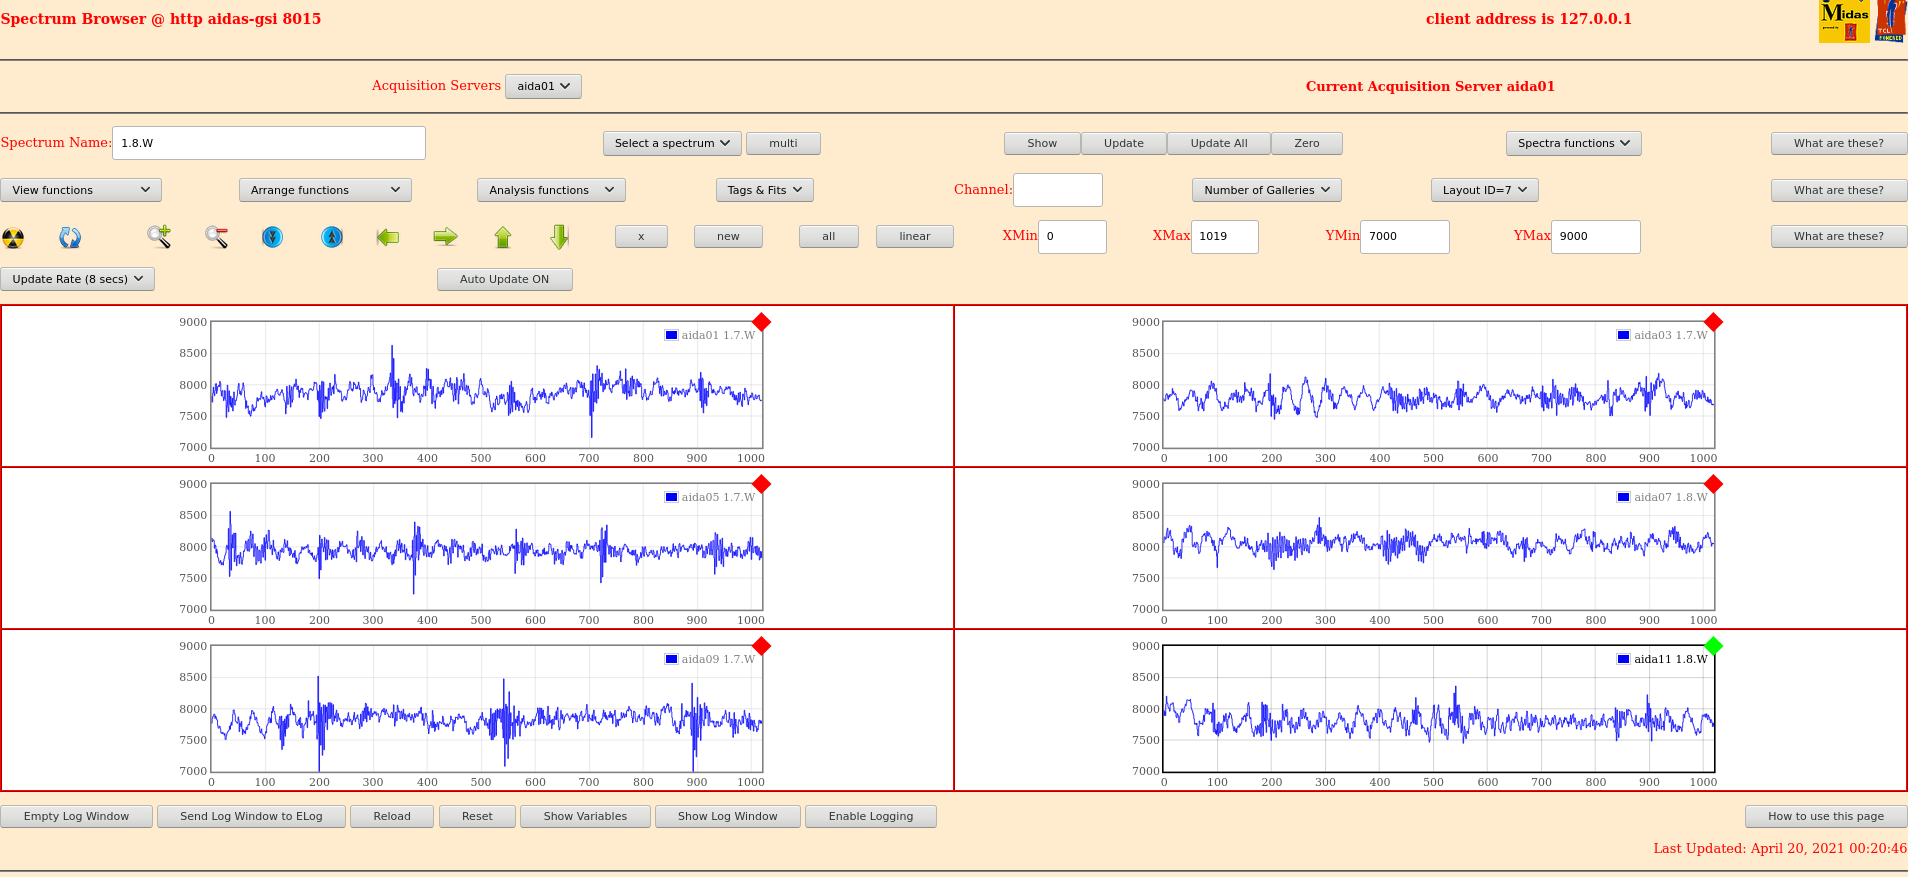
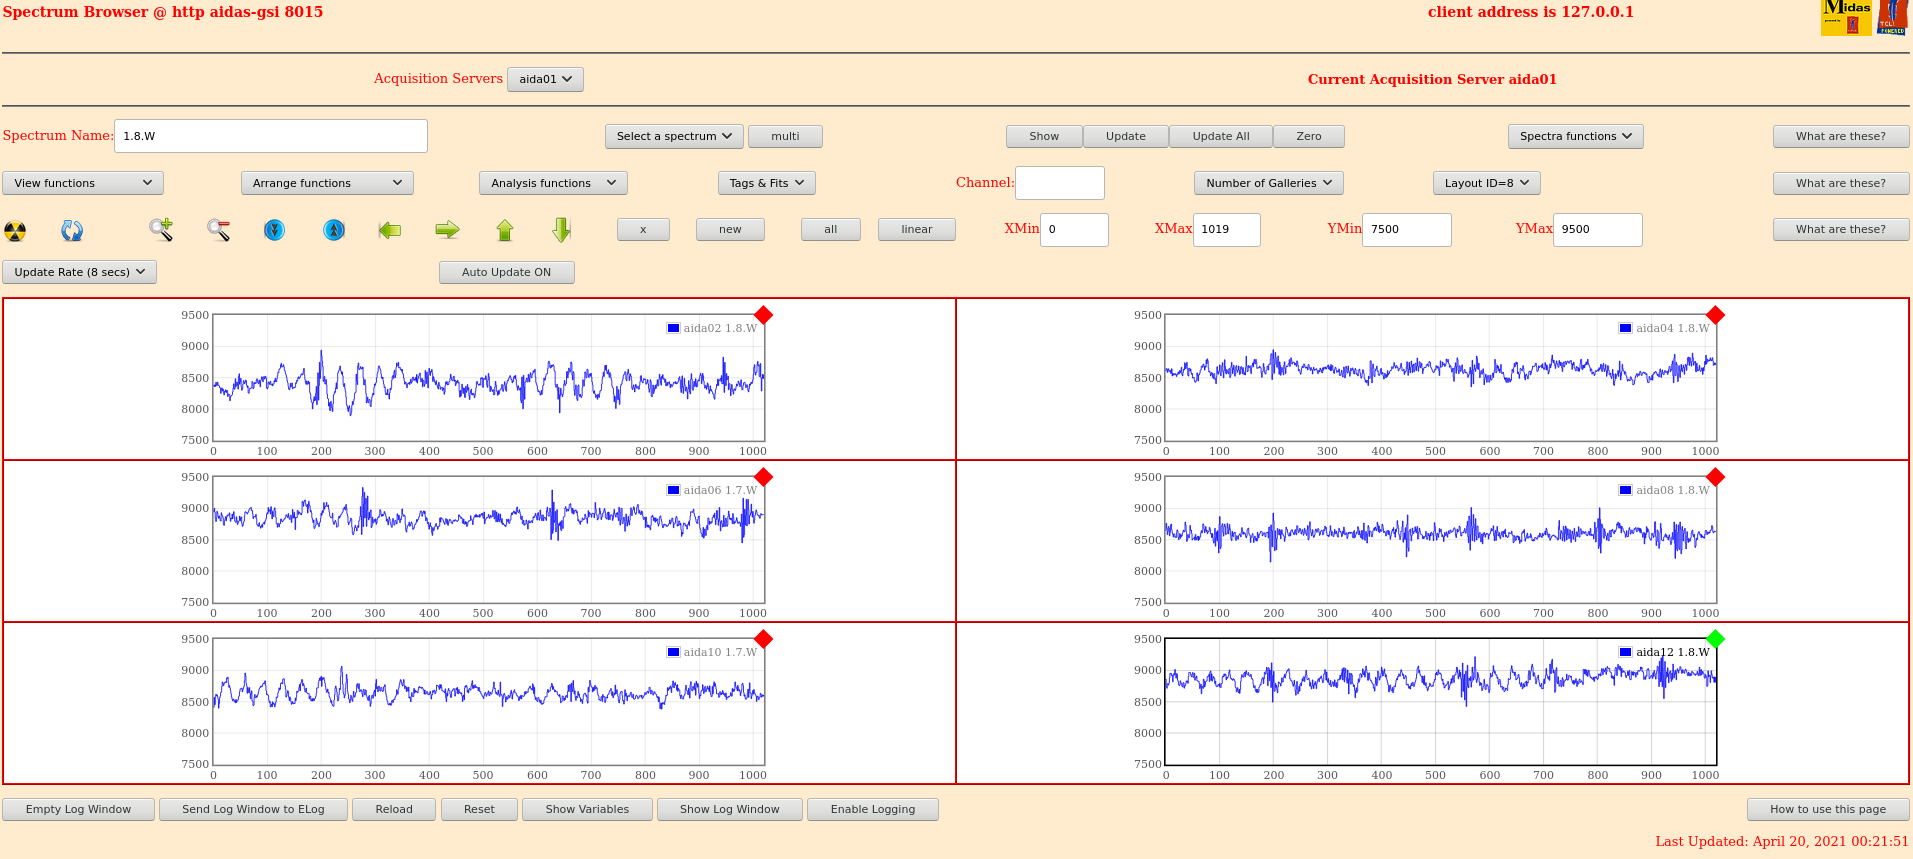
      Waveforms also look improved - attachmens 2 and 3


      Current system parameters
      ASIC settings Dec19 (All LEC comparator 0xa)
      Pulser at 2V and 2Hz
      DSSD 1 and 2 Bias 160V
      DSSD 3 at 120V (Will lower to 100 again during the beam off period tomorrow)


00:28 In analysis of R34_13 the number of HEC items in DSSD3 appears to make sense again. The number in aida09 are consistent with the number in aida05 and the same for aida11 and aida07.
      This appears to confirm that the earlier HEC issues we were observing were hardware related but we are unsure what/why/how these issues were caused.
      Analysis - attachment 4

00:40 Issue with one of the FRS magnets so they stop recording data. Leaving AIDA running.

01:08 While beam was down have reset DSSD3 bias to 100V as was agreed with Tom and Nic in email
      Leakage current decreased as expected - attachment 5
      Once beam is back will check HEC still as expected.

01:14 Last magnet in FRS has an issue with the water flowing. Either sensor issue or water flow is to low.
      Hakke have increased the water flow to hopefully keep the water running.
      Beam is back.

      From ucesb it seems that the HEC events in DSSD3 are still appearing as expected. Will check a file once we have a complete file.
      Checked R34_36 and the HEC events in DSSD3 are still consistent - attachment 6

2:20 Statistics ok - attachment 7
     Temp - attachment 8
     Bias and leakage current ok - attachment 9

     All system wide checks ok except for WR error check:
	
		 Base 		Current 	Difference
aida07 fault 	 0x9154 : 	 0x915b : 	 7  
aida10 fault 	 0x8d3 : 	 0x8d3 : 	 0  
aida10 : WR status 0x10
 White Rabbit error counter test result: Passed 10, Failed 2

Understand the status reports as follows:-
Status bit 3 : White Rabbit decoder detected an error in the received data
Status bit 2 : Firmware registered WR error, no reload of Timestamp
Status bit 0 : White Rabbit decoder reports uncertain of Timestamp information from WR

     Note aida07 reports two bad timestamps in the merger
     MERGE Data Link (3762): bad timestamp  6 3 0xc1817ea7 0x04a8fc66 0x0000683974a8fc66 0x1677683974a8fc66 0x167768397a546a56
     MERGE Data Link (3762): bad timestamp  6 3 0xc1b77e25 0x04a8fc66 0x0000683974a8fc66 0x1677683974a8fc66 0x167768397a546a56


02:25 Remembered during a pre-experiment meeting with Vic, Patrick and Carl they mentioned the merger would track timestamp sequence errors
      Can confirm this is true. Can see the two in aida07 in the counter in the merger stats page - attachment 10

02:45 Now up to 7 timestamp errors on aida07 in the merger
      
02:49 Ran R34_45 through AIDASort - It reports a greater number of implant events are able to have a front back match performed
      Ratio between aida07 and 09 is 0.71 -> Double what it was before
      Energy response of the HEC channels in aida07 and aida09 looks equivalent (left group aida09 right group aida11) - attahchment 11 

04:40 Statistics ok - attachment 12
      Temperatures ok - attachment 13
      Bias and leakage currents - attachment 14
      Clock status, ADC calibration and memory infomration all ok
      aida07 fails both WR and FPGA
	
		 Base 		Current 	Difference
aida07 fault 	 0x915b : 	 0x9161 : 	 6  
aida10 fault 	 0x8d3 : 	 0x8d3 : 	 0  
aida10 : WR status 0x10
 White Rabbit error counter test result: Passed 10, Failed 2

Understand the status reports as follows:-
Status bit 3 : White Rabbit decoder detected an error in the received data
Status bit 2 : Firmware registered WR error, no reload of Timestamp
Status bit 0 : White Rabbit decoder reports uncertain of Timestamp information from WR

	
			 Base 		Current 		Difference
aida07 fault 	 0x0 : 	 0x1 : 	 1  
FPGA Timestamp error counter test result: Passed 11, Failed 1
If any of these counts are reported as in error
The ASIC readout system has detected a timeslip.
That is the timestamp read from the time FIFO is not younger than the last


       TS errors in the merger still only at 7 with all in aida07

06:25 Statistics - attachment 15
      Temps ok - attachment 16
      Bias and leakage currents ok - attachment 17

      System wide checks: clock status, adc calibration and memory information all ok
      WR multiple fails
	
		 Base 		Current 	Difference
aida05 fault 	 0xc9ca : 	 0xc9cb : 	 1  
aida06 fault 	 0xe900 : 	 0xe901 : 	 1  
aida07 fault 	 0x915b : 	 0x9166 : 	 11  
aida08 fault 	 0x641e : 	 0x641f : 	 1  
aida10 fault 	 0x8d3 : 	 0x8d3 : 	 0  
aida10 : WR status 0x10
 White Rabbit error counter test result: Passed 7, Failed 5

Understand the status reports as follows:-
Status bit 3 : White Rabbit decoder detected an error in the received data
Status bit 2 : Firmware registered WR error, no reload of Timestamp
Status bit 0 : White Rabbit decoder reports uncertain of Timestamp information from WR

     FPGA aida07 fails with difference of 1

     No new TS sequence errors in merger      
      

07:10 Beam has dropped out.
07:14 Beam is back
Attachment 1: 210420_0016_Stats.png
210420_0016_Stats.png
Attachment 2: 210420_0021_Layout7.png
210420_0021_Layout7.png
Attachment 3: 210420_0022_Layout8.png
210420_0022_Layout8.png
Attachment 4: 210420_0026_R34_13_Analysis.txt
 *** TDR format 3.3.0 analyser - TD - January 2019
 *** ERROR: READ I/O error:       5002
                   blocks:      32000
          ADC data format:  255975543 ( 1356743.5 Hz)
        Other data format:    5944457 (   31507.3 Hz)
 Sample trace data format:          0 (       0.0 Hz)
         Undefined format:          0 (       0.0 Hz)
   Other data format type:      PAUSE:          0 (       0.0 Hz)
                               RESUME:          0 (       0.0 Hz)
                              SYNC100:      32703 (     173.3 Hz)
                              WR48-63:      32703 (     173.3 Hz)
                           FEE64 disc:    1073243 (    5688.5 Hz)
                             MBS info:    4805808 (   25472.2 Hz)
                           Other info:          0 (       0.0 Hz)

   ADC data range bit set:     345437 (    1830.9 Hz)

                Timewarps:        ADC:          0 (       0.0 Hz)
                                PAUSE:          0 (       0.0 Hz)
                               RESUME:          0 (       0.0 Hz)
                              SYNC100:          0 (       0.0 Hz)
                              WR48-63:          0 (       0.0 Hz)
                           FEE64 disc:          0 (       0.0 Hz)
                             MBS info:          0 (       0.0 Hz)
                            Undefined:          0 (       0.0 Hz)
                         Sample trace:          0 (       0.0 Hz)

 *** Timestamp elapsed time:      188.669 s
 FEE  elapsed dead time(s) elapsed idle time(s)
  1                0.000               46.534
  2                0.000               63.789
  3                0.000               54.847
  4                0.000              174.519
  5                0.000              123.945
  6                0.000              113.898
  7                0.000              135.923
  8                0.000               59.774
  9                0.000               27.296
 10                0.000               12.263
 11                0.000               65.598
 12                0.000                0.000
 13                0.000                0.000
 14                0.000                0.000
 15                0.000                0.000
 16                0.000                0.000
 17                0.000                0.000
 18                0.000                0.000
 19                0.000                0.000
 20                0.000                0.000
 21                0.000                0.000
 22                0.000                0.000
 23                0.000                0.000
 24                0.000                0.000
 25                0.000                0.000
 26                0.000                0.000
 27                0.000                0.000
 28                0.000                0.000
 29                0.000                0.000
 30                0.000                0.000
 31                0.000                0.000
 32                0.000                0.000

 *** Statistics
 FEE  ADC Data Other Data     Sample  Undefined      Pause     Resume    SYNC100    WR48-63       Disc        MBS      Other   HEC Data
  0   14400003     100475          0          0          0          0       1767       1767      95813       1128          0      35602
  1   23251868      63483          0          0          0          0       2988       2988      57507          0          0      21204
  2   17192461    2025458          0          0          0          0       2415       2415     200396    1820232          0      34093
  3   20019932    1908259          0          0          0          0       2815       2815      81941    1820688          0      32715
  4    3059738     405674          0          0          0          0        403        403     100680     304188          0      35774
  5   10595698     355900          0          0          0          0       1322       1322      58122     295134          0      21319
  6   12037952     388178          0          0          0          0       1554       1554     105230     279840          0      34521
  7    9390918     368608          0          0          0          0       1205       1205      81600     284598          0      31165
  8   46854628      72459          0          0          0          0       5872       5872      60715          0          0      21758
  9   43874737      60599          0          0          0          0       5426       5426      49747          0          0      17382
 10   36184433     112868          0          0          0          0       4528       4528     103812          0          0      31745
 11   19113175      82496          0          0          0          0       2408       2408      77680          0          0      28159
 12          0          0          0          0          0          0          0          0          0          0          0          0
 13          0          0          0          0          0          0          0          0          0          0          0          0
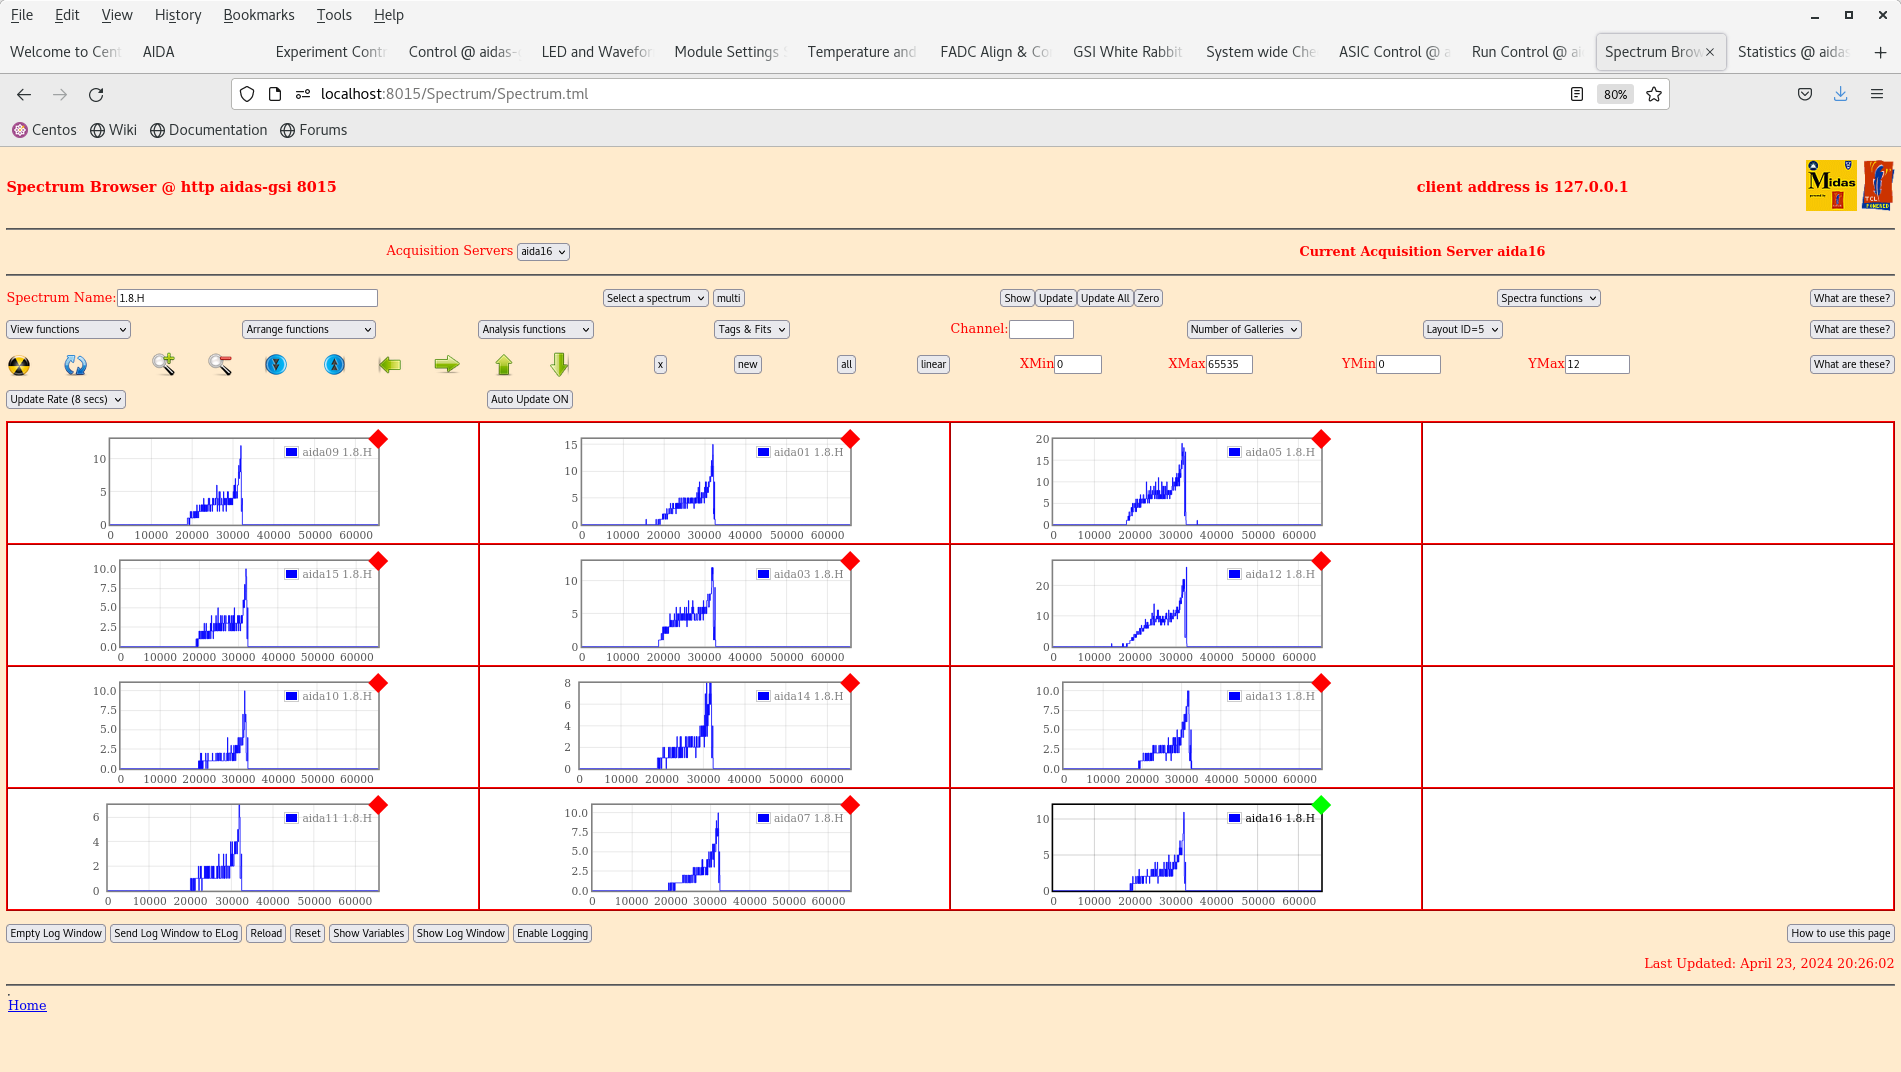
 14          0          0          0          0          0          0          0          0          0          0          0          0
 15          0          0          0          0          0          0          0          0          0          0          0          0
 16          0          0          0          0          0          0          0          0          0          0          0          0
 17          0          0          0          0          0          0          0          0          0          0          0          0
 18          0          0          0          0          0          0          0          0          0          0          0          0
 19          0          0          0          0          0          0          0          0          0          0          0          0
 20          0          0          0          0          0          0          0          0          0          0          0          0
 21          0          0          0          0          0          0          0          0          0          0          0          0
 22          0          0          0          0          0          0          0          0          0          0          0          0
 23          0          0          0          0          0          0          0          0          0          0          0          0
 24          0          0          0          0          0          0          0          0          0          0          0          0
 25          0          0          0          0          0          0          0          0          0          0          0          0
 26          0          0          0          0          0          0          0          0          0          0          0          0
 27          0          0          0          0          0          0          0          0          0          0          0          0
 28          0          0          0          0          0          0          0          0          0          0          0          0
 29          0          0          0          0          0          0          0          0          0          0          0          0
 30          0          0          0          0          0          0          0          0          0          0          0          0
 31          0          0          0          0          0          0          0          0          0          0          0          0
 32          0          0          0          0          0          0          0          0          0          0          0          0

 *** Timewarps
 FEE       ADC      Pause     Resume    SYNC100    WR48-63       Disc        MBS  Undefined    Samples
  0          0          0          0          0          0          0          0          0          0
  1          0          0          0          0          0          0          0          0          0
  2          0          0          0          0          0          0          0          0          0
  3          0          0          0          0          0          0          0          0          0
  4          0          0          0          0          0          0          0          0          0
  5          0          0          0          0          0          0          0          0          0
  6          0          0          0          0          0          0          0          0          0
  7          0          0          0          0          0          0          0          0          0
  8          0          0          0          0          0          0          0          0          0
  9          0          0          0          0          0          0          0          0          0
 10          0          0          0          0          0          0          0          0          0
 11          0          0          0          0          0          0          0          0          0
 12          0          0          0          0          0          0          0          0          0
 13          0          0          0          0          0          0          0          0          0
 14          0          0          0          0          0          0          0          0          0
 15          0          0          0          0          0          0          0          0          0
 16          0          0          0          0          0          0          0          0          0
 17          0          0          0          0          0          0          0          0          0
 18          0          0          0          0          0          0          0          0          0
 19          0          0          0          0          0          0          0          0          0
 20          0          0          0          0          0          0          0          0          0
 21          0          0          0          0          0          0          0          0          0
 22          0          0          0          0          0          0          0          0          0
 23          0          0          0          0          0          0          0          0          0
 24          0          0          0          0          0          0          0          0          0
 25          0          0          0          0          0          0          0          0          0
 26          0          0          0          0          0          0          0          0          0
 27          0          0          0          0          0          0          0          0          0
 28          0          0          0          0          0          0          0          0          0
 29          0          0          0          0          0          0          0          0          0
 30          0          0          0          0          0          0          0          0          0
 31          0          0          0          0          0          0          0          0          0
 32          0          0          0          0          0          0          0          0          0

 *** Program elapsed time: 1641.051s (   19.500 blocks/s,   1.219 Mb/s)
Attachment 5: 210420_0109_Bias.png
210420_0109_Bias.png
Attachment 6: 210420_0026_R34_36_Analysis.txt
 *** TDR format 3.3.0 analyser - TD - January 2019
 *** ERROR: READ I/O error:       5002
                   blocks:      32000
          ADC data format:  255999603 ( 1309621.8 Hz)
        Other data format:    5920397 (   30287.1 Hz)
 Sample trace data format:          0 (       0.0 Hz)
         Undefined format:          0 (       0.0 Hz)
   Other data format type:      PAUSE:          0 (       0.0 Hz)
                               RESUME:          0 (       0.0 Hz)
                              SYNC100:      32728 (     167.4 Hz)
                              WR48-63:      32728 (     167.4 Hz)
                           FEE64 disc:    1044504 (    5343.4 Hz)
                             MBS info:    4810437 (   24608.8 Hz)
                           Other info:          0 (       0.0 Hz)

   ADC data range bit set:     327887 (    1677.4 Hz)

                Timewarps:        ADC:          0 (       0.0 Hz)
                                PAUSE:          0 (       0.0 Hz)
                               RESUME:          0 (       0.0 Hz)
                              SYNC100:          0 (       0.0 Hz)
                              WR48-63:          0 (       0.0 Hz)
                           FEE64 disc:          0 (       0.0 Hz)
                             MBS info:          0 (       0.0 Hz)
                            Undefined:          0 (       0.0 Hz)
                         Sample trace:          0 (       0.0 Hz)

 *** Timestamp elapsed time:      195.476 s
 FEE  elapsed dead time(s) elapsed idle time(s)
  1                0.000               51.325
  2                0.000               68.599
  3                0.000               55.115
  4                0.000              180.174
  5                0.000              140.295
  6                0.000              123.427
  7                0.000              138.446
  8                0.000               55.510
  9                0.000               13.463
 10                0.000               24.357
 11                0.000               74.336
 12                0.000                0.000
 13                0.000                0.000
 14                0.000                0.000
 15                0.000                0.000
 16                0.000                0.000
 17                0.000                0.000
 18                0.000                0.000
 19                0.000                0.000
 20                0.000                0.000
 21                0.000                0.000
 22                0.000                0.000
 23                0.000                0.000
 24                0.000                0.000
 25                0.000                0.000
 26                0.000                0.000
 27                0.000                0.000
 28                0.000                0.000
 29                0.000                0.000
 30                0.000                0.000
 31                0.000                0.000
 32                0.000                0.000

 *** Statistics
 FEE  ADC Data Other Data     Sample  Undefined      Pause     Resume    SYNC100    WR48-63       Disc        MBS      Other   HEC Data
  0   14611253      94841          0          0          0          0       1936       1936      89802       1167          0      33511
  1   23423897      61346          0          0          0          0       3006       3006      55334          0          0      20222
  2   17311487    2050104          0          0          0          0       2477       2477     195362    1849788          0      32021
  3   20533060    1944396          0          0          0          0       2862       2862      77493    1861179          0      30741
  4    2942569     381933          0          0          0          0        417        417      93930     287169          0      33667
  5    9776355     338395          0          0          0          0       1239       1239      56110     279807          0      20096
  6   11887130     369619          0          0          0          0       1555       1555     103862     262647          0      32503
  7    9239609     348065          0          0          0          0       1200       1200      76985     268680          0      29470
  8   49507336      72711          0          0          0          0       6129       6129      60453          0          0      21190
  9   44170393      65100          0          0          0          0       5430       5430      54240          0          0      18016
 10   32977762     112783          0          0          0          0       4022       4022     104739          0          0      30280
 11   19618752      81104          0          0          0          0       2455       2455      76194          0          0      26170
 12          0          0          0          0          0          0          0          0          0          0          0          0
 13          0          0          0          0          0          0          0          0          0          0          0          0
 14          0          0          0          0          0          0          0          0          0          0          0          0
 15          0          0          0          0          0          0          0          0          0          0          0          0
 16          0          0          0          0          0          0          0          0          0          0          0          0
 17          0          0          0          0          0          0          0          0          0          0          0          0
 18          0          0          0          0          0          0          0          0          0          0          0          0
 19          0          0          0          0          0          0          0          0          0          0          0          0
 20          0          0          0          0          0          0          0          0          0          0          0          0
 21          0          0          0          0          0          0          0          0          0          0          0          0
 22          0          0          0          0          0          0          0          0          0          0          0          0
 23          0          0          0          0          0          0          0          0          0          0          0          0
 24          0          0          0          0          0          0          0          0          0          0          0          0
 25          0          0          0          0          0          0          0          0          0          0          0          0
 26          0          0          0          0          0          0          0          0          0          0          0          0
 27          0          0          0          0          0          0          0          0          0          0          0          0
 28          0          0          0          0          0          0          0          0          0          0          0          0
 29          0          0          0          0          0          0          0          0          0          0          0          0
 30          0          0          0          0          0          0          0          0          0          0          0          0
 31          0          0          0          0          0          0          0          0          0          0          0          0
 32          0          0          0          0          0          0          0          0          0          0          0          0

 *** Timewarps
 FEE       ADC      Pause     Resume    SYNC100    WR48-63       Disc        MBS  Undefined    Samples
  0          0          0          0          0          0          0          0          0          0
  1          0          0          0          0          0          0          0          0          0
  2          0          0          0          0          0          0          0          0          0
  3          0          0          0          0          0          0          0          0          0
  4          0          0          0          0          0          0          0          0          0
  5          0          0          0          0          0          0          0          0          0
  6          0          0          0          0          0          0          0          0          0
  7          0          0          0          0          0          0          0          0          0
  8          0          0          0          0          0          0          0          0          0
  9          0          0          0          0          0          0          0          0          0
 10          0          0          0          0          0          0          0          0          0
 11          0          0          0          0          0          0          0          0          0
 12          0          0          0          0          0          0          0          0          0
 13          0          0          0          0          0          0          0          0          0
 14          0          0          0          0          0          0          0          0          0
 15          0          0          0          0          0          0          0          0          0
 16          0          0          0          0          0          0          0          0          0
 17          0          0          0          0          0          0          0          0          0
 18          0          0          0          0          0          0          0          0          0
 19          0          0          0          0          0          0          0          0          0
 20          0          0          0          0          0          0          0          0          0
 21          0          0          0          0          0          0          0          0          0
 22          0          0          0          0          0          0          0          0          0
 23          0          0          0          0          0          0          0          0          0
 24          0          0          0          0          0          0          0          0          0
 25          0          0          0          0          0          0          0          0          0
 26          0          0          0          0          0          0          0          0          0
 27          0          0          0          0          0          0          0          0          0
 28          0          0          0          0          0          0          0          0          0
 29          0          0          0          0          0          0          0          0          0
 30          0          0          0          0          0          0          0          0          0
 31          0          0          0          0          0          0          0          0          0
 32          0          0          0          0          0          0          0          0          0

 *** Program elapsed time: 5995.524s (    5.337 blocks/s,   0.334 Mb/s)
Attachment 7: 210420_0220_Stats.png
210420_0220_Stats.png
Attachment 8: 210420_0229_Temp.png
210420_0229_Temp.png
Attachment 9: 210420_0220_Bias.png
210420_0220_Bias.png
Attachment 10: 210420_0225_MergerStats.png
210420_0225_MergerStats.png
Attachment 11: Capture.PNG
Capture.PNG
Attachment 12: 210420_0437_stats.png
210420_0437_stats.png
Attachment 13: 210420_0538_Temp.png
210420_0538_Temp.png
Attachment 14: 210420_0439_Bias.png
210420_0439_Bias.png
Attachment 15: 210420_0624_stats.png
210420_0624_stats.png
Attachment 16: 210420_0624_Temp.png
210420_0624_Temp.png
Attachment 17: 210420_0625_Bias.png
210420_0625_Bias.png
  599   Tue Apr 23 19:23:42 2024 PP20:30 checks

All looks good.

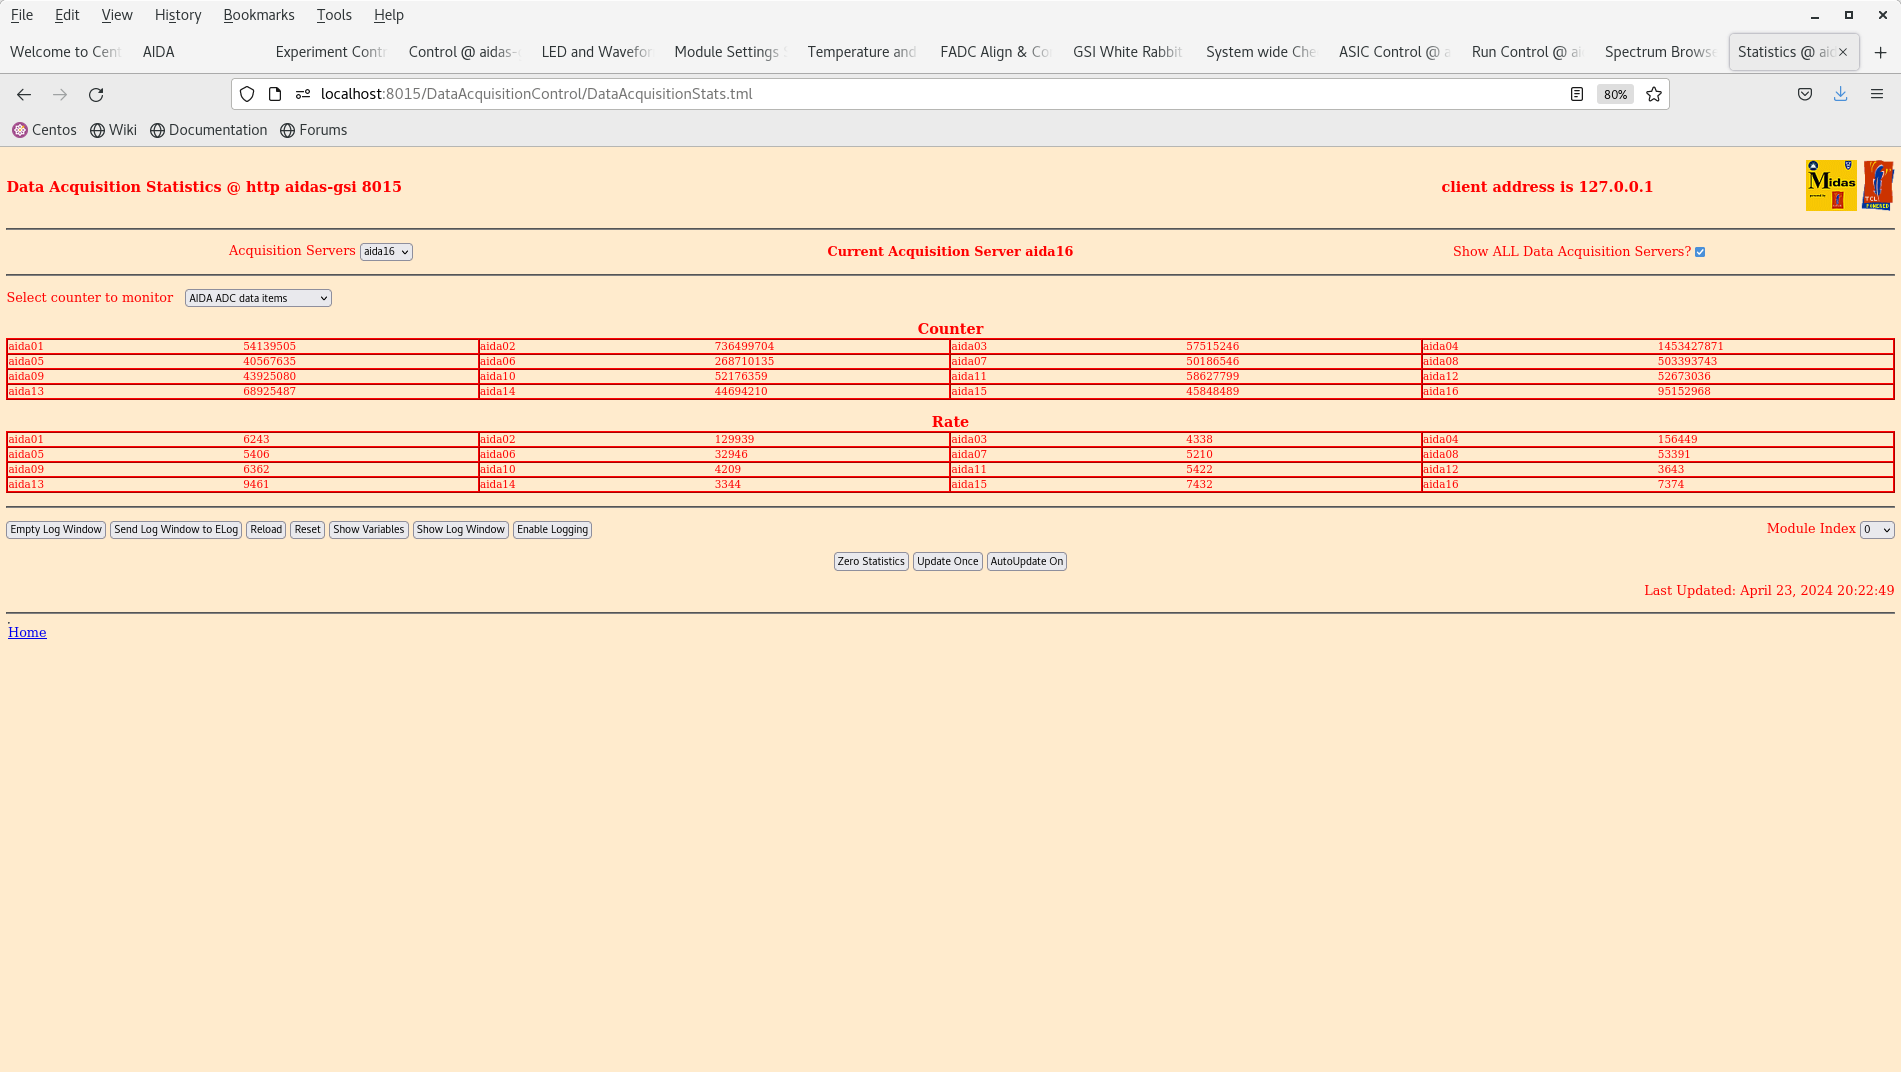
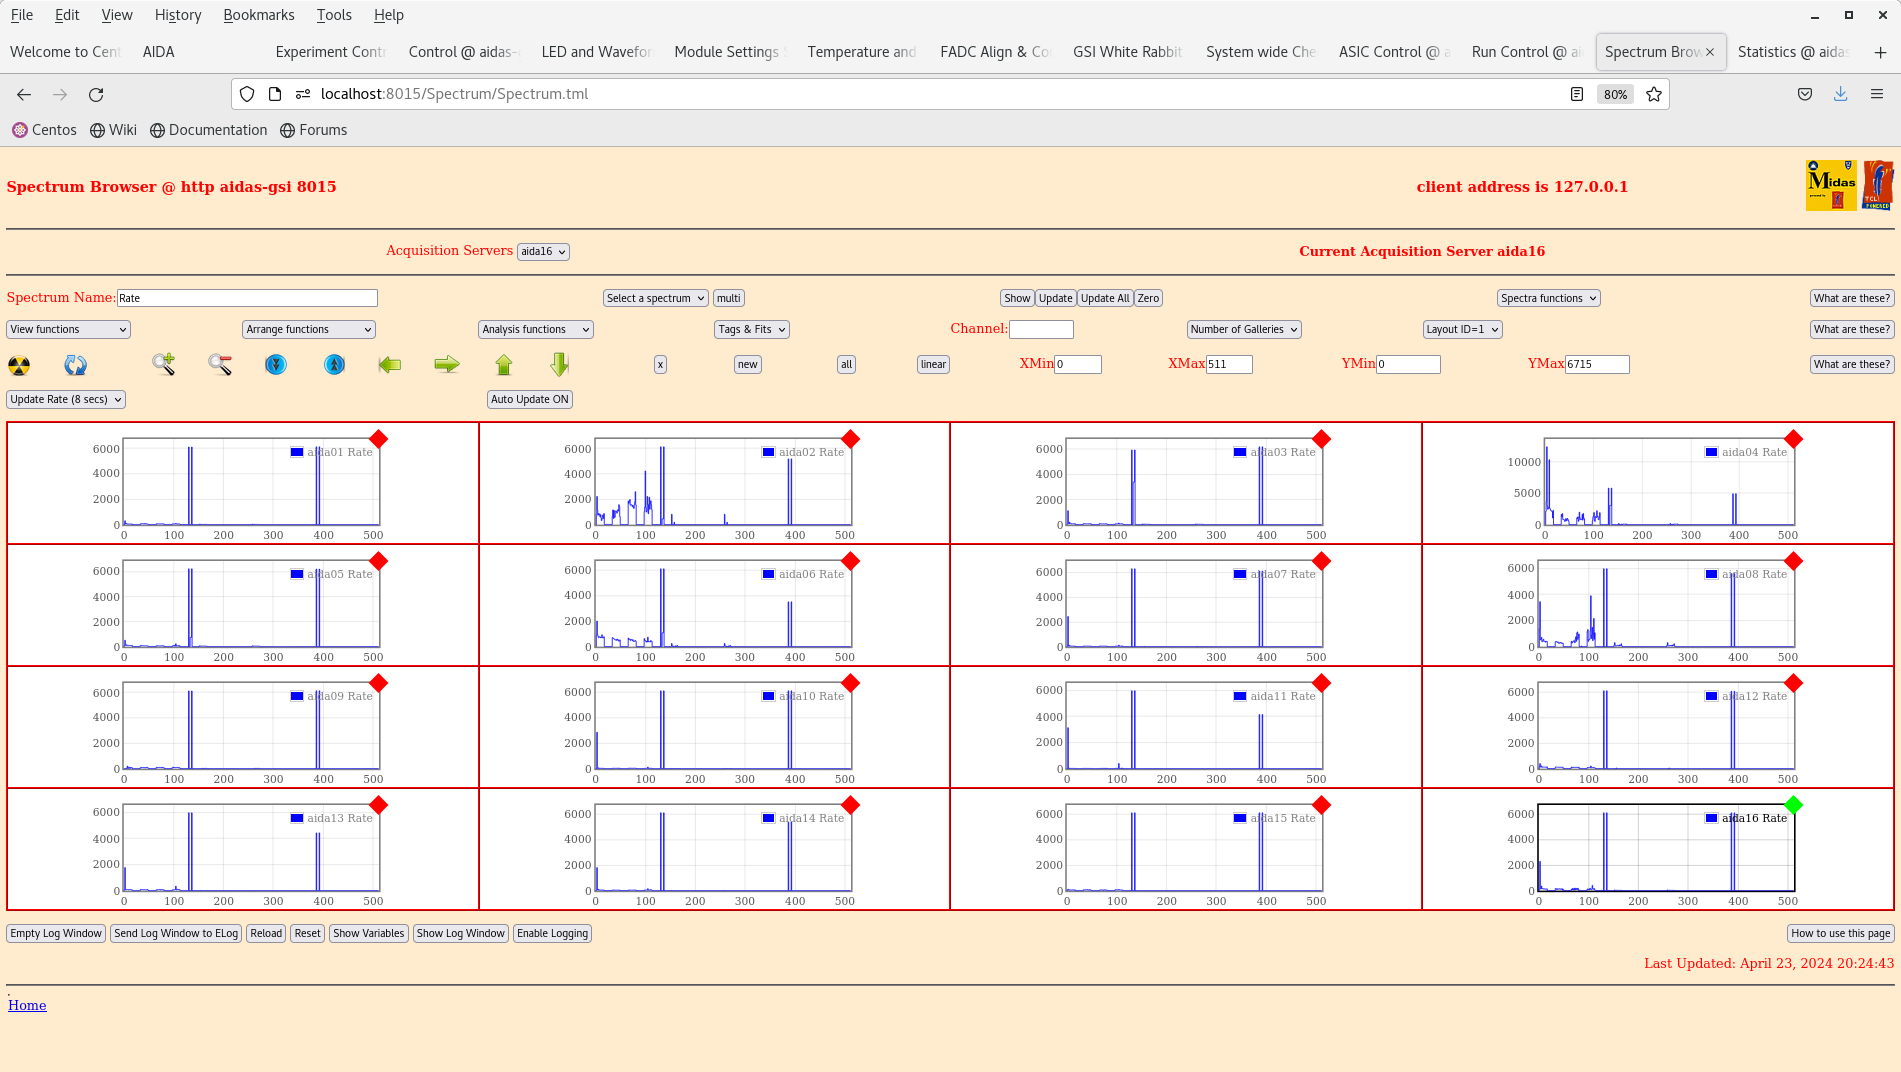
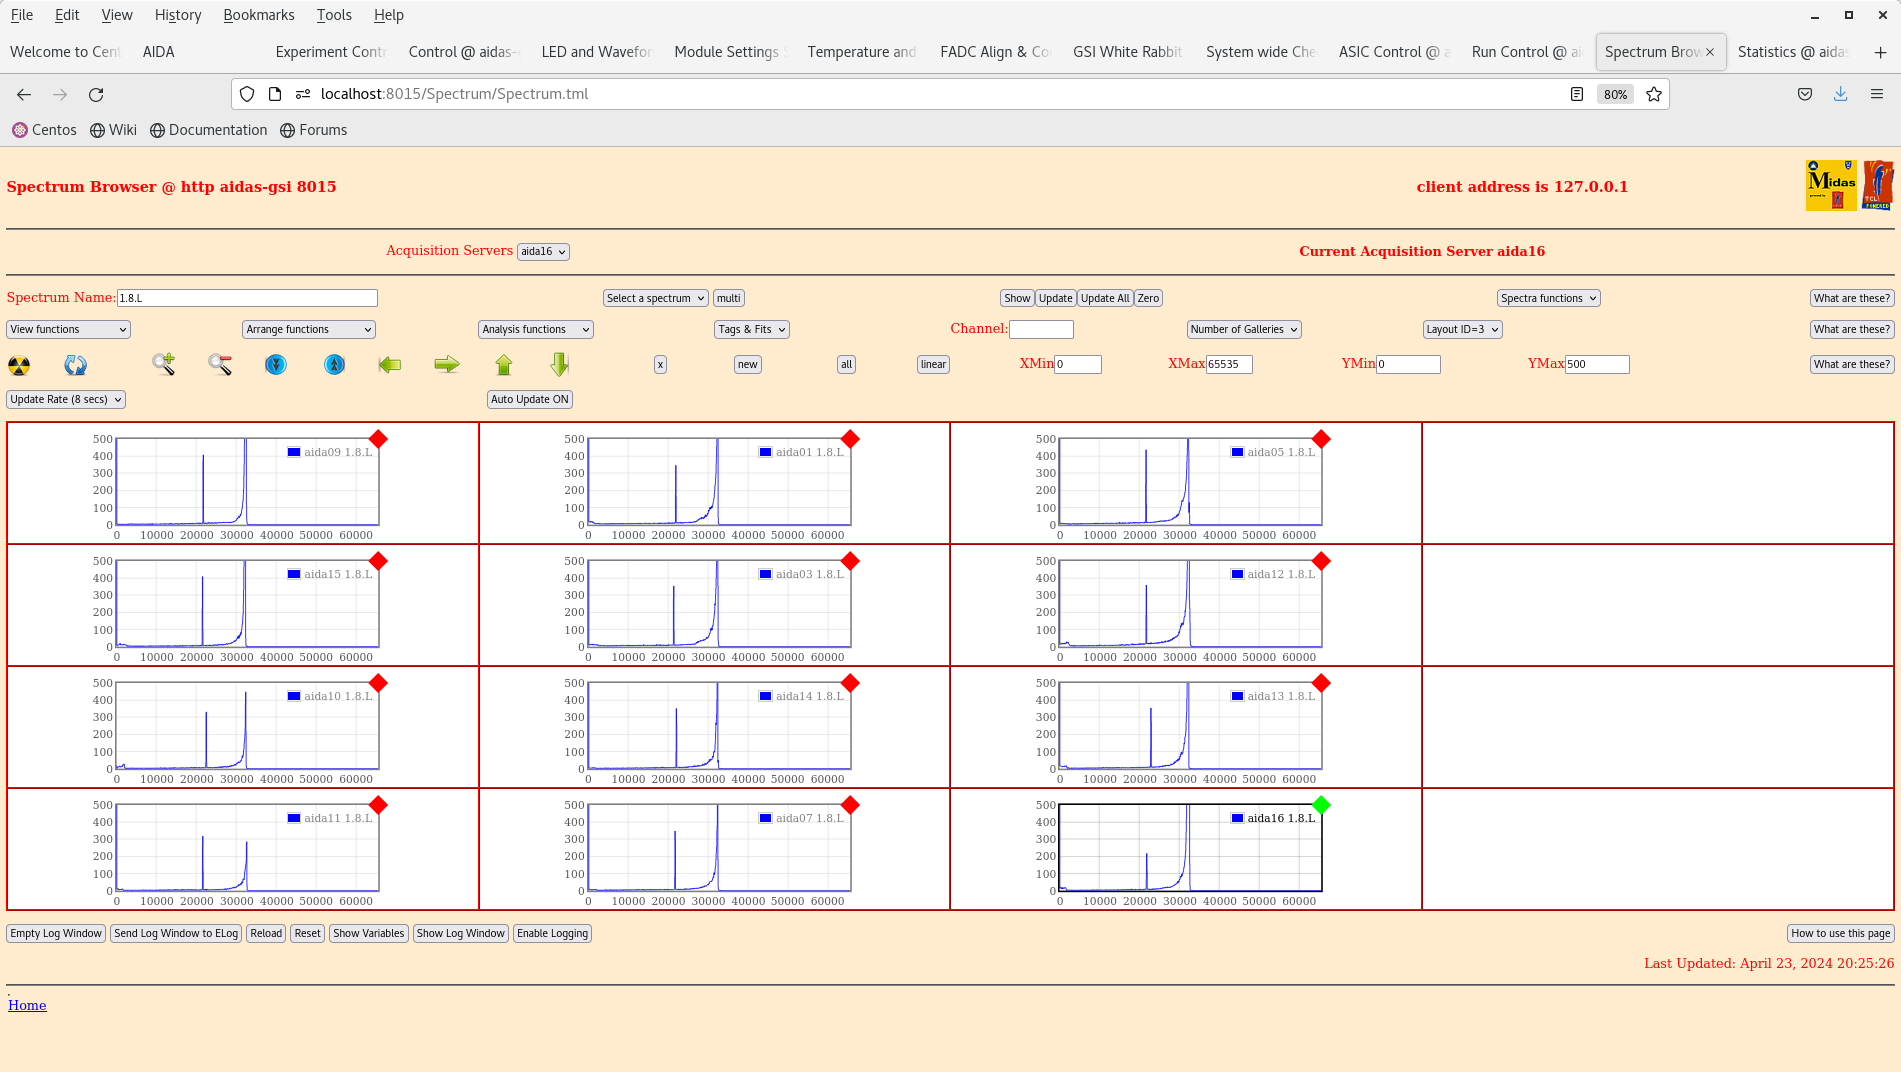
Screenshots attached.

Attachment 1: Screenshot_from_2024-04-23_20-24-09.png
Screenshot_from_2024-04-23_20-24-09.png
Attachment 2: Screenshot_from_2024-04-23_20-24-25.png
Screenshot_from_2024-04-23_20-24-25.png
Attachment 3: Screenshot_from_2024-04-23_20-24-52.png
Screenshot_from_2024-04-23_20-24-52.png
Attachment 4: Screenshot_from_2024-04-23_20-25-35.png
Screenshot_from_2024-04-23_20-25-35.png
Attachment 5: Screenshot_from_2024-04-23_20-26-16.png
Screenshot_from_2024-04-23_20-26-16.png
Attachment 6: Screenshot_from_2024-04-23_20-27-01.png
Screenshot_from_2024-04-23_20-27-01.png
Attachment 7: Screenshot_from_2024-04-23_20-27-26.png
Screenshot_from_2024-04-23_20-27-26.png
Attachment 8: Screenshot_from_2024-04-23_20-27-53.png
Screenshot_from_2024-04-23_20-27-53.png
  720   Wed Oct 15 09:41:24 2025 JB, GB, MP207Bi source threshold tests
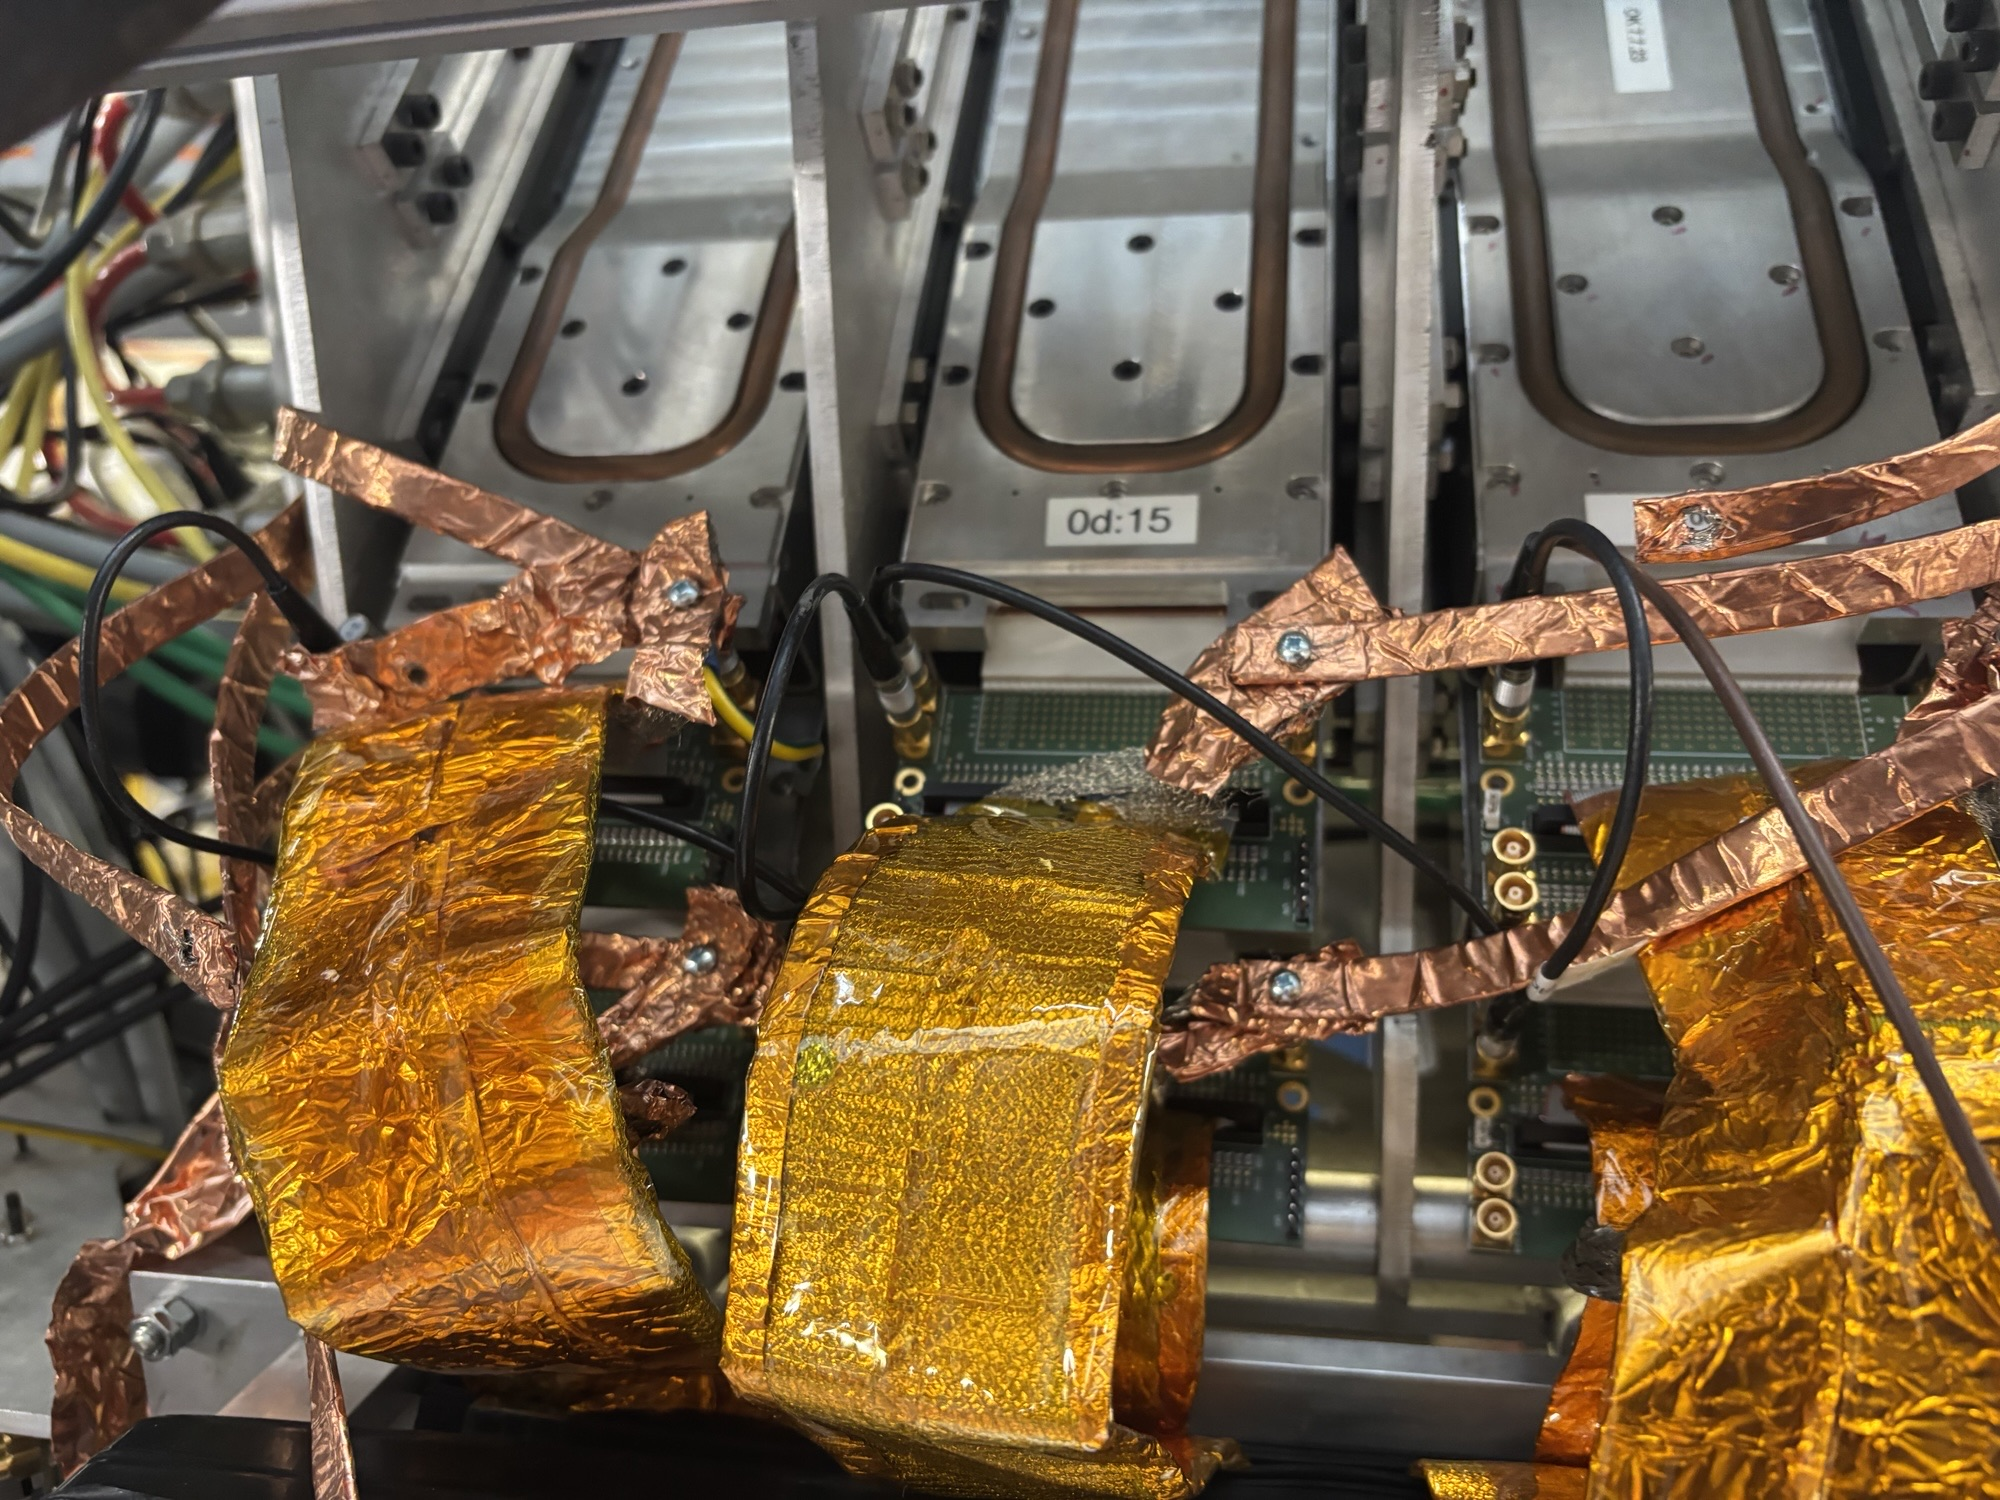
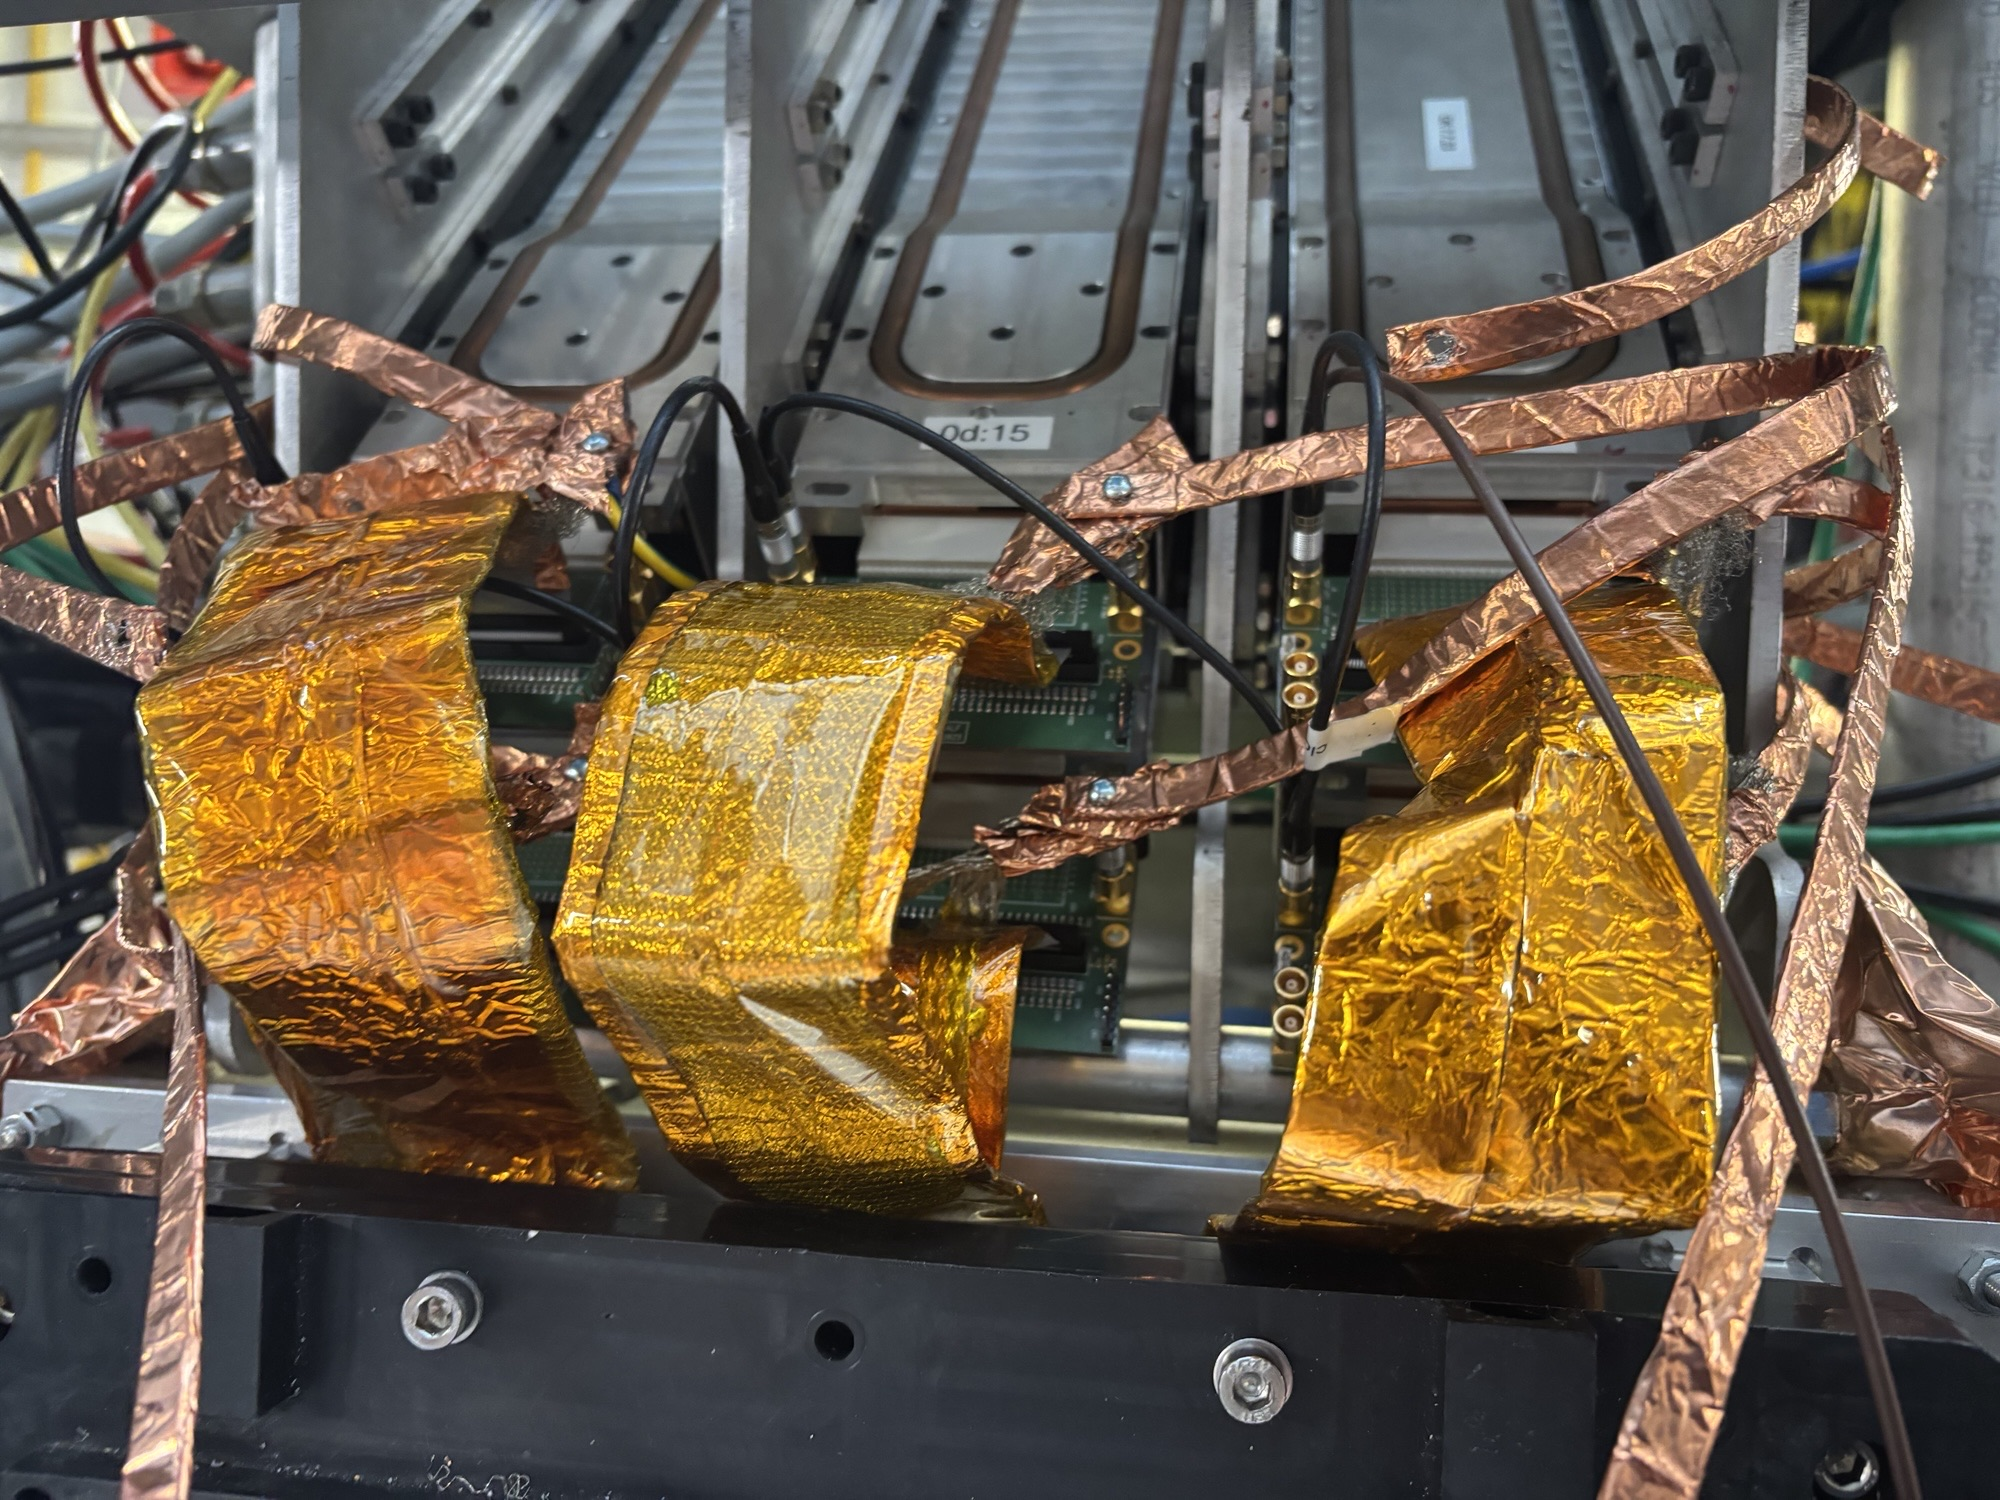
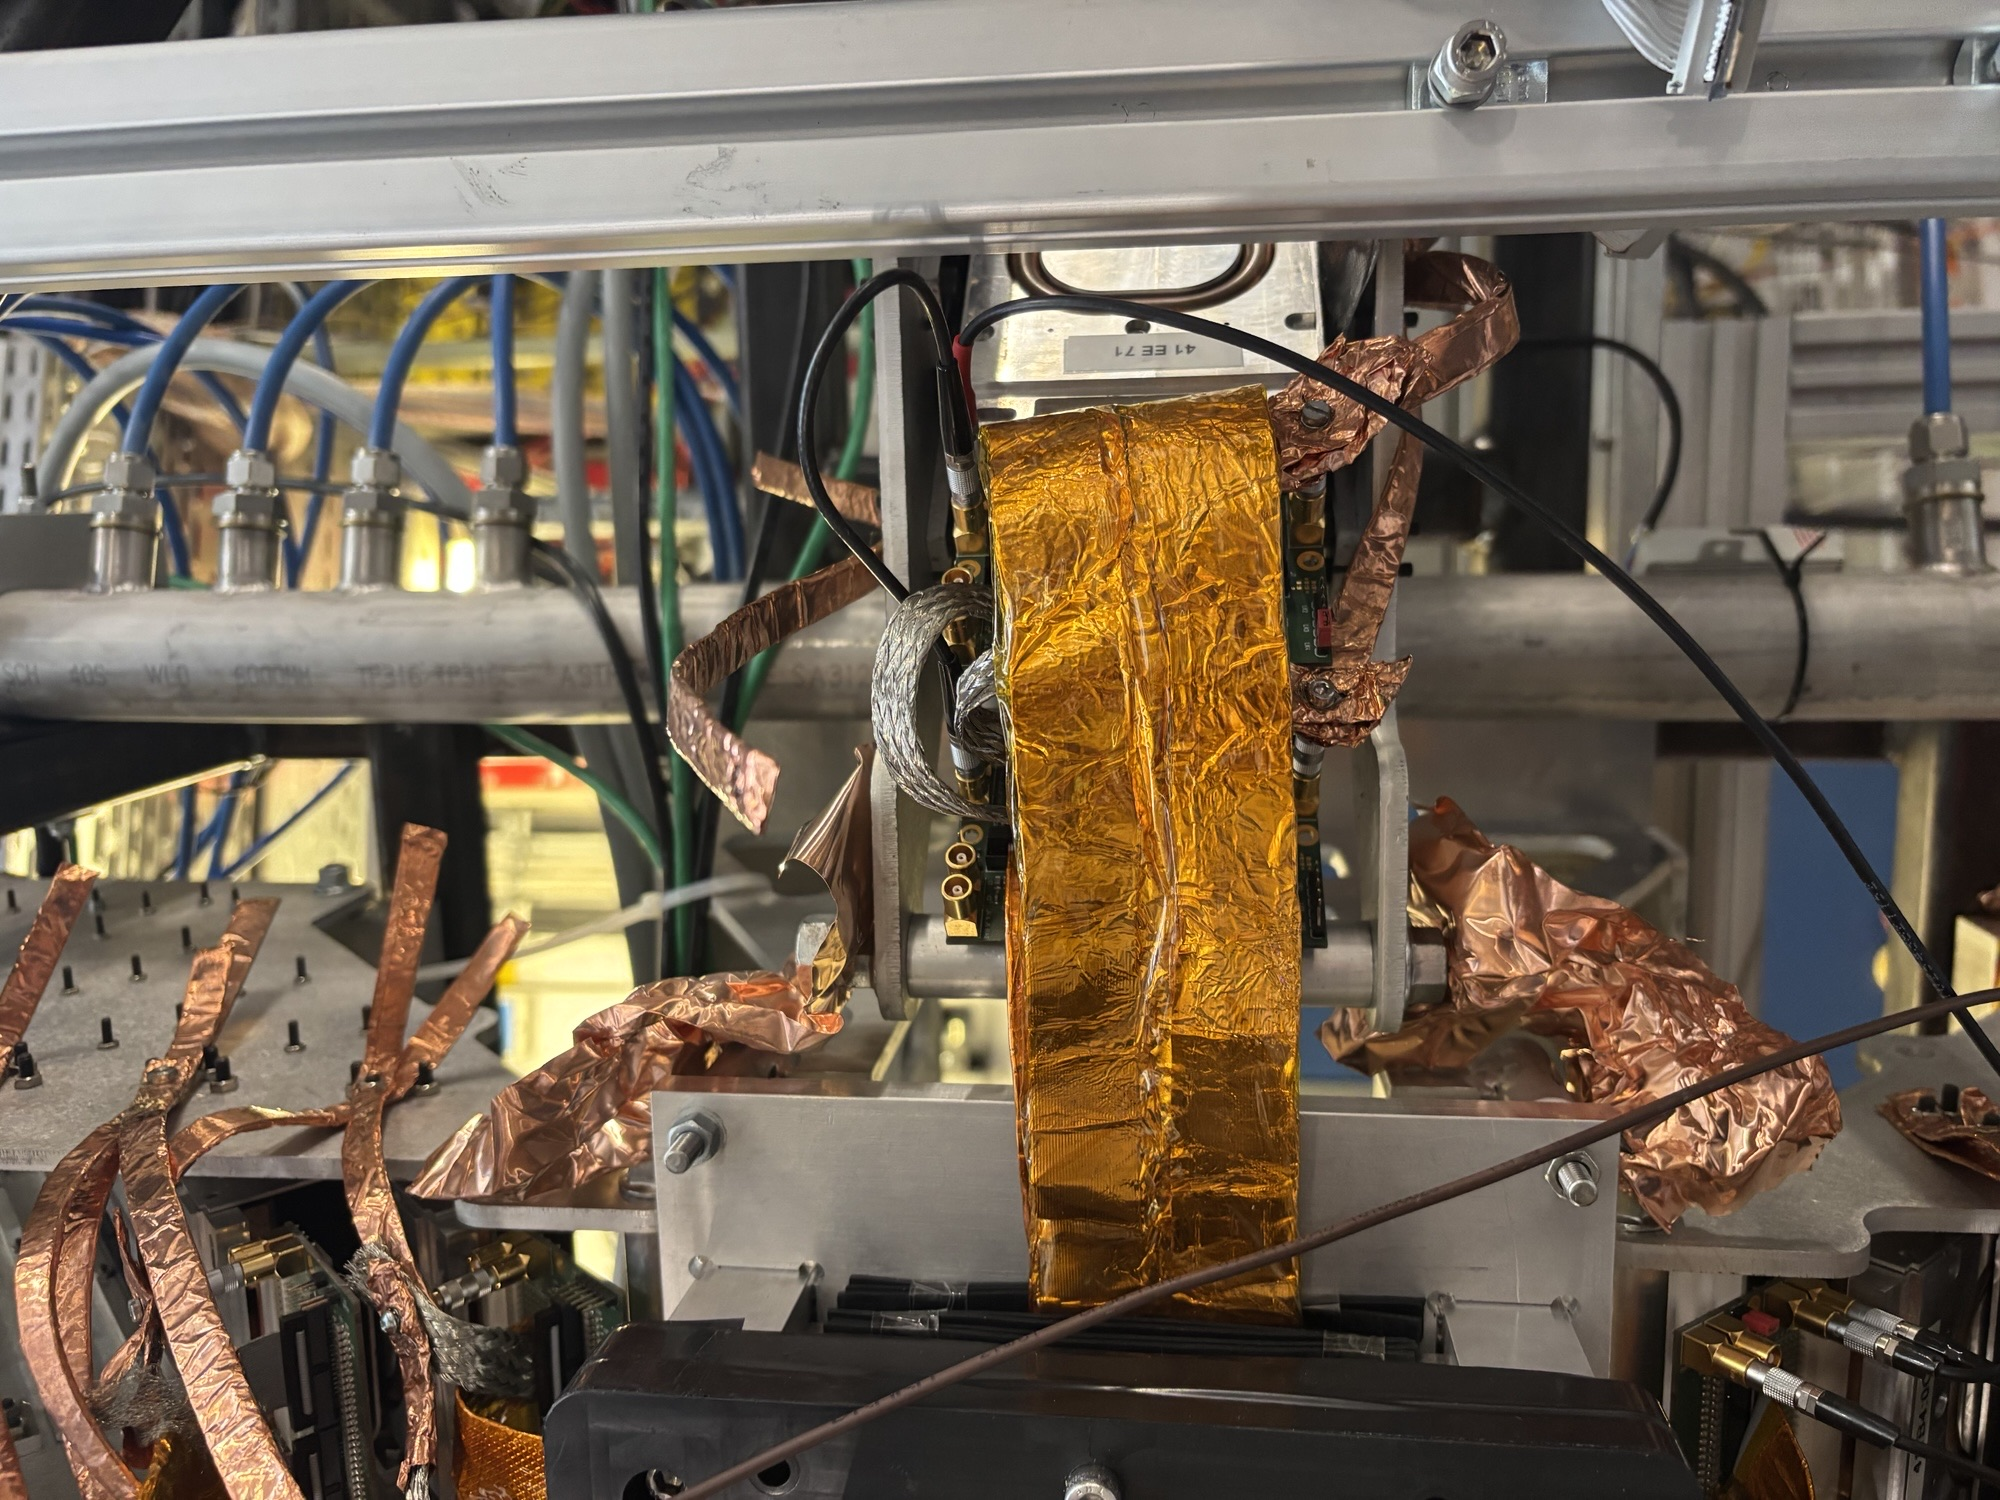
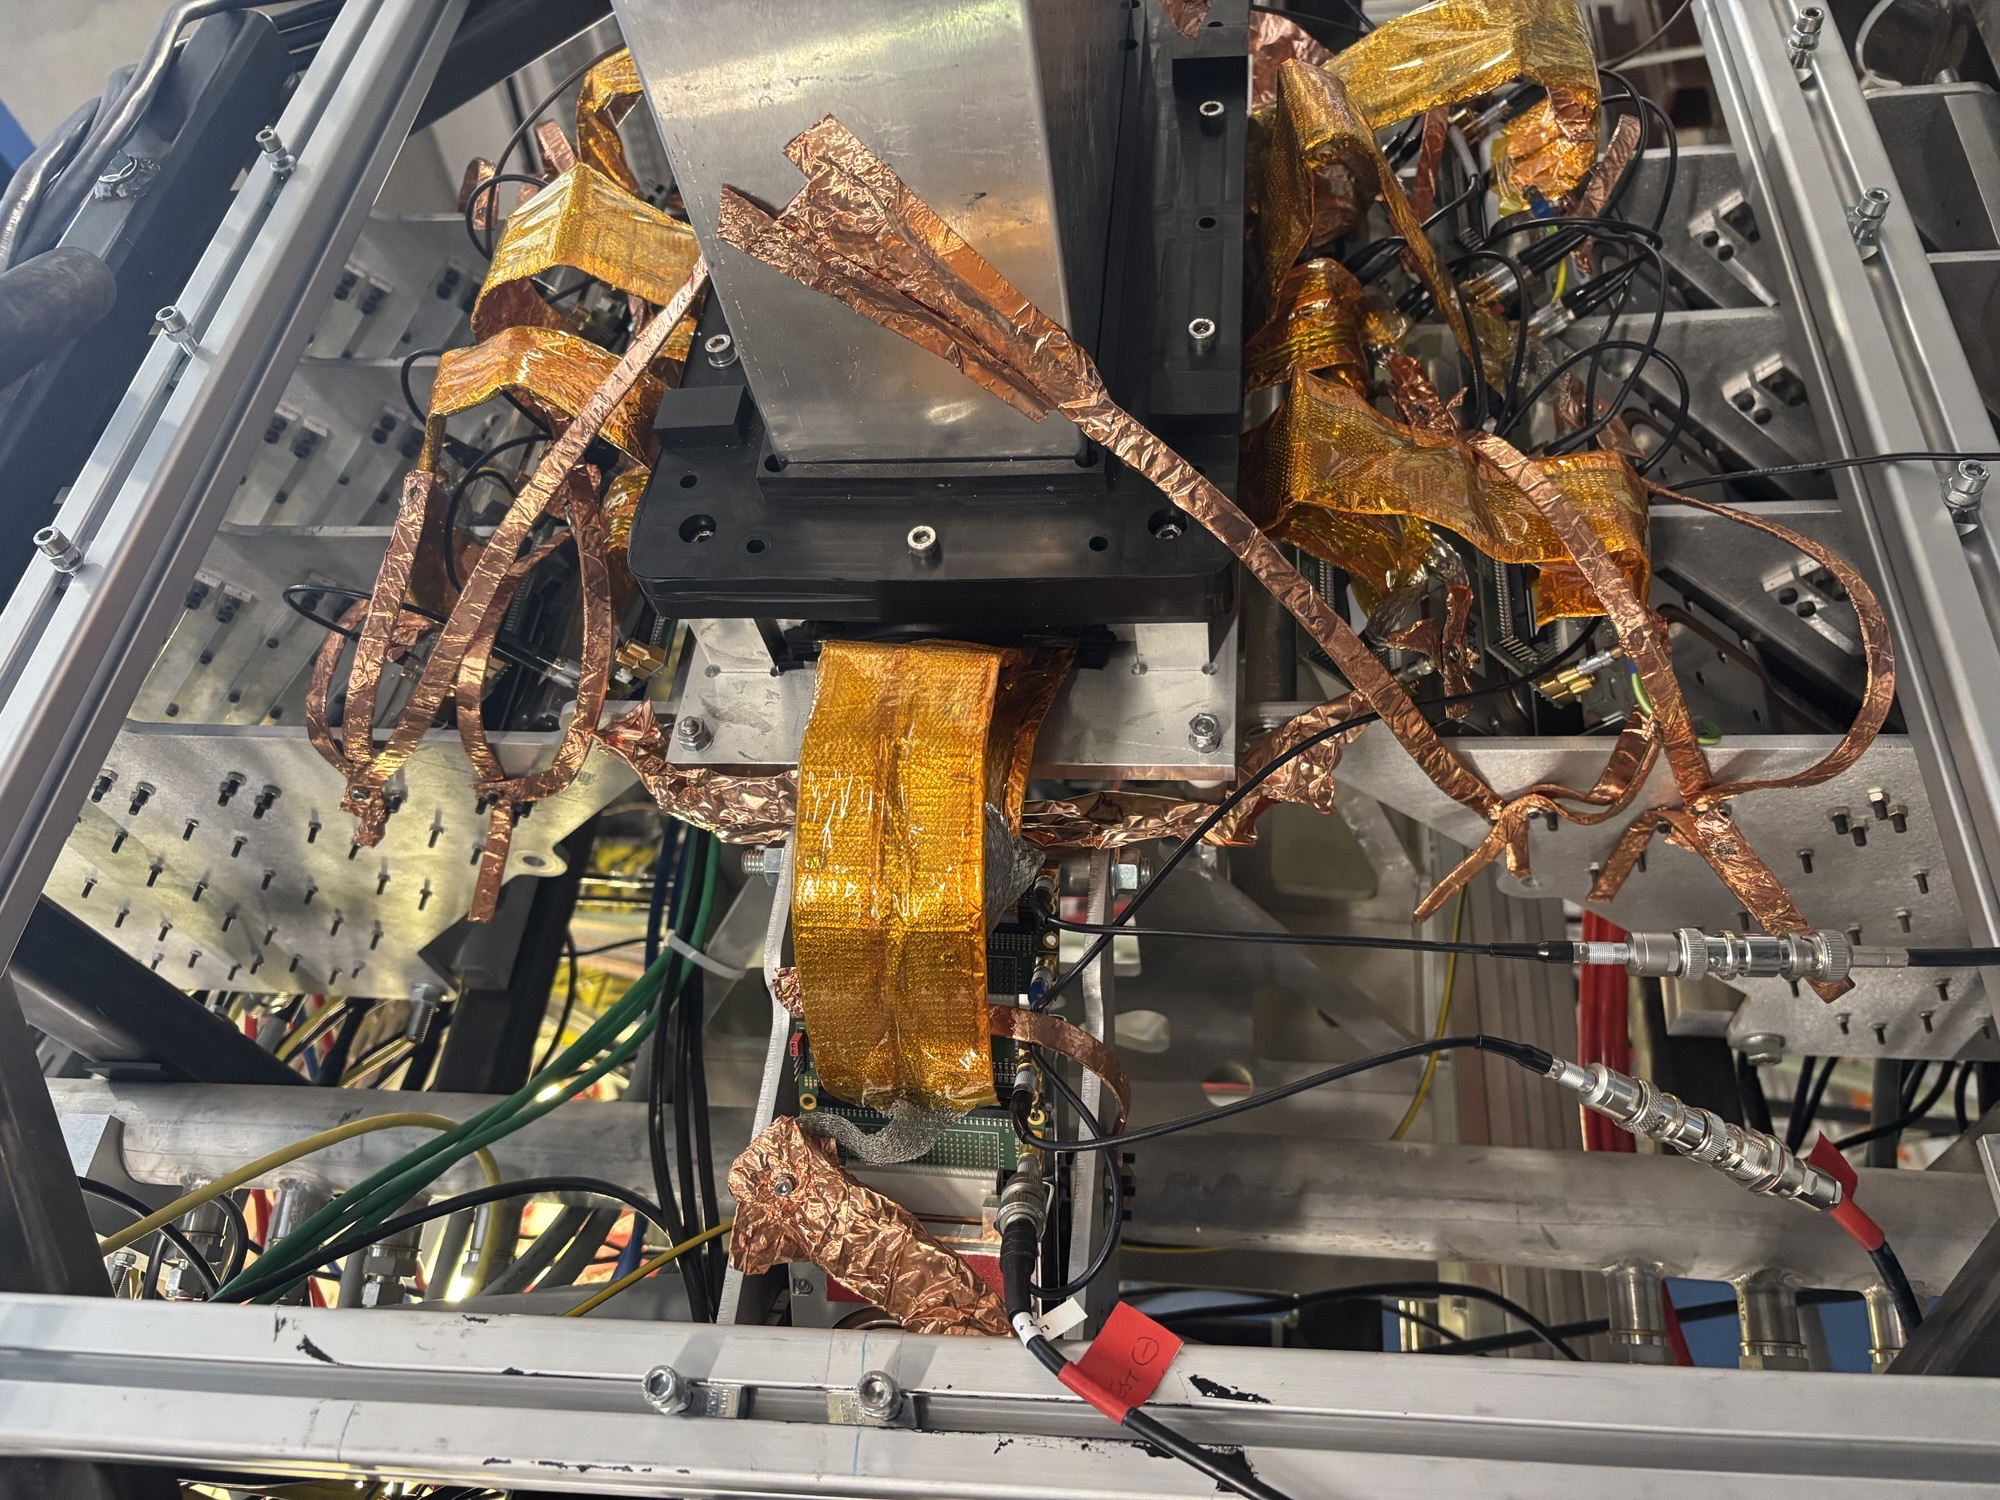
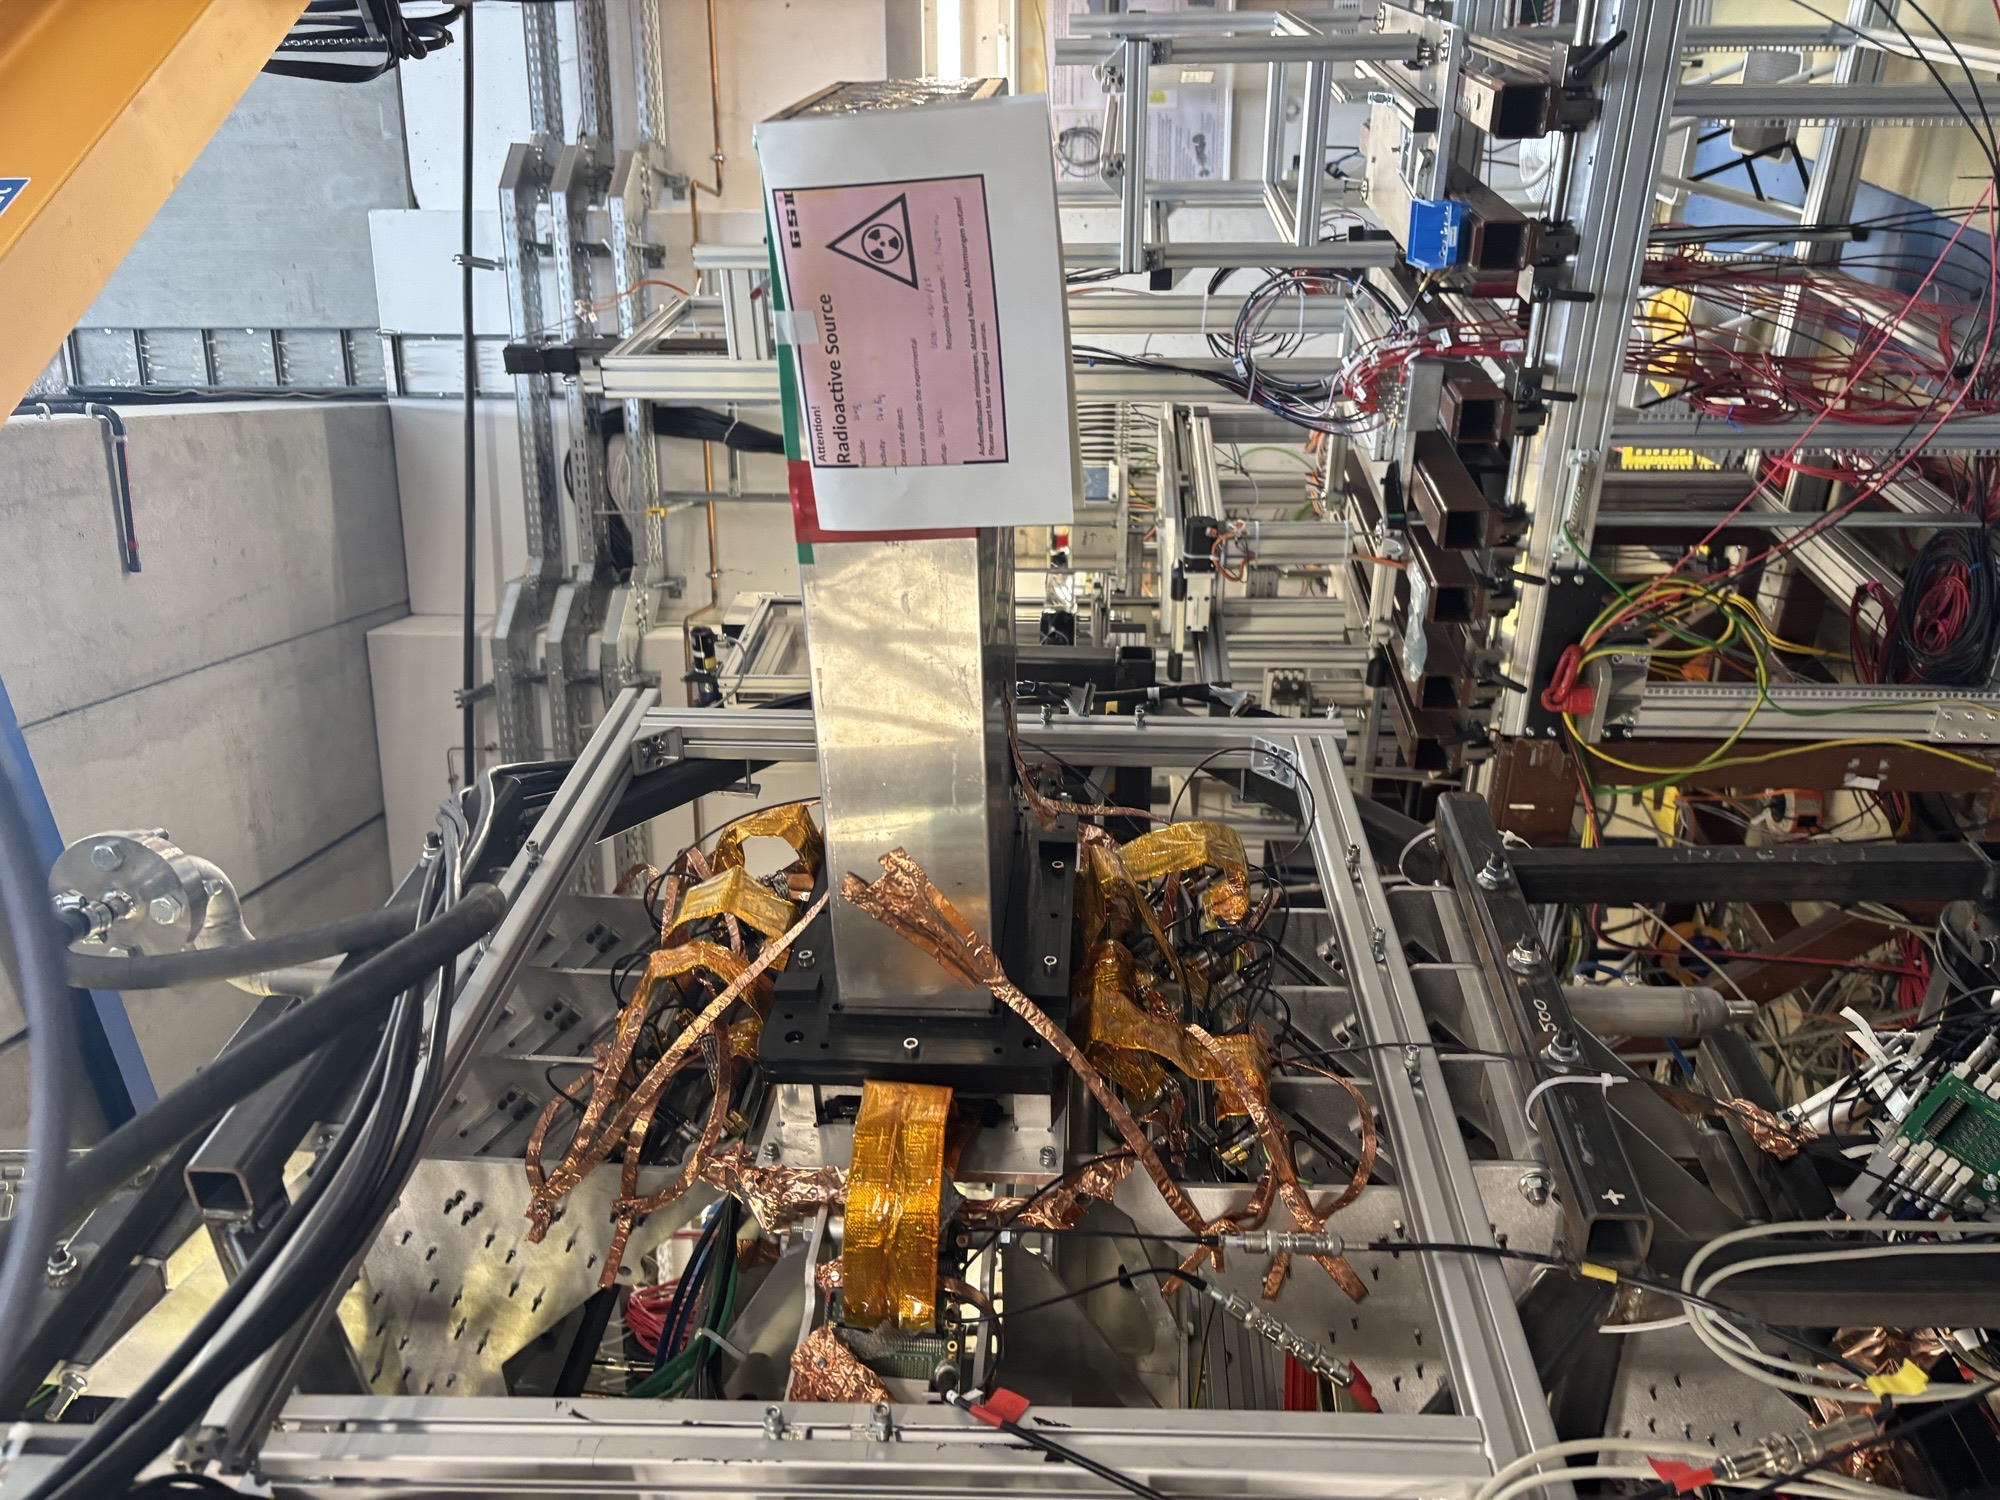
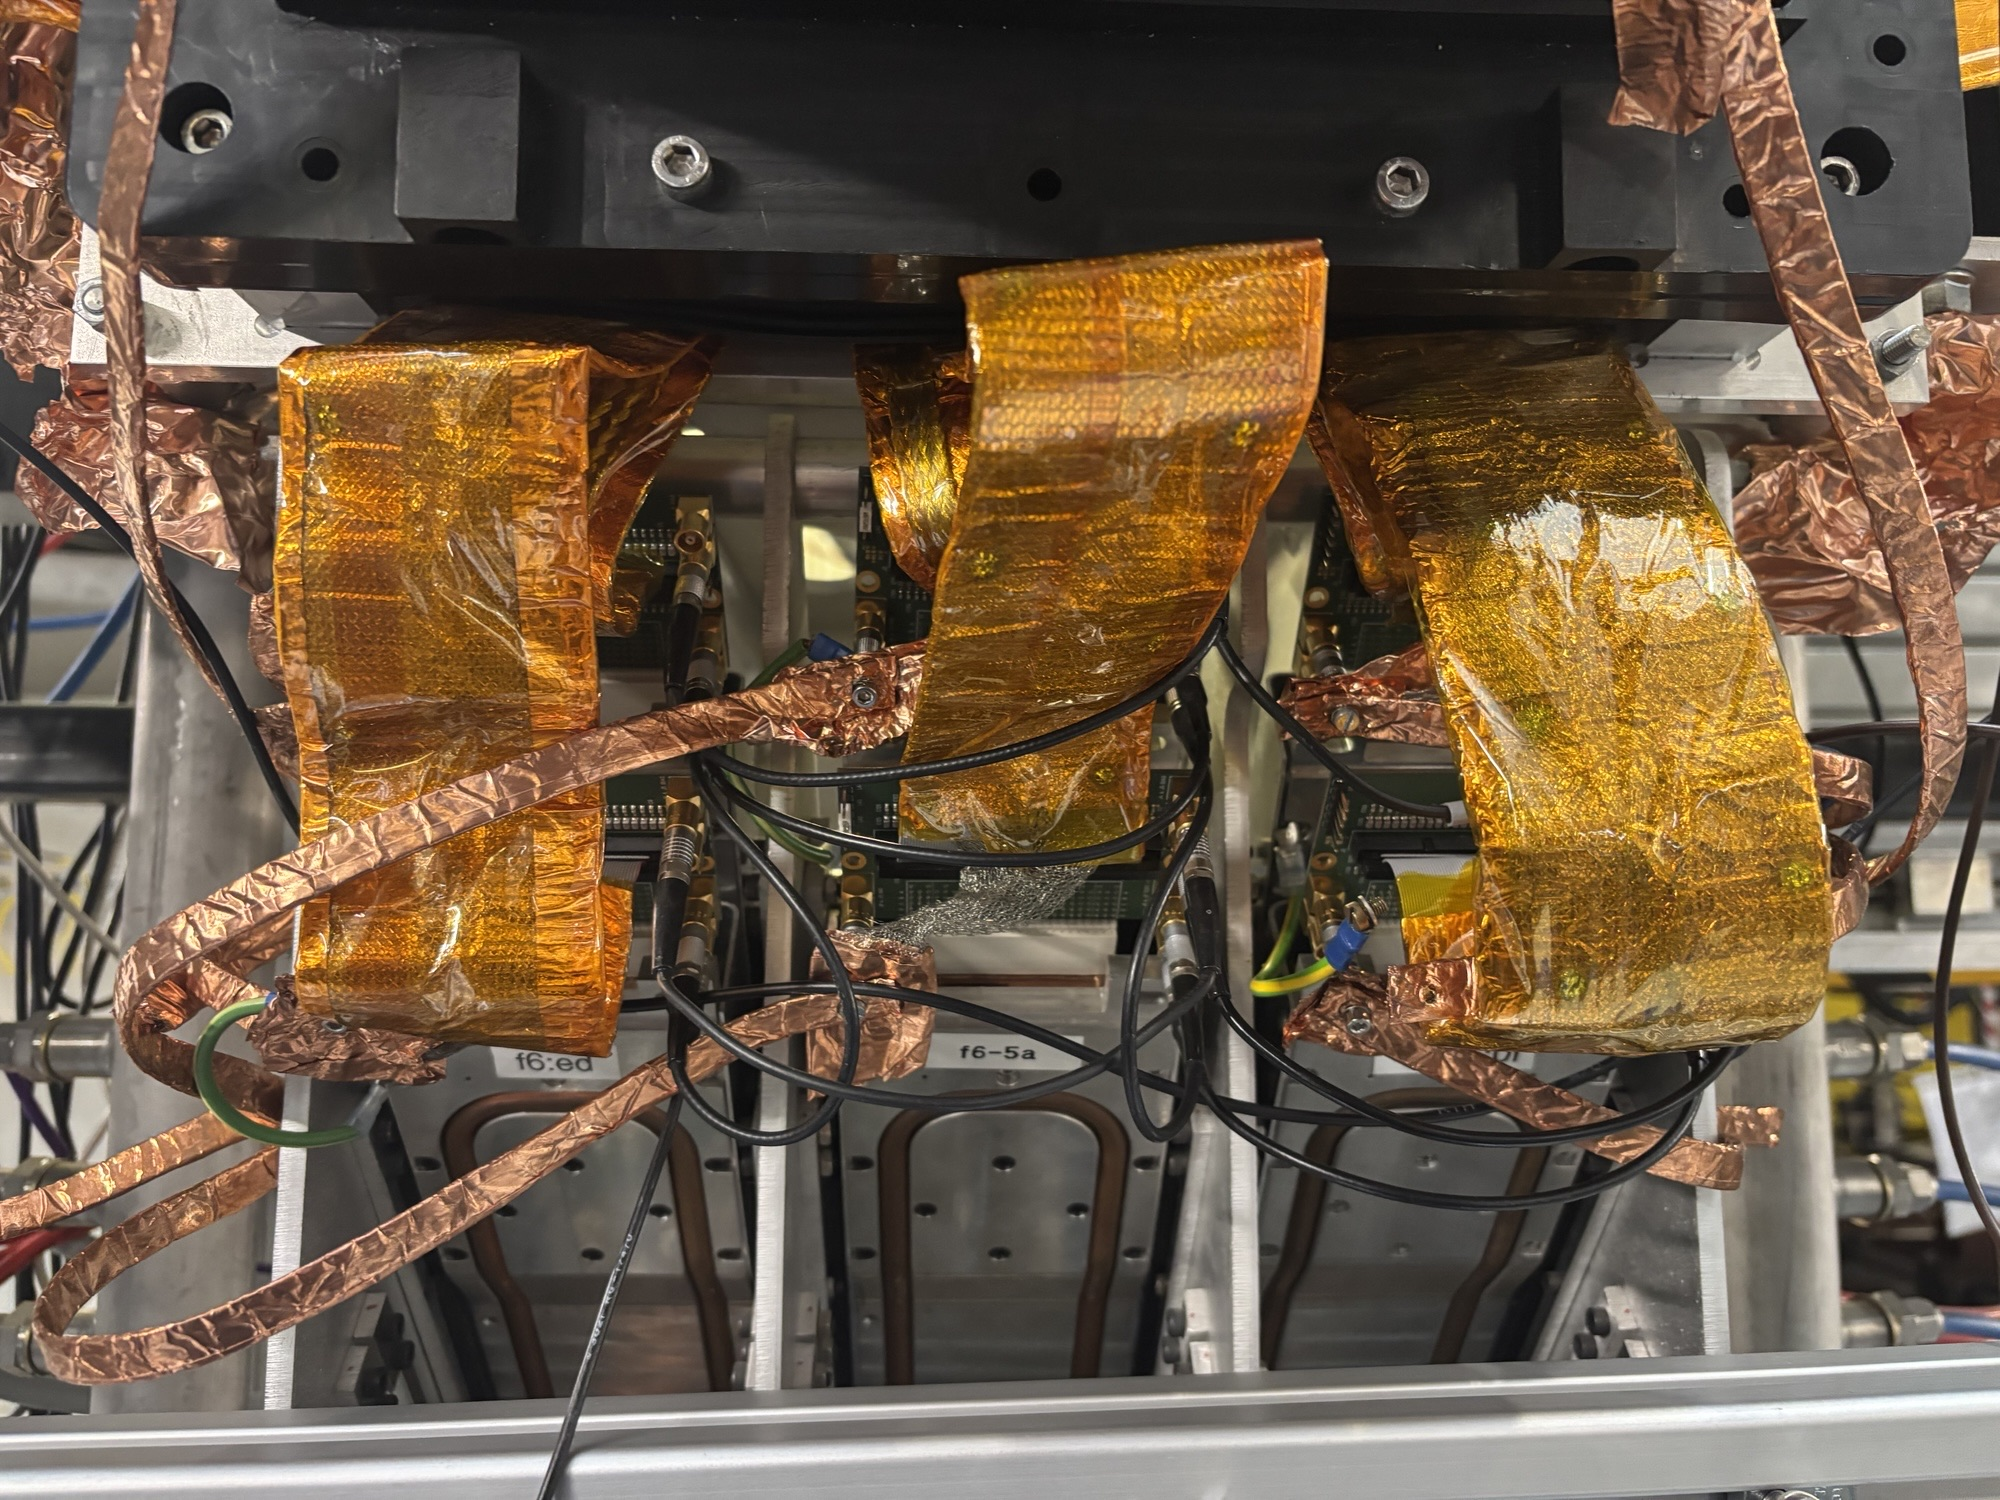
We have dismounted the AIDA stack and bPlast and realigned the cables so that they can fit into the adapters.

The plan for the next couple days is the following:

- Alignment -- done
- Remount cable -- done
- Fix position w/o bPlast mounted -- done
- Remount bracket for the last stage -- done
- Remount AIDA 1 &amp; 2 and the 207Bi source with the source holder -- done
- Mount the snout and take data -- we wait till next week Monday when the heat exchanger is active again. (ongoing)

The current setup at the end of work is that the snout is mount with a bPlast (uncabled) and 2 AIDA layers at the regular spaced position with a 207Bi source down stream, as can be seen in the previous elog. The source is ~1 cm away from the middle AIDA wafer.

Currently what is cabled:

- Signal out from the detector
- Bias daisy chain

Still to be cabled:

- HV cable
- Grounding
- Pulser

Additional info on the source position:
- the source is at ~9.6 mm distance from the downstream detector
- the source is placed at the centre of the middle wafer: 12.25 cm in x, 4.75 cm in y
- the radius of the source is ~1.5 mm
Attachment 1: IMG_5796.jpg
IMG_5796.jpg
Attachment 2: IMG_5797.jpg
IMG_5797.jpg
Attachment 3: IMG_5798.jpg
IMG_5798.jpg
  721   Thu Oct 23 12:22:31 2025 JB, GB, MP, AM, NH207Bi source threshold tests
> 
> We have dismounted the AIDA stack and bPlast and realigned the cables so that they can fit into the adapters.
> 
> The plan for the next couple days is the following:
> 
> - Alignment -- done
> - Remount cable -- done
> - Fix position w/o bPlast mounted -- done
> - Remount bracket for the last stage -- done
> - Remount AIDA 1 &amp; 2 and the 207Bi source with the source holder -- done
> - Mount the snout and take data -- we wait till next week Monday when the heat exchanger is active again. (ongoing)
> 
> The current setup at the end of work is that the snout is mount with a bPlast (uncabled) and 2 AIDA layers at the regular spaced position with a 207Bi source down stream, as can be seen in the previous elog. The source is ~1 cm away from the middle AIDA wafer.
> 
> Currently what is cabled:
> 
> - Signal out from the detector
> - Bias daisy chain
> 
> Still to be cabled:
> 
> - HV cable
> - Grounding
> - Pulser
> 
> Additional info on the source position:
> - the source is at ~9.6 mm distance from the downstream detector
> - the source is placed at the centre of the middle wafer: 12.25 cm in x, 4.75 cm in y
> - the radius of the source is ~1.5 mm

The Messhuette has been cleaned and equipment has been rearranged. If there are any broken or missing components be sure to follow up with the FRS group (as I believe they have been cleaning here).

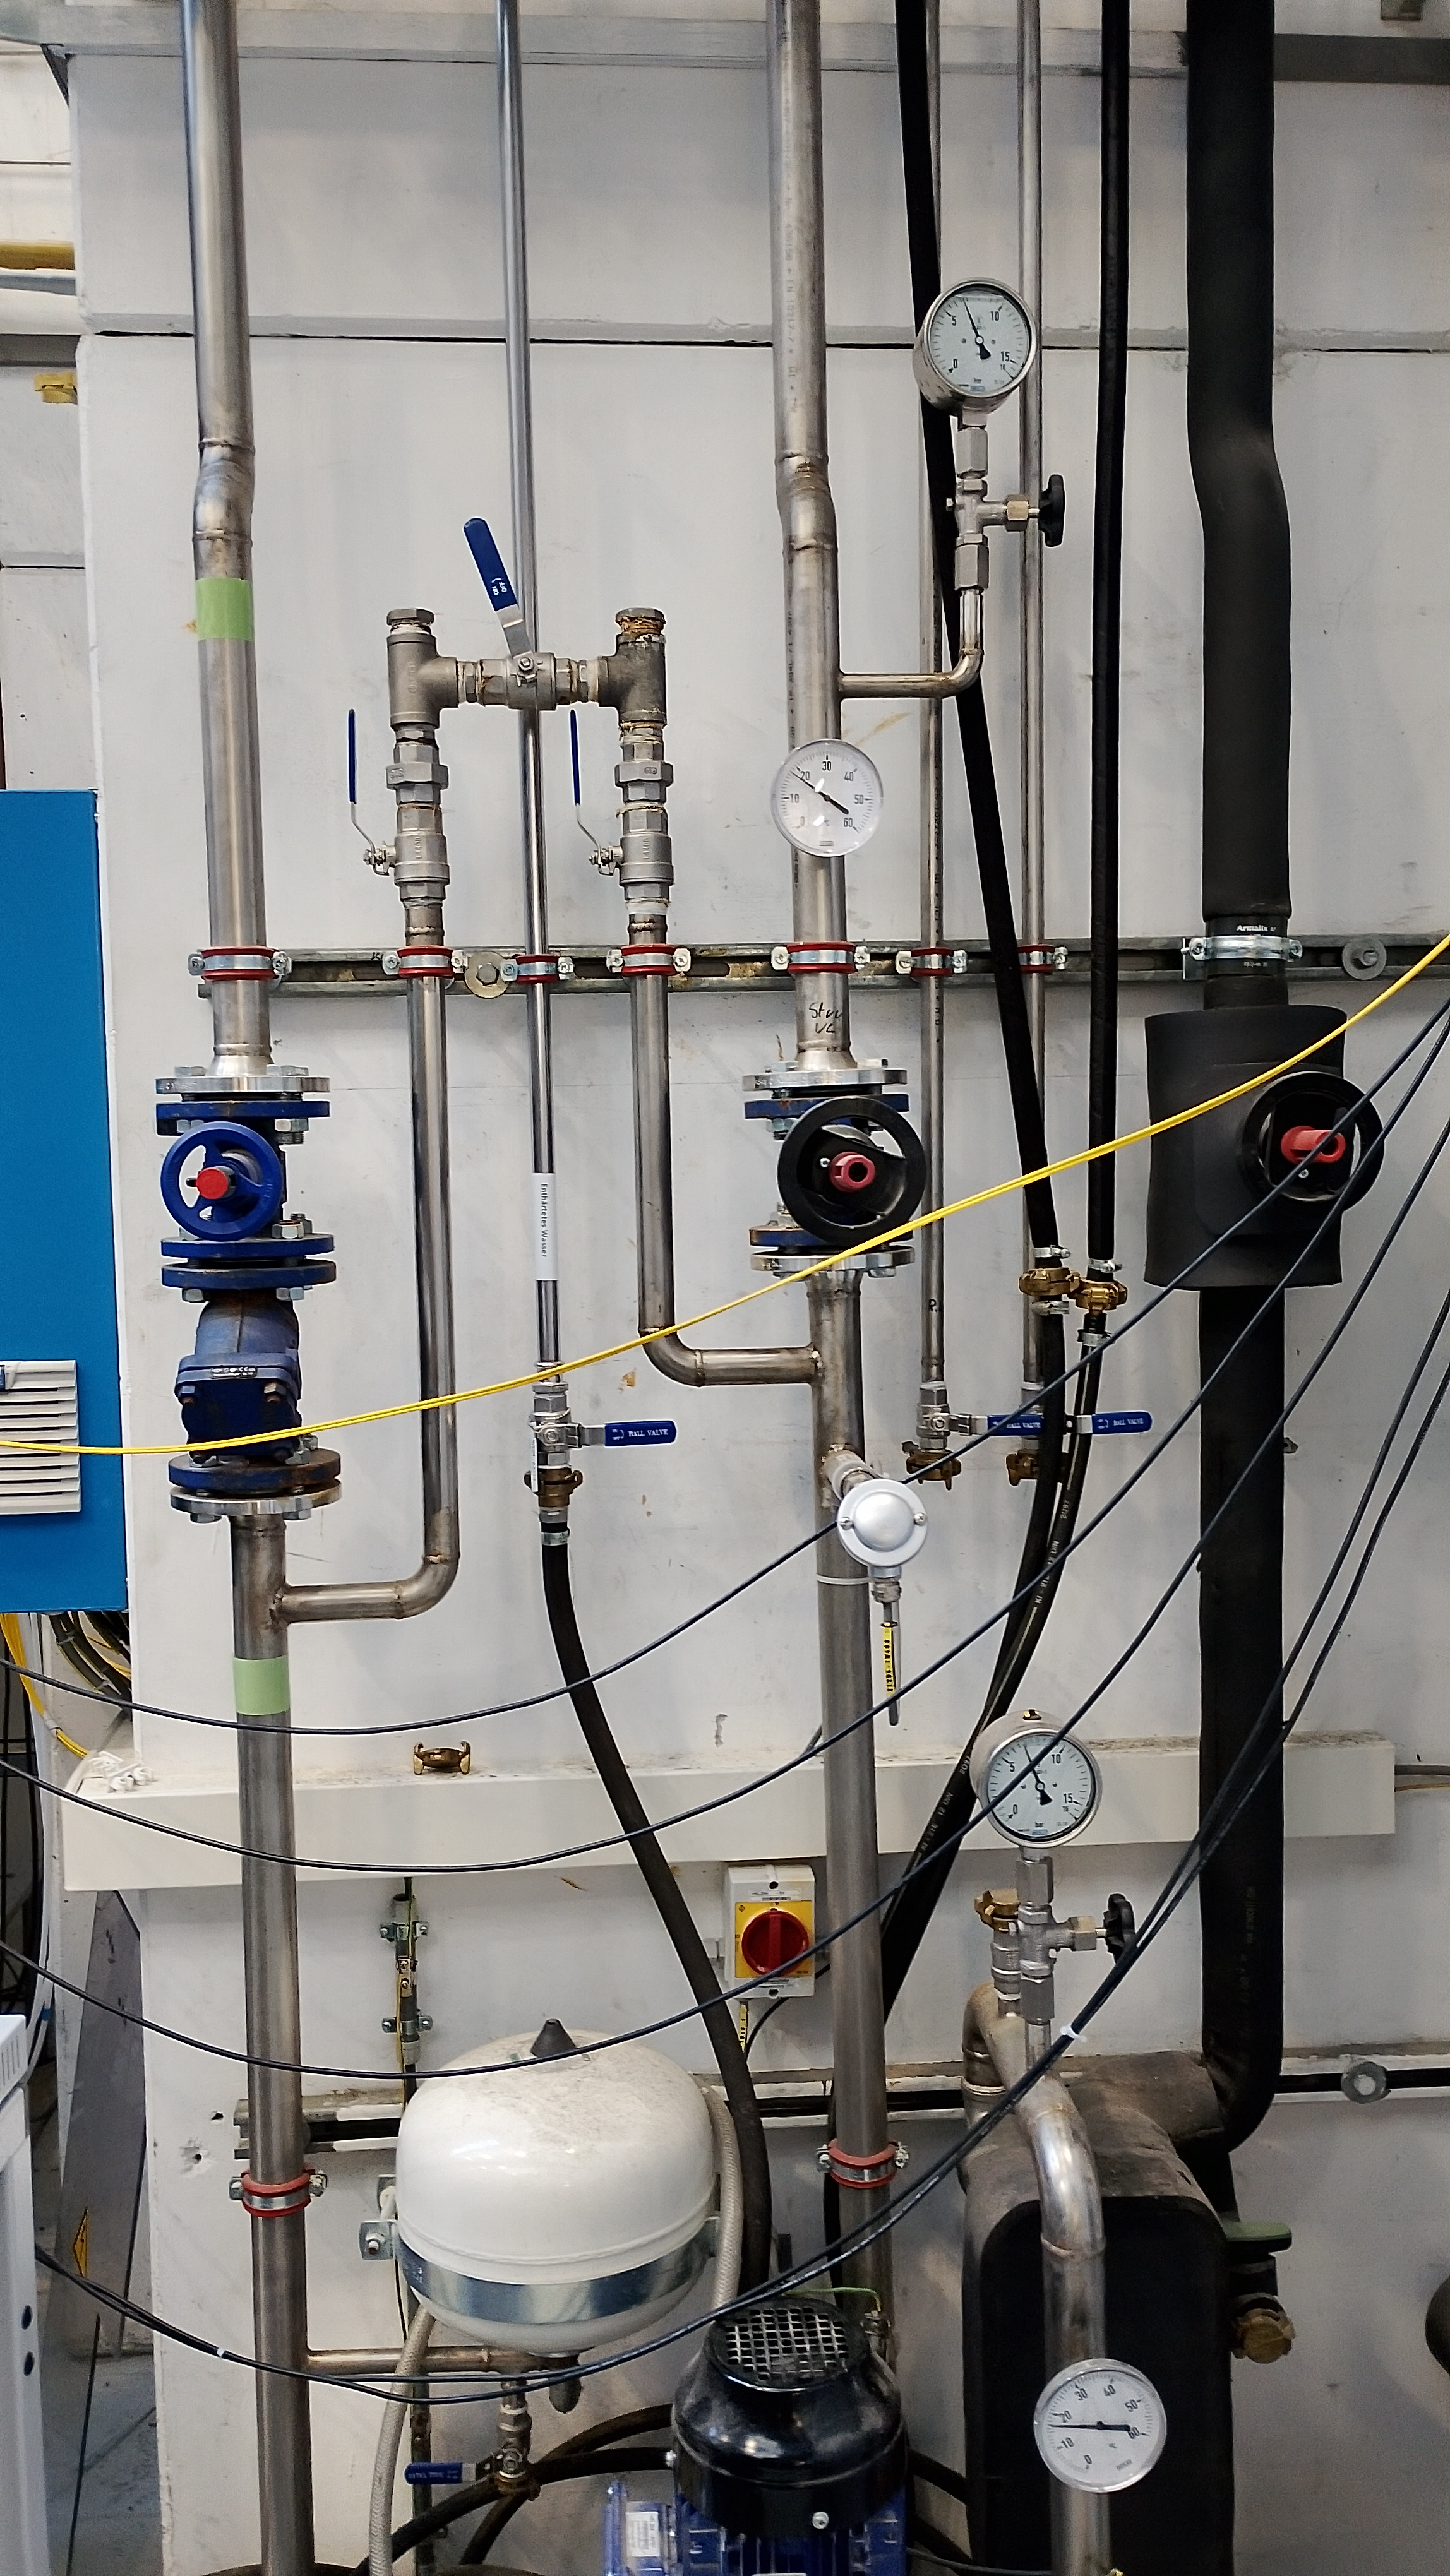
We are resuming the work on the source measurements as the cooling water is back. Some of the valves still look closed so we are investigating if the water is flowing to the setup.

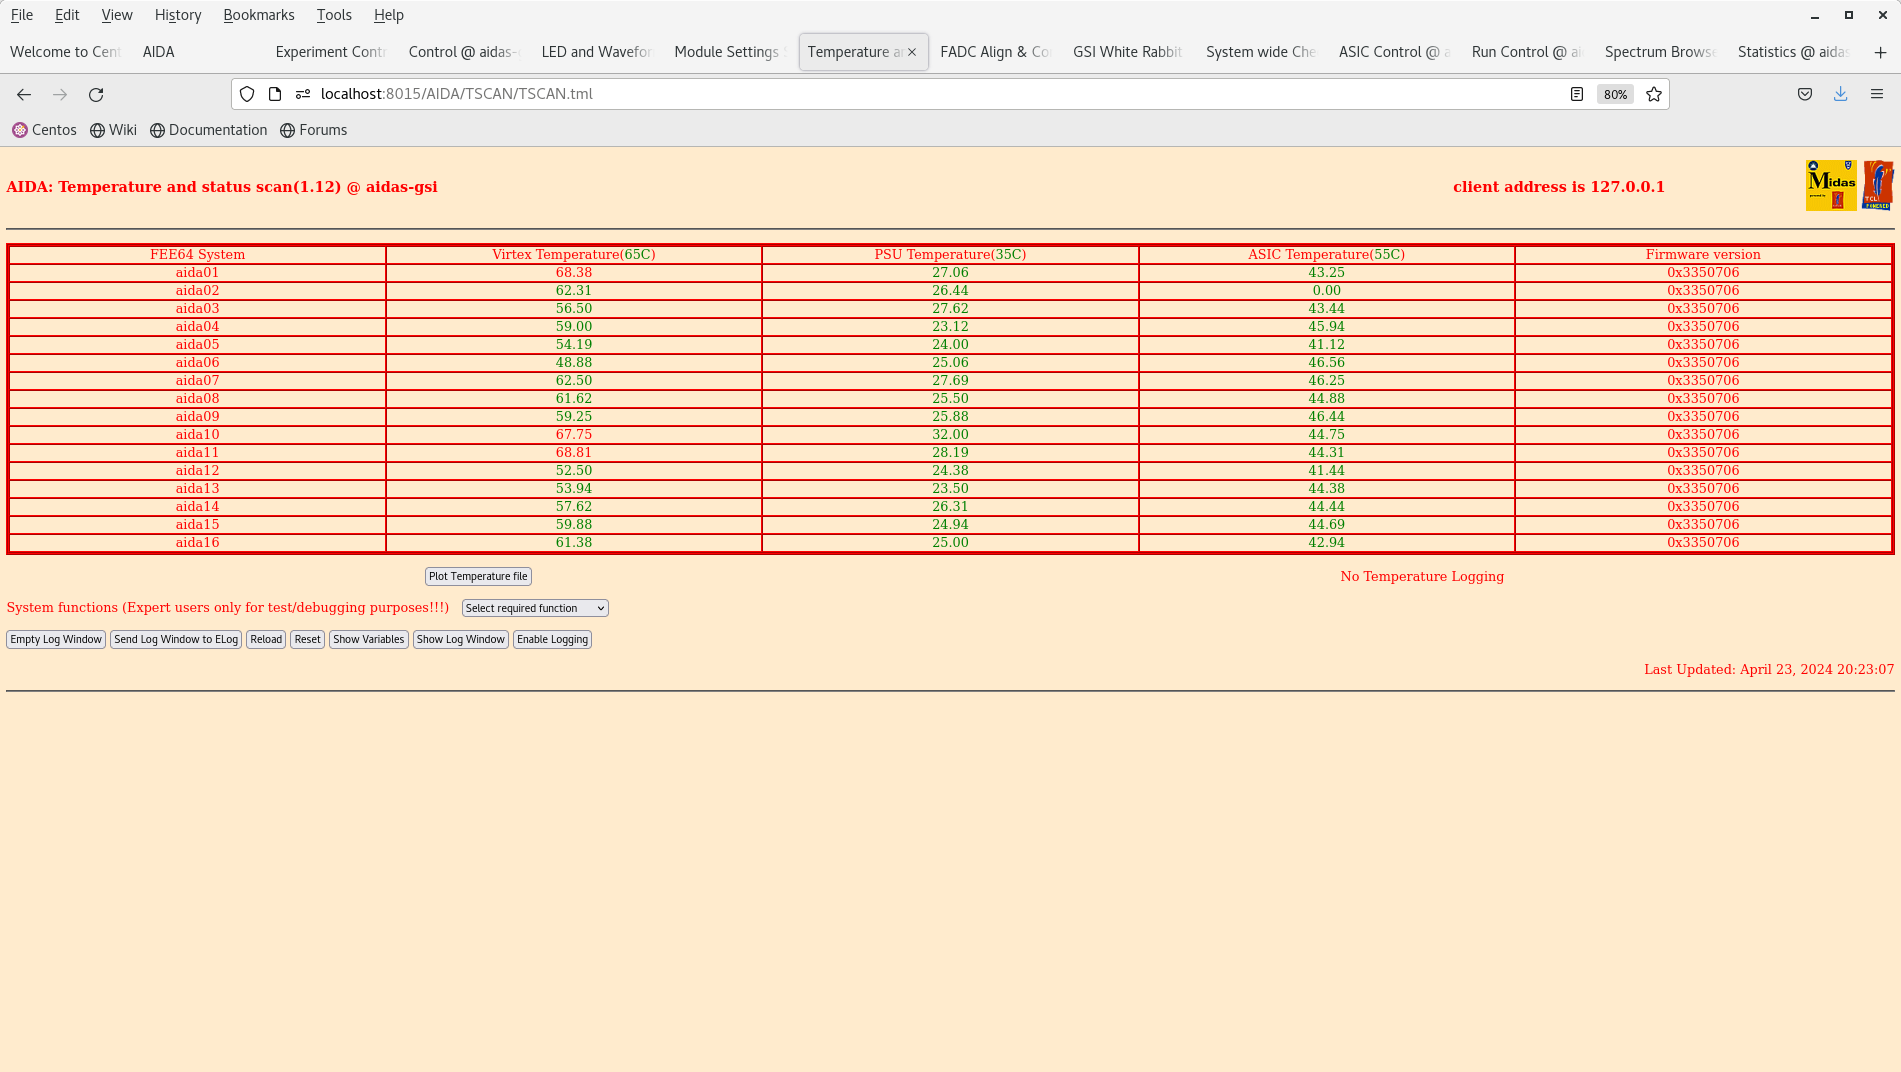
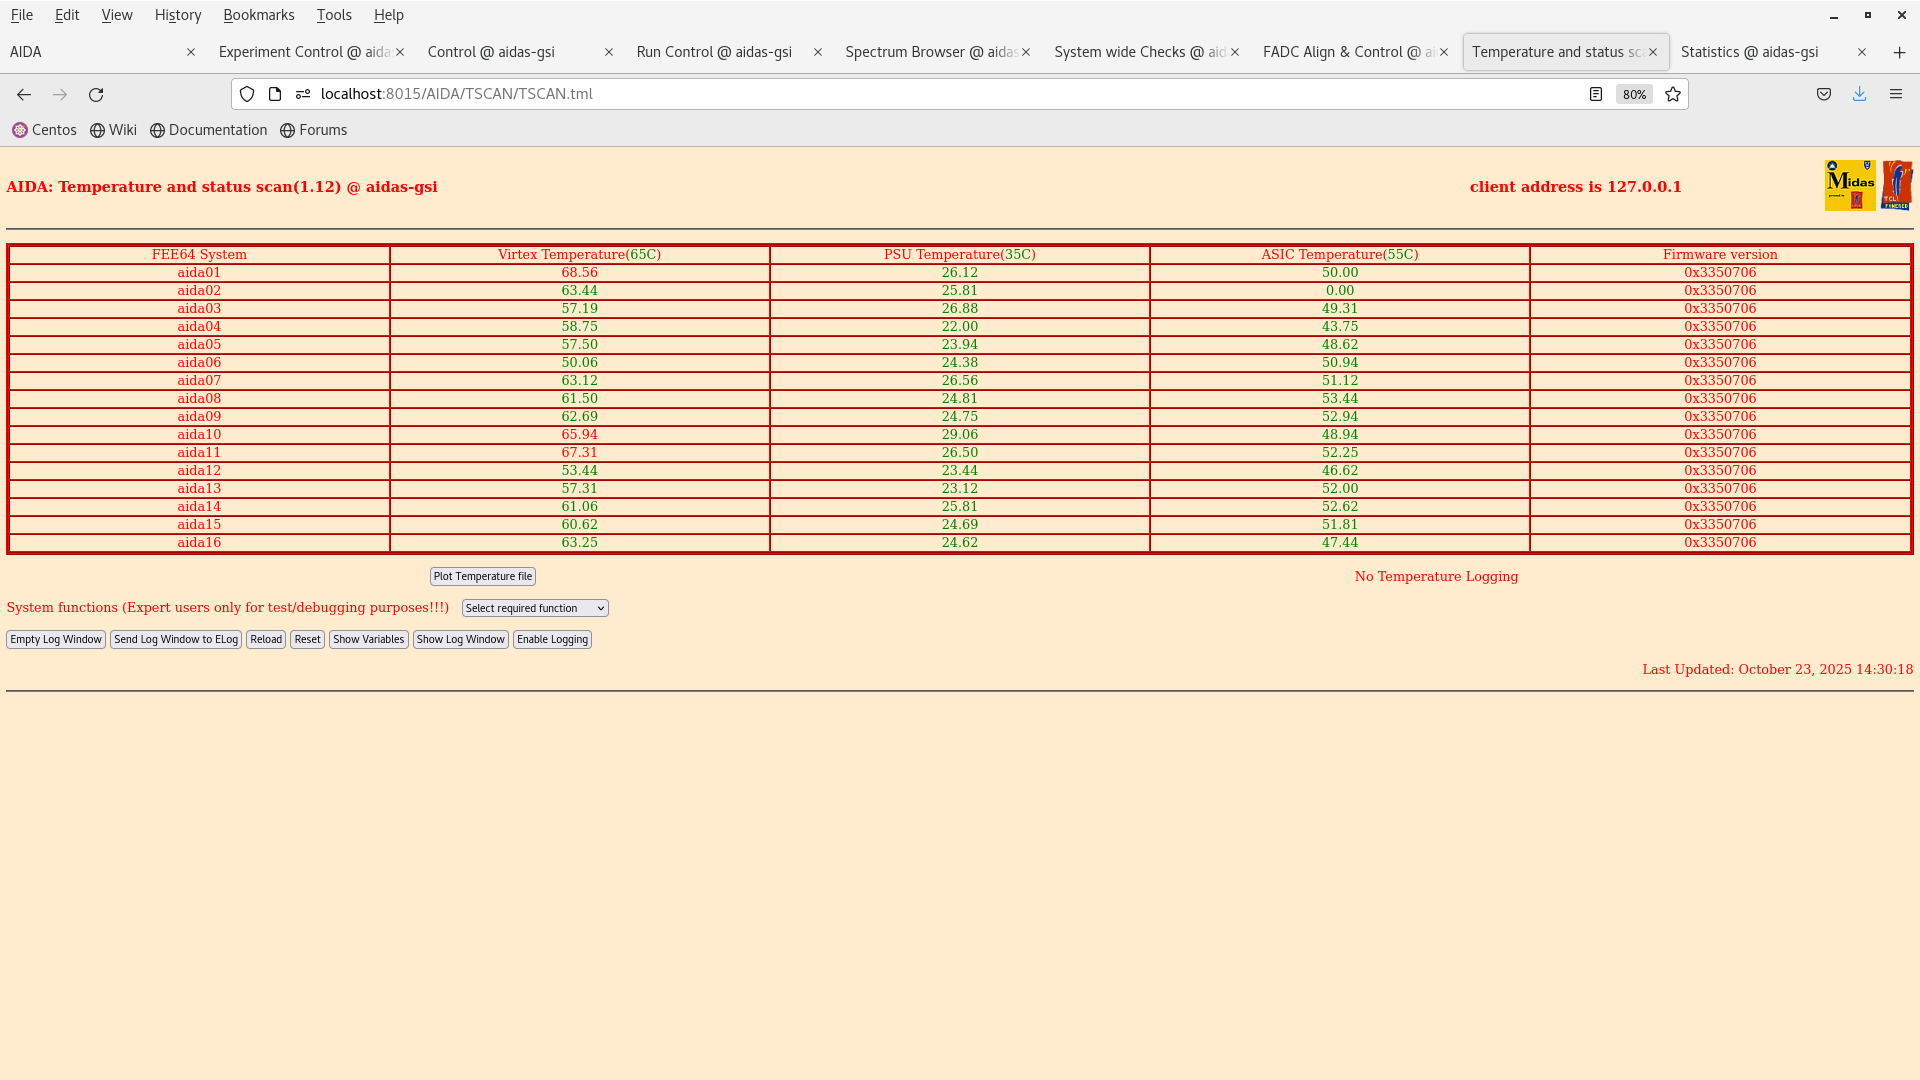
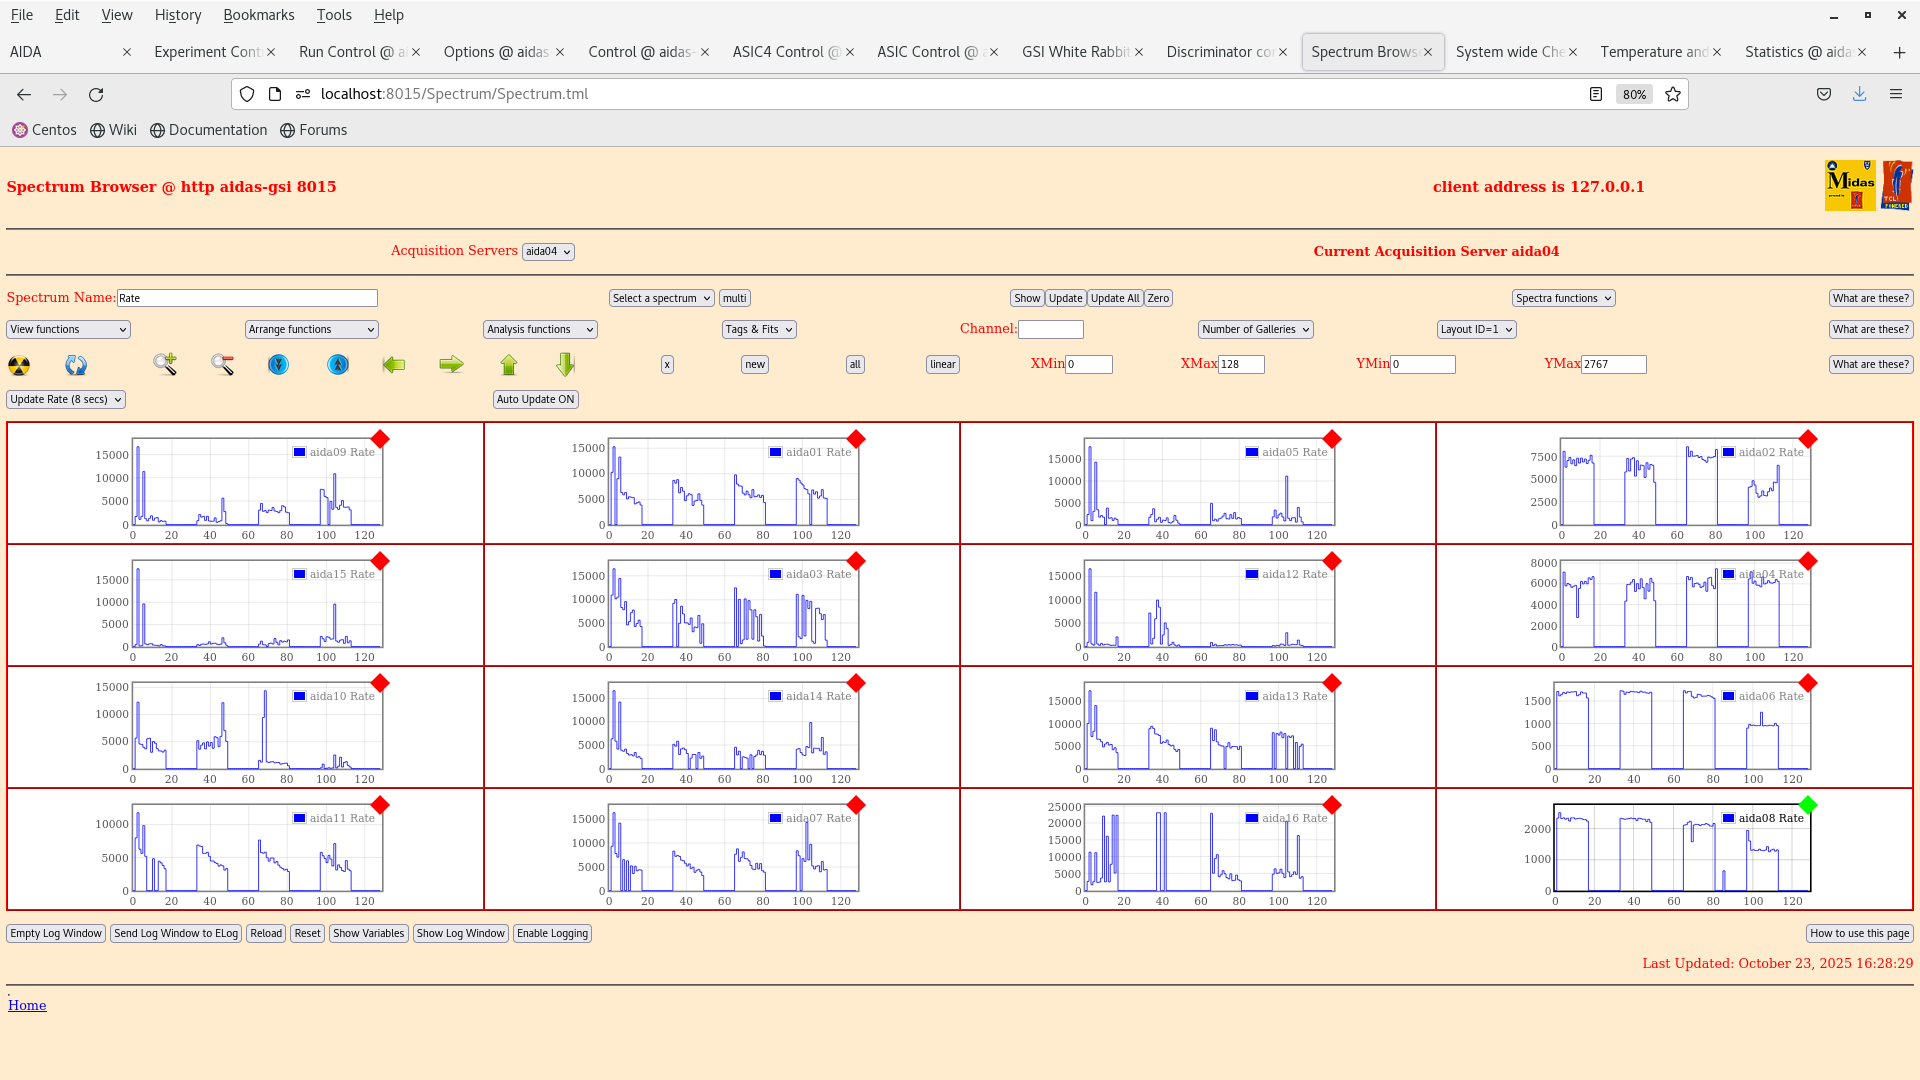
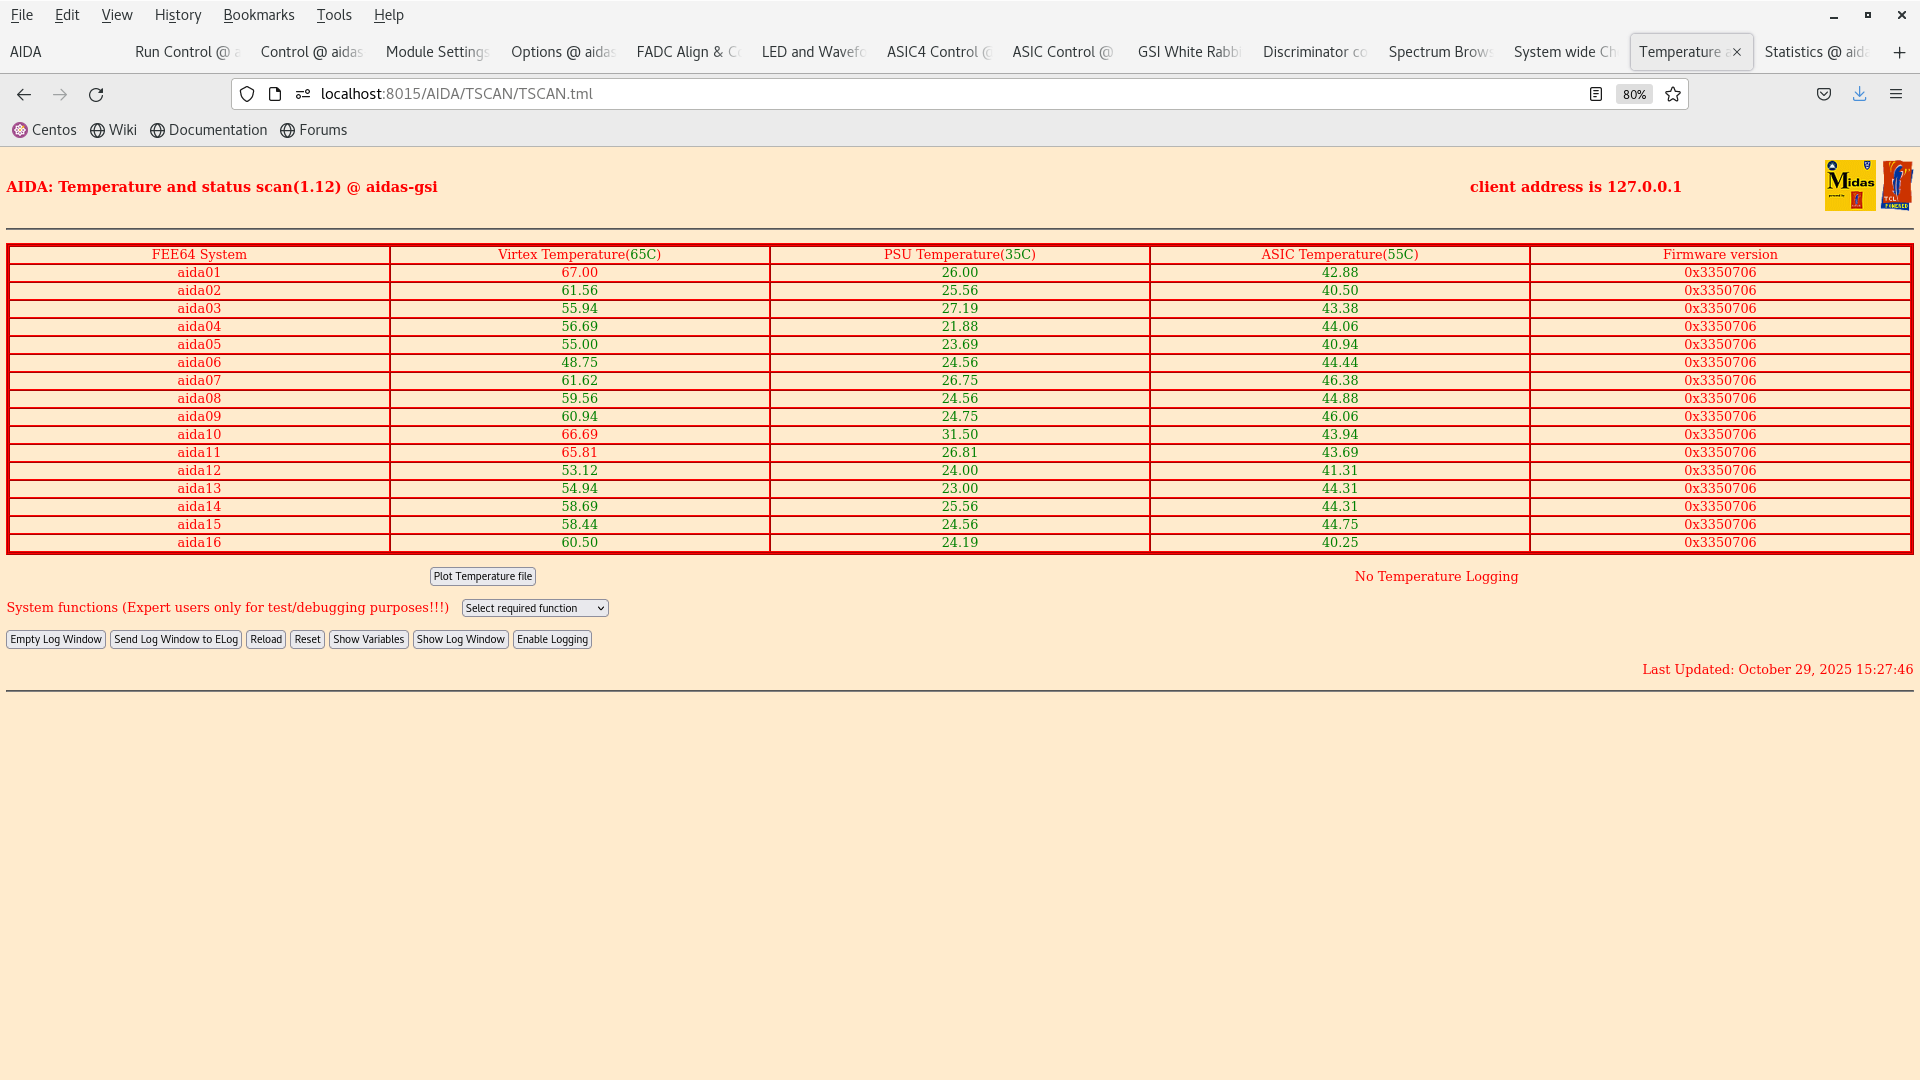
14:31 Temperature on start up OK - attachment 2.

15:41 We reset the ASIC control registers to a setup used in Feb 2024 (2025Feb24-17.14.52) to match the full AIDA setup (it was using BB7 initially in aida10).

The old bias scheme is obsolete and the bias is now done via the Ohmic side.

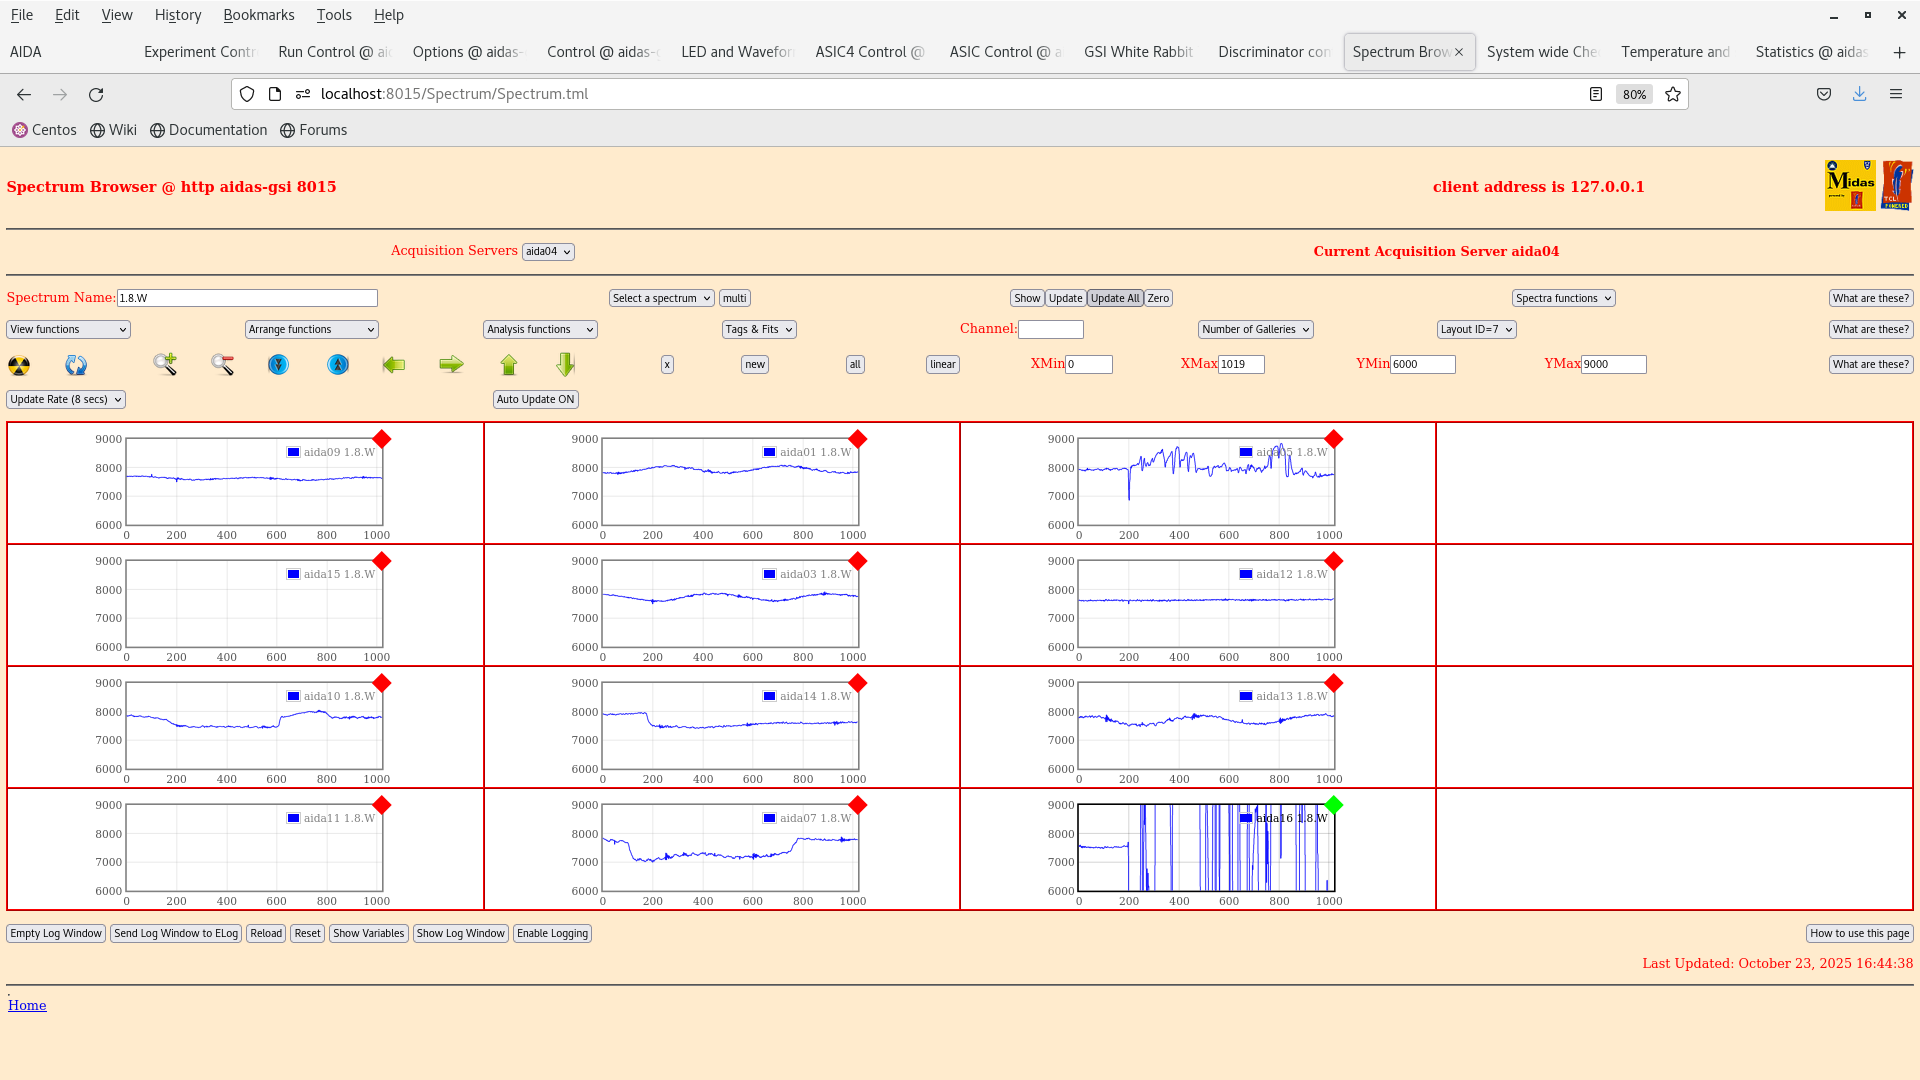
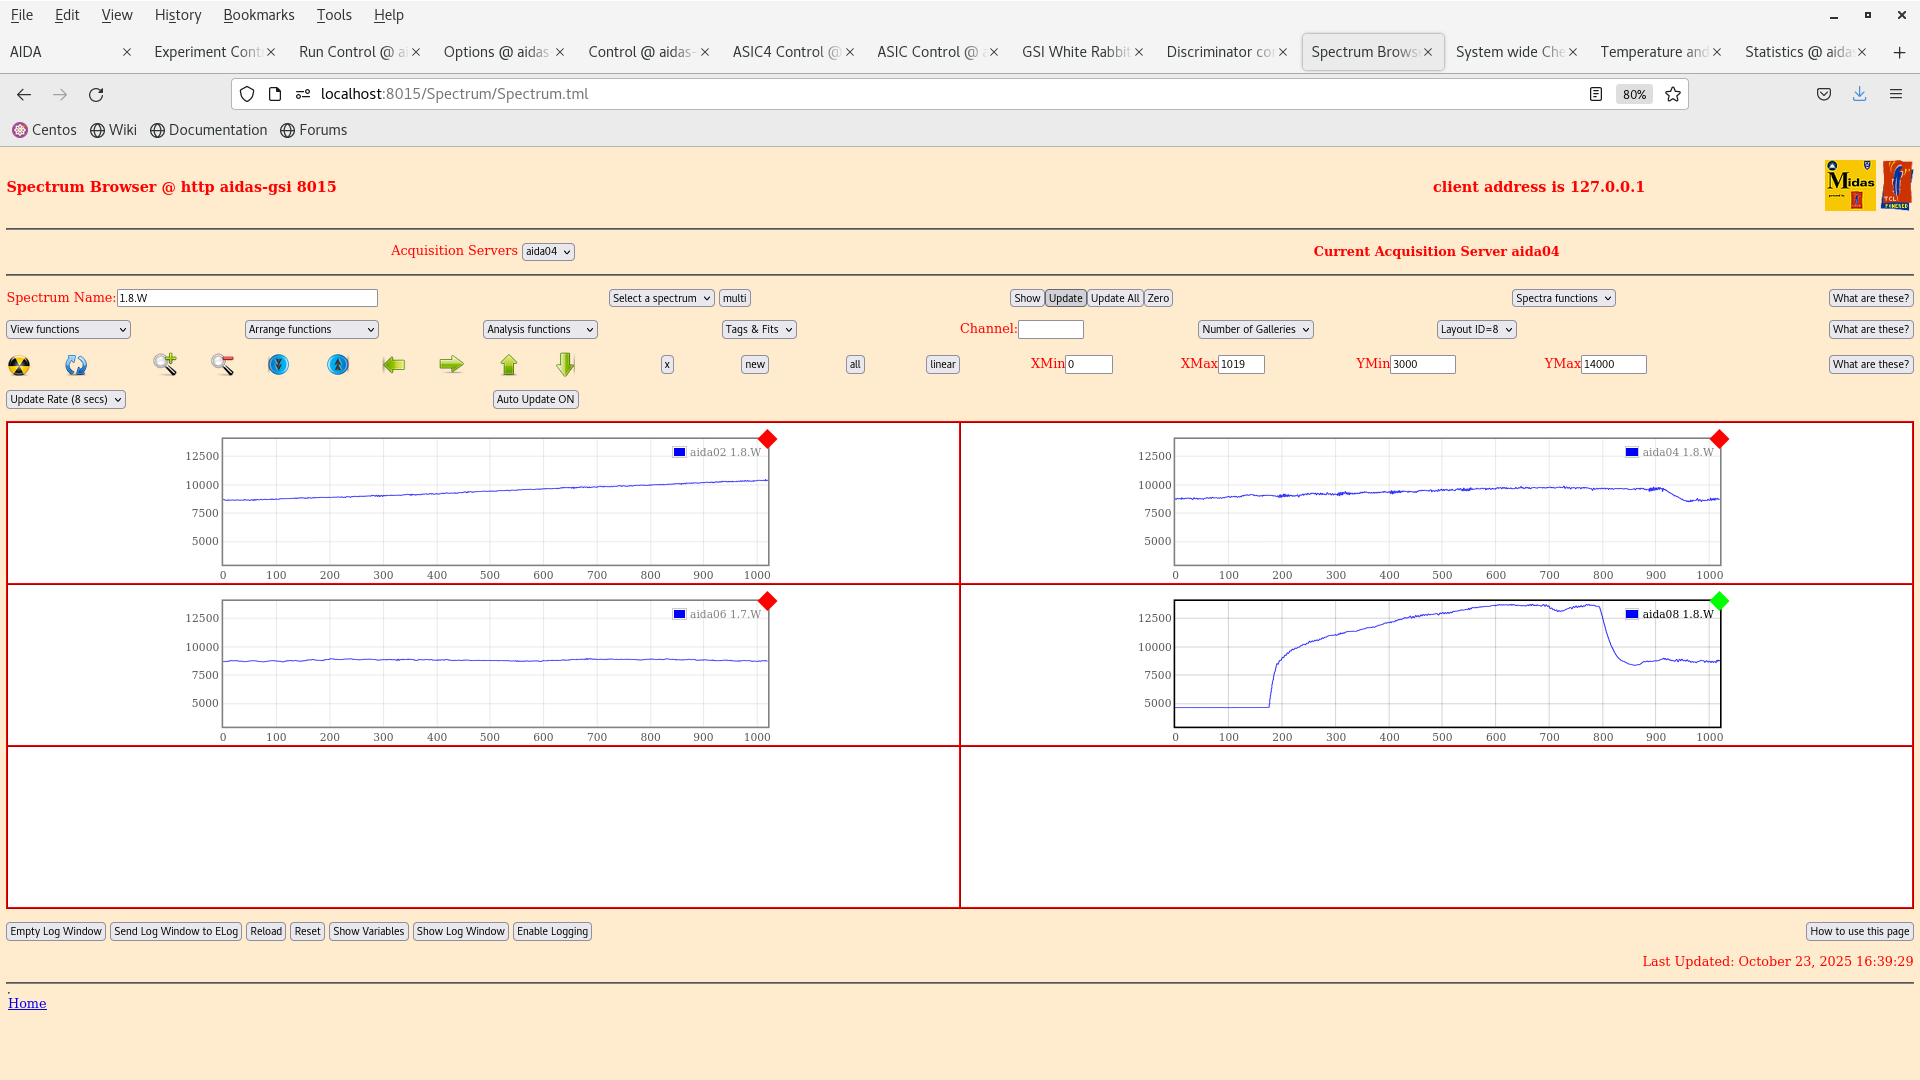
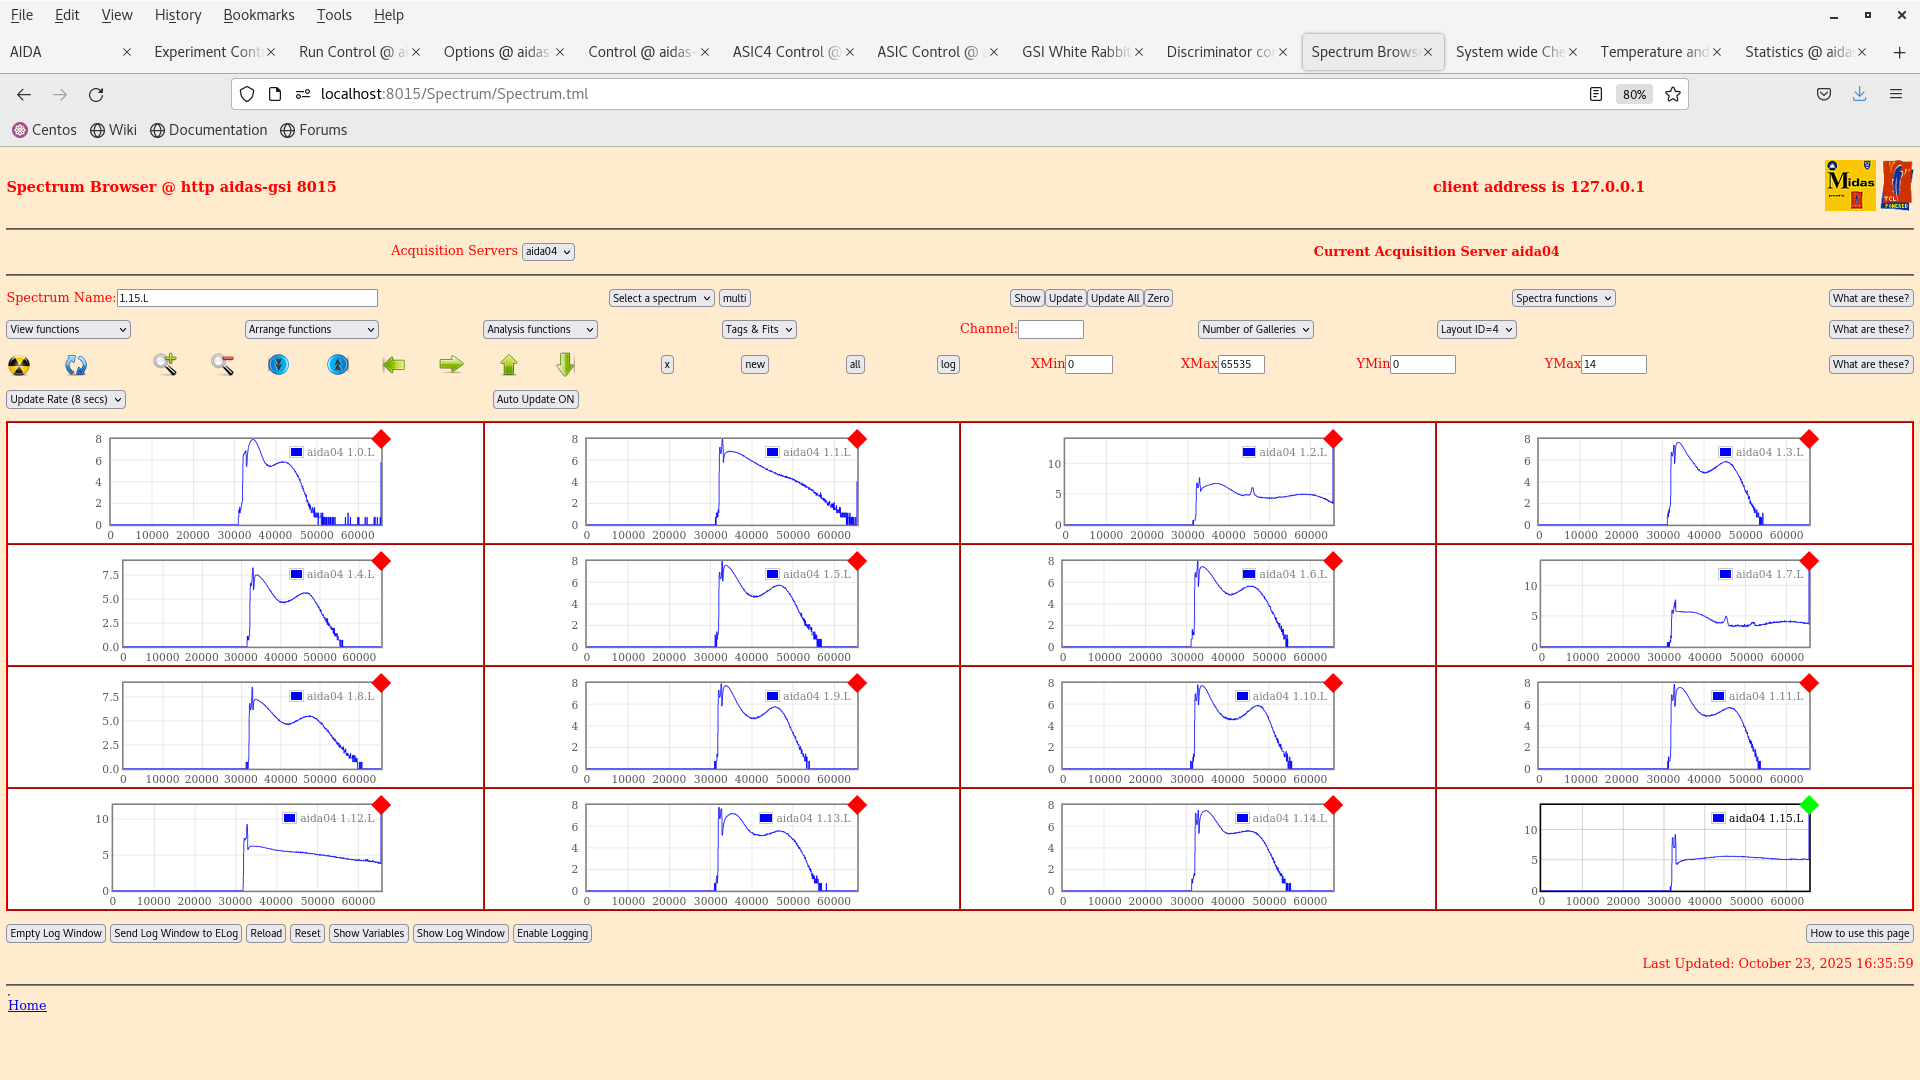
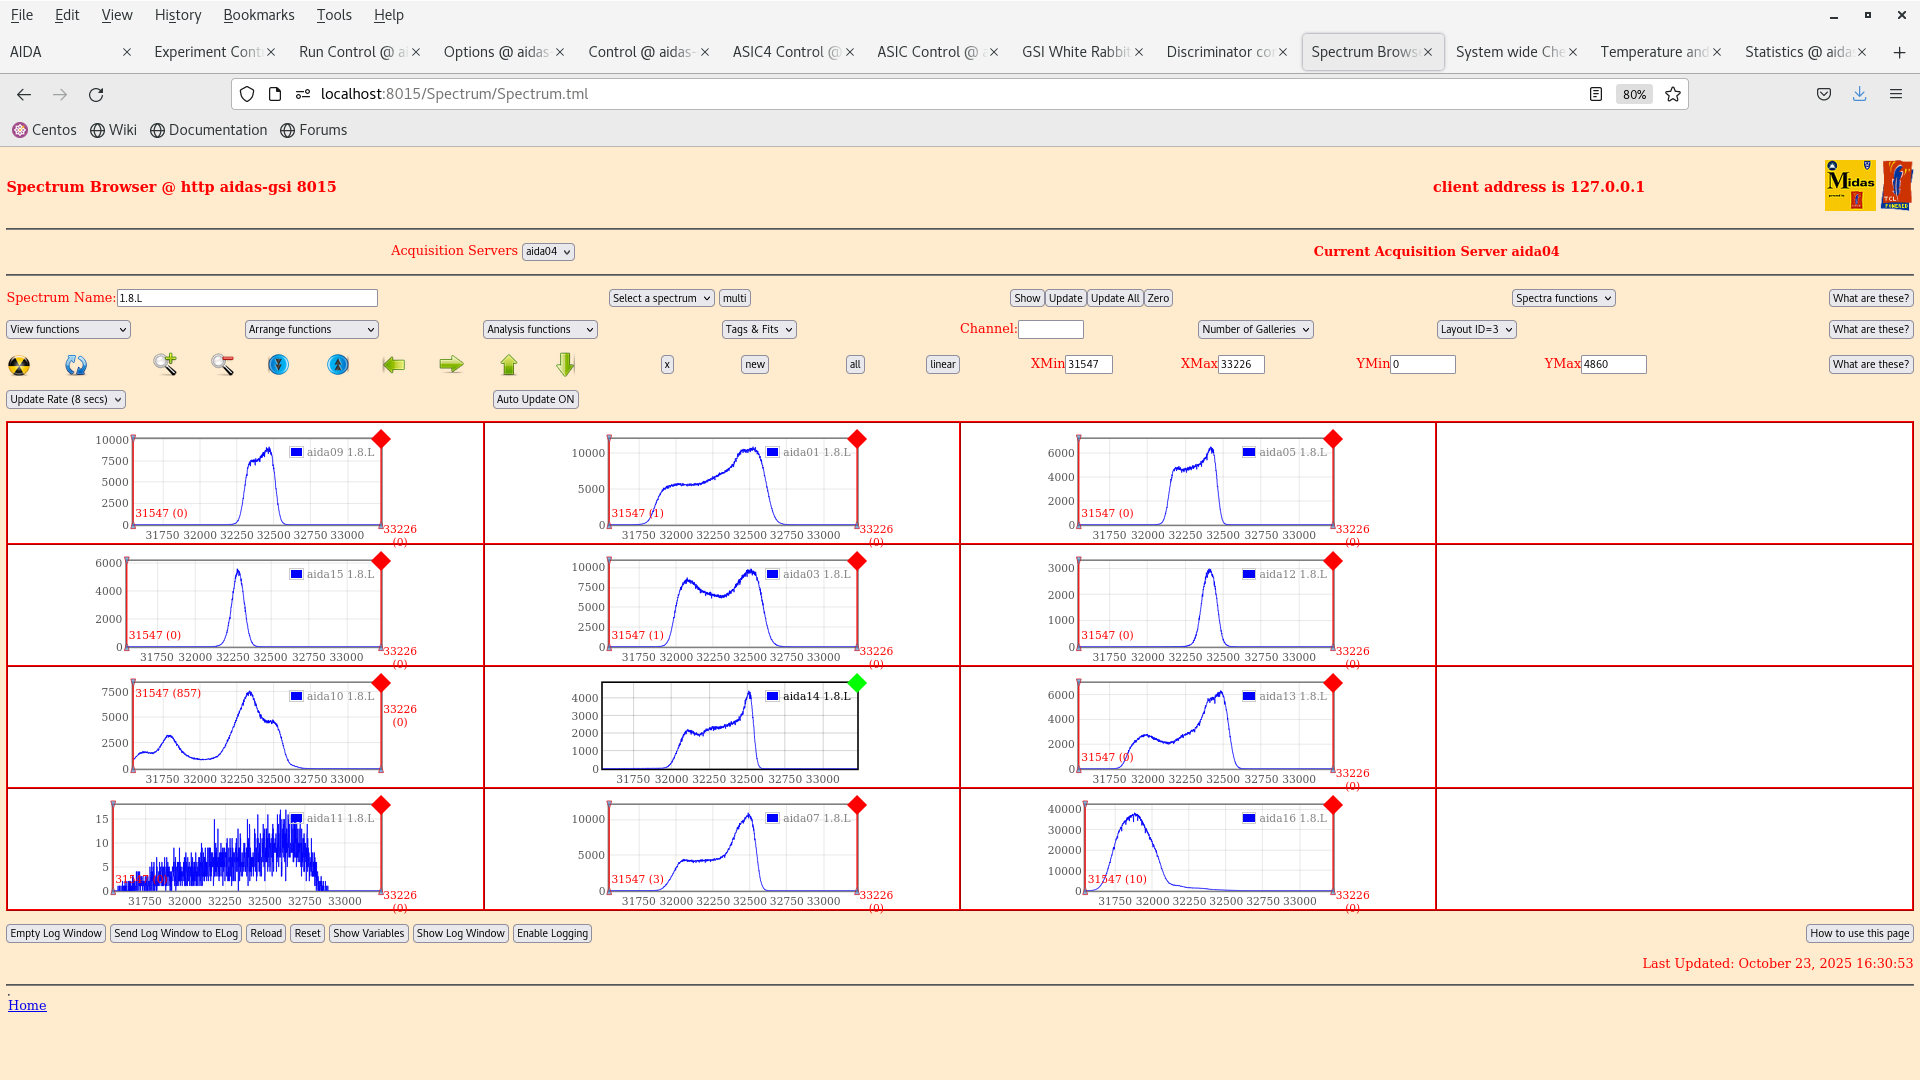
16:47 We have look at some initial spectra with the 207Bi 3-8 shows the ADC channels and waveforms of the n+n and p+n sides. Bias and grounding developed by Nabiel have been done.

We are going to wait for the system to stabilise over night so that we start taking data tomorrow. Then we can analyse the results and see what we get :) Some channels are clearly broken which can be seen in the waveforms eg. aida16.
Attachment 1: IMG_20251023_132958.jpg
IMG_20251023_132958.jpg
Attachment 2: Screenshot_from_2025-10-23_14-30-28.png
Screenshot_from_2025-10-23_14-30-28.png
Attachment 3: Screenshot_from_2025-10-23_16-44-41.png
Screenshot_from_2025-10-23_16-44-41.png
Attachment 4: Screenshot_from_2025-10-23_16-39-32.png
Screenshot_from_2025-10-23_16-39-32.png
Attachment 5: Screenshot_from_2025-10-23_16-36-03.png
Screenshot_from_2025-10-23_16-36-03.png
Attachment 6: Screenshot_from_2025-10-23_16-31-33.png
Screenshot_from_2025-10-23_16-31-33.png
Attachment 7: Screenshot_from_2025-10-23_16-29-28.png
Screenshot_from_2025-10-23_16-29-28.png
Attachment 8: Screenshot_from_2025-10-23_16-29-15.png
Screenshot_from_2025-10-23_16-29-15.png
  723   Fri Oct 24 10:31:59 2025 JB, GB, MP, AM, NH207Bi source threshold tests
> > 
> > We have dismounted the AIDA stack and bPlast and realigned the cables so that they can fit into the adapters.
> > 
> > The plan for the next couple days is the following:
> > 
> > - Alignment -- done
> > - Remount cable -- done
> > - Fix position w/o bPlast mounted -- done
> > - Remount bracket for the last stage -- done
> > - Remount AIDA 1 &amp; 2 and the 207Bi source with the source holder -- done
> > - Mount the snout and take data -- we wait till next week Monday when the heat exchanger is active again. (ongoing)
> > 
> > The current setup at the end of work is that the snout is mount with a bPlast (uncabled) and 2 AIDA layers at the regular spaced position with a 207Bi source down stream, as can be seen in the previous elog. The source is ~1 cm away from the middle AIDA wafer.
> > 
> > Currently what is cabled:
> > 
> > - Signal out from the detector
> > - Bias daisy chain
> > 
> > Still to be cabled:
> > 
> > - HV cable
> > - Grounding
> > - Pulser
> > 
> > Additional info on the source position:
> > - the source is at ~9.6 mm distance from the downstream detector
> > - the source is placed at the centre of the middle wafer: 12.25 cm in x, 4.75 cm in y
> > - the radius of the source is ~1.5 mm
> 
> The Messhuette has been cleaned and equipment has been rearranged. If there are any broken or missing components be sure to follow up with the FRS group (as I believe they have been cleaning here).
> 
> We are resuming the work on the source measurements as the cooling water is back. Some of the valves still look closed so we are investigating if the water is flowing to the setup.
> 
> 14:31 Temperature on start up OK - attachment 2.
> 
> 15:41 We reset the ASIC control registers to a setup used in Feb 2024 (2025Feb24-17.14.52) to match the full AIDA setup (it was using BB7 initially in aida10).
> 
> The old bias scheme is obsolete and the bias is now done via the Ohmic side.
> 
> 16:47 We have look at some initial spectra with the 207Bi 3-8 shows the ADC channels and waveforms of the n+n and p+n sides. Bias and grounding developed by Nabiel have been done.
> 
> We are going to wait for the system to stabilise over night so that we start taking data tomorrow. Then we can analyse the results and see what we get :) Some channels are clearly broken which can be seen in the waveforms eg. aida16.

11:31 The detector was turned off last night to put it into a safe state. We return to make some comparison of the noise w.r.t the tests performed by Nabil and co. 

email snippet:

"
I would suggest that you first quantify current noise performance (slow comparators -> 0x64 to reduce rate, measure pulser peak width) for each FEE64 (use layouts 3 and 4) and compare to Nabil's most recent test results. Looking at last night's 1.8.W spectra I would assume that they would be significantly worse but best to check.

I would then suggest you carefully check

    Grounding configuration (both internal and external to the snout) used Nabil's most recent tests has actually been re-established
    Grounding of the bPlas cabling
"

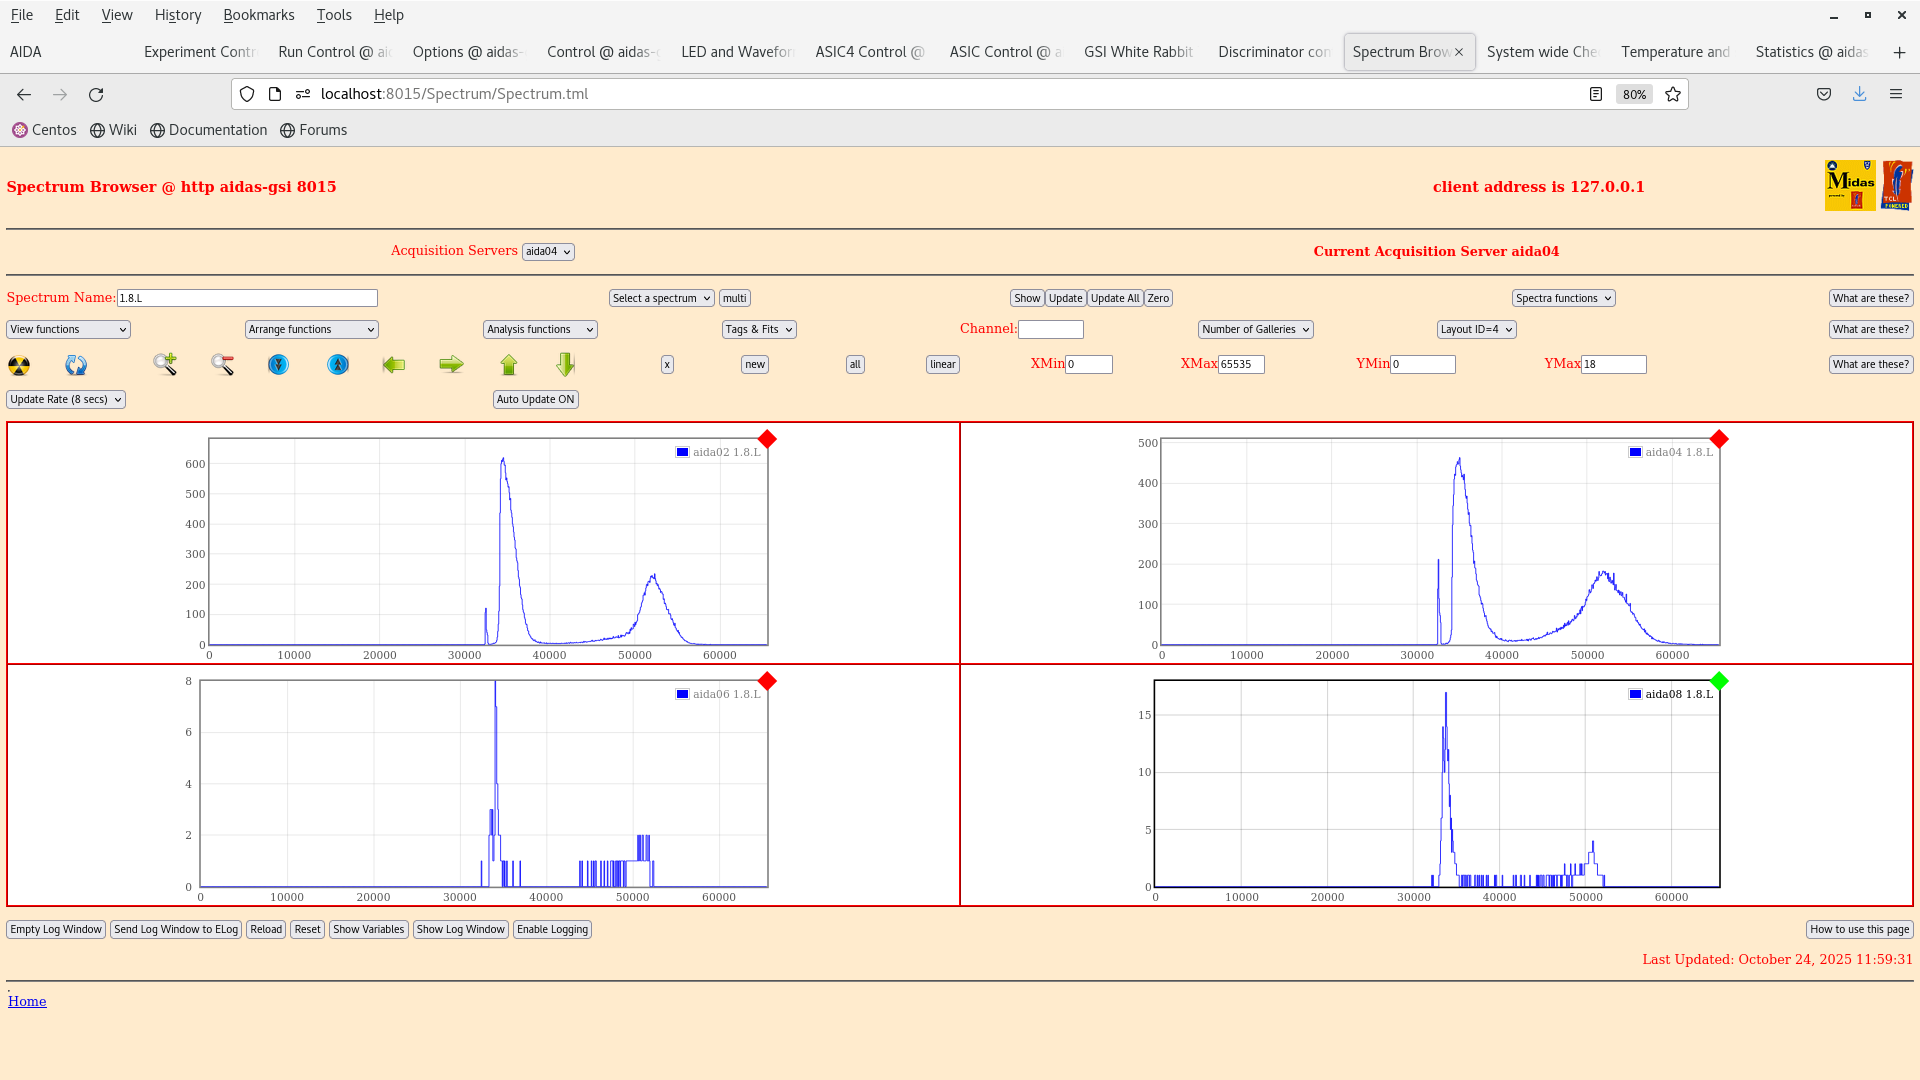
We are going to restart the DAQ and set the LEC thresholds to 0x64 and compare the peak FWHM with a pulser.

11:50 We started up the DAQ temps and bias look OK.

12:00 We set the thresholds on each ASIC in the slow comparator LEC to 0x64. This should correspond to a high threshold. For some reason the y-strips are still noisy (wrong polarity in the register ?)
Attachment 1: Screenshot_from_2025-10-24_11-56-06.png
Screenshot_from_2025-10-24_11-56-06.png
Attachment 2: Screenshot_from_2025-10-24_12-00-30.png
Screenshot_from_2025-10-24_12-00-30.png
Attachment 3: Screenshot_from_2025-10-24_11-59-35.png
Screenshot_from_2025-10-24_11-59-35.png
Attachment 4: Screenshot_from_2025-10-24_11-55-02.png
Screenshot_from_2025-10-24_11-55-02.png
Attachment 5: Screenshot_from_2025-10-24_11-54-09.png
Screenshot_from_2025-10-24_11-54-09.png
Attachment 6: Screenshot_from_2025-10-24_11-53-59.png
Screenshot_from_2025-10-24_11-53-59.png
  724   Fri Oct 24 12:29:02 2025 JB, GB, MP, AM, NH207Bi source threshold tests
> > > 
> > > We have dismounted the AIDA stack and bPlast and realigned the cables so that they can fit into the adapters.
> > > 
> > > The plan for the next couple days is the following:
> > > 
> > > - Alignment -- done
> > > - Remount cable -- done
> > > - Fix position w/o bPlast mounted -- done
> > > - Remount bracket for the last stage -- done
> > > - Remount AIDA 1 &amp; 2 and the 207Bi source with the source holder -- done
> > > - Mount the snout and take data -- we wait till next week Monday when the heat exchanger is active again. (ongoing)
> > > 
> > > The current setup at the end of work is that the snout is mount with a bPlast (uncabled) and 2 AIDA layers at the regular spaced position with a 207Bi source down stream, as can be seen in the previous elog. The source is ~1 cm away from the middle AIDA wafer.
> > > 
> > > Currently what is cabled:
> > > 
> > > - Signal out from the detector
> > > - Bias daisy chain
> > > 
> > > Still to be cabled:
> > > 
> > > - HV cable
> > > - Grounding
> > > - Pulser
> > > 
> > > Additional info on the source position:
> > > - the source is at ~9.6 mm distance from the downstream detector
> > > - the source is placed at the centre of the middle wafer: 12.25 cm in x, 4.75 cm in y
> > > - the radius of the source is ~1.5 mm
> > 
> > The Messhuette has been cleaned and equipment has been rearranged. If there are any broken or missing components be sure to follow up with the FRS group (as I believe they have been cleaning here).
> > 
> > We are resuming the work on the source measurements as the cooling water is back. Some of the valves still look closed so we are investigating if the water is flowing to the setup.
> > 
> > 14:31 Temperature on start up OK - attachment 2.
> > 
> > 15:41 We reset the ASIC control registers to a setup used in Feb 2024 (2025Feb24-17.14.52) to match the full AIDA setup (it was using BB7 initially in aida10).
> > 
> > The old bias scheme is obsolete and the bias is now done via the Ohmic side.
> > 
> > 16:47 We have look at some initial spectra with the 207Bi 3-8 shows the ADC channels and waveforms of the n+n and p+n sides. Bias and grounding developed by Nabiel have been done.
> > 
> > We are going to wait for the system to stabilise over night so that we start taking data tomorrow. Then we can analyse the results and see what we get :) Some channels are clearly broken which can be seen in the waveforms eg. aida16.
> 
> 11:31 The detector was turned off last night to put it into a safe state. We return to make some comparison of the noise w.r.t the tests performed by Nabil and co. 
> 
> email snippet:
> 
> "
> I would suggest that you first quantify current noise performance (slow comparators -> 0x64 to reduce rate, measure pulser peak width) for each FEE64 (use layouts 3 and 4) and compare to Nabil's most recent test results. Looking at last night's 1.8.W spectra I would assume that they would be significantly worse but best to check.
> 
> I would then suggest you carefully check
> 
>     Grounding configuration (both internal and external to the snout) used Nabil's most recent tests has actually been re-established
>     Grounding of the bPlas cabling
> "
> 
> We are going to restart the DAQ and set the LEC thresholds to 0x64 and compare the peak FWHM with a pulser.
> 
> 11:50 We started up the DAQ temps and bias look OK.
> 
> 12:00 We set the thresholds on each ASIC in the slow comparator LEC to 0x64. This should correspond to a high threshold. For some reason the y-strips are still noisy (wrong polarity in the register ?)

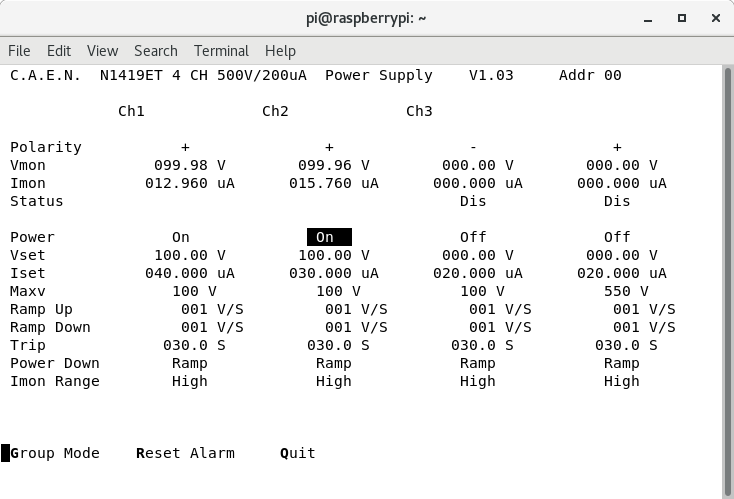
13:28 we returned after a hearty lunch. When turning on the FEE64s we noticed that the bias of the CAEN to the detector increases by 0.3 V.

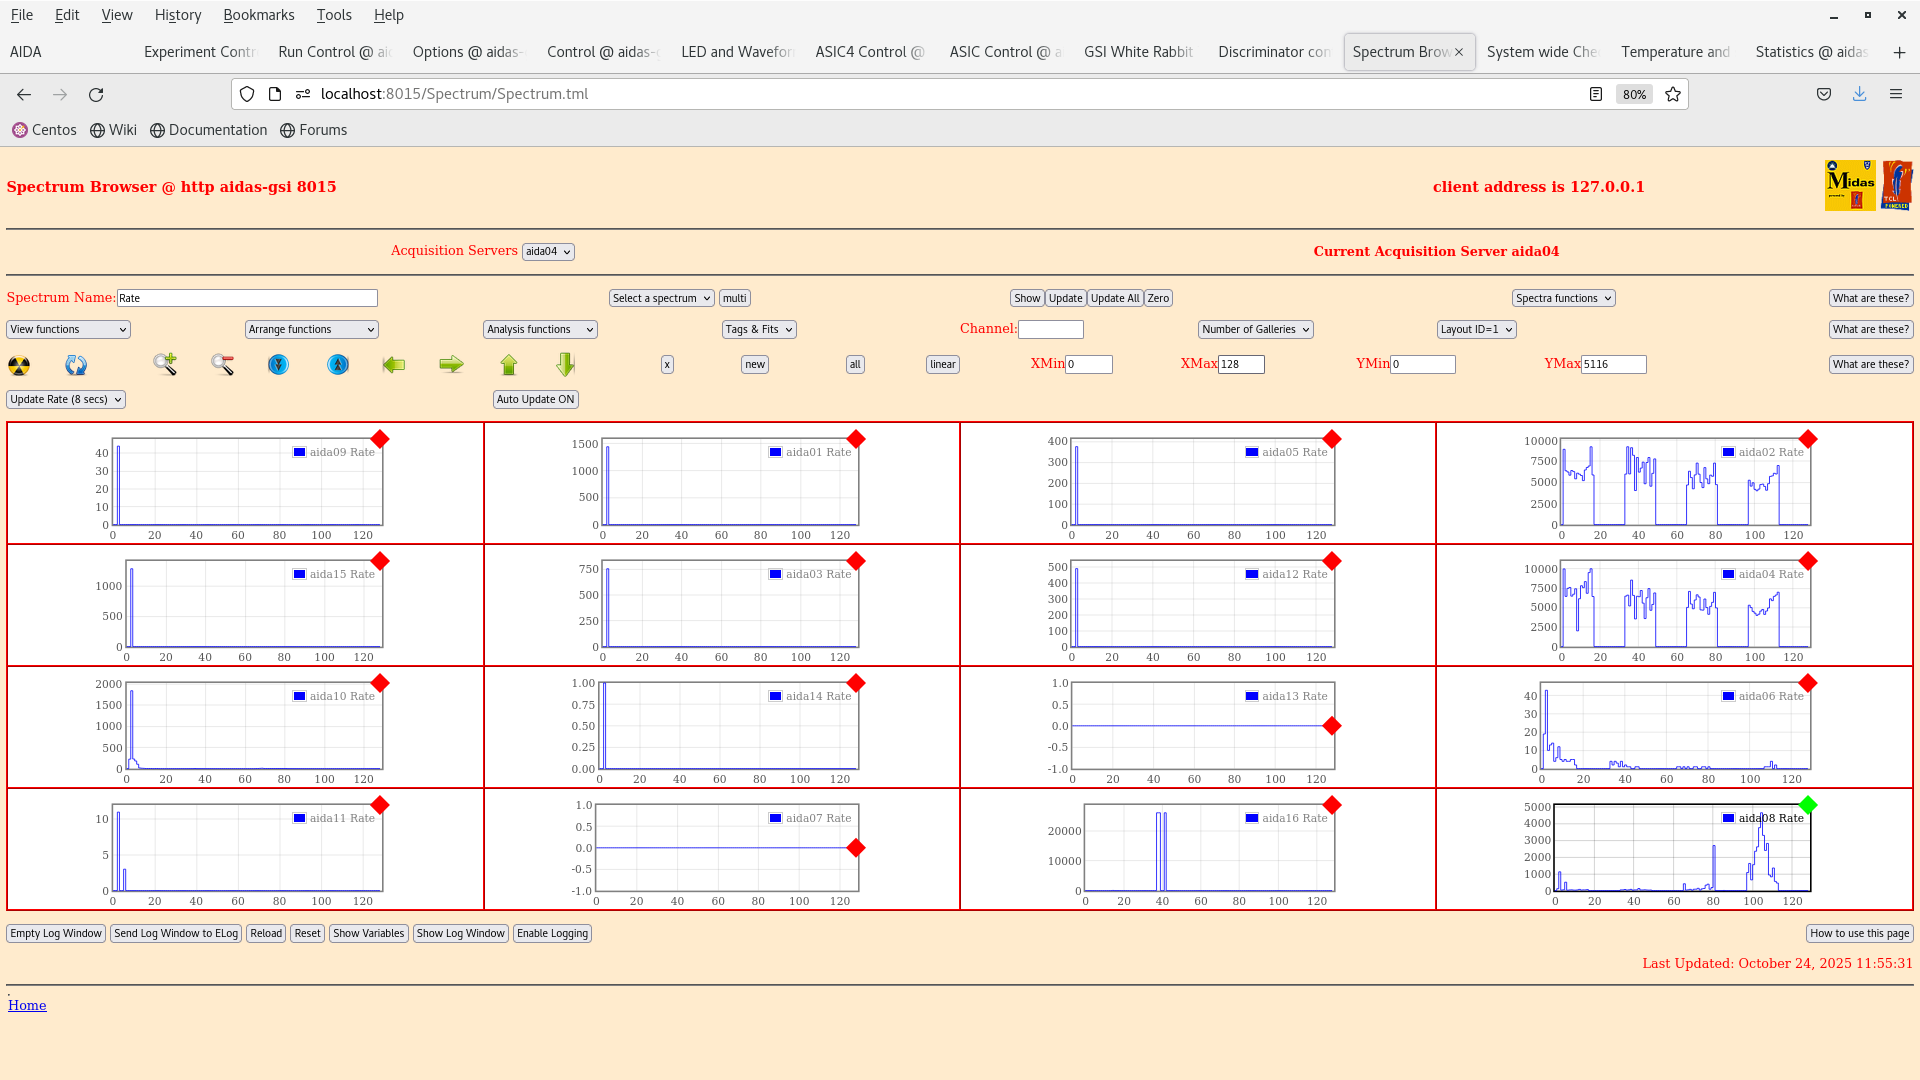
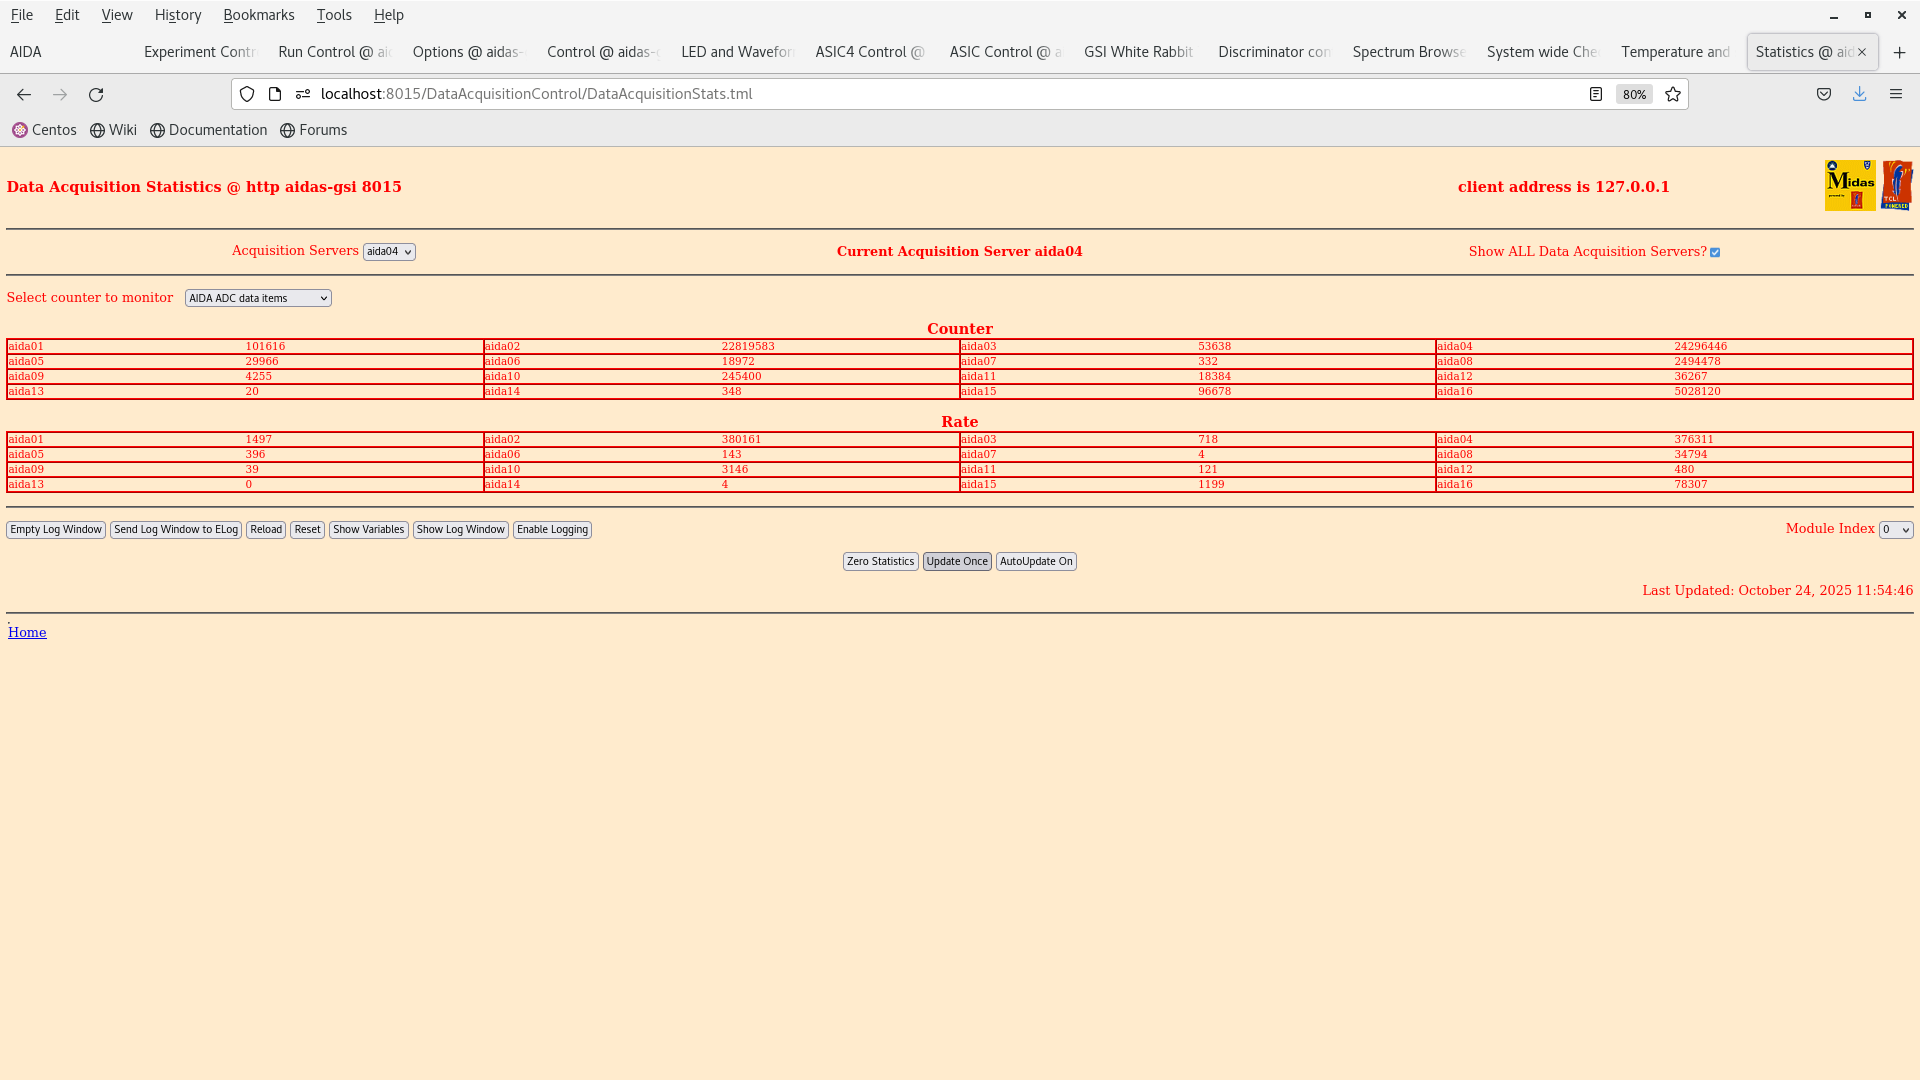
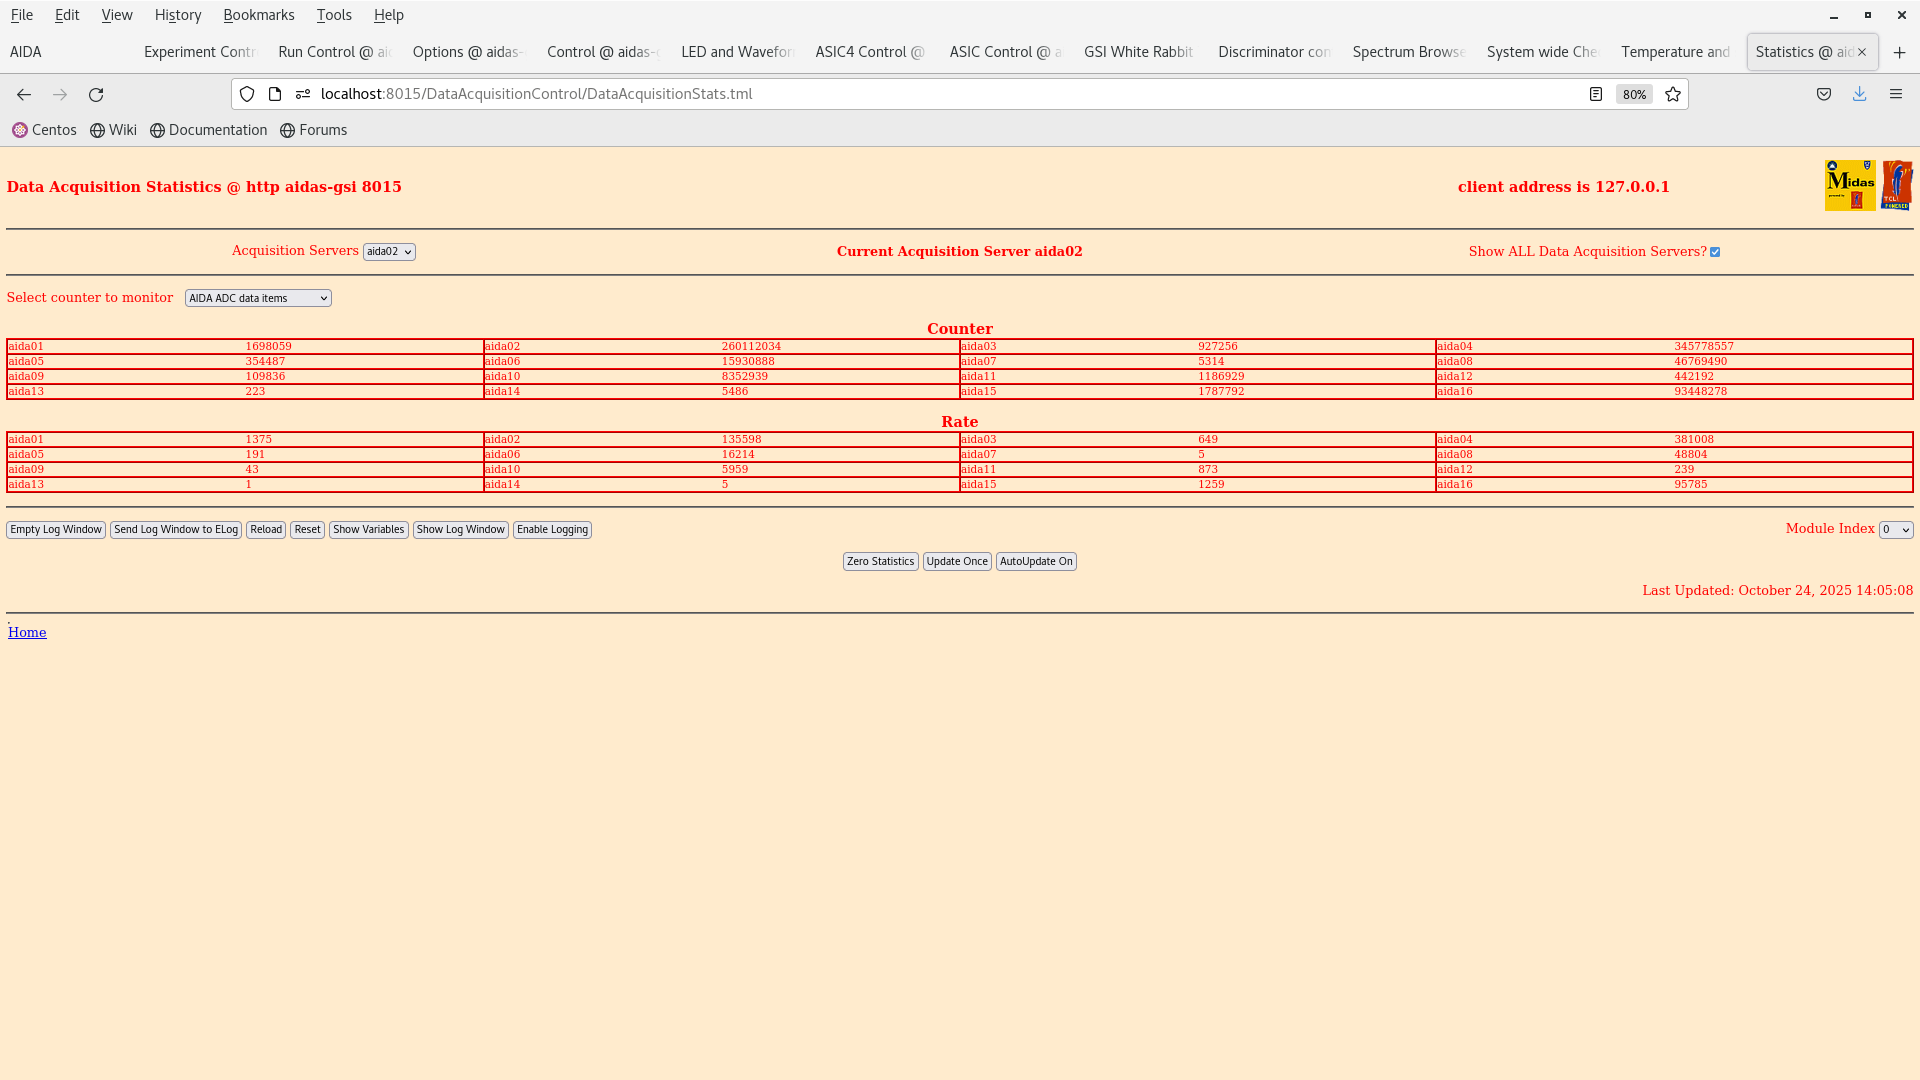
We rebiased and set the thresholds in one FEE64 aida02 to 0xff (very high, attachment 2) and the detector is still reading about 100 kHz ADC items. When the threshold was set to 0x64 it was 360 kHz (attachment 4).

We bias down the system to cross-check the cabling etc.
Attachment 1: Screenshot_from_2025-10-24_13-52-42.png
Screenshot_from_2025-10-24_13-52-42.png
Attachment 2: Screenshot_from_2025-10-24_13-53-05.png
Screenshot_from_2025-10-24_13-53-05.png
Attachment 3: Screenshot_from_2025-10-24_14-08-56.png
Screenshot_from_2025-10-24_14-08-56.png
Attachment 4: Screenshot_from_2025-10-24_14-08-52.png
Screenshot_from_2025-10-24_14-08-52.png
Attachment 5: IMG_5919.jpeg
IMG_5919.jpeg
Attachment 6: IMG_5918.jpeg
IMG_5918.jpeg
Attachment 7: IMG_5917.jpeg
IMG_5917.jpeg
Attachment 8: IMG_5914.jpeg
IMG_5914.jpeg
Attachment 9: IMG_5913.jpeg
IMG_5913.jpeg
Attachment 10: IMG_5915.jpeg
IMG_5915.jpeg
Attachment 11: IMG_5916.jpeg
IMG_5916.jpeg
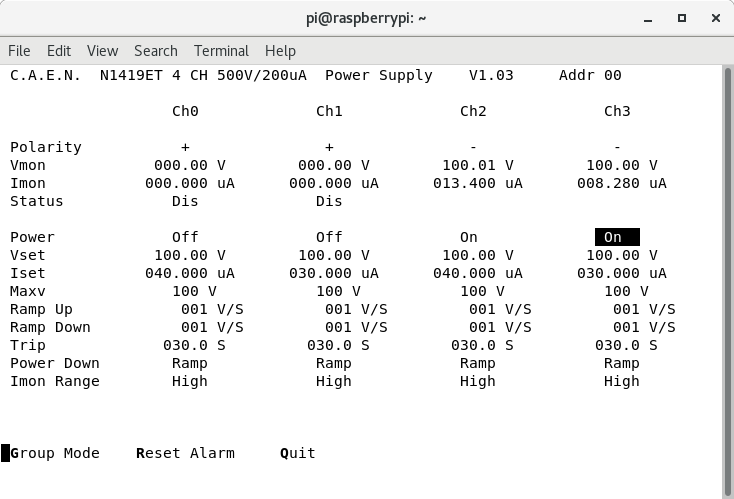
  734   Wed Oct 29 14:11:01 2025 JB, MP207Bi source test - data taking
15:10 MP entered and check the water pressure OK.
15:10 DSSSDs biased - OK.

The plan from https://elog.ph.ed.ac.uk/DESPEC/719


- Energy distribution in x and y for ADC items and cluster
- The cluster size from conversion electrons
- ADC offsets with the 207Bi source after performing a pulser walkthrough
- Threshold test /w a 207Bi source - varying the threshold as while the source is in place and seeing when the 207Bi peaks are cut off. 
- Background run without the 207Bi source (after the above tests)
- Possible test with a 152Eu source as well to measure conversion electrons from Eu could also be an option but we would need to discuss how to do this since all the 152Eu source are closed. We could possibly measure the compton edge from this 
data.

Currently the n+n ohmic channels are too noisy to be used for the test. So we will disable their readout for the data taking.

All system wide checks passed. ADC calibration not (but we don't care since we aren't looking at waveforms... for now...).

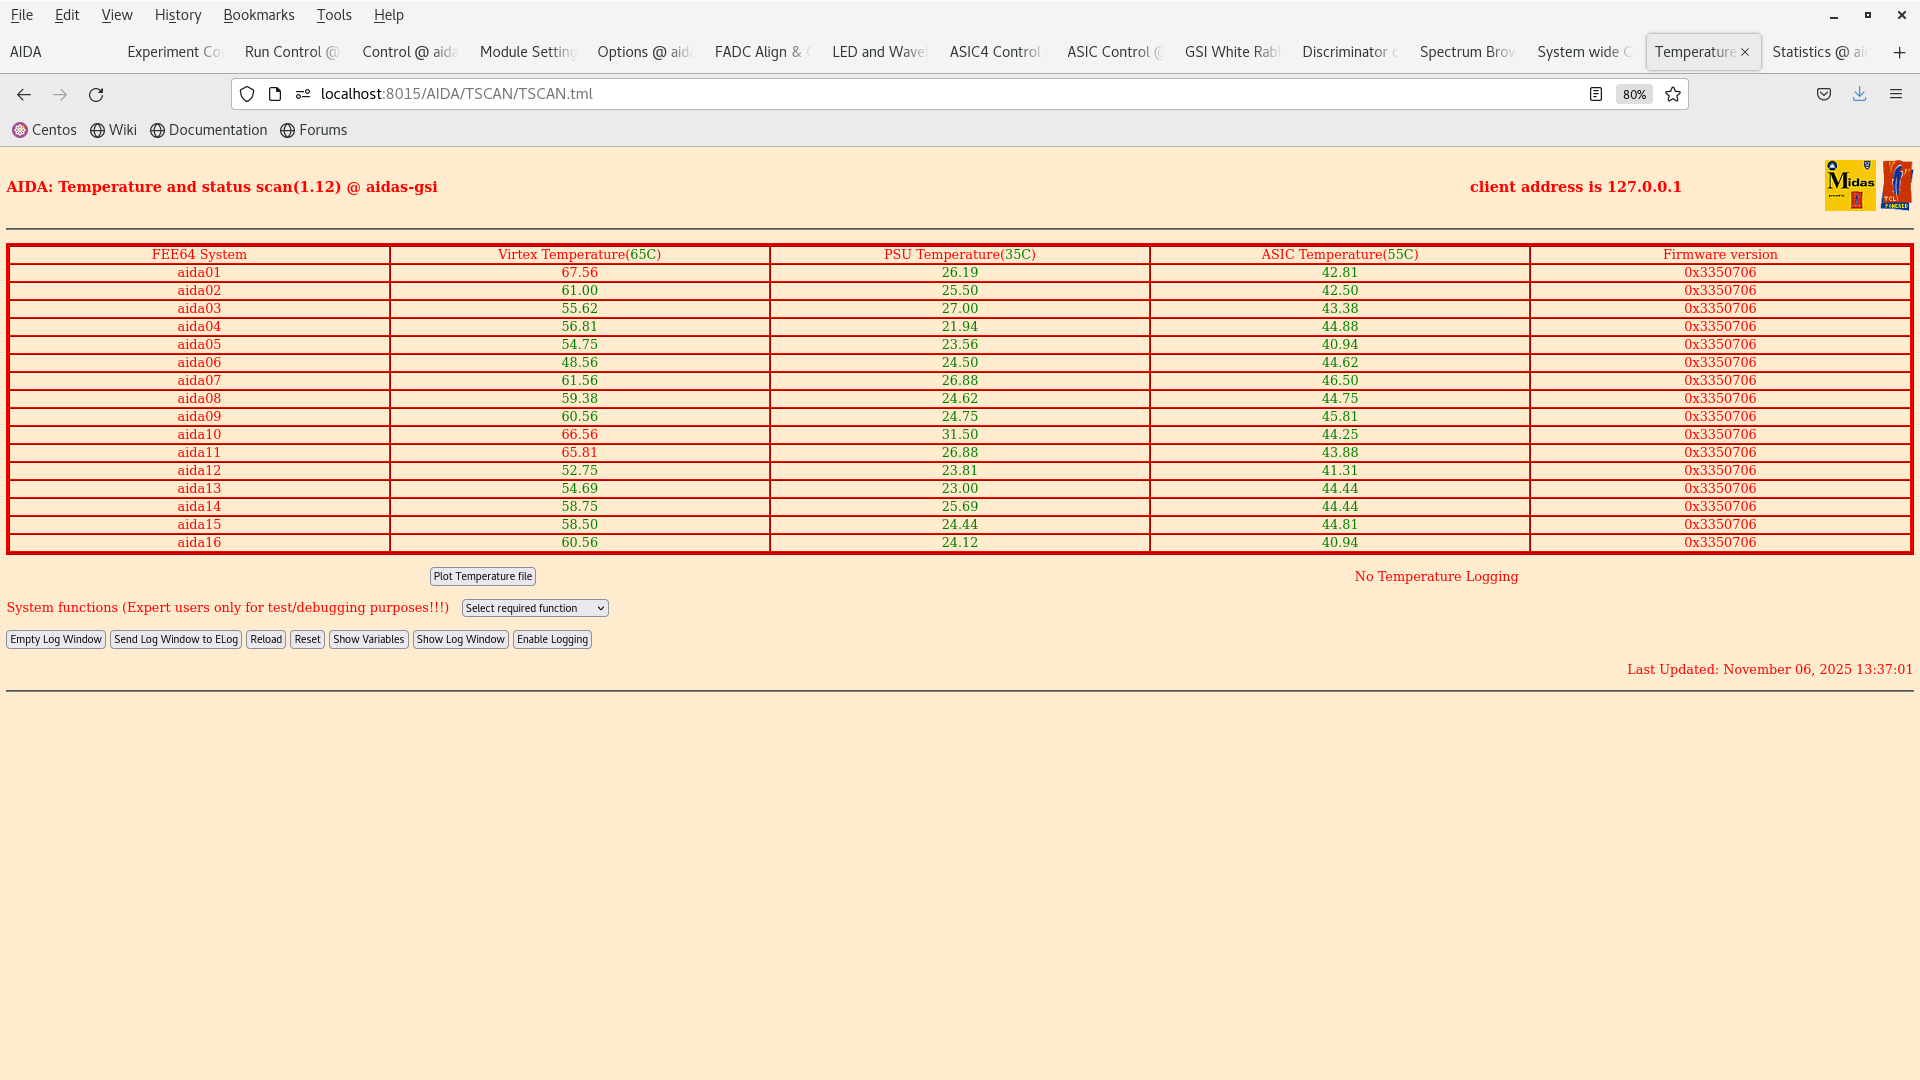
TEMPS OK. Attachment 2.

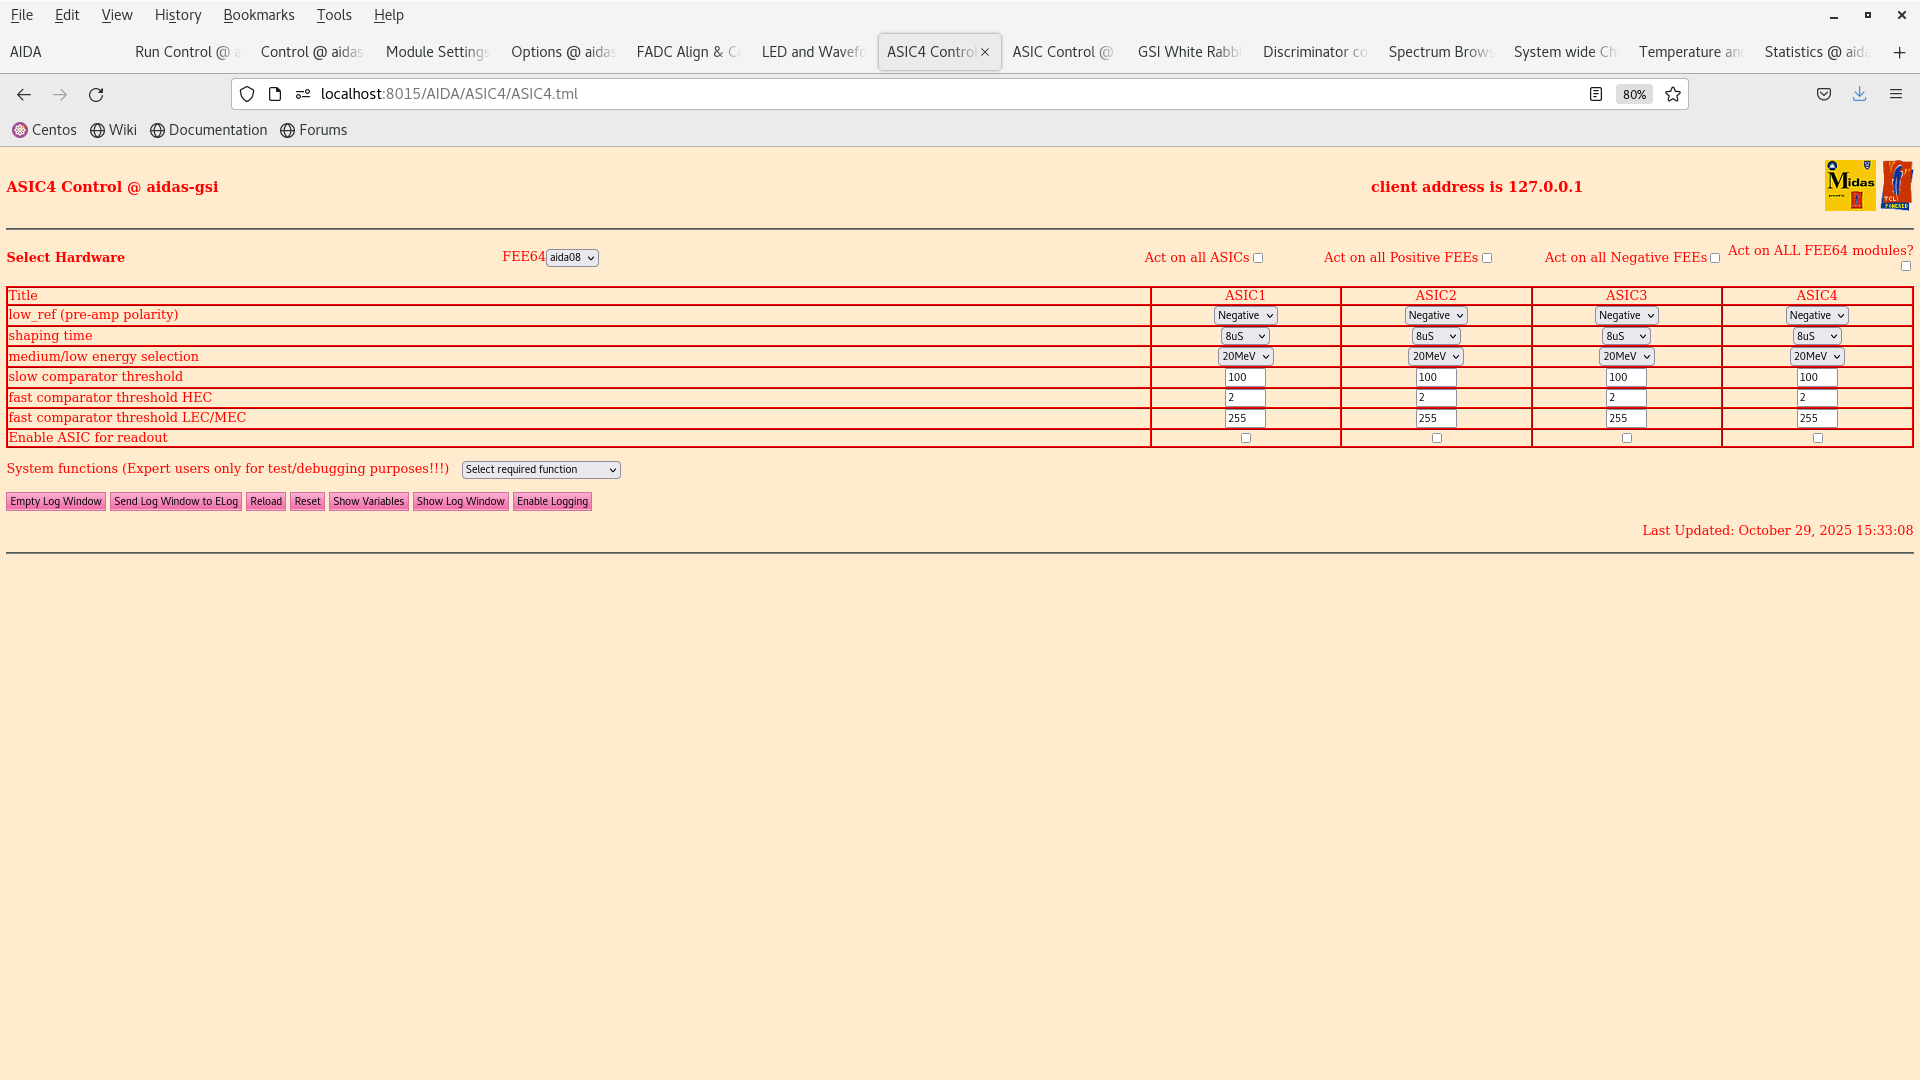
We loaded the settings from 2025Oct28-14.55.15 which has blanket thresholds of 0x64 (1 MeV) for all the ASICs.
 
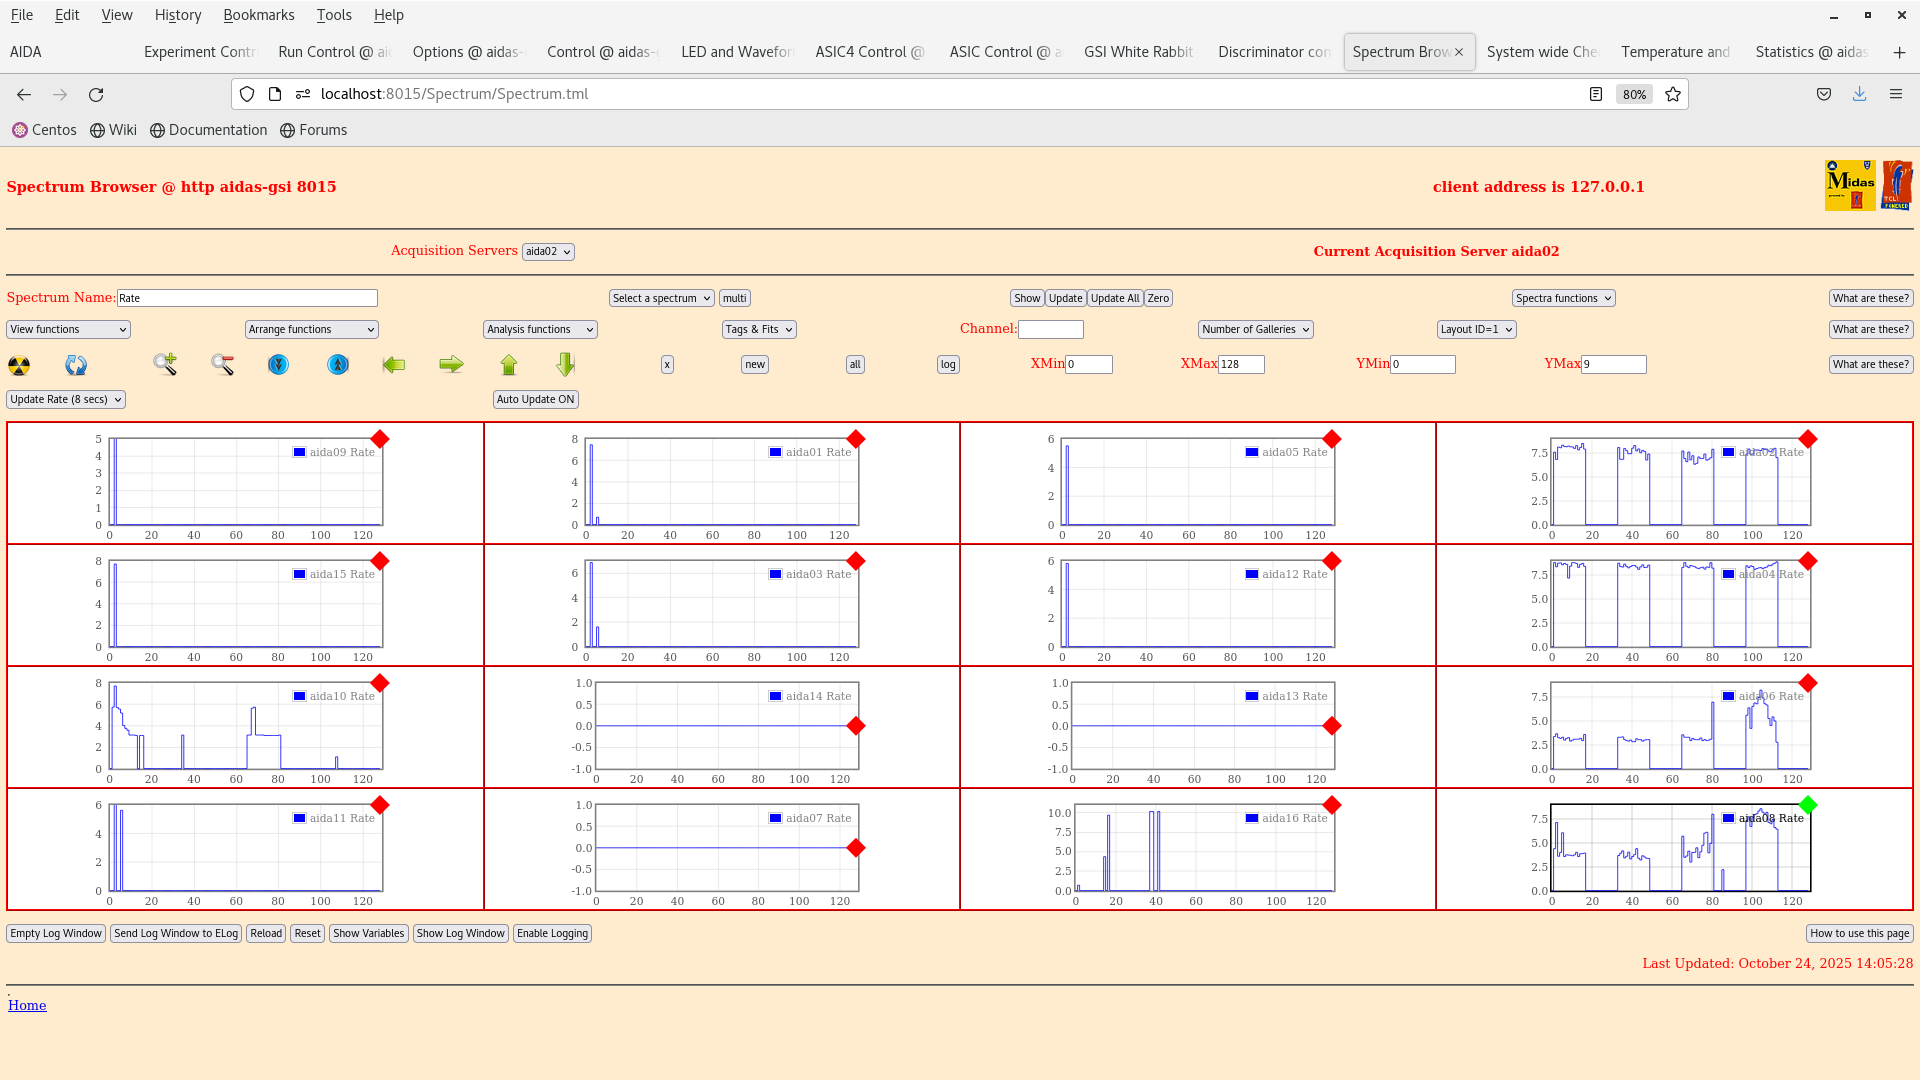
The pulser peaks seem to have gotten wider since yesterday (75 channels). We have now measured a peak width of 167 channels in aida14 (!) (attachment 3). This was only after tightening the grounding of the setup and disabling the y FEEs. Rates in the ohmic FEEs appear to have decreased by a whole order of magnitude excl. aida02 (see attachment 4).

Currently, we have the ohmic FEE64s disabled aida02,04,06,08, in the discriminator channel mask value set 0x0 ---> 0xfffffff.

15:47 We lower the thresholds to 200 keV (2025Oct29-09.55.31)to see how the system responds and what the rates are. 

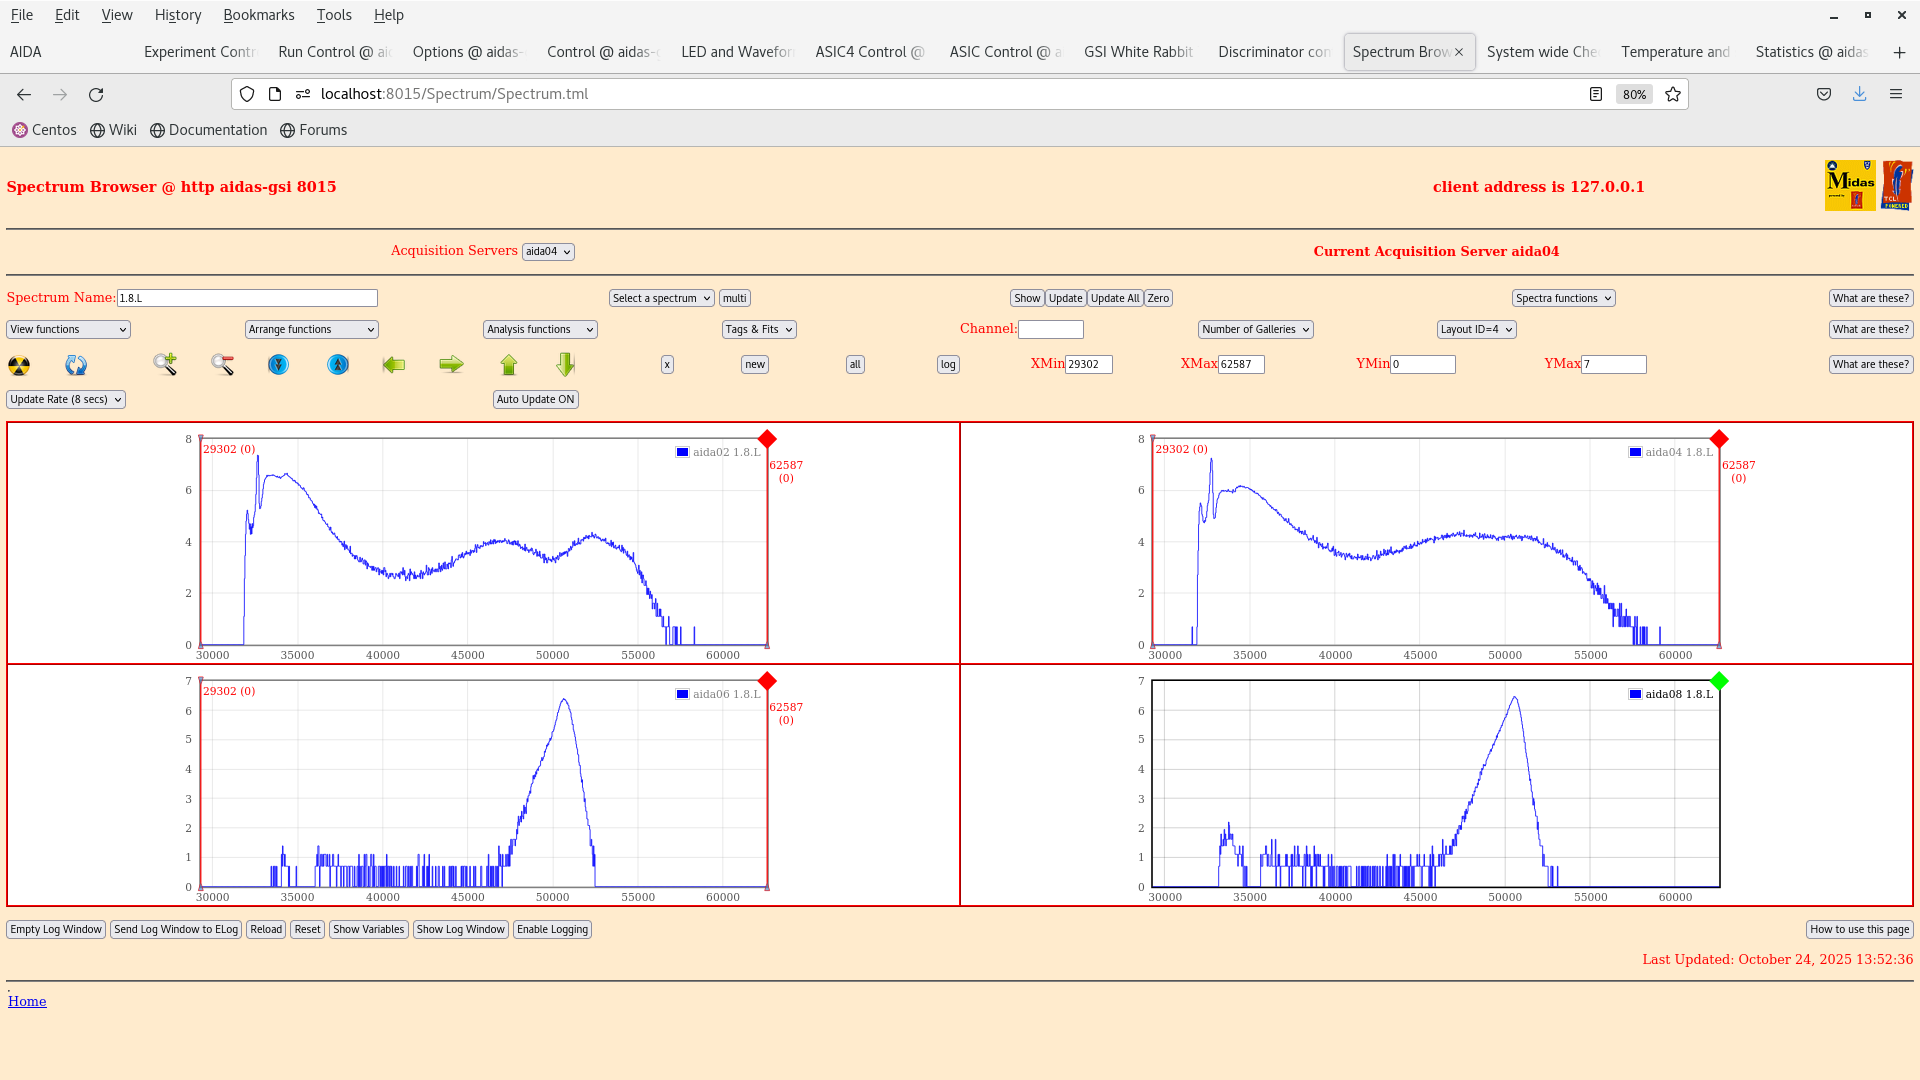
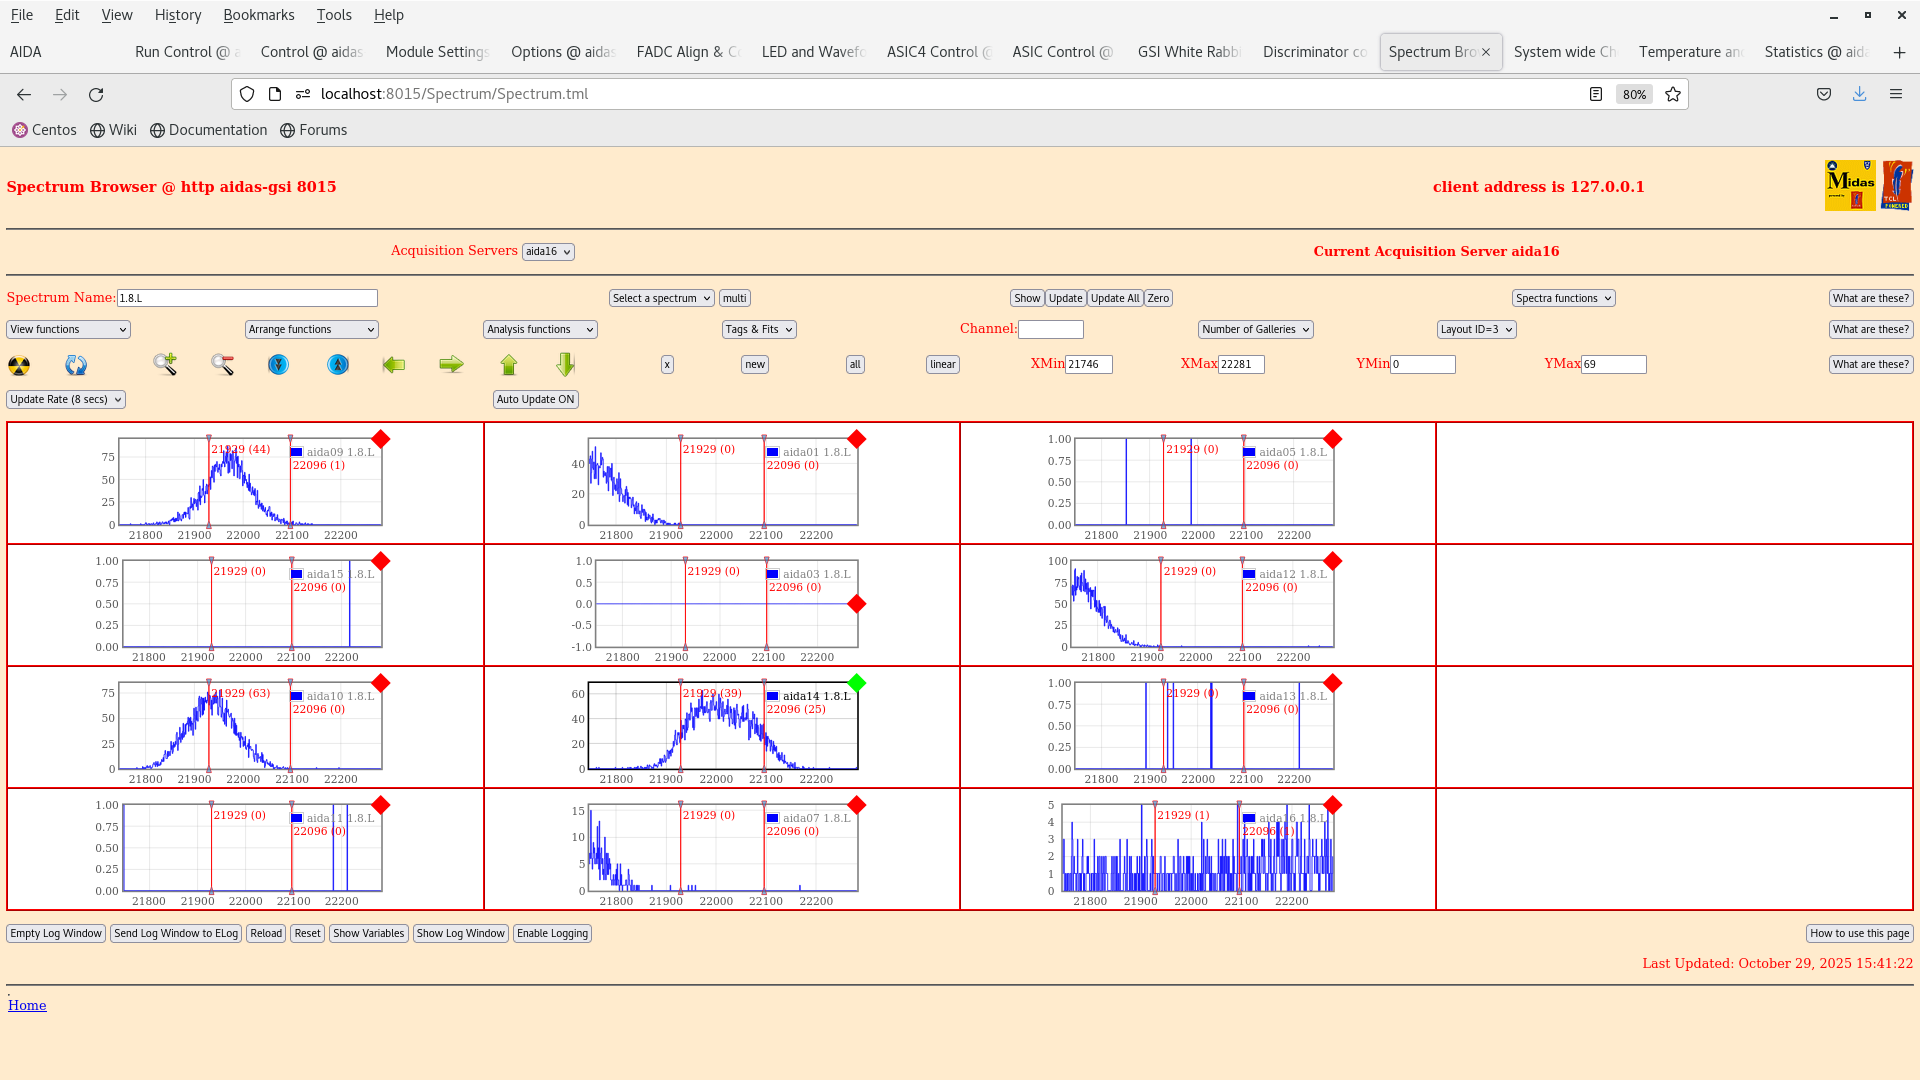
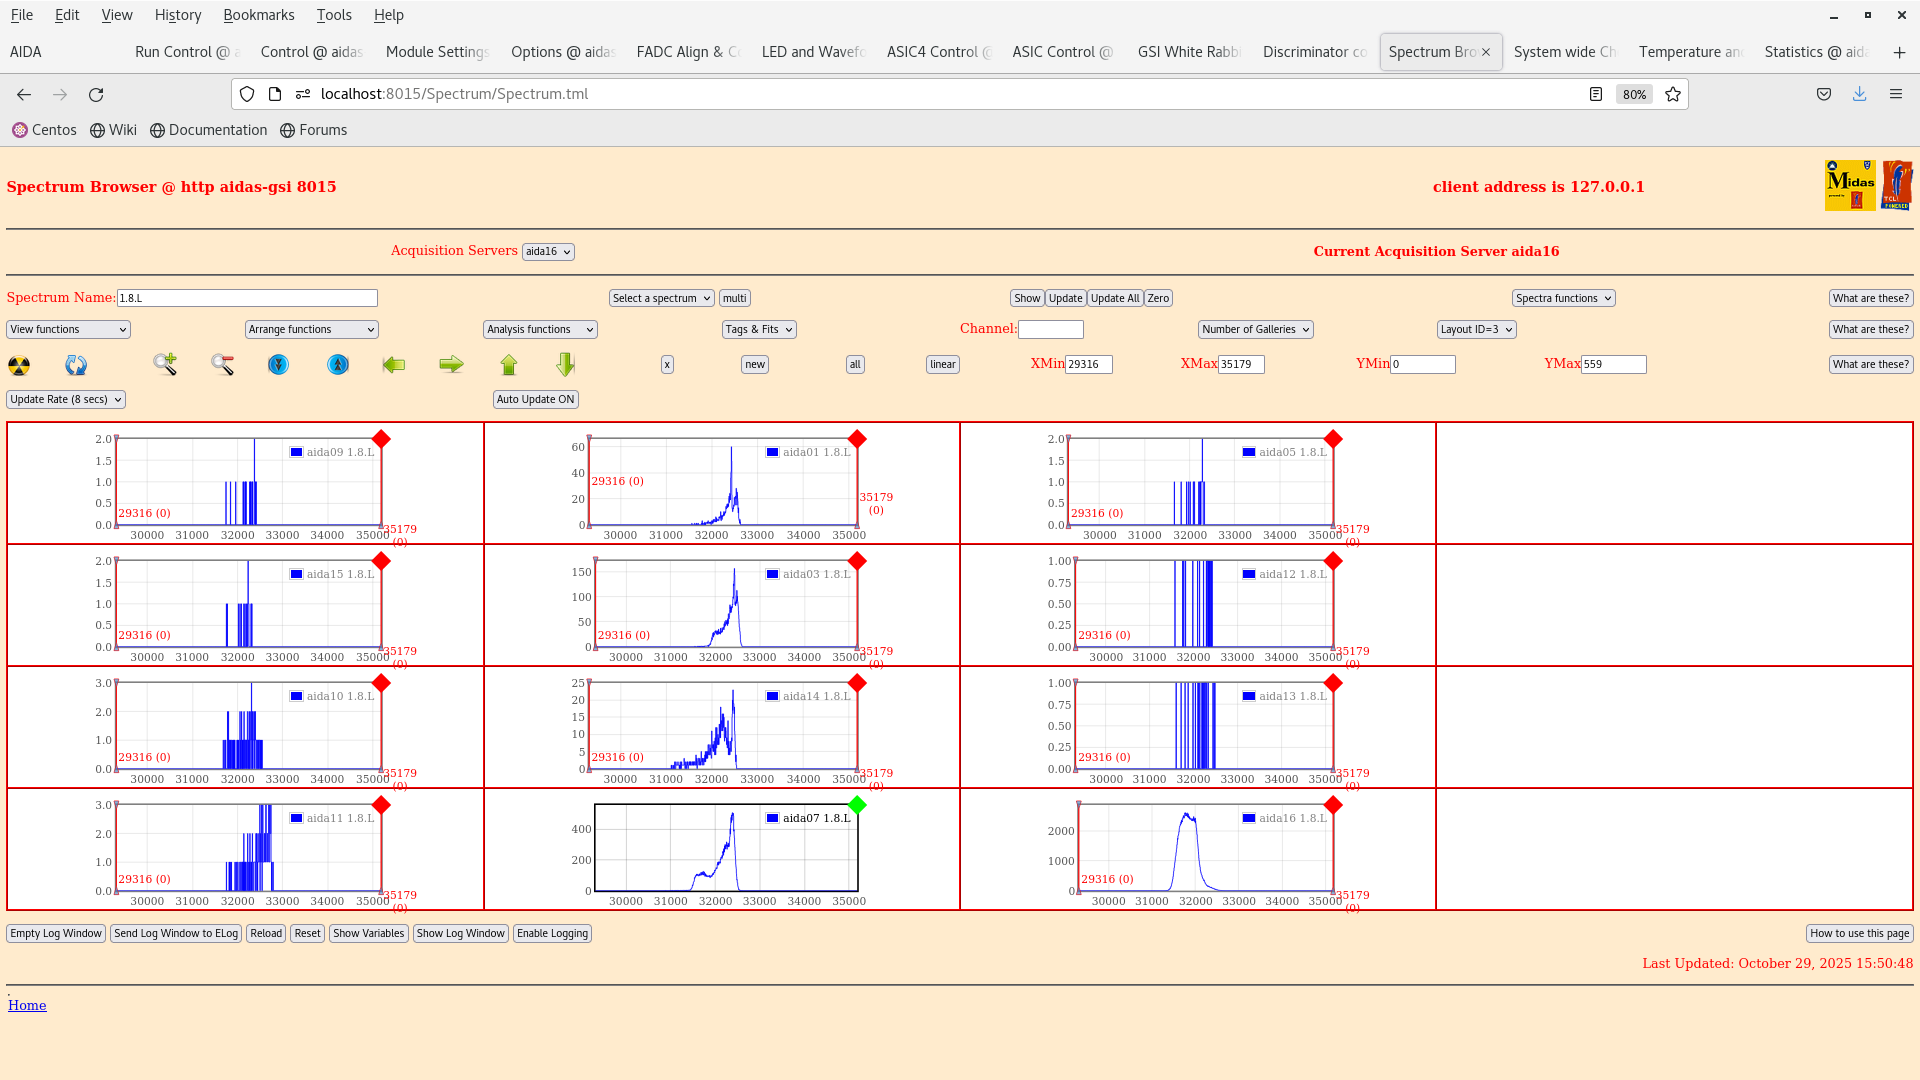
15:54 We see a 207Bi spectrum cleanly ontop of the FEE64s over which the source is place (aida01,aida14,aida03,aida07). Attachment 6. (For comparison the 207Bi spectrum obtained by Oscar Hall in the AIDA NIM paper Attachment 7).

- A quick observation is that the low energy peak around 400 keV is slightly cut off in some of the FEEs (this could suggest that the operating threshold might be slightly different in some of the FEEs).

16:00 Setting up the merger. EXPERIMENTS/AIDA/2025Oct29-16.11.06 setting made for the discriminators mask setting for the y FEEs disabled.

To the reader of this elog: By now it has taken over an hour to start up the DAQ... We give up and will try tomorrow morning
Attachment 1: Screenshot_from_2025-10-29_15-09-11.png
Screenshot_from_2025-10-29_15-09-11.png
Attachment 2: Screenshot_from_2025-10-29_15-27-50.png
Screenshot_from_2025-10-29_15-27-50.png
Attachment 3: Screenshot_from_2025-10-29_15-41-53.png
Screenshot_from_2025-10-29_15-41-53.png
Attachment 4: Screenshot_from_2025-10-29_15-34-12.png
Screenshot_from_2025-10-29_15-34-12.png
Attachment 5: Screenshot_from_2025-10-29_15-33-15.png
Screenshot_from_2025-10-29_15-33-15.png
Attachment 6: Screenshot_from_2025-10-29_15-51-38.png
Screenshot_from_2025-10-29_15-51-38.png
Attachment 7: Screenshot_2025-10-29_at_15-53-02_The_Advanced_Implantation_Detector_Array_(AIDA)_-_220923_AIDA_NIM_23Sept2022_pdf.png
Screenshot_2025-10-29_at_15-53-02_The_Advanced_Implantation_Detector_Array_(AIDA)_-_220923_AIDA_NIM_23Sept2022_pdf.png
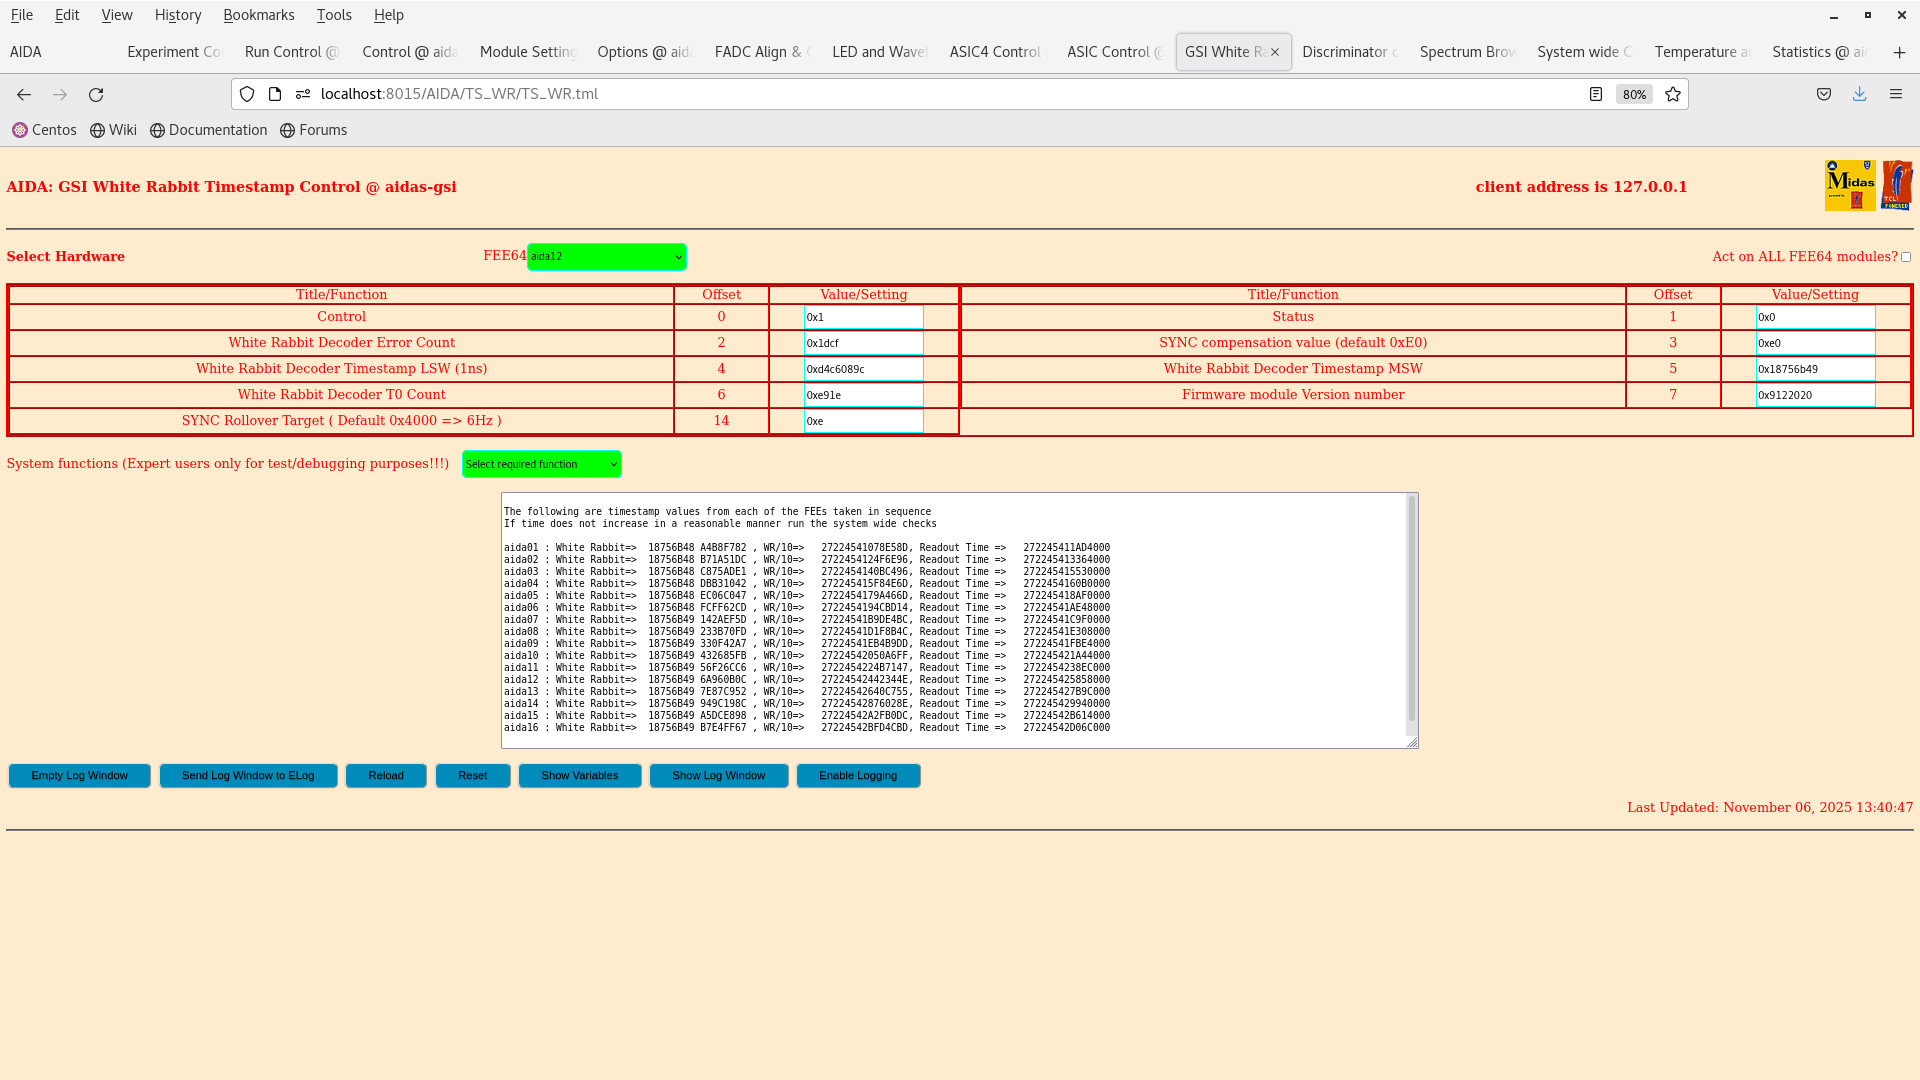
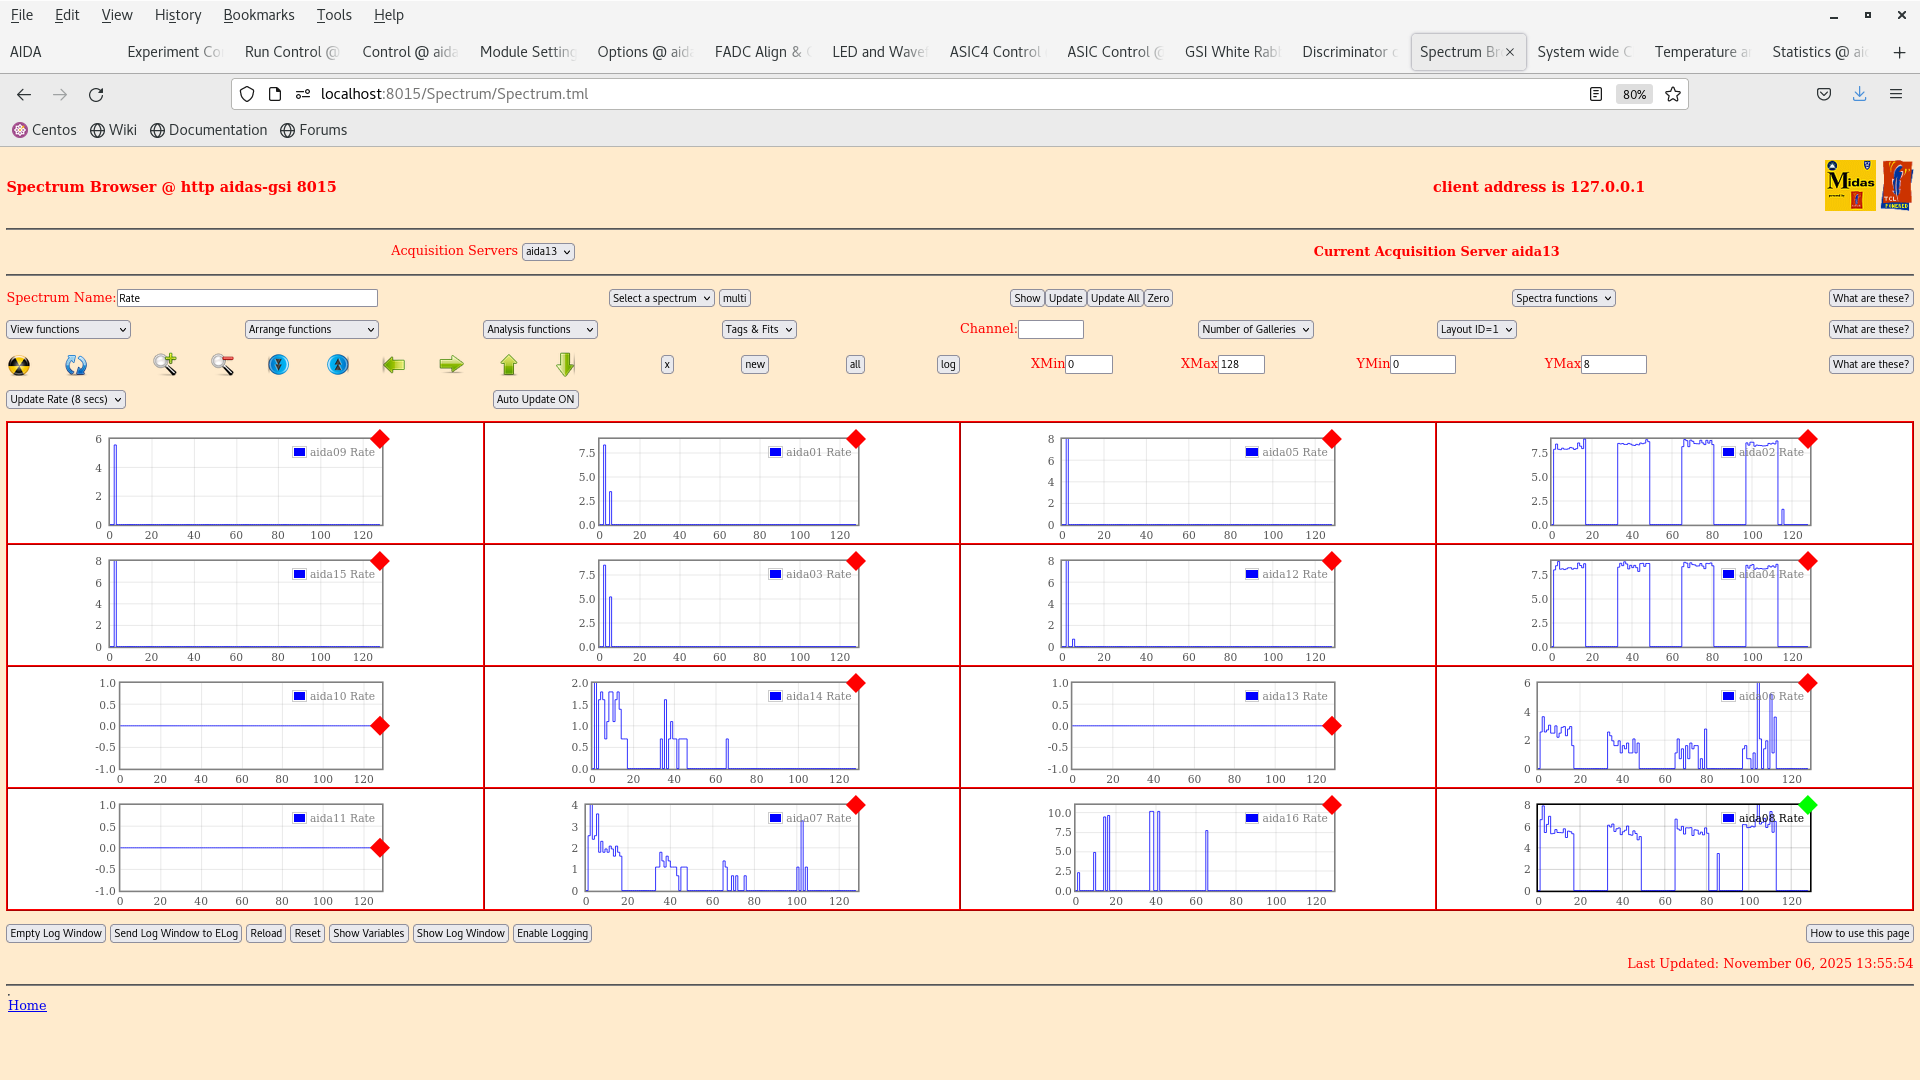
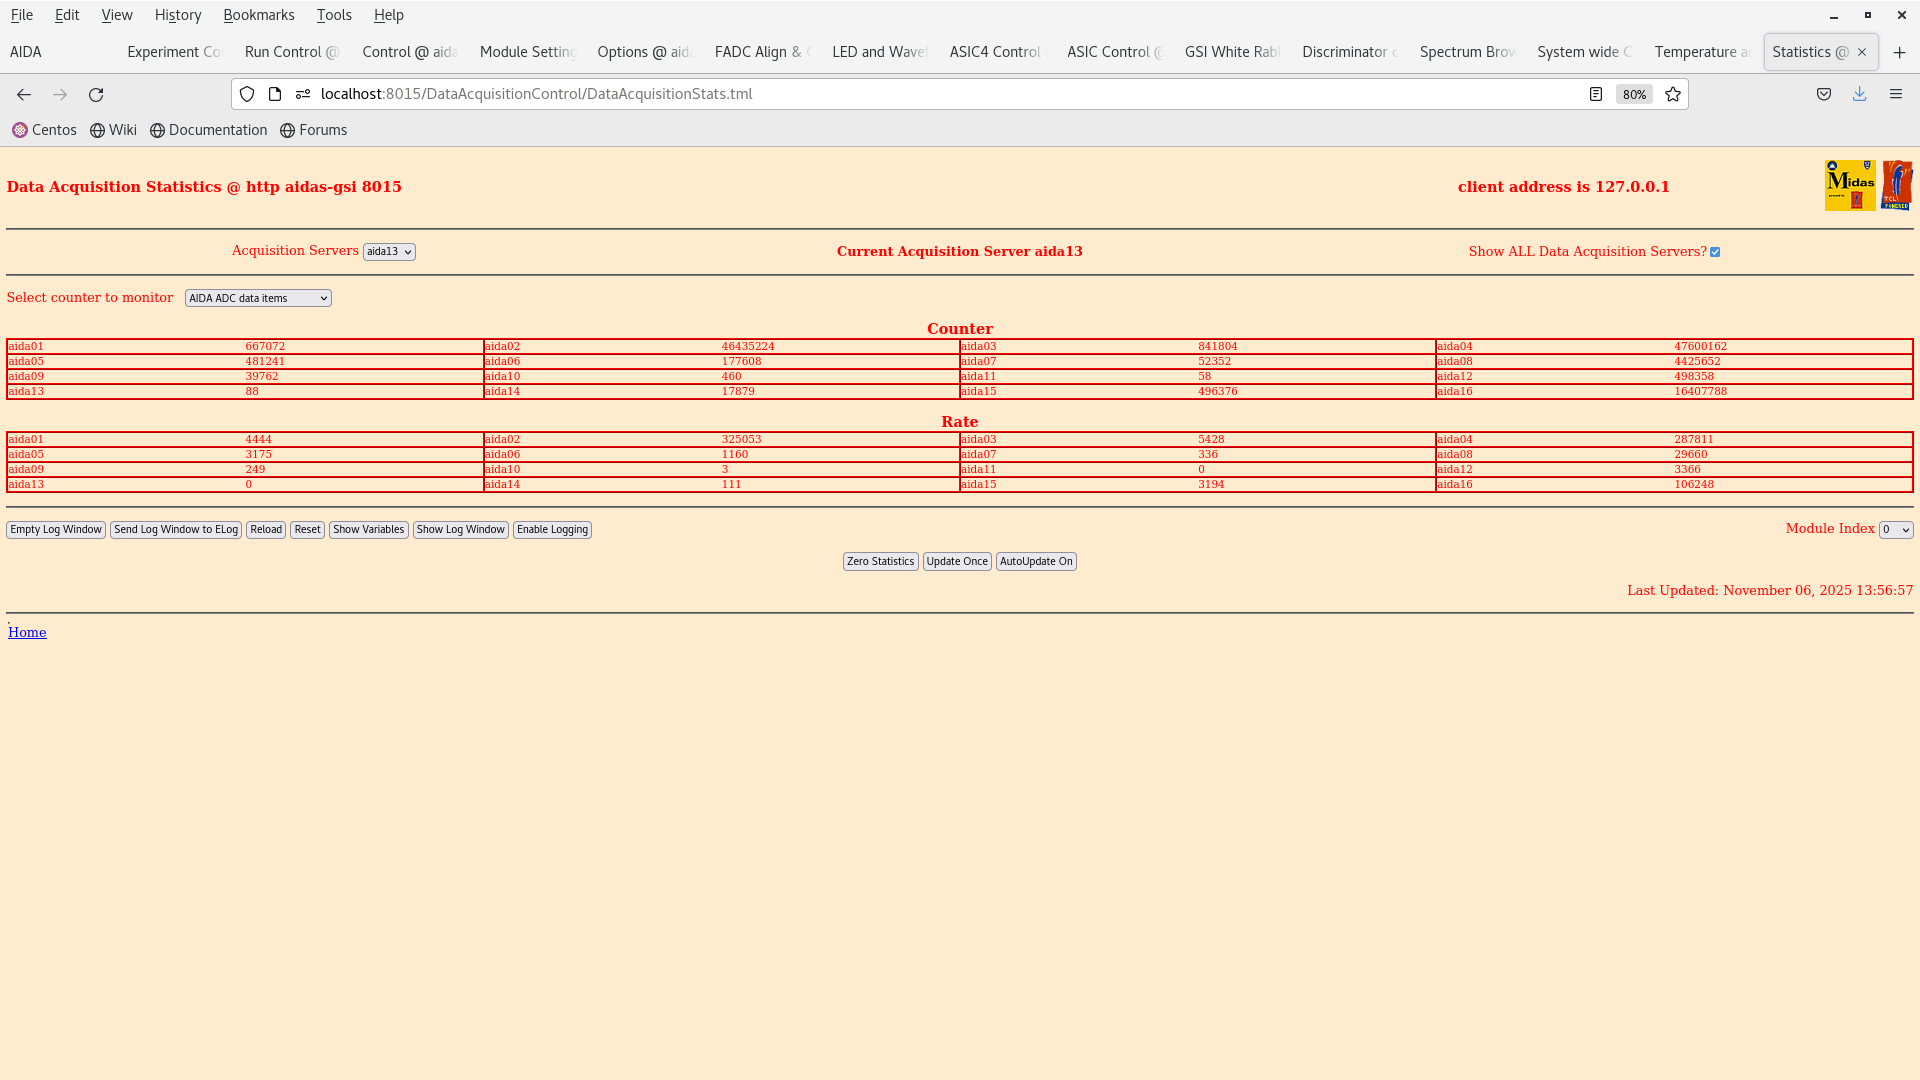
  741   Thu Nov 6 12:58:09 2025 NH207Bi source test - data taking
Restart AIDA

aida06 took three attempts to boot today :(

All system checks OK, ASICs aligned

Run DAQ without merger - looks okay, all FEEs working

When connecting to merger aida15 drops connection, solution restart merger

Aida13 not sending data - do an ASIC check/load

Finally all DAQs send data, merger is happy with all 16 FEEs

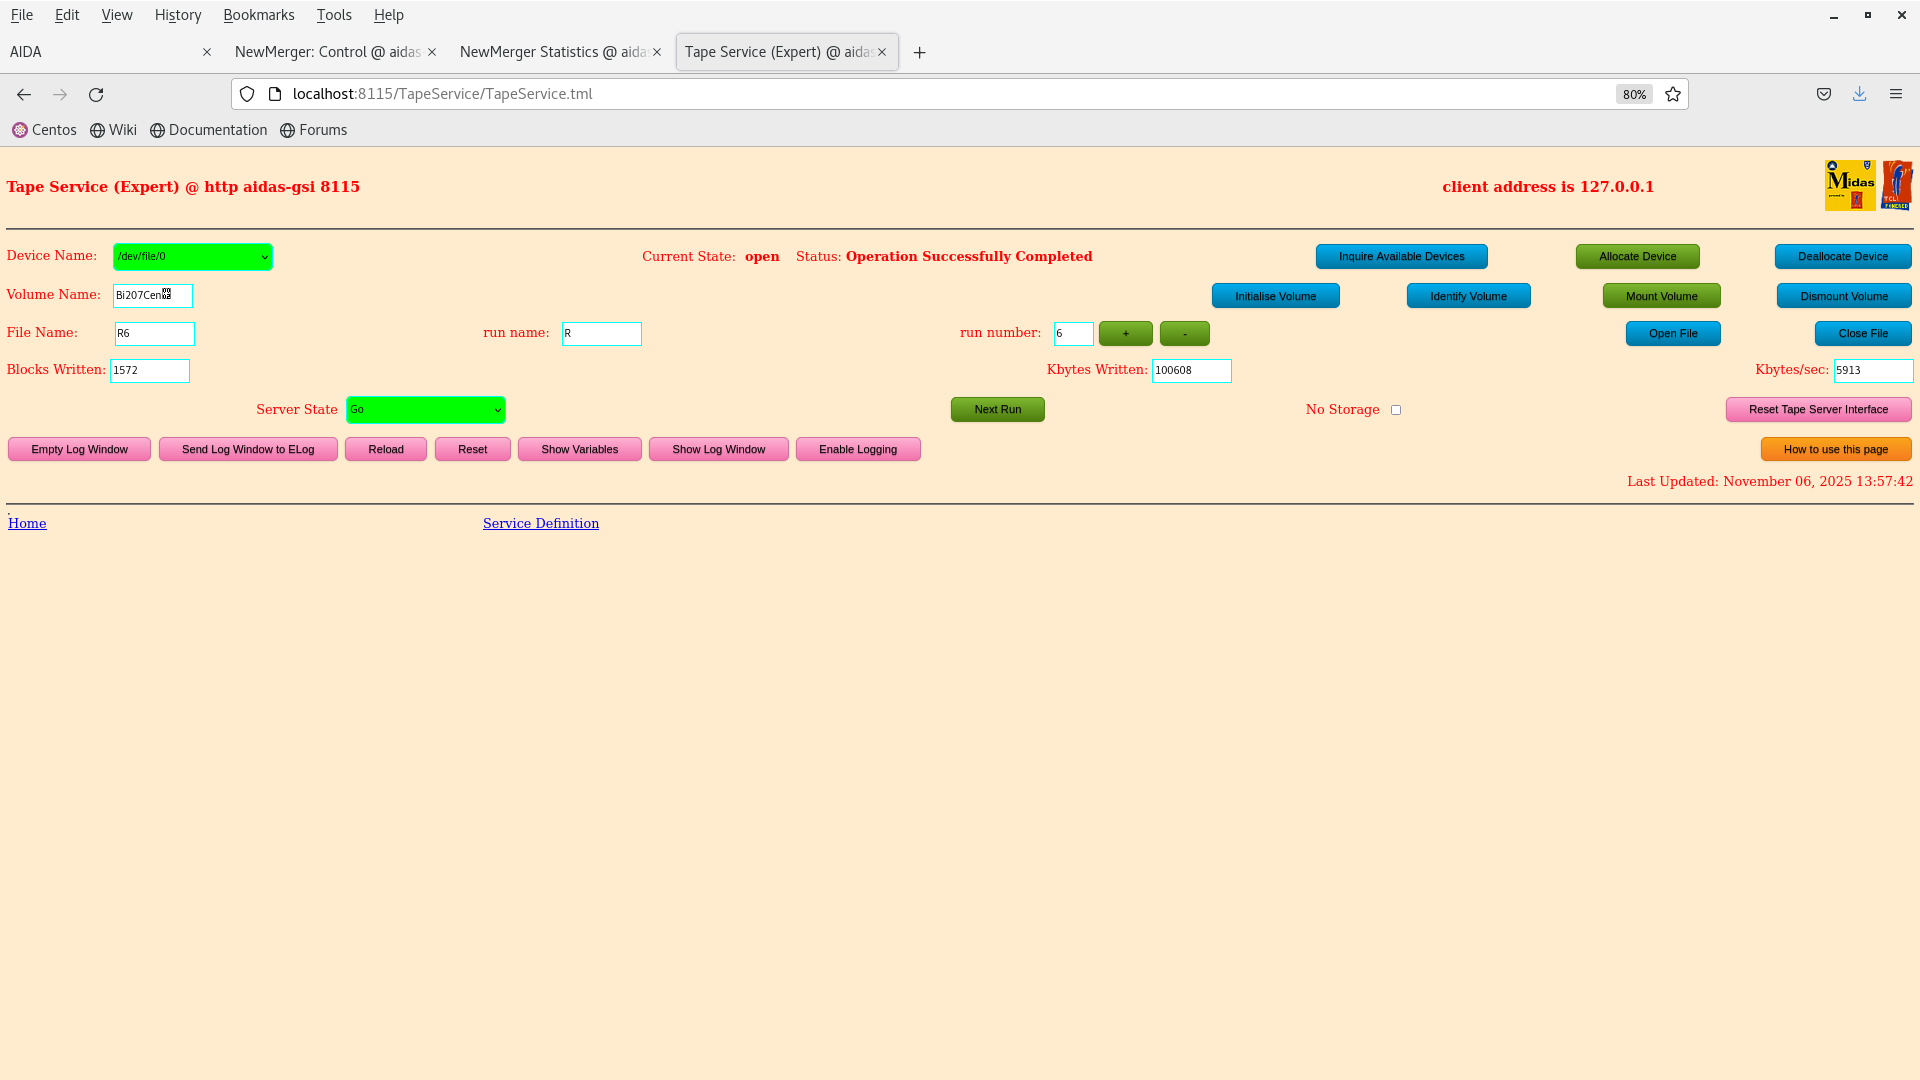
Open run R6 on disk
Attachment 1: Screenshot_from_2025-11-06_13-37-10.png
Screenshot_from_2025-11-06_13-37-10.png
Attachment 2: Screenshot_from_2025-11-06_13-40-37.png
Screenshot_from_2025-11-06_13-40-37.png
Attachment 3: Screenshot_from_2025-11-06_13-40-50.png
Screenshot_from_2025-11-06_13-40-50.png
Attachment 4: Screenshot_from_2025-11-06_13-55-58.png
Screenshot_from_2025-11-06_13-55-58.png
Attachment 5: Screenshot_from_2025-11-06_13-57-00.png
Screenshot_from_2025-11-06_13-57-00.png
Attachment 6: Screenshot_from_2025-11-06_13-57-43.png
Screenshot_from_2025-11-06_13-57-43.png
  742   Fri Nov 7 10:47:29 2025 MP207Bi source test - data taking
DAQ stopped at ~17.30 due to anydesk failure


> Restart AIDA
> 
> aida06 took three attempts to boot today :(
> 
> All system checks OK, ASICs aligned
> 
> Run DAQ without merger - looks okay, all FEEs working
> 
> When connecting to merger aida15 drops connection, solution restart merger
> 
> Aida13 not sending data - do an ASIC check/load
> 
> Finally all DAQs send data, merger is happy with all 16 FEEs
> 
> Open run R6 on disk
  740   Wed Nov 5 13:23:38 2025 JB, MP207Bi source test - FWHM tests
14:10 started up the DAQ. HV and TEMPS OK.

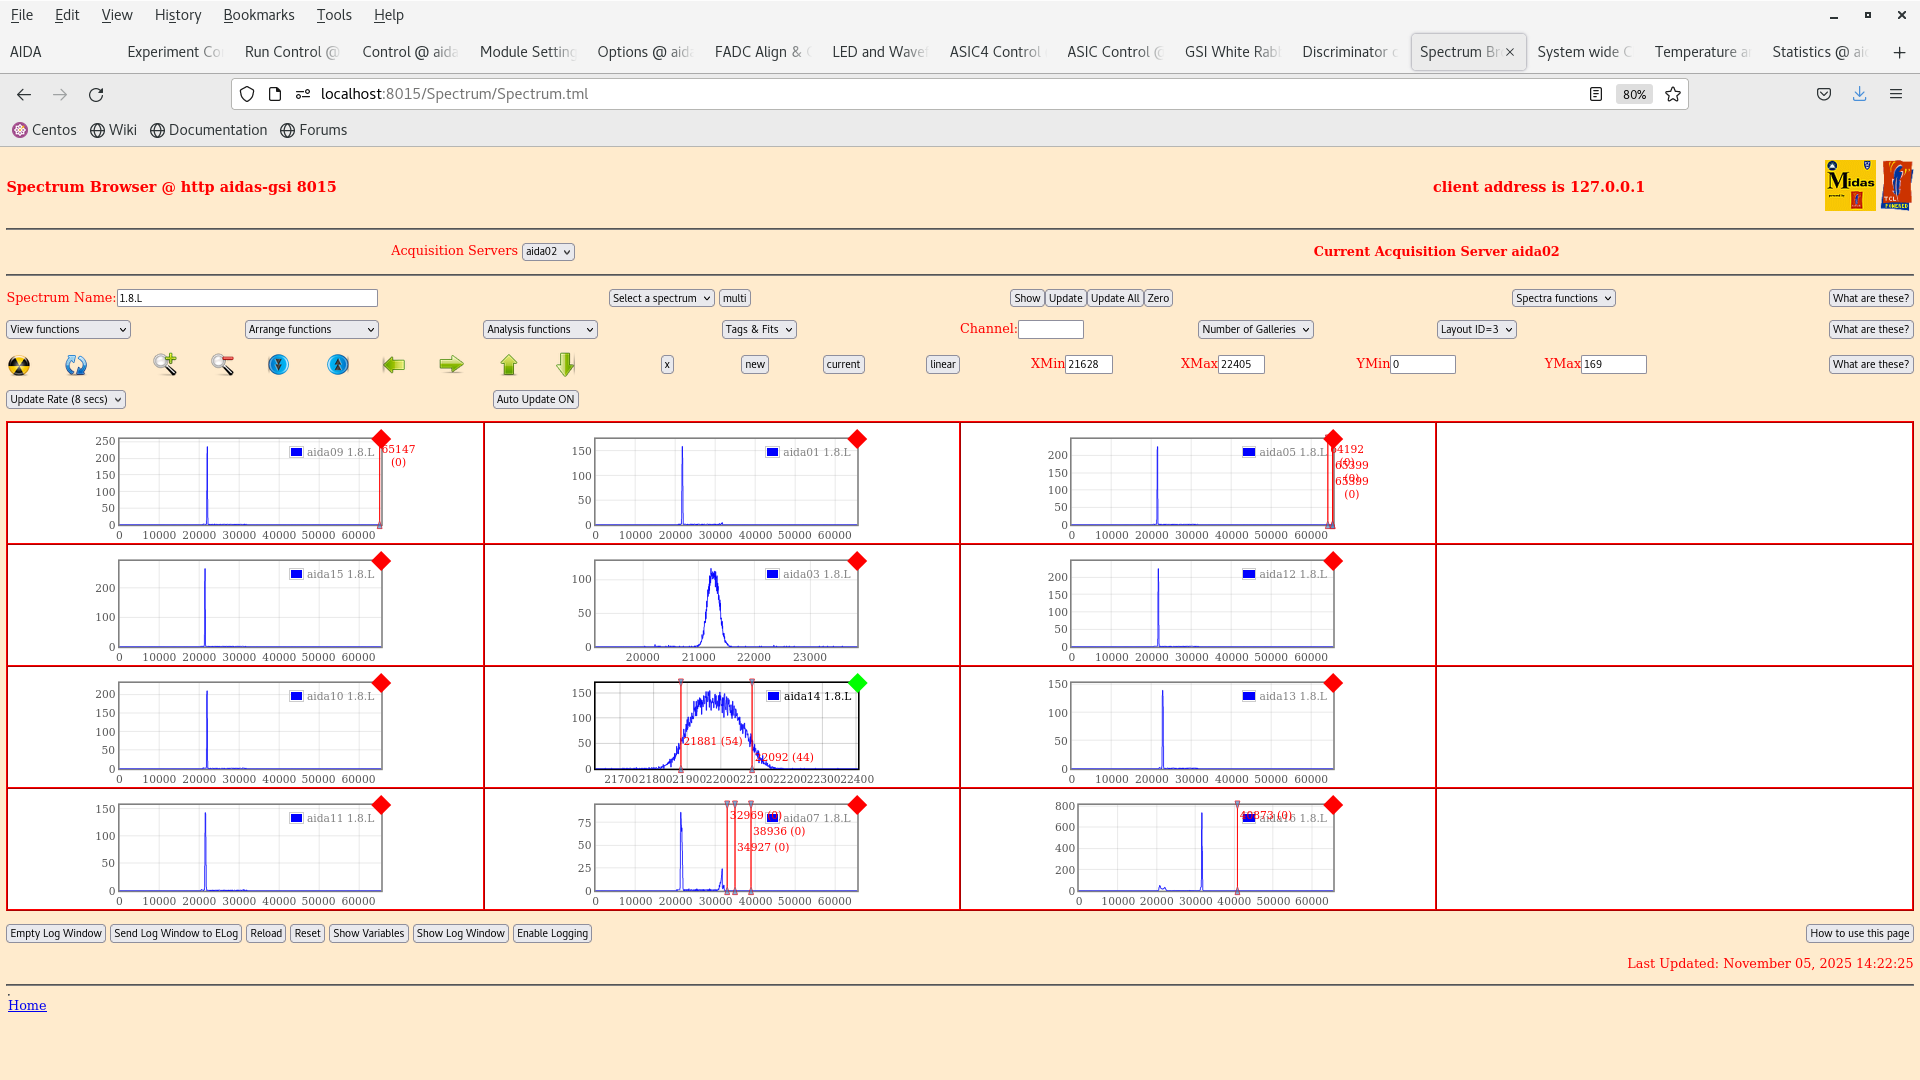
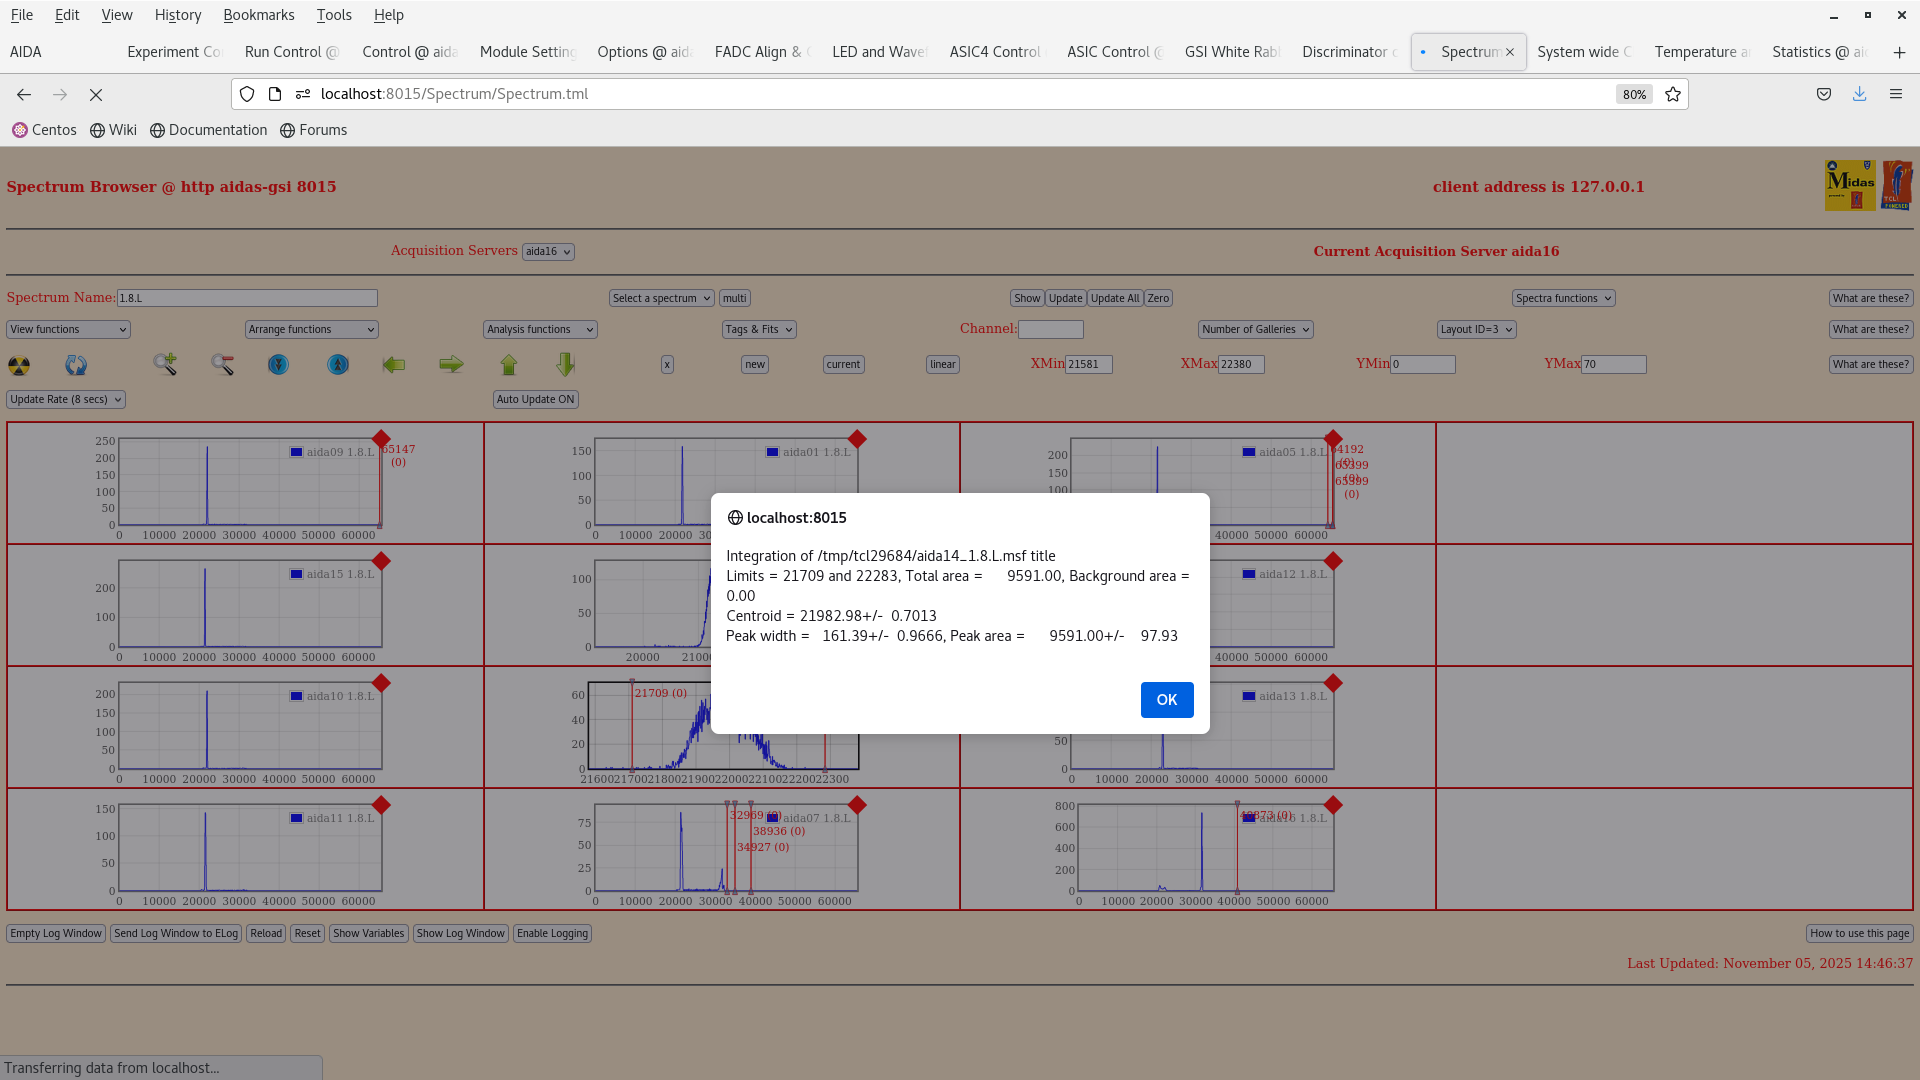
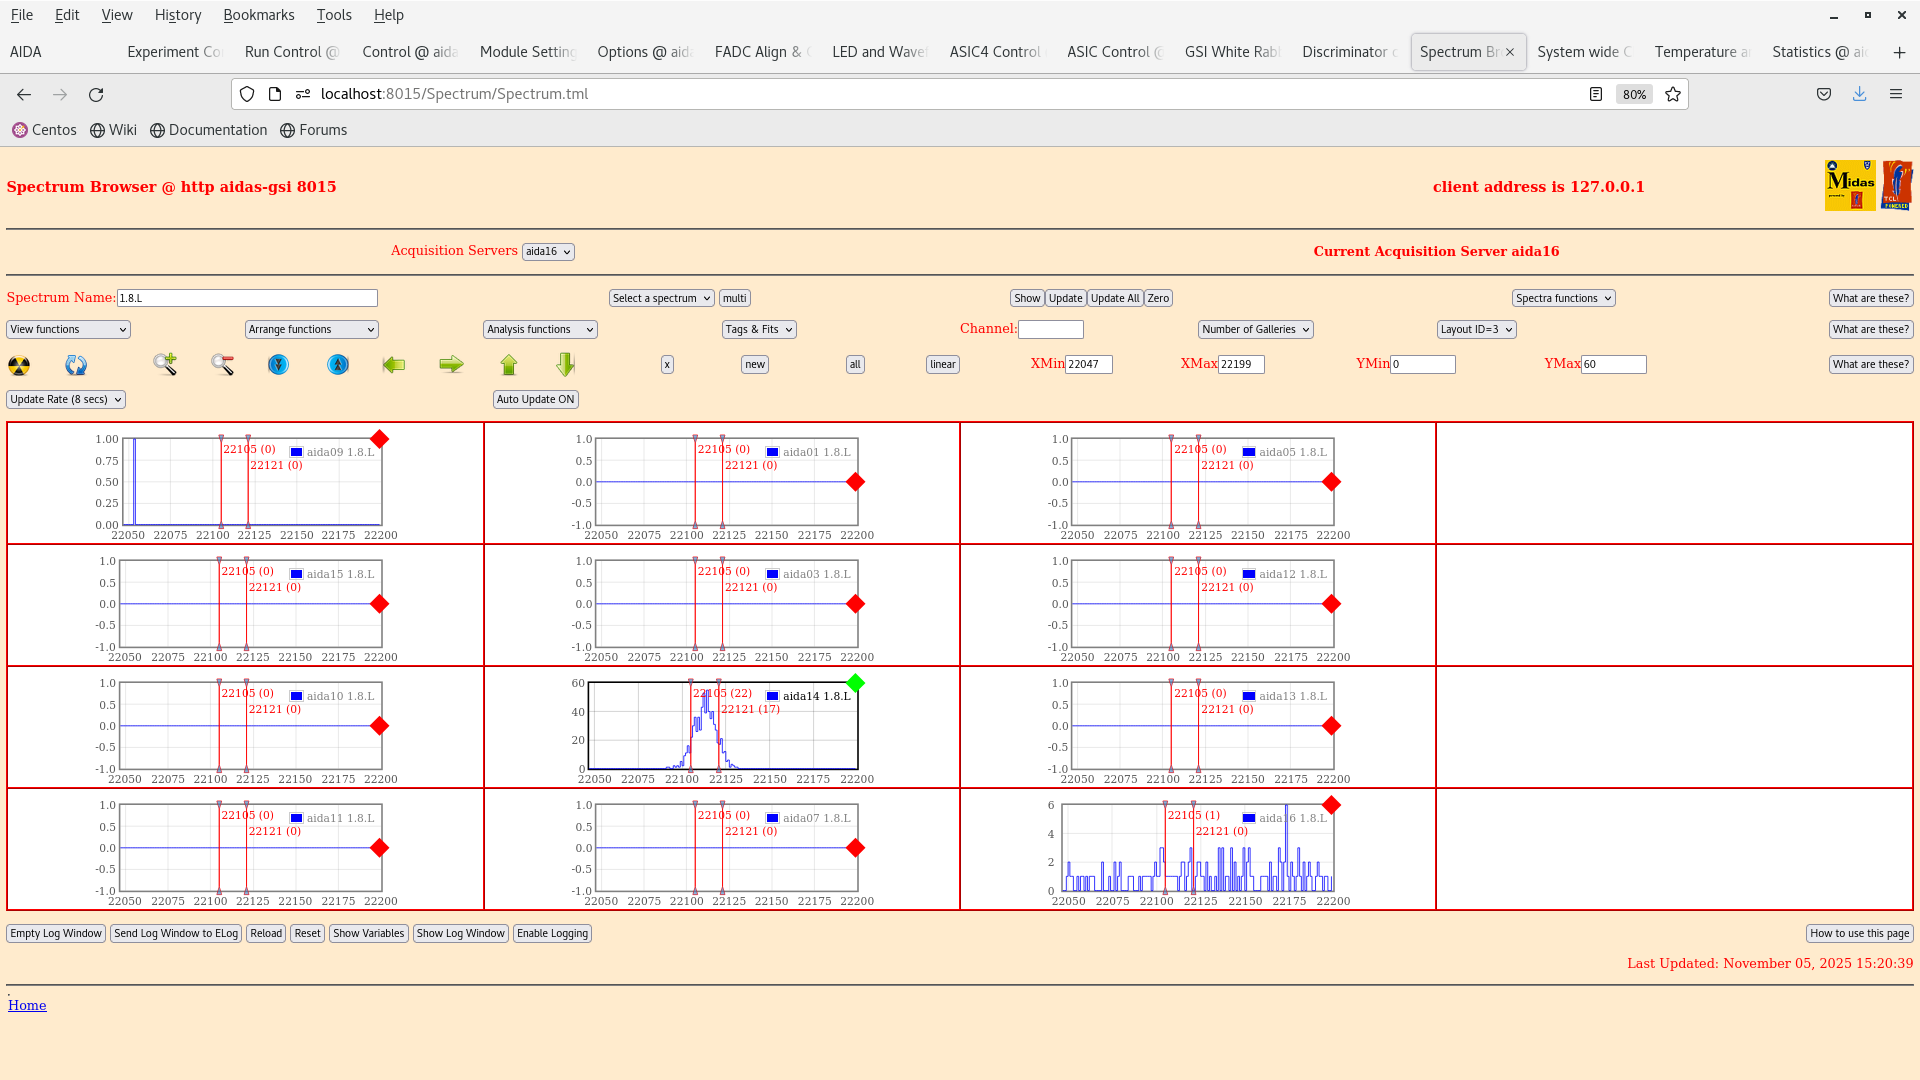
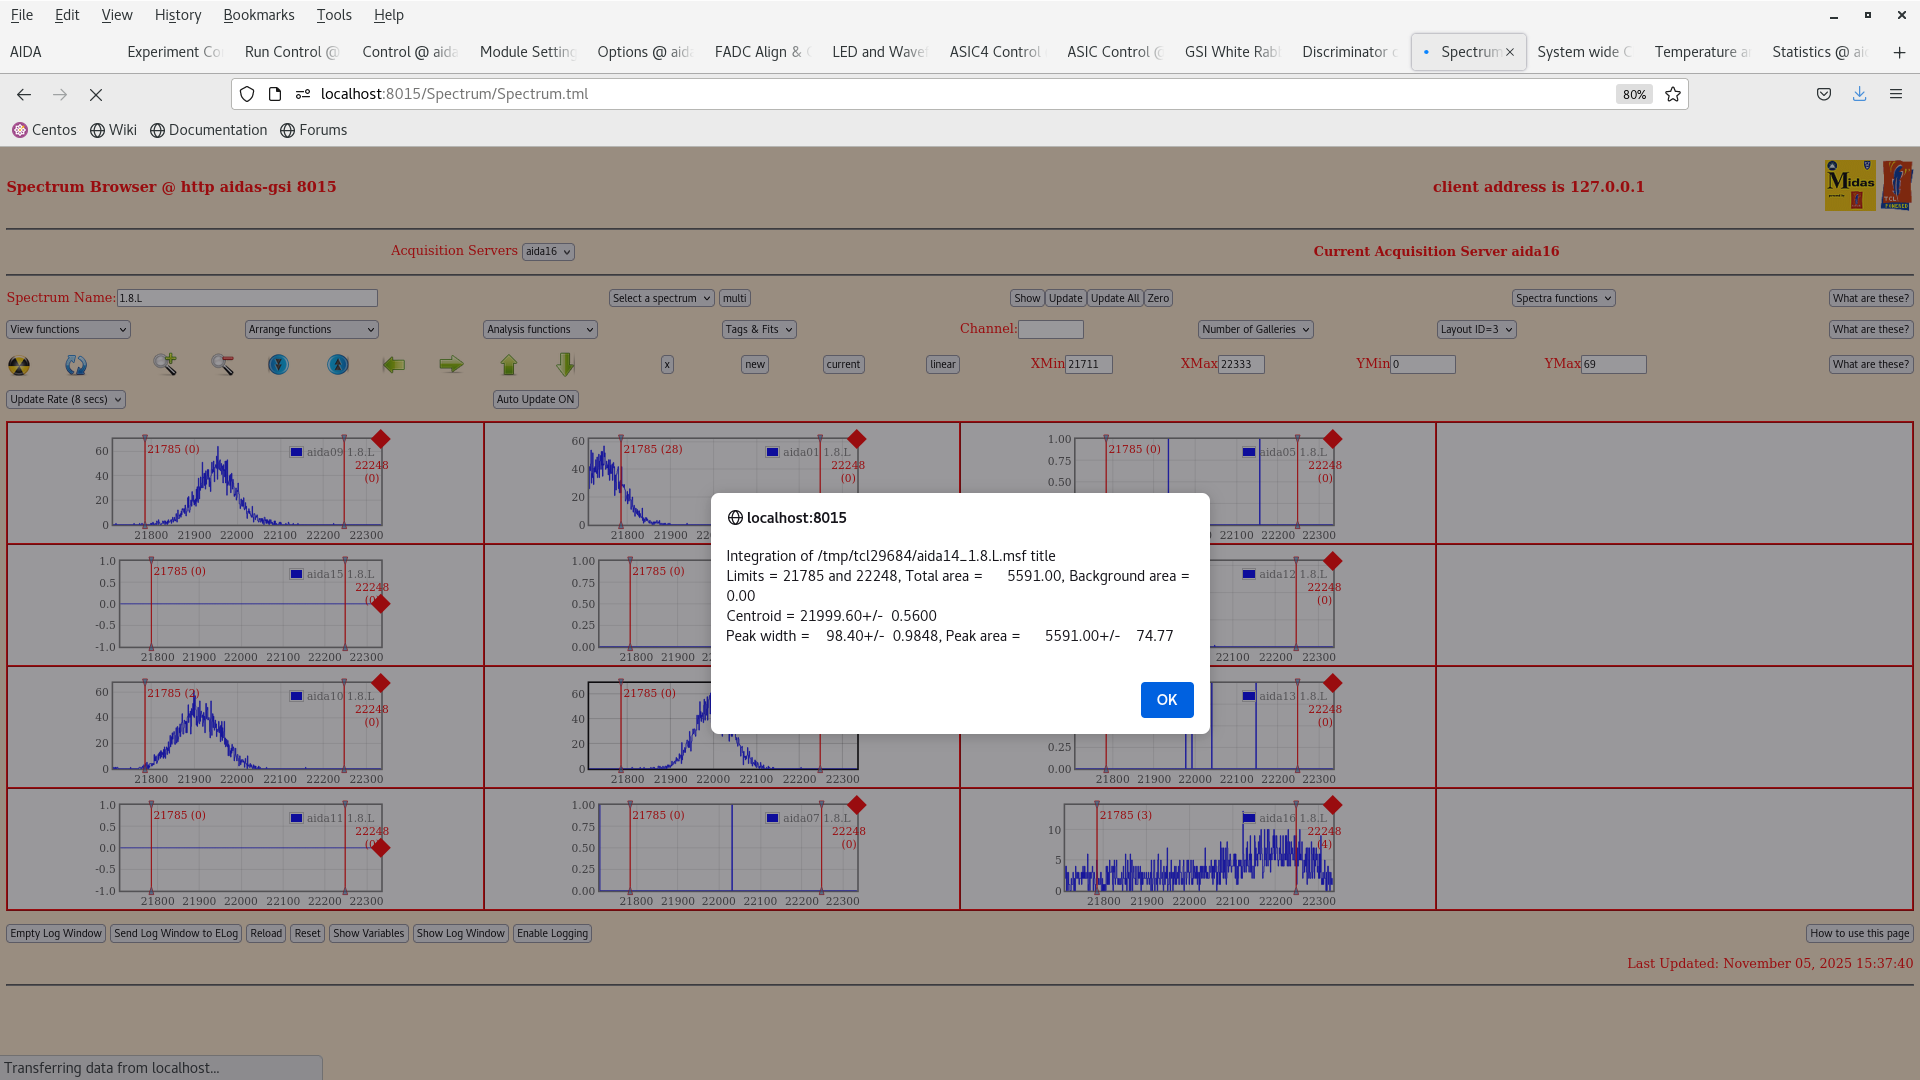
Peak threshold with 1V pulser measured at ~ 175 ADC channels. Attachment 3.

14:24 DAQ stopped and detector debiased. We are going to do the following:

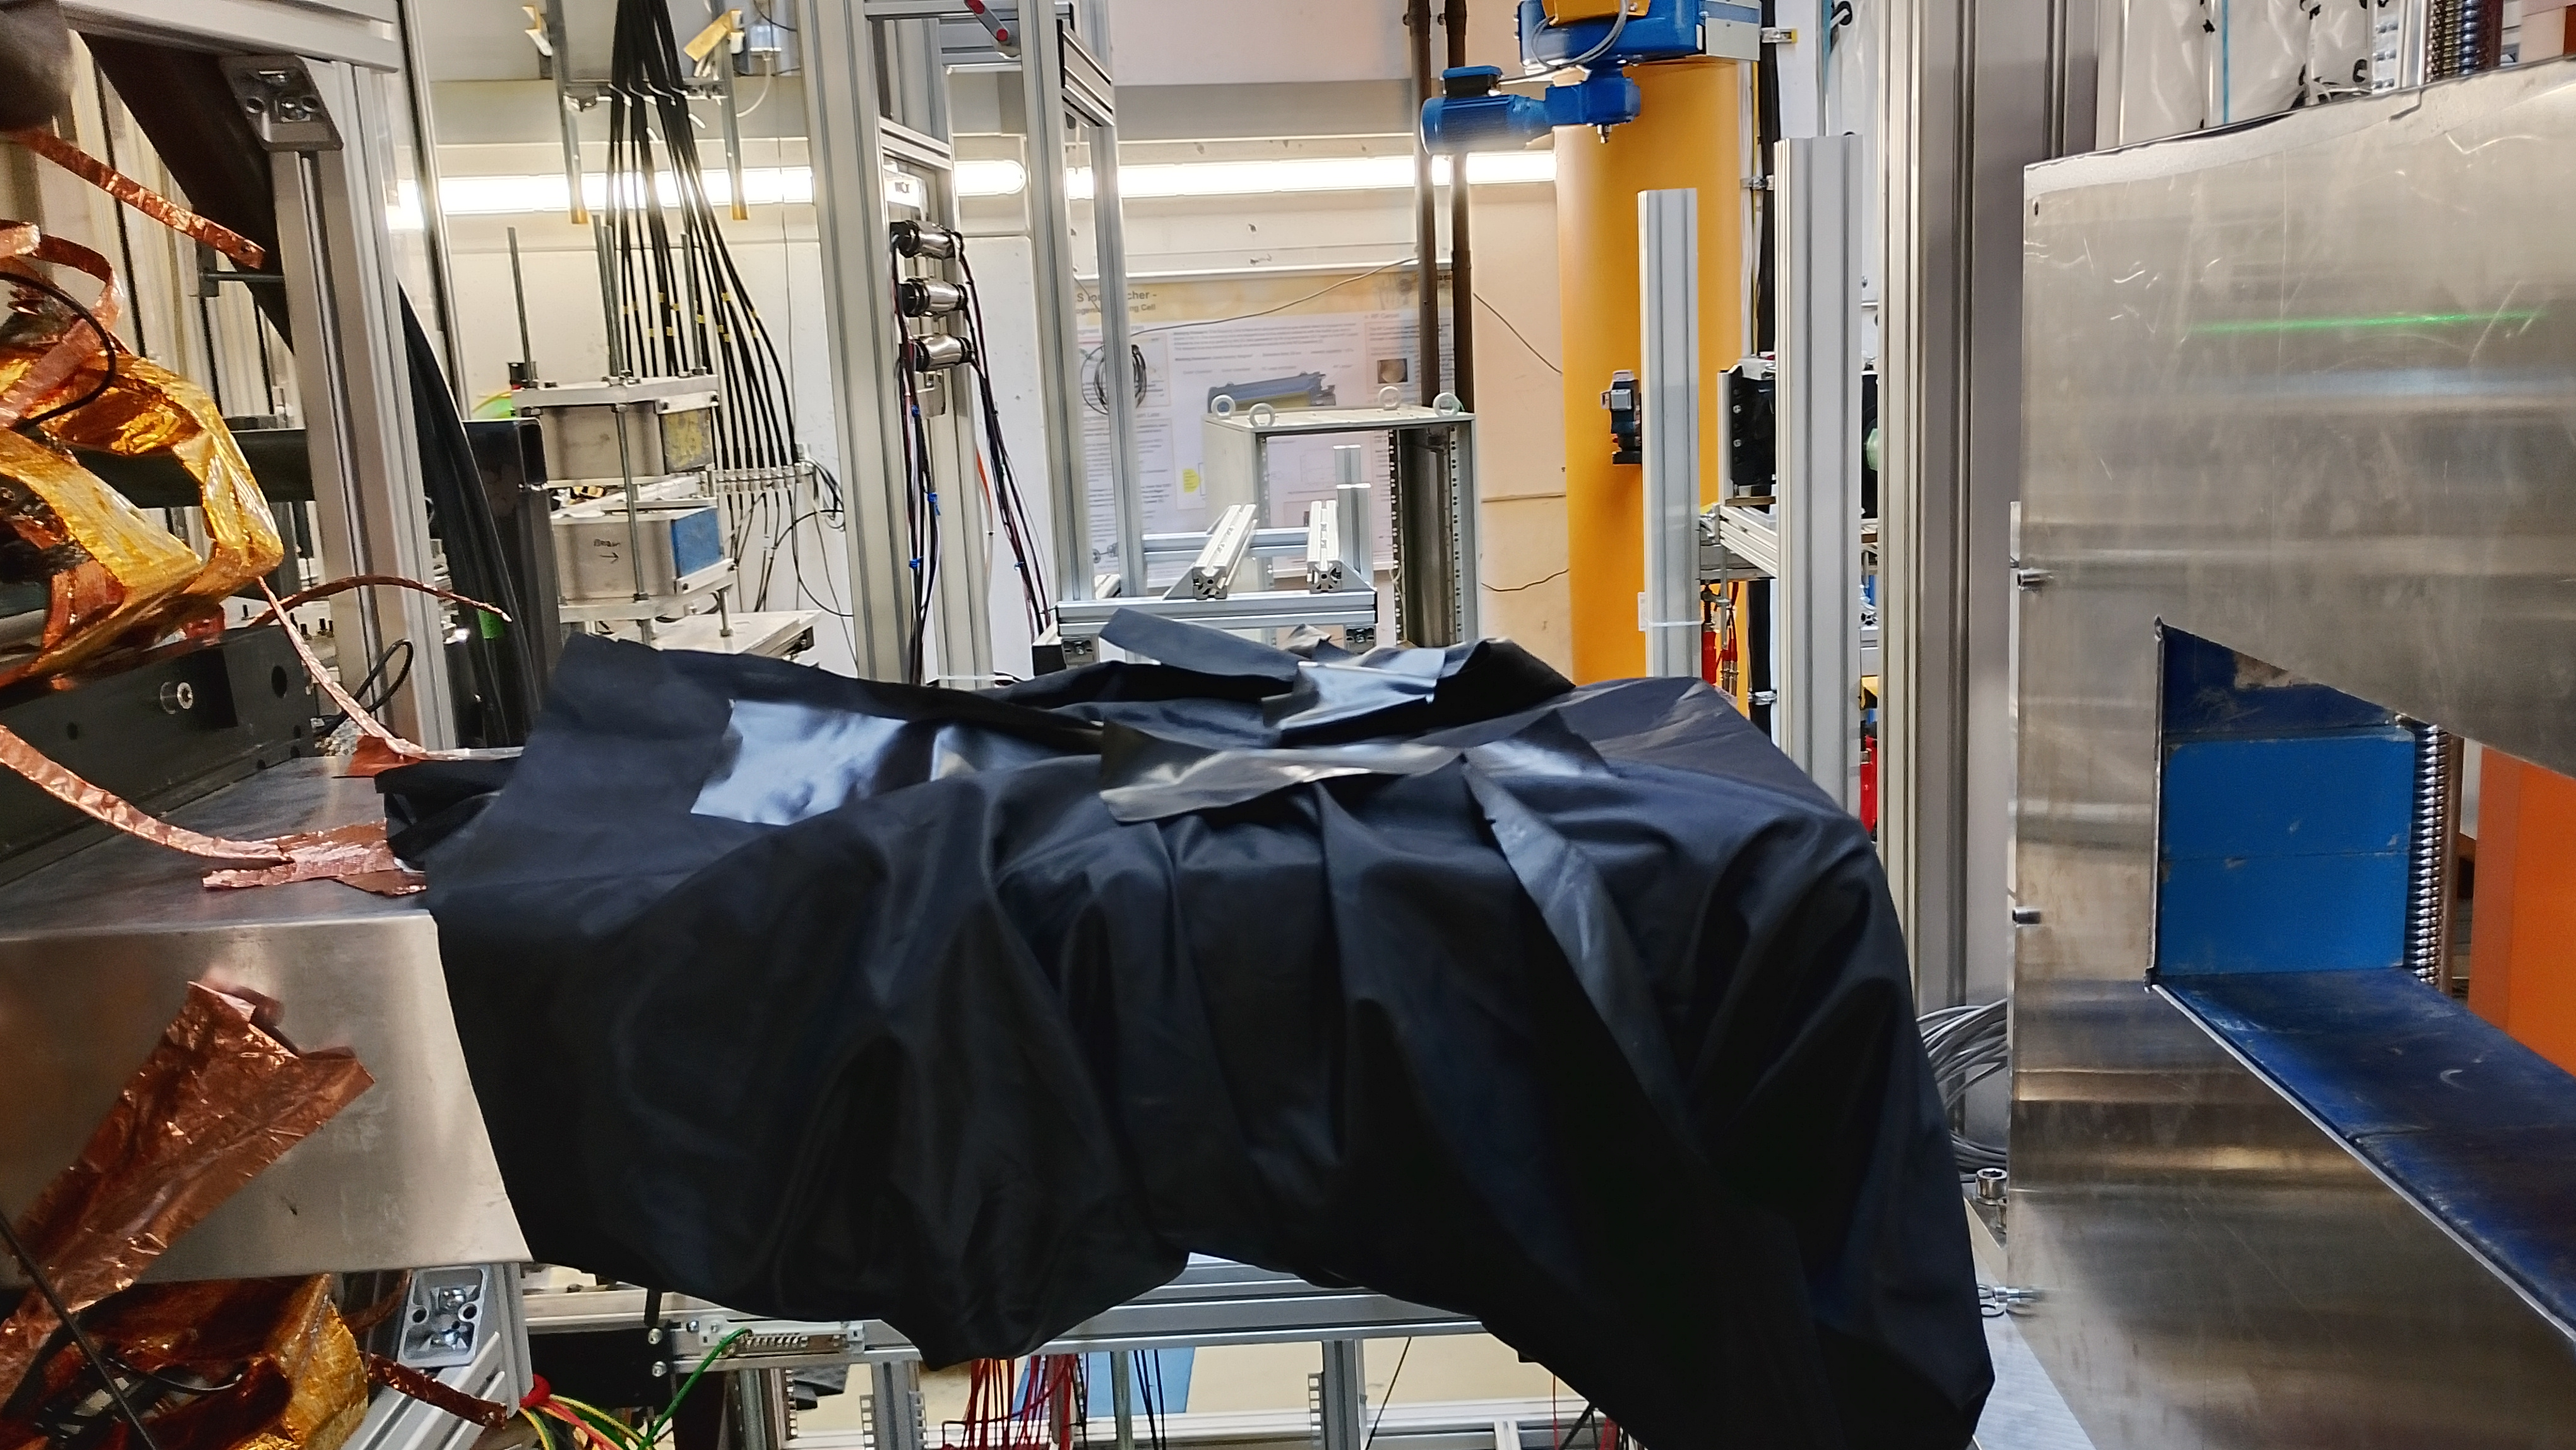
1. Cover the snout with a black cloth to check if it is light tight!
2. Disconnect the detector signal cable from the FEE64 adaptor card of aida14.

We put a black cloth cover over the snout, but pulser peak width remained the same ~161 ADC channel. Attachment 4,5.

We disconnected the cable from aida14 and the FWHM pf the pulser is ~15 ADC channels (as expected)

Wrapped the snout with more copper tape at the point where the PCB ground makes contact with the snout to ensure better contact, this seems to improve the FWHM to ~95 ADC channels
Attachment 1: Screenshot_from_2025-11-05_14-05-24.png
Screenshot_from_2025-11-05_14-05-24.png
Attachment 2: Screenshot_from_2025-11-05_14-05-14.png
Screenshot_from_2025-11-05_14-05-14.png
Attachment 3: Screenshot_from_2025-11-05_14-22-57.png
Screenshot_from_2025-11-05_14-22-57.png
Attachment 4: IMG_20251105_143017_hdr.jpg
IMG_20251105_143017_hdr.jpg
Attachment 5: Screenshot_from_2025-11-05_14-46-44.png
Screenshot_from_2025-11-05_14-46-44.png
Attachment 6: Screenshot_from_2025-11-05_15-20-45.png
Screenshot_from_2025-11-05_15-20-45.png
Attachment 7: Screenshot_from_2025-11-05_15-37-47.png
Screenshot_from_2025-11-05_15-37-47.png
Attachment 8: IMG_20251105_154023_hdr.jpg
IMG_20251105_154023_hdr.jpg
  99   Wed Nov 20 20:36:14 2019 CA, CB, DK, NH20/21 November Night Shift
21:35 (NH) - A few merger timestamp errors were appearing - Decided to powercycle all FEE64s, all checks OK.
 No Screenshot due to forgetting before I closed merger 
 FEEs were often not stopping properly and needing merger reset as well.

Beam Plan:

40Ar 300 MeV/u Primary Beam
and/or
34Si Fragment from Ar

22:45

FEES were restart near these timestamps in the TapeData, evidently
-rw-rw-r--.  1 npg  npg  2.0G Nov 20 21:17 R1_361
-rw-rw-r--.  1 npg  npg  2.0G Nov 20 21:36 R1_362

Run number was kept the same (Tape Server was not stopped @ FEE restart?)

All system wide checks are okay (except of course the master clock fails)
Temps look okay (attachment 1, dated 21/Nov by mistake)
Leak currents all around 0.9 uA as before (attachment 2)
Stats are behaved. We don't have beam yet (attachment 3)
Merger and tape server happy (see attachment 4)
Data rate histos while beam is still off (see attachment 5)

==Nov 21==

0:00
TD noted that the data rates have gone up at some point (about double).  
Now we increased the slow comparator thresholds from 0xa to 0xb (data rate drops from 24 Mb/s to 16 Mb/s).
We increased it again from 0xb to 0xc, but near that time the beam was also turned on, and the data rate was about 25 Mb/s.

Beam was turned on near R1_472 or a bit earlier.

TD requested waveforms, but at the moment they are not appearing.  Will enable WFs after a condition change.

Beam seen in all three DSSSDs, see attachment 6.  Beam was turned off before I could get more screencaps.

Degrader change ... near R1_481

00:32 waveforms now enabled under Run Control.  They also appear to be enabled on ASIC1 undre LED and Waveform controls.  However, we are unable to see the waveforms in the relevant histograms.

00:44 3 g/cm^2 inserted R1_488

00:45 3.2 g/cm^2 degrader in R1_489.

1:00 Several degraders and combinations are being tested since last note.

1:10 It seems 1 g/cm^2 of energy loss is not accounted for by LISE++.  Trying to understand the reason.

1:28 Satisfied with a total degrader thickness of 2.6 g/cm^2 -- seems to calculate that fragments should implant mainly in DSSSD2?  Issue seems to be resolved updating the LISE++ file.
  Near R1_507

Can see the implant samples attached as #7 and #8

1:43 According to the stats, most of the beam energy is being deposited in DSSSD1.  See #9.
  Present beam burst repetition is around 0.1 Hz (each ~10 sec)

2:00 better example of stats histos (see #10)

2:45 tuning the FRS degraders (ones for RIB separation rather than AIDA implantation depth).

3:17 Just started fragments.  Disregard previous filenames with "34Si".  Finally no degrader in the FRS was needed to get Z separation.
  R1_559
  As the DAQs are not synchronized, a quick call to the BNC PB-5 pulser shifiting from 2 -> 50 -> 2 Hz was used to make a signal burst.
  S4 degrader is 5.2 g/cm^2

3:22 Updated biases in Google Sheets.

Having trouble seeing the fragments in the AIDA histograms.  Since we just started fragments, zero the histos.

3:35 Attachment 11, with 34Si fragments as Stats.  Difficult to click Update on the Rates at the right time.  
   From the beam monitors, fragments should be at around 3000 cps.

3:45 (Up to now, some optics tuning with slits, etc)

3:46 Optics settings accepted, AIDA at R1_572, accept this condition for data runs on ~34Si fragments.

3:47 Sent a pulser burst 2 -> 50 -> 2 Hz

3:50 zero histograms again.
   Temperatures attachment 12
   Biases attachment 13
   Statistics attachment 14
   Merger / Tape Server attachment 15

3:56   
   StatHistos attachment 16

4:09 FRS starts new run #56, AIDA R1_583.  Pulser 2-> 50 -> 2 Hz

4:56 Stat histograms in attachment 17.  Not zeroed since noted at 3:50
Attachment 1: 21-11-temps.png
21-11-temps.png
Attachment 2: 20-11-biases.png
20-11-biases.png
Attachment 3: 20-11-stats.png
20-11-stats.png
Attachment 4: 20-11-merger-ts.png
20-11-merger-ts.png
Attachment 5: 20-11-statshistos.png
20-11-statshistos.png
Attachment 6: 21-11-layout5histos.png
21-11-layout5histos.png
Attachment 7: 34si-implants-130-1.png
34si-implants-130-1.png
Attachment 8: 34si-implants-130-2.png
34si-implants-130-2.png
Attachment 9: 34si-stats-histos.png
34si-stats-histos.png
Attachment 10: stats-histos-2am.png
stats-histos-2am.png
Attachment 11: 34si-fragments-stats.png
34si-fragments-stats.png
Attachment 12: temperatures-fragments.png
temperatures-fragments.png
Attachment 13: biases-fragments.png
biases-fragments.png
Attachment 14: stats-fragments.png
stats-fragments.png
Attachment 15: merger-tapeserver-fragments.png
merger-tapeserver-fragments.png
Attachment 16: stathistos-fragments.png
stathistos-fragments.png
Attachment 17: stathistos-5am.png
stathistos-5am.png
  603   Wed Apr 24 18:44:05 2024 PP19:30 checks

All seems smooth.

Screenshots attached.

Attachment 1: Screenshot_from_2024-04-24_19-34-58.png
Screenshot_from_2024-04-24_19-34-58.png
Attachment 2: Screenshot_from_2024-04-24_19-37-12.png
Screenshot_from_2024-04-24_19-37-12.png
Attachment 3: Screenshot_from_2024-04-24_19-40-36.png
Screenshot_from_2024-04-24_19-40-36.png
Attachment 4: Screenshot_from_2024-04-24_19-41-39.png
Screenshot_from_2024-04-24_19-41-39.png
Attachment 5: Screenshot_from_2024-04-24_19-42-20.png
Screenshot_from_2024-04-24_19-42-20.png
Attachment 6: Screenshot_from_2024-04-24_19-42-53.png
Screenshot_from_2024-04-24_19-42-53.png
Attachment 7: Screenshot_from_2024-04-24_19-43-21.png
Screenshot_from_2024-04-24_19-43-21.png
Attachment 8: Screenshot_from_2024-04-24_19-43-41.png
Screenshot_from_2024-04-24_19-43-41.png
  98   Tue Nov 19 21:22:06 2019 CA, CB, DK, NH19/20 November 2019 - overnight shift
19 November

Waiting for 40Ar beam to be delivered for tests.
Objective today is to assess degrader thickness suitable to stop 40Ar in 2nd DSSD layer.
Energy expected at 300 MeV/A, around 1E3-4 beam intensity - to be determined.

Tomorrow fragments could be expected.

DSSD / FEE64 pairing as follows

DSSD3 (most downstream): FEEs 9,10,11,12
DSSD2 (middle): FEEs 5,6,7,8
DSSD1 (most upstream): FEEs 1,2,3,4
+plastic scintillator furthest upstream

New AIDA Google spreadsheet created with leakage current, to monitor them during beamtime. First entry added. Bias attached.
https://docs.google.com/spreadsheets/d/12hgbrywB10hGsKt5uc2HnLfZymh8_uvM6cEASbbqnBE/edit#gid=813167023

DESPEC platform has already been moved. No effect on rates - see attached. FEE1 is missing one channel. FEE9, 10 noisy as expected. See attached.


System wide checks *all OK* except
Master clock failed (normal)
ADC calibration fails on 6 and 12. Recalibrated via FADC Align. All OK now.

MBS transfer OK. See attached.

Good event statistics OK. See attached.

FEE64 temperatures OK. See attached.

Merger and data rate OK. See attached.

Waiting for beam.


20 November

01:07 - Still no beam. 

System wide checks OK. 
Stats OK. 
Temps OK. 
MBS OK. 
Merger and data rate OK.


02:35  - Beam is expected soon
Tried enabling writing data to disk. Merger crashed. FEE64 stopped responding to commands.
Reset Merger. FEE64 now respond to commands.
Tried enabling writing to disk again. Merger crashed once more. Reset merger.
Reset Tape Server interface. Now writing to disk.

No data currently being sent to MBS, but operators say they "are adding a new detector". May be normal.

DAQ & Merger going OK. Writing to Nov19/R1

No beam yet.

Temperatures OK
System wide checks OK
Stats OK. See attached.
MBS not working.
Merger and data rate OK. See attached.

~02:48 Beam on. 40Ar. 300 MeV/A, 500 pps. Degrader settings unclear.

03:54 Degrader settings have been changing between 4.5, 1 and 6 ug/cm2
Currently on 6 g/cm2.
AIDA seen through MBS shows no HE on detector 3, and Det 1 and 2 show no counts on positive y (FEE6 and 1). That is not the case from MIDAS.

04:30 The aim of the tests above was to have no 40Ar at all in DSSD3. It does not appear that 6 g/cm2 is sufficient, as we still see events. The reduction between 1 & 2 vs. 3 is about a factor of 2-10 depending on ADC channel. See attached.

~04:30 Moved to 6.2 g/cm2 degrader. See attached.

~04:45 Moved to 5.8 g/cm2. See attached.

~05:09 Moved to 6.4 g/cm2. See attached.

05:31 High energy channel spectra (1.8.H) for all FEE64 w/ 6.4 g/cm2 degrader - See attachments 13 & 14

05:38: Moved to 1.0 g/cm2. See attached. Difference is not huge which may indicate these spectra are misleading, as partly expected. A more detailed analysis will be carried out off line.

06:00: Beam stopped. ~R77. AIDA keeps running background over the day. Beam should restart around 11 pm later today.
Attachment 1: Bias2235.png
Bias2235.png
Attachment 2: Rates2236.png
Rates2236.png
Attachment 3: 19112241MBS.png
19112241MBS.png
Attachment 4: 19112242Stats.png
19112242Stats.png
Attachment 5: 19112244Temperatures.png
19112244Temperatures.png
Attachment 6: 19112246Merger.png
19112246Merger.png
Attachment 7: 20110239.png
20110239.png
Attachment 8: 20110240DataTransfer.png
20110240DataTransfer.png
Attachment 9: 6gdegrader.png
6gdegrader.png
Attachment 10: 6.2degrader.png
6.2degrader.png
Attachment 11: 5.8degrader.png
5.8degrader.png
Attachment 12: 6.4degrader.png
6.4degrader.png
Attachment 13: 18h_0530.png
18h_0530.png
Attachment 14: 18H_0528.png
18H_0528.png
Attachment 15: 1gcm2degrader.png
1gcm2degrader.png
  330   Wed May 19 09:12:52 2021 Muneerah, Betool, LS17th May 00:00-12:00
Auther: Muneerah and Betool
02:00 The dead time have been checked every 30 min from the start of the shift, it seemes Ok
      Statistics ok - 210517_0202_Stats
      Temperatures ok - 210517_0202_Temp
      Bias and leakage ok - 210517_0200_Bias 
02:05 System wide checks:
Clock status test result: Passed 16, Failed 0

Understand status as follows
Status bit 3 : firmware PLL that creates clocks from external clock not locked
Status bit 2 : always logic '1' 
Status bit 1 : LMK3200(2) PLL and clock distribution chip not locked to external clock
Status bit 0 : LMK3200(1) PLL and clock distribution chip not locked to external clock
If all these bits are not set then the operation of the firmware is unreliable

FEE64 module aida02 failed
FEE64 module aida03 failed
FEE64 module aida06 failed
FEE64 module aida10 failed
Calibration test result: Passed 12, Failed 4

If any modules fail calibration , check the clock status and open the FADC Align and Control browser page to rerun calibration for that module

		 Base 		Current 	Difference
aida05 fault 	 0x1552 : 	 0x155d : 	 11  
White Rabbit error counter test result: Passed 15, Failed 1

Understand the status reports as follows:-
Status bit 3 : White Rabbit decoder detected an error in the received data
Status bit 2 : Firmware registered WR error, no reload of Timestamp
Status bit 0 : White Rabbit decoder reports uncertain of Timestamp information from WR

	
			 Base 		Current 		Difference
aida05 fault 	 0x0 : 	 0x2 : 	 2  
FPGA Timestamp error counter test result: Passed 15, Failed 1
If any of these counts are reported as in error
The ASIC readout system has detected a timeslip.
That is the timestamp read from the time FIFO is not younger than the last

Returned 0 0 0 0 0 0 0 0 0 0 0 0 0 0 0 0  
Mem(KB) :	4	8	16	32	64	128	256	512	1k	2k	4k
aida01 :      5      8      3      3      3      5      2      2      2      3      7   : 39460
aida02 :     22      4      5      0      3      2      2      3      2      3      7   : 39560
aida03 :     21     10      2      1      1      3      2      4      2      3      7   : 40100
aida04 :     18      7      2      0      3      3      3      2      2      3      7   : 39392
aida05 :     16      6      5      1      2      4      3      2      2      3      7   : 39520
aida06 :     18      6      6      2      2      2      2      3      2      3      7   : 39576
aida07 :     12      8      6      1      2      3      1      3      2      3      7   : 39408
aida08 :     13     11      4      0      1      3      3      2      2      3      7   : 39308
aida09 :     10      8      4      2      3      4      2      3      2      3      7   : 39848
aida10 :     16      8      2      1      2      4      2      3      1      4      7   : 40768
aida11 :     26     10      2      2      1      2      2      3      2      3      7   : 39512
aida12 :     16      9      2      1      2      4      2      2      2      3      7   : 39240
aida13 :     15      9      3      2      2      4      2      2      2      3      7   : 39284
aida14 :     25     10      2      3      3      3      2      3      2      3      7   : 39796
aida15 :      4      2      2      1      1      3      2      2      2      3      7   : 38944
aida16 :     16      7      3      3      1      3      3      2      2      3      7   : 39368

04:00   Statistics ok - 210517_0403_Stats
        Temperatures ok - 210517_0403_Temp
        Bias and leakage ok - 210517_0400_Bias 
04:05 System wide checks:
      Clock status test result: Passed 16, Failed 0

Understand status as follows
Status bit 3 : firmware PLL that creates clocks from external clock not locked
Status bit 2 : always logic '1' 
Status bit 1 : LMK3200(2) PLL and clock distribution chip not locked to external clock
Status bit 0 : LMK3200(1) PLL and clock distribution chip not locked to external clock
If all these bits are not set then the operation of the firmware is unreliable

FEE64 module aida02 failed
FEE64 module aida03 failed
FEE64 module aida06 failed
FEE64 module aida10 failed
Calibration test result: Passed 12, Failed 4

If any modules fail calibration , check the clock status and open the FADC Align and Control browser page to rerun calibration for that module


		 Base 		Current 	Difference
aida05 fault 	 0x1552 : 	 0x1560 : 	 14  
White Rabbit error counter test result: Passed 15, Failed 1

Understand the status reports as follows:-
Status bit 3 : White Rabbit decoder detected an error in the received data
Status bit 2 : Firmware registered WR error, no reload of Timestamp
Status bit 0 : White Rabbit decoder reports uncertain of Timestamp information from WR

	
			 Base 		Current 		Difference
aida05 fault 	 0x0 : 	 0x2 : 	 2  
FPGA Timestamp error counter test result: Passed 15, Failed 1
If any of these counts are reported as in error
The ASIC readout system has detected a timeslip.
That is the timestamp read from the time FIFO is not younger than the last

	
Returned 0 0 0 0 0 0 0 0 0 0 0 0 0 0 0 0  
Mem(KB) :	4	8	16	32	64	128	256	512	1k	2k	4k
aida01 :     15      7      5      2      3      5      2      2      2      3      7   : 39492
aida02 :     23      6      7      2      1      3      2      3      2      3      7   : 39676
aida03 :     17      9      3      2      0      3      2      3      2      3      7   : 39548
aida04 :     16      4      1      2      1      3      3      3      2      3      7   : 39792
aida05 :     22      7      3      3      1      4      3      3      2      3      7   : 40032
aida06 :     18      6      7      3      1      3      2      3      2      3      7   : 39688
aida07 :     18      7      4      1      2      4      1      4      2      3      7   : 40032
aida08 :     19      5      4      1      1      3      3      3      2      3      7   : 39828
aida09 :     10      6      7      1      3      4      2      2      2      3      7   : 39336
aida10 :     12     10      2      3      1      4      2      3      1      4      7   : 40768
aida11 :     10      9      4      3      2      1      2      3      2      3      7   : 39440
aida12 :      8      7      6      1      2      4      2      3      2      3      7   : 39768
aida13 :     11      2      6      1      2      3      2      3      2      3      7   : 39612
aida14 :     27      7      4      2      3      3      2      3      2      3      7   : 39780
aida15 :      4      2      3      1      1      3      2      2      2      3      7   : 38960
aida16 :     18      8      4      2      1      4      2      2      2      3      7   : 39240


06:27 aida07 has dropped out and lost connection with the merger. Powercycling AIDA
06:48 Restarted system but the noise was extremely high. Equivalent to yesterday 15:00. Restarting again.
07:01 it is working fine.
07:40 Screen shots after the restart
 	Statistics ok - 210517_0742_Stats
        Temperatures ok - 210517_0743_Temp
        Bias and leakage ok - 210517_0740_Bias 

System wide checks

	
FEE64 module aida06 global clocks failed, 6
 Clock status test result: Passed 15, Failed 1

Understand status as follows
Status bit 3 : firmware PLL that creates clocks from external clock not locked
Status bit 2 : always logic '1' 
Status bit 1 : LMK3200(2) PLL and clock distribution chip not locked to external clock
Status bit 0 : LMK3200(1) PLL and clock distribution chip not locked to external clock
If all these bits are not set then the operation of the firmware is unreliable

	
FEE64 module aida01 failed
FEE64 module aida02 failed
FEE64 module aida03 failed
FEE64 module aida04 failed
FEE64 module aida05 failed
FEE64 module aida06 failed
FEE64 module aida07 failed
FEE64 module aida08 failed
FEE64 module aida09 failed
FEE64 module aida10 failed
FEE64 module aida11 failed
FEE64 module aida12 failed
FEE64 module aida13 failed
FEE64 module aida14 failed
FEE64 module aida15 failed
FEE64 module aida16 failed
Calibration test result: Passed 0, Failed 16

If any modules fail calibration , check the clock status and open the FADC Align and Control browser page to rerun calibration for that module

	
		 Base 		Current 	Difference
aida05 fault 	 0x61da : 	 0x61dd : 	 3  
White Rabbit error counter test result: Passed 15, Failed 1

Understand the status reports as follows:-
Status bit 3 : White Rabbit decoder detected an error in the received data
Status bit 2 : Firmware registered WR error, no reload of Timestamp
Status bit 0 : White Rabbit decoder reports uncertain of Timestamp information from WR


FPGA Timestamp error counter test result: Passed 16, Failed 0
If any of these counts are reported as in error
The ASIC readout system has detected a timeslip.
That is the timestamp read from the time FIFO is not younger than the last


Returned 0 0 0 0 0 0 0 0 0 0 0 0 0 0 0 0  
Mem(KB) :	4	8	16	32	64	128	256	512	1k	2k	4k
aida01 :     20      6      3      1      1      3      1      3      3      3      7   : 40336
aida02 :     11      6      0      1      1      5      2      4      2      3      7   : 40252
aida03 :      0      5      2      3      3      3      3      4      2      3      7   : 40424
aida04 :      2      4      2      1      2      4      3      3      2      3      7   : 39912
aida05 :     11      7      5      1      2      2      4      2      3      3      7   : 40532
aida06 :     20      6      0      2      3      2      1      3      3      3      7   : 40320
aida07 :     15      5      1      2      2      3      2      2      3      3      7   : 40116
aida08 :      2      3      4      1      3      3      2      2      3      3      7   : 40128
aida09 :     18      5      1      3      2      4      2      2      3      3      7   : 40288
aida10 :     11      6      3      4      2      3      3      2      2      4      7   : 41484
aida11 :      4      4      5      2      2      2      3      3      2      3      7   : 39744
aida12 :     18      7      2      3      2      2      4      3      2      3      7   : 40064
aida13 :      2      2      1      3      0      3      2      4      2      3      7   : 39944
aida14 :     16      4      5      3      3      3      3      2      2      4      7   : 41552
aida15 :      9      3      1      1      2      3      2      3      3      3      7   : 40556
aida16 :     16      5      1      2      1      2      3      4      2      3      7   : 40184

Date:17/05/2021
Elog for shift: 08.00 to 12.00
Author: Lewis Sexton
Screenshots saved to: /tmp/Elog_210517_0800_1200

*****	08.30	*****

Checked R12_34 through analyser, dead time seems okay:

*** Timestamp elapsed time:      232.154 s
 FEE  elapsed dead time(s) elapsed idle time(s)
  0                0.021                0.000
  1                2.781                0.000
  2                0.849                0.000
  3                5.686                0.000
  4                0.000               25.816
  5                0.017                0.000
  6                0.177                0.000
  7                1.349                0.000
  8                1.791                0.000
  9                0.000               91.660
 10                6.194                0.000
 11                0.320                0.000
 12                1.425                0.000
 13                0.000               72.999
 14                0.052                0.000
 15                1.729                0.000
 16                0.000                0.000
 17                0.000                0.000
 18                0.000                0.000
 19                0.000                0.000
 20                0.000                0.000
 21                0.000                0.000
 22                0.000                0.000
 23                0.000                0.000
 24                0.000                0.000
 25                0.000                0.000
 26                0.000                0.000
 27                0.000                0.000
 28                0.000                0.000
 29                0.000                0.000
 30                0.000                0.000
 31                0.000                0.000
 32                0.000                0.000

Stats checked seem okay (0833_Stats.png)
Merger rate ~3M items/s
Tape server ~12 MB/s

*****	09.00	*****

Checked R12_48 through analyser, dead time seems okay:

*** Timestamp elapsed time:      170.459 s
 FEE  elapsed dead time(s) elapsed idle time(s)
  0                0.196                0.000
  1                6.294                0.000
  2                0.992                0.000
  3                8.944                0.000
  4                0.024                0.000
  5                0.001                0.000
  6                0.605                0.000
  7                2.096                0.000
  8                1.654                0.000
  9                0.000               31.395
 10                6.175                0.000
 11                2.524                0.000
 12                2.076                0.000
 13                0.000               10.337
 14                0.103                0.000
 15                2.203                0.000
 16                0.000                0.000
 17                0.000                0.000
 18                0.000                0.000
 19                0.000                0.000
 20                0.000                0.000
 21                0.000                0.000
 22                0.000                0.000
 23                0.000                0.000
 24                0.000                0.000
 25                0.000                0.000
 26                0.000                0.000
 27                0.000                0.000
 28                0.000                0.000
 29                0.000                0.000
 30                0.000                0.000
 31                0.000                0.000
 32                0.000                0.000

Stats checked seem okay (0902_Stats.png)

*****	09.30	*****

AIDA crash aida05 displaying 0 in stats
Power cycle performed with help of TD
Writing to R13 now
MBS relay restared
AIDA back up at 10.20

Ran analyser for R13_16

 *** Timestamp elapsed time:      168.059 s
 FEE  elapsed dead time(s) elapsed idle time(s)
  0                0.047                0.000
  1                2.282                0.000
  2                0.080                0.000
  3                0.806                0.000
  4                0.000                0.000
  5                0.260                0.000
  6                0.030                0.000
  7                1.471                0.000
  8               67.467                0.000
  9               80.552                0.000
 10                0.057                0.000
 11                0.000               11.671
 12                1.191                0.000
 13                0.080                0.000
 14                0.091                0.000
 15                0.202                0.000
 16                0.000                0.000
 17                0.000                0.000
 18                0.000                0.000
 19                0.000                0.000
 20                0.000                0.000
 21                0.000                0.000
 22                0.000                0.000
 23                0.000                0.000
 24                0.000                0.000
 25                0.000                0.000
 26                0.000                0.000
 27                0.000                0.000
 28                0.000                0.000
 29                0.000                0.000
 30                0.000                0.000
 31                0.000                0.000
 32                0.000                0.000

High deadtime in aida09 and aida10, changed slow comparator threshold to 0xe (previously 0xc)
Ran analyser for R13_21 for comparision

 *** Timestamp elapsed time:      149.082 s
 FEE  elapsed dead time(s) elapsed idle time(s)
  0                0.000                0.000
  1                3.580                0.000
  2                0.000                0.000
  3                2.800                0.000
  4                0.000                0.000
  5                0.514                0.000
  6                0.140                0.000
  7                1.372                0.000
  8               55.544                0.000
  9               66.588                0.000
 10                1.065                0.000
 11                0.000               10.010
 12                0.681                0.000
 13                0.044                0.000
 14                0.070                0.000
 15                0.400                0.000
 16                0.000                0.000
 17                0.000                0.000
 18                0.000                0.000
 19                0.000                0.000
 20                0.000                0.000
 21                0.000                0.000
 22                0.000                0.000
 23                0.000                0.000
 24                0.000                0.000
 25                0.000                0.000
 26                0.000                0.000
 27                0.000                0.000
 28                0.000                0.000
 29                0.000                0.000
 30                0.000                0.000
 31                0.000                0.000
 32                0.000                0.000

FEE temp slightly high in aida04, 0.44 above limit of 65 (FEETemps_1042.png)

Merger rate ~5M items/s
Tape server ~17 MB/s

Raised slow comparator in aida09 and aida10 to 0xf, analyse R13_26 for comparision

*** Timestamp elapsed time:      122.147 s
 FEE  elapsed dead time(s) elapsed idle time(s)
  0                0.027                0.000
  1               19.945                0.000
  2                0.601                0.000
  3               21.555                0.000
  4                0.042                0.000
  5                3.226                0.000
  6                1.211                0.000
  7                9.674                0.000
  8               52.817                0.000
  9               54.972                0.000
 10                1.848                0.000
 11                0.008                0.000
 12                2.034                0.000
 13                0.278                0.000
 14                0.018                0.000
 15                0.634                0.000
 16                0.000                0.000
 17                0.000                0.000
 18                0.000                0.000
 19                0.000                0.000
 20                0.000                0.000
 21                0.000                0.000
 22                0.000                0.000
 23                0.000                0.000
 24                0.000                0.000
 25                0.000                0.000
 26                0.000                0.000
 27                0.000                0.000
 28                0.000                0.000
 29                0.000                0.000
 30                0.000                0.000
 31                0.000                0.000
 32                0.000                0.000

high deatime now also seen in aida02 and aida04

Several powercycles performed as high rates after restart, analysis of R14_13 showed low deadtime for all FEEs
Back running as of 10.45
Analyser of R14_15 to double check

 *** Timestamp elapsed time:      205.006 s
 FEE  elapsed dead time(s) elapsed idle time(s)
  0                0.000               40.176
  1                0.438                0.000
  2                0.199                0.000
  3                2.927                0.000
  4                0.000              140.347
  5                1.282                0.000
  6                0.150                0.000
  7                2.097                0.000
  8                1.673                0.000
  9                0.000               87.749
 10                1.150                0.000
 11                0.489                0.000
 12                0.374                0.000
 13                0.048               20.995
 14                0.251                0.000
 15                2.441                0.000
 16                0.000                0.000
 17                0.000                0.000
 18                0.000                0.000
 19                0.000                0.000
 20                0.000                0.000
 21                0.000                0.000
 22                0.000                0.000
 23                0.000                0.000
 24                0.000                0.000
 25                0.000                0.000
 26                0.000                0.000
 27                0.000                0.000
 28                0.000                0.000
 29                0.000                0.000
 30                0.000                0.000
 31                0.000                0.000
 32                0.000                0.000


12:04 During access Sultan added an additional ground cable and also noted the bias cable going into FEE12 was loose. He pushed it in solidly and the rates appear to have dropped across the FEEs


12:52 Check FPGA Timestamp errors gives following error message:

Got the error Server Internal Error
while trying to obtain /AIDA/Check/Check.tml.
can't read "TS_Base_Collected": no such variable while executing "if { $TS_Base_Collected == 0 } { collect_TS_Base }" (procedure "do_TS_errors" line 8) invoked from within "do_TS_errors " ("TSERRORS" arm line 1) invoked from within "switch -glob $w { RESET {set started 0} CLEAR {EmptyLog} ELOG {PrintLog} ..." (procedure "do_click" line 23) invoked from within "do_click" invoked from within "if {$started != 0} { variable JS "" variable LogFlag if {$LogFlag == 1} {InsertLog "Last Updated: [clock format [clock seconds] -form..." (file "Check.tcl" line 8) invoked from within "source Check.tcl" (in namespace eval "::Check" script line 6) invoked from within "namespace eval Check { global env source [file join $env(MIDASBASE) TclHttpd tcl Common common.tcl] source [file join $env(MIDASB..." invoked from within "subst { [Doc_Dynamic] <! [global Httpd; upvar #0 Httpd[set Httpd(currentSocket)] data; set ClientIPAddress $data(ipaddr); set MyInfo $data(self)] >..." ("uplevel" body line 1) invoked from within "uplevel #0 [list subst $script]" (procedure "SubstFile" line 12) invoked from within "SubstFile /home/npg/MIDAS_Releases/23Jan19/MIDAS_200119/TclHttpd/Html/AIDA/Check/Check.tml {}" ("uplevel" body line 1) invoked from within "uplevel 1 [list SubstFile $path $interp]" (procedure "Subst_File" line 7) invoked from within "Subst_File $template $interp" invoked from within "TemplateInstantiate $sock $path {} $suffix {} $Template(templateInterp)" (procedure "Doc_application/x-tcl-template" line 9) invoked from within "$cmd $path $suffix $sock" (procedure "Doc_Handle" line 20) invoked from within "Doc_Handle $prefix $path $suffix $sock" (procedure "DocDomain" line 44) invoked from within "DocDomain / /MIDAS/TclHttpd/Html sock8 AIDA/Check/Check.tml" ("eval" body line 1) invoked from within "eval $Url(command,$prefix) [list $sock $suffix]"
Tcl Call Trace
6: DocSubstSystemFile sock8 error 500 can't\ read\ &quot\;TS_Base_Collected&quot\;:\ no\ such\ variable\n\ \ \ \ while\ executing\n&quot\;if\ \{\ \$TS_Base_Collected\ ==\ 0\ \}\ \{\ collect_TS_Base\ \}&quot\;\n\ \ \ \ (procedure\ &quot\;do_TS_errors&quot\;\ line\ 8)\n\ \ \ \ invoked\ from\ within\n&quot\;do_TS_errors\ &quot\;\n\ \ \ \ (&quot\;TSERRORS&quot\;\ arm\ line\ 1)\n\ \ \ \ invoked\ from\ within\n&quot\;switch\ -glob\ \$w\ \{\n\n\ \ \ \ \ \ \ \ \ \ \ \ \ \ \ \ \ \ \ RESET\ \ \ \ \{set\ started\ 0\}\n\ \ \ \ \ \ \ \ \ \ \ \ \ \ \ \ \ \ \ CLEAR\ \ \ \ \{EmptyLog\}\n\ \ \ \ \ \ \ \ \ \ \ \ \ \ \ \ \ \ \ ELOG\ \ \ \ \ \{PrintLog\}\n\ \ \ \ \ \ \ \ \ ...&quot\;\n\ \ \ \ (procedure\ &quot\;do_click&quot\;\ line\ 23)\n\ \ \ \ invoked\ from\ within\n&quot\;do_click&quot\;\n\ \ \ \ invoked\ from\ within\n&quot\;if\ \{\$started\ !=\ 0\}\ \{\n\n\ \ \ \ \ variable\ JS\ &quot\;&quot\;\n\ \ \ \ \ variable\ LogFlag\n\n\ \ \ \ \ if\ \{\$LogFlag\ ==\ 1\}\ \{InsertLog\ &quot\;Last\ Updated:\ [clock\ format\ [clock\ seconds\]\ -form...&quot\;\n\ \ \ \ (file\ &quot\;Check.tcl&quot\;\ line\ 8)\n\ \ \ \ invoked\ from\ within\n&quot\;source\ Check.tcl&quot\;\n\ \ \ \ (in\ namespace\ eval\ &quot\;::Check&quot\;\ script\ line\ 6)\n\ \ \ \ invoked\ from\ within\n&quot\;namespace\ eval\ Check\ \{\n\ \ \ \ \ \ \ global\ env\n\ \ \ \ \ \ \ source\ [file\ join\ \$env(MIDASBASE)\ TclHttpd\ tcl\ Common\ common.tcl\]\n\ \ \ \ \ \ \ source\ [file\ join\ \$env(MIDASB...&quot\;\n\ \ \ \ invoked\ from\ within\n&quot\;subst\ \{\n\n[Doc_Dynamic\]\n\n\n&lt\;!\n[global\ Httpd\;\ upvar\ #0\ Httpd[set\ Httpd(currentSocket)\]\ data\;\ set\ ClientIPAddress\ \$data(ipaddr)\;\ set\ MyInfo\ \$data(self)\]\n&gt\;...&quot\;\n\ \ \ \ (&quot\;uplevel&quot\;\ body\ line\ 1)\n\ \ \ \ invoked\ from\ within\n&quot\;uplevel\ #0\ [list\ subst\ \$script\]&quot\;\n\ \ \ \ (procedure\ &quot\;SubstFile&quot\;\ line\ 12)\n\ \ \ \ invoked\ from\ within\n&quot\;SubstFile\ /home/npg/MIDAS_Releases/23Jan19/MIDAS_200119/TclHttpd/Html/AIDA/Check/Check.tml\ \{\}&quot\;\n\ \ \ \ (&quot\;uplevel&quot\;\ body\ line\ 1)\n\ \ \ \ invoked\ from\ within\n&quot\;uplevel\ 1\ [list\ SubstFile\ \$path\ \$interp\]&quot\;\n\ \ \ \ (procedure\ &quot\;Subst_File&quot\;\ line\ 7)\n\ \ \ \ invoked\ from\ within\n&quot\;Subst_File\ \$template\ \$interp&quot\;\n\ \ \ \ invoked\ from\ within\n&quot\;TemplateInstantiate\ \$sock\ \$path\ \{\}\ \$suffix\ \{\}\ \$Template(templateInterp)&quot\;\n\ \ \ \ (procedure\ &quot\;Doc_application/x-tcl-template&quot\;\ line\ 9)\n\ \ \ \ invoked\ from\ within\n&quot\;\$cmd\ \$path\ \$suffix\ \$sock&quot\;\n\ \ \ \ (procedure\ &quot\;Doc_Handle&quot\;\ line\ 20)\n\ \ \ \ invoked\ from\ within\n&quot\;Doc_Handle\ \$prefix\ \$path\ \$suffix\ \$sock&quot\;\n\ \ \ \ (procedure\ &quot\;DocDomain&quot\;\ line\ 44)\n\ \ \ \ invoked\ from\ within\n&quot\;DocDomain\ /\ /MIDAS/TclHttpd/Html\ sock8\ AIDA/Check/Check.tml&quot\;\n\ \ \ \ (&quot\;eval&quot\;\ body\ line\ 1)\n\ \ \ \ invoked\ from\ within\n&quot\;eval\ \$Url(command,\$prefix)\ [list\ \$sock\ \$suffix\]&quot\;
5: Doc_Error sock8 can't\ read\ \"TS_Base_Collected\":\ no\ such\ variable\n\ \ \ \ while\ executing\n\"if\ \{\ \$TS_Base_Collected\ ==\ 0\ \}\ \{\ collect_TS_Base\ \}\"\n\ \ \ \ (procedure\ \"do_TS_errors\"\ line\ 8)\n\ \ \ \ invoked\ from\ within\n\"do_TS_errors\ \"\n\ \ \ \ (\"TSERRORS\"\ arm\ line\ 1)\n\ \ \ \ invoked\ from\ within\n\"switch\ -glob\ \$w\ \{\n\n\ \ \ \ \ \ \ \ \ \ \ \ \ \ \ \ \ \ \ RESET\ \ \ \ \{set\ started\ 0\}\n\ \ \ \ \ \ \ \ \ \ \ \ \ \ \ \ \ \ \ CLEAR\ \ \ \ \{EmptyLog\}\n\ \ \ \ \ \ \ \ \ \ \ \ \ \ \ \ \ \ \ ELOG\ \ \ \ \ \{PrintLog\}\n\ \ \ \ \ \ \ \ \ ...\"\n\ \ \ \ (procedure\ \"do_click\"\ line\ 23)\n\ \ \ \ invoked\ from\ within\n\"do_click\"\n\ \ \ \ invoked\ from\ within\n\"if\ \{\$started\ !=\ 0\}\ \{\n\n\ \ \ \ \ variable\ JS\ \"\"\n\ \ \ \ \ variable\ LogFlag\n\n\ \ \ \ \ if\ \{\$LogFlag\ ==\ 1\}\ \{InsertLog\ \"Last\ Updated:\ [clock\ format\ [clock\ seconds\]\ -form...\"\n\ \ \ \ (file\ \"Check.tcl\"\ line\ 8)\n\ \ \ \ invoked\ from\ within\n\"source\ Check.tcl\"\n\ \ \ \ (in\ namespace\ eval\ \"::Check\"\ script\ line\ 6)\n\ \ \ \ invoked\ from\ within\n\"namespace\ eval\ Check\ \{\n\ \ \ \ \ \ \ global\ env\n\ \ \ \ \ \ \ source\ [file\ join\ \$env(MIDASBASE)\ TclHttpd\ tcl\ Common\ common.tcl\]\n\ \ \ \ \ \ \ source\ [file\ join\ \$env(MIDASB...\"\n\ \ \ \ invoked\ from\ within\n\"subst\ \{\n\n[Doc_Dynamic\]\n\n\n<!\n[global\ Httpd\;\ upvar\ #0\ Httpd[set\ Httpd(currentSocket)\]\ data\;\ set\ ClientIPAddress\ \$data(ipaddr)\;\ set\ MyInfo\ \$data(self)\]\n>...\"\n\ \ \ \ (\"uplevel\"\ body\ line\ 1)\n\ \ \ \ invoked\ from\ within\n\"uplevel\ #0\ [list\ subst\ \$script\]\"\n\ \ \ \ (procedure\ \"SubstFile\"\ line\ 12)\n\ \ \ \ invoked\ from\ within\n\"SubstFile\ /home/npg/MIDAS_Releases/23Jan19/MIDAS_200119/TclHttpd/Html/AIDA/Check/Check.tml\ \{\}\"\n\ \ \ \ (\"uplevel\"\ body\ line\ 1)\n\ \ \ \ invoked\ from\ within\n\"uplevel\ 1\ [list\ SubstFile\ \$path\ \$interp\]\"\n\ \ \ \ (procedure\ \"Subst_File\"\ line\ 7)\n\ \ \ \ invoked\ from\ within\n\"Subst_File\ \$template\ \$interp\"\n\ \ \ \ invoked\ from\ within\n\"TemplateInstantiate\ \$sock\ \$path\ \{\}\ \$suffix\ \{\}\ \$Template(templateInterp)\"\n\ \ \ \ (procedure\ \"Doc_application/x-tcl-template\"\ line\ 9)\n\ \ \ \ invoked\ from\ within\n\"\$cmd\ \$path\ \$suffix\ \$sock\"\n\ \ \ \ (procedure\ \"Doc_Handle\"\ line\ 20)\n\ \ \ \ invoked\ from\ within\n\"Doc_Handle\ \$prefix\ \$path\ \$suffix\ \$sock\"\n\ \ \ \ (procedure\ \"DocDomain\"\ line\ 44)\n\ \ \ \ invoked\ from\ within\n\"DocDomain\ /\ /MIDAS/TclHttpd/Html\ sock8\ AIDA/Check/Check.tml\"\n\ \ \ \ (\"eval\"\ body\ line\ 1)\n\ \ \ \ invoked\ from\ within\n\"eval\ \$Url(command,\$prefix)\ [list\ \$sock\ \$suffix\]\"
4: Url_Unwind sock8 can't\ read\ \"TS_Base_Collected\":\ no\ such\ variable\n\ \ \ \ while\ executing\n\"if\ \{\ \$TS_Base_Collected\ ==\ 0\ \}\ \{\ collect_TS_Base\ \}\"\n\ \ \ \ (procedure\ \"do_TS_errors\"\ line\ 8)\n\ \ \ \ invoked\ from\ within\n\"do_TS_errors\ \"\n\ \ \ \ (\"TSERRORS\"\ arm\ line\ 1)\n\ \ \ \ invoked\ from\ within\n\"switch\ -glob\ \$w\ \{\n\n\ \ \ \ \ \ \ \ \ \ \ \ \ \ \ \ \ \ \ RESET\ \ \ \ \{set\ started\ 0\}\n\ \ \ \ \ \ \ \ \ \ \ \ \ \ \ \ \ \ \ CLEAR\ \ \ \ \{EmptyLog\}\n\ \ \ \ \ \ \ \ \ \ \ \ \ \ \ \ \ \ \ ELOG\ \ \ \ \ \{PrintLog\}\n\ \ \ \ \ \ \ \ \ ...\"\n\ \ \ \ (procedure\ \"do_click\"\ line\ 23)\n\ \ \ \ invoked\ from\ within\n\"do_click\"\n\ \ \ \ invoked\ from\ within\n\"if\ \{\$started\ !=\ 0\}\ \{\n\n\ \ \ \ \ variable\ JS\ \"\"\n\ \ \ \ \ variable\ LogFlag\n\n\ \ \ \ \ if\ \{\$LogFlag\ ==\ 1\}\ \{InsertLog\ \"Last\ Updated:\ [clock\ format\ [clock\ seconds\]\ -form...\"\n\ \ \ \ (file\ \"Check.tcl\"\ line\ 8)\n\ \ \ \ invoked\ from\ within\n\"source\ Check.tcl\"\n\ \ \ \ (in\ namespace\ eval\ \"::Check\"\ script\ line\ 6)\n\ \ \ \ invoked\ from\ within\n\"namespace\ eval\ Check\ \{\n\ \ \ \ \ \ \ global\ env\n\ \ \ \ \ \ \ source\ [file\ join\ \$env(MIDASBASE)\ TclHttpd\ tcl\ Common\ common.tcl\]\n\ \ \ \ \ \ \ source\ [file\ join\ \$env(MIDASB...\"\n\ \ \ \ invoked\ from\ within\n\"subst\ \{\n\n[Doc_Dynamic\]\n\n\n<!\n[global\ Httpd\;\ upvar\ #0\ Httpd[set\ Httpd(currentSocket)\]\ data\;\ set\ ClientIPAddress\ \$data(ipaddr)\;\ set\ MyInfo\ \$data(self)\]\n>...\"\n\ \ \ \ (\"uplevel\"\ body\ line\ 1)\n\ \ \ \ invoked\ from\ within\n\"uplevel\ #0\ [list\ subst\ \$script\]\"\n\ \ \ \ (procedure\ \"SubstFile\"\ line\ 12)\n\ \ \ \ invoked\ from\ within\n\"SubstFile\ /home/npg/MIDAS_Releases/23Jan19/MIDAS_200119/TclHttpd/Html/AIDA/Check/Check.tml\ \{\}\"\n\ \ \ \ (\"uplevel\"\ body\ line\ 1)\n\ \ \ \ invoked\ from\ within\n\"uplevel\ 1\ [list\ SubstFile\ \$path\ \$interp\]\"\n\ \ \ \ (procedure\ \"Subst_File\"\ line\ 7)\n\ \ \ \ invoked\ from\ within\n\"Subst_File\ \$template\ \$interp\"\n\ \ \ \ invoked\ from\ within\n\"TemplateInstantiate\ \$sock\ \$path\ \{\}\ \$suffix\ \{\}\ \$Template(templateInterp)\"\n\ \ \ \ (procedure\ \"Doc_application/x-tcl-template\"\ line\ 9)\n\ \ \ \ invoked\ from\ within\n\"\$cmd\ \$path\ \$suffix\ \$sock\"\n\ \ \ \ (procedure\ \"Doc_Handle\"\ line\ 20)\n\ \ \ \ invoked\ from\ within\n\"Doc_Handle\ \$prefix\ \$path\ \$suffix\ \$sock\"\n\ \ \ \ (procedure\ \"DocDomain\"\ line\ 44)\n\ \ \ \ invoked\ from\ within\n\"DocDomain\ /\ /MIDAS/TclHttpd/Html\ sock8\ AIDA/Check/Check.tml\"\n\ \ \ \ (\"eval\"\ body\ line\ 1)\n\ \ \ \ invoked\ from\ within\n\"eval\ \$Url(command,\$prefix)\ [list\ \$sock\ \$suffix\]\" NONE
3: Url_DeferredDispatch / AIDA/Check/Check.tml sock8 buffer {}
2: HttpdReadPost sock8 buffer 16384 {Url_DeferredDispatch / AIDA/Check/Check.tml}
1: HttpdReadPostGlobal sock8 Httpds

Dead time check:

[npg@aidas-gsi S496]$ ~/analyser/analyser R14_24
 *** TDR format 3.3.0 analyser - TD - May 2021
 *** ERROR: READ I/O error:       5002
                   blocks:      32000
          ADC data format:  252995858 (  451517.9 Hz)
        Other data format:    8924143 (   15926.8 Hz)
 Sample trace data format:          0 (       0.0 Hz)
         Undefined format:          0 (       0.0 Hz)
   Other data format type:      PAUSE:         85 (       0.2 Hz)
                               RESUME:         85 (       0.2 Hz)
                              SYNC100:      34087 (      60.8 Hz)
                              WR48-63:      34087 (      60.8 Hz)
                           FEE64 disc:          0 (       0.0 Hz)
                             MBS info:    8855799 (   15804.8 Hz)
                           Other info:          0 (       0.0 Hz)

   ADC data range bit set:          0 (       0.0 Hz)

                Timewarps:        ADC:          0 (       0.0 Hz)
                                PAUSE:          0 (       0.0 Hz)
                               RESUME:          0 (       0.0 Hz)
                              SYNC100:          0 (       0.0 Hz)
                              WR48-63:          0 (       0.0 Hz)
                           FEE64 disc:          0 (       0.0 Hz)
                             MBS info:          0 (       0.0 Hz)
                            Undefined:          0 (       0.0 Hz)
                         Sample trace:          0 (       0.0 Hz)

 *** Timestamp elapsed time:      560.323 s
 FEE  elapsed dead time(s) elapsed idle time(s)
  0                0.000              349.960
  1                0.002                0.000
  2                0.000                5.974
  3                1.105                0.000
  4                0.000              447.454
  5                0.000                2.809
  6                0.000               16.727
  7                0.137                0.000
  8                0.090                0.000
  9                0.000              429.897
 10                0.461                0.000
 11                0.018                0.000
 12                0.000                8.985
 13                0.000              466.311
 14                0.000               15.095
 15                0.346                0.000

13:24 Beam is off at the moment...

13:43 Changing spill structure from 1.5s/3.5s to 1s. 

13:50

[npg@aidas-gsi S496]$ ~/analyser/analyser R14_29
 *** TDR format 3.3.0 analyser - TD - May 2021
 *** ERROR: READ I/O error:       5002
                   blocks:      32000
          ADC data format:  251763810 (  930342.1 Hz)
        Other data format:   10156190 (   37530.1 Hz)
 Sample trace data format:          0 (       0.0 Hz)
         Undefined format:          0 (       0.0 Hz)
   Other data format type:      PAUSE:        205 (       0.8 Hz)
                               RESUME:        205 (       0.8 Hz)
                              SYNC100:      33009 (     122.0 Hz)
                              WR48-63:      33009 (     122.0 Hz)
                           FEE64 disc:          0 (       0.0 Hz)
                             MBS info:   10089762 (   37284.7 Hz)
                           Other info:          0 (       0.0 Hz)

   ADC data range bit set:     527077 (    1947.7 Hz)

                Timewarps:        ADC:          0 (       0.0 Hz)
                                PAUSE:          0 (       0.0 Hz)
                               RESUME:          0 (       0.0 Hz)
                              SYNC100:          0 (       0.0 Hz)
                              WR48-63:          0 (       0.0 Hz)
                           FEE64 disc:          0 (       0.0 Hz)
                             MBS info:          0 (       0.0 Hz)
                            Undefined:          0 (       0.0 Hz)
                         Sample trace:          0 (       0.0 Hz)

 *** Timestamp elapsed time:      270.614 s
 FEE  elapsed dead time(s) elapsed idle time(s)
  0                0.034                6.803
  1                8.461                0.000
  2                0.569                0.000
  3               11.664                0.000
  4                0.024               26.416
  5                0.854                0.000
  6                0.069                0.000
  7                0.741                0.000
  8                1.336                0.000
  9                0.000               75.926
 10                0.353                0.000
 11                0.105                0.000
 12                0.070                0.000
 13                0.000               93.585
 14                0.017                0.000
 15                0.121                0.000

15:06 Spill structure back to 1.5 on 2s off.
Attachment 1: 210517_0200_Bias.png
210517_0200_Bias.png
Attachment 2: 210517_0202_stats.png
210517_0202_stats.png
Attachment 3: 210517_0202_temp.png
210517_0202_temp.png
Attachment 4: 210517_0400_Bias.png
210517_0400_Bias.png
Attachment 5: 210517_0403_stats.png
210517_0403_stats.png
Attachment 6: 210517_0403_temp.png
210517_0403_temp.png
Attachment 7: 210517_0740_Bias.png
210517_0740_Bias.png
Attachment 8: 210517_0742_Stats.png
210517_0742_Stats.png
Attachment 9: 210517_0743_Temp.png
210517_0743_Temp.png
Attachment 10: 0833_Stats.png
0833_Stats.png
Attachment 11: 0902_Stats.png
0902_Stats.png
Attachment 12: 1241_Stats.png
1241_Stats.png
Attachment 13: 1347_Stats.png
1347_Stats.png
Attachment 14: FEETemps_1042.png
FEETemps_1042.png
Attachment 15: FEETemps_1246.png
FEETemps_1246.png
Attachment 16: FEETemps_1350.png
FEETemps_1350.png
Attachment 17: leakage_currents_1302.png
leakage_currents_1302.png
  108   Wed Dec 18 02:44:27 2019 NH17.12.19, 18.12.19
Beam: 238U (850 MeV/u)
Fragment: 168Re

Tuning accelerator and FRS, believed since 3AM we are implanting on AIDA.

FEE issues:
One HEC in aida03 seems to be empty - LEC channel fills
aida09 has a lot of weird channels, check/load doesn't seem to fix
aida10 still no data after cable replaced

DSSD leakages OK - slightly higher now

Temps good


Fig 4: Rates 14:32

Leakages and temps good AS Before

Checking if we are implanting properly - possibly into the first DSSD at the moment

Fig 5 FRS PID
Fig 6 DSSD 
Fig 7 DSSD (PID gated)
Attachment 1: 1812-stats.png
1812-stats.png
Attachment 2: 1812-leakages.png
1812-leakages.png
Attachment 3: 1812-temps.png
1812-temps.png
Attachment 4: 1812v2-Rates.png
1812v2-Rates.png
Attachment 5: nh_1712_zaoq.png
nh_1712_zaoq.png
Attachment 6: nh_1712_dssd.png
nh_1712_dssd.png
Attachment 7: nh_1712_dssd_id.png
nh_1712_dssd_id.png
  602   Wed Apr 24 15:37:59 2024 PP16:00-00:00 shift Wednesday 24 April

All seems OK.

Screenshots attached.

Attachment 1: Screenshot_from_2024-04-24_16-38-45.png
Screenshot_from_2024-04-24_16-38-45.png
Attachment 2: Screenshot_from_2024-04-24_16-39-09.png
Screenshot_from_2024-04-24_16-39-09.png
Attachment 3: Screenshot_from_2024-04-24_16-39-38.png
Screenshot_from_2024-04-24_16-39-38.png
Attachment 4: Screenshot_from_2024-04-24_16-40-24.png
Screenshot_from_2024-04-24_16-40-24.png
Attachment 5: Screenshot_from_2024-04-24_16-41-15.png
Screenshot_from_2024-04-24_16-41-15.png
Attachment 6: Screenshot_from_2024-04-24_16-43-41.png
Screenshot_from_2024-04-24_16-43-41.png
Attachment 7: Screenshot_from_2024-04-24_16-44-15.png
Screenshot_from_2024-04-24_16-44-15.png
Attachment 8: Screenshot_from_2024-04-24_16-44-32.png
Screenshot_from_2024-04-24_16-44-32.png
ELOG V3.1.3-7933898