| ID |
Date |
Author |
Subject |
|
178
|
Sun Mar 7 23:13:50 2021 |
OH | Monday 8th March |
00:00 ASIC settings 2019Dec19-16.19.51
      DSSSD#1 slow comparator 0xa
      DSSSD#2 slow comparator 0xa
      DSSSD#3 slow comparator 0xd

      BNC PB-5 Pulser
      Amplitude1.0V
      Attenuation x1
      Frequency 2Hz
      tau_d 1ms
      - polarity
      Delay 250ns, tail pulse


00:14 All system wide checks ok *except aida06 fails clock status 6*
      Statistics - attachment 1
      FEE Temperatures - attachment 2
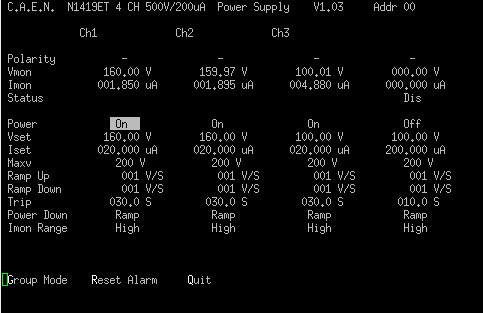
      Bias and leakage currents ok - attachment 3

01:20 Can see now that we are writing to a separate drive the compression is going much faster - attachment 4

02:15 All system wide checks ok *except aida06 fails clock status 6*
      Statistics - attachment 5
      FEE Temperatures - attachment 6
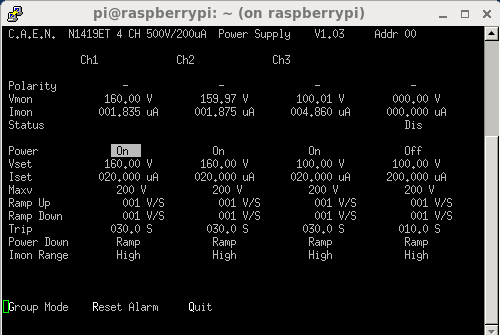
      Bias and leakage currents ok - attachment 7

03:43 Beam has been lost. Not and FRS fault. Several powersupplies have tripped

04:00 Noticed more bad merge events
      System wide checks has also noted an FPGA error.
      All other system wide checks same results as previous

			 Base 		Current 		Difference
aida12 fault 	 0x0 : 	 0x1 : 	 1
FPGA Timestamp error counter test result: Passed 11, Failed 1
If any of these counts are reported as in error
The ASIC readout system has detected a timeslip.
That is the timestamp read from the time FIFO is not younger than the last

The following are timestamp values from each of the FEEs taken in sequence
If time does not increase in a reasonable manner run the system wide checks

aida01 : White Rabbit=>  166A3F29 BA0DF4D2 , WR/10=>   23DD31DC5CE3215, Readout Time =>   23DD31DC6F34000
aida02 : White Rabbit=>  166A3F29 CC49ECD7 , WR/10=>   23DD31DC7A0FE15, Readout Time =>   23DD31DC8428000
aida03 : White Rabbit=>  166A3F29 DF55B7E8 , WR/10=>   23DD31DC9889264, Readout Time =>   23DD31DCA85C000
aida04 : White Rabbit=>  166A3F29 EECF82B7 , WR/10=>   23DD31DCB14C045, Readout Time =>   23DD31DCC2B8000
aida05 : White Rabbit=>  166A3F29 FED2EFD2 , WR/10=>   23DD31DCCAEB195, Readout Time =>   23DD31DCDC14000
aida06 : White Rabbit=>  166A3F2A 0EDC023D , WR/10=>   23DD31DCE49336C, Readout Time =>   23DD31DCF204000
aida07 : White Rabbit=>  166A3F2A 1E8170D3 , WR/10=>   23DD31DCFD9BE7B, Readout Time =>   23DD31DD10A0000
aida08 : White Rabbit=>  166A3F2A 30448F76 , WR/10=>   23DD31DD1A074BF, Readout Time =>   23DD31DD2A34000
aida09 : White Rabbit=>  166A3F2A 3FE36E61 , WR/10=>   23DD31DD33057D6, Readout Time =>   23DD31DD3B94000
aida10 : White Rabbit=>  166A3F2A 4E83A1F7 , WR/10=>   23DD31DD4A6C365, Readout Time =>   23DD31DD46A8000
aida11 : White Rabbit=>  166A3F2A 5FD19086 , WR/10=>   23DD31DD661C1A7, Readout Time =>   23DD31DD7664000
aida12 : White Rabbit=>  166A3F2A 6FE06F3D , WR/10=>   23DD31DD7FCD7EC, Readout Time =>   23DD31DD9684000

04:07 Beam is back AIDA on file R6_815
      Statistics - attachment 8
      FEE Temperatures - attachment 9
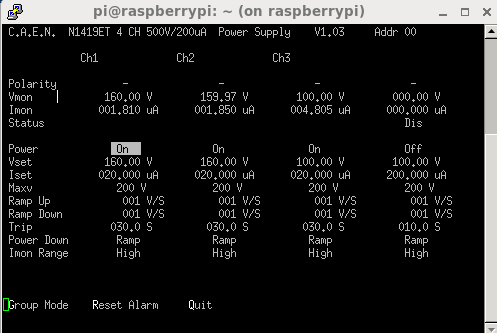
      Bias and leakage currents ok - attachment 10
      ASIC check ok

      Multiple merge data error events observed

06:04 All system wide checks ok *except aida06 fails clock status 6*
      Statistics - attachment 11
      FEE Temperatures - attachment 12
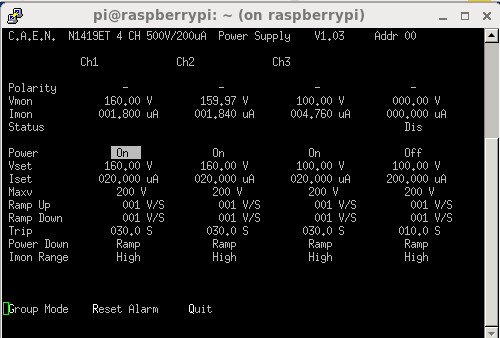
      Bias and leakage currents ok - attachment 13

07:22 Beam noticed dropped but back quickly |
| Attachment 1: 210308_0014_Stats.png
|

|
| Attachment 2: 2303108_0015_Temp.png
|

|
| Attachment 3: 210308_0016_Bias.png
|
|
| Attachment 4: 210308_0120_System.png
|

|
| Attachment 5: 210308_0213_Stats.png
|

|
| Attachment 6: 210308_0213_Temp.png
|

|
| Attachment 7: 210308_0215_Bias.png
|
|
| Attachment 8: 210308_0403_Stats.png
|

|
| Attachment 9: 210308_0404_Temp.png
|

|
| Attachment 10: 210308_04011_Bias.png
|
|
| Attachment 11: 210308_0602_Stats.png
|

|
| Attachment 12: 210308_0603_Temp.png
|

|
| Attachment 13: 210308_0604_Bias.png
|
|
|
182
|
Mon Mar 8 22:51:47 2021 |
OH | Tuesday 9th March |
18:00 ASIC settings 2019Dec19-16.19.51
      DSSSD#1 slow comparator 0xa
      DSSSD#2 slow comparator 0xa
      DSSSD#3 slow comparator 0xd

      BNC PB-5 Pulser
      Amplitude1.0V
      Attenuation x1
      Frequency 2Hz
      tau_d 1ms
      - polarity
      Delay 250ns, tail pulse

      All system wide checks ok *except aida06 fails clock status 6*
      Statistics - attachment 1
      FEE Temperatures - attachment 2
      Bias and leakage currents ok - attachment 3

00:12 Noticed this log in UCESB.
Closed connection [140.181.60.97]...
1 clients...
AIDA Timewarp (166a7a92f8421252 before 166a7a92fdad3848)
AIDA timewarp is over, skipped 2728 AIDA event(s)
=> Not emitting timewarped event (before 166a7a92fdac5c02)
Recovered from timewarp but skipped 5 event(s)

at 00:30 this was 7853.9854 seconds ago or 2 hours and 11 minutes ago which would be 22:19 possibly R9_957 ->R9_961
          Tracked the timestamp down to R9_954 found no evidence of timewarp in analysis of file not in R9_255 either
          Checked all files from R9_254->R9_263 found no timewarps and covers the span of timestamps mentioned in message

01:09 Another timewarp message
AIDA Timewarp (166a83bc5badee1a before 166a83bc6bade974)
=> Not emitting timewarped event (before 166a83bc6226e9ea)
Recovered from timewarp but skipped 6 event(s)
AIDA timewarp is over, skipped 323841 AIDA event

Time relates to Your time zone: Tuesday, 9 March 2021 00:04:21.649 GMT+00:00 this corresponds to R9_1175
Again no timewarps in analysis of file.


02:00 All system wide checks ok *except aida06 fails clock status 6*
      Statistics - attachment 4
      FEE Temperatures - attachment 5
      Bias and leakage currents ok - attachment 6

03:10 Problem with accelerator will be no beam for ~30 minutes


03:56 There was a huge spike of bad merge events. AIDA also stopped forwarding data to the MBS relay while this spike was taking place.
      There are now also errors in all FEEs for WR events

		 Base 		Current 	Difference
aida01 fault 	 0xc45f : 	 0xc46a : 	 11
aida02 fault 	 0xd250 : 	 0xd25b : 	 11
aida03 fault 	 0x27b2 : 	 0x27bd : 	 11
aida04 fault 	 0x714b : 	 0x7156 : 	 11
aida05 fault 	 0x74f5 : 	 0x7500 : 	 11
aida06 fault 	 0x558a : 	 0x5595 : 	 11
aida07 fault 	 0x8d20 : 	 0x8d2b : 	 11
aida08 fault 	 0x8131 : 	 0x813c : 	 11
aida09 fault 	 0xf412 : 	 0xf41d : 	 11
aida10 fault 	 0x82c2 : 	 0x82cd : 	 11
aida11 fault 	 0x2845 : 	 0x2850 : 	 11
aida12 fault 	 0x1bf6 : 	 0x1c01 : 	 11
White Rabbit error counter test result: Passed 0, Failed 12

Understand the status reports as follows:-
Status bit 3 : White Rabbit decoder detected an error in the received data
Status bit 2 : Firmware registered WR error, no reload of Timestamp
Status bit 0 : White Rabbit decoder reports uncertain of Timestamp information from WR

Also errors in FPGA
			 Base 		Current 		Difference
aida03 fault 	 0x0 : 	 0x1 : 	 1
aida04 fault 	 0x0 : 	 0x1 : 	 1
aida10 fault 	 0x0 : 	 0x2 : 	 2
aida11 fault 	 0x0 : 	 0x1 : 	 1
aida12 fault 	 0x1 : 	 0x2 : 	 1
FPGA Timestamp error counter test result: Passed 7, Failed 5
If any of these counts are reported as in error
The ASIC readout system has detected a timeslip.
That is the timestamp read from the time FIFO is not younger than the last

The following are timestamp values from each of the FEEs taken in sequence
If time does not increase in a reasonable manner run the system wide checks

aida01 : White Rabbit=>  166A8D22 3A5FDE66 , WR/10=>   23DDAE9D2A32FD7, Readout Time =>   23DDAE9D3C9C000
aida02 : White Rabbit=>  166A8D22 4C6C3AEB , WR/10=>   23DDAE9D4713917, Readout Time =>   23DDAE9D5B94000
aida03 : White Rabbit=>  166A8D22 5FB33A3C , WR/10=>   23DDAE9D65EB906, Readout Time =>   23DDAE9D769C000
aida04 : White Rabbit=>  166A8D22 6FBA29DB , WR/10=>   23DDAE9D7F9042F, Readout Time =>   23DDAE9D8D14000
aida05 : White Rabbit=>  166A8D22 7F71248D , WR/10=>   23DDAE9D98B5074, Readout Time =>   23DDAE9DA9D8000
aida06 : White Rabbit=>  166A8D22 8F78B071 , WR/10=>   23DDAE9DB25AB3E, Readout Time =>   23DDAE9DC280000
aida07 : White Rabbit=>  166A8D22 9F5A64B7 , WR/10=>   23DDAE9DCBC3D45, Readout Time =>   23DDAE9DDFF0000
aida08 : White Rabbit=>  166A8D22 B1E91092 , WR/10=>   23DDAE9DE974E75, Readout Time =>   23DDAE9DFA08000
aida09 : White Rabbit=>  166A8D22 C150D9ED , WR/10=>   23DDAE9E021AF64, Readout Time =>   23DDAE9E0FD8000
aida10 : White Rabbit=>  166A8D22 D02BA583 , WR/10=>   23DDAE9E19DF6F3, Readout Time =>   23DDAE9E2D50000
aida11 : White Rabbit=>  166A8D22 E287CFC2 , WR/10=>   23DDAE9E373FB2D, Readout Time =>   23DDAE9E4720000
aida12 : White Rabbit=>  166A8D22 F2D4C911 , WR/10=>   23DDAE9E515474E, Readout Time =>   23DDAE9E1BCC000

System recovered and started forwarding data to MBS again but then had another spike in bad merge events with the same results

AIDA DAQ Stopped (Still no beam)
The problem is extraction from the SIS (That is the problem with the beam and not the problem with AIDA).

03:23 AIDA recovered from power cycle. This was done as previously it was observed that after white rabbit issues (When the fibre optic was unplugged) a reset alone was not able to resume synchronisation between AIDA and the other systems. AIDA recovered from the power cycle uneventfully.

All system wide checks in AIDA now pass. (AIDA06 no longer shows the error)
Currently running to no storage on the TapeServer will resume with R13 once beam is back. Forwarding to MBS again.

05:27 Accelerator operators say beam should be back. We see no evidence of this in the triggers or AIDA though - attachment 7
      The problem was with the accelerator operators system. There was no beam.

06:20 Error in WR system wide checks. Rest all ok
      This time there is no bad merge items recorded in the merger terminal.
      There are also no timewarp events seen in ucesb which were observed with the issues at 3am.

		 Base 		Current 	Difference
aida01 fault 	 0xdbe9 : 	 0xdbea : 	 1
aida02 fault 	 0xa93d : 	 0xa93e : 	 1
aida03 fault 	 0x8fc4 : 	 0x8fc5 : 	 1
aida04 fault 	 0x3e56 : 	 0x3e57 : 	 1
aida05 fault 	 0xb04c : 	 0xb04d : 	 1
aida06 fault 	 0x5576 : 	 0x5577 : 	 1
aida07 fault 	 0x99ff : 	 0x9a00 : 	 1
aida08 fault 	 0x8412 : 	 0x8413 : 	 1
aida09 fault 	 0x2457 : 	 0x2458 : 	 1
White Rabbit error counter test result: Passed 3, Failed 9

Understand the status reports as follows:-
Status bit 3 : White Rabbit decoder detected an error in the received data
Status bit 2 : Firmware registered WR error, no reload of Timestamp
Status bit 0 : White Rabbit decoder reports uncertain of Timestamp information from WR


The following are timestamp values from each of the FEEs taken in sequence
If time does not increase in a reasonable manner run the system wide checks

aida01 : White Rabbit=>  166A9523 11478D1D , WR/10=>   23DDBB6B4ED8E1C, Readout Time =>   23DDBB6B6148000
aida02 : White Rabbit=>  166A9523 236AA5E8 , WR/10=>   23DDBB6B6BDDD64, Readout Time =>   23DDBB6B8164000
aida03 : White Rabbit=>  166A9523 375F235D , WR/10=>   23DDBB6B8BCB6BC, Readout Time =>   23DDBB6B9C3C000
aida04 : White Rabbit=>  166A9523 47B8038C , WR/10=>   23DDBB6BA5F338E, Readout Time =>   23DDBB6BA77C000
aida05 : White Rabbit=>  166A9523 599FC116 , WR/10=>   23DDBB6BC29934F, Readout Time =>   23DDBB6BD34C000
aida06 : White Rabbit=>  166A9523 696EB0A7 , WR/10=>   23DDBB6BDBE44DD, Readout Time =>   23DDBB6BECB8000
aida07 : White Rabbit=>  166A9523 7982236B , WR/10=>   23DDBB6BF59D057, Readout Time =>   23DDBB6C0418000
aida08 : White Rabbit=>  166A9523 87C85008 , WR/10=>   23DDBB6C0C73B34, Readout Time =>   23DDBB6C1C7C000
aida09 : White Rabbit=>  166A9523 97020497 , WR/10=>   23DDBB6C24D0075, Readout Time =>   23DDBB6C34B4000
aida10 : White Rabbit=>  166A9523 A69B171D , WR/10=>   23DDBB6C3DC4F1C, Readout Time =>   23DDBB6C50A0000
aida11 : White Rabbit=>  166A9523 B86C8D7D , WR/10=>   23DDBB6C5A4748C, Readout Time =>   23DDBB6C6C88000
aida12 : White Rabbit=>  166A9523 CA1DD1B2 , WR/10=>   23DDBB6C76961C5, Readout Time =>   23DDBB6C5C40000

Possibly occured at 05:28 as a ucesb reports a timewarp at the time.
AIDA Timewarp (166a922b75368928 before 166a922b799e6c92)
AIDA timewarp is over, skipped 2728 AIDA event(s)
Cannot check file as was not writing to file.

      Statistics - attachment 8
      FEE Temperatures - attachment 9
      Bias and leakage currents ok - attachment 10

06:40 There are occasional seconds of beam. According to operators it comes and then it goes again

06:45 Beam fairly stable so we are running again.
      AIDA starts R13. Once again it has skipped many files when unselecting no storage and started on R13_19

07:00 Beam stopped again
07:02 Beam returned
      There are apparently issues with MUSIC chamber one and its resolution

07:46 Beam is still intermitent. There now seems to be problems with the Go4 analysis as it keeps crashing. |
| Attachment 1: 210308_2354_Stats.png
|

|
| Attachment 2: 210308_2355_Temp.png
|

|
| Attachment 3: 210308_2357_Bias.png
|
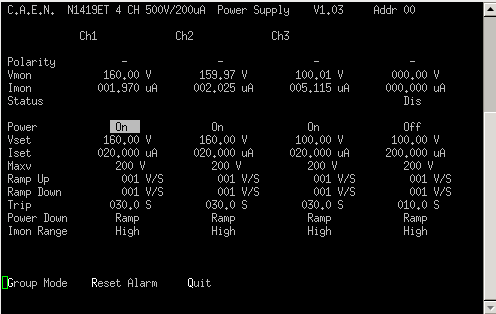
|
| Attachment 4: 210309_0104_Stats.png
|

|
| Attachment 5: 210309_0205_Temp.png
|

|
| Attachment 6: 210309_0205_Bias.png
|
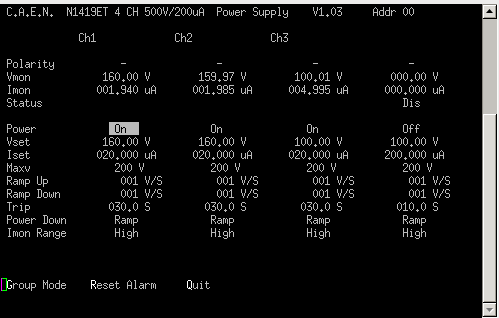
|
| Attachment 7: 210309_0529_layout1.png
|

|
| Attachment 8: 210309_0619_Stats.png
|

|
| Attachment 9: 210309_0620_Temp.png
|

|
| Attachment 10: 210309_0623_Bias.png
|
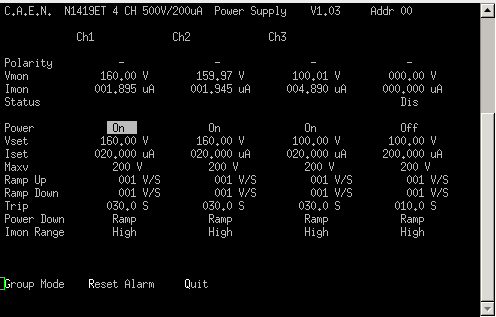
|
|
194
|
Fri Mar 12 23:56:00 2021 |
OH | Saturday March 13th 00:00-08:00 |
24:00 Joined in with TD to debug the dropout of AIDA05 - See https://elog.ph.ed.ac.uk/DESPEC/193
      After both powercycles and telnet reboots we were still seeing 0 in the statistics but did note that the counter was > 0
      The last check we did was a restart of the merger server. This solved the issue.
      It is likely that the link to the FEE was dropped but not re-established upon the resets.
      There was no error message that this was seen. From now on I recommend refreshing the statistics ever 30 minutes.

01:29 System wide check
N.B. May not have reset baselines after reset
WR fault
		 Base 		Current 	Difference
aida01 fault 	 0x1ad : 	 0x1af : 	 2
aida02 fault 	 0x4434 : 	 0x4436 : 	 2
aida03 fault 	 0xcf95 : 	 0xcf99 : 	 4
aida04 fault 	 0x25aa : 	 0x25ae : 	 4
aida05 fault 	 0x4b4 : 	 0x4b7 : 	 3
aida06 fault 	 0x834 : 	 0x837 : 	 3
aida07 fault 	 0x146d : 	 0x1472 : 	 5
aida08 fault 	 0xf4a8 : 	 0xf4ab : 	 3
aida09 fault 	 0x4f6f : 	 0x4f73 : 	 4
aida10 fault 	 0x7504 : 	 0x7506 : 	 2
aida11 fault 	 0x26fa : 	 0x26fc : 	 2
aida12 fault 	 0x2858 : 	 0x285b : 	 3
White Rabbit error counter test result: Passed 0, Failed 12

Understand the status reports as follows:-
Status bit 3 : White Rabbit decoder detected an error in the received data
Status bit 2 : Firmware registered WR error, no reload of Timestamp
Status bit 0 : White Rabbit decoder reports uncertain of Timestamp information from WR

FPGA Check
			 Base 		Current 		Difference
aida12 fault 	 0x0 : 	 0x4 : 	 4
FPGA Timestamp error counter test result: Passed 11, Failed 1
If any of these counts are reported as in error
The ASIC readout system has detected a timeslip.
That is the timestamp read from the time FIFO is not younger than the last

01:42 Statistics - attachment 1
      Temperature - attachment 2
      Bias and leakage current - attachment 3

03:57 System wide checks

		 Base 		Current 	Difference
aida07 fault 	 0x1472 : 	 0x1473 : 	 1
White Rabbit error counter test result: Passed 11, Failed 1

Understand the status reports as follows:-
Status bit 3 : White Rabbit decoder detected an error in the received data
Status bit 2 : Firmware registered WR error, no reload of Timestamp
Status bit 0 : White Rabbit decoder reports uncertain of Timestamp information from WR

			 Base 		Current 		Difference
aida12 fault 	 0x4 : 	 0xc : 	 8
FPGA Timestamp error counter test result: Passed 11, Failed 1
If any of these counts are reported as in error
The ASIC readout system has detected a timeslip.
That is the timestamp read from the time FIFO is not younger than the last

      Statistics - attachment 4
      Temp - attachment 5
      Bias - attachment 6

05:27 System wide checks

		 Base 		Current 	Difference
aida07 fault 	 0x1472 : 	 0x1474 : 	 2
White Rabbit error counter test result: Passed 11, Failed 1

Understand the status reports as follows:-
Status bit 3 : White Rabbit decoder detected an error in the received data
Status bit 2 : Firmware registered WR error, no reload of Timestamp
Status bit 0 : White Rabbit decoder reports uncertain of Timestamp information from WR

			 Base 		Current 		Difference
aida07 fault 	 0x0 : 	 0x1 : 	 1
aida12 fault 	 0x4 : 	 0x16 : 	 18
FPGA Timestamp error counter test result: Passed 10, Failed 2
If any of these counts are reported as in error
The ASIC readout system has detected a timeslip.
That is the timestamp read from the time FIFO is not younger than the last


     Statistics - attachment 7
     Temp - attachment 8
     Bias - attachment 9

05:51 Looking into the bad timestamp messages in the merger e.g.
MERGE Data Link (28348): bad timestamp  5 3 0xc14f8415 0x00eea280 0x0000cd2e70eea280 0x166bcd2e70eea280 0x166bcd2e716c1f80

Looking in the merger source for the bad timestamp message:

            if (op->Time < LastTimeStamp) {

//     invalid time stamp

               (*StatsMem[TSSEQERR])++;

               (*StatsMem[TSSEQERR+((LinkNum+1)*MAXCOUNTERS)])++;

               sprintf(message_buffer, "bad timestamp  %d %d 0x%08lx 0x%08lx 0x%016llx 0x%016llx 0x%016llx",LinkNum, link_table[LinkNum]->link_state, op->Data, op->Timestamp, INFO4, op->Time, LastTimeStamp);

                report_message(MSG_WARNING);   /***************************/

//              LastTimeStamp = op->Time;


So the message is generated when the merger detects a timewarp.

Took the first warning a data block of errors (The first instance of that particular `LastTimeStamp` and c alculated the time difference between the new timestamp and the last timestamp
The time and LastTimestamp were 0x166bccef3f424a50 0x166bccef4f4232e0 respectively
The time difference between them is 268429456 which is 268ms which seems quite a large difference


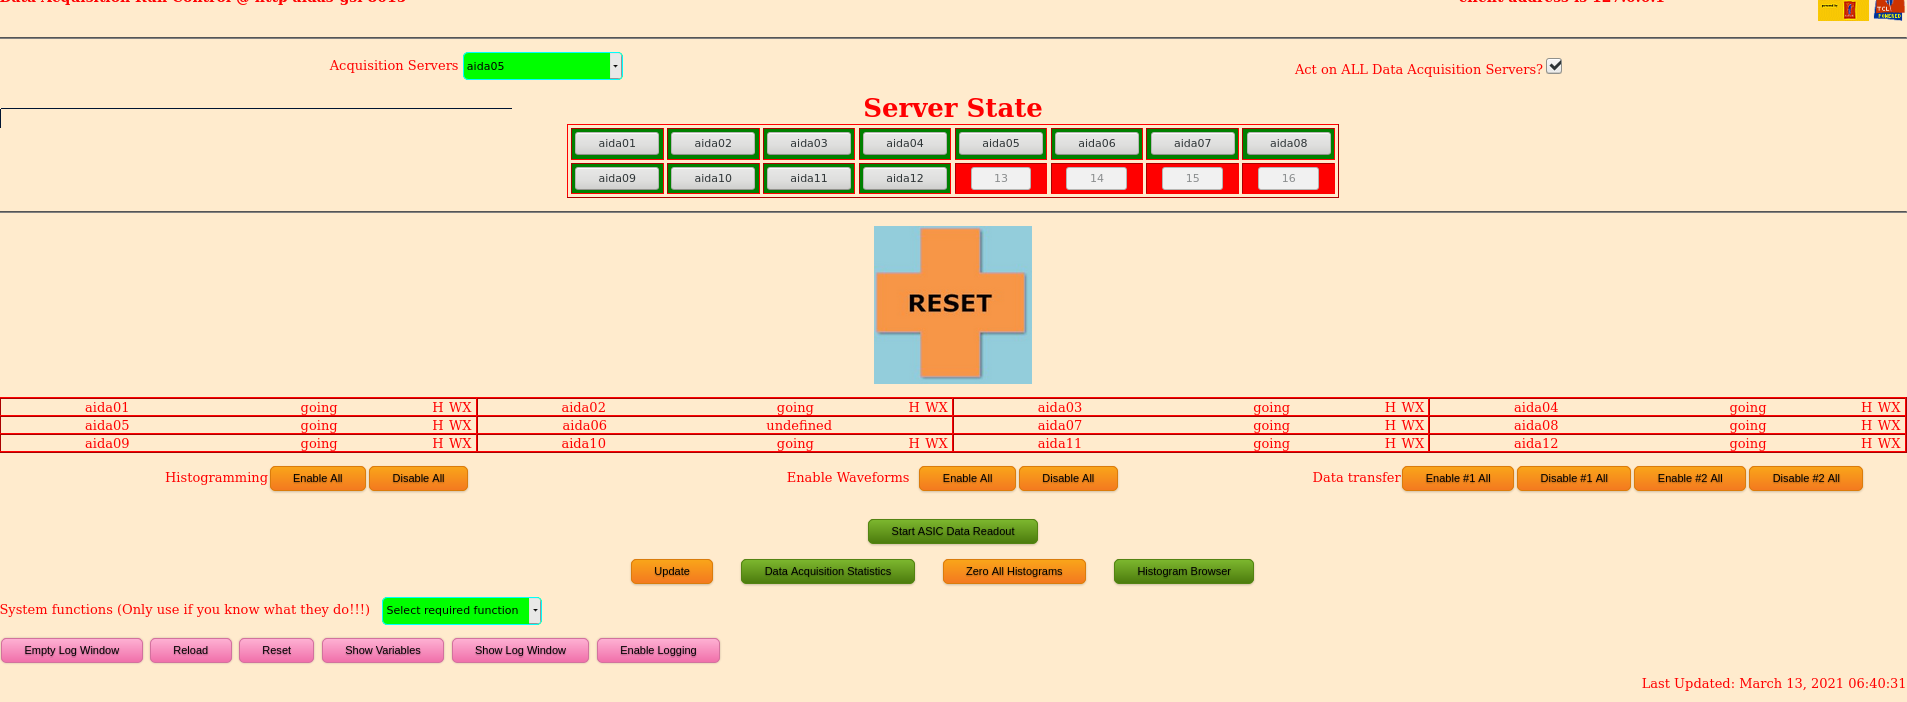
06:39 AIDA Crashed
      This time all FEEs were responsive but not showing any stats
      When stopping the DAQ all FEEs except aida06 stopped - attachment 10
      Did a reset of the DAQ and all recovered but no stats on aida06 - attachment 11
      Regained DAQ with a powercycle and a complete restart of the AIDA:8115 Merger and TaperServer

      It is worth noting that aida06 is connected to link 5 the data link which had been producing the bad merge messages overnight.
      We have now had it in aida05, aida6 and aida07. Could it be to do with the correlation scaler rate going into these FEES?

      Going through the var/log/messages on aida-3 aida06 rebooted itself at 06:37
      Mar 13 06:37:16 aidas-gsi rpc.mountd[4497]: authenticated mount request from 192.168.11.6:918 for /home/Embedded/XilinxLinux/ppc_4xx/rfs/aida06 (/home/Embedded/XilinxLinux/ppc_4xx/rfs)
Mar 13 06:37:18 aidas-gsi xinetd[4578]: START: time-stream pid=0 from=::ffff:192.168.11.6
Mar 13 06:37:32 aidas-gsi rpc.mountd[4497]: authenticated mount request from 192.168.11.6:862 for /home/npg/MIDAS_Releases/23Jan19/MIDAS_200119 (/home/npg/MIDAS_Releases/23Jan19/MIDAS_200119)

Looking in /var/log/messages on aida06 no evidence of a reason why:
Mar 12 23:30:56 aida06 kernel: Trying to free nonexistent resource <0000000007000000-0000000007ffffff>
Mar 12 23:30:56 aida06 kernel: AIDAMEM: aidamem: mem region start 0x7000000 for 0x1000000 mapped at 0xd2380000
Mar 12 23:30:56 aida06 kernel: AIDAMEM: aidamem: driver assigned major number 253
Mar 12 23:31:13 aida06 kernel: xaida: open:
Mar 12 23:31:14 aida06 kernel: AIDAMEM: aidamem_open:
Mar 12 23:33:06 aida06 kernel: xaida: open:
Mar 13 05:37:30 aida06 syslogd 1.4.2: restart.
Mar 13 05:37:30 aida06 kernel: klogd 1.4.2, log source = /proc/kmsg started.
Mar 13 05:37:30 aida06 kernel: Using Xilinx Virtex440 machine description
Mar 13 05:37:30 aida06 kernel: Linux version 2.6.31 (nf@nnlxb.dl.ac.uk) (gcc version 4.2.2) #34 PREEMPT Tue Nov 15 15:57:04 GMT 2011
Mar 13 05:37:30 aida06 kernel: Zone PFN ranges: |
| Attachment 1: 210313_0138_Stats.png
|

|
| Attachment 2: 210313_0141_Temp.png
|

|
| Attachment 3: 210313_0142_Bias.png
|
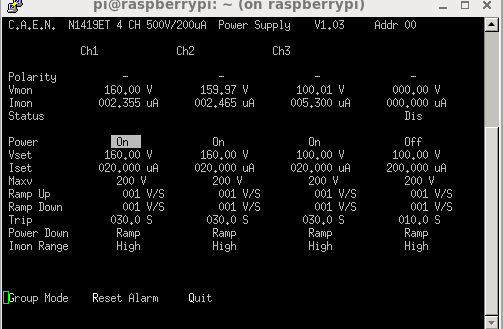
|
| Attachment 4: 210313_0355_Stats.png
|

|
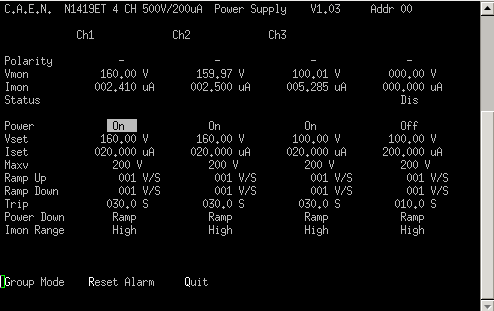
| Attachment 5: 210313_0356_Bias.png
|
|
| Attachment 6: 210313_0356_Temp.png
|

|
| Attachment 7: 210313_0528_Stats.png
|

|
| Attachment 8: 210313_0529_Temp.png
|

|
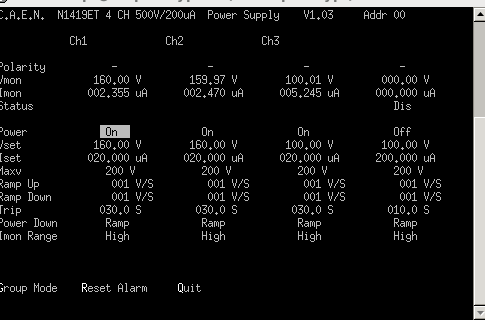
| Attachment 9: 210313_0530_Bias.png
|
|
| Attachment 10: 2210313_0640_AIDAissue.png
|
|
| Attachment 11: 210313_0647_aida6MMissing.png
|

|
|
198
|
Sun Mar 14 07:04:30 2021 |
OH | Sunday 14th March 2021 |
08:07 Realised the correlation scalers hadn't been enabled again. Have enabled them now. R56_151

Looking through the merger messages from the nightshift we see bad timestamps in FEE 11. This FEE does not have any scalers going into it.
It is also the least noisy FEE in the back DSSD

MERGE Data Link (20510): bad timestamp  10 3 0xc2b77eff 0x037a3b92 0x000017f7f37a3b92 0x166c17f7f37a3b92 0x166c17f7f3877262
MERGE Data Link (20510): bad timestamp  10 3 0xc2827f3a 0x037aa122 0x000017f7f37aa122 0x166c17f7f37aa122 0x166c17f7f3877262

09:01 System wide checks

		 Base 		Current 	Difference
aida07 fault 	 0x8c74 : 	 0x8c77 : 	 3
White Rabbit error counter test result: Passed 11, Failed 1

Understand the status reports as follows:-
Status bit 3 : White Rabbit decoder detected an error in the received data
Status bit 2 : Firmware registered WR error, no reload of Timestamp
Status bit 0 : White Rabbit decoder reports uncertain of Timestamp information from WR

			 Base 		Current 		Difference
aida07 fault 	 0x2 : 	 0x5 : 	 3
FPGA Timestamp error counter test result: Passed 11, Failed 1
If any of these counts are reported as in error
The ASIC readout system has detected a timeslip.
That is the timestamp read from the time FIFO is not younger than the last

     Statistics - attachment 1
     Temperature - attachment 2
     Bias and leakage current - attachment 3

11:18 System wide checks

		 Base 		Current 	Difference
aida07 fault 	 0x8c77 : 	 0x8c78 : 	 1
White Rabbit error counter test result: Passed 11, Failed 1

Understand the status reports as follows:-
Status bit 3 : White Rabbit decoder detected an error in the received data
Status bit 2 : Firmware registered WR error, no reload of Timestamp
Status bit 0 : White Rabbit decoder reports uncertain of Timestamp information from WR

     Statistics - attachment 4
     Temperatures - attachment 5
     Bias and leakage - attachment 6


13.14 DAQ continues OK - file R56_285

      ASIC settings 2019Dec19-16.19.51
      DSSSD#1 slow comparator 0xa
      DSSSD#2 slow comparator 0xa
      DSSSD#3 slow comparator 0xd

      BNC PB-5 Pulser
      Amplitude1.0V
      Attenuation x1
      Frequency 2Hz
      tau_d 1ms
      - polarity
      Delay 250ns, tail pulse

13.18 System wide checks

FEE64 module aida09 global clocks failed, 6
 Clock status test result: Passed 11, Failed 1

Understand status as follows
Status bit 3 : firmware PLL that creates clocks from external clock not locked
Status bit 2 : always logic '1'
Status bit 1 : LMK3200(2) PLL and clock distribution chip not locked to external clock
Status bit 0 : LMK3200(1) PLL and clock distribution chip not locked to external clock
If all these bits are not set then the operation of the firmware is unreliable

FEE64 module aida07 failed
FEE64 module aida09 failed
Calibration test result: Passed 10, Failed 2

If any modules fail calibration , check the clock status and open the FADC Align and Control browser page to rerun calibration for that module


		 Base 		Current 	Difference
aida07 fault 	 0x8c77 : 	 0x8c78 : 	 1
White Rabbit error counter test result: Passed 11, Failed 1

Understand the status reports as follows:-
Status bit 3 : White Rabbit decoder detected an error in the received data
Status bit 2 : Firmware registered WR error, no reload of Timestamp
Status bit 0 : White Rabbit decoder reports uncertain of Timestamp information from WR


FPGA Timestamp error counter test result: Passed 12, Failed 0
If any of these counts are reported as in error
The ASIC readout system has detected a timeslip.
That is the timestamp read from the time FIFO is not younger than the last

Returned 0 0 0 0 0 0 0 0 0 0 0 0
Mem(KB) :	4	8	16	32	64	128	256	512	1k	2k	4k
aida01 :     27      8      3      4      2      2      2      2      3      4     10   : 54492
aida02 :      0      2      3      0      2      3      2      3      3      3      6   : 36416
aida03 :     18      9      1      2      0      4      1      3      3      3      6   : 36320
aida04 :      2      3      3      3      1      4      3      2      2      4     15   : 74224
aida05 :     26     72     72     54     53     49     22     18      7      4      7   : 72104
aida06 :      7      5      5     10      0      2      2      4      3      2      5   : 30932
aida07 :      2      4      2      1      1      3      2      3      2      3      7   : 39464
aida08 :     25      9      4      2      1      2      1      4      3      3      6   : 36716
aida09 :      4     11      3      5      2      4      1      2      3      3      6   : 36024
aida10 :     18      5      2      1      0      5      2      2      3      3      6   : 36144
aida11 :     25     10      4      1      1      4      2      3      2      3      6   : 35668
aida12 :     26      7      1      1      1      3      2      3      3      3      6   : 36496

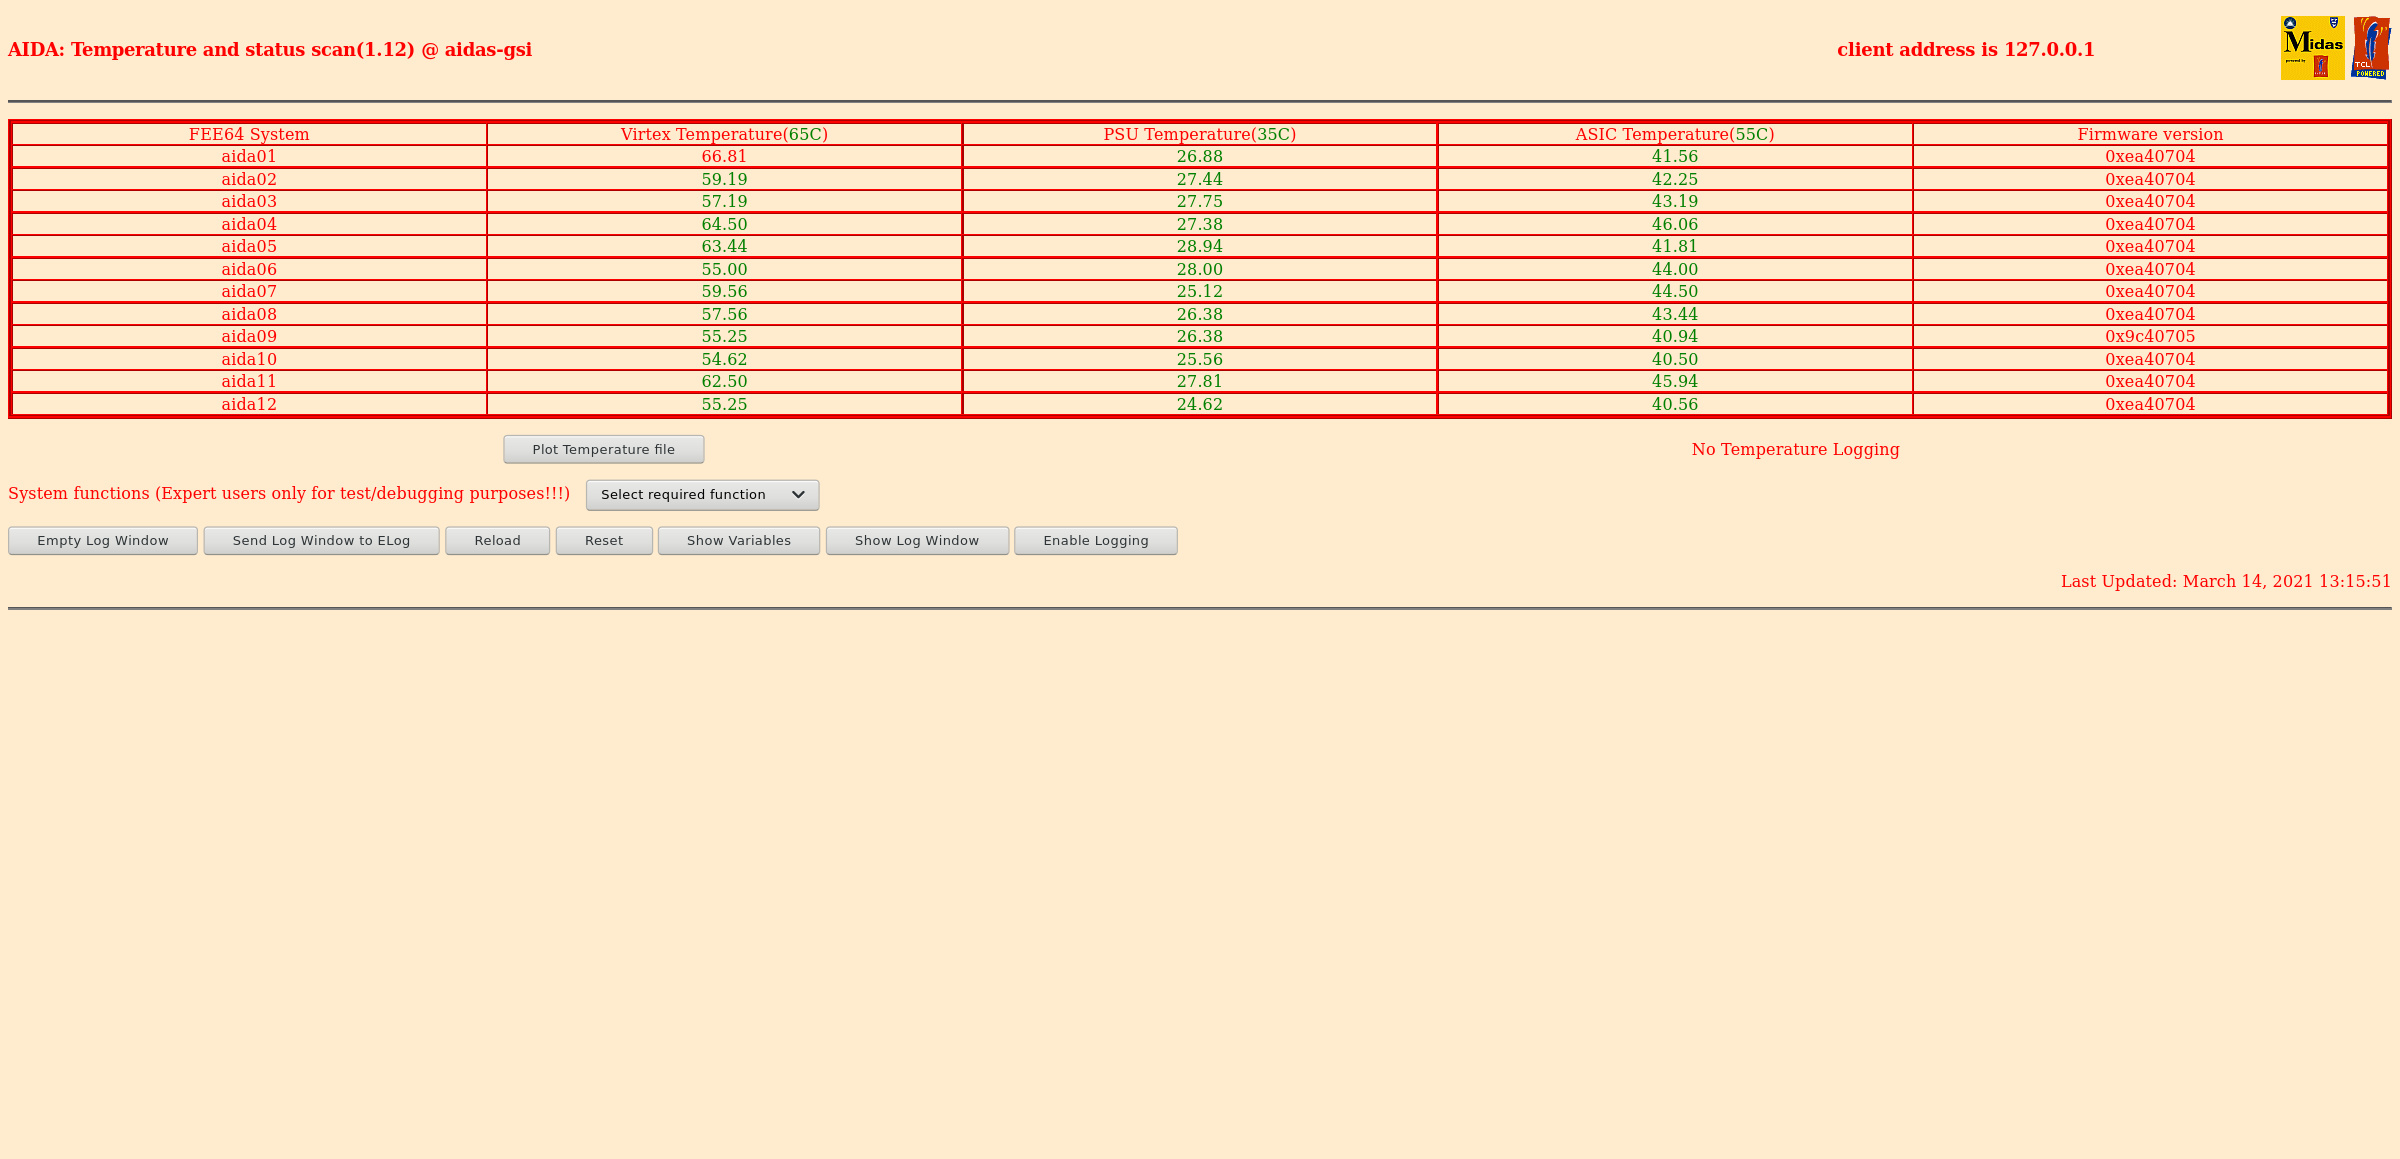
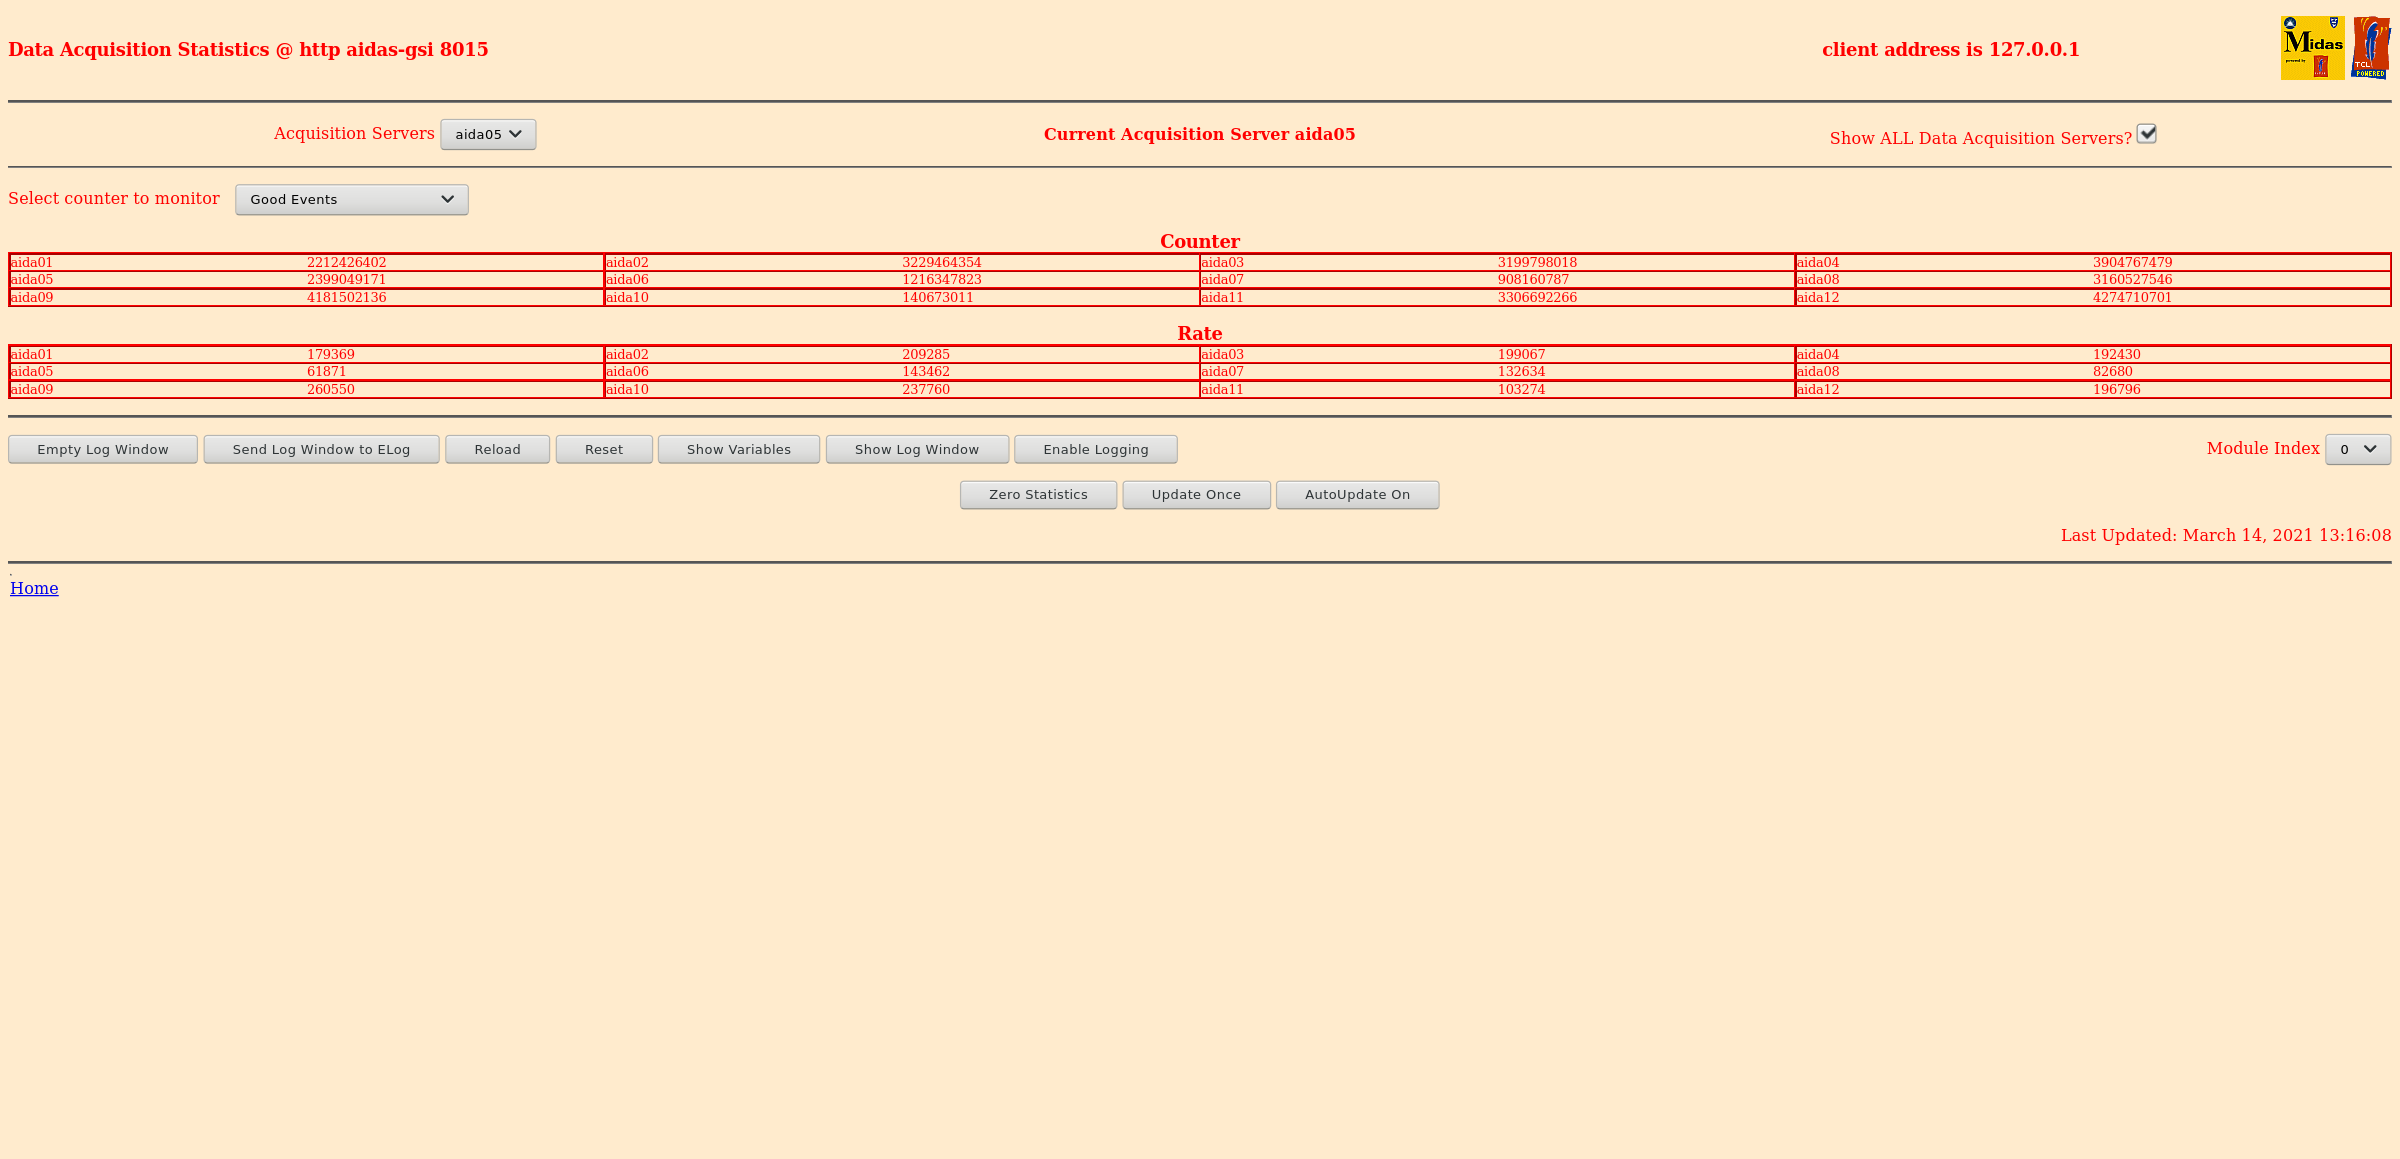
13.19 FEE64 temperatures OK - attachment 7
      Good events stats OK - attachment 8
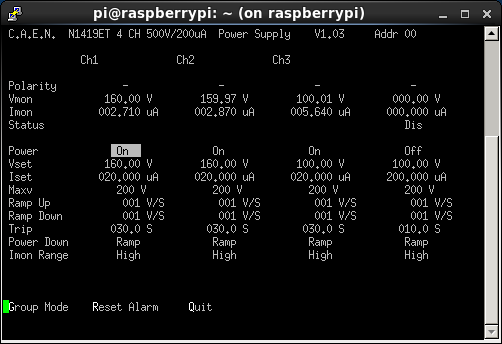
      Bias & leakage currents OK - attachment 9
      Merger 4.5M items/s
      Tape Server 14Mb/s
      No Merger warning/error messages since last report. No MBS relay warning/error/messages since last restart.

      All histograms zero'd


16.00 DAQ contiues R56_361

       System wide checks

FEE64 module aida09 global clocks failed, 6
 Clock status test result: Passed 11, Failed 1

Understand status as follows
Status bit 3 : firmware PLL that creates clocks from external clock not locked
Status bit 2 : always logic '1'
Status bit 1 : LMK3200(2) PLL and clock distribution chip not locked to external clock
Status bit 0 : LMK3200(1) PLL and clock distribution chip not locked to external clock
If all these bits are not set then the operation of the firmware is unreliable

FEE64 module aida07 failed
FEE64 module aida09 failed
Calibration test result: Passed 10, Failed 2

If any modules fail calibration , check the clock status and open the FADC Align and Control browser page to rerun calibration for that module

	 Base 		Current 	Difference
aida07 fault 	 0x8c77 : 	 0x8c79 : 	 2
White Rabbit error counter test result: Passed 11, Failed 1

Understand the status reports as follows:-
Status bit 3 : White Rabbit decoder detected an error in the received data
Status bit 2 : Firmware registered WR error, no reload of Timestamp
Status bit 0 : White Rabbit decoder reports uncertain of Timestamp information from WR

FPGA Timestamp error counter test result: Passed 12, Failed 0
If any of these counts are reported as in error
The ASIC readout system has detected a timeslip.
That is the timestamp read from the time FIFO is not younger than the last

Returned 0 0 0 0 0 0 0 0 0 0 0 0
Mem(KB) :	4	8	16	32	64	128	256	512	1k	2k	4k
aida01 :     23      8      6      4      2      2      2      2      3      4     10   : 54524
aida02 :      1      3      4      2      1      2      1      4      3      3      6   : 36572
aida03 :      2      3      2      3      1      3      2      2      3      3      6   : 35936
aida04 :     19      7      2      3      1      4      3      3      1      4     15   : 73796
aida05 :     34     68     72     54     53     49     22     18      7      4      7   : 72104
aida06 :     11     10      4     10      0      2      2      4      3      2      5   : 30972
aida07 :      1      3      2      2      2      2      2      3      2      3      7   : 39420
aida08 :     24     10      5      2      1      3      1      4      3      3      6   : 36864
aida09 :     20      8      3      5      2      3      2      3      3      3      6   : 36704
aida10 :      2      3      2      3      1      3      3      2      3      3      6   : 36192
aida11 :     17     10      4      0      1      4      2      3      2      3      6   : 35604
aida12 :     20      6      3      2      1      3      2      2      2      4      6   : 37040


15.05 FEE64 temperatures OK - attachment 10
      Good events stats OK - attachment 11
      Bias & leakage currents OK - attachment 12
      Merger 4.6M items/s
      Tape Server 14Mb/s
      No Merger warning/error messages since last report. No MBS relay warning/error/messages since last restart.

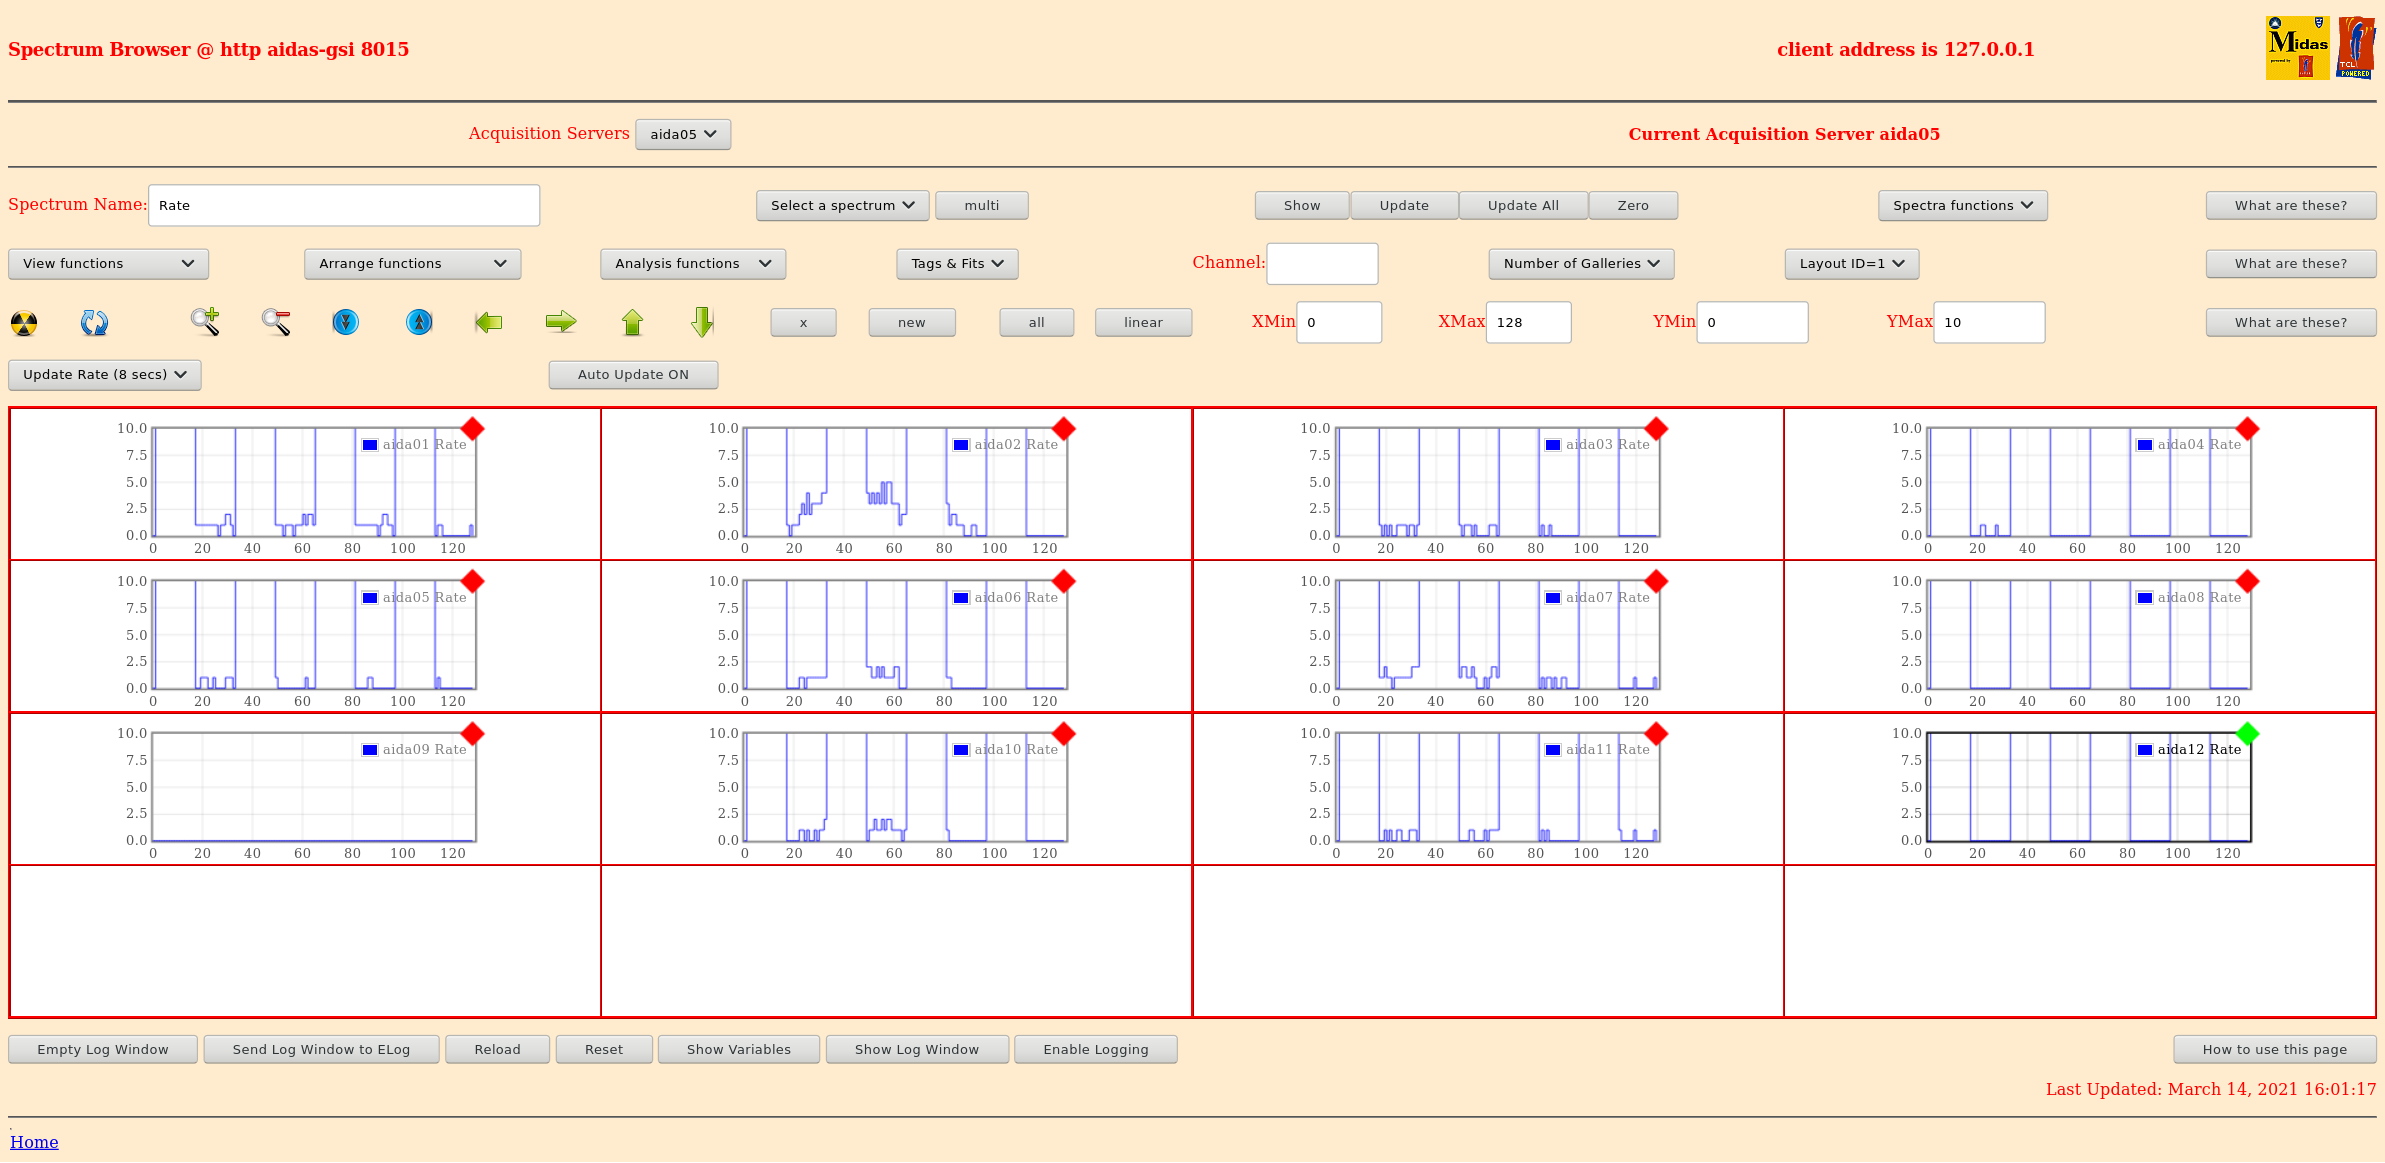
      Rate spectra - attachments 13 & 14
      p+n junction HEC spectra - attachment 15

17.33 end of S452 run file R56_397
      No Merger warning/error messages since last report. No MBS relay warning/error/messages since last restart.

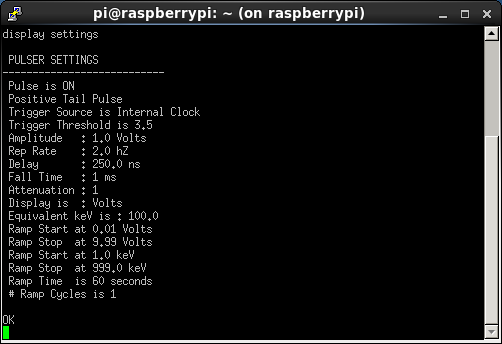
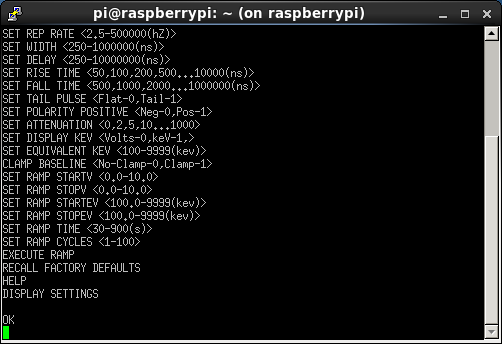
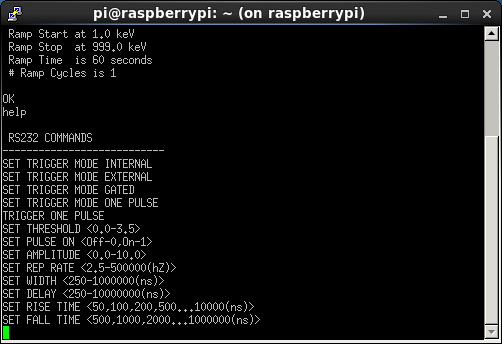
      BNC PB-5 config - attachment 16
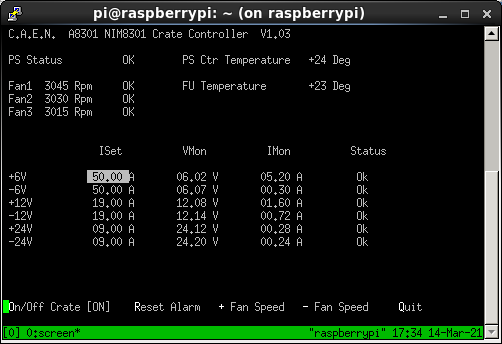
CAEN 8xxx NIM bin config - attachment 17 |
| Attachment 1: 210314_0858_Stats.png
|

|
| Attachment 2: 210314_0859_Temp.png
|

|
| Attachment 3: 210314_0900_Bias.png
|

|
| Attachment 4: 210314_1116_Stats.png
|

|
| Attachment 5: 210314_1116_Temp.png
|

|
| Attachment 6: 210314_1117_Bias.png
|

|
| Attachment 7: Screenshot_2021-03-14_Temperature_and_status_scan_aidas-gsi.png
|
|
| Attachment 8: Screenshot_2021-03-14_Statistics_aidas-gsi.png
|
|
| Attachment 9: 34.png
|
|
| Attachment 10: Screenshot_2021-03-14_Temperature_and_status_scan_aidas-gsi(1).png
|
.png.png)
|
| Attachment 11: Screenshot_2021-03-14_Statistics_aidas-gsi(1).png
|
.png.png)
|
| Attachment 12: 35.png
|

|
| Attachment 13: Screenshot_2021-03-14_Spectrum_Browser_aidas-gsi.png
|
|
| Attachment 14: Screenshot_2021-03-14_Spectrum_Browser_aidas-gsi(1).png
|
.png.png)
|
| Attachment 15: Screenshot_2021-03-12_Spectrum_Browser_aidas-gsi(1).png
|
.png.png)
|
| Attachment 16: 40.png
|
|
| Attachment 17: 41.png
|
|
| Attachment 18: 51.png
|
|
| Attachment 19: 52.png
|
|
| Attachment 20: Screenshot_2021-03-14_Spectrum_Browser_aidas-gsi(3).png
|
.png.png)
|
|
224
|
Thu Apr 15 22:38:18 2021 |
OH | Thursday 15th April - 16th April |
23:38 They are testing the finger detector
      It is a lot of U they are putting into it which is passing through to AIDA ~3500Hz
      Most seems to be punching through

23:45 Rate seems to be reduced to peaking at 1000Hz

00:06 DAQ Running to no storage
      ASIC settings 2019Dec19-16.19.51
      DSSSD#1 slow comparator 0xa
      DSSSD#2 slow comparator 0xa
      DSSSD#3 slow comparator 0xa


      BNC PB-5 Pulser
      Amplitude1.0V
      Attenuation x1
      Frequency 2Hz
      tau_d 1ms
      - polarity
Delay 250ns, tail pulse |
|
230
|
Fri Apr 16 11:42:45 2021 |
OH | Shifter checklist |
Every 30 minutes:

- Reload statistics (Web browser tab screen 1, workspace 2)
    - Are all FEEs still showing a rate?
    - If one shows 0 after multiple reloads Call Oscar or Tom.

- Options database monitor (Top middle terminal screen 2, workspace 2)
    - Has the message changed since the last check?
    - If so copy the message and place in elog

- Do the ucesb scalers make sense? (Web browser, screen 2, workspace 4)
    - If one DSSD is reporting kHz of implants when the others are much less it is likely an ASIC getting stuck.
    - Perform and ASIC check (ASIC control tab, web browser, screen 1, workspace 2)
        - Ensure "Act on all FEE" and "Act on all asic" selected
        - Click on drop down menu in the bottom of the screen and select check ASIC control
        - It will take a minute or so be patient (MIDAS can only respond to one command at once so don't try to do anything else)
        - A pop up will appear check that all options say ok
        - Has the implant rate gone to a more normal amount?
            - If not feel free to call

Every two hours:

- Take a screenshot of the statistics page (Web browser tab screen 1, workspace 2)
     - Compare to the previous screenshot to check if anything has drastically changed

- Take a screenshot of the temperatures (Web browser tab screen 1, workspace 2)
     - Do they all appear stable?

- Take a screenshot of the bias and leakage currents - (Top left terminal, screen 2, workspace 2)

- Perform the five system wide checks (Web browser tab screen 1, workspace 2)
     - Make a note in the elog of which tests are successful
     - If failed copy the text from the white box into the elog and make a note of it

- Enter the screenshots into the elog

- Update the leakage current spreadsheet (Web browser, screen 2, workspace 4) |
|
250
|
Mon Apr 19 23:01:02 2021 |
OH | 20th April 00:00-08:00 |
23:52 Noticed AIDA07 has dropped out of the merger and is producing no statistics
      Powercycling to recover

00:14 All FEEs recovered from powercycle
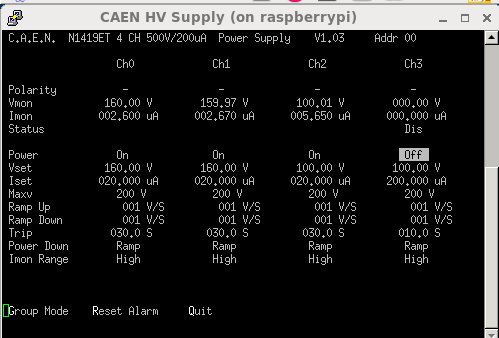
      aida09 running again at HEC threshold of 0x2 (Was set to 0x1 earlier in the day while testing the HEC event disparity in DSSD3)
      Now writing to R34
      Following the powercycle the rates in the FEEs are much improved and back to where they were before the 08:30 crash on the 19th. - Attachment 1
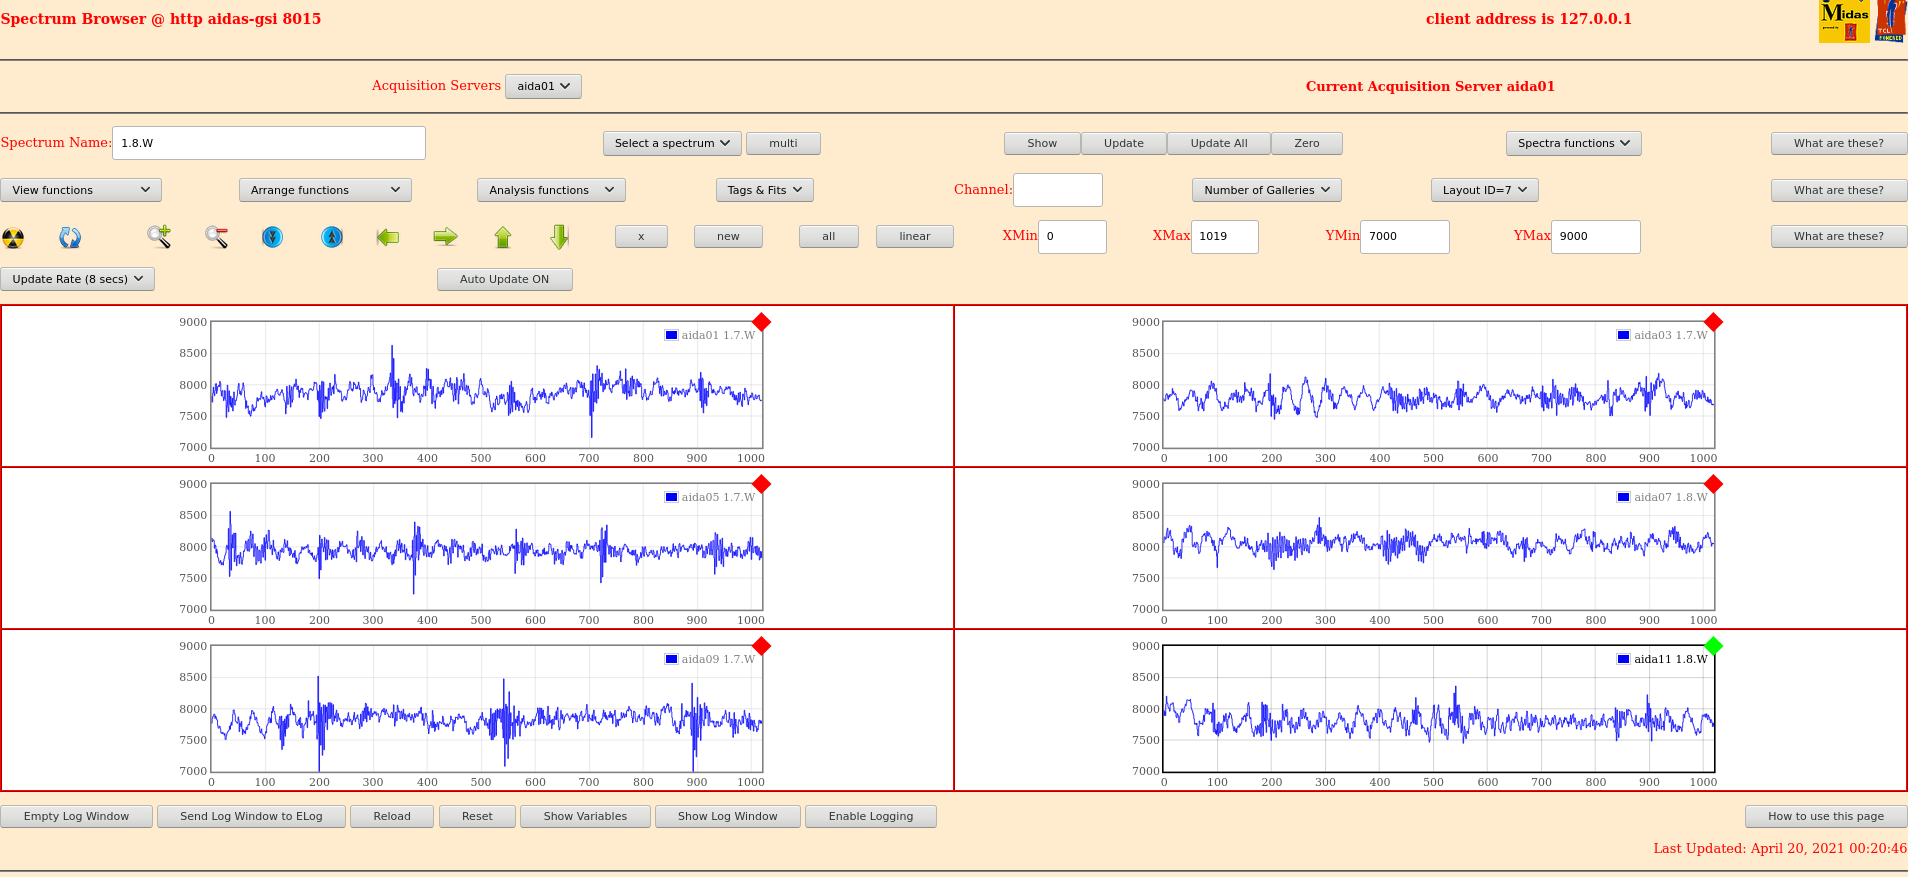
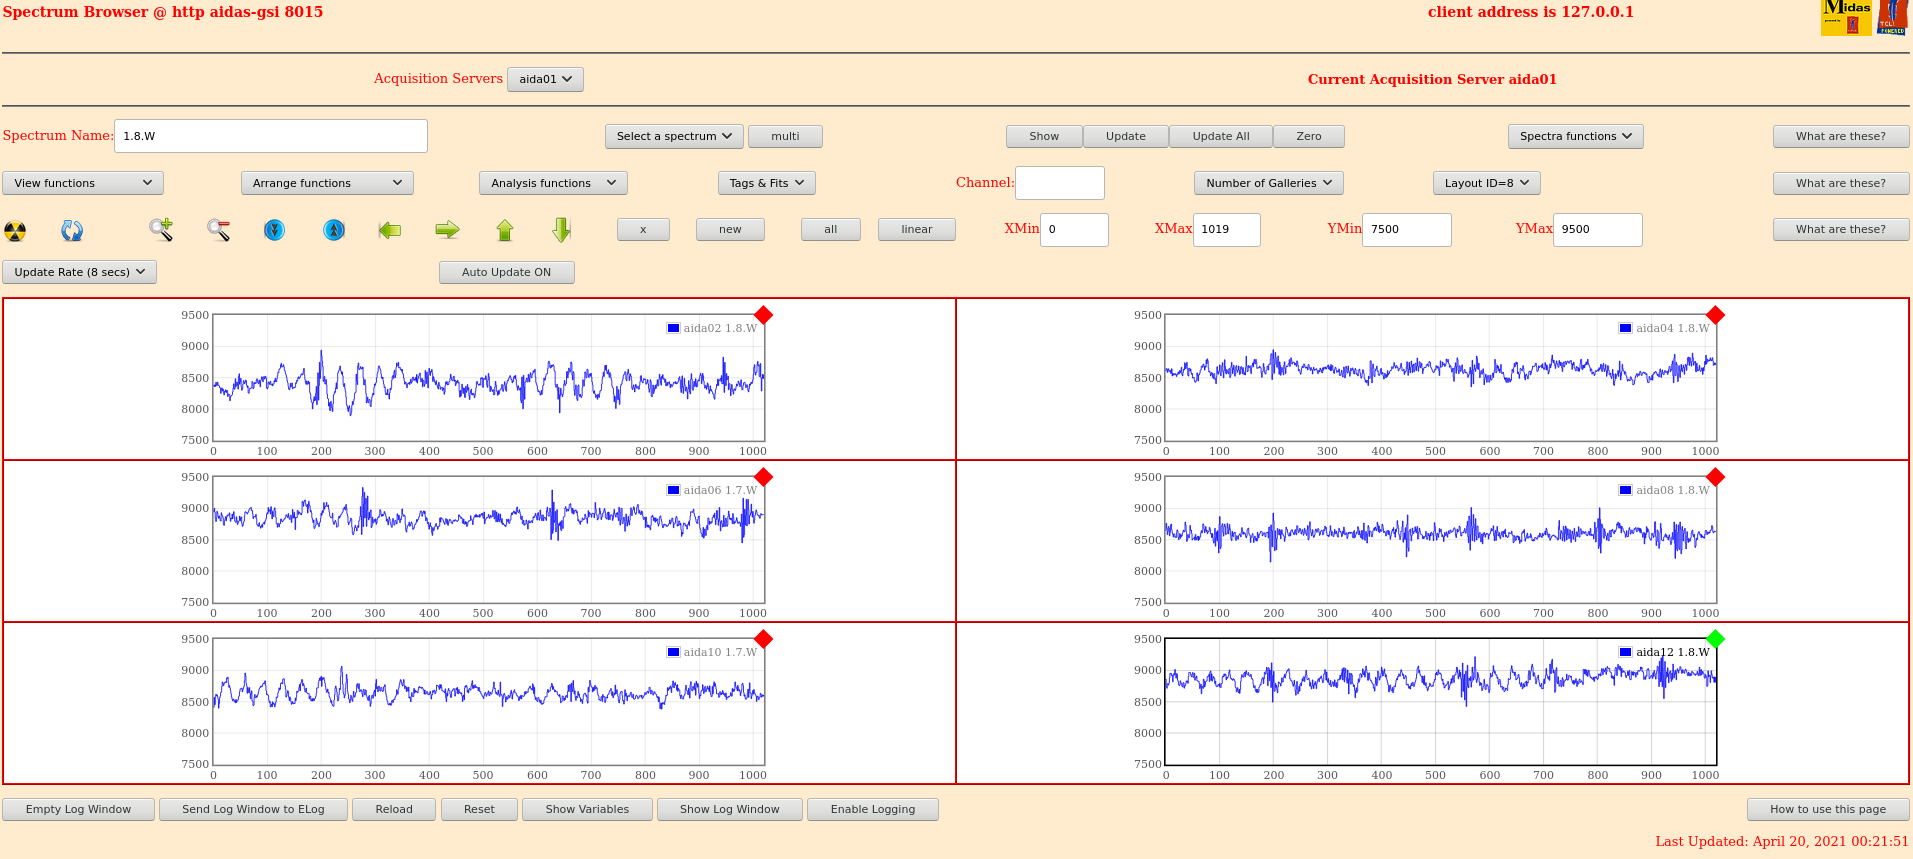
      Waveforms also look improved - attachmens 2 and 3


      Current system parameters
      ASIC settings Dec19 (All LEC comparator 0xa)
      Pulser at 2V and 2Hz
      DSSD 1 and 2 Bias 160V
      DSSD 3 at 120V (Will lower to 100 again during the beam off period tomorrow)


00:28 In analysis of R34_13 the number of HEC items in DSSD3 appears to make sense again. The number in aida09 are consistent with the number in aida05 and the same for aida11 and aida07.
      This appears to confirm that the earlier HEC issues we were observing were hardware related but we are unsure what/why/how these issues were caused.
      Analysis - attachment 4

00:40 Issue with one of the FRS magnets so they stop recording data. Leaving AIDA running.

01:08 While beam was down have reset DSSD3 bias to 100V as was agreed with Tom and Nic in email
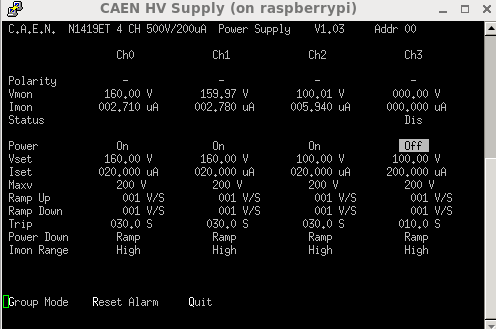
      Leakage current decreased as expected - attachment 5
      Once beam is back will check HEC still as expected.

01:14 Last magnet in FRS has an issue with the water flowing. Either sensor issue or water flow is to low.
      Hakke have increased the water flow to hopefully keep the water running.
      Beam is back.

      From ucesb it seems that the HEC events in DSSD3 are still appearing as expected. Will check a file once we have a complete file.
      Checked R34_36 and the HEC events in DSSD3 are still consistent - attachment 6

2:20 Statistics ok - attachment 7
     Temp - attachment 8
     Bias and leakage current ok - attachment 9

     All system wide checks ok except for WR error check:

		 Base 		Current 	Difference
aida07 fault 	 0x9154 : 	 0x915b : 	 7
aida10 fault 	 0x8d3 : 	 0x8d3 : 	 0
aida10 : WR status 0x10
 White Rabbit error counter test result: Passed 10, Failed 2

Understand the status reports as follows:-
Status bit 3 : White Rabbit decoder detected an error in the received data
Status bit 2 : Firmware registered WR error, no reload of Timestamp
Status bit 0 : White Rabbit decoder reports uncertain of Timestamp information from WR

     Note aida07 reports two bad timestamps in the merger
     MERGE Data Link (3762): bad timestamp  6 3 0xc1817ea7 0x04a8fc66 0x0000683974a8fc66 0x1677683974a8fc66 0x167768397a546a56
     MERGE Data Link (3762): bad timestamp  6 3 0xc1b77e25 0x04a8fc66 0x0000683974a8fc66 0x1677683974a8fc66 0x167768397a546a56


02:25 Remembered during a pre-experiment meeting with Vic, Patrick and Carl they mentioned the merger would track timestamp sequence errors
      Can confirm this is true. Can see the two in aida07 in the counter in the merger stats page - attachment 10

02:45 Now up to 7 timestamp errors on aida07 in the merger

02:49 Ran R34_45 through AIDASort - It reports a greater number of implant events are able to have a front back match performed
      Ratio between aida07 and 09 is 0.71 -> Double what it was before
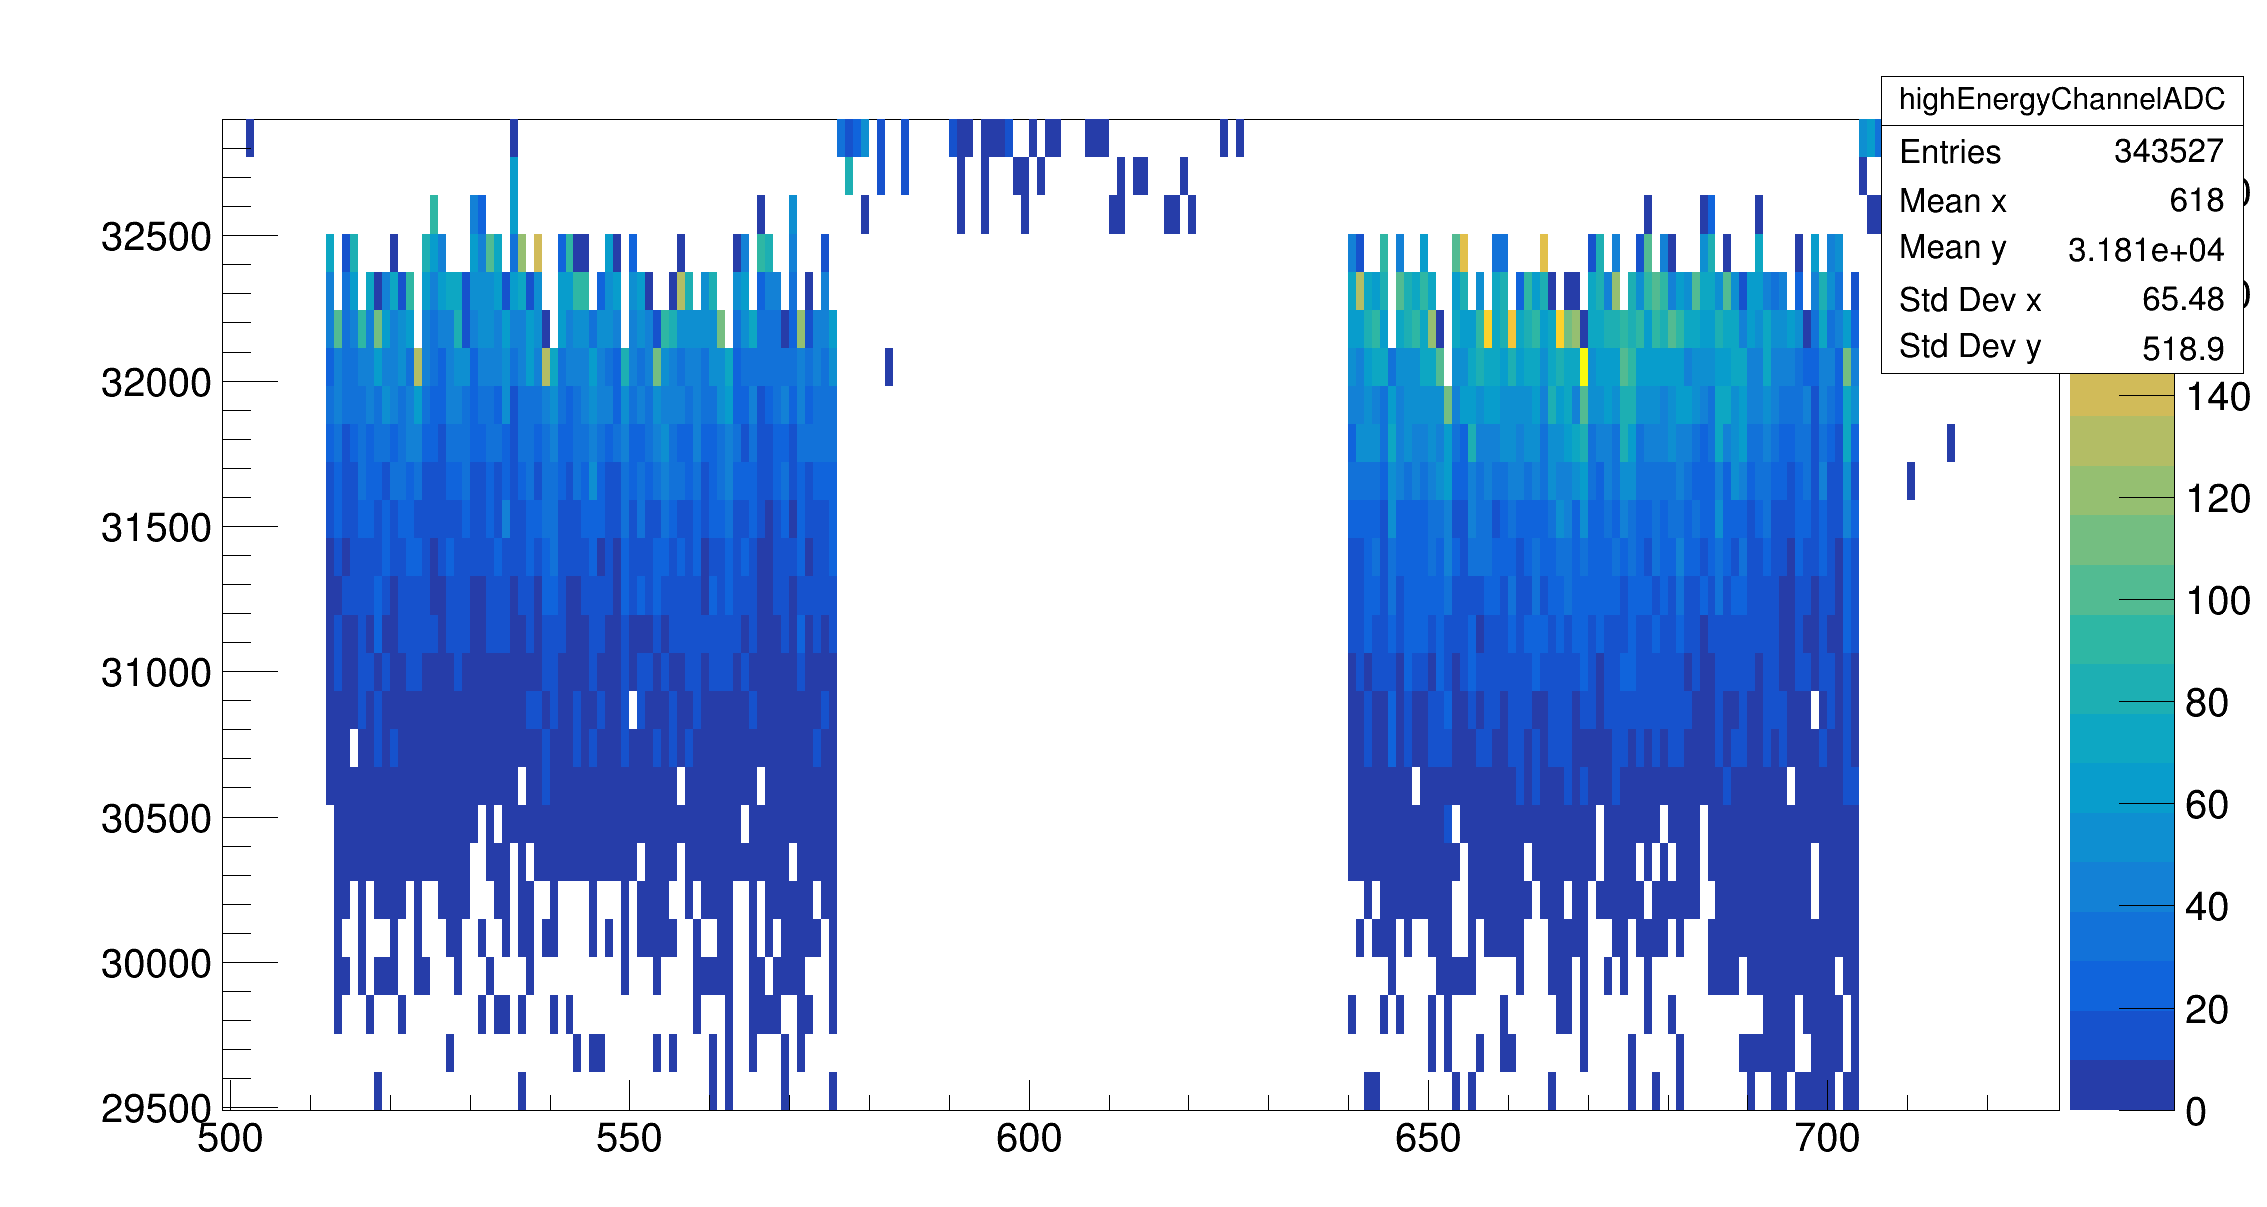
      Energy response of the HEC channels in aida07 and aida09 looks equivalent (left group aida09 right group aida11) - attahchment 11

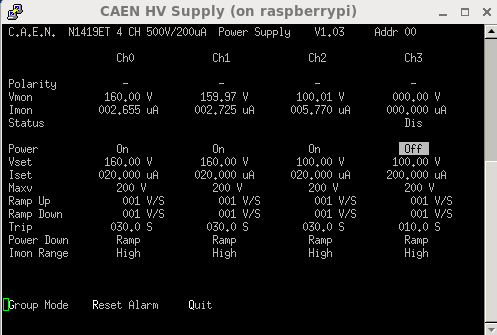
04:40 Statistics ok - attachment 12
      Temperatures ok - attachment 13
      Bias and leakage currents - attachment 14
      Clock status, ADC calibration and memory infomration all ok
      aida07 fails both WR and FPGA

		 Base 		Current 	Difference
aida07 fault 	 0x915b : 	 0x9161 : 	 6
aida10 fault 	 0x8d3 : 	 0x8d3 : 	 0
aida10 : WR status 0x10
 White Rabbit error counter test result: Passed 10, Failed 2

Understand the status reports as follows:-
Status bit 3 : White Rabbit decoder detected an error in the received data
Status bit 2 : Firmware registered WR error, no reload of Timestamp
Status bit 0 : White Rabbit decoder reports uncertain of Timestamp information from WR


			 Base 		Current 		Difference
aida07 fault 	 0x0 : 	 0x1 : 	 1
FPGA Timestamp error counter test result: Passed 11, Failed 1
If any of these counts are reported as in error
The ASIC readout system has detected a timeslip.
That is the timestamp read from the time FIFO is not younger than the last


       TS errors in the merger still only at 7 with all in aida07

06:25 Statistics - attachment 15
      Temps ok - attachment 16
      Bias and leakage currents ok - attachment 17

      System wide checks: clock status, adc calibration and memory information all ok
      WR multiple fails

		 Base 		Current 	Difference
aida05 fault 	 0xc9ca : 	 0xc9cb : 	 1
aida06 fault 	 0xe900 : 	 0xe901 : 	 1
aida07 fault 	 0x915b : 	 0x9166 : 	 11
aida08 fault 	 0x641e : 	 0x641f : 	 1
aida10 fault 	 0x8d3 : 	 0x8d3 : 	 0
aida10 : WR status 0x10
 White Rabbit error counter test result: Passed 7, Failed 5

Understand the status reports as follows:-
Status bit 3 : White Rabbit decoder detected an error in the received data
Status bit 2 : Firmware registered WR error, no reload of Timestamp
Status bit 0 : White Rabbit decoder reports uncertain of Timestamp information from WR

     FPGA aida07 fails with difference of 1

     No new TS sequence errors in merger


07:10 Beam has dropped out.
07:14 Beam is back |
| Attachment 1: 210420_0016_Stats.png
|

|
| Attachment 2: 210420_0021_Layout7.png
|
|
| Attachment 3: 210420_0022_Layout8.png
|
|
| Attachment 4: 210420_0026_R34_13_Analysis.txt
|
*** TDR format 3.3.0 analyser - TD - January 2019
*** ERROR: READ I/O error: 5002
blocks: 32000
ADC data format: 255975543 ( 1356743.5 Hz)
Other data format: 5944457 ( 31507.3 Hz)
Sample trace data format: 0 ( 0.0 Hz)
Undefined format: 0 ( 0.0 Hz)
Other data format type: PAUSE: 0 ( 0.0 Hz)
RESUME: 0 ( 0.0 Hz)
SYNC100: 32703 ( 173.3 Hz)
WR48-63: 32703 ( 173.3 Hz)
FEE64 disc: 1073243 ( 5688.5 Hz)
MBS info: 4805808 ( 25472.2 Hz)
Other info: 0 ( 0.0 Hz)
ADC data range bit set: 345437 ( 1830.9 Hz)
Timewarps: ADC: 0 ( 0.0 Hz)
PAUSE: 0 ( 0.0 Hz)
RESUME: 0 ( 0.0 Hz)
SYNC100: 0 ( 0.0 Hz)
WR48-63: 0 ( 0.0 Hz)
FEE64 disc: 0 ( 0.0 Hz)
MBS info: 0 ( 0.0 Hz)
Undefined: 0 ( 0.0 Hz)
Sample trace: 0 ( 0.0 Hz)
*** Timestamp elapsed time: 188.669 s
FEE elapsed dead time(s) elapsed idle time(s)
1 0.000 46.534
2 0.000 63.789
3 0.000 54.847
4 0.000 174.519
5 0.000 123.945
6 0.000 113.898
7 0.000 135.923
8 0.000 59.774
9 0.000 27.296
10 0.000 12.263
11 0.000 65.598
12 0.000 0.000
13 0.000 0.000
14 0.000 0.000
15 0.000 0.000
16 0.000 0.000
17 0.000 0.000
18 0.000 0.000
19 0.000 0.000
20 0.000 0.000
21 0.000 0.000
22 0.000 0.000
23 0.000 0.000
24 0.000 0.000
25 0.000 0.000
26 0.000 0.000
27 0.000 0.000
28 0.000 0.000
29 0.000 0.000
30 0.000 0.000
31 0.000 0.000
32 0.000 0.000
*** Statistics
FEE ADC Data Other Data Sample Undefined Pause Resume SYNC100 WR48-63 Disc MBS Other HEC Data
0 14400003 100475 0 0 0 0 1767 1767 95813 1128 0 35602
1 23251868 63483 0 0 0 0 2988 2988 57507 0 0 21204
2 17192461 2025458 0 0 0 0 2415 2415 200396 1820232 0 34093
3 20019932 1908259 0 0 0 0 2815 2815 81941 1820688 0 32715
4 3059738 405674 0 0 0 0 403 403 100680 304188 0 35774
5 10595698 355900 0 0 0 0 1322 1322 58122 295134 0 21319
6 12037952 388178 0 0 0 0 1554 1554 105230 279840 0 34521
7 9390918 368608 0 0 0 0 1205 1205 81600 284598 0 31165
8 46854628 72459 0 0 0 0 5872 5872 60715 0 0 21758
9 43874737 60599 0 0 0 0 5426 5426 49747 0 0 17382
10 36184433 112868 0 0 0 0 4528 4528 103812 0 0 31745
11 19113175 82496 0 0 0 0 2408 2408 77680 0 0 28159
12 0 0 0 0 0 0 0 0 0 0 0 0
13 0 0 0 0 0 0 0 0 0 0 0 0
14 0 0 0 0 0 0 0 0 0 0 0 0
15 0 0 0 0 0 0 0 0 0 0 0 0
16 0 0 0 0 0 0 0 0 0 0 0 0
17 0 0 0 0 0 0 0 0 0 0 0 0
18 0 0 0 0 0 0 0 0 0 0 0 0
19 0 0 0 0 0 0 0 0 0 0 0 0
20 0 0 0 0 0 0 0 0 0 0 0 0
21 0 0 0 0 0 0 0 0 0 0 0 0
22 0 0 0 0 0 0 0 0 0 0 0 0
23 0 0 0 0 0 0 0 0 0 0 0 0
24 0 0 0 0 0 0 0 0 0 0 0 0
25 0 0 0 0 0 0 0 0 0 0 0 0
26 0 0 0 0 0 0 0 0 0 0 0 0
27 0 0 0 0 0 0 0 0 0 0 0 0
28 0 0 0 0 0 0 0 0 0 0 0 0
29 0 0 0 0 0 0 0 0 0 0 0 0
30 0 0 0 0 0 0 0 0 0 0 0 0
31 0 0 0 0 0 0 0 0 0 0 0 0
32 0 0 0 0 0 0 0 0 0 0 0 0
*** Timewarps
FEE ADC Pause Resume SYNC100 WR48-63 Disc MBS Undefined Samples
0 0 0 0 0 0 0 0 0 0
1 0 0 0 0 0 0 0 0 0
2 0 0 0 0 0 0 0 0 0
3 0 0 0 0 0 0 0 0 0
4 0 0 0 0 0 0 0 0 0
5 0 0 0 0 0 0 0 0 0
6 0 0 0 0 0 0 0 0 0
7 0 0 0 0 0 0 0 0 0
8 0 0 0 0 0 0 0 0 0
9 0 0 0 0 0 0 0 0 0
10 0 0 0 0 0 0 0 0 0
11 0 0 0 0 0 0 0 0 0
12 0 0 0 0 0 0 0 0 0
13 0 0 0 0 0 0 0 0 0
14 0 0 0 0 0 0 0 0 0
15 0 0 0 0 0 0 0 0 0
16 0 0 0 0 0 0 0 0 0
17 0 0 0 0 0 0 0 0 0
18 0 0 0 0 0 0 0 0 0
19 0 0 0 0 0 0 0 0 0
20 0 0 0 0 0 0 0 0 0
21 0 0 0 0 0 0 0 0 0
22 0 0 0 0 0 0 0 0 0
23 0 0 0 0 0 0 0 0 0
24 0 0 0 0 0 0 0 0 0
25 0 0 0 0 0 0 0 0 0
26 0 0 0 0 0 0 0 0 0
27 0 0 0 0 0 0 0 0 0
28 0 0 0 0 0 0 0 0 0
29 0 0 0 0 0 0 0 0 0
30 0 0 0 0 0 0 0 0 0
31 0 0 0 0 0 0 0 0 0
32 0 0 0 0 0 0 0 0 0
*** Program elapsed time: 1641.051s ( 19.500 blocks/s, 1.219 Mb/s)
|
| Attachment 5: 210420_0109_Bias.png
|

|
| Attachment 6: 210420_0026_R34_36_Analysis.txt
|
*** TDR format 3.3.0 analyser - TD - January 2019
*** ERROR: READ I/O error: 5002
blocks: 32000
ADC data format: 255999603 ( 1309621.8 Hz)
Other data format: 5920397 ( 30287.1 Hz)
Sample trace data format: 0 ( 0.0 Hz)
Undefined format: 0 ( 0.0 Hz)
Other data format type: PAUSE: 0 ( 0.0 Hz)
RESUME: 0 ( 0.0 Hz)
SYNC100: 32728 ( 167.4 Hz)
WR48-63: 32728 ( 167.4 Hz)
FEE64 disc: 1044504 ( 5343.4 Hz)
MBS info: 4810437 ( 24608.8 Hz)
Other info: 0 ( 0.0 Hz)
ADC data range bit set: 327887 ( 1677.4 Hz)
Timewarps: ADC: 0 ( 0.0 Hz)
PAUSE: 0 ( 0.0 Hz)
RESUME: 0 ( 0.0 Hz)
SYNC100: 0 ( 0.0 Hz)
WR48-63: 0 ( 0.0 Hz)
FEE64 disc: 0 ( 0.0 Hz)
MBS info: 0 ( 0.0 Hz)
Undefined: 0 ( 0.0 Hz)
Sample trace: 0 ( 0.0 Hz)
*** Timestamp elapsed time: 195.476 s
FEE elapsed dead time(s) elapsed idle time(s)
1 0.000 51.325
2 0.000 68.599
3 0.000 55.115
4 0.000 180.174
5 0.000 140.295
6 0.000 123.427
7 0.000 138.446
8 0.000 55.510
9 0.000 13.463
10 0.000 24.357
11 0.000 74.336
12 0.000 0.000
13 0.000 0.000
14 0.000 0.000
15 0.000 0.000
16 0.000 0.000
17 0.000 0.000
18 0.000 0.000
19 0.000 0.000
20 0.000 0.000
21 0.000 0.000
22 0.000 0.000
23 0.000 0.000
24 0.000 0.000
25 0.000 0.000
26 0.000 0.000
27 0.000 0.000
28 0.000 0.000
29 0.000 0.000
30 0.000 0.000
31 0.000 0.000
32 0.000 0.000
*** Statistics
FEE ADC Data Other Data Sample Undefined Pause Resume SYNC100 WR48-63 Disc MBS Other HEC Data
0 14611253 94841 0 0 0 0 1936 1936 89802 1167 0 33511
1 23423897 61346 0 0 0 0 3006 3006 55334 0 0 20222
2 17311487 2050104 0 0 0 0 2477 2477 195362 1849788 0 32021
3 20533060 1944396 0 0 0 0 2862 2862 77493 1861179 0 30741
4 2942569 381933 0 0 0 0 417 417 93930 287169 0 33667
5 9776355 338395 0 0 0 0 1239 1239 56110 279807 0 20096
6 11887130 369619 0 0 0 0 1555 1555 103862 262647 0 32503
7 9239609 348065 0 0 0 0 1200 1200 76985 268680 0 29470
8 49507336 72711 0 0 0 0 6129 6129 60453 0 0 21190
9 44170393 65100 0 0 0 0 5430 5430 54240 0 0 18016
10 32977762 112783 0 0 0 0 4022 4022 104739 0 0 30280
11 19618752 81104 0 0 0 0 2455 2455 76194 0 0 26170
12 0 0 0 0 0 0 0 0 0 0 0 0
13 0 0 0 0 0 0 0 0 0 0 0 0
14 0 0 0 0 0 0 0 0 0 0 0 0
15 0 0 0 0 0 0 0 0 0 0 0 0
16 0 0 0 0 0 0 0 0 0 0 0 0
17 0 0 0 0 0 0 0 0 0 0 0 0
18 0 0 0 0 0 0 0 0 0 0 0 0
19 0 0 0 0 0 0 0 0 0 0 0 0
20 0 0 0 0 0 0 0 0 0 0 0 0
21 0 0 0 0 0 0 0 0 0 0 0 0
22 0 0 0 0 0 0 0 0 0 0 0 0
23 0 0 0 0 0 0 0 0 0 0 0 0
24 0 0 0 0 0 0 0 0 0 0 0 0
25 0 0 0 0 0 0 0 0 0 0 0 0
26 0 0 0 0 0 0 0 0 0 0 0 0
27 0 0 0 0 0 0 0 0 0 0 0 0
28 0 0 0 0 0 0 0 0 0 0 0 0
29 0 0 0 0 0 0 0 0 0 0 0 0
30 0 0 0 0 0 0 0 0 0 0 0 0
31 0 0 0 0 0 0 0 0 0 0 0 0
32 0 0 0 0 0 0 0 0 0 0 0 0
*** Timewarps
FEE ADC Pause Resume SYNC100 WR48-63 Disc MBS Undefined Samples
0 0 0 0 0 0 0 0 0 0
1 0 0 0 0 0 0 0 0 0
2 0 0 0 0 0 0 0 0 0
3 0 0 0 0 0 0 0 0 0
4 0 0 0 0 0 0 0 0 0
5 0 0 0 0 0 0 0 0 0
6 0 0 0 0 0 0 0 0 0
7 0 0 0 0 0 0 0 0 0
8 0 0 0 0 0 0 0 0 0
9 0 0 0 0 0 0 0 0 0
10 0 0 0 0 0 0 0 0 0
11 0 0 0 0 0 0 0 0 0
12 0 0 0 0 0 0 0 0 0
13 0 0 0 0 0 0 0 0 0
14 0 0 0 0 0 0 0 0 0
15 0 0 0 0 0 0 0 0 0
16 0 0 0 0 0 0 0 0 0
17 0 0 0 0 0 0 0 0 0
18 0 0 0 0 0 0 0 0 0
19 0 0 0 0 0 0 0 0 0
20 0 0 0 0 0 0 0 0 0
21 0 0 0 0 0 0 0 0 0
22 0 0 0 0 0 0 0 0 0
23 0 0 0 0 0 0 0 0 0
24 0 0 0 0 0 0 0 0 0
25 0 0 0 0 0 0 0 0 0
26 0 0 0 0 0 0 0 0 0
27 0 0 0 0 0 0 0 0 0
28 0 0 0 0 0 0 0 0 0
29 0 0 0 0 0 0 0 0 0
30 0 0 0 0 0 0 0 0 0
31 0 0 0 0 0 0 0 0 0
32 0 0 0 0 0 0 0 0 0
*** Program elapsed time: 5995.524s ( 5.337 blocks/s, 0.334 Mb/s)
|
| Attachment 7: 210420_0220_Stats.png
|

|
| Attachment 8: 210420_0229_Temp.png
|

|
| Attachment 9: 210420_0220_Bias.png
|
|
| Attachment 10: 210420_0225_MergerStats.png
|

|
| Attachment 11: Capture.PNG
|
|
| Attachment 12: 210420_0437_stats.png
|

|
| Attachment 13: 210420_0538_Temp.png
|

|
| Attachment 14: 210420_0439_Bias.png
|
|
| Attachment 15: 210420_0624_stats.png
|

|
| Attachment 16: 210420_0624_Temp.png
|

|
| Attachment 17: 210420_0625_Bias.png
|
|
|
257
|
Wed Apr 21 11:27:55 2021 |
OH | Wed 21st April 12:00-16:00 |
12:30 MBS has crashed
      This time AIDA is still running fine.

      Stats ok - attachment 1
      Temperature - attachment 2
      Bias and leakage currents - attachment 3

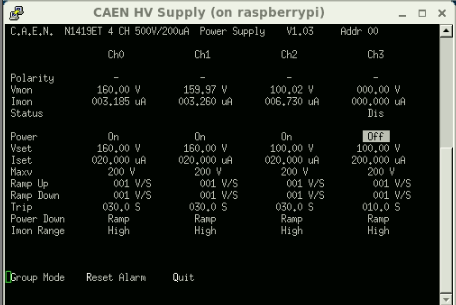
      All system wide checks ok *except*

			 Base 		Current 		Difference
aida12 fault 	 0x0 : 	 0x19 : 	 25
FPGA Timestamp error counter test result: Passed 11, Failed 1
If any of these counts are reported as in error
The ASIC readout system has detected a timeslip.
That is the timestamp read from the time FIFO is not younger than the last

     Now also note errors on aida7 and aida03 in the merger TS errors
     (0 represents the sum across all FEE)
0	1355800	0x0014b018
1	0	0x00000000
2	0	0x00000000
3	33	0x00000021
4	0	0x00000000
5	0	0x00000000
6	0	0x00000000
7	10	0x0000000a
8	0	0x00000000
9	0	0x00000000
10	0	0x00000000
11	1355757	0x0014afed

15:30 CA takes over

      Stats ok - attachment 4
      Temperature - attachment 5
      Bias and leakage currents - attachment 6

      all system wide checks ok *except*

			 Base 		Current 		Difference
aida12 fault 	 0x0 : 	 0x19 : 	 27
FPGA Timestamp error counter test result: Passed 11, Failed 1
If any of these counts are reported as in error
The ASIC readout system has detected a timeslip.
That is the timestamp read from the time FIFO is not younger than the last

15:42 db check and ucesb ok |
| Attachment 1: 210421_1338_Stats.png
|

|
| Attachment 2: 210421_1328_Temp.png
|

|
| Attachment 3: 210421_1342_Bias.png
|

|
| Attachment 4: Screenshot_from_2021-04-21_14-33-36.png
|

|
| Attachment 5: Screenshot_from_2021-04-21_14-34-29.png
|

|
| Attachment 6: Screenshot_from_2021-04-21_14-36-08.png
|
|
|
287
|
Thu Apr 29 16:56:42 2021 |
OH | Config changes for 16FEE |
New set of ASIC settings produced 2021Apr29-13-16-00
- Note no longer odd/even for polarity of signal

New set of Options file for FEEs - Points to the new ASIC settings

New layouts for histograms grouped by side of the detector. Heavily weighted to the front side in terms of number of his

/MIDAS/Linux/startup/NewMerger Updated line from "./master64 -i 12 -l 16 -p 11001  &" to "./master64 -i 16 -l 16 -p 11001  &"

/MIDAS/DB/EXPERIMENTS/MERGE/Options/aidas-gsi/CONTENTS updated the number of links to 16.

System wide checks passed *except aida03 ADC calibration*

System left running to no storage. |
|
295
|
Tue May 4 21:26:43 2021 |
OH | Alpha run |
22:26 Tape server set up to write to directory May21
      DAQ stopped
      Slow comparator set to 0x64 for all FEE64 and an ASIC check performed
      Pulser turned off
      DAQ started
      ~300k in merger - 38kB per second to file
      Statistics good (all FEE show 0 bar FEE4 at 3k) - attachment 1
      All system wide checks ok apart from FPGA check

	        Base	Current  	Difference
aida13 fault 	 0x0 : 	 0x62 : 	 98
FPGA Timestamp error counter test result: Passed 15, Failed 1
If any of these counts are reported as in error
The ASIC readout system has detected a timeslip.
That is the timestamp read from the time FIFO is not younger than the last

     Histograms zeroed.
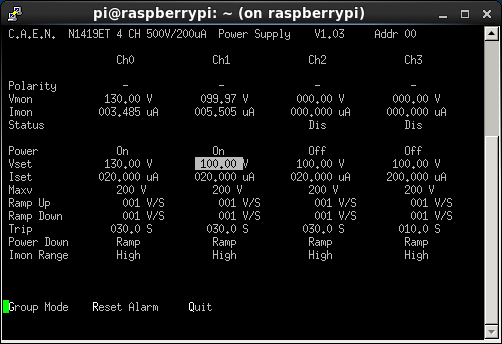
     DSSD1 at 130V
     DSSD2 at 100V

08:47 Found DAQ running at c. 3M data items/s / 13MB/s
      Switched Tape Server to no storage mode

[npg@aidas-gsi ~]$ ls -lrth /TapeData/May21
total 113G
-rw-rw-r--. 1 npg npg  64K May  4 22:24 R1_0
-rw-rw-r--. 1 npg npg  64K May  4 22:24 R1_1
-rw-rw-r--. 1 npg npg  64K May  4 22:24 R1_2
-rw-rw-r--. 1 npg npg  64K May  4 22:24 R1_3
-rw-rw-r--. 1 npg npg  64K May  4 22:24 R1_4
-rw-rw-r--. 1 npg npg  64K May  4 22:24 R1_5
-rw-rw-r--. 1 npg npg  64K May  4 22:24 R1_6
-rw-rw-r--. 1 npg npg  64K May  4 22:24 R1_7
-rw-rw-r--. 1 npg npg  64K May  4 22:24 R1_8
-rw-rw-r--. 1 npg npg  64K May  4 22:24 R1_9
-rw-rw-r--. 1 npg npg 1.3G May  5 06:15 R1_10
-rw-rw-r--. 1 npg npg 2.0G May  5 06:17 R1_11
-rw-rw-r--. 1 npg npg 2.0G May  5 06:20 R1_12
-rw-rw-r--. 1 npg npg 2.0G May  5 06:23 R1_13
-rw-rw-r--. 1 npg npg 2.0G May  5 06:25 R1_14
-rw-rw-r--. 1 npg npg 2.0G May  5 06:28 R1_15
-rw-rw-r--. 1 npg npg 2.0G May  5 06:30 R1_16
-rw-rw-r--. 1 npg npg 2.0G May  5 06:33 R1_17
-rw-rw-r--. 1 npg npg 2.0G May  5 06:36 R1_18
-rw-rw-r--. 1 npg npg 2.0G May  5 06:38 R1_19
-rw-rw-r--. 1 npg npg 2.0G May  5 06:41 R1_20
-rw-rw-r--. 1 npg npg 2.0G May  5 06:43 R1_21
-rw-rw-r--. 1 npg npg 2.0G May  5 06:46 R1_22
-rw-rw-r--. 1 npg npg 2.0G May  5 06:49 R1_23
-rw-rw-r--. 1 npg npg 2.0G May  5 06:51 R1_24
-rw-rw-r--. 1 npg npg 2.0G May  5 06:54 R1_25
-rw-rw-r--. 1 npg npg 2.0G May  5 06:57 R1_26
-rw-rw-r--. 1 npg npg 2.0G May  5 06:59 R1_27
-rw-rw-r--. 1 npg npg 2.0G May  5 07:02 R1_28
-rw-rw-r--. 1 npg npg 2.0G May  5 07:04 R1_29
-rw-rw-r--. 1 npg npg 2.0G May  5 07:07 R1_30
-rw-rw-r--. 1 npg npg 2.0G May  5 07:10 R1_31
-rw-rw-r--. 1 npg npg 2.0G May  5 07:12 R1_32
-rw-rw-r--. 1 npg npg 2.0G May  5 07:15 R1_33
-rw-rw-r--. 1 npg npg 2.0G May  5 07:18 R1_34
-rw-rw-r--. 1 npg npg 2.0G May  5 07:20 R1_35
-rw-rw-r--. 1 npg npg 2.0G May  5 07:23 R1_36
-rw-rw-r--. 1 npg npg 2.0G May  5 07:25 R1_37
-rw-rw-r--. 1 npg npg 2.0G May  5 07:28 R1_38
-rw-rw-r--. 1 npg npg 2.0G May  5 07:31 R1_39
-rw-rw-r--. 1 npg npg 2.0G May  5 07:33 R1_40
-rw-rw-r--. 1 npg npg 2.0G May  5 07:36 R1_41
-rw-rw-r--. 1 npg npg 2.0G May  5 07:39 R1_42
-rw-rw-r--. 1 npg npg 2.0G May  5 07:41 R1_43
-rw-rw-r--. 1 npg npg 2.0G May  5 07:44 R1_44
-rw-rw-r--. 1 npg npg 2.0G May  5 07:46 R1_45
-rw-rw-r--. 1 npg npg 2.0G May  5 07:49 R1_46
-rw-rw-r--. 1 npg npg 2.0G May  5 07:52 R1_47
-rw-rw-r--. 1 npg npg 2.0G May  5 07:54 R1_48
-rw-rw-r--. 1 npg npg 2.0G May  5 07:57 R1_49
-rw-rw-r--. 1 npg npg 2.0G May  5 08:00 R1_50
-rw-rw-r--. 1 npg npg 2.0G May  5 08:02 R1_51
-rw-rw-r--. 1 npg npg 2.0G May  5 08:05 R1_52
-rw-rw-r--. 1 npg npg 2.0G May  5 08:07 R1_53
-rw-rw-r--. 1 npg npg 2.0G May  5 08:10 R1_54
-rw-rw-r--. 1 npg npg 2.0G May  5 08:13 R1_55
-rw-rw-r--. 1 npg npg 2.0G May  5 08:15 R1_56
-rw-rw-r--. 1 npg npg 2.0G May  5 08:18 R1_57
-rw-rw-r--. 1 npg npg 2.0G May  5 08:20 R1_58
-rw-rw-r--. 1 npg npg 2.0G May  5 08:23 R1_59
-rw-rw-r--. 1 npg npg 2.0G May  5 08:26 R1_60
-rw-rw-r--. 1 npg npg 2.0G May  5 08:28 R1_61
-rw-rw-r--. 1 npg npg 2.0G May  5 08:31 R1_62
-rw-rw-r--. 1 npg npg 2.0G May  5 08:34 R1_63
-rw-rw-r--. 1 npg npg 2.0G May  5 08:36 R1_64
-rw-rw-r--. 1 npg npg 2.0G May  5 08:39 R1_65
-rw-rw-r--. 1 npg npg 2.0G May  5 08:41 R1_66
-rw-rw-r--. 1 npg npg 1.6G May  5 08:44 R1_67
[npg@aidas-gsi ~]$

      Rate increased c. 06.15
       multiple ASICs in multiple FEE64s hot HEC channels
      ASIC check load restores rates to those at beginning of May21/R1
      Switched Tape Server to storage mode - file May21/R1_67

08.53 All system wide checks OK *except*

			 Base 		Current 		Difference
aida07 fault 	 0x0 : 	 0x1 : 	 1
aida08 fault 	 0x0 : 	 0x1 : 	 1
aida13 fault 	 0x62 : 	 0x9380 : 	 37662
FPGA Timestamp error counter test result: Passed 13, Failed 3
If any of these counts are reported as in error
The ASIC readout system has detected a timeslip.
That is the timestamp read from the time FIFO is not younger than the last

      Most recent merger errors

MERGE Data Link (2497): bad timestamp  7 3 0xd1fc813c 0x073033d6 0x00001083773033d6 0x167c1083773033d6 0x167c108377304b46
MERGE Data Link (2497): bad timestamp  7 3 0xd1ce7ff9 0x07303ba6 0x0000108377303ba6 0x167c108377303ba6 0x167c108377304b46
MERGE Data Link (2497): bad timestamp  7 3 0xd1dd806e 0x07303ba6 0x0000108377303ba6 0x167c108377303ba6 0x167c108377304b46
MERGE Data Link (2497): bad timestamp  7 3 0xd1ed7fc1 0x07303ba6 0x0000108377303ba6 0x167c108377303ba6 0x167c108377304b46
MERGE Data Link (2497): bad timestamp  7 3 0xd1fd803c 0x07303ba6 0x0000108377303ba6 0x167c108377303ba6 0x167c108377304b46
MERGE Data Link (2497): bad timestamp  7 3 0xd1cf8066 0x07304376 0x0000108377304376 0x167c108377304376 0x167c108377304b46
MERGE Data Link (2497): bad timestamp  7 3 0xd1de8110 0x07304376 0x0000108377304376 0x167c108377304376 0x167c108377304b46
MERGE Data Link (2497): bad timestamp  7 3 0xd1ee8086 0x07304376 0x0000108377304376 0x167c108377304376 0x167c108377304b46
MERGE Data Link (2497): bad timestamp  7 3 0xd1fe7ff7 0x07304376 0x0000108377304376 0x167c108377304376 0x167c108377304b46
MERGE Data Link (2497): bad timestamp  7 3 0xd1c38041 0x0e60a6d6 0x000010832e60a6d6 0x167c10832e60a6d6 0x167c108377304b46

09.04 FEE64 temps OK - attachment 2
      ADC data item stats - attachment 3
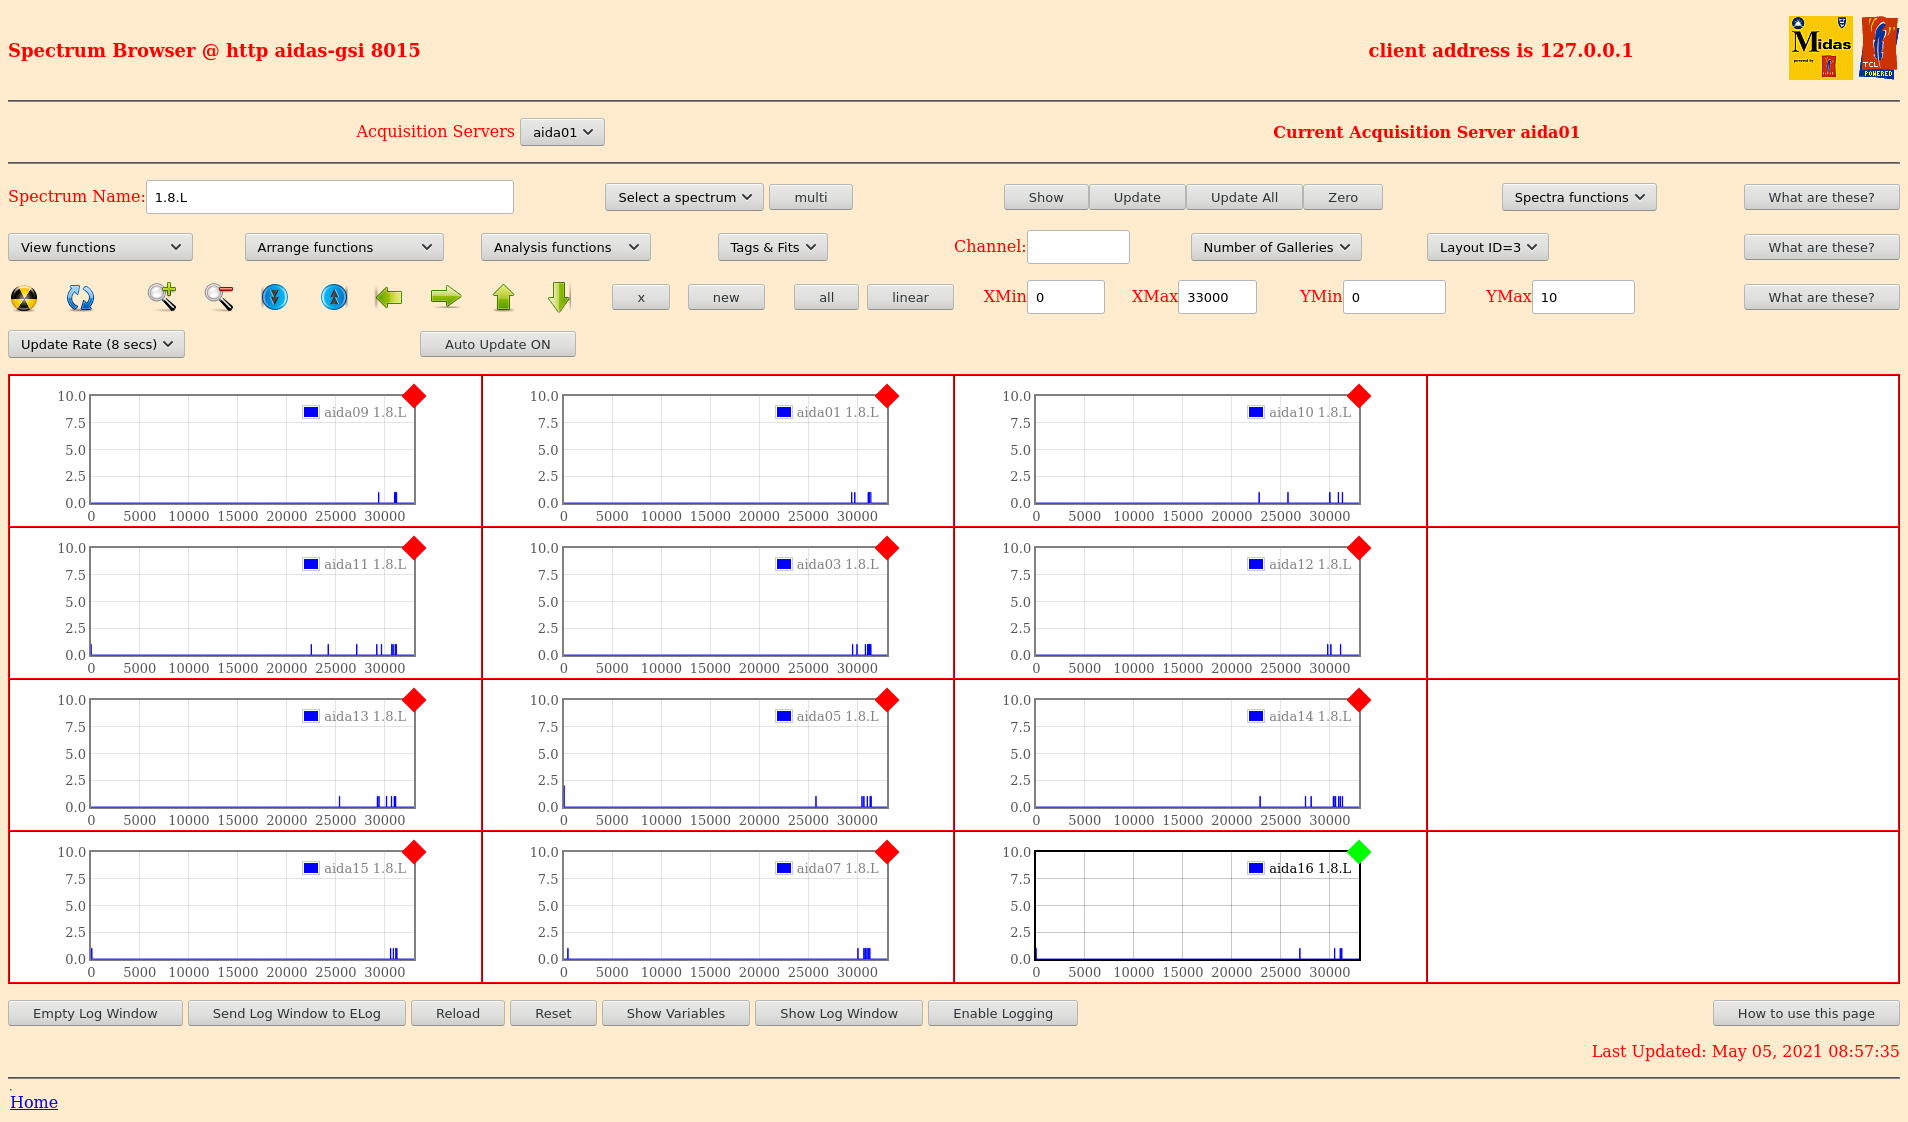
      1.8.L spectra - attachments 4 & 5
      1.8.W spectra - attachments 6 & 7
      Grafana DSSSD bias & Leakage current most recent 24h - attachment 8
      DSSSD bias & leakage current - attacment 9

11:32 R1 stopped to realign boards and check situation in S4 |
| Attachment 1: 210504_2228_Stats.png
|

|
| Attachment 2: Screenshot_2021-05-05_Temperature_and_status_scan_aidas-gsi.png
|

|
| Attachment 3: Screenshot_2021-05-05_Statistics_aidas-gsi.png
|

|
| Attachment 4: Screenshot_2021-05-05_Spectrum_Browser_aidas-gsi.png
|
|
| Attachment 5: Screenshot_2021-05-05_Spectrum_Browser_aidas-gsi(1).png
|
.png.png)
|
| Attachment 6: Screenshot_2021-05-05_Spectrum_Browser_aidas-gsi(2).png
|
.png.png)
|
| Attachment 7: Screenshot_2021-05-05_Spectrum_Browser_aidas-gsi(3).png
|
.png.png)
|
| Attachment 8: Screenshot_2021-05-05_Spectrum_Browser_aidas-gsi(4).png
|
.png.png)
|
| Attachment 9: Screenshot_2021-05-05_AIDA_Alerting_-_Grafana.png
|

|
| Attachment 10: 400.png
|
|
|
297
|
Wed May 5 20:10:16 2021 |
OH | Wednesday 5 May Alpha run |
21:10 After all of the works in S4 today the noise in the system was considerably worse
      It was decided that before starting a new alpha run a powercycle would be performed.
      The powercycle has had no effect on the rates. They are still terrible.

      The difference between yesterday and today is:
      - Adaptor cards for FEE9 and 13 were re-aligned as they were previously misaligned
      - bPlast has been plugged in and biased

      All system wide checks ok
      Statistics threshold at 0xa - attachment 1
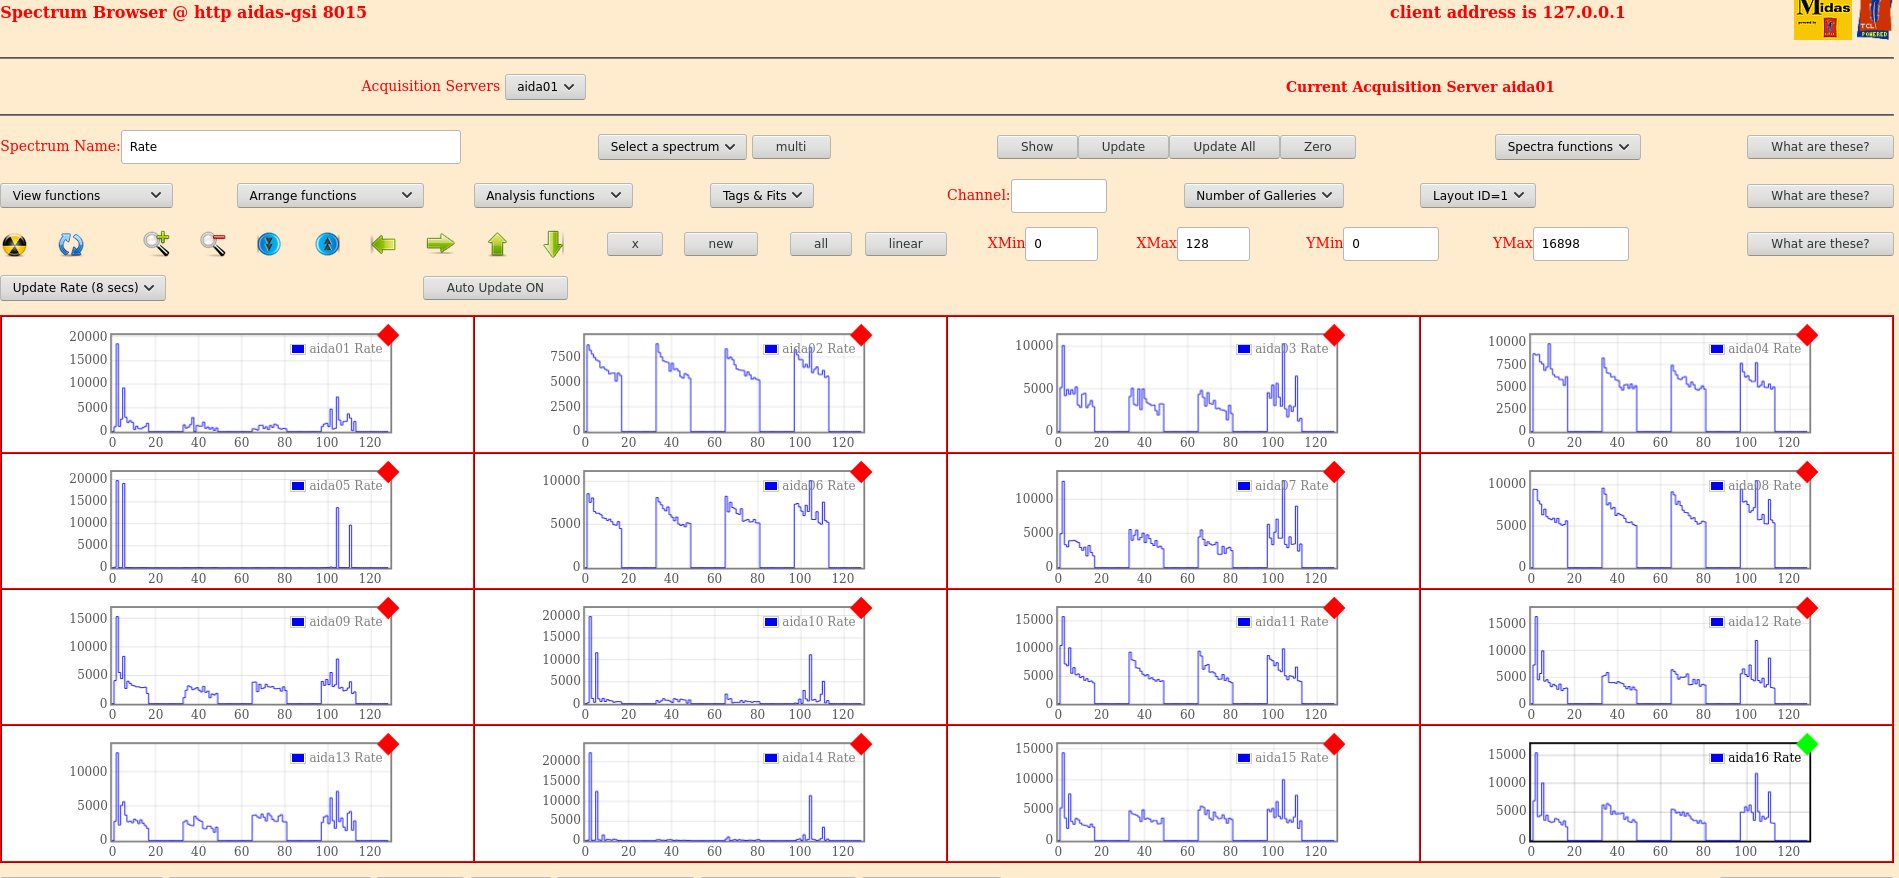
      Rate spectra (FEE5 does have events in all channels just noise is dominated by a few) - attachment 2
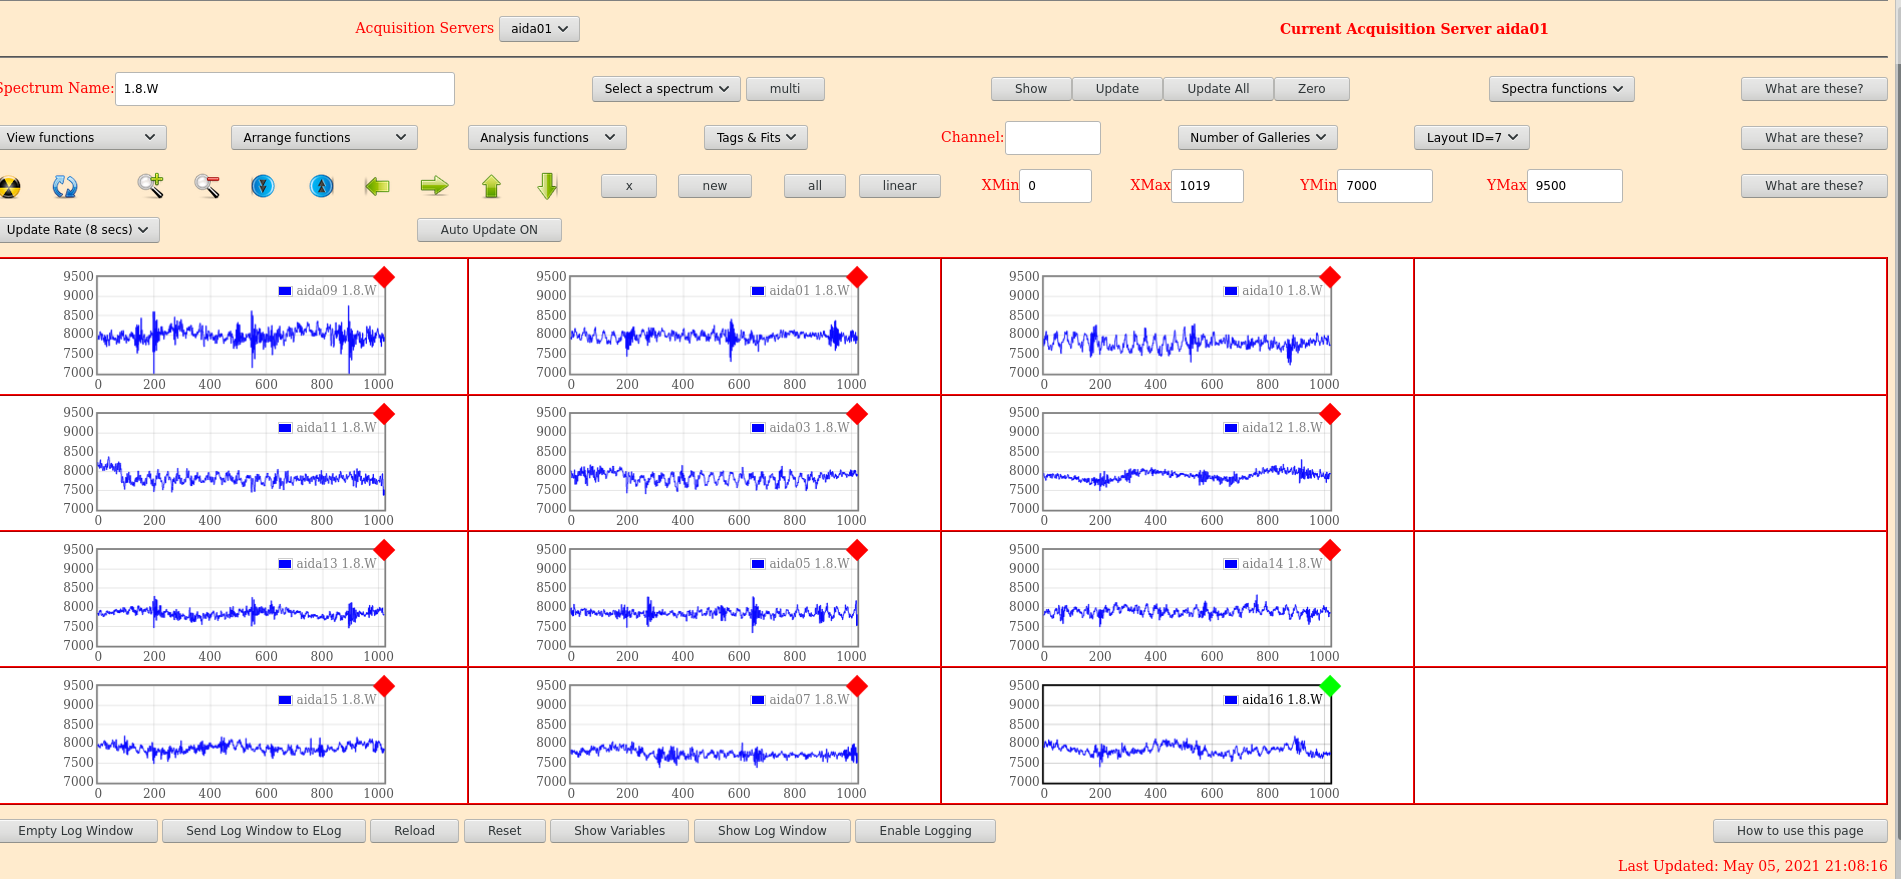
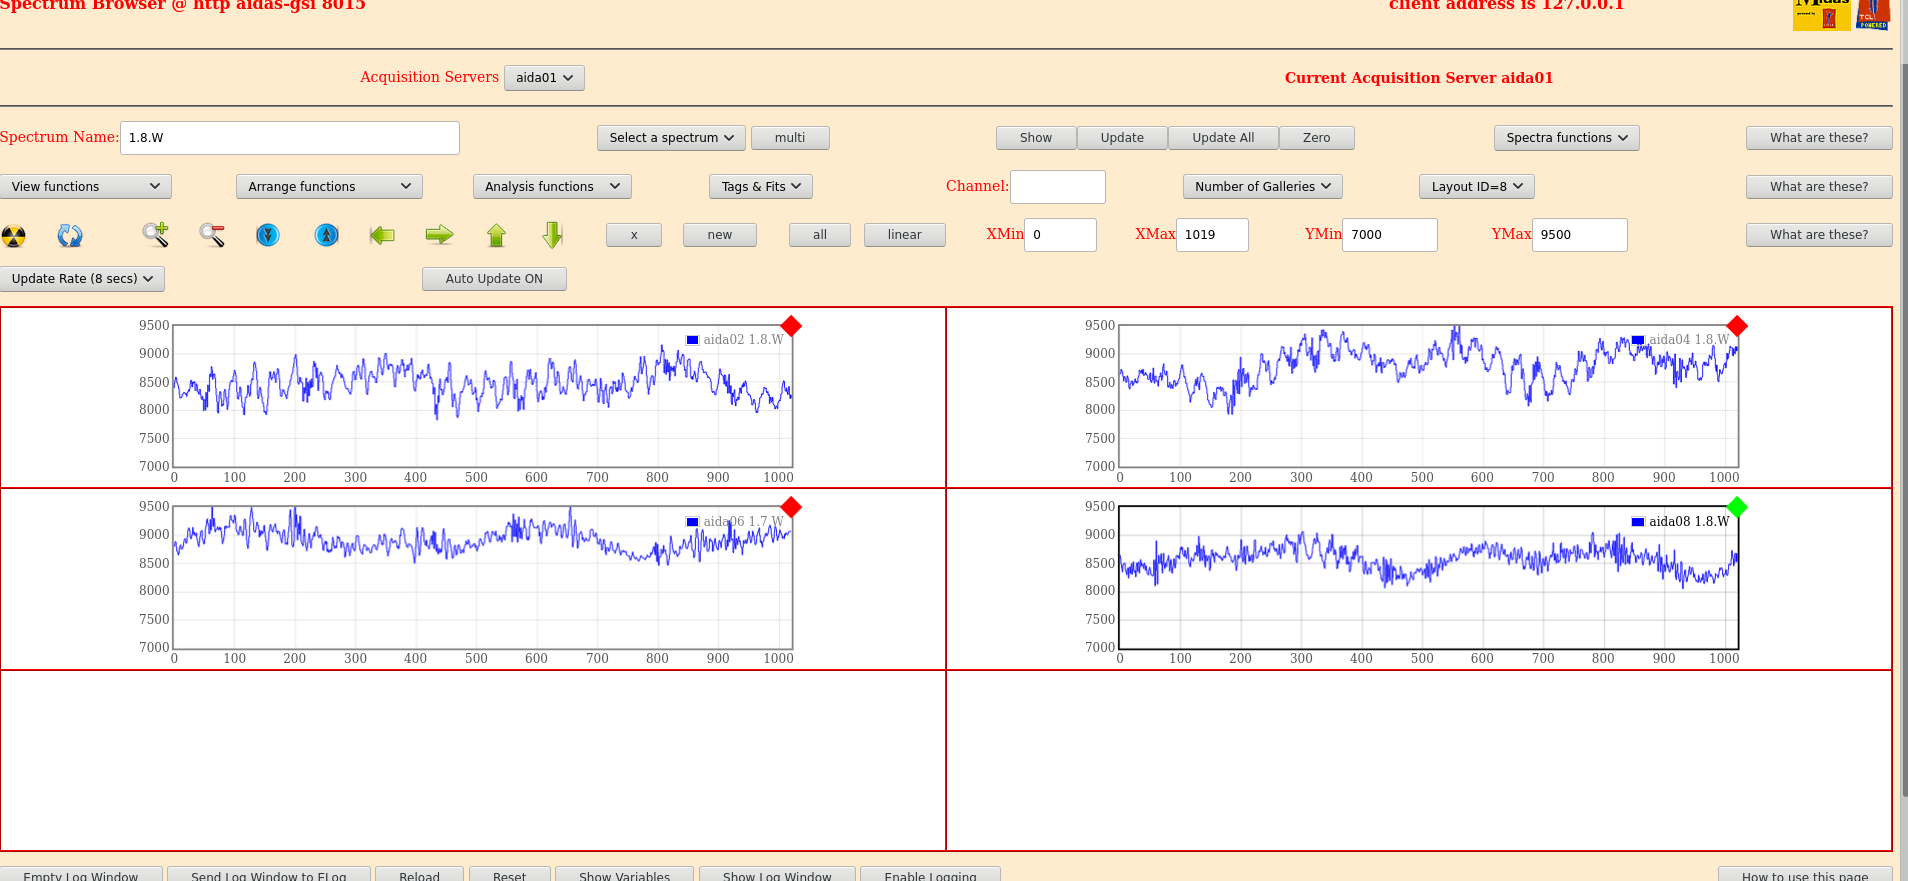
      Waveforms - attachments 3 and 4

      Pulser turned off and threshold raised to 0x64
      Statistics - attachment 5

21:19 Alpha run started to May21/R4*


08:51 DAQ continues OK - file May21/R4_23

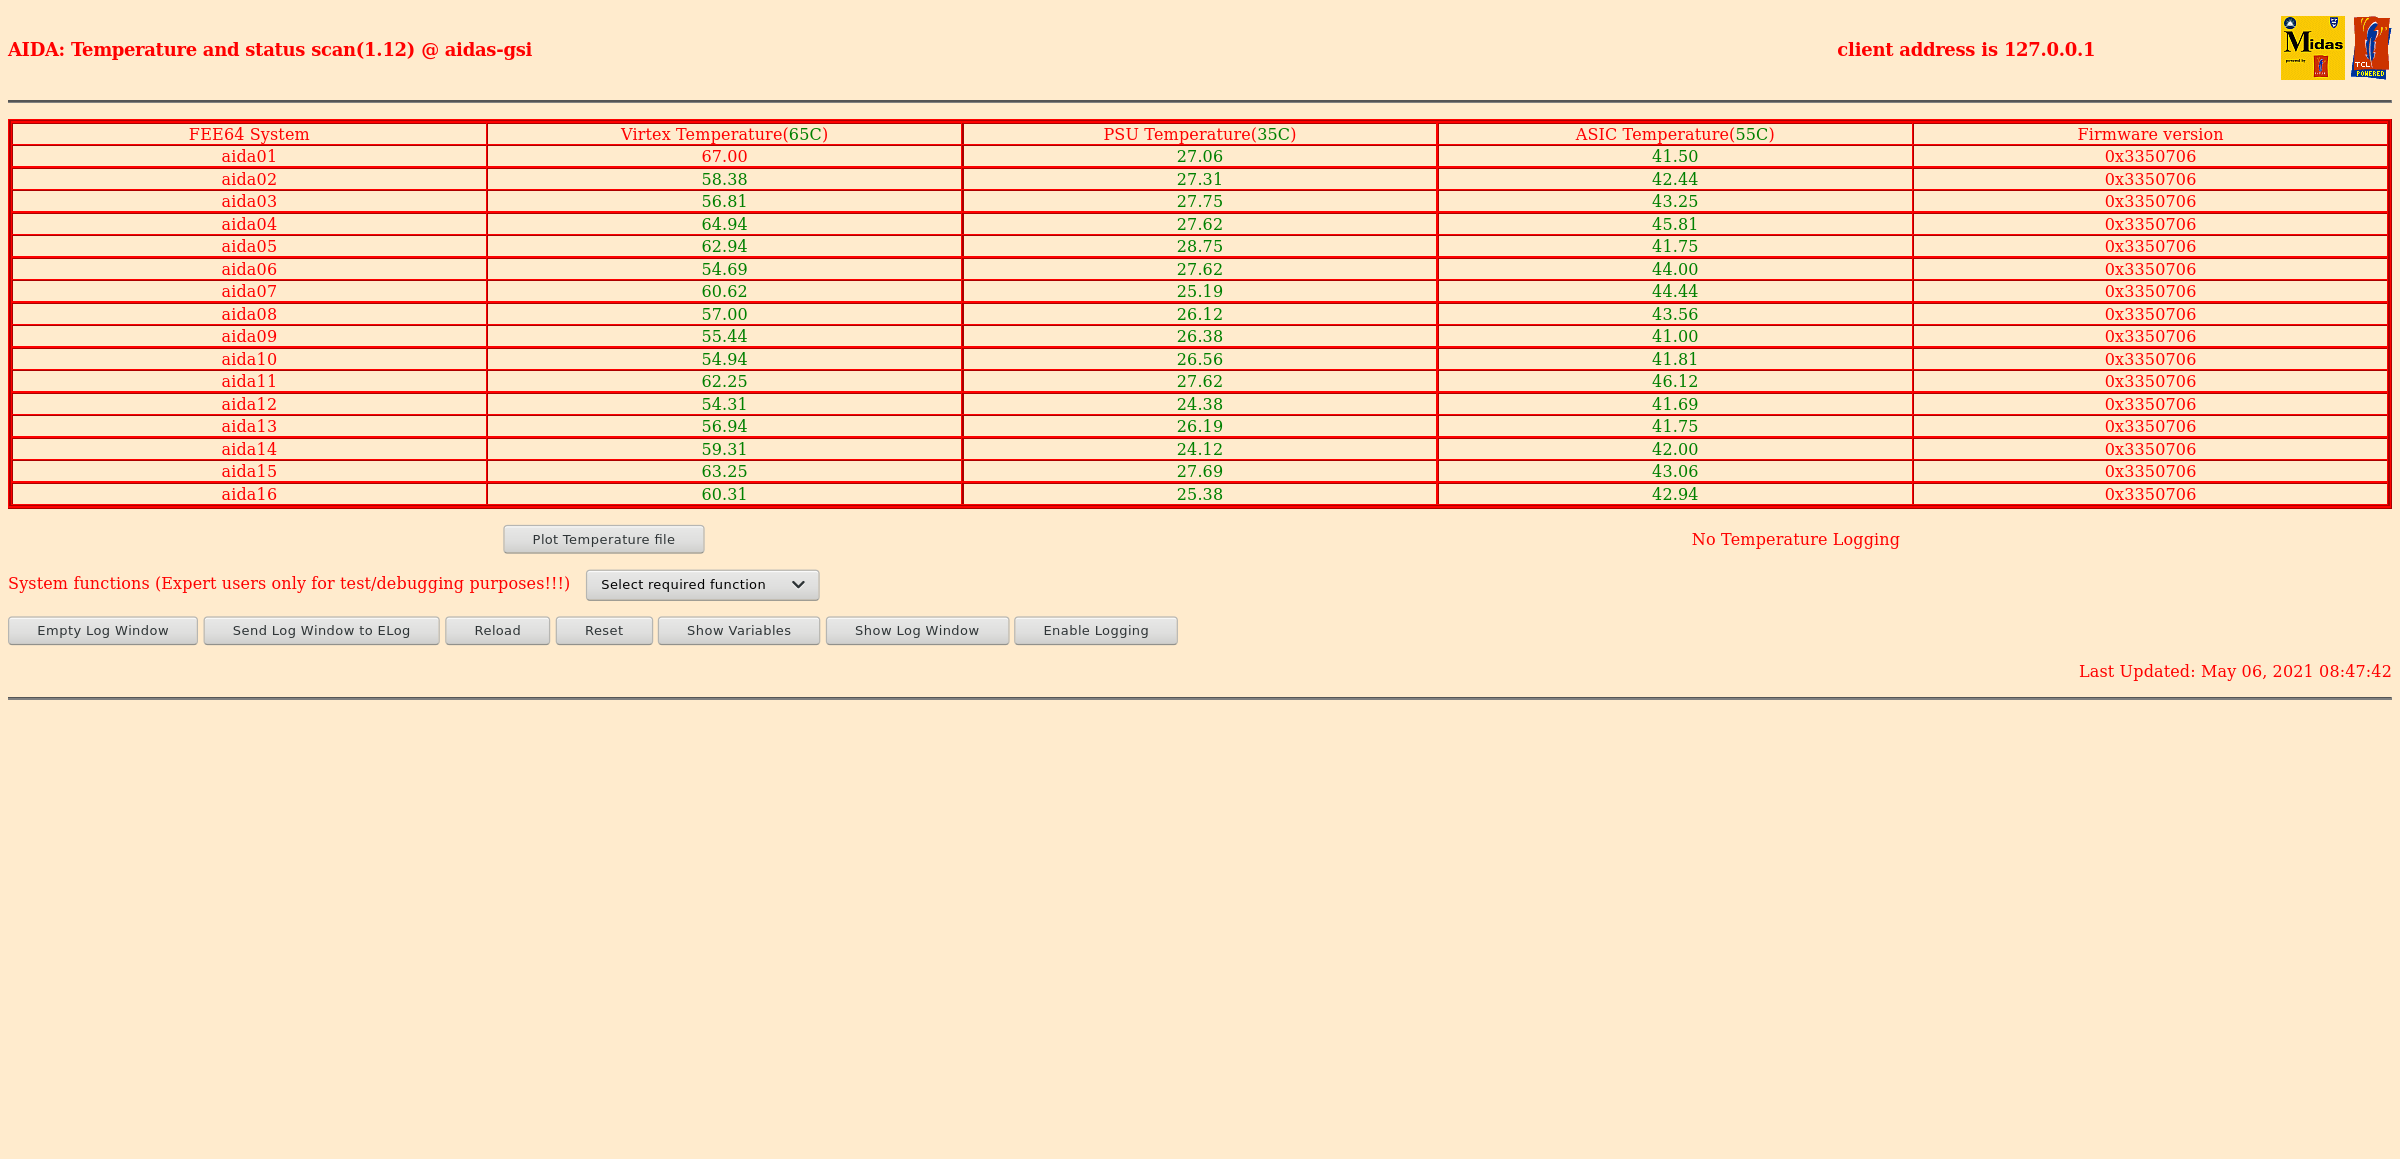
      FEE64 temps OK - attachment 8
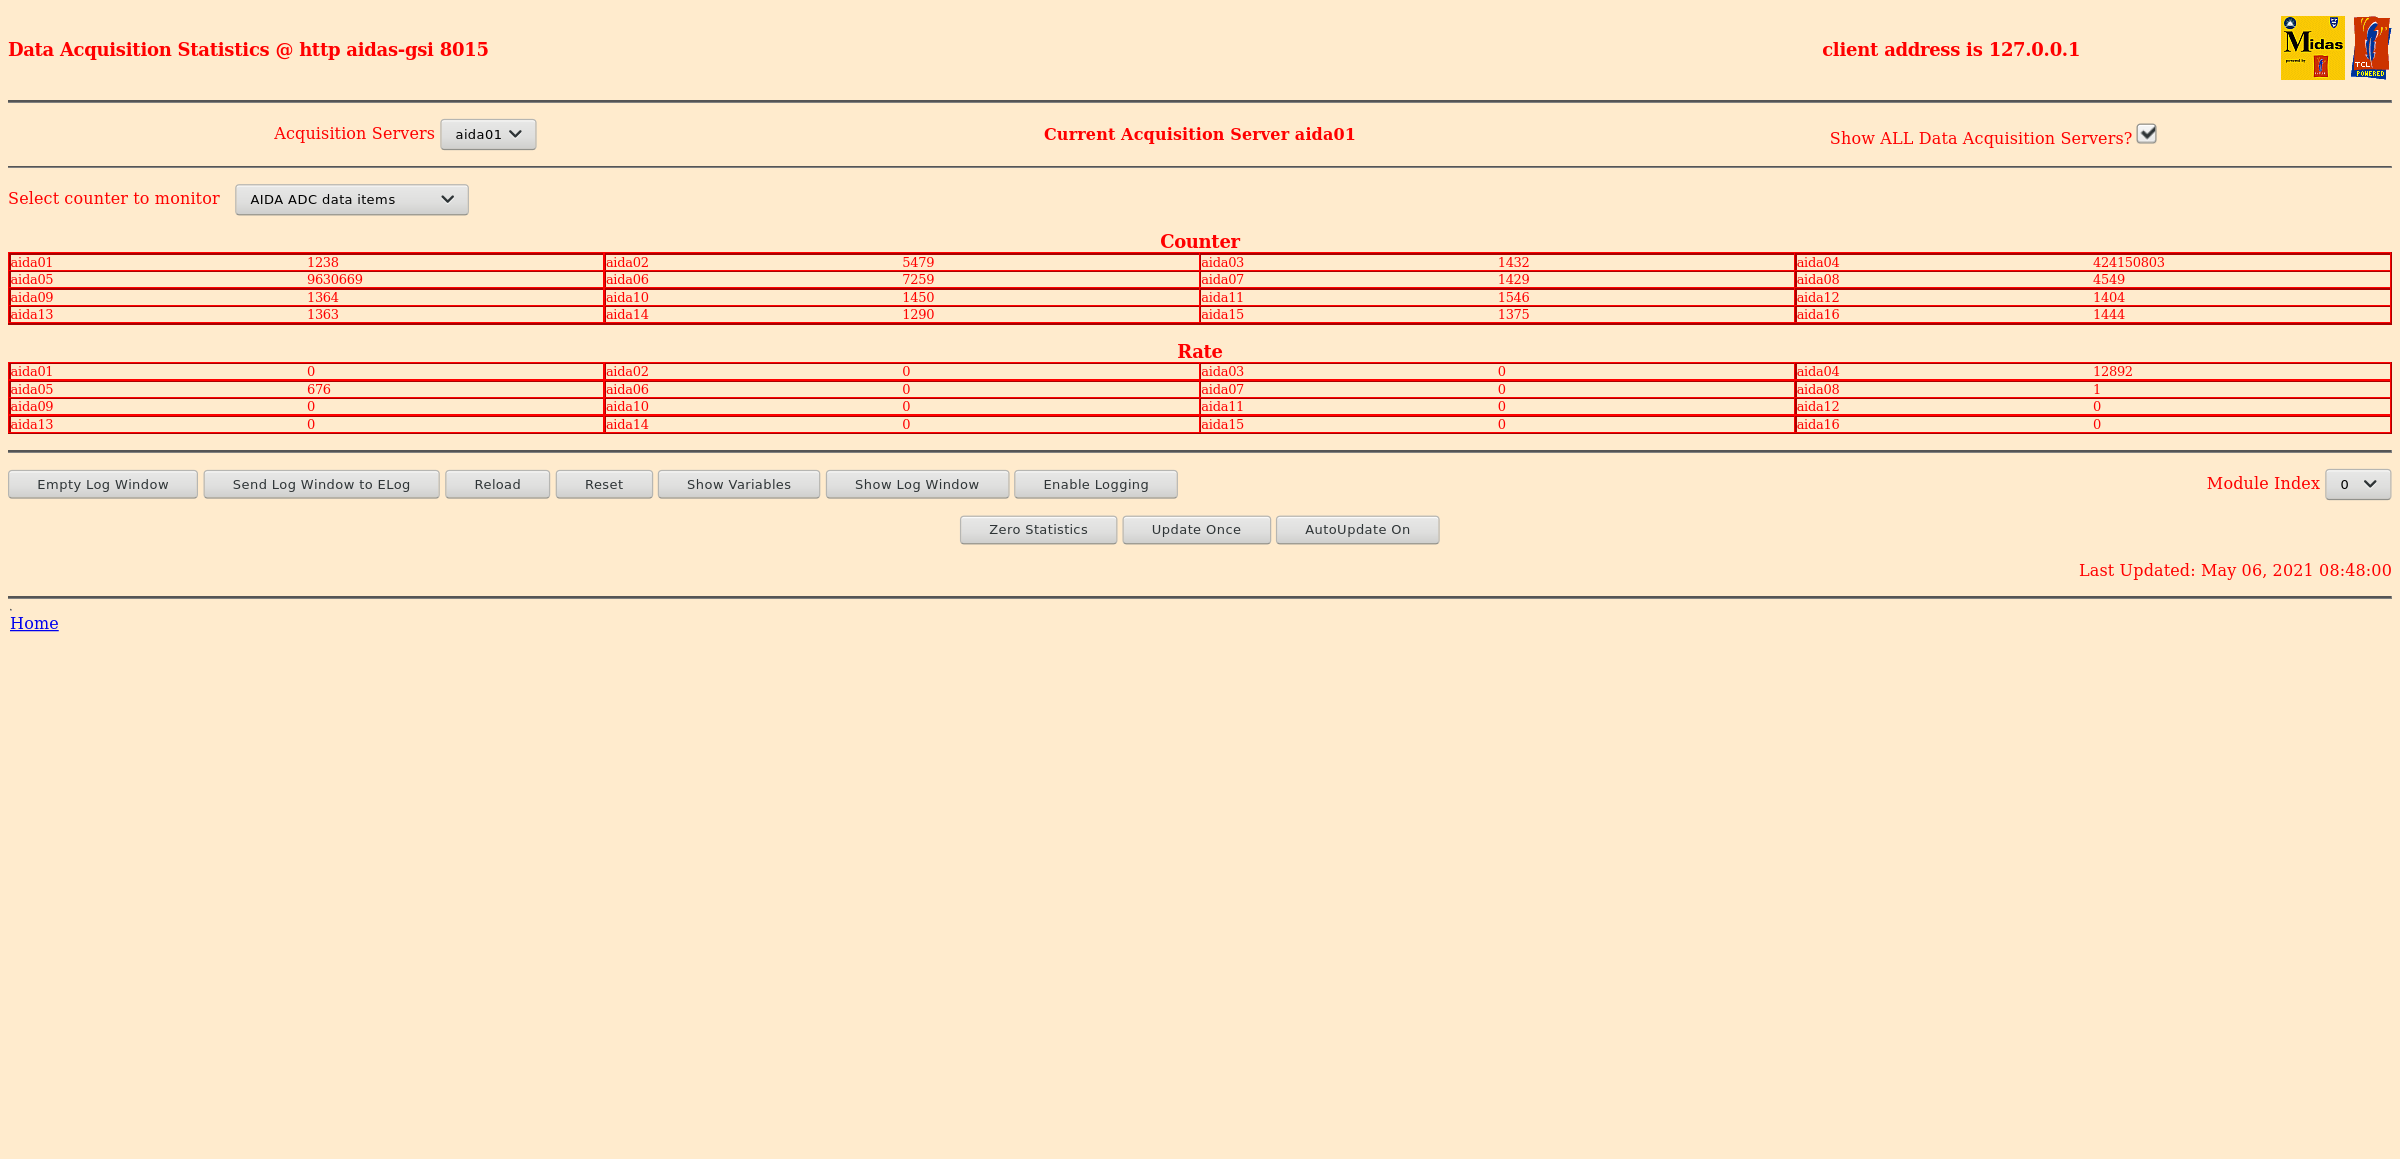
      ADC data items OK - attachment 9
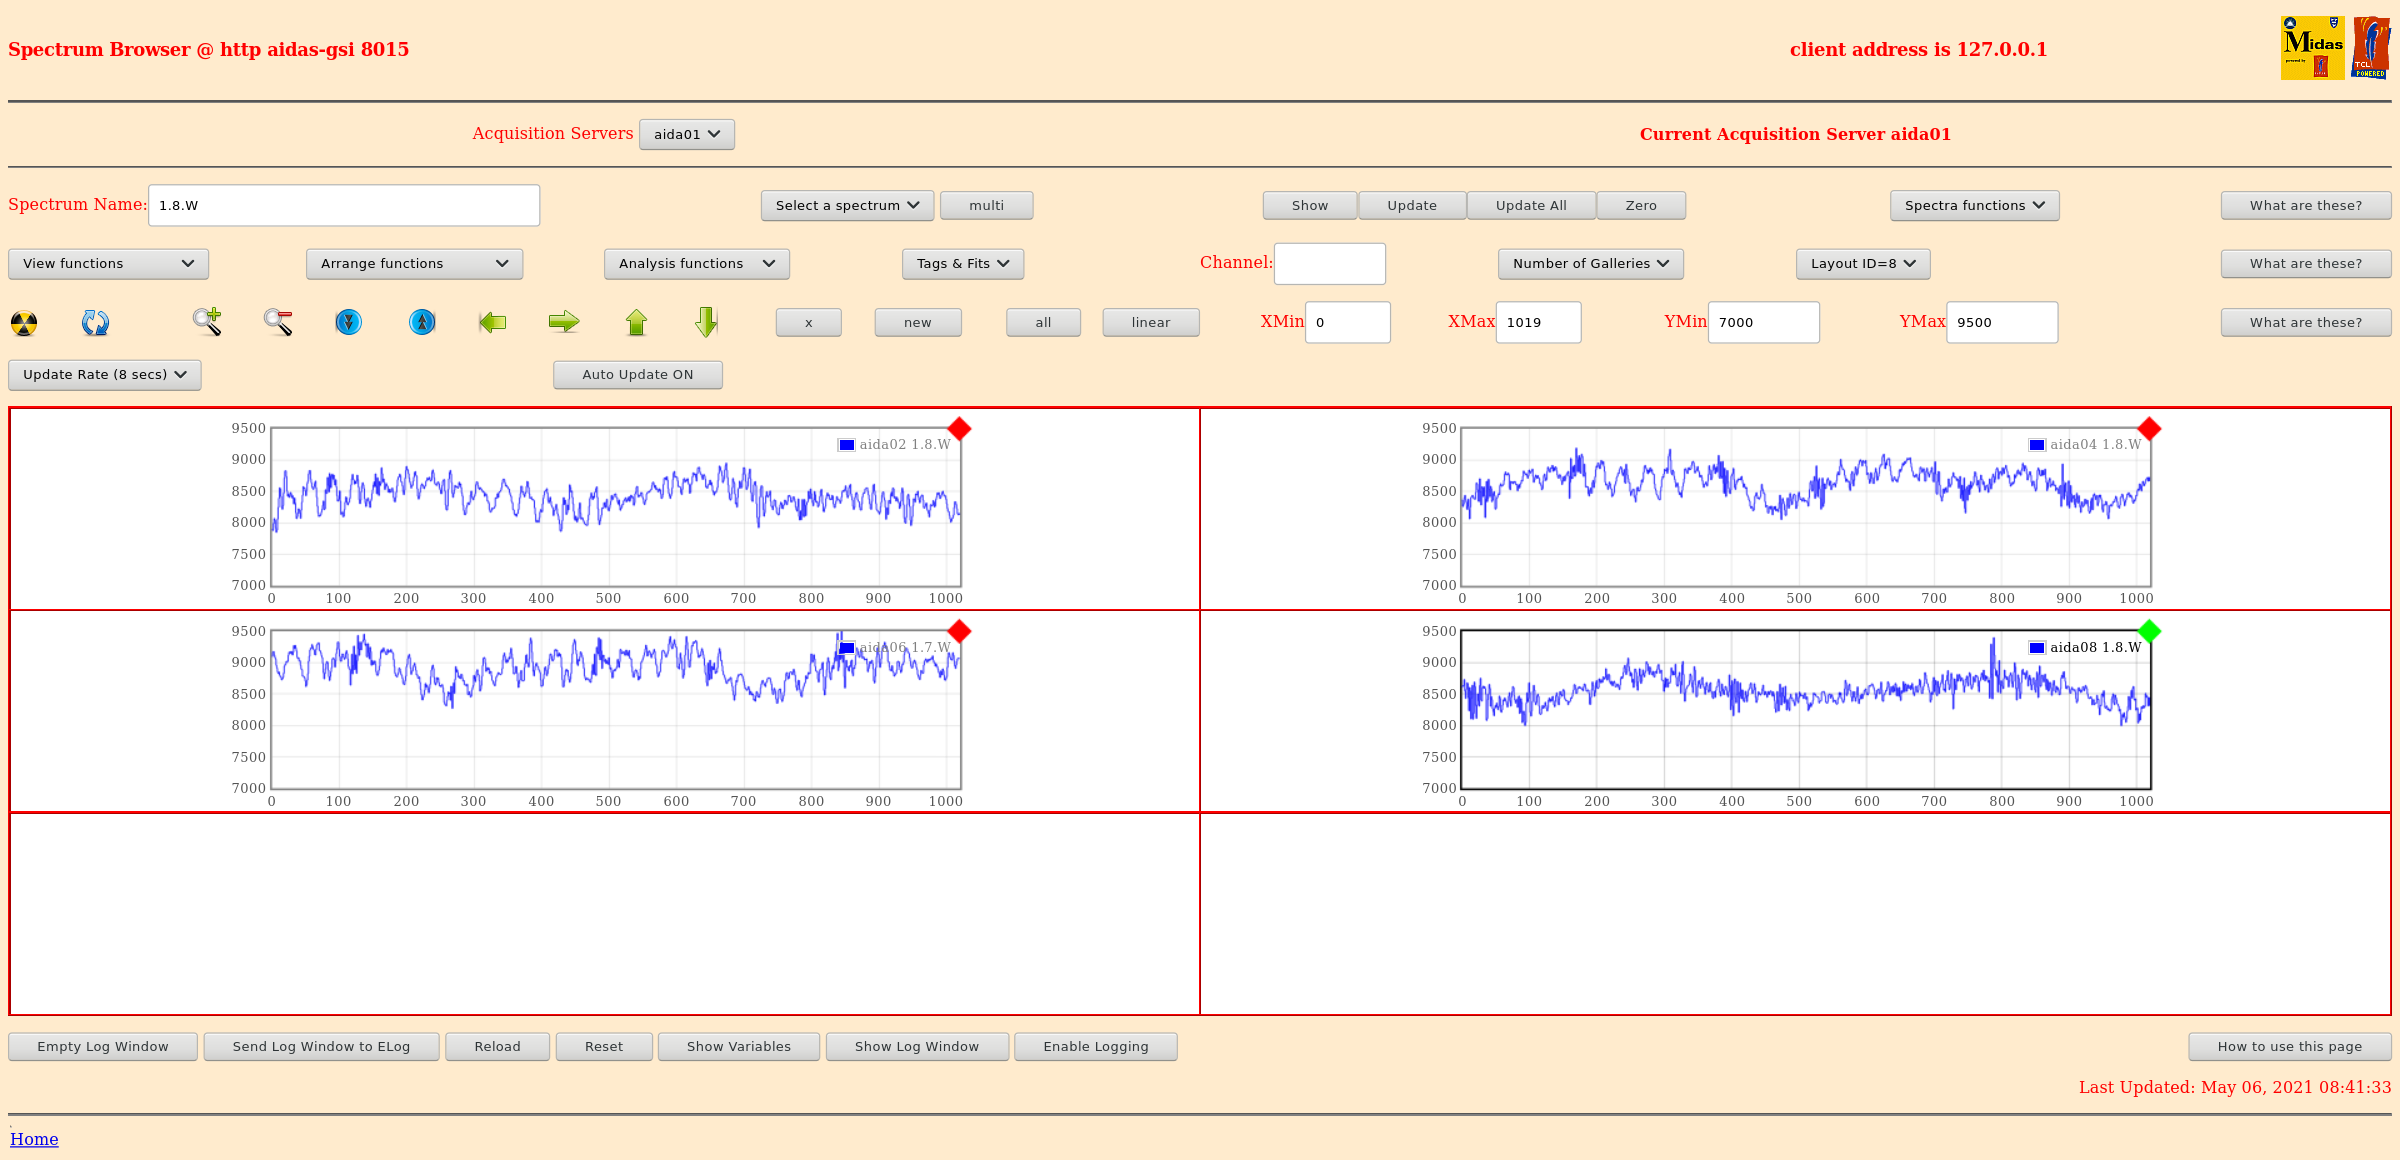
      1.8.W spectra - attachments 6 & 7
       no change cf. yesterday pm
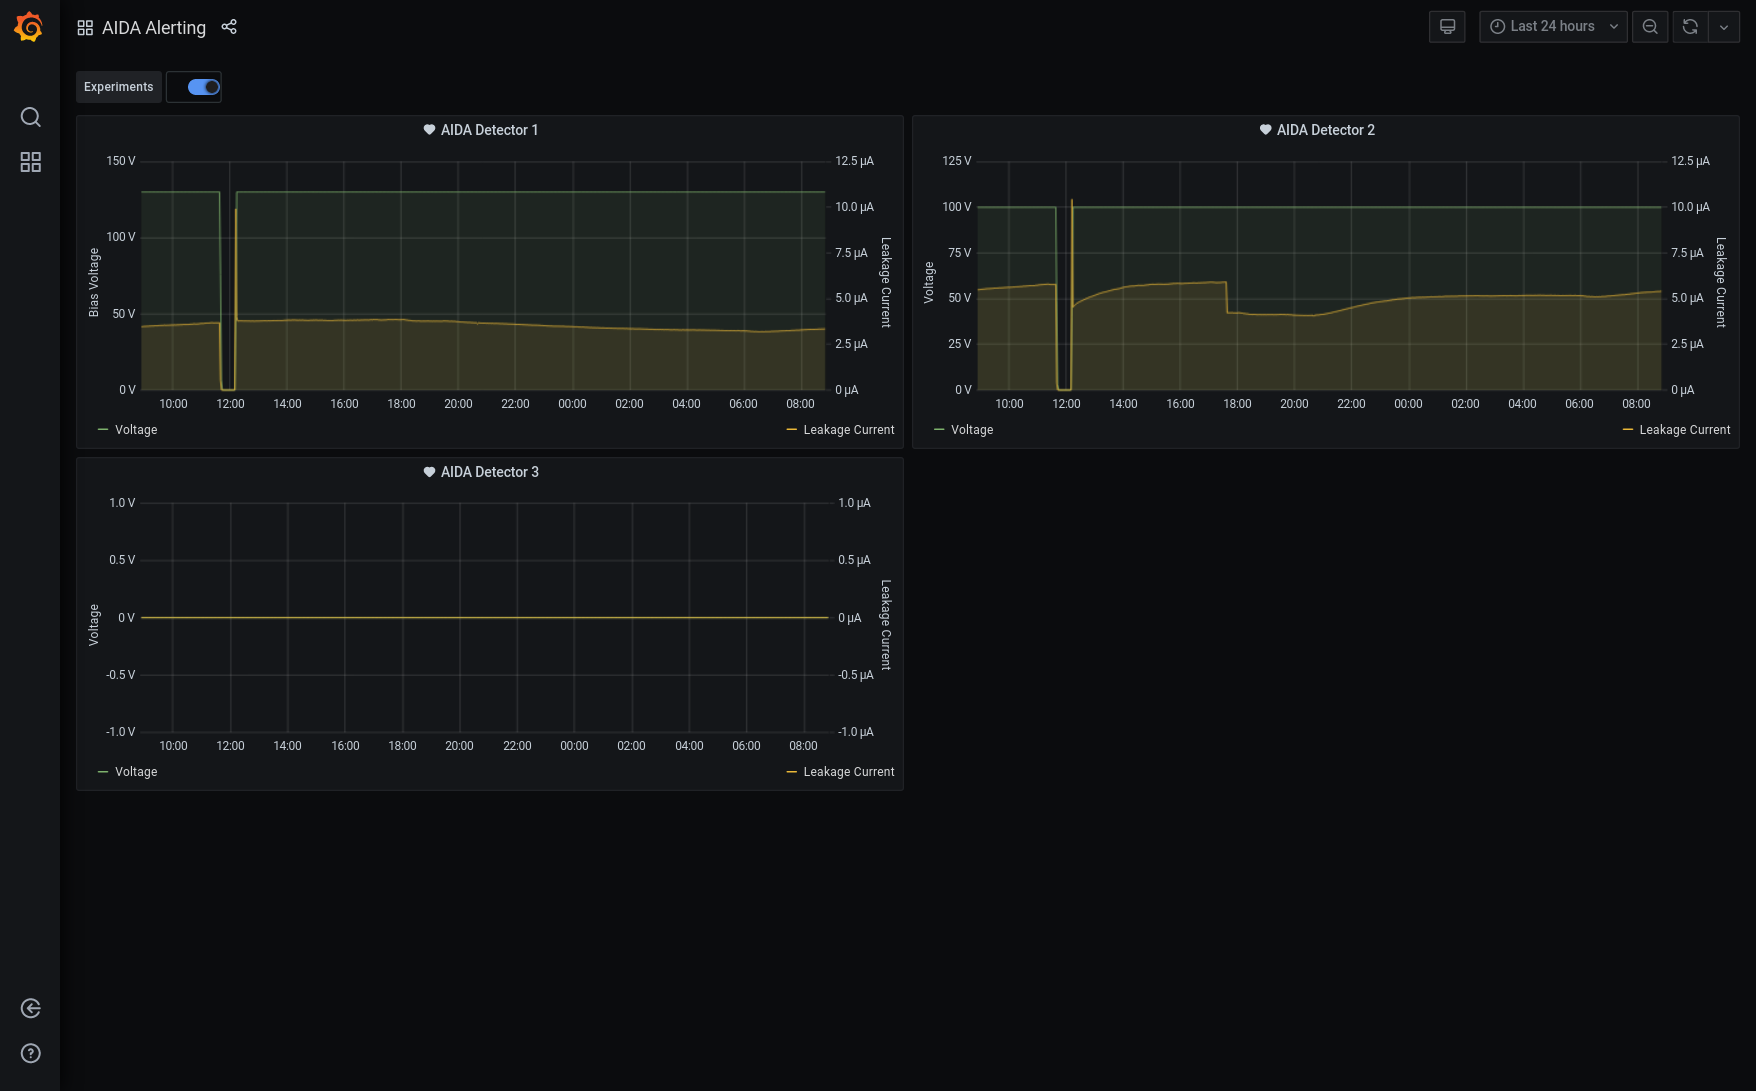
      Grafana - most recent 12h DSSSD bias & leakage current - attachment 10
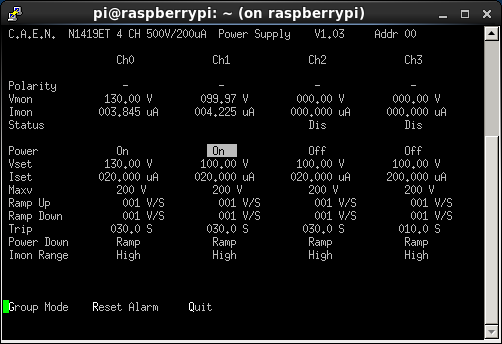
      DSSSD biases & leakage currents - attachment 11
      Tape Server/Merger - attachment 12

09:44 R4 stopped |
| Attachment 1: 210504_2105_Stats.png
|

|
| Attachment 2: 210504_2107_Layout1.png
|
|
| Attachment 3: 210504_2108_layout7.png
|
|
| Attachment 4: 210504_2109_Layout8.png
|
|
| Attachment 5: 210504_2115_stats.png
|

|
| Attachment 6: Screenshot_2021-05-06_Spectrum_Browser_aidas-gsi.png
|
|
| Attachment 7: Screenshot_2021-05-06_Spectrum_Browser_aidas-gsi(1).png
|
.png.png)
|
| Attachment 8: Screenshot_2021-05-06_Temperature_and_status_scan_aidas-gsi.png
|
|
| Attachment 9: Screenshot_2021-05-06_Statistics_aidas-gsi.png
|
|
| Attachment 10: Screenshot_2021-05-06_AIDA_Alerting_-_Grafana.png
|
|
| Attachment 11: 401.png
|
|
| Attachment 12: 402.png
|

|
|
305
|
Tue May 11 07:21:24 2021 |
OH | Tuesday 11 May |
08:20 System wide checks all ok except
		 Base 		Current 	Difference
aida01 fault 	 0xc10c : 	 0xc10e : 	 2
aida02 fault 	 0xbe2a : 	 0xbe2c : 	 2
aida03 fault 	 0xf665 : 	 0xf667 : 	 2
aida04 fault 	 0xeabd : 	 0xeabf : 	 2
aida05 fault 	 0x36c8 : 	 0x36ca : 	 2
aida06 fault 	 0x2ea2 : 	 0x2ea4 : 	 2
aida07 fault 	 0x9186 : 	 0x9188 : 	 2
aida08 fault 	 0x5443 : 	 0x5445 : 	 2
White Rabbit error counter test result: Passed 8, Failed 8

Understand the status reports as follows:-
Status bit 3 : White Rabbit decoder detected an error in the received data
Status bit 2 : Firmware registered WR error, no reload of Timestamp
Status bit 0 : White Rabbit decoder reports uncertain of Timestamp information from WR

and


		 Base 		Current 	Difference
aida01 fault 	 0xc10c : 	 0xc10e : 	 2
aida02 fault 	 0xbe2a : 	 0xbe2c : 	 2
aida03 fault 	 0xf665 : 	 0xf667 : 	 2
aida04 fault 	 0xeabd : 	 0xeabf : 	 2
aida05 fault 	 0x36c8 : 	 0x36ca : 	 2
aida06 fault 	 0x2ea2 : 	 0x2ea4 : 	 2
aida07 fault 	 0x9186 : 	 0x9188 : 	 2
aida08 fault 	 0x5443 : 	 0x5445 : 	 2
White Rabbit error counter test result: Passed 8, Failed 8

Understand the status reports as follows:-
Status bit 3 : White Rabbit decoder detected an error in the received data
Status bit 2 : Firmware registered WR error, no reload of Timestamp
Status bit 0 : White Rabbit decoder reports uncertain of Timestamp information from WR

    Statistics still high - attachment 1
    Temperatures ok - attachment 2
Bias and leakage currents ok - attachment 3 |
| Attachment 1: 210511_0823_Stats.png
|

|
| Attachment 2: 210511_0824_Temp.png
|

|
| Attachment 3: 210511_0825_Bias.png
|

|
|
315
|
Thu May 13 23:58:05 2021 |
OH | Friday 14th May 00:00 - 08:00 |
00:00 OH Takes over.
 PULSER SETTINGS
---------------------------
 Pulse is ON
 Positive Tail Pulse
 Trigger Source is Internal Clock
 Trigger Threshold is 3.5
 Amplitude   : 2.0 Volts
 Rep Rate    : 2.0 hZ
 Delay       : 250.0 ns
 Fall Time   : 1 ms
 Attenuation : 1
 Display is  : Volts
 Equivalent keV is : 200.0
 Ramp Start at 0.01 Volts
 Ramp Stop  at 9.99 Volts
 Ramp Start at 1.0 keV
 Ramp Stop  at 999.0 keV
 Ramp Time  is 60 seconds
 # Ramp Cycles is 1

OK
0x210

 p+n Thresholds 0xa (100keV)
 n+n Threshold 0x20 (320keV)

01:00 System wide checks
 Clock status ok
 ADC calibration fail as expected (Waveforms off)
 WR Errors
		 Base 		Current 	Difference
aida01 fault 	 0xf932 : 	 0xf933 : 	 1
aida02 fault 	 0x62ec : 	 0x62ed : 	 1
aida03 fault 	 0x8679 : 	 0x867a : 	 1
aida04 fault 	 0xf0e4 : 	 0xf0e5 : 	 1
aida05 fault 	 0x9db8 : 	 0x9dbf : 	 7
aida06 fault 	 0x7f18 : 	 0x7f19 : 	 1
aida07 fault 	 0xdd2c : 	 0xdd2d : 	 1
aida08 fault 	 0x1557 : 	 0x1558 : 	 1
White Rabbit error counter test result: Passed 8, Failed 8

Understand the status reports as follows:-
Status bit 3 : White Rabbit decoder detected an error in the received data
Status bit 2 : Firmware registered WR error, no reload of Timestamp
Status bit 0 : White Rabbit decoder reports uncertain of Timestamp information from WR

 FPGA Errors

                Base Current Difference
aida05 fault 	 0x0 : 	 0x2 : 	 2
FPGA Timestamp error counter test result: Passed 15, Failed 1
If any of these counts are reported as in error
The ASIC readout system has detected a timeslip.
That is the timestamp read from the time FIFO is not younger than the last

 Statistics ok - attachment 1
 Temp ok - attachment 2
 Bias and leakage current ok - attachment 3

01:42 Comparing the CS of AIDA3 and 4
      Stats have been running for a while (Believe since 5am)
      Looking at the counter ratio - attachment 4
      We still have a deadtime of around 14% in FEE4 (Assuming FEE3 has no dead time)

01:56 Noticed /media/ThirdDrive was at 97% full
      Let DESPEC locals know I would like to use the next run stop to change the directory.
      They said they could do it now so they stopped their run.
      Changed the symbolic link to /media/1e2....
      Now writing to R4_

03:26 MBS DAQ Stopped as beam stopped
03:33 Beam back now and DAQ running again

04:44 System wide checks as before
      Statistics ok - attachment 5
      Temperatures ok - attachment - 7
      Bias and leakage currents ok - attachment 6

05:53 MBS stops run as beam drops
06:00 MBS started a new run as beam is back

07:37 System wide checks clock ok and FPGA as before
      WR additional difference on FEE5

		 Base 		Current 	Difference
aida01 fault 	 0xf932 : 	 0xf933 : 	 1
aida02 fault 	 0x62ec : 	 0x62ed : 	 1
aida03 fault 	 0x8679 : 	 0x867a : 	 1
aida04 fault 	 0xf0e4 : 	 0xf0e5 : 	 1
aida05 fault 	 0x9db8 : 	 0x9dc0 : 	 8
aida06 fault 	 0x7f18 : 	 0x7f19 : 	 1
aida07 fault 	 0xdd2c : 	 0xdd2d : 	 1
aida08 fault 	 0x1557 : 	 0x1558 : 	 1
White Rabbit error counter test result: Passed 8, Failed 8

Understand the status reports as follows:-
Status bit 3 : White Rabbit decoder detected an error in the received data
Status bit 2 : Firmware registered WR error, no reload of Timestamp
Status bit 0 : White Rabbit decoder reports uncertain of Timestamp information from WR

     Statistics ok - attachment 8
     Temp ok - attachment 9
     Bias and leakage ok - attachment 10
|
| Attachment 1: 210514_0100_Stats.png
|

|
| Attachment 2: 210514_0101_Temp.png
|

|
| Attachment 3: 210514_0102_Bias.png
|

|
| Attachment 4: 210514_0141_CS_Stats.png
|

|
| Attachment 5: 210514_0442_Stats.png
|

|
| Attachment 6: 210514_0443_Bias.png
|

|
| Attachment 7: 210514_0443_Temp.png
|

|
| Attachment 8: 210514_0737_Stats.png
|

|
| Attachment 9: 210514_0738_Temp.png
|

|
| Attachment 10: 210514_0739_Bias.png
|

|
| Attachment 11: Screenshot_2021-05-14_Spectrum_Browser_aidas-gsi.png
|
|
| Attachment 12: Screenshot_2021-05-14_Spectrum_Browser_aidas-gsi(1).png
|
.png.png)
|
| Attachment 13: Screenshot_2021-05-14_Statistics_aidas-gsi.png
|
|
| Attachment 14: Screenshot_2021-05-14_Statistics_aidas-gsi(1).png
|
.png.png)
|
| Attachment 15: Screenshot_2021-05-14_Statistics_aidas-gsi(2).png
|
.png.png)
|
| Attachment 16: Screenshot_2021-05-14_Statistics_aidas-gsi(3).png
|
.png.png)
|
| Attachment 17: Screenshot_2021-05-14_Statistics_aidas-gsi(4).png
|
.png.png)
|
| Attachment 18: Screenshot_2021-05-14_Temperature_and_status_scan_aidas-gsi.png
|

|
| Attachment 19: Screenshot_2021-05-14_AIDA_Alerting_-_Grafana.png
|

|
| Attachment 20: 600.png
|

|
| Attachment 21: 601.png
|

|
|
327
|
Wed May 19 06:59:33 2021 |
OH | Wednesday 19th May 08:00 - 16:00 |
08:00 OH Takes over for CA
      Thresholds 0xc for p+n and 0x19 for n+n ASICs 1-3 and 0x64 for n+nASIC4

 PULSER SETTINGS
---------------------------
 Pulse is ON
 Positive Tail Pulse
 Trigger Source is Internal Clock
 Trigger Threshold is 3.5
 Amplitude   : 2.0 Volts
 Rep Rate    : 2.0 hZ
 Delay       : 250.0 ns
 Fall Time   : 1 ms
 Attenuation : 1
 Display is  : Volts
 Equivalent keV is : 200.0
 Ramp Start at 0.01 Volts
 Ramp Stop  at 9.99 Volts
 Ramp Start at 1.0 keV
 Ramp Stop  at 999.0 keV
 Ramp Time  is 60 seconds
 # Ramp Cycles is 1

       Max average dead time in R14_586 3.2% which is 9.6% on spill
       Stable from yesterday

10:02 System wide checks. All ok expect WR

		 Base 		Current 	Difference
aida05 fault 	 0x500 : 	 0x554 : 	 84
White Rabbit error counter test result: Passed 15, Failed 1

Understand the status reports as follows:-
Status bit 3 : White Rabbit decoder detected an error in the received data
Status bit 2 : Firmware registered WR error, no reload of Timestamp
Status bit 0 : White Rabbit decoder reports uncertain of Timestamp information from WR

      Statistics - Attachment 1
      Temp - attachment 2
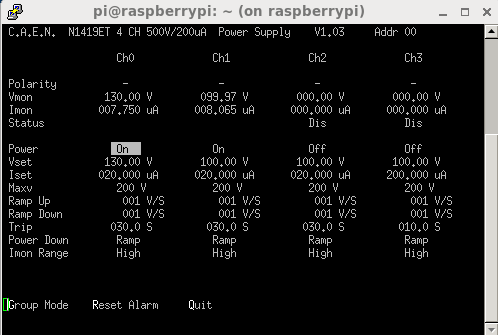
      Bias and leakage currents ok - Attachment 3


11:17 A new run was started as the microspill has been changed. I believe to optimise FRS deadtime.
11:45 They are still working on it

12:05 Beam off for a bit while they optimise spill

12:15 System wide checks ok expect WR

		 Base 		Current 	Difference
aida05 fault 	 0x500 : 	 0x567 : 	 103
White Rabbit error counter test result: Passed 15, Failed 1

Understand the status reports as follows:-
Status bit 3 : White Rabbit decoder detected an error in the received data
Status bit 2 : Firmware registered WR error, no reload of Timestamp
Status bit 0 : White Rabbit decoder reports uncertain of Timestamp information from WR

     Statistics - Attachment 4
     Temp - Attachment 5
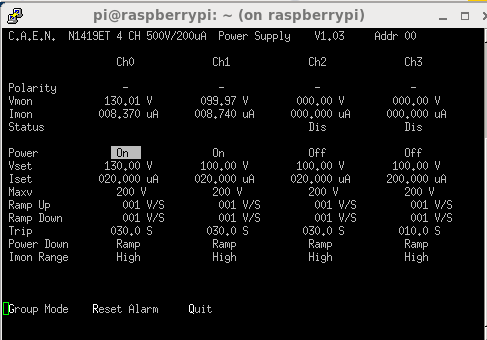
     Bias - Attachment 6

13:11 Magda has said that the changes to the spill structure only gained them a few percent in dead time
      Further changes could be done, but would take at least two hours

13:19 Dead time following the current spill changes
	R14_648	R14_649	R14_650	R14_651	Sum DT (S)   Avergage DT (%)   On Spill DT (%)
FEE	244.823	252.168	247.155	240.421	984.567
0	0.063	0.025	0.105	0.096	0.289	     0.029353005	0.088059015
1	3.981	4.907	4.17	2.484	15.542	     1.578561947	4.73568584
2	0.01	0	0.121	0.779	0.91	     0.092426417	0.277279251
3	3.625	2.972	2.766	3.335	12.698	     1.289704002	3.869112006
4	0.088	0.1	0.12	0.136	0.444	     0.045095966	0.135287898
5	9.392	5.798	9.835	8.01	33.035	     3.355282068	10.0658462
6	0.153	0.075	0.01	0.517	0.755	     0.076683456	0.230050367
7	7.4	7.565	7.703	6.415	29.083	     2.953887343	8.86166203
8	0.221	0.606	1.321	0.539	2.687	     0.272911849	0.818735546
9	0	0	0	0	0	     0          	0
10	1.381	0.368	1.196	1.091	4.036	     0.409926394	1.229779182
11	0.066	0.025	0.039	0.017	0.147	     0.014930421	0.044791264
12	0.166	0.041	0.062	0.024	0.293	     0.029759275	0.089277825
13	0	0	0	0	0	     0          	0
14	0.71	0	0.005	0.074	0.789	     0.08013675	        0.240410251
15	0.239	0.17	0.208	0.286	0.903	     0.091715444	0.275146333
16	0	0	0	0	0	     0          	0

14:03 System wide checks ok - WR same difference as before
      Statistics - attachment 7
      Temperatures - attachment 8
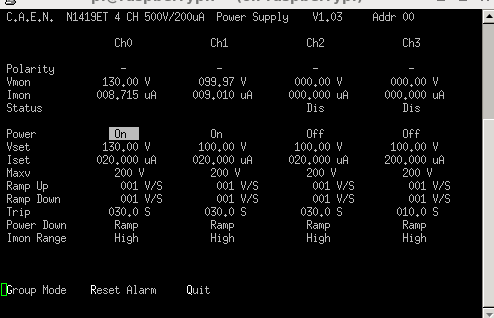
Bias and leakage currents - attachment 9 |
| Attachment 1: 210519_1002_Stats.png
|

|
| Attachment 2: 210519_1002_Temp.png
|

|
| Attachment 3: 210519_1003_Bias.png
|
|
| Attachment 4: 210519_1213_Stats.png
|

|
| Attachment 5: 210519_1214_Temp.png
|

|
| Attachment 6: 210519_1215_Bioas.png
|
|
| Attachment 7: 210519_1403_Stats.png
|

|
| Attachment 8: 210519_1404_Temp.png
|

|
| Attachment 9: 210519_1405_bias.png
|
|
|
337
|
Thu May 20 14:56:33 2021 |
OH | Thursday 20th May 16:00 - 24:00 |
16:00 p+n threshold 0xc (120keV)
      n+n threshold DSSD2 0x20 (250keV) ASICS 1-3, 0x64 ASIC4
      n+n threshold DSSD2 0x19 (250keV) ASICS 1-3, 0x64 ASIC4

      Dead time has increased from yesterday. From the elog this appears to coincide with their changing of the spill structure.

17:30 Grafana informs us we have hit 10uA on DSSD2. This is fine with the size of the detector

18:12 Gregor noticed that at 18:02 the rate in AIDA increased. This could be related to the autofill starting around now.
      The deadtimes in FEE6 and 8 have risen to around 6.25%.
      Looking at this mornings and yesterday evenings fill times this behavior isn't observed

18:30 The rates still seem to be increased so is unlikely to be due to the filling which finished at least 10 minutes ago

18:49 Have tried raising the thresholds to 0x1a for the y side strips of DSSD2
      This has brought the deadtime of AIDA06 down to 5.53% (This seems to have just been a statistical fluctuation and the rate went back up again in the next file)

18:12 Raised threshold to 0x1b for ASIC1-3 of FEE6 and 8

18:15 System wide checks ok except WR as usual

		 Base 		Current 	Difference
aida05 fault 	 0x500 : 	 0x56d : 	 109
White Rabbit error counter test result: Passed 15, Failed 1

Understand the status reports as follows:-
Status bit 3 : White Rabbit decoder detected an error in the received data
Status bit 2 : Firmware registered WR error, no reload of Timestamp
Status bit 0 : White Rabbit decoder reports uncertain of Timestamp information from WR

      Statistics increased at 18:02 still working on - attachment 2
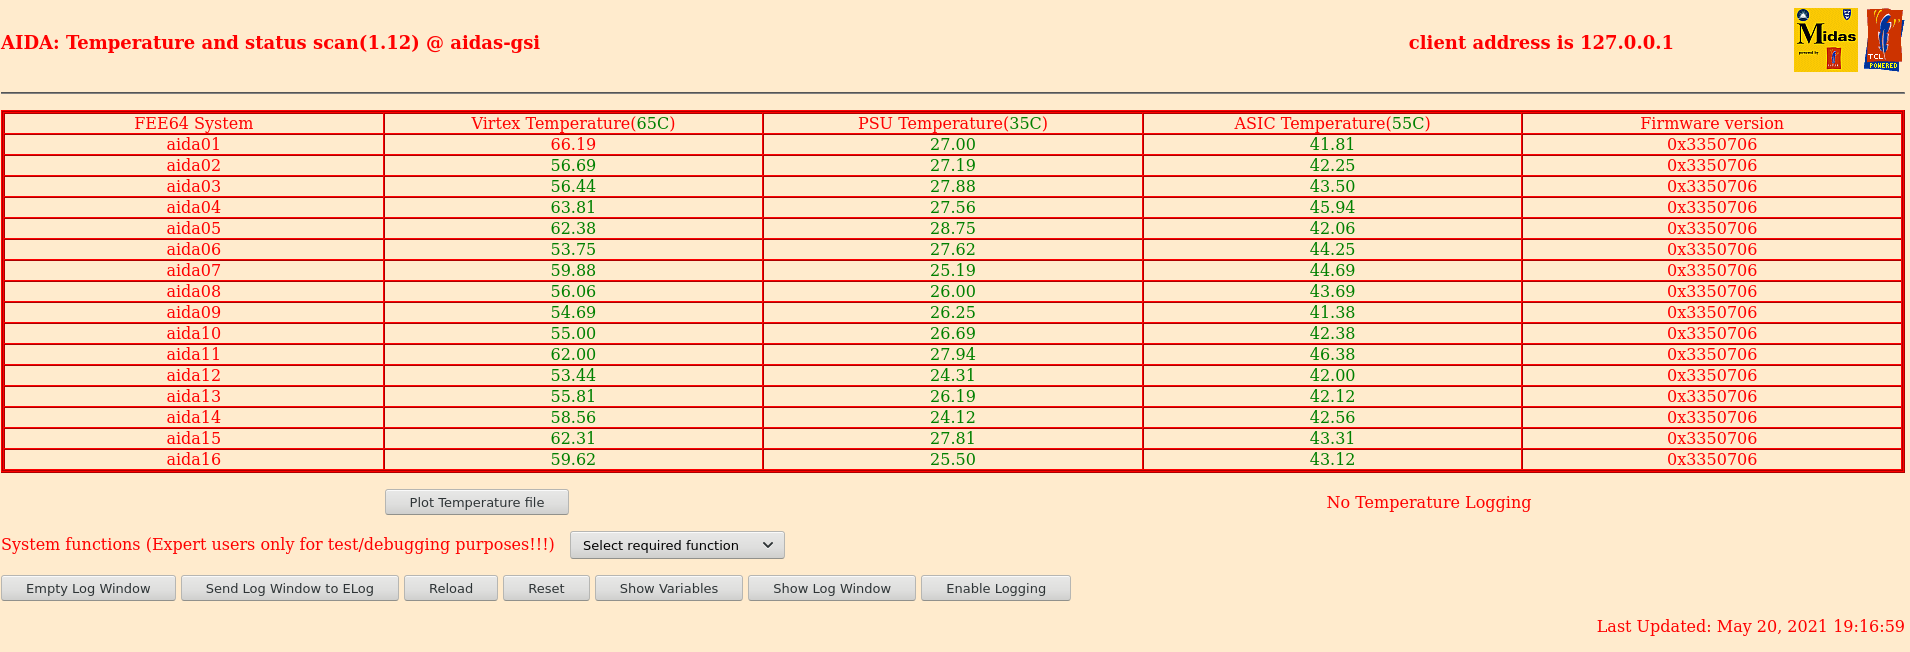
      FEE temp - attachment 3
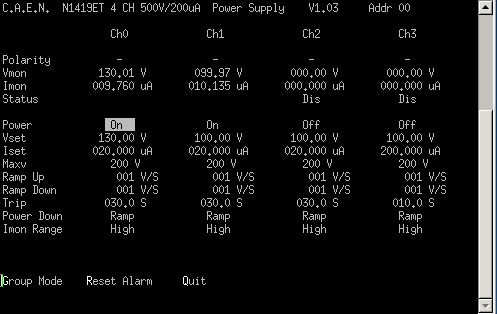
      Bias and leakage current - attachment 4


20:51 System wide checks ok - WR same as before
      Statistics still high - attachment 5
      Temperatures ok - attachment 6
      Bias and leakage currents ok - attachment 7

22:52 Statistics still high - attachment 8
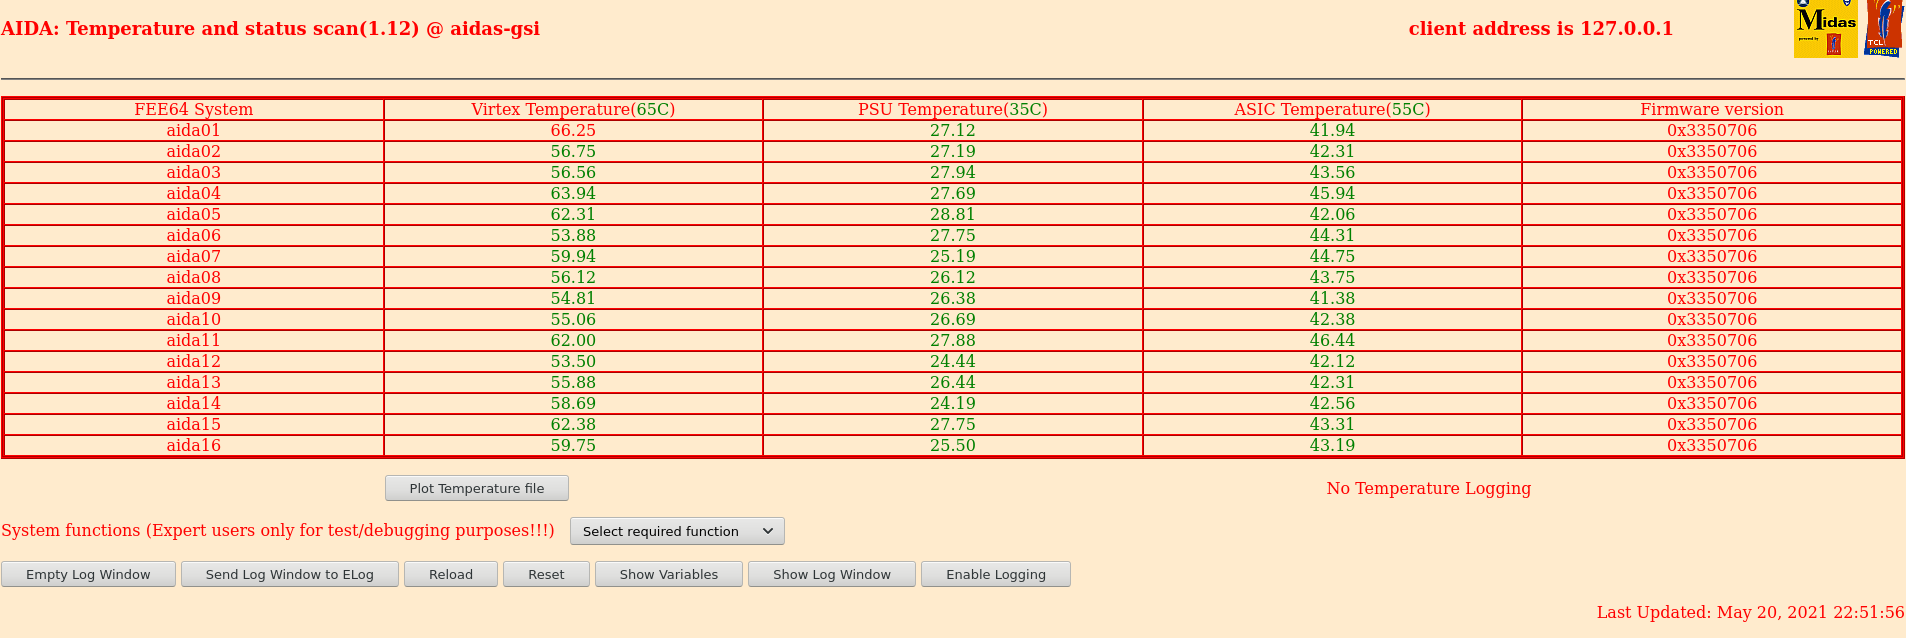
      Temp ok - attachment 9
      Bias and leakage current ok - attachment 10
System wide checks ok - WR difference still 109 |
| Attachment 1: 210520_18002_MBSRate.png
|

|
| Attachment 2: 210520_1916_Stats.png
|

|
| Attachment 3: 210520_1916_Temp.png
|
|
| Attachment 4: 210520_1917_Bias.png
|
|
| Attachment 5: 21050_2052_Stats.png
|

|
| Attachment 6: 210520_2052_Temp.png
|

|
| Attachment 7: 210520_2053_Bias.png
|

|
| Attachment 8: 210520_2251_Stats.png
|

|
| Attachment 9: 210520_2251_Temp.png
|
|
| Attachment 10: 210520_2254_Bias.png
|

|
|
380
|
Fri Sep 3 13:39:42 2021 |
OH | Additional noise tests performed at GSI |
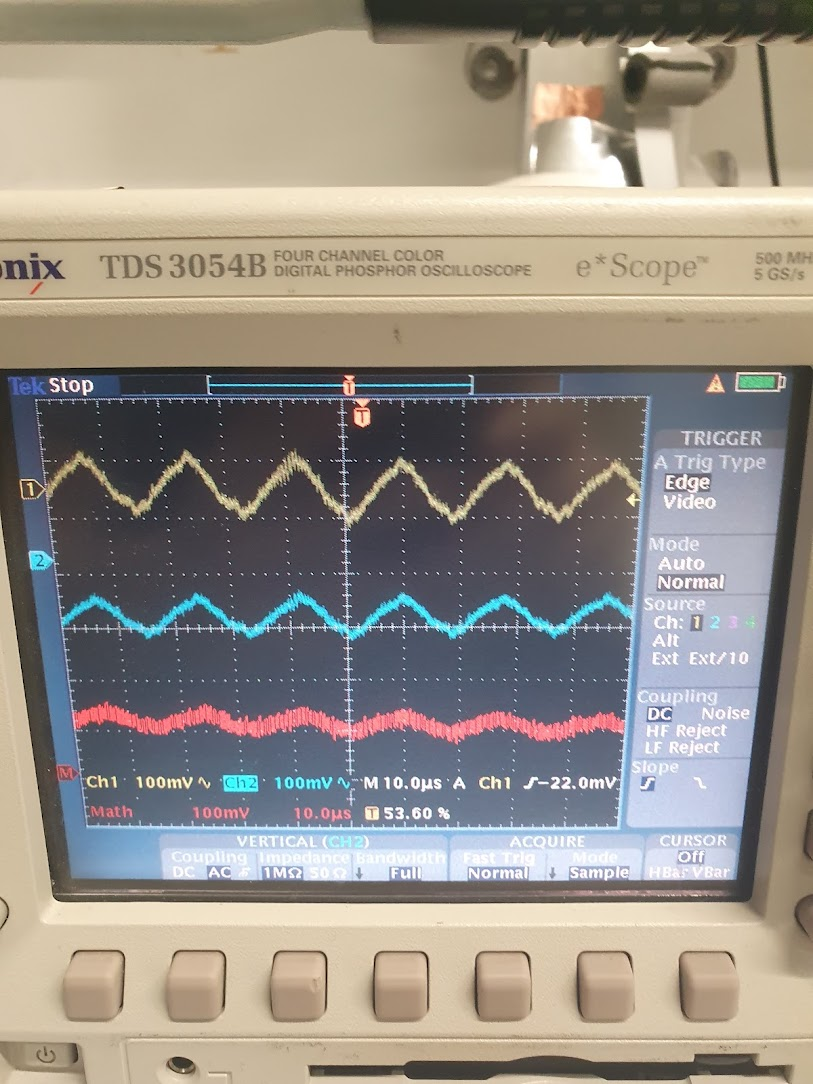
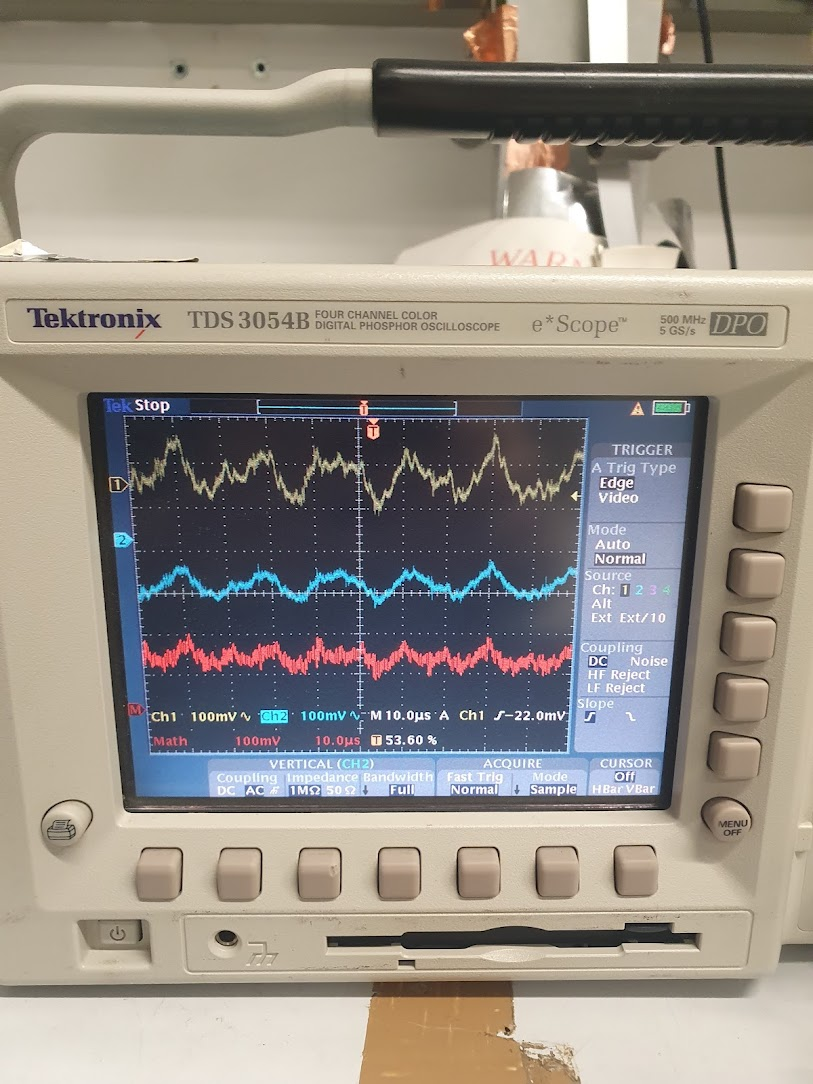
Contents of an email from NH to OH and TD about tests performed on an additional bias supply:

This email was sent to you by someone outside the University.
You should only click on links or attachments if you are certain that the email is genuine and the content is safe.

so I looked at the other supply in the lab (in a NIM crate there, cable direct to DSO)

Still see the same noise wave - also it looked a lot worse at 50V but that may be a worse NIM crate or something else - the current also wasn't 0 (calibration?)

More unusually the signals remain even if the NIM crate is off (DSO_Lab_NoP) and when the SHV is removed from the HV completely (DSO_Lab_NoCable) |
| Attachment 1: DSO_Lab_NoP.jpg
|
|
| Attachment 2: DSO_Lab_1.jpg
|

|
| Attachment 3: DSO_Lab_50V.jpg
|
|
| Attachment 4: DSO_Lab_NoCable.jpg
|
|
|
381
|
Mon Oct 18 13:01:04 2021 |
OH | Proxy config |
Proxy for firefox and anydesk |
| Attachment 1: proxy.png
|
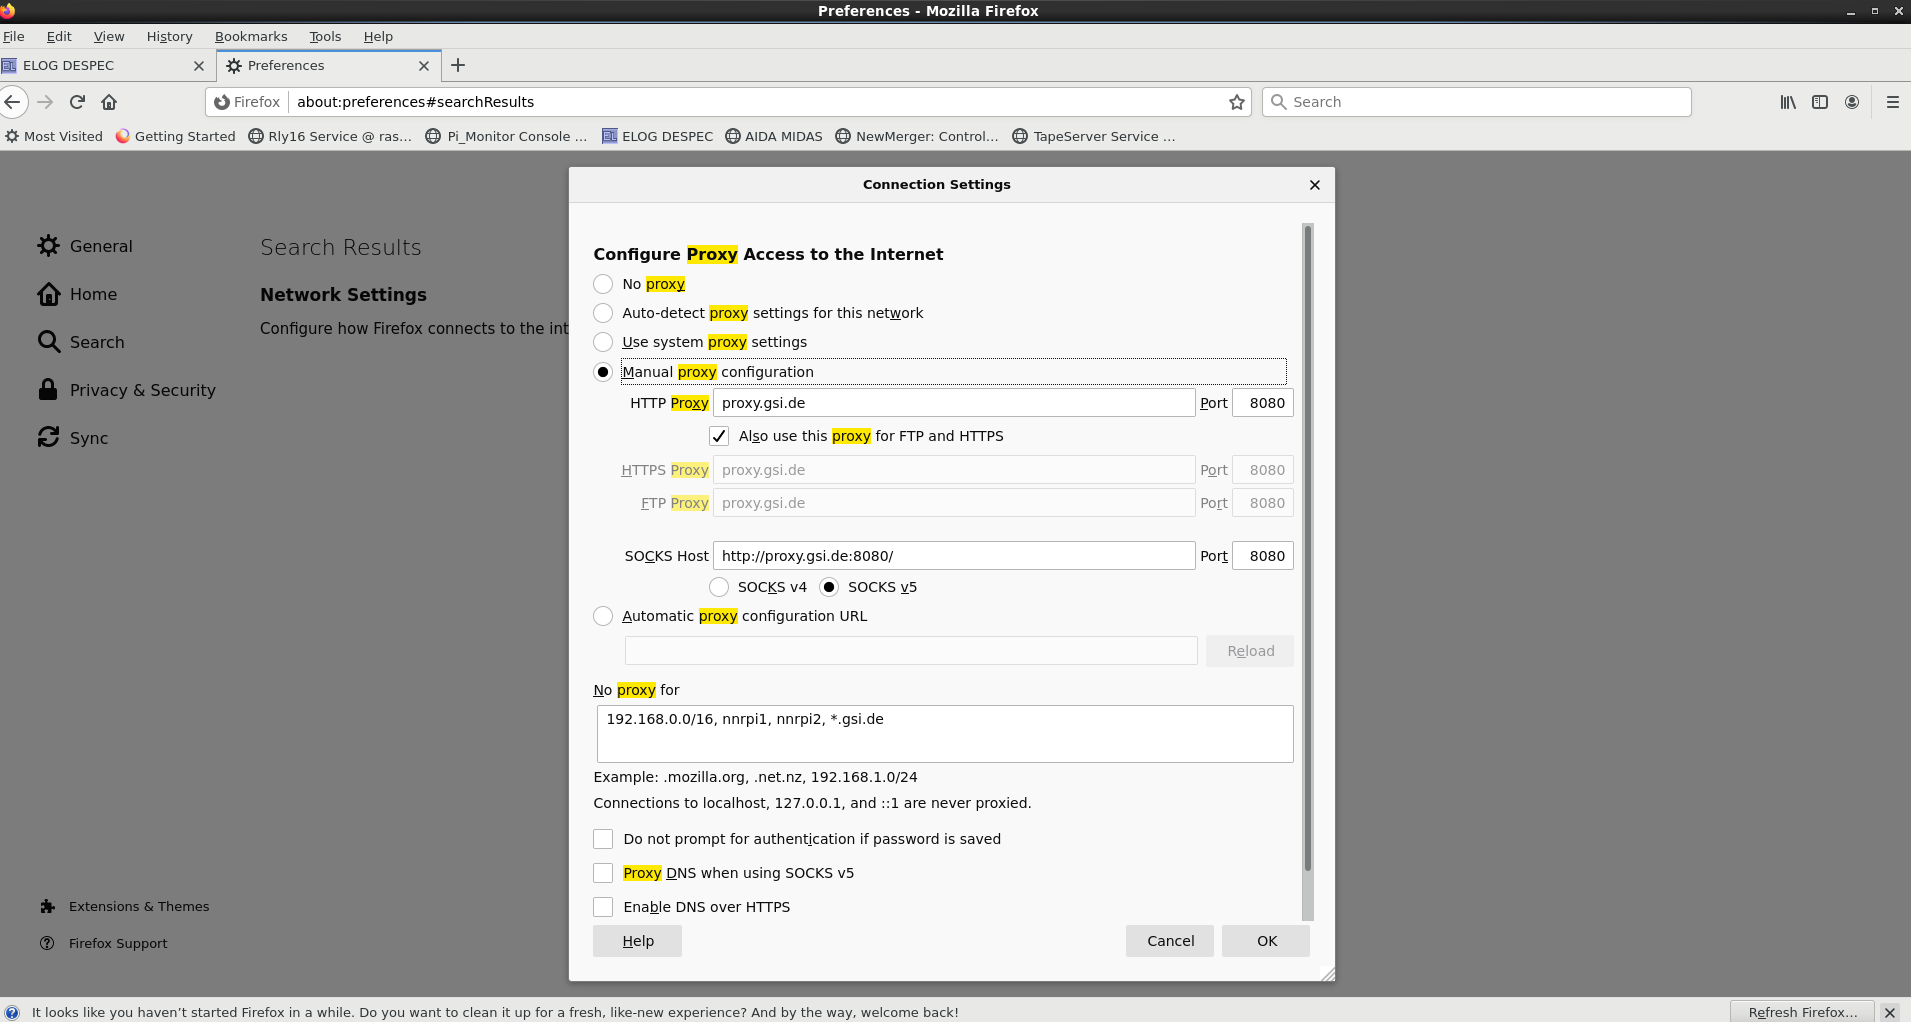
|
| Attachment 2: proxy2.png
|
|
|
382
|
Mon Oct 18 13:03:23 2021 |
OH | DHCPd.conf backup |
|
| Attachment 1: dhcpd.conf
|
#
# DHCP Server Configuration file.
#   see /usr/share/doc/dhcp*/dhcpd.conf.sample
#
# Date of last update  Jan 12 2015
#
authoritative;

ddns-update-style none; ddns-updates off;

# 2 days
#default-lease-time 172800;
# 4 days
default-lease-time 345600;
# 8 days
max-lease-time 691200;

option domain-search code 119 = string;

option domain-name "dl.ac.uk";
option domain-name-servers 193.62.115.16, 148.79.80.78;
option netbios-name-servers 148.79.160.89;
option netbios-node-type 8;
option nis-domain "nuclear.physics";
option nis-servers 193.62.115.77;


subnet 192.168.11.0 netmask 255.255.255.0 {
   option subnet-mask 255.255.255.0;
   option broadcast-address 192.168.11.255;
   pool {
 range 192.168.11.118 192.168.11.199;
   }
}

group {
   use-host-decl-names true;
   default-lease-time 3600;
   max-lease-time 14400;

   server-name "192.168.11.99";
   next-server 192.168.11.99;

   host nnrpi1 {
     hardware ethernet b8:27:eb:bb:46:7b;
     fixed-address 192.168.11.251;
   }

   host nnrpi2 {
     hardware ethernet b8:27:eb:40:53:e8;
     fixed-address 192.168.11.117;
   }

   host aida01 {
     hardware ethernet d8:80:39:41:ba:8a;
     fixed-address 192.168.11.1;
    option root-path "/home/Embedded/XilinxLinux/ppc_4xx/rfs/aida01";
   }

   host aida02 {
     hardware ethernet d8:80:39:41:ba:22;
     fixed-address 192.168.11.2;
    option root-path "/home/Embedded/XilinxLinux/ppc_4xx/rfs/aida02";
   }

   host aida03 {
     hardware ethernet d8:80:39:41:d8:21;
     fixed-address 192.168.11.3;
    option root-path "/home/Embedded/XilinxLinux/ppc_4xx/rfs/aida03";
   }

   host aida04 {
     hardware ethernet d8:80:39:41:f6:b7;
     fixed-address 192.168.11.4;
    option root-path "/home/Embedded/XilinxLinux/ppc_4xx/rfs/aida04";
   }

   host aida05 {
     hardware ethernet d8:80:39:41:d7:cc;
     fixed-address 192.168.11.5;
    option root-path "/home/Embedded/XilinxLinux/ppc_4xx/rfs/aida05";
   }

   host aida06 {
     hardware ethernet d8:80:39:41:ee:72;
     fixed-address 192.168.11.6;
    option root-path "/home/Embedded/XilinxLinux/ppc_4xx/rfs/aida06";
   }

   host aida07 {
     hardware ethernet d8:80:39:41:b4:0c;
     fixed-address 192.168.11.7;
    option root-path "/home/Embedded/XilinxLinux/ppc_4xx/rfs/aida07";
   }

   host aida08 {
     hardware ethernet d8:80:39:41:ba:2b;
     fixed-address 192.168.11.8;
    option root-path "/home/Embedded/XilinxLinux/ppc_4xx/rfs/aida08";
   }

   host aida09 {
     hardware ethernet d8:80:39:41:f6:ee;
     fixed-address 192.168.11.9;
    option root-path "/home/Embedded/XilinxLinux/ppc_4xx/rfs/aida09";
   }

   host aida10 {
     hardware ethernet d8:80:39:41:ba:89;
     fixed-address 192.168.11.10;
    option root-path "/home/Embedded/XilinxLinux/ppc_4xx/rfs/aida10";
   }

   host aida11 {
     hardware ethernet d8:80:39:41:f6:5a;
     fixed-address 192.168.11.11;
    option root-path "/home/Embedded/XilinxLinux/ppc_4xx/rfs/aida11";
   }

   host aida12 {
     hardware ethernet d8:80:39:41:cf:ac;
     fixed-address 192.168.11.12;
    option root-path "/home/Embedded/XilinxLinux/ppc_4xx/rfs/aida12";
   }

   host aida13 {
     hardware ethernet d8:80:39:42:d:15;
     fixed-address 192.168.11.13;
    option root-path "/home/Embedded/XilinxLinux/ppc_4xx/rfs/aida13";
   }

   host aida14 {
     hardware ethernet d8:80:39:42:d:b;
     fixed-address 192.168.11.14;
    option root-path "/home/Embedded/XilinxLinux/ppc_4xx/rfs/aida14";
   }

   host aida15 {
     hardware ethernet d8:80:39:41:ee:10;
     fixed-address 192.168.11.15;
    option root-path "/home/Embedded/XilinxLinux/ppc_4xx/rfs/aida15";
   }

   host aida16 {
     hardware ethernet d8:80:39:41:f6:ed;
     fixed-address 192.168.11.16;
    option root-path "/home/Embedded/XilinxLinux/ppc_4xx/rfs/aida16";
   }
}


subnet 192.168.12.0 netmask 255.255.255.0 {
   option subnet-mask 255.255.255.0;
   option broadcast-address 192.168.12.255;
   pool {
 range 192.168.12.100 192.168.12.199;
   }
}

group {
   use-host-decl-names true;
   default-lease-time 3600;
   max-lease-time 14400;

   server-name "192.168.12.99";
   next-server 192.168.12.99;

   host aida21 {
     hardware ethernet d8:80:39:41:d8:2a;
     fixed-address 192.168.12.1;
    option root-path "/home/Embedded/XilinxLinux/ppc_4xx/rfs/aida21";
   }

   host aida22 {
     hardware ethernet 00:04:a3:2a:d0:26;
     fixed-address 192.168.12.2;
    option root-path "/home/Embedded/XilinxLinux/ppc_4xx/rfs/aida22";
   }

   host aida23 {
     hardware ethernet 00:04:a3:2b:09:ce;
     fixed-address 192.168.12.3;
    option root-path "/home/Embedded/XilinxLinux/ppc_4xx/rfs/aida23";
   }

   host aida24 {
     hardware ethernet 00:04:a3:2b:09:e8;
     fixed-address 192.168.12.4;
    option root-path "/home/Embedded/XilinxLinux/ppc_4xx/rfs/aida24";
   }

}
|
|
383
|
Mon Oct 18 14:20:32 2021 |
OH | Top bar launchers |
launcher1
TclHttpd @8015 for AIDA
/MIDAS/Linux/startup/HTTPD

launcher2
TclHttpd @8115 for AIDA
/MIDAS/Linux/startup/HTTPD@8115

launcher3
TapeServer
/MIDAS/Linux/startup/TapeServer

launcher4
New Merger for AIDA
/MIDAS/Linux/startup/NewMerger

Launcher5
MBS Relay
/MIDAS/Linux/startup/datarelaymbs |
|
384
|
Tue Oct 19 16:17:49 2021 |
OH | AIDA-gsi server to centos 7 |
Following advice of CU have updated the server to centos 7.

To do this a new 500GB SSD was purchased and installed in the enclosure and a clean install of centos7 was installed to this.
An npg account was setup with the same password as previously. Likewise the su password is the same

The existing 500GB HDD can then be mounted using the disk tool in Applications/Utilities/Disks (Requires administrator rights)

The MIDAS_Releases directory was tarballed and coppied across to its respective place on the new install.
A symlink from /MIDAS to this location was created

dhcpd.conf was copied across. dhcp needed to be installed on the machine as well.
/etc/hosts was also required to get the hostnames for the rpis working

oh, GREAT, LayOut, Patrick and analyser directories were also tarballed and moved across

.desktop files have been created for all of the shell scripts used to start the servers.
A gnome extension Frippery panel favourites has also been installed which allows the shortcuts to be stored in the top panel similar to sl6

Early tests appear to be working.

Will test with the FEEs later this week.

Currently the machine is booted into centos but will be booting into sl6 tomorrow to run some tests. |