| ID |
Date |
Author |
Subject |
|
256
|
Wed Apr 21 06:56:42 2021 |
MS | Wednesday 21 April 08:00-12:00 2021 |
8:00
Clock status test result: Passed 12, Failed 0
Understand status as follows
Status bit 3 : firmware PLL that creates clocks from external clock not locked
Status bit 2 : always logic '1'
Status bit 1 : LMK3200(2) PLL and clock distribution chip not locked to external clock
Status bit 0 : LMK3200(1) PLL and clock distribution chip not locked to external clock
If all these bits are not set then the operation of the firmware is unreliable
FEE64 module aida01 failed
FEE64 module aida02 failed
FEE64 module aida03 failed
FEE64 module aida04 failed
FEE64 module aida05 failed
FEE64 module aida06 failed
FEE64 module aida07 failed
FEE64 module aida08 failed
FEE64 module aida09 failed
FEE64 module aida10 failed
FEE64 module aida11 failed
FEE64 module aida12 failed
Calibration test result: Passed 0, Failed 12
If any modules fail calibration , check the clock status and open the FADC Align and Control browser page to rerun calibration for that module
White Rabbit error counter test result: Passed 12, Failed 0
Understand the status reports as follows:-
Status bit 3 : White Rabbit decoder detected an error in the received data
Status bit 2 : Firmware registered WR error, no reload of Timestamp
Status bit 0 : White Rabbit decoder reports uncertain of Timestamp information from WR
Base Current Difference
aida12 fault 0x0 : 0x15 : 21
FPGA Timestamp error counter test result: Passed 11, Failed 1
If any of these counts are reported as in error
The ASIC readout system has detected a timeslip.
That is the timestamp read from the time FIFO is not younger than the last
Returned 0 0 0 0 0 0 0 0 0 0 0 0
Mem(KB) : 4 8 16 32 64 128 256 512 1k 2k 4k
aida01 : 19 6 7 2 2 4 3 2 2 3 7 : 39596
aida02 : 25 3 2 1 1 3 2 3 2 3 7 : 39548
aida03 : 28 5 3 1 2 2 2 3 2 3 7 : 39528
aida04 : 27 6 2 2 2 4 2 4 2 3 7 : 40316
aida05 : 9 9 4 3 1 3 2 3 3 3 7 : 40652
aida06 : 21 7 6 1 2 2 4 2 2 3 7 : 39564
aida07 : 20 7 5 0 1 2 2 3 2 3 7 : 39448
aida08 : 21 5 4 1 1 2 3 3 2 3 7 : 39708
aida09 : 1 3 1 3 0 2 1 4 2 3 7 : 39564
aida10 : 20 6 3 2 1 2 3 3 2 3 7 : 39728
aida11 : 18 4 2 1 2 2 2 2 2 3 7 : 38952
aida12 : 19 8 7 1 1 2 3 3 2 3 7 : 39772
From the merger statistics during the night there have been 1355757 TS errors in aida12. Corrigan said they have been quiet since around 3am though.
10:00
Clock status test result: Passed 12, Failed 0
Understand status as follows
Status bit 3 : firmware PLL that creates clocks from external clock not locked
Status bit 2 : always logic '1'
Status bit 1 : LMK3200(2) PLL and clock distribution chip not locked to external clock
Status bit 0 : LMK3200(1) PLL and clock distribution chip not locked to external clock
If all these bits are not set then the operation of the firmware is unreliable
FEE64 module aida01 failed
FEE64 module aida02 failed
FEE64 module aida03 failed
FEE64 module aida04 failed
FEE64 module aida06 failed
FEE64 module aida07 failed
FEE64 module aida08 failed
FEE64 module aida09 failed
FEE64 module aida10 failed
FEE64 module aida11 failed
FEE64 module aida12 failed
Calibration test result: Passed 1, Failed 11
If any modules fail calibration , check the clock status and open the FADC Align and Control browser page to rerun calibration for that module
White Rabbit error counter test result: Passed 12, Failed 0
Understand the status reports as follows:-
Status bit 3 : White Rabbit decoder detected an error in the received data
Status bit 2 : Firmware registered WR error, no reload of Timestamp
Status bit 0 : White Rabbit decoder reports uncertain of Timestamp information from WR
Base Current Difference
aida12 fault 0x0 : 0x15 : 21
FPGA Timestamp error counter test result: Passed 11, Failed 1
If any of these counts are reported as in error
The ASIC readout system has detected a timeslip.
That is the timestamp read from the time FIFO is not younger than the last
Returned 0 0 0 0 0 0 0 0 0 0 0 0
Mem(KB) : 4 8 16 32 64 128 256 512 1k 2k 4k
aida01 : 15 7 6 2 1 4 3 2 2 3 7 : 39508
aida02 : 1 2 1 0 1 2 2 4 2 3 7 : 39780
aida03 : 23 8 2 0 1 3 2 3 2 3 7 : 39548
aida04 : 23 9 1 2 3 3 2 4 2 3 7 : 40244
aida05 : 14 7 2 2 4 3 2 3 1 4 7 : 40784
aida06 : 18 5 5 2 2 2 3 3 2 3 7 : 39808
aida07 : 27 4 3 2 2 3 3 2 2 3 7 : 39420
aida08 : 23 6 3 2 2 2 3 3 2 3 7 : 39804
aida09 : 18 4 6 3 2 4 3 2 2 3 7 : 39592
aida10 : 6 9 5 3 2 3 2 3 2 3 7 : 39696
aida11 : 16 4 1 2 3 4 1 3 2 3 7 : 39536
aida12 : 18 5 7 1 0 3 3 3 2 3 7 : 39808
10:22
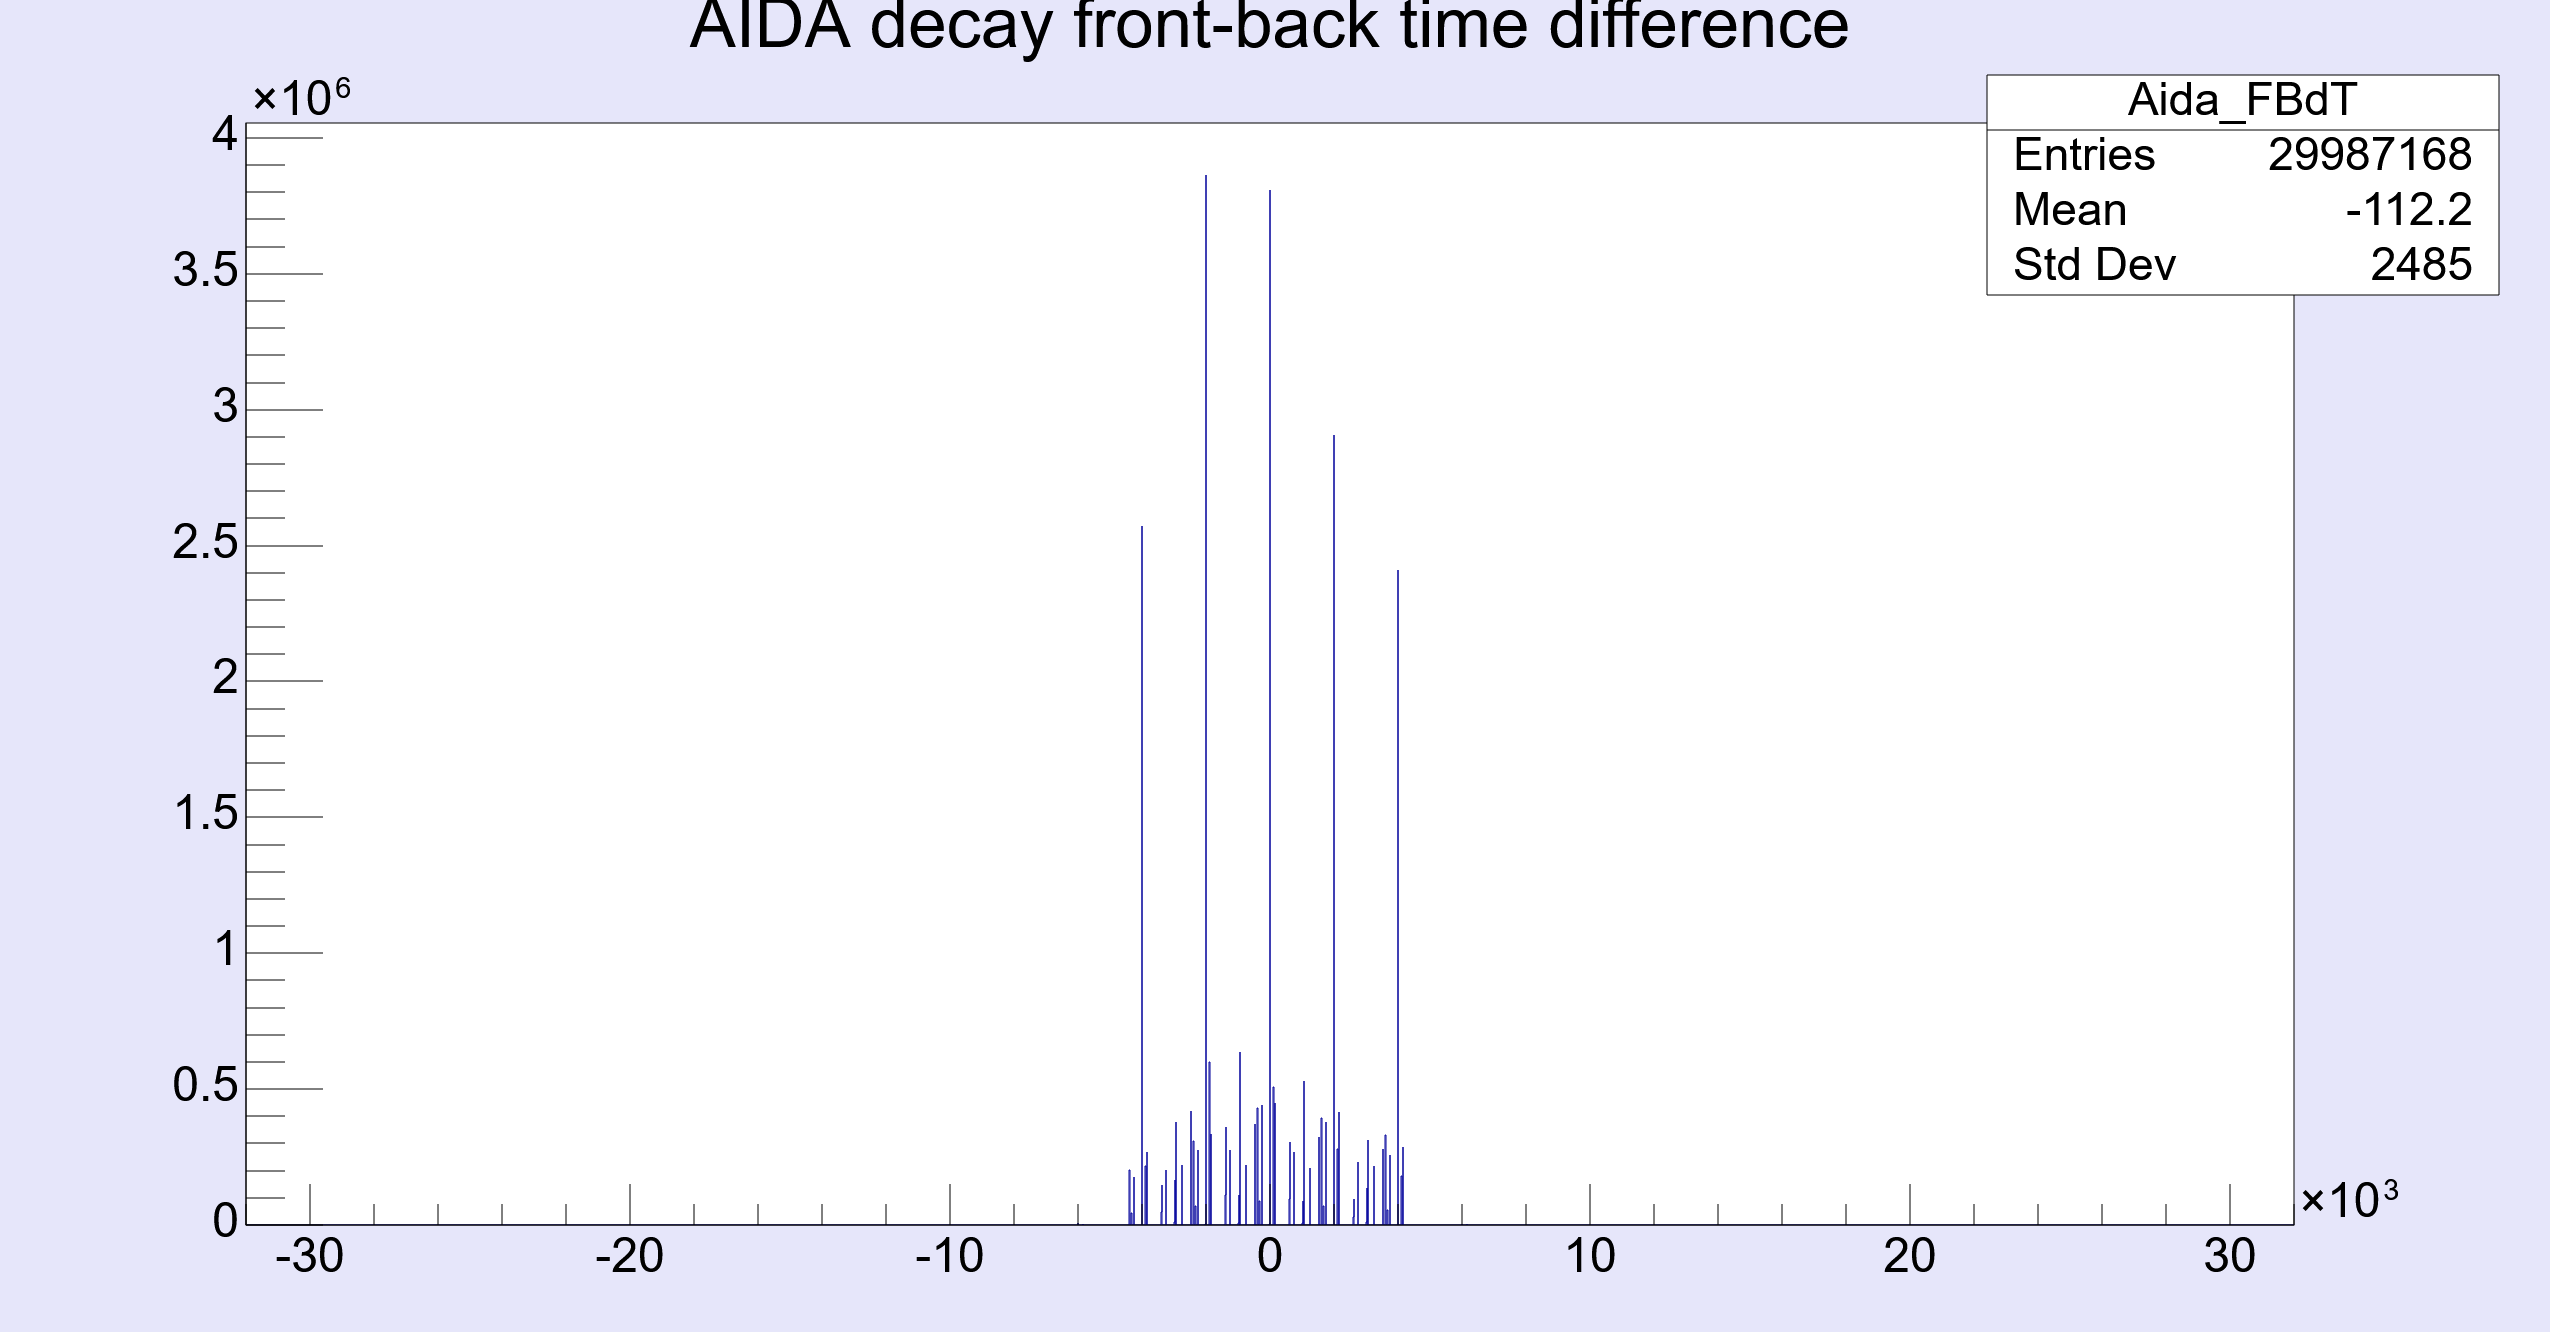
NH Noticed that the ASIC clocks had not been synchronised following the last AIDA restart. - attachment 7
As the beam is having issues they are not currently recording
I have now synchronised the ASIC clocks.
All ADC are now calibrated
11:06
Used the beam off time to change the drive writing to. Now writing to /media/ThirdDrive/TapeData/S460/R50
11:10
Beam is back they will start writing to file again
12:00
Clock status test result: Passed 12, Failed 0
Understand status as follows
Status bit 3 : firmware PLL that creates clocks from external clock not locked
Status bit 2 : always logic '1'
Status bit 1 : LMK3200(2) PLL and clock distribution chip not locked to external clock
Status bit 0 : LMK3200(1) PLL and clock distribution chip not locked to external clock
If all these bits are not set then the operation of the firmware is unreliable
Calibration test result: Passed 12, Failed 0
If any modules fail calibration , check the clock status and open the FADC Align and Control browser page to rerun calibration for that module
White Rabbit error counter test result: Passed 12, Failed 0
Understand the status reports as follows:-
Status bit 3 : White Rabbit decoder detected an error in the received data
Status bit 2 : Firmware registered WR error, no reload of Timestamp
Status bit 0 : White Rabbit decoder reports uncertain of Timestamp information from WR
Base Current Difference
aida12 fault 0x0 : 0x17 : 23
FPGA Timestamp error counter test result: Passed 11, Failed 1
If any of these counts are reported as in error
The ASIC readout system has detected a timeslip.
That is the timestamp read from the time FIFO is not younger than the last
Returned 0 0 0 0 0 0 0 0 0 0 0 0
Mem(KB) : 4 8 16 32 64 128 256 512 1k 2k 4k
aida01 : 20 5 5 1 1 4 2 3 2 3 7 : 39720
aida02 : 16 8 4 1 0 2 1 4 2 3 7 : 39648
aida03 : 9 7 3 2 3 3 2 3 2 3 7 : 39692
aida04 : 8 7 5 2 3 5 3 2 2 3 7 : 39720
aida05 : 20 5 3 4 2 3 3 3 2 3 7 : 39976
aida06 : 25 8 0 3 1 2 3 3 2 3 7 : 39748
aida07 : 24 8 4 2 3 3 2 3 2 3 7 : 39776
aida08 : 22 9 0 2 2 2 3 3 2 3 7 : 39776
aida09 : 1 4 4 3 2 3 2 3 2 3 7 : 39620
aida10 : 13 4 4 3 2 3 1 3 2 3 7 : 39412
aida11 : 2 3 1 1 3 4 2 2 2 3 7 : 39184
aida12 : 16 10 7 2 1 3 1 3 2 3 7 : 39424
|
| Attachment 1: Screenshot_2021-04-21_Statistics_aidas-gsi.png
|

|
| Attachment 2: Screenshot_2021-04-21_Temperature_and_status_scan_aidas-gsi.png
|

|
| Attachment 3: 46.png
|
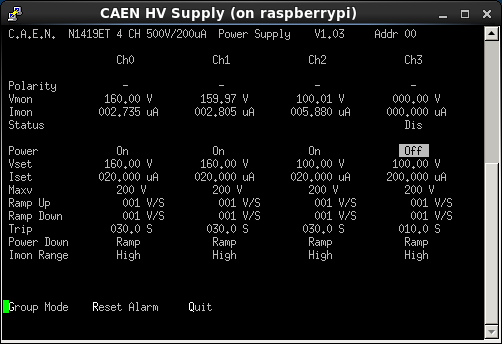
|
| Attachment 4: Screenshot_2021-04-21_Statistics_aidas-gsi(1).png
|
.png.png)
|
| Attachment 5: Screenshot_2021-04-21_Temperature_and_status_scan_aidas-gsi(1).png
|
.png.png)
|
| Attachment 6: 47.png
|

|
| Attachment 7: Capture.PNG
|
|
| Attachment 8: Screenshot_2021-04-21_Temperature_and_status_scan_aidas-gsi(2).png
|
.png.png)
|
| Attachment 9: Screenshot_2021-04-21_Statistics_aidas-gsi(2).png
|
.png.png)
|
| Attachment 10: 48.png
|

|
|
333
|
Wed May 19 18:50:01 2021 |
LS | Wednesday 19th May 20:00 to 24:00 |
20.00
Stats okay (Fig 1)
Analysed R14_762 deadtimes are okay (Fig 2)

20.30
Stats okay (Fig 3)
Analysed R14_771 deadtimes are okay (Fig 4)

21.00
Stats okay (Fig 5)
FEE temps okay (Fig 6)
Bias (Fig 7)
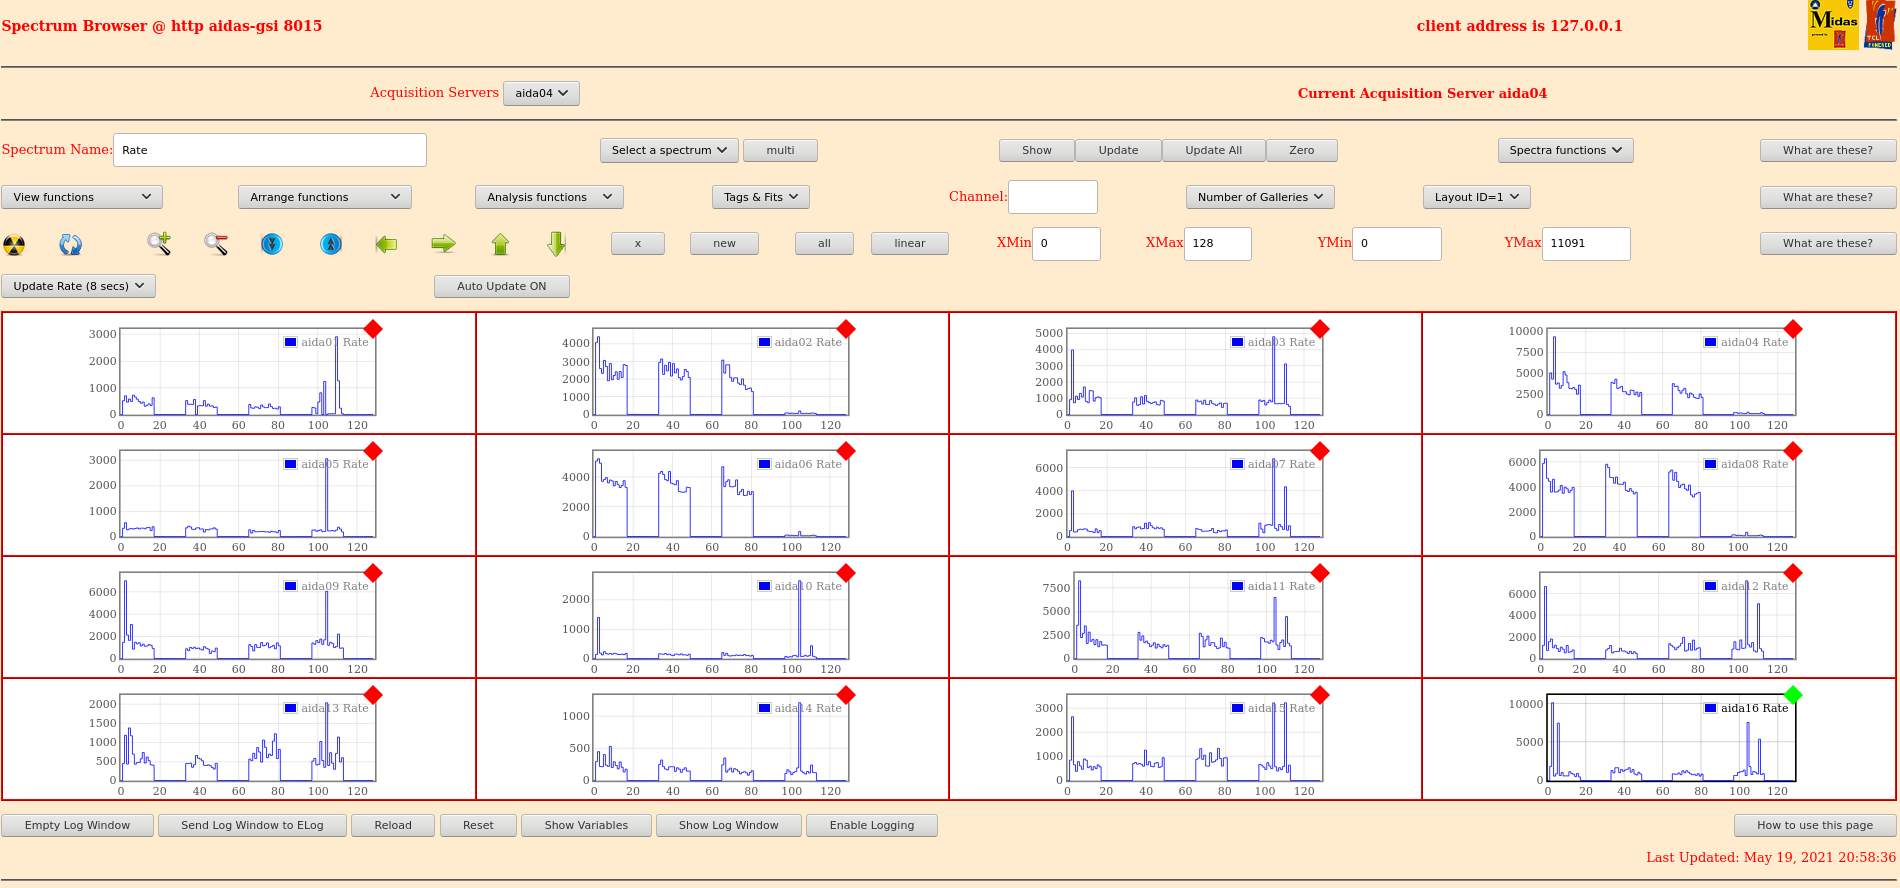
Rate spectra (Fig 8)

System wide checks okay except white rabbit 1 fail:
		 Base 		Current 	Difference
aida05 fault 	 0x500 : 	 0x569 : 	 105
White Rabbit error counter test result: Passed 15, Failed 1

Understand the status reports as follows:-
Status bit 3 : White Rabbit decoder detected an error in the received data
Status bit 2 : Firmware registered WR error, no reload of Timestamp
Status bit 0 : White Rabbit decoder reports uncertain of Timestamp information from WR

Merger rate ~2.8M items/s
Tape server ~10MB/s

Analysed R14_781 deadtimes are okay (Fig 9)

21.30
Stats okay (Fig 10)
Analysed R14_789 deadtimes are okay (Fig 11)

22.00
Stats okay (Fig 12)
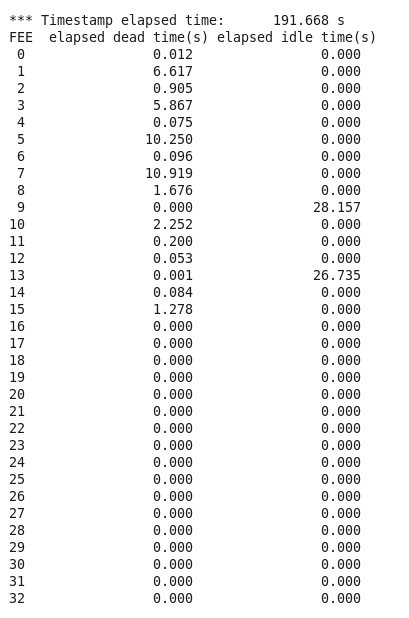
Analysed R14_799 deadtimes are okay (Fig 13)

22.30
Stats okay (Fig 14)
Analysed R14_807 deadtimes are okay (Fig 15)

23.00
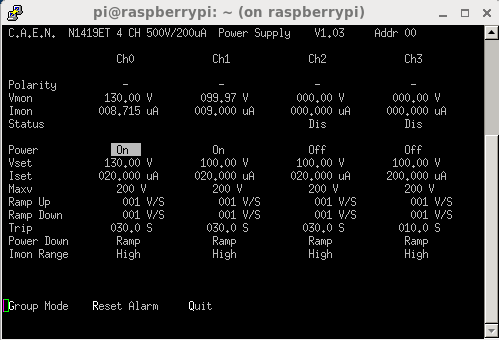
Stats okay (Fig 16)
FEE temps okay (Fig 17)
Bias (Fig 18)

System wide checks okay except white rabbit 1 fail:
		 Base 		Current 	Difference
aida05 fault 	 0x500 : 	 0x569 : 	 105
White Rabbit error counter test result: Passed 15, Failed 1

Understand the status reports as follows:-
Status bit 3 : White Rabbit decoder detected an error in the received data
Status bit 2 : Firmware registered WR error, no reload of Timestamp
Status bit 0 : White Rabbit decoder reports uncertain of Timestamp information from WR

Merger rate ~3M items/s
Tape server ~10MB/s

Analysed R14_819 deadtimes are okay (Fig 19)

23.30
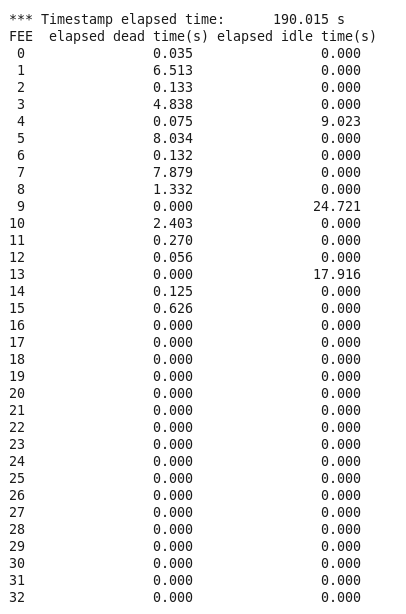
Stats okay (Fig 20)
Analysed R14_827 deadtimes are okay (Fig 21) |
| Attachment 1: 210519_Stats_2000.png
|

|
| Attachment 2: Deadtimes_R14_762.png
|

|
| Attachment 3: 210519_Stats_2030.png
|

|
| Attachment 4: Deadtimes_R14_771.png
|

|
| Attachment 5: 210519_Stats_2100.png
|

|
| Attachment 6: 210519_FEEtemps_2100.png
|

|
| Attachment 7: 210519_BIAS_2100.png
|

|
| Attachment 8: 210519_Spectra_2100.png
|
|
| Attachment 9: deadtimes_R14_781.png
|

|
| Attachment 10: 210519_Stats_2130.png
|

|
| Attachment 11: deadtimes_R14_789.png
|

|
| Attachment 12: 210519_Stats_2200.png
|

|
| Attachment 13: deadtimes_R14_799.png
|

|
| Attachment 14: 210519_Stats_2230.png
|

|
| Attachment 15: deatimes_R14_807.png
|
|
| Attachment 16: 210519_Stats_2300.png
|

|
| Attachment 17: 210519_FEEtemps_2300.png
|

|
| Attachment 18: 210519_bias_2300.png
|
|
| Attachment 19: deatimes_R14_819.png
|

|
| Attachment 20: 210519_Stats_2330.png
|

|
| Attachment 21: deadtimes_R14_827.png
|
|
|
327
|
Wed May 19 06:59:33 2021 |
OH | Wednesday 19th May 08:00 - 16:00 |
08:00 OH Takes over for CA
      Thresholds 0xc for p+n and 0x19 for n+n ASICs 1-3 and 0x64 for n+nASIC4

 PULSER SETTINGS
---------------------------
 Pulse is ON
 Positive Tail Pulse
 Trigger Source is Internal Clock
 Trigger Threshold is 3.5
 Amplitude   : 2.0 Volts
 Rep Rate    : 2.0 hZ
 Delay       : 250.0 ns
 Fall Time   : 1 ms
 Attenuation : 1
 Display is  : Volts
 Equivalent keV is : 200.0
 Ramp Start at 0.01 Volts
 Ramp Stop  at 9.99 Volts
 Ramp Start at 1.0 keV
 Ramp Stop  at 999.0 keV
 Ramp Time  is 60 seconds
 # Ramp Cycles is 1

       Max average dead time in R14_586 3.2% which is 9.6% on spill
       Stable from yesterday

10:02 System wide checks. All ok expect WR

		 Base 		Current 	Difference
aida05 fault 	 0x500 : 	 0x554 : 	 84
White Rabbit error counter test result: Passed 15, Failed 1

Understand the status reports as follows:-
Status bit 3 : White Rabbit decoder detected an error in the received data
Status bit 2 : Firmware registered WR error, no reload of Timestamp
Status bit 0 : White Rabbit decoder reports uncertain of Timestamp information from WR

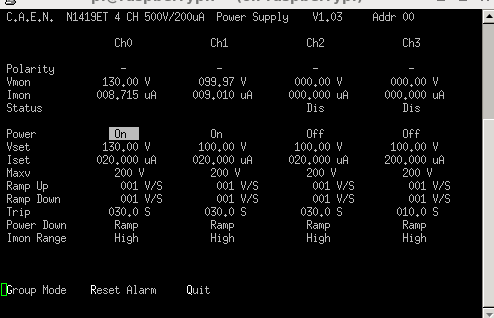
      Statistics - Attachment 1
      Temp - attachment 2
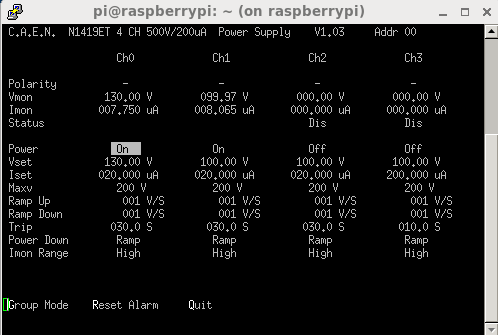
      Bias and leakage currents ok - Attachment 3


11:17 A new run was started as the microspill has been changed. I believe to optimise FRS deadtime.
11:45 They are still working on it

12:05 Beam off for a bit while they optimise spill

12:15 System wide checks ok expect WR

		 Base 		Current 	Difference
aida05 fault 	 0x500 : 	 0x567 : 	 103
White Rabbit error counter test result: Passed 15, Failed 1

Understand the status reports as follows:-
Status bit 3 : White Rabbit decoder detected an error in the received data
Status bit 2 : Firmware registered WR error, no reload of Timestamp
Status bit 0 : White Rabbit decoder reports uncertain of Timestamp information from WR

     Statistics - Attachment 4
     Temp - Attachment 5
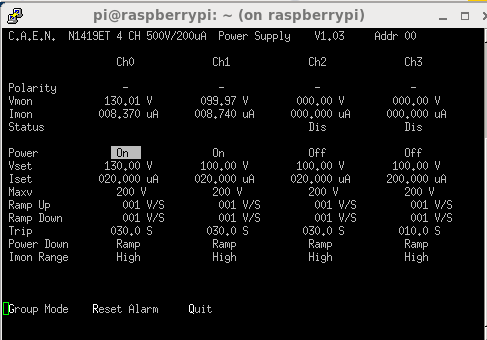
     Bias - Attachment 6

13:11 Magda has said that the changes to the spill structure only gained them a few percent in dead time
      Further changes could be done, but would take at least two hours

13:19 Dead time following the current spill changes
	R14_648	R14_649	R14_650	R14_651	Sum DT (S)   Avergage DT (%)   On Spill DT (%)
FEE	244.823	252.168	247.155	240.421	984.567
0	0.063	0.025	0.105	0.096	0.289	     0.029353005	0.088059015
1	3.981	4.907	4.17	2.484	15.542	     1.578561947	4.73568584
2	0.01	0	0.121	0.779	0.91	     0.092426417	0.277279251
3	3.625	2.972	2.766	3.335	12.698	     1.289704002	3.869112006
4	0.088	0.1	0.12	0.136	0.444	     0.045095966	0.135287898
5	9.392	5.798	9.835	8.01	33.035	     3.355282068	10.0658462
6	0.153	0.075	0.01	0.517	0.755	     0.076683456	0.230050367
7	7.4	7.565	7.703	6.415	29.083	     2.953887343	8.86166203
8	0.221	0.606	1.321	0.539	2.687	     0.272911849	0.818735546
9	0	0	0	0	0	     0          	0
10	1.381	0.368	1.196	1.091	4.036	     0.409926394	1.229779182
11	0.066	0.025	0.039	0.017	0.147	     0.014930421	0.044791264
12	0.166	0.041	0.062	0.024	0.293	     0.029759275	0.089277825
13	0	0	0	0	0	     0          	0
14	0.71	0	0.005	0.074	0.789	     0.08013675	        0.240410251
15	0.239	0.17	0.208	0.286	0.903	     0.091715444	0.275146333
16	0	0	0	0	0	     0          	0

14:03 System wide checks ok - WR same difference as before
      Statistics - attachment 7
      Temperatures - attachment 8
Bias and leakage currents - attachment 9 |
| Attachment 1: 210519_1002_Stats.png
|

|
| Attachment 2: 210519_1002_Temp.png
|

|
| Attachment 3: 210519_1003_Bias.png
|
|
| Attachment 4: 210519_1213_Stats.png
|

|
| Attachment 5: 210519_1214_Temp.png
|

|
| Attachment 6: 210519_1215_Bioas.png
|
|
| Attachment 7: 210519_1403_Stats.png
|

|
| Attachment 8: 210519_1404_Temp.png
|

|
| Attachment 9: 210519_1405_bias.png
|
|
|
332
|
Wed May 19 14:54:36 2021 |
CB | Wednesday 19 May 16:00 - 20:00 |
15:55 Took over from OH

16:00
Stats OK - attach 1
Temps OK - attach 2
Bias  OK - attach 3

System wide checks
All OK, except ADC all fail (as before) and WR

		 Base 		Current 	Difference
aida05 fault 	 0x500 : 	 0x567 : 	 103
White Rabbit error counter test result: Passed 15, Failed 1

Understand the status reports as follows:-
Status bit 3 : White Rabbit decoder detected an error in the received data
Status bit 2 : Firmware registered WR error, no reload of Timestamp
Status bit 0 : White Rabbit decoder reports uncertain of Timestamp information from WR

Analysed R14_691. Attach 4. Dead time <5%

16:34 MBS changes file.


17:00
Stats OK - attach 5
Temps OK - as before
System wide checks as before

 Collecting the file size of each FEE64 Options CONTENTS file to check they are all the same

 FEE : aida01 =>   Options file size is 1026 	 Last changed Mon May 17 11:43:04 CEST 2021
 FEE : aida02 =>   Options file size is 1014 	 Last changed Thu Apr 29 14:43:46 CEST 2021
 FEE : aida03 =>   Options file size is 1014 	 Last changed Thu Apr 29 14:43:50 CEST 2021
 FEE : aida04 =>   Options file size is 1025 	 Last changed Fri May 14 16:54:56 CEST 2021
 FEE : aida05 =>   Options file size is 1025 	 Last changed Mon May 17 06:25:41 CEST 2021
 FEE : aida06 =>   Options file size is 1014 	 Last changed Thu Apr 29 14:43:59 CEST 2021
 FEE : aida07 =>   Options file size is 1014 	 Last changed Thu Apr 29 14:44:02 CEST 2021
 FEE : aida08 =>   Options file size is 1025 	 Last changed Wed May 05 12:15:54 CEST 2021
 FEE : aida09 =>   Options file size is 1014 	 Last changed Thu Apr 29 14:44:08 CEST 2021
 FEE : aida10 =>   Options file size is 1014 	 Last changed Thu Apr 29 14:44:57 CEST 2021
 FEE : aida11 =>   Options file size is 1014 	 Last changed Thu Apr 29 14:44:57 CEST 2021
 FEE : aida12 =>   Options file size is 1014 	 Last changed Thu Apr 29 14:44:57 CEST 2021
 FEE : aida13 =>   Options file size is 1025 	 Last changed Fri May 07 19:40:34 CEST 2021
 FEE : aida14 =>   Options file size is 1014 	 Last changed Thu Apr 29 14:44:57 CEST 2021
 FEE : aida15 =>   Options file size is 1014 	 Last changed Thu Apr 29 14:44:57 CEST 2021
 FEE : aida16 =>   Options file size is 1014 	 Last changed Thu Apr 29 14:44:57 CEST 2021


17:55
Stats OK - attach 6
Temps OK - as before

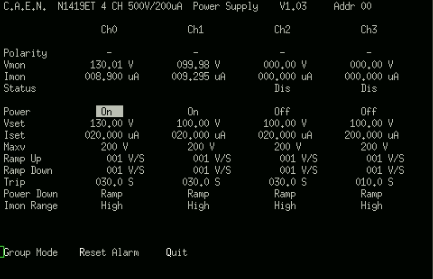
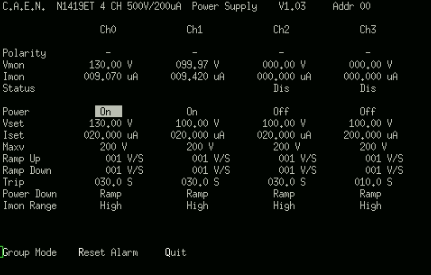
Leakage current approaching 10 uA - attach 7

System-wide checks - as before except
		 Base 		Current 	Difference
aida05 fault 	 0x500 : 	 0x568 : 	 104
White Rabbit error counter test result: Passed 15, Failed 1

Understand the status reports as follows:-
Status bit 3 : White Rabbit decoder detected an error in the received data
Status bit 2 : Firmware registered WR error, no reload of Timestamp
Status bit 0 : White Rabbit decoder reports uncertain of Timestamp information from WR


18:01 MBS switches to new file


18:52
Stats OK - attach 8
Temps OK - as before

System-wide checks as before

Analysed R14_741. Avg. dead time slightly increased to 5.1%. Attach 9

19:36 Stats OK - attach 10
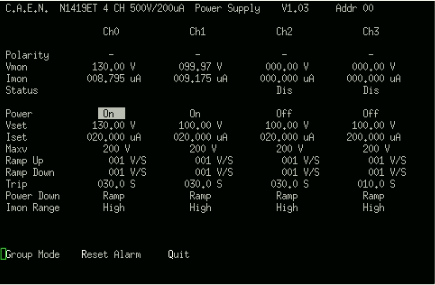
Bias - attach 11

19:48 Shift handed over to LS |
| Attachment 1: Stats1.png
|

|
| Attachment 2: Temps1.png
|

|
| Attachment 3: Bias1.png
|
|
| Attachment 4: Analysis_R14_691
|
*** TDR format 3.3.0 analyser - TD - May 2021
*** ERROR: READ I/O error: 5002
blocks: 32000
ADC data format: 251761346 ( 995725.1 Hz)
Other data format: 10158654 ( 40177.8 Hz)
Sample trace data format: 0 ( 0.0 Hz)
Undefined format: 0 ( 0.0 Hz)
Other data format type: PAUSE: 199 ( 0.8 Hz)
RESUME: 199 ( 0.8 Hz)
SYNC100: 32942 ( 130.3 Hz)
WR48-63: 32942 ( 130.3 Hz)
FEE64 disc: 0 ( 0.0 Hz)
MBS info: 10092372 ( 39915.7 Hz)
Other info: 0 ( 0.0 Hz)
ADC data range bit set: 503210 ( 1990.2 Hz)
Timewarps: ADC: 0 ( 0.0 Hz)
PAUSE: 0 ( 0.0 Hz)
RESUME: 0 ( 0.0 Hz)
SYNC100: 0 ( 0.0 Hz)
WR48-63: 0 ( 0.0 Hz)
FEE64 disc: 0 ( 0.0 Hz)
MBS info: 0 ( 0.0 Hz)
Undefined: 0 ( 0.0 Hz)
Sample trace: 0 ( 0.0 Hz)
*** Timestamp elapsed time: 252.842 s
FEE elapsed dead time(s) elapsed idle time(s)
0 0.053 17.526
1 1.803 0.000
2 0.604 2.918
3 3.773 0.000
4 0.070 17.512
5 9.601 0.000
6 0.278 0.000
7 9.149 0.000
8 0.114 0.000
9 0.000 64.964
10 0.536 0.000
11 0.070 0.000
12 0.024 6.415
13 0.000 66.391
14 0.036 7.395
15 0.097 0.000
16 0.000 0.000
17 0.000 0.000
18 0.000 0.000
19 0.000 0.000
20 0.000 0.000
21 0.000 0.000
22 0.000 0.000
23 0.000 0.000
24 0.000 0.000
25 0.000 0.000
26 0.000 0.000
27 0.000 0.000
28 0.000 0.000
29 0.000 0.000
30 0.000 0.000
31 0.000 0.000
32 0.000 0.000
*** Statistics
FEE ADC Data Other Data Sample Undefined Pause Resume SYNC100 WR48-63 Disc MBS Other HEC Data
0 6023981 3019 0 0 3 3 749 749 0 1515 0 26768
1 22620294 5924 0 0 14 14 2948 2948 0 0 0 55394
2 11082857 2607083 0 0 5 5 1799 1799 0 2603475 0 43681
3 30564809 2580290 0 0 26 26 4295 4295 0 2571648 0 65104
4 3958862 1393424 0 0 7 7 678 678 0 1392054 0 11940
5 37388332 780379 0 0 62 62 4752 4752 0 770751 0 33878
6 10191568 1631763 0 0 8 8 1480 1480 0 1628787 0 23955
7 39960208 1134610 0 0 55 55 5179 5179 0 1124142 0 42303
8 17144158 4230 0 0 3 3 2112 2112 0 0 0 56568
9 2458065 662 0 0 0 0 331 331 0 0 0 4321
10 20331742 4810 0 0 6 6 2399 2399 0 0 0 34970
11 11809904 2968 0 0 4 4 1480 1480 0 0 0 10406
12 9134013 2250 0 0 1 1 1124 1124 0 0 0 49240
13 2508032 620 0 0 0 0 310 310 0 0 0 3587
14 8541585 2182 0 0 2 2 1089 1089 0 0 0 33394
15 18042936 4440 0 0 3 3 2217 2217 0 0 0 7701
16 0 0 0 0 0 0 0 0 0 0 0 0
17 0 0 0 0 0 0 0 0 0 0 0 0
18 0 0 0 0 0 0 0 0 0 0 0 0
19 0 0 0 0 0 0 0 0 0 0 0 0
20 0 0 0 0 0 0 0 0 0 0 0 0
21 0 0 0 0 0 0 0 0 0 0 0 0
22 0 0 0 0 0 0 0 0 0 0 0 0
23 0 0 0 0 0 0 0 0 0 0 0 0
24 0 0 0 0 0 0 0 0 0 0 0 0
25 0 0 0 0 0 0 0 0 0 0 0 0
26 0 0 0 0 0 0 0 0 0 0 0 0
27 0 0 0 0 0 0 0 0 0 0 0 0
28 0 0 0 0 0 0 0 0 0 0 0 0
29 0 0 0 0 0 0 0 0 0 0 0 0
30 0 0 0 0 0 0 0 0 0 0 0 0
31 0 0 0 0 0 0 0 0 0 0 0 0
32 0 0 0 0 0 0 0 0 0 0 0 0
*** Timewarps
FEE ADC Pause Resume SYNC100 WR48-63 Disc MBS Undefined Samples
0 0 0 0 0 0 0 0 0 0
1 0 0 0 0 0 0 0 0 0
2 0 0 0 0 0 0 0 0 0
3 0 0 0 0 0 0 0 0 0
4 0 0 0 0 0 0 0 0 0
5 0 0 0 0 0 0 0 0 0
6 0 0 0 0 0 0 0 0 0
7 0 0 0 0 0 0 0 0 0
8 0 0 0 0 0 0 0 0 0
9 0 0 0 0 0 0 0 0 0
10 0 0 0 0 0 0 0 0 0
11 0 0 0 0 0 0 0 0 0
12 0 0 0 0 0 0 0 0 0
13 0 0 0 0 0 0 0 0 0
14 0 0 0 0 0 0 0 0 0
15 0 0 0 0 0 0 0 0 0
16 0 0 0 0 0 0 0 0 0
17 0 0 0 0 0 0 0 0 0
18 0 0 0 0 0 0 0 0 0
19 0 0 0 0 0 0 0 0 0
20 0 0 0 0 0 0 0 0 0
21 0 0 0 0 0 0 0 0 0
22 0 0 0 0 0 0 0 0 0
23 0 0 0 0 0 0 0 0 0
24 0 0 0 0 0 0 0 0 0
25 0 0 0 0 0 0 0 0 0
26 0 0 0 0 0 0 0 0 0
27 0 0 0 0 0 0 0 0 0
28 0 0 0 0 0 0 0 0 0
29 0 0 0 0 0 0 0 0 0
30 0 0 0 0 0 0 0 0 0
31 0 0 0 0 0 0 0 0 0
32 0 0 0 0 0 0 0 0 0
*** Program elapsed time: 33.672s ( 950.348 blocks/s, 59.397 Mb/s)
|
| Attachment 5: Stats2.png
|

|
| Attachment 6: Stats3.png
|

|
| Attachment 7: Bias3.png
|
|
| Attachment 8: Analysis_R14_741
|
*** TDR format 3.3.0 analyser - TD - May 2021
*** ERROR: READ I/O error: 5002
blocks: 32000
ADC data format: 253670855 ( 1280798.3 Hz)
Other data format: 8249145 ( 41650.4 Hz)
Sample trace data format: 0 ( 0.0 Hz)
Undefined format: 0 ( 0.0 Hz)
Other data format type: PAUSE: 236 ( 1.2 Hz)
RESUME: 236 ( 1.2 Hz)
SYNC100: 32737 ( 165.3 Hz)
WR48-63: 32737 ( 165.3 Hz)
FEE64 disc: 0 ( 0.0 Hz)
MBS info: 8183199 ( 41317.4 Hz)
Other info: 0 ( 0.0 Hz)
ADC data range bit set: 413031 ( 2085.4 Hz)
Timewarps: ADC: 0 ( 0.0 Hz)
PAUSE: 0 ( 0.0 Hz)
RESUME: 0 ( 0.0 Hz)
SYNC100: 0 ( 0.0 Hz)
WR48-63: 0 ( 0.0 Hz)
FEE64 disc: 0 ( 0.0 Hz)
MBS info: 0 ( 0.0 Hz)
Undefined: 0 ( 0.0 Hz)
Sample trace: 0 ( 0.0 Hz)
*** Timestamp elapsed time: 198.057 s
FEE elapsed dead time(s) elapsed idle time(s)
0 0.011 2.771
1 4.649 0.000
2 0.028 0.000
3 4.808 0.000
4 0.111 7.488
5 7.093 0.000
6 0.128 0.000
7 10.340 0.000
8 0.971 0.000
9 0.000 24.260
10 0.713 0.000
11 0.245 0.000
12 0.122 0.000
13 0.000 21.524
14 0.232 0.000
15 1.605 0.000
16 0.000 0.000
17 0.000 0.000
18 0.000 0.000
19 0.000 0.000
20 0.000 0.000
21 0.000 0.000
22 0.000 0.000
23 0.000 0.000
24 0.000 0.000
25 0.000 0.000
26 0.000 0.000
27 0.000 0.000
28 0.000 0.000
29 0.000 0.000
30 0.000 0.000
31 0.000 0.000
32 0.000 0.000
*** Statistics
FEE ADC Data Other Data Sample Undefined Pause Resume SYNC100 WR48-63 Disc MBS Other HEC Data
0 5709345 2725 0 0 1 1 769 769 0 1185 0 22625
1 23799538 6034 0 0 27 27 2990 2990 0 0 0 44162
2 11722022 2092139 0 0 1 1 1767 1767 0 2088603 0 36240
3 29654318 2044332 0 0 38 38 3940 3940 0 2036376 0 53125
4 3438629 1158241 0 0 8 8 579 579 0 1157067 0 9655
5 33876189 636041 0 0 60 60 4396 4396 0 627129 0 27488
6 10663472 1364583 0 0 5 5 1426 1426 0 1361721 0 20341
7 38937063 921272 0 0 54 54 5023 5023 0 911118 0 34159
8 16044621 3966 0 0 9 9 1974 1974 0 0 0 46740
9 2236927 610 0 0 0 0 305 305 0 0 0 3583
10 23087850 5792 0 0 6 6 2890 2890 0 0 0 28946
11 13996775 3362 0 0 8 8 1673 1673 0 0 0 8557
12 9568717 2316 0 0 4 4 1154 1154 0 0 0 40620
13 2488330 626 0 0 0 0 313 313 0 0 0 2902
14 9604847 2392 0 0 6 6 1190 1190 0 0 0 27522
15 18842212 4714 0 0 9 9 2348 2348 0 0 0 6366
16 0 0 0 0 0 0 0 0 0 0 0 0
17 0 0 0 0 0 0 0 0 0 0 0 0
18 0 0 0 0 0 0 0 0 0 0 0 0
19 0 0 0 0 0 0 0 0 0 0 0 0
20 0 0 0 0 0 0 0 0 0 0 0 0
21 0 0 0 0 0 0 0 0 0 0 0 0
22 0 0 0 0 0 0 0 0 0 0 0 0
23 0 0 0 0 0 0 0 0 0 0 0 0
24 0 0 0 0 0 0 0 0 0 0 0 0
25 0 0 0 0 0 0 0 0 0 0 0 0
26 0 0 0 0 0 0 0 0 0 0 0 0
27 0 0 0 0 0 0 0 0 0 0 0 0
28 0 0 0 0 0 0 0 0 0 0 0 0
29 0 0 0 0 0 0 0 0 0 0 0 0
30 0 0 0 0 0 0 0 0 0 0 0 0
31 0 0 0 0 0 0 0 0 0 0 0 0
32 0 0 0 0 0 0 0 0 0 0 0 0
*** Timewarps
FEE ADC Pause Resume SYNC100 WR48-63 Disc MBS Undefined Samples
0 0 0 0 0 0 0 0 0 0
1 0 0 0 0 0 0 0 0 0
2 0 0 0 0 0 0 0 0 0
3 0 0 0 0 0 0 0 0 0
4 0 0 0 0 0 0 0 0 0
5 0 0 0 0 0 0 0 0 0
6 0 0 0 0 0 0 0 0 0
7 0 0 0 0 0 0 0 0 0
8 0 0 0 0 0 0 0 0 0
9 0 0 0 0 0 0 0 0 0
10 0 0 0 0 0 0 0 0 0
11 0 0 0 0 0 0 0 0 0
12 0 0 0 0 0 0 0 0 0
13 0 0 0 0 0 0 0 0 0
14 0 0 0 0 0 0 0 0 0
15 0 0 0 0 0 0 0 0 0
16 0 0 0 0 0 0 0 0 0
17 0 0 0 0 0 0 0 0 0
18 0 0 0 0 0 0 0 0 0
19 0 0 0 0 0 0 0 0 0
20 0 0 0 0 0 0 0 0 0
21 0 0 0 0 0 0 0 0 0
22 0 0 0 0 0 0 0 0 0
23 0 0 0 0 0 0 0 0 0
24 0 0 0 0 0 0 0 0 0
25 0 0 0 0 0 0 0 0 0
26 0 0 0 0 0 0 0 0 0
27 0 0 0 0 0 0 0 0 0
28 0 0 0 0 0 0 0 0 0
29 0 0 0 0 0 0 0 0 0
30 0 0 0 0 0 0 0 0 0
31 0 0 0 0 0 0 0 0 0
32 0 0 0 0 0 0 0 0 0
*** Program elapsed time: 34.094s ( 938.588 blocks/s, 58.662 Mb/s)
|
| Attachment 9: Stats4.png
|

|
| Attachment 10: Stats6.png
|

|
| Attachment 11: Bias6.png
|
|
|
466
|
Wed May 18 15:29:50 2022 |
TD | Wednesday 18 May |
      file no storage mode, no MBS data transfer

      ADC control register 0x0

      std disc outputs disabled

      ASIC settings 2021Apr29-13-16-00
       slow comparator 0xa

      BNC PB-5 settings
      amplitude 1.000V
      attenuation x1
      tau_d 1ms
      frequency 2Hz
      polarity +

Attachment 1 - DSSSD bias & leakage current

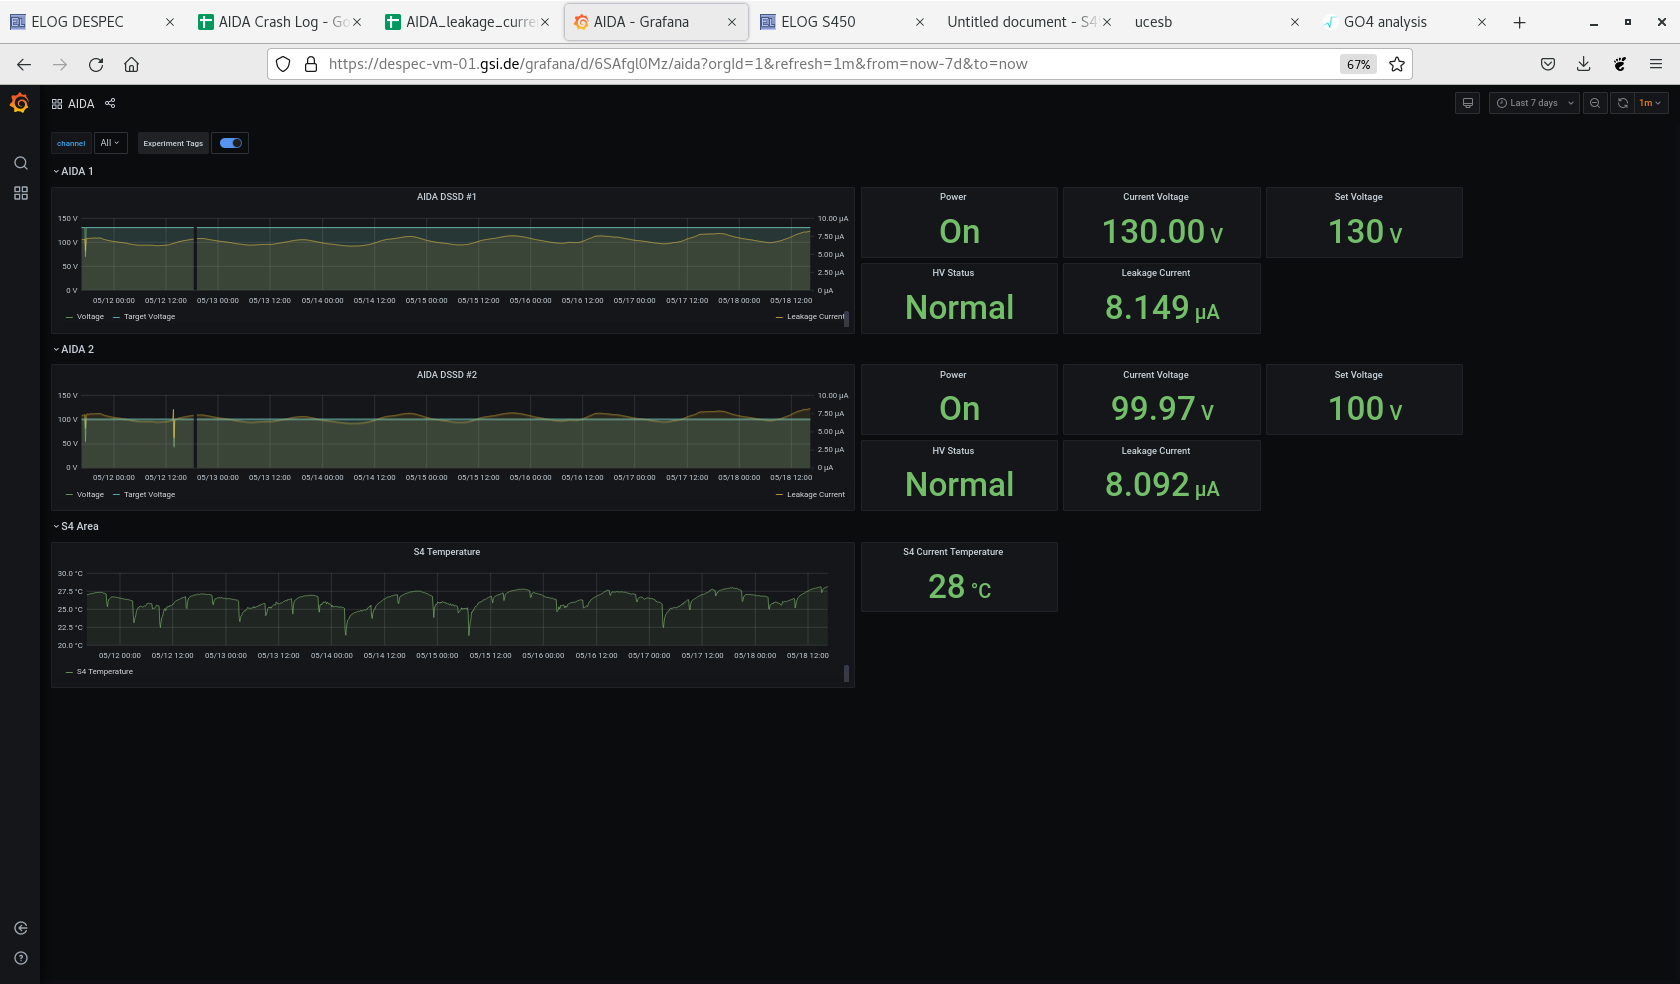
Attachment 2 - grafana DSSSD bias, leakage current & temp - OK

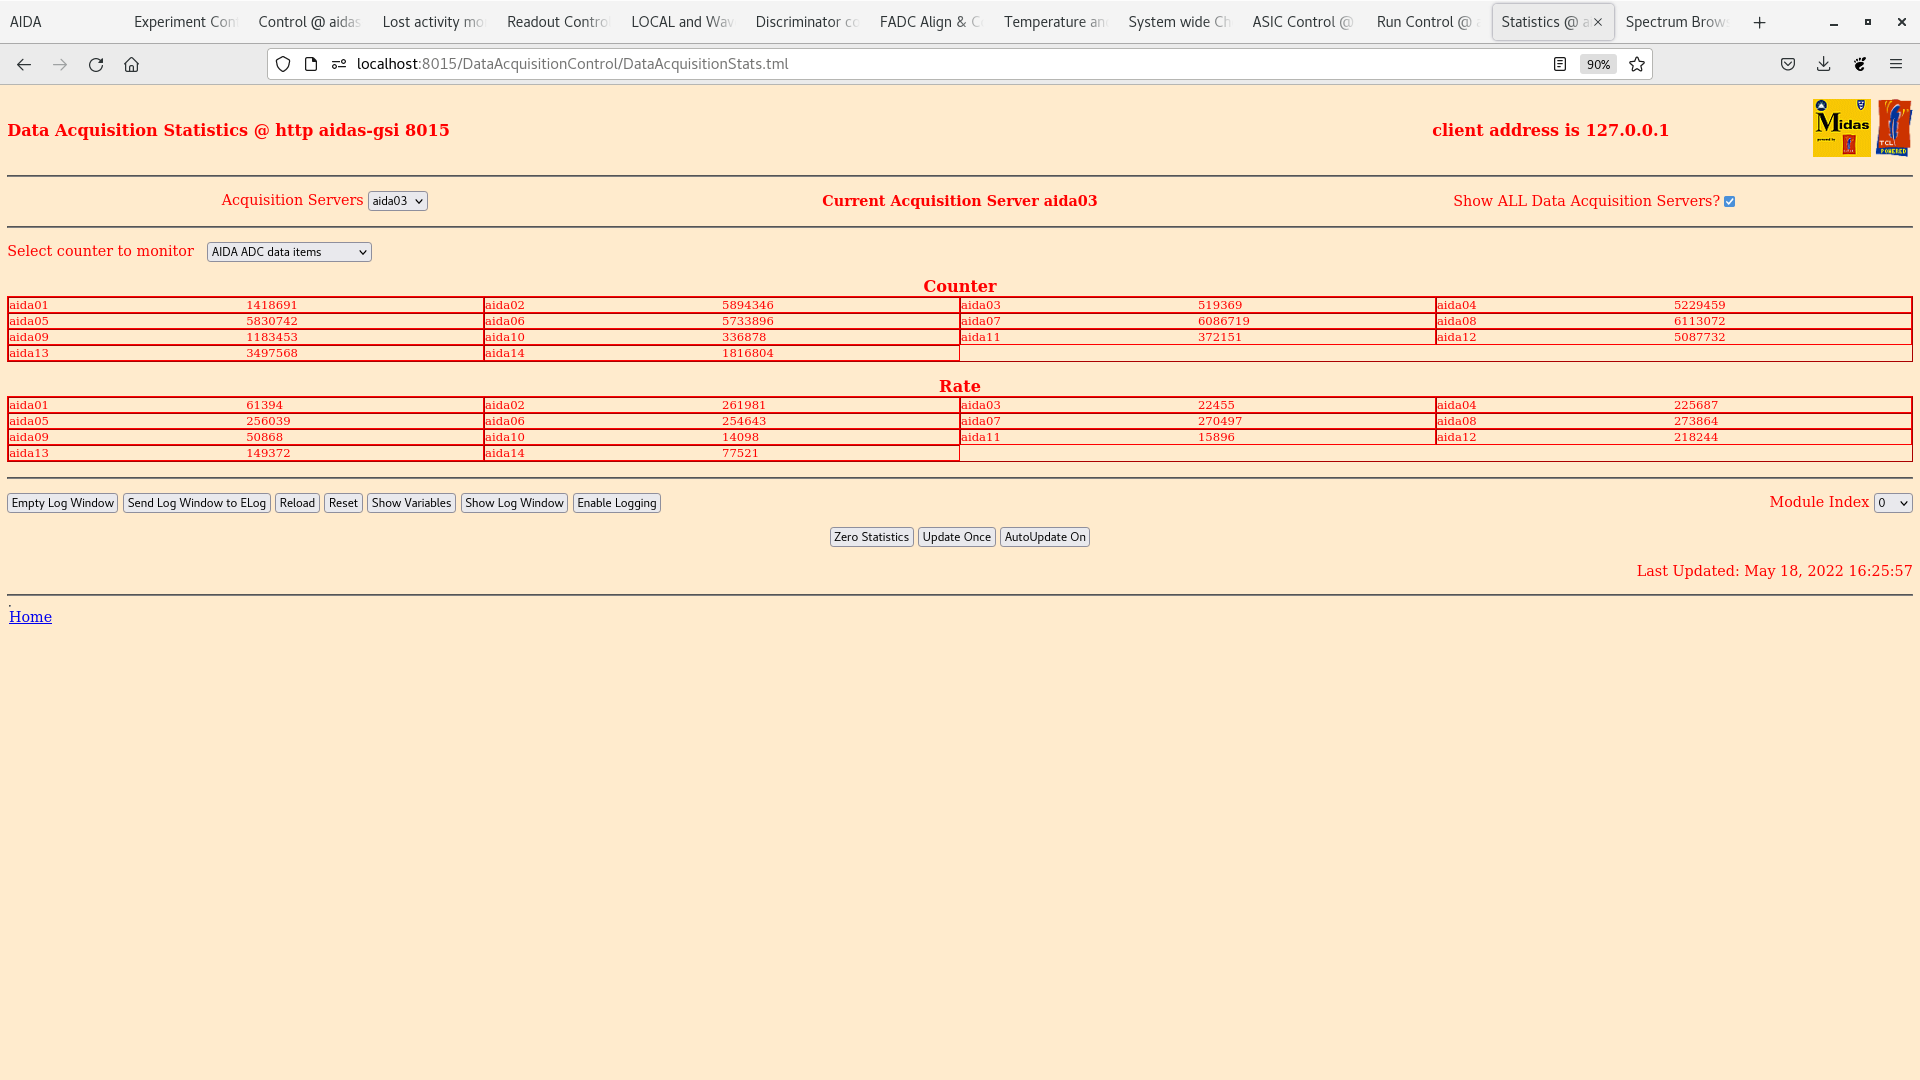
Attachment 3 - ADC data item stats

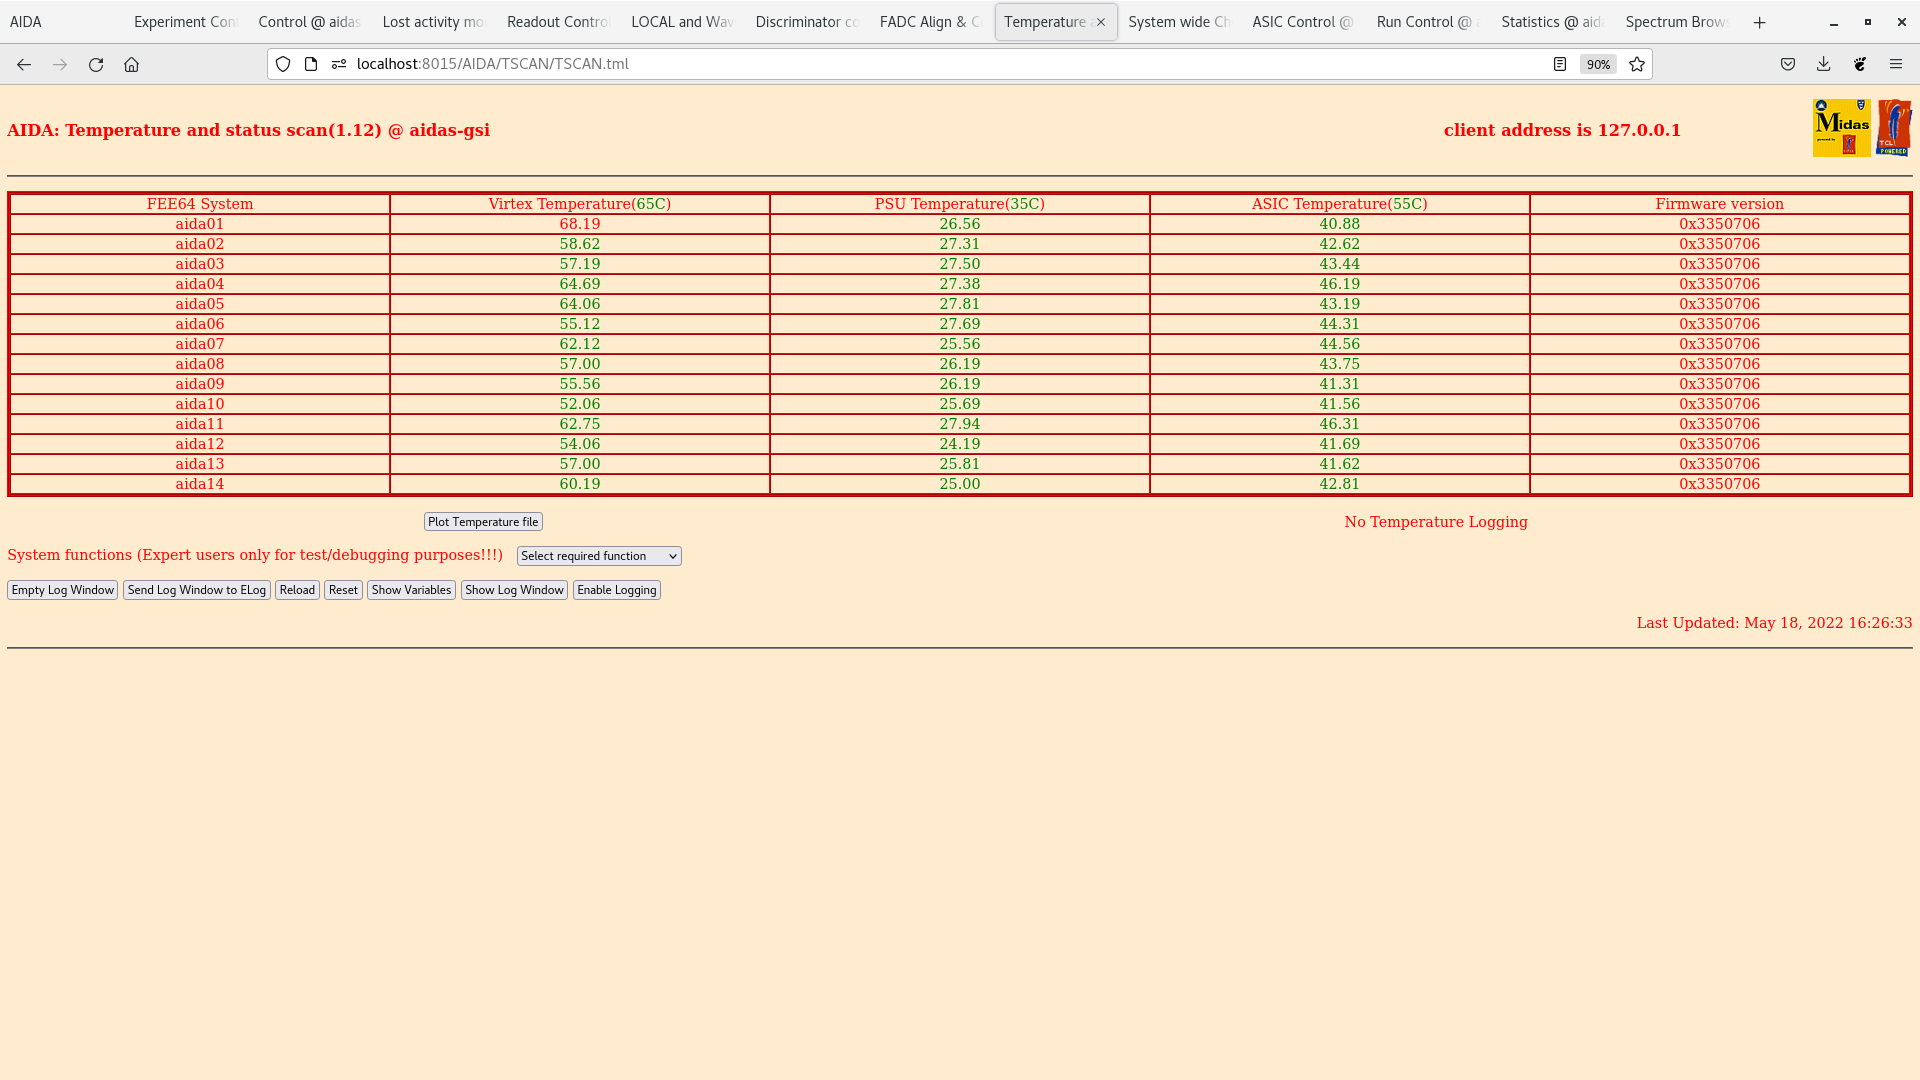
Attachment 4 - FEE64 temps - OK

16.35 zero all histograms
      zero statistics
      zero NewMerger statistics

      ASIC check control - all FEE64s, all ASICs

      baseline counters
      system wide checks - all OK *except* aida07 WR error 0x10

Attachment 5 - per FEE64 rate spectra

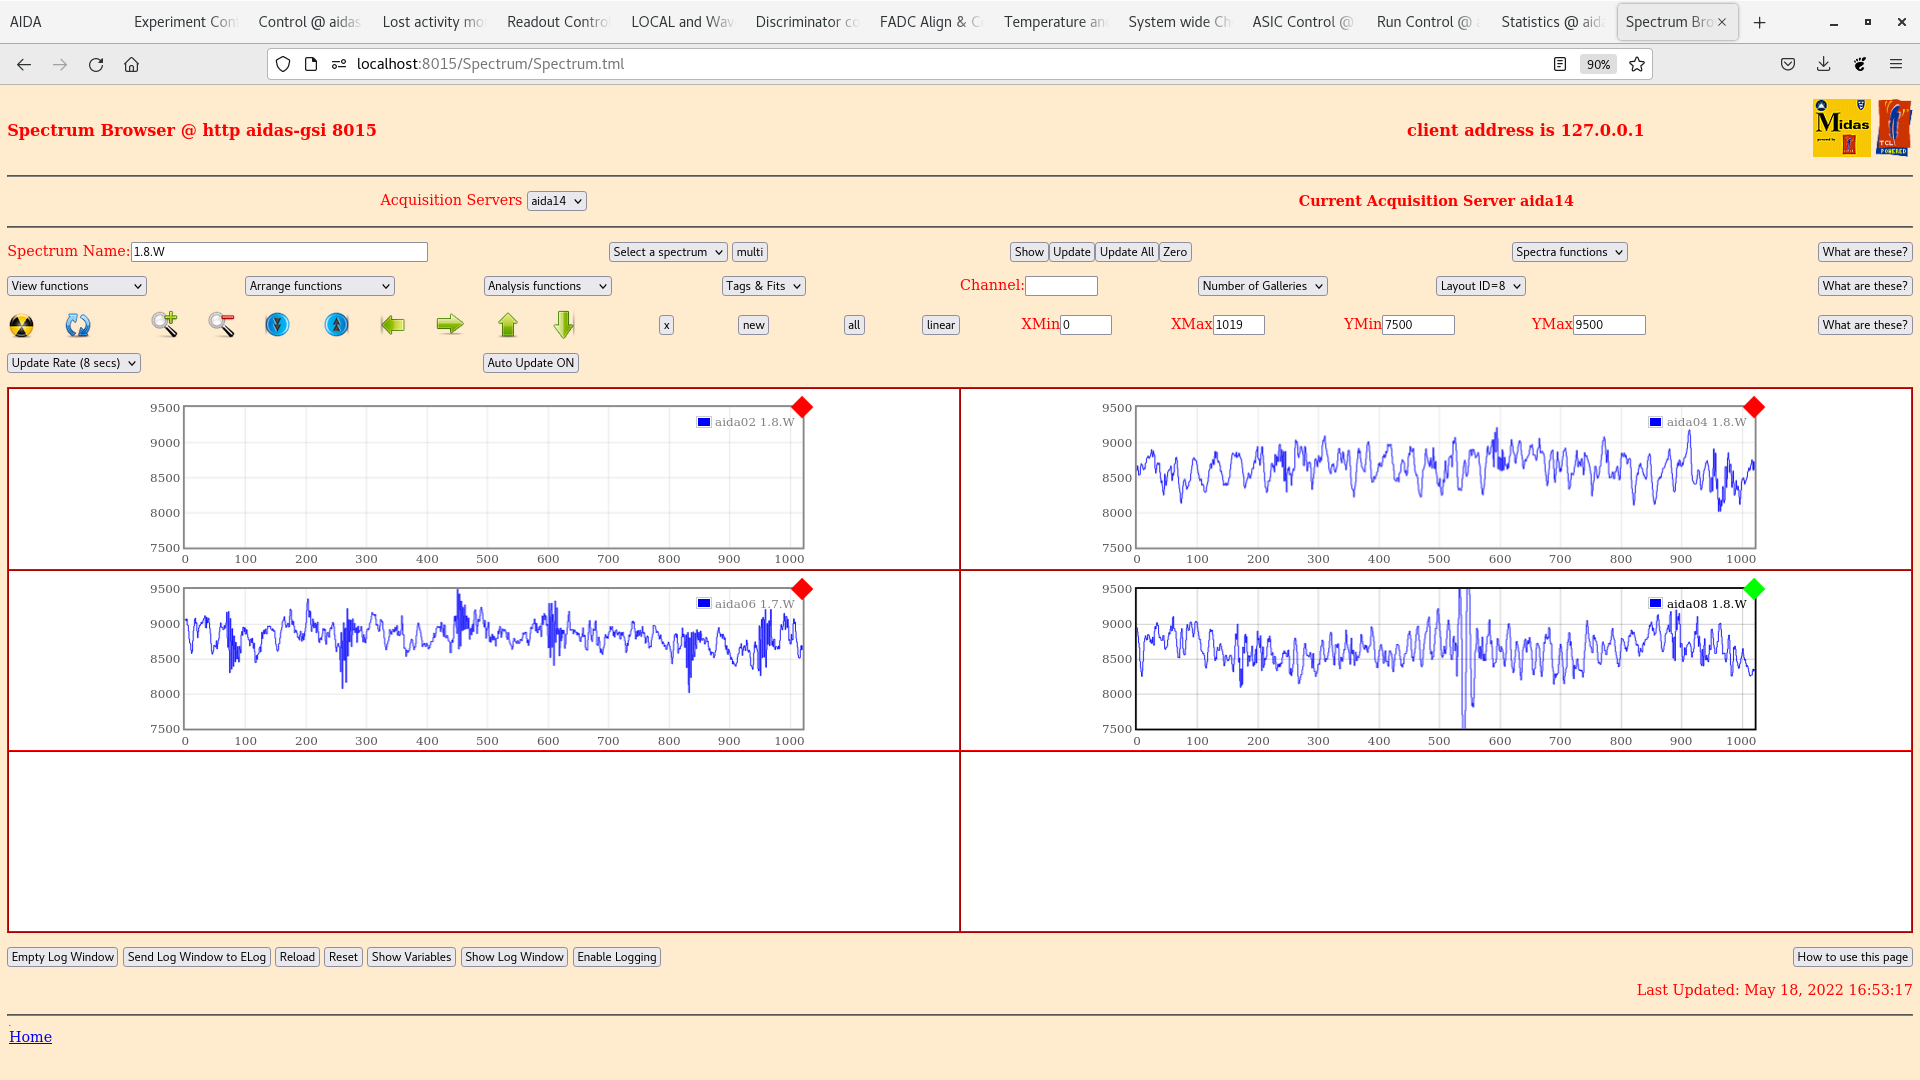
Attachmnents 6 & 7 - per FEE64 1.8.W spectra 20us FSR |
| Attachment 1: Screenshot_from_2022-05-18_16-24-18.png
|

|
| Attachment 2: Screenshot_from_2022-05-18_16-24-41.png
|
|
| Attachment 3: Screenshot_from_2022-05-18_16-26-13.png
|
|
| Attachment 4: Screenshot_from_2022-05-18_16-26-53.png
|
|
| Attachment 5: Screenshot_from_2022-05-18_16-36-47.png
|

|
| Attachment 6: Screenshot_from_2022-05-18_16-39-48.png
|

|
| Attachment 7: Screenshot_from_2022-05-18_16-52-18.png
|

|
| Attachment 8: Screenshot_from_2022-05-18_16-53-32.png
|
|
|
109
|
Wed Dec 18 17:39:27 2019 |
TD | Wednesday 18 December |
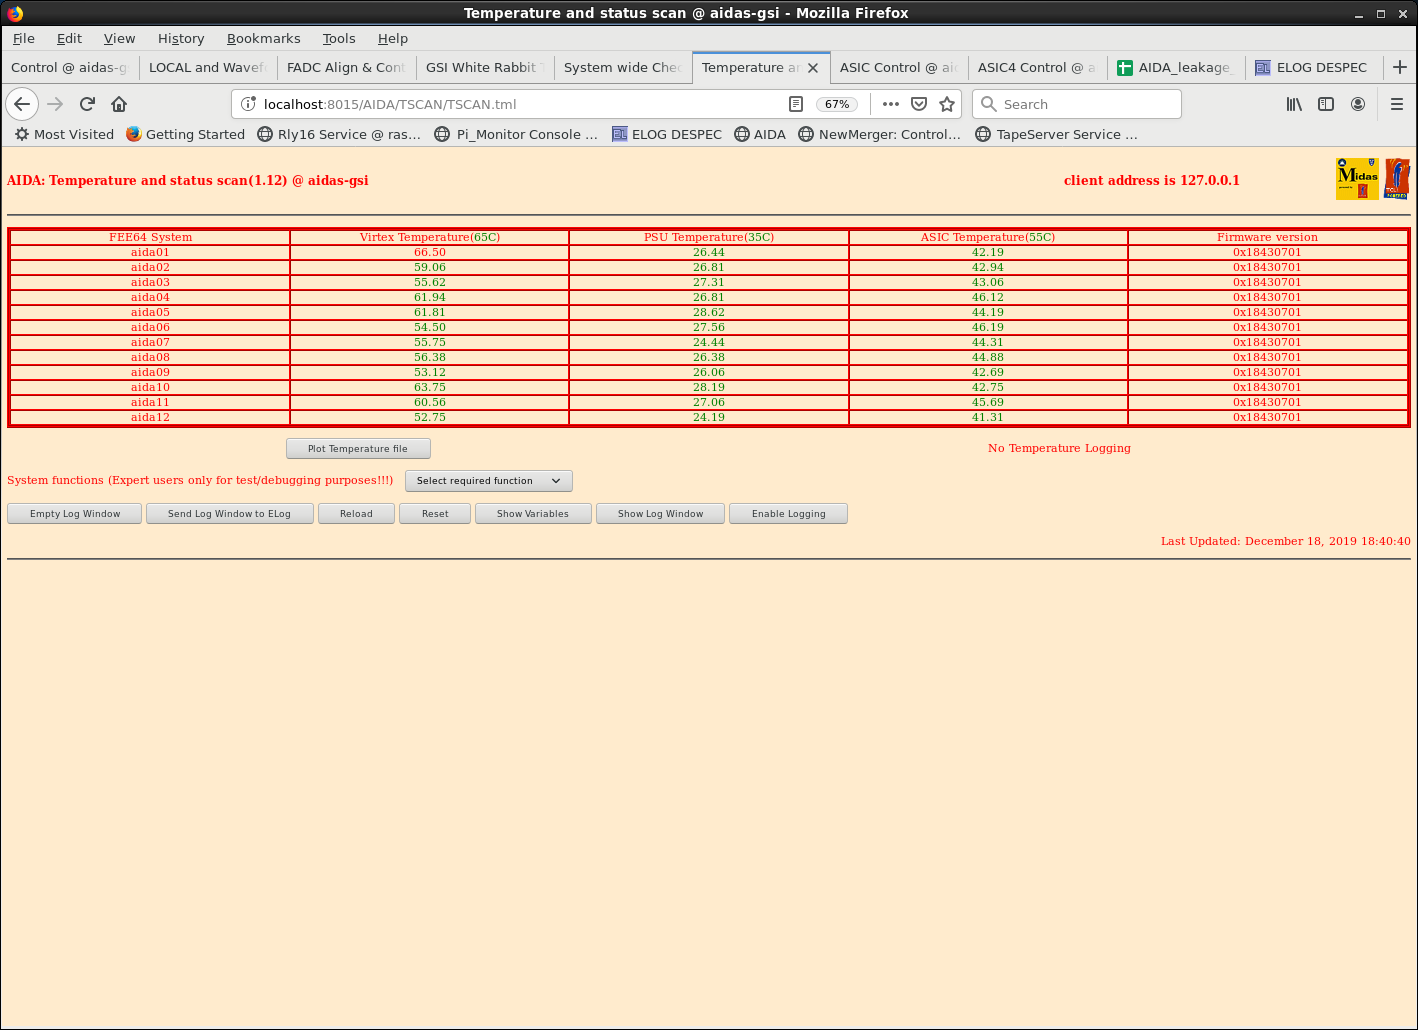
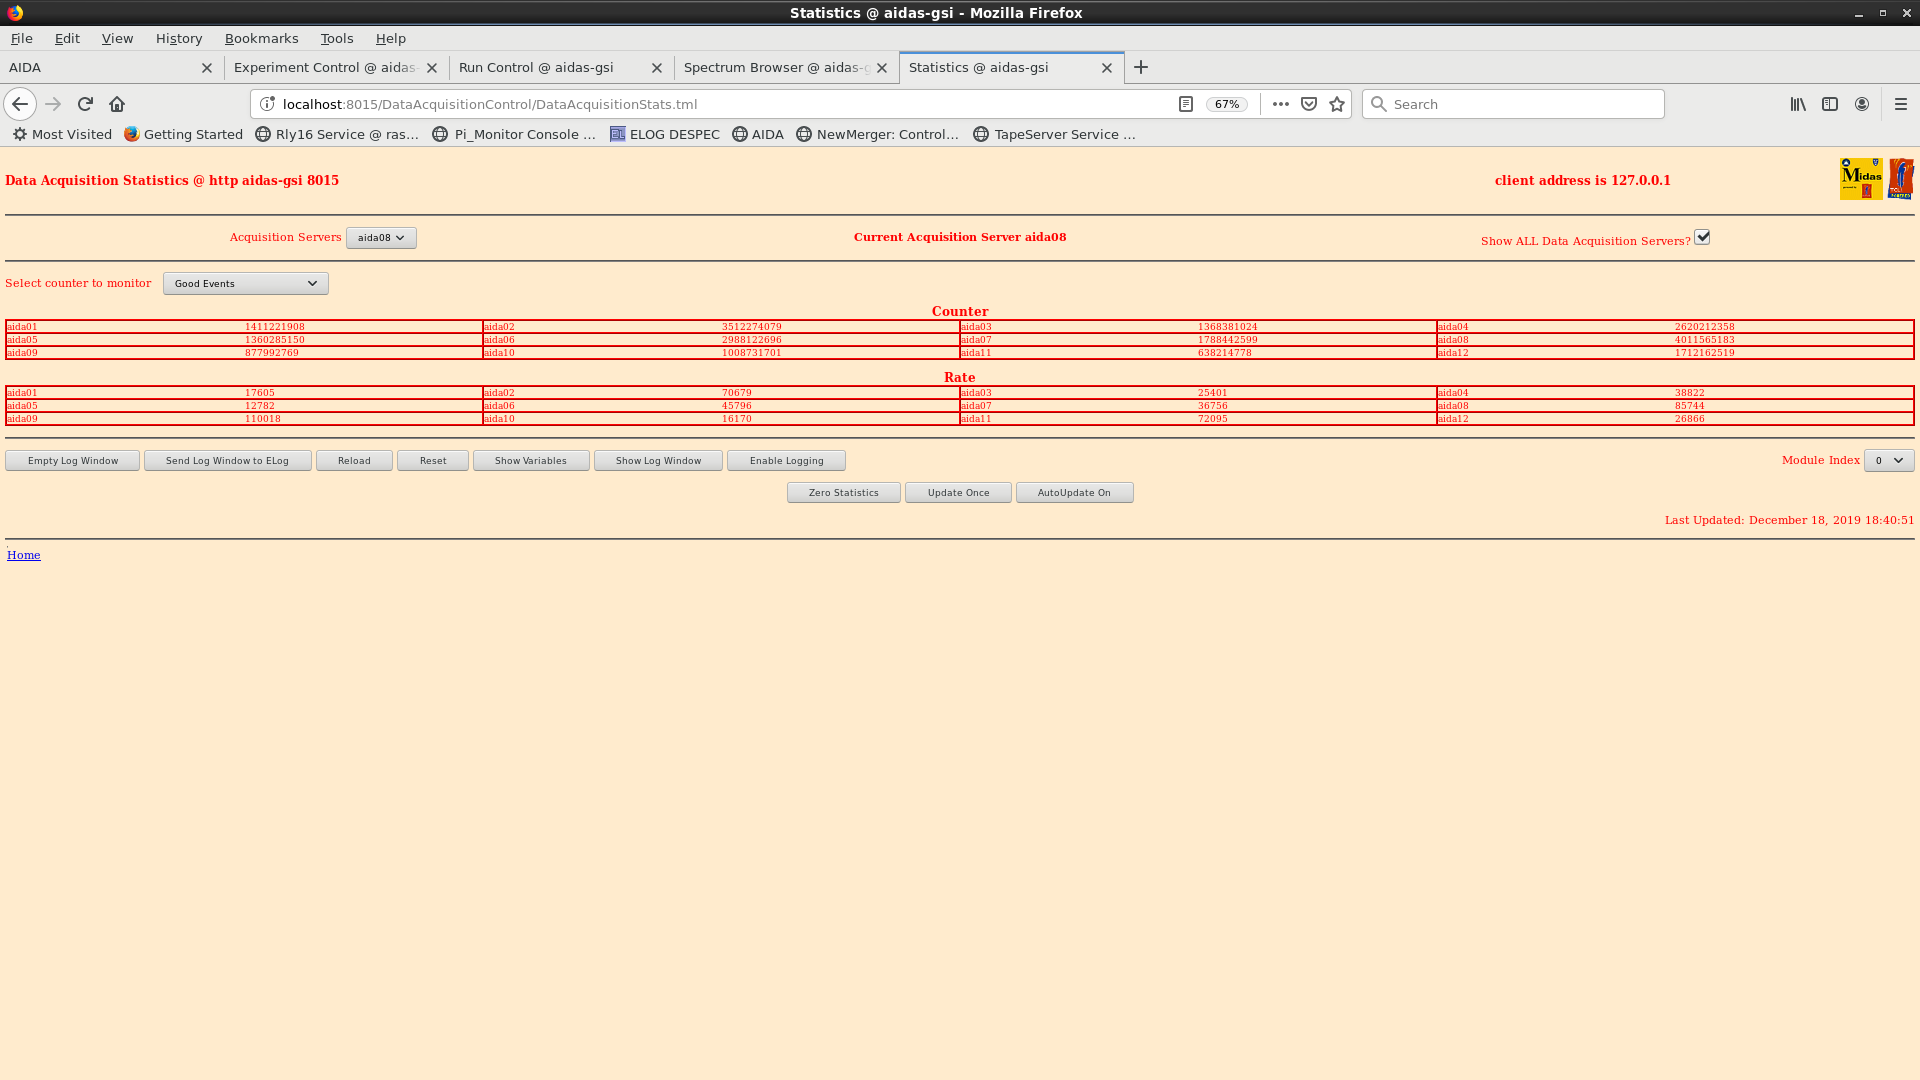
18.40 Detector biases & leakage currents OK - attachment 1
      FEE64 temperatures OK - attachment 2
      FEE64 good event statistics OK - attachment 3
      3x <20k, 8x <50k, 11x <100k
      note - all 12x FEE64s zero disc-info #6

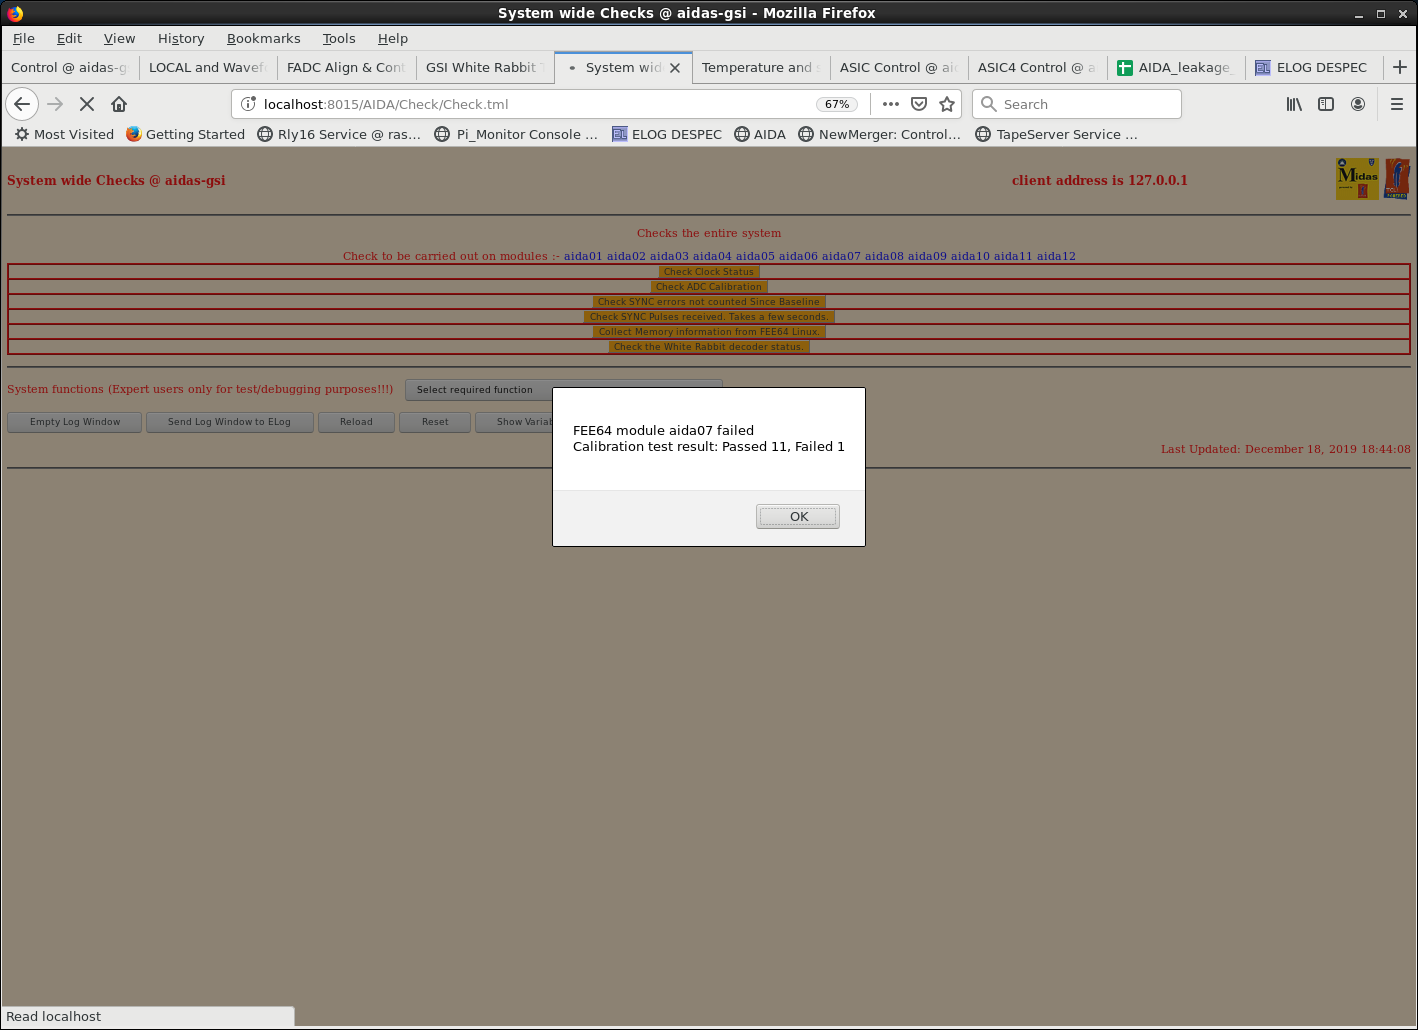
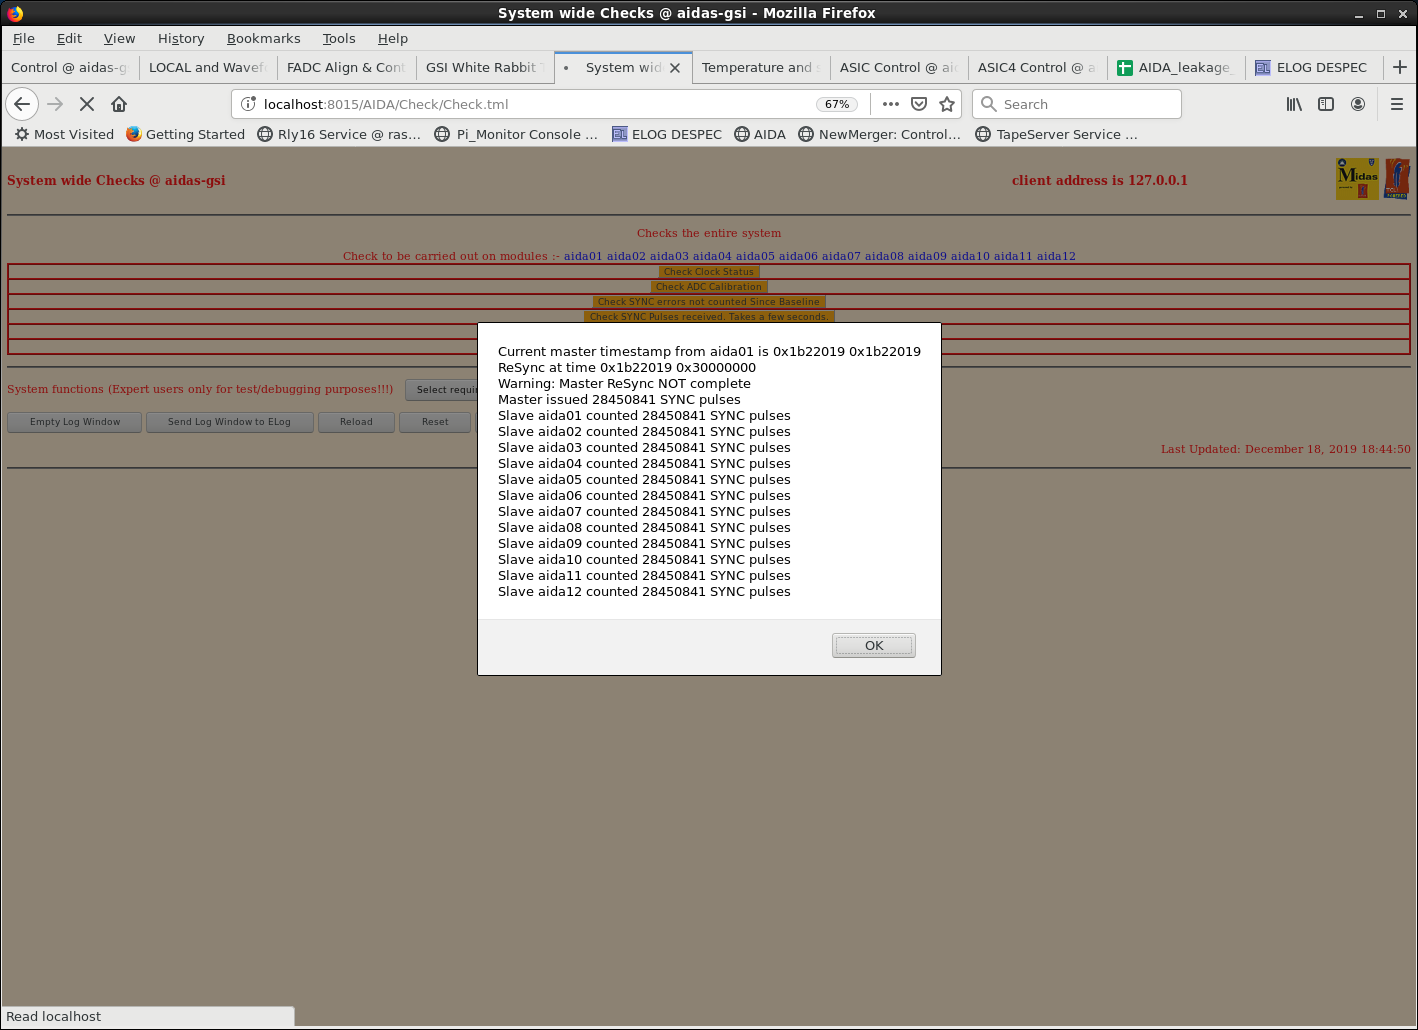
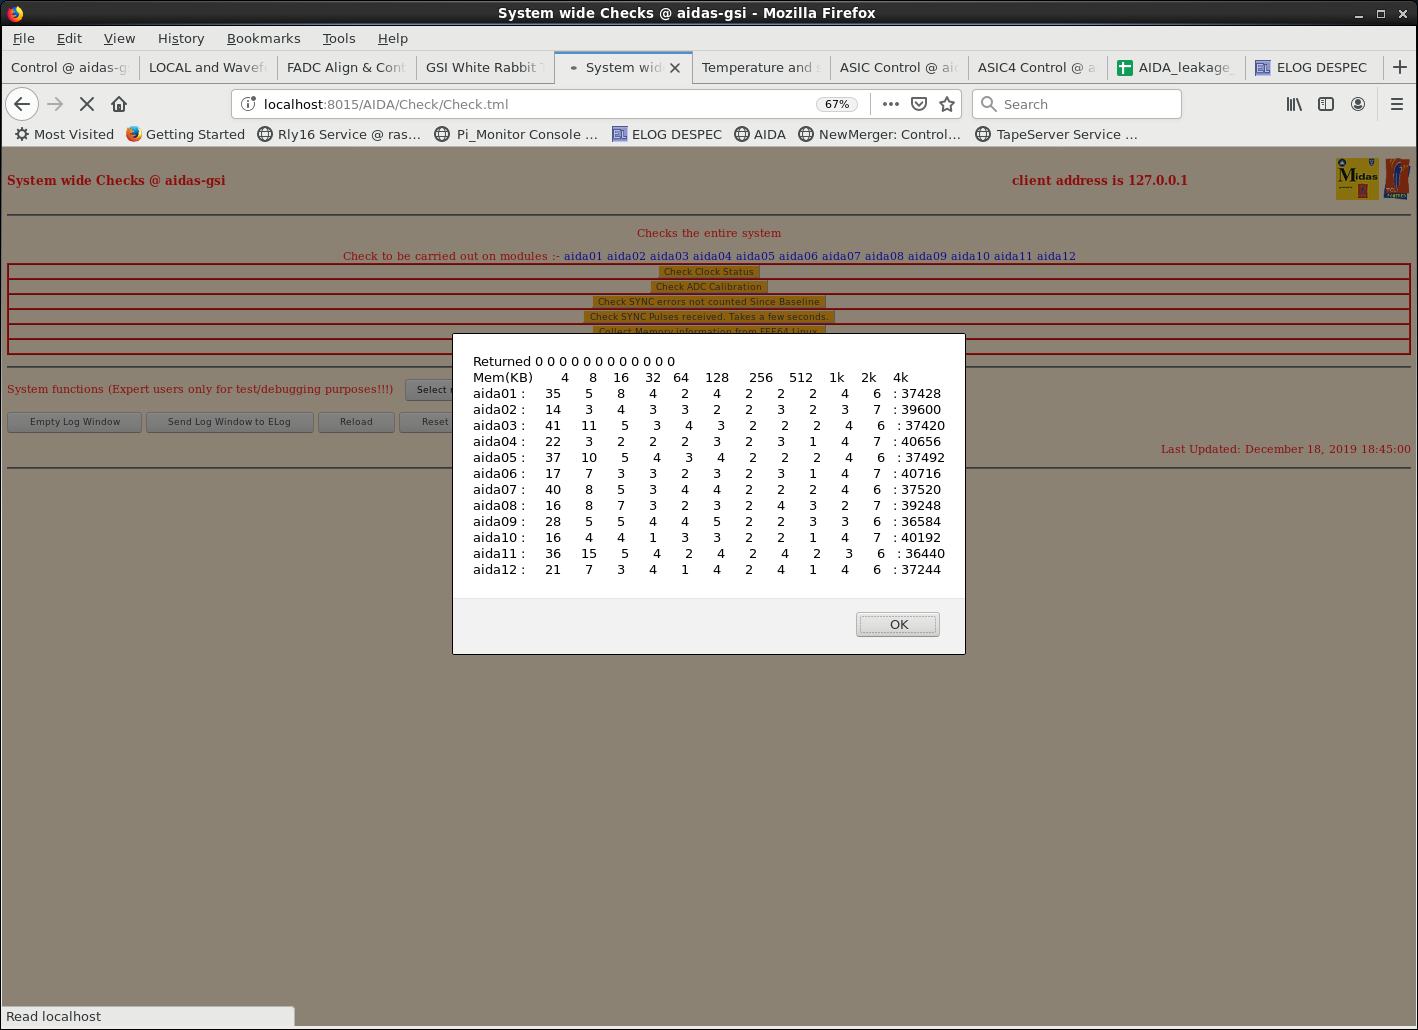
      system wide checks - see attachments 4-9
      master clock status fail
      WR decoder status - aida08 fails

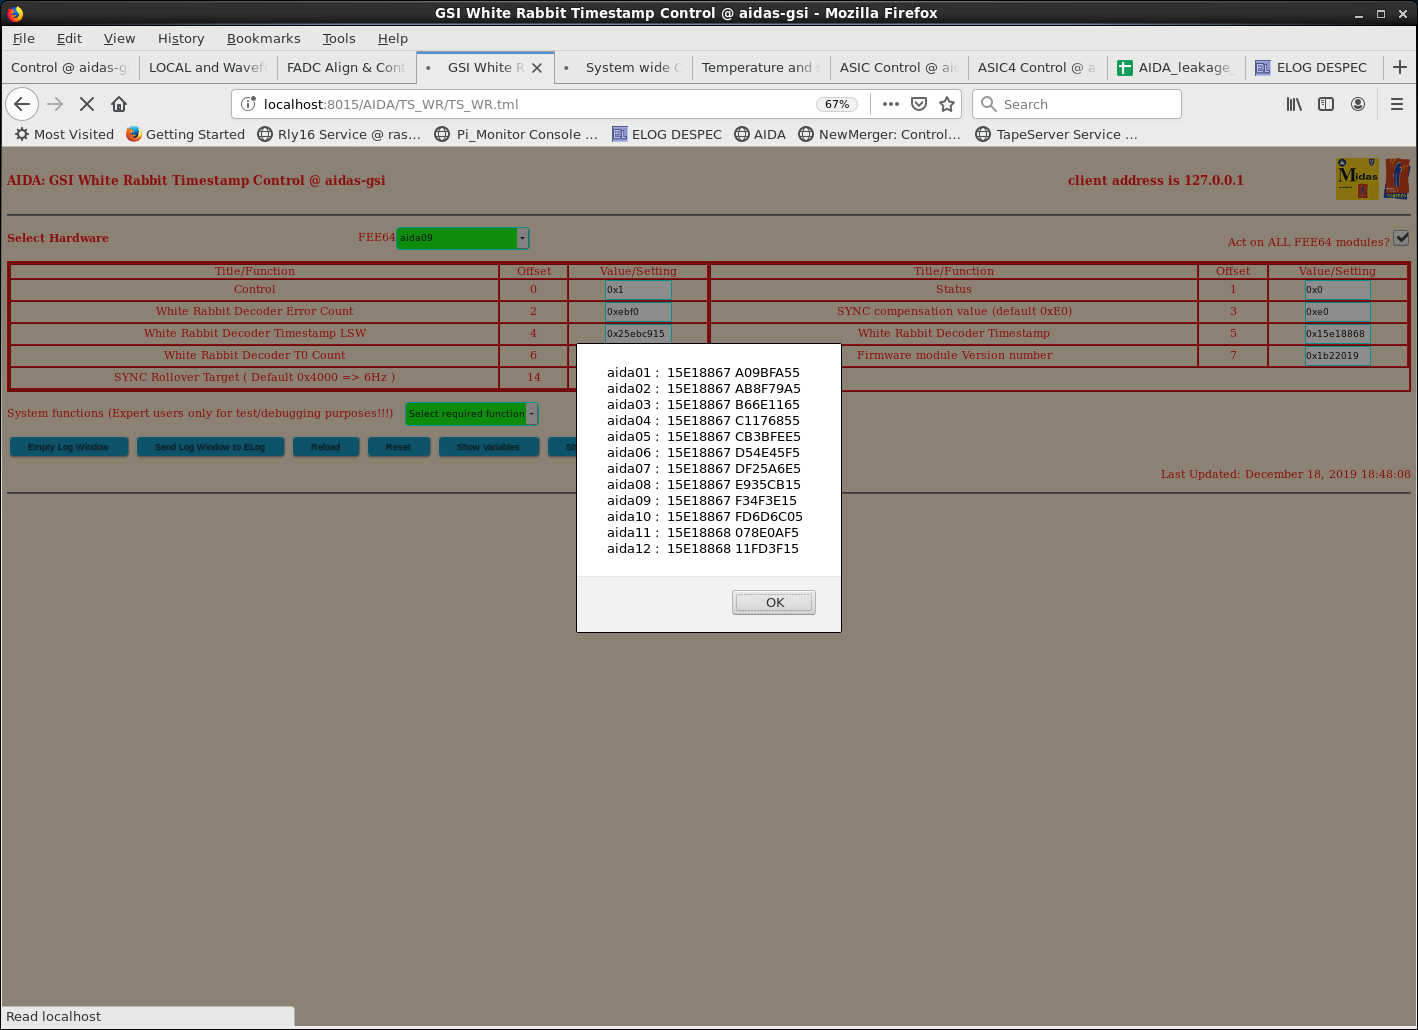
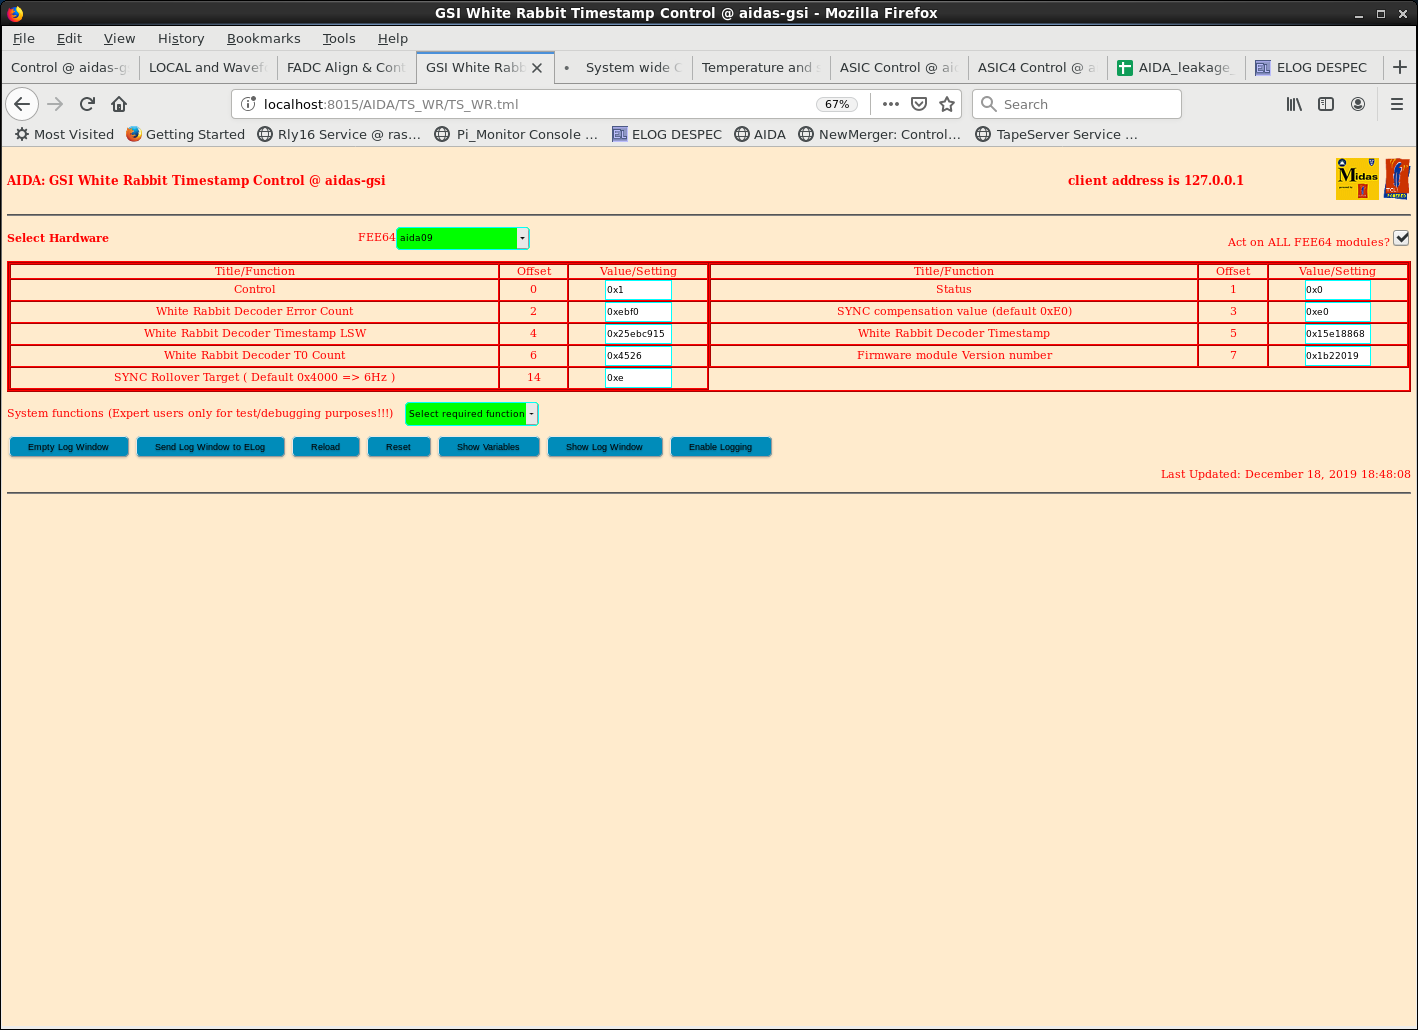
18.49 GSI WR status control & timestamps - attachments 10 & 11

18.50 check ASIC control *all* FEE64s *all* ASICs

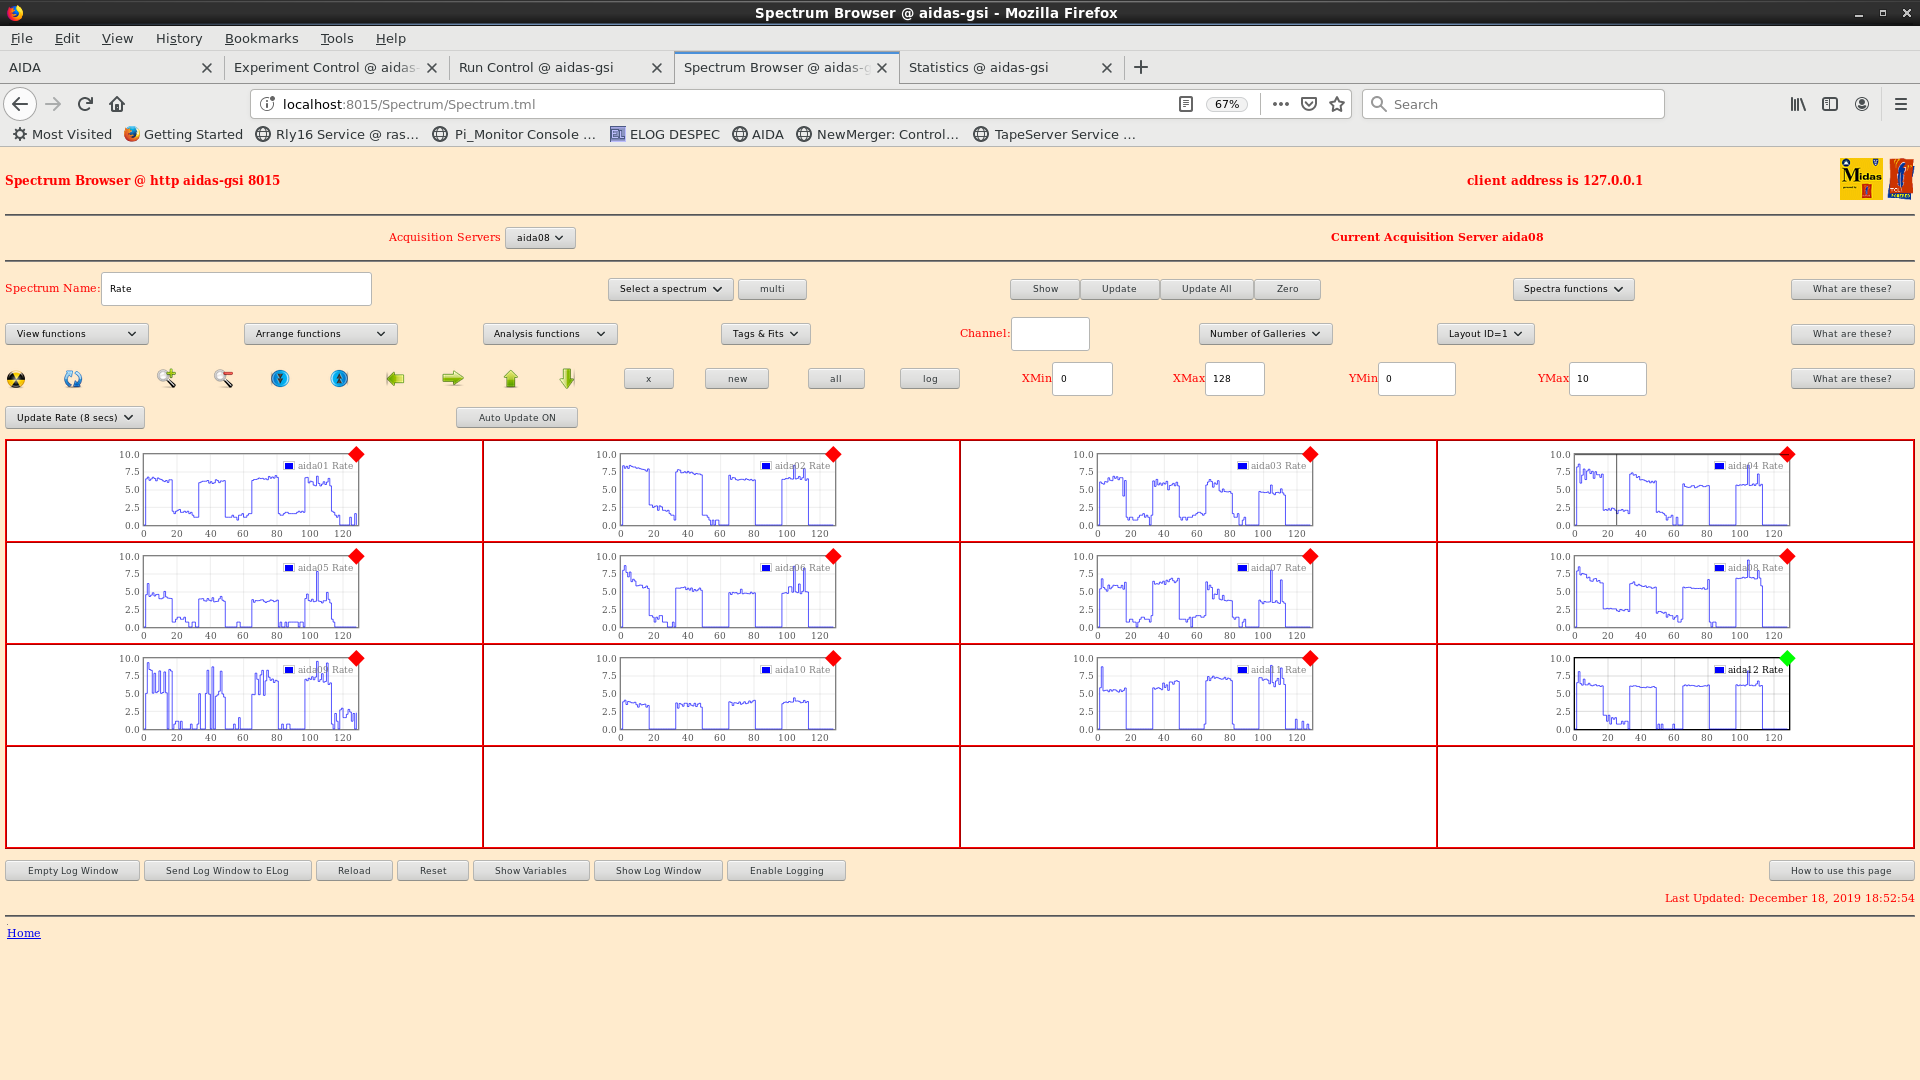
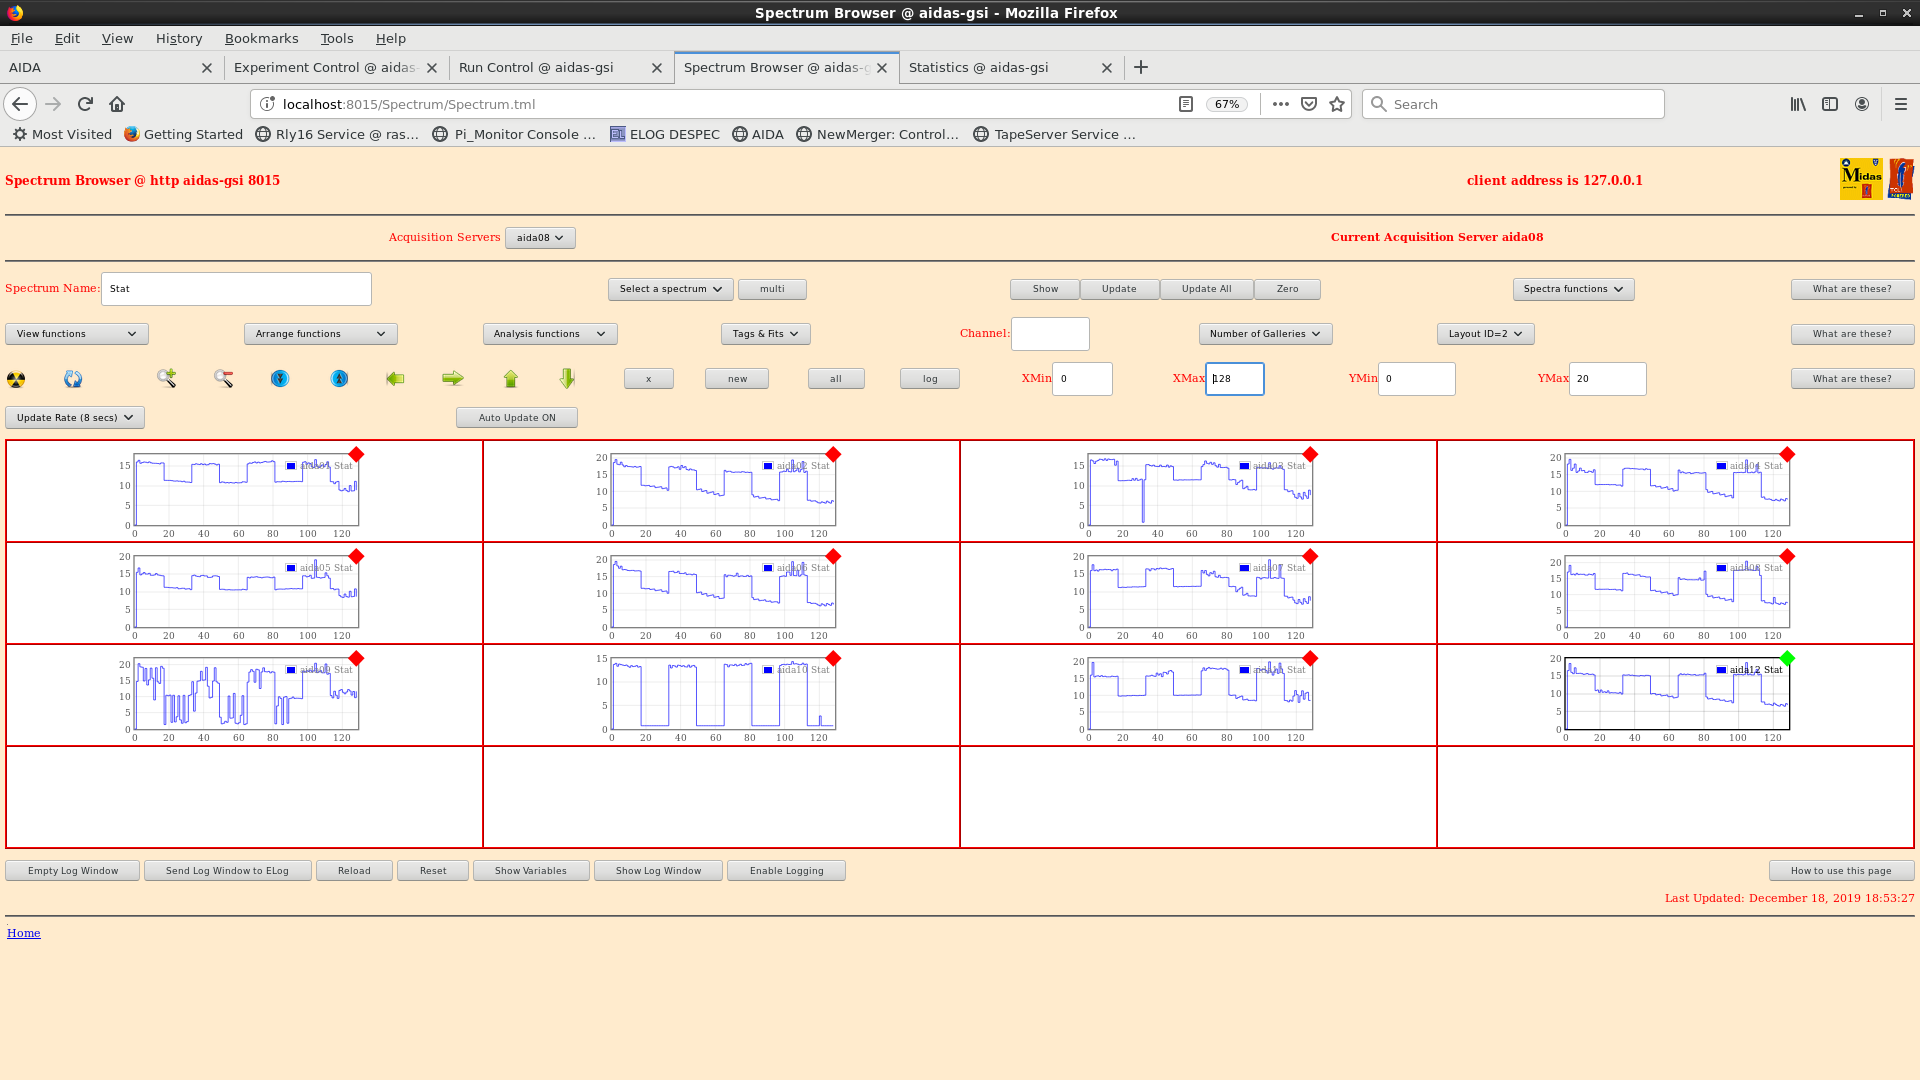
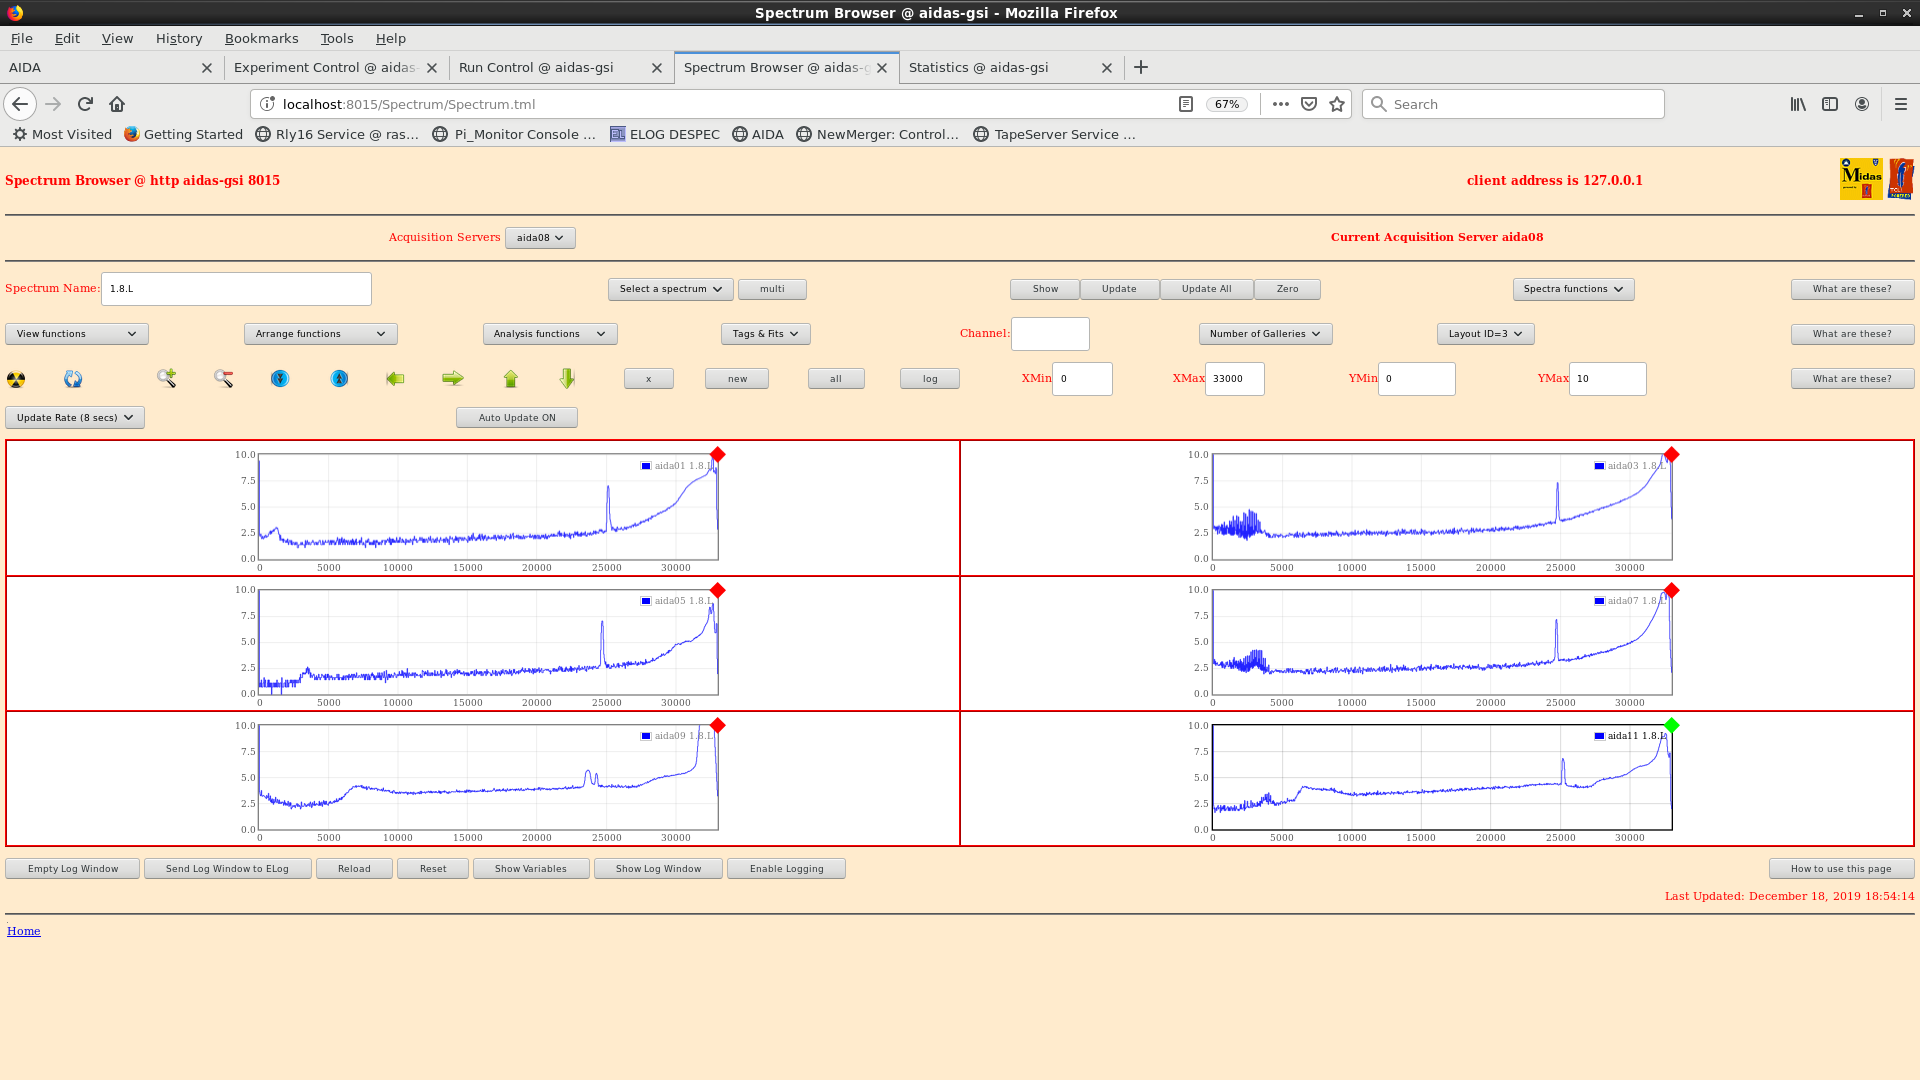
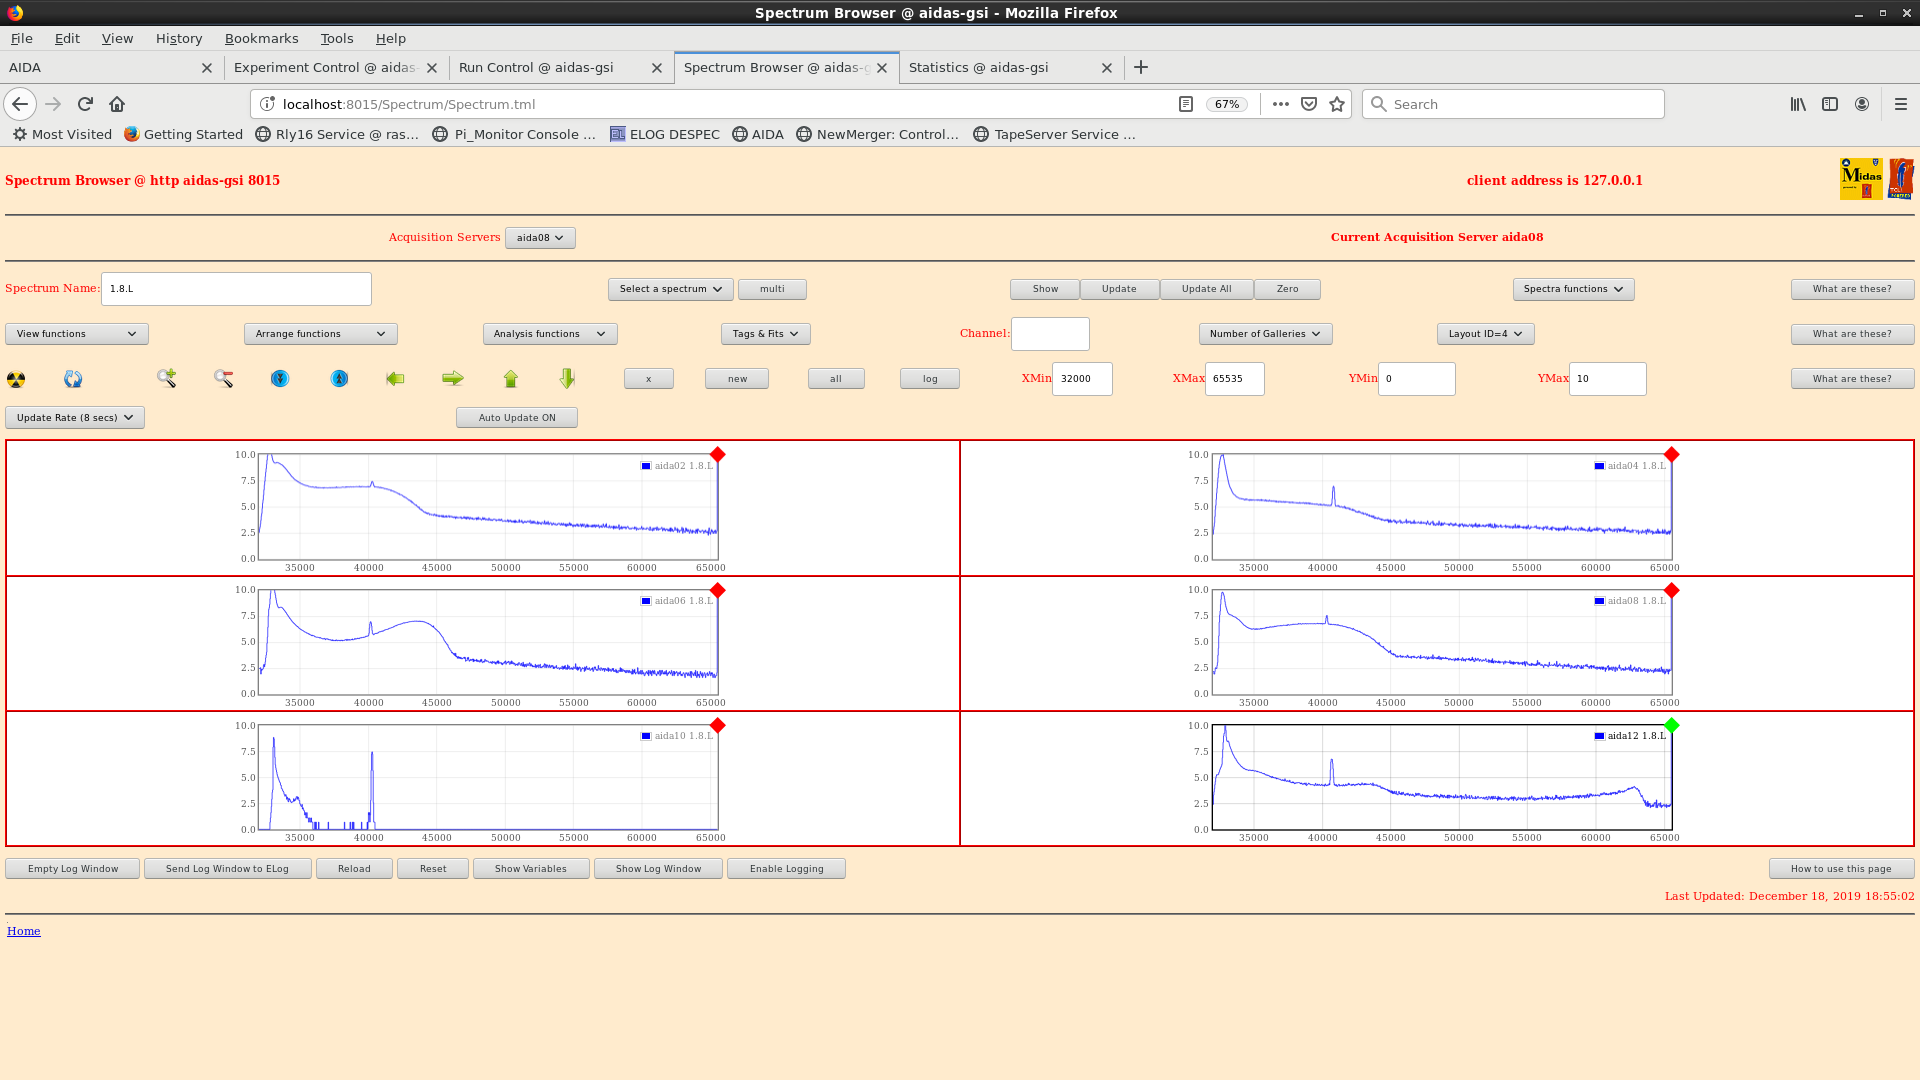
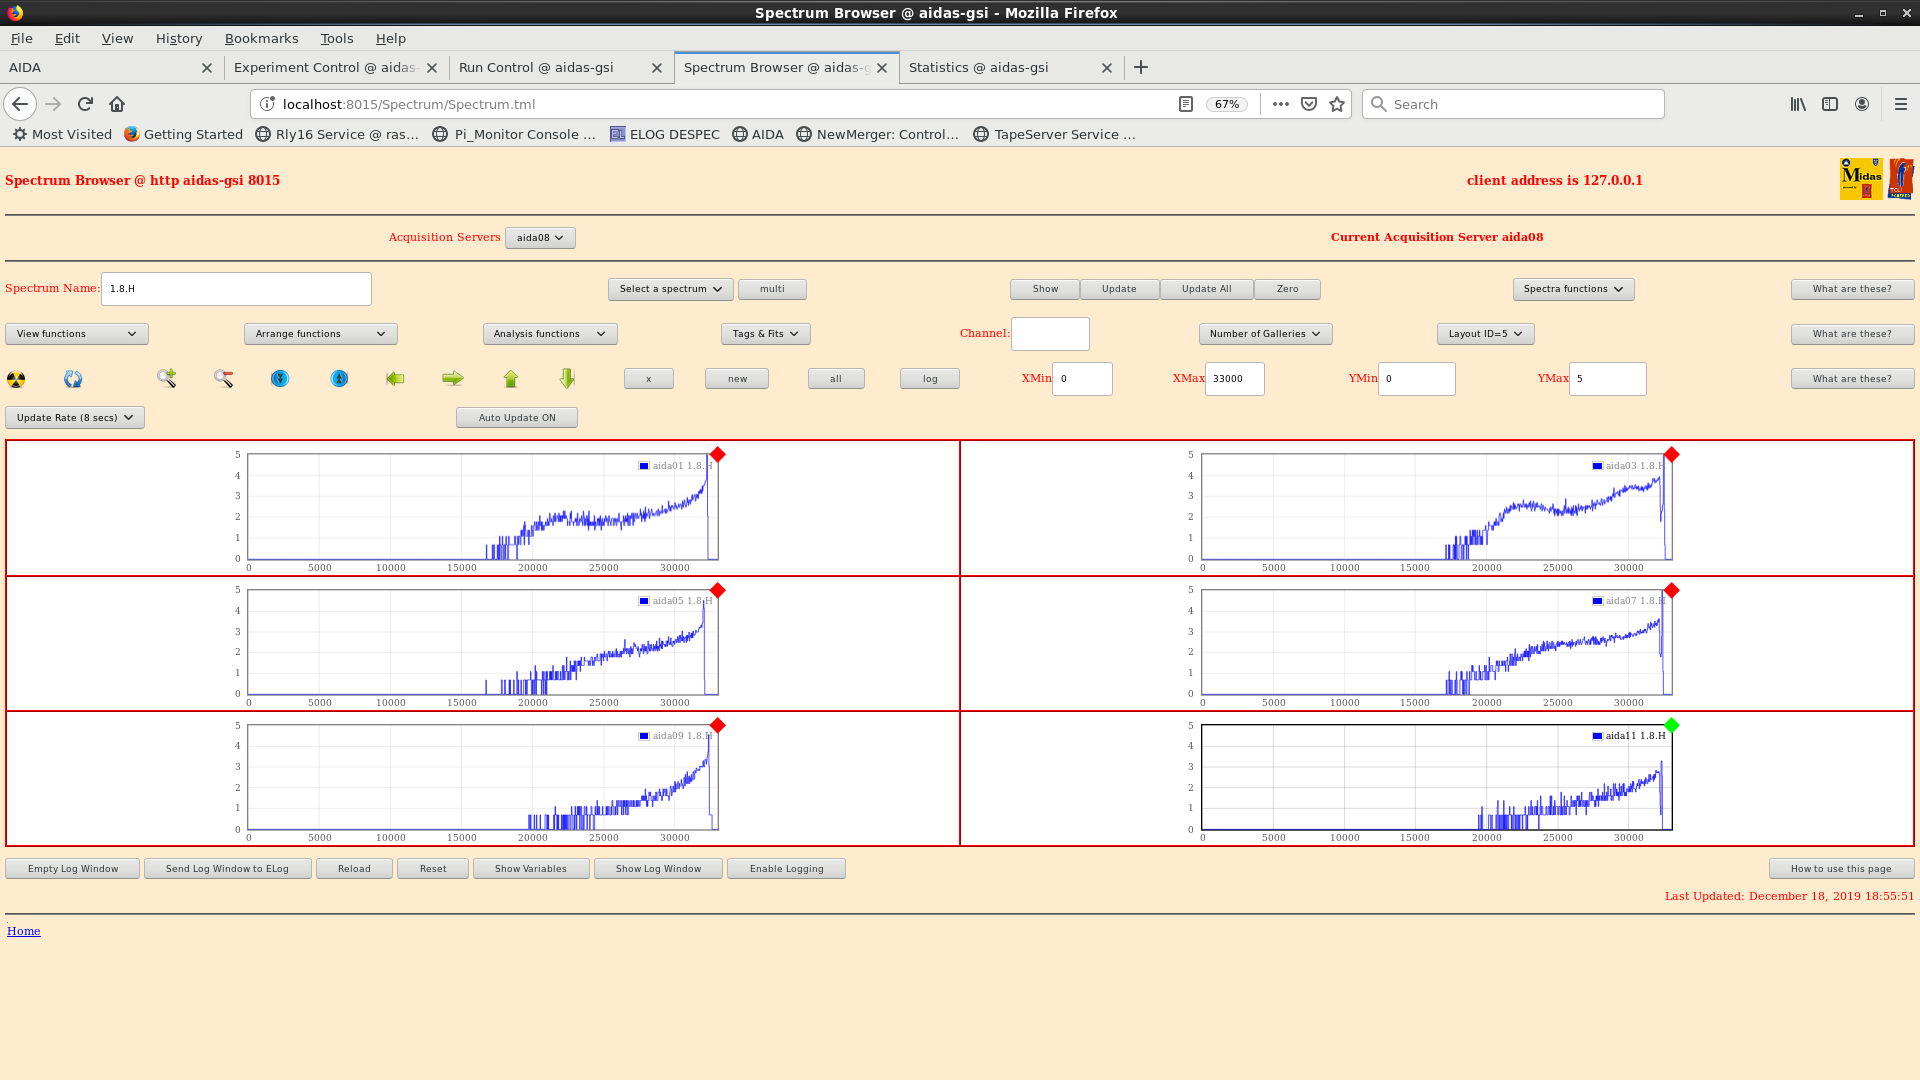
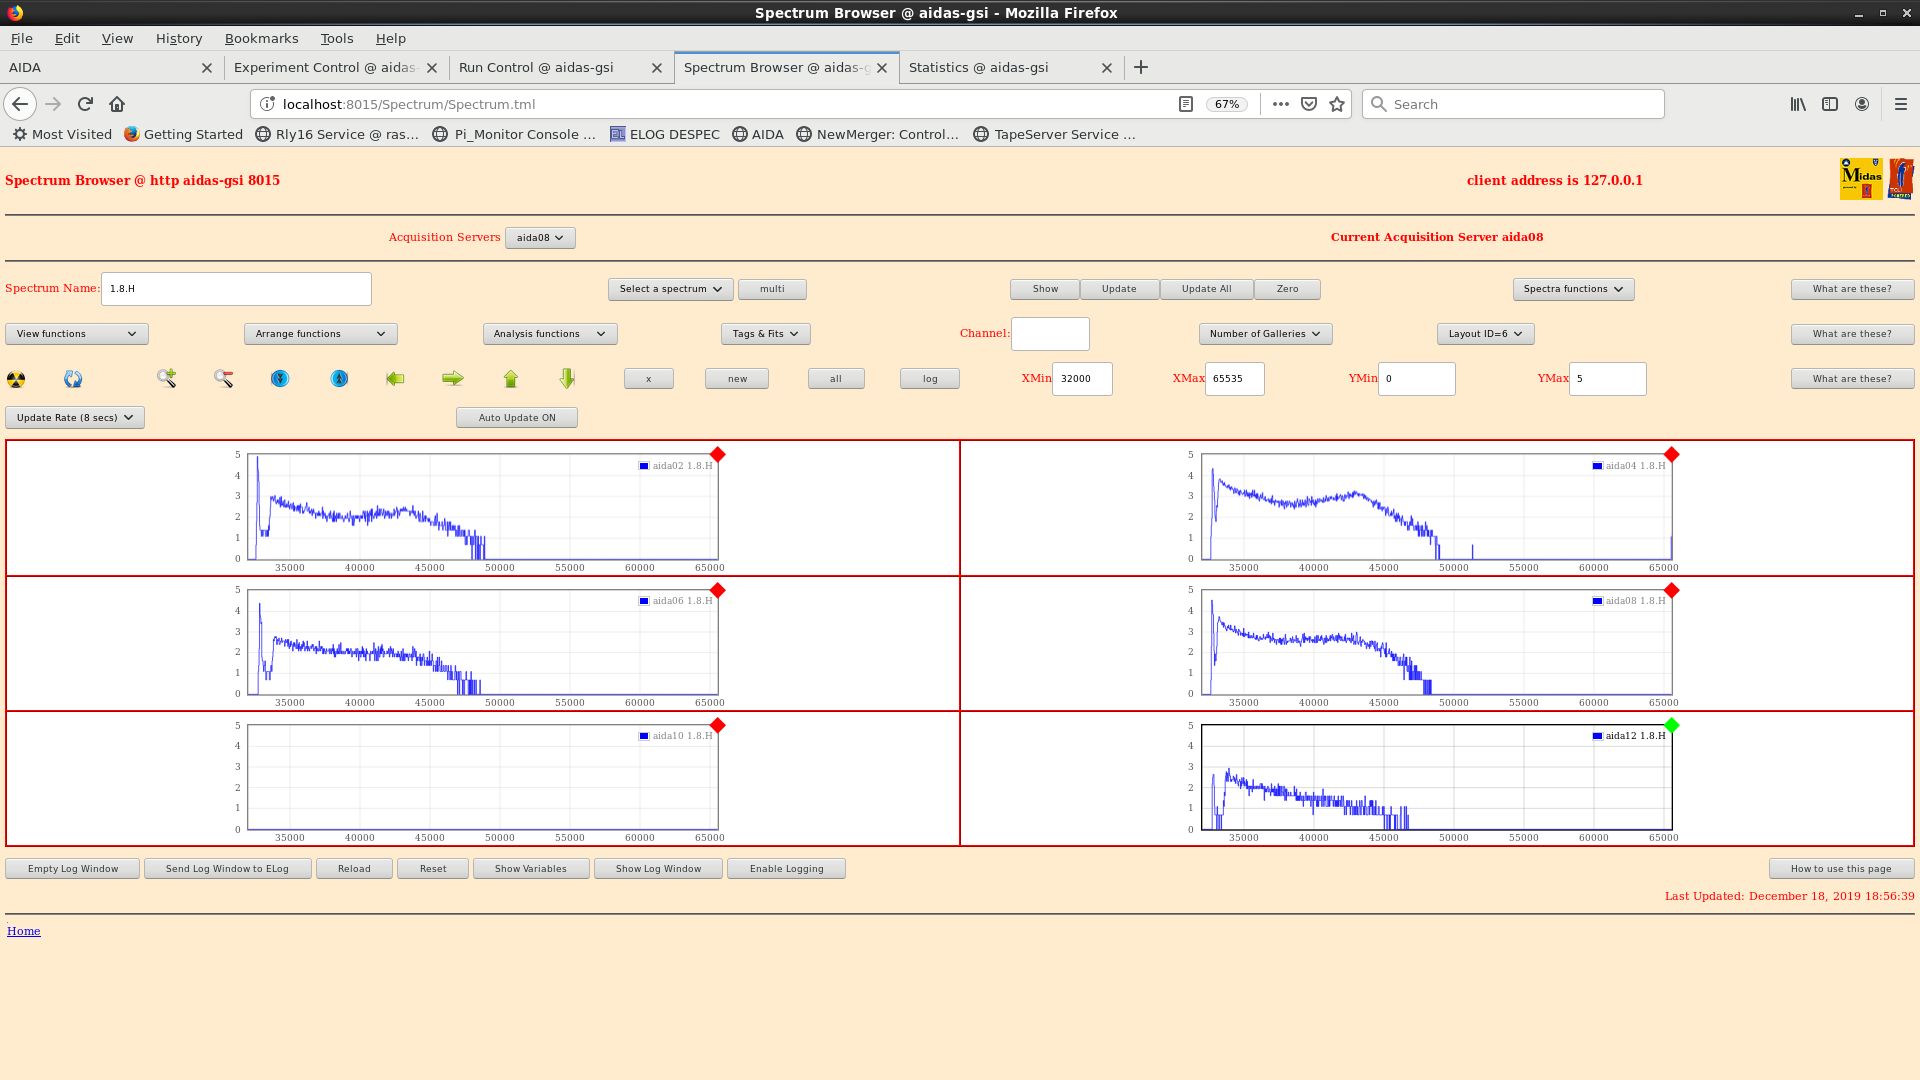
18.58 Rate, Stat, 1.8.L and 1.8.H spectra all FEE64s - attachments 12-17
      OK except aida10 no HEC data & low amplitude LEC data

19.00 *all* histograms zero'd

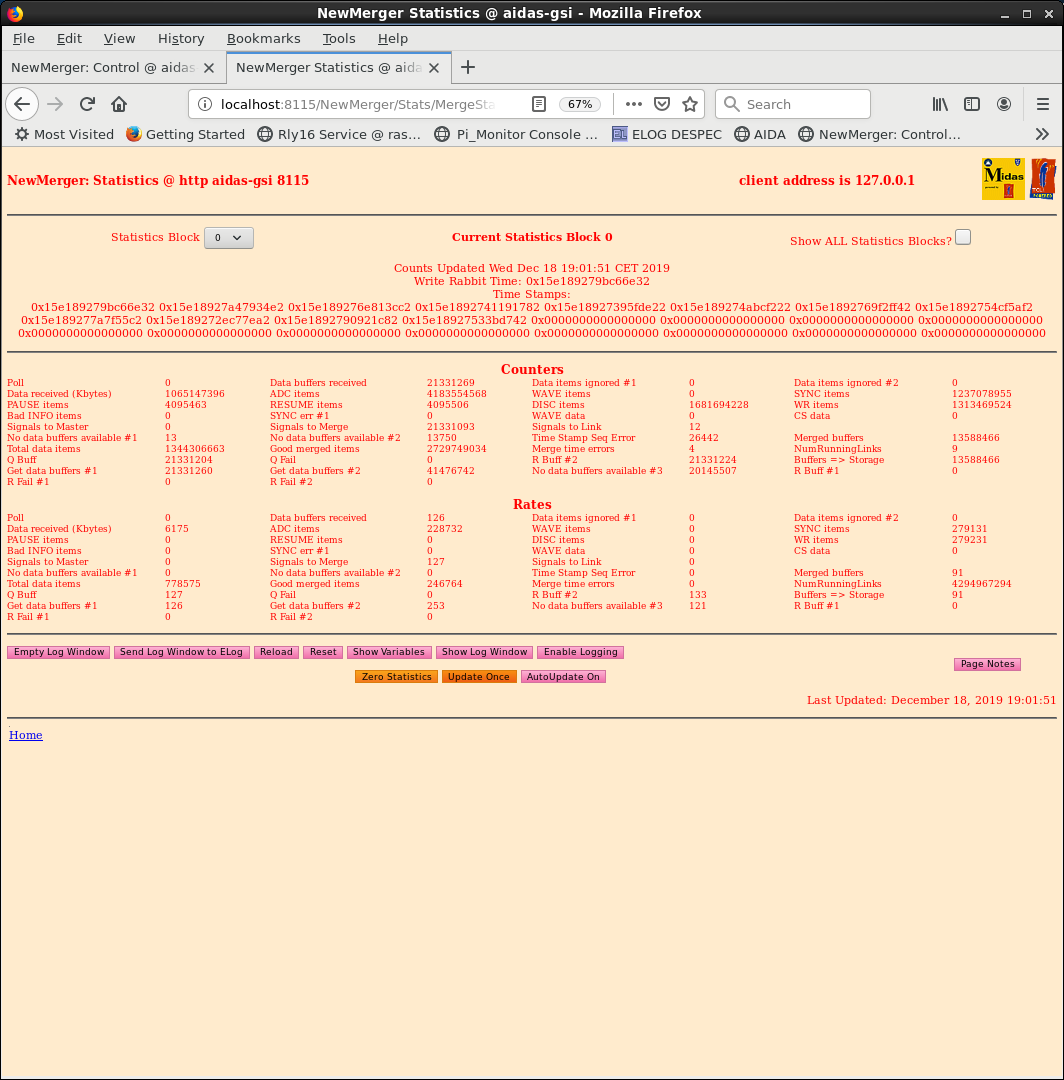
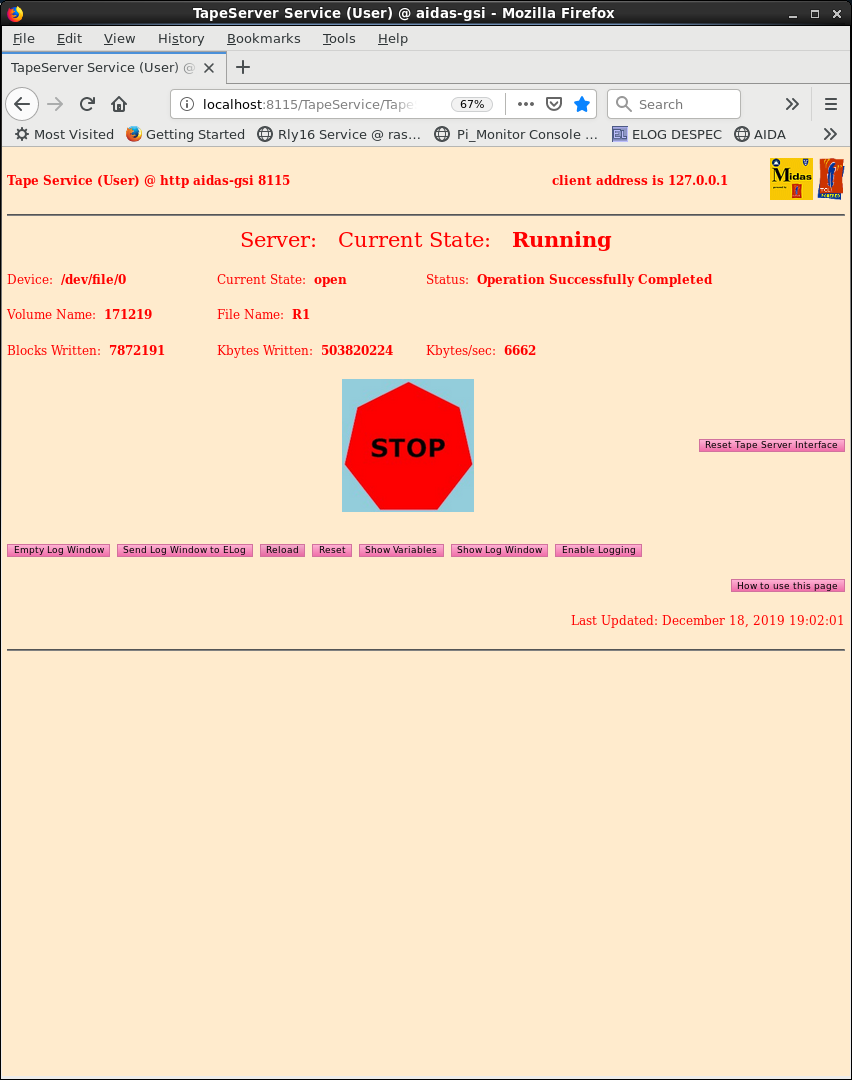
19.03 NewMerger, TapeServer and full screen - attachments 18-20

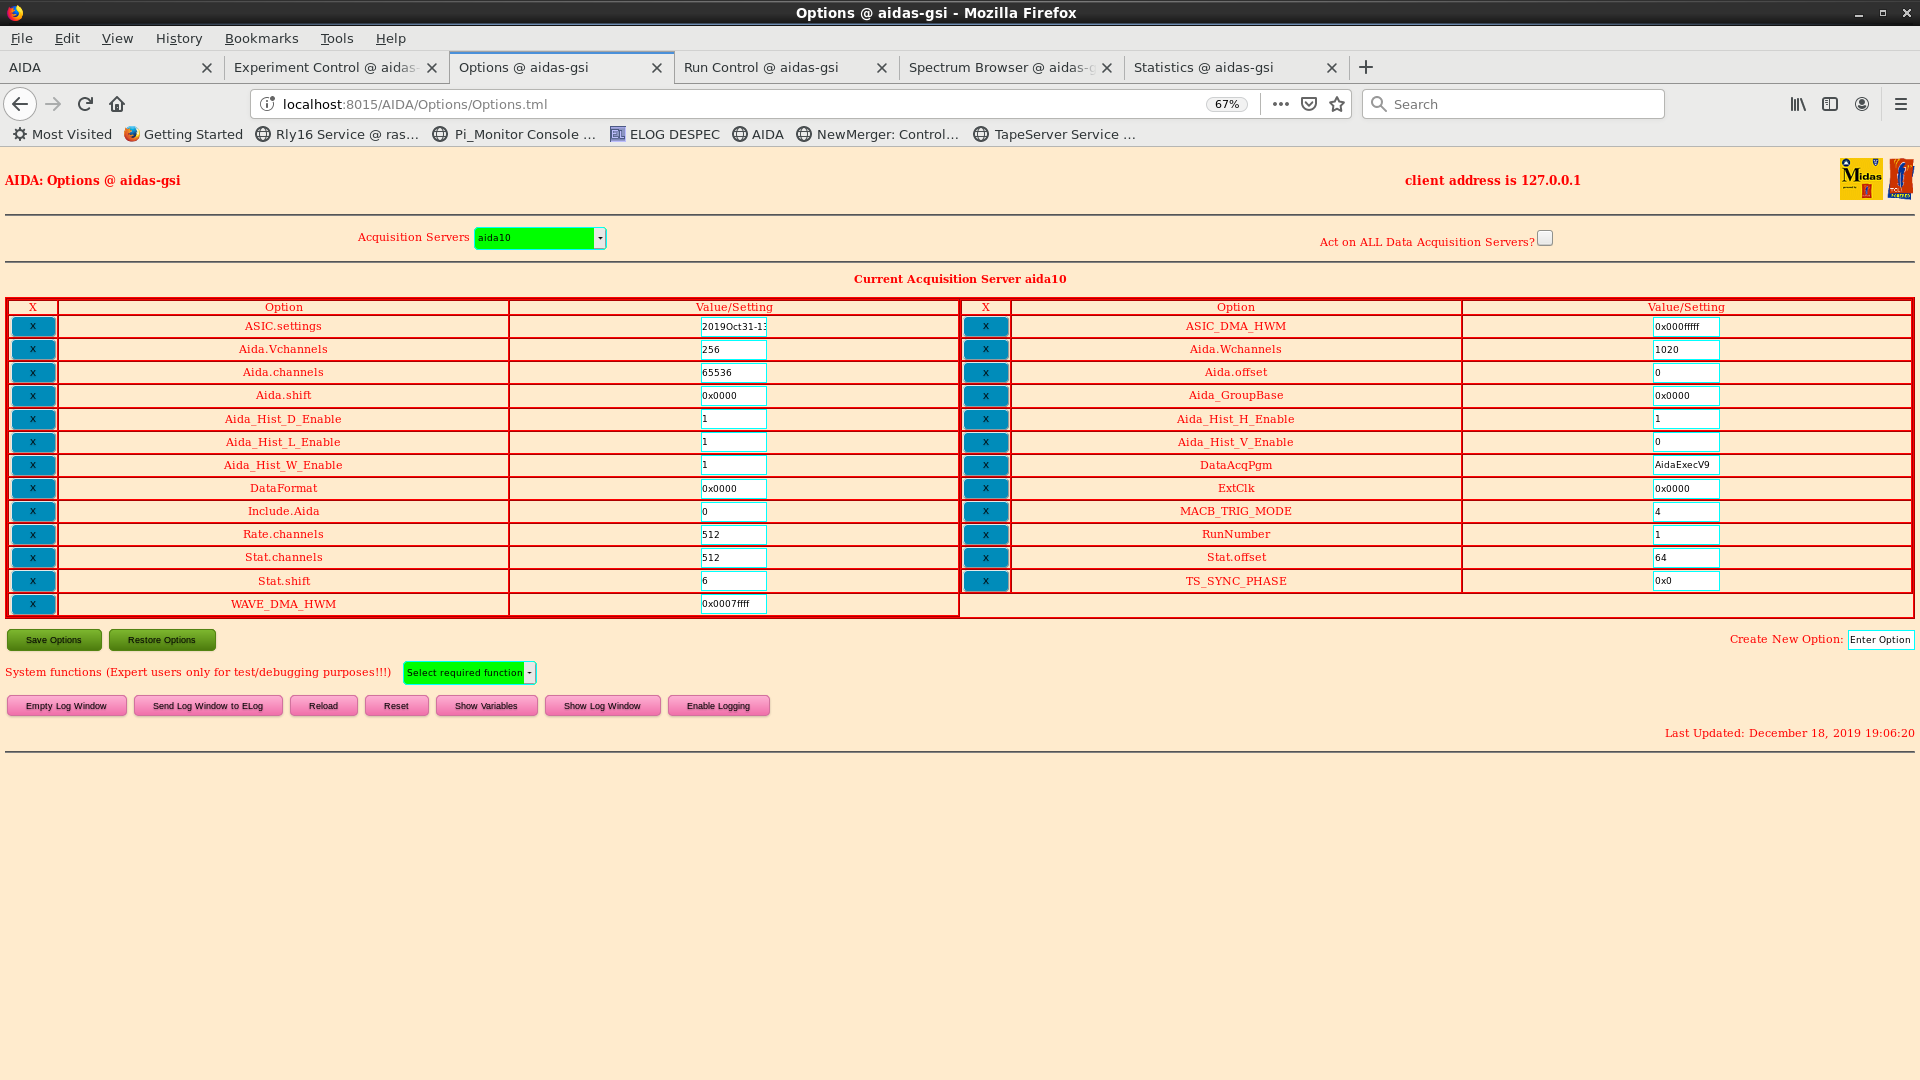
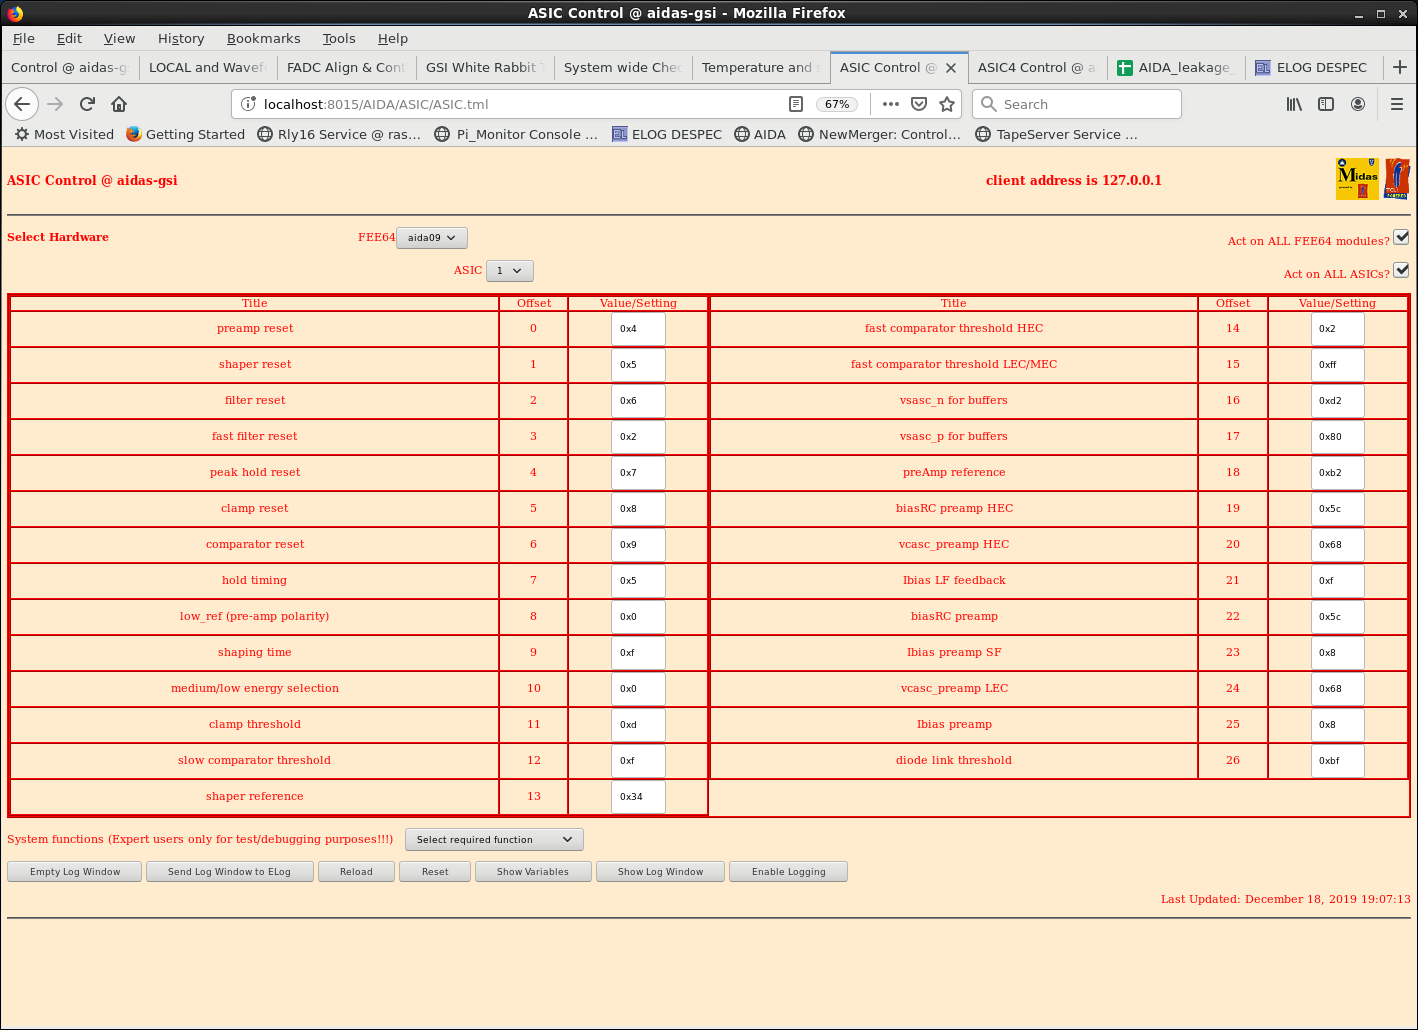
19.07 Options, ASIC settings aida09 & aida10 - attachments 21-23

20.15 collect all WR status erro counters for baseline
      WR decoder status - no errors

21.56 FRS DAQ crashed and not currently recoverable
      Stop current run and run background alphas overnight

21.57 run stopped file 171219/R1_304

      slow comparator threshold 0xf -> 0x64
      check ASIC control *all* FEE64s *all* ASICs

      BNC PB-5 attenuation x1 -> x1000

      *all* histograms zero'd

22.02 DAQ start file 171219/R2

      background alphas
|
| Attachment 1: 1.png
|

|
| Attachment 2: 2.png
|
|
| Attachment 3: 3.png
|
|
| Attachment 4: 4.png
|

|
| Attachment 5: 5.png
|
|
| Attachment 6: 6.png
|

|
| Attachment 7: 7.png
|
|
| Attachment 8: 8.png
|
|
| Attachment 9: 9.png
|

|
| Attachment 10: 10.png
|
|
| Attachment 11: 11.png
|
|
| Attachment 12: 21.png
|
|
| Attachment 13: 22.png
|
|
| Attachment 14: 23.png
|
|
| Attachment 15: 24.png
|
|
| Attachment 16: 25.png
|
|
| Attachment 17: 26.png
|
|
| Attachment 18: 30.png
|
|
| Attachment 19: 31.png
|
|
| Attachment 20: 32.png
|

|
| Attachment 21: 40.png
|
|
| Attachment 22: 41.png
|
|
| Attachment 23: 42.png
|

|
|
203
|
Wed Mar 17 10:31:09 2021 |
TD | Wednesday 17 March |
11.28 DAQ continues OK - no storage

      ASIC settings 2019Dec19-16.19.51
      DSSSD#1 slow comparator 0xa
      DSSSD#2 slow comparator 0xa
      DSSSD#3 slow comparator 0xd

      BNC PB-5 Pulser
      Amplitude1.0V
      Attenuation x1
      Frequency 2Hz
      tau_d 1ms
      - polarity
      Delay 250ns, tail pulse

10.26 System wide checks

FEE64 module aida09 global clocks failed, 6
 Clock status test result: Passed 11, Failed 1

Understand status as follows
Status bit 3 : firmware PLL that creates clocks from external clock not locked
Status bit 2 : always logic '1'
Status bit 1 : LMK3200(2) PLL and clock distribution chip not locked to external clock
Status bit 0 : LMK3200(1) PLL and clock distribution chip not locked to external clock
If all these bits are not set then the operation of the firmware is unreliable


FEE64 module aida07 failed
FEE64 module aida09 failed
Calibration test result: Passed 10, Failed 2

If any modules fail calibration , check the clock status and open the FADC Align and Control browser page to rerun calibration for that module


		 Base 		Current 	Difference
aida05 fault 	 0x6acb : 	 0x6acc : 	 1
aida06 fault 	 0x8394 : 	 0x8395 : 	 1
aida07 fault 	 0x8c77 : 	 0x8c7a : 	 3
aida08 fault 	 0x1692 : 	 0x1693 : 	 1
White Rabbit error counter test result: Passed 8, Failed 4

Understand the status reports as follows:-
Status bit 3 : White Rabbit decoder detected an error in the received data
Status bit 2 : Firmware registered WR error, no reload of Timestamp
Status bit 0 : White Rabbit decoder reports uncertain of Timestamp information from WR


FPGA Timestamp error counter test result: Passed 12, Failed 0
If any of these counts are reported as in error
The ASIC readout system has detected a timeslip.
That is the timestamp read from the time FIFO is not younger than the last


Returned 0 0 0 0 0 0 0 0 0 0 0 0
Mem(KB) :	4	8	16	32	64	128	256	512	1k	2k	4k
aida01 :     25     16      3      6      1      3      2      2      3      4     10   : 54676
aida02 :     17     13     14     10      5      5      2      3      3      3      6   : 37516
aida03 :     19     10      8      3      2      3      2      4      2      3      6   : 36220
aida04 :      2      6      2      3      3      2      2      3      2      4     15   : 74360
aida05 :     89     48     20      3      3     34     21     20      6      4      7   : 64324
aida06 :     31     11      1     10      0      1      1      3      4      2      5   : 31140
aida07 :     21     13      8      4      3      2      4      4      3      3      6   : 37756
aida08 :     37     10      2      0      1      2      2      4      3      3      6   : 36932
aida09 :      4     18      6      3      1      3      1      2      3      3      6   : 35872
aida10 :     20      4      1      3      0      2      2      3      3      3      6   : 36320
aida11 :      2      6      6      2      2      4      2      3      2      3      6   : 35672
aida12 :     15     10      2      3      1      2      2      3      3      3      6   : 36428


      FEE64 Temperatures OK - attachment 1
      Good event, disc info #6 & good wave statistics - attachments 2, 3 & 4
           note high disc rates (c. 200k) in FEE64s aida03, aida05 & aida07
      Detector bias & leakage currents OK - attachment 5
      Merger OK - 4.5M data items/s
      TapeServer OK - 15Mb/s

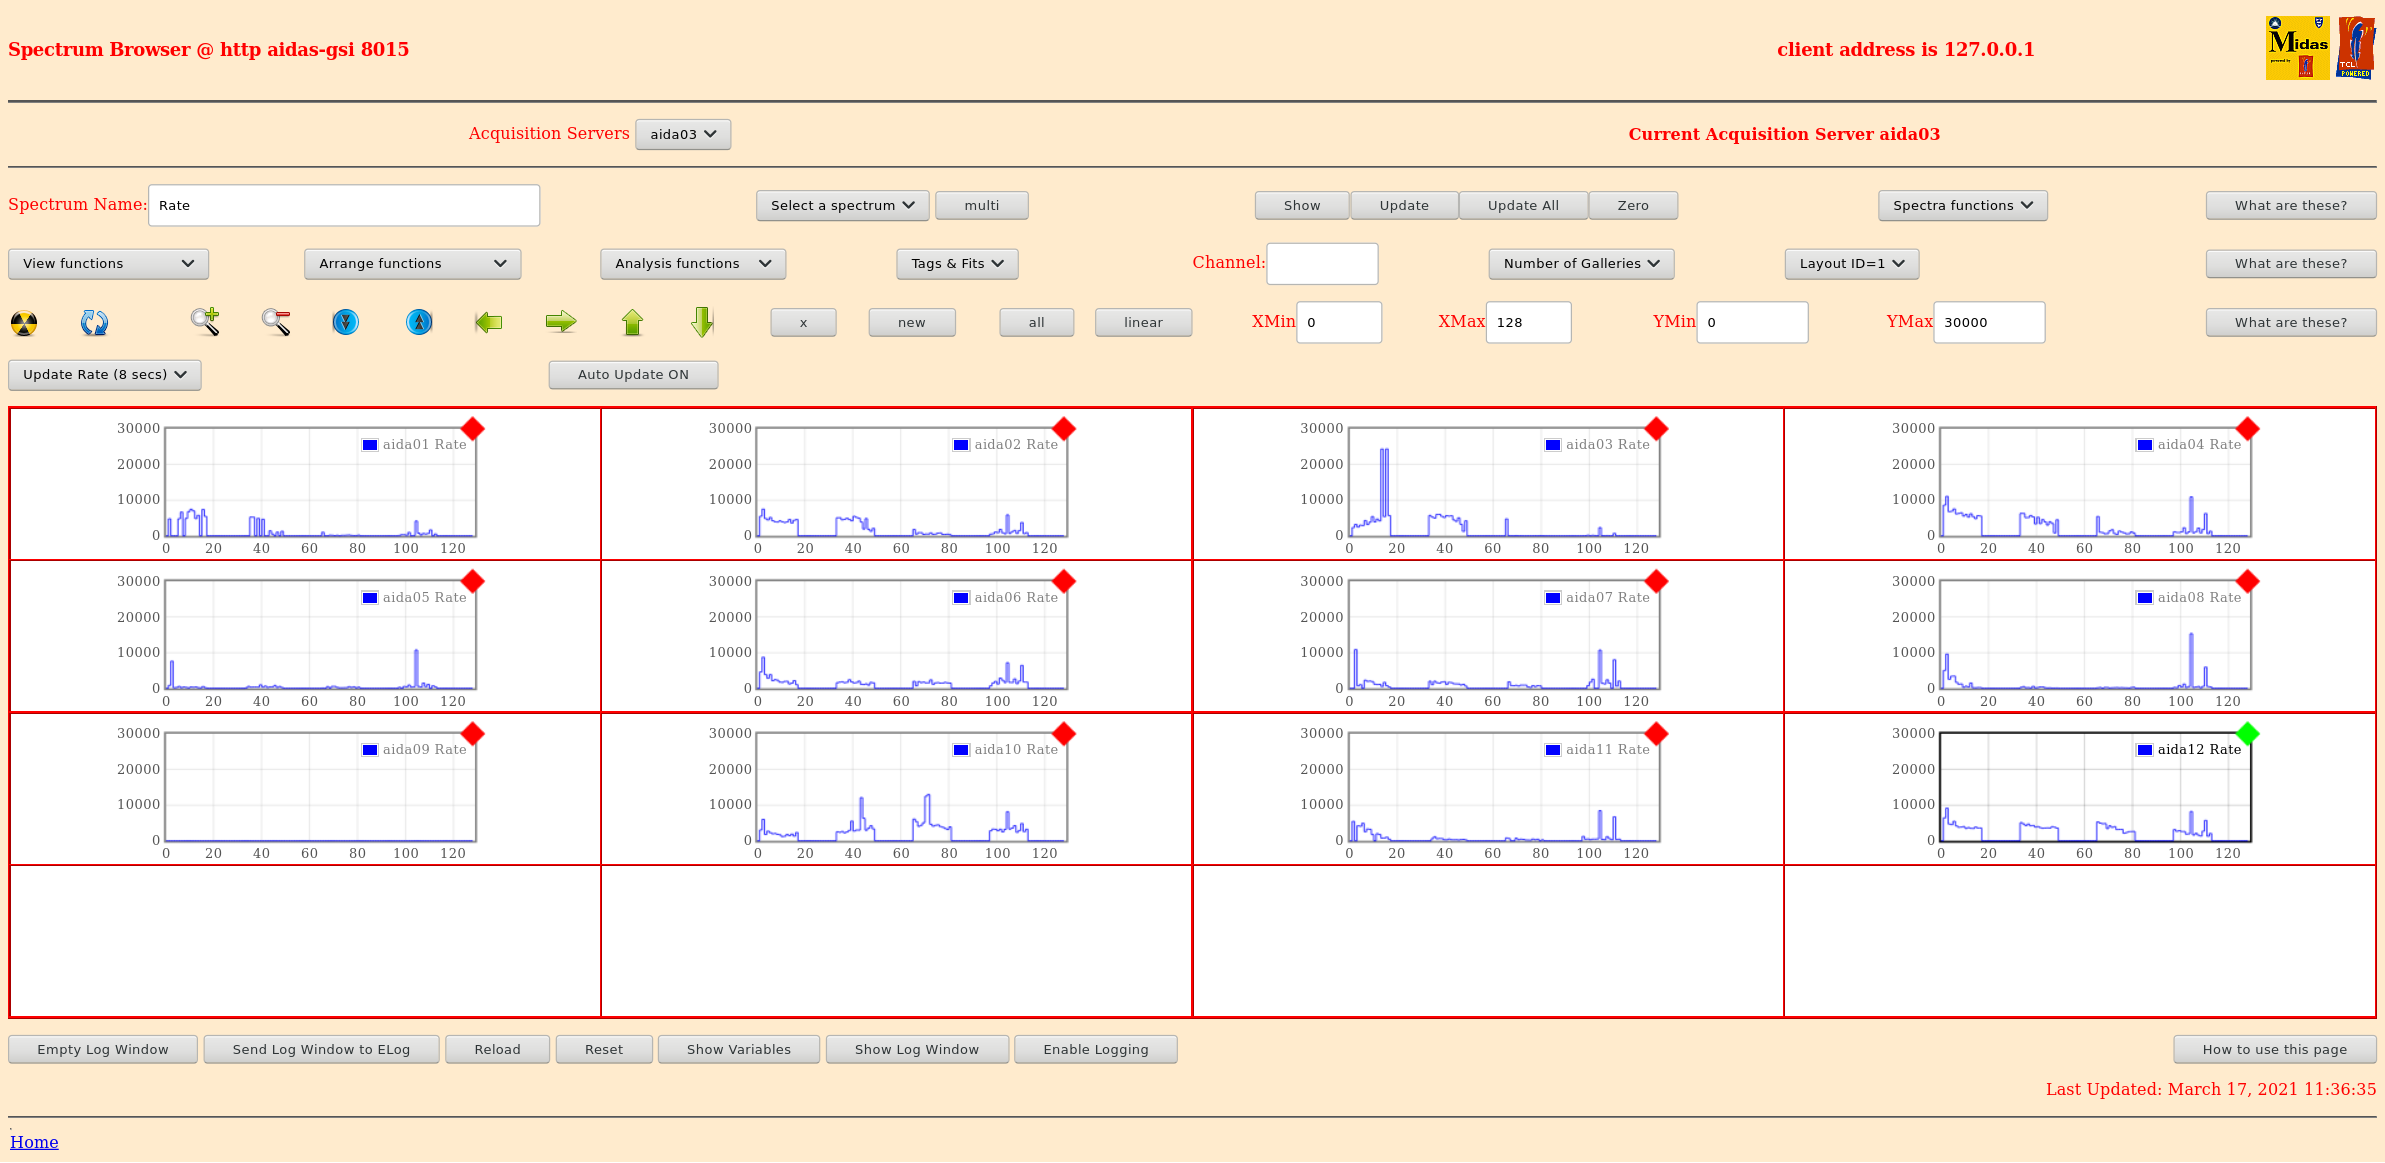
      Rate spectra - attachment 6

11.41 Merger errors since yesterday's Elog


MERGE Data Link (20502): bad timestamp  2 3 0xc08e4cce 0x0c1c8460 0x0000f14c5c1c8460 0x166cf14c5c1c8460 0x166cf1515c1c74c0
MERGE Data Link (20502): bad timestamp  2 3 0xc0967f4f 0x0c1c8460 0x0000f14c5c1c8460 0x166cf14c5c1c8460 0x166cf1515c1c74c0
MERGE Data Link (20502): bad timestamp  2 3 0xc0807dc7 0x0c1c9bd0 0x0000f14c5c1c9bd0 0x166cf14c5c1c9bd0 0x166cf1515c1c74c0
MERGE Data Link (20502): bad timestamp  2 3 0xc0957ee9 0x0c1c9bd0 0x0000f14c5c1c9bd0 0x166cf14c5c1c9bd0 0x166cf1515c1c74c0
MERGE Data Link (20502): bad timestamp  2 3 0xc0857eea 0x0c1ca3a0 0x0000f14c5c1ca3a0 0x166cf14c5c1ca3a0 0x166cf1515c1c74c0
MERGE Data Link (20502): bad timestamp  2 3 0xc0977df3 0x0c1ca3a0 0x0000f14c5c1ca3a0 0x166cf14c5c1ca3a0 0x166cf1515c1c74c0
MERGE Data Link (20502): bad timestamp  2 3 0xc08a7edd 0x0c1cab70 0x0000f14c5c1cab70 0x166cf14c5c1cab70 0x166cf1515c1c74c0
MERGE Data Link (20502): bad timestamp  2 3 0xc09c7c7f 0x0c1cab70 0x0000f14c5c1cab70 0x166cf14c5c1cab70 0x166cf1515c1c74c0
MERGE Data Link (20502): bad timestamp  2 3 0xc09d7fd8 0x0c1cb340 0x0000f14c5c1cb340 0x166cf14c5c1cb340 0x166cf1515c1c74c0

 :
 :

MERGE Data Link (20502): bad timestamp  2 3 0x8263ffff 0x0433c338 0x000018ff4433c338 0x166d18ff4433c338 0x166d18ff4e17c2c0
MERGE Data Link (20502): bad timestamp  2 3 0x8263ffff 0x0433c356 0x000018ff4433c356 0x166d18ff4433c356 0x166d18ff4e17c2c0
MERGE Data Link (20502): bad timestamp  2 3 0x8263f080 0x0433c36a 0x000018ff4433c36a 0x166d18ff4433c36a 0x166d18ff4e17c2c0
MERGE Data Link (20502): bad timestamp  2 3 0x82630f7f 0x0433c374 0x000018ff4433c374 0x166d18ff4433c374 0x166d18ff4e17c2c0
MERGE Data Link (20502): bad timestamp  2 3 0x8263ffff 0x0433c388 0x000018ff4433c388 0x166d18ff4433c388 0x166d18ff4e17c2c0
MERGE Data Link (20502): bad timestamp  2 3 0x8263ffff 0x0433c3a6 0x000018ff4433c3a6 0x166d18ff4433c3a6 0x166d18ff4e17c2c0
MERGE Data Link (20502): bad timestamp  2 3 0x8263efff 0x0433c3c4 0x000018ff4433c3c4 0x166d18ff4433c3c4 0x166d18ff4e17c2c0
MERGE Data Link (20502): bad timestamp  2 3 0x8263ffff 0x0433c3d8 0x000018ff4433c3d8 0x166d18ff4433c3d8 0x166d18ff4e17c2c0
MERGE Data Link (20502): bad timestamp  2 3 0x8263ffff 0x0433c3f6 0x000018ff4433c3f6 0x166d18ff4433c3f6 0x166d18ff4e17c2c0
MERGE Data Link (20502): bad timestamp  2 3 0x8263efff 0x0433c414 0x000018ff4433c414 0x166d18ff4433c414 0x166d18ff4e17c2c0
MERGE Data Link (20502): bad timestamp  2 3 0x82218ff4 0x0433c41e 0x000018ff4433c41e 0x166d18ff4433c41e 0x166d18ff4e17c2c0

From Tuesday, March 16, 2021 9:54:36.584 PM to Wednesday, March 17, 2021 10:02:05.935 AM

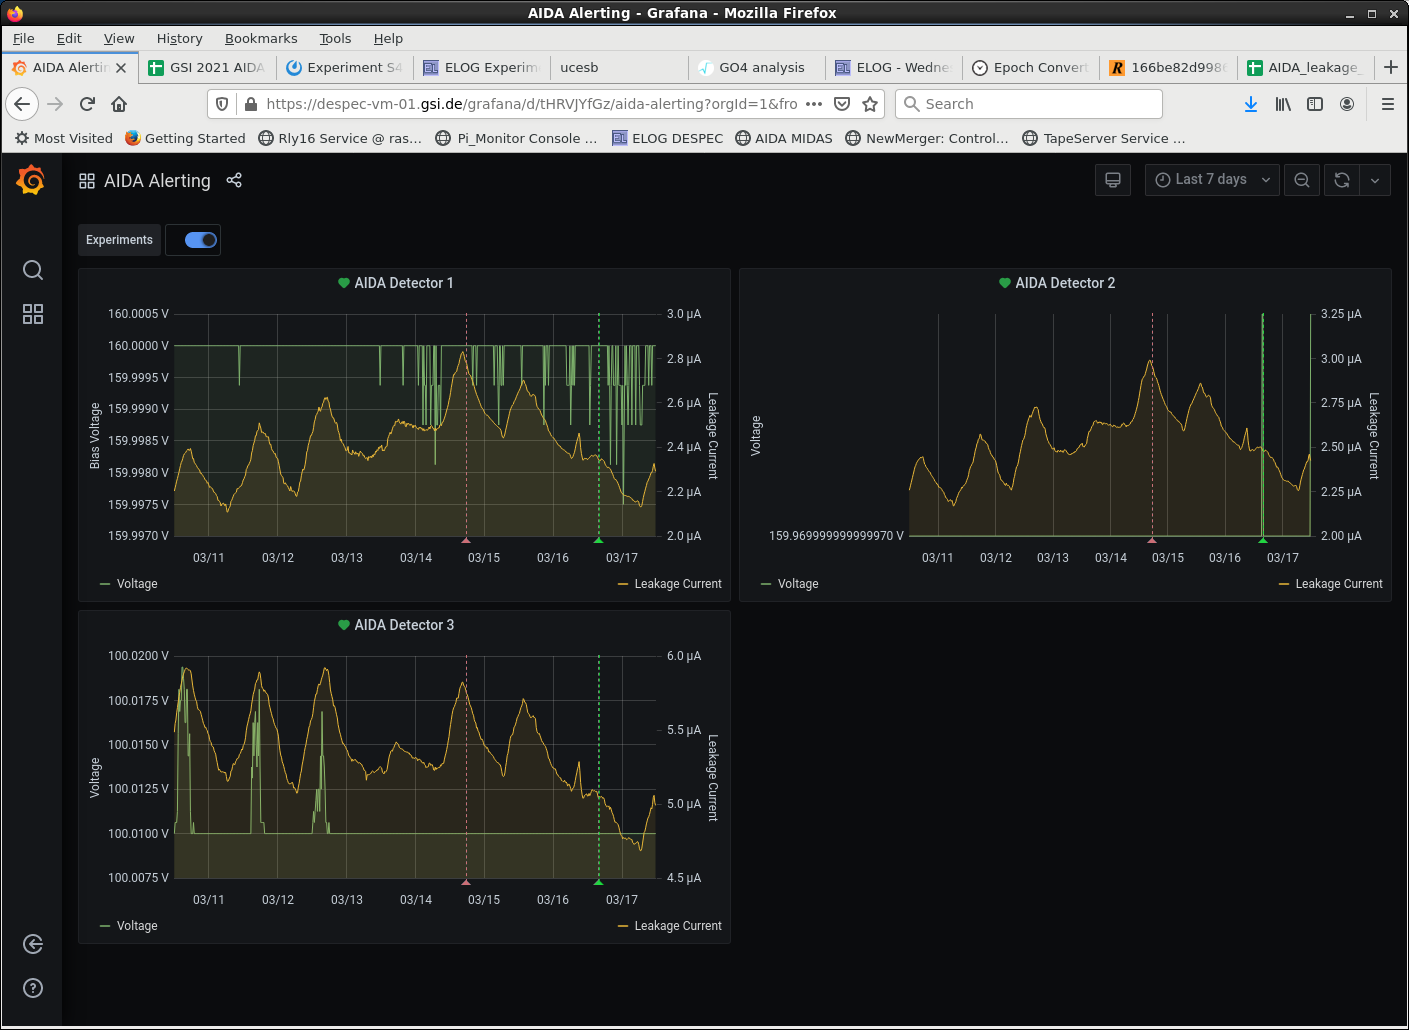
11.46 Grafana record of bias & leakage current for the 7 days to date - attachment 7

11.51 ASIC check load - all FEE64s, all ASICs

11.51 Disable 'no storage' mode and start writing to disk file S452/R58

12.01 R58_18 & R58_19 *no* change

12.16  R58_24 & R58_25 *all* waveforms disabled (Run Control tab)

12.23 R58_27 & R58_28 *all* discriminators disabled (Discriminator tab) *but* disc rates now low - see attachment 8 cf. attachment 3

12.27 Enable 'no storage' mode

12.38 Analysis of files R58_19, R58_25 & R58_28 - see attachments 9, 10 & 11
      Disabling waveforms significantly reduces pause/resume for aida01 - aida08
Effect of disabling discriminators less clear - disc rate zero for all FEE64s except aida03 (2k). |
| Attachment 1: Screenshot_2021-03-17_Temperature_and_status_scan_aidas-gsi.png
|

|
| Attachment 2: Screenshot_2021-03-17_Statistics_aidas-gsi.png
|

|
| Attachment 3: Screenshot_2021-03-17_Statistics_aidas-gsi(1).png
|
.png.png)
|
| Attachment 4: Screenshot_2021-03-17_Statistics_aidas-gsi(2).png
|
.png.png)
|
| Attachment 5: 84.png
|

|
| Attachment 6: Screenshot_2021-03-17_Spectrum_Browser_aidas-gsi.png
|
|
| Attachment 7: 85.png
|
|
| Attachment 8: Screenshot_2021-03-17_Statistics_aidas-gsi(3).png
|
.png.png)
|
| Attachment 9: R58_19
|
*** TDR format 3.3.0 analyser - TD - January 2019
*** ERROR: READ I/O error: 5002
blocks: 32000
ADC data format: 260603204 ( 1825295.6 Hz)
Other data format: 1316796 ( 9223.0 Hz)
Sample trace data format: 0 ( 0.0 Hz)
Undefined format: 0 ( 0.0 Hz)
Other data format type: PAUSE: 1800 ( 12.6 Hz)
RESUME: 1800 ( 12.6 Hz)
SYNC100: 532 ( 3.7 Hz)
WR48-63: 532 ( 3.7 Hz)
FEE64 disc: 351517 ( 2462.1 Hz)
MBS info: 960615 ( 6728.3 Hz)
Other info: 0 ( 0.0 Hz)
ADC data range bit set: 2 ( 0.0 Hz)
Timewarps: ADC: 0 ( 0.0 Hz)
PAUSE: 0 ( 0.0 Hz)
RESUME: 0 ( 0.0 Hz)
SYNC100: 0 ( 0.0 Hz)
WR48-63: 0 ( 0.0 Hz)
FEE64 disc: 0 ( 0.0 Hz)
MBS info: 0 ( 0.0 Hz)
Undefined: 0 ( 0.0 Hz)
Sample trace: 0 ( 0.0 Hz)
*** Timestamp elapsed time: 142.773 s
FEE elapsed dead time(s) elapsed idle time(s)
1 0.872 137.171
2 2.370 140.392
3 4.557 140.929
4 12.507 102.274
5 9.566 138.244
6 0.000 130.460
7 0.043 132.607
8 21.086 137.171
9 14.355 142.539
10 0.094 126.165
11 38.783 127.507
12 0.000 0.000
13 0.000 0.000
14 0.000 0.000
15 0.000 0.000
16 0.000 0.000
17 0.000 0.000
18 0.000 0.000
19 0.000 0.000
20 0.000 0.000
21 0.000 0.000
22 0.000 0.000
23 0.000 0.000
24 0.000 0.000
25 0.000 0.000
26 0.000 0.000
27 0.000 0.000
28 0.000 0.000
29 0.000 0.000
30 0.000 0.000
31 0.000 0.000
32 0.000 0.000
*** Statistics
FEE ADC Data Other Data Sample Undefined Pause Resume SYNC100 WR48-63 Disc MBS Other HEC Data
0 21184711 1567 0 0 302 302 78 78 0 807 0 0
1 26163497 939 0 0 5 5 40 40 0 849 0 0
2 26414580 834315 0 0 9 9 78 78 351513 482628 0 0
3 30144417 476485 0 0 23 23 54 54 0 476331 0 0
4 6641111 1448 0 0 716 716 8 8 0 0 0 0
5 18794955 716 0 0 334 334 24 24 0 0 0 0
6 13042480 36 0 0 0 0 18 18 0 0 0 0
7 9502247 42 0 0 1 1 20 20 0 0 0 0
8 31490514 302 0 0 109 109 42 42 0 0 0 0
9 33799793 352 0 0 86 86 88 88 4 0 0 2
10 11018662 96 0 0 2 2 46 46 0 0 0 0
11 32406237 498 0 0 213 213 36 36 0 0 0 0
12 0 0 0 0 0 0 0 0 0 0 0 0
13 0 0 0 0 0 0 0 0 0 0 0 0
14 0 0 0 0 0 0 0 0 0 0 0 0
15 0 0 0 0 0 0 0 0 0 0 0 0
16 0 0 0 0 0 0 0 0 0 0 0 0
17 0 0 0 0 0 0 0 0 0 0 0 0
18 0 0 0 0 0 0 0 0 0 0 0 0
19 0 0 0 0 0 0 0 0 0 0 0 0
20 0 0 0 0 0 0 0 0 0 0 0 0
21 0 0 0 0 0 0 0 0 0 0 0 0
22 0 0 0 0 0 0 0 0 0 0 0 0
23 0 0 0 0 0 0 0 0 0 0 0 0
24 0 0 0 0 0 0 0 0 0 0 0 0
25 0 0 0 0 0 0 0 0 0 0 0 0
26 0 0 0 0 0 0 0 0 0 0 0 0
27 0 0 0 0 0 0 0 0 0 0 0 0
28 0 0 0 0 0 0 0 0 0 0 0 0
29 0 0 0 0 0 0 0 0 0 0 0 0
30 0 0 0 0 0 0 0 0 0 0 0 0
31 0 0 0 0 0 0 0 0 0 0 0 0
32 0 0 0 0 0 0 0 0 0 0 0 0
*** Timewarps
FEE ADC Pause Resume SYNC100 WR48-63 Disc MBS Undefined Samples
0 0 0 0 0 0 0 0 0 0
1 0 0 0 0 0 0 0 0 0
2 0 0 0 0 0 0 0 0 0
3 0 0 0 0 0 0 0 0 0
4 0 0 0 0 0 0 0 0 0
5 0 0 0 0 0 0 0 0 0
6 0 0 0 0 0 0 0 0 0
7 0 0 0 0 0 0 0 0 0
8 0 0 0 0 0 0 0 0 0
9 0 0 0 0 0 0 0 0 0
10 0 0 0 0 0 0 0 0 0
11 0 0 0 0 0 0 0 0 0
12 0 0 0 0 0 0 0 0 0
13 0 0 0 0 0 0 0 0 0
14 0 0 0 0 0 0 0 0 0
15 0 0 0 0 0 0 0 0 0
16 0 0 0 0 0 0 0 0 0
17 0 0 0 0 0 0 0 0 0
18 0 0 0 0 0 0 0 0 0
19 0 0 0 0 0 0 0 0 0
20 0 0 0 0 0 0 0 0 0
21 0 0 0 0 0 0 0 0 0
22 0 0 0 0 0 0 0 0 0
23 0 0 0 0 0 0 0 0 0
24 0 0 0 0 0 0 0 0 0
25 0 0 0 0 0 0 0 0 0
26 0 0 0 0 0 0 0 0 0
27 0 0 0 0 0 0 0 0 0
28 0 0 0 0 0 0 0 0 0
29 0 0 0 0 0 0 0 0 0
30 0 0 0 0 0 0 0 0 0
31 0 0 0 0 0 0 0 0 0
32 0 0 0 0 0 0 0 0 0
*** Program elapsed time:45075.926s ( 0.710 blocks/s, 0.044 Mb/s)
|
| Attachment 10: R58_25
|
*** TDR format 3.3.0 analyser - TD - January 2019
*** ERROR: READ I/O error: 5002
blocks: 32000
ADC data format: 261566975 ( 1848651.9 Hz)
Other data format: 353025 ( 2495.0 Hz)
Sample trace data format: 0 ( 0.0 Hz)
Undefined format: 0 ( 0.0 Hz)
Other data format type: PAUSE: 498 ( 3.5 Hz)
RESUME: 497 ( 3.5 Hz)
SYNC100: 528 ( 3.7 Hz)
WR48-63: 528 ( 3.7 Hz)
FEE64 disc: 350128 ( 2474.6 Hz)
MBS info: 846 ( 6.0 Hz)
Other info: 0 ( 0.0 Hz)
ADC data range bit set: 0 ( 0.0 Hz)
Timewarps: ADC: 0 ( 0.0 Hz)
PAUSE: 0 ( 0.0 Hz)
RESUME: 0 ( 0.0 Hz)
SYNC100: 0 ( 0.0 Hz)
WR48-63: 0 ( 0.0 Hz)
FEE64 disc: 0 ( 0.0 Hz)
MBS info: 0 ( 0.0 Hz)
Undefined: 0 ( 0.0 Hz)
Sample trace: 0 ( 0.0 Hz)
*** Timestamp elapsed time: 141.491 s
FEE elapsed dead time(s) elapsed idle time(s)
1 2.252 140.123
2 1.261 137.707
3 1.206 132.607
4 0.000 122.675
5 0.045 124.017
6 0.225 128.312
7 0.137 137.171
8 25.852 127.238
9 22.485 137.976
10 0.119 139.318
11 34.852 135.828
12 0.000 0.000
13 0.000 0.000
14 0.000 0.000
15 0.000 0.000
16 0.000 0.000
17 0.000 0.000
18 0.000 0.000
19 0.000 0.000
20 0.000 0.000
21 0.000 0.000
22 0.000 0.000
23 0.000 0.000
24 0.000 0.000
25 0.000 0.000
26 0.000 0.000
27 0.000 0.000
28 0.000 0.000
29 0.000 0.000
30 0.000 0.000
31 0.000 0.000
32 0.000 0.000
*** Statistics
FEE ADC Data Other Data Sample Undefined Pause Resume SYNC100 WR48-63 Disc MBS Other HEC Data
0 22601243 1010 0 0 5 5 77 77 0 846 0 0
1 25817640 118 0 0 10 10 49 49 0 0 0 0
2 26662668 350294 0 0 10 10 73 73 350128 0 0 0
3 31065481 116 0 0 9 9 49 49 0 0 0 0
4 7606752 38 0 0 0 0 19 19 0 0 0 0
5 20370392 52 0 0 3 3 23 23 0 0 0 0
6 13822142 52 0 0 5 5 21 21 0 0 0 0
7 9358078 60 0 0 5 5 25 25 0 0 0 0
8 31862906 361 0 0 132 131 49 49 0 0 0 0
9 30480452 364 0 0 115 115 67 67 0 0 0 0
10 7772769 92 0 0 5 5 41 41 0 0 0 0
11 34146452 468 0 0 199 199 35 35 0 0 0 0
12 0 0 0 0 0 0 0 0 0 0 0 0
13 0 0 0 0 0 0 0 0 0 0 0 0
14 0 0 0 0 0 0 0 0 0 0 0 0
15 0 0 0 0 0 0 0 0 0 0 0 0
16 0 0 0 0 0 0 0 0 0 0 0 0
17 0 0 0 0 0 0 0 0 0 0 0 0
18 0 0 0 0 0 0 0 0 0 0 0 0
19 0 0 0 0 0 0 0 0 0 0 0 0
20 0 0 0 0 0 0 0 0 0 0 0 0
21 0 0 0 0 0 0 0 0 0 0 0 0
22 0 0 0 0 0 0 0 0 0 0 0 0
23 0 0 0 0 0 0 0 0 0 0 0 0
24 0 0 0 0 0 0 0 0 0 0 0 0
25 0 0 0 0 0 0 0 0 0 0 0 0
26 0 0 0 0 0 0 0 0 0 0 0 0
27 0 0 0 0 0 0 0 0 0 0 0 0
28 0 0 0 0 0 0 0 0 0 0 0 0
29 0 0 0 0 0 0 0 0 0 0 0 0
30 0 0 0 0 0 0 0 0 0 0 0 0
31 0 0 0 0 0 0 0 0 0 0 0 0
32 0 0 0 0 0 0 0 0 0 0 0 0
*** Timewarps
FEE ADC Pause Resume SYNC100 WR48-63 Disc MBS Undefined Samples
0 0 0 0 0 0 0 0 0 0
1 0 0 0 0 0 0 0 0 0
2 0 0 0 0 0 0 0 0 0
3 0 0 0 0 0 0 0 0 0
4 0 0 0 0 0 0 0 0 0
5 0 0 0 0 0 0 0 0 0
6 0 0 0 0 0 0 0 0 0
7 0 0 0 0 0 0 0 0 0
8 0 0 0 0 0 0 0 0 0
9 0 0 0 0 0 0 0 0 0
10 0 0 0 0 0 0 0 0 0
11 0 0 0 0 0 0 0 0 0
12 0 0 0 0 0 0 0 0 0
13 0 0 0 0 0 0 0 0 0
14 0 0 0 0 0 0 0 0 0
15 0 0 0 0 0 0 0 0 0
16 0 0 0 0 0 0 0 0 0
17 0 0 0 0 0 0 0 0 0
18 0 0 0 0 0 0 0 0 0
19 0 0 0 0 0 0 0 0 0
20 0 0 0 0 0 0 0 0 0
21 0 0 0 0 0 0 0 0 0
22 0 0 0 0 0 0 0 0 0
23 0 0 0 0 0 0 0 0 0
24 0 0 0 0 0 0 0 0 0
25 0 0 0 0 0 0 0 0 0
26 0 0 0 0 0 0 0 0 0
27 0 0 0 0 0 0 0 0 0
28 0 0 0 0 0 0 0 0 0
29 0 0 0 0 0 0 0 0 0
30 0 0 0 0 0 0 0 0 0
31 0 0 0 0 0 0 0 0 0
32 0 0 0 0 0 0 0 0 0
*** Program elapsed time:45119.996s ( 0.709 blocks/s, 0.044 Mb/s)
|
| Attachment 11: R58_28
|
*** TDR format 3.3.0 analyser - TD - January 2019
*** ERROR: READ I/O error: 5002
blocks: 32000
ADC data format: 261917114 ( 1867522.0 Hz)
Other data format: 2886 ( 20.6 Hz)
Sample trace data format: 0 ( 0.0 Hz)
Undefined format: 0 ( 0.0 Hz)
Other data format type: PAUSE: 500 ( 3.6 Hz)
RESUME: 500 ( 3.6 Hz)
SYNC100: 523 ( 3.7 Hz)
WR48-63: 523 ( 3.7 Hz)
FEE64 disc: 0 ( 0.0 Hz)
MBS info: 840 ( 6.0 Hz)
Other info: 0 ( 0.0 Hz)
ADC data range bit set: 1 ( 0.0 Hz)
Timewarps: ADC: 0 ( 0.0 Hz)
PAUSE: 0 ( 0.0 Hz)
RESUME: 0 ( 0.0 Hz)
SYNC100: 0 ( 0.0 Hz)
WR48-63: 0 ( 0.0 Hz)
FEE64 disc: 0 ( 0.0 Hz)
MBS info: 0 ( 0.0 Hz)
Undefined: 0 ( 0.0 Hz)
Sample trace: 0 ( 0.0 Hz)
*** Timestamp elapsed time: 140.248 s
FEE elapsed dead time(s) elapsed idle time(s)
1 2.196 135.828
2 1.735 133.949
3 1.362 133.412
4 0.000 133.949
5 0.624 134.218
6 0.297 110.595
7 0.085 138.513
8 26.310 131.265
9 16.413 138.781
10 0.037 139.318
11 35.860 131.265
12 0.000 0.000
13 0.000 0.000
14 0.000 0.000
15 0.000 0.000
16 0.000 0.000
17 0.000 0.000
18 0.000 0.000
19 0.000 0.000
20 0.000 0.000
21 0.000 0.000
22 0.000 0.000
23 0.000 0.000
24 0.000 0.000
25 0.000 0.000
26 0.000 0.000
27 0.000 0.000
28 0.000 0.000
29 0.000 0.000
30 0.000 0.000
31 0.000 0.000
32 0.000 0.000
*** Statistics
FEE ADC Data Other Data Sample Undefined Pause Resume SYNC100 WR48-63 Disc MBS Other HEC Data
0 22486922 1022 0 0 7 7 84 84 0 840 0 0
1 25724429 84 0 0 9 9 33 33 0 0 0 0
2 26397664 186 0 0 7 7 86 86 0 0 0 0
3 31045386 104 0 0 11 11 41 41 0 0 0 0
4 7561349 28 0 0 0 0 14 14 0 0 0 0
5 20305012 70 0 0 8 8 27 27 0 0 0 0
6 14228124 40 0 0 6 6 14 14 0 0 0 0
7 9428091 66 0 0 3 3 30 30 0 0 0 0
8 31422421 379 0 0 144 145 45 45 0 0 0 0
9 32040015 335 0 0 92 91 76 76 0 0 0 1
10 7197353 72 0 0 2 2 34 34 0 0 0 0
11 34080348 500 0 0 211 211 39 39 0 0 0 0
12 0 0 0 0 0 0 0 0 0 0 0 0
13 0 0 0 0 0 0 0 0 0 0 0 0
14 0 0 0 0 0 0 0 0 0 0 0 0
15 0 0 0 0 0 0 0 0 0 0 0 0
16 0 0 0 0 0 0 0 0 0 0 0 0
17 0 0 0 0 0 0 0 0 0 0 0 0
18 0 0 0 0 0 0 0 0 0 0 0 0
19 0 0 0 0 0 0 0 0 0 0 0 0
20 0 0 0 0 0 0 0 0 0 0 0 0
21 0 0 0 0 0 0 0 0 0 0 0 0
22 0 0 0 0 0 0 0 0 0 0 0 0
23 0 0 0 0 0 0 0 0 0 0 0 0
24 0 0 0 0 0 0 0 0 0 0 0 0
25 0 0 0 0 0 0 0 0 0 0 0 0
26 0 0 0 0 0 0 0 0 0 0 0 0
27 0 0 0 0 0 0 0 0 0 0 0 0
28 0 0 0 0 0 0 0 0 0 0 0 0
29 0 0 0 0 0 0 0 0 0 0 0 0
30 0 0 0 0 0 0 0 0 0 0 0 0
31 0 0 0 0 0 0 0 0 0 0 0 0
32 0 0 0 0 0 0 0 0 0 0 0 0
*** Timewarps
FEE ADC Pause Resume SYNC100 WR48-63 Disc MBS Undefined Samples
0 0 0 0 0 0 0 0 0 0
1 0 0 0 0 0 0 0 0 0
2 0 0 0 0 0 0 0 0 0
3 0 0 0 0 0 0 0 0 0
4 0 0 0 0 0 0 0 0 0
5 0 0 0 0 0 0 0 0 0
6 0 0 0 0 0 0 0 0 0
7 0 0 0 0 0 0 0 0 0
8 0 0 0 0 0 0 0 0 0
9 0 0 0 0 0 0 0 0 0
10 0 0 0 0 0 0 0 0 0
11 0 0 0 0 0 0 0 0 0
12 0 0 0 0 0 0 0 0 0
13 0 0 0 0 0 0 0 0 0
14 0 0 0 0 0 0 0 0 0
15 0 0 0 0 0 0 0 0 0
16 0 0 0 0 0 0 0 0 0
17 0 0 0 0 0 0 0 0 0
18 0 0 0 0 0 0 0 0 0
19 0 0 0 0 0 0 0 0 0
20 0 0 0 0 0 0 0 0 0
21 0 0 0 0 0 0 0 0 0
22 0 0 0 0 0 0 0 0 0
23 0 0 0 0 0 0 0 0 0
24 0 0 0 0 0 0 0 0 0
25 0 0 0 0 0 0 0 0 0
26 0 0 0 0 0 0 0 0 0
27 0 0 0 0 0 0 0 0 0
28 0 0 0 0 0 0 0 0 0
29 0 0 0 0 0 0 0 0 0
30 0 0 0 0 0 0 0 0 0
31 0 0 0 0 0 0 0 0 0
32 0 0 0 0 0 0 0 0 0
*** Program elapsed time:45164.730s ( 0.709 blocks/s, 0.044 Mb/s)
|
|
576
|
Tue Apr 16 23:37:58 2024 |
TD | Wednesday 17 April |
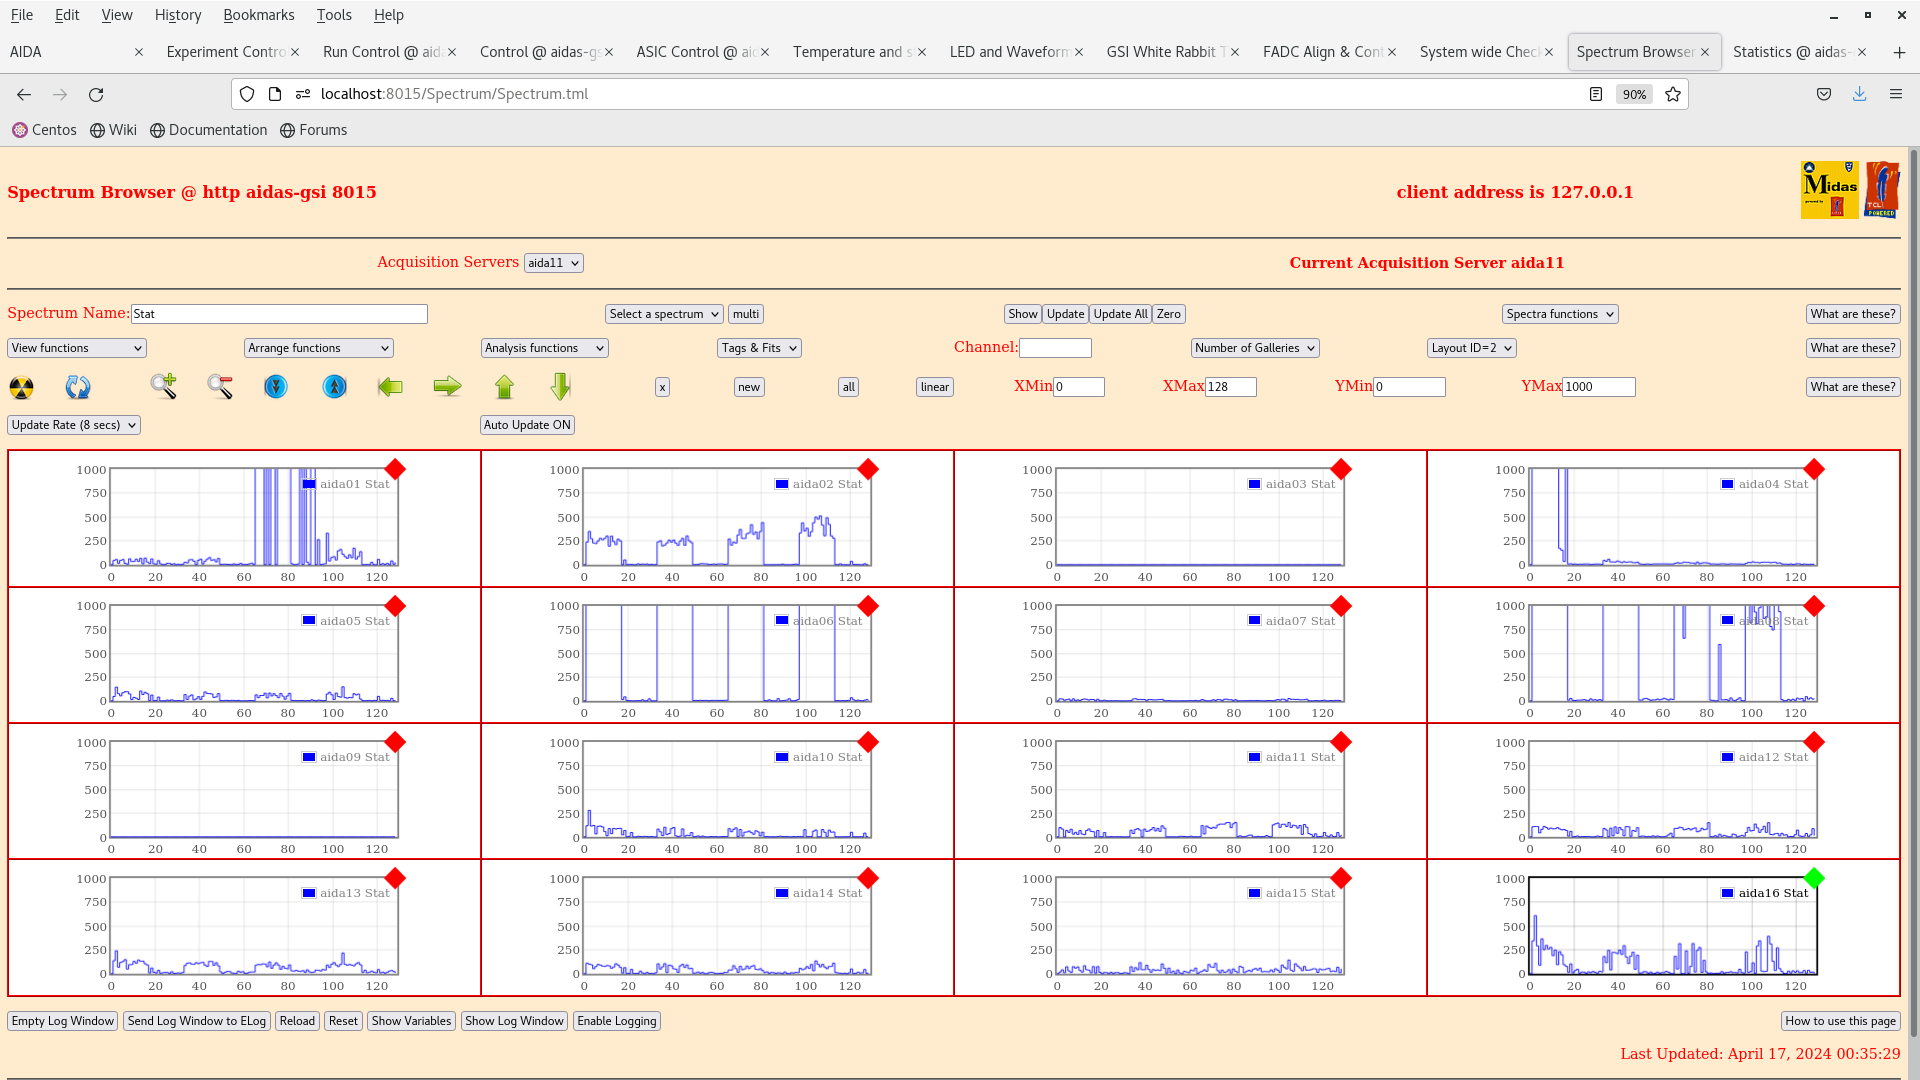
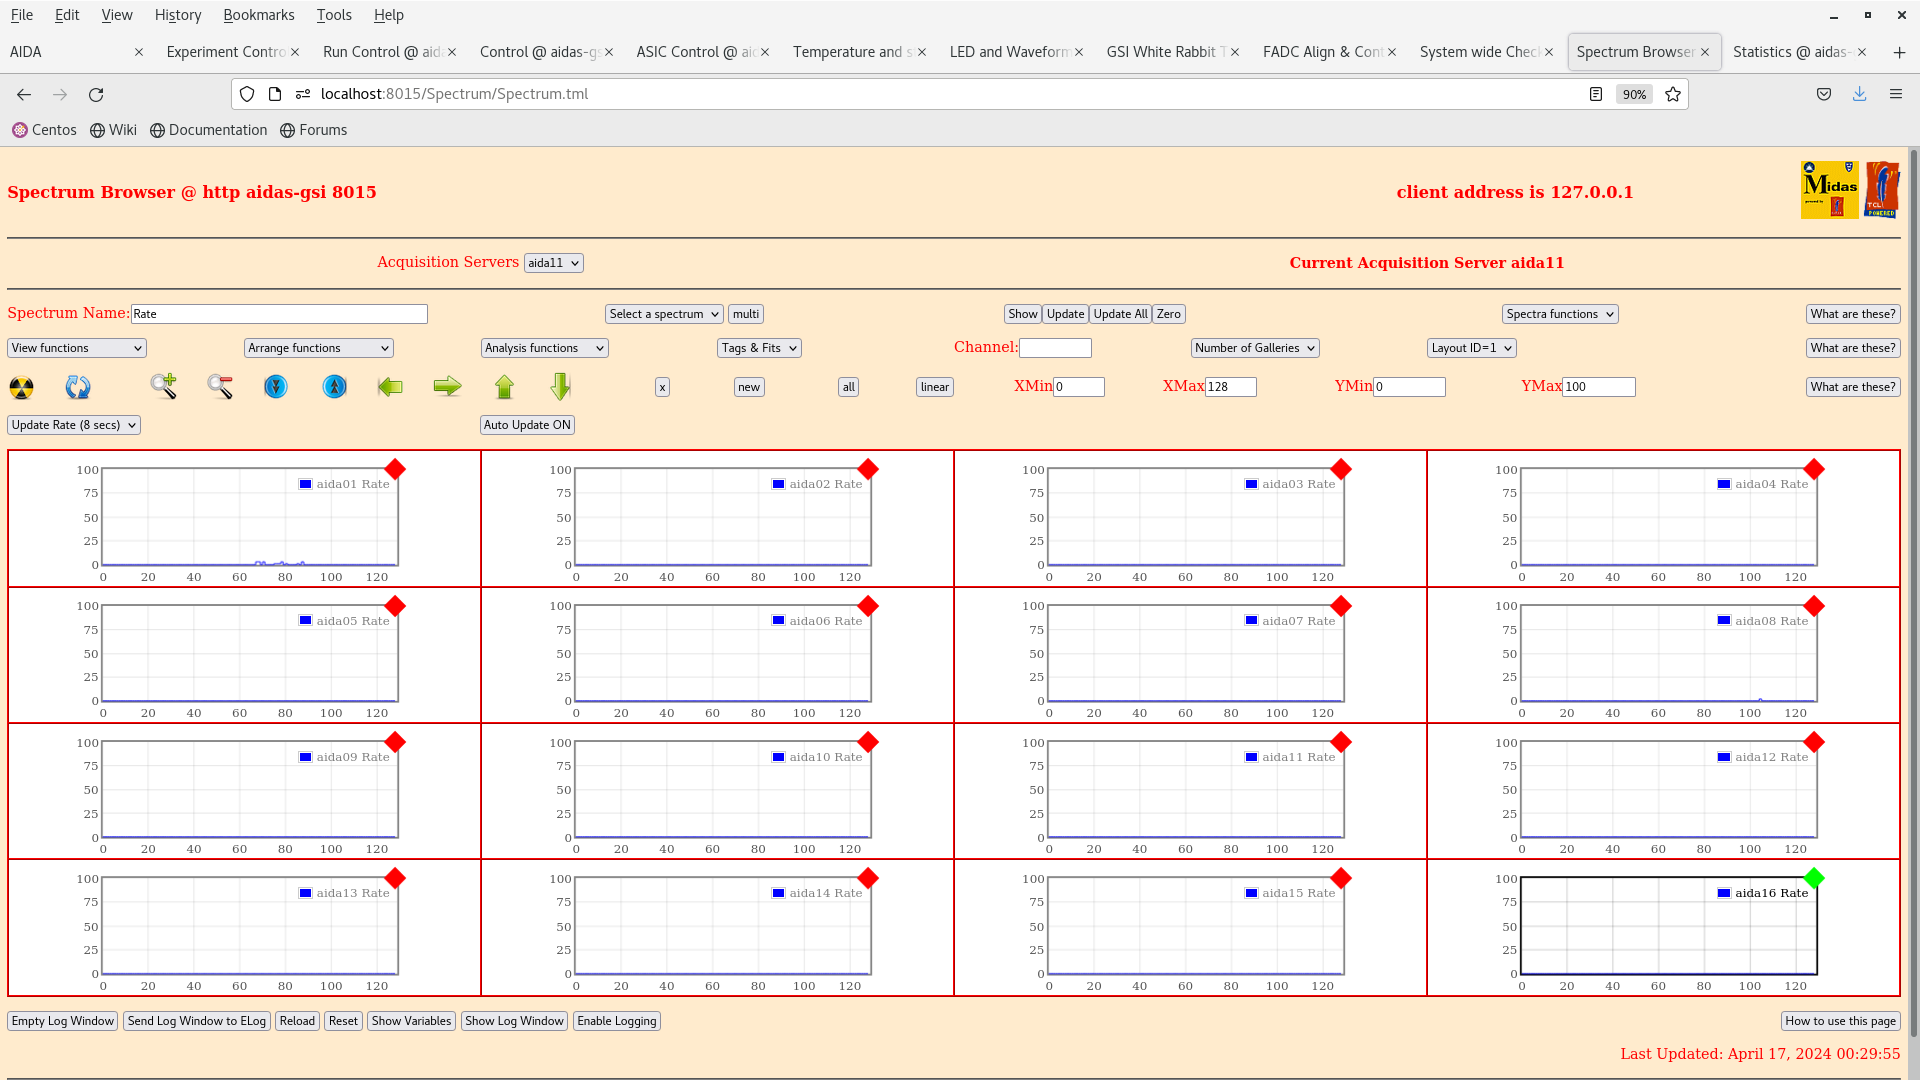
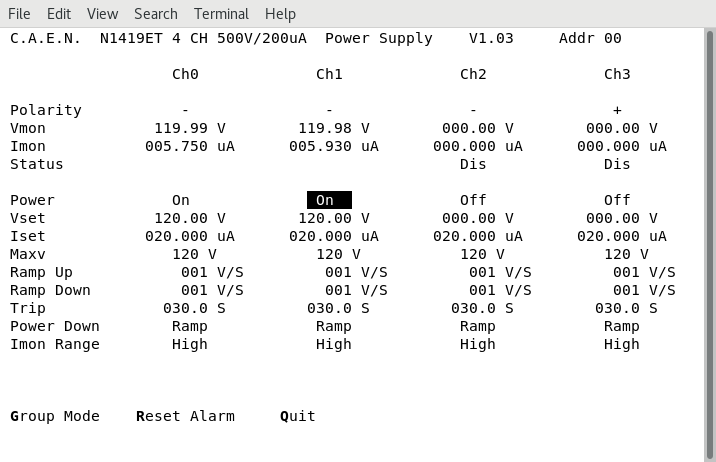
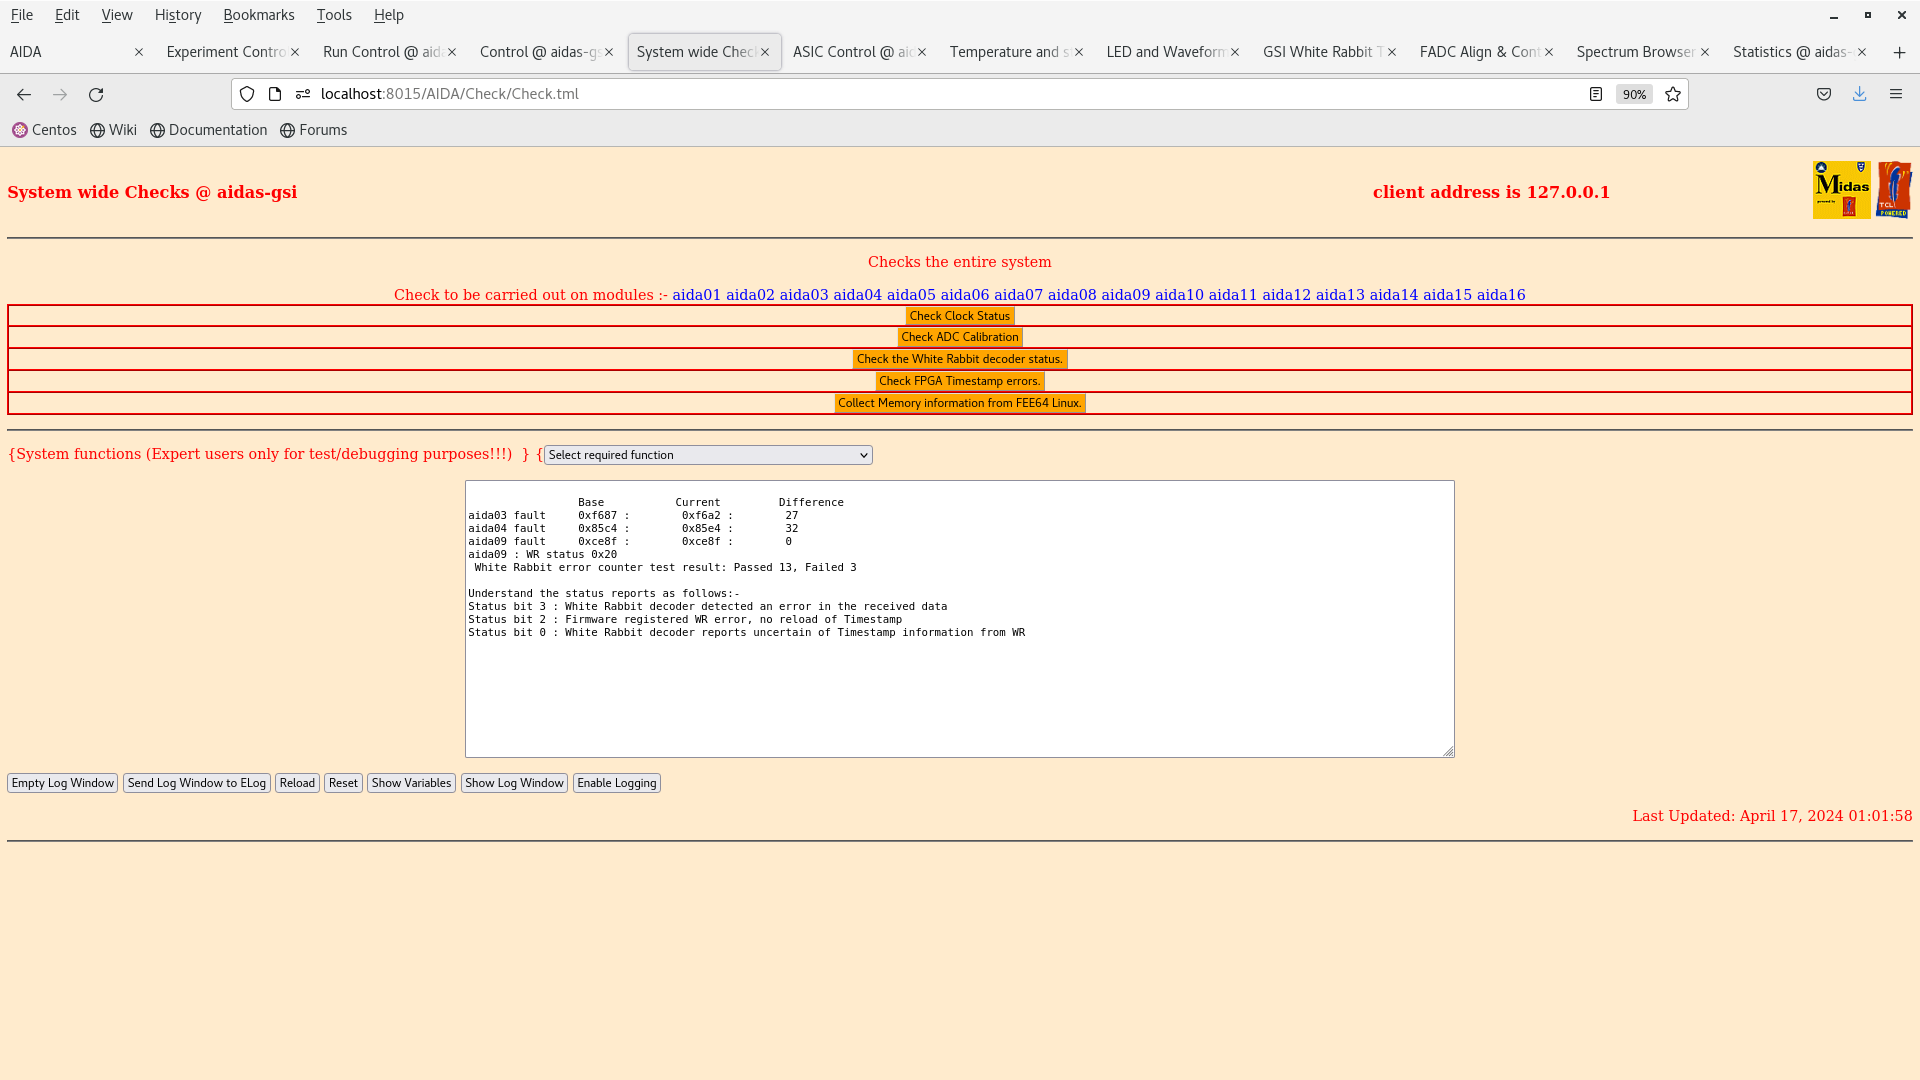
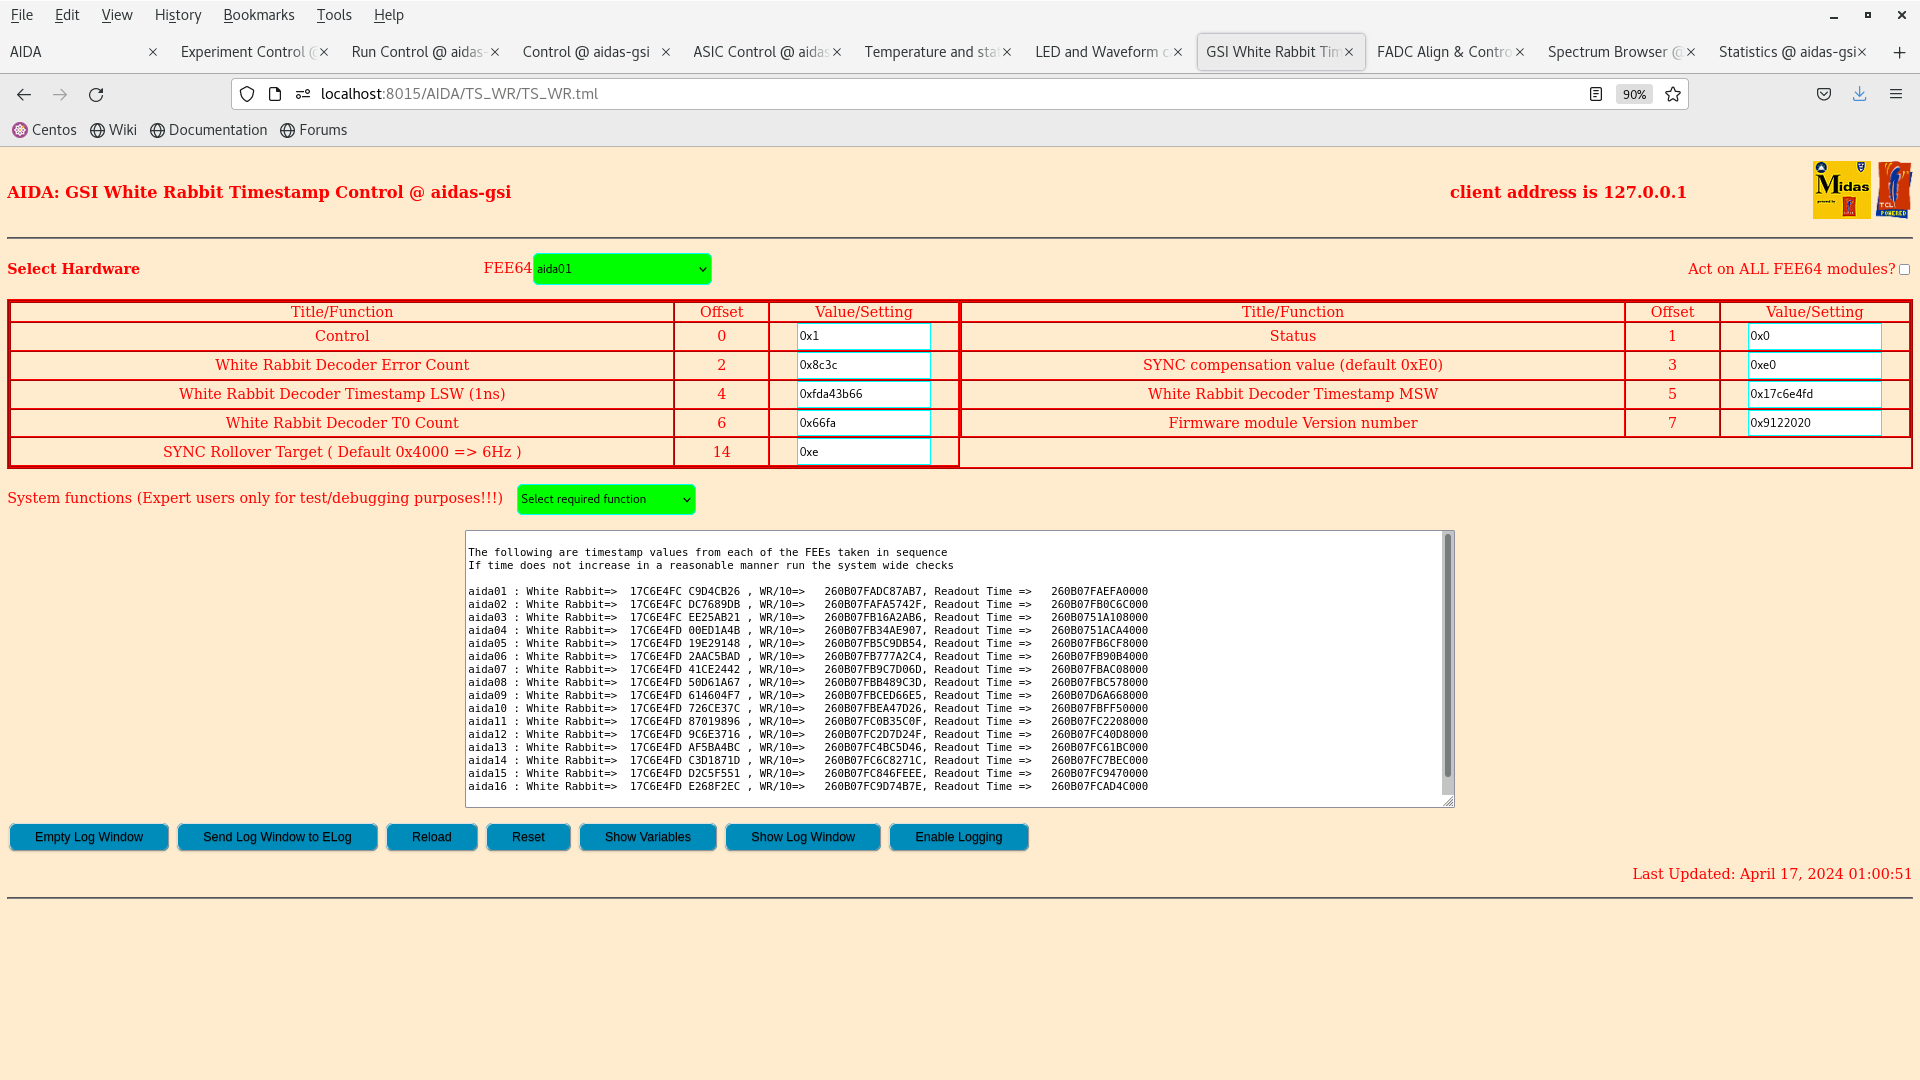
00.40 Observed zero data fron aida03, aida04, aida09
      WR timestamps offset from other FEE64s

      rebooted aida03, aida04, aida09
      no change
      see attachments 14-17


18.25 rebooted aida03, aida04, aida09, aida15

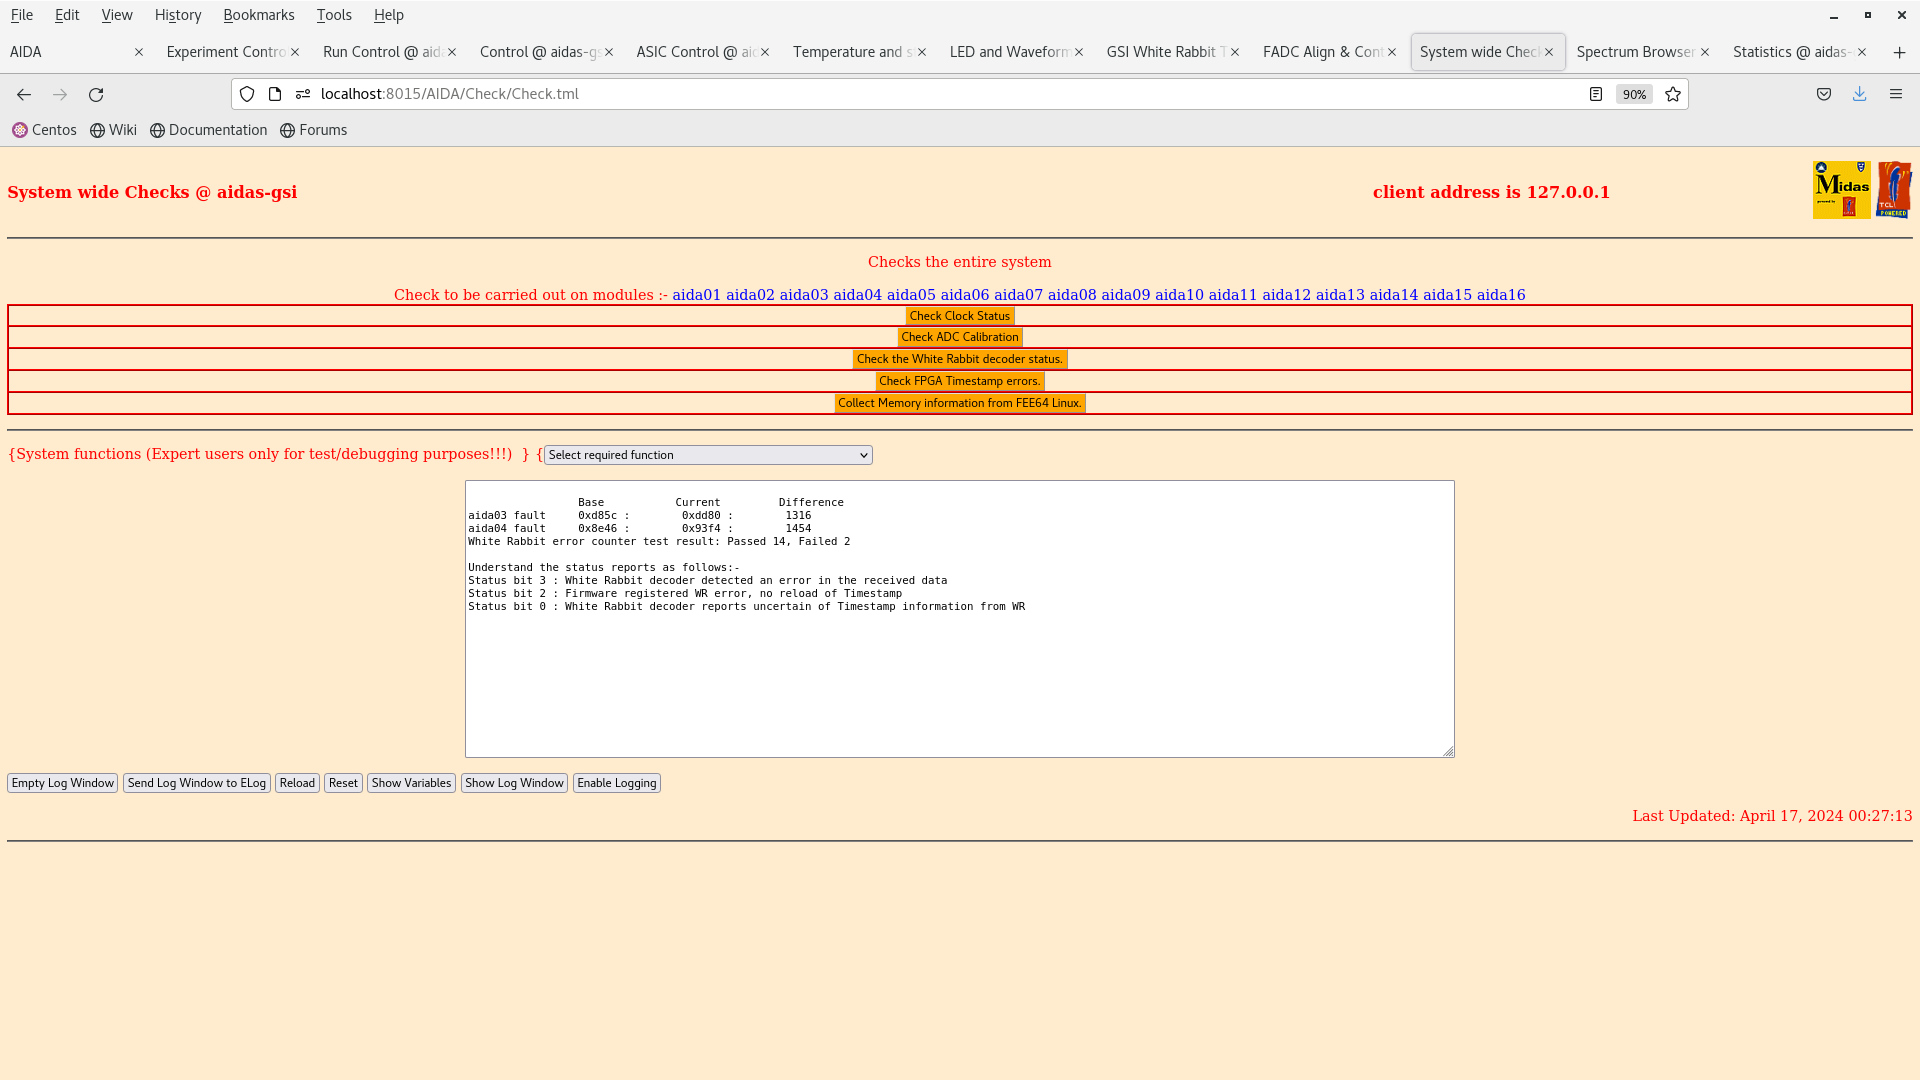
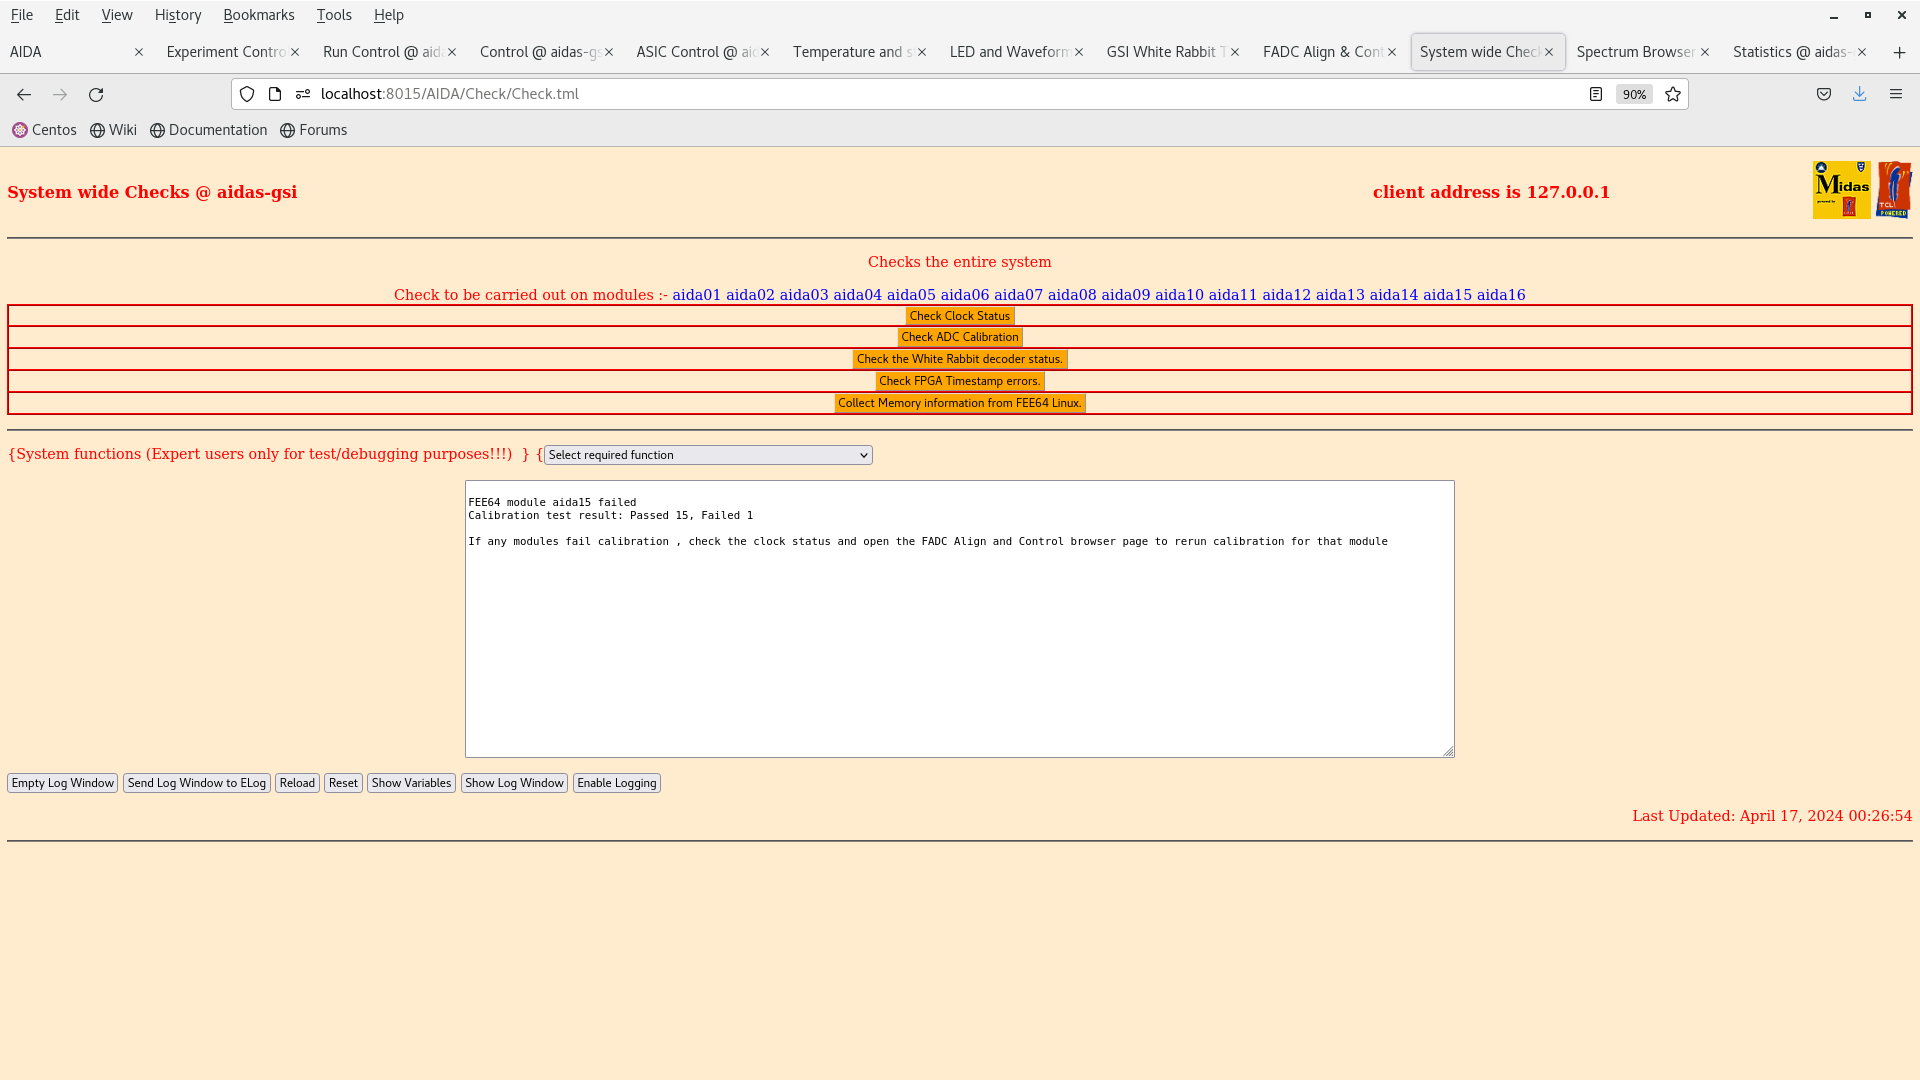
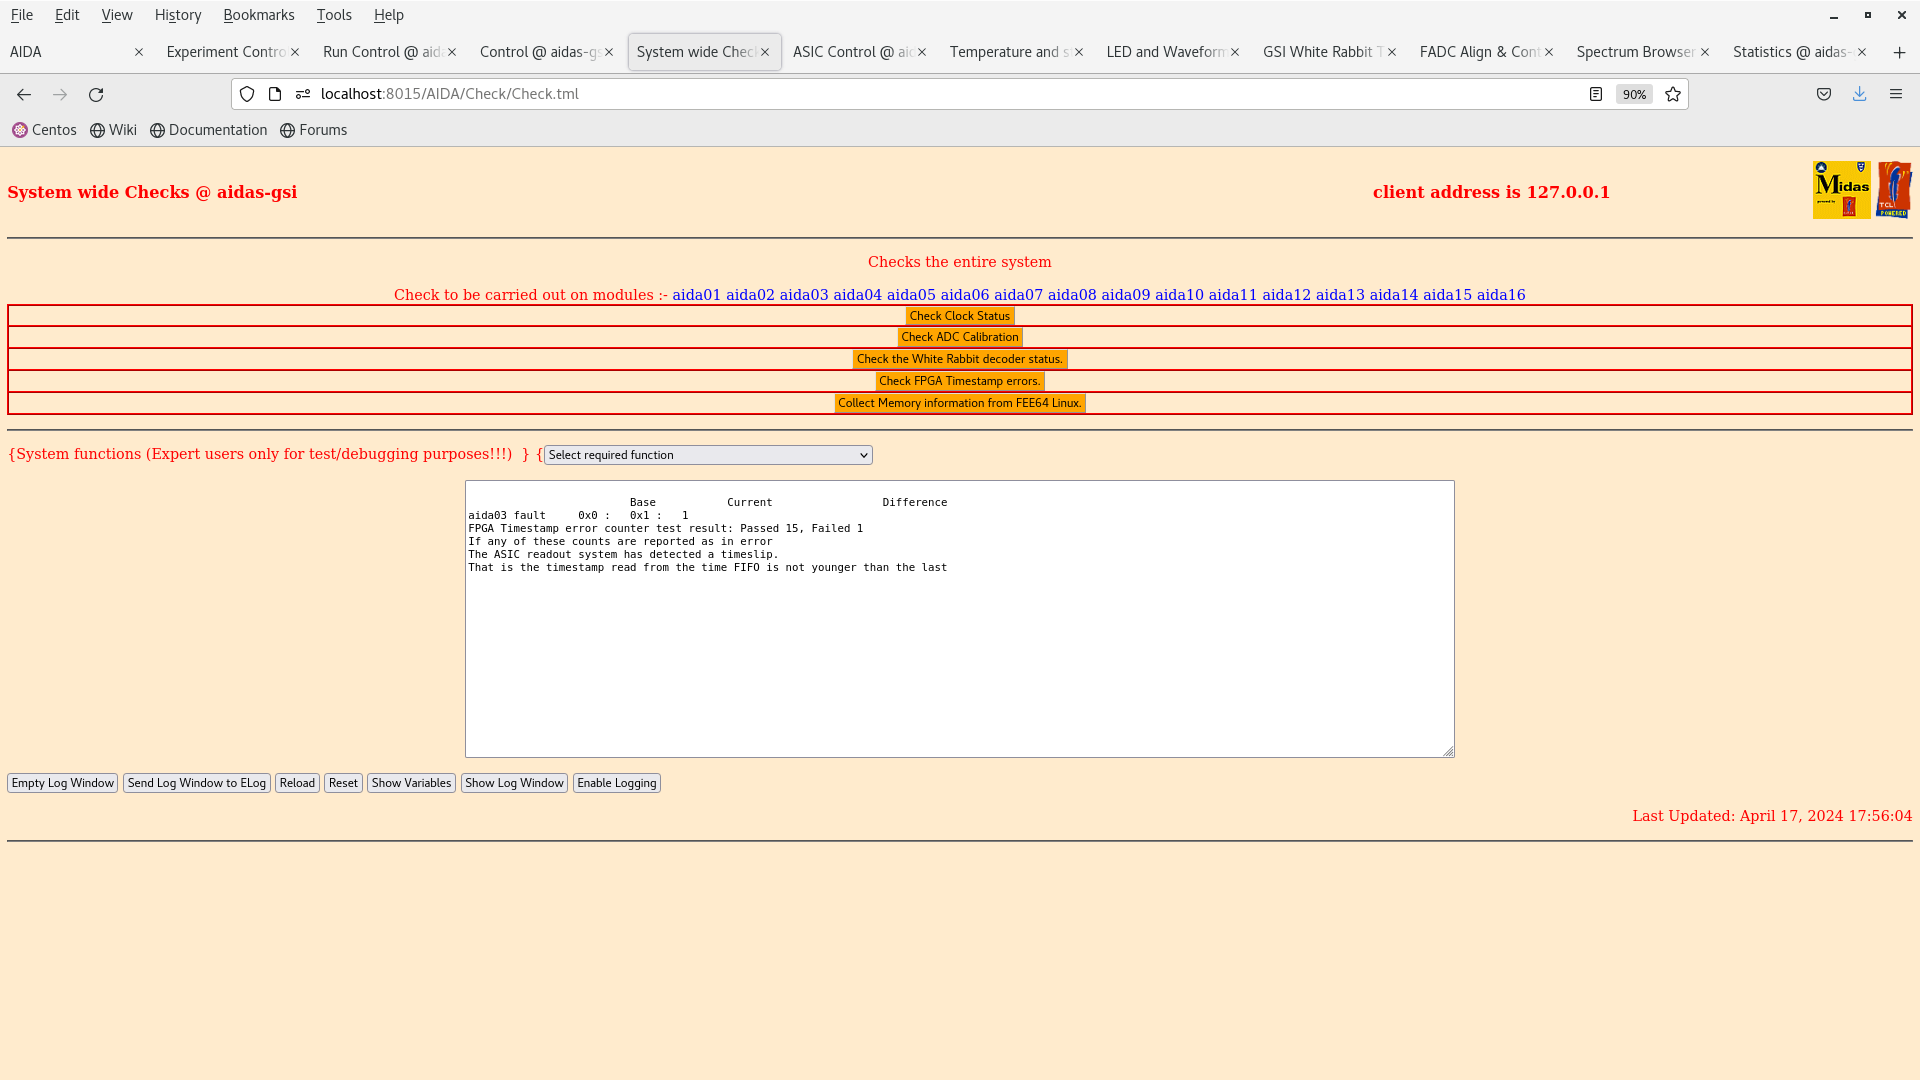
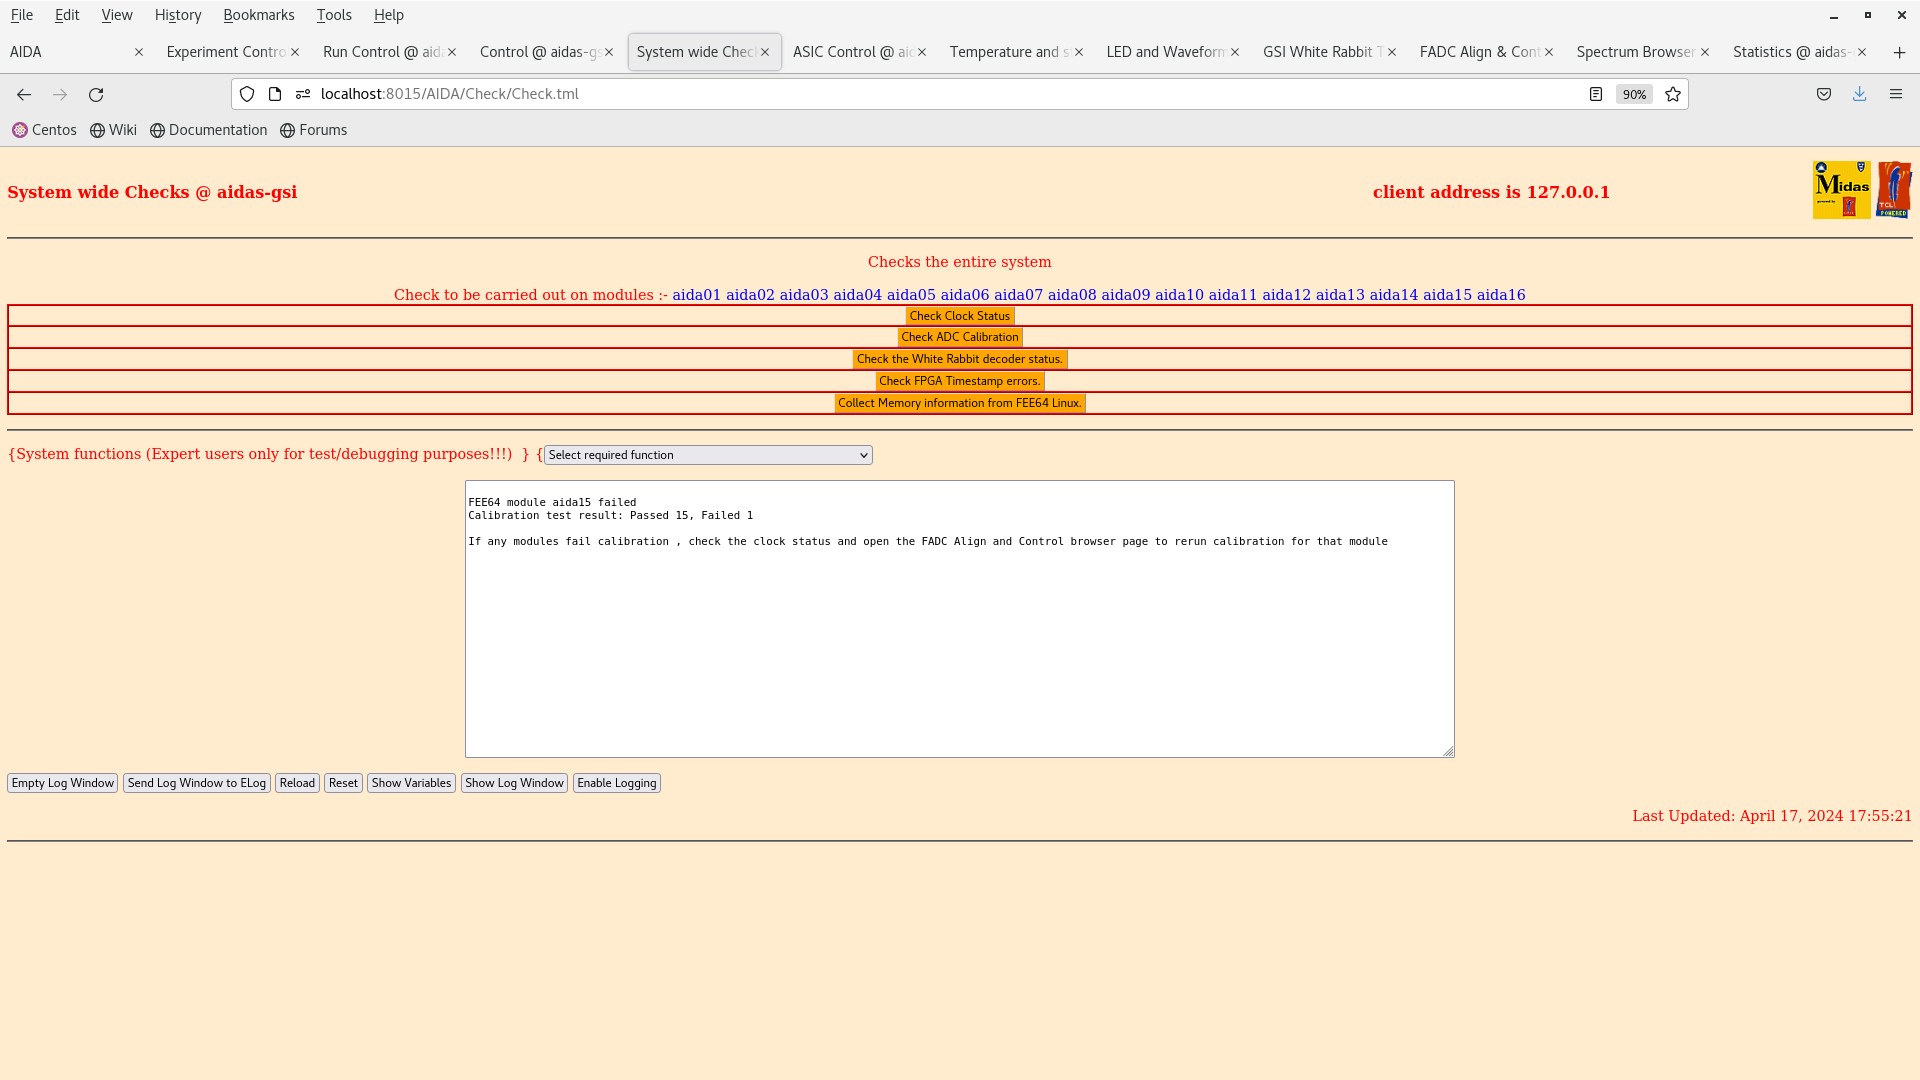
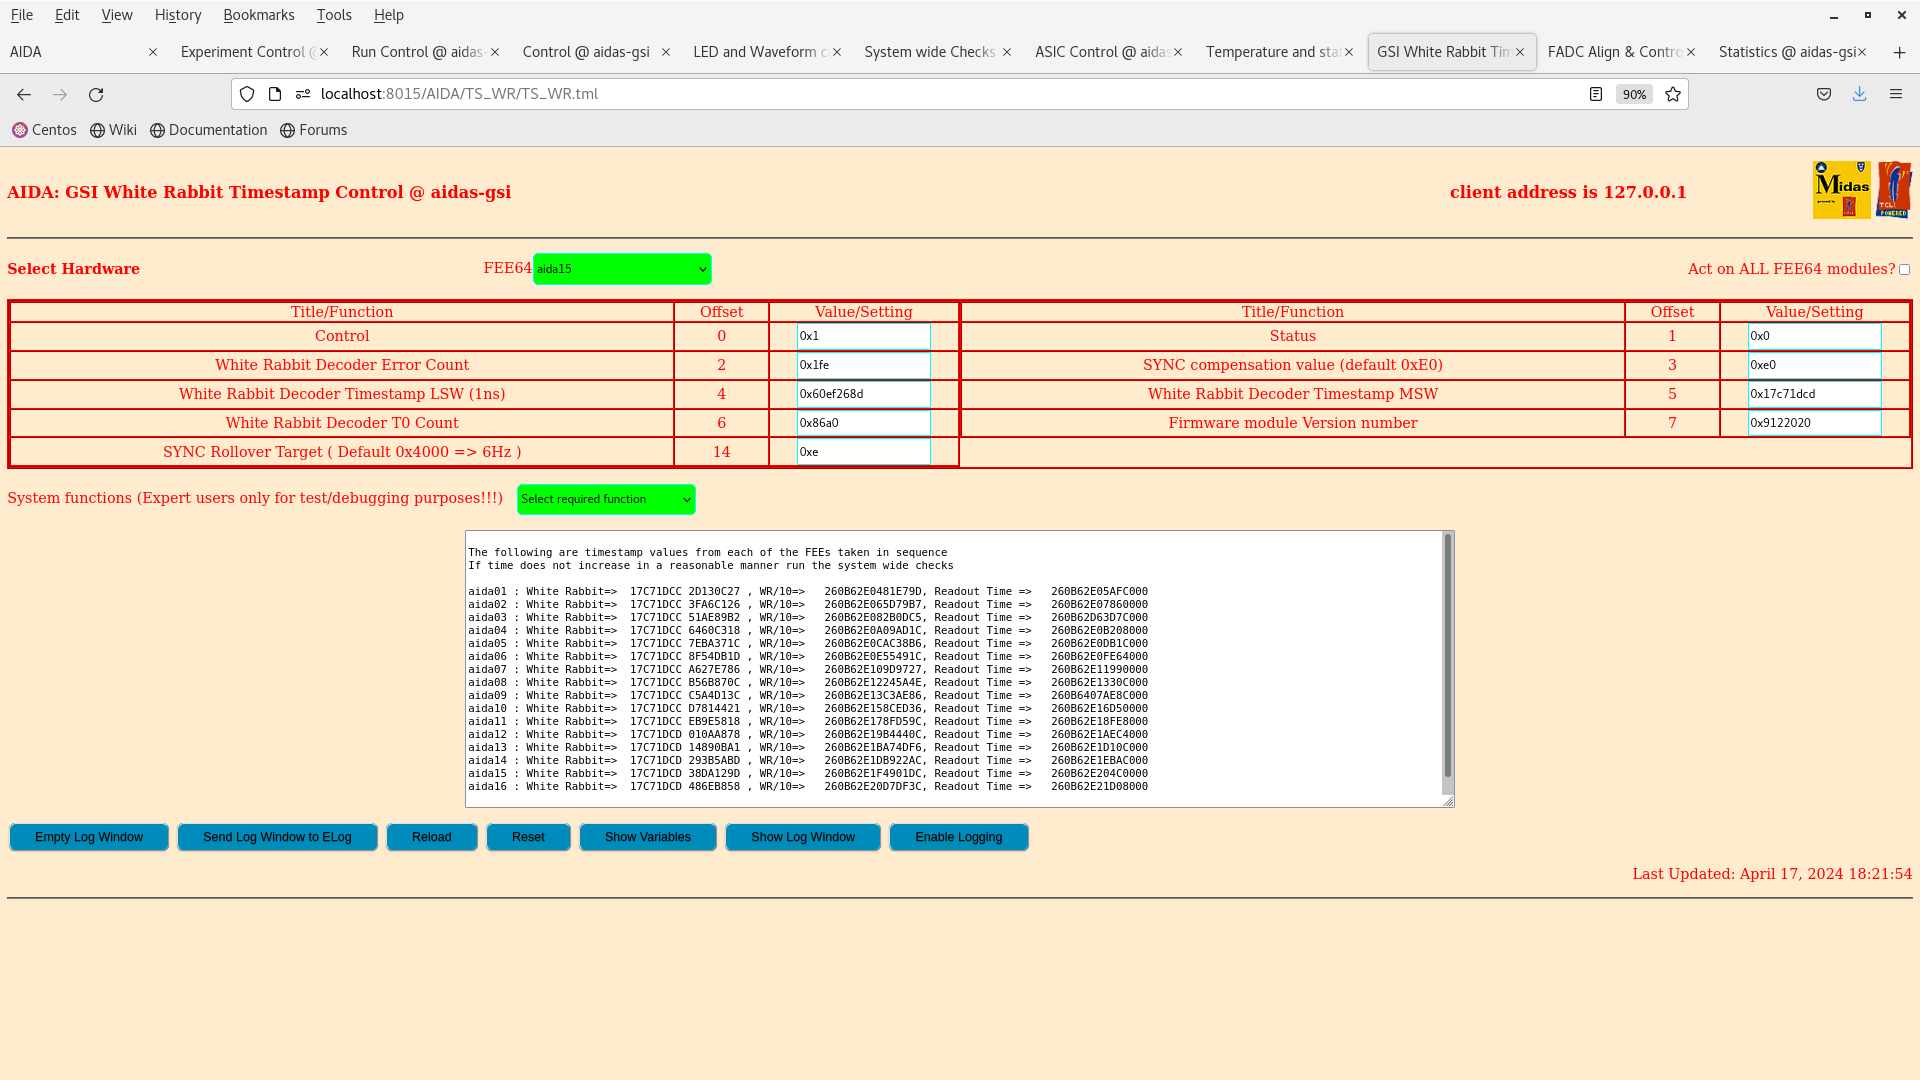
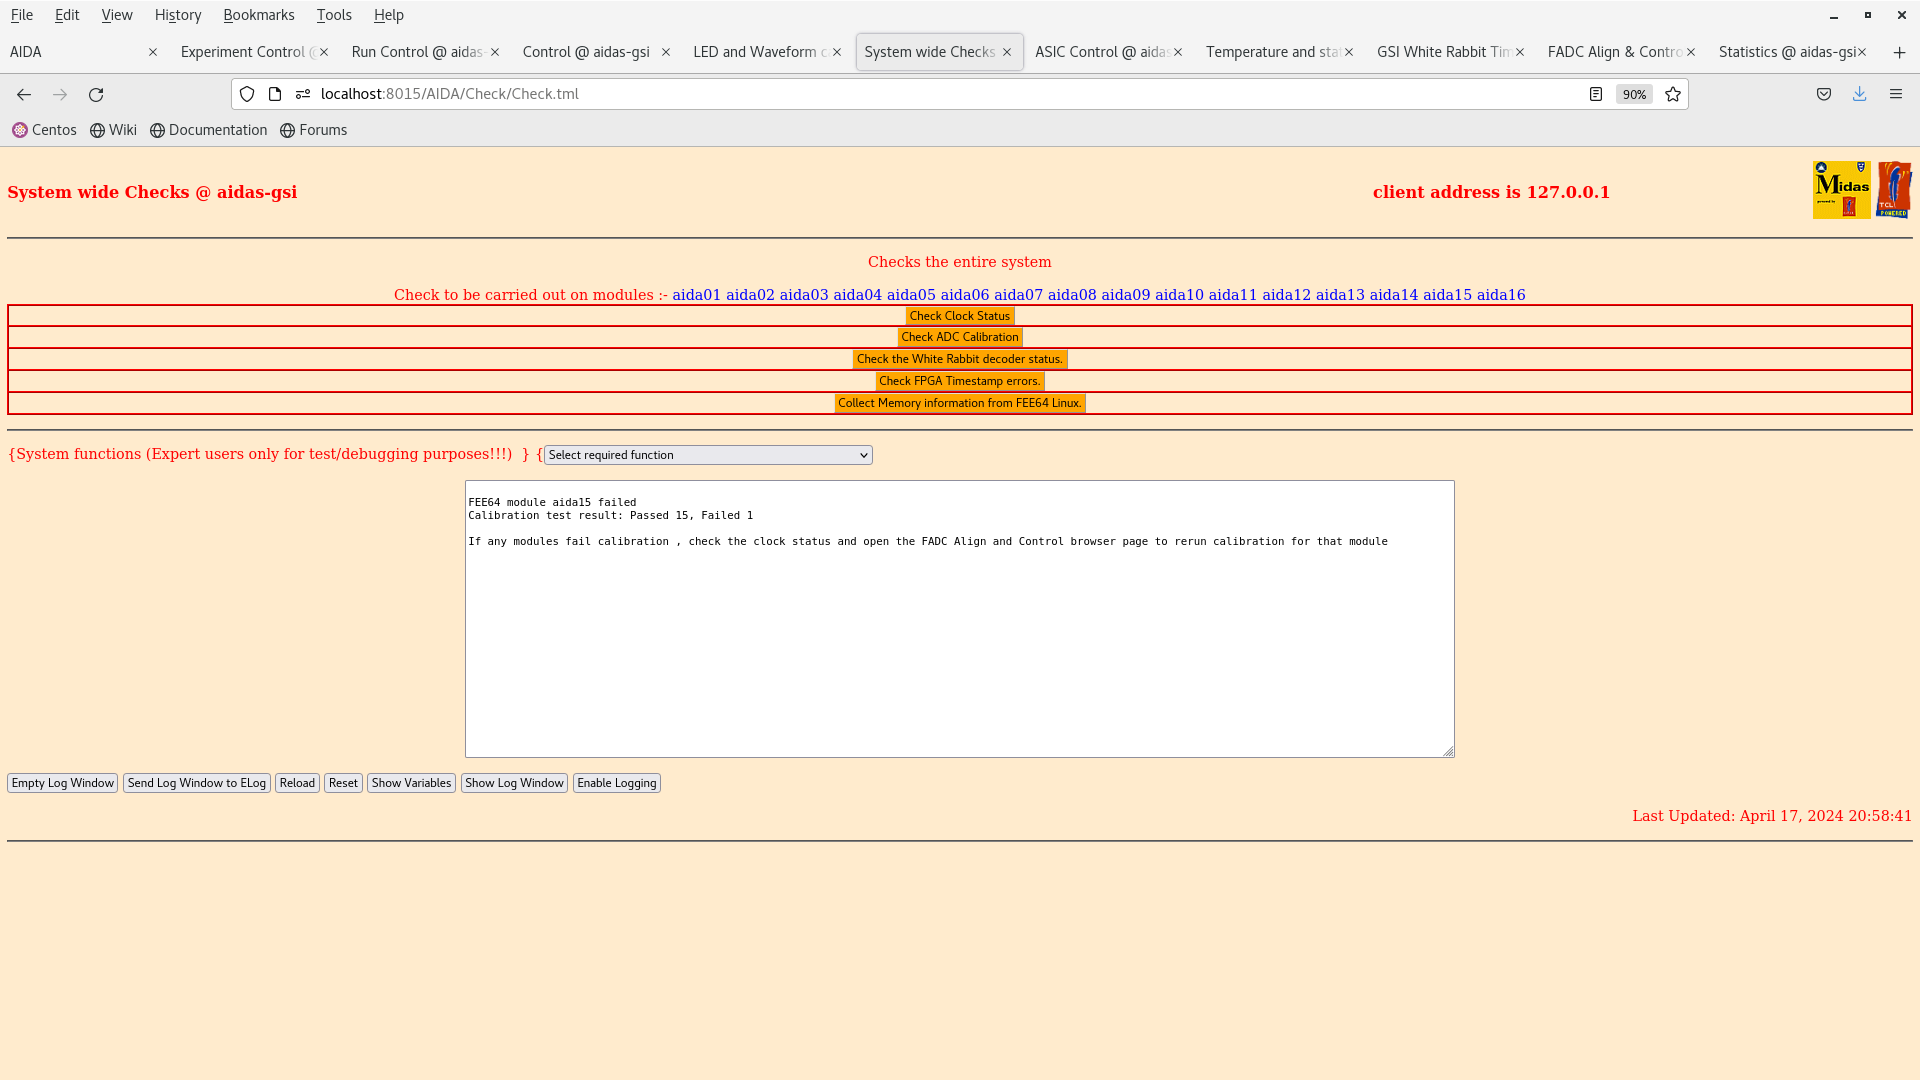
      system wide checks OK *except* aida15 ADC not calibrated, FPGA decoder errors aida02, aida03
      ADC data item stats - attachment 28
      WR timestamps OK - attachment 29

      data file S100_alpha/R5 - alpha background

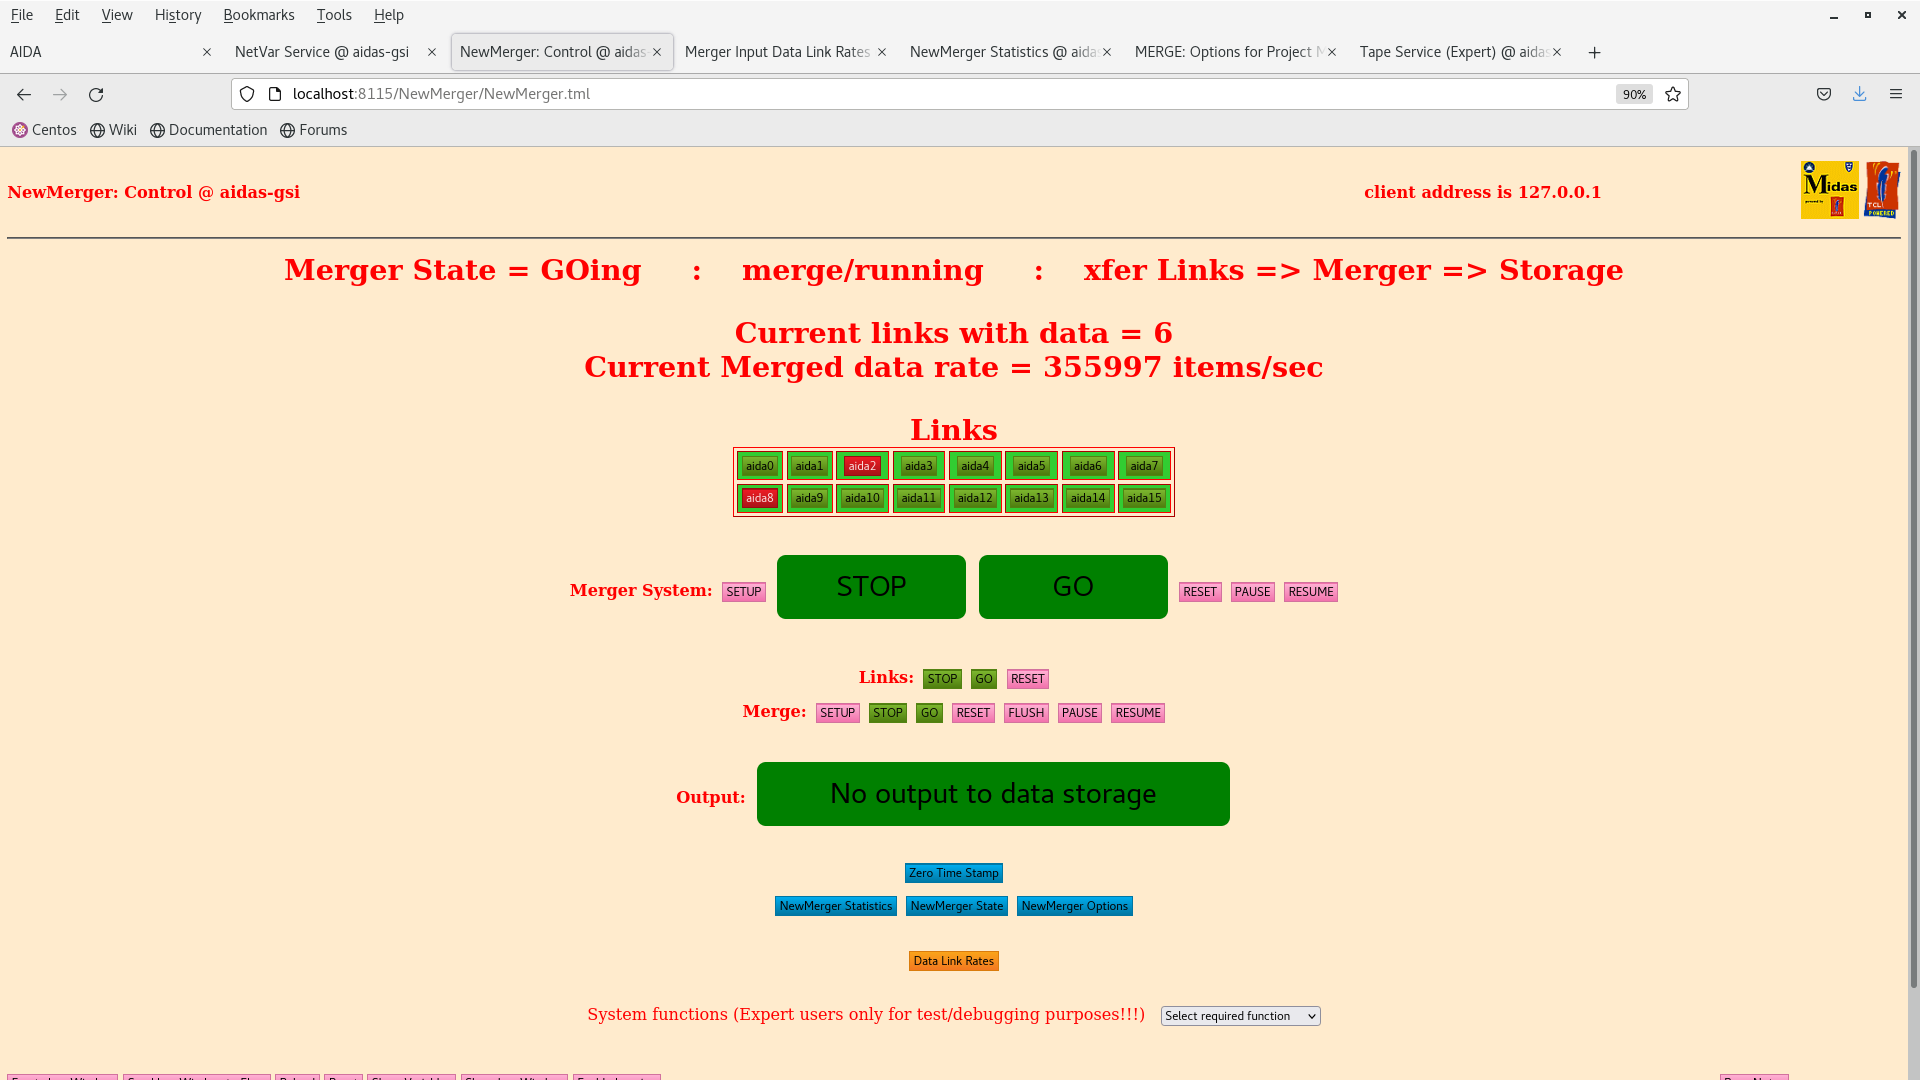
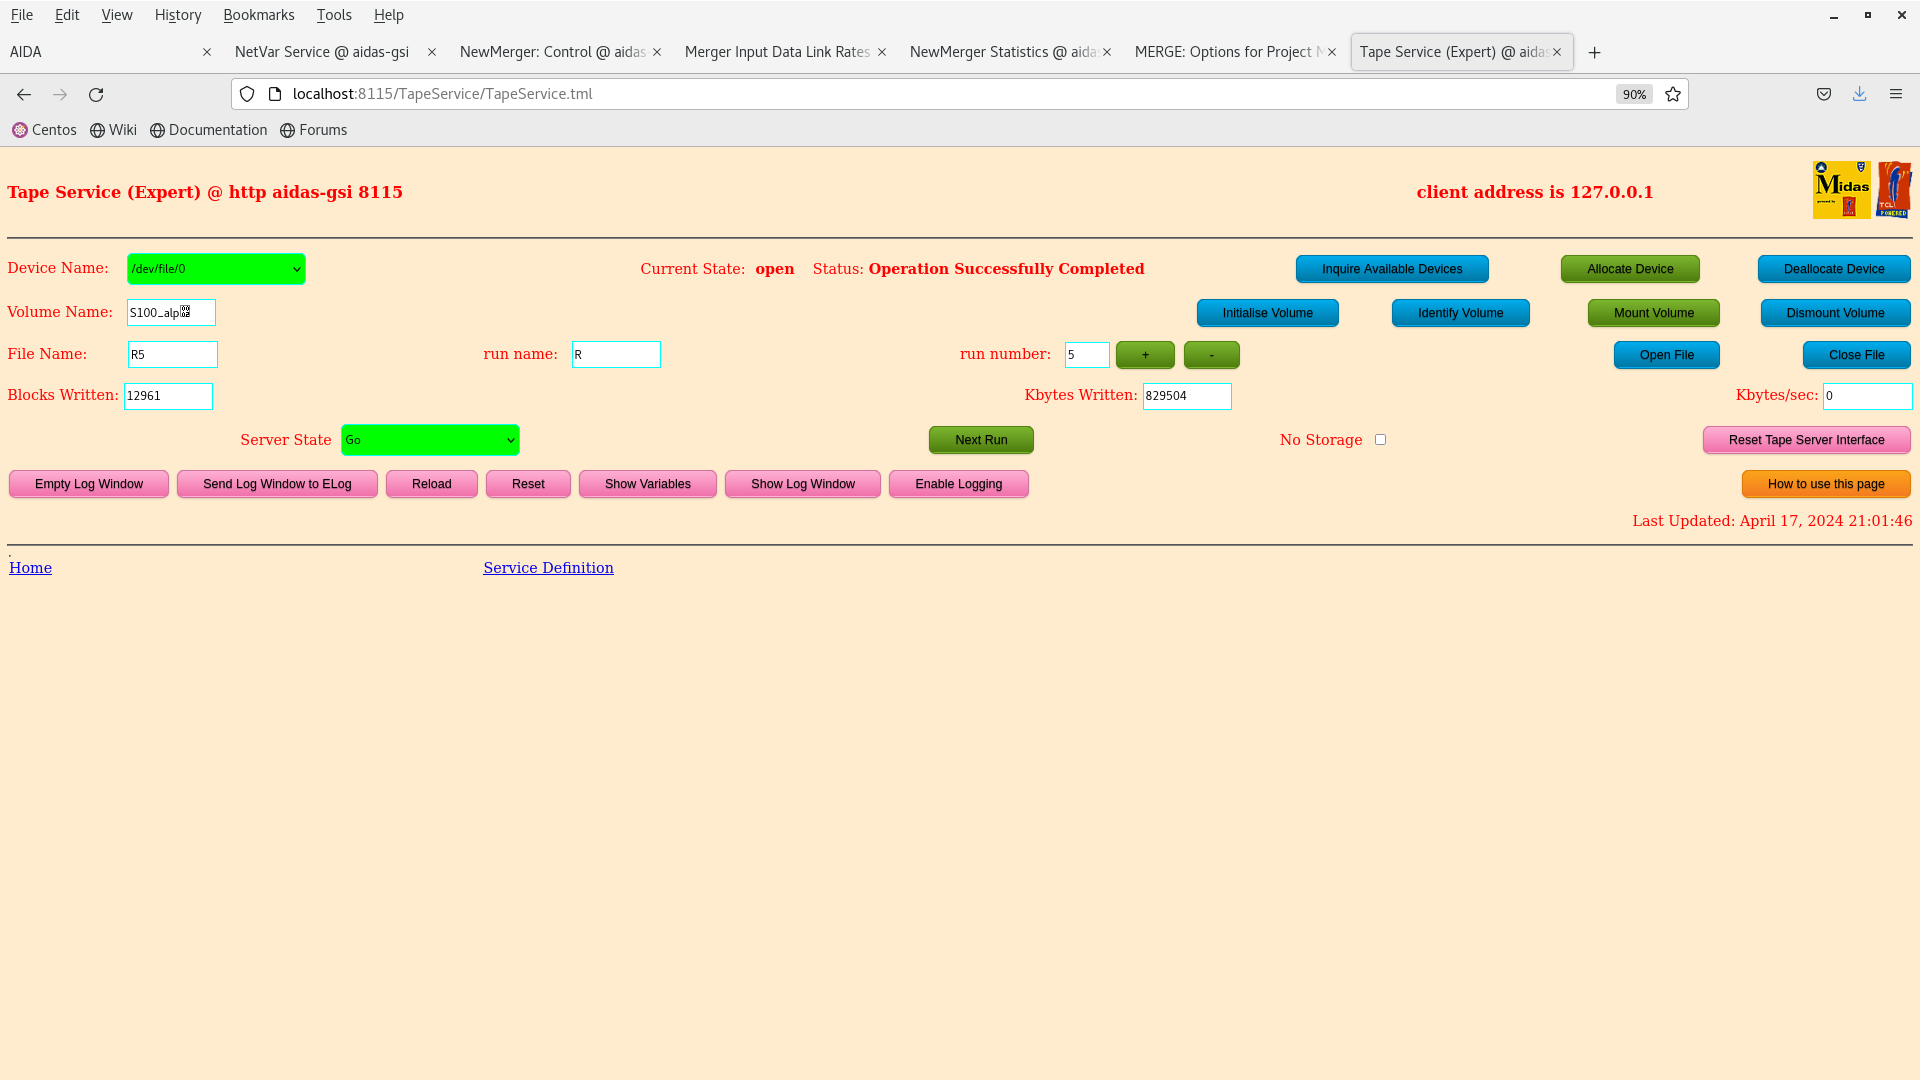
      Merger and TapeServer - attachments 30-31
       c. 1Mb/s to disk

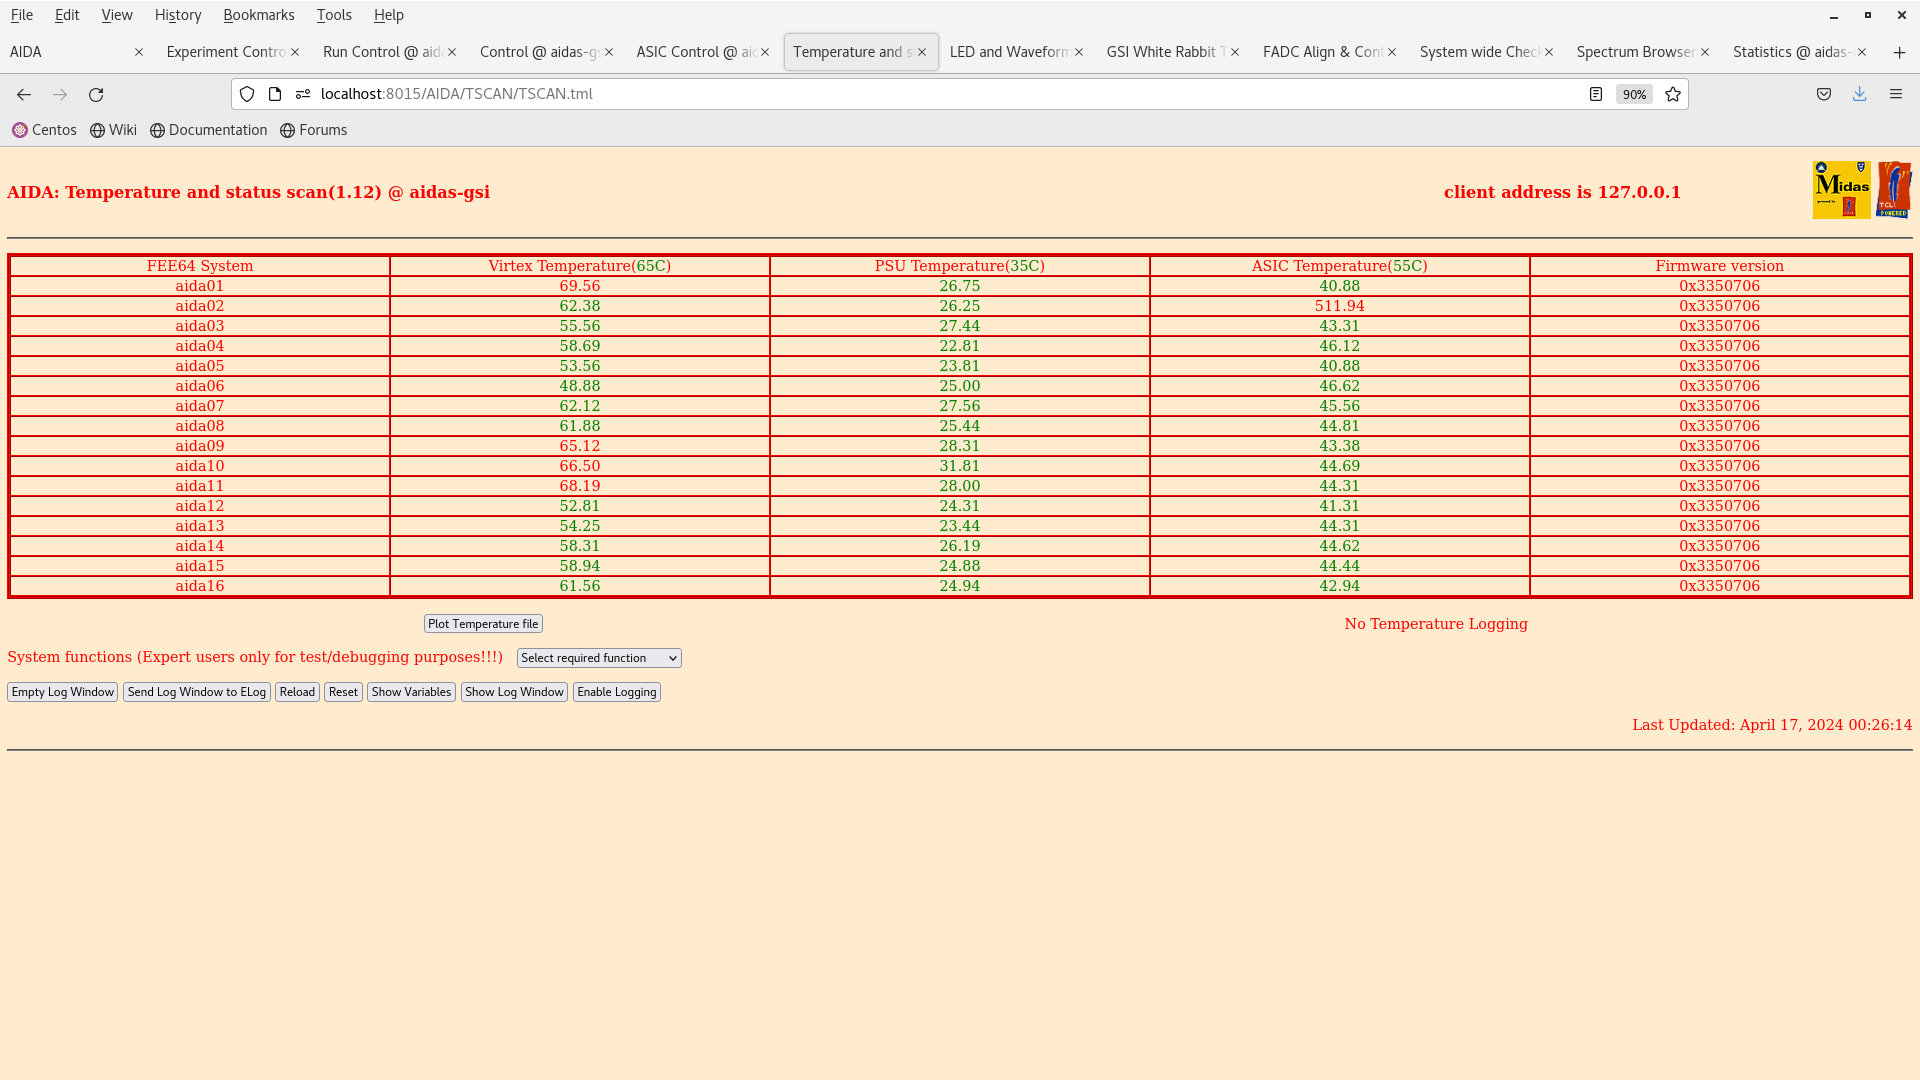
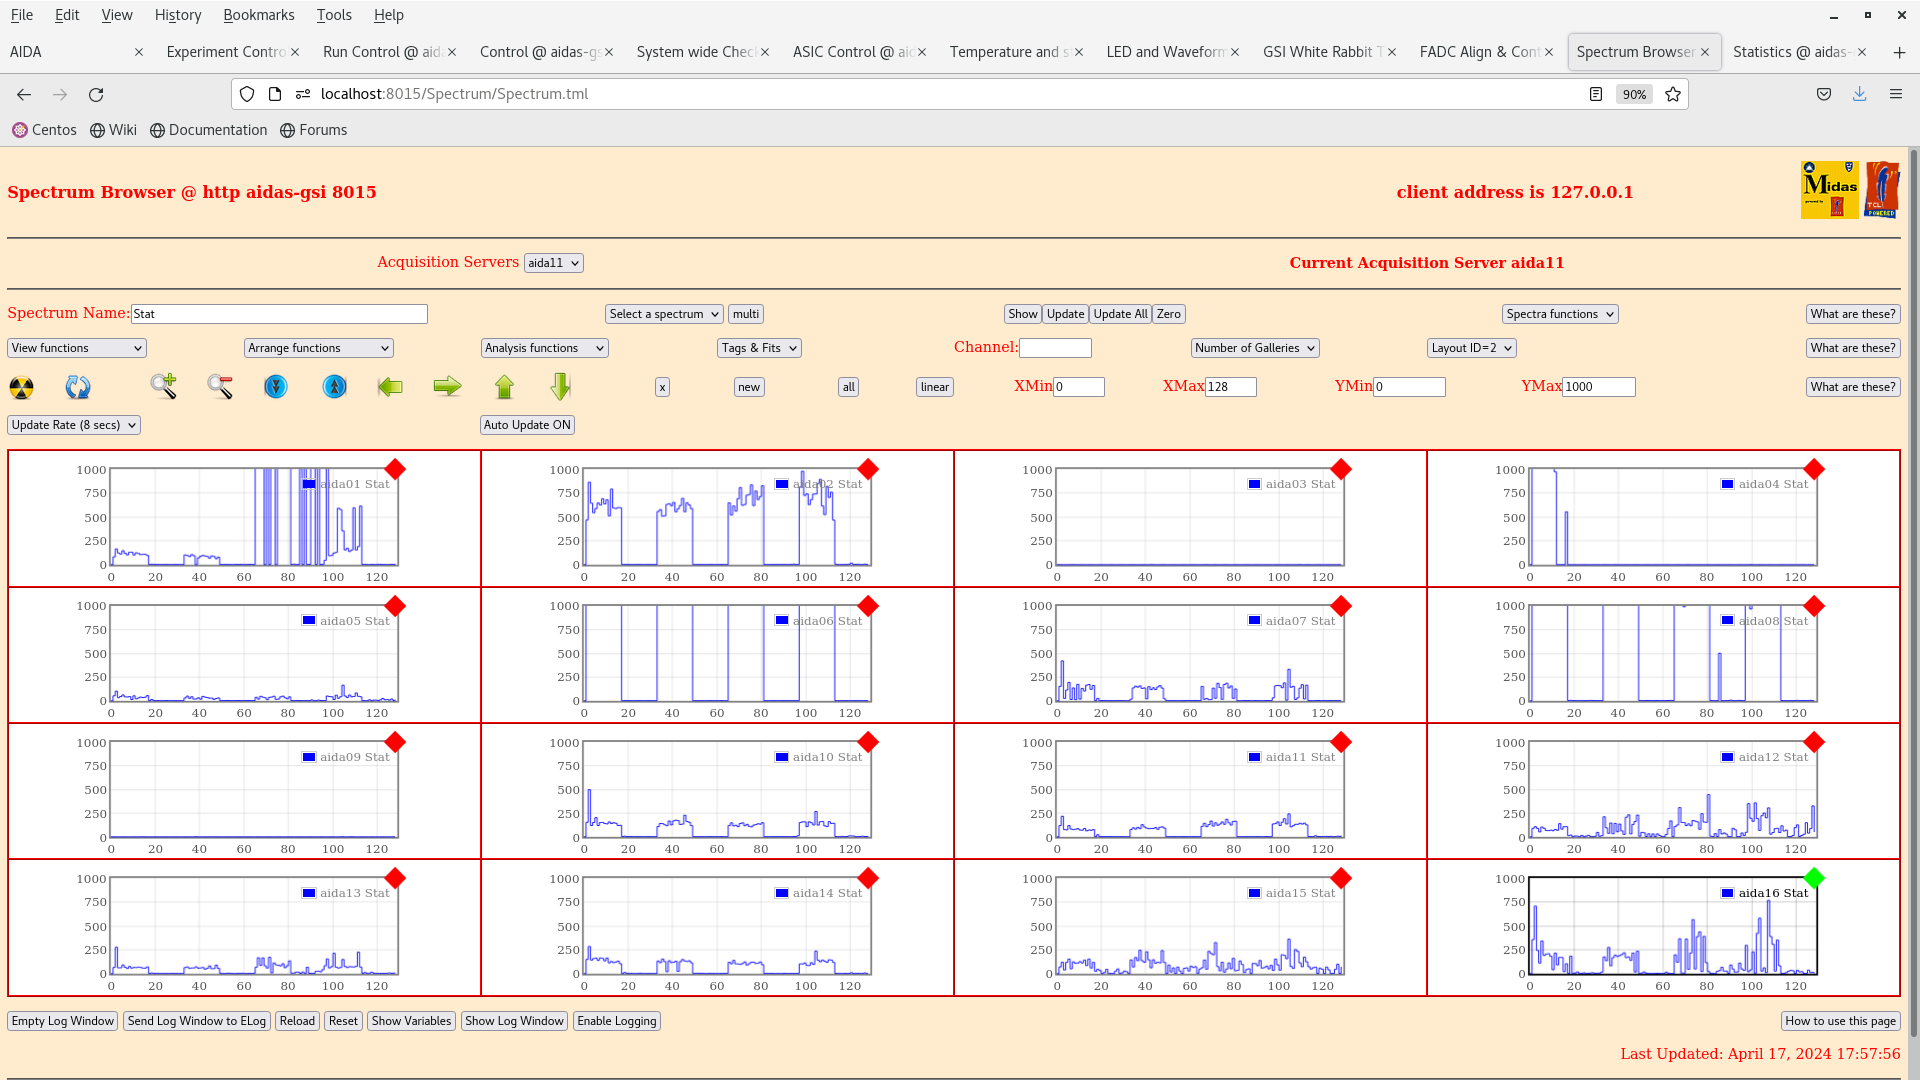
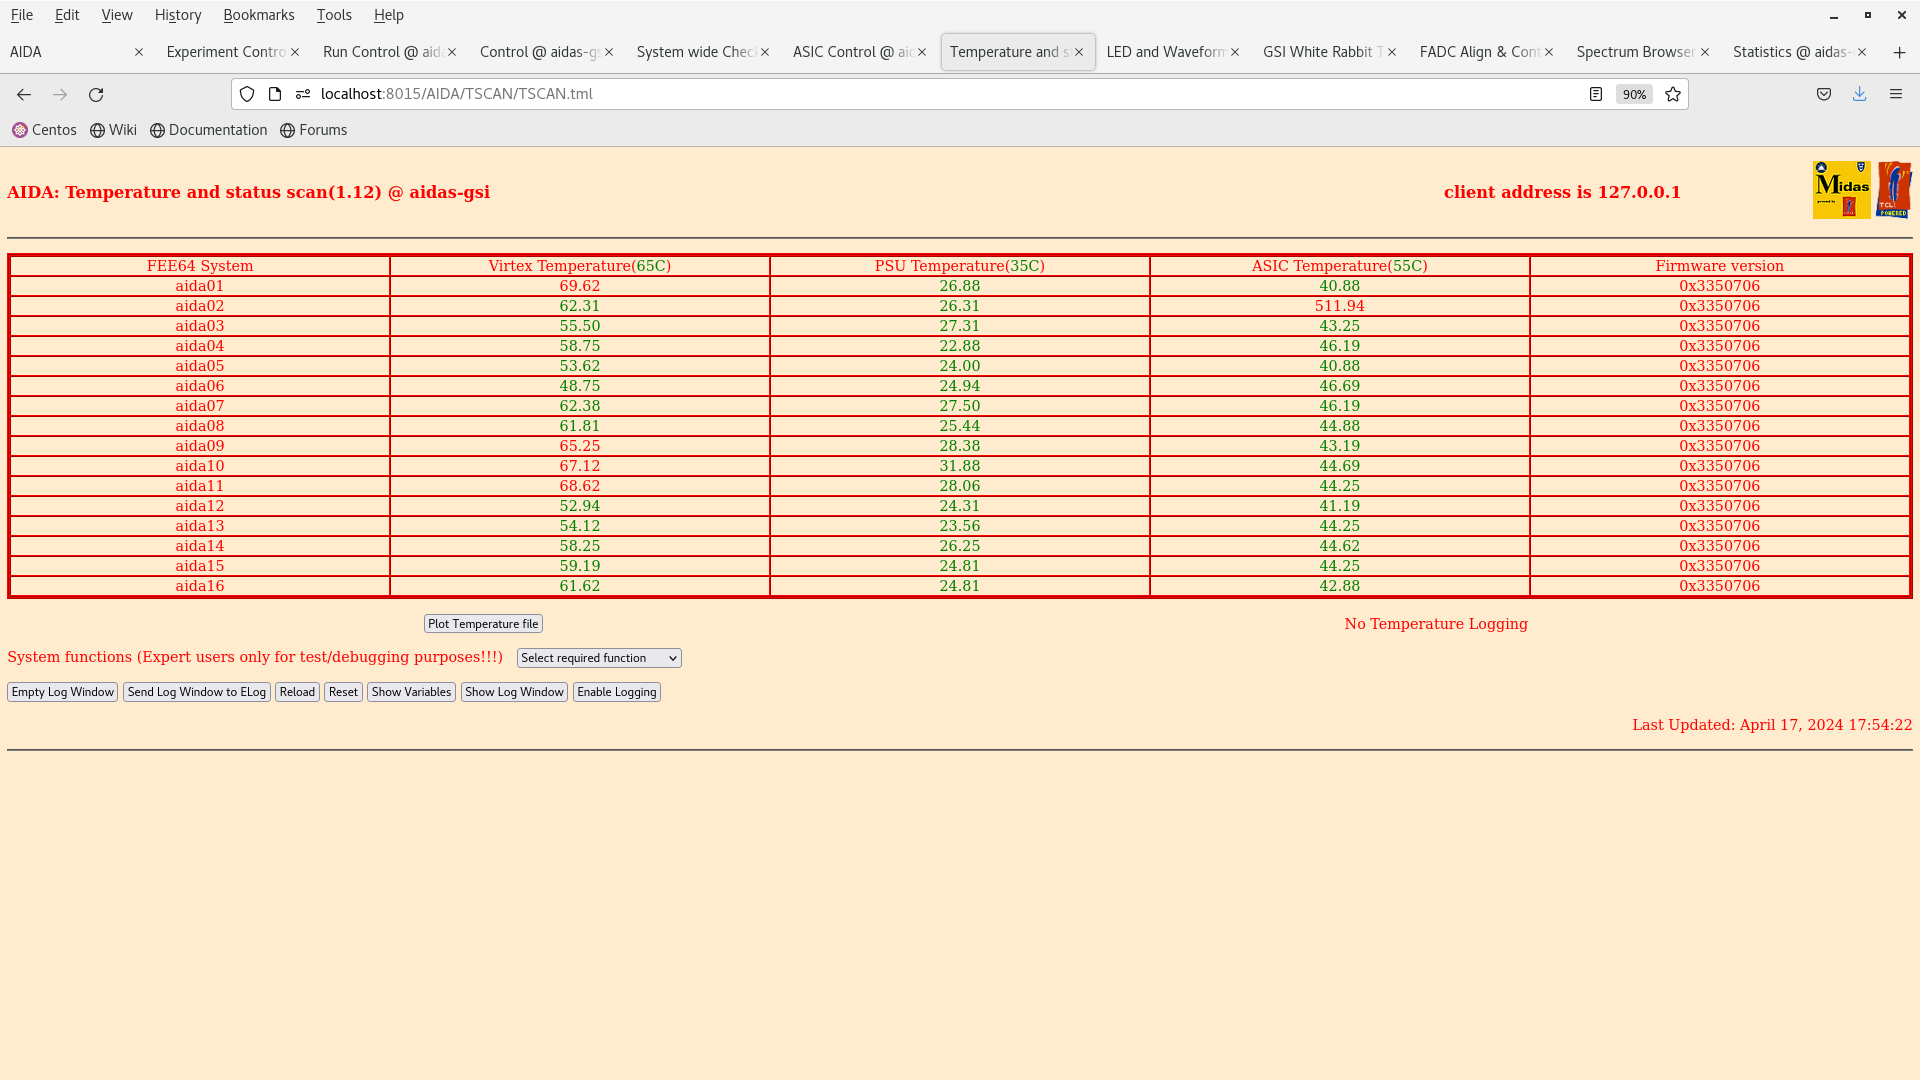
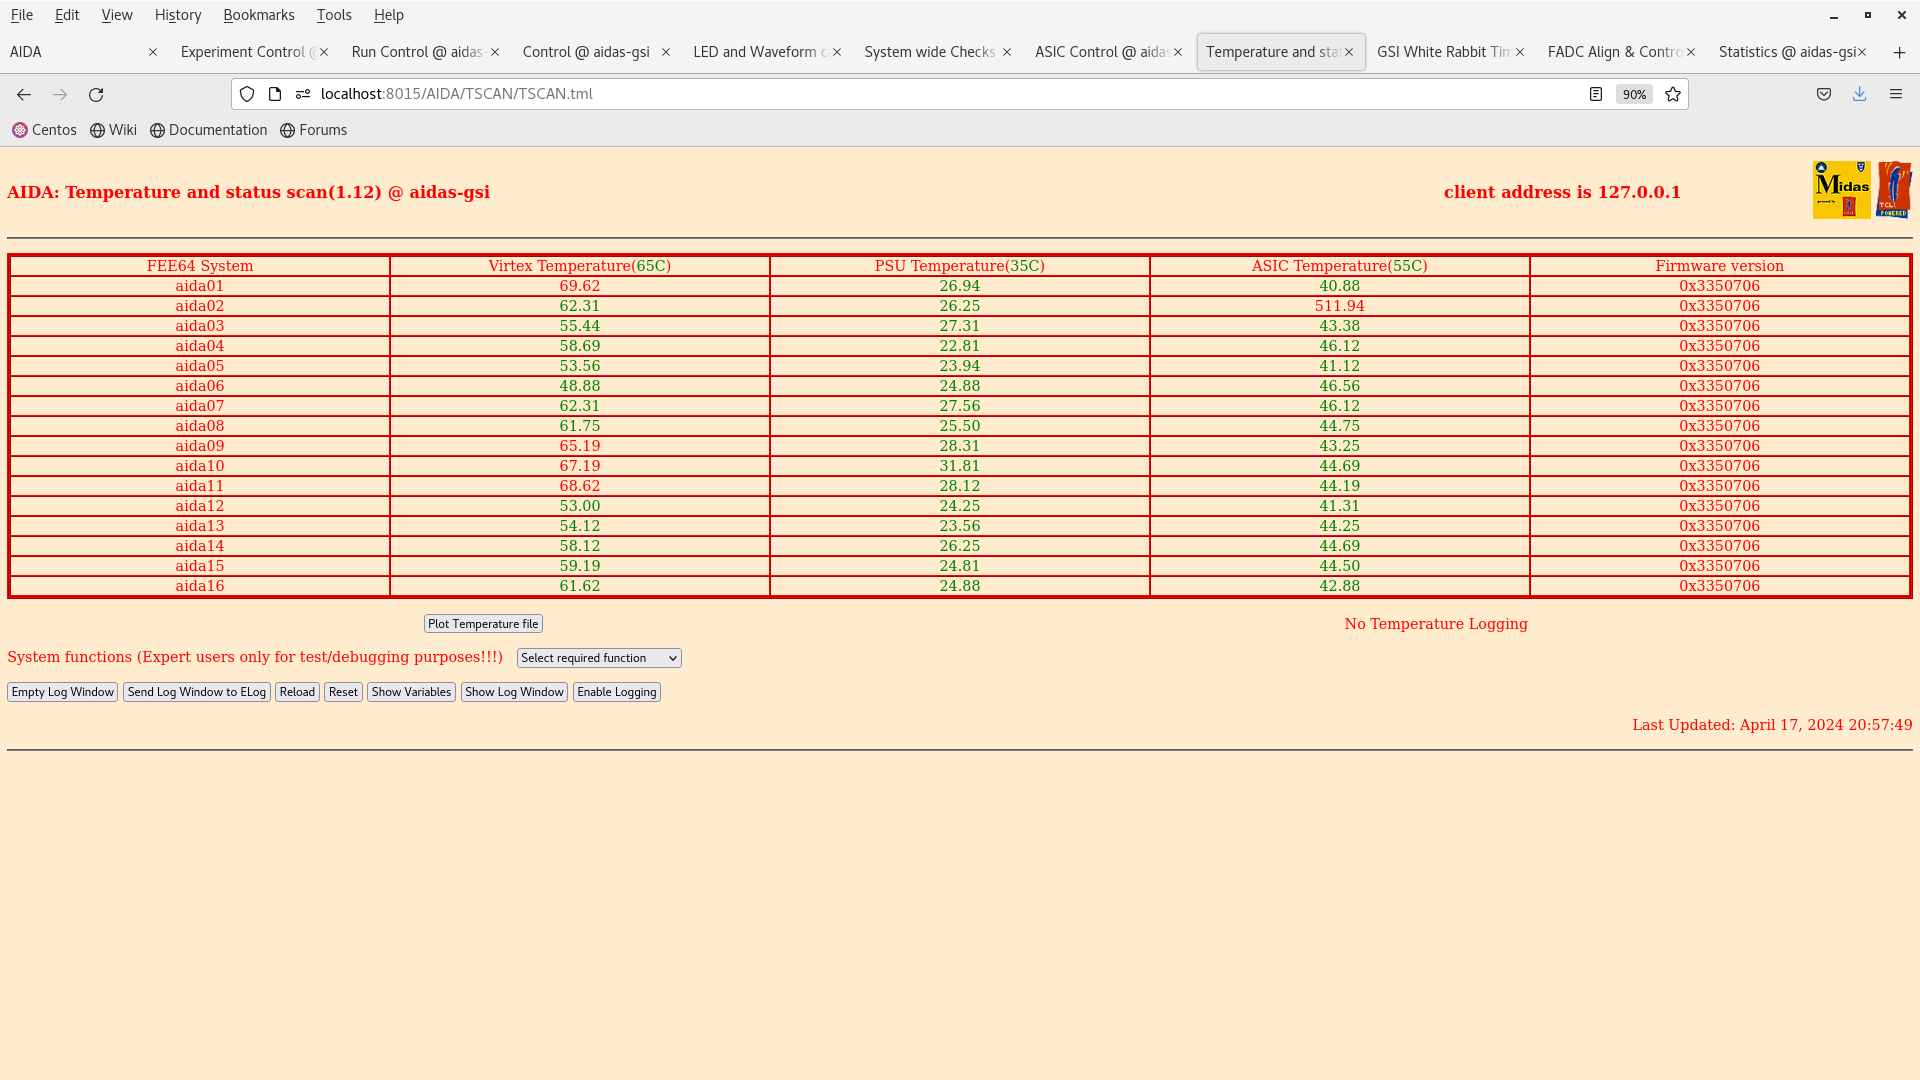
21.05 FEE64 temps OK - attachment 44
      *except* aida02 ASIC temp which is known to be u/s

      All system wide checks OK *except* aida15 ASDC not calibrated, WR timestam/FPGA errors - attachments 41-43

      WR timestamps- attachment 40
       aida03, aida04 and aida09 differ from other timestamps again

      Merger and TapeServer - attachments 38-39
       c. 0Mb/s to disk due to WR timestamp issues

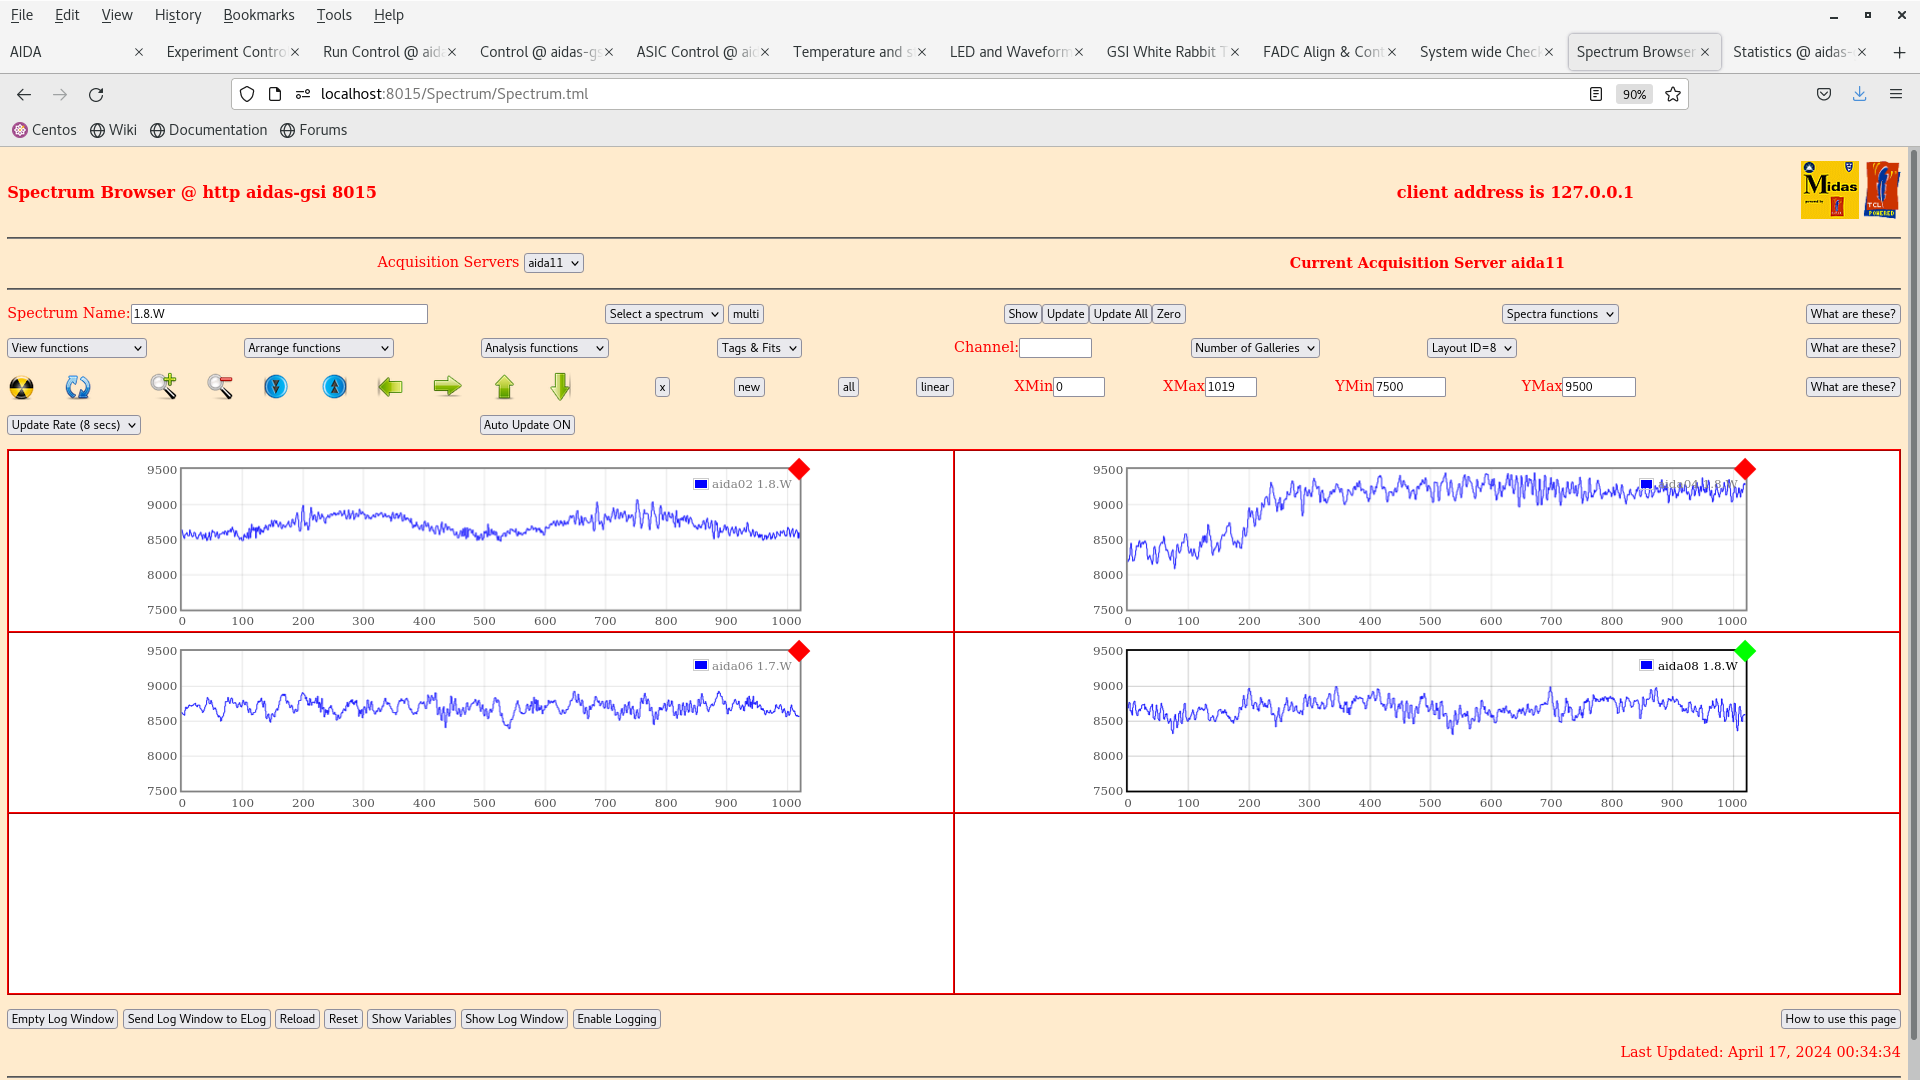
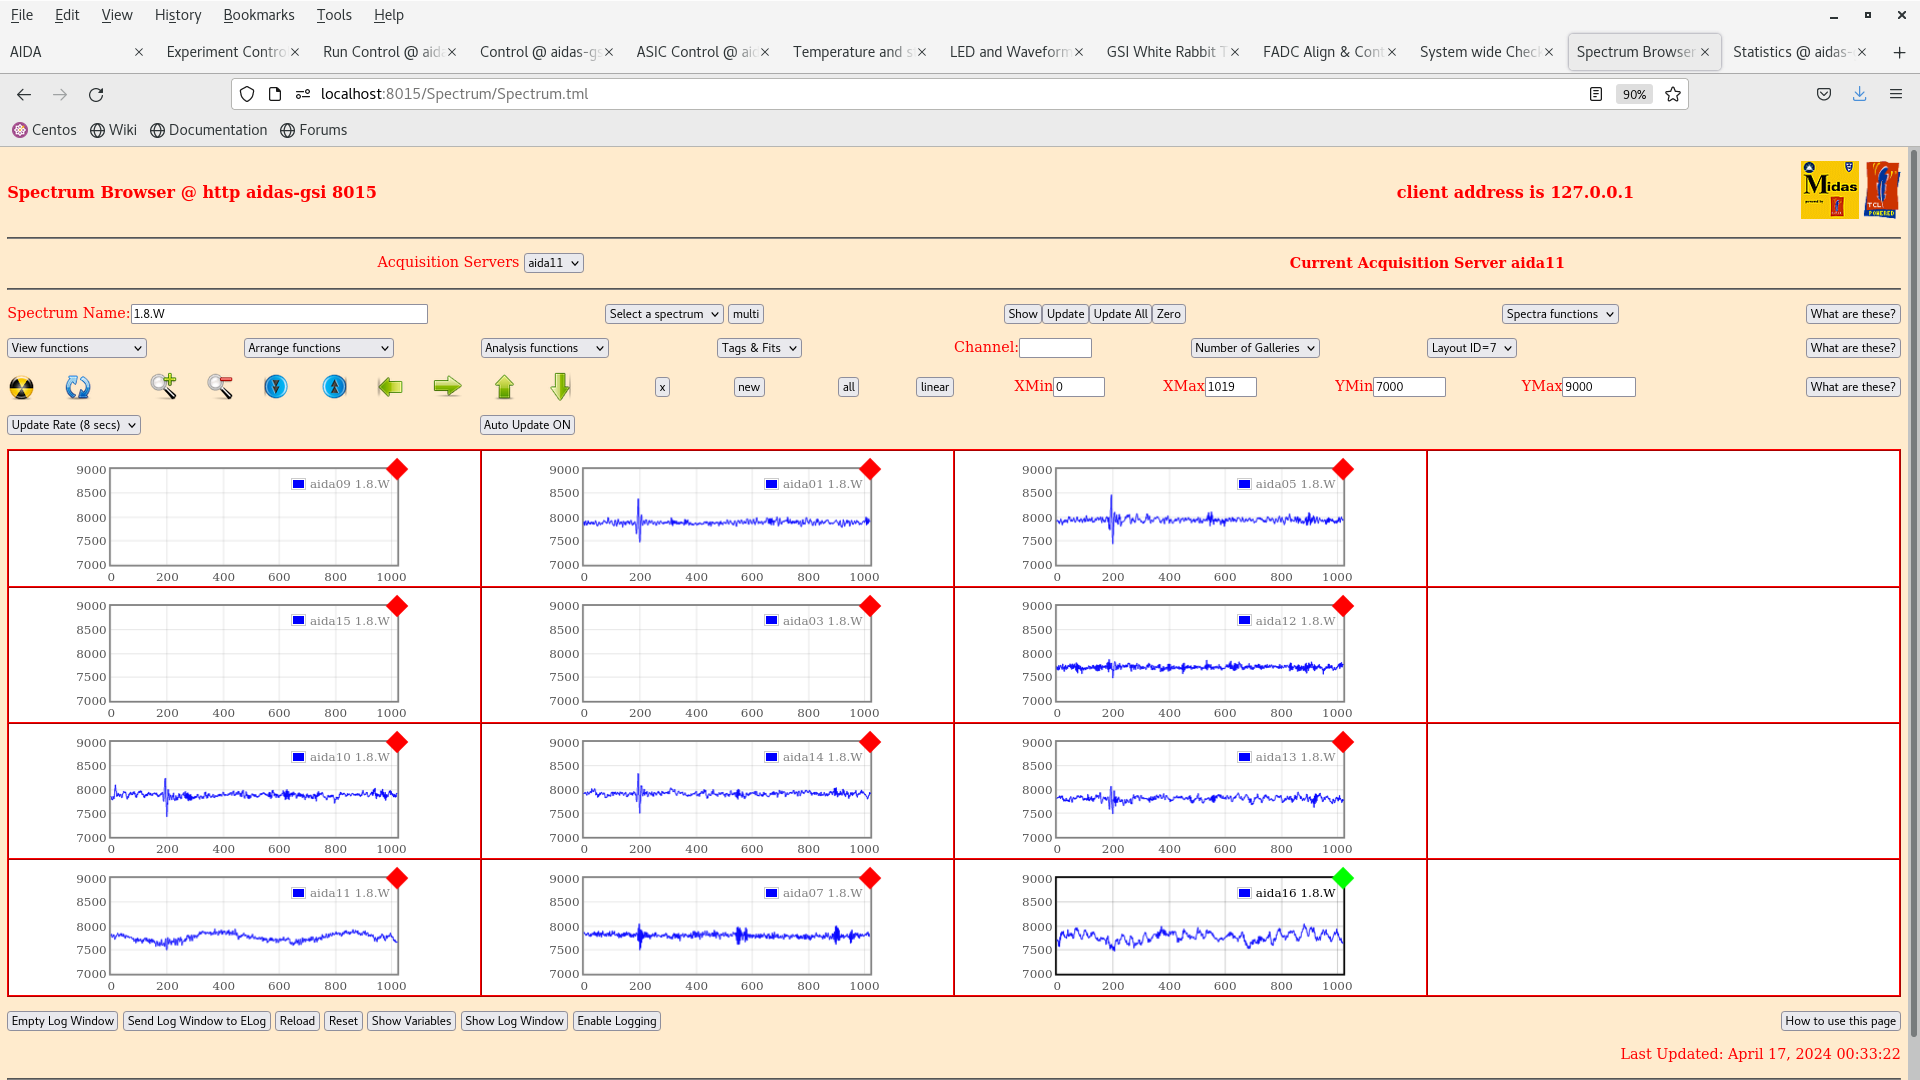
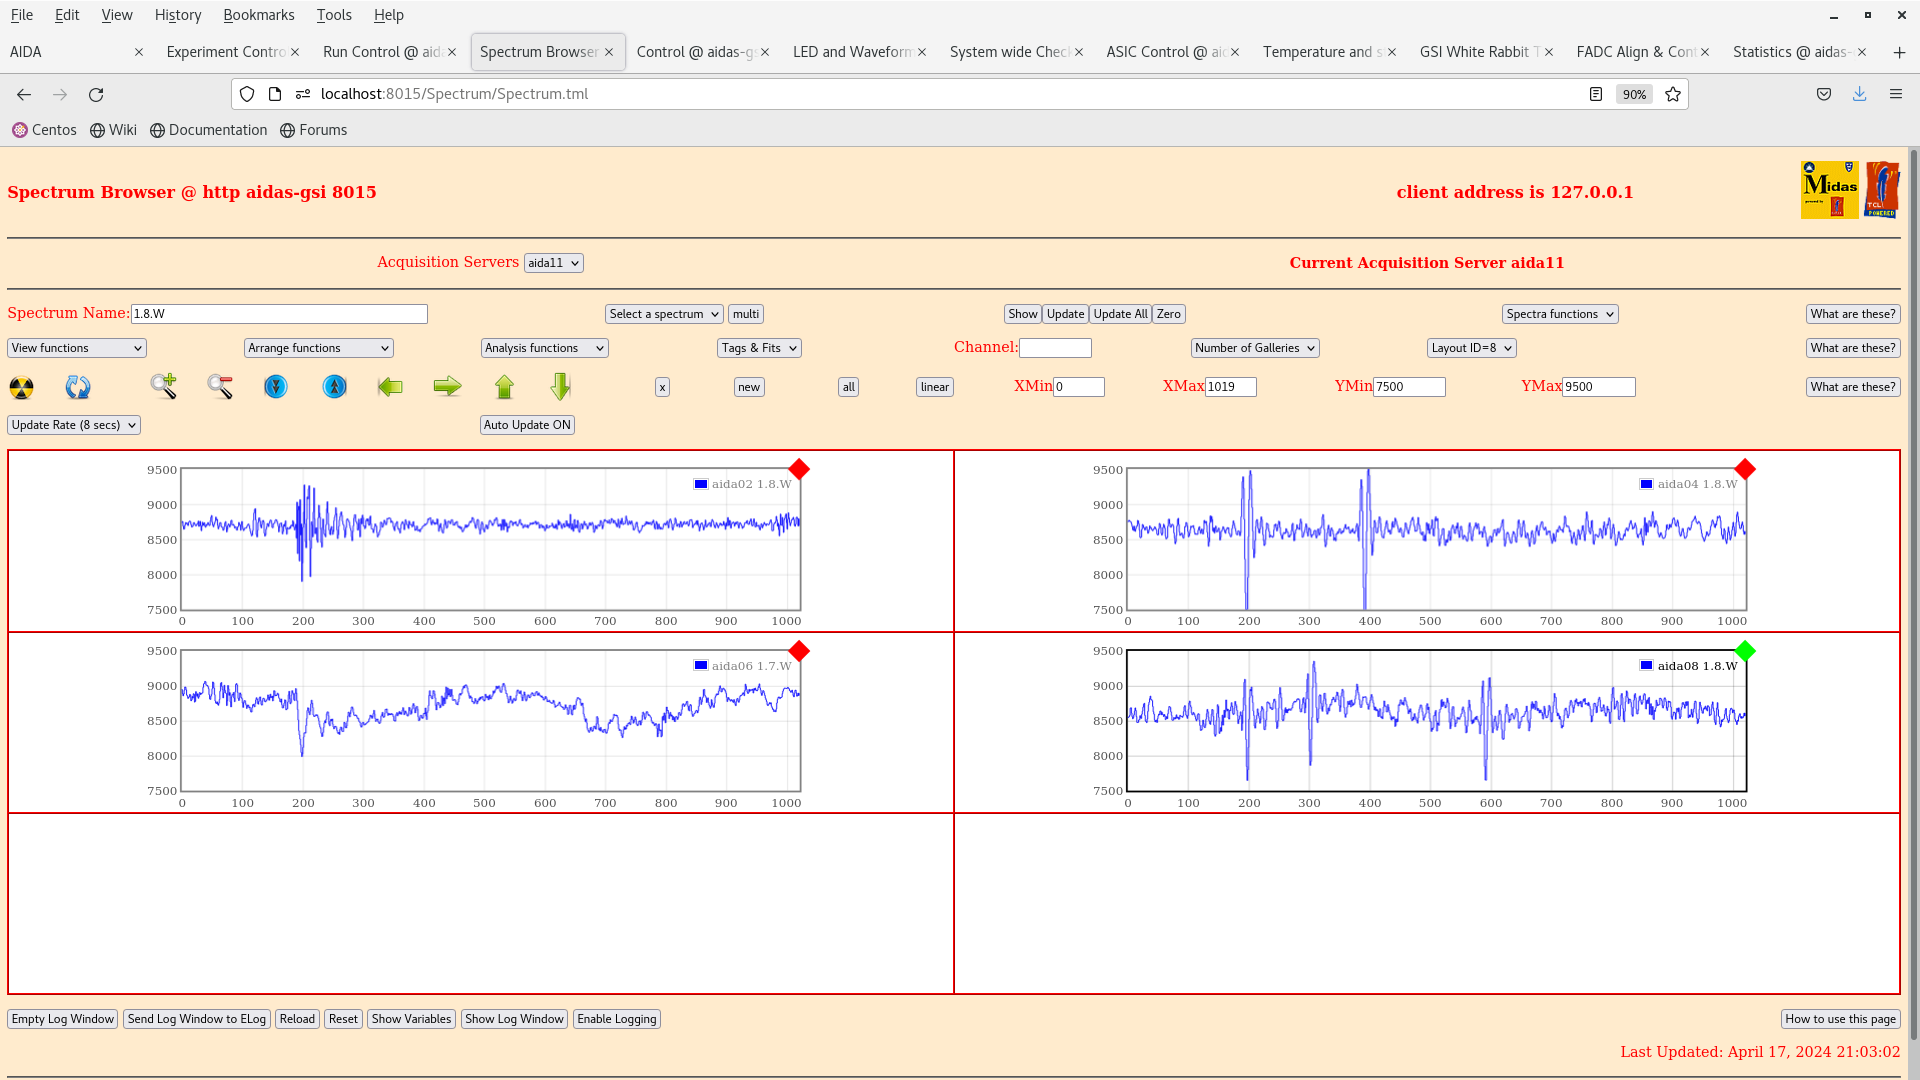
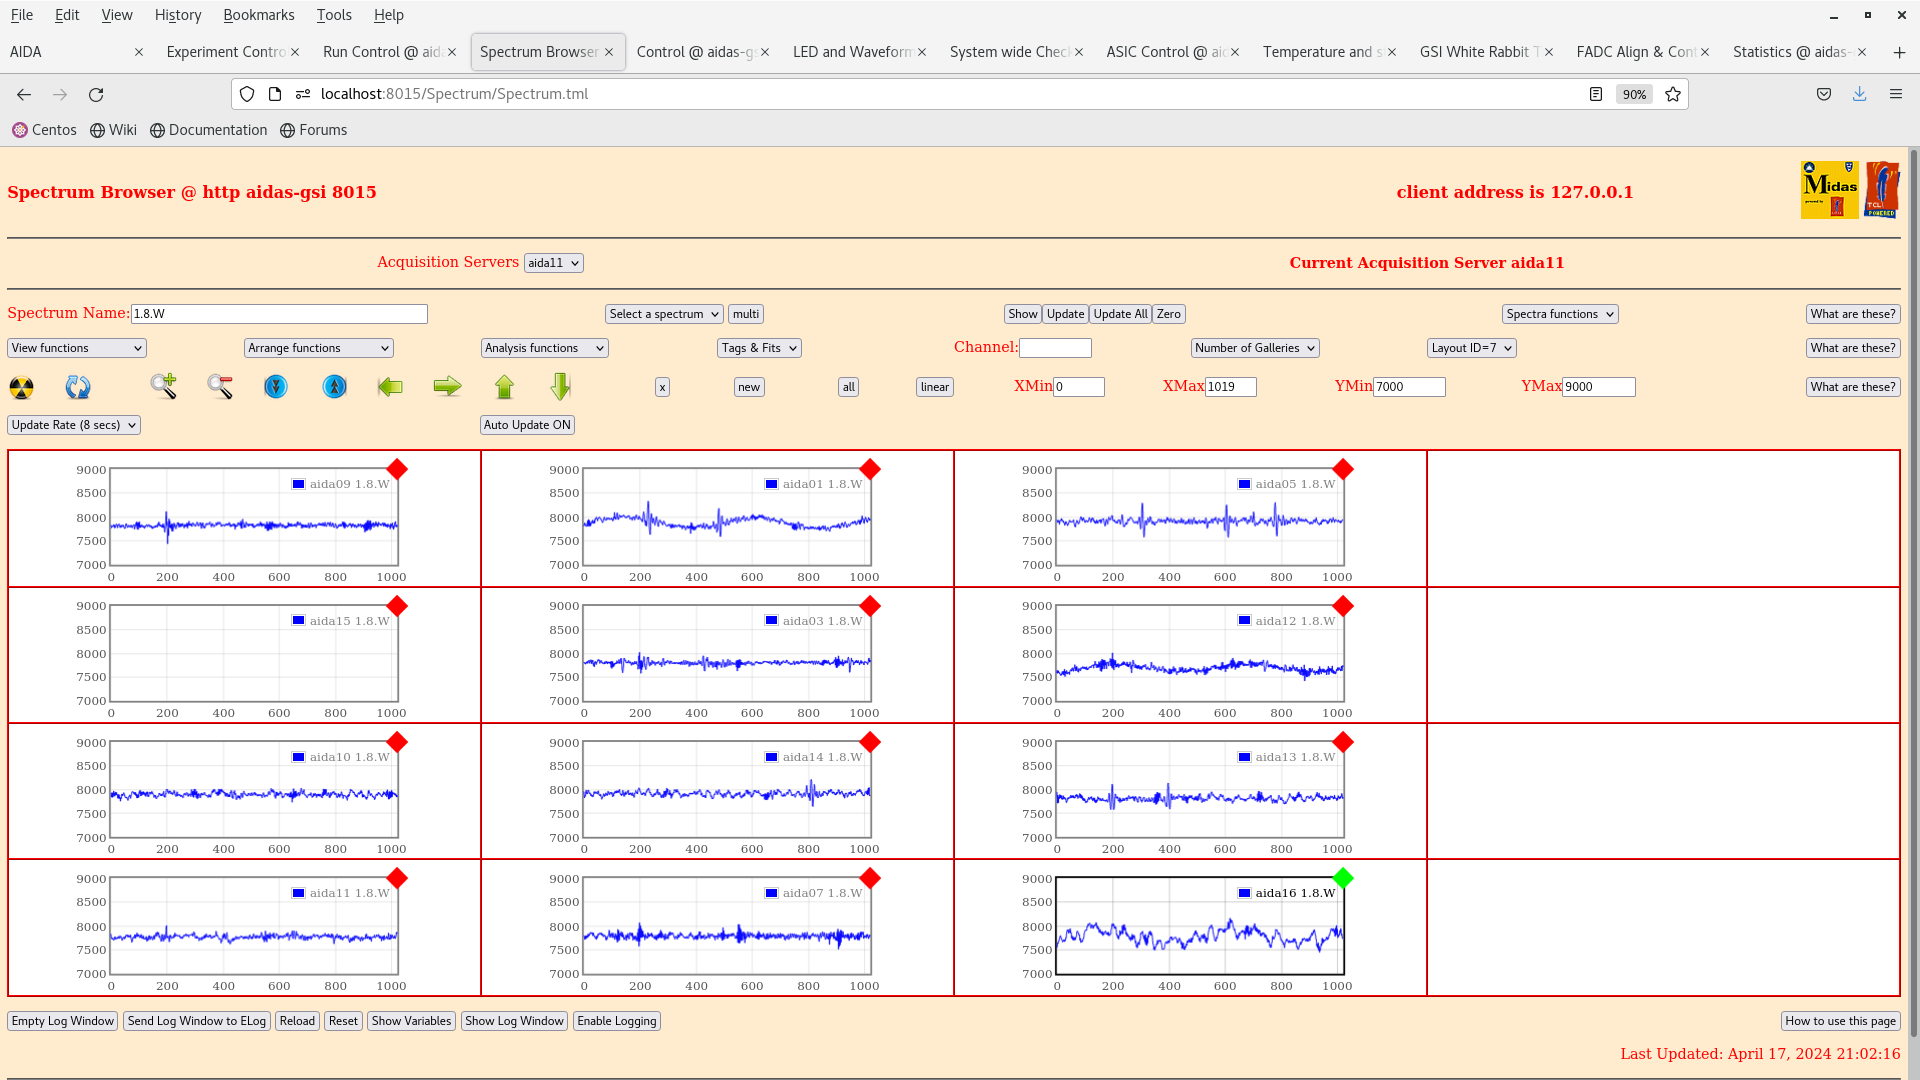
      per 1.8.W spectra - 20us FSR - attachments 36-37

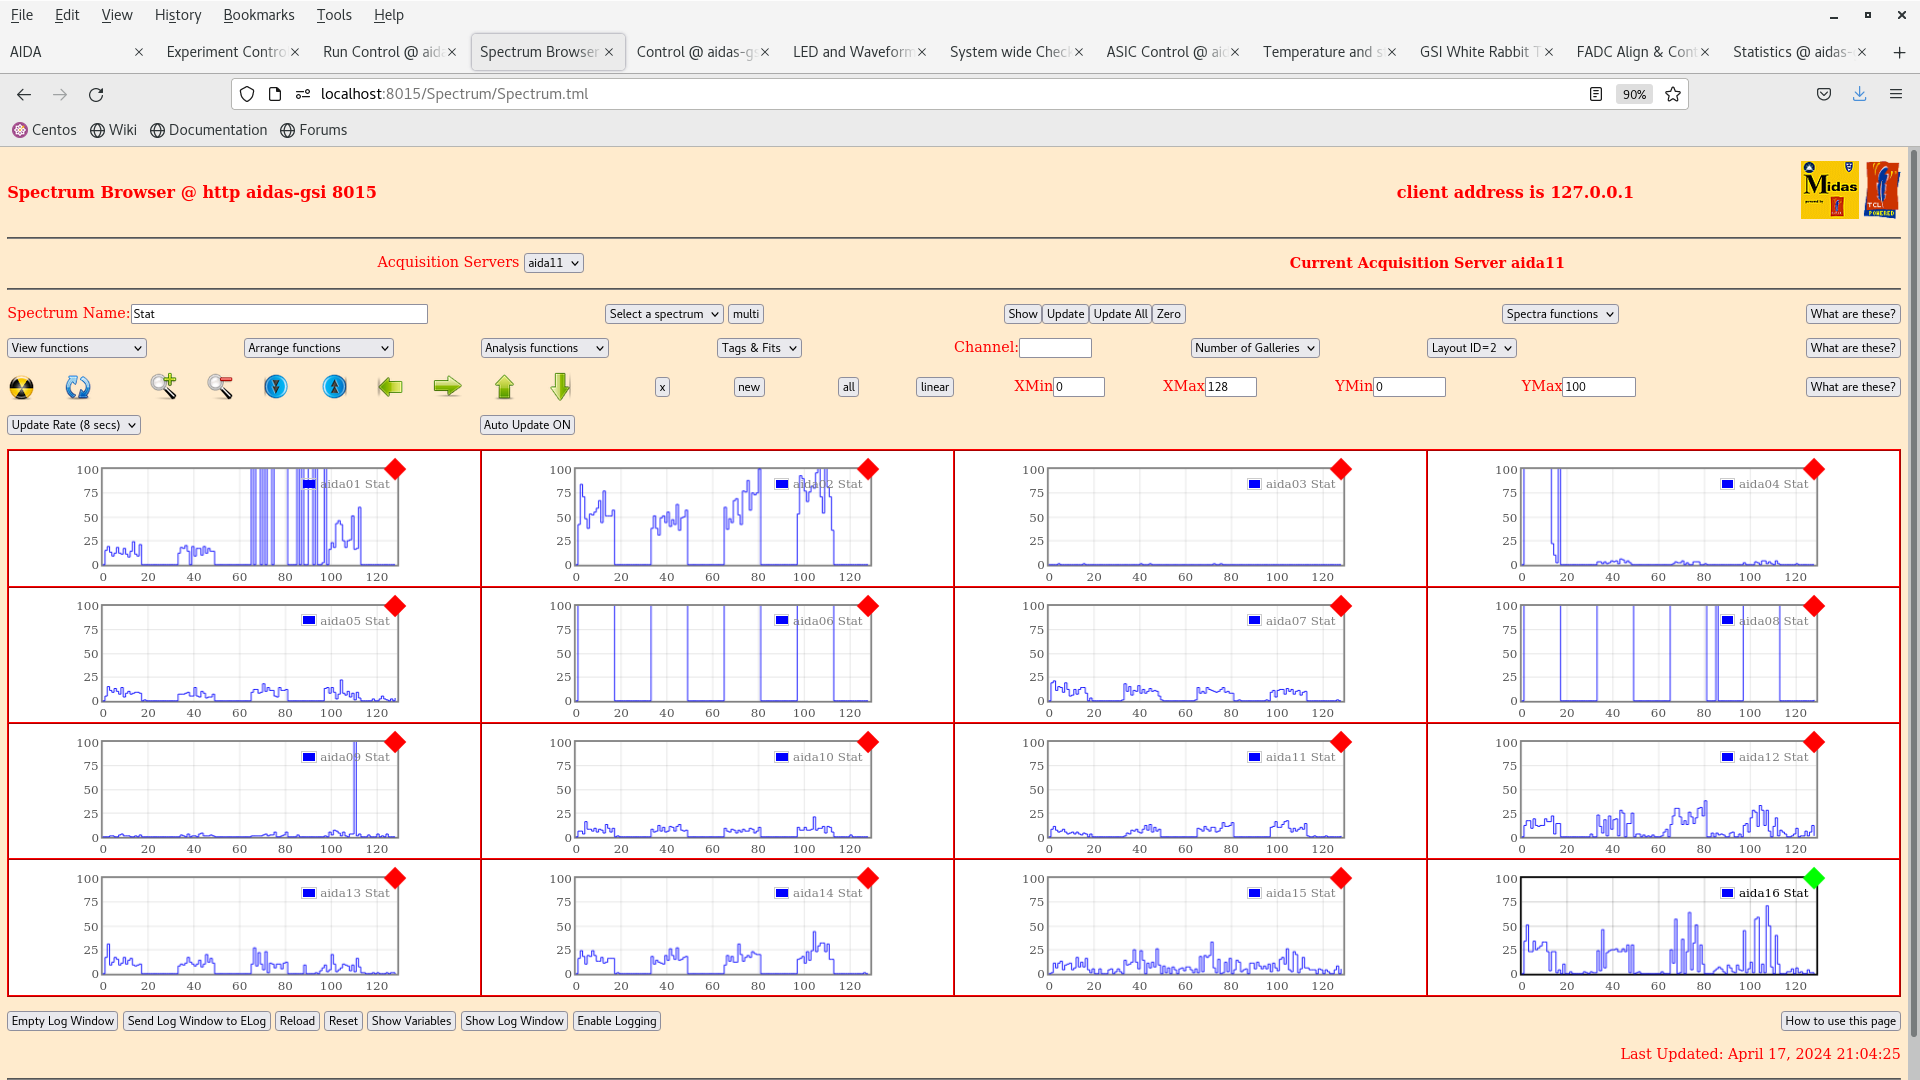
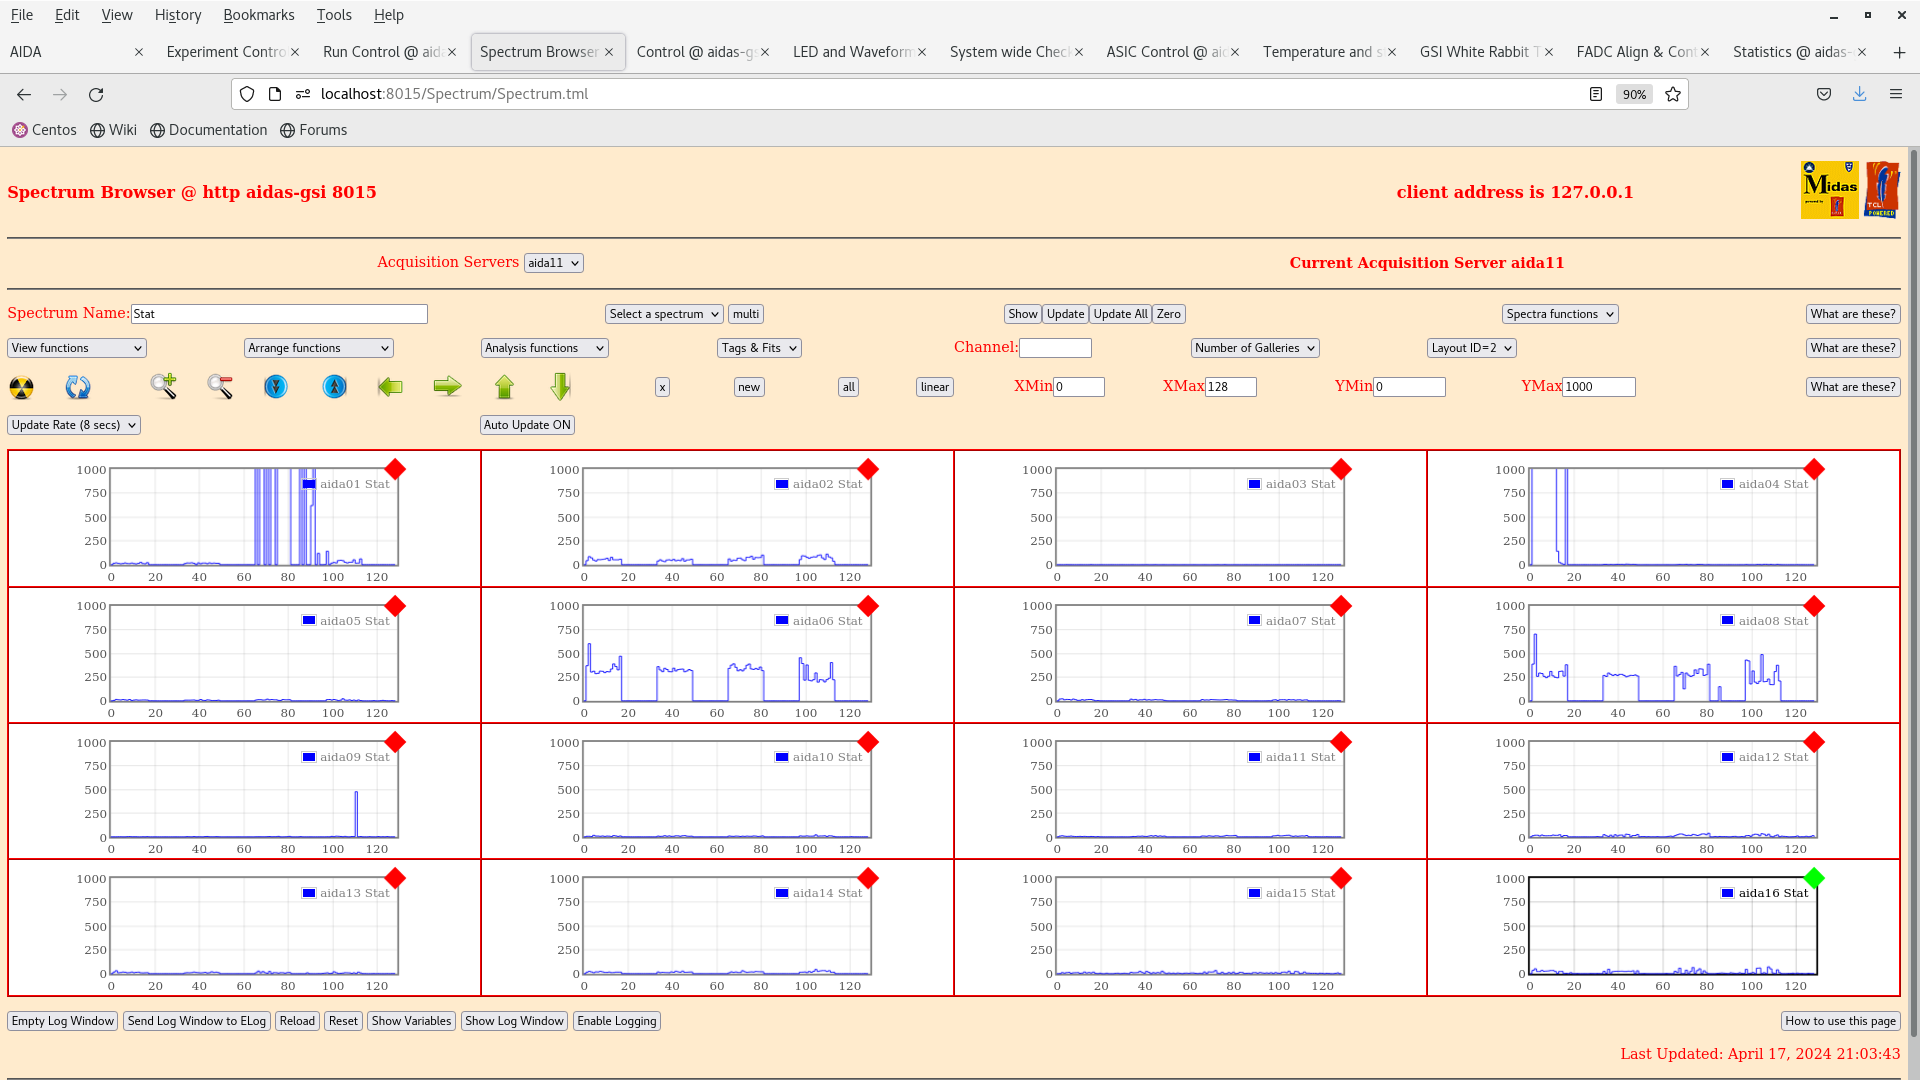
      per FEE64 Rate spectra - attachments 34-35

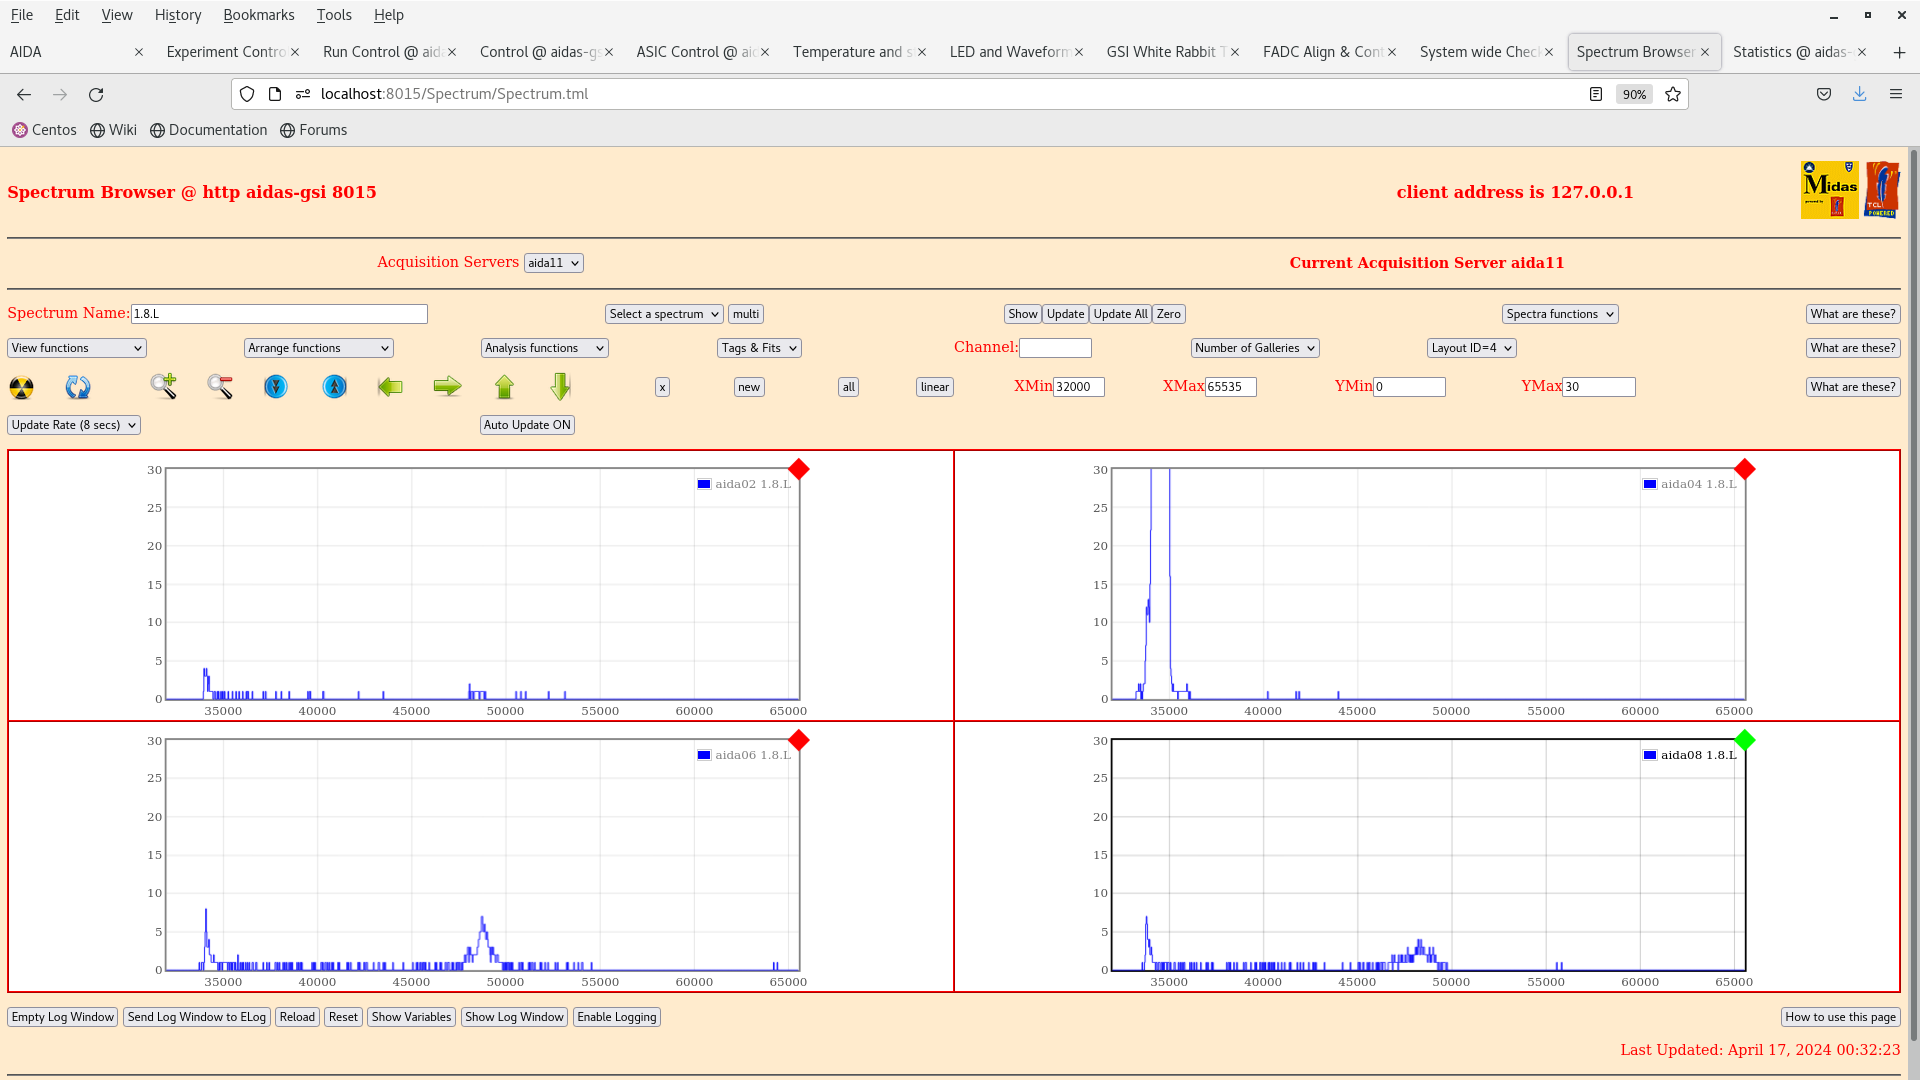
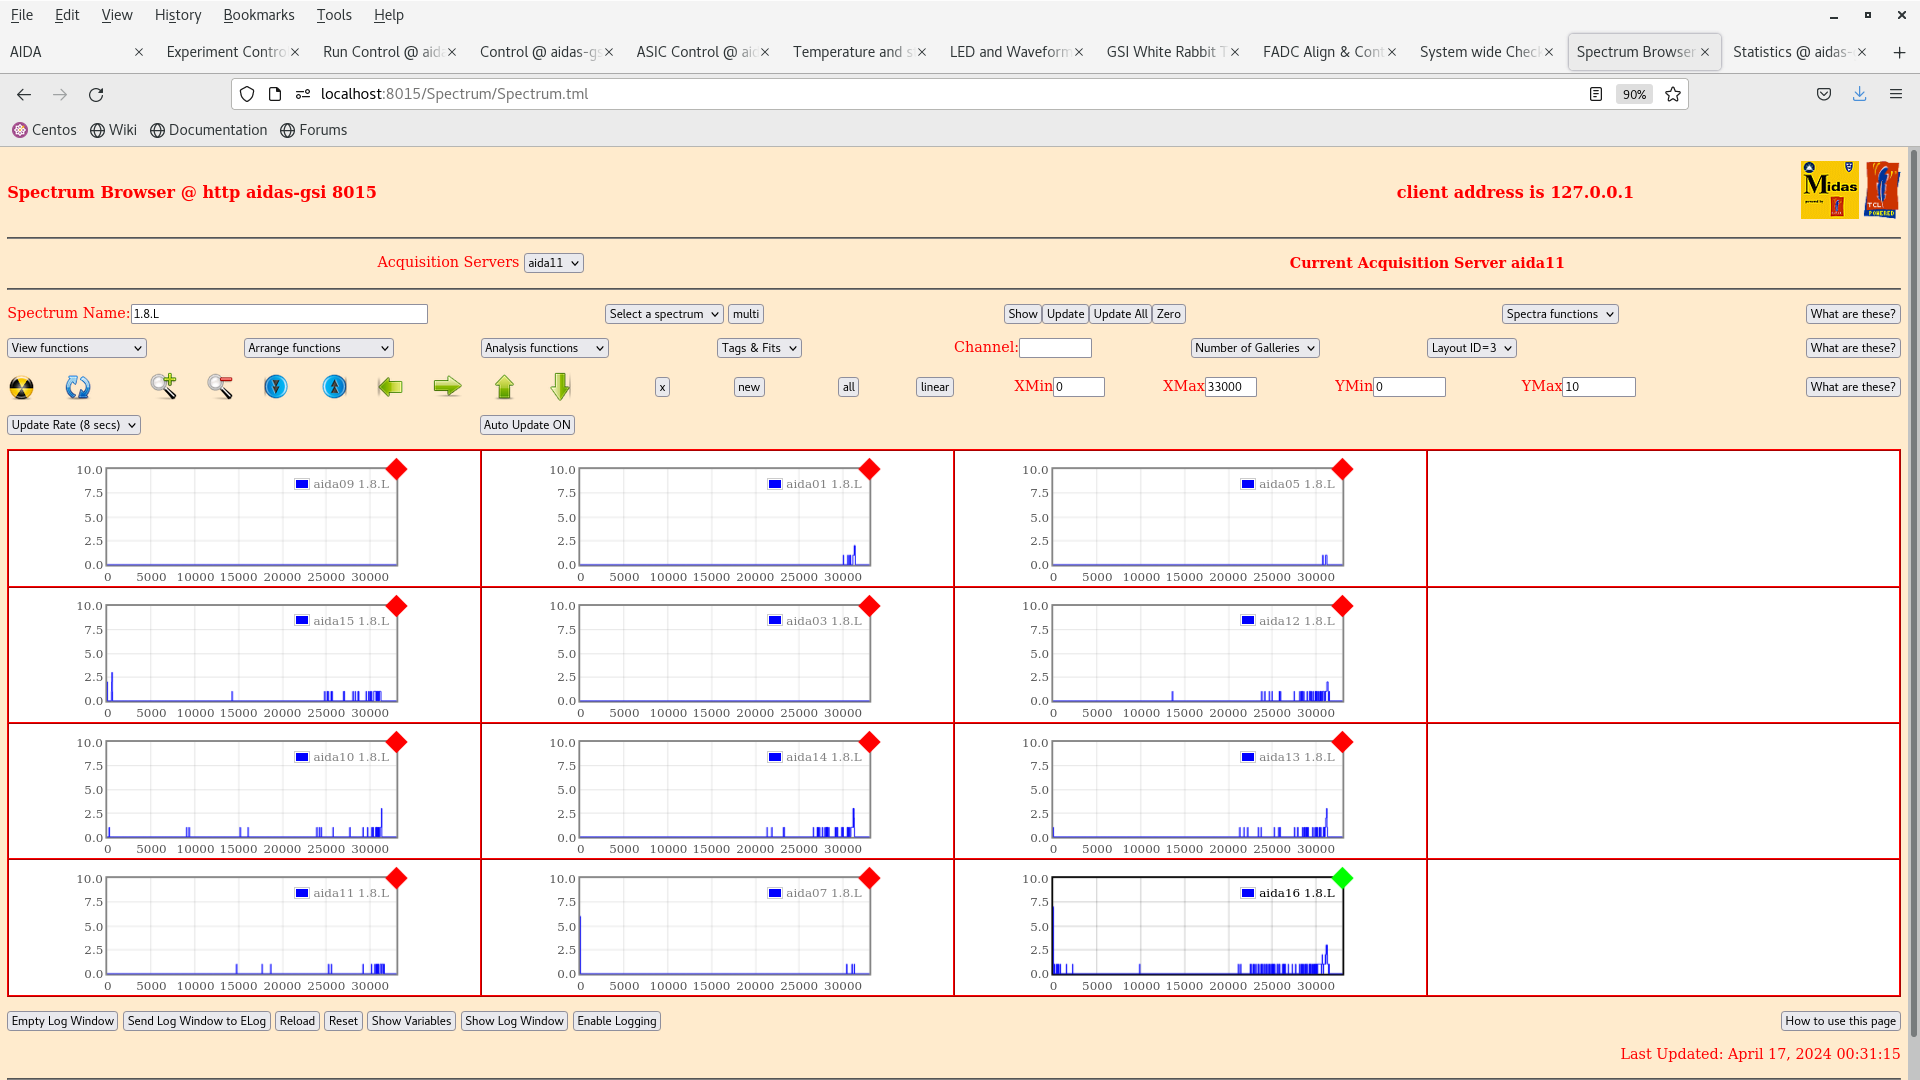
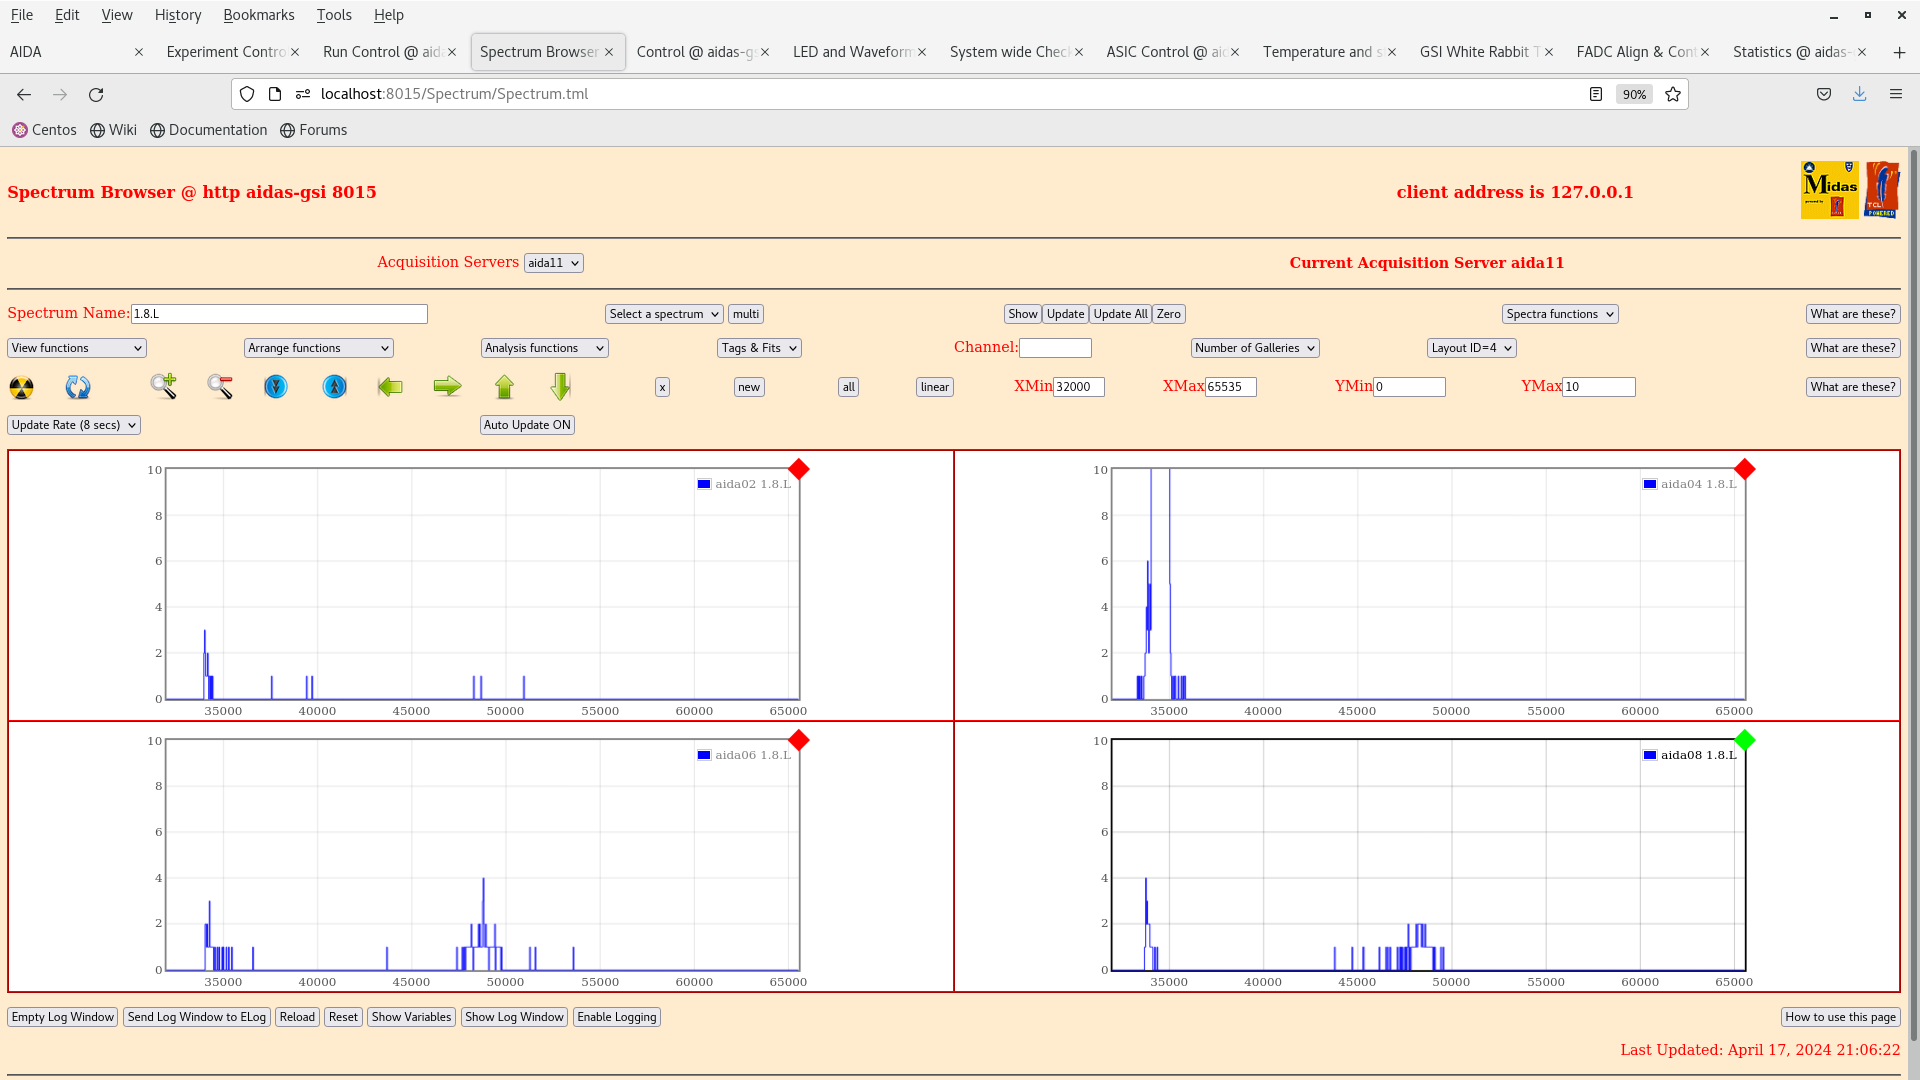
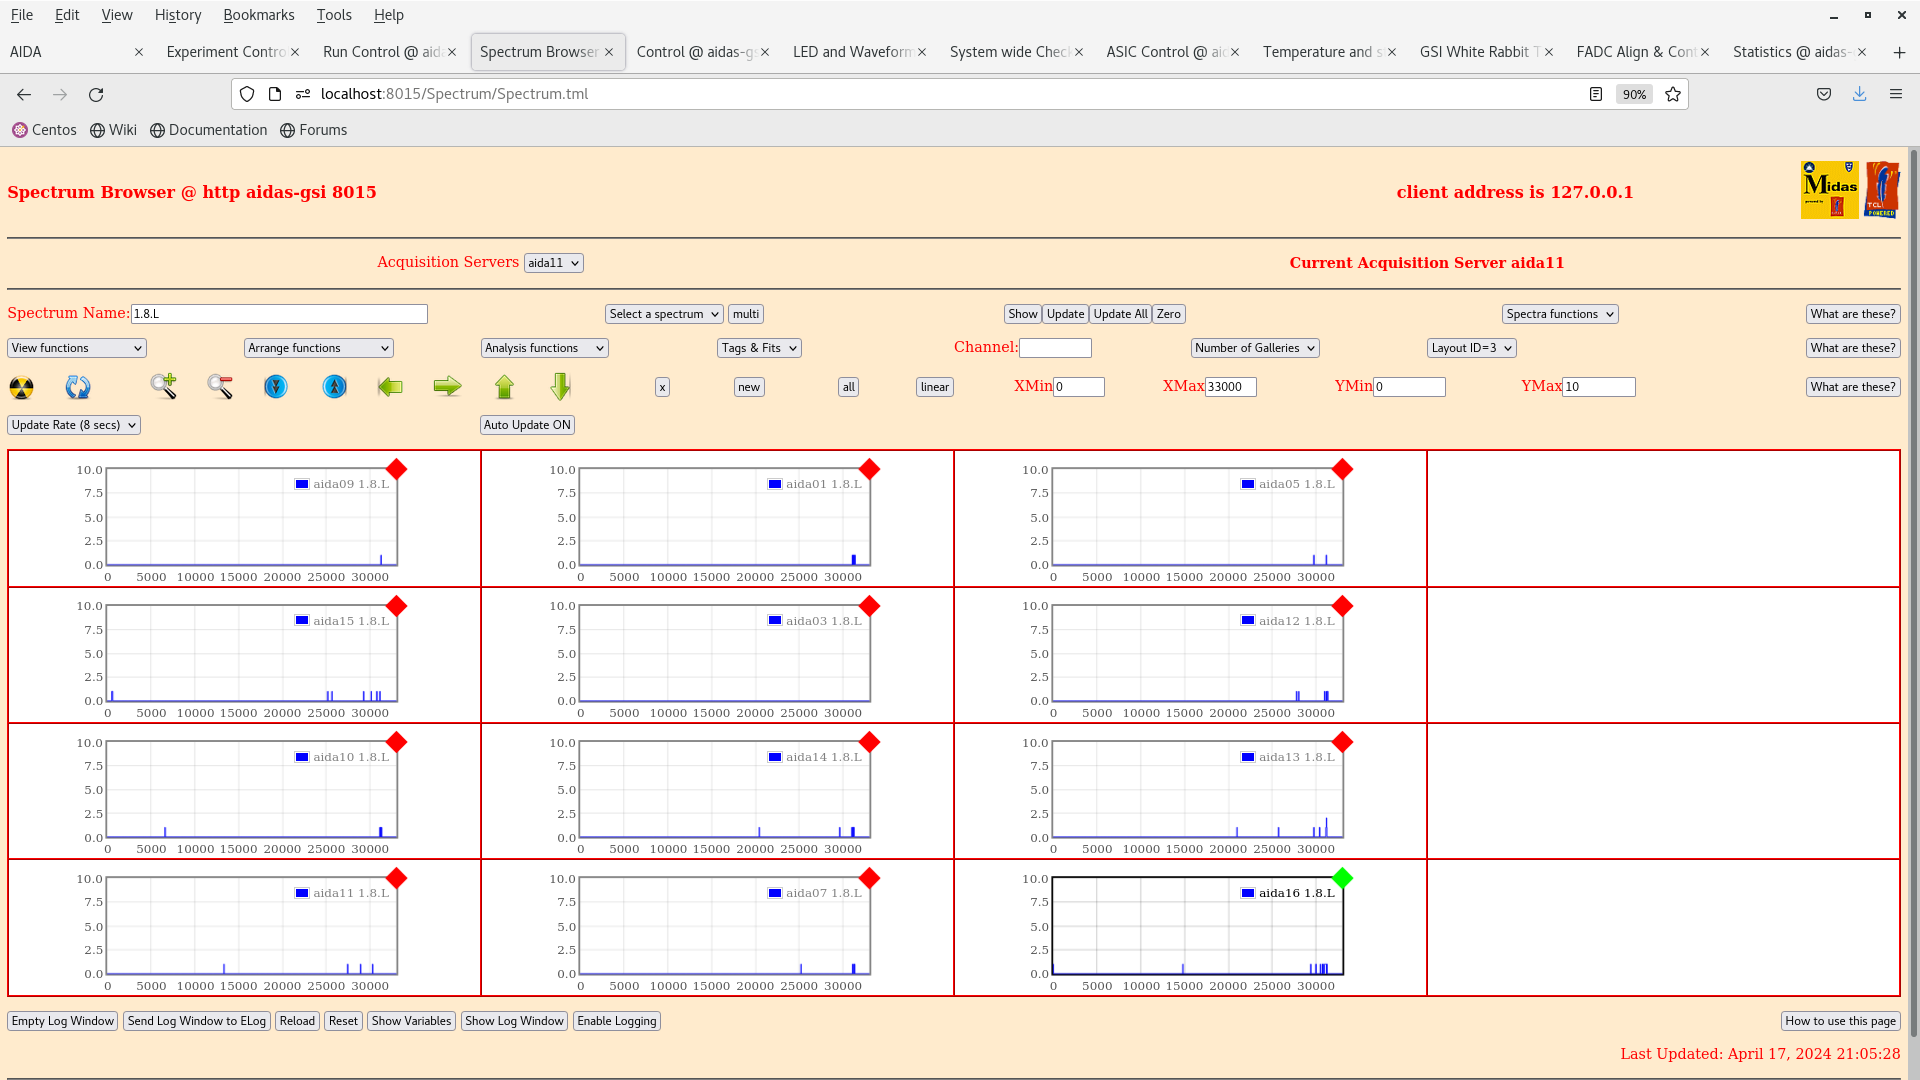
per FEE64 1.8.L spectra - attachments 32-33 |
| Attachment 1: Screenshot_from_2024-04-17_00-35-53.png
|
|
| Attachment 2: Screenshot_from_2024-04-17_00-34-46.png
|
|
| Attachment 3: Screenshot_from_2024-04-17_00-33-46.png
|
|
| Attachment 4: Screenshot_from_2024-04-17_00-32-53.png
|
|
| Attachment 5: Screenshot_from_2024-04-17_00-31-43.png
|
|
| Attachment 6: Screenshot_from_2024-04-17_00-30-24.png
|
|
| Attachment 7: Screenshot_from_2024-04-17_00-29-34.png
|

|
| Attachment 8: Screenshot_from_2024-04-17_00-28-43.png
|

|
| Attachment 9: Screenshot_from_2024-04-17_00-27-54.png
|

|
| Attachment 10: Screenshot_from_2024-04-17_00-27-31.png
|
|
| Attachment 11: Screenshot_from_2024-04-17_00-27-05.png
|
|
| Attachment 12: Screenshot_from_2024-04-17_00-26-32.png
|
|
| Attachment 13: Screenshot_from_2024-04-17_00-25-51.png
|
|
| Attachment 14: Screenshot_from_2024-04-17_01-05-47.png
|

|
| Attachment 15: Screenshot_from_2024-04-17_01-05-09.png
|
|
| Attachment 16: Screenshot_from_2024-04-17_01-01-20.png
|
|
| Attachment 17: Screenshot_from_2024-04-17_01-00-33.png
|

|
| Attachment 18: Screenshot_from_2024-04-17_18-00-08.png
|

|
| Attachment 19: Screenshot_from_2024-04-17_17-59-42.png
|

|
| Attachment 20: Screenshot_from_2024-04-17_17-58-30.png
|
|
| Attachment 21: Screenshot_from_2024-04-17_17-57-46.png
|

|
| Attachment 22: Screenshot_from_2024-04-17_17-57-12.png
|

|
| Attachment 23: Screenshot_from_2024-04-17_17-56-27.png
|
|
| Attachment 24: Screenshot_from_2024-04-17_17-55-54.png
|

|
| Attachment 25: Screenshot_from_2024-04-17_17-55-33.png
|
|
| Attachment 26: Screenshot_from_2024-04-17_17-54-35.png
|
|
| Attachment 27: Screenshot_from_2024-04-17_17-54-04.png
|
|
| Attachment 28: Screenshot_from_2024-04-17_18-23-26.png
|

|
| Attachment 29: Screenshot_from_2024-04-17_18-22-42.png
|
|
| Attachment 30: Screenshot_from_2024-04-17_18-25-37.png
|
|
| Attachment 31: Screenshot_from_2024-04-17_18-25-08.png
|

|
| Attachment 32: Screenshot_from_2024-04-17_21-06-56.png
|
|
| Attachment 33: Screenshot_from_2024-04-17_21-05-45.png
|
|
| Attachment 34: Screenshot_from_2024-04-17_21-04-52.png
|
|
| Attachment 35: Screenshot_from_2024-04-17_21-04-17.png
|
|
| Attachment 36: Screenshot_from_2024-04-17_21-03-15.png
|
|
| Attachment 37: Screenshot_from_2024-04-17_21-02-29.png
|
|
| Attachment 38: Screenshot_from_2024-04-17_21-01-57.png
|
|
| Attachment 39: Screenshot_from_2024-04-17_21-01-32.png
|

|
| Attachment 40: Screenshot_from_2024-04-17_21-00-34.png
|

|
| Attachment 41: Screenshot_from_2024-04-17_20-59-40.png
|

|
| Attachment 42: Screenshot_from_2024-04-17_20-59-16.png
|

|
| Attachment 43: Screenshot_from_2024-04-17_20-58-54.png
|
|
| Attachment 44: Screenshot_from_2024-04-17_20-58-02.png
|
|
|
370
|
Wed Jun 16 18:05:03 2021 |
TD | Wednesday 16 June |
19.04 All system wide checks OK *except*

		 Base 		Current 	Difference
aida01 fault 	 0x8944 : 	 0x8960 : 	 28
aida02 fault 	 0x9b36 : 	 0x9b52 : 	 28
aida03 fault 	 0xf26b : 	 0xf287 : 	 28
aida04 fault 	 0x57a0 : 	 0x57bc : 	 28
aida05 fault 	 0x4d3c : 	 0x4d55 : 	 25
aida05 : WR status 0x10
 aida06 fault 	 0x640c : 	 0x6425 : 	 25
aida07 fault 	 0x255e : 	 0x2577 : 	 25
aida08 fault 	 0xffbd : 	 0xffd6 : 	 25
aida09 fault 	 0x87e : 	 0x895 : 	 23
aida10 fault 	 0xc557 : 	 0xc56e : 	 23
aida11 fault 	 0x683e : 	 0x6855 : 	 23
aida12 fault 	 0x1c35 : 	 0x1c4c : 	 23
aida13 fault 	 0x8f41 : 	 0x8f58 : 	 23
aida14 fault 	 0x1b47 : 	 0x1b5e : 	 23
aida15 fault 	 0x4e4 : 	 0x127e : 	 3482
aida16 fault 	 0xf570 : 	 0xf587 : 	 23
White Rabbit error counter test result: Passed 0, Failed 16

			 Base 		Current 		Difference
aida01 fault 	 0x0 : 	 0x2 : 	 2
aida02 fault 	 0x0 : 	 0x2 : 	 2
aida05 fault 	 0x0 : 	 0x2 : 	 2
aida06 fault 	 0x0 : 	 0x2 : 	 2
aida09 fault 	 0x0 : 	 0x2 : 	 2
aida10 fault 	 0x0 : 	 0x2 : 	 2
aida11 fault 	 0x0 : 	 0x2 : 	 2
aida12 fault 	 0x0 : 	 0x3e03 : 	 15875
aida13 fault 	 0x0 : 	 0x32d4 : 	 13012
aida14 fault 	 0x0 : 	 0x2 : 	 2
aida15 fault 	 0x0 : 	 0x2 : 	 2
aida16 fault 	 0x0 : 	 0x2 : 	 2
FPGA Timestamp error counter test result: Passed 4, Failed 12
If any of these counts are reported as in error
The ASIC readout system has detected a timeslip.
That is the timestamp read from the time FIFO is not younger than the last

Returned 0 0 0 0 0 0 0 0 0 0 0 0 0 0 0 0
Mem(KB) :	4	8	16	32	64	128	256	512	1k	2k	4k
aida01 :     53     10      4      4      4      4      2      2      3      3      6   : 36580
aida02 :     28      7     10      4      3      4      3      2      2      4      6   : 37768
aida03 :     41     10      7      6      5      3      1      3      3      3      6   : 36836
aida04 :     45      7      2      4      3      4      2      3      3      3      6   : 36940
aida05 :     35      8      8      4      4      4      2      2      2      4      6   : 37580
aida06 :     45      6      6      3      3      3      2      3      4      3      6   : 37860
aida07 :     37     10      6      4      5      2      3      2      2      4      6   : 37636
aida08 :     32      5     10      4      4      4      3      2      2      4      6   : 37832
aida09 :     24      5      8      7      1      3      3      2      2      4      6   : 37544
aida10 :     29      9     12      5      4      3      3      3      3      3      6   : 37276
aida11 :     33      7      7      6      3      4      3      3      1      4      6   : 37292
aida12 :     36     11      6      6      3      4      3      3      1      4      6   : 37320
aida13 :     37      7      6      6      5      3      3      3      1      4      6   : 37292
aida14 :     25      9      7      6      5      3      3      3      3      3      6   : 37276
aida15 :      3      3      4      3      0      3      3      2      1      4      7   : 40260
aida16 :     35      7      6      6      4      4      3      3      1      4      6   : 37348

Collecting the file size of each FEE64 Options CONTENTS file to check they are all the same

 FEE : aida01 =>   Options file size is 1026 	 Last changed Sat Jun 12 15:46:33 CEST 2021
 FEE : aida02 =>   Options file size is 1025 	 Last changed Sun May 23 00:19:21 CEST 2021
 FEE : aida03 =>   Options file size is 1014 	 Last changed Thu Apr 29 14:43:50 CEST 2021
 FEE : aida04 =>   Options file size is 1025 	 Last changed Fri May 14 16:54:56 CEST 2021
 FEE : aida05 =>   Options file size is 1025 	 Last changed Mon May 17 06:25:41 CEST 2021
 FEE : aida06 =>   Options file size is 1014 	 Last changed Thu Apr 29 14:43:59 CEST 2021
 FEE : aida07 =>   Options file size is 1014 	 Last changed Thu Apr 29 14:44:02 CEST 2021
 FEE : aida08 =>   Options file size is 1025 	 Last changed Sun May 23 00:16:54 CEST 2021
 FEE : aida09 =>   Options file size is 1014 	 Last changed Thu Apr 29 14:44:08 CEST 2021
 FEE : aida10 =>   Options file size is 1014 	 Last changed Thu Apr 29 14:44:57 CEST 2021
 FEE : aida11 =>   Options file size is 1014 	 Last changed Thu Apr 29 14:44:57 CEST 2021
 FEE : aida12 =>   Options file size is 1014 	 Last changed Thu Apr 29 14:44:57 CEST 2021
 FEE : aida13 =>   Options file size is 1025 	 Last changed Fri May 07 19:40:34 CEST 2021
 FEE : aida14 =>   Options file size is 1014 	 Last changed Thu Apr 29 14:44:57 CEST 2021
 FEE : aida15 =>   Options file size is 1025 	 Last changed Sat Jun 12 15:48:28 CEST 2021
 FEE : aida16 =>   Options file size is 1014 	 Last changed Thu Apr 29 14:44:57 CEST 2021

19.07 Hot HEC channels - ASIC check

      Grafana - DSSSD bias & leakage current - most recent 7 days - attachment 1
      Lost activity monitor - attachment 2
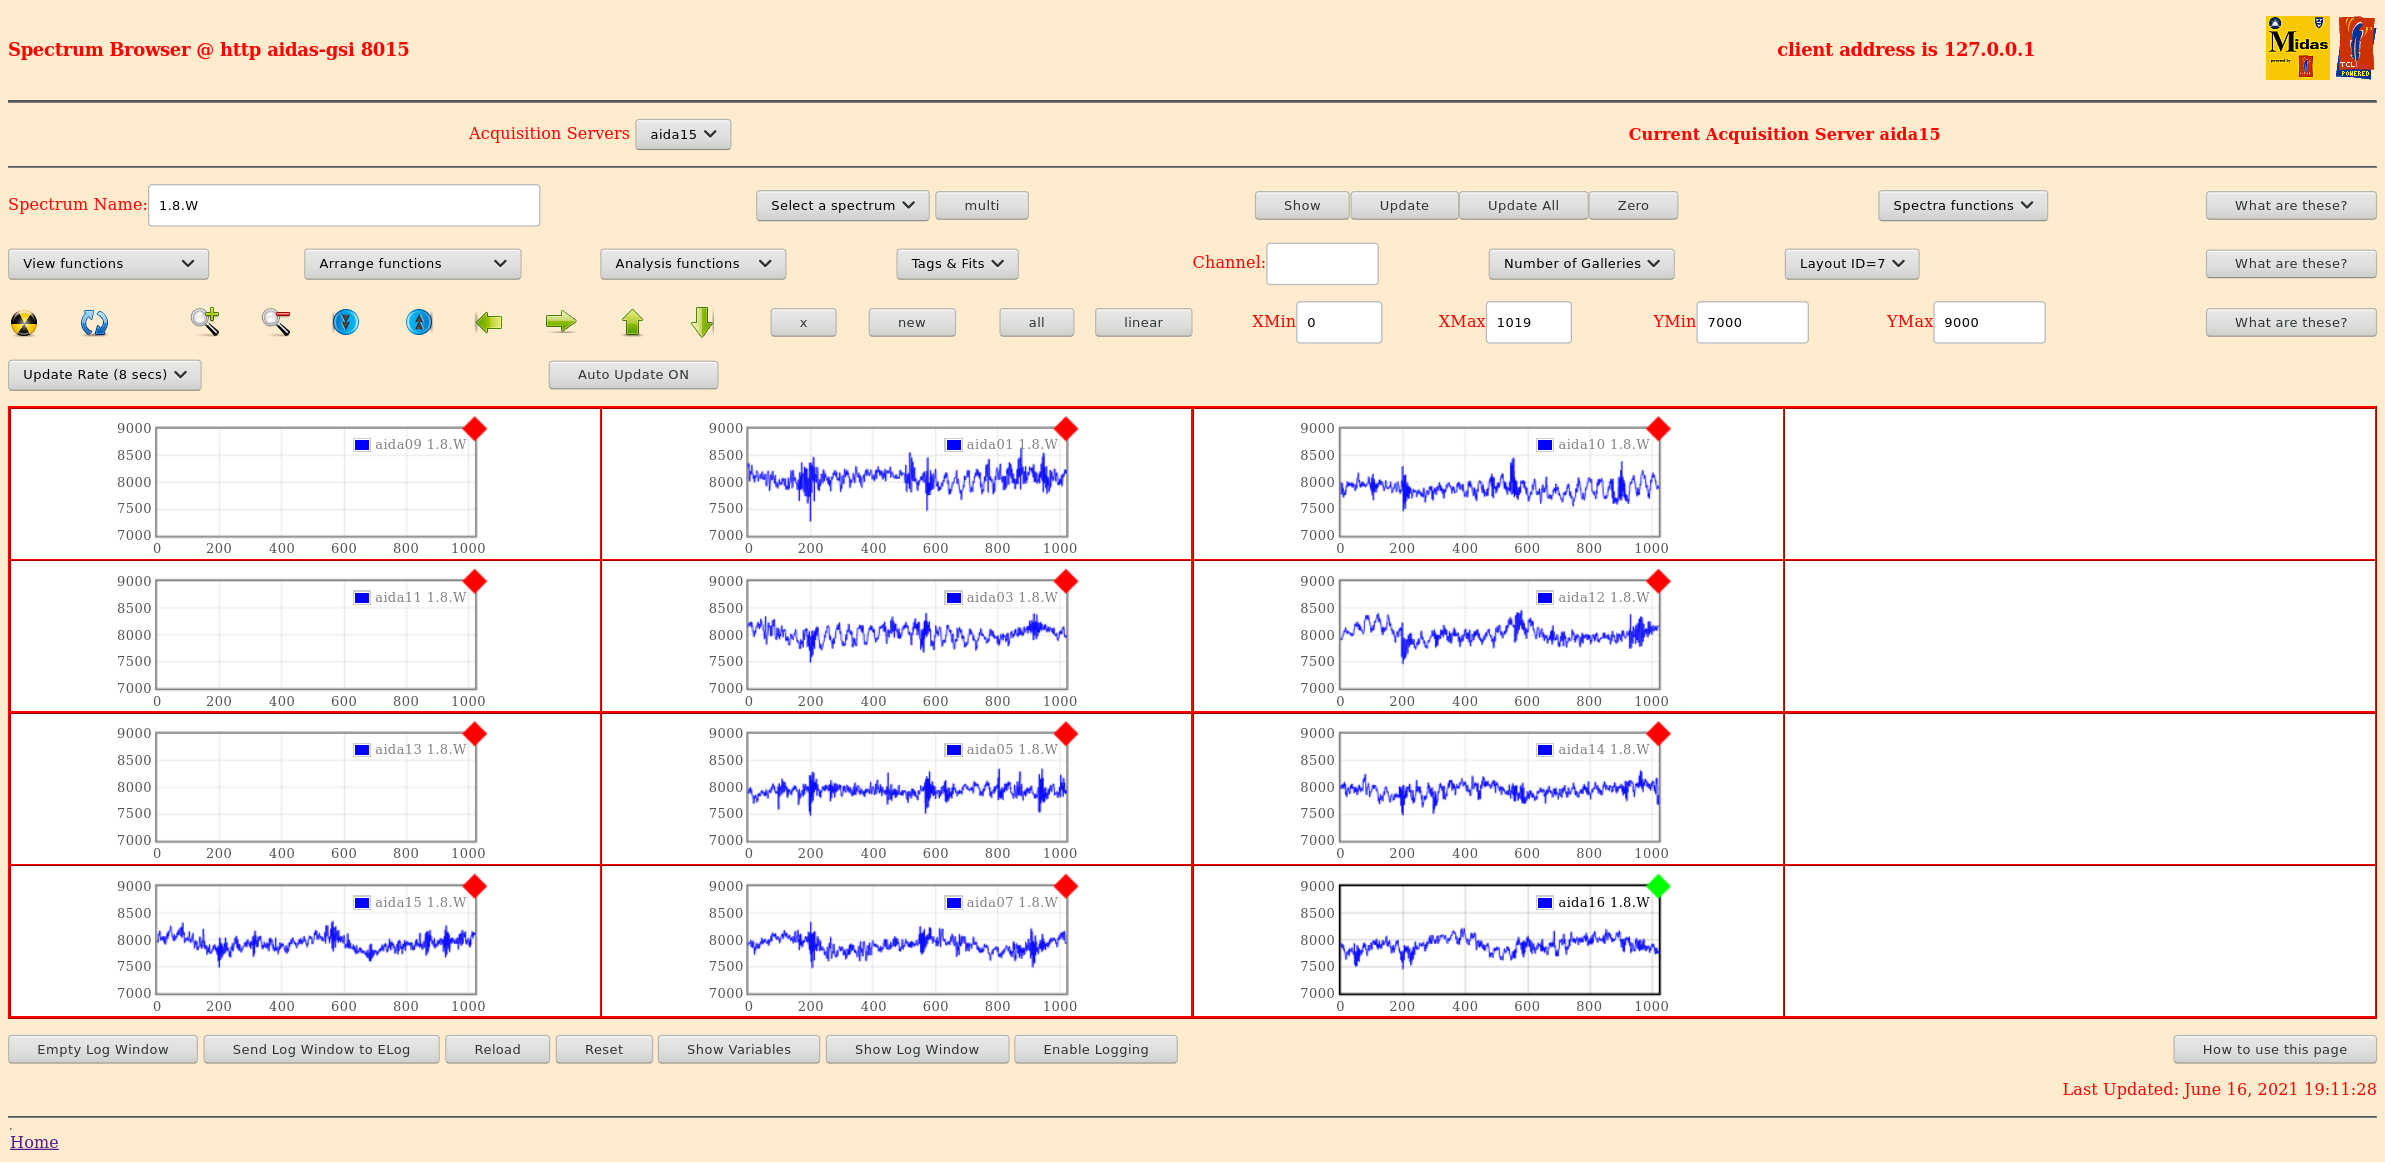
      1.8.W spectra - 20us FSR - attachments 3 & 4
      ADC data items - attachment 5
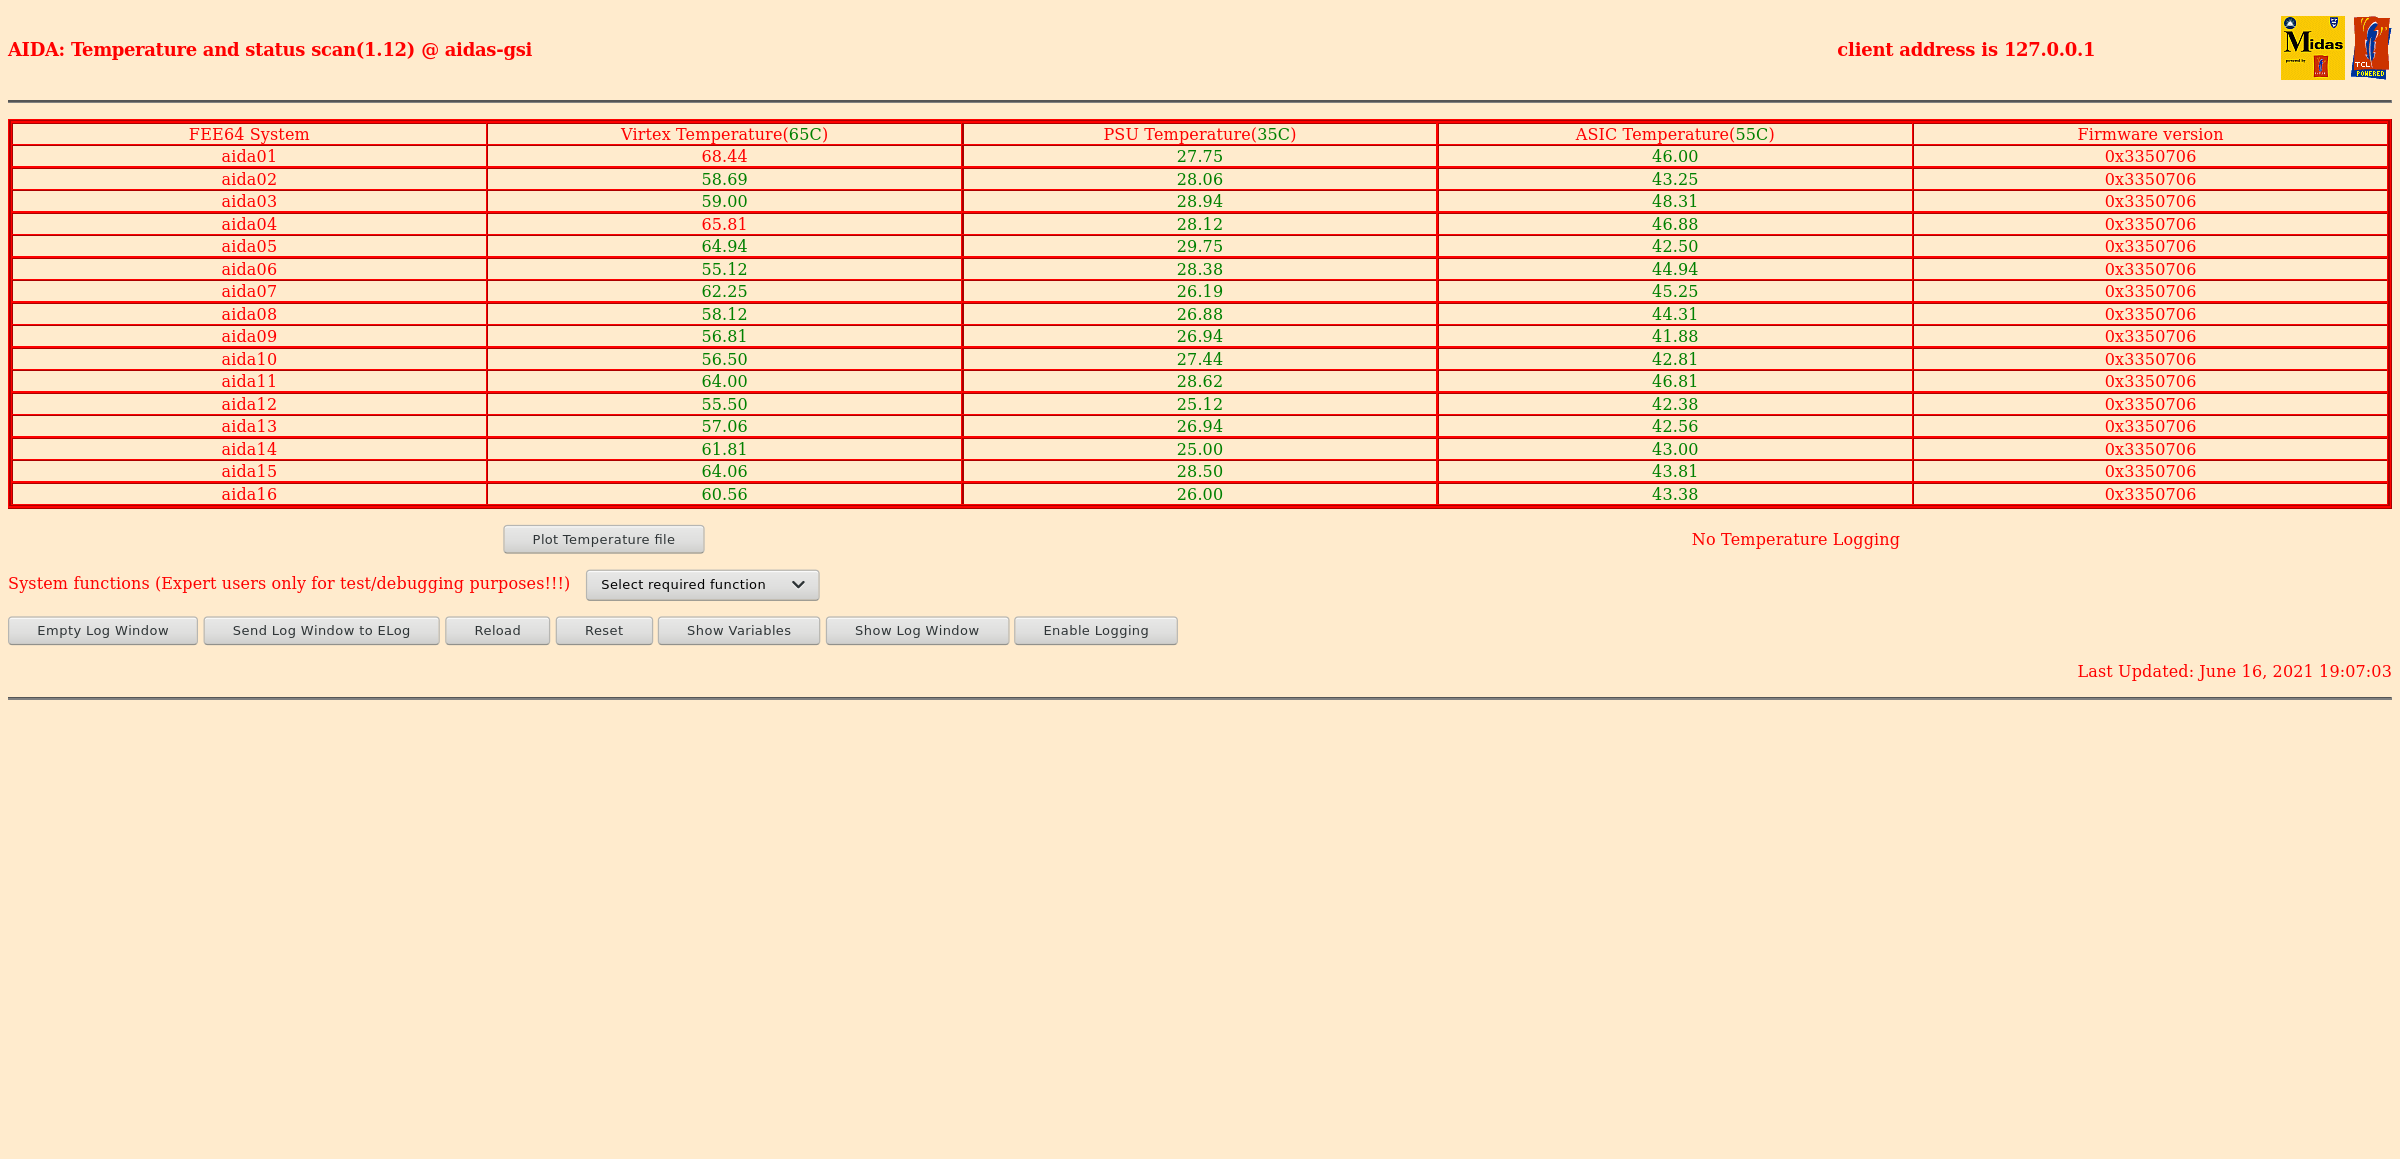
      FEE64 temperatures OK - attachment 6
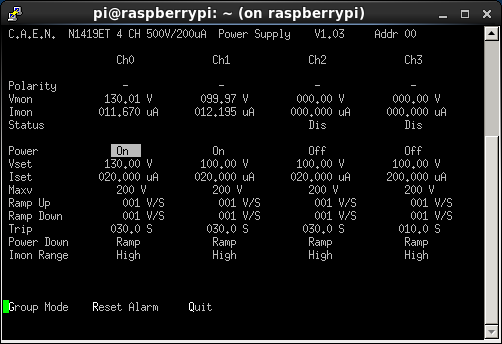
      DSSSD bias & leakage currents - attachment 7
       significant increases of leakage current to c. 12uA - temperature c. 30 deg C
      Merger/Tape Server/Merger statistics - attachment 8
no merger errors reported since previous restart |
| Attachment 1: Screenshot_2021-06-16_AIDA_Alerting_-_Grafana.png
|

|
| Attachment 2: Screenshot_2021-06-16_Spectrum_Browser_aidas-gsi(1).png
|
.png.png)
|
| Attachment 3: Screenshot_2021-06-16_Statistics_aidas-gsi(1).png
|
.png.png)
|
| Attachment 4: Screenshot_2021-06-16_Spectrum_Browser_aidas-gsi.png
|
|
| Attachment 5: Screenshot_2021-06-16_Temperature_and_status_scan_aidas-gsi.png
|
|
| Attachment 6: 1005.png
|

|
| Attachment 7: 1006.png
|
|
|
429
|
Wed May 11 19:08:41 2022 |
CB, PP | Wednesday 11th May - evening shift |
20:19 no beam yet.
Statistic check (screenshot attached).
Temperatures OK (screenshot attached).
Bias and leakage currents OK (same screenshot as temps).
All ADC failed calibration. Clock and white rabbit all passed.
22:12 no beam yet.
Statistic check (screenshot attached).
Temperatures OK (screenshot attached).
Bias and leakage currents OK (same screenshot as temps).
All ADC failed calibration. Clock and white rabbit all passed. |
| Attachment 1: 16.png
|

|
| Attachment 2: 22.png
|

|
| Attachment 3: 13.png
|

|
| Attachment 4: 14.png
|

|
|
428
|
Wed May 11 07:04:13 2022 |
OH, NH, TD | Wednesday 11th May |
08:00 Overnight at some point it appears that aida14 has stopped producing any ASIC data
      It is currently sending data pause requests and data push requests but nothing else - attachment 1
      telnet into aida14 and run top to see what the current state of the FEE is. AIDAExec currently using 0% CPU usage.
      FEE appears to have hung. - attachment 2
      Still passes all system wide checks.
      When performing a check load can see the tclsh process take up CPU usage

09:02 AIDA out of time sorter. Going to perform a power cycle to see if it recovers FEE14
      AIDA14 recovered but ASIC2 still missing

      Current working hypothesis is ASIC2 on AIDA14 is dead and that the problem with AIDA05 is either DSSD, cable or adaptor board.
      Given access would change the adapter board on AIDA05.
      Could consider installing the old AIDA05 FEE above AIDA14 and moving the cables up 1.
      Would retain the option of a speedybacktrack

      Alternatively the HEC events in AIDA05 are just above threshold. Can raise the HEC threshold
      A threshold of 0x4 reduced the rate in the HEC channels considerably
      A threshold of 0x6 removes entirely

      Note when the rate of HEC channels decreases can see the pulser in all channels of AIDA05 again. Showing that the adapter board is properly aligned

09:59 Had access so replaced the adapter card on AIDA05
      Did note that while replacing the card the right hand edge of the right hand ribbon cable was lifted slightly.
      This could also have been the cause


10:09 Restarted DAQ and there is no change to the behavior of AIDA05
      Still see events in HEC
      Again raising threshold to 0x5 in ASIC1 largely removes them.

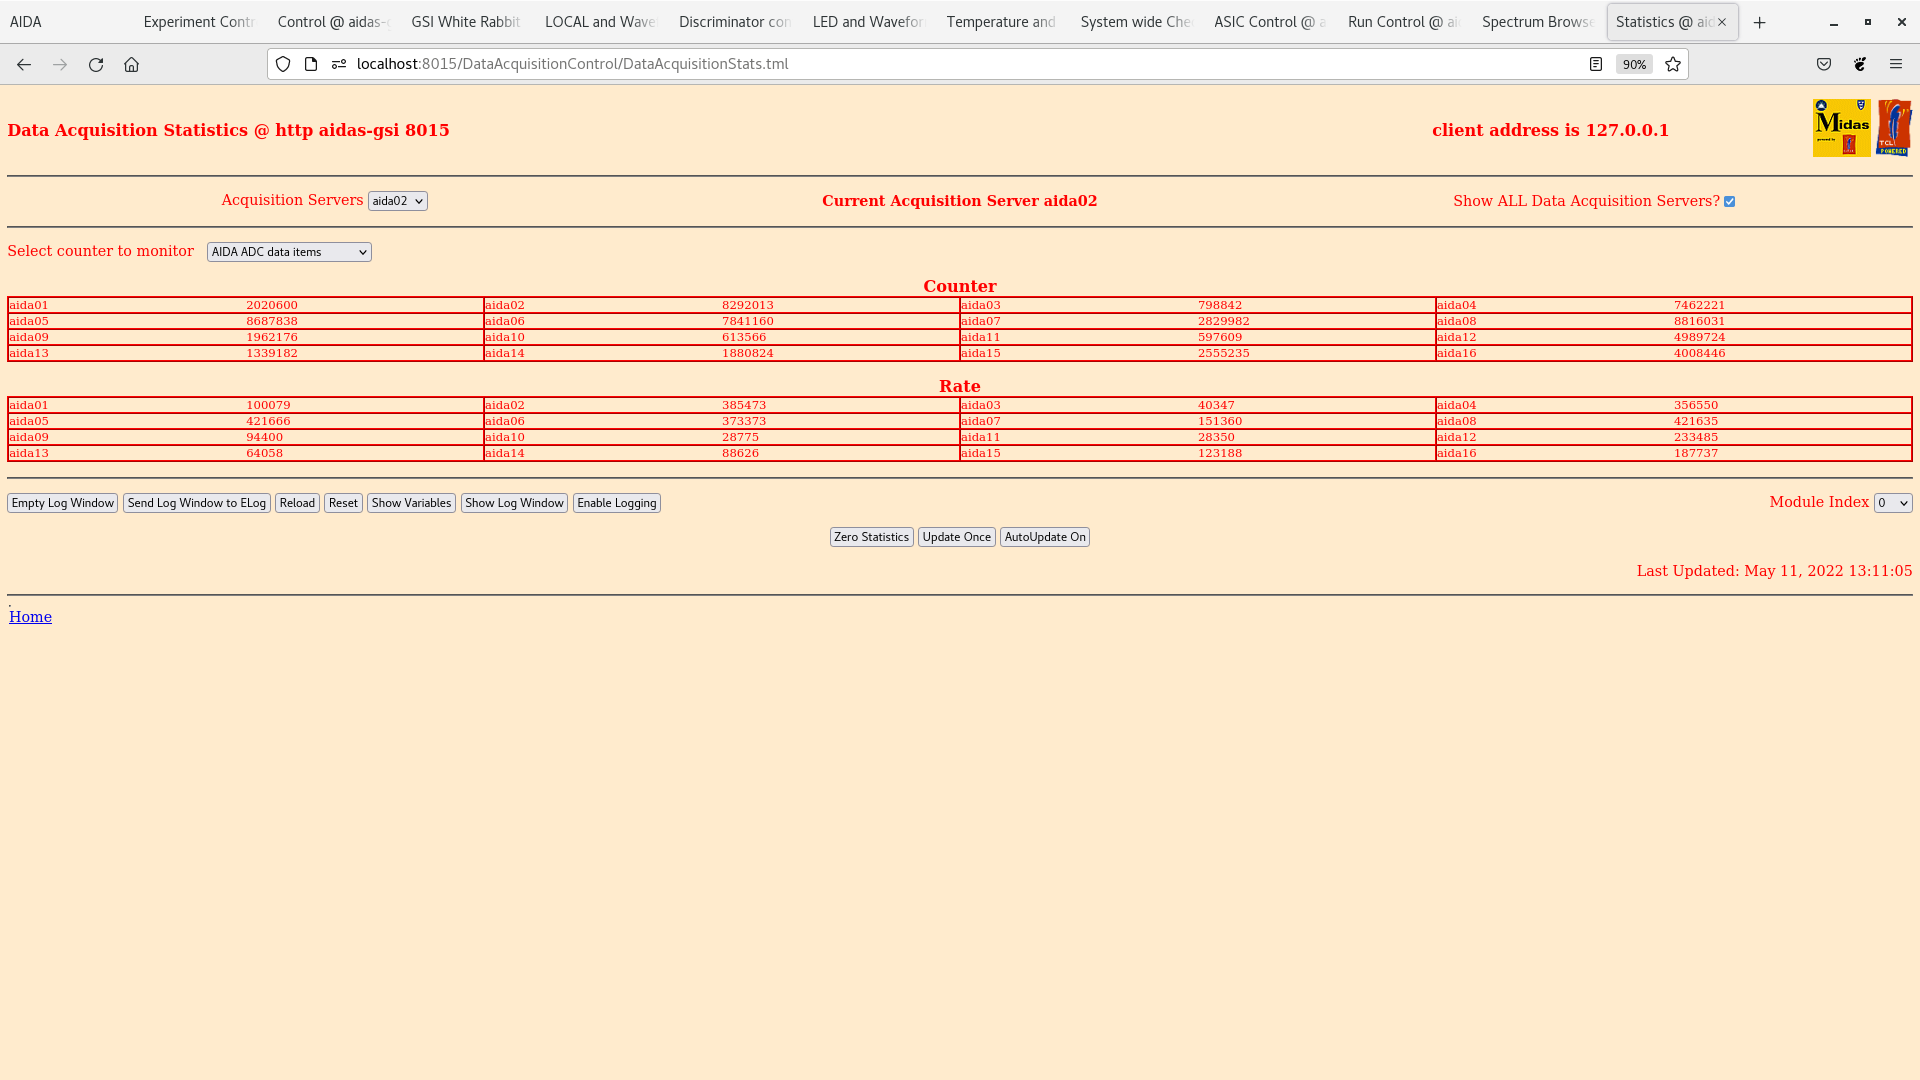
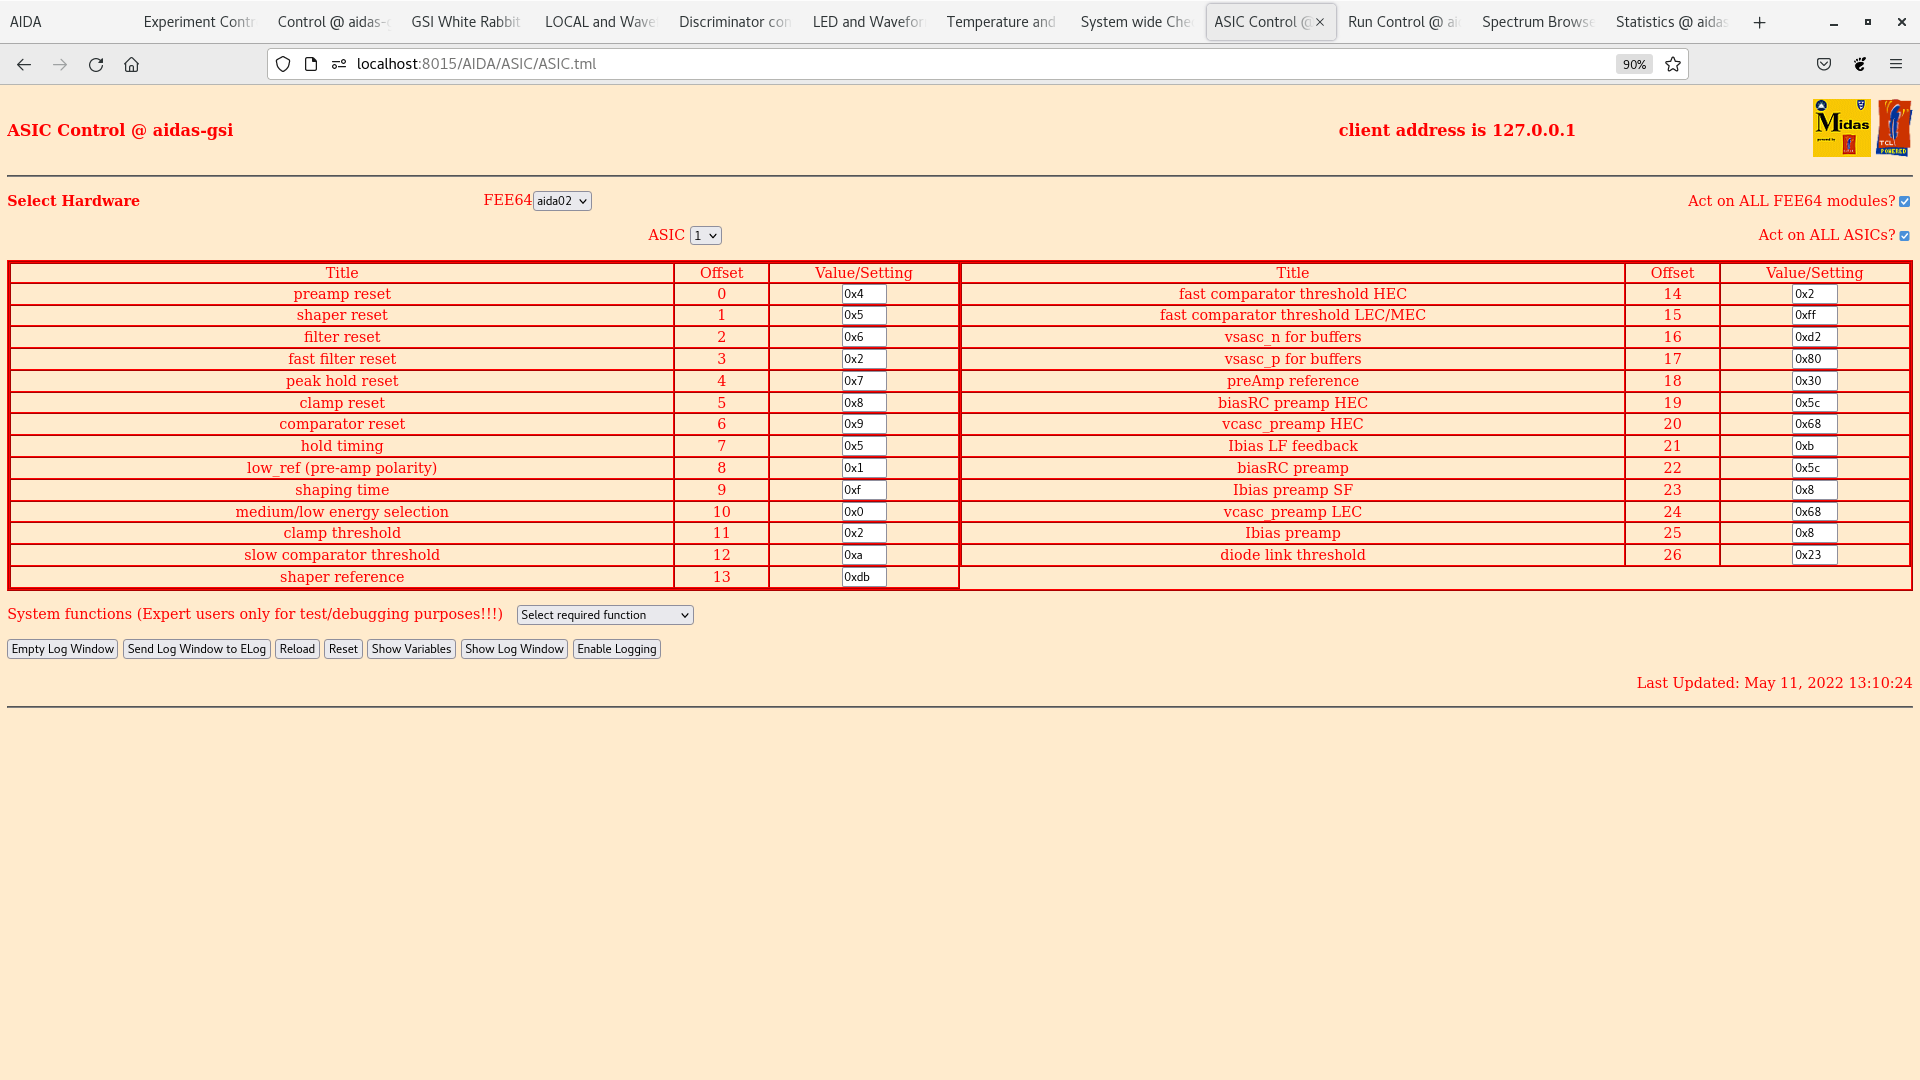
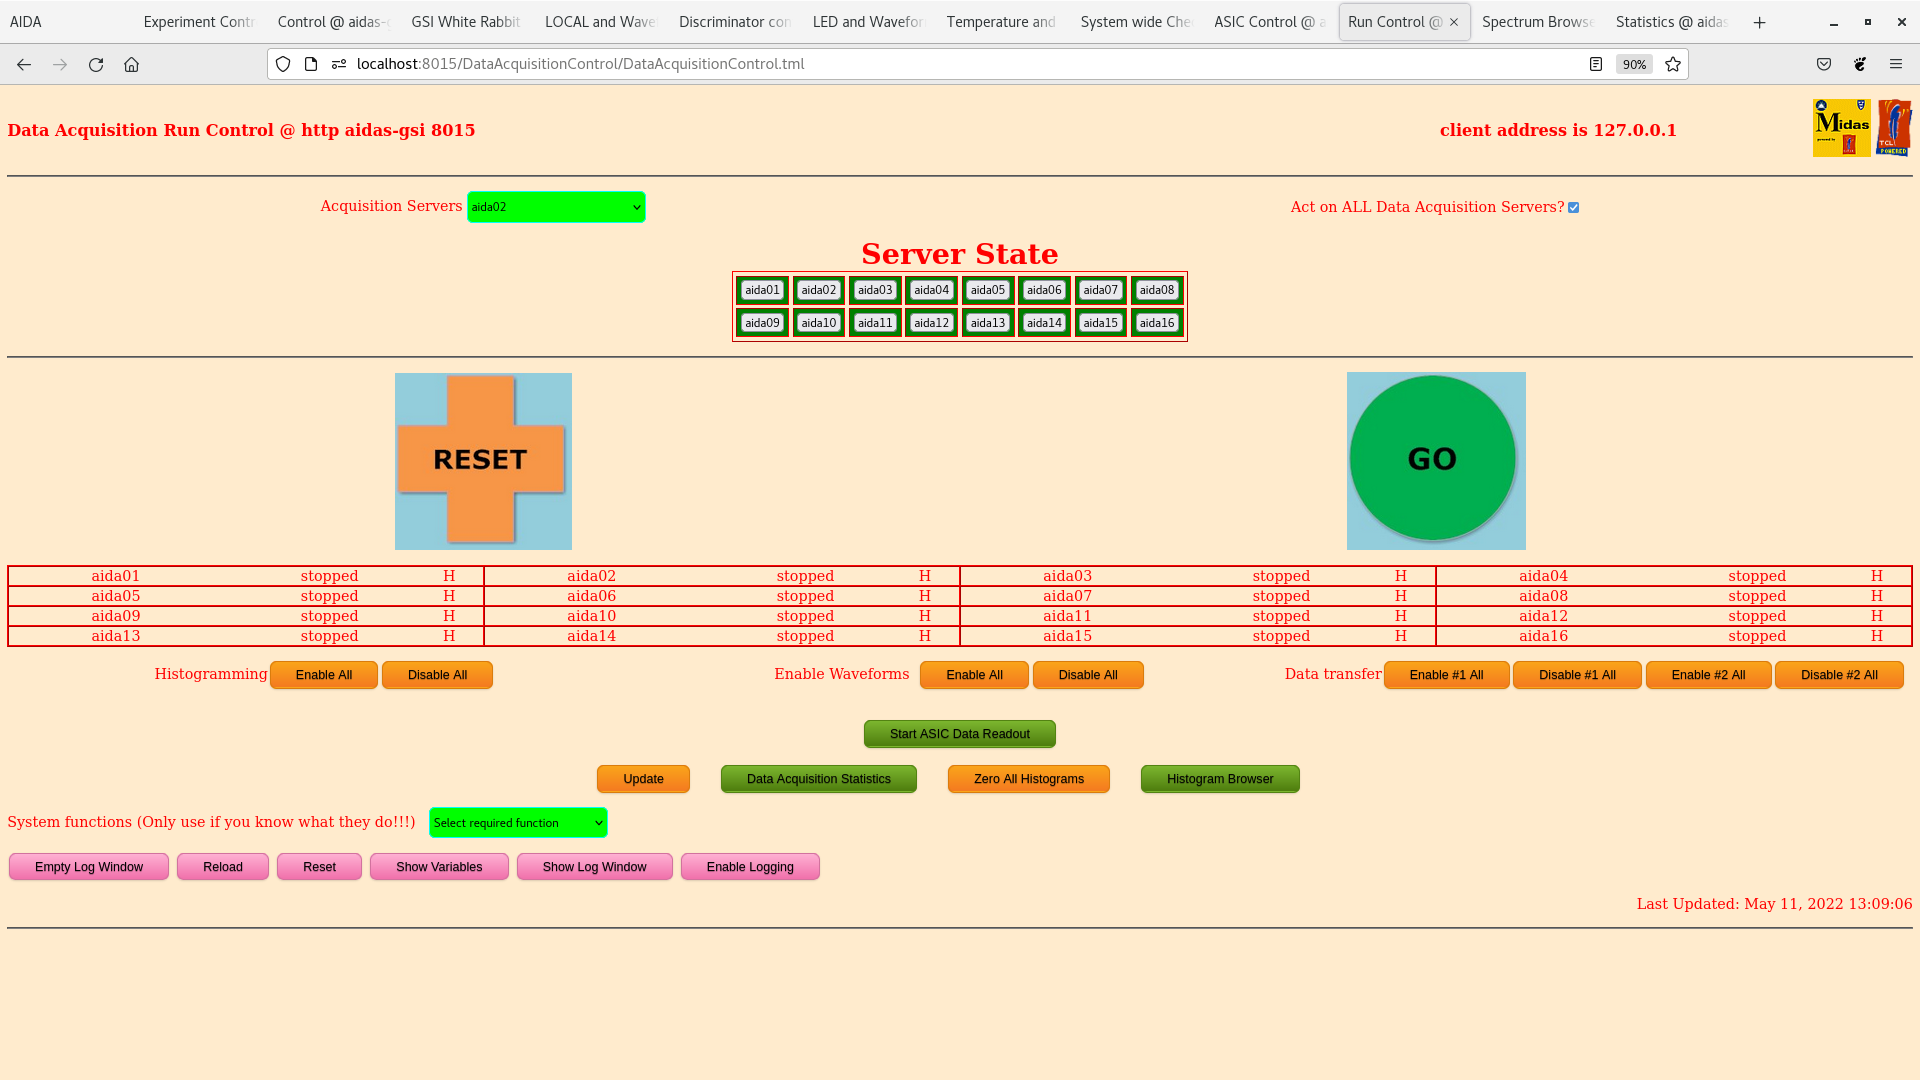
13.10 Attachments 3-5
      DAQ histogramming only enabled, waveforms/data transfer disabled, sampling ADCs OFF
      ASIC check load
      ASIC slow comparator all FEE64s all ASICS 0xa
      ADC data item stats

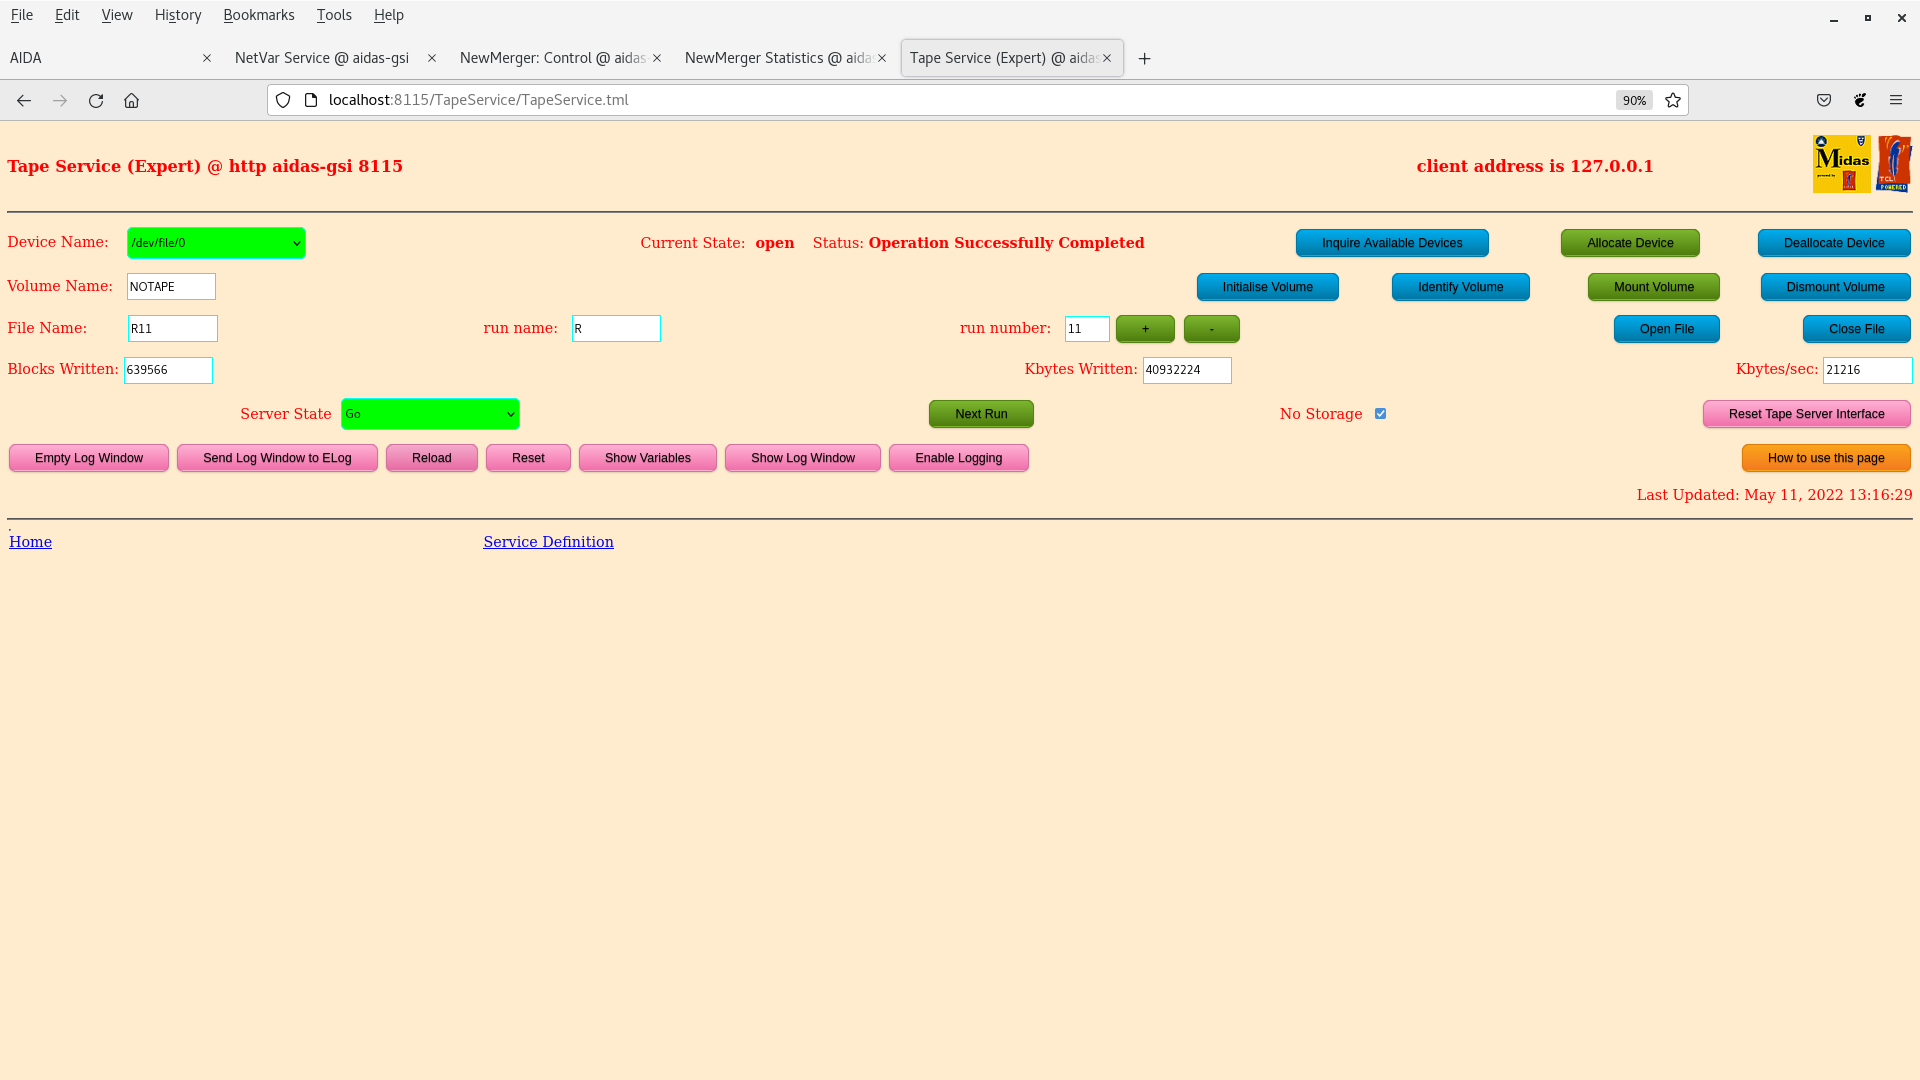
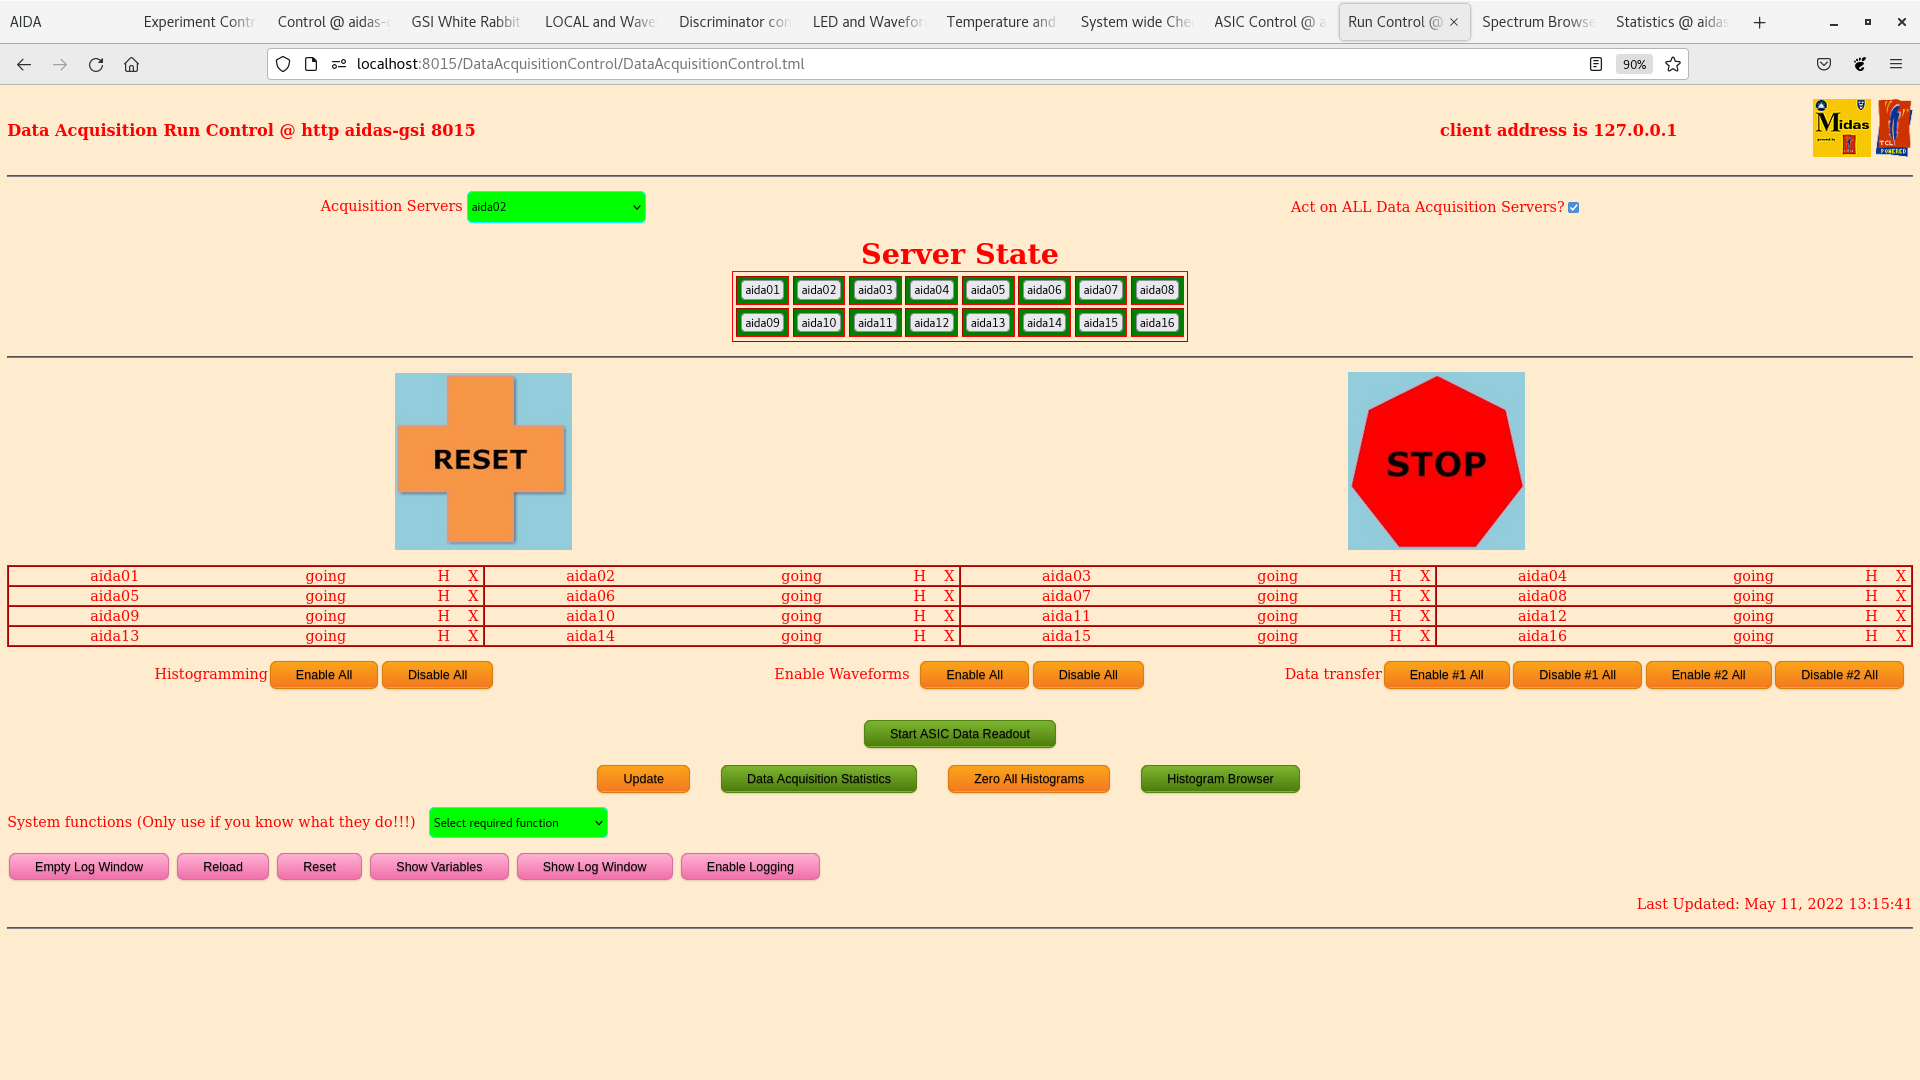
13.17 Attachments 6-9
      DAQ histogramming & data transfer enabled, waveforms disabled, sampling ADCs OFF
      ADC data item stats
      NewMerger/Tape Server

18:00 As part of tests in the afternoon it was investigated powering only one DSSD worth of FEEs at a time
      It was found that reasonable rates could be found for DSSD1 but poor rates only for DSSD2

      To try and help isolate the two detectors the jumpers 2 and 4 were removed from FEEs 13, 5 and 14 (Top, DSSD2)
      After powering on it was found there was no improvement and possible worse noise than before

We were able to recover the rates in the 1DSSD setup so instead have removed FEE power from FEE5 and FEE14 |
| Attachment 1: 220511_0806_aida14.png
|

|
| Attachment 2: 220511_0817_aida14_top.png
|

|
| Attachment 3: Screenshot_from_2022-05-11_13-11-09.png
|
|
| Attachment 4: Screenshot_from_2022-05-11_13-10-29.png
|
|
| Attachment 5: Screenshot_from_2022-05-11_13-09-12.png
|
|
| Attachment 6: Screenshot_from_2022-05-11_13-16-32.png
|
|
| Attachment 7: Screenshot_from_2022-05-11_13-16-24.png
|

|
| Attachment 8: Screenshot_from_2022-05-11_13-16-01.png
|

|
| Attachment 9: Screenshot_from_2022-05-11_13-15-45.png
|
|
|
140
|
Tue Mar 10 23:17:31 2020 |
DK, LS, PW, TD, CA | Wednesday 11 March 2020 |
00:15 Shift change near AIDA R6_475

  We continue with spill cycles around 0.2 Hz or one beginning once each ~5 seconds.

  All system-wide checks passed successfully
  Temperatures ok (aida01 still a bit hot) - see attachment #1
  Stats as normal (SSD3 still noisy) - see attachment #2
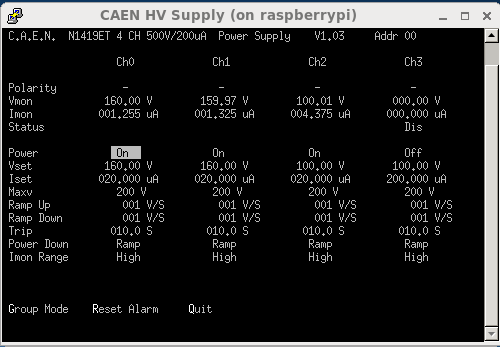
  Bias and pulser settings remain sane - see attachment #3
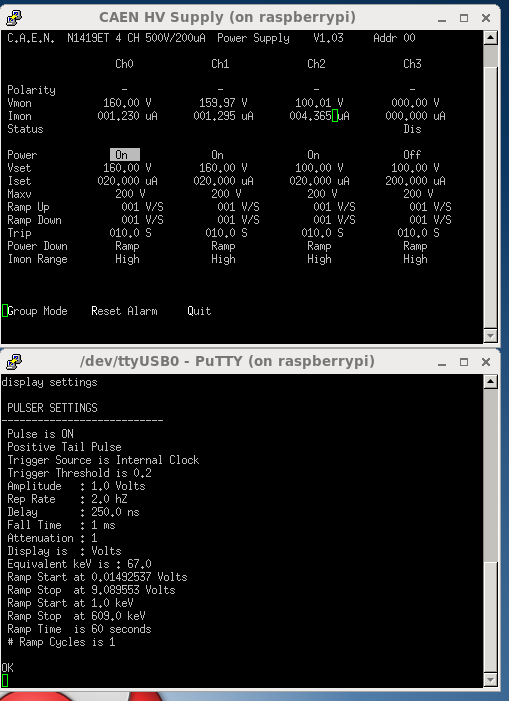
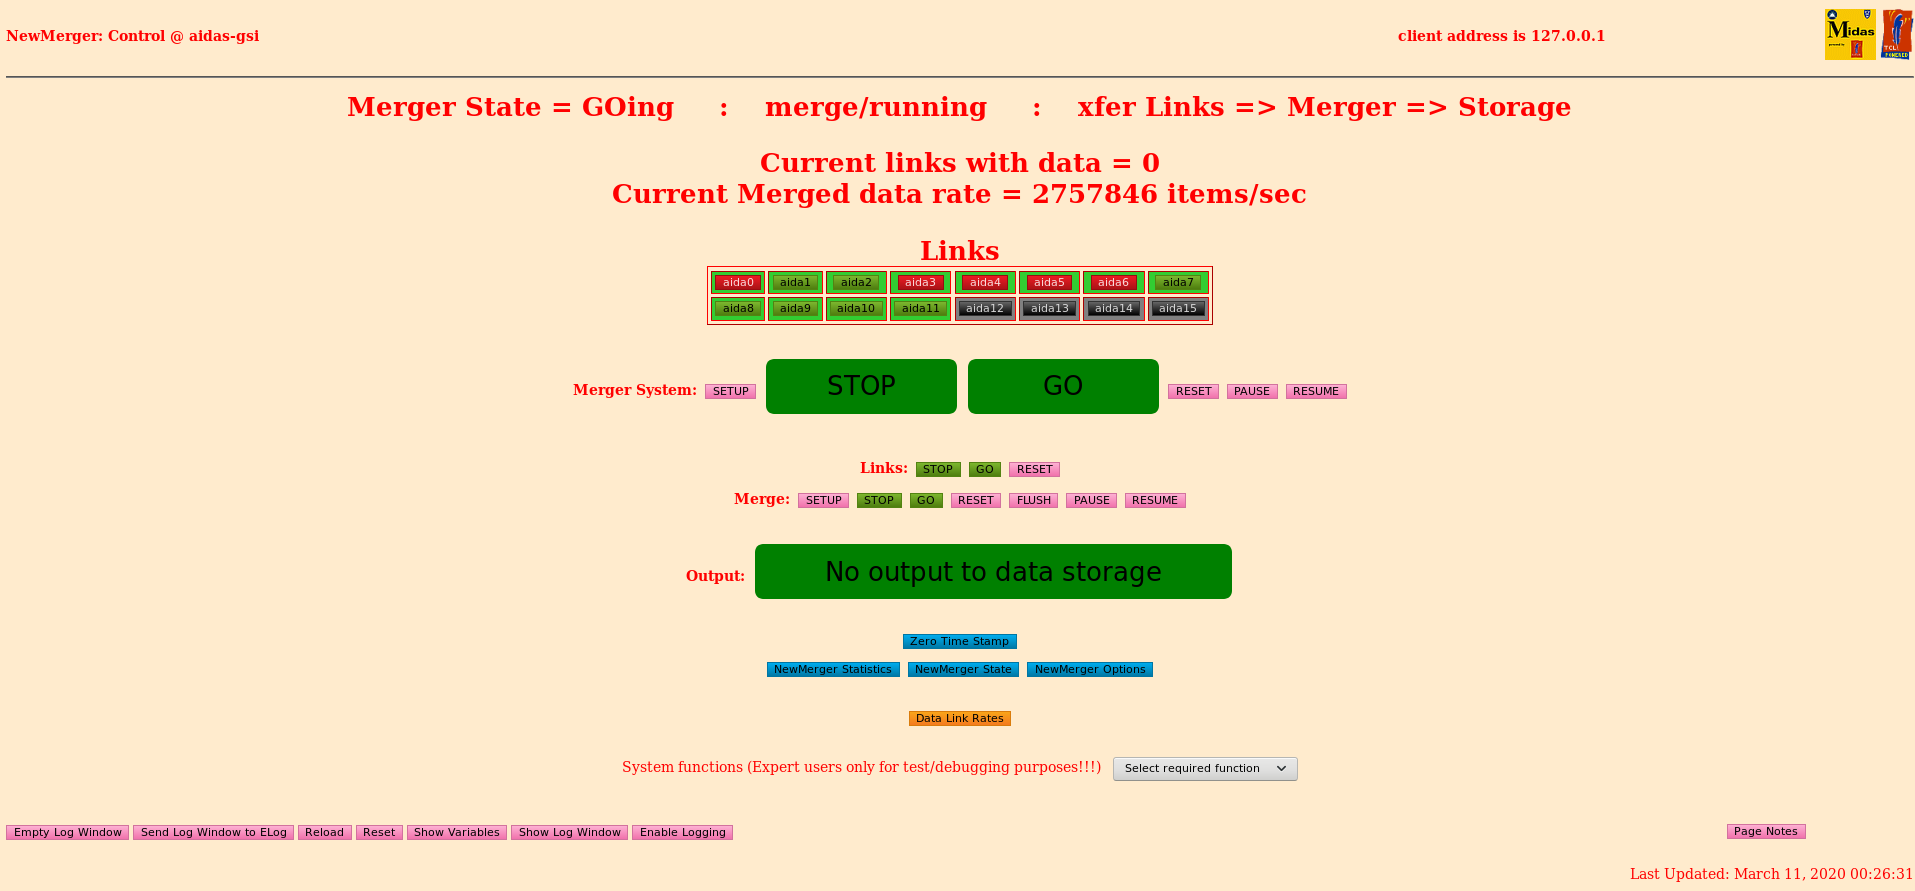
  Writing data to disk at ~26 MB/s as yesterday - see attachment #4
  Merging fine, 2.6 to 3.3 Mega items / sec (all aida## seen to go on) - see attachment #5
  Rates look not unreasonable for expected implantation in short time window - see attachment #6

2:26
   We are near R6_574
   All system checks are fine
   Temps are fine - attachment #7
   Stats look as before - attachment #8
   Biases and leaks typical - attachment #9
   Merger fine, 3 x 10^6 items / sec (skip screencap)
   TapeServer still sits near 25 MB/s (skip screencap)
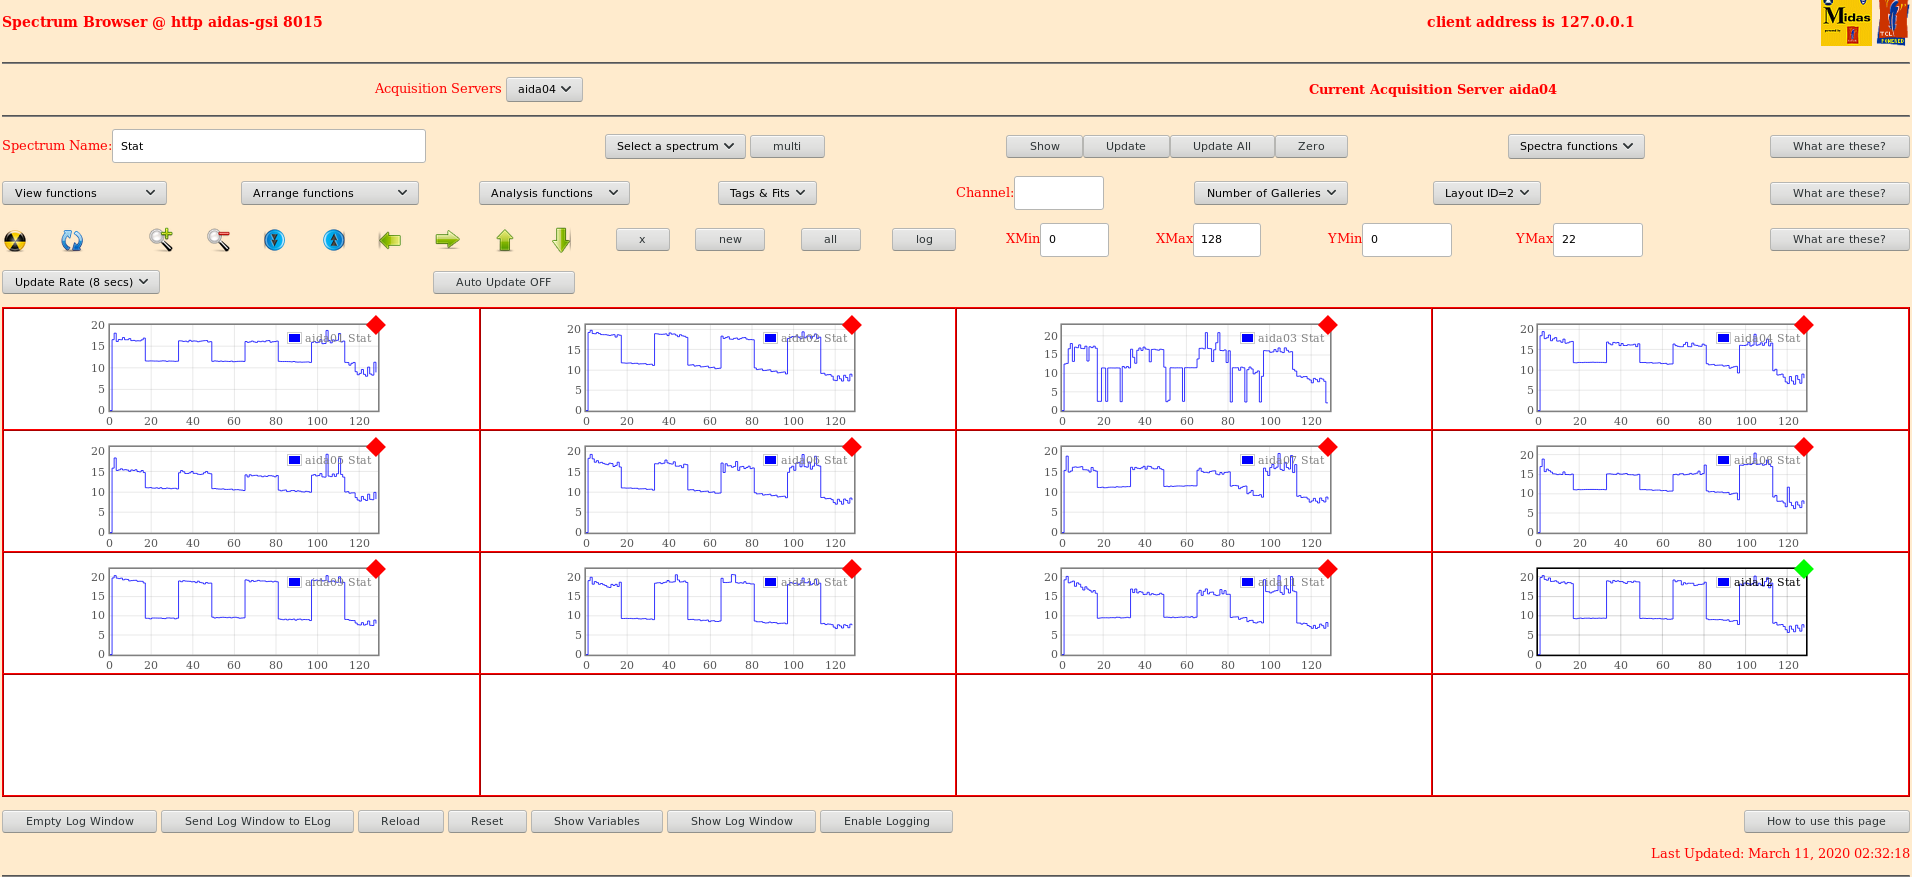
   Cumulative implants look reasonable, but NB that histos have not been cleared - attachment #10

2:44 R6_587 or R6_588
   The spills seem to have stopped based on the beeping scalars.  Confirmed with other group there are no scint counts.
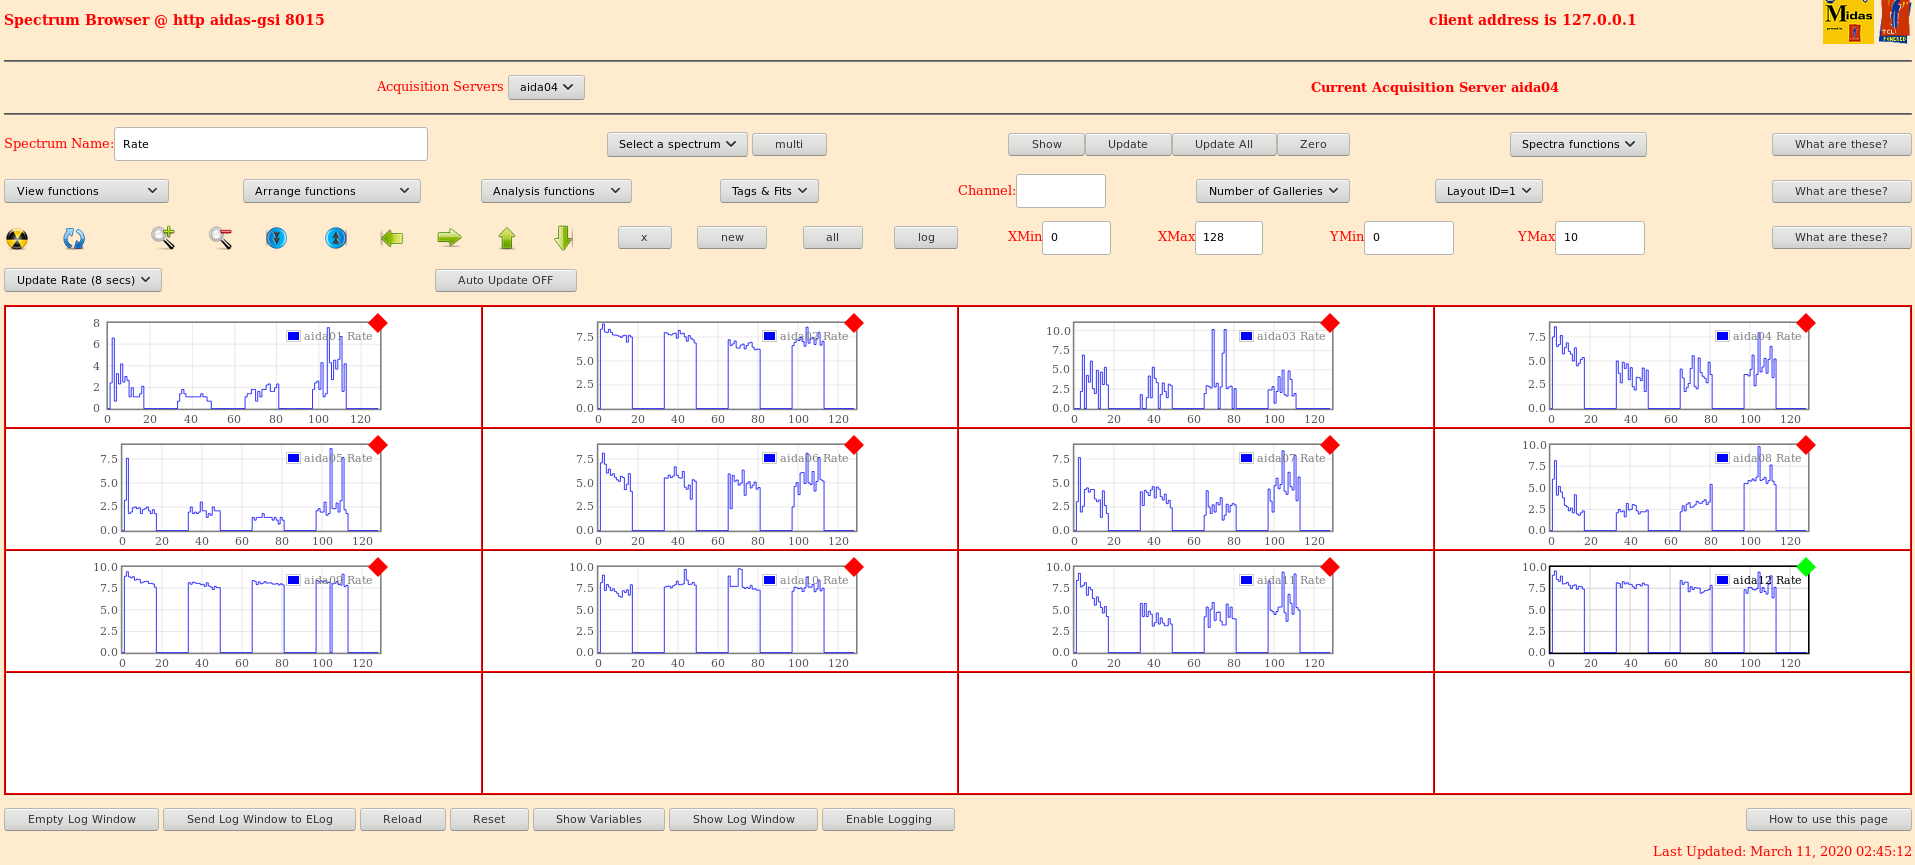
   See attachment of AIDA rates where no implants can be seen.  See attachment #11

2:46 Spill beeps heard briefly, but they cut again.  R6_590

2:49 Beam seems to be back R6_592
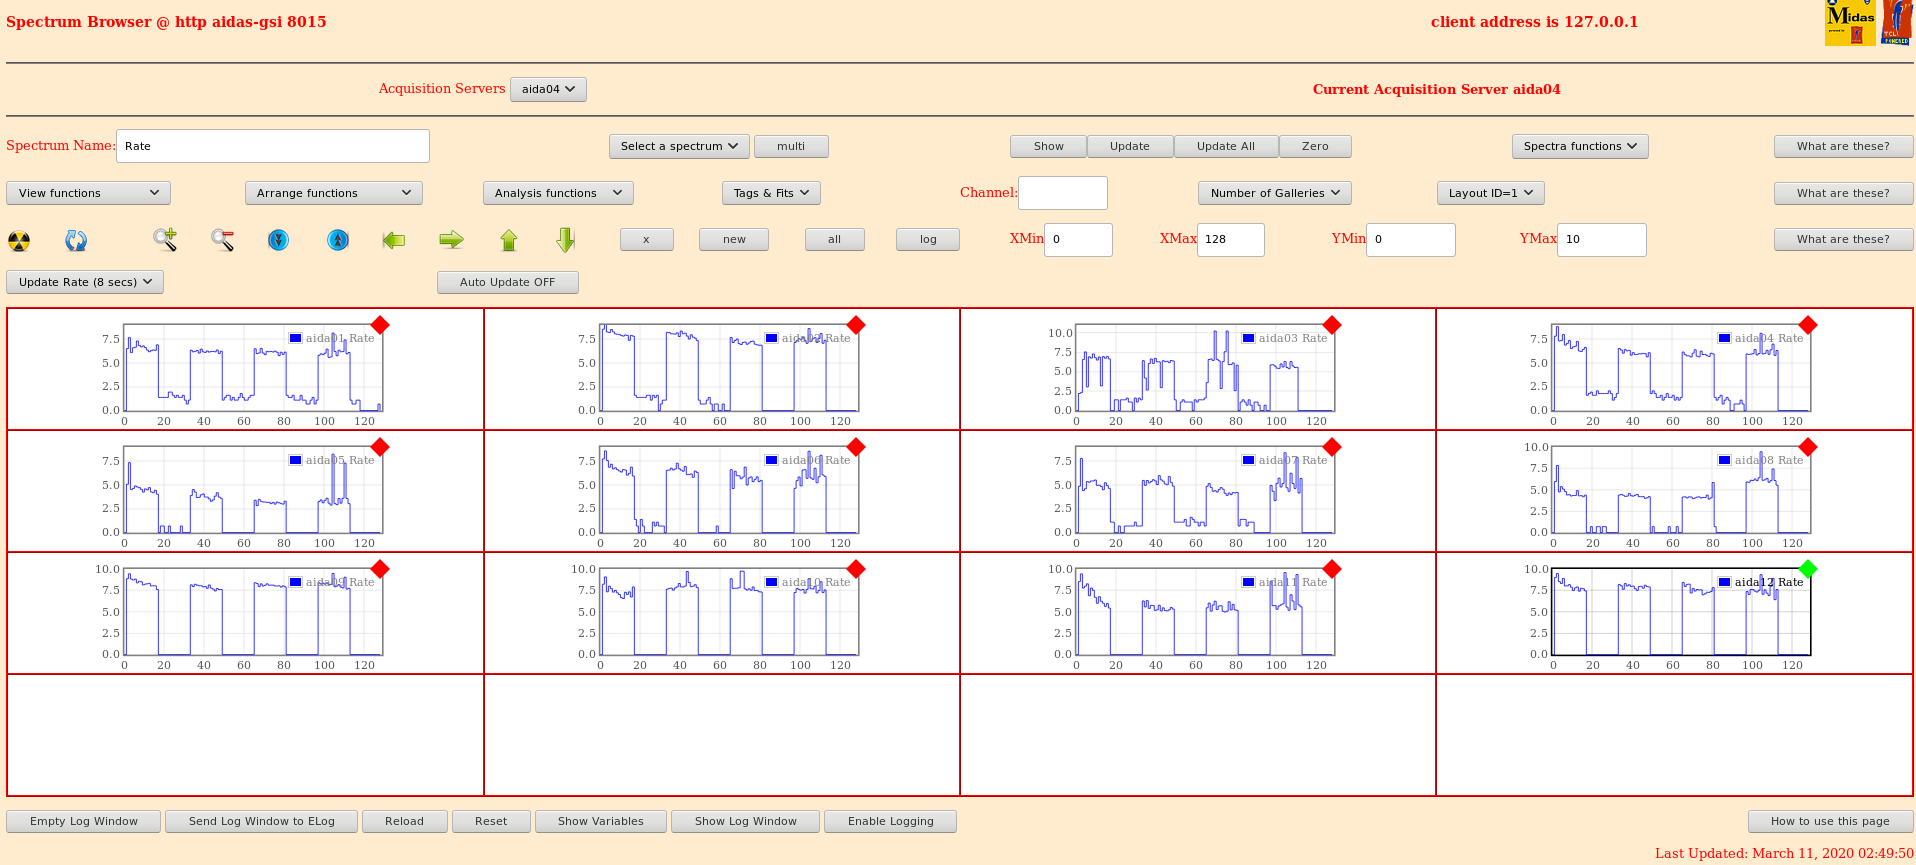
  Scints have counts in DESPEC DAQ, scalars are beeping, AIDA sees implants.  No problem.  See attachment #12 for implants.

4:35
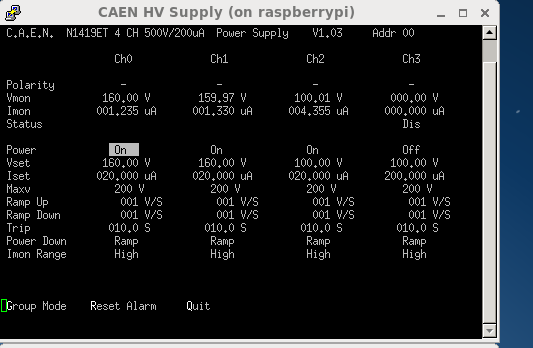
  System checks all pass (except expected error on master clock)
  Temps okay - attachment #13
  Biases and leak currents normal - attachment #14
  Stats as before - attachment #15
  Merger going, 3 mega items per sec
  TapeServer going, 25 MB/s

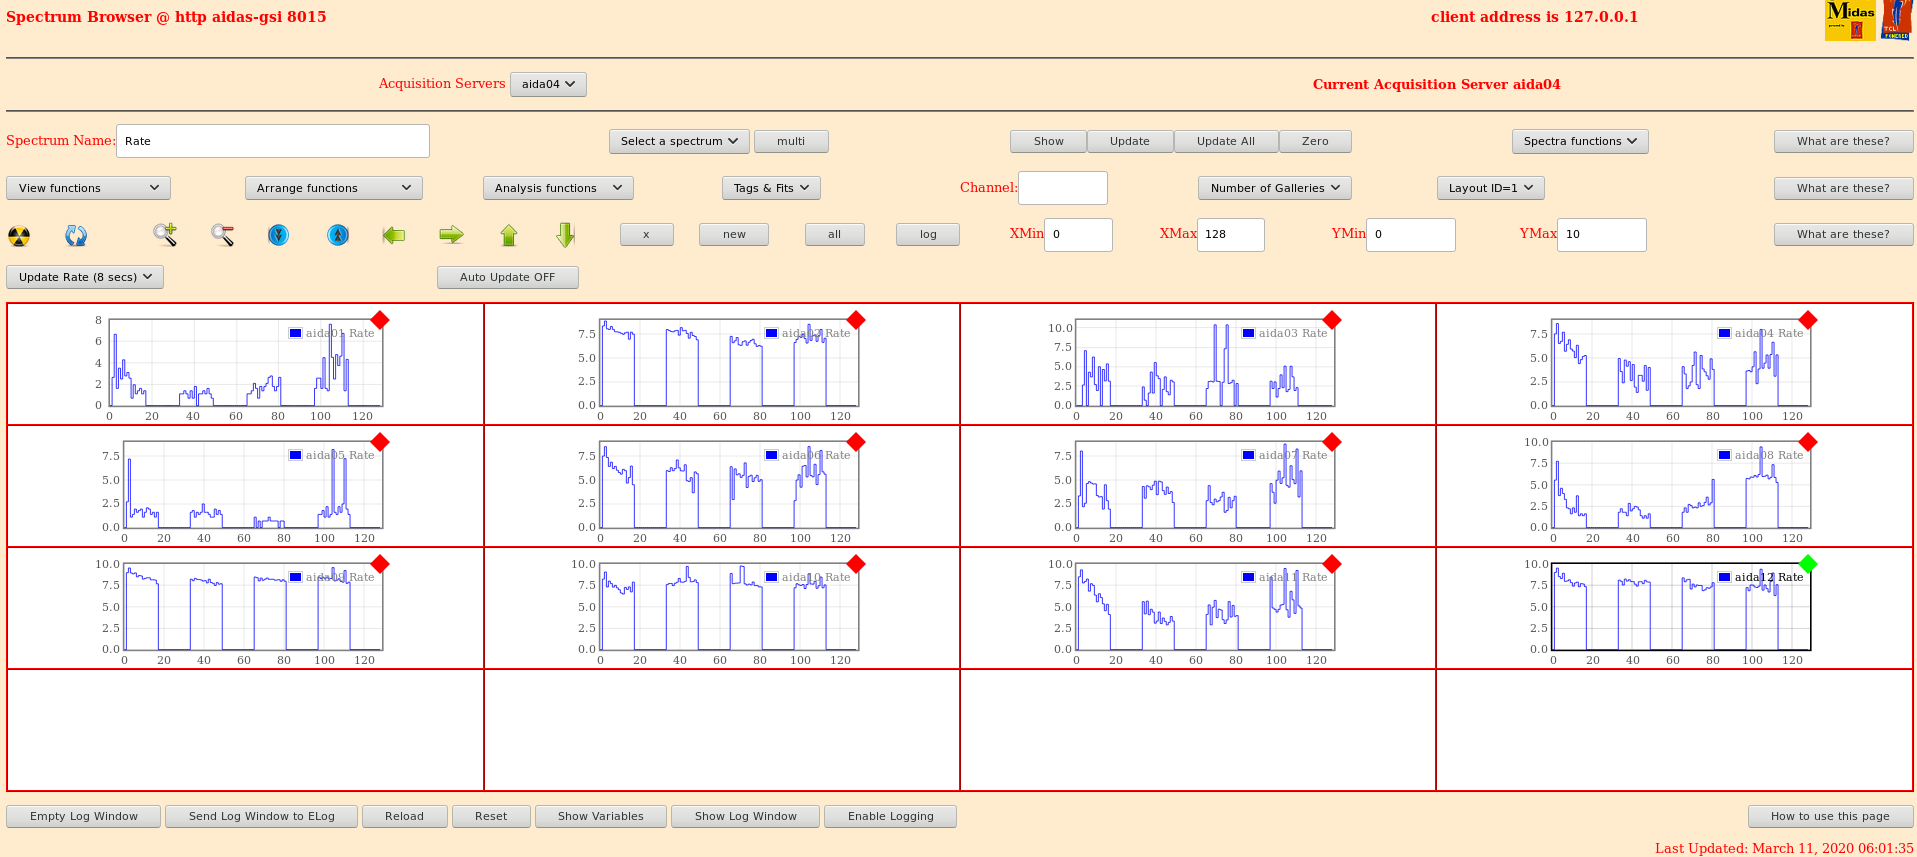
5:59 Beam is gone again, near R6_738.  As before, we get consistent confirmation from the trigger clicks and the plastic scint data of DESPEC group.
   See attachment #16 which shows no implants in the rate.


Contact phones for Control Room: 2222

We called, they are aware of a problem with the magnets and they are working to resolve it.  So we will await them.

Expert is scheduled for 7:30, but he may come earlier like 7:00 if he can make it in.

We leave AIDA writing to disk since there are some longer lived daughters (hour or more) so we may still get some interesting decays with beam off

7:14  Beam is still off, but I make some notes
   System wide checks all okay
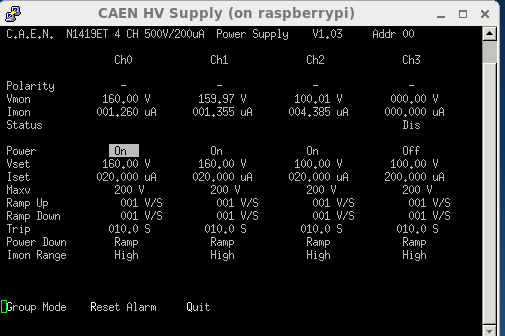
   Temps as normal (see attachment #17)
   Biases and leak currents okay (see attachment #18)
   Stats as normal (see attachment #19)
   Merger going at 3 mega cps
   TapeServer on, around 25 MB/sec
   Implants not seen in histogram rate as expected (see attachment #20)

7:32 We called the operators to confirm that they don't change anything before calling us first.
     Surely they said they don't touch the settings without telling us first, and just one magnet (maybe upstream of SIS) is down, and no plan to alter settings.

8.00 shift change at file R6_823
     beam is back on, no settings changed.
     particles per spill is similar to before (2k~3k per spill)
     implants now being seen in rate histogram (attachment 21)

8.32 system wide checks all okay
     FEE temperatures are normal (attachment 22)
     leak currents are okay and have been recorded to sheet (attachment 23)
     good event stats seem normal, although noted that all FEEs in DSSD3 now over 100k (attachment 24)
     merger rate is running around 3M items/sec
     tape service rate is running around 26MB/sec

9.20 high energy spectra histograms for even FEEs was not displaying correctly (attachment 25). can also be seen on yesterdays elog on attachment 34
     problem can be seen clearly in /tmp/LayOut6.mlf for the line corresponding to aida4 was 1.8h not 1.8H as the information was somehow saved in the layout (attachment 26).
     remaking each histogram and saving layout6 seems to be fixed (attachment 27)

Top of the error message showed the problem, like:
====
Using /tmp/LayOut6.mlf
restore server=aida02 spectrum=1.8.H to gallery=1 overlap=1
restore server=aida04 spectrum=1.8.h to gallery=2 overlap=1
SpecDetails returned with an error
0x30004
SOAP-ENV:Server-Error detected in method SpecDetails
Invalid spectrum name
    invoked from within
"SpecDetails 1.8.h"
    (in namespace inscope "::urn:SpectrumService" script line 1)
    invoked from within
====

10.05 beam is being stopped to change some thresholds

10.34 system wide checks all okay
      FEE temperatures are normal (attachment 28)
      leak currents are okay and have been recorded to spreadsheet (attachment 29)
      good event stats are normal, as previously mentioned aida11 rate was over 100k this looks to have just been a fluctuation (attachment 30)
      merger is running at a rate of 3M items/sec
      tape service is running at a rate of 24MB/sec
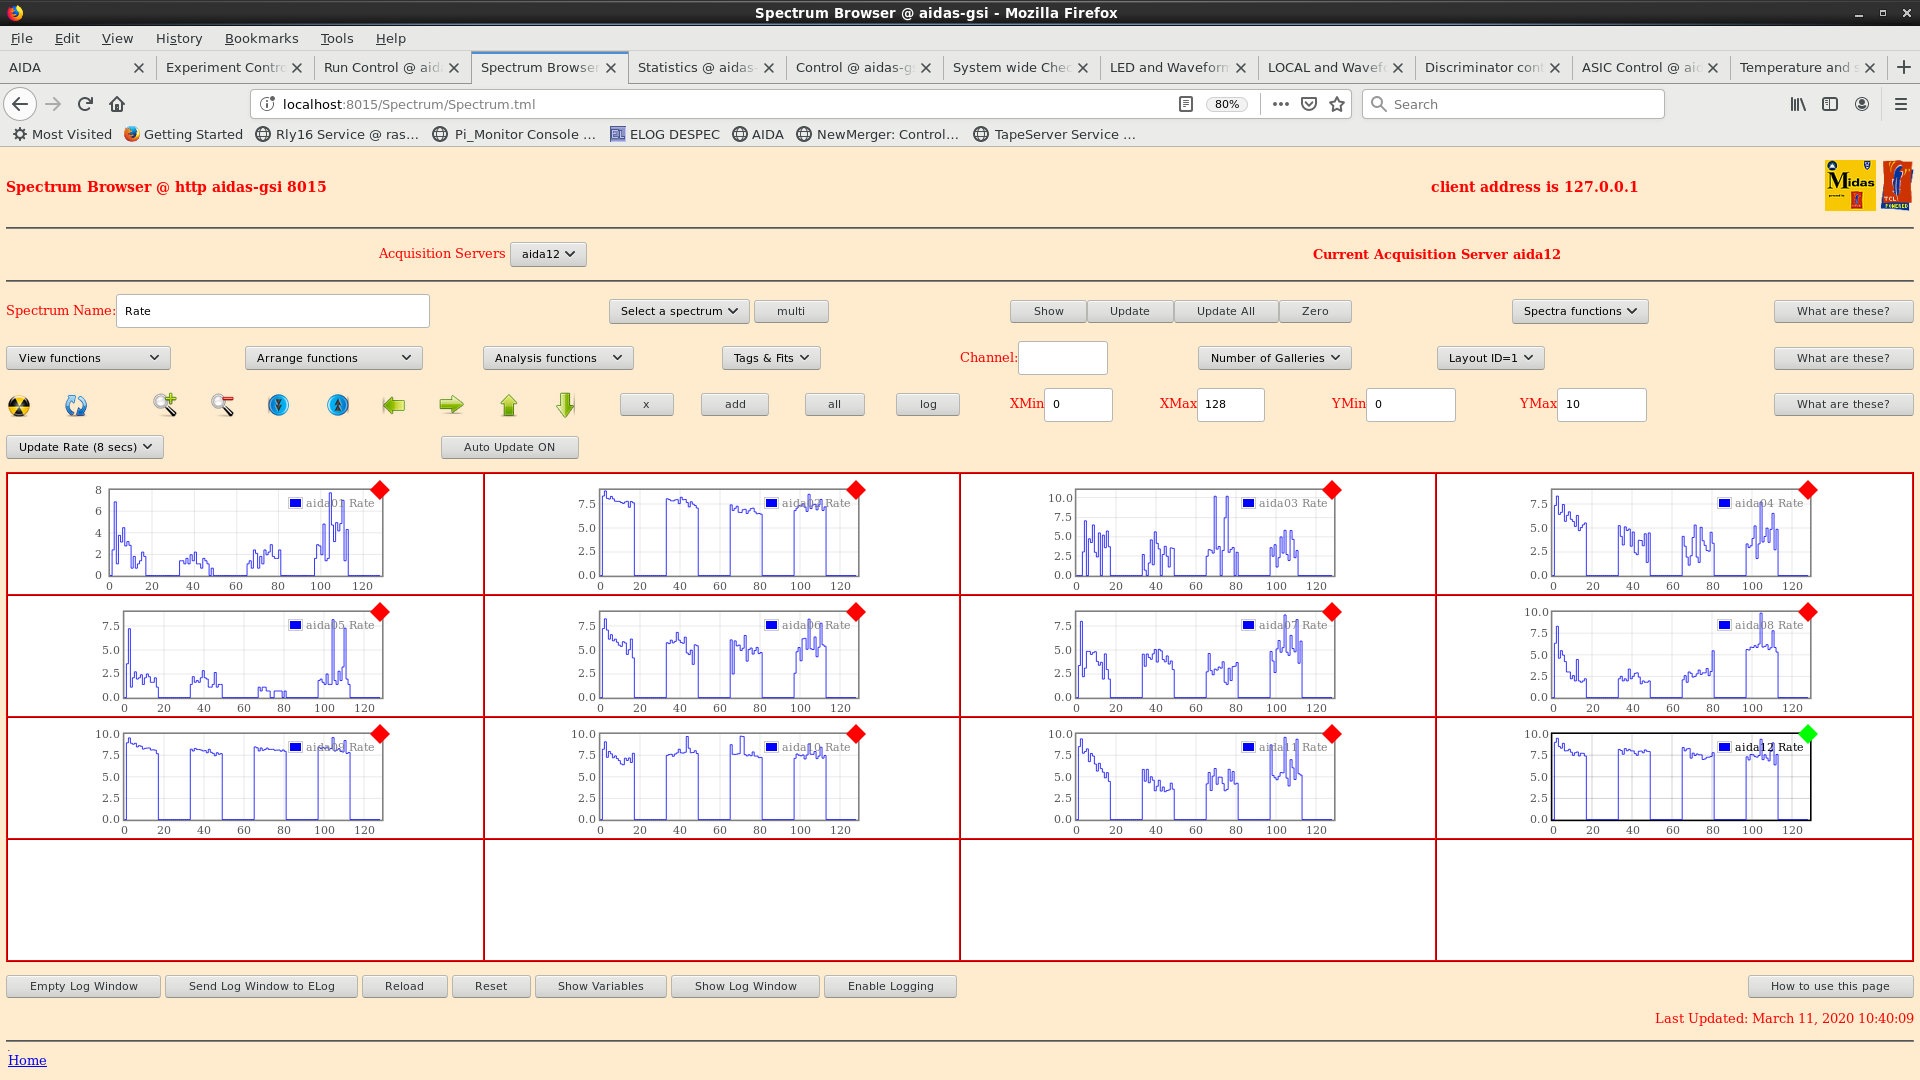
      implants not seen in histogram rate as expected as beam still down (see attachment 30)

10.42 beam still down but taking data, currently file finishing R6_946
      as of now we have 3.2Tb left which should correspond to around 26 hours left until space is full
      have zeroed all histograms so will take screenshots at 11.00

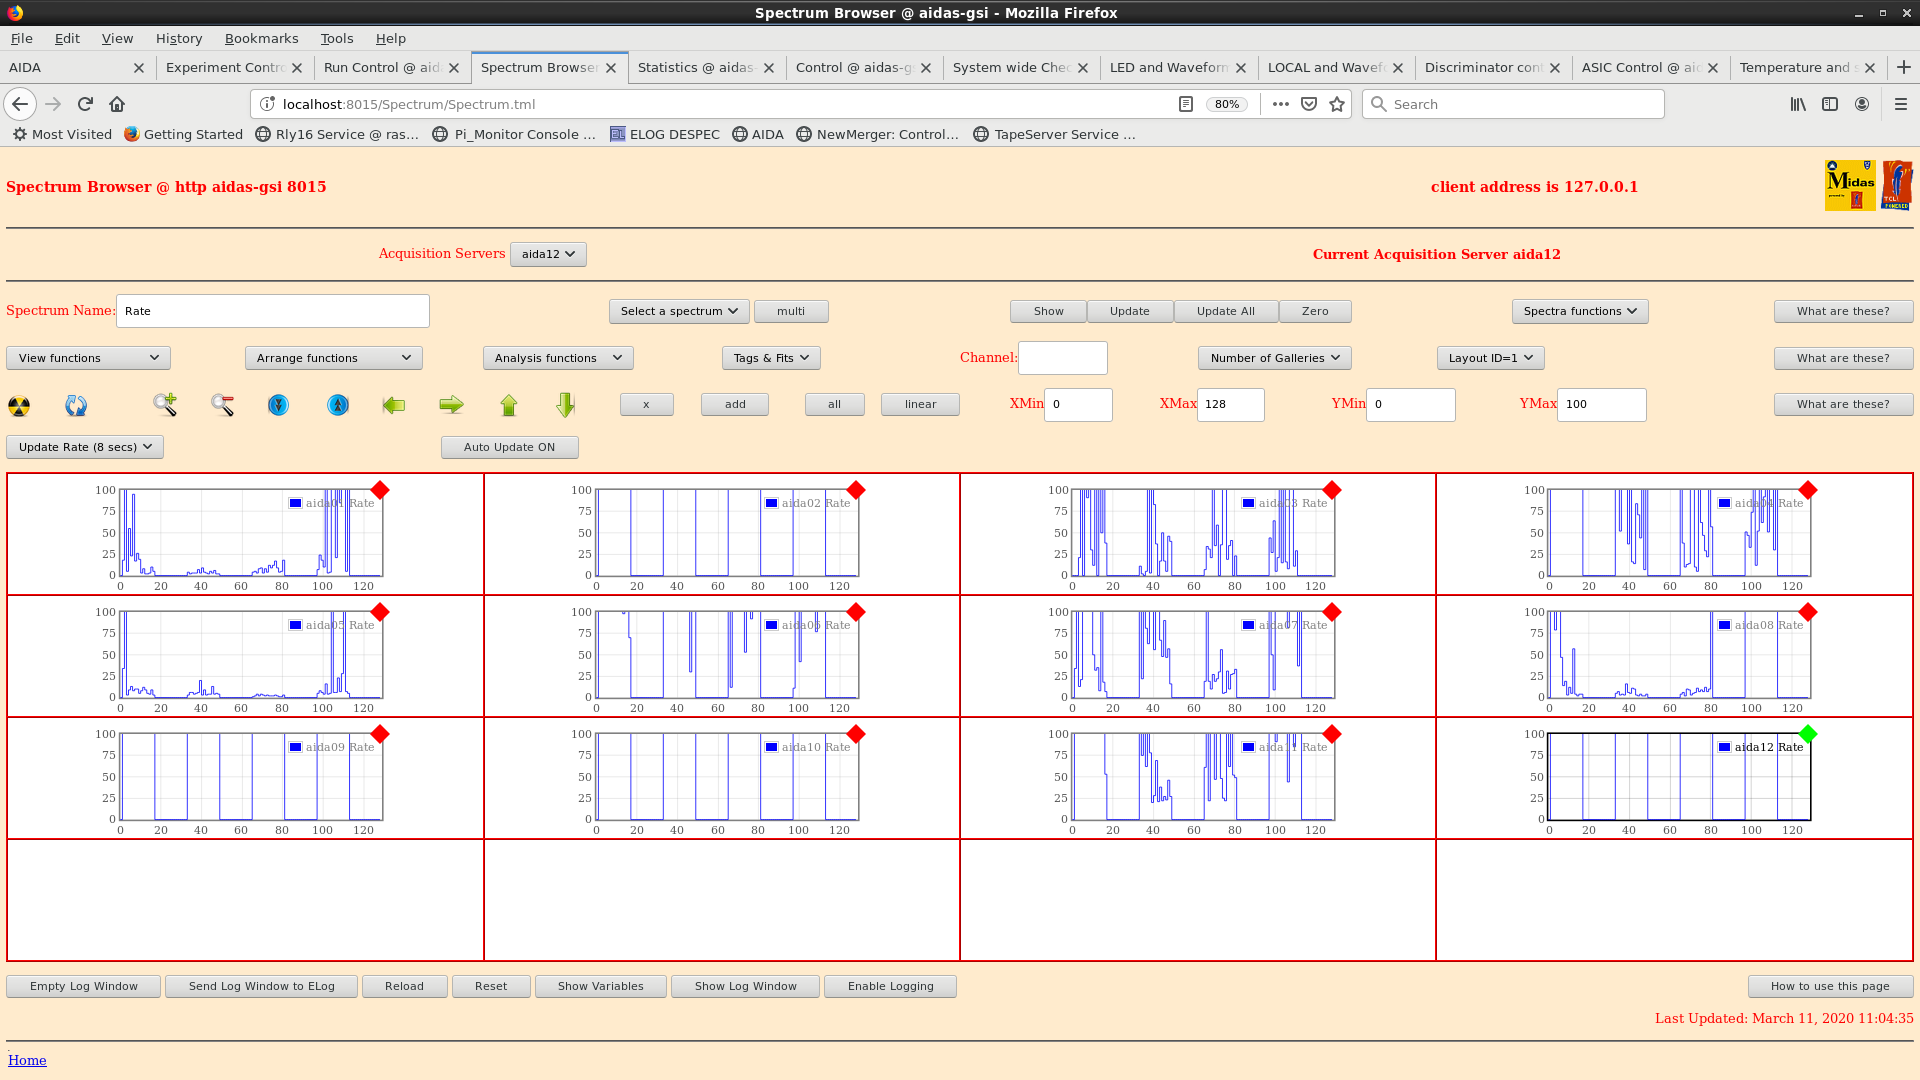
11.06 checked rates histograms, for aida3 some low energy channels in ASICs 1,2, and 3 were missing so performed ASIC control checks

11.25 beam back file S480/R6_975

12.00 analysis file S480/R6_1001 - attachment 33
      FEE aida09 deadtime c. 5% (highest rate good events c. 250k), all other FEE64s << 1%
      all HEC data rate c. 1kHz
      all ADC data rate c. 1.2MHz

12.23 system wide checks all okay
      FEE temperatures are normal (attachment 34)
      leak currents are okay and have been recorded to spreadsheet (attachment 35)
      good event stats are okay (attachment 36)
      merger is running at a rate of 3M items/sec
      tape service is running at a rate of 26MB/sec

13.00 beam off, unknown reason at the moment, but can confirm from rates histogram (attachment 37)
      seems to be intermittent. file R6_1051

13.10 beam back on, no one was called. currently on file R6_1061

13.22 beam off as going to higher intensity beam. file R6_1069

14.42 system wide checks all okay
      FEE temperatures are normal (attachment 38)
      leak currents are okay and have been recorded to spreadsheet (attachment 39)
      good event stats are okay (attachment 40)
      merger is running at a rate of 3M items/sec
      tape service is running at a rate of 24M/sec
14.48 on file R6_1131

16.19 beam stop for 2 hours. TapeServer stopped and restarted - AIDA writing to No Storage
      file R6_1193

16:35 compression of files R6_[200-999] commenced (nice -20)

16:40 system wide checks all okay
      FEE temperatures are normal (attachment 41)
      leak currents are okay and have been recorded to spreadsheet (attachment 42)
good event stats are okay (attachment 43) |
| Attachment 1: daid-11-tempsA.png
|

|
| Attachment 2: daid-11-statsA.png
|

|
| Attachment 3: daid-11-biasA.png
|
|
| Attachment 4: daid-11-TSA.png
|

|
| Attachment 5: daid-11-mergerA.png
|
|
| Attachment 6: daid-11-implantsA.png
|

|
| Attachment 7: daid-11-tempB.png
|

|
| Attachment 8: daid-11-statsB.png
|

|
| Attachment 9: daid-11-biasB.png
|
|
| Attachment 10: daid-11-histoB.png
|
|
| Attachment 11: daid-11-histos-beamdrop.png
|
|
| Attachment 12: daid-11-beamreturn.png
|
|
| Attachment 13: daid-11-tempC.png
|

|
| Attachment 14: daid-11-biasC.png
|
|
| Attachment 15: daid-11-statsC.png
|

|
| Attachment 16: daid-beamstop2.png
|
|
| Attachment 17: daid-11-tempD.png
|

|
| Attachment 18: daid-11-biasD.png
|
|
| Attachment 19: daid-11-statsD.png
|

|
| Attachment 20: daid-11-histosD.png
|
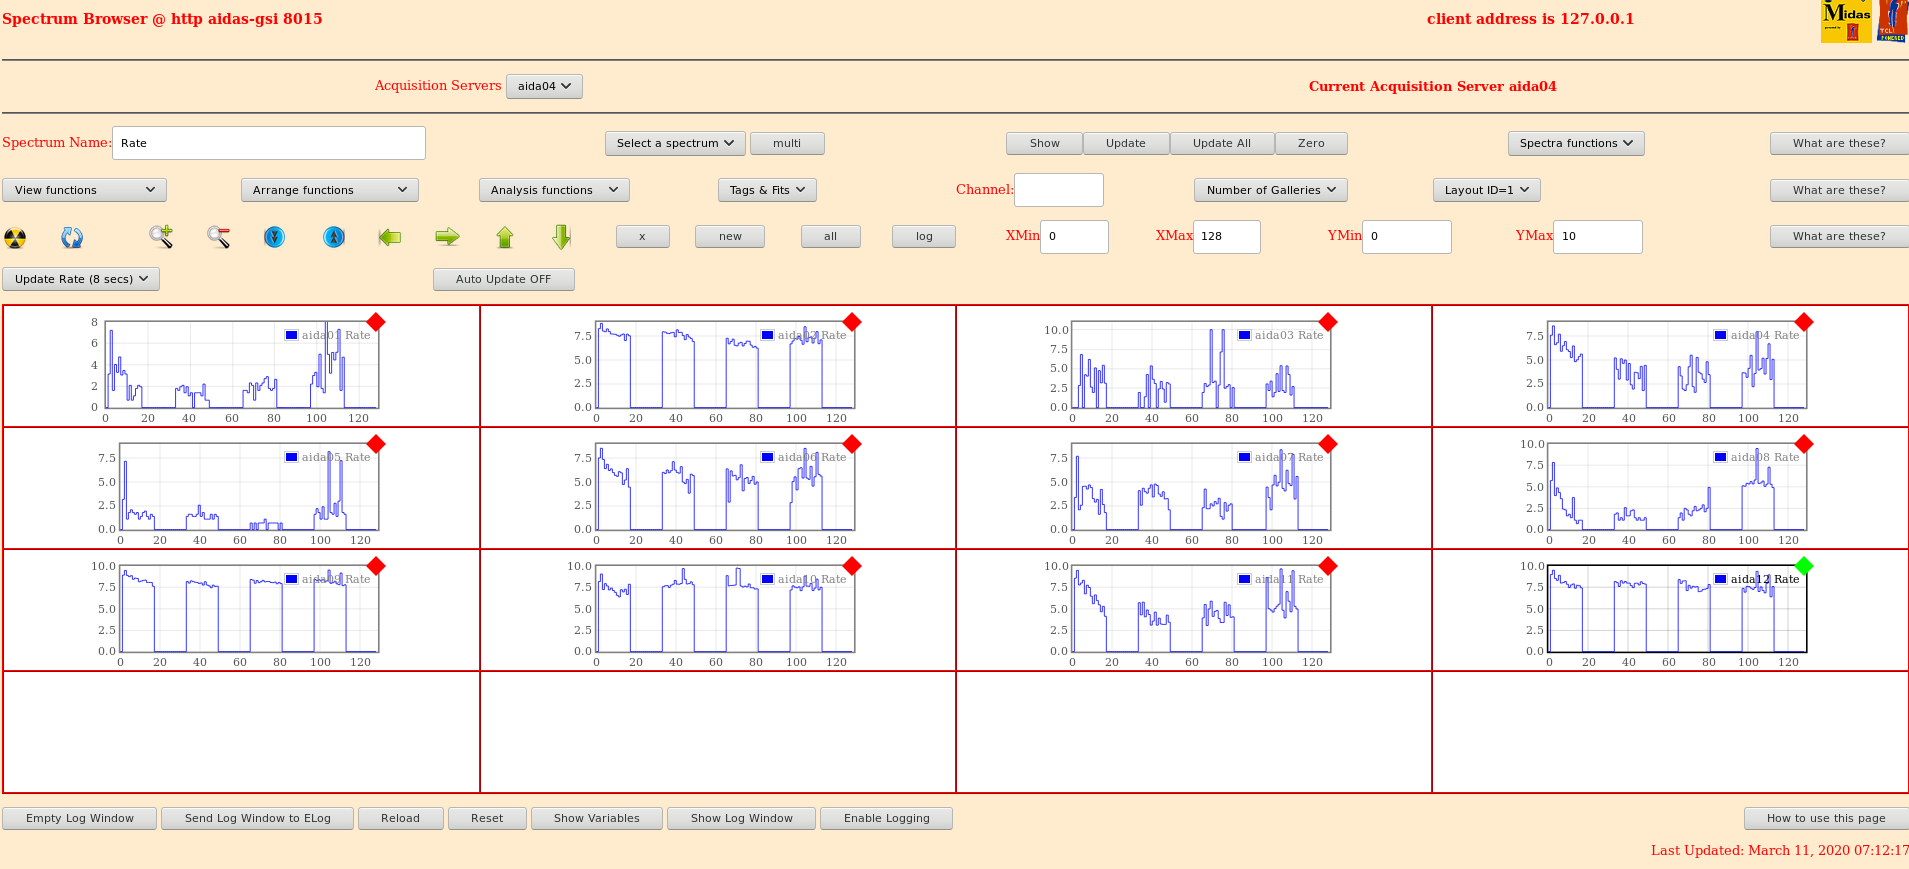
|
| Attachment 21: 200311_804_rateshistograms.png
|

|
| Attachment 22: 200311_28_feetemps.png
|

|
| Attachment 23: 200311_831_leakcurrents.png
|

|
| Attachment 24: 200311_829_goodevents.png
|

|
| Attachment 25: 200311_845_highEevenfees.png
|

|
| Attachment 26: daid-11-histos-lowgaineven.png
|

|
| Attachment 27: 200311_919_highEevenfixed.png
|

|
| Attachment 28: 200311_1030_feetemps.png
|

|
| Attachment 29: 200311_1032_leakcurrents.png
|

|
| Attachment 30: 200311_1031_goodevents.png
|

|
| Attachment 31: 200311_1040_ratehistogram.png
|
|
| Attachment 32: 200311_1107_rates.png
|
|
| Attachment 33: R6_1001
|
*** TDR format 3.3.0 analyser - TD - January 2019
*** ERROR: READ I/O error: 5002
blocks: 32000
ADC data format: 87080536 ( 1162937.9 Hz)
Other data format: 174903340 ( 2335788.5 Hz)
Sample trace data format: 0 ( 0.0 Hz)
Undefined format: 0 ( 0.0 Hz)
Other data format type: PAUSE: 31 ( 0.4 Hz)
RESUME: 31 ( 0.4 Hz)
SYNC100: 87327938 ( 1166241.9 Hz)
WR48-63: 87327938 ( 1166241.9 Hz)
FEE64 disc: 247402 ( 3304.0 Hz)
MBS info: 0 ( 0.0 Hz)
Other info: 0 ( 0.0 Hz)
ADC data range bit set: 73144 ( 976.8 Hz)
Timewarps: ADC: 0 ( 0.0 Hz)
PAUSE: 0 ( 0.0 Hz)
RESUME: 0 ( 0.0 Hz)
SYNC100: 0 ( 0.0 Hz)
WR48-63: 0 ( 0.0 Hz)
FEE64 disc: 0 ( 0.0 Hz)
MBS info: 0 ( 0.0 Hz)
Undefined: 0 ( 0.0 Hz)
Sample trace: 0 ( 0.0 Hz)
*** Timestamp elapsed time: 74.880 s
FEE elapsed dead time(s) elapsed idle time(s)
1 0.000 0.000
2 0.000 0.000
3 0.144 0.000
4 0.000 0.000
5 0.033 0.000
6 0.000 0.000
7 0.033 0.000
8 4.160 3.444
9 0.111 0.000
10 0.116 0.000
11 0.111 0.000
12 0.000 0.000
13 0.000 0.000
14 0.000 0.000
15 0.000 0.000
16 0.000 0.000
17 0.000 0.000
18 0.000 0.000
19 0.000 0.000
20 0.000 0.000
21 0.000 0.000
22 0.000 0.000
23 0.000 0.000
24 0.000 0.000
25 0.000 0.000
26 0.000 0.000
27 0.000 0.000
28 0.000 0.000
29 0.000 0.000
30 0.000 0.000
31 0.000 0.000
32 0.000 0.000
*** Statistics
FEE ADC Data Other Data Sample Undefined Pause Resume SYNC100 WR48-63 Disc MBS Other HEC Data
0 2537909 5321817 0 0 1 1 2619908 2619908 81999 0 0 13572
1 12374388 24792837 0 0 0 0 12389075 12389075 14687 0 0 7144
2 5995747 12118373 0 0 0 0 6038040 6038040 42293 0 0 8968
3 3245929 6571235 0 0 3 3 3272386 3272386 26457 0 0 13205
4 1018810 2094536 0 0 0 0 1037782 1037782 18972 0 0 5843
5 3175371 6374045 0 0 1 1 3183138 3183138 7767 0 0 3654
6 1851746 3764473 0 0 0 0 1872073 1872073 20327 0 0 9037
7 2503081 5045008 0 0 1 1 2516029 2516029 12948 0 0 6580
8 19164914 38353829 0 0 20 20 19172901 19172901 7987 0 0 1389
9 15009332 30028700 0 0 2 2 15012676 15012676 3344 0 0 894
10 5573107 11166435 0 0 2 2 5579846 5579846 6739 0 0 1608
11 14630202 29272052 0 0 1 1 14634084 14634084 3882 0 0 1250
12 0 0 0 0 0 0 0 0 0 0 0 0
13 0 0 0 0 0 0 0 0 0 0 0 0
14 0 0 0 0 0 0 0 0 0 0 0 0
15 0 0 0 0 0 0 0 0 0 0 0 0
16 0 0 0 0 0 0 0 0 0 0 0 0
17 0 0 0 0 0 0 0 0 0 0 0 0
18 0 0 0 0 0 0 0 0 0 0 0 0
19 0 0 0 0 0 0 0 0 0 0 0 0
20 0 0 0 0 0 0 0 0 0 0 0 0
21 0 0 0 0 0 0 0 0 0 0 0 0
22 0 0 0 0 0 0 0 0 0 0 0 0
23 0 0 0 0 0 0 0 0 0 0 0 0
24 0 0 0 0 0 0 0 0 0 0 0 0
25 0 0 0 0 0 0 0 0 0 0 0 0
26 0 0 0 0 0 0 0 0 0 0 0 0
27 0 0 0 0 0 0 0 0 0 0 0 0
28 0 0 0 0 0 0 0 0 0 0 0 0
29 0 0 0 0 0 0 0 0 0 0 0 0
30 0 0 0 0 0 0 0 0 0 0 0 0
31 0 0 0 0 0 0 0 0 0 0 0 0
32 0 0 0 0 0 0 0 0 0 0 0 0
*** Timewarps
FEE ADC Pause Resume SYNC100 WR48-63 Disc MBS Undefined Samples
0 0 0 0 0 0 0 0 0 0
1 0 0 0 0 0 0 0 0 0
2 0 0 0 0 0 0 0 0 0
3 0 0 0 0 0 0 0 0 0
4 0 0 0 0 0 0 0 0 0
5 0 0 0 0 0 0 0 0 0
6 0 0 0 0 0 0 0 0 0
7 0 0 0 0 0 0 0 0 0
8 0 0 0 0 0 0 0 0 0
9 0 0 0 0 0 0 0 0 0
10 0 0 0 0 0 0 0 0 0
11 0 0 0 0 0 0 0 0 0
12 0 0 0 0 0 0 0 0 0
13 0 0 0 0 0 0 0 0 0
14 0 0 0 0 0 0 0 0 0
15 0 0 0 0 0 0 0 0 0
16 0 0 0 0 0 0 0 0 0
17 0 0 0 0 0 0 0 0 0
18 0 0 0 0 0 0 0 0 0
19 0 0 0 0 0 0 0 0 0
20 0 0 0 0 0 0 0 0 0
21 0 0 0 0 0 0 0 0 0
22 0 0 0 0 0 0 0 0 0
23 0 0 0 0 0 0 0 0 0
24 0 0 0 0 0 0 0 0 0
25 0 0 0 0 0 0 0 0 0
26 0 0 0 0 0 0 0 0 0
27 0 0 0 0 0 0 0 0 0
28 0 0 0 0 0 0 0 0 0
29 0 0 0 0 0 0 0 0 0
30 0 0 0 0 0 0 0 0 0
31 0 0 0 0 0 0 0 0 0
32 0 0 0 0 0 0 0 0 0
*** Program elapsed time:43185.973s ( 0.741 blocks/s, 0.046 Mb/s)
|
| Attachment 34: 200311_1219_feetemps.png
|
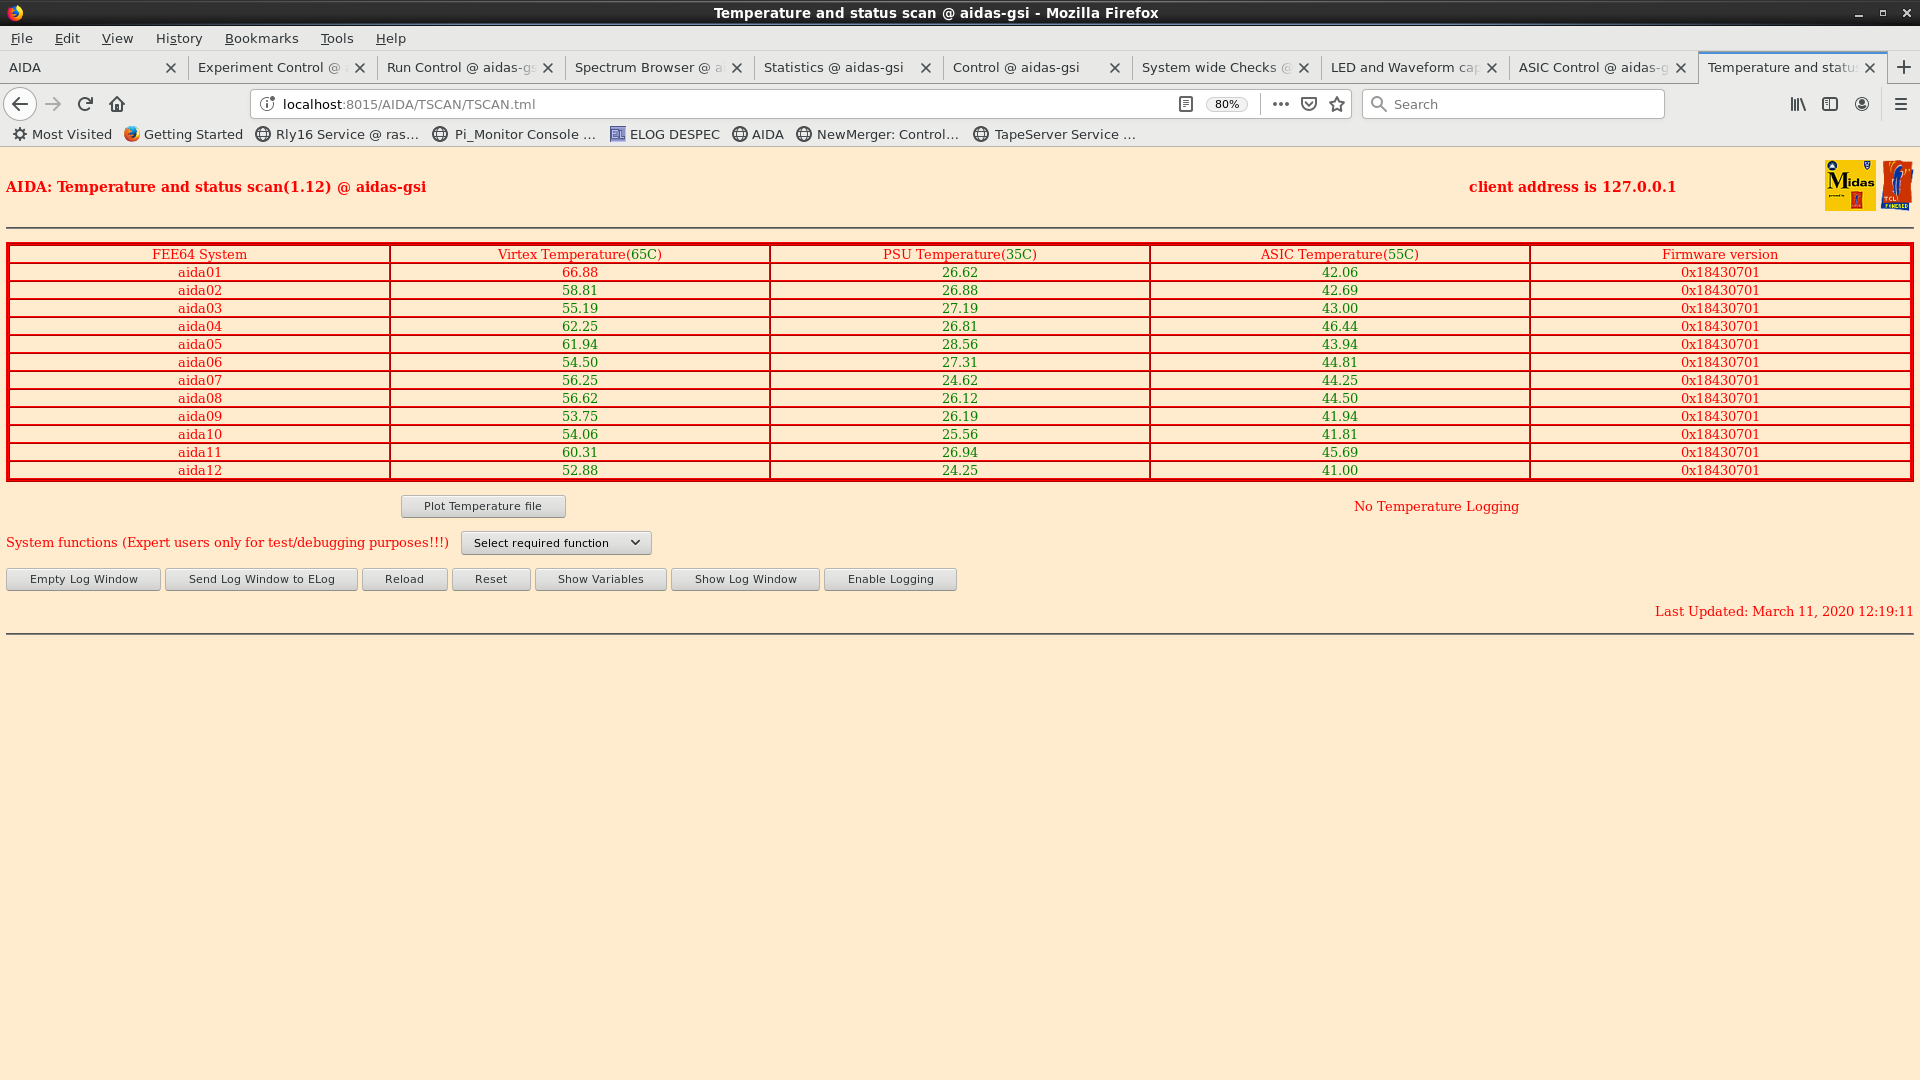
|
| Attachment 35: 200311_1221_leakcurrents.png
|
|
| Attachment 36: 200311_1220_goodevents.png
|

|
| Attachment 37: 200311_1300_rateshistogram.png
|

|
| Attachment 38: 200311_1440_FEETEMPS.png
|

|
| Attachment 39: 200311_1442_leakcurrents.png
|
|
| Attachment 40: 200311_1442_GOODEVENTS.png
|

|
| Attachment 41: 200311_1638_temp.png
|

|
| Attachment 42: 200311_1639_bias.png
|
|
| Attachment 43: 200311_1639_stats.png
|

|
|
142
|
Wed Mar 11 17:21:33 2020 |
CA, TD, OH | Wednesday 11 March 16.00-00.00 |
18.25 DAQ currently running No Storage mode

ASIC settings 2019Oct31-13.24.23
     slow comparator 0xa

BNC PB-5 pulser
     amplitude 1.0V , attenuator x1
     frequency 2Hz
     decay time 1ms

DSSSD biases & leakage currents OK - attachment 1
FEE64 temps OK - attachment 2
good events statistics OK - attachment 3

system wide checks - OK

WR timestamp control - attachments 4 & 5

merger & TapeServer OK - attachments 6-8

rate spectra - attachment 9

1.8.L spectra - attachments 10 & 11
  aida03 72 ch FWHM

20:36 DSSSD biases & leakage currents OK - attachment 12
      FEE64 temps OK - attachment 13
      good events statistics OK - attachment 14

      all system wide checks ok

21.50 beam starts back up
      DAQ running, TapeServer now writing to file R7_0
      data rate ~ 25 Mb/s
      data forwarding to MBS ok
      merger ok, data item rate ~ 2.7 million items/sec
      spill time length is now 3 seconds
      1500 count rate per spill, ~ 300 Hz implant rate in AIDA

22.35 FEE64 temps OK - attachment 15
      good event statistics ok - attachment 16
      detector bias/ leakage currents ok - attachment 17

      all system wide checks ok

22.47 attachments 18 & 19 - high energy spectra for all FEE64 (1.8.H)

      attachment 20 - hit rate spectra for all FEE64

23.02 beam down
      on file R7_55

23.11 beam back online
      on file R7_61

23.15 system wide checks all ok

      detector bias/ leakage currents ok - attachment 21

      good event statistics ok - attachment 22

FEE64 temperatures ok - attachment 23 |
| Attachment 1: 1.png
|

|
| Attachment 2: 2.png
|

|
| Attachment 3: 3.png
|

|
| Attachment 4: 4.png
|
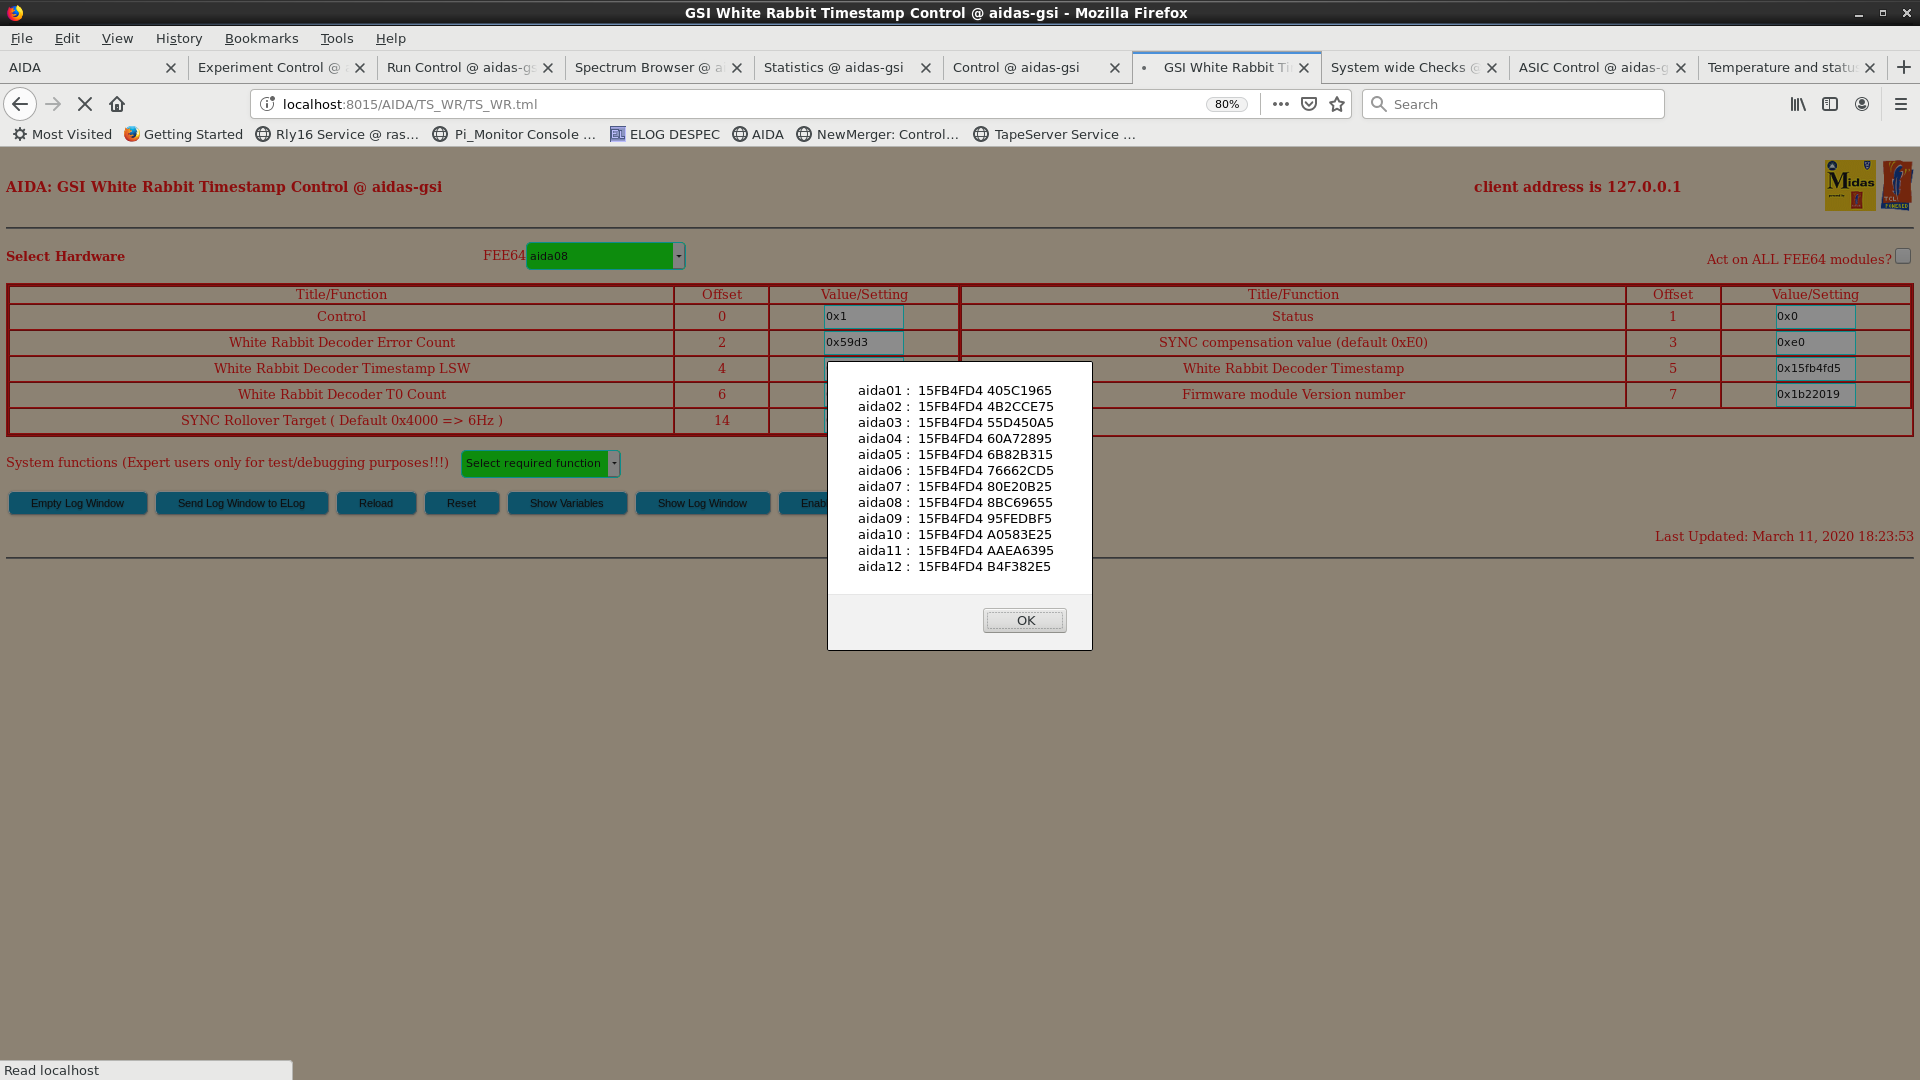
|
| Attachment 5: 5.png
|
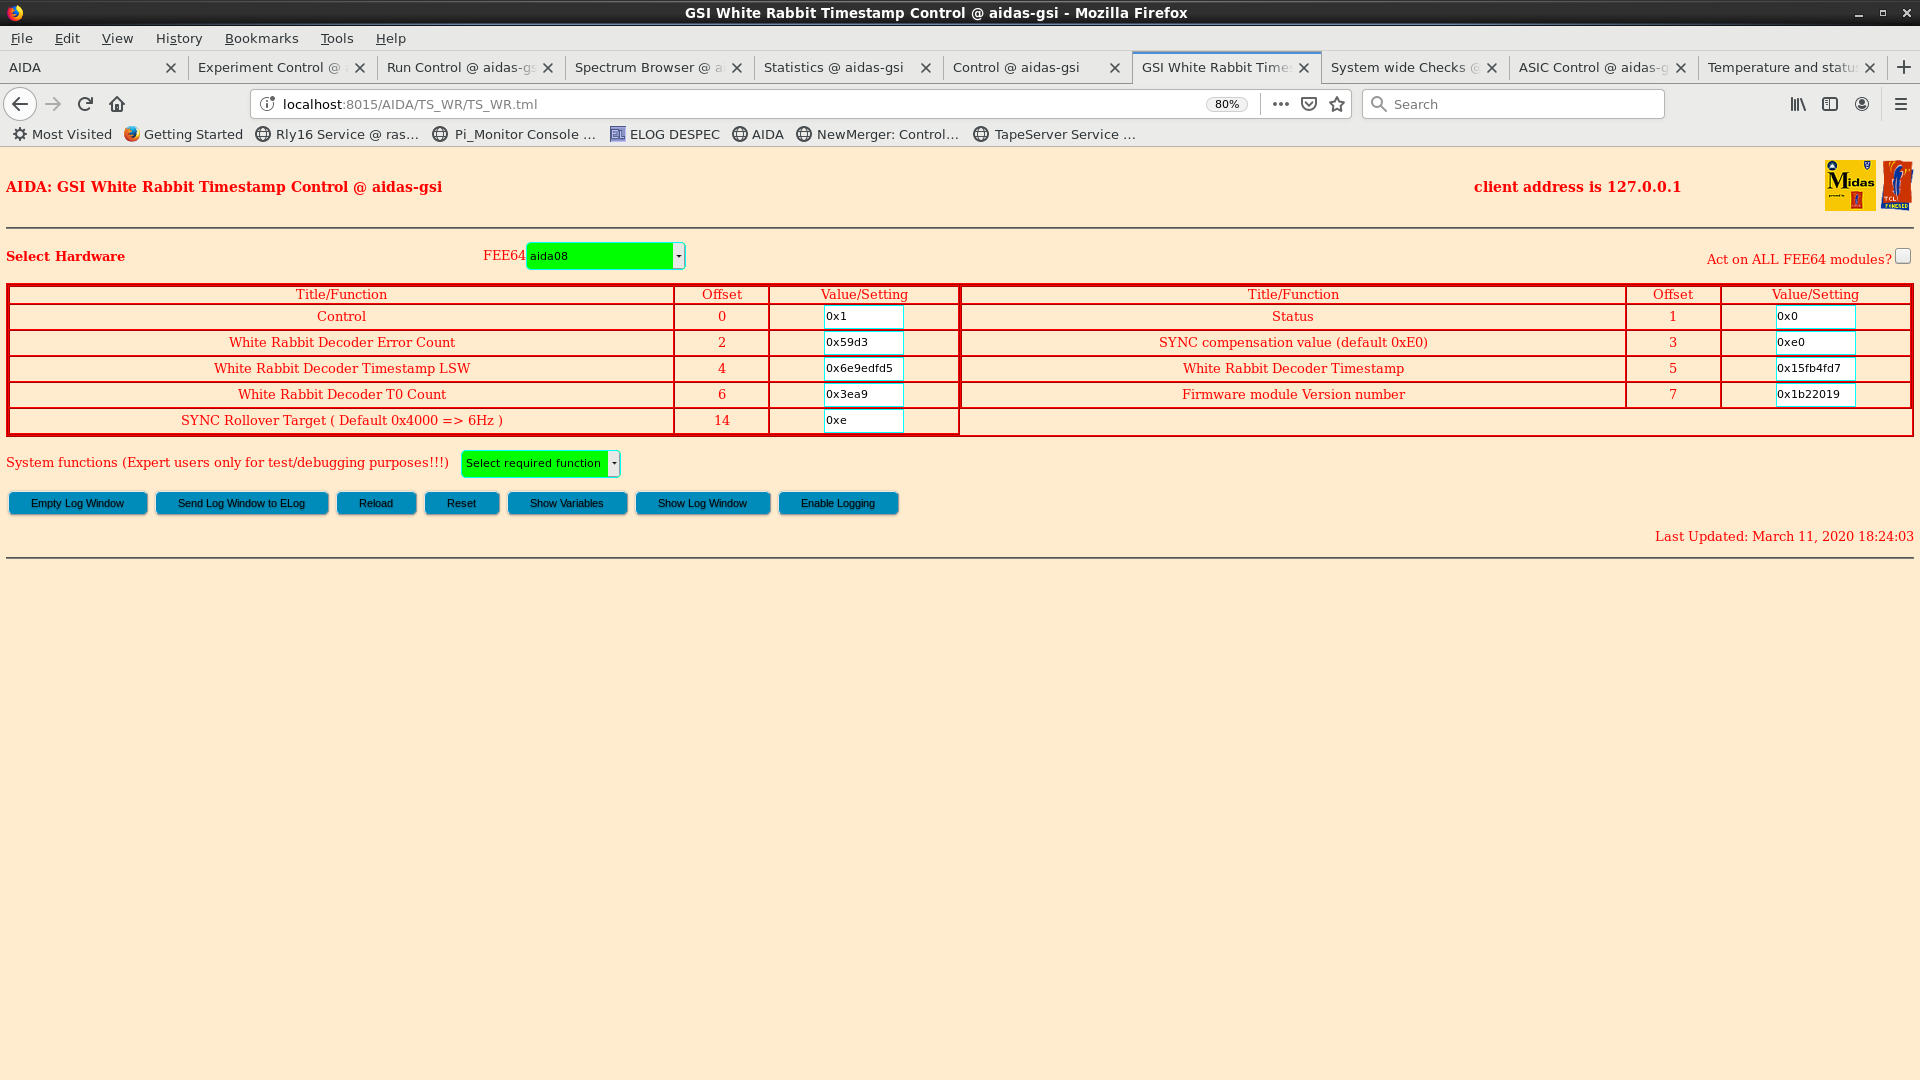
|
| Attachment 6: 6.png
|
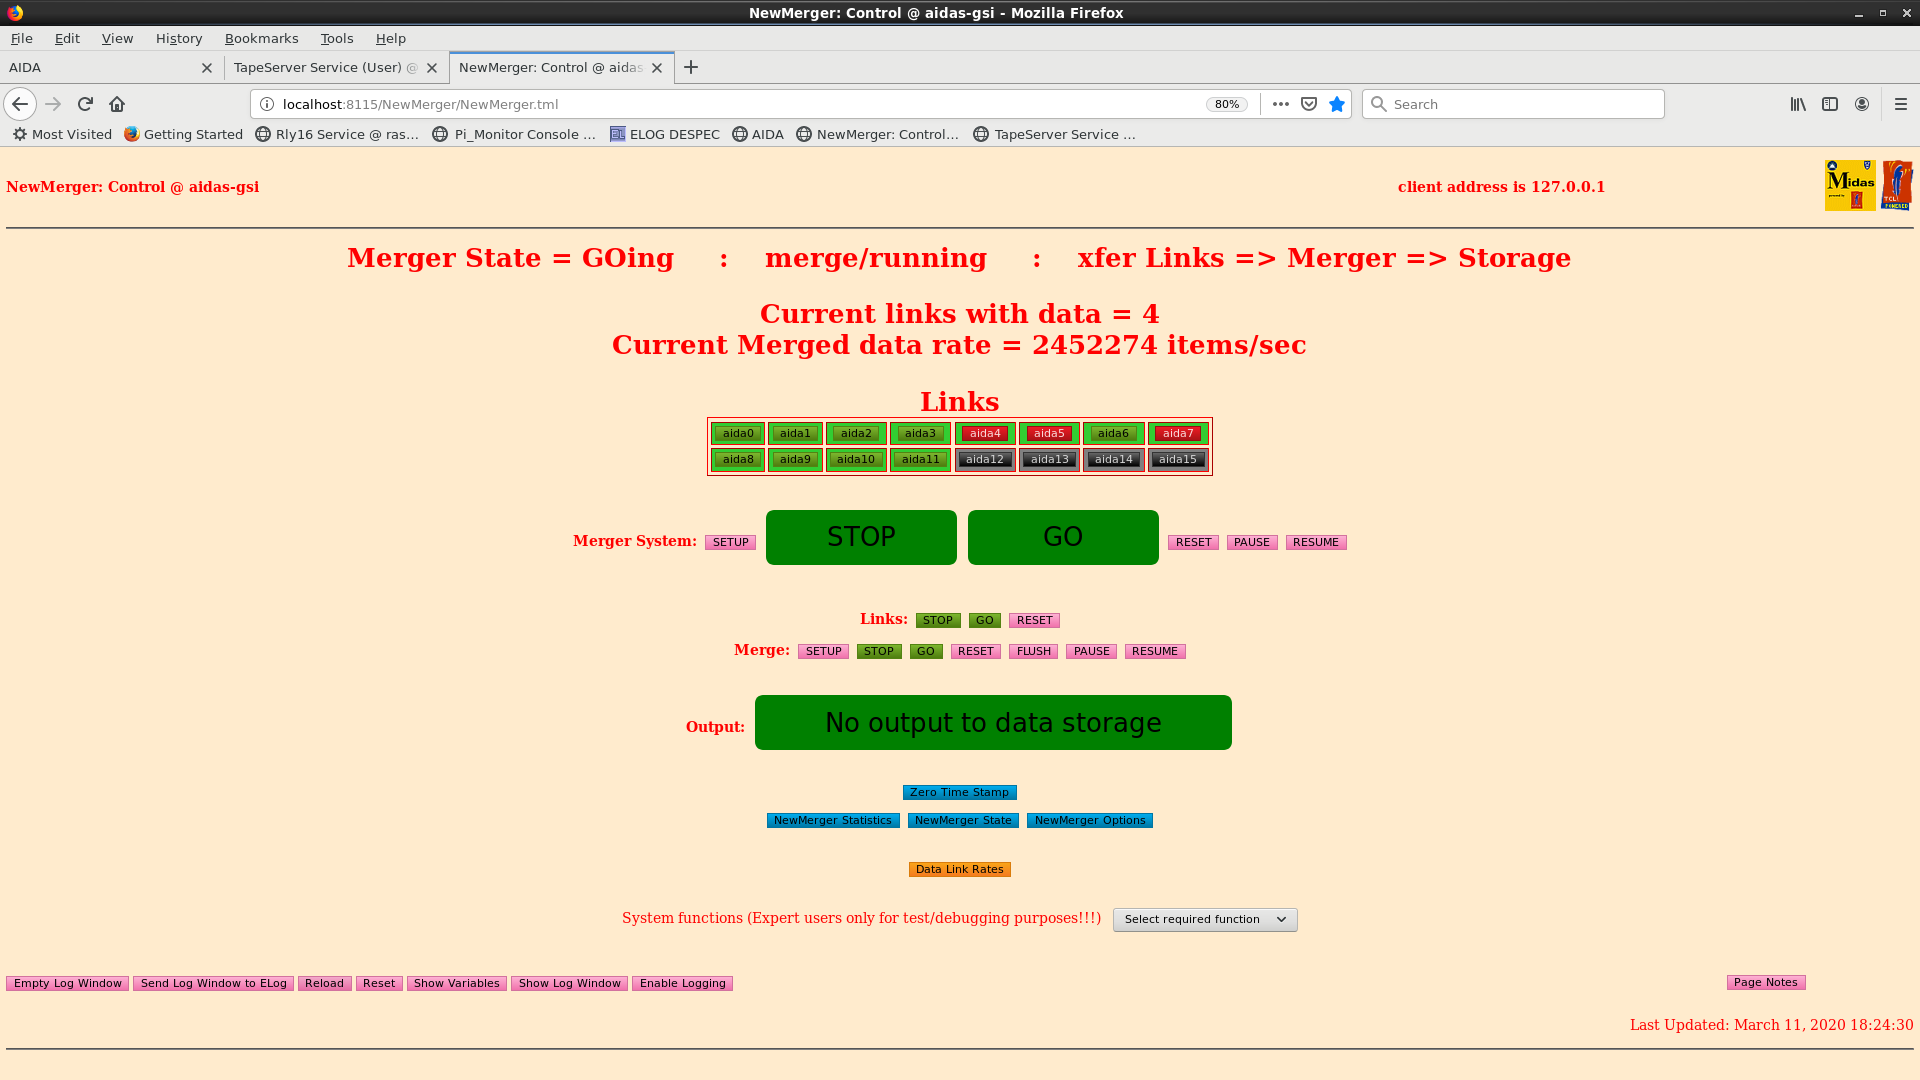
|
| Attachment 7: 7.png
|
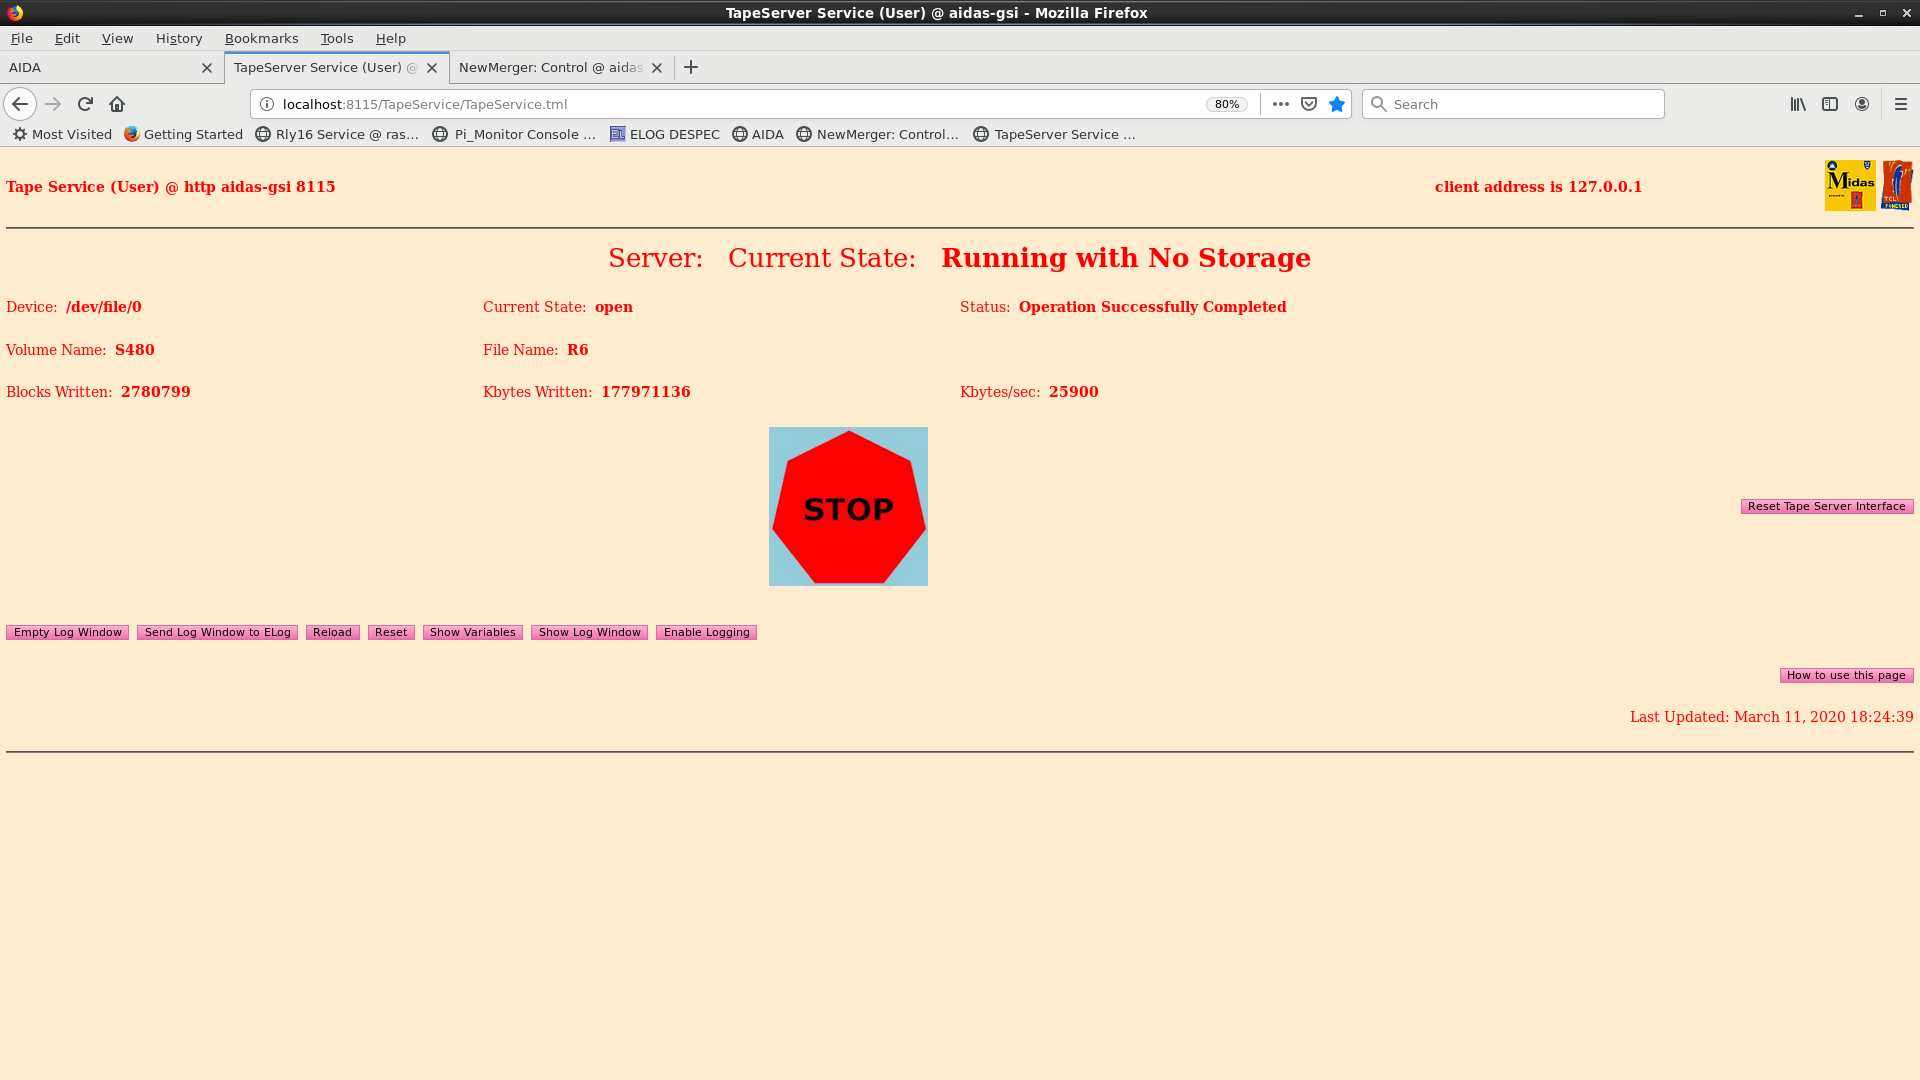
|
| Attachment 8: 8.png
|

|
| Attachment 9: 10.png
|

|
| Attachment 10: 11.png
|
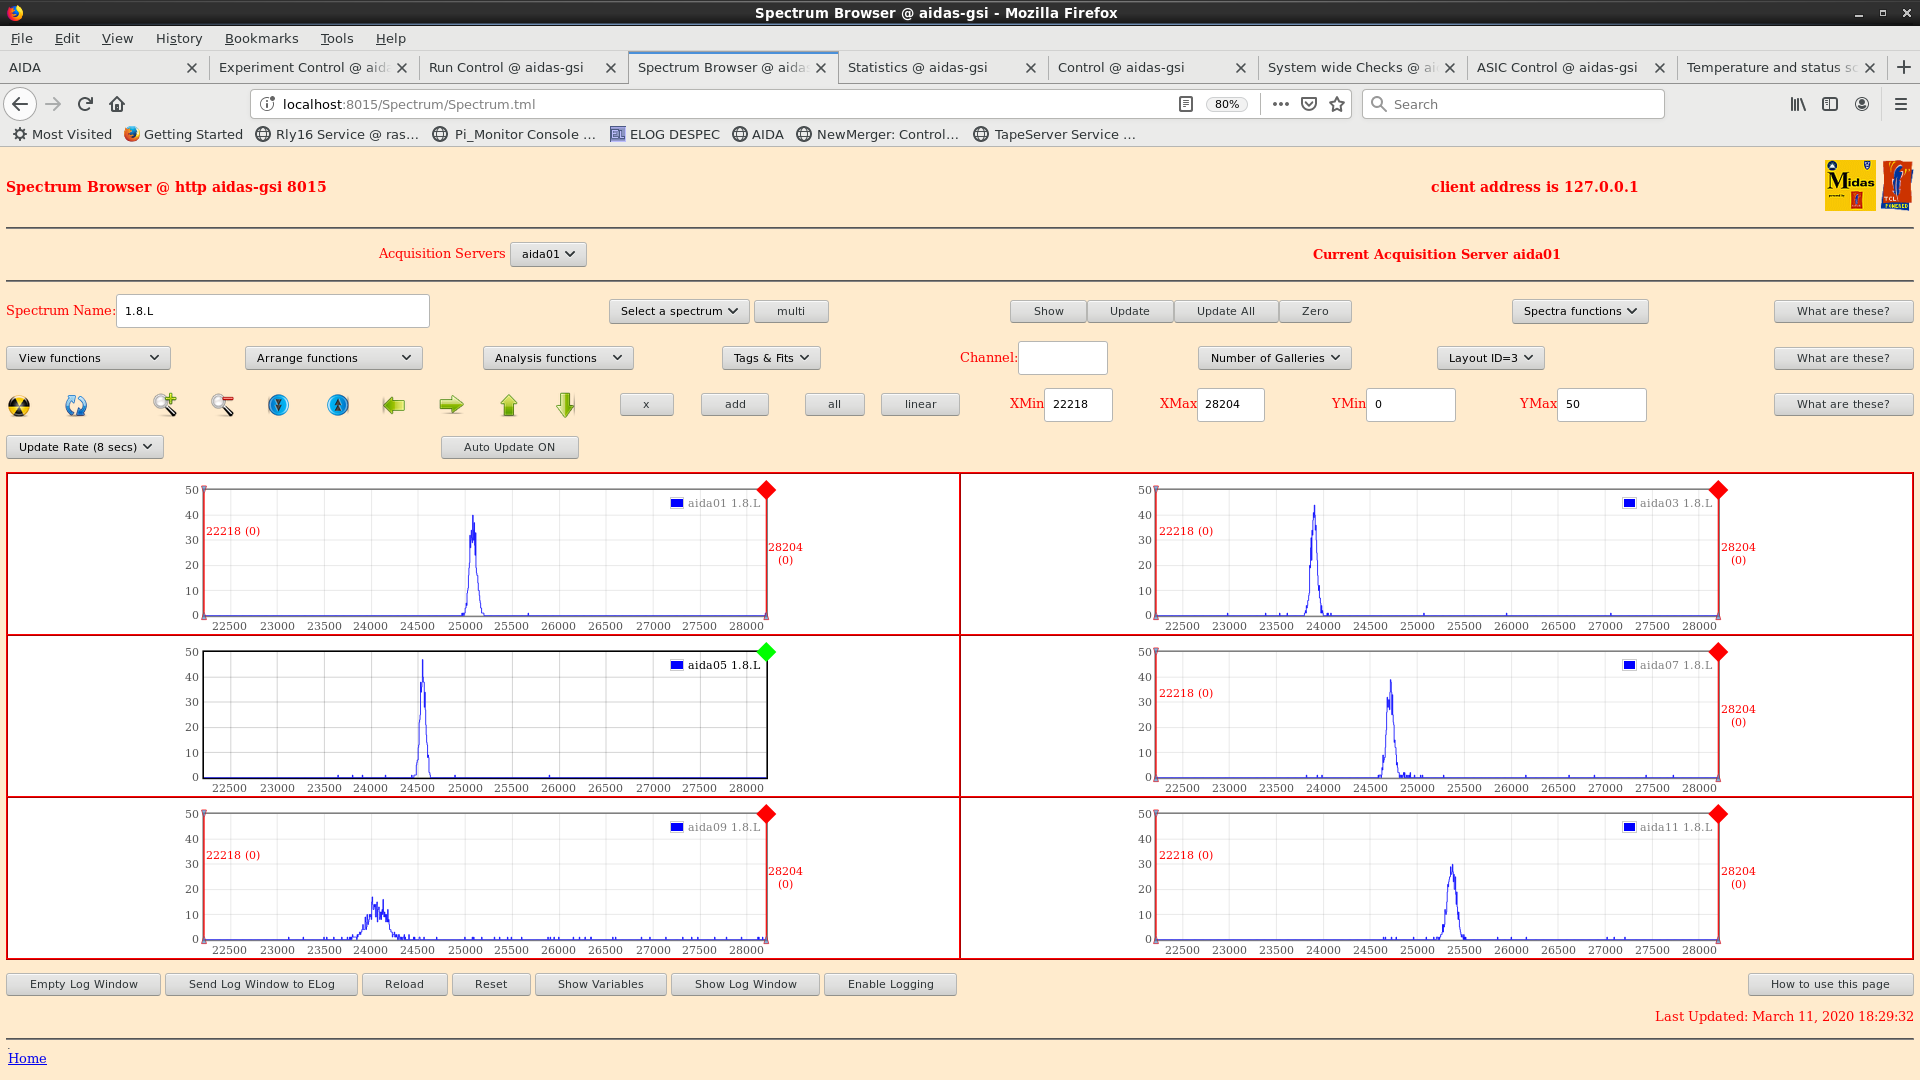
|
| Attachment 11: 12.png
|
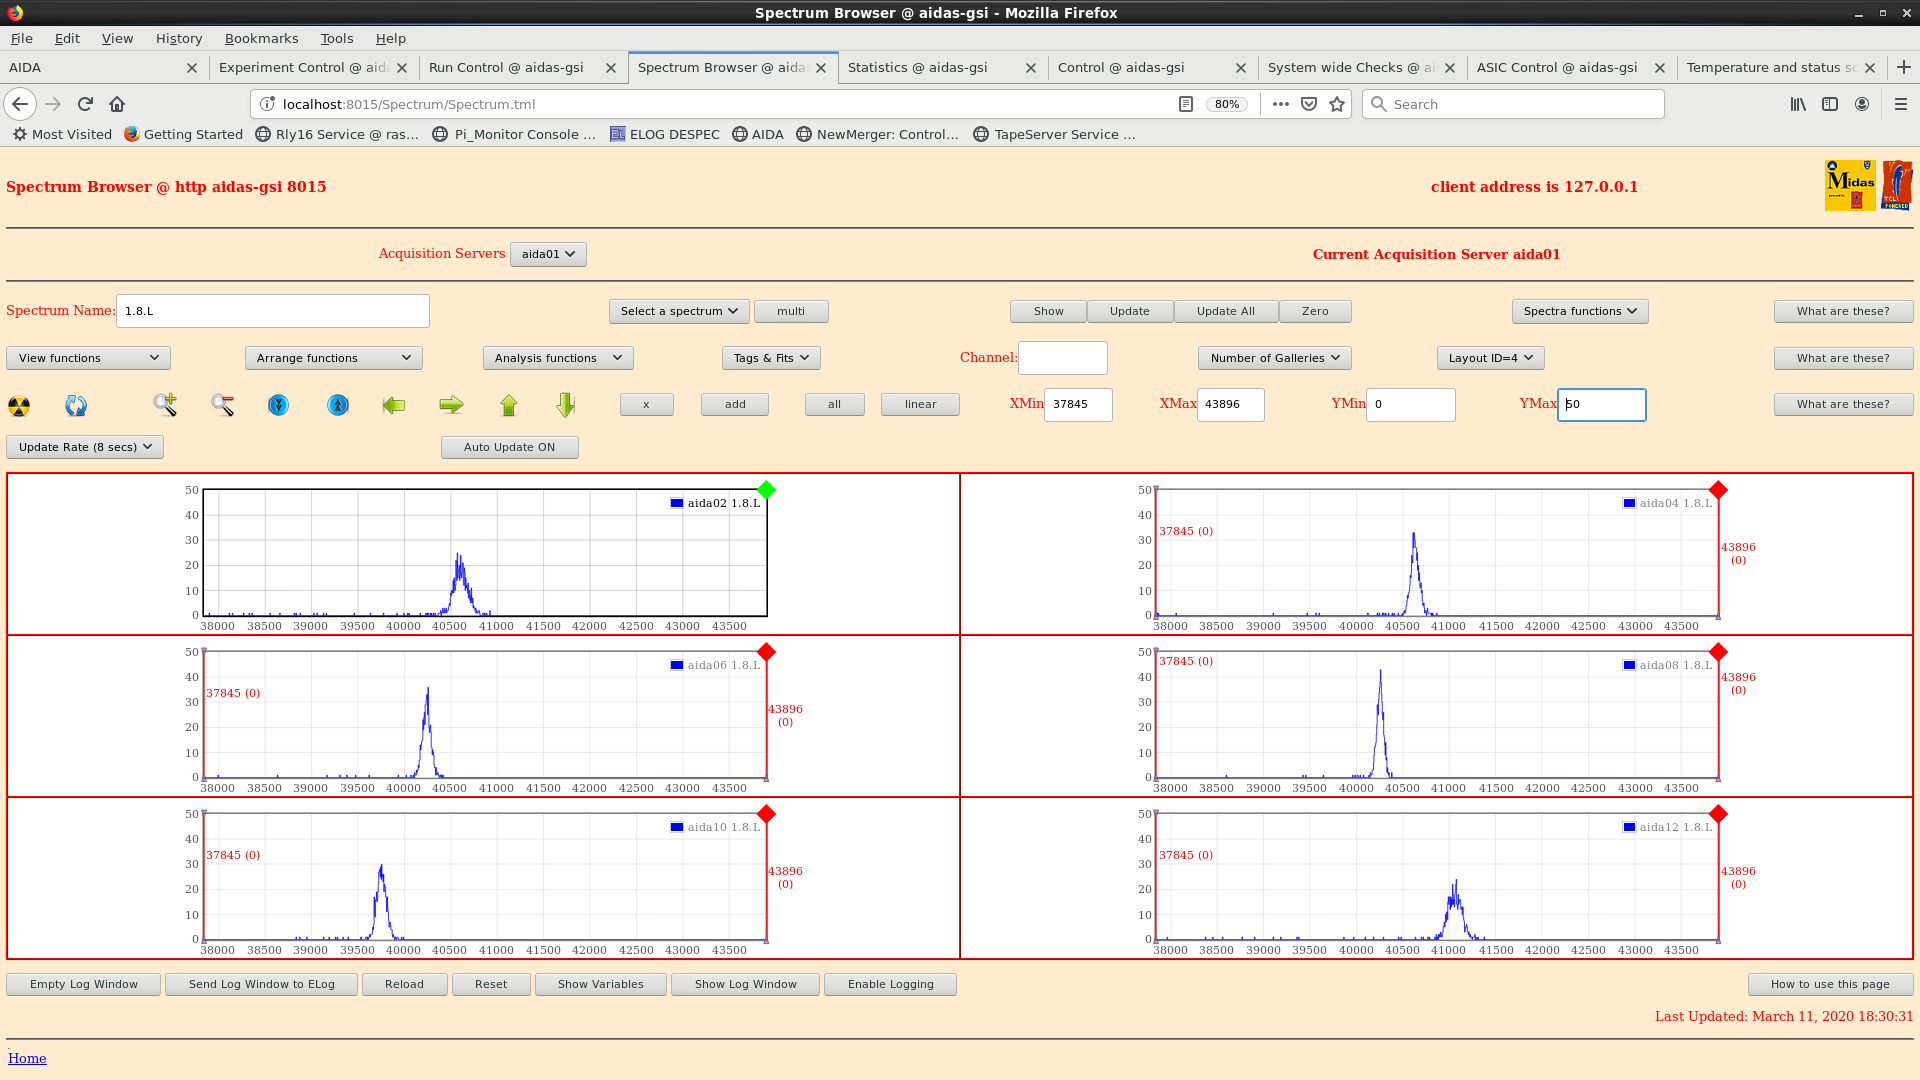
|
| Attachment 12: 200311_2035_bias.png
|

|
| Attachment 13: 200311_2034_temps.png
|

|
| Attachment 14: 200311_2034_stats.png
|

|
| Attachment 15: 200311_2233_temp.png
|

|
| Attachment 16: 200311_2234_stats.png
|

|
| Attachment 17: 200311_2235_bias.png
|
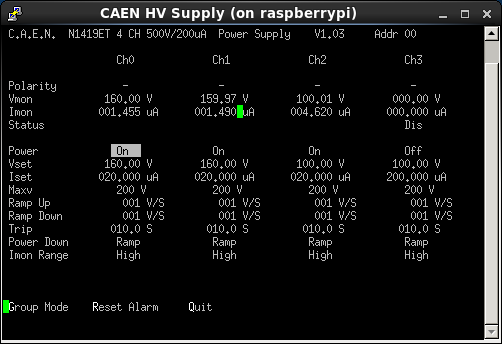
|
| Attachment 18: 200311_18h_odd.png
|
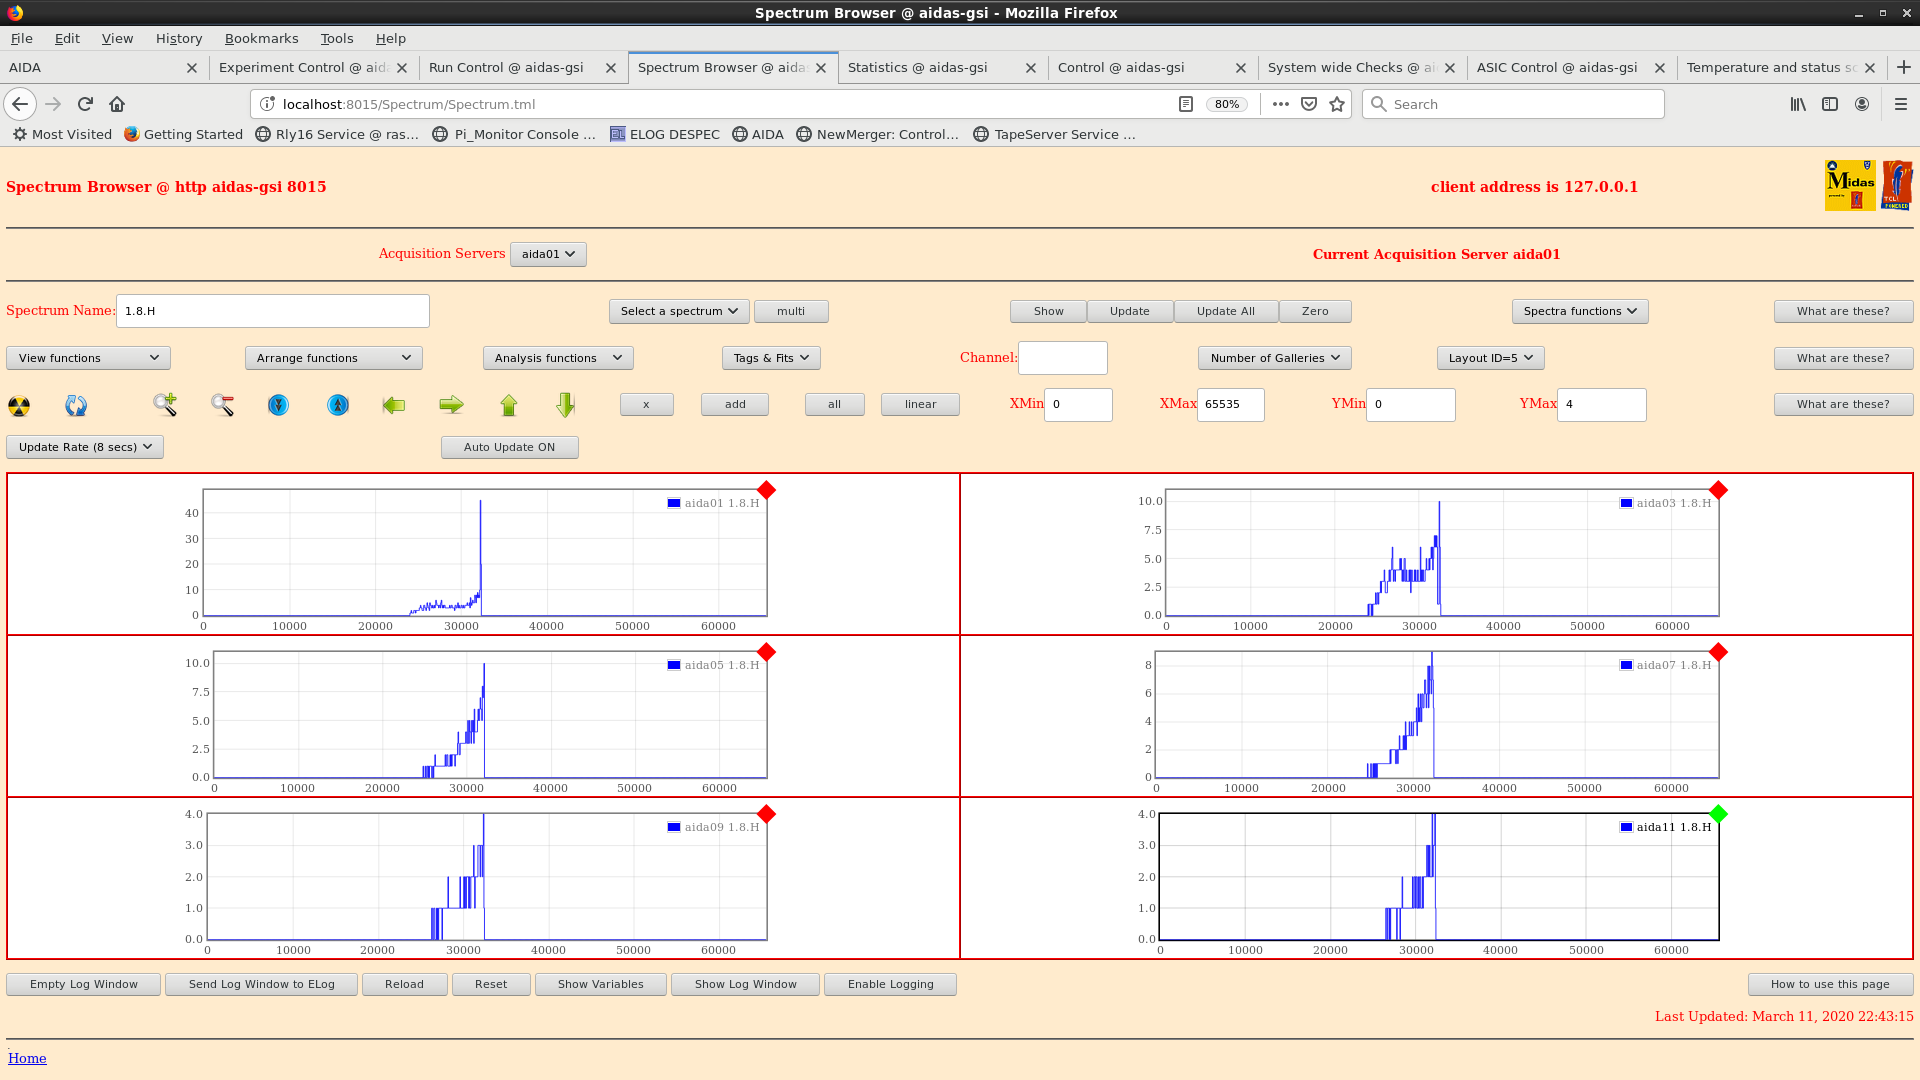
|
| Attachment 19: 200311_2245_18h_even.png
|
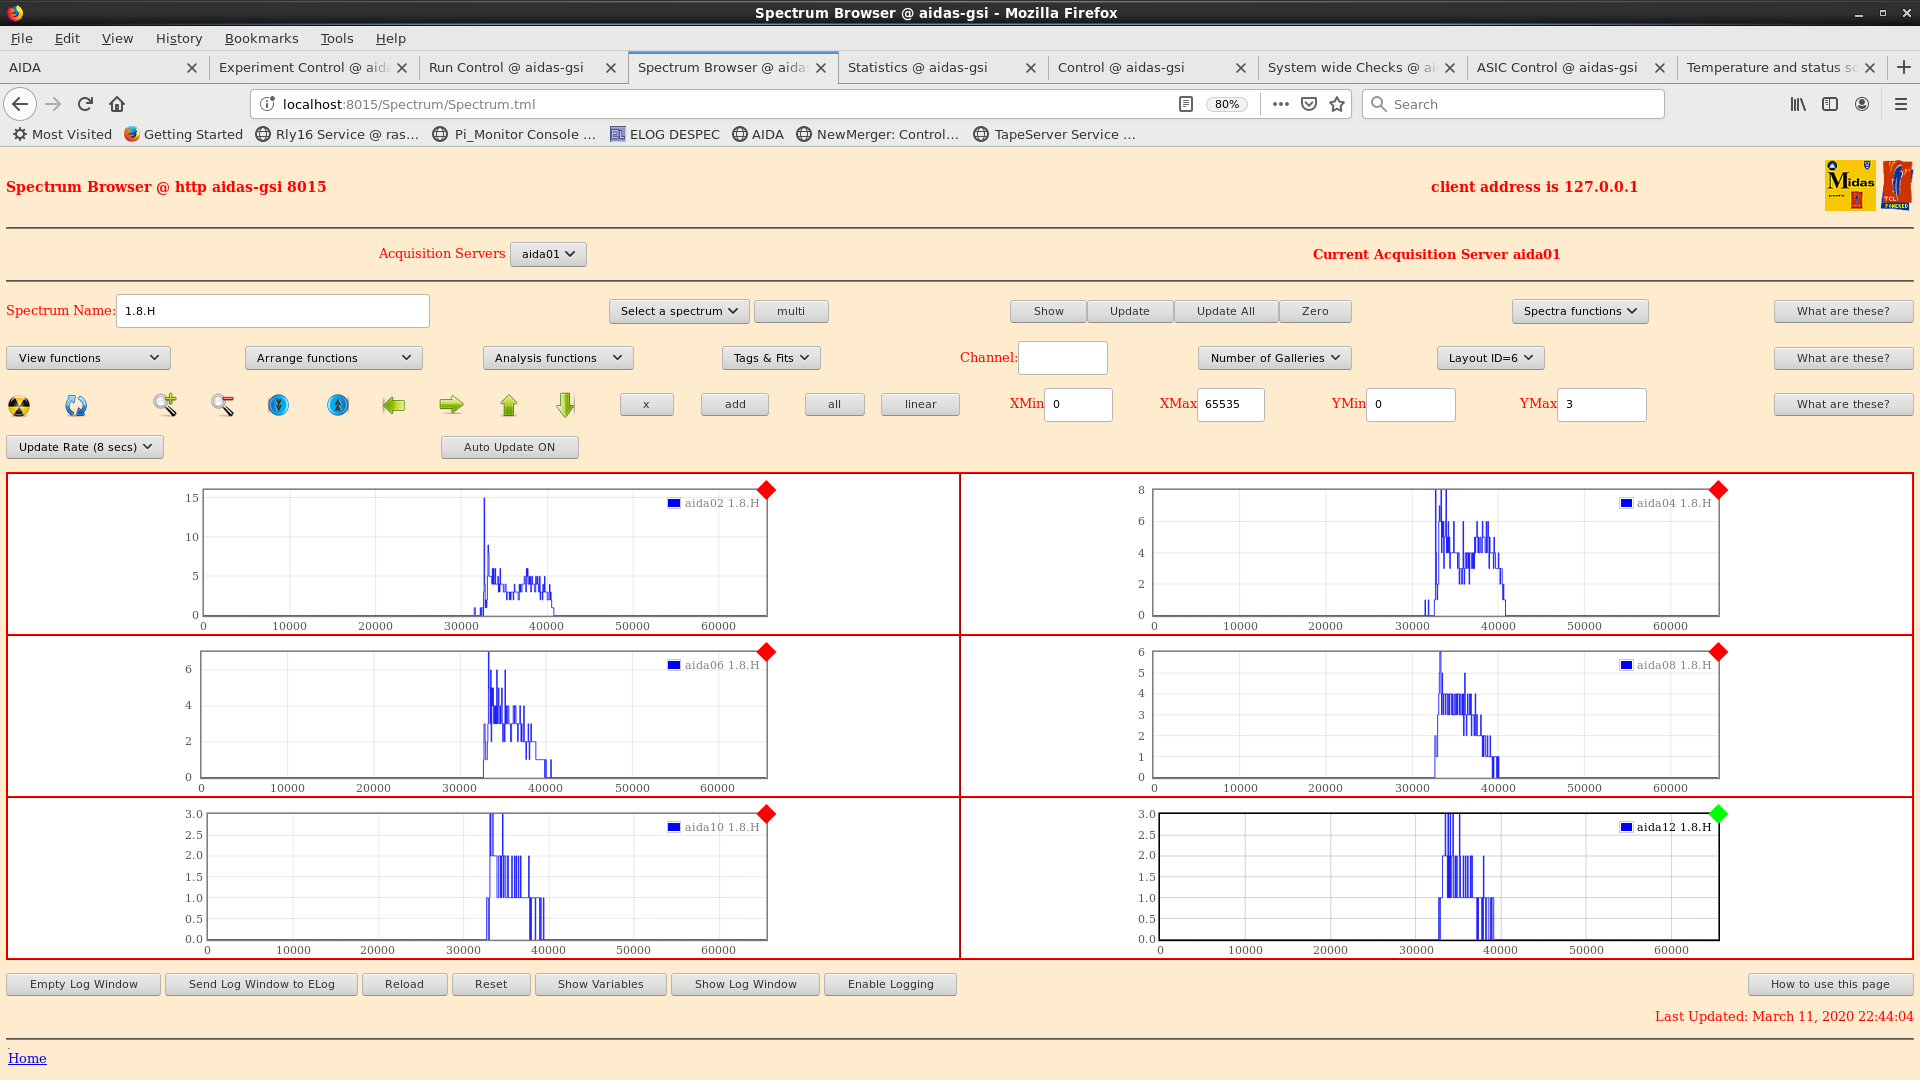
|
| Attachment 20: 200311_2242_rates.png
|
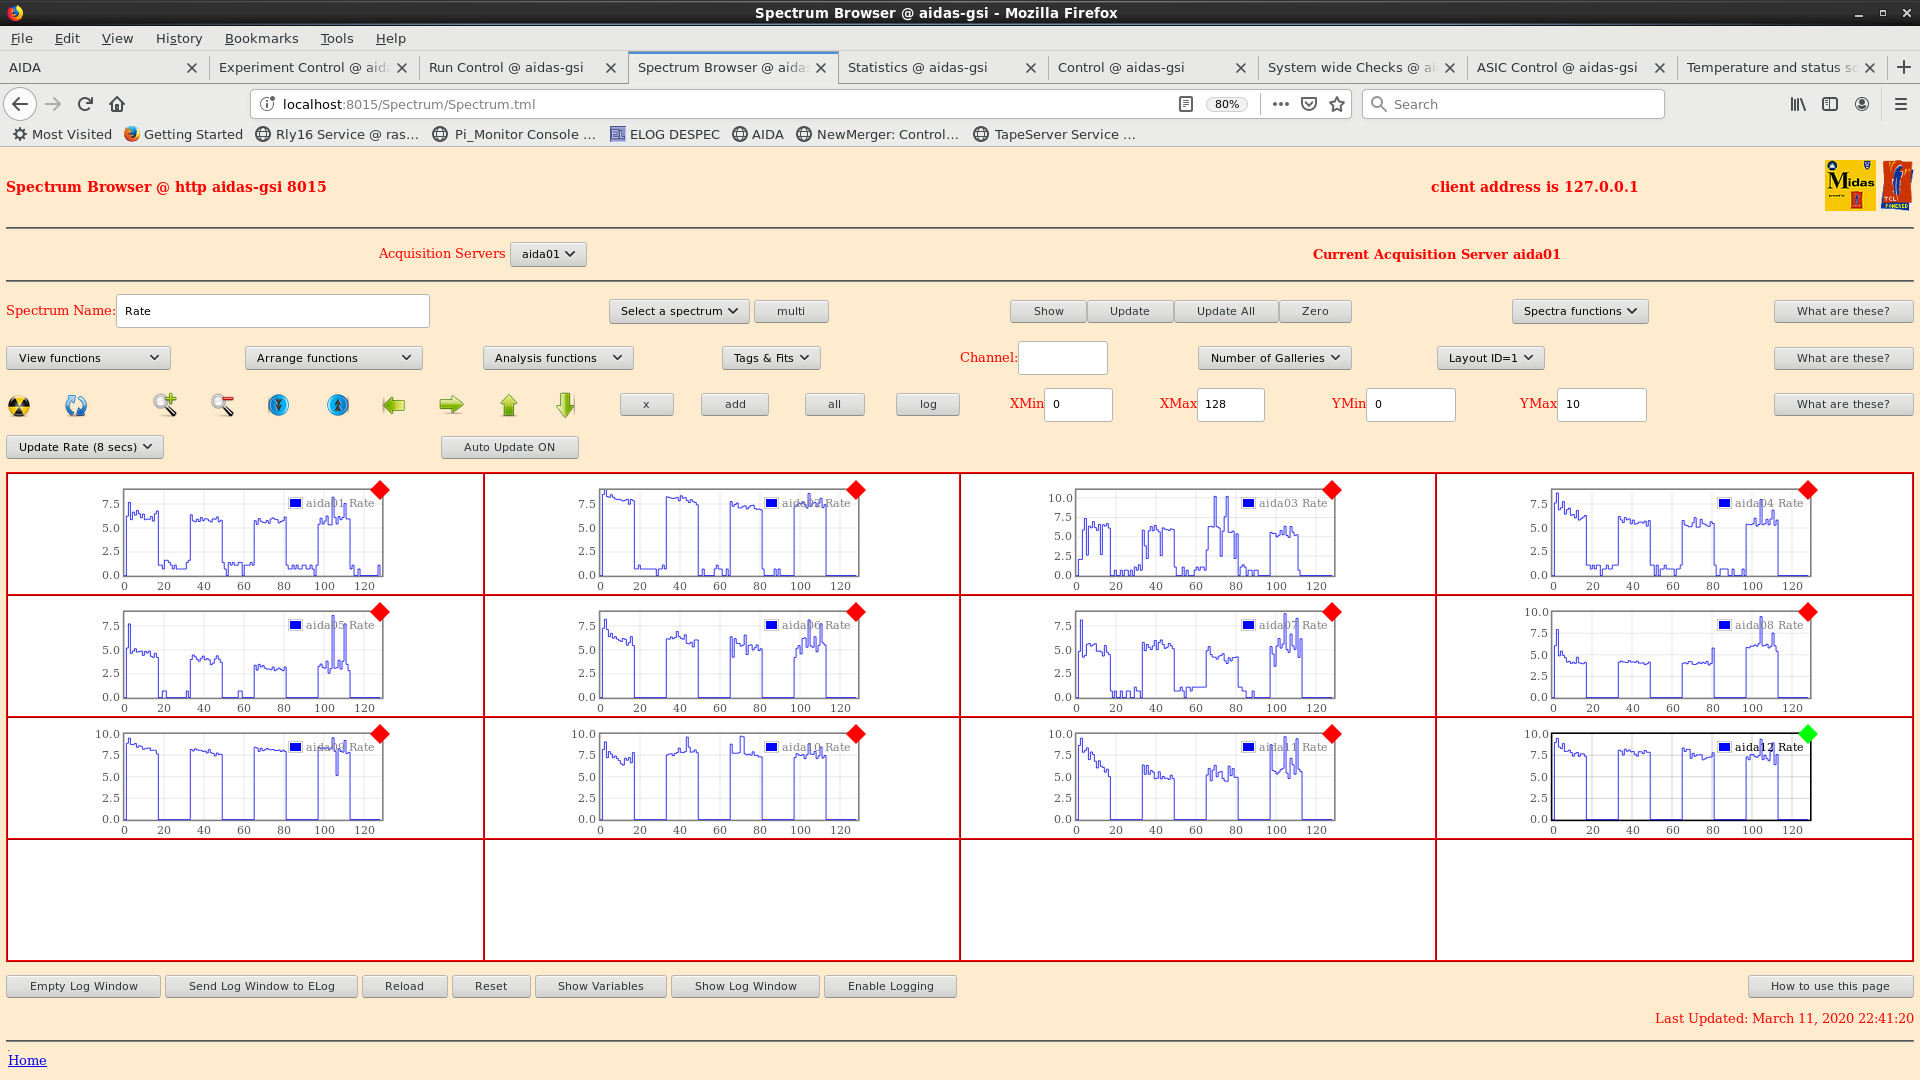
|
| Attachment 21: 200311_2314_bias.png
|

|
| Attachment 22: 200311_2314_stats.png
|
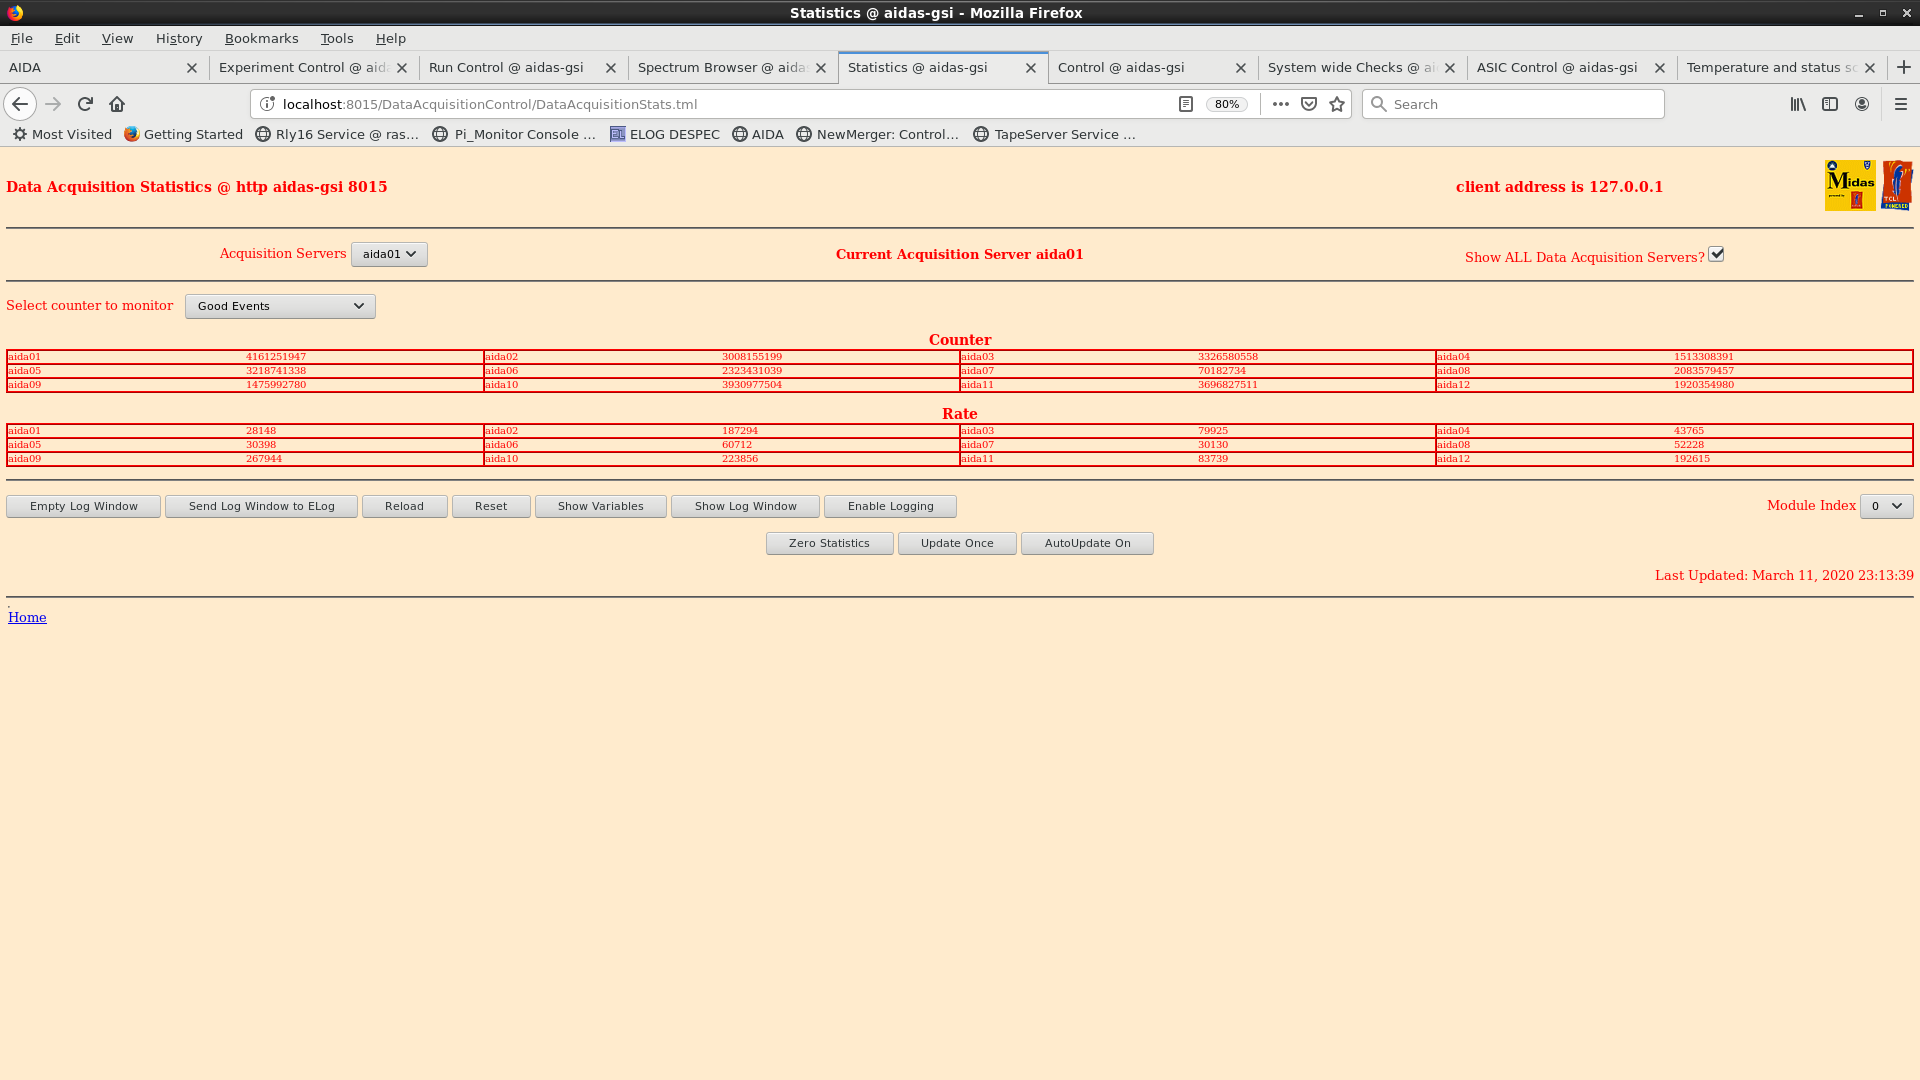
|
| Attachment 23: 201103_2313_temp.png
|

|
|
187
|
Wed Mar 10 07:16:02 2021 |
OH, LS | Wednesday 10th March 08:00-24:00 |
08:16 System wide checks all ok
      Statistics - attachment 1
      Temperatures - attachment 2
      bias - attachment 3
      Merger running 4.5e6 events per second
      Tape data writing at 42MB per second

      Currently no beam

09:45 While there is no beam we will perform a longer test of the new merger.
      Run R20 stopped and merger changed to neew version
      Started R21.

      The now usual behaviour of additional files at start of merge observed.
      N.B. That there was no toggling of the merger no storage or tapeserver no storage. Both were running before the DAQ was
set to going
-rw-rw-r--. 1 npg npg  64K Mar 10 09:50 R21_0
-rw-rw-r--. 1 npg npg  64K Mar 10 09:50 R21_1
-rw-rw-r--. 1 npg npg  64K Mar 10 09:50 R21_2
-rw-rw-r--. 1 npg npg  64K Mar 10 09:50 R21_3
-rw-rw-r--. 1 npg npg  64K Mar 10 09:50 R21_4
-rw-rw-r--. 1 npg npg  64K Mar 10 09:50 R21_5
-rw-rw-r--. 1 npg npg  64K Mar 10 09:50 R21_6
-rw-rw-r--. 1 npg npg  64K Mar 10 09:50 R21_7
-rw-rw-r--. 1 npg npg  64K Mar 10 09:50 R21_8
-rw-rw-r--. 1 npg npg  64K Mar 10 09:50 R21_9
-rw-rw-r--. 1 npg npg  64K Mar 10 09:50 R21_10
-rw-rw-r--. 1 npg npg  64K Mar 10 09:50 R21_11
-rw-rw-r--. 1 npg npg  64K Mar 10 09:50 R21_12
-rw-rw-r--. 1 npg npg  64K Mar 10 09:50 R21_13
-rw-rw-r--. 1 npg npg  64K Mar 10 09:50 R21_14
-rw-rw-r--. 1 npg npg  64K Mar 10 09:50 R21_15
-rw-rw-r--. 1 npg npg  64K Mar 10 09:50 R21_16
-rw-rw-r--. 1 npg npg 407M Mar 10 09:50 R21_17
-rw-rw-r--. 1 npg npg 1.6G Mar 10 09:52 R21_18

     TapeData rate of 13280 kB/sec
     No errors observed in ucesb
     Correlations seen between time machine in AIDA and Ge in online
     Pulser rate in the online makes sense
     With the current data rate remaining HDD space on current drive will last around 89 hours.

09.20 analysis of file R21_27
      ignore rates/elapsed idle time - timestamp incomplete until first info code 4 & 5 data


10:24 Message while performing system wide checks:
Get returned with an error
error: SOAP http transport timed out after 10000 ms
NONE
error: SOAP http transport timed out after 10000 ms
    while executing
"$transport $procVarName $url $req"
    (procedure "::SOAP::invoke" line 18)
    invoked from within
"::SOAP::invoke ::SOAP::_XAIDAAccessClient__Get 10"
    ("eval" body line 1)
    invoked from within
"eval ::SOAP::invoke ::SOAP::_XAIDAAccessClient__Get $args"
    (procedure "XAIDAAccessClient__Get" line 1)
    invoked from within
"XAIDAAccessClient__Get $Addr"

     aida02 restarted itself during the reset process
     Looking at the log messages on aida02 cannot see any reason for the cause of the restart.
     System wide checks following the restart all ok.
     When restarting the MBS relay errors observed until a timestamp was observed:
     Warning: MBSTimeF = 0; 0x0000000000000000 0x00000000 0x00000000 0x00000000

10:55 Statistics - attachment 5
      Temperature - attachment 6
      Bias - attachment 7

11:03 Time machine correlation spectra with new merger
      AIDA - FATIMA - Attachment 8
      AIDA - Ge - Attachment 9

11:30 An implant rate observed in DSSD2. With no beam. A check of the ASIC control restored the rate to 0. Did not check the
layout to determine which FEE/ASIC caused the events before checking ASIC control

12:12 System wide checks all ok *except adc calibration which is same as before
      Statistics - attachment 10
      Temperature - attachment 11
      Bias and leakage currents ok - attachment 12

      A note on the statistics. aida11 has doubled in rate today and aida07 has gone down somewhat.

      After talking with the DESPEC locals. Helena and Juergen entere at S4 at 9:40 German time.
      They stood on the platform but stayed away from the snout, they added two channels to the scope and adjusted the ribbon
cable from the VME scalers.
      Looking at the leakage currents on Grafana at 9:50 German time a fluctuation can be observed in the leakage currents of
DSSD3.

12:50 We have waveforms for some FEES
      Layout 7 attachment -14
      Layout 8 - attachment 15

14.00 (LS)
      Still no beam
      System wide checks okay except same as before:
      **FEE64 module aida07 failed
      FEE64 module aida10 failed
      Calibration test result: Passed 10, Failed 2
      If any modules fail calibration , check the clock status and open the FADC Align and Control browser page to rerun
      calibration for that module**

      Statistics (attachment16)
      Checked rate in aida07 and aida11 following Oscars previous comment, last four statistics attachments(1,5,10,16):
      aida07 - 124772, 81773, 95526, 101493 - seems to be increasing back up
      aida11 - 72901, 95942, 176139, 93799 - more than doubled but large drop in rate back below 100k will keep an eye on

      FEE Temps (attachment17)
      Leakage currents written to sheets(attachment18)
      Merger ~ 45M items/s
      TapeServer~ 14MB/s

14.10 While performing checks informed that some beam is back, and they have started a run file (no. S452f113), AIDA on file
      R22_98, rate spectra attached (attachment19)

14.10 During the meeting errors appeared in ucesb, checked these timestamps with the corresponding AIDA files and saw
      no timewarps so we are not losing anything.
      Restarted MBS relay, errors have not reappeared so far

16.10 System wide checks all okay except aida07 and aida10 fail calibration (same as previous checks)
      Statistics (attachment20)
      Rate spectra (attachment21)
      FEE Temps (attachment22)
      Leakage currents written to sheets(attachment23)
      Merger ~ 4.3M items/s
      TapeServer~ 14MB/s
      Current file R22_148

16.26 Increase rate in AIDA as target slits have been opened wider (attachment24), corresponding to runs starting from
S452f115
      Around R22_150

18.00 Analysis of R22_122 (before slit adjustments think +-3mm) and R22_178 (after slit adjustment to +-5mm)
      Rates of R22_122 (attachment25):
      First DSSSD (fee0-fee3) ~66/s
      Second DSSSD (fee4-fee7) ~49/s
      Third DSSSD (fee8-fee11) ~22/s

      Rates of R22_178 (attachment26):
      First DSSSD (fee0-fee3) ~122/s
      Second DSSSD (fee4-fee7) ~94/s
      Third DSSSD (fee8-fee11) ~49/s


18.10 System wide checks all okay except aida07 and aida10 fail calibration (same as previous checks)
      Statistics (attachment27)
      Rate spectra (attachment28)
      FEE Temps (attachment29)
      Leakage currents written to sheets(attachment30), look to be on the way down
      Merger ~ 4.5M items/s
      TapeServer~ 15MB/s

18.24 Several timestamp errors again which also happened earlier (14.10) restarted MBS relay like earlier

19:34 MBS DAQ Crashed
20:00 DAQ is still down. They have Sultan working on it.

20:21 DAQ is back but there are issues with land04 (The raid array data is written to. It was taken out during the lustre
reboot)
      We are borrowing a HDD from the SHIP group

20:30 System wide checks all ok
      Statistics - attachment 31
      Temperature - attachment 32
      Bias - attachment 33

22:10 MBS DAQ has crashed
      Merger terminal is now showing a large number of bad merge events

      It's taken a while but we have managed to get the DAQ back. We had to reset the AIDA MBS.


22:42 System wide checks all ok
      Statistics - attachment 34
      Temperature - Attachment 35
      Bias and leakage currents ok - attachment 36

23:33 System wide checks all ok - attachment 37
      Temperatures - attachment 38
Bias and leakage currents ok - attachment 39 |
| Attachment 1: 210310_0813_Stats.png
|

|
| Attachment 2: 210310_0813_Temp.png
|

|
| Attachment 3: 210310_0714_Bias.png
|

|
| Attachment 4: R21_27
|
*** TDR format 3.3.0 analyser - TD - January 2019
*** ERROR: READ I/O error: 5002
blocks: 32000
ADC data format: 259319480 ( 1687258.2 Hz)
Other data format: 2600520 ( 16920.2 Hz)
Sample trace data format: 0 ( 0.0 Hz)
Undefined format: 0 ( 0.0 Hz)
Other data format type: PAUSE: 1272 ( 8.3 Hz)
RESUME: 1272 ( 8.3 Hz)
SYNC100: 573 ( 3.7 Hz)
WR48-63: 573 ( 3.7 Hz)
FEE64 disc: 302889 ( 1970.7 Hz)
MBS info: 2293941 ( 14925.5 Hz)
Other info: 0 ( 0.0 Hz)
ADC data range bit set: 0 ( 0.0 Hz)
Timewarps: ADC: 0 ( 0.0 Hz)
PAUSE: 0 ( 0.0 Hz)
RESUME: 0 ( 0.0 Hz)
SYNC100: 0 ( 0.0 Hz)
WR48-63: 0 ( 0.0 Hz)
FEE64 disc: 0 ( 0.0 Hz)
MBS info: 0 ( 0.0 Hz)
Undefined: 0 ( 0.0 Hz)
Sample trace: 0 ( 0.0 Hz)
*** Timestamp elapsed time: 153.693 s
FEE elapsed dead time(s) elapsed idle time(s)
1 0.000 150.055
2 0.129 153.277
3 1.695 152.203
4 0.000 97.174
5 15.630 152.471
6 0.533 122.407
7 0.048 144.955
8 17.221 151.934
9 26.571 143.076
10 0.063 148.982
11 11.592 141.197
12 0.000 0.000
13 0.000 0.000
14 0.000 0.000
15 0.000 0.000
16 0.000 0.000
17 0.000 0.000
18 0.000 0.000
19 0.000 0.000
20 0.000 0.000
21 0.000 0.000
22 0.000 0.000
23 0.000 0.000
24 0.000 0.000
25 0.000 0.000
26 0.000 0.000
27 0.000 0.000
28 0.000 0.000
29 0.000 0.000
30 0.000 0.000
31 0.000 0.000
32 0.000 0.000
*** Statistics
FEE ADC Data Other Data Sample Undefined Pause Resume SYNC100 WR48-63 Disc MBS Other HEC Data
0 20482535 1736 0 0 381 381 52 52 0 870 0 0
1 26566394 1030 0 0 0 0 56 56 0 918 0 0
2 26980761 1455064 0 0 2 2 87 87 302889 1151997 0 0
3 26884821 1140284 0 0 5 5 65 65 0 1140144 0 0
4 7516935 23 0 0 0 0 7 7 0 9 0 0
5 16098094 1219 0 0 577 577 31 31 0 3 0 0
6 9441595 40 0 0 2 2 18 18 0 0 0 0
7 8769482 38 0 0 2 2 17 17 0 0 0 0
8 32618578 336 0 0 98 98 70 70 0 0 0 0
9 32790396 426 0 0 136 136 77 77 0 0 0 0
10 16087963 82 0 0 1 1 40 40 0 0 0 0
11 35081926 242 0 0 68 68 53 53 0 0 0 0
12 0 0 0 0 0 0 0 0 0 0 0 0
13 0 0 0 0 0 0 0 0 0 0 0 0
14 0 0 0 0 0 0 0 0 0 0 0 0
15 0 0 0 0 0 0 0 0 0 0 0 0
16 0 0 0 0 0 0 0 0 0 0 0 0
17 0 0 0 0 0 0 0 0 0 0 0 0
18 0 0 0 0 0 0 0 0 0 0 0 0
19 0 0 0 0 0 0 0 0 0 0 0 0
20 0 0 0 0 0 0 0 0 0 0 0 0
21 0 0 0 0 0 0 0 0 0 0 0 0
22 0 0 0 0 0 0 0 0 0 0 0 0
23 0 0 0 0 0 0 0 0 0 0 0 0
24 0 0 0 0 0 0 0 0 0 0 0 0
25 0 0 0 0 0 0 0 0 0 0 0 0
26 0 0 0 0 0 0 0 0 0 0 0 0
27 0 0 0 0 0 0 0 0 0 0 0 0
28 0 0 0 0 0 0 0 0 0 0 0 0
29 0 0 0 0 0 0 0 0 0 0 0 0
30 0 0 0 0 0 0 0 0 0 0 0 0
31 0 0 0 0 0 0 0 0 0 0 0 0
32 0 0 0 0 0 0 0 0 0 0 0 0
*** Timewarps
FEE ADC Pause Resume SYNC100 WR48-63 Disc MBS Undefined Samples
0 0 0 0 0 0 0 0 0 0
1 0 0 0 0 0 0 0 0 0
2 0 0 0 0 0 0 0 0 0
3 0 0 0 0 0 0 0 0 0
4 0 0 0 0 0 0 0 0 0
5 0 0 0 0 0 0 0 0 0
6 0 0 0 0 0 0 0 0 0
7 0 0 0 0 0 0 0 0 0
8 0 0 0 0 0 0 0 0 0
9 0 0 0 0 0 0 0 0 0
10 0 0 0 0 0 0 0 0 0
11 0 0 0 0 0 0 0 0 0
12 0 0 0 0 0 0 0 0 0
13 0 0 0 0 0 0 0 0 0
14 0 0 0 0 0 0 0 0 0
15 0 0 0 0 0 0 0 0 0
16 0 0 0 0 0 0 0 0 0
17 0 0 0 0 0 0 0 0 0
18 0 0 0 0 0 0 0 0 0
19 0 0 0 0 0 0 0 0 0
20 0 0 0 0 0 0 0 0 0
21 0 0 0 0 0 0 0 0 0
22 0 0 0 0 0 0 0 0 0
23 0 0 0 0 0 0 0 0 0
24 0 0 0 0 0 0 0 0 0
25 0 0 0 0 0 0 0 0 0
26 0 0 0 0 0 0 0 0 0
27 0 0 0 0 0 0 0 0 0
28 0 0 0 0 0 0 0 0 0
29 0 0 0 0 0 0 0 0 0
30 0 0 0 0 0 0 0 0 0
31 0 0 0 0 0 0 0 0 0
32 0 0 0 0 0 0 0 0 0
*** Program elapsed time:37059.496s ( 0.863 blocks/s, 0.054 Mb/s)
|
| Attachment 5: 210310_1054_Stats.png
|

|
| Attachment 6: 210310_1055_Temp.png
|

|
| Attachment 7: 210310_1055_Bias.png
|
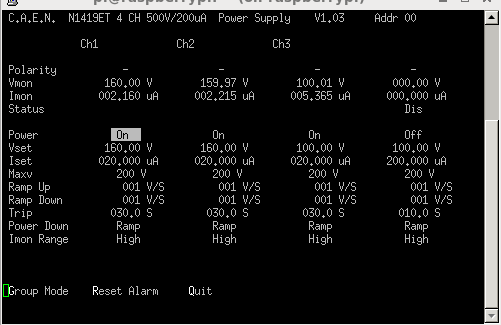
|
| Attachment 8: AIDA_Fatima_Correlation.PNG
|
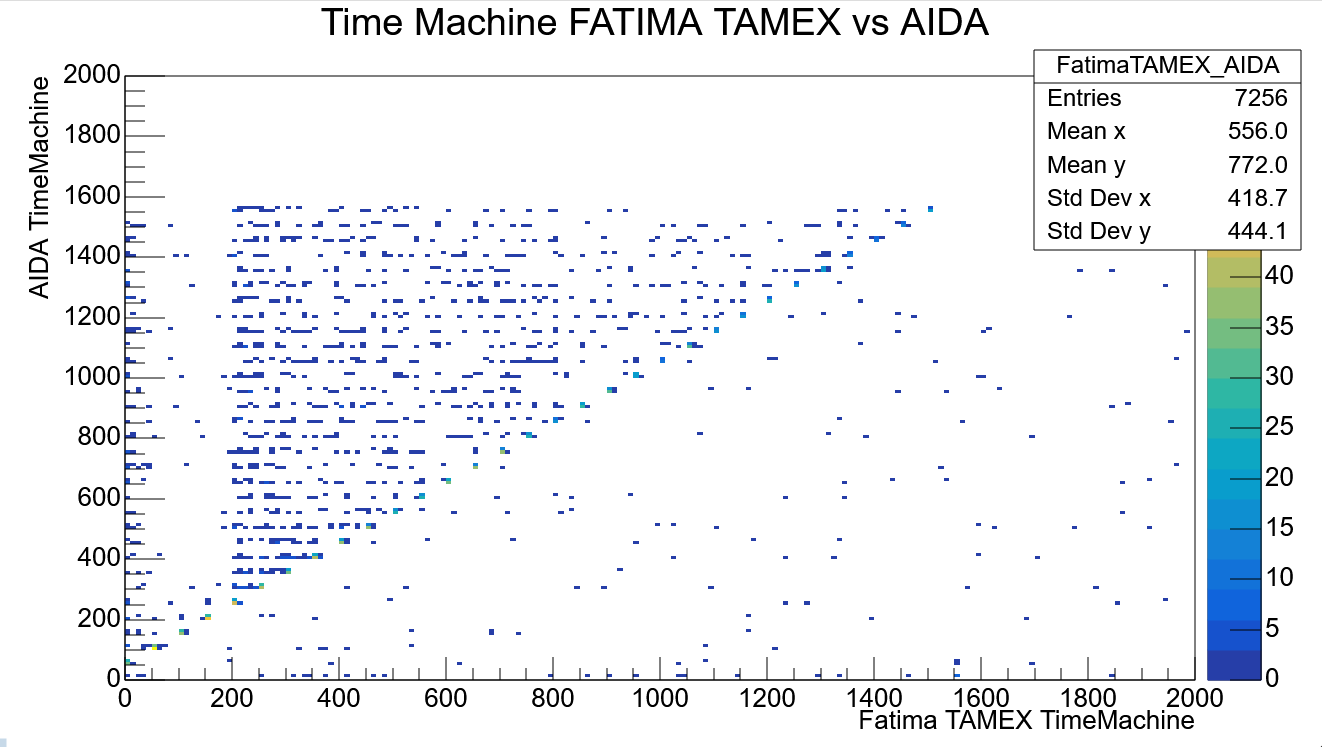
|
| Attachment 9: AIDA_Ge_Correlation.PNG
|
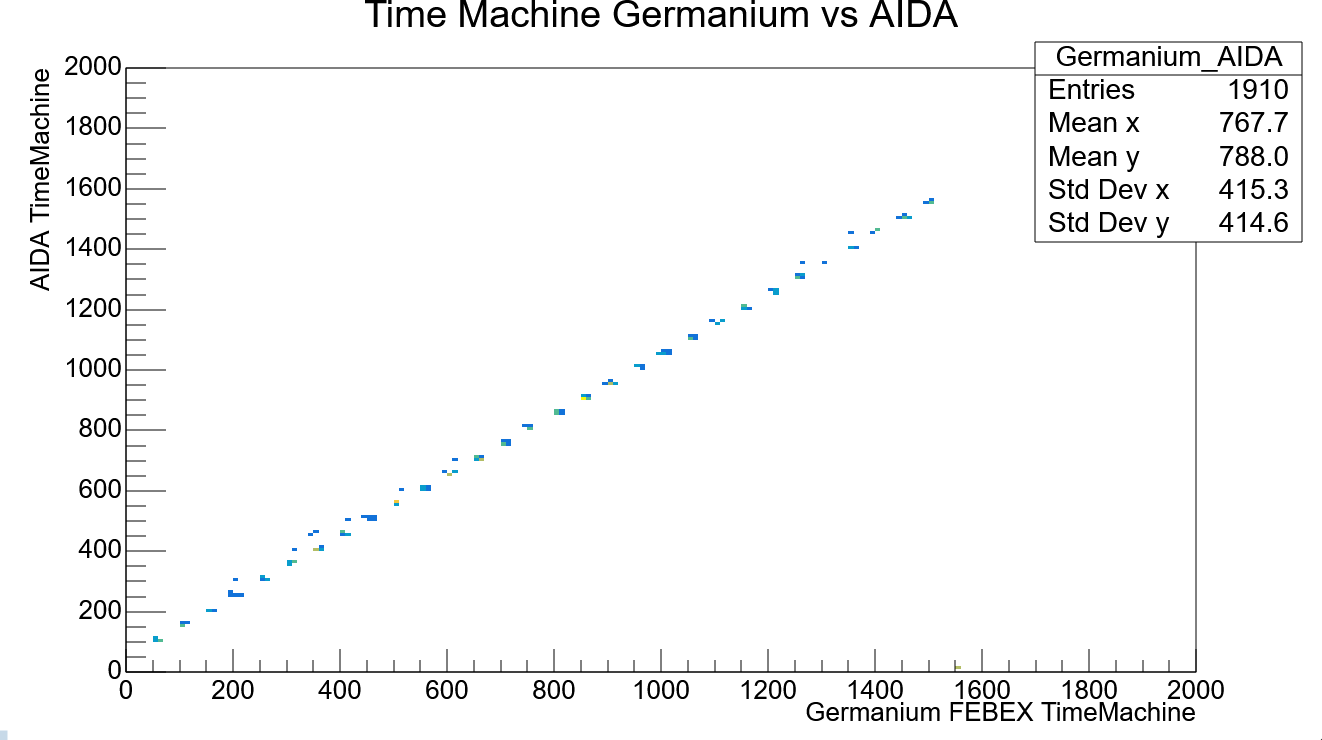
|
| Attachment 10: 210310_1210_Stats.png
|

|
| Attachment 11: 210310_1211_Temp.png
|

|
| Attachment 12: 210310_1212_Bias.png
|
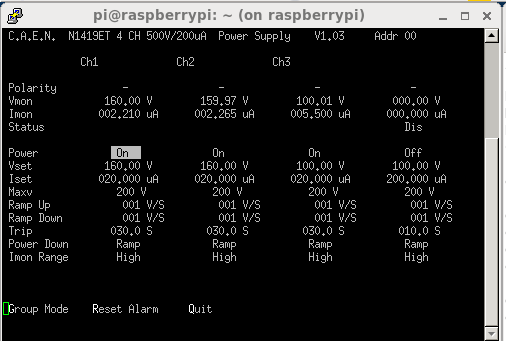
|
| Attachment 13: AIDA_leakage.PNG
|

|
| Attachment 14: 210310_1348_Layout7.png
|
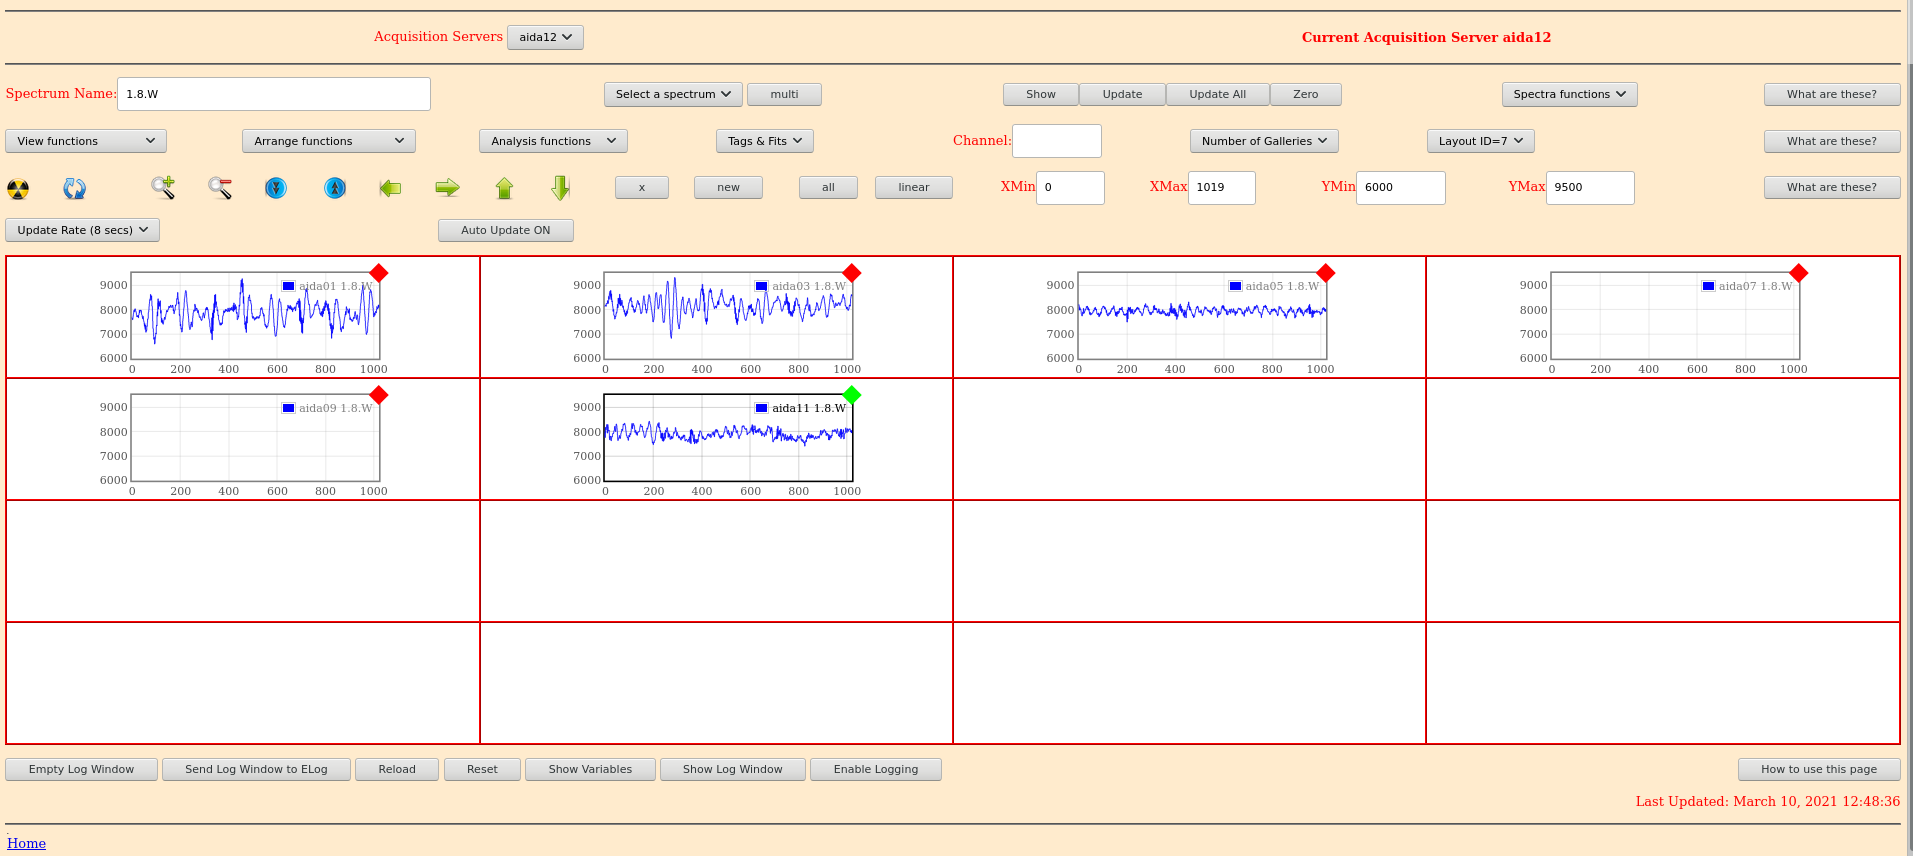
|
| Attachment 15: 210310_1252_Layout8.png
|
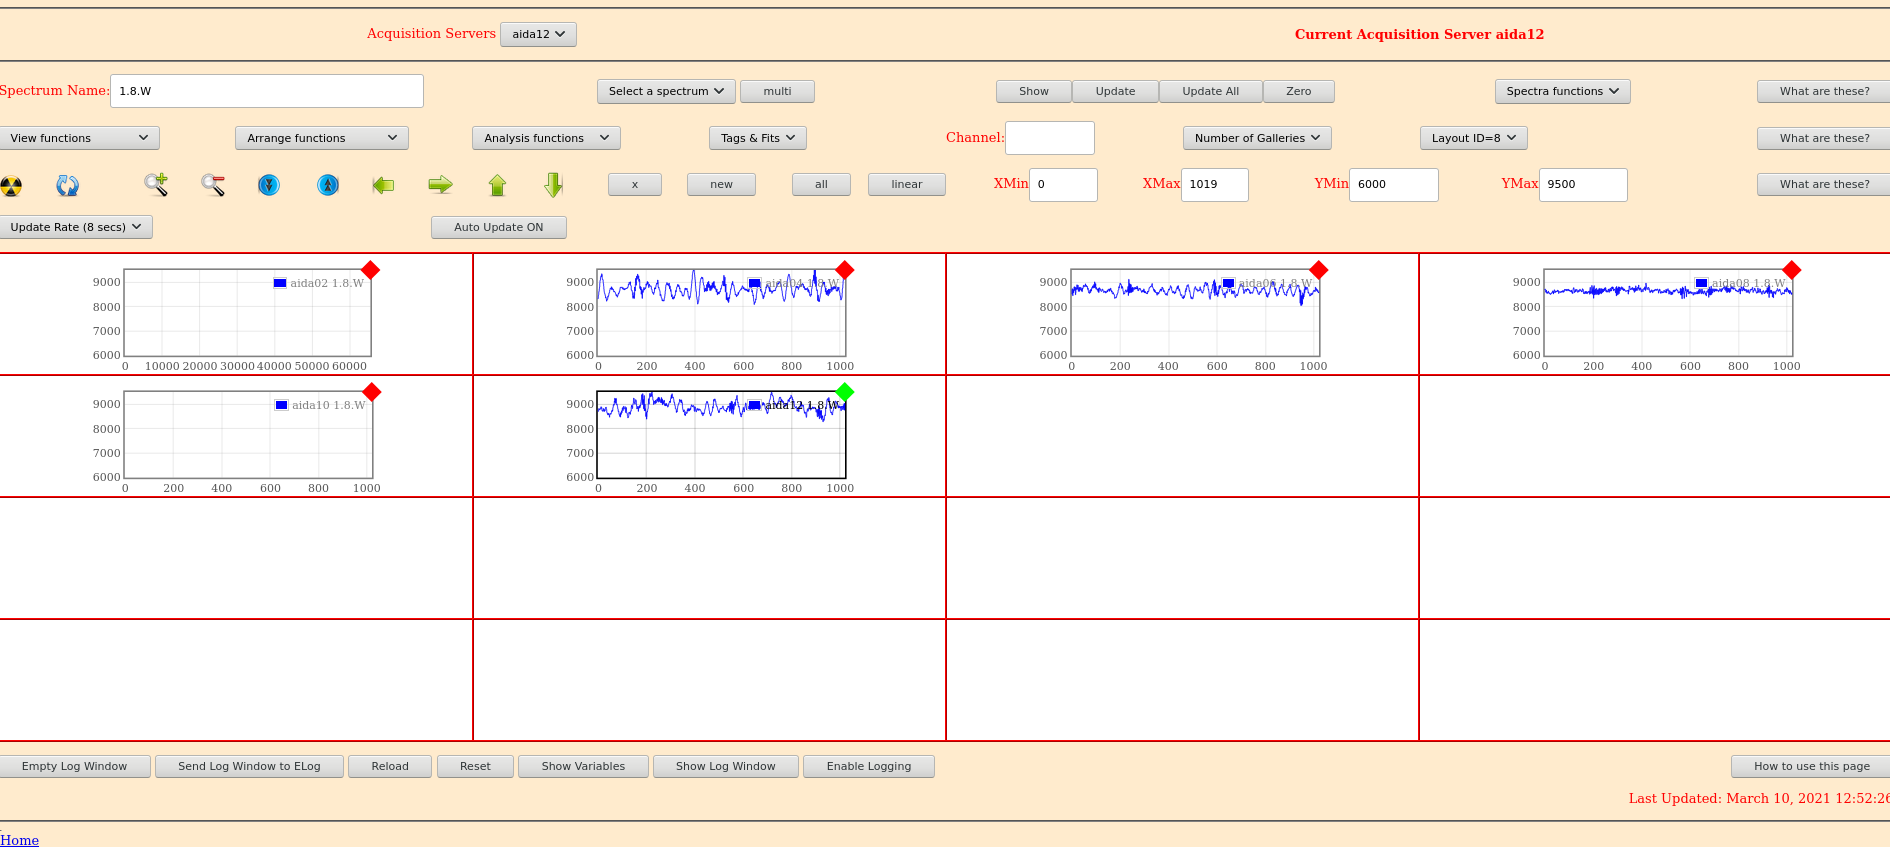
|
| Attachment 16: 1400_Statistics.PNG
|

|
| Attachment 17: 1400_FEETemps.PNG
|

|
| Attachment 18: 1400_LeakageCurrents.PNG
|

|
| Attachment 19: 1400_SpectraRate.PNG
|

|
| Attachment 20: 1600_Statistics.PNG
|

|
| Attachment 21: 1600_SpectraRate.PNG
|
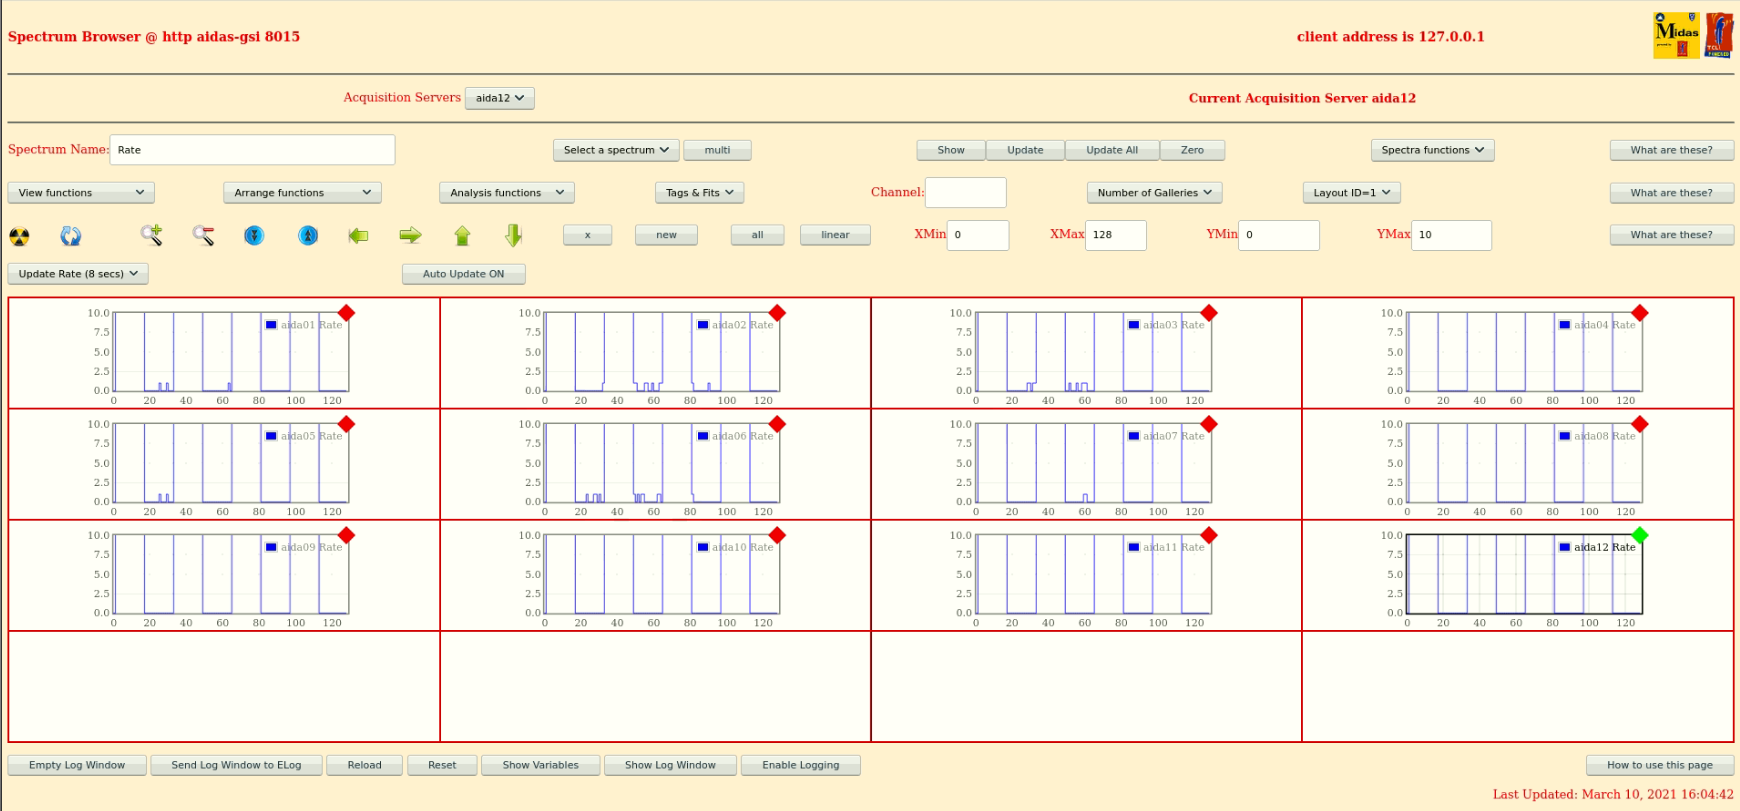
|
| Attachment 22: 1600_FEETemps.PNG
|

|
| Attachment 23: 1600_LeakageCurrents.PNG
|
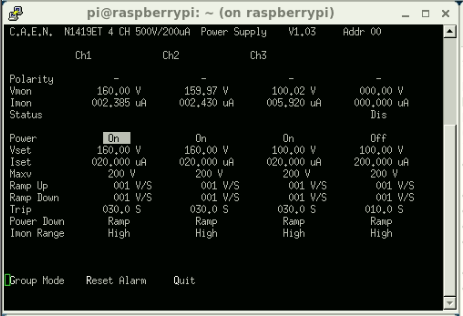
|
| Attachment 24: 1640_SpectraRate.PNG
|

|
| Attachment 25: 1700_R22_122_Rates.PNG
|

|
| Attachment 26: 1700_R22_178_Rates.PNG
|
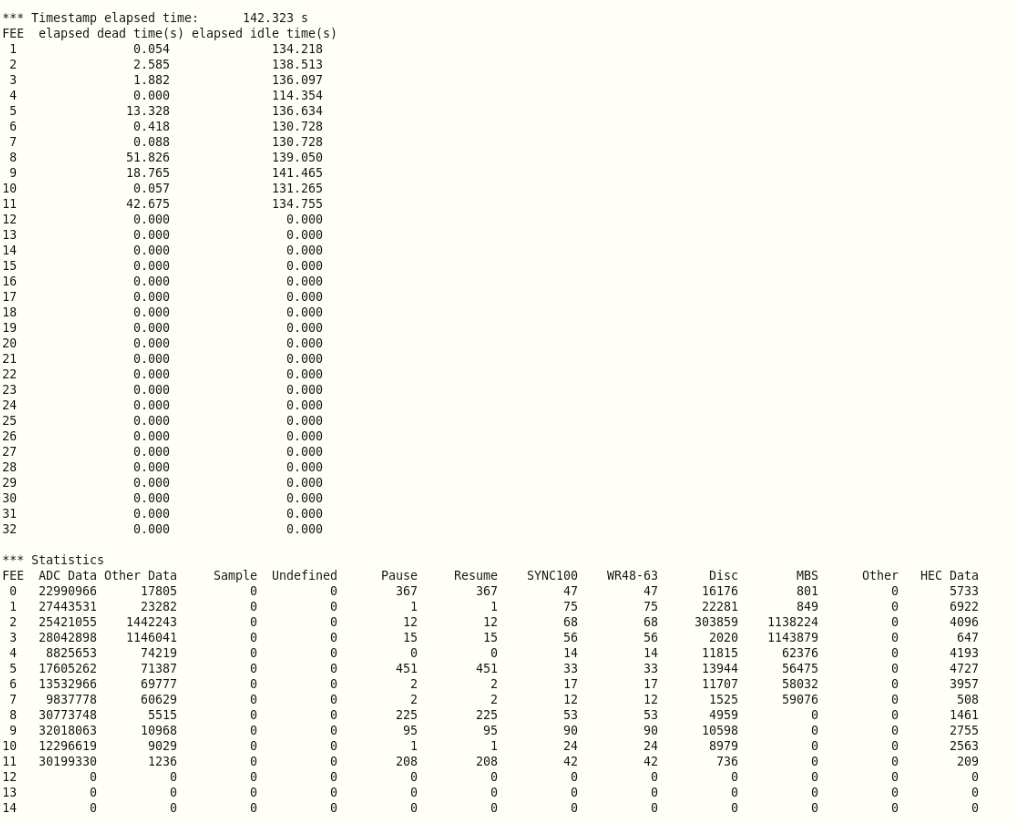
|
| Attachment 27: 1800_Statistics.PNG
|

|
| Attachment 28: 1800_SpectraRate.PNG
|
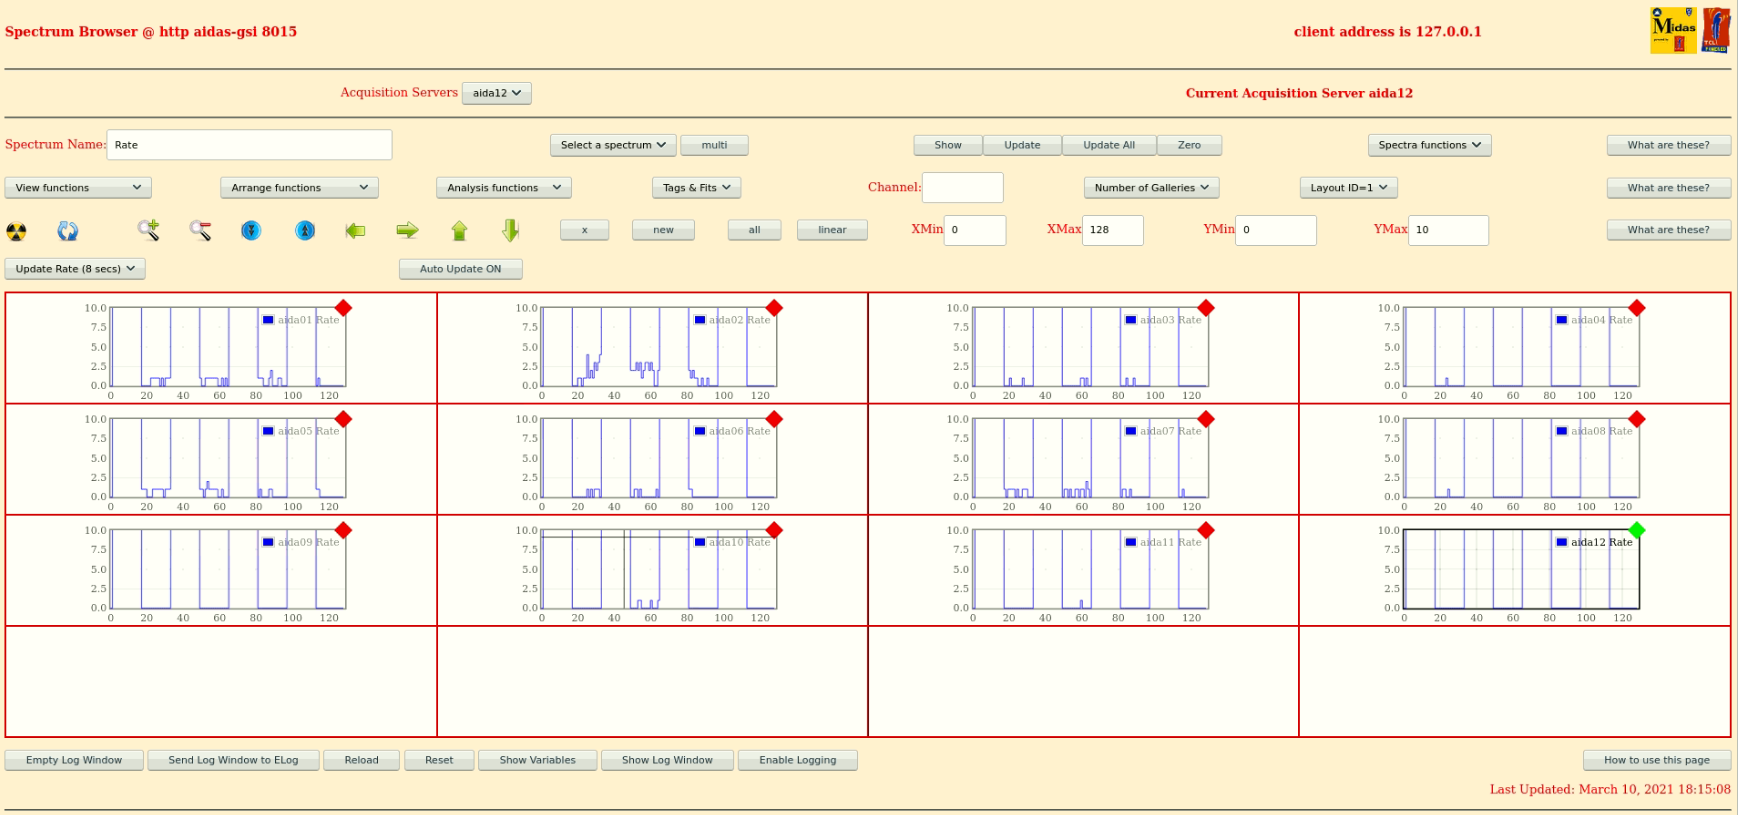
|
| Attachment 29: 1800_FEETemps.PNG
|

|
| Attachment 30: 1800_LeakageCurrents.PNG
|

|
| Attachment 31: 210310_2039_Stats.png
|

|
| Attachment 32: 210310_2040_Temp.png
|

|
| Attachment 33: 210310_2041_Bias.png
|

|
| Attachment 34: 210310_2241_Stats.png
|

|
| Attachment 35: 210310_2241_Temp.png
|

|
| Attachment 36: 210310_2242_Bias.png
|

|
| Attachment 37: 210310_2331_Stats.png
|

|
| Attachment 38: 210310_2332_Temp.png
|

|
| Attachment 39: 210310_2333_Bias.png
|

|
|
570
|
Wed Apr 10 08:37:57 2024 |
JB, CC, TD | Wednesday 10 April |
09.38 CC completed install of Bplast driver PCBs yesterday evening.
      All flat ribbon cables connected - all drain wires grounded
      PSU on but not enabled - return terminals grounded to PSU front panel ground
      SiPm bias off

      Water pressure and temperature OK
      FEE64 power ON

      DSSSD bias & leakage current OK - attachment 1

      FEE64 temps OK - attachment 2
      *except* aida02 ASIC temp which is known to be u/s

      All system wide checks OK *except* aida02 and aida03 WR decoder status - attachment 3

      WR timestamps OK - attachment 4

      ADC data item stats - attachments 5

      per FEE64 Rate spectra - attachments 6-7

      per 1.8.W spectra - 20us FSR - attachments 8-11

      ASIC settings 2024Mar27-11.25.32
       LEC slow comparator p+n FEE64s 0xa, n+n FEE64s 0xf

      BNC PB-5 pulser - attachment 12


10.45 CC returns
      bPlas ON

      ADC data item stats - attachments 13
       8x < 20k, max c. 310k

      per FEE64 Rate spectra - attachments 14

      per 1.8.W spectra - 20us FSR - attachments 15-16

      downstream DSSSD n+n and bottom left & right p+n FEE64s noisy


11.40 per p+n FEE64 1.8.L spectra - attachment 17
       aida09 pulser peak width 55 ch FWHM ~38keV FWHM - no change cf. before installation of bPas *except* aida16


12.00 Photos of snout, bPlas driver PCBs, cabling, grounding and PSUs courtesy JB - attachments 18-27

      N.B outputs of PN300 PSU at base of AIDA support stand are *not* ground ref'd - attachment 23


12.20 Slow comparator -> 0x64
      Pulser OFF
      All histograms zero'd

13.17 JB: returned from lunch. Current status of AIDA modules given by attachment 29.

15.55 While bPlast thresholds were being set the noise increased substantially.

16.51 Replaced mezzanine of aida14, reinstalled and biasing detector. Resulting for noise conditions in the detector given by attachments 30-33.

17.31 With a multimeter it was found that there is continuity between the snout and the frame.

18.50 We tried to disconnect the cables of the short side of the bPlast detector and all of the grounds. This seemed to show an open line OL on the multimeter and whence connecting the bPlast grounds back excluding the short side ribbon cable grounds, the multimeter still read OL.
      We also tried to wedge paper between the short side ribbon cable of bPlast and the snout, but this did not work, the detector still reading continuity between the frame, booster board and snout.
      The results after booting up the detector again are given by the attachments 34-36.
      The noise condition is appreciably better than before with 12 out of the 16 FEE64 modules with sub 20 kHz rates.
      Disconnect the BB7 preamp. ground from the frame.

18.54 We powered up bPlast. The noise condition three FEEs got worse, aida01, aida11 and 06. The problem may be associated with downstream grounding. The results are given by the attachments 37-43. 10 out of the 16 FEE64 modules showed sub 20 kHz rates.

19.07 We turned off the power supply on the base of the snout support. PN300 Attachment 23. Rates did not change - attachment 44.

19.10 We turned off the mesytec PSU that is located in the bPlast NIM crate. No change was observed in the rates - attachment 45.

19.13 We turned off the R&SRMP4040 PSU that is located above the AIDA crate. And the noise situation did not change attachment 46.

19.22 Leaving the R&SRMP4040 PSU off we turned back on the mesytec PSU and PN300 PSU, attachment 47.

Summary:

It is clear that with no continuity on the short side we are able to reduce the noise back to the scenario where bPlast was not connected. However, powering bPlast introduced substantial noise in both DSSSDs that did not go away when turning all the PSUs off. There might be some hysteresis in the system (this is just speculation).

The situation is still fair considering that 10 out of the 16 FEE64 modules are in the sub 20 kHz rate level (good noise condition).

TO-DO for 11.04.2024

- Try bringing bPlast ground back to the PSU ground.

- Recheck the downstream detector bias and ground scheme.
|
| Attachment 1: Screenshot_from_2024-04-10_09-43-13.png
|
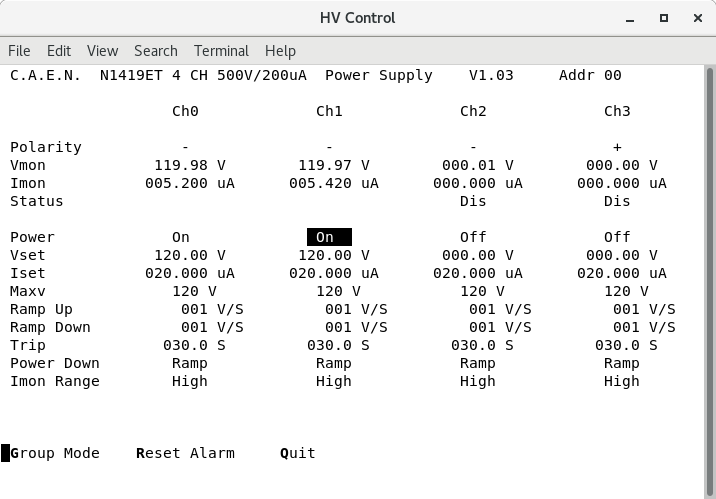
|
| Attachment 2: Screenshot_from_2024-04-10_09-46-53.png
|
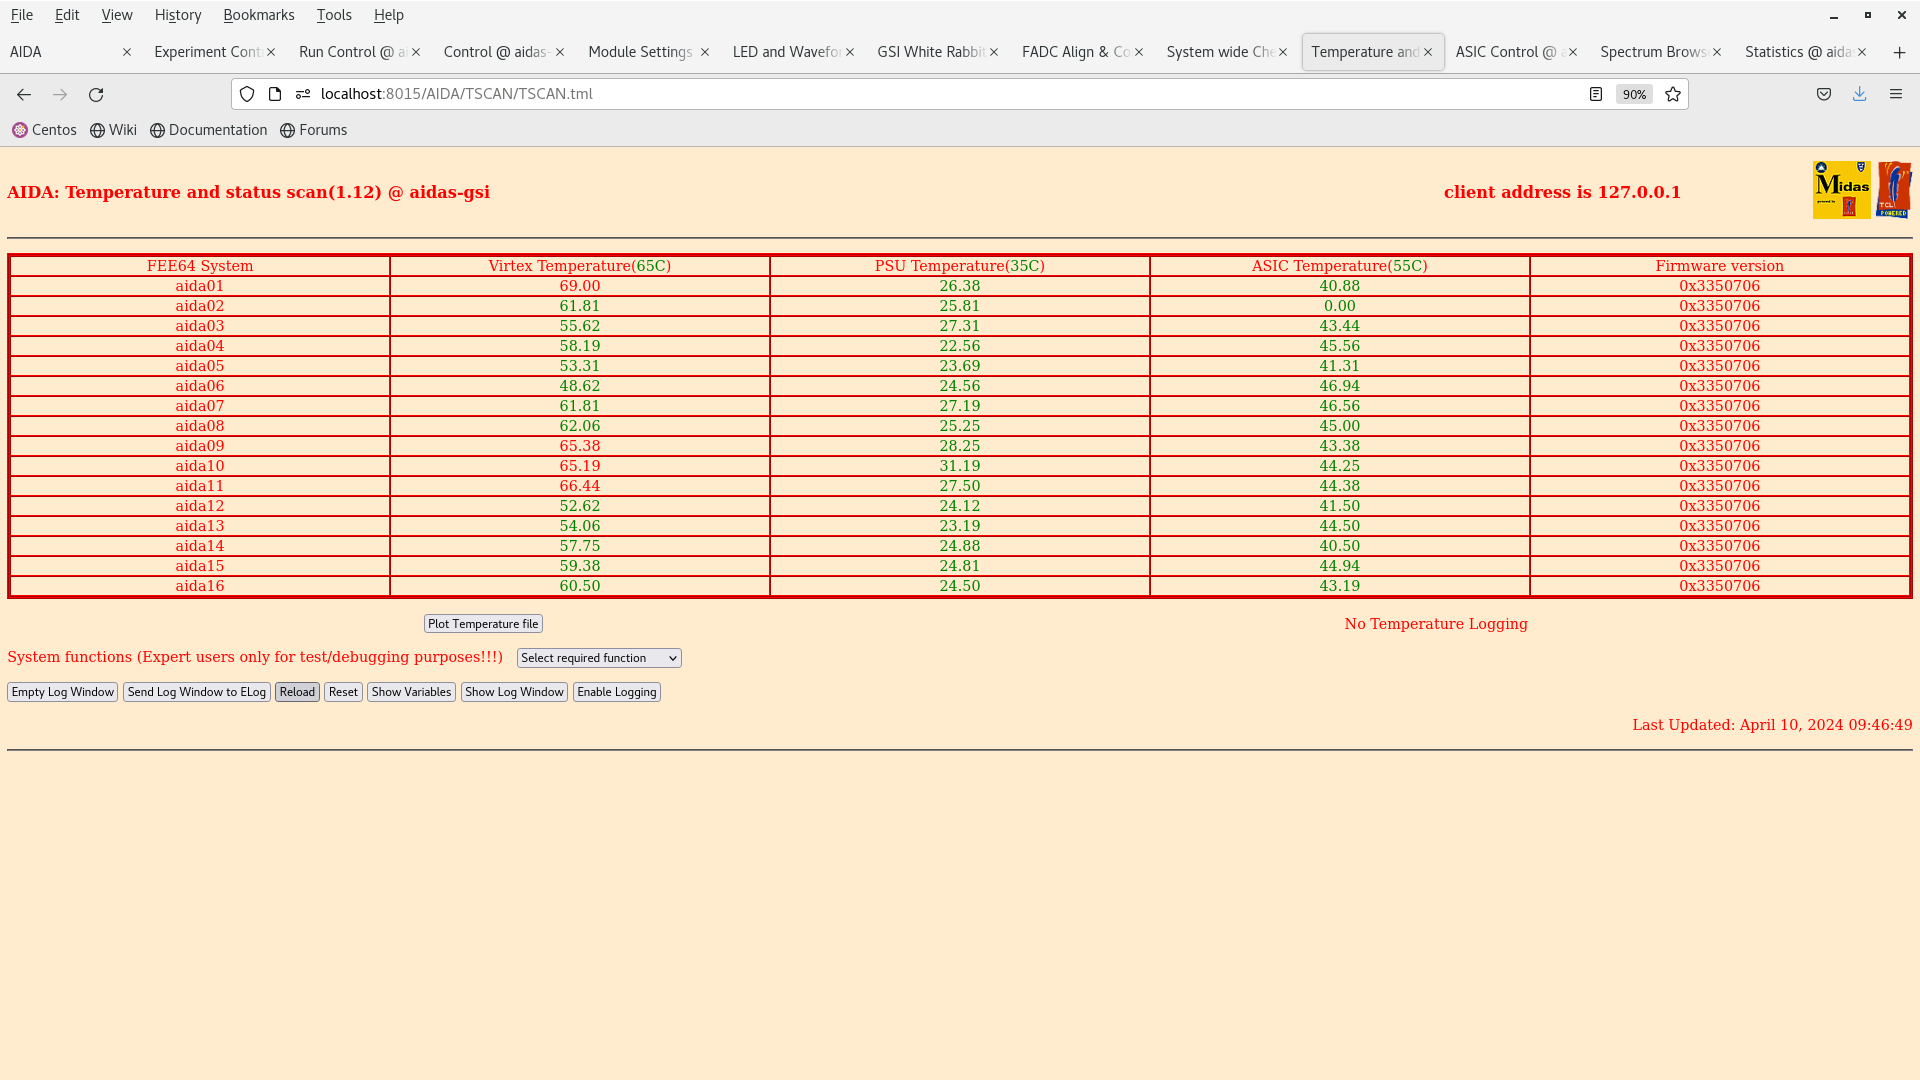
|
| Attachment 3: Screenshot_from_2024-04-10_09-49-03.png
|
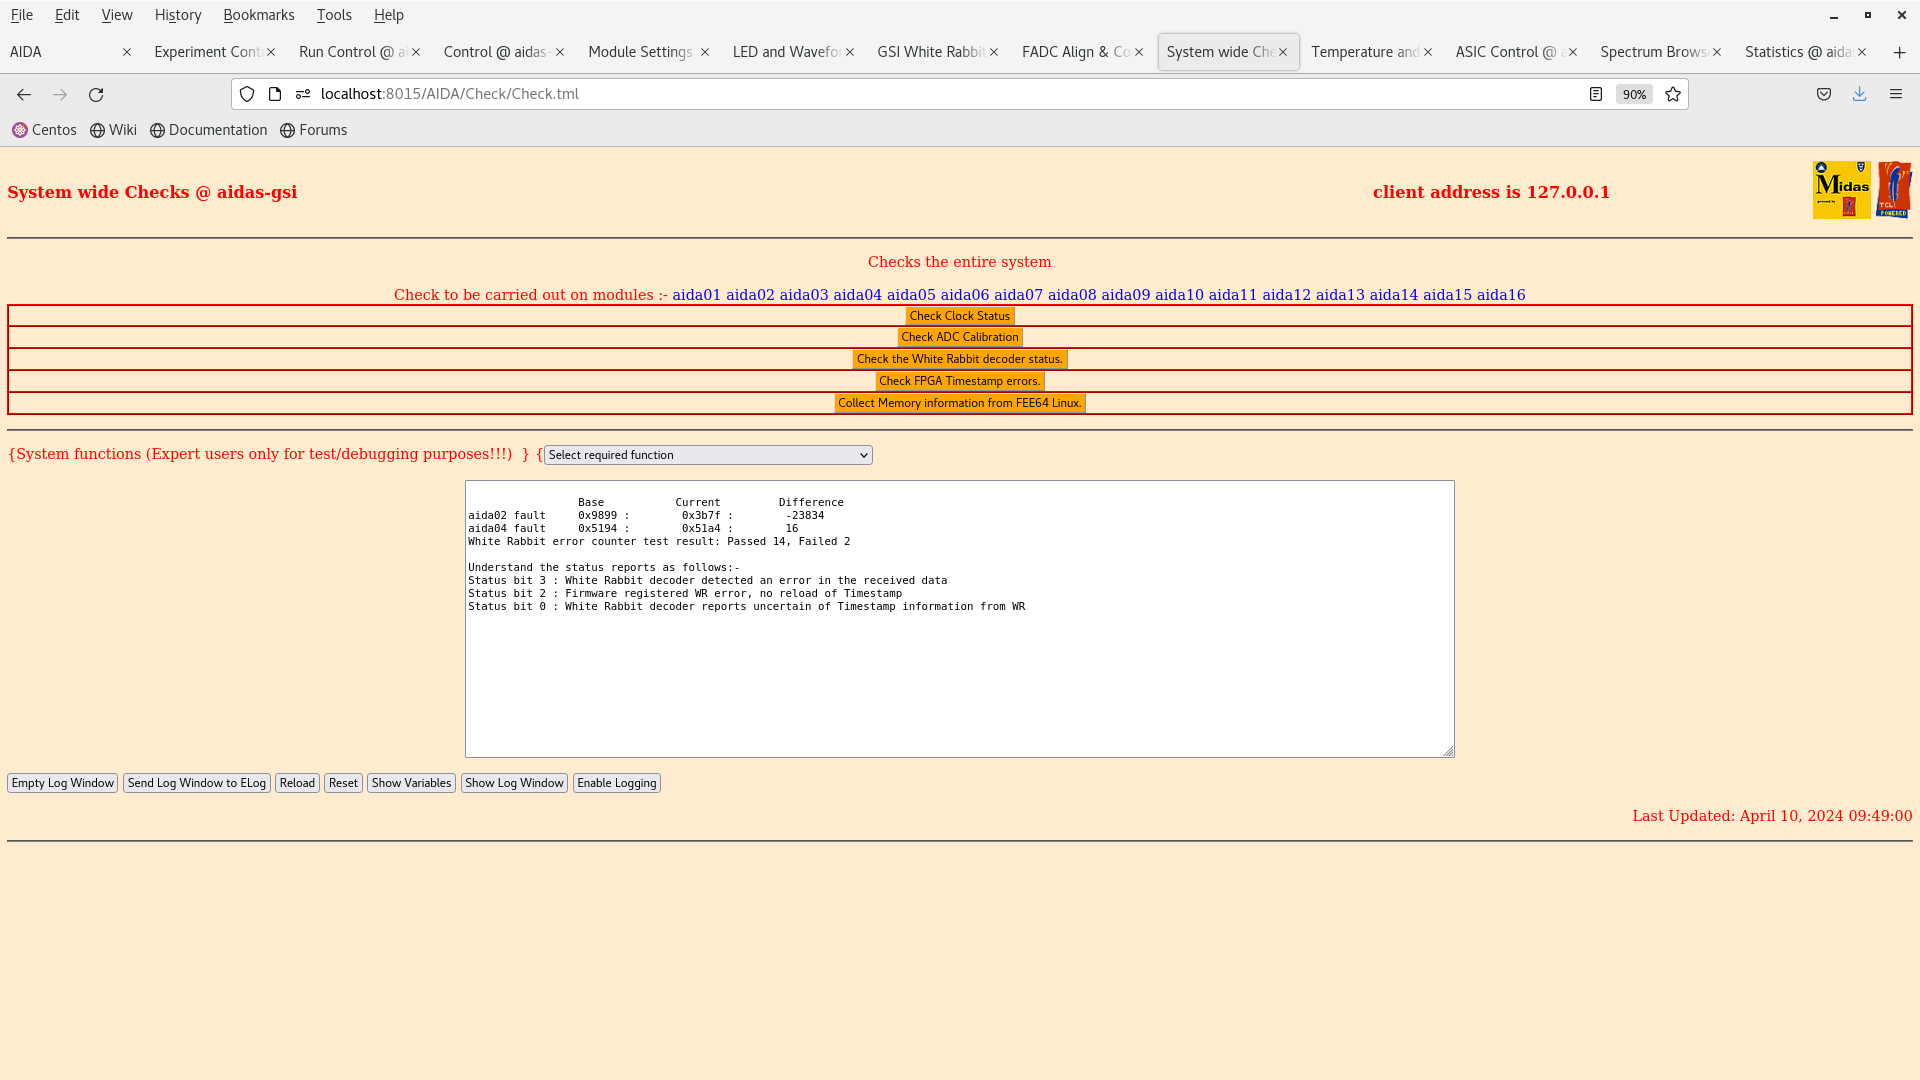
|
| Attachment 4: Screenshot_from_2024-04-10_09-49-35.png
|
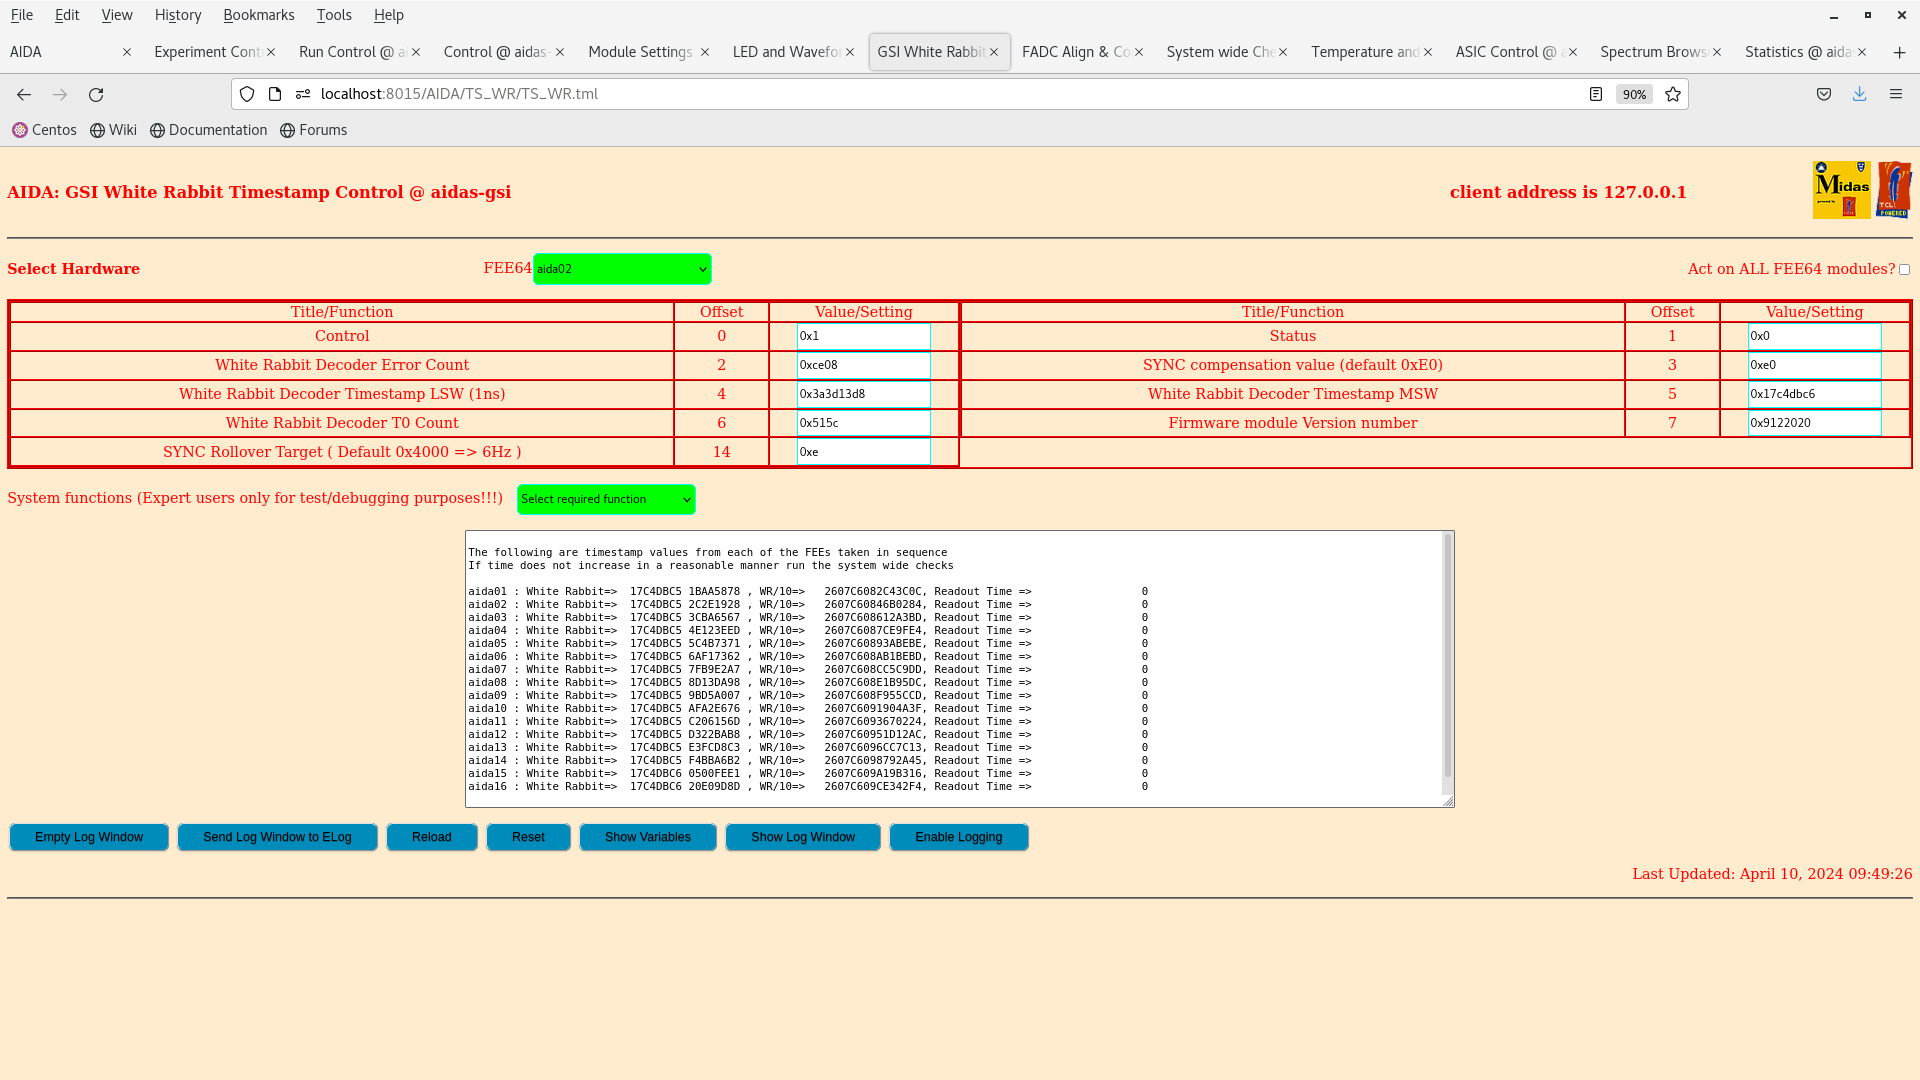
|
| Attachment 5: Screenshot_from_2024-04-10_09-50-23.png
|

|
| Attachment 6: Screenshot_from_2024-04-10_09-50-52.png
|
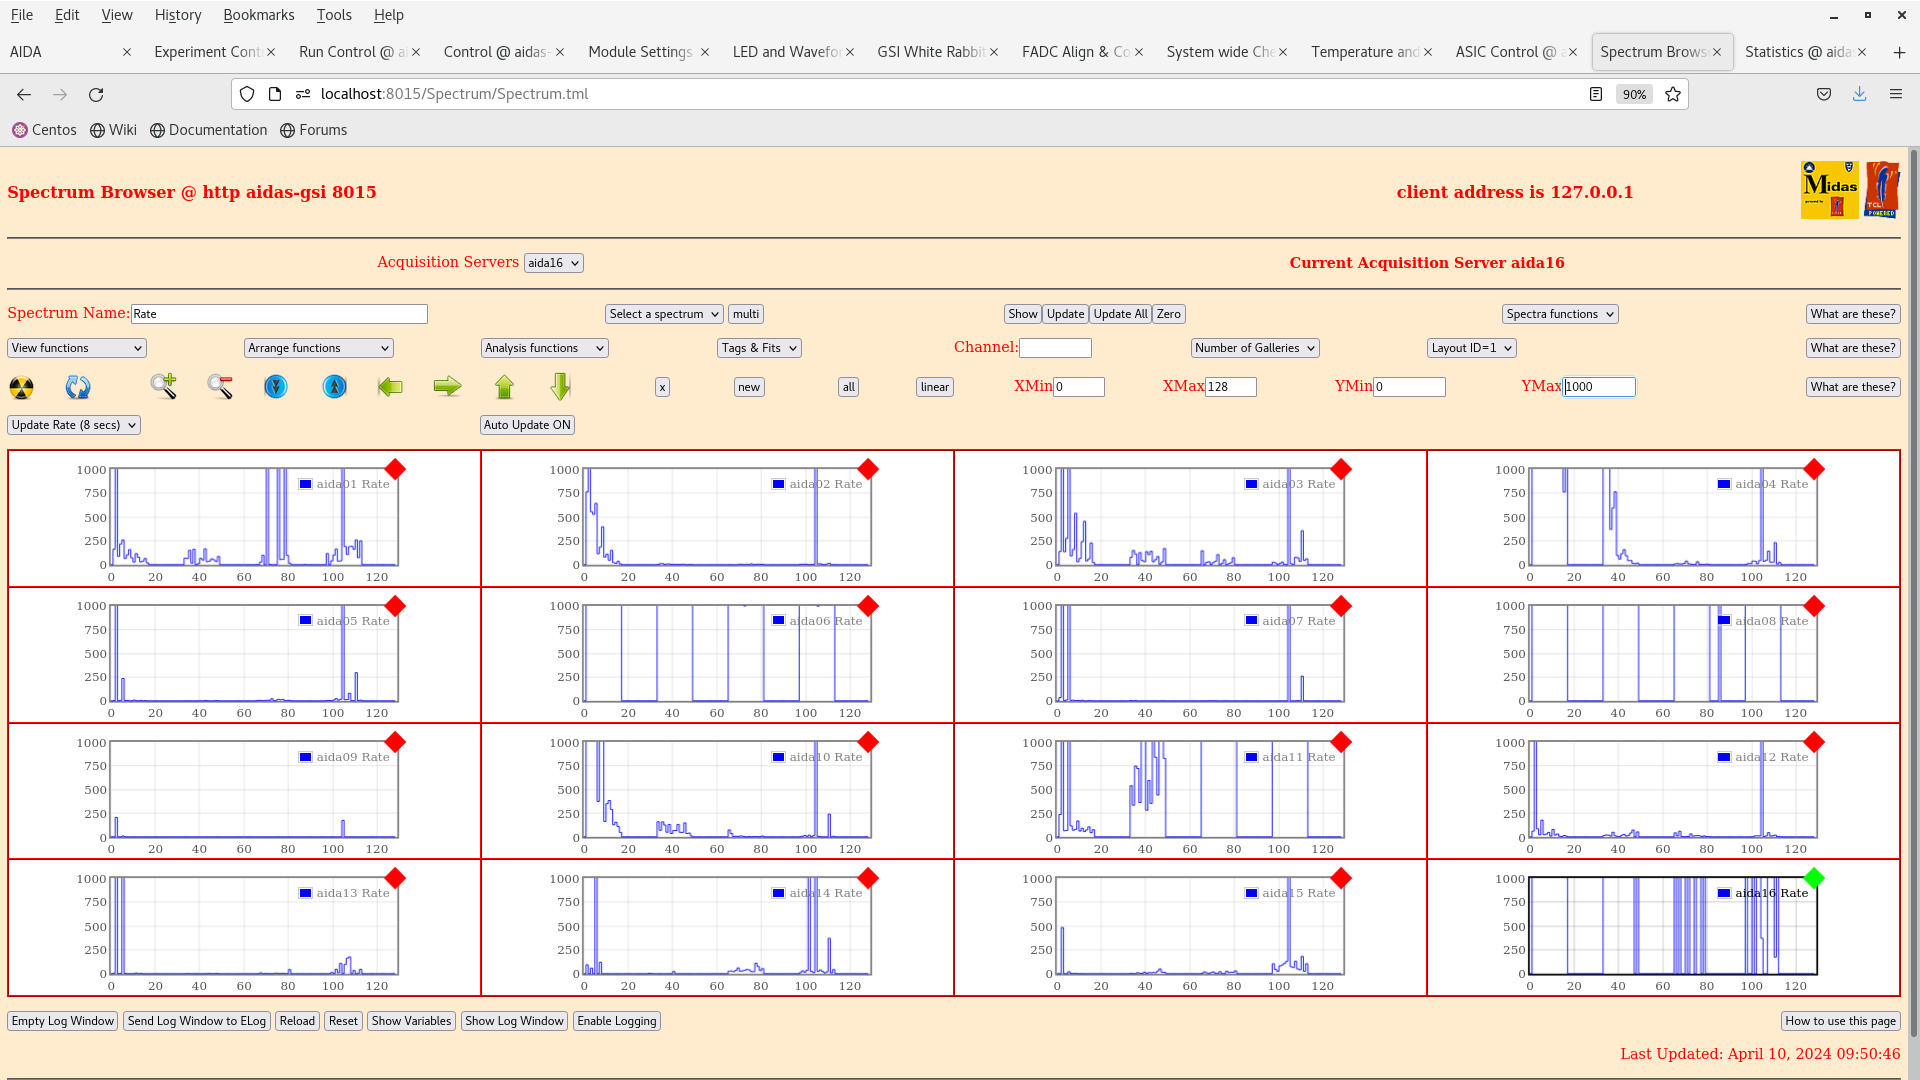
|
| Attachment 7: Screenshot_from_2024-04-10_09-50-42.png
|
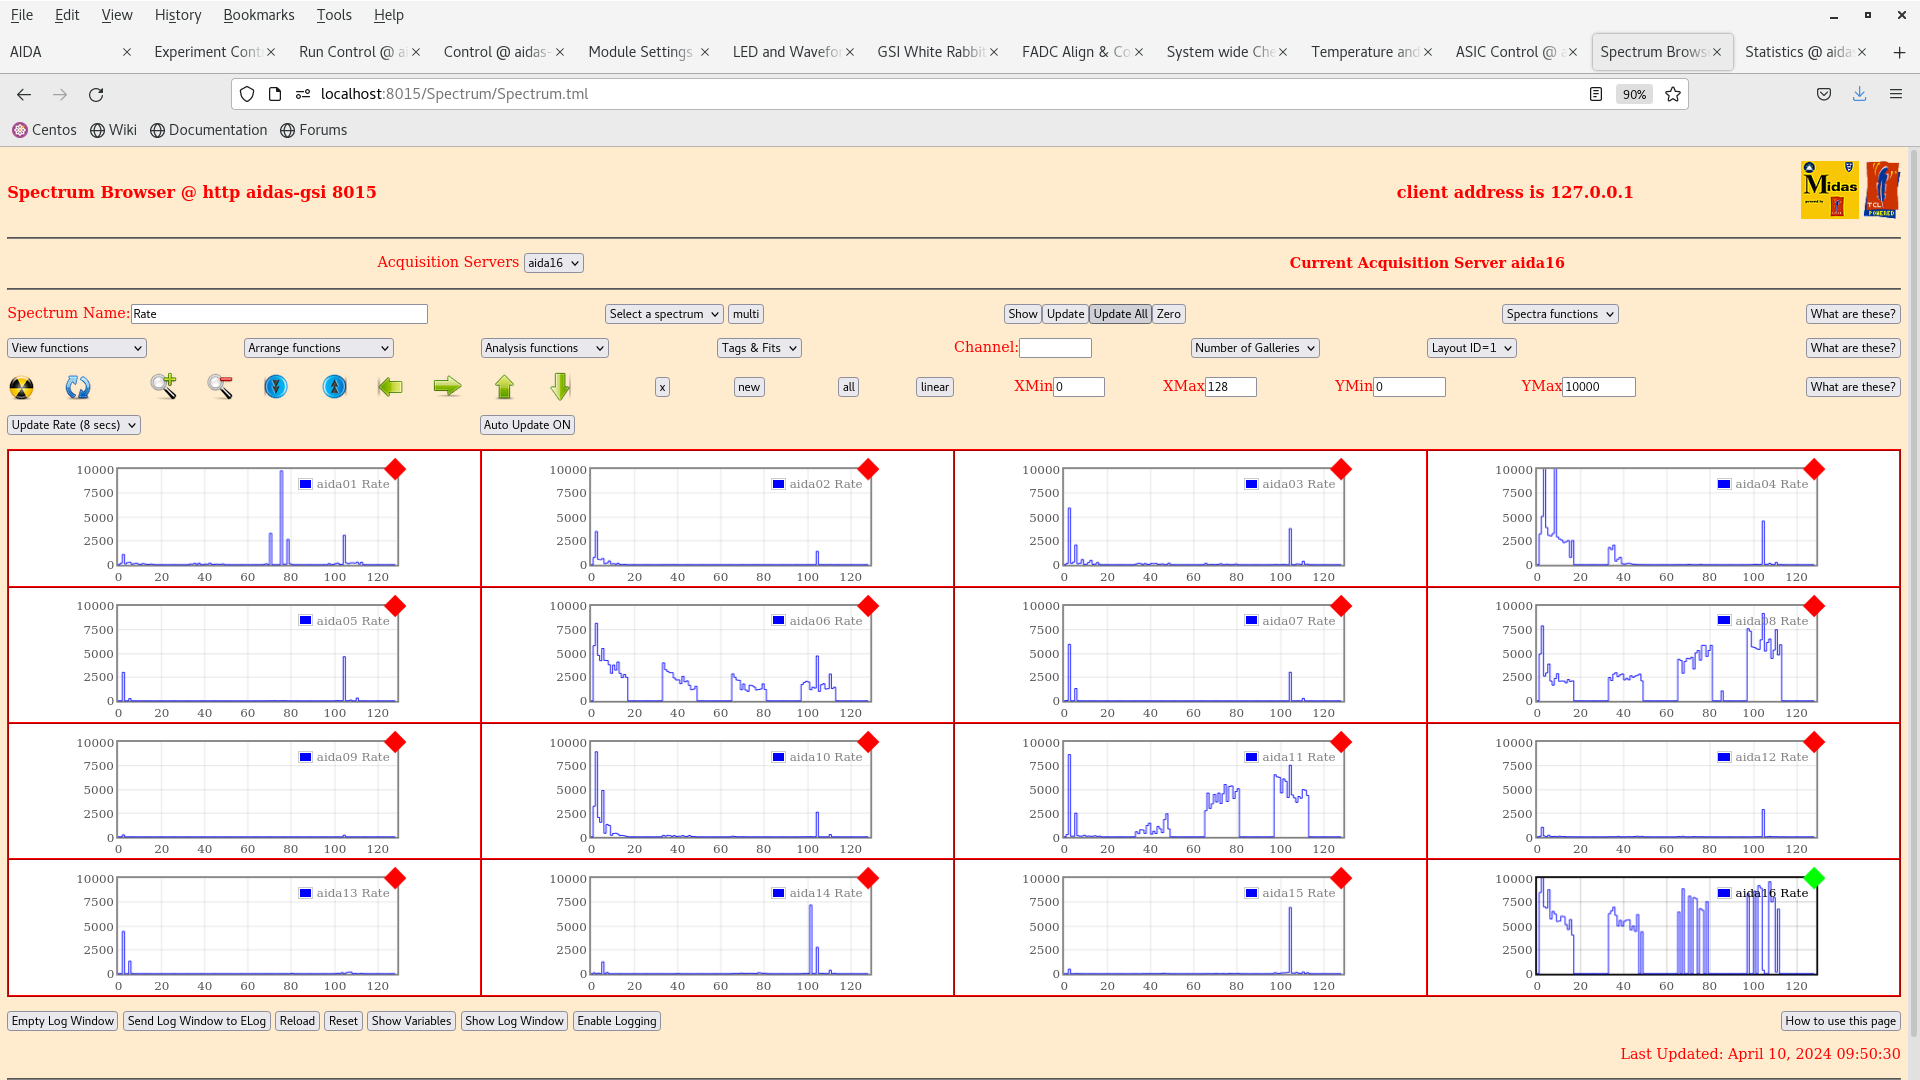
|
| Attachment 8: Screenshot_from_2024-04-10_09-53-41.png
|
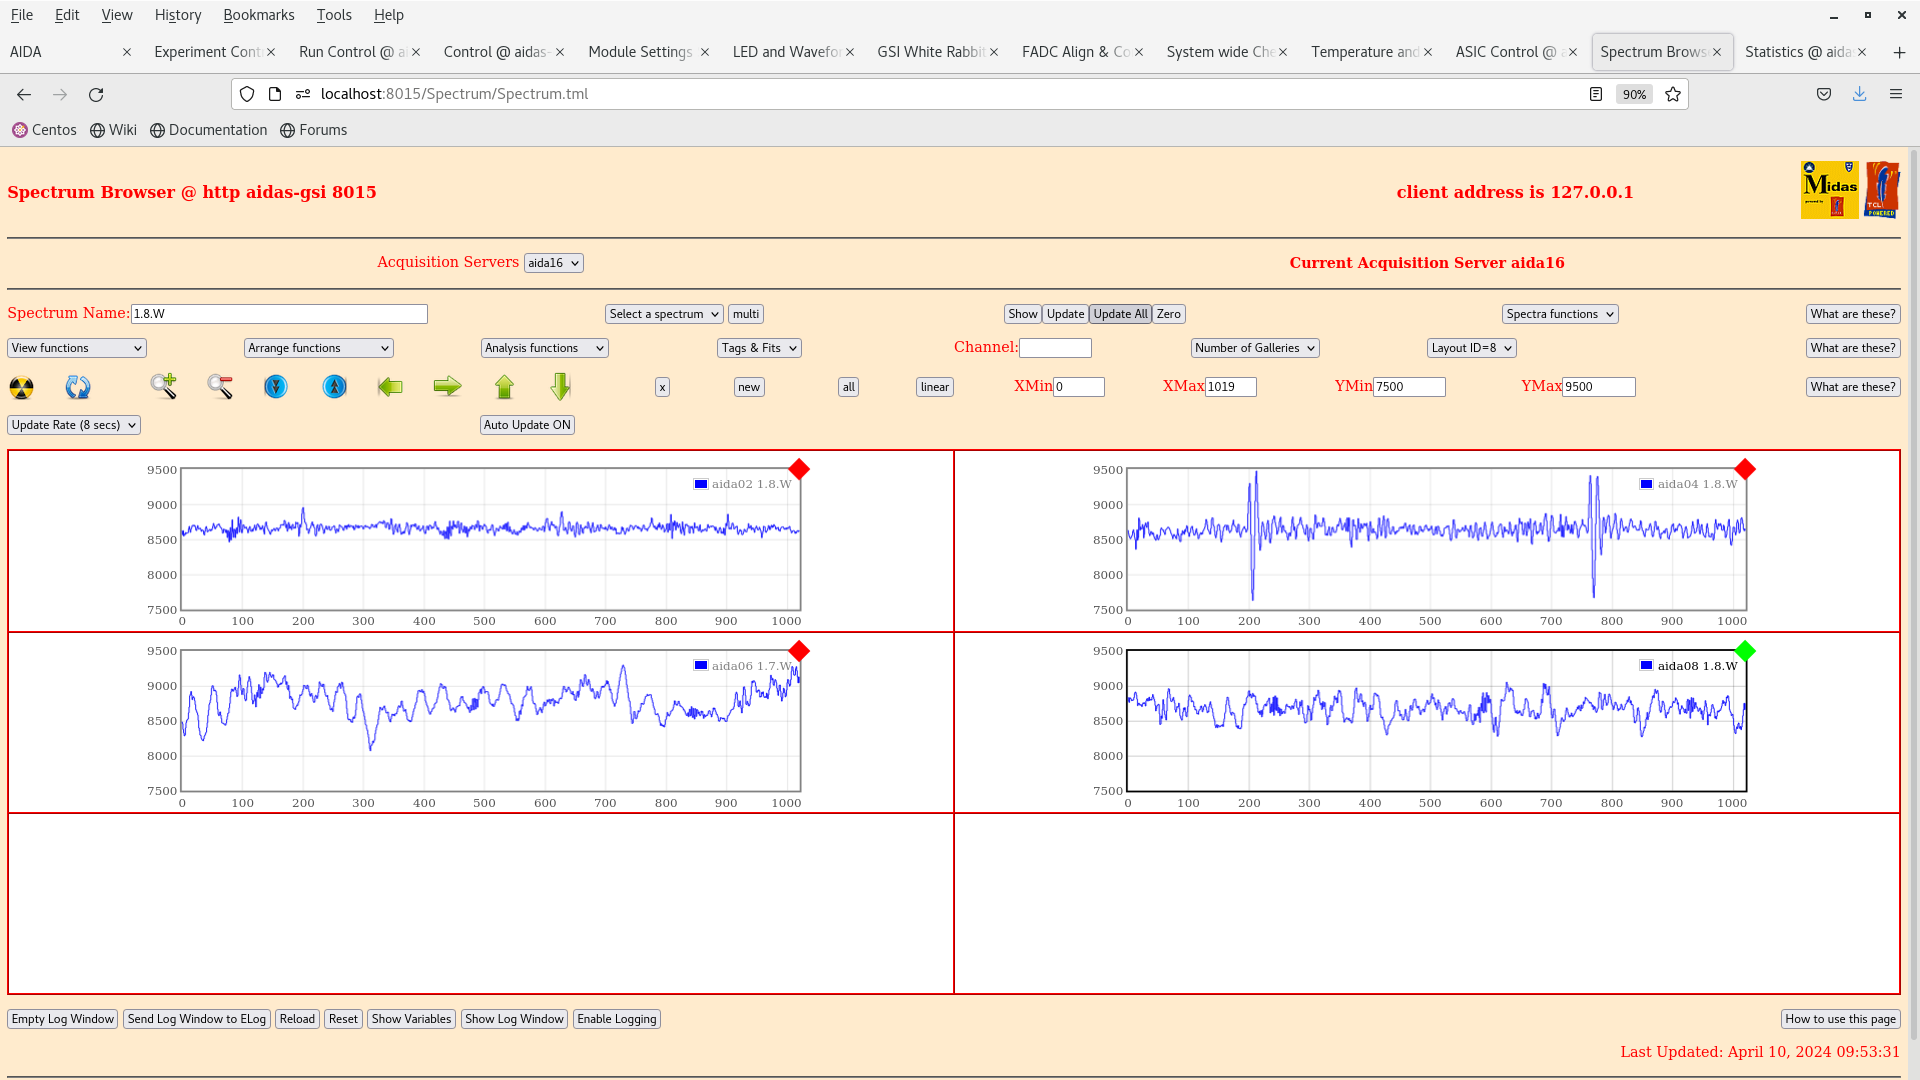
|
| Attachment 9: Screenshot_from_2024-04-10_09-53-17.png
|
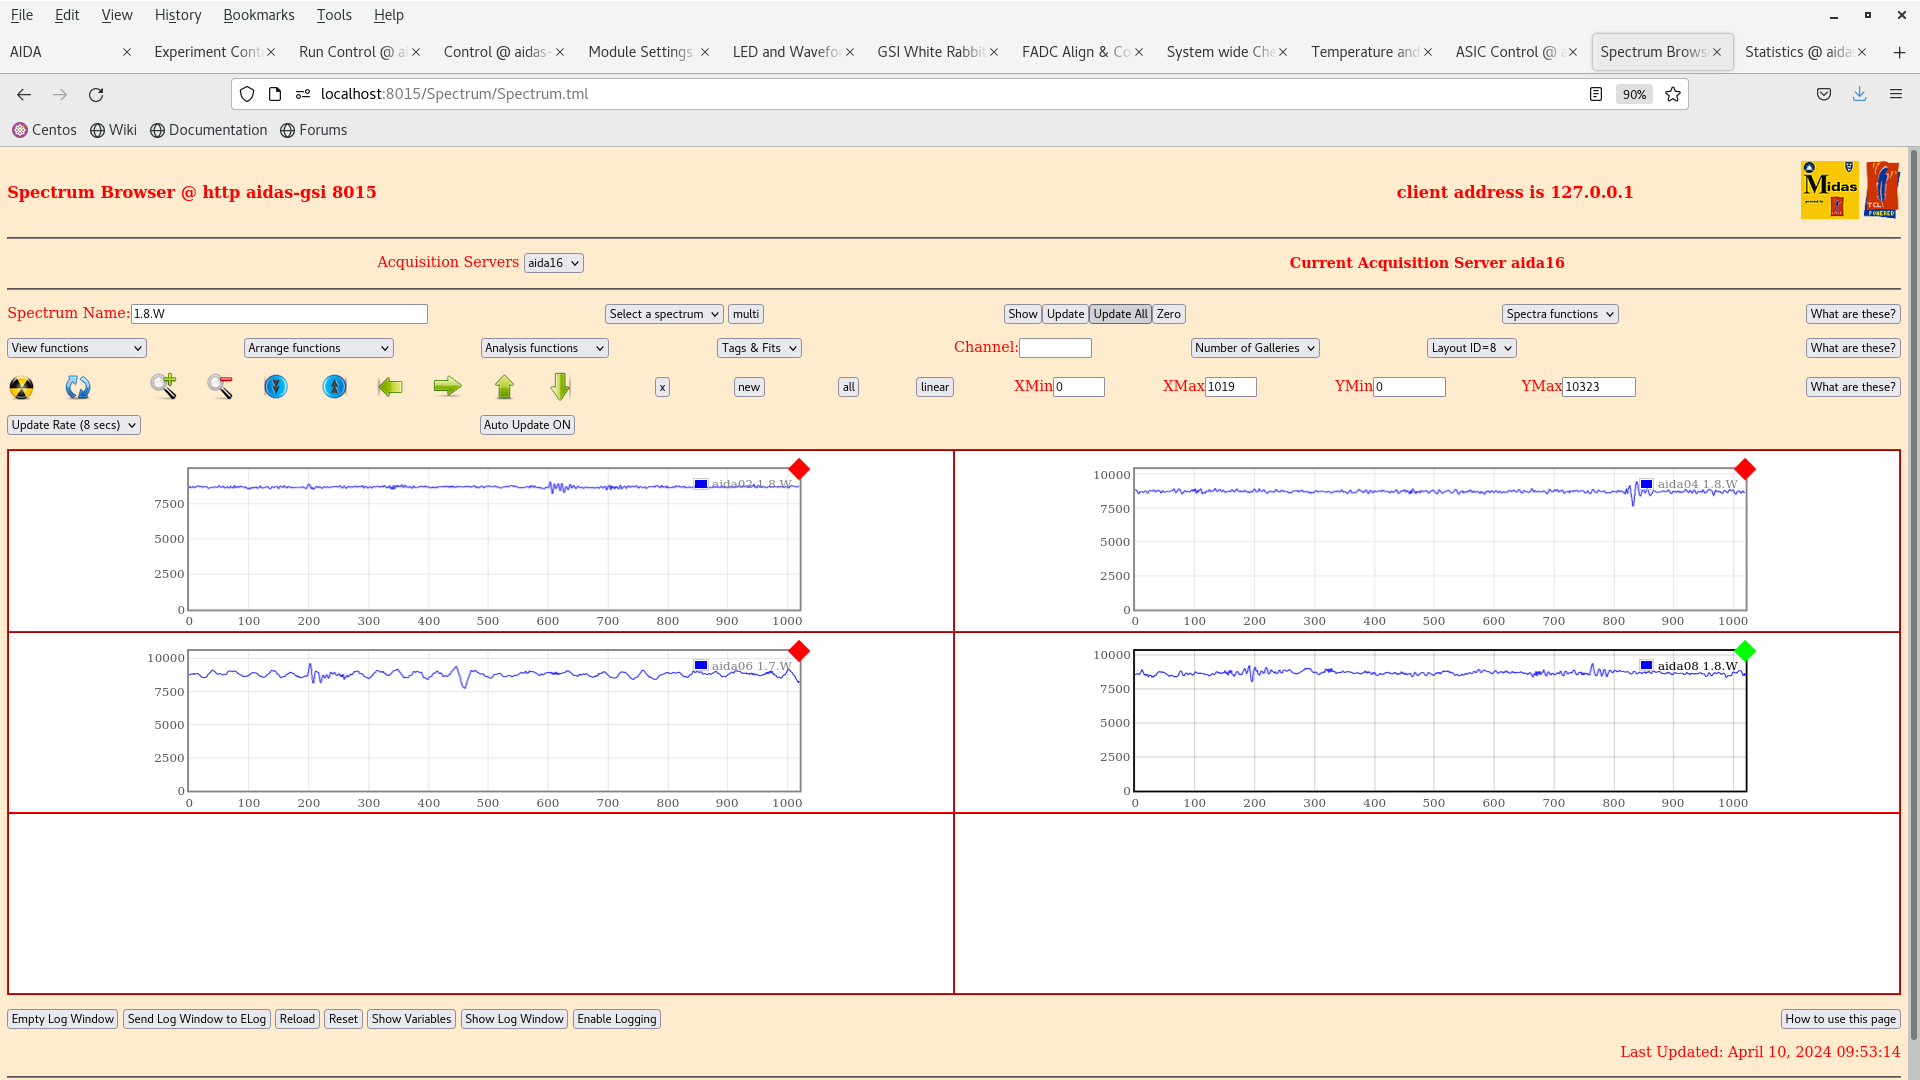
|
| Attachment 10: Screenshot_from_2024-04-10_09-52-49.png
|
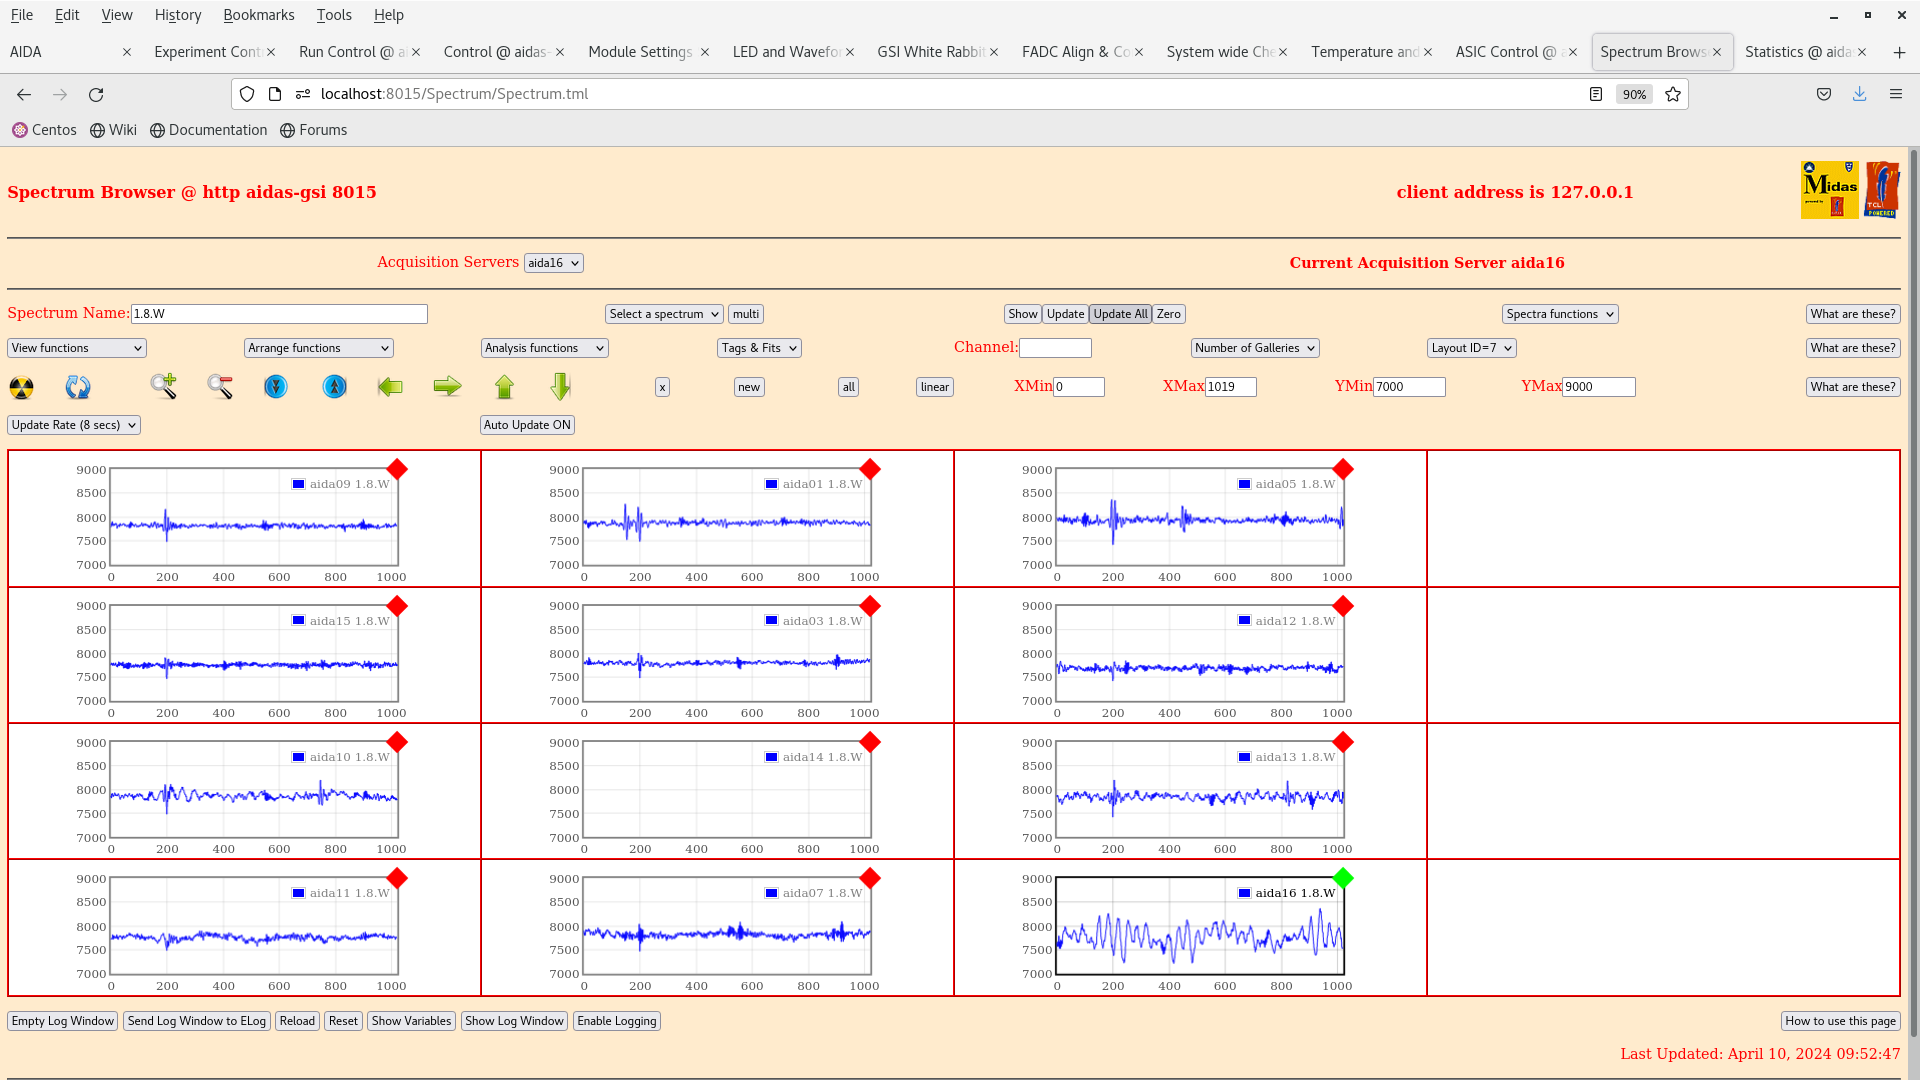
|
| Attachment 11: Screenshot_from_2024-04-10_09-52-22.png
|
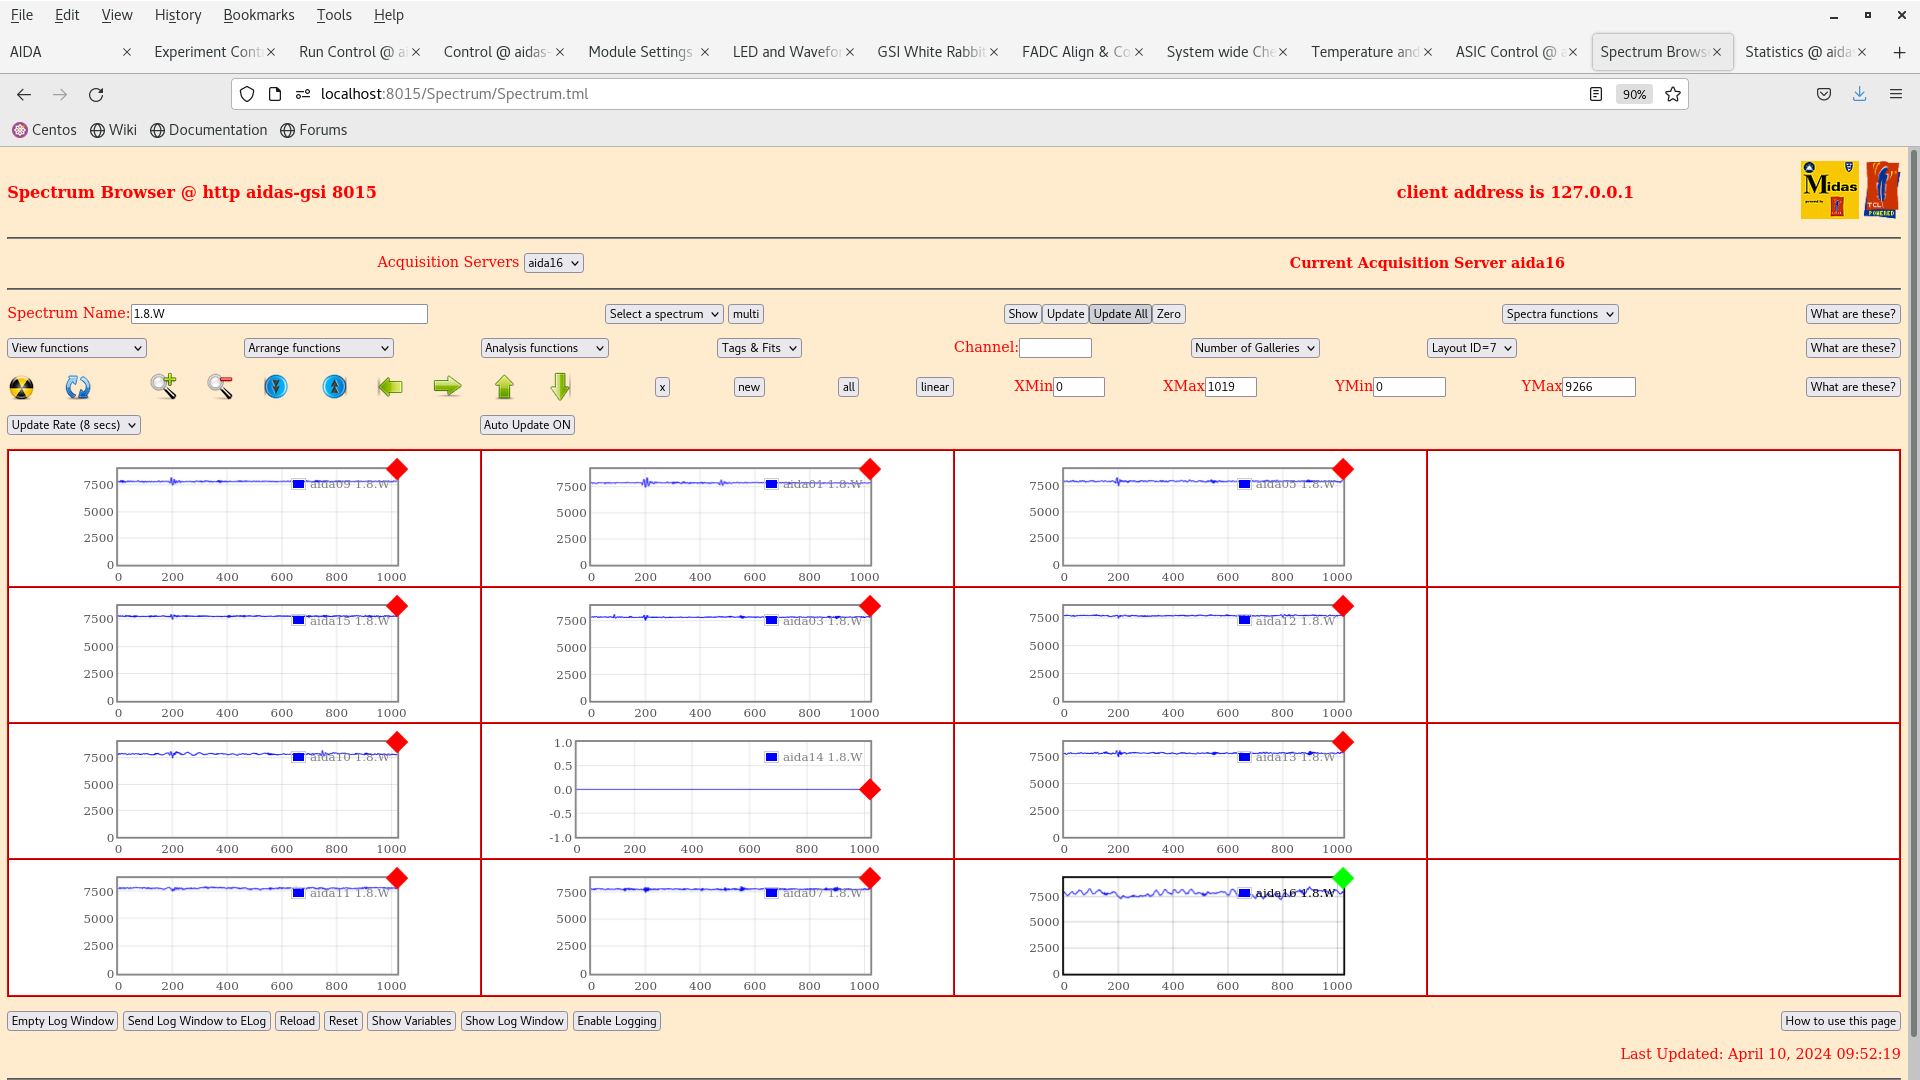
|
| Attachment 12: Screenshot_from_2024-04-10_09-59-02.png
|
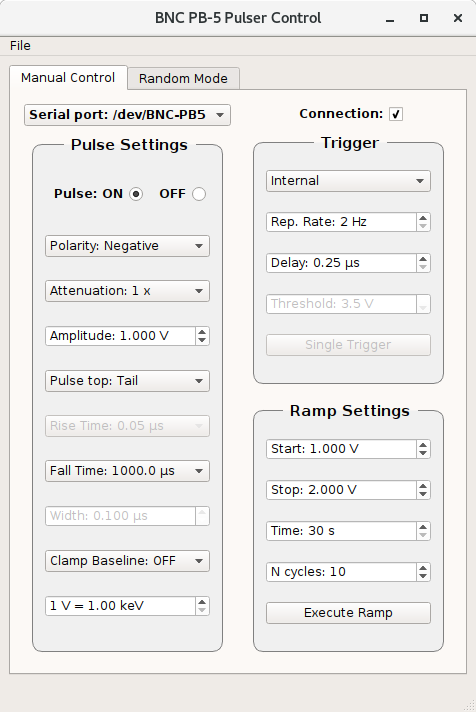
|
| Attachment 13: Screenshot_from_2024-04-10_10-51-20.png
|
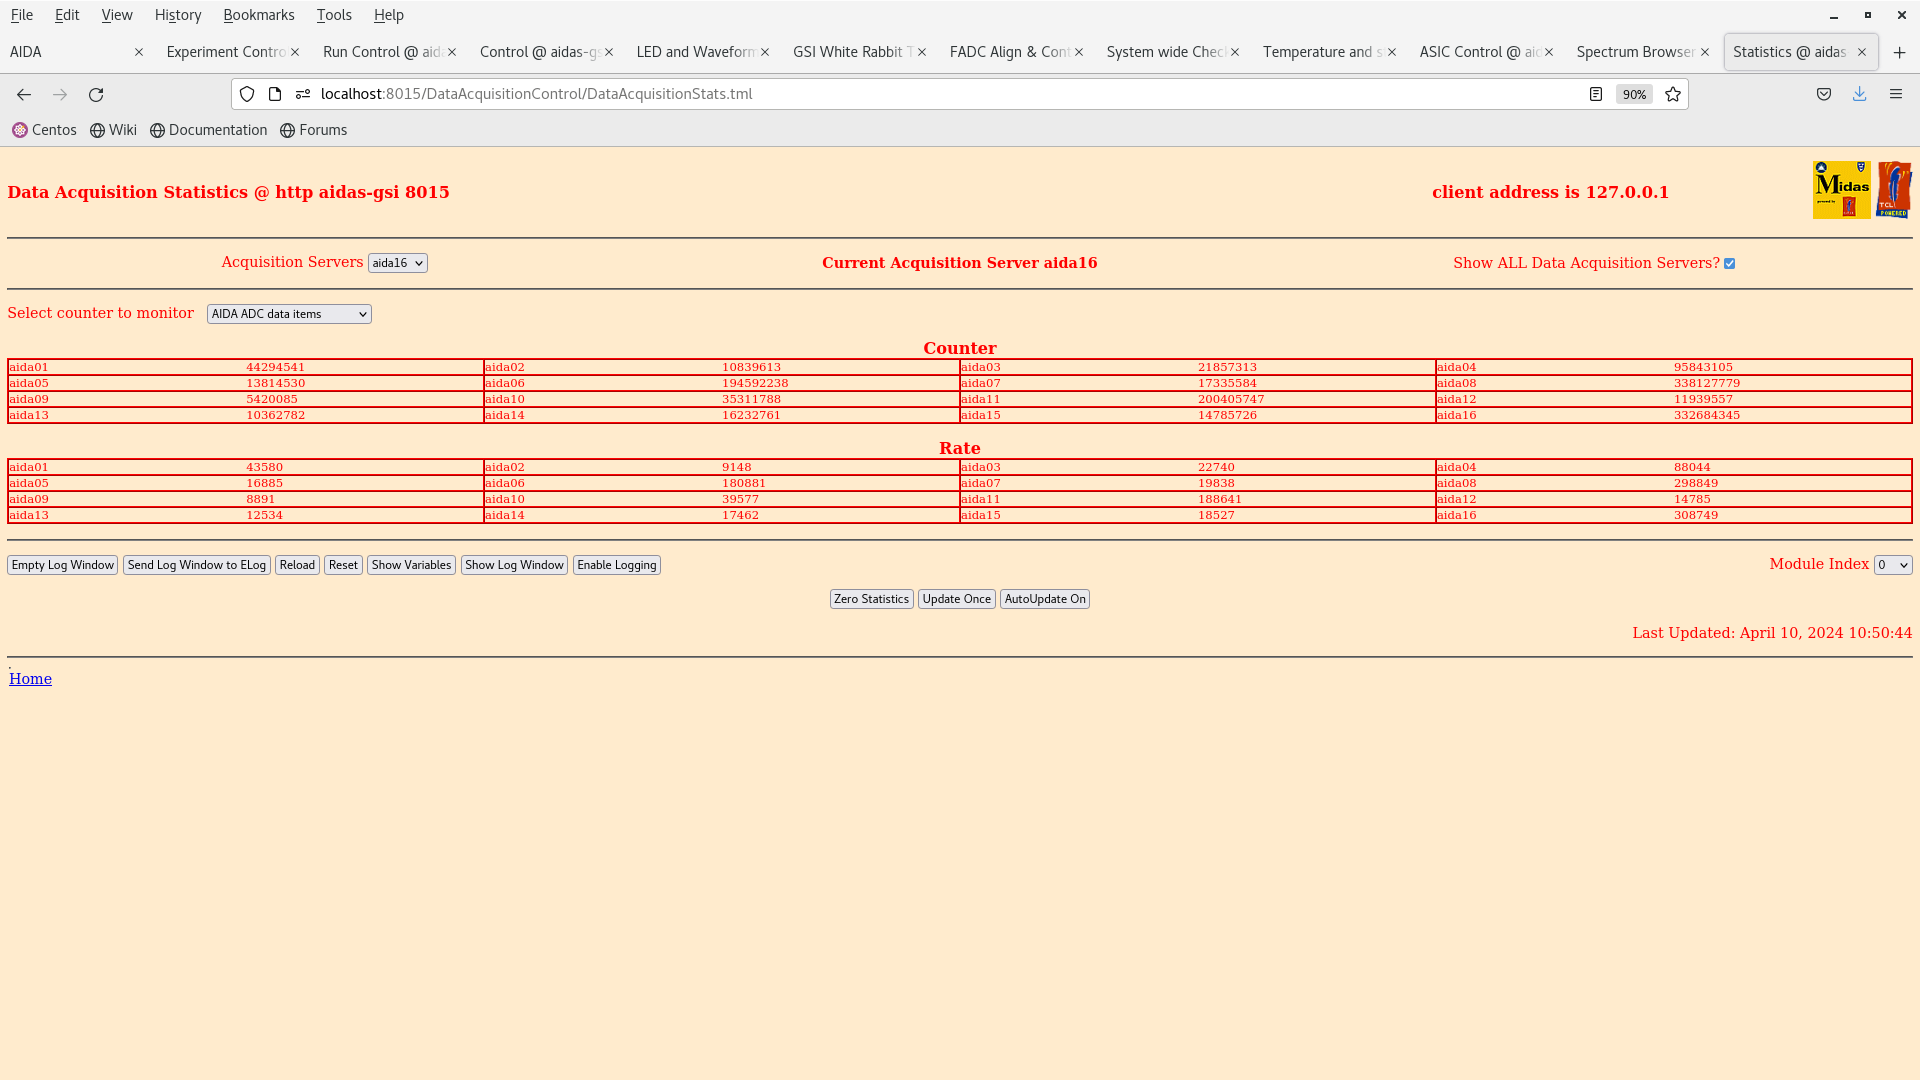
|
| Attachment 14: Screenshot_from_2024-04-10_10-50-37.png
|
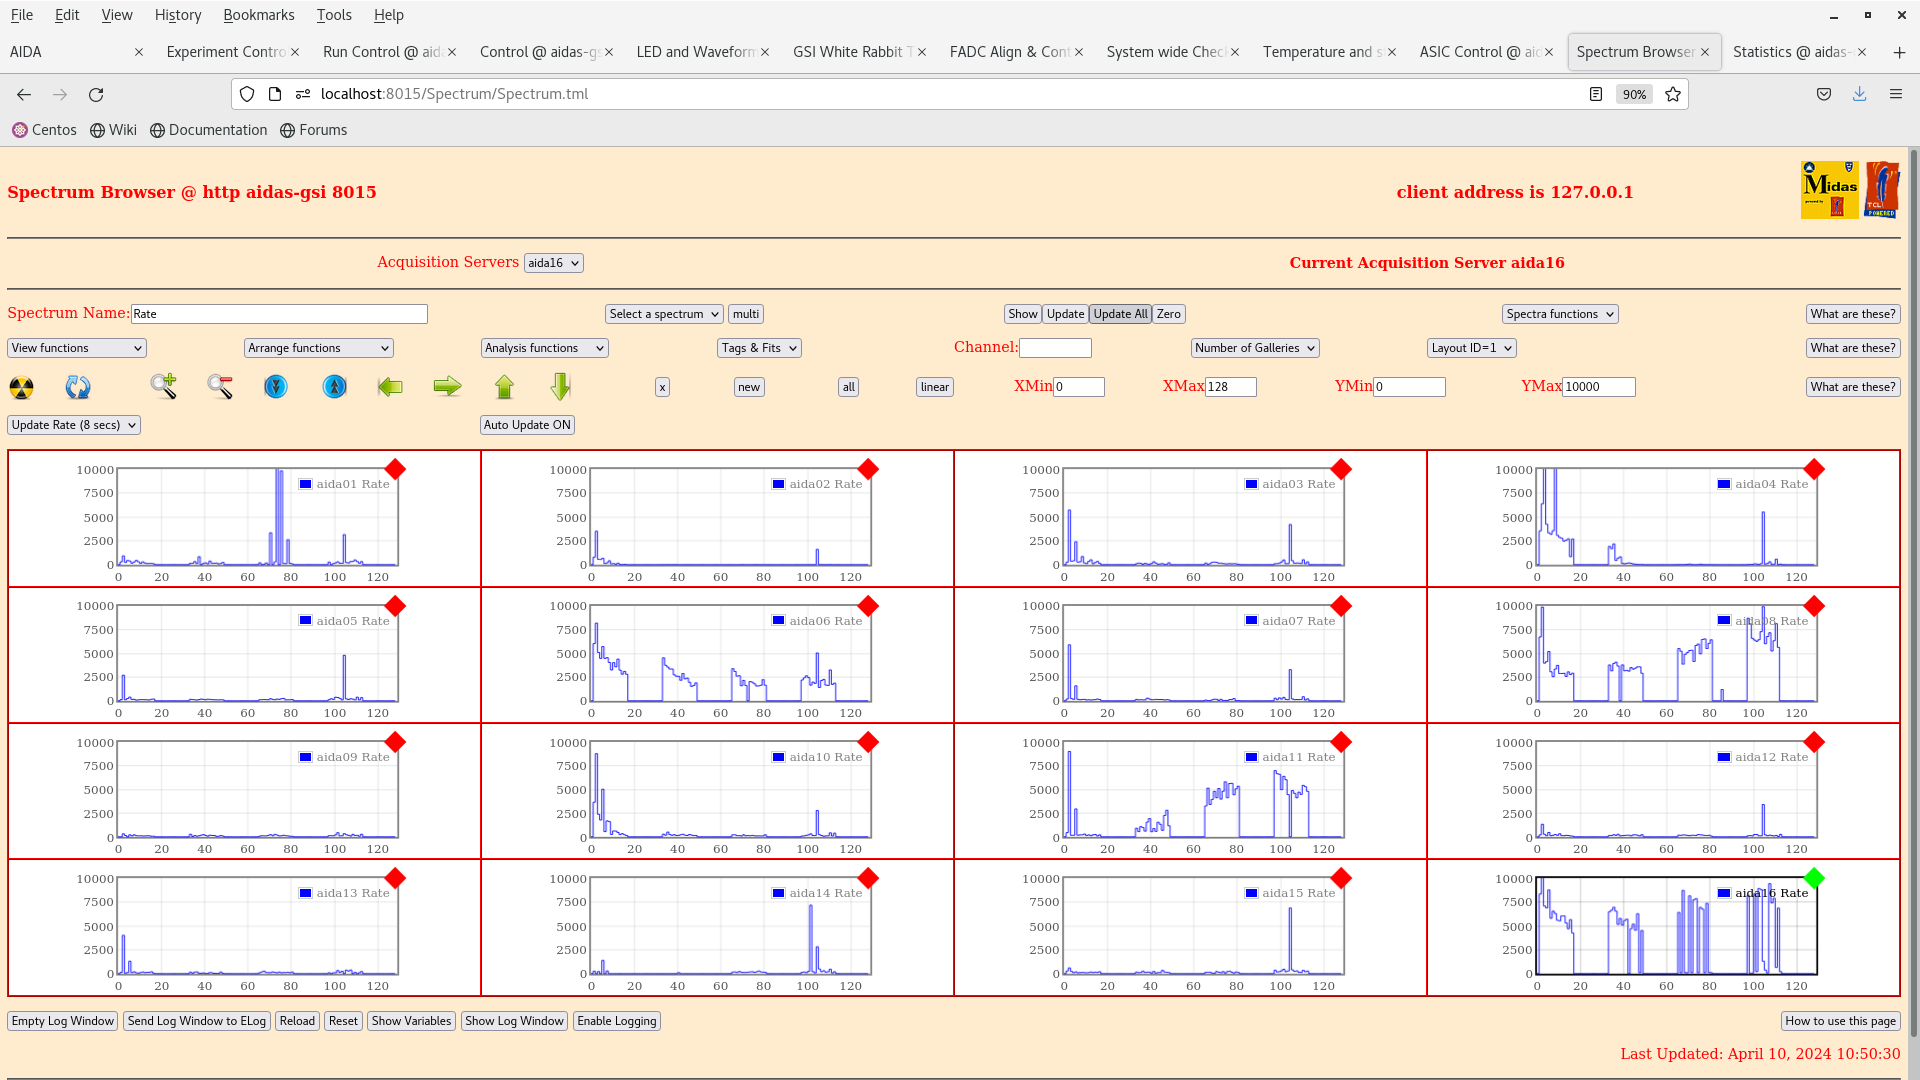
|
| Attachment 15: Screenshot_from_2024-04-10_10-52-40.png
|
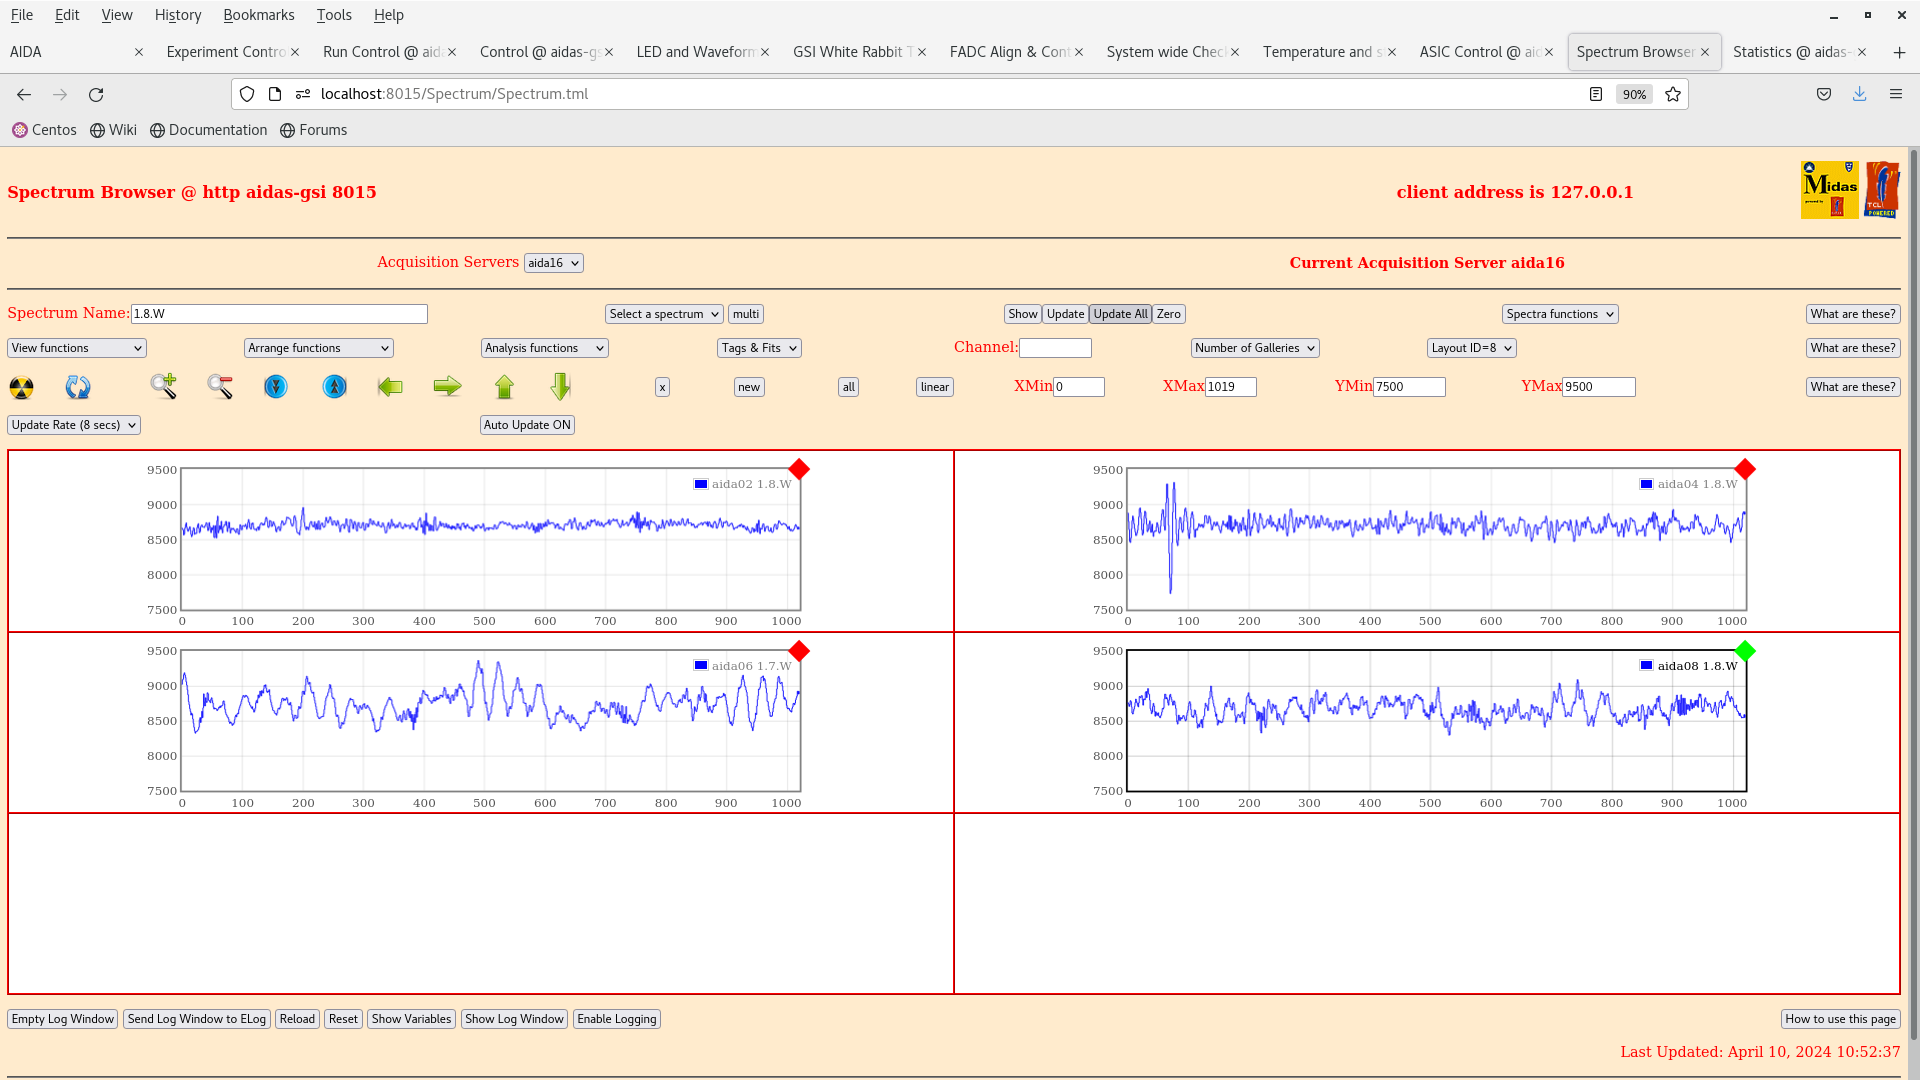
|
| Attachment 16: Screenshot_from_2024-04-10_10-52-16.png
|
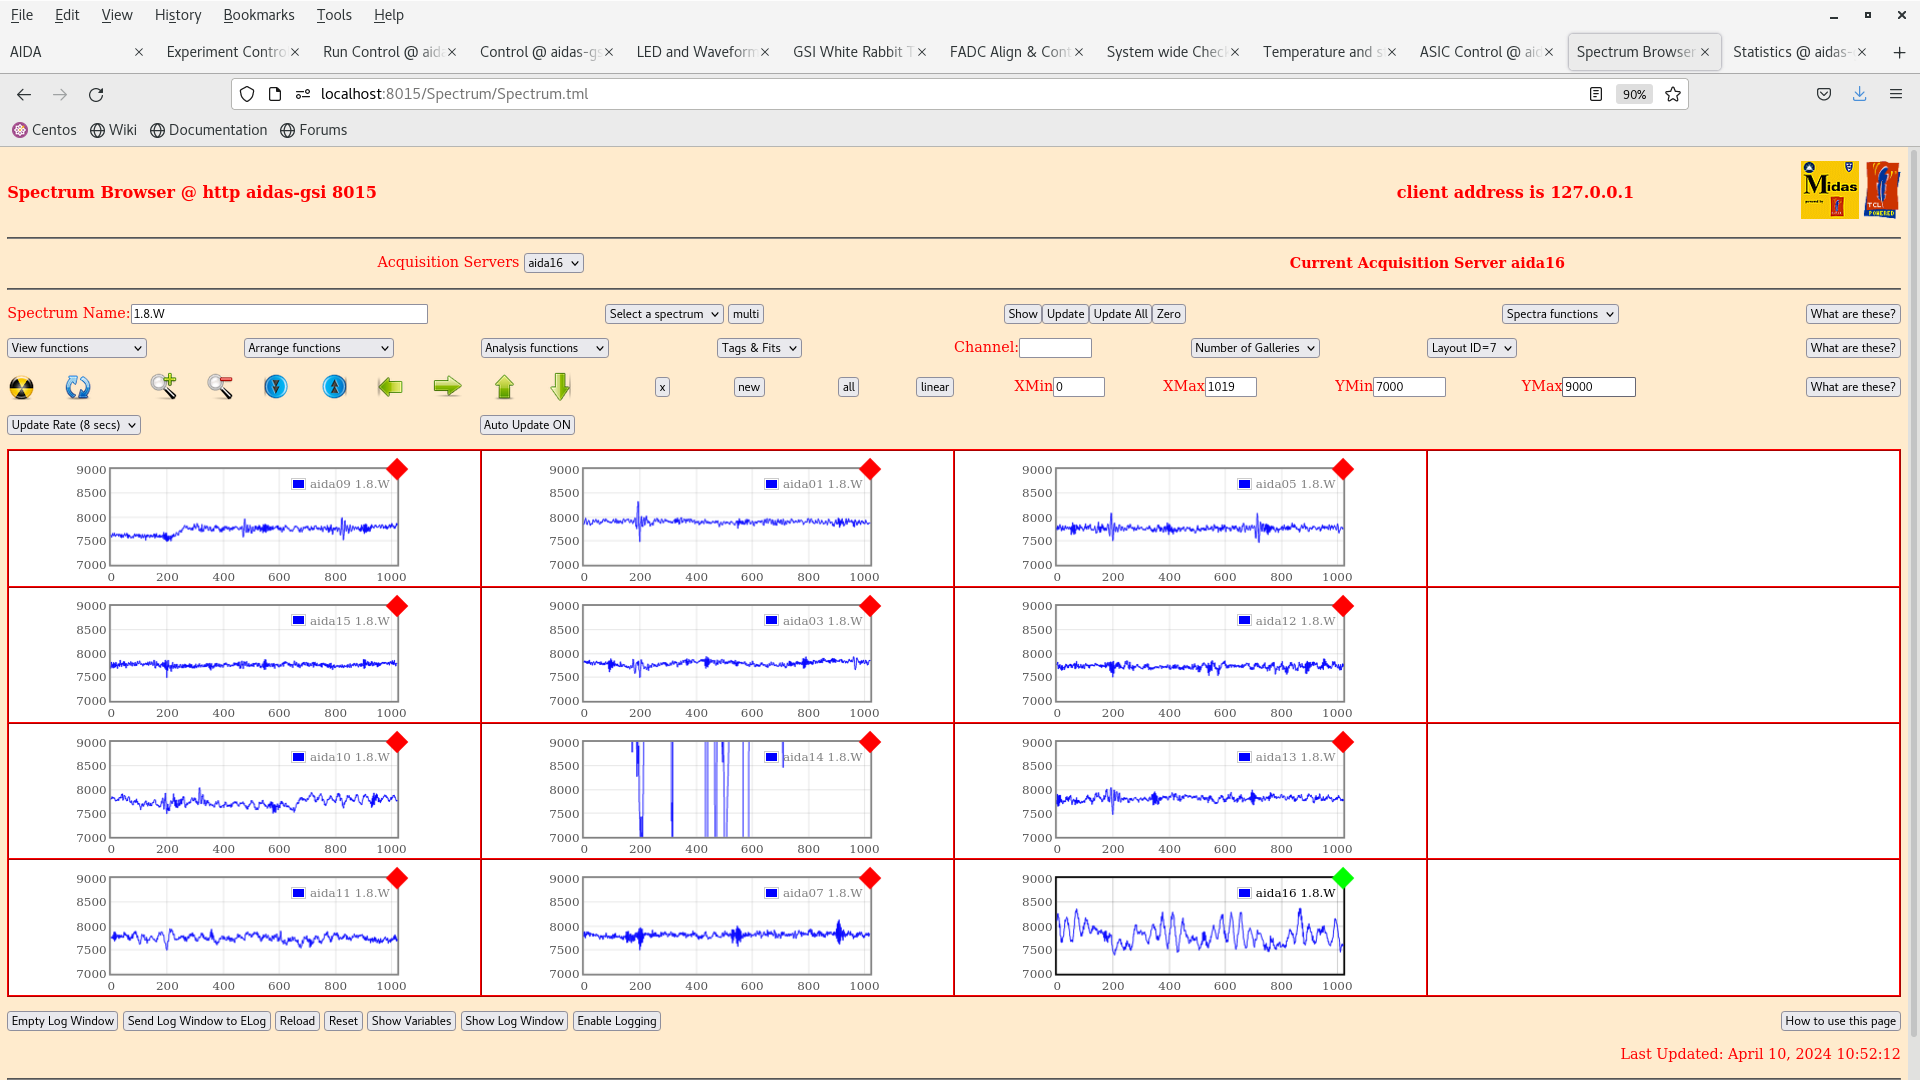
|
| Attachment 17: Screenshot_from_2024-04-10_11-41-42.png
|

|
| Attachment 18: IMG_0010.JPG
|
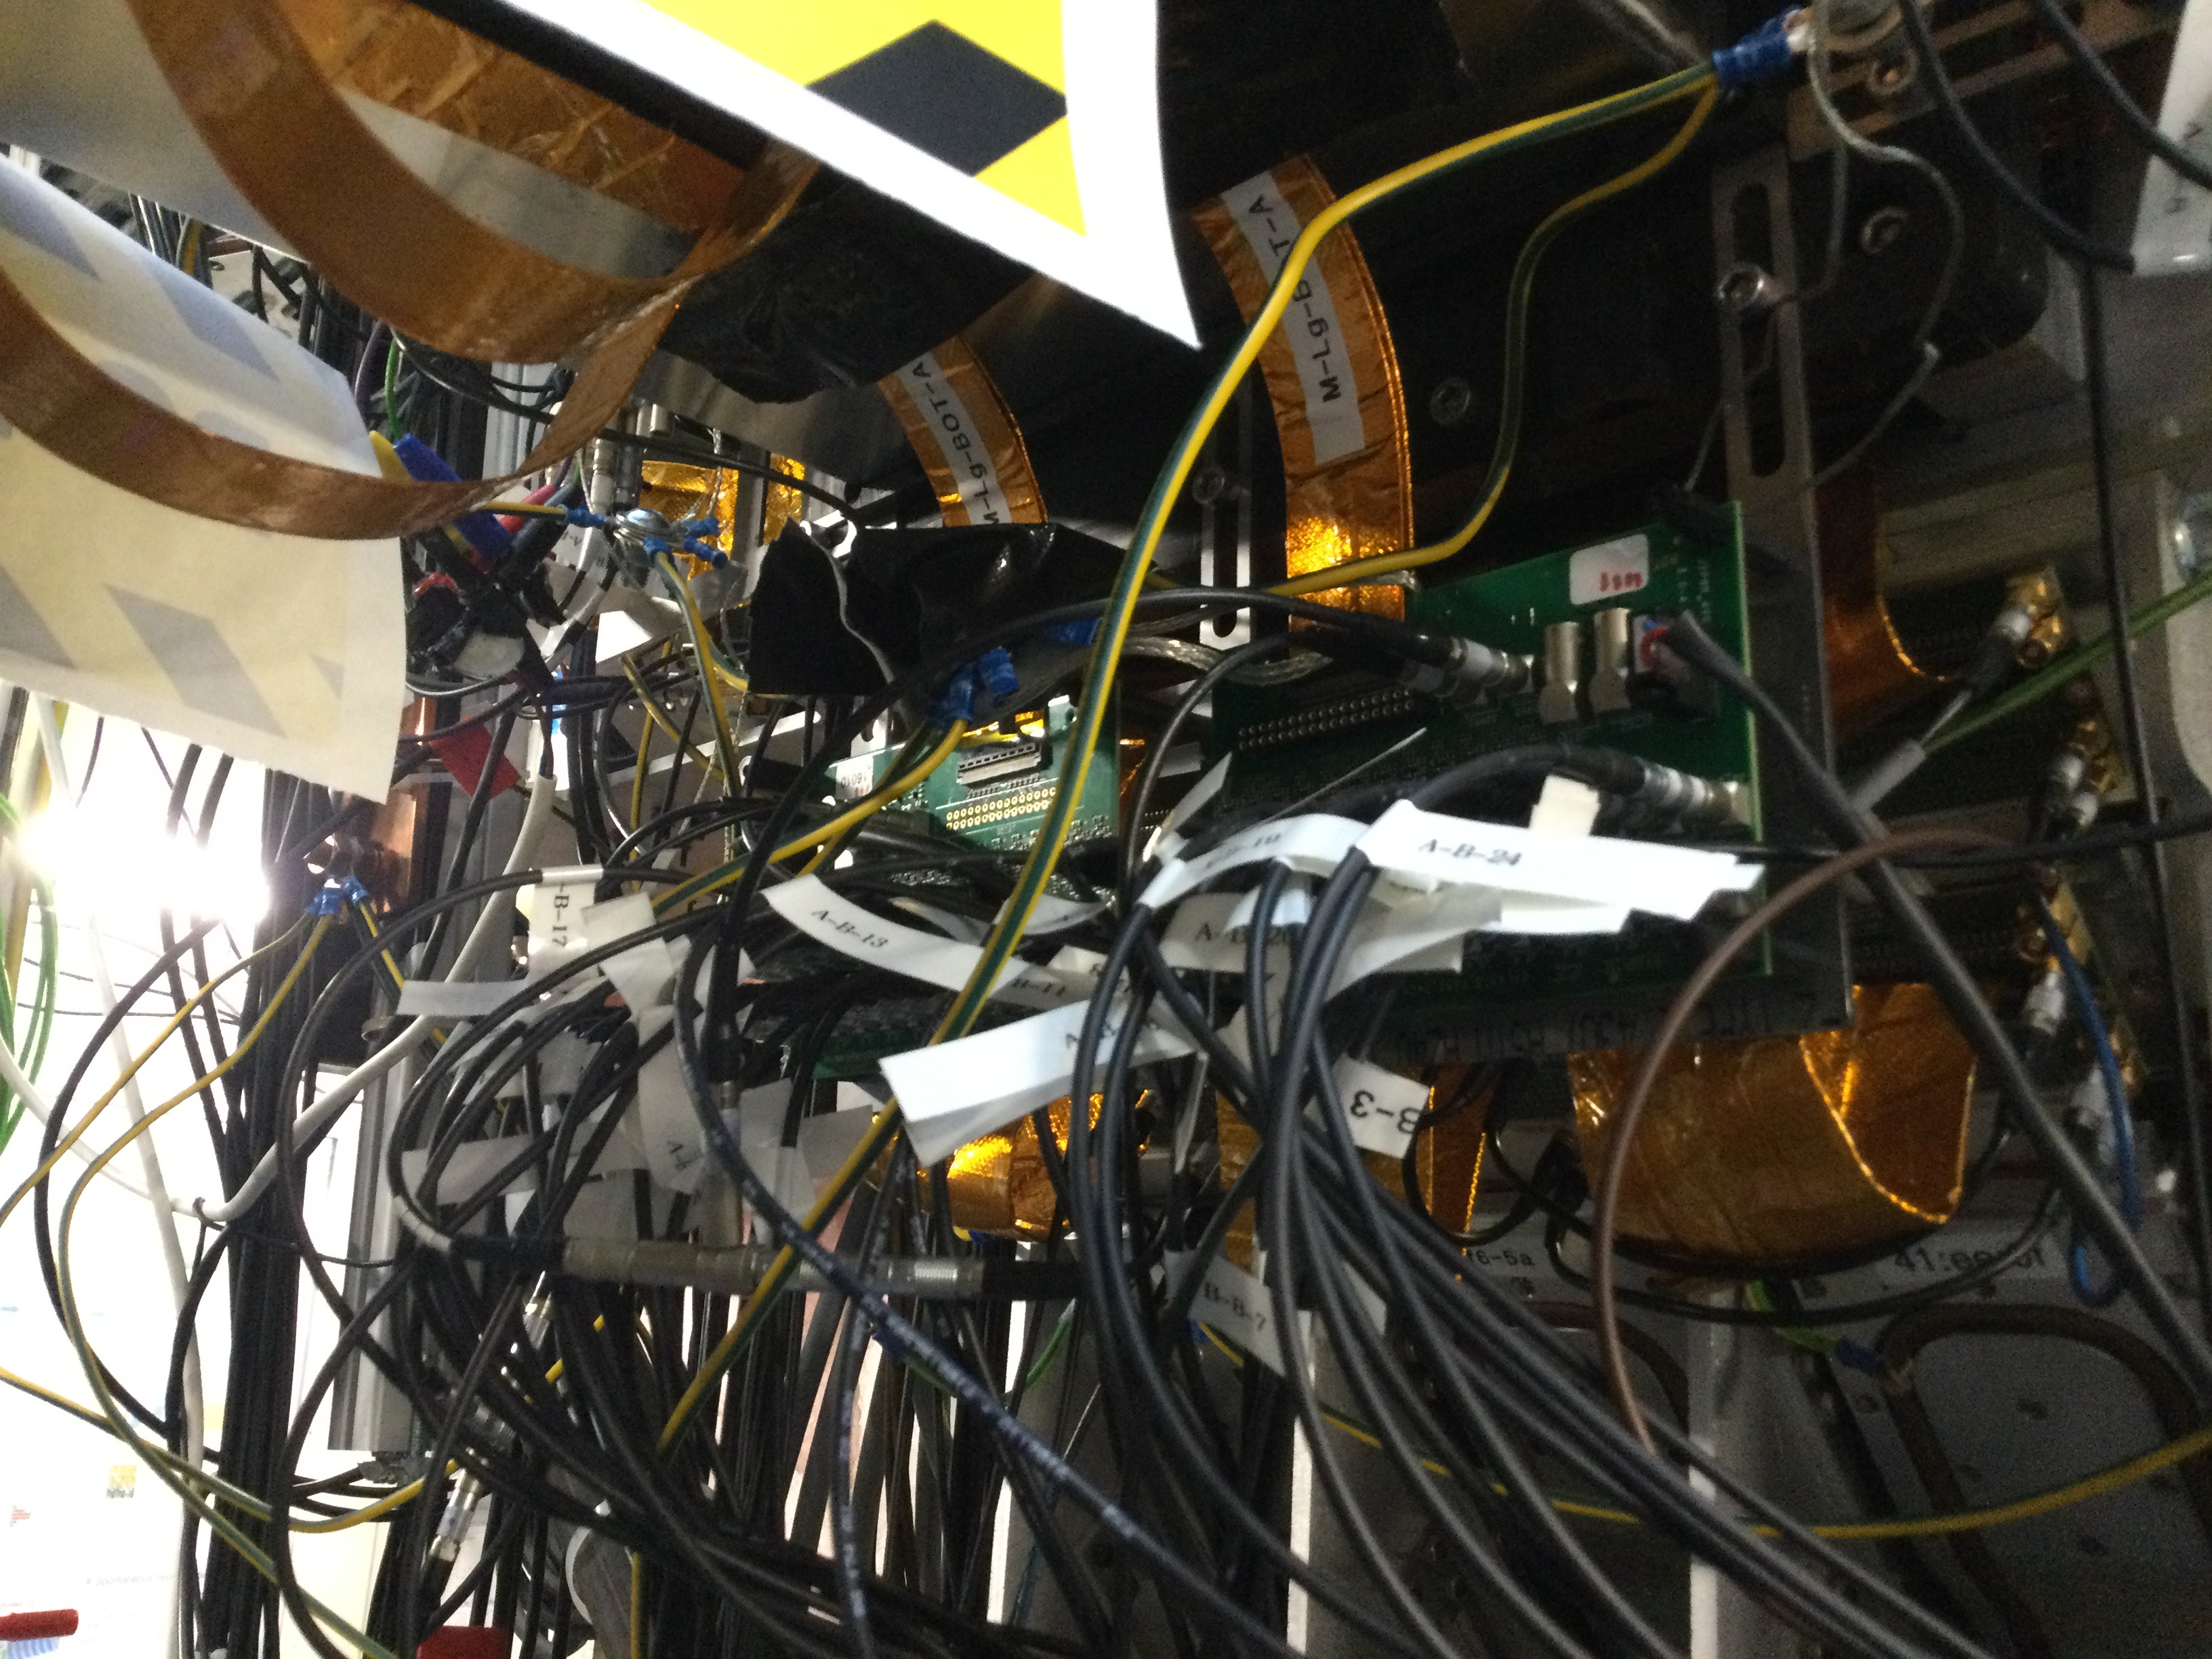
|
| Attachment 19: IMG_0007.JPG
|
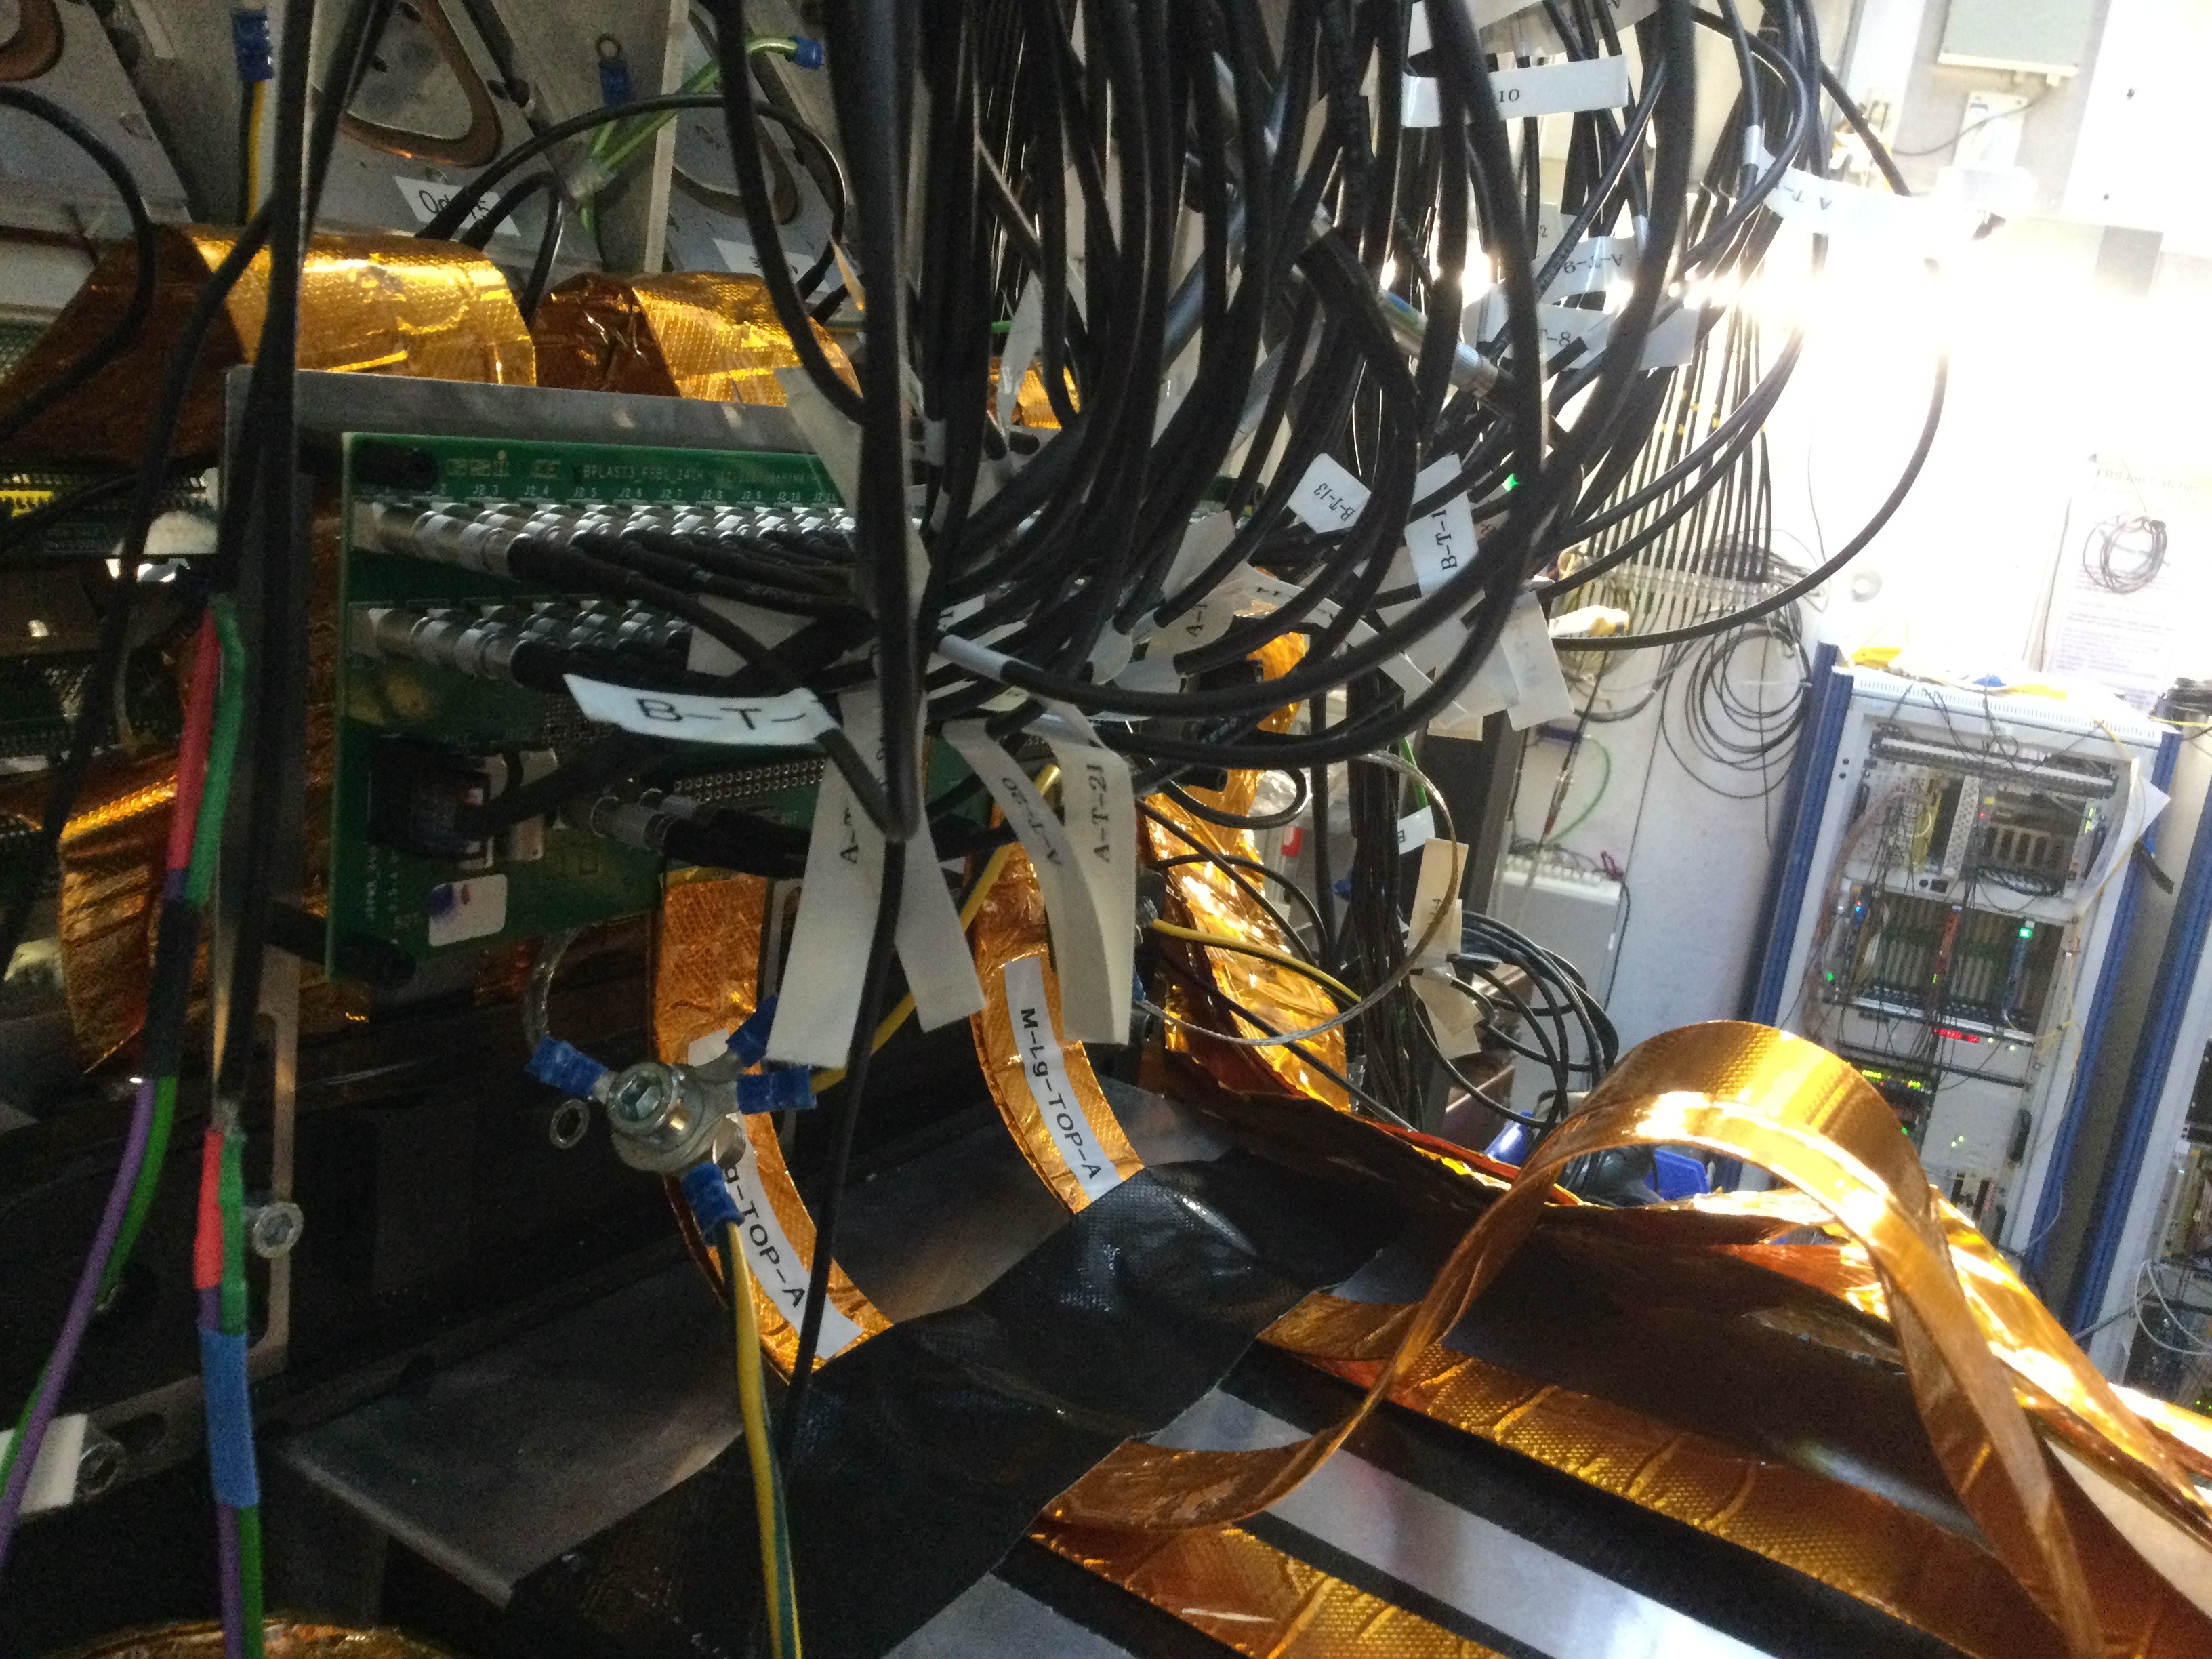
|
| Attachment 20: IMG_0012.JPG
|
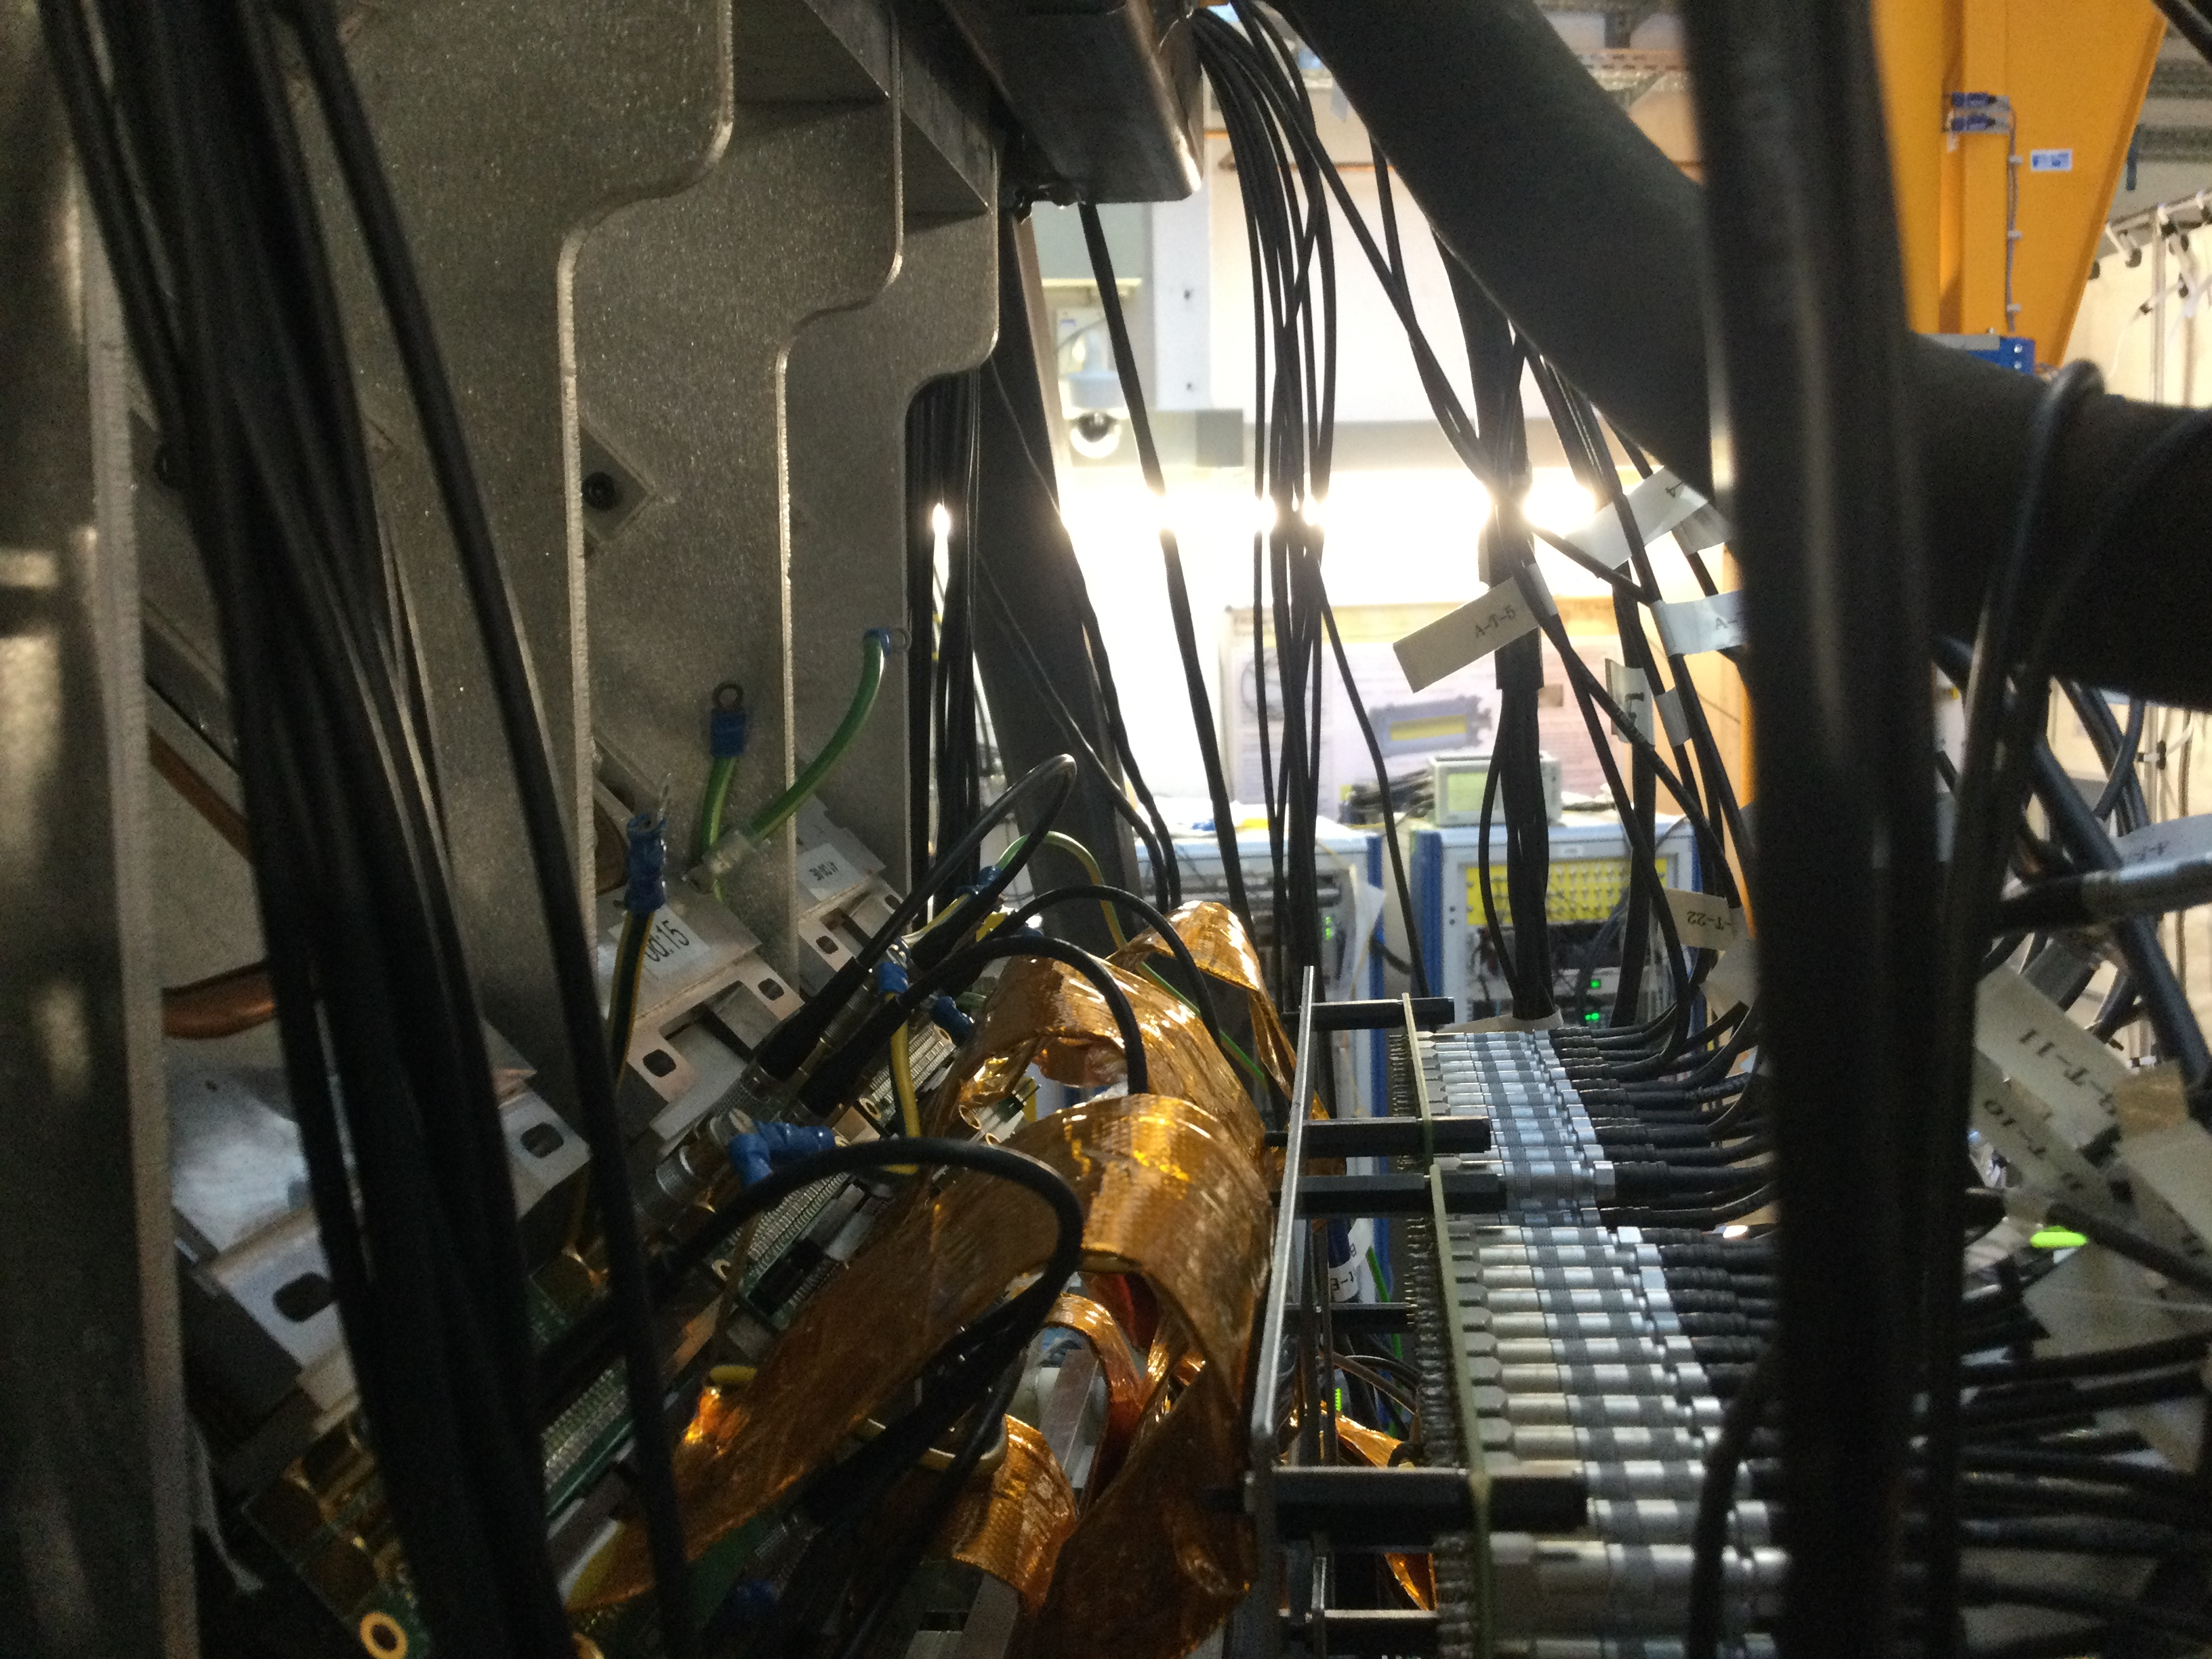
|
| Attachment 21: IMG_0005.JPG
|
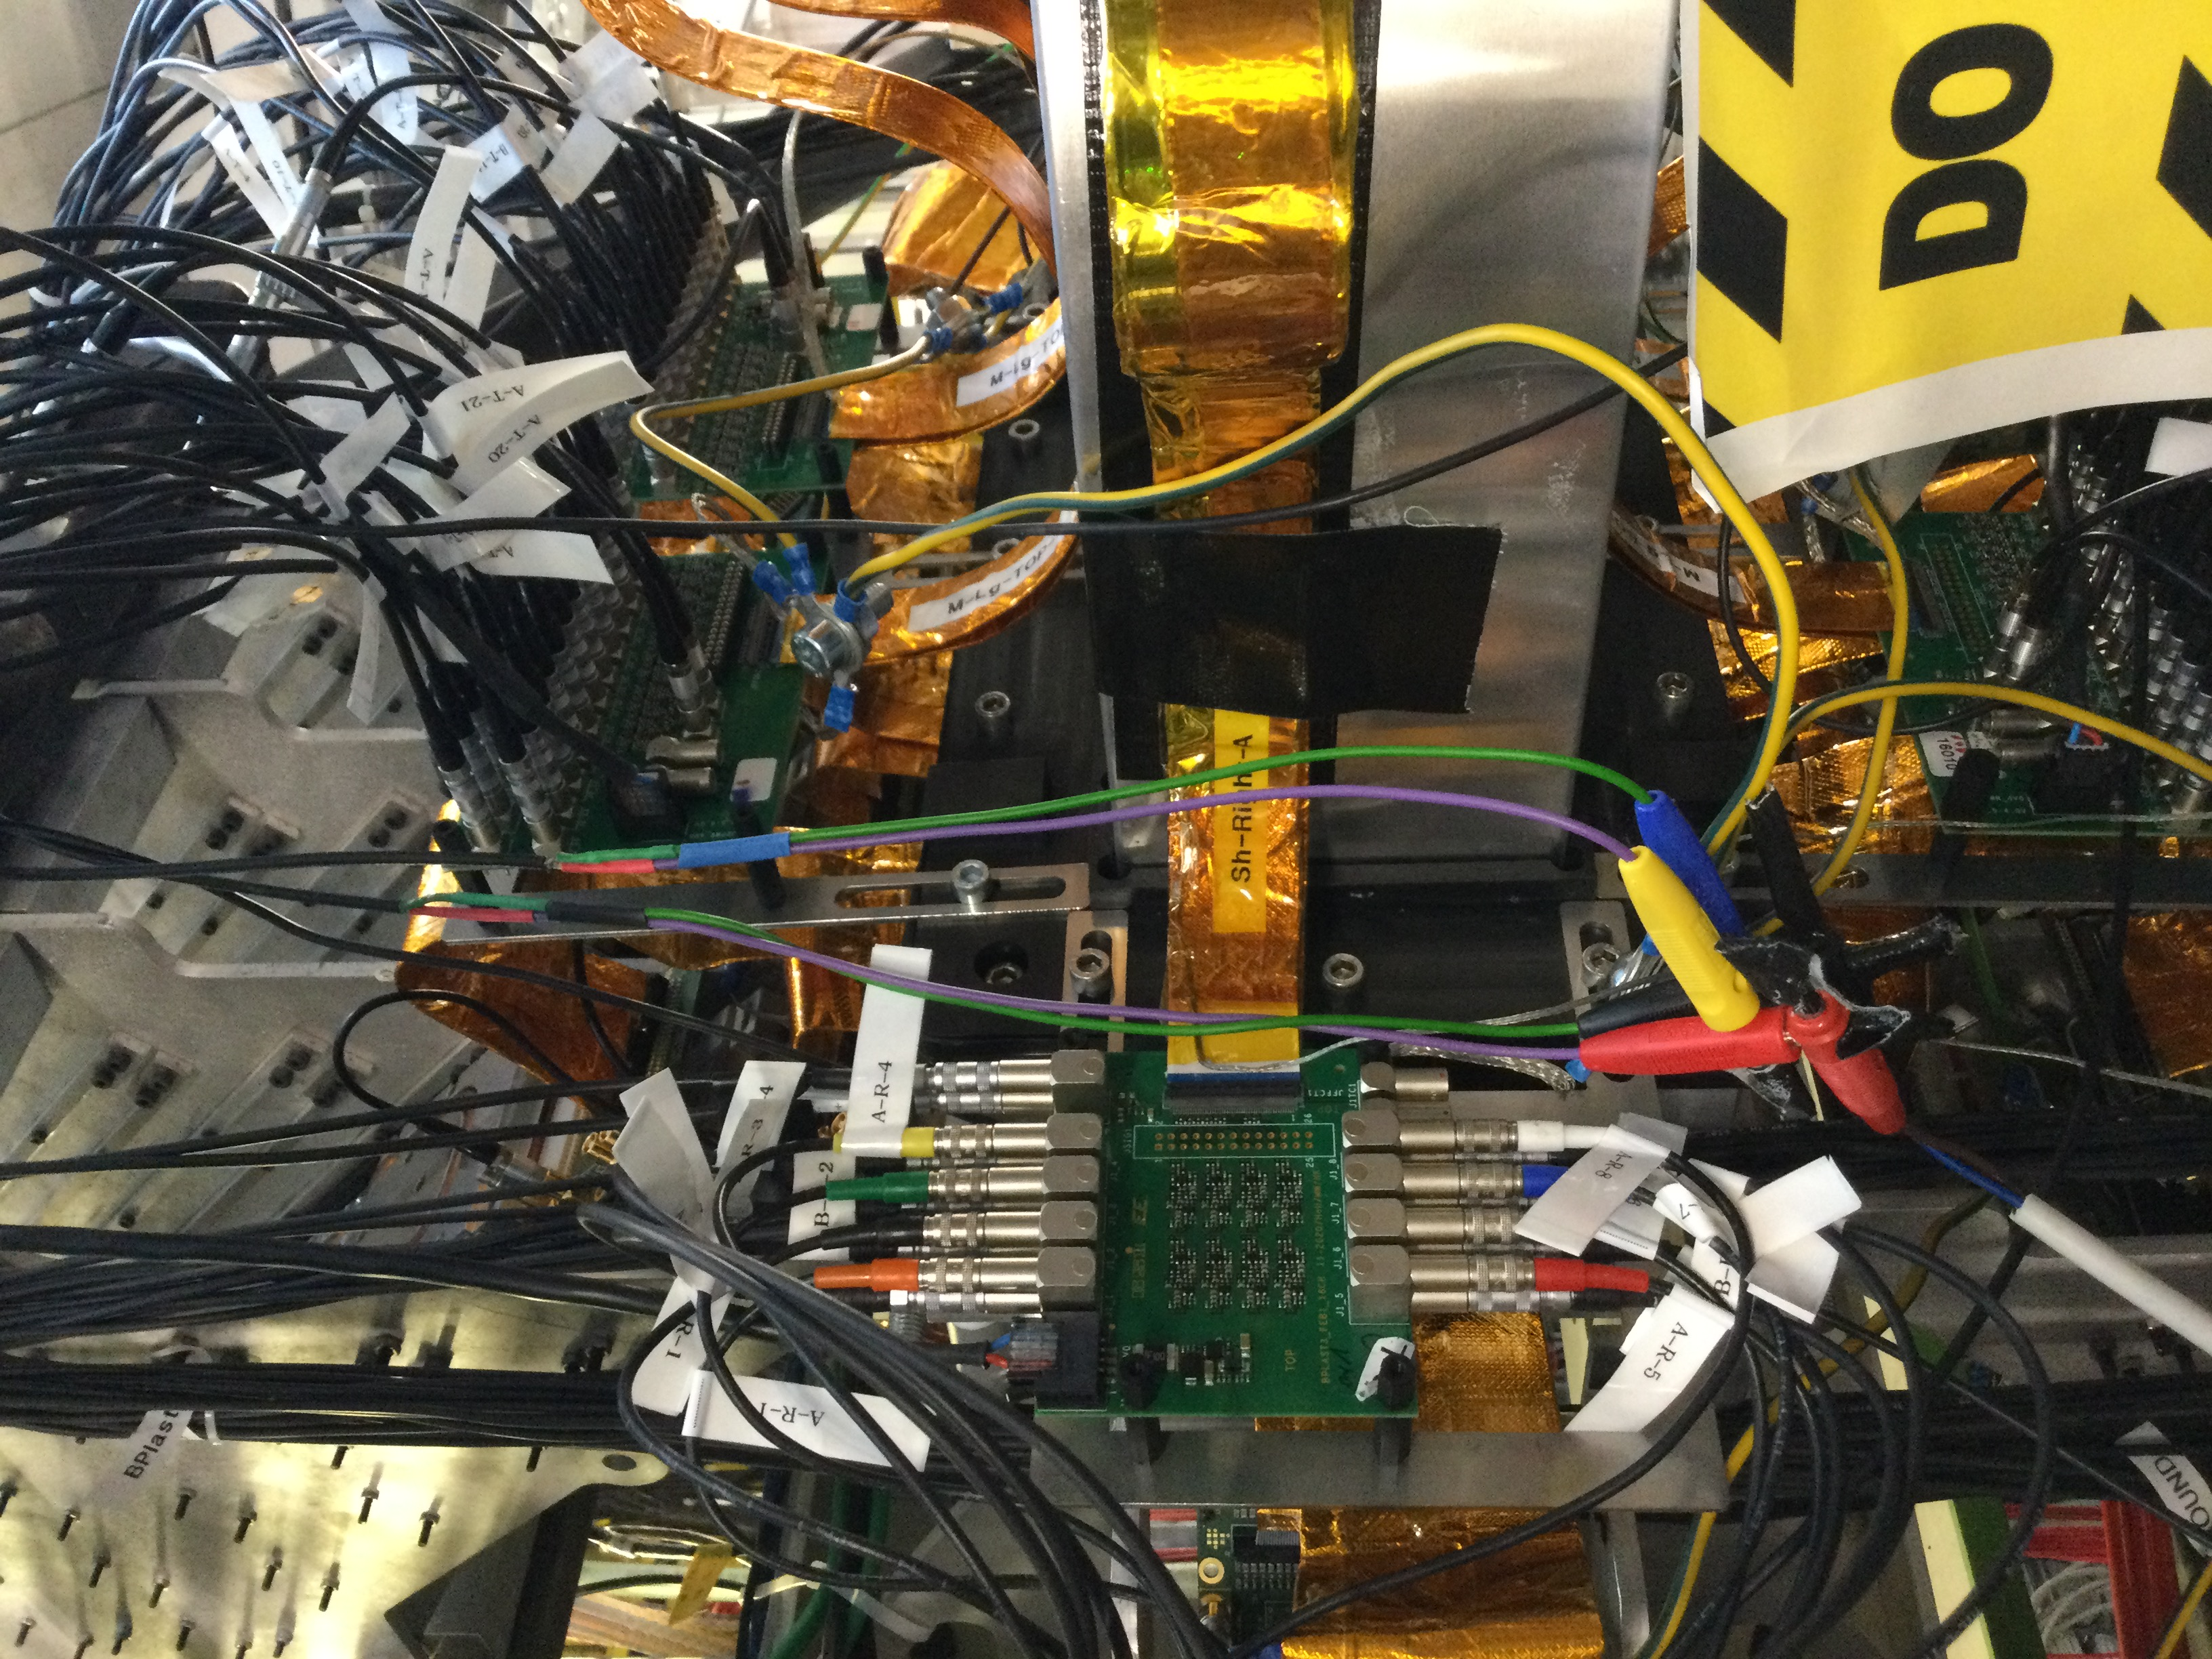
|
| Attachment 22: IMG_0009.JPG
|
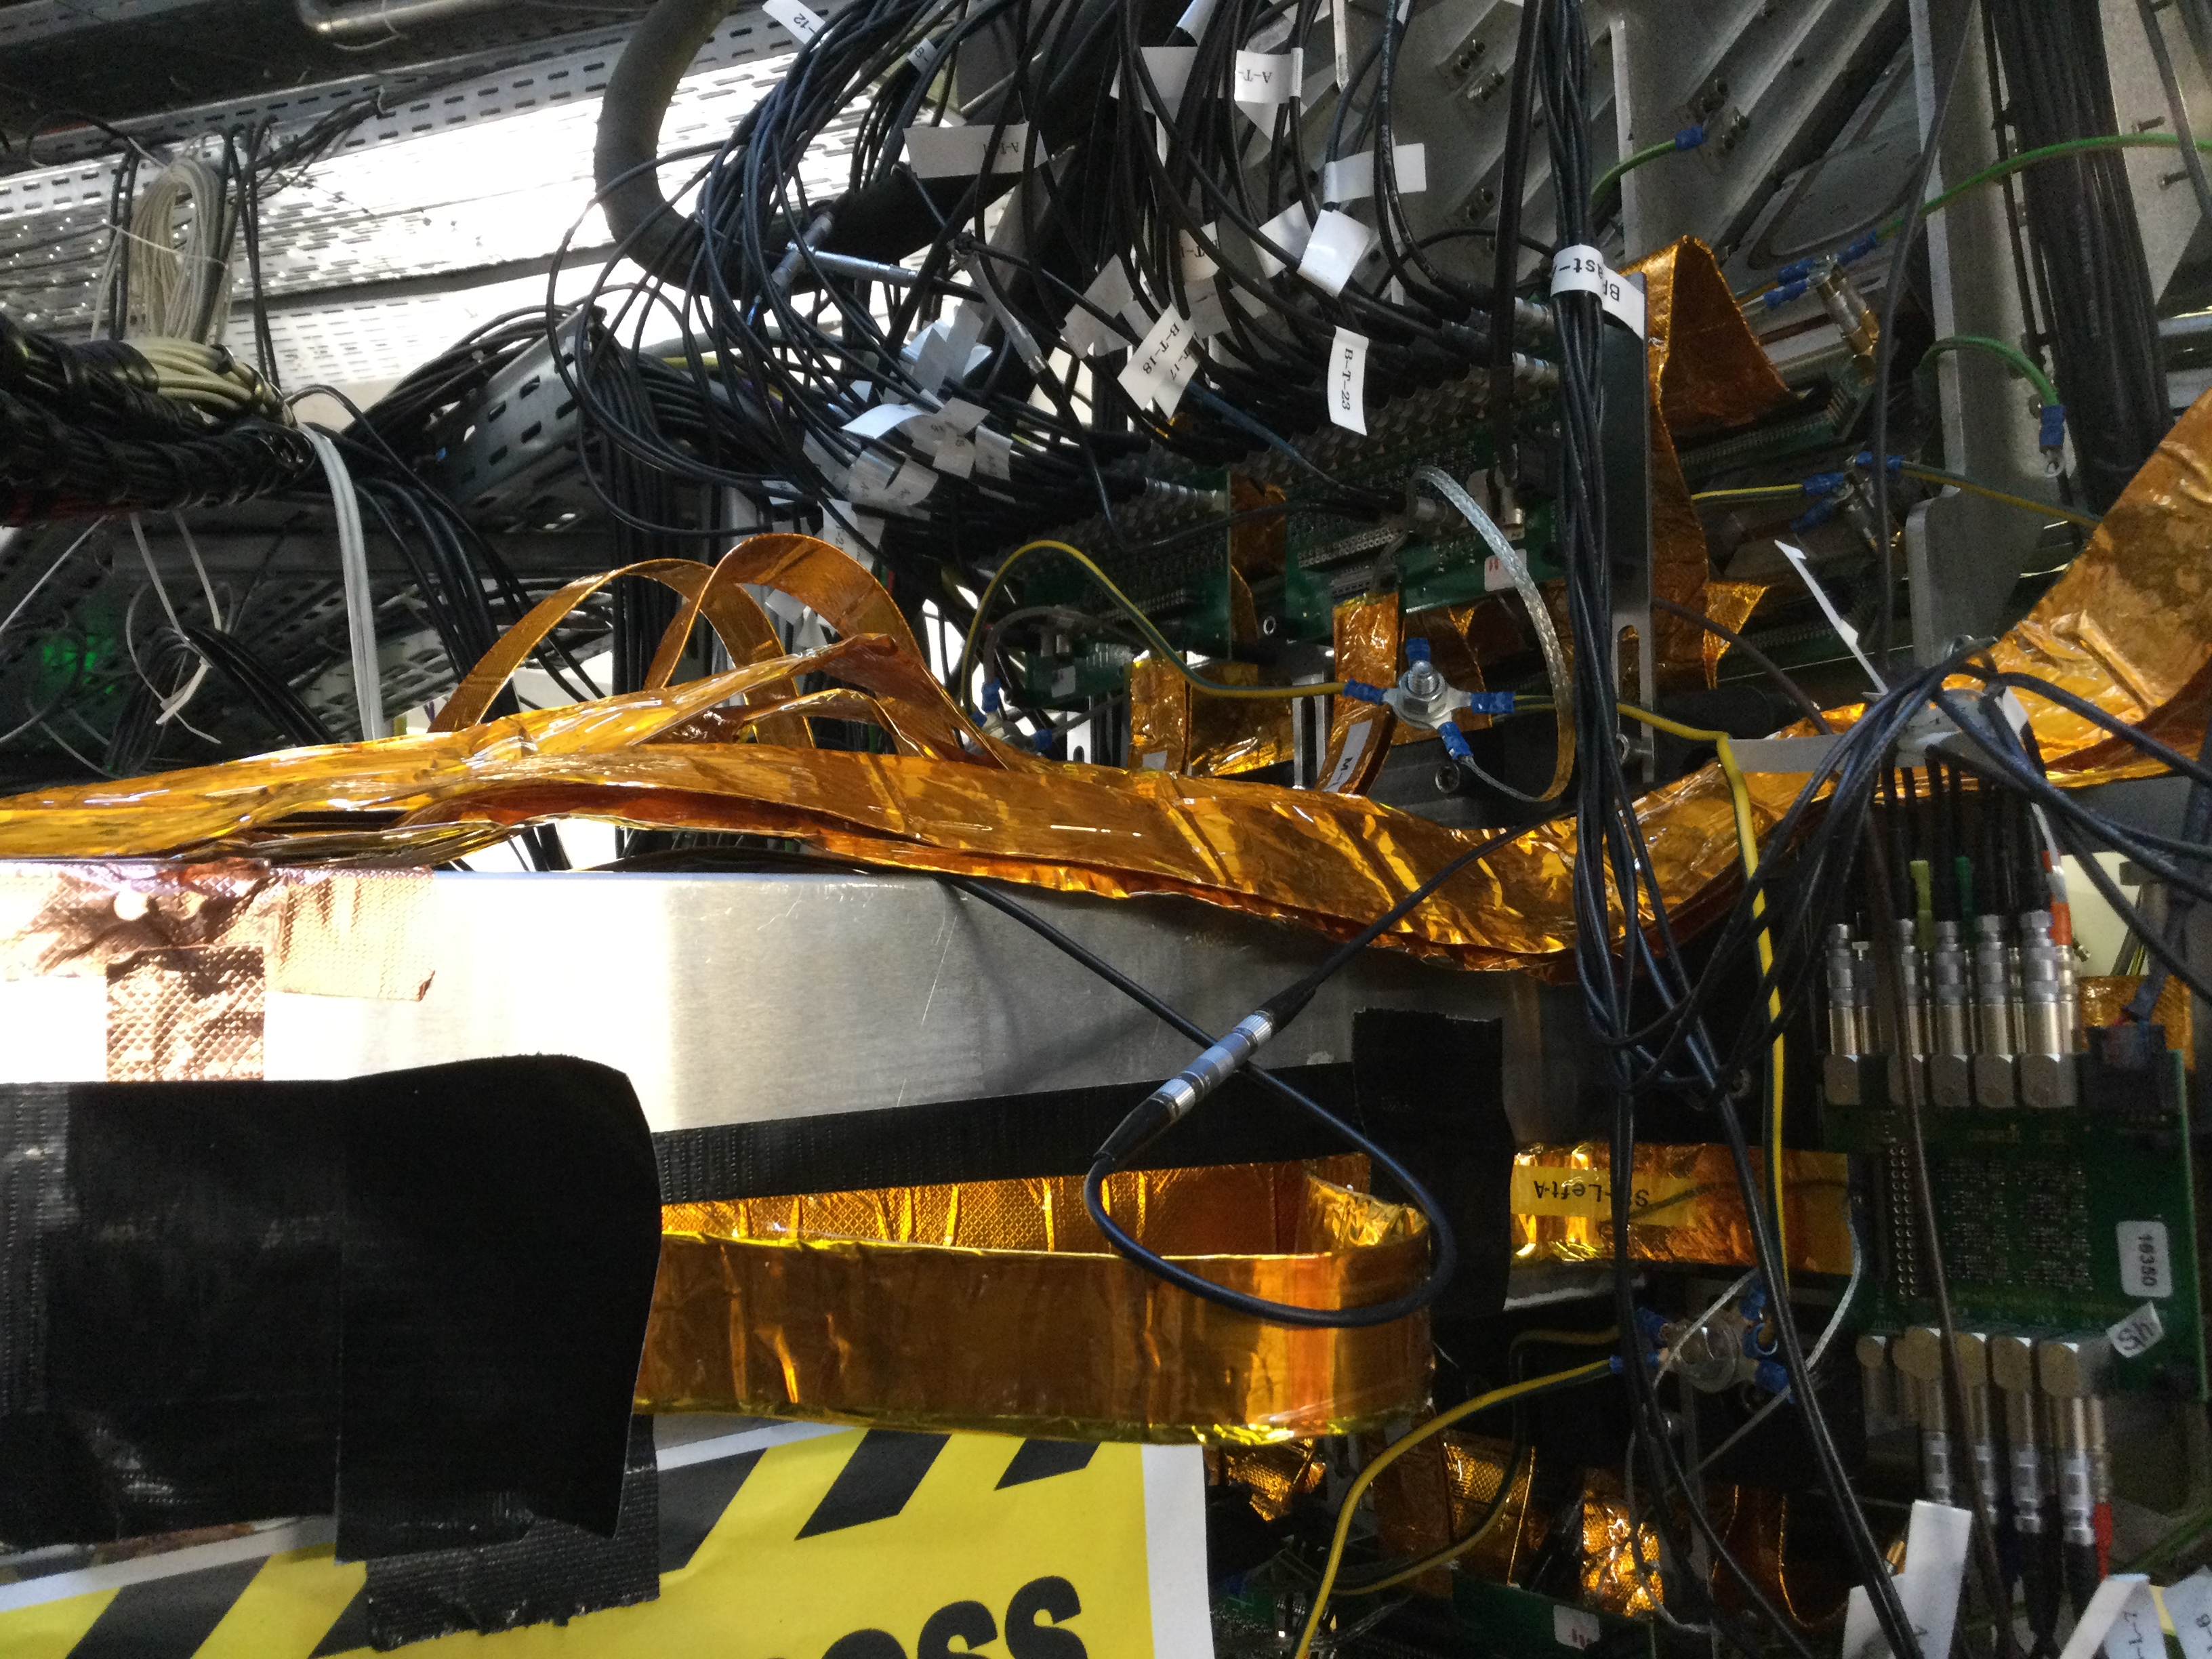
|
| Attachment 23: IMG_0015.JPG
|
|
| Attachment 24: IMG_0014.JPG
|
|
| Attachment 25: IMG_0017.JPG
|
|
| Attachment 26: IMG_0006.JPG
|
|
| Attachment 27: IMG_0013.JPG
|
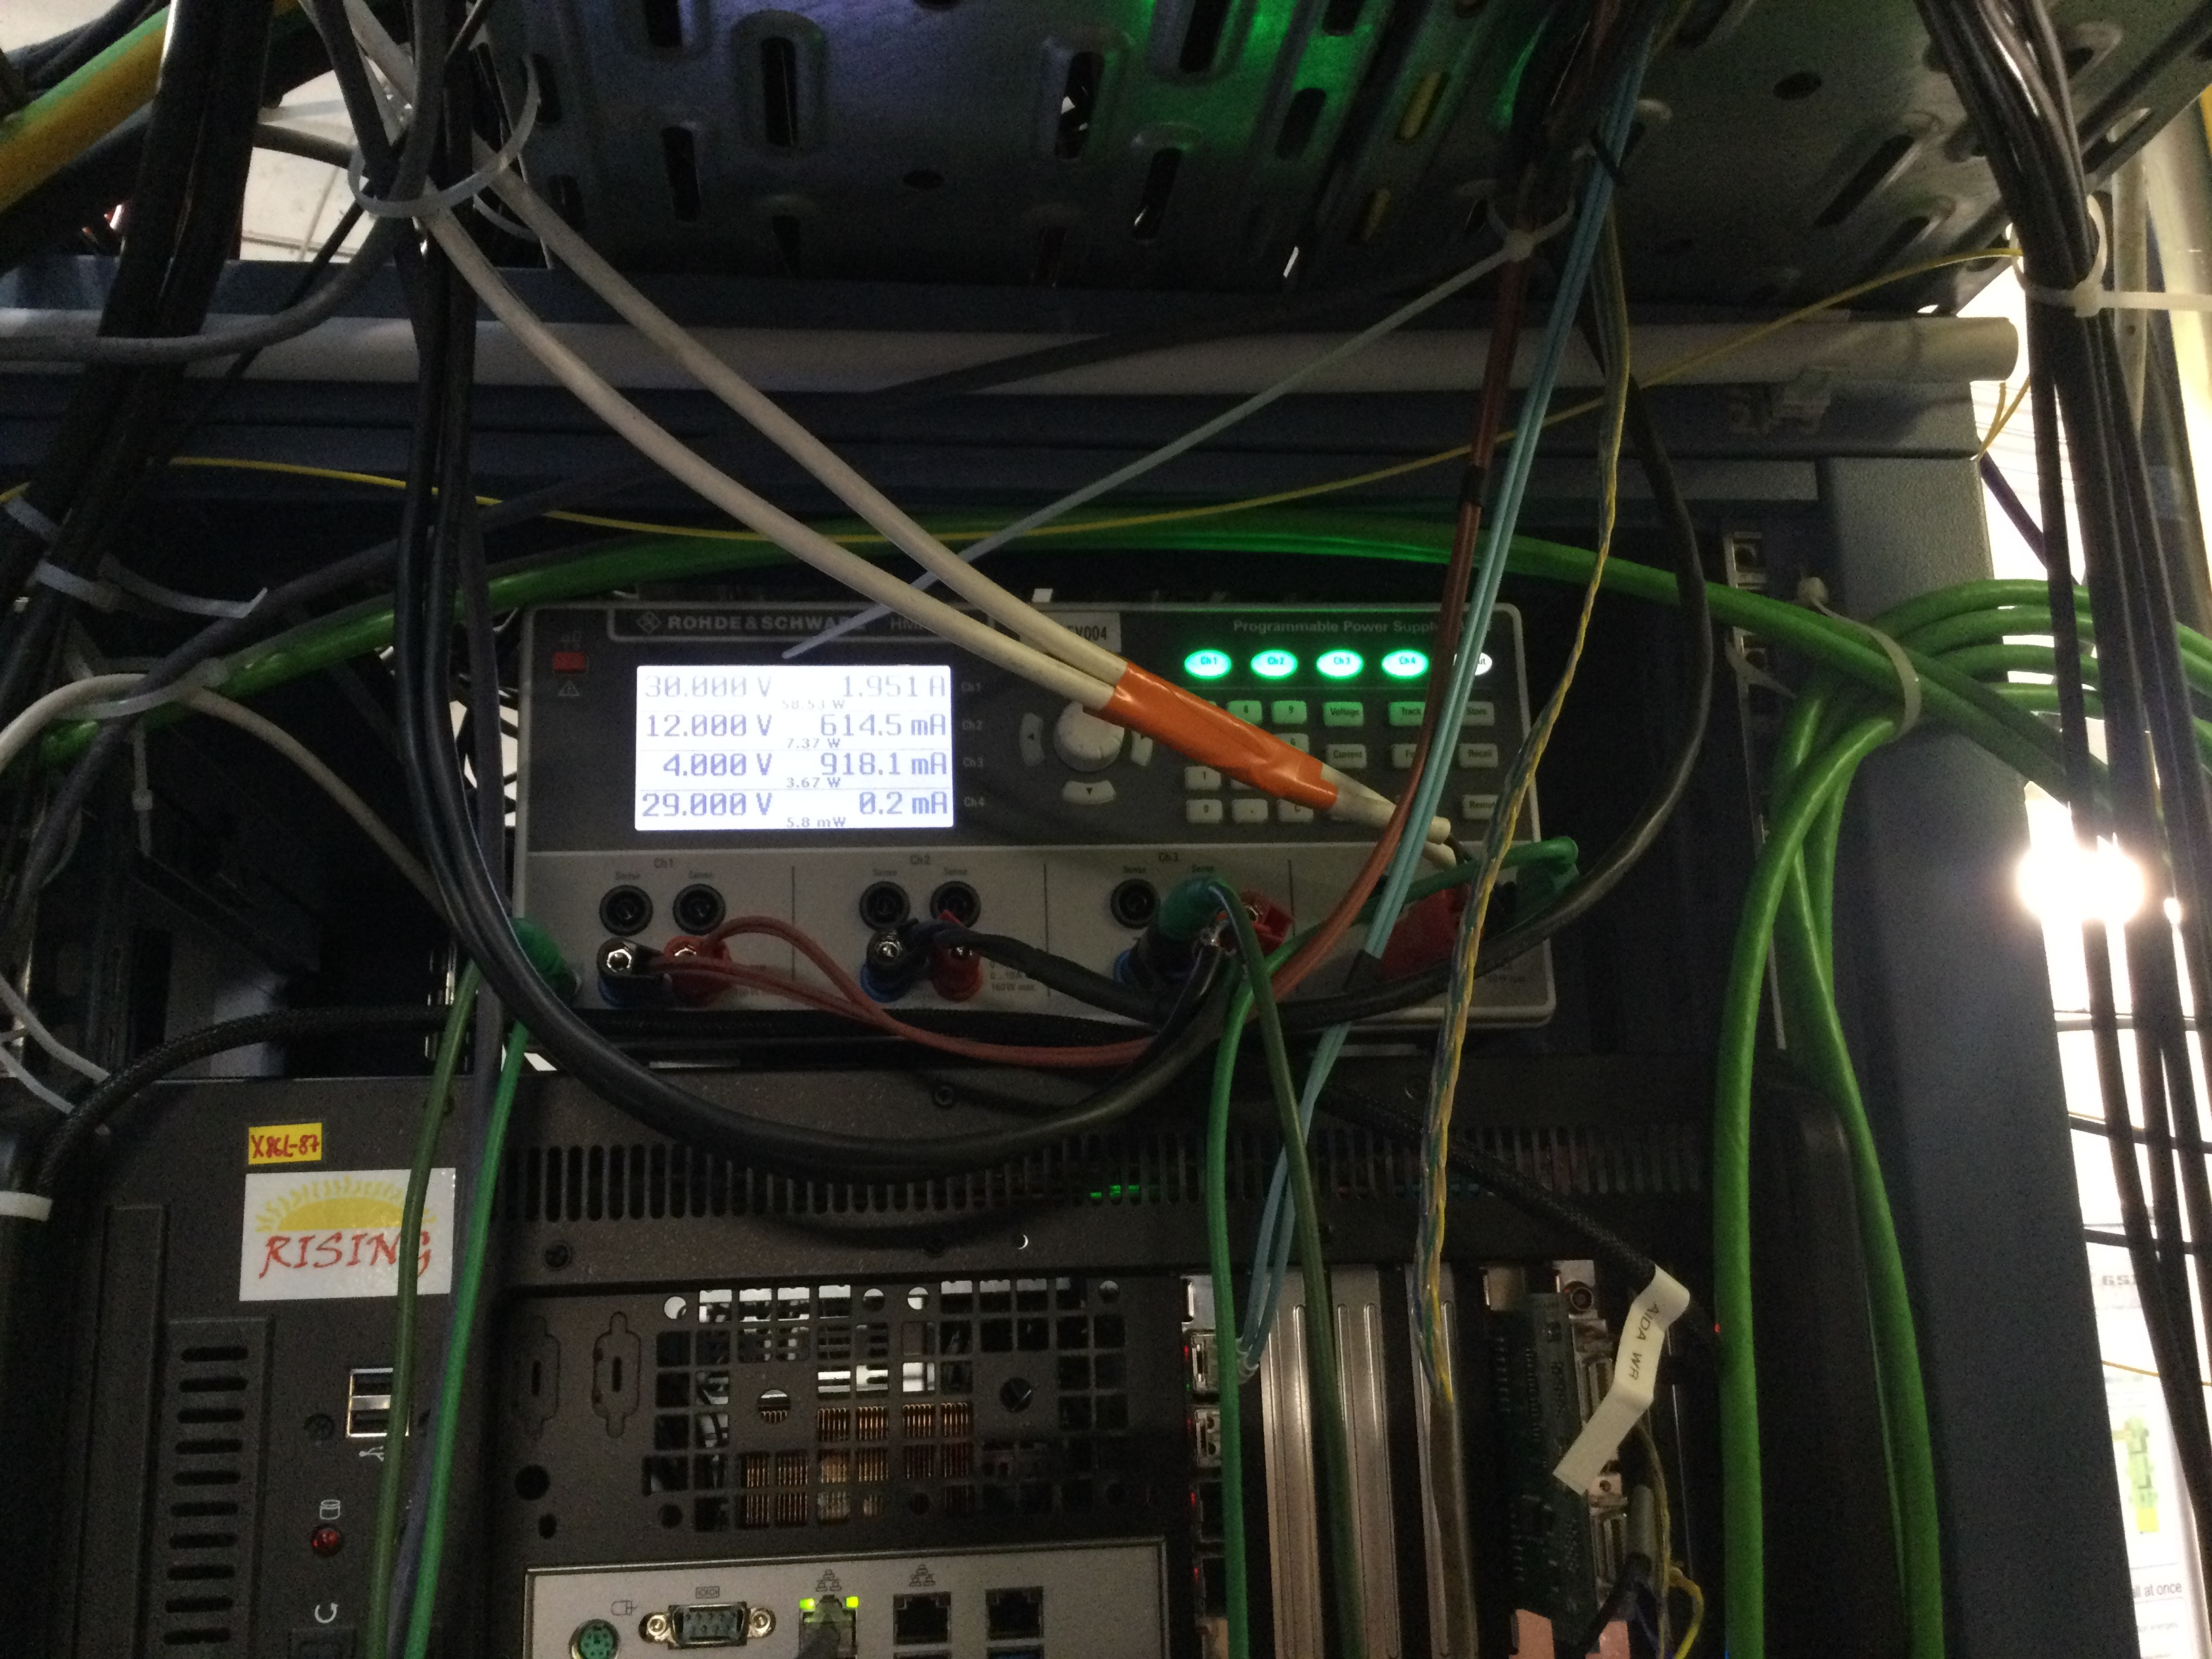
|
| Attachment 28: Screenshot_from_2024-04-10_13-18-09.png
|
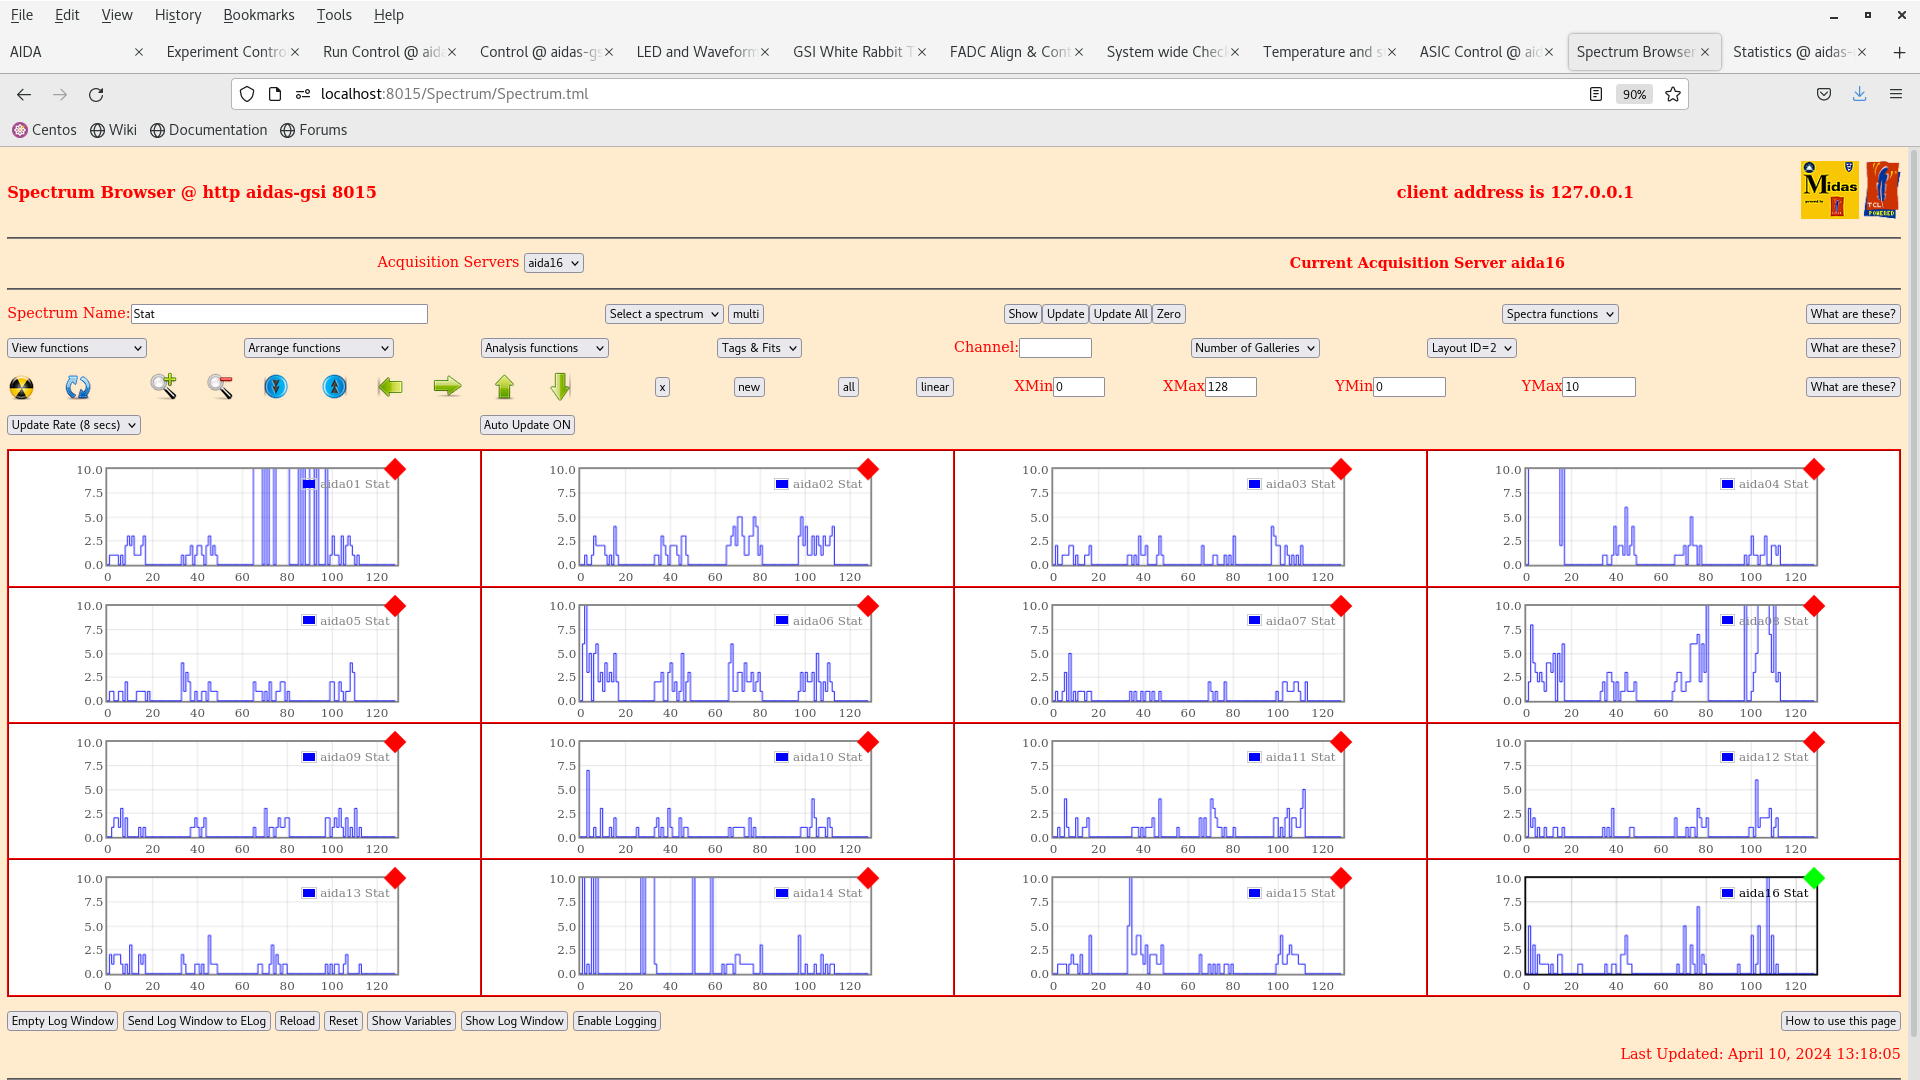
|
| Attachment 29: Screenshot_from_2024-04-10_15-55-15.png
|
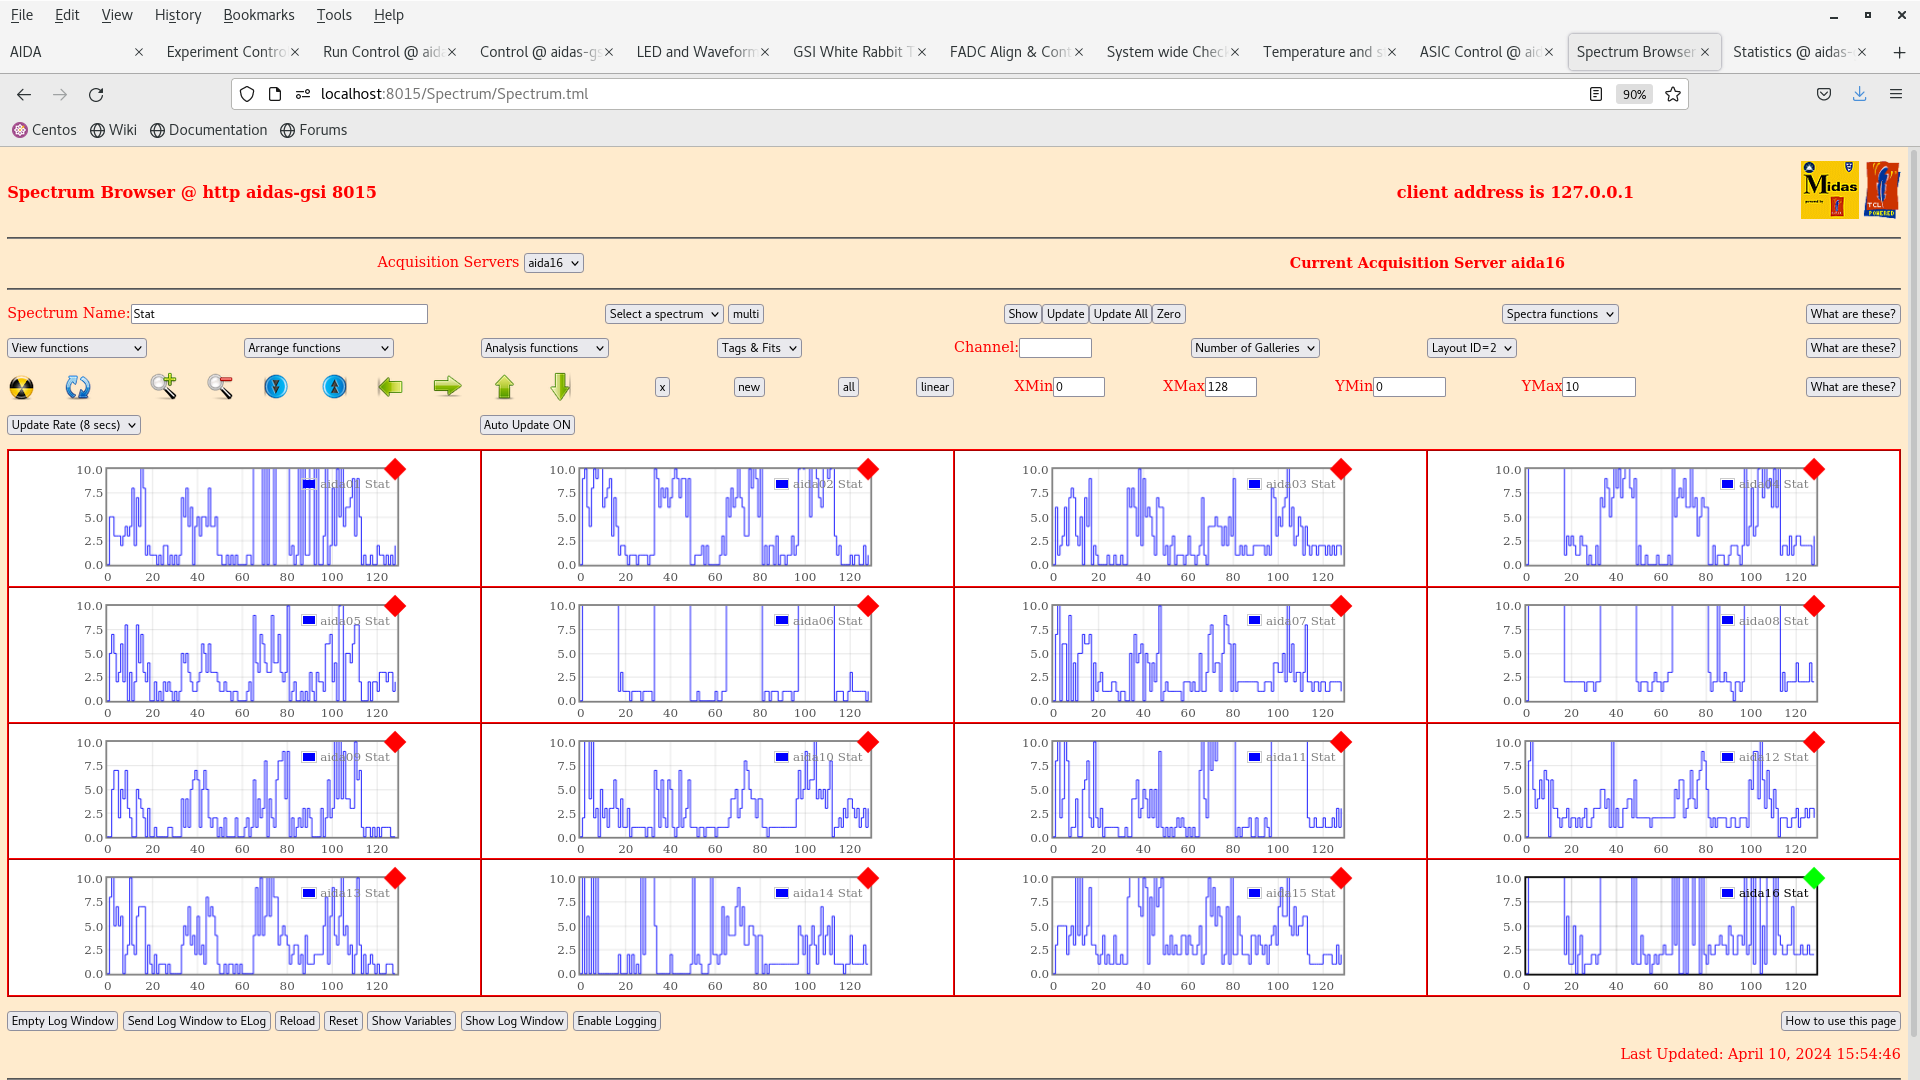
|
| Attachment 30: Screenshot_from_2024-04-10_17-19-01.png
|

|
| Attachment 31: Screenshot_from_2024-04-10_17-13-25.png
|
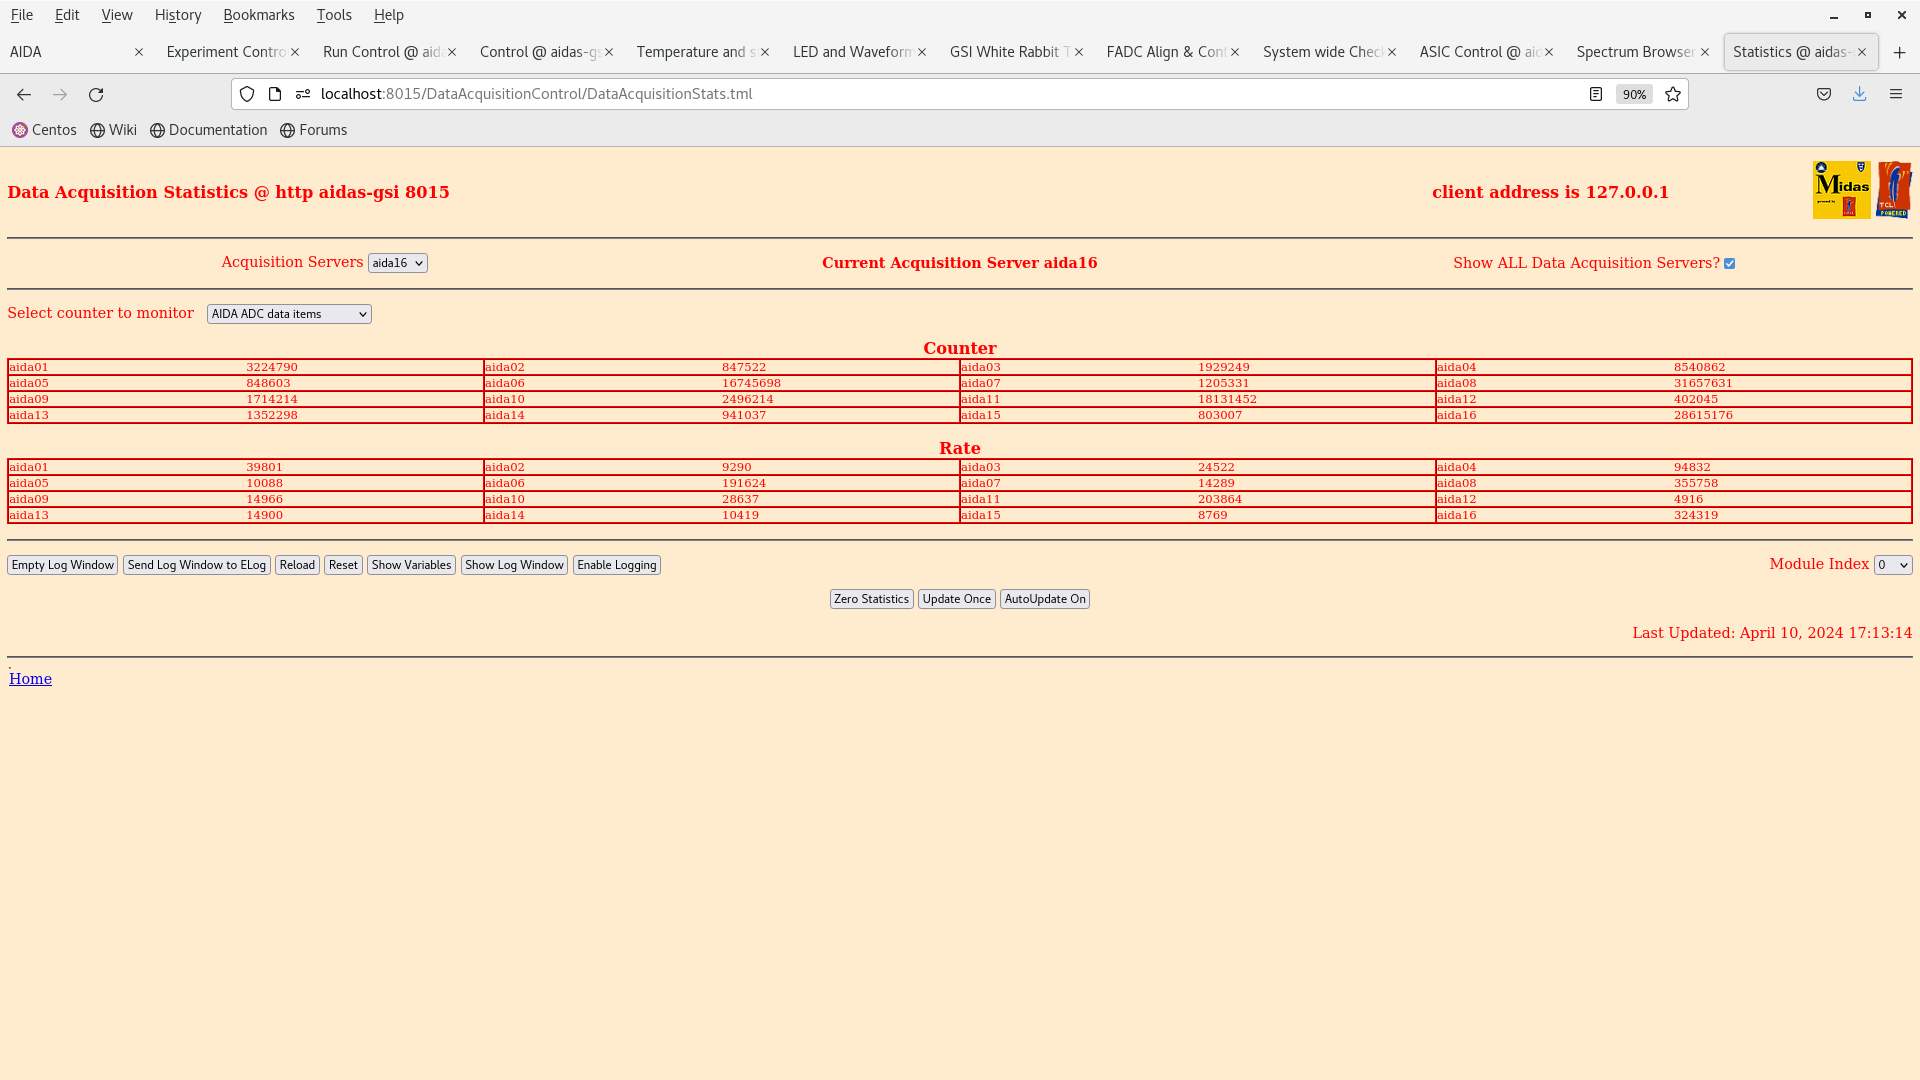
|
| Attachment 32: Screenshot_from_2024-04-10_17-12-33.png
|
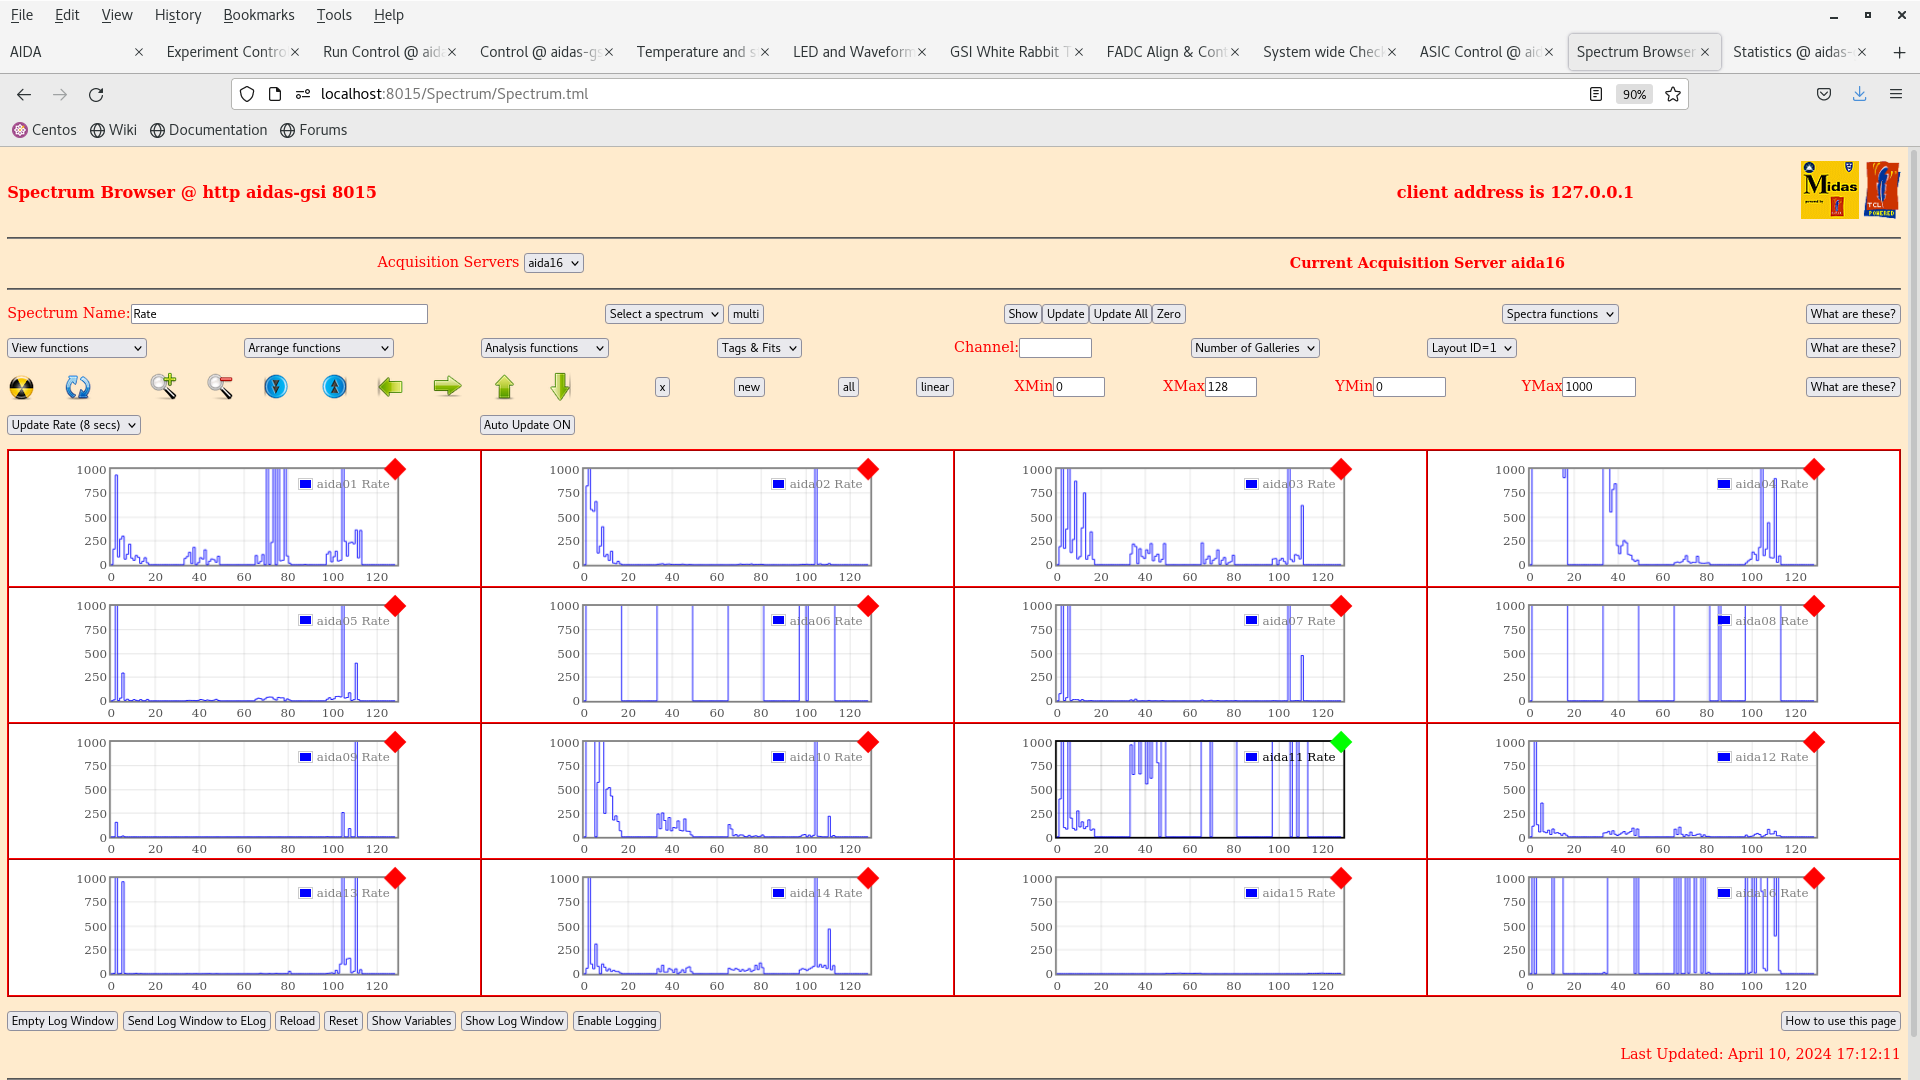
|
| Attachment 33: Screenshot_from_2024-04-10_17-04-11.png
|

|
| Attachment 34: Screenshot_from_2024-04-10_18-49-54.png
|
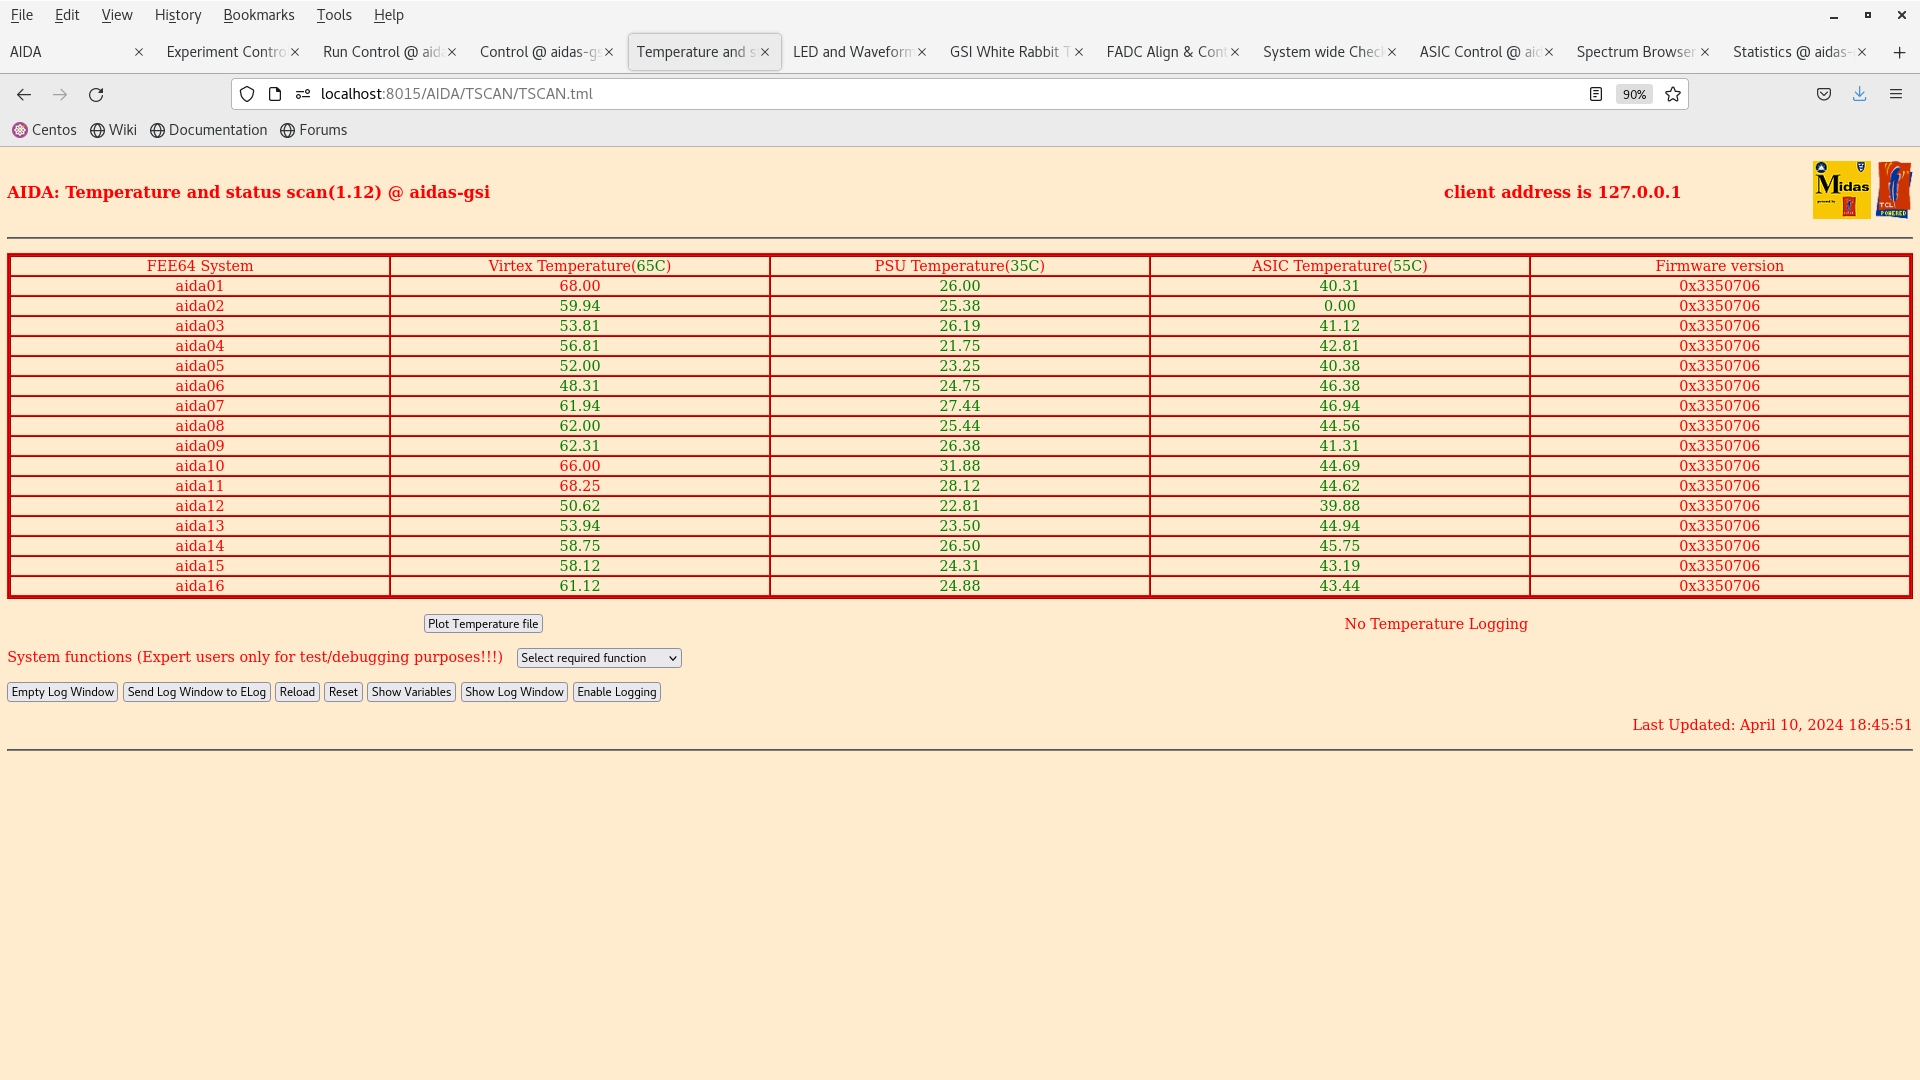
|
| Attachment 35: Screenshot_from_2024-04-10_18-49-50.png
|

|
| Attachment 36: Screenshot_from_2024-04-10_18-49-44.png
|
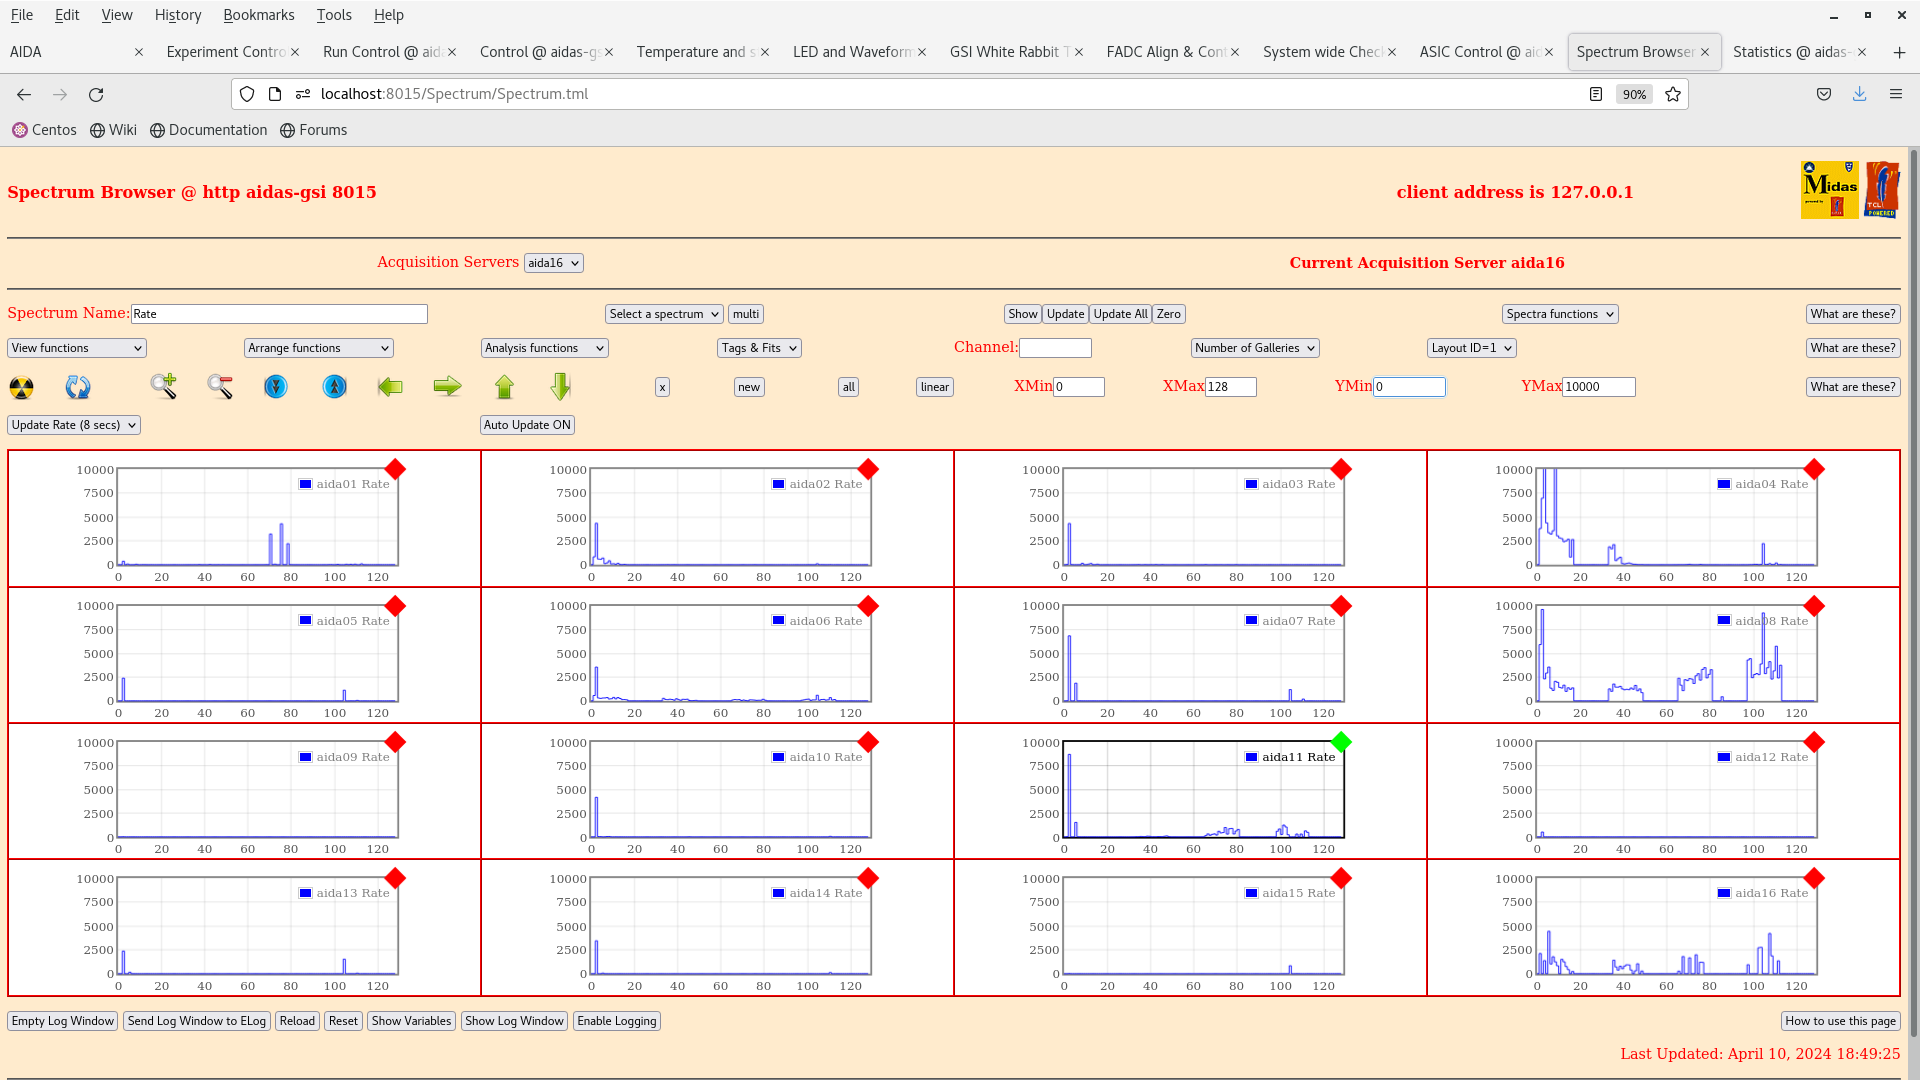
|
| Attachment 37: Screenshot_from_2024-04-10_19-00-27.png
|
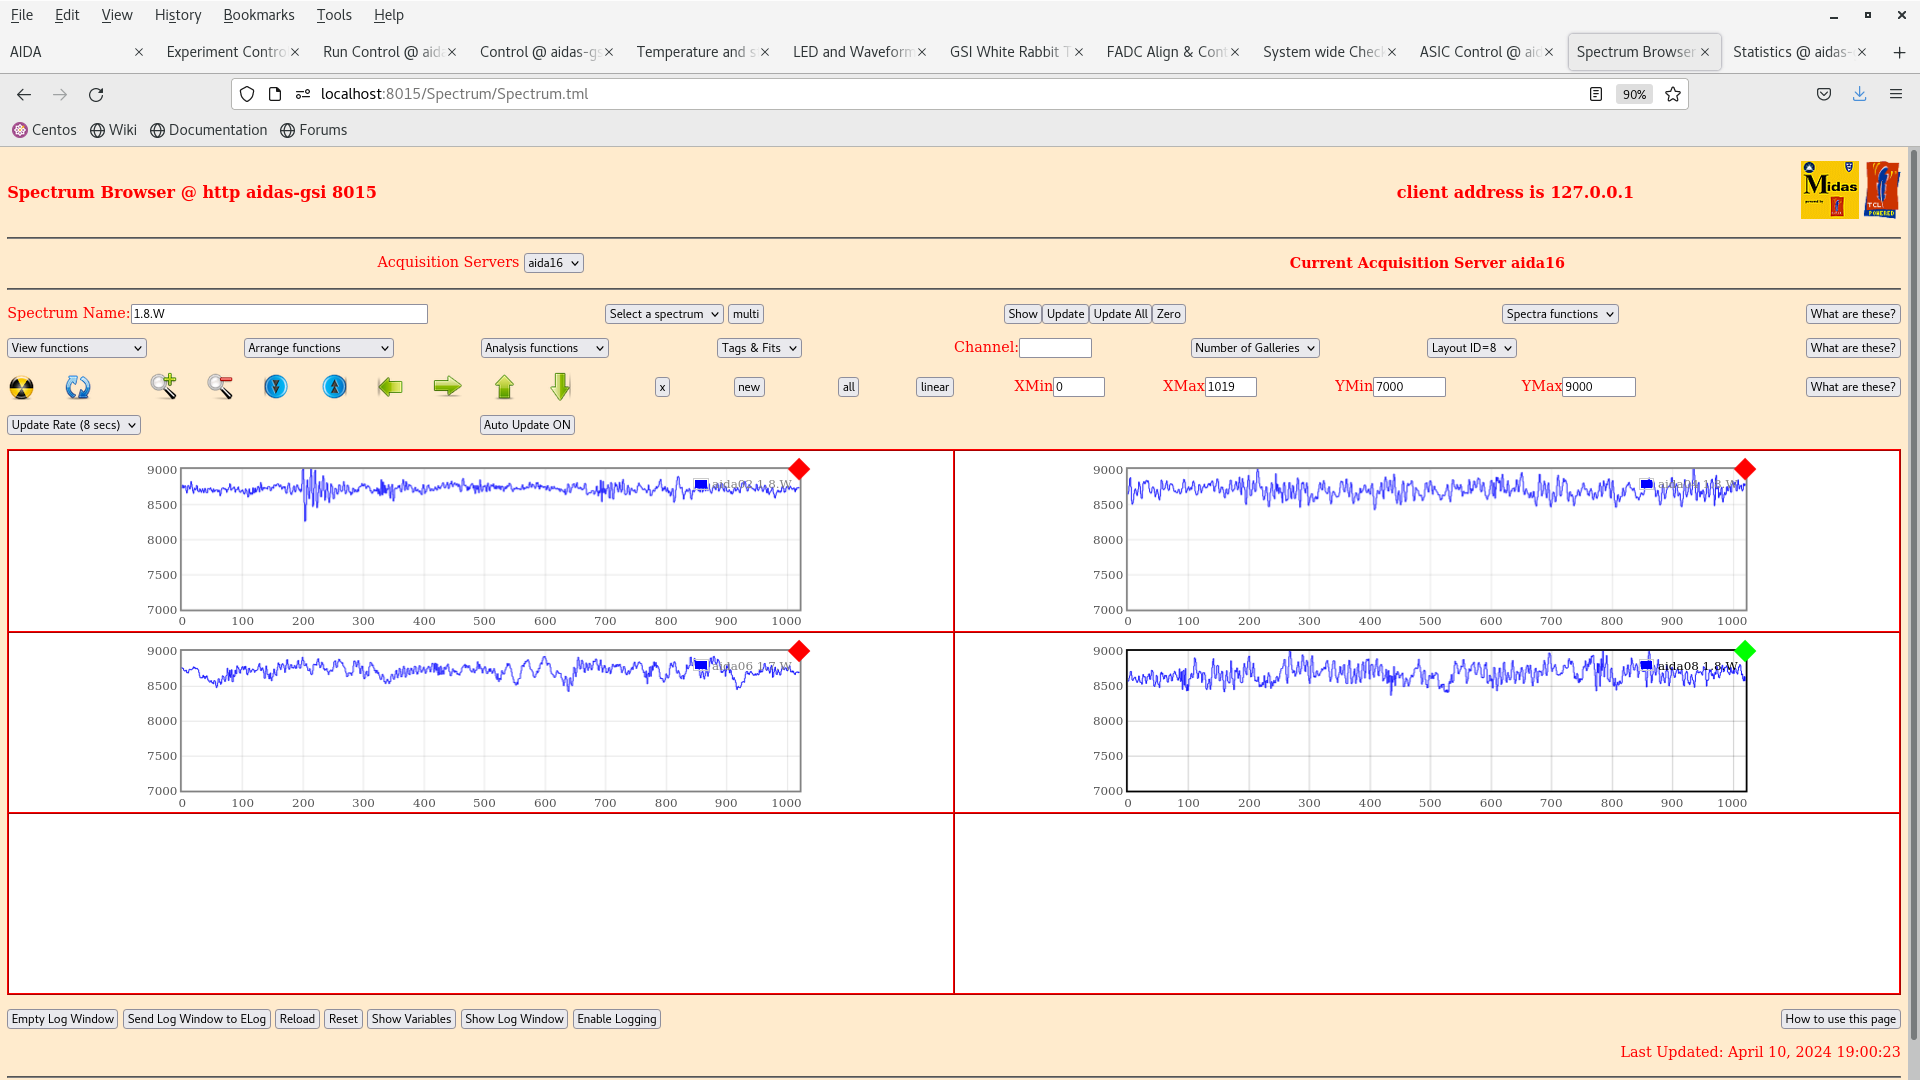
|
| Attachment 38: Screenshot_from_2024-04-10_18-59-41.png
|
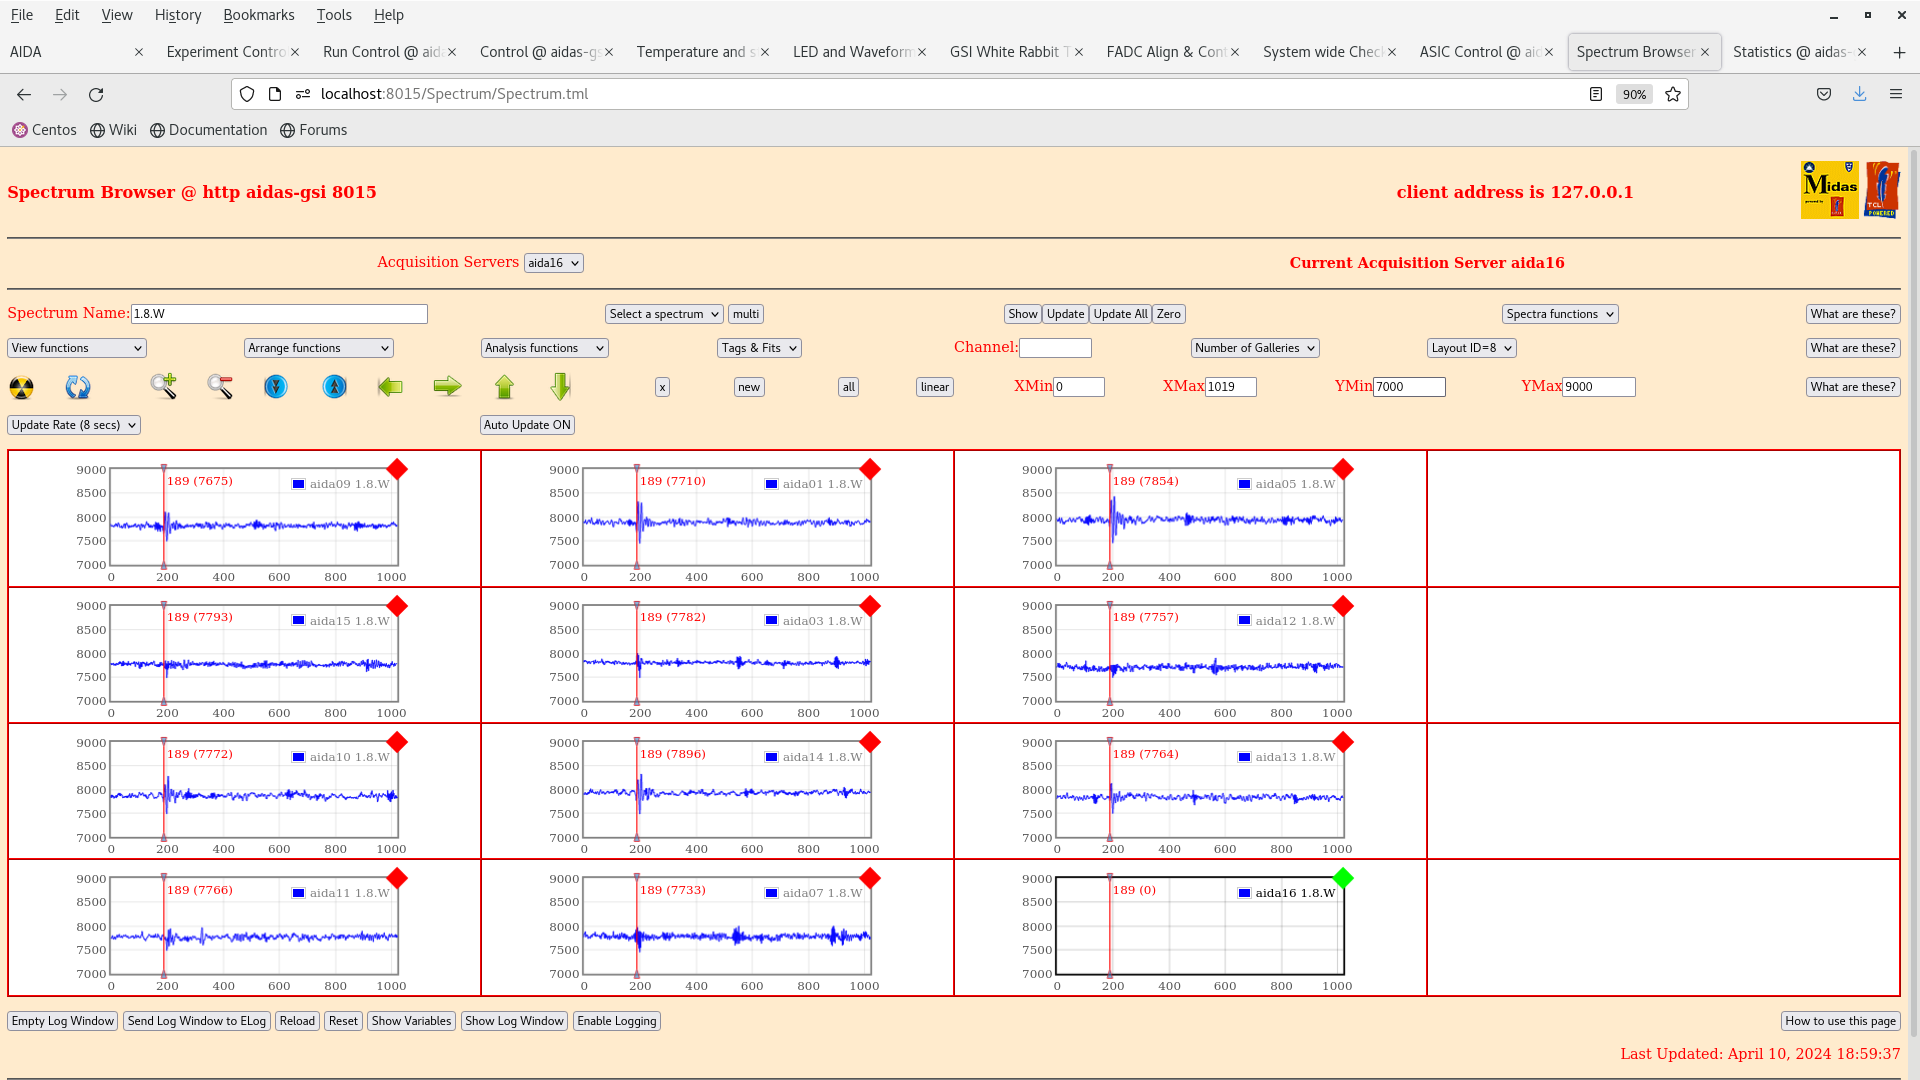
|
| Attachment 39: Screenshot_from_2024-04-10_18-59-26.png
|
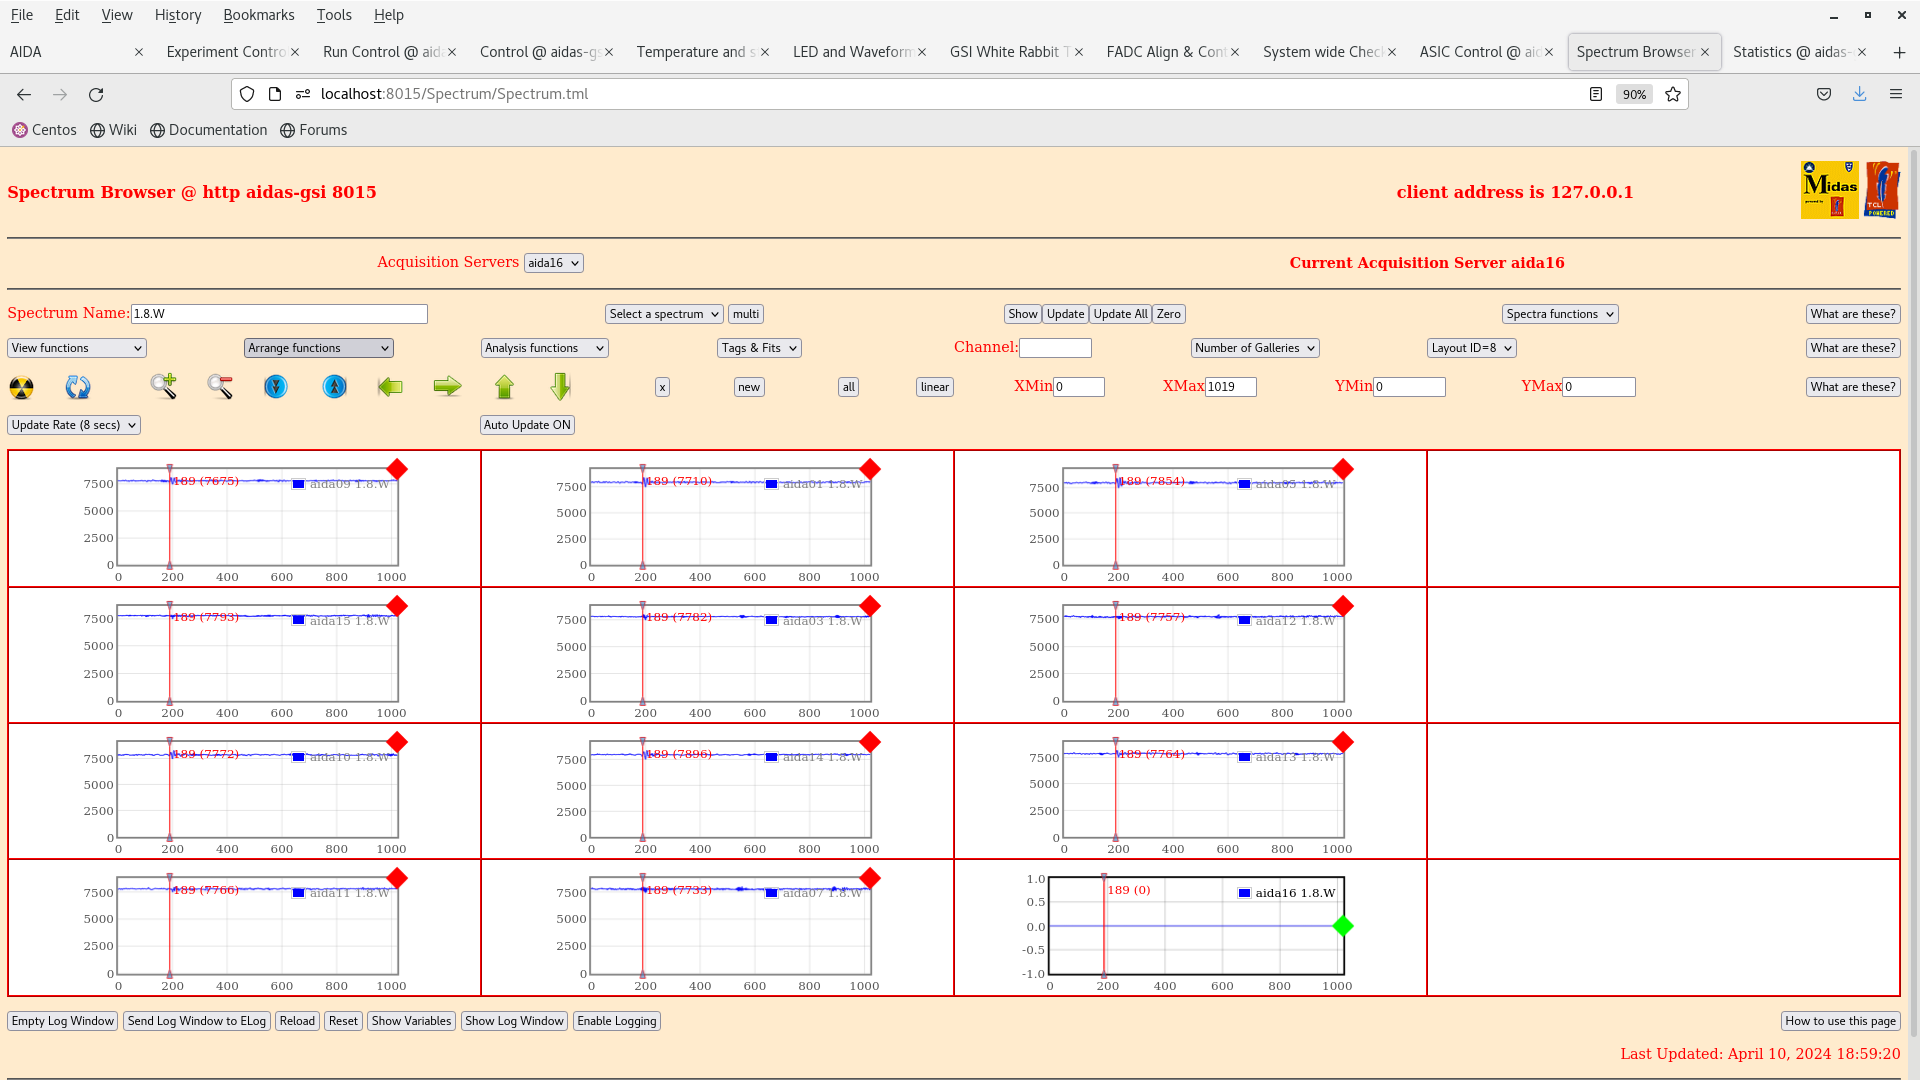
|
| Attachment 40: Screenshot_from_2024-04-10_18-58-43.png
|
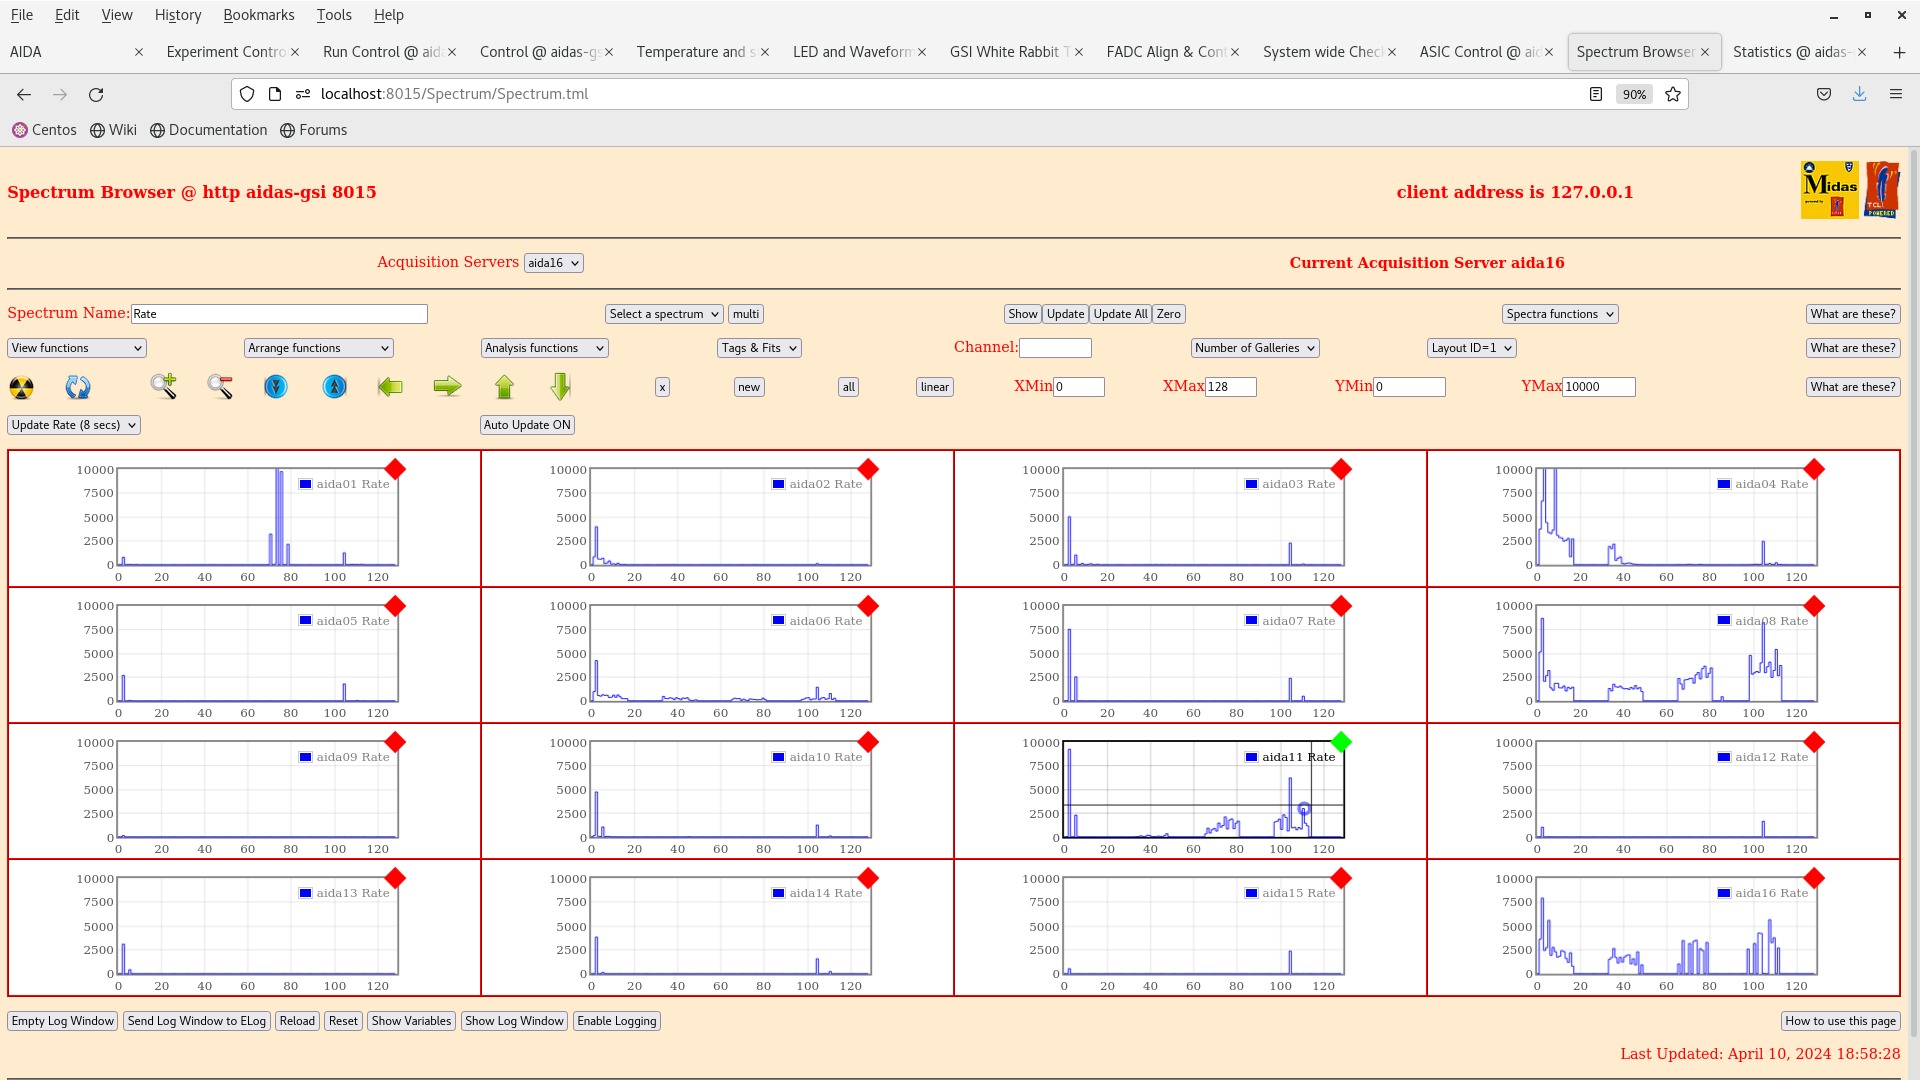
|
| Attachment 41: Screenshot_from_2024-04-10_18-58-21.png
|

|
| Attachment 42: Screenshot_from_2024-04-10_18-57-53.png
|
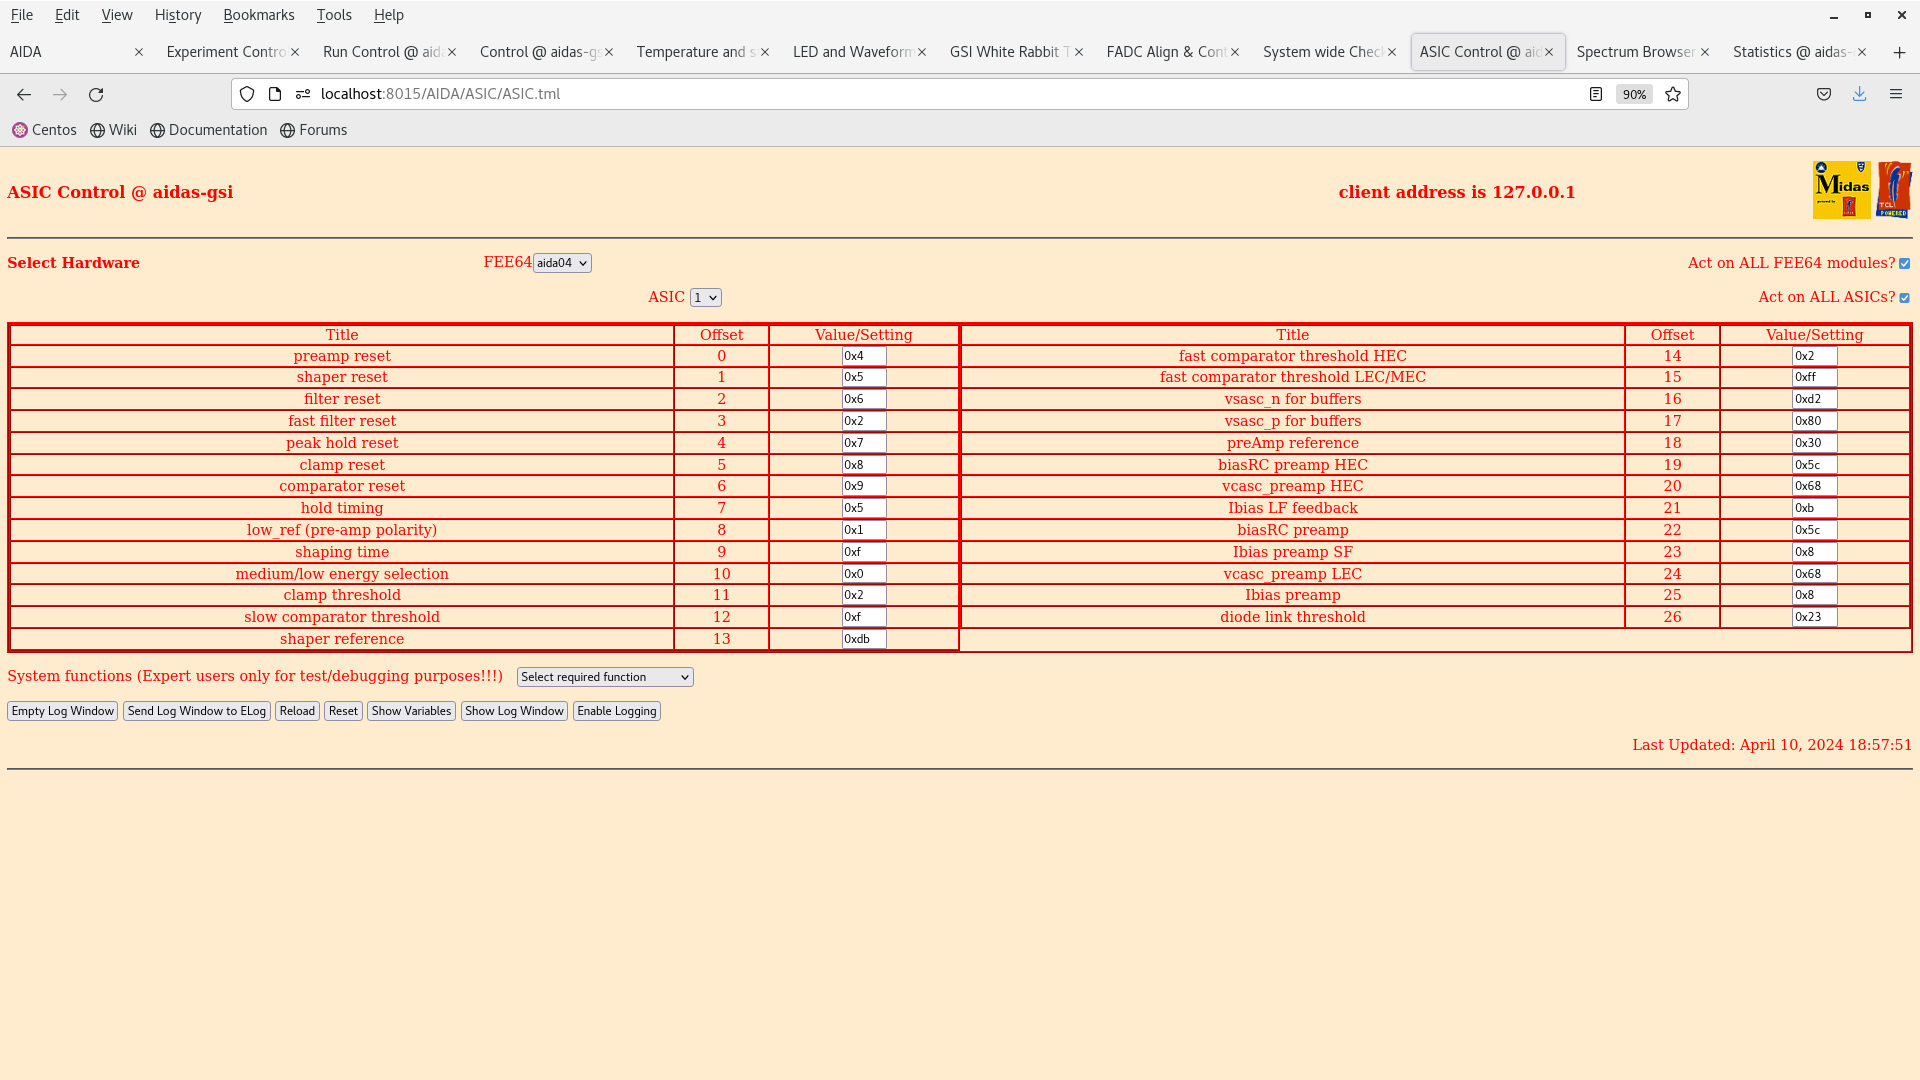
|
| Attachment 43: Screenshot_from_2024-04-10_18-57-46.png
|

|
| Attachment 44: Screenshot_from_2024-04-10_19-23-16.png
|

|
| Attachment 45: Screenshot_from_2024-04-10_19-20-55.png
|

|
| Attachment 46: Screenshot_from_2024-04-10_19-12-22.png
|

|
| Attachment 47: Screenshot_from_2024-04-10_19-09-07.png
|
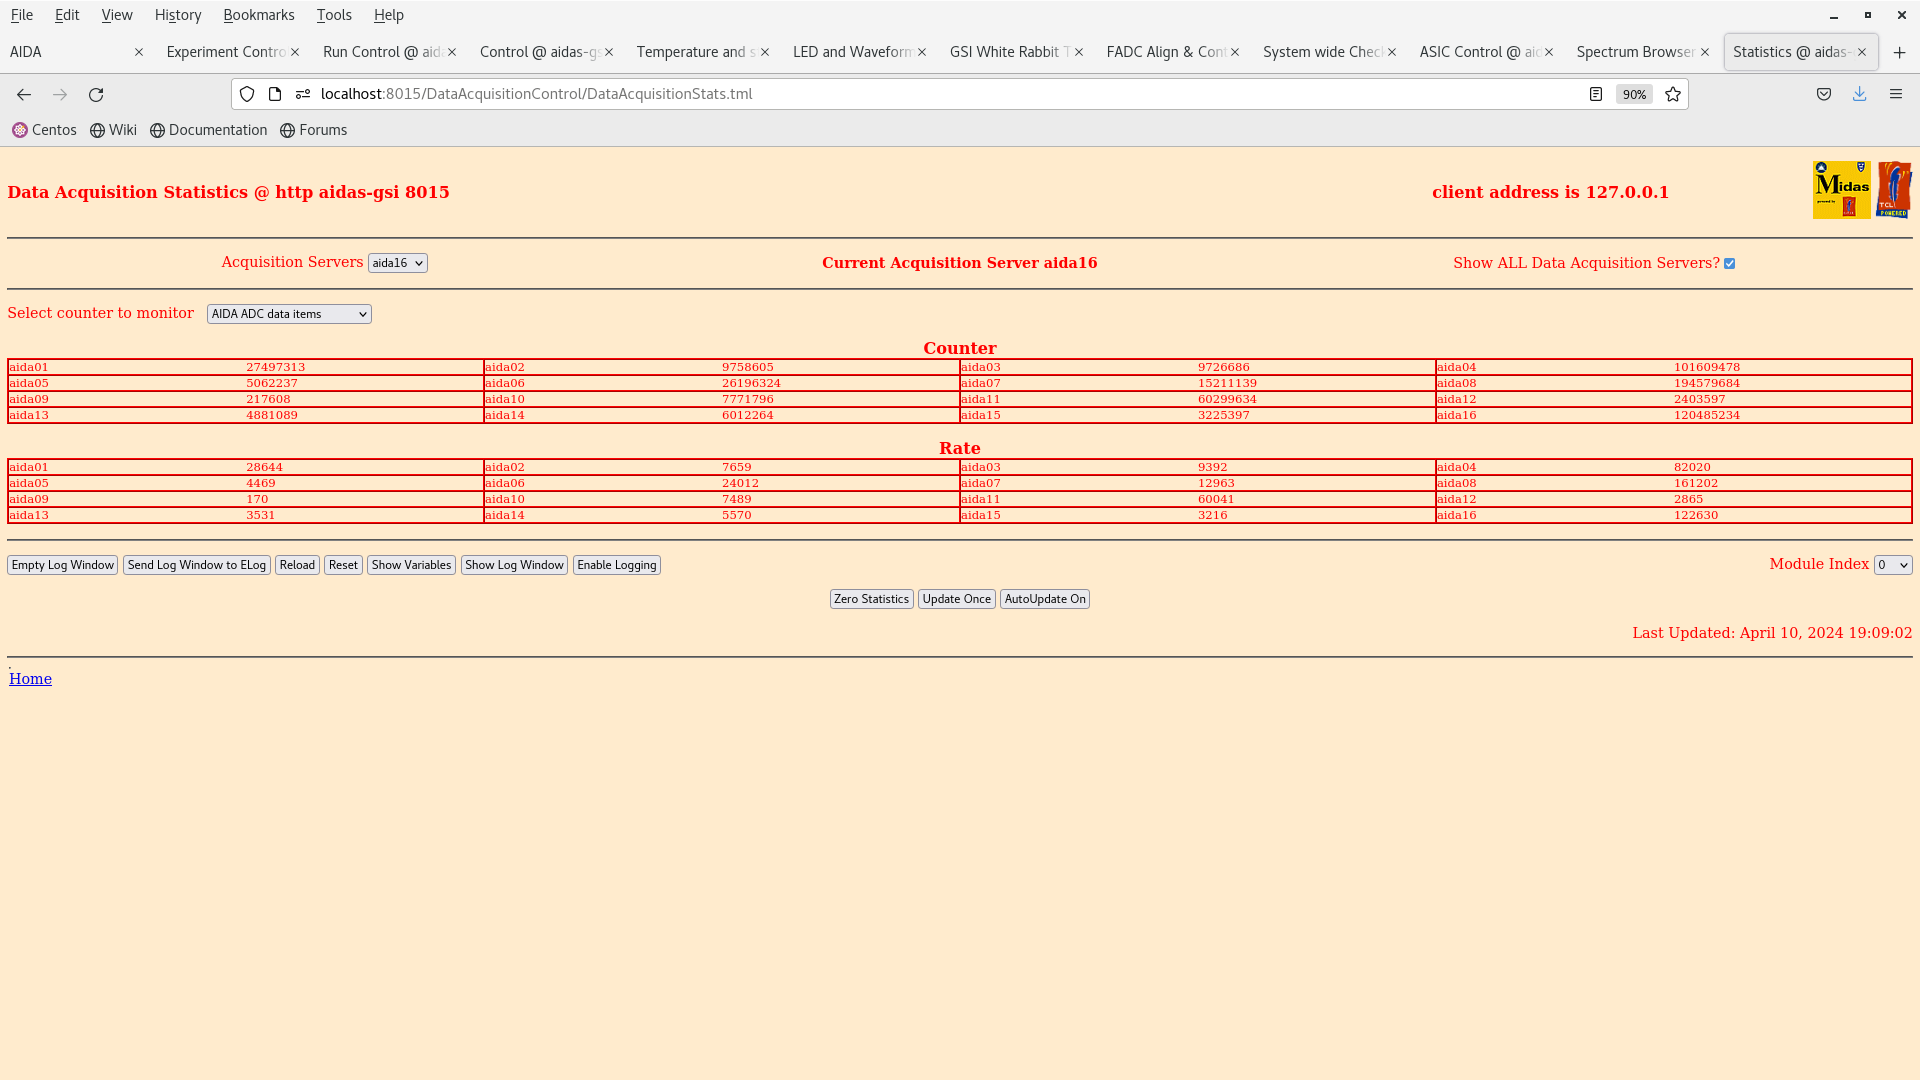
|
|
624
|
Wed May 1 08:59:15 2024 |
TD | Wednesday 1 May |
04.55 FEE64 temperatures OK
      ADC data item stats OK *except* aida04 no data
      TapeServer no storage mode

09.55 FEE64 temperatures OK
      ADC data item stats OK *except* aida02 & aida04 no data
      DSSSD bias and leakage current - Grafana - attachment 1

19.28 FEE64 temperatures OK
      ADC data item stats
       aida02 & aida04 no data
       noted increase in rates for aid08 and aida16
5/16 < 20k |
| Attachment 1: Capture.PNG
|
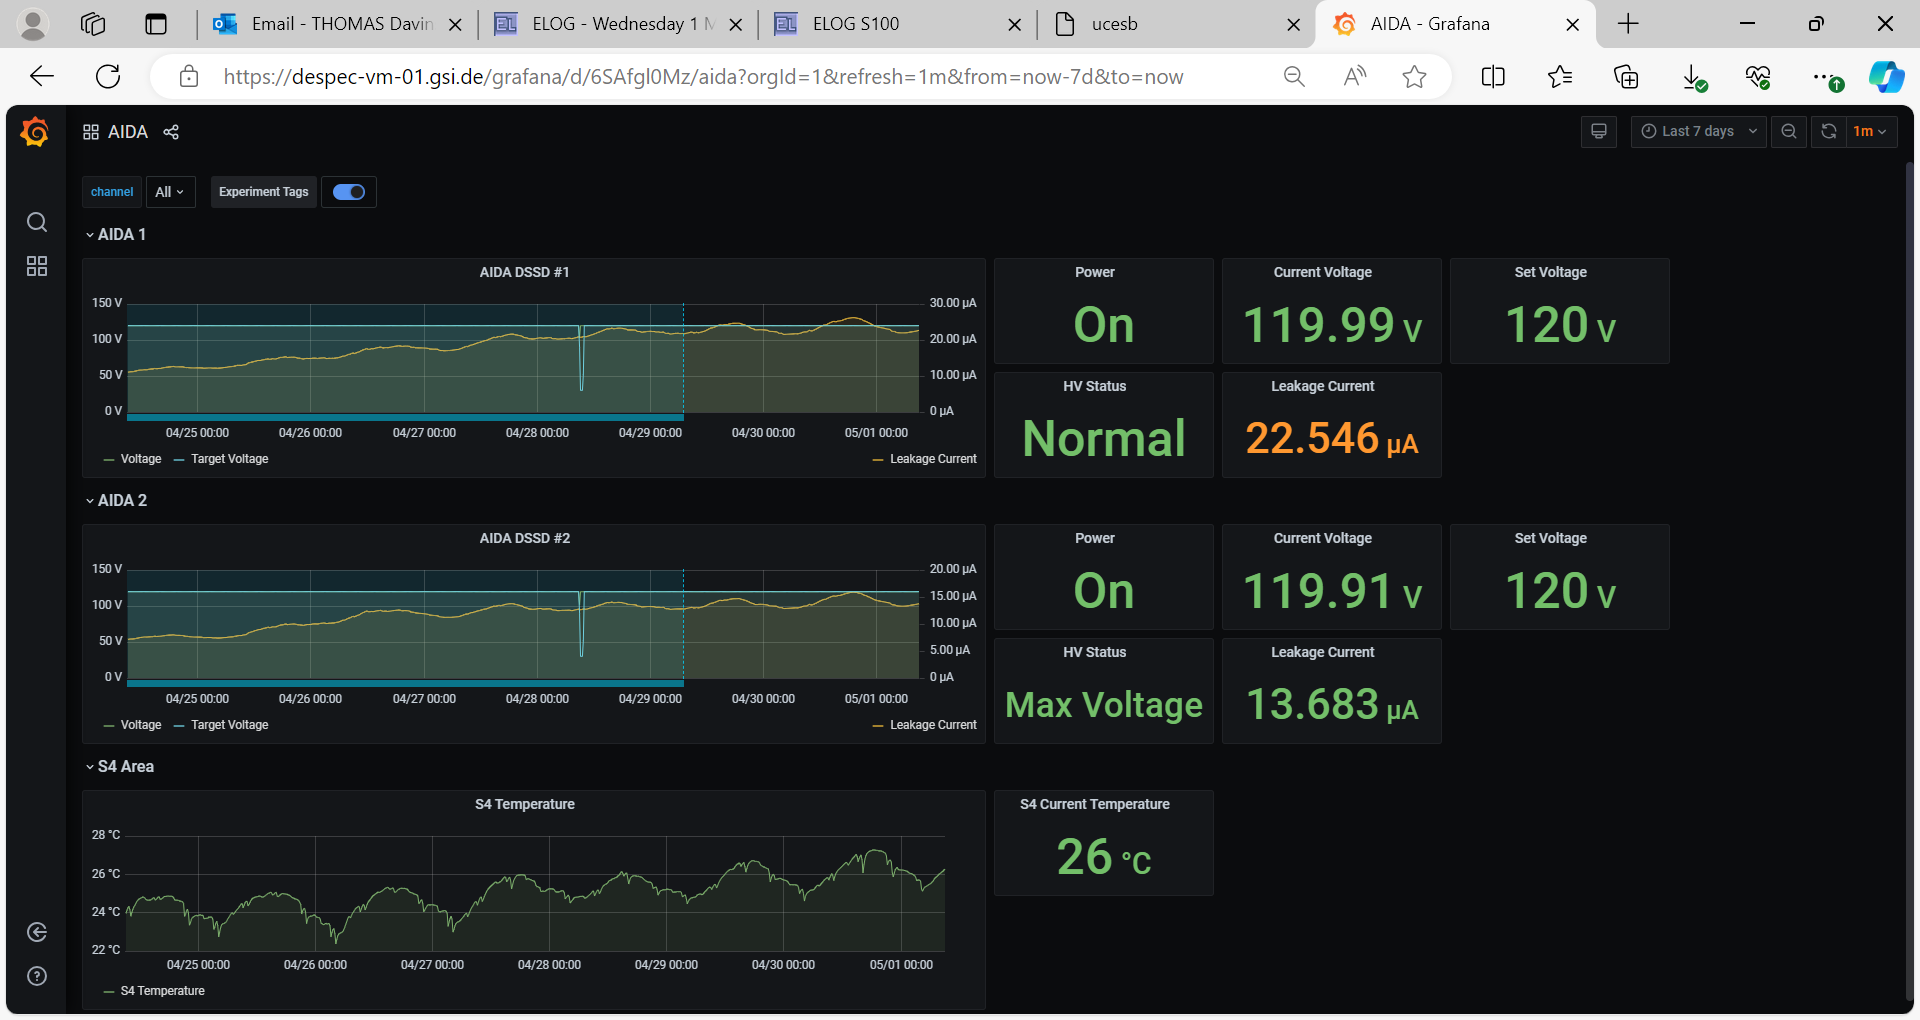
|
|
476
|
Wed Jun 1 07:35:13 2022 |
TD | Wednesday 1 June |
Attachment 1 - DSSSD bias & leakage current - OK

Attachment 2 - ADC data item stats

Attachment 3 - FEE64 temps - OK

Attachments 4-7 - aida01, 02, 03 & 04 2.*.W spectra

Noise observed for asics #1 & #2 of aida02 consistent with no cable attached - confirmed by visual inspection - ribbon cable disconnected from Samtec header of adaptor PCB

To Do list

1) re-connect ribbon cable to aida02 adaptor PCB
2) good quality ground to snout - use screws at inter-stage
3) install heavy duty grounds
4) ...


Attachment 8 - adc data item stats - slow comparator 0x64

Attachment 9 - per FEE64 rate spectra - slow comparator 0x64

Attachment 10 - per FEE64 rate spectra - slow comparator 0xa

-

13:30 - Attach heavy duty ground to AIDA

Attachment 11 - per FEE64 rate spectra - slow comparator 0xa

Try power cycle as system ground changed significantly now

Try to reattach aida04 TTY connector - still wrong

Archive old tty logs (ttyUSB*) to zip and delete them, makes easier to track startup

Attachment 12 - per FEE64 rate spectra - slow comparator 0xa

No major difference, aida01 quieter than before

aida05 has some missing channels - loose ERNI?

Attachements 13 & 14 - Waveforms

Temporarily raise to 0x64 and test merger for DTAS synchro test later... all works good to MBS
Change NETVAR MERGE.LinksAvailable to 8

Notice one copper screw touching aluminium, add some kapton tape behind it to isolate it. No difference

Voltage diff between aida02,aida06 < 1 mV
Voltage diff between copper bars < 0.5 mV (but not 0)

A comment from DTAS people that they observed a large increase in noise recently - perhaps from accelerator
May indicate current power/gronud oddities?

Attachment 15 - Rates at 0x1f (= 310 keV)

DSSSD#1 reasonable (aida04 a bit bad), but mostly just pulser (25 Hz)

DSSSD#2 much worse esp. p+n sides (aida05, aida07)

ERNI connectors pushed in and feel fully in |
| Attachment 1: Screenshot_from_2022-06-01_08-33-30.png
|

|
| Attachment 2: Screenshot_from_2022-06-01_08-33-13.png
|
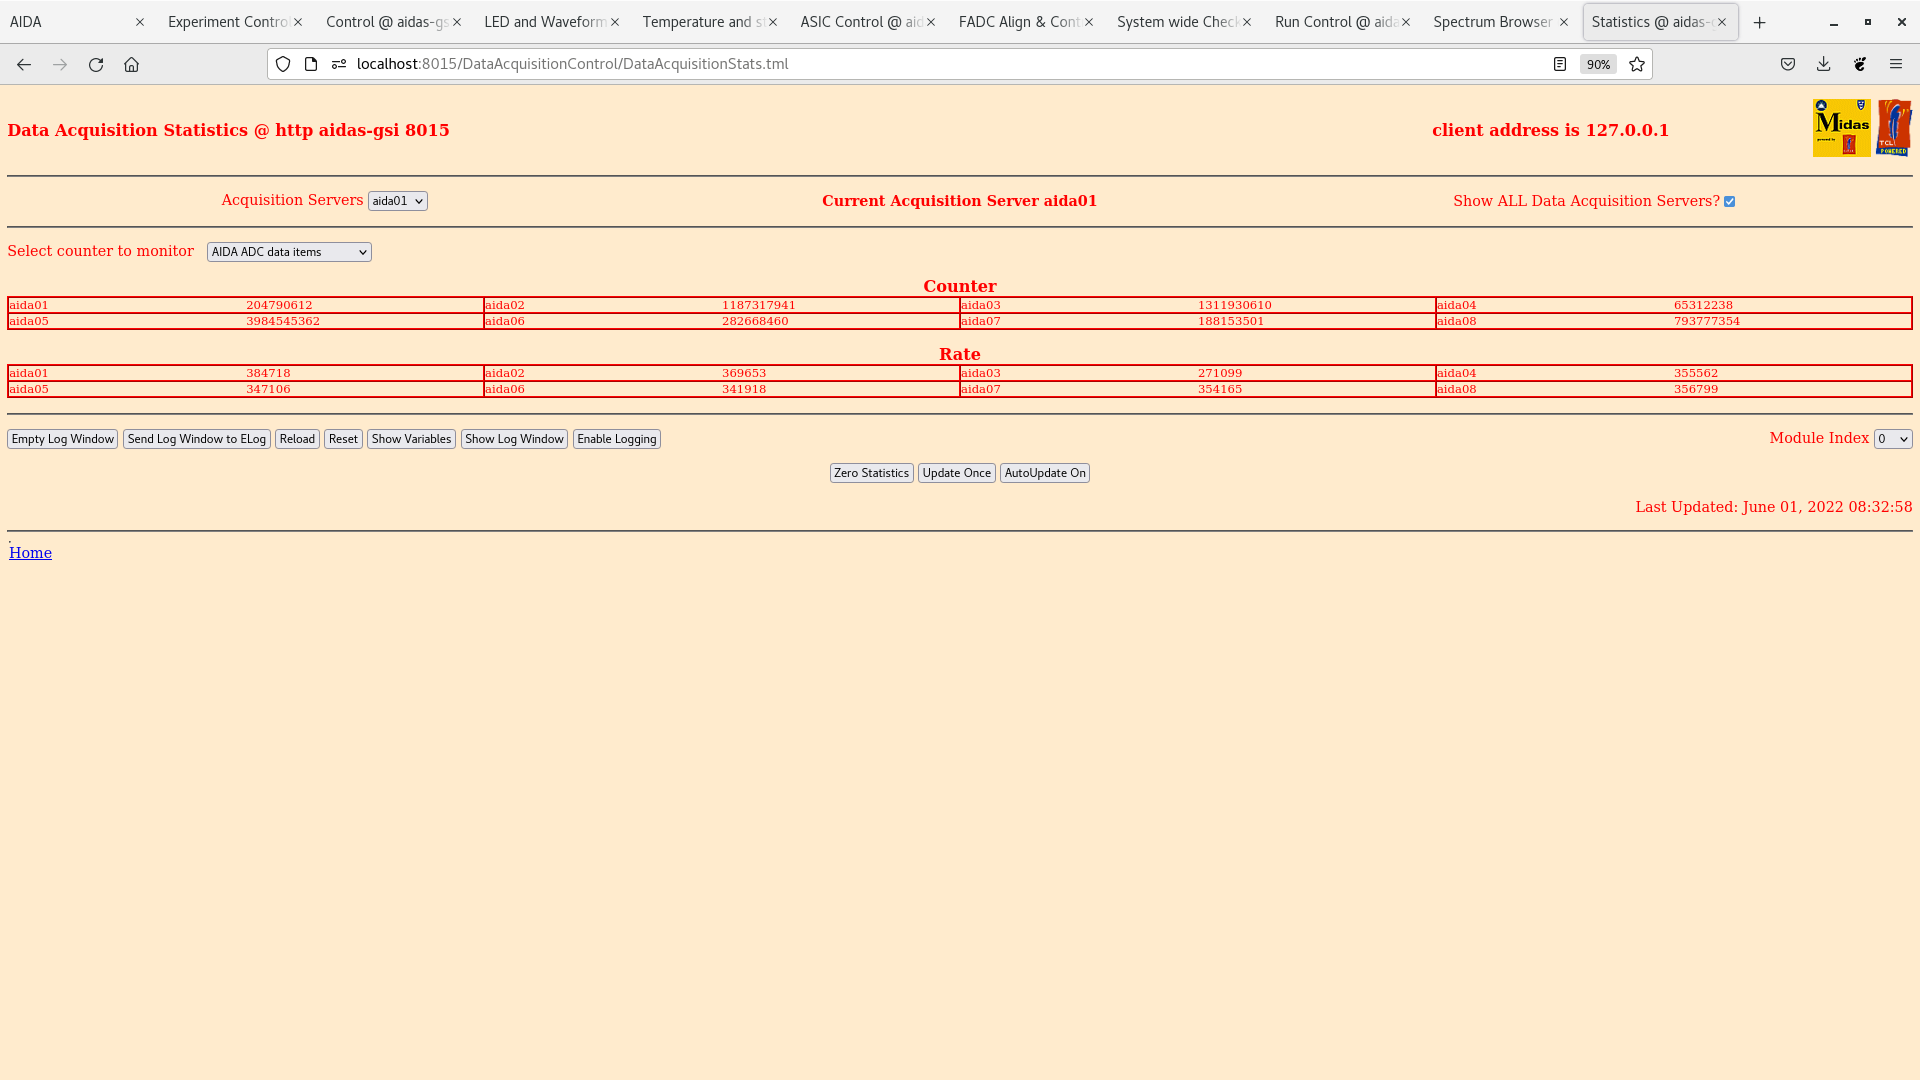
|
| Attachment 3: Screenshot_from_2022-06-01_08-32-44.png
|
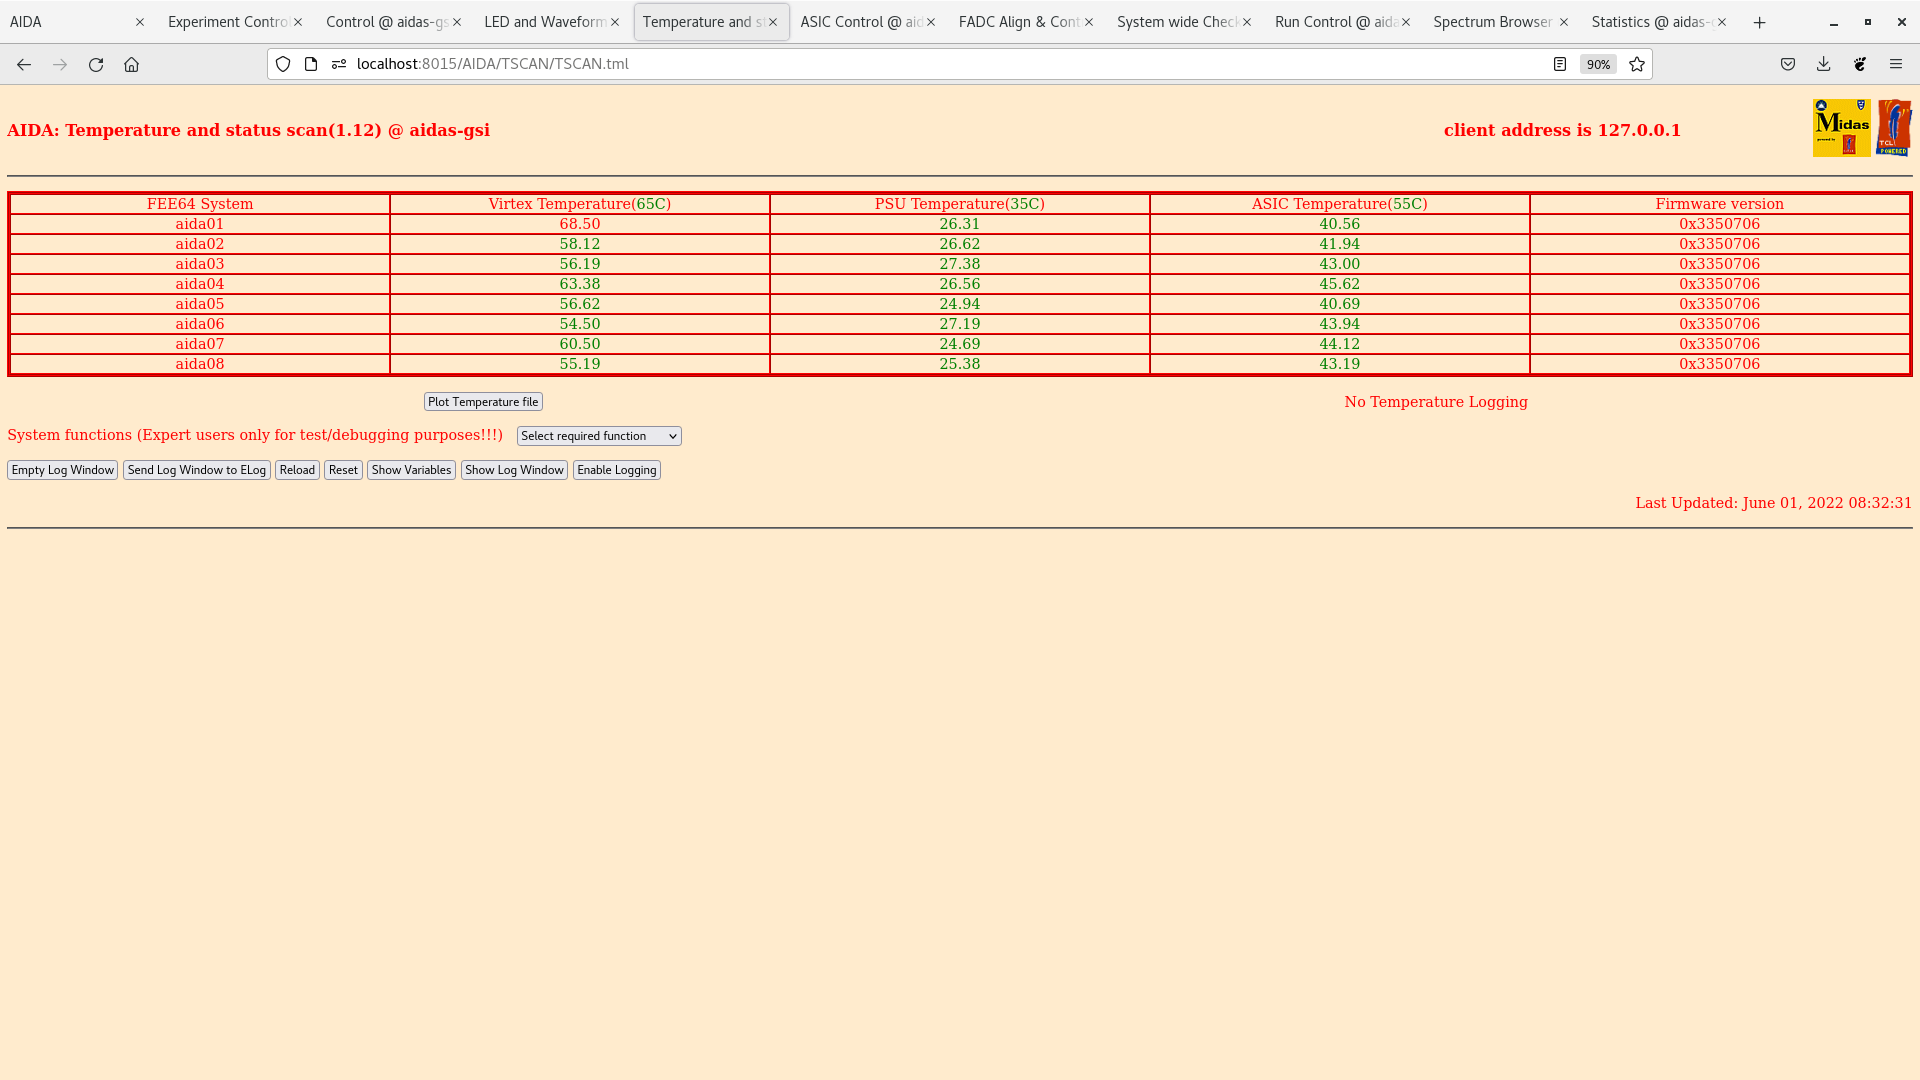
|
| Attachment 4: Screenshot_from_2022-06-01_08-32-14.png
|
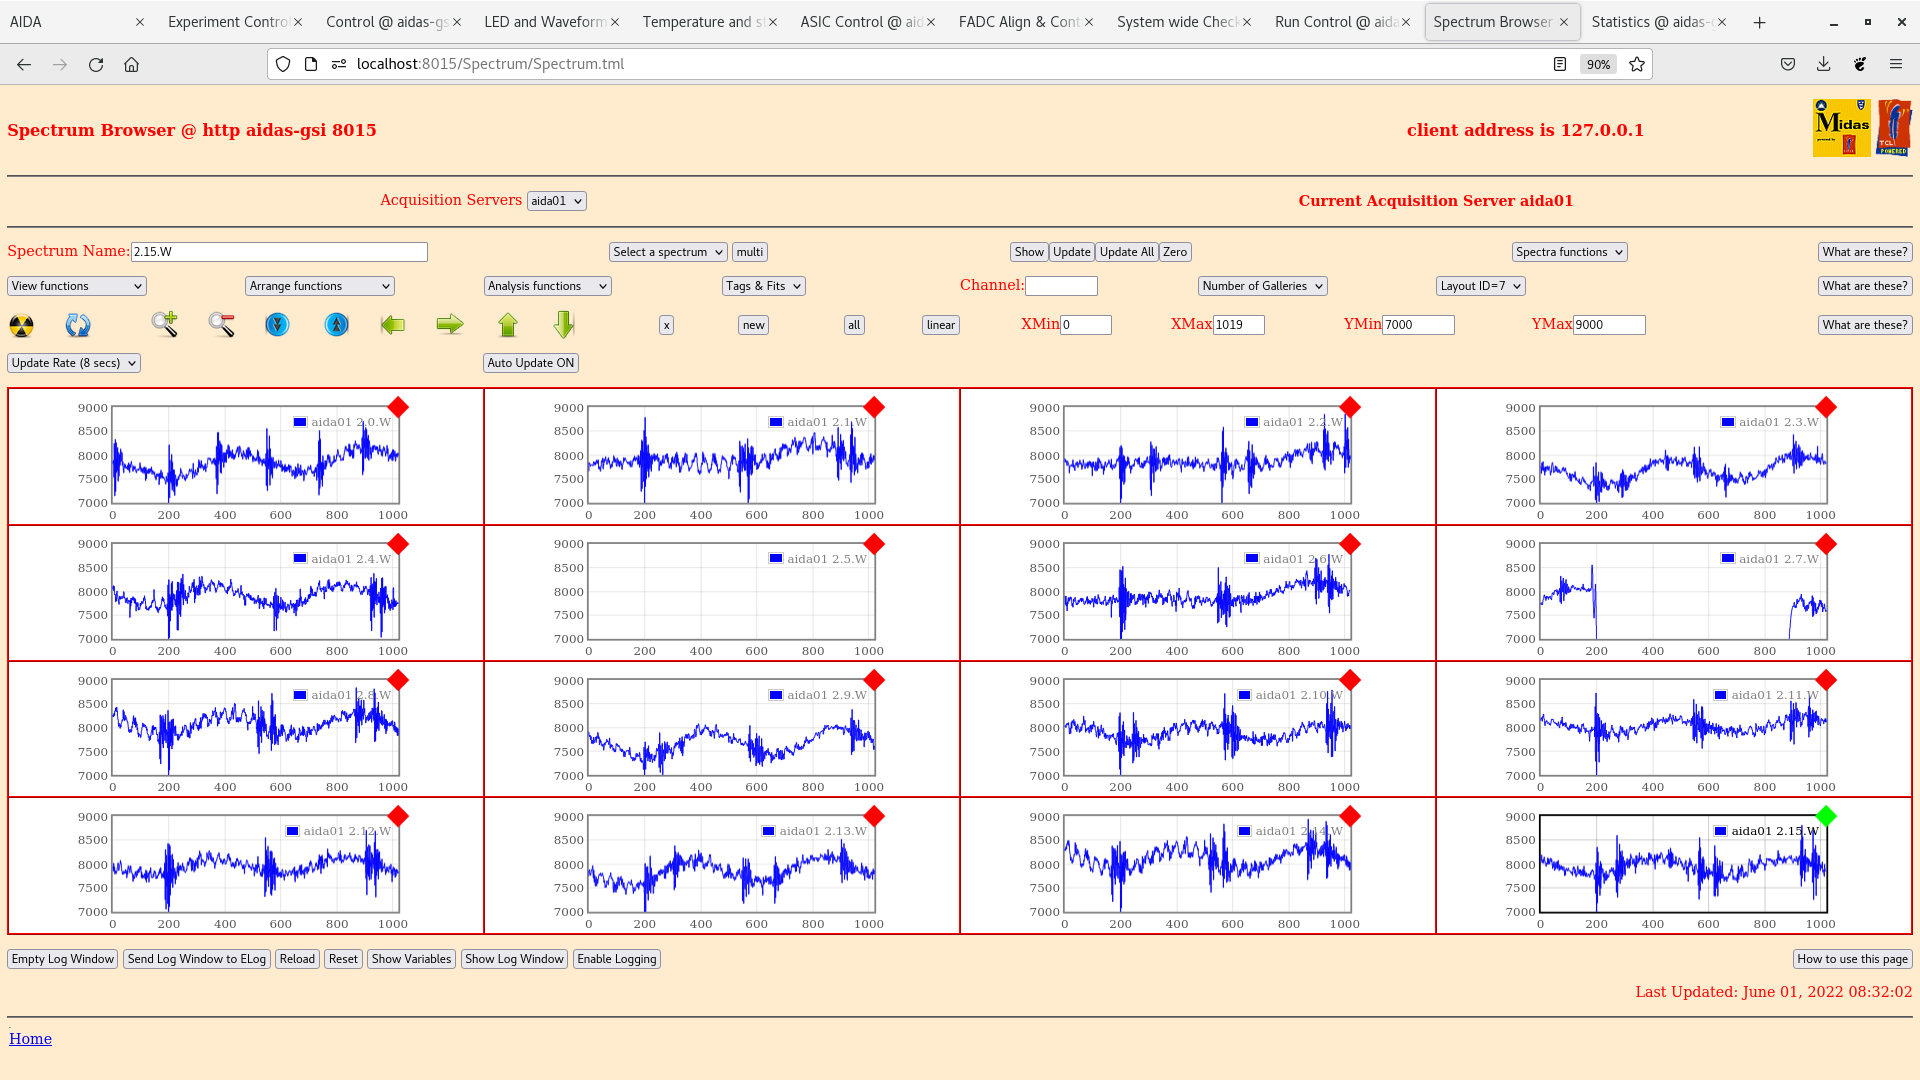
|
| Attachment 5: Screenshot_from_2022-06-01_08-31-04.png
|
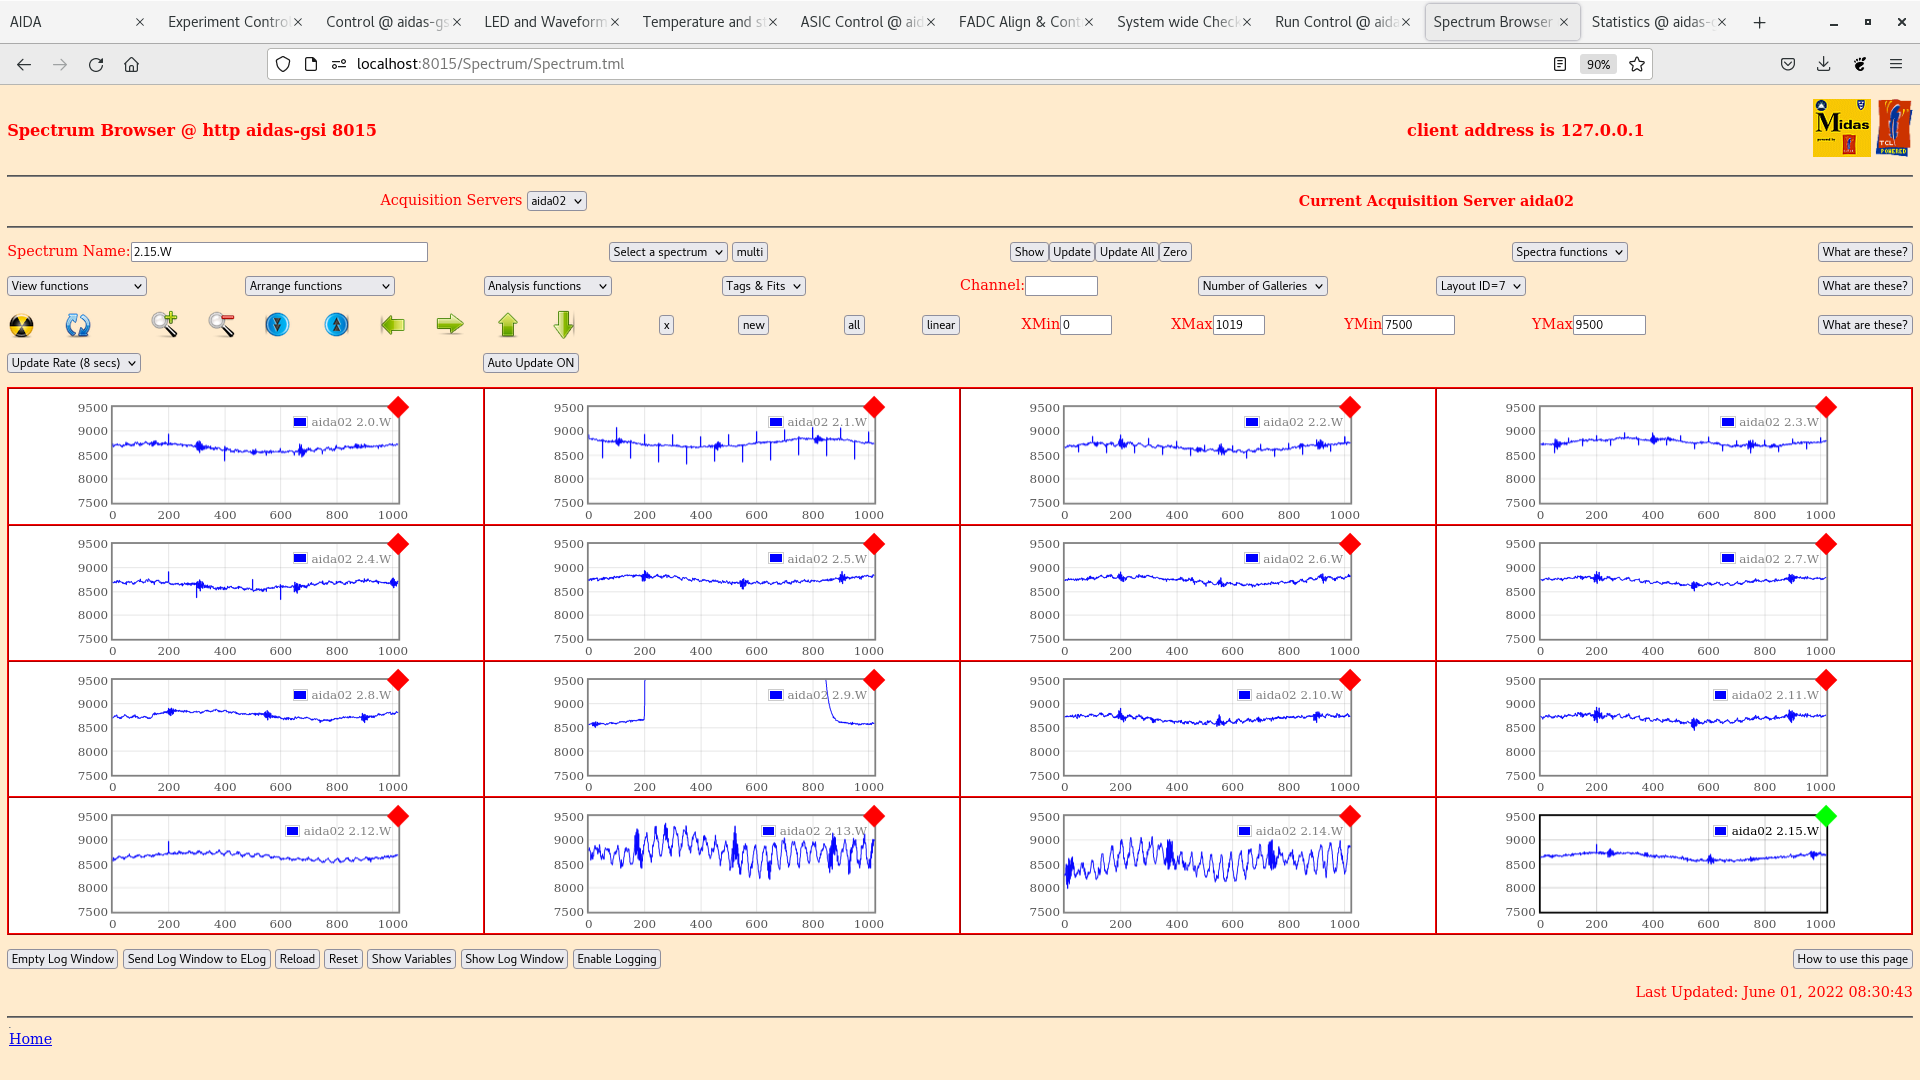
|
| Attachment 6: Screenshot_from_2022-06-01_08-29-37.png
|
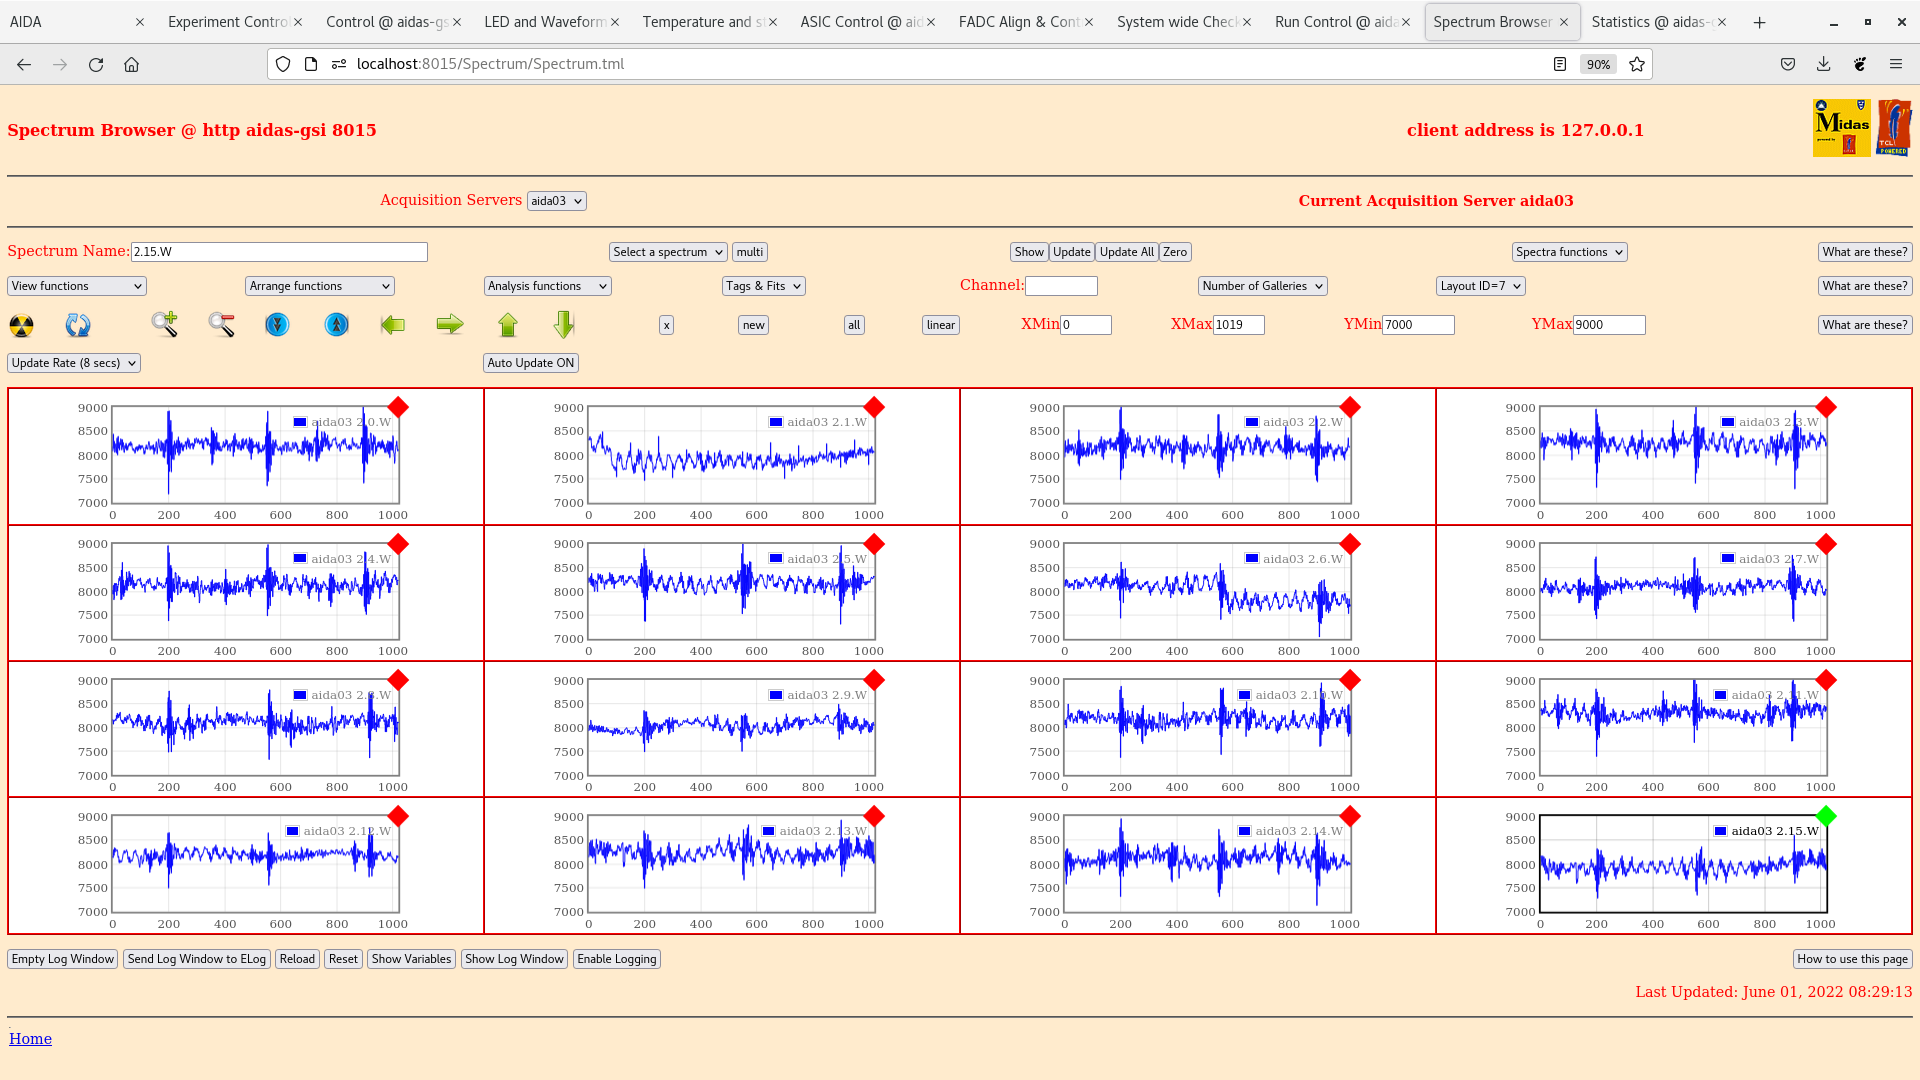
|
| Attachment 7: Screenshot_from_2022-06-01_08-27-41.png
|
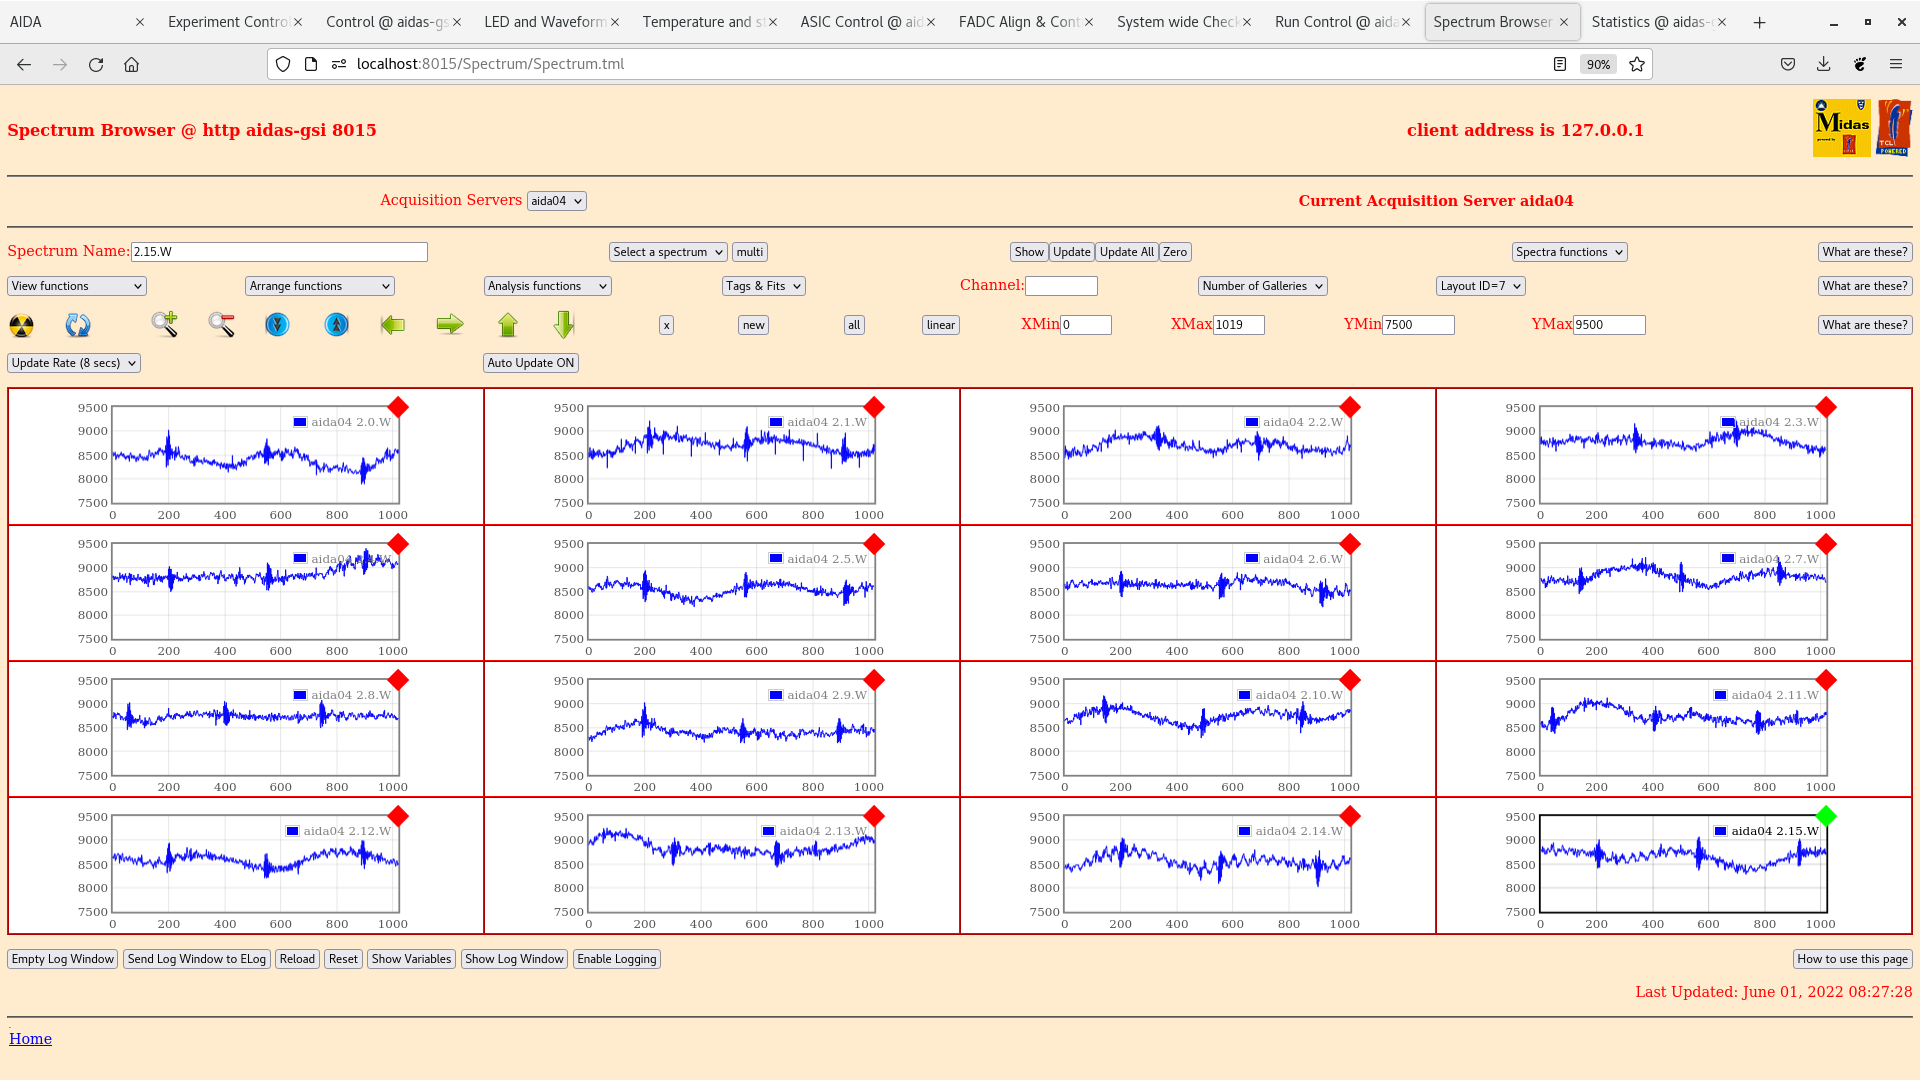
|
| Attachment 8: Screenshot_from_2022-06-01_08-54-54.png
|

|
| Attachment 9: Screenshot_from_2022-06-01_08-54-34.png
|
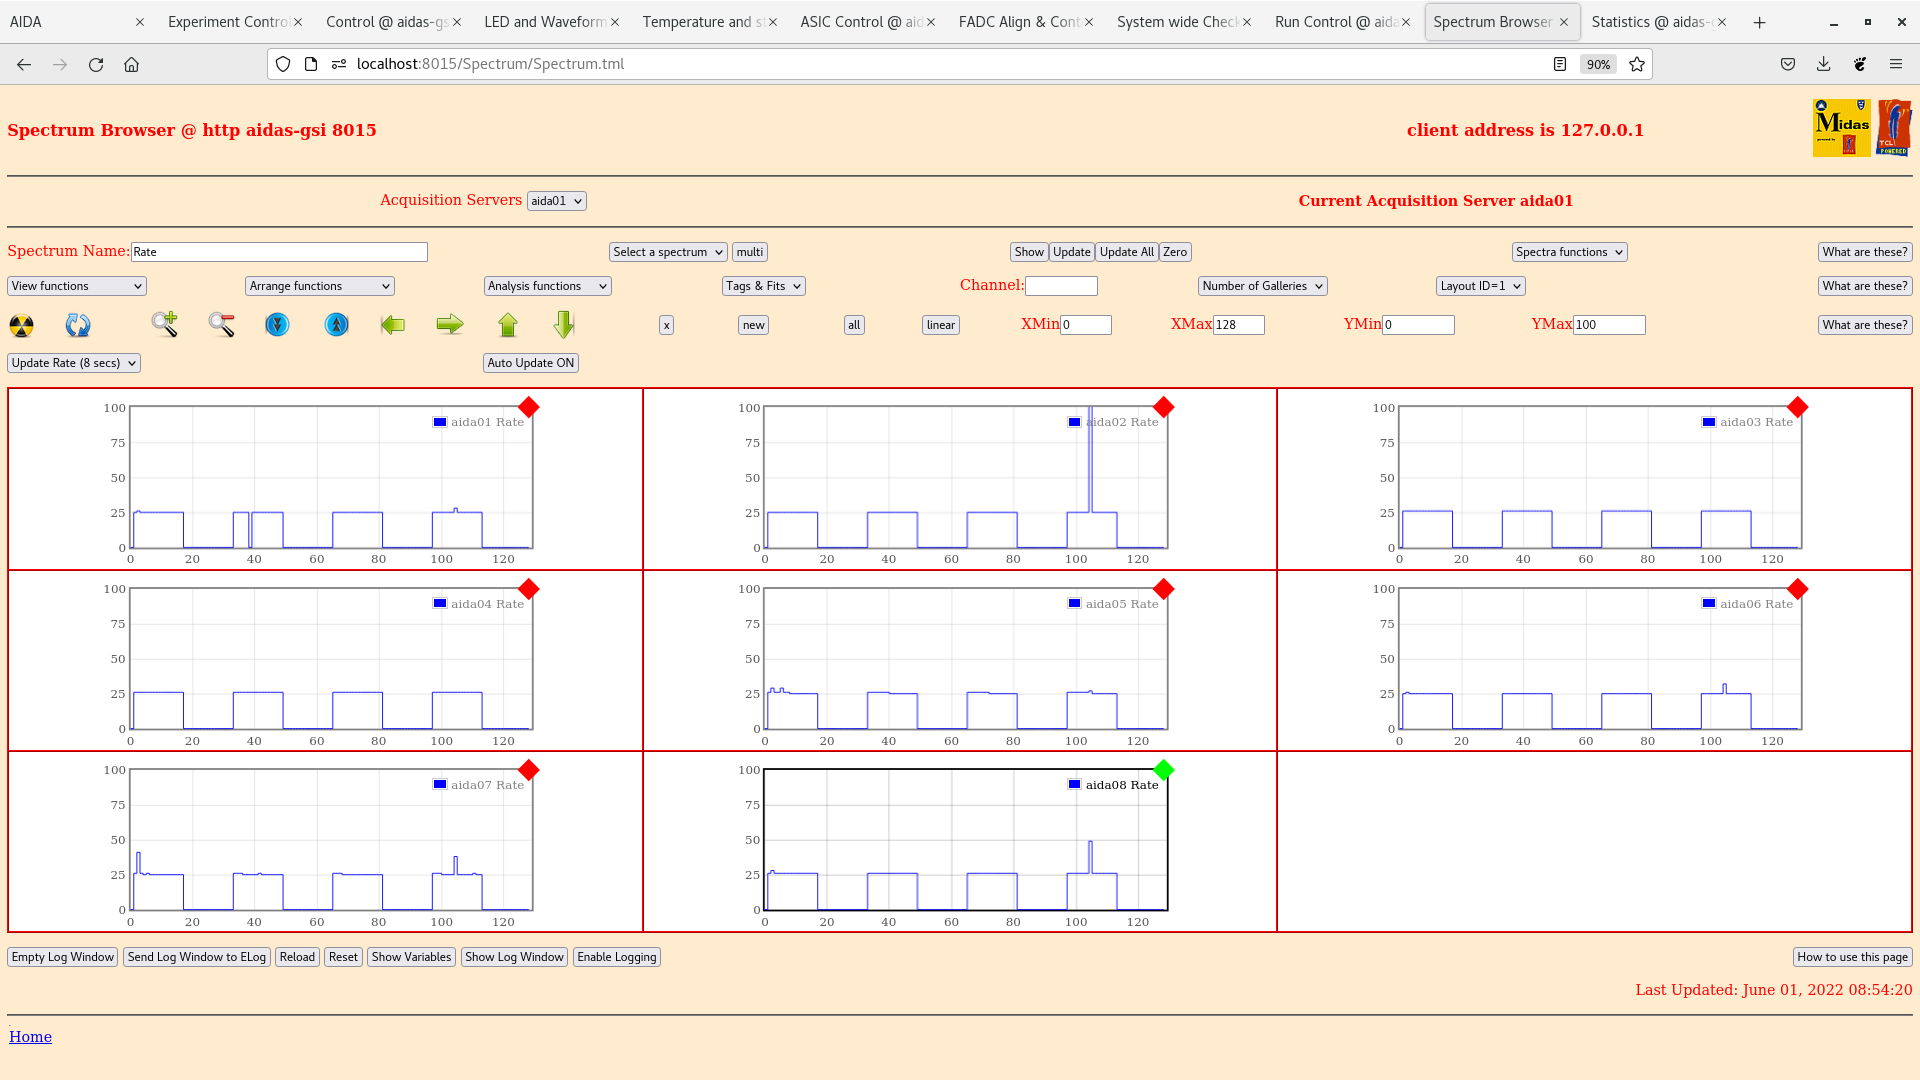
|
| Attachment 10: Screenshot_from_2022-06-01_08-51-51.png
|
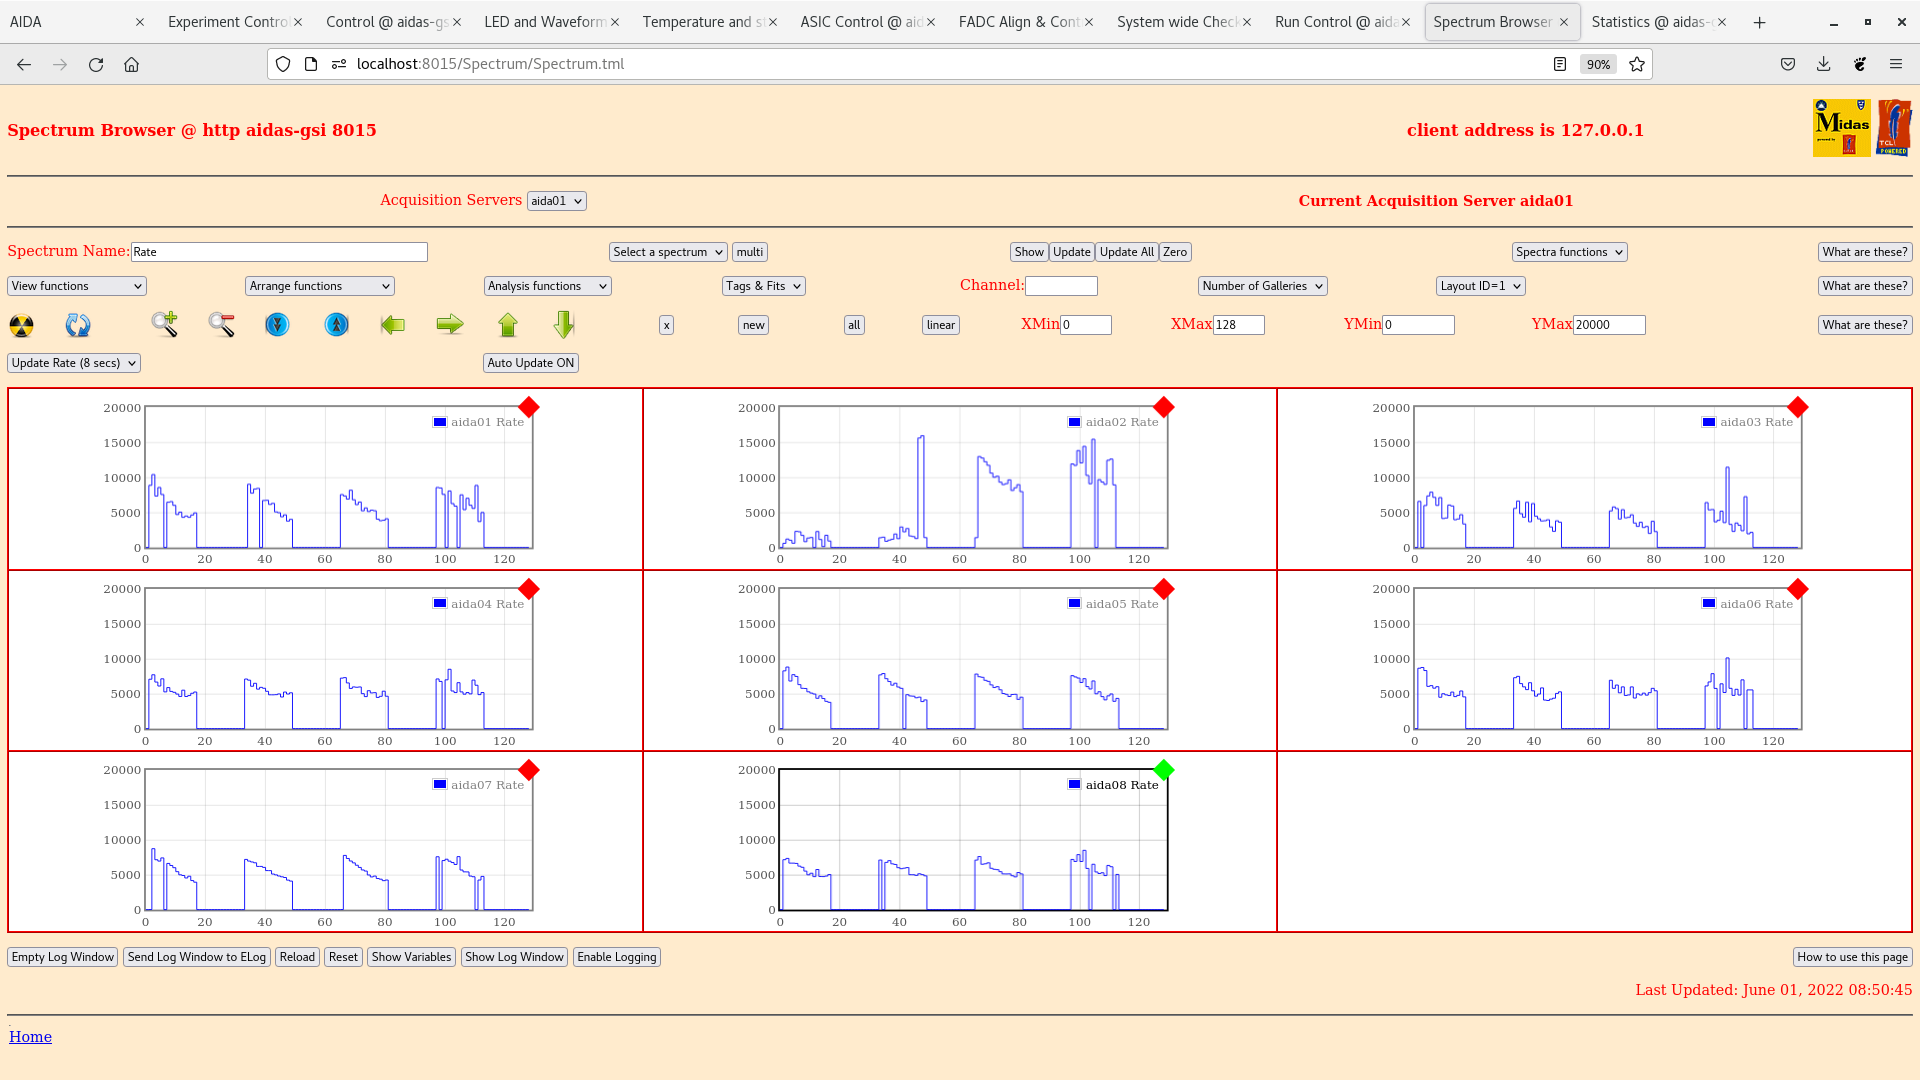
|
| Attachment 11: 2022-06-01_13-29-47_stats.png
|

|
| Attachment 12: 2022-06-01_13-42-07_rates.png
|

|
| Attachment 13: 2022-06-01_13-44-25_waves_pn.png
|

|
| Attachment 14: 2022-06-01_13-44-52_nn_waves.png
|
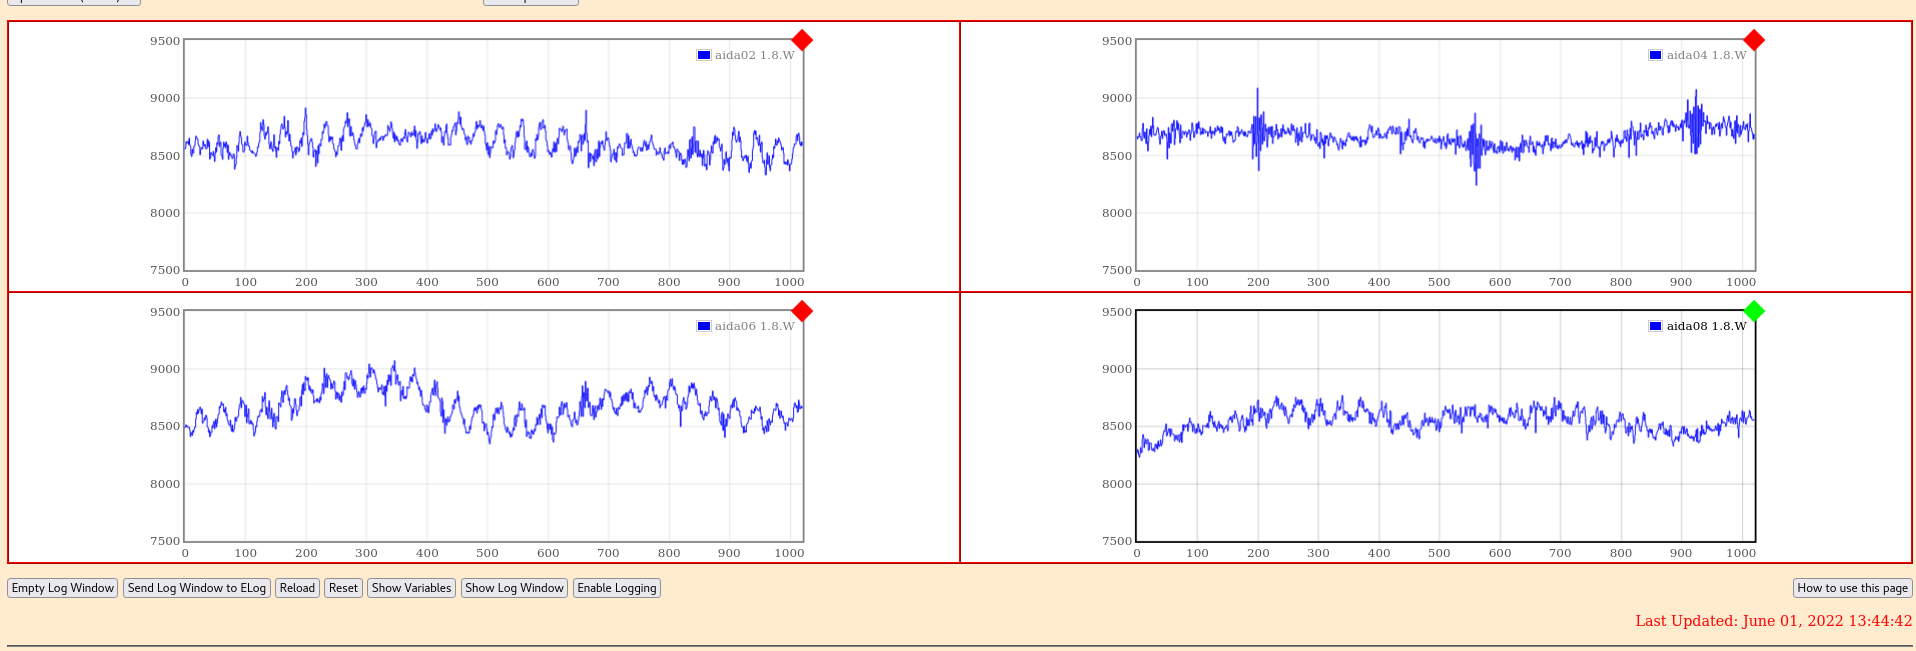
|
| Attachment 15: 2022-06-01_14-23-57_0x1f.png
|

|
|
542
|
Wed Mar 20 12:22:27 2024 |
NH | Wed Mar 20 |
Turn on AIDA for Dry Run demonstrations and so on
All system wide checks, temp, bias OK
Noise situation is dreadful (but has not been optimised). Deterioriation since first mounted, suspect cabling issues with bPlast and BB7.
Note thresholds at 0x32 (!!!) to not brutalise the DAQs during testing
aida08 seems OK
Server running to MBS totally fine
18:00
Carole grounded some of the Bplast and this reduced the rates in AIDA, although they are a bit fluctuatey. Due to position constraints she couldn't ground it all
Also AIDA ribbon cables are not grounded yet
The indication is these fixes should make a lot of difference to the situation
AIDA is now powered off for the end of day |
| Attachment 1: Screenshot_from_2024-03-20_13-20-43.png
|
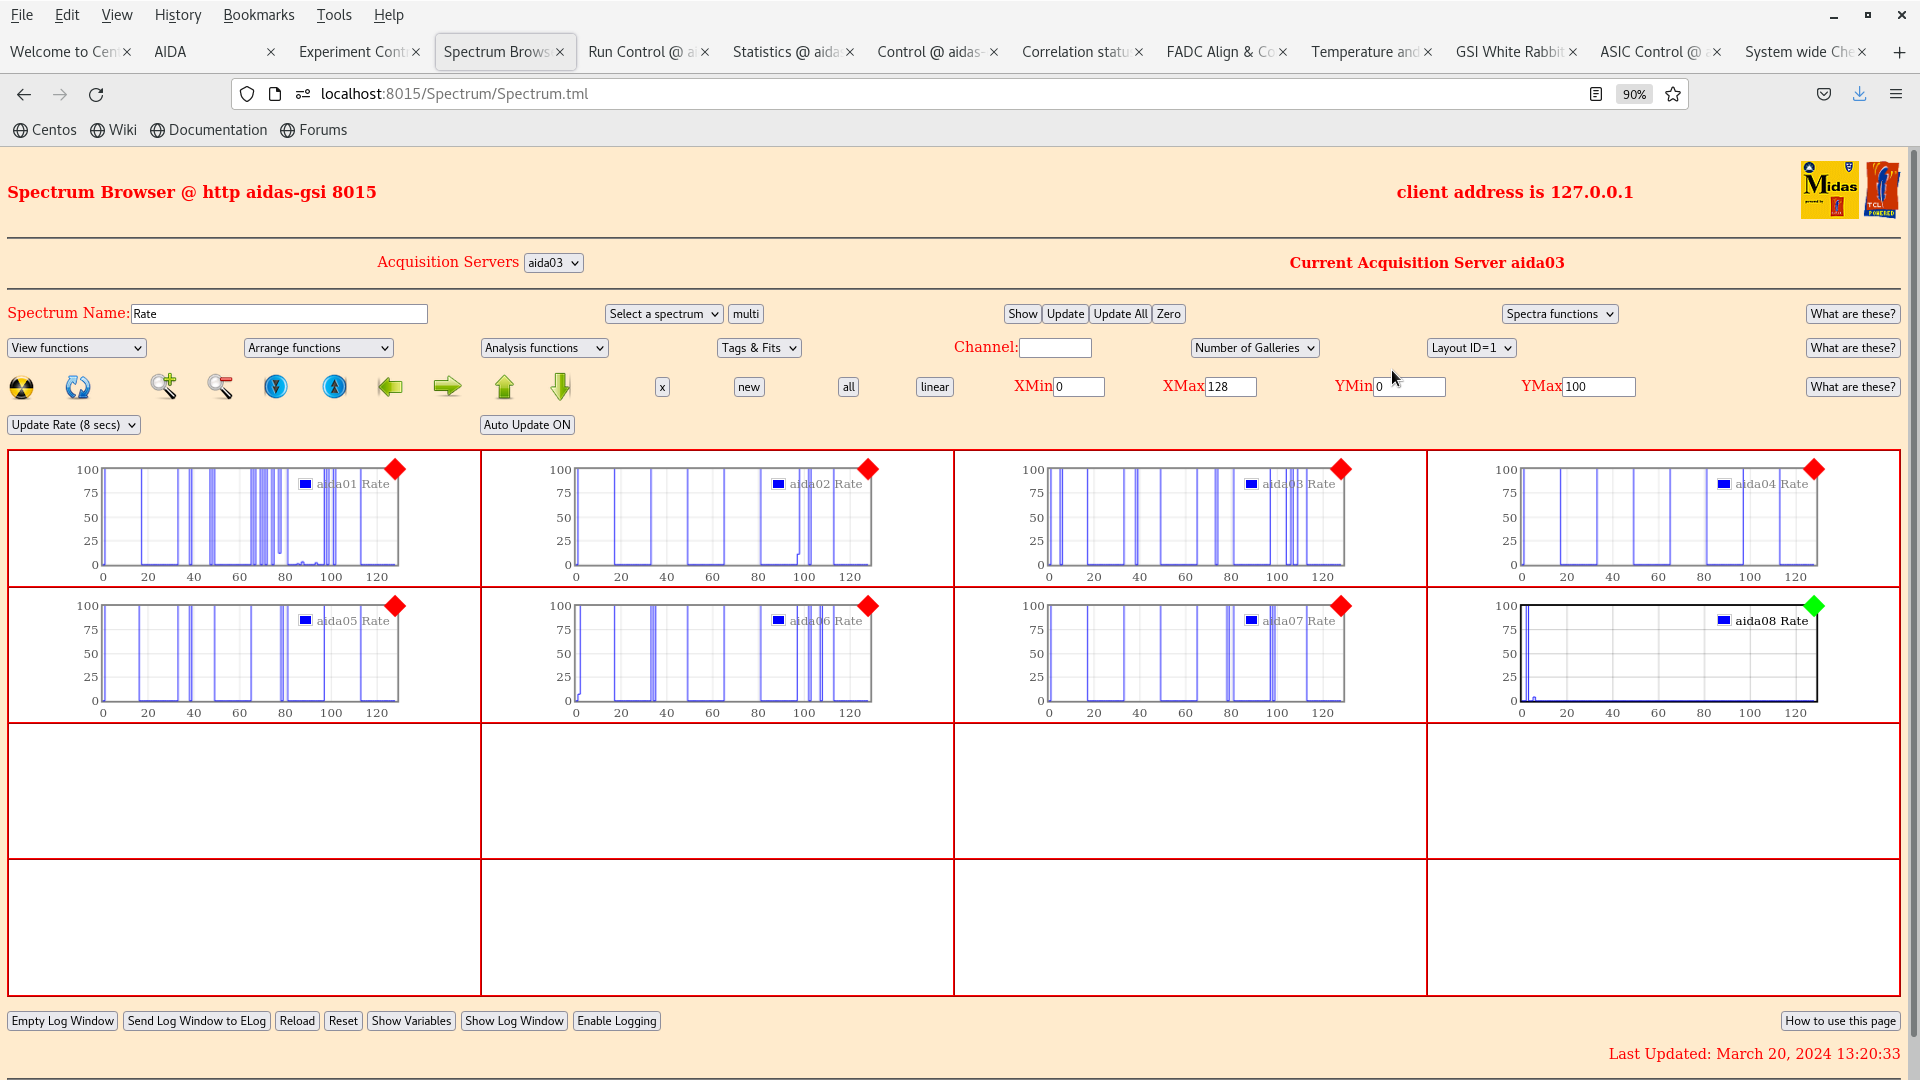
|
| Attachment 2: Screenshot_from_2024-03-20_13-20-54.png
|
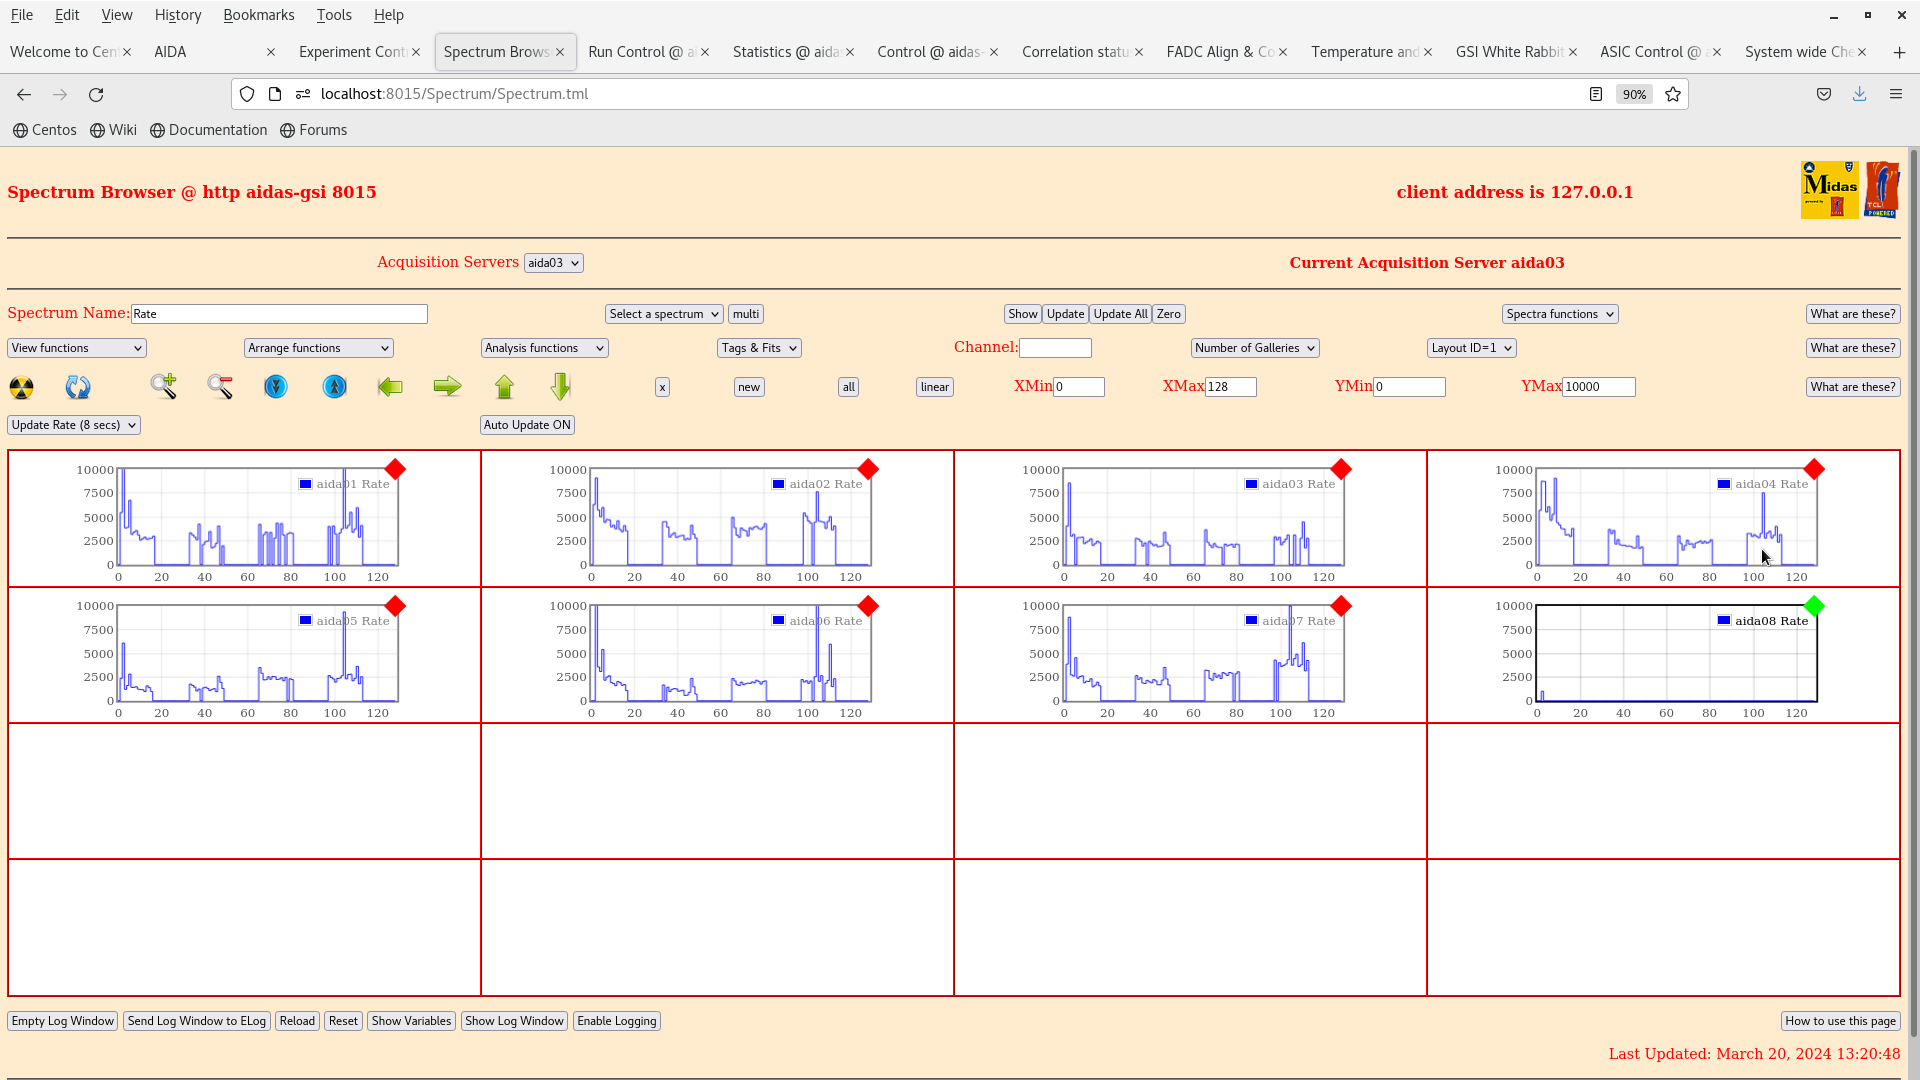
|
| Attachment 3: Screenshot_from_2024-03-20_13-21-18.png
|
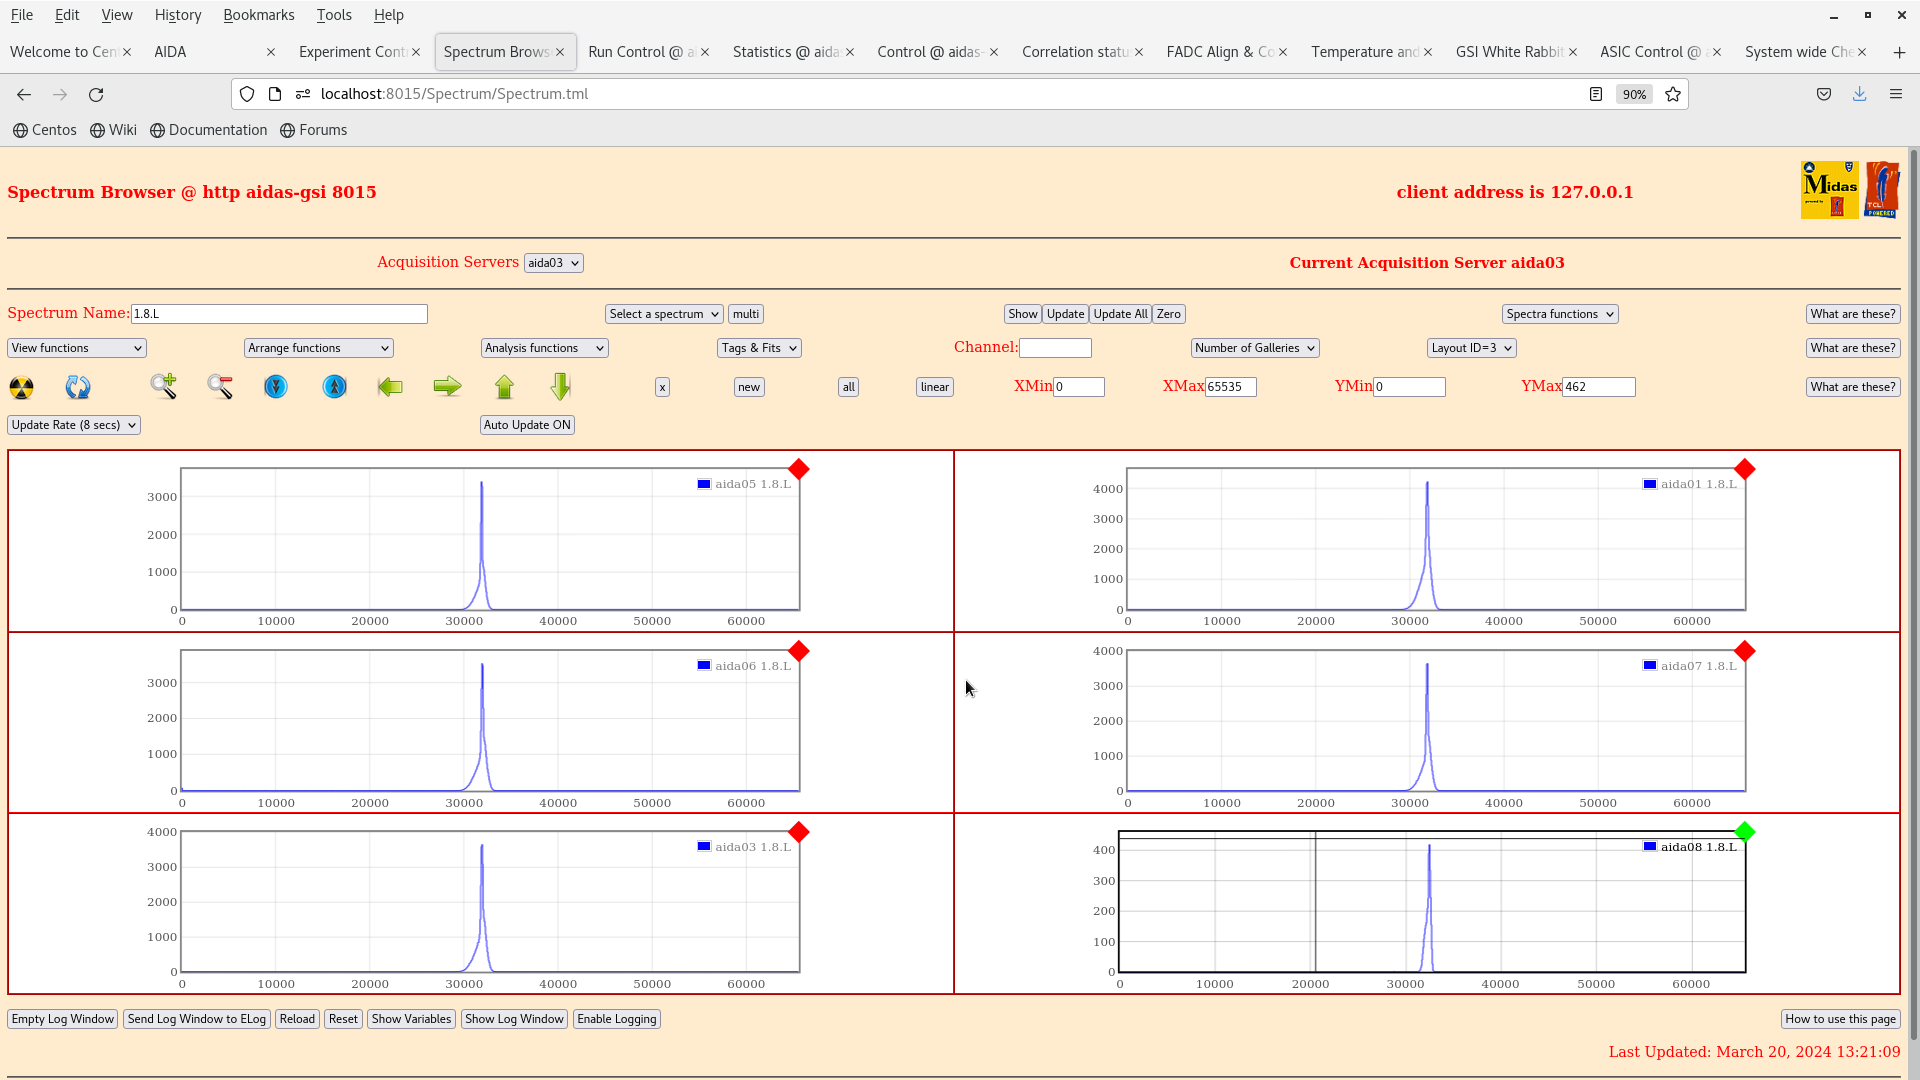
|
| Attachment 4: Screenshot_from_2024-03-20_13-21-38.png
|
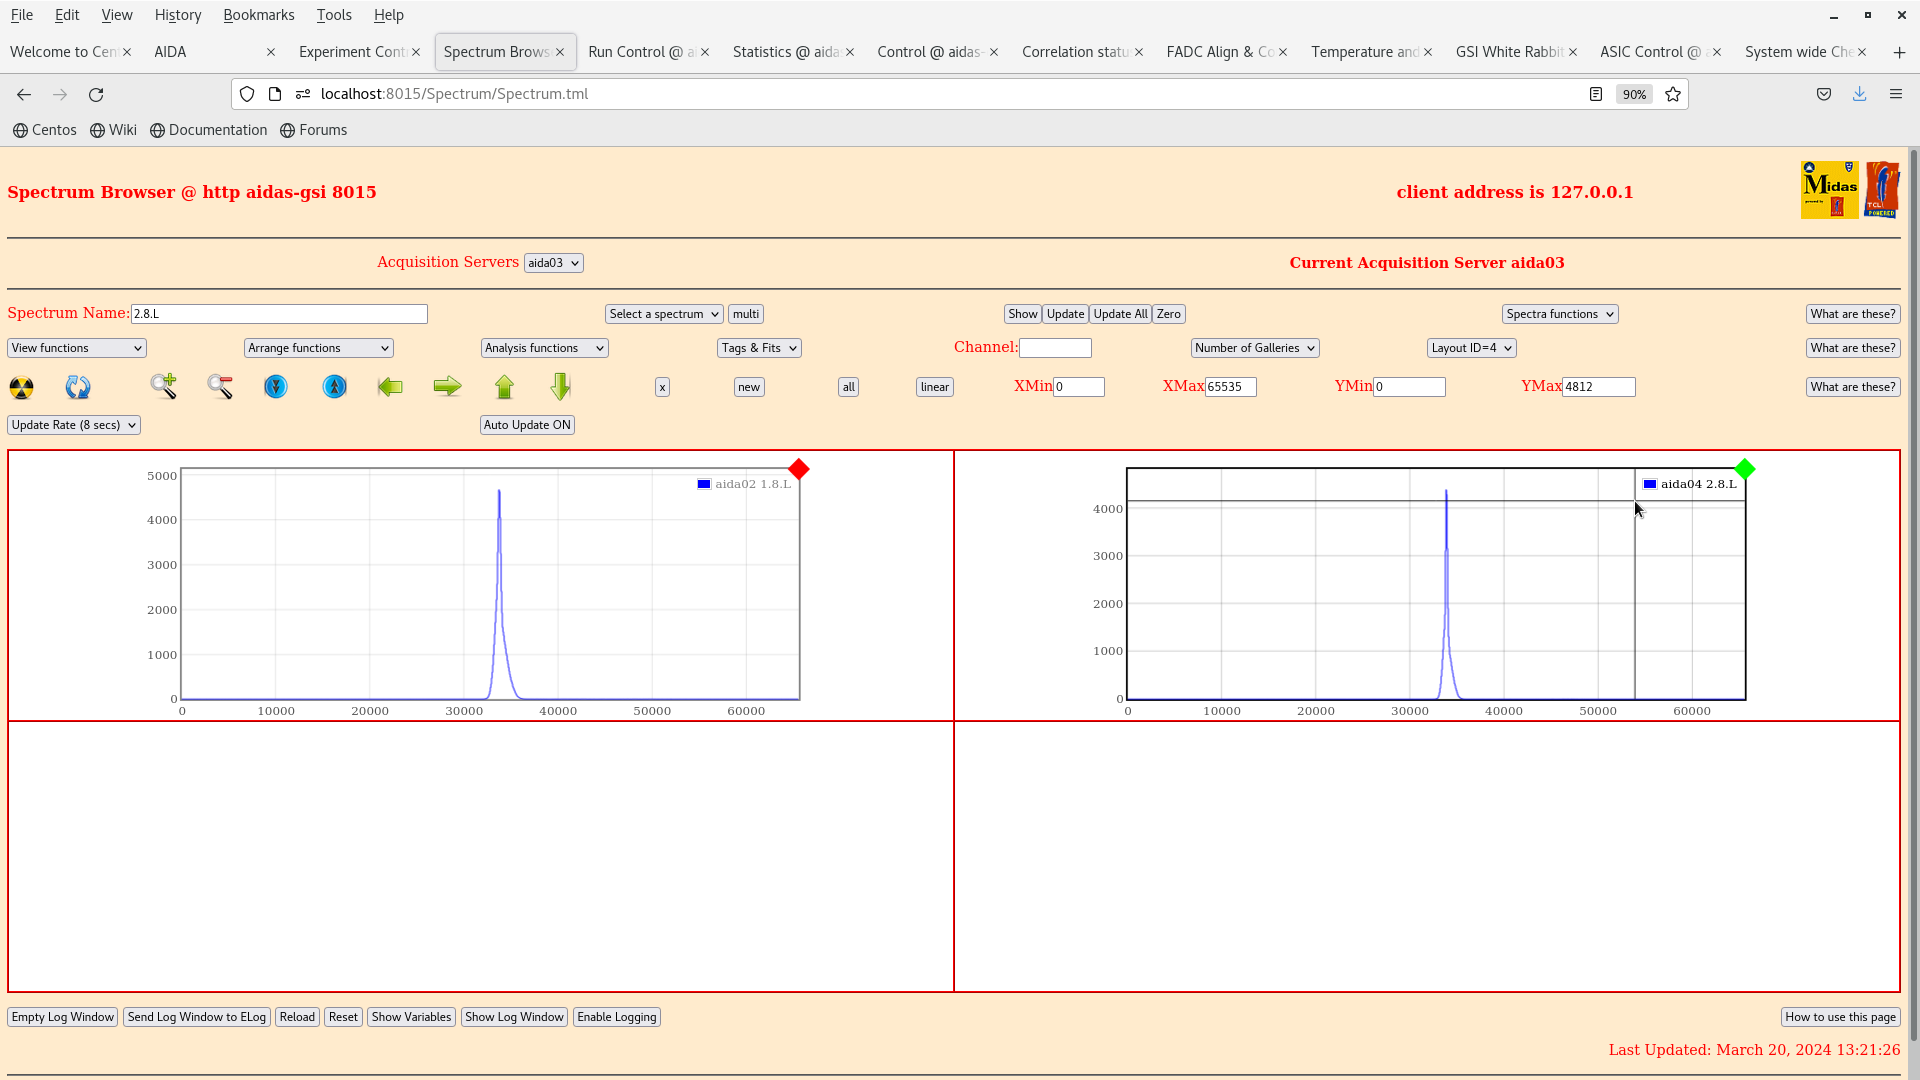
|
| Attachment 5: Screenshot_from_2024-03-20_13-21-57.png
|
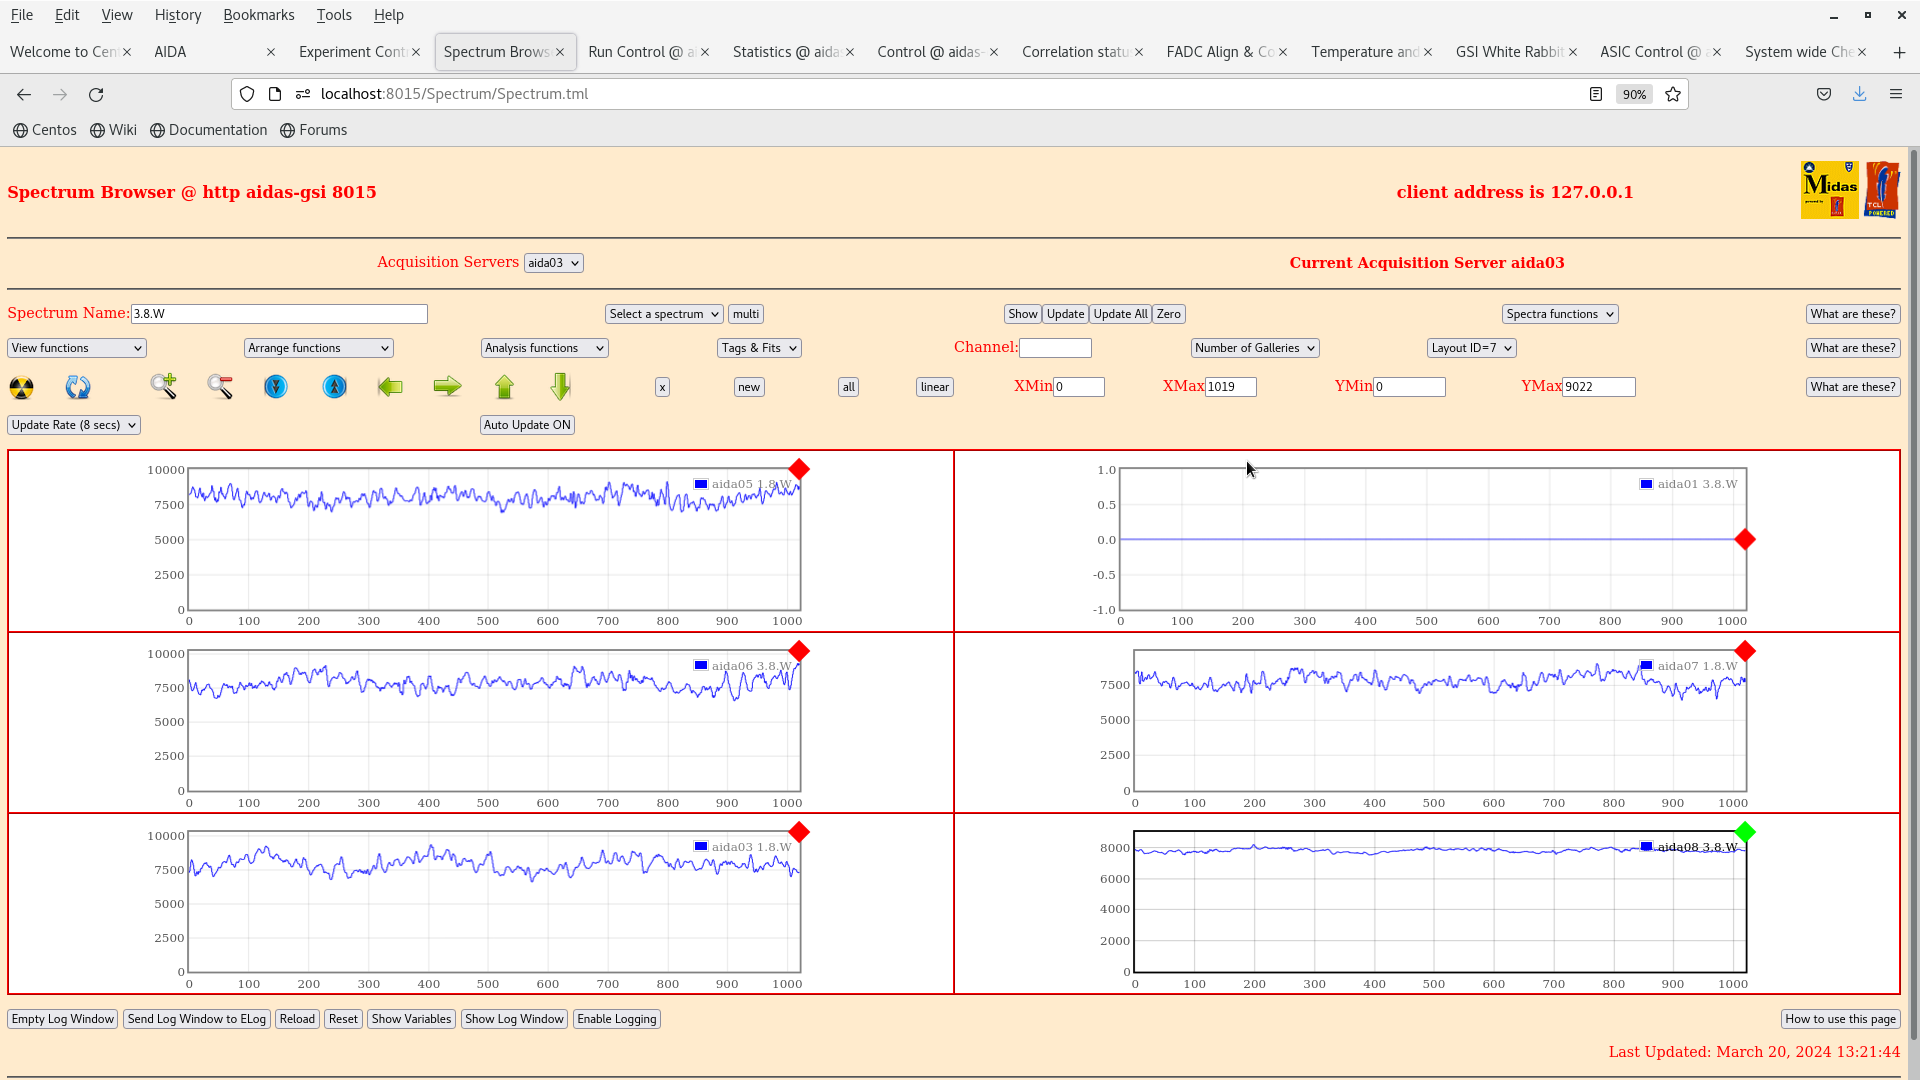
|
| Attachment 6: Screenshot_from_2024-03-20_13-22-12.png
|
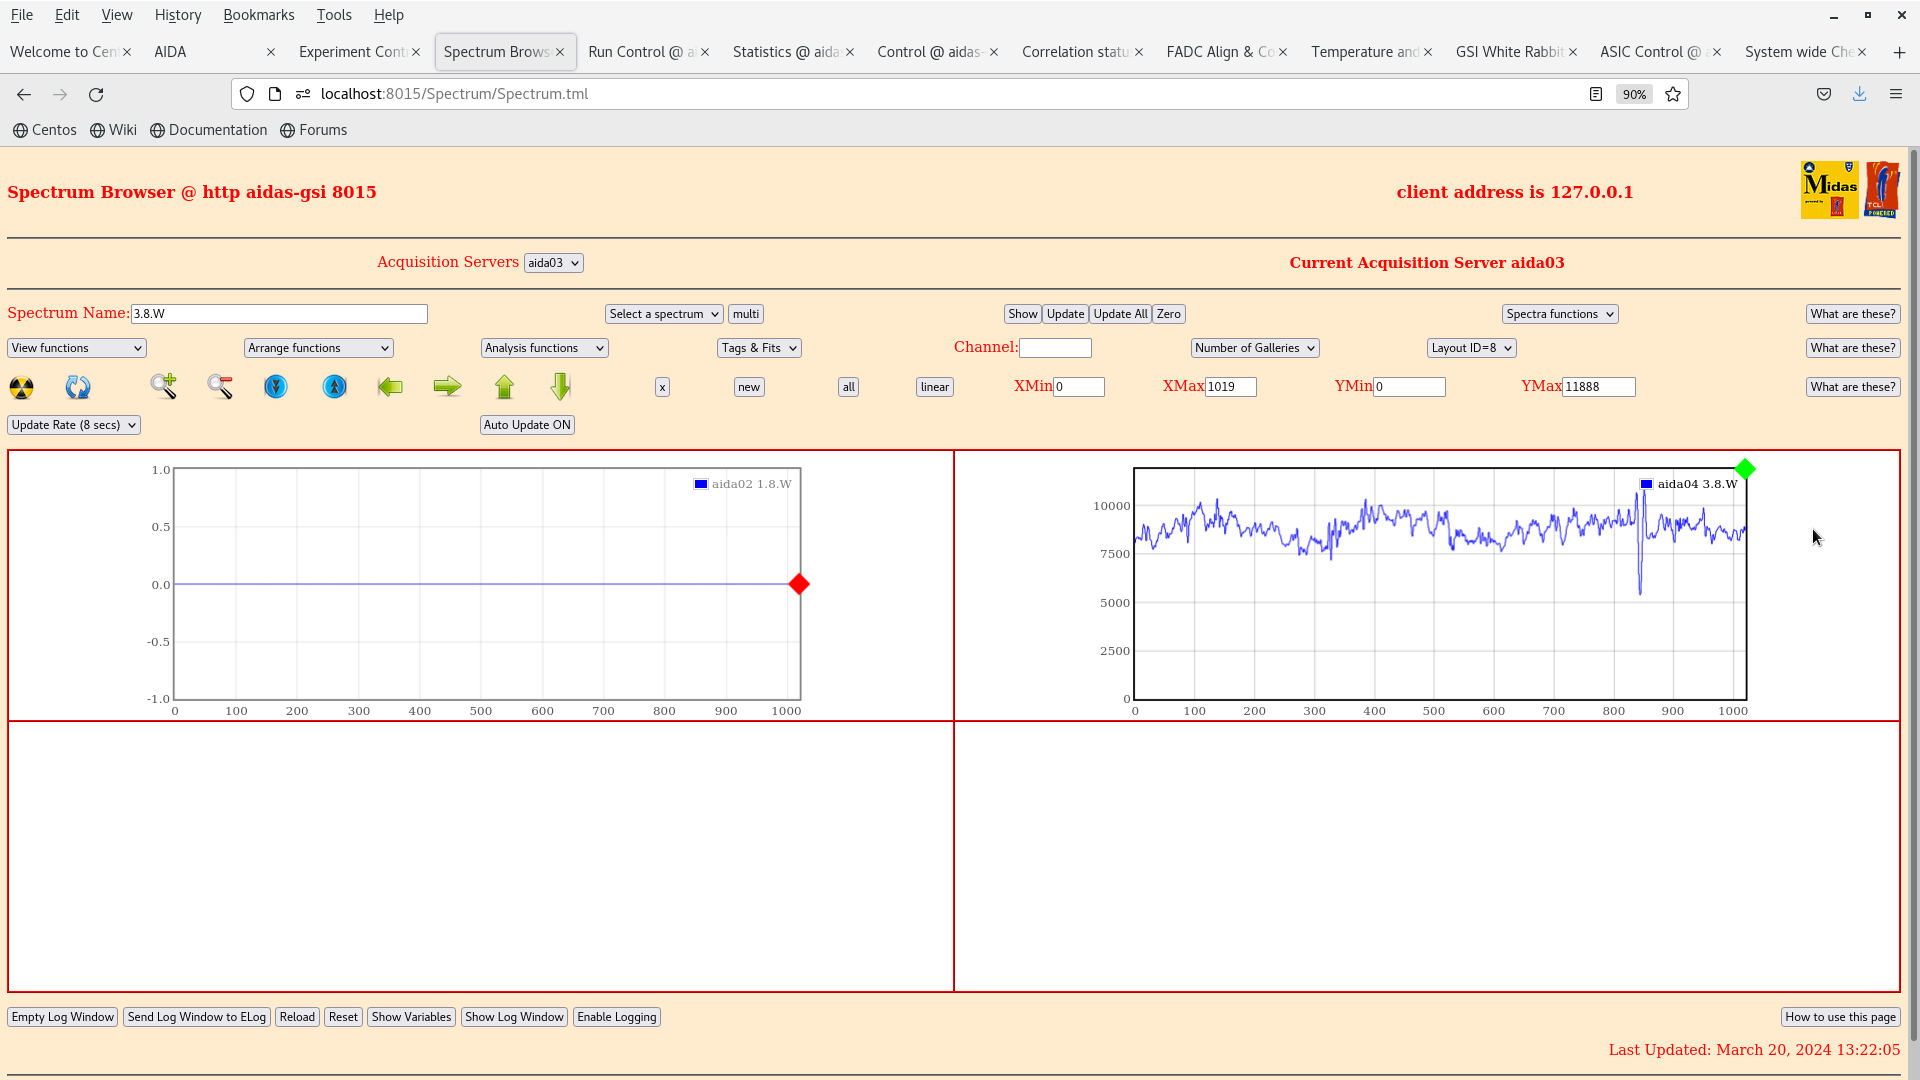
|
| Attachment 7: Screenshot_from_2024-03-20_13-24-21.png
|

|
| Attachment 8: Screenshot_from_2024-03-20_13-25-02.png
|

|
| Attachment 9: Screenshot_from_2024-03-20_13-25-13.png
|

|
|
255
|
Tue Apr 20 23:08:22 2021 |
CA | Wed Apr 21 00:00-08:00 |
00:00 - CA takes over

00:15 - stats/database/ucesb ok - attachment 1

      - another burst of bad timestamp error messages in NewMerger terminal - but all FEE64 still ok - attachment 2

      - Merger/TapeService ok

00:21 - beam still off while UNILAC having problems

00:26 - beam is back - rate spectra - attachment 3

00:32 - ucesb following beam return - attachment 4

      - implant rates reaching highs of ~1kHz

00:35 - Grafana leakage current monitor last 6 hours - attachment 5

01:00 *all* system wide checks ok

      stats ok - attachment 6

      temperatures ok - attachment 7

      detector bias / leakage currents ok - attachment 8

      db check ok / ucesb ok

      still observe periodic bursts of bad timestamp errors in NewMerger terminal - FEE64s still linked with merger ok

01:30 AIDA crashes just as I make check, most FEE64 lost connection -> powercycle and restart MIDAS

01:53 AIDA reset completed - writing to file NULL/R48

01:56 all system wide checks ok *except*

FPGA error counter

			 Base 		Current 		Difference
aida12 fault 	 0x0 : 	 0x1 : 	 1
FPGA Timestamp error counter test result: Passed 11, Failed 1
If any of these counts are reported as in error
The ASIC readout system has detected a timeslip.
That is the timestamp read from the time FIFO is not younger than the last

ADC calibration

FEE64 module aida04 failed
FEE64 module aida05 failed
Calibration test result: Passed 10, Failed 2

If any modules fail calibration , check the clock status and open the FADC Align and Control browser page to rerun calibration for that module


02:01 good event statistics ok - attachment 9

      temperatures ok - attachment 10

      detector bias / leakage currents ok - attachment 11

      db check / ucesb ok

02:20 beam stop

02:21 beam back

02:30 stats/ucesb/db checks all ok

03:00 stats/ucesb/db checks all ok - attachment 12

03:30 stats/ucesb/db checks all ok

04:00 system wide checks ok, except;

      ADC calibration

FEE64 module aida04 failed
FEE64 module aida05 failed
Calibration test result: Passed 10, Failed 2

If any modules fail calibration , check the clock status and open the FADC Align and Control browser page to rerun calibration for that module

     FPGA errors

Base 		Current 		Difference
aida12 fault 	 0x0 : 	 0x9 : 	 9
FPGA Timestamp error counter test result: Passed 11, Failed 1
If any of these counts are reported as in error
The ASIC readout system has detected a timeslip.
That is the timestamp read from the time FIFO is not younger than the last

04:03 beam off briefly

04:05 good event statistics ok - attachment 13

04:07 beam back

      temperatures ok - attachment 14

      bias / leakage currents ok - attachment 15

      db check / ucesb ok - attachment 16

      implant rates in AIDA peaking at ~1.5kHz

04:30 stats/ucesb/db checks all ok

04:48 no beam

04:58 beam back

05:00 stats/ucesb/db checks all ok - attachment 17

05:30 stats/ucesb/db checks all ok

06:00 system wide checks ok, except;

      ADC calibration

FEE64 module aida04 failed
FEE64 module aida05 failed
Calibration test result: Passed 10, Failed 2

If any modules fail calibration , check the clock status and open the FADC Align and Control browser page to rerun calibration for that module

     FPGA errors

Base 		Current 		Difference
aida12 fault 	 0x0 : 	 0x9 : 	 9
FPGA Timestamp error counter test result: Passed 11, Failed 1
If any of these counts are reported as in error
The ASIC readout system has detected a timeslip.
That is the timestamp read from the time FIFO is not younger than the last

    FEE64 Linux Memory Info

Returned 0 0 0 0 0 0 0 0 0 0 0 0
Mem(KB) :	4	8	16	32	64	128	256	512	1k	2k	4k
aida01 :      5      5      3      3      2      3      2      3      2      3      7   : 39628
aida02 :     22     11      3      0      2      3      2      3      2      3      7   : 39648
aida03 :     20     10      1      1      2      2      1      4      2      3      7   : 39760
aida04 :     17     10      2      2      3      3      2      3      2      3      7   : 39732
aida05 :      1      8      3      2      3      2      2      3      3      3      7   : 40564
aida06 :      5      6      2      3      2      2      3      3      2      3      7   : 39748
aida07 :     18      4      7      0      1      3      1      4      2      3      7   : 39832
aida08 :     22     10      3      3      2      2      3      3      2      3      7   : 39864
aida09 :      3      6      2      2      0      3      1      4      2      3      7   : 39708
aida10 :      2      4      3      2      1      2      2      3      2      3      7   : 39384
aida11 :     20      8      3      1      1      3      3      2      2      3      7   : 39328
aida12 :     16      6      3      1      0      3      2      3      2      3      7   : 39488

06:02 good event statistics ok - attachment 18

      FEE64 temperatures ok - attachment 19

      detector bias / leakage currents ok - attachment 20

06:06 db check and ucesb ok - attachment 21

      NewMerger terminal hasn't flagged up any more errors since ~ 03:00

06:30 stats/ucesb/db checks all ok

      DESPEC restarts timesorter

07:00 stats/ucesb/db checks all ok

07:30 stats/ucesb/db checks all ok - attachment 22

      grafana leakage currents last 1 hour - attachment 23
|
| Attachment 1: Screenshot_from_2021-04-20_23-15-20.png
|

|
| Attachment 2: Screenshot_from_2021-04-20_23-18-14.png
|
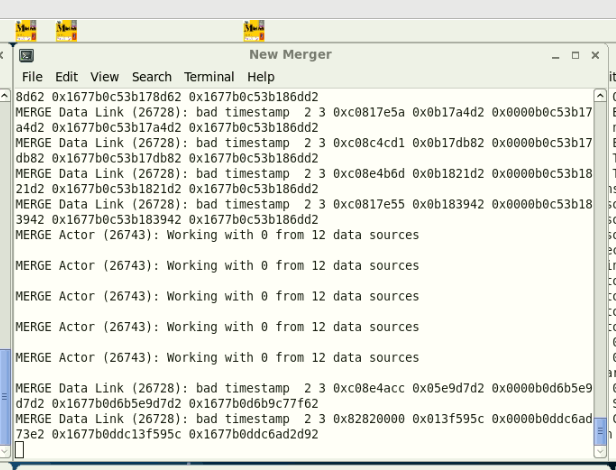
|
| Attachment 3: Screenshot_from_2021-04-20_23-29-06.png
|

|
| Attachment 4: Screenshot_from_2021-04-20_23-32-08.png
|

|
| Attachment 5: Screenshot_from_2021-04-20_23-34-42.png
|

|
| Attachment 6: Screenshot_from_2021-04-21_00-00-06.png
|

|
| Attachment 7: Screenshot_from_2021-04-21_00-00-29.png
|

|
| Attachment 8: Screenshot_from_2021-04-21_00-01-15.png
|
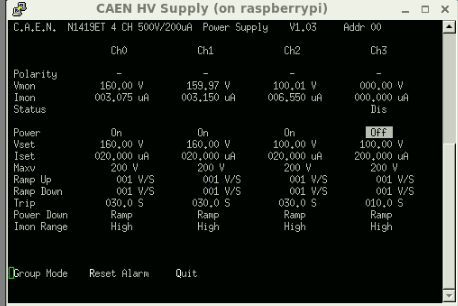
|
| Attachment 9: Screenshot_from_2021-04-21_01-00-03.png
|

|
| Attachment 10: Screenshot_from_2021-04-21_01-00-48.png
|

|
| Attachment 11: Screenshot_from_2021-04-21_01-01-05.png
|
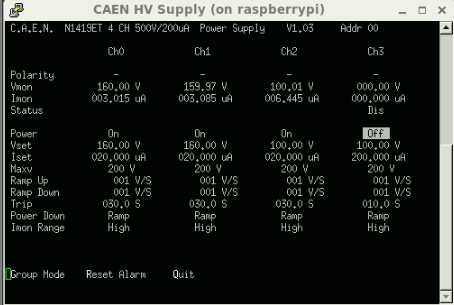
|
| Attachment 12: Screenshot_from_2021-04-21_01-59-30.png
|
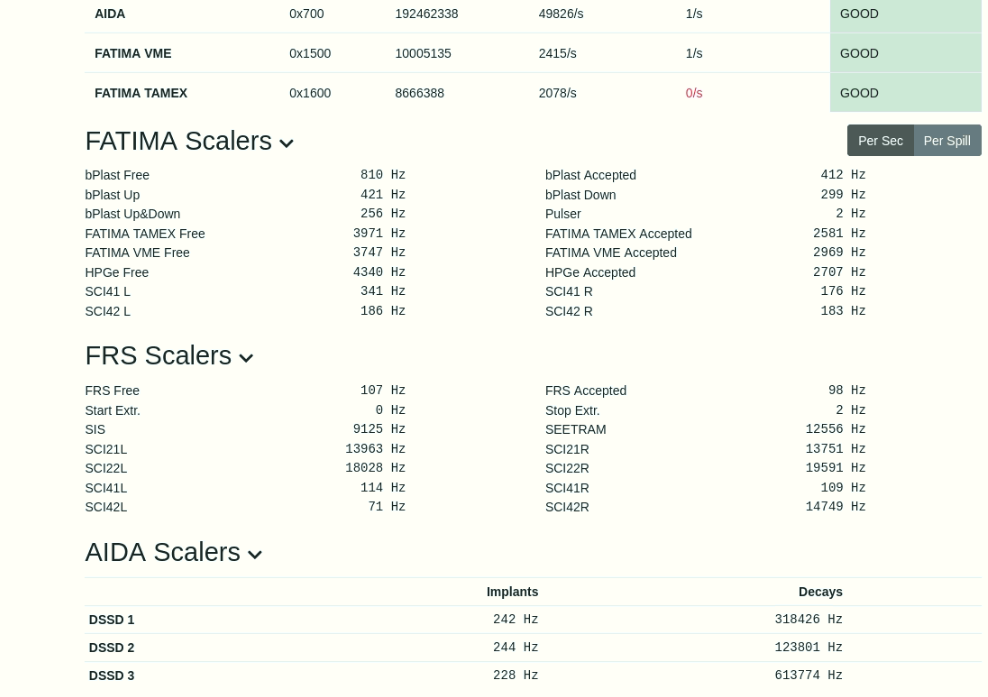
|
| Attachment 13: Screenshot_from_2021-04-21_03-05-24.png
|

|
| Attachment 14: Screenshot_from_2021-04-21_03-05-47.png
|

|
| Attachment 15: Screenshot_from_2021-04-21_03-06-07.png
|
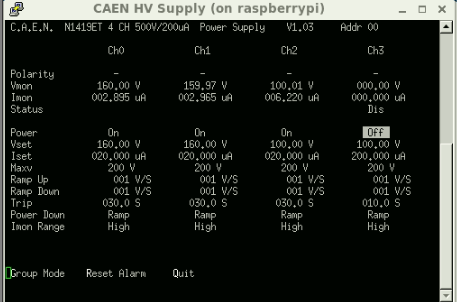
|
| Attachment 16: Screenshot_from_2021-04-21_03-11-44.png
|
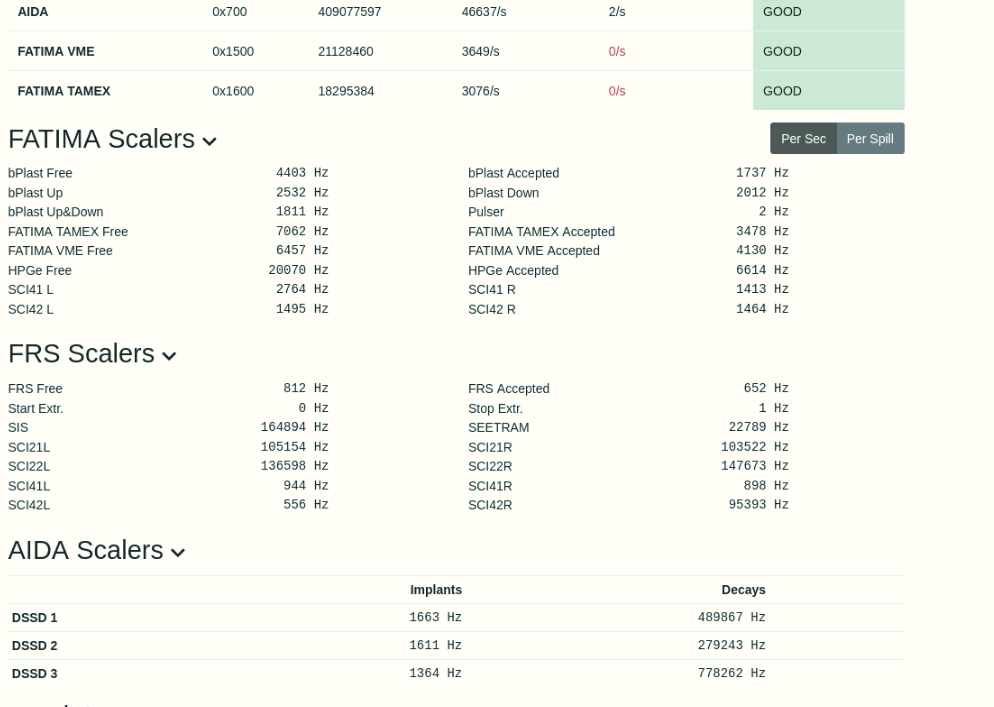
|
| Attachment 17: Screenshot_from_2021-04-21_04-00-22.png
|
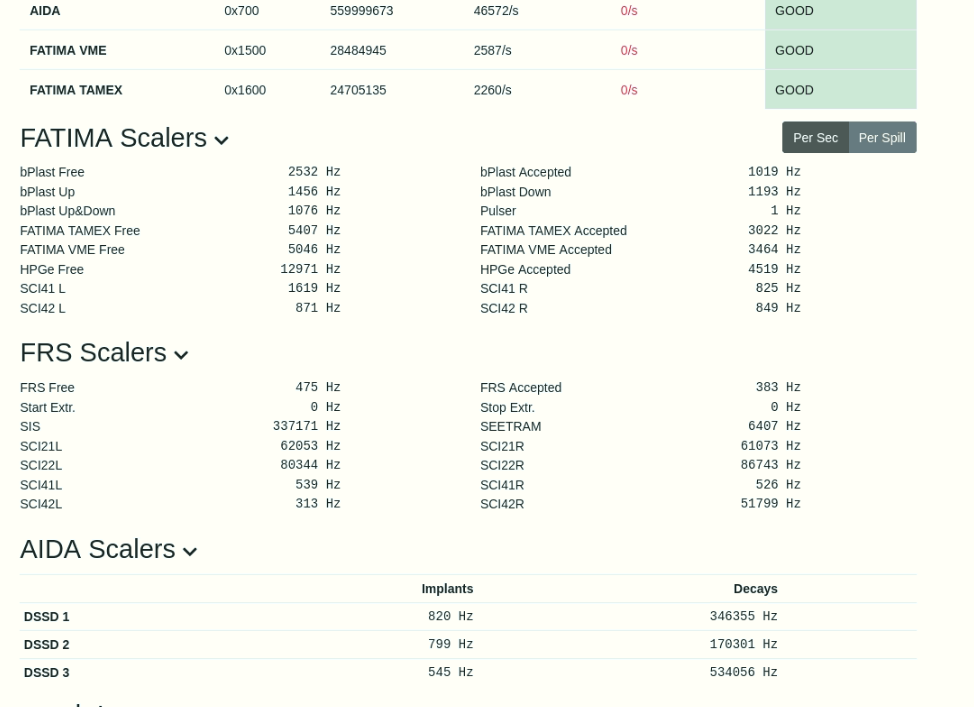
|
| Attachment 18: Screenshot_from_2021-04-21_05-00-18.png
|

|
| Attachment 19: Screenshot_from_2021-04-21_05-00-43.png
|

|
| Attachment 20: Screenshot_from_2021-04-21_05-03-47.png
|
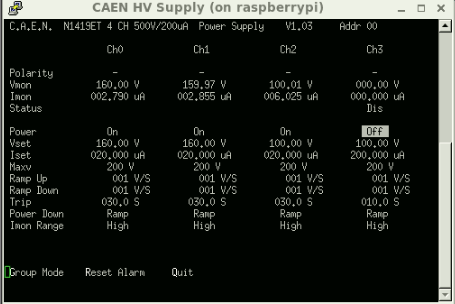
|
| Attachment 21: Screenshot_from_2021-04-21_05-05-43.png
|
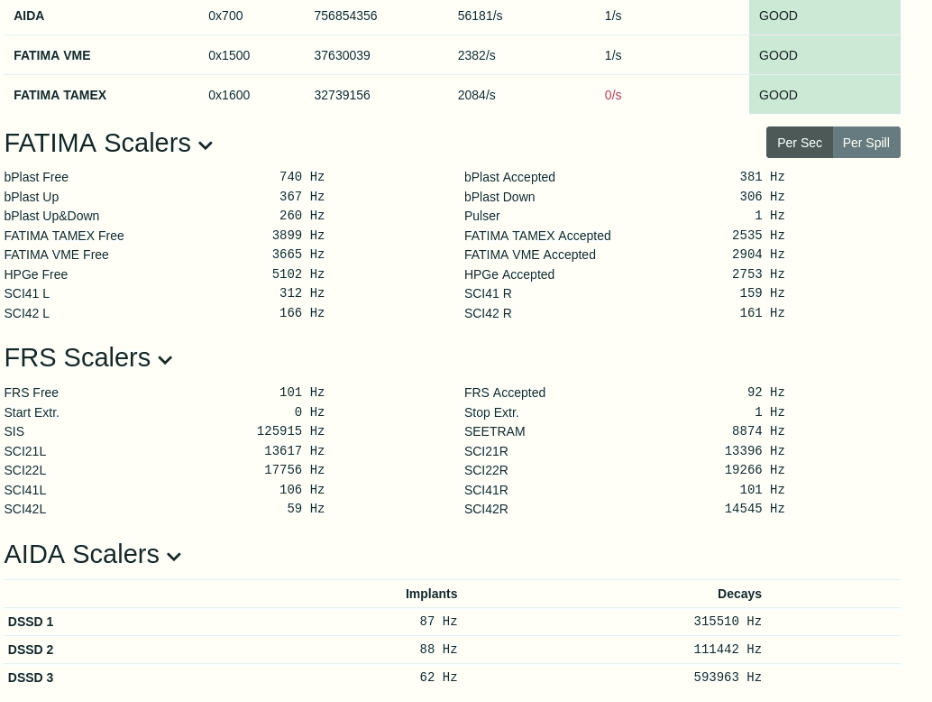
|
| Attachment 22: Screenshot_from_2021-04-21_06-30-20.png
|

|
| Attachment 23: Screenshot_from_2021-04-21_06-32-51.png
|
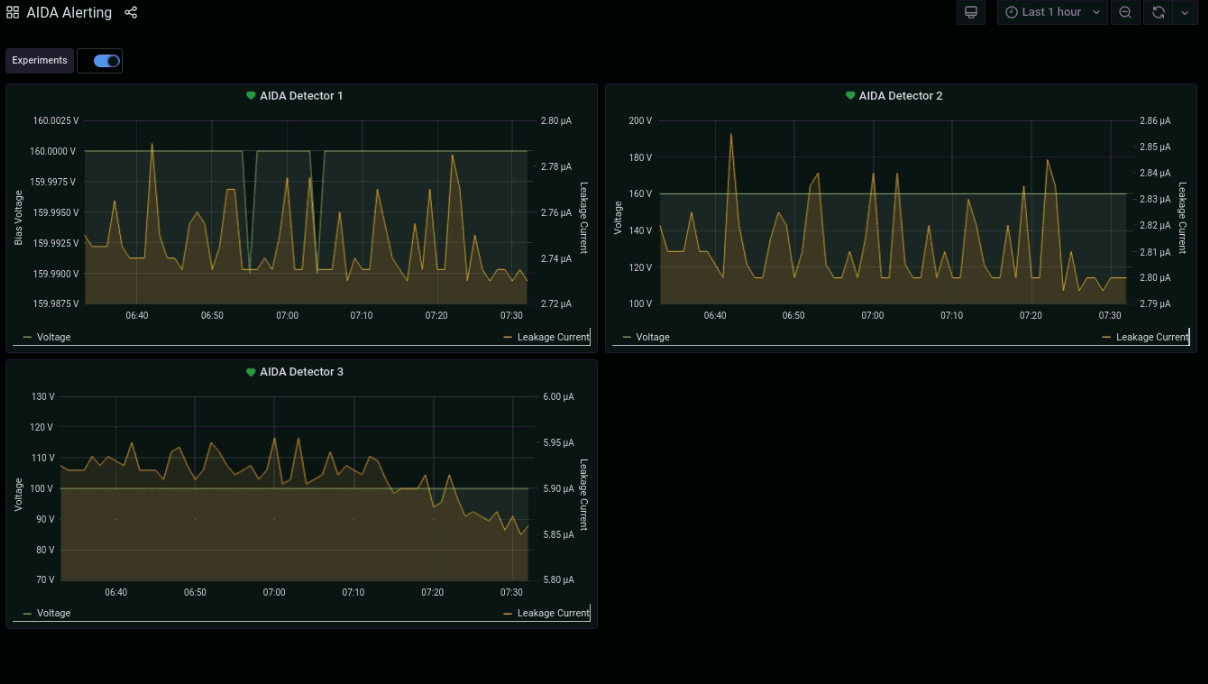
|
|
473
|
Wed May 25 14:28:26 2022 |
NH | Wed 25 May |
The n+n FEEs were all removed to adjust the platform back to the single configuration

After some confusion we found the orientation of the frame to position the single detectors and moved back

Faulty AIDA cards aida05 and aida14 were removed to be returned backi (ASIC damage)

The cables for aida10 and aida12 were moved back to the left-right side and the n+n cards were installed and reocnnected

p+n cards moved to bring aida11 and aida09 above aida03/aida07 and aida01/aida05. Also move a different card to replace old aida05

While doing this it was noticed the HDMI for aida13 was very loose and actually fell off (I guess the cable was pulled incorrectly)
It has been removed and will eb sent back to be resoldered

The copper grounding bars and ITEM frame were removed due to conflicting with the single snout layout
The bolts are slightly too short to hold the frame where it won't conflict so we loko for longer bolts to reattach the system
Some new ground cables will be made to reach the extra n+n FEEs

Aida13-Aida16 removed from the PSU

fig1: layout of snout frame in "single" mode (alu block configuration)


MAC Addresses

aida01 - ba-8a
aida05 - 0d:15
aida09 - ee-01

aida04 - f6-b7
aida08 - ba-2b
aida12 - ba:89

aida03 - d8-21
aida07 - 41:b4:0c
aida11 - f6-5a

aida02 - ba:22
aida06 - ee:72
aida10 - cf-ac [mistakenly swapped with aida12]

Second switch will stay in S4 and has now been screwed in properly below the switch 1 and the hdmi cables entrance

DHCP *not* updated

Relay is powered *off* so FEEs cannot be turned on, alL HV channels disabled

Tomorrow is a holiday so no work will be happening @ GSI |
| Attachment 1: aida_single_alu.jpg
|
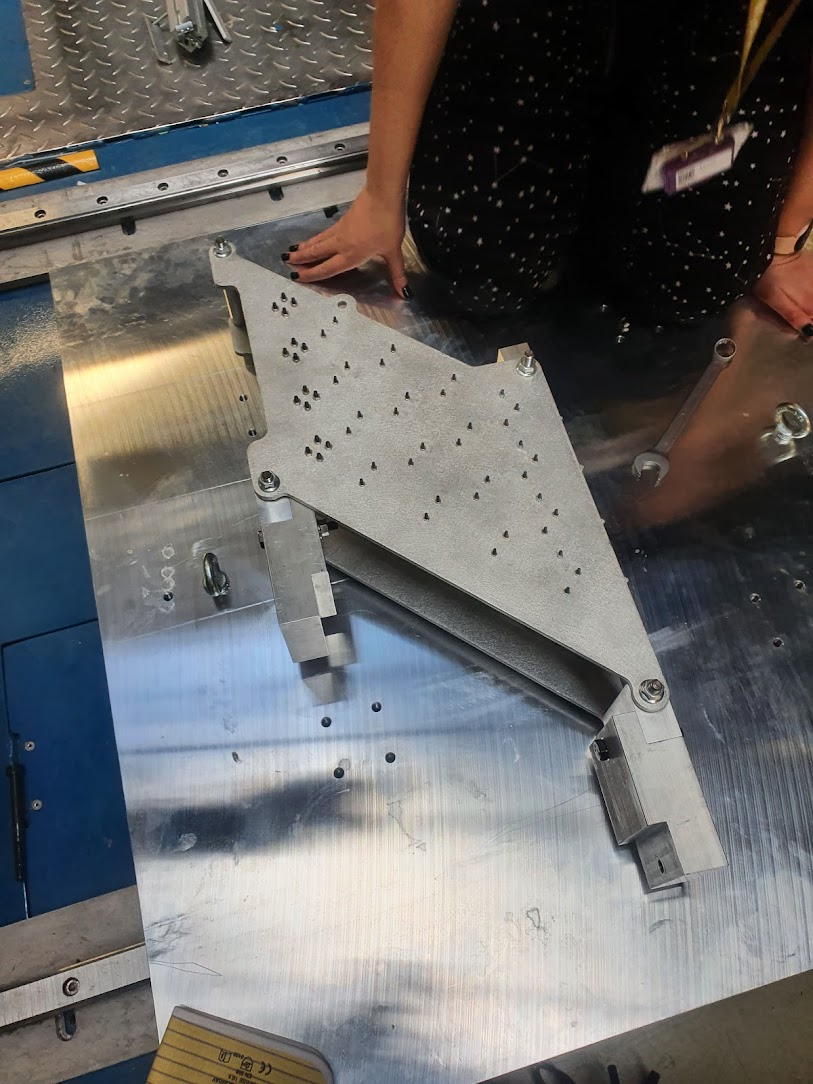
|