ID |
Date |
Author |
Subject |
19
|
Thu Jan 24 10:26:09 2019 |
VP, TD, CA, NH | Start up Merger |
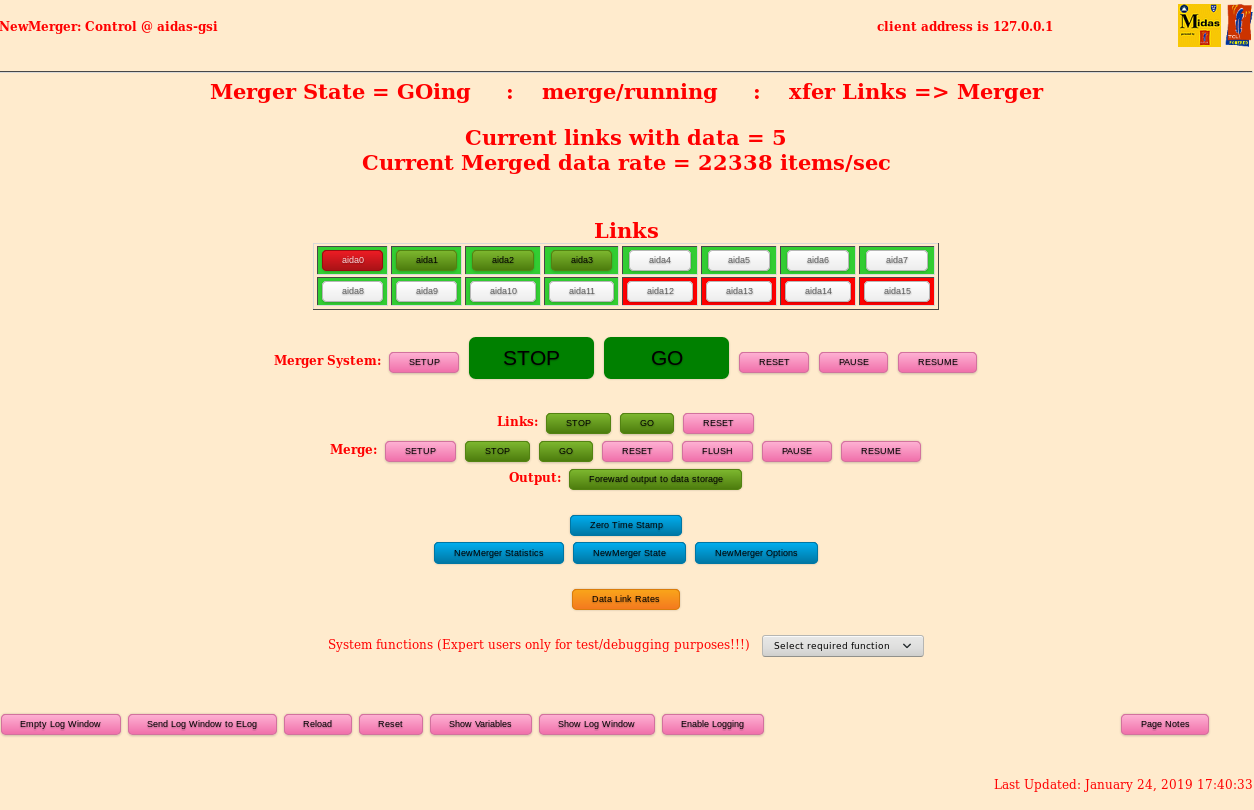
1) Click on item "Merger MK2" in top panel
This kills any existing Merger existence and loads a new copy.
2) Start (if needed) browser conection to localhost:8115.
3) Click on "NewMerger Control"
4) In NewMerger Control, click "Reload"
5) If MergerState = IDLE, click "SETUP".
6) Wait until state = STOPed
7) If links shown are correct, click "GO"
8) Wait until popup about "Resume Merger" appears and click OK
9) when writing to disk, click "Forward Output to Data" |
Attachment 1: merger_screenshot.png
|
|
274
|
Sat Apr 24 04:50:01 2021 |
ML | Spectra |
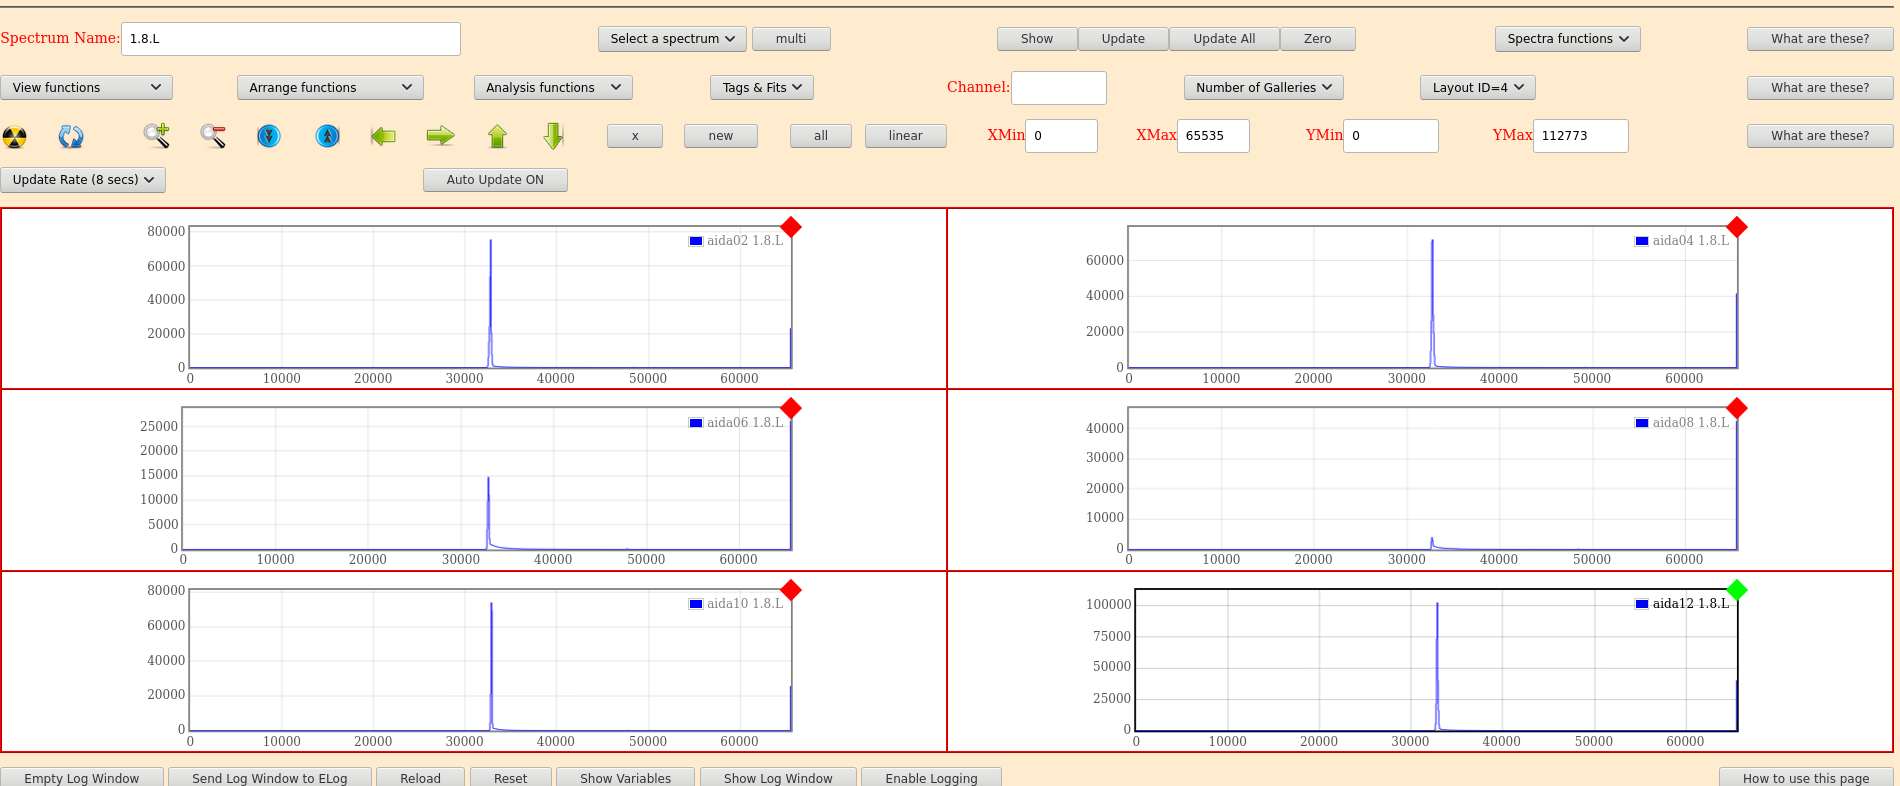
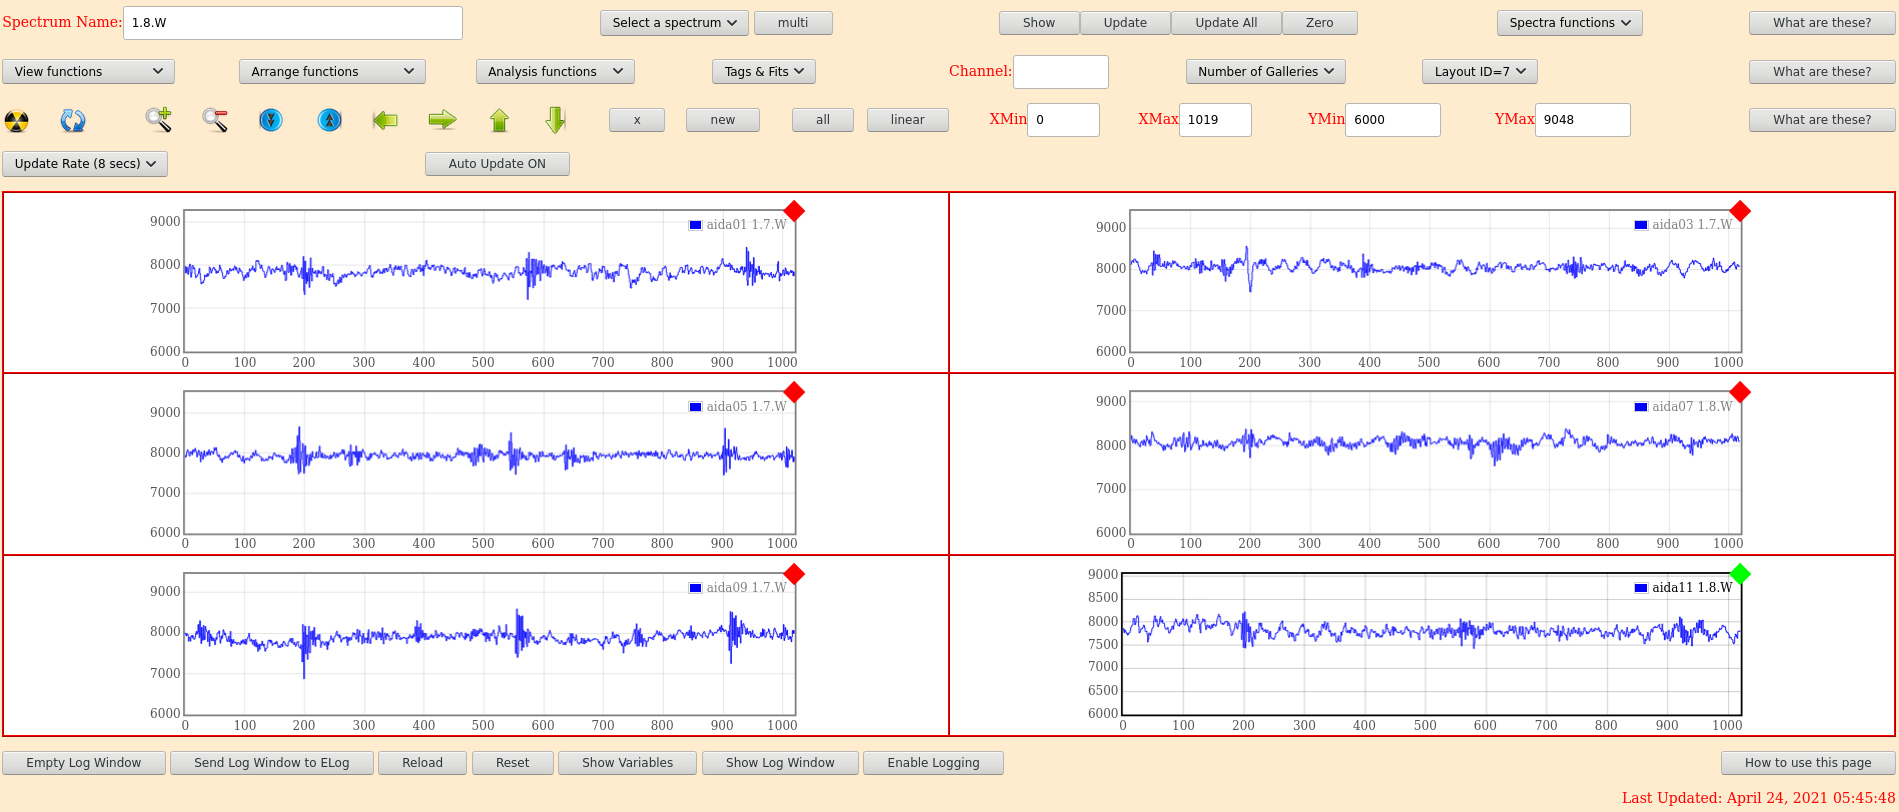
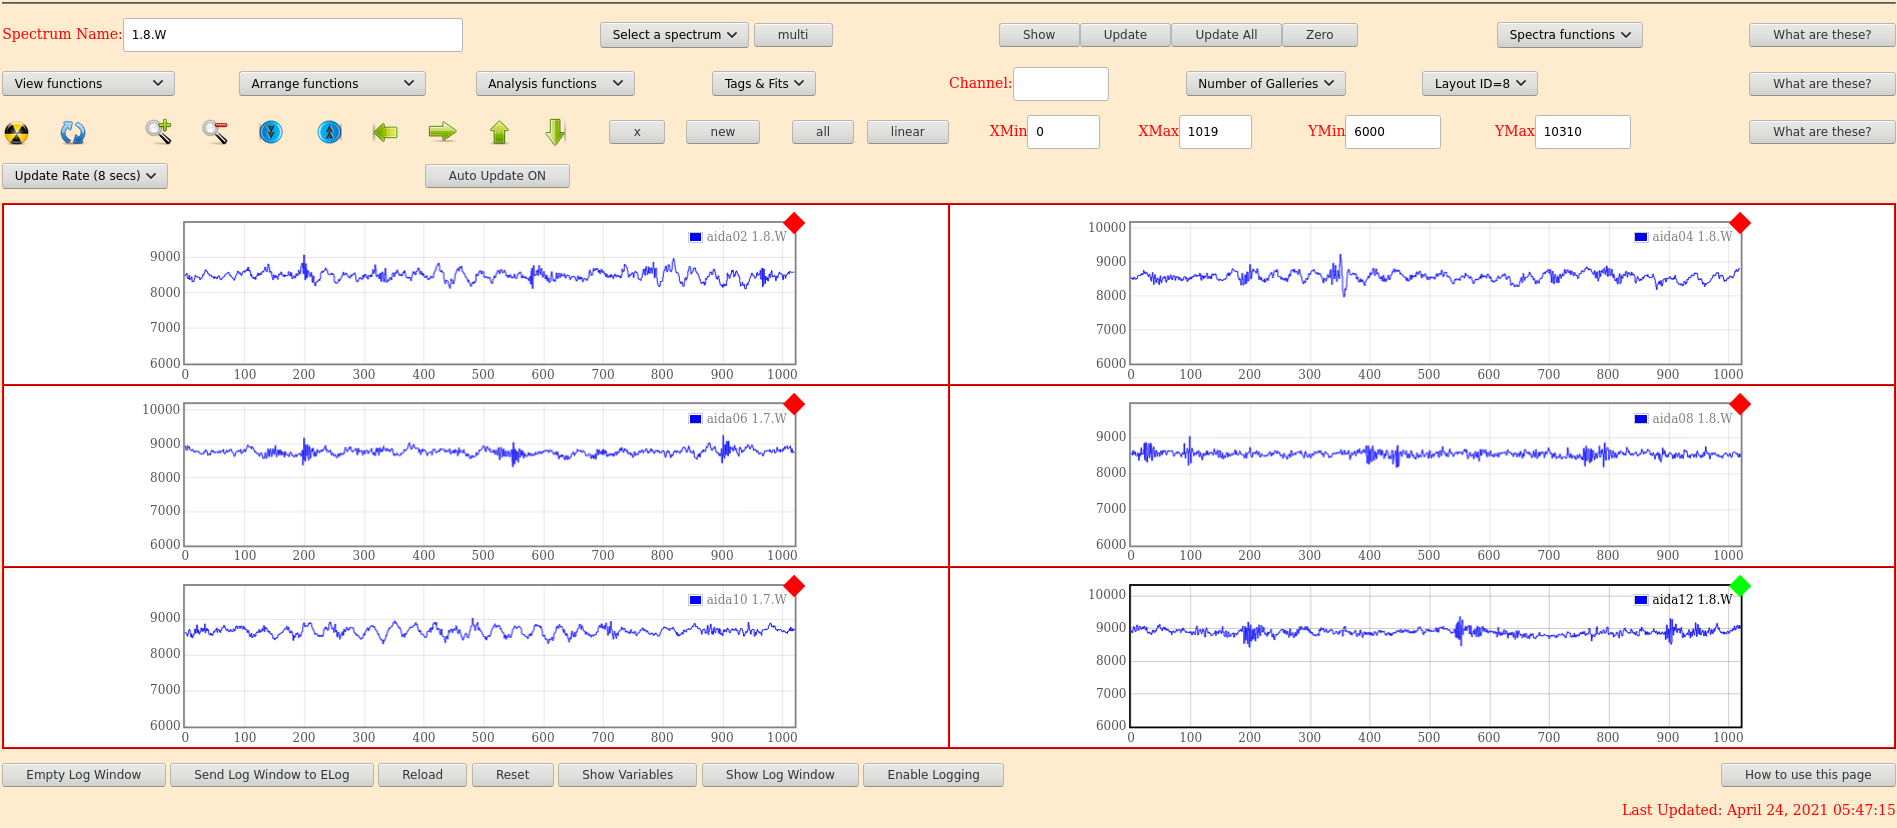
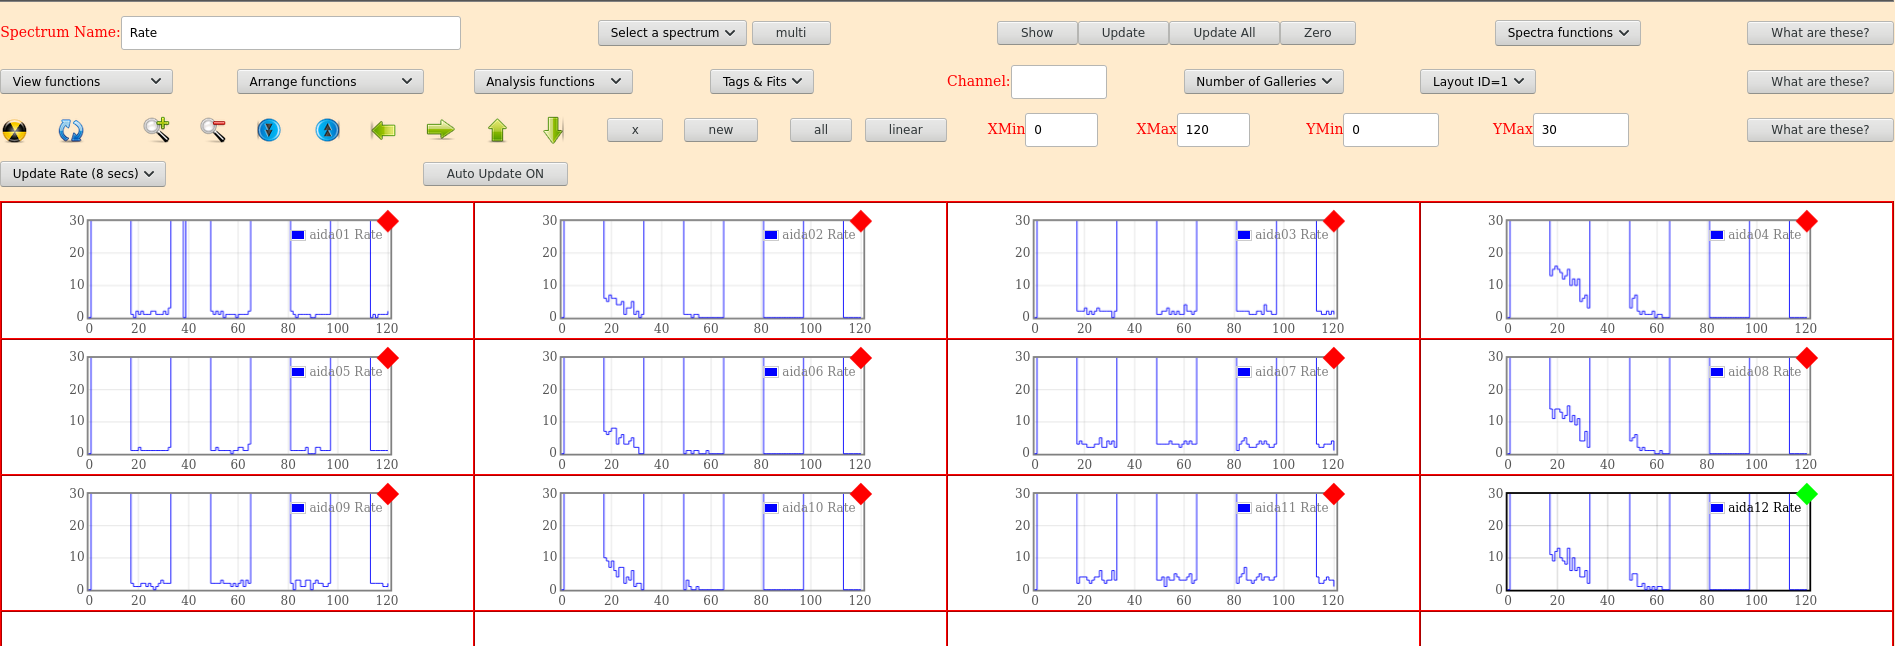
Some screenshot of spectra attached |
Attachment 1: 24-04-2021_540am_SpecLayoutId3.png
|
|
Attachment 2: 24-04-2021_540am_SpecLayId4.png
|
|
Attachment 3: 24-04-2021_540am_SpecLayId5.png
|
|
Attachment 4: 24-04-2021_540am_SpecLayId6.png
|
|
Attachment 5: 24-04-2021_540am_SpecLayId7.png
|
|
Attachment 6: 24-04-2021_540am_SpecLayId8.png
|
|
Attachment 7: 24-04-2021_540am_SpecLayId1.png
|
|
Attachment 8: 24-04-2021_540am_SpecLayId2.png
|
|
30
|
Thu Mar 21 15:45:48 2019 |
NH, AS, SA, MP | Snout Mounting & DSSD Bias |
The AIDA snout (with single DSSD and plastic) has been mounted in S4 cave again. DSSD was connected to the outer 4 FEEs again.
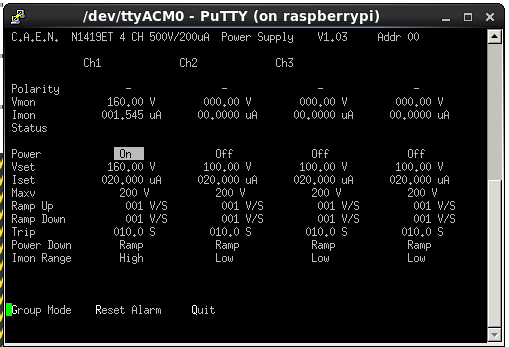
-160 V Bias applied and DSSD holds voltage with leakage current of around 1.3 uA (was dropping as only biased briefly)
Bias off and FEEs offline again now as day nearly done. MBS testing will be performed shortly, as well as resolution checks. |
Attachment 1: LeakageBias.png
|
|
5
|
Wed Sep 19 12:40:41 2018 |
OH, TD | Single DSSD Installation and Tests |
On the 18th of September we installed DSSD 3208-14
Was found to have problems including exponential leakage behavior
V Ic
-5 15.4uA
-10 53uA
-15 Tripped at over 100uA
Cables were double checked, bond wires were checked and no problems could be observed.
DSSD replaced with 3208-15
Bias at -100V Ic 10.2uA GP/grnd Jumpers removed,
rising upwards, possible short circuit as well.
Jumpers replaced
Bias -100V Ic 1.6uA
Bias -160V Ic 1.62uA
Possibility that mechanical sample 3208-17 and 3208-14 have been swapped. (To check at later date)
FEEs powered up and Adapter boards and all grounding installed with DSSD going to 9,10,11 and 12
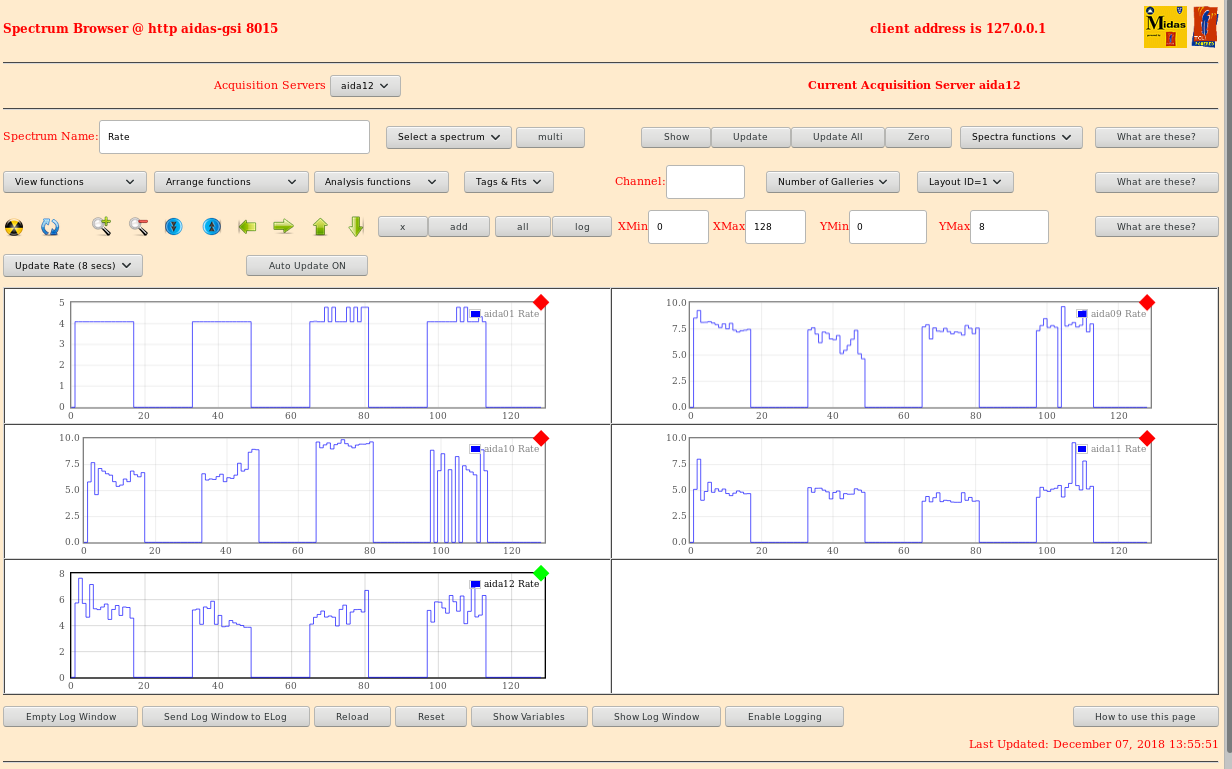
Rates shown - attachment 1
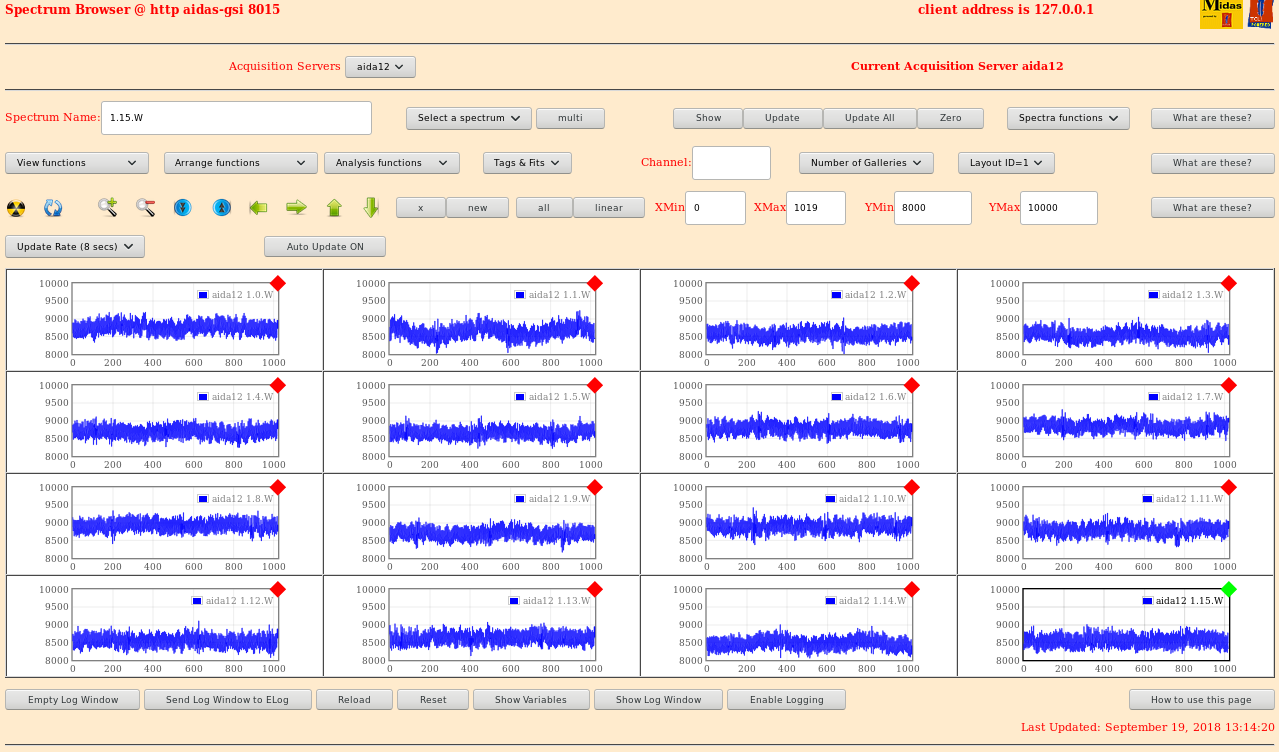
Waveforms - attachment 2-4
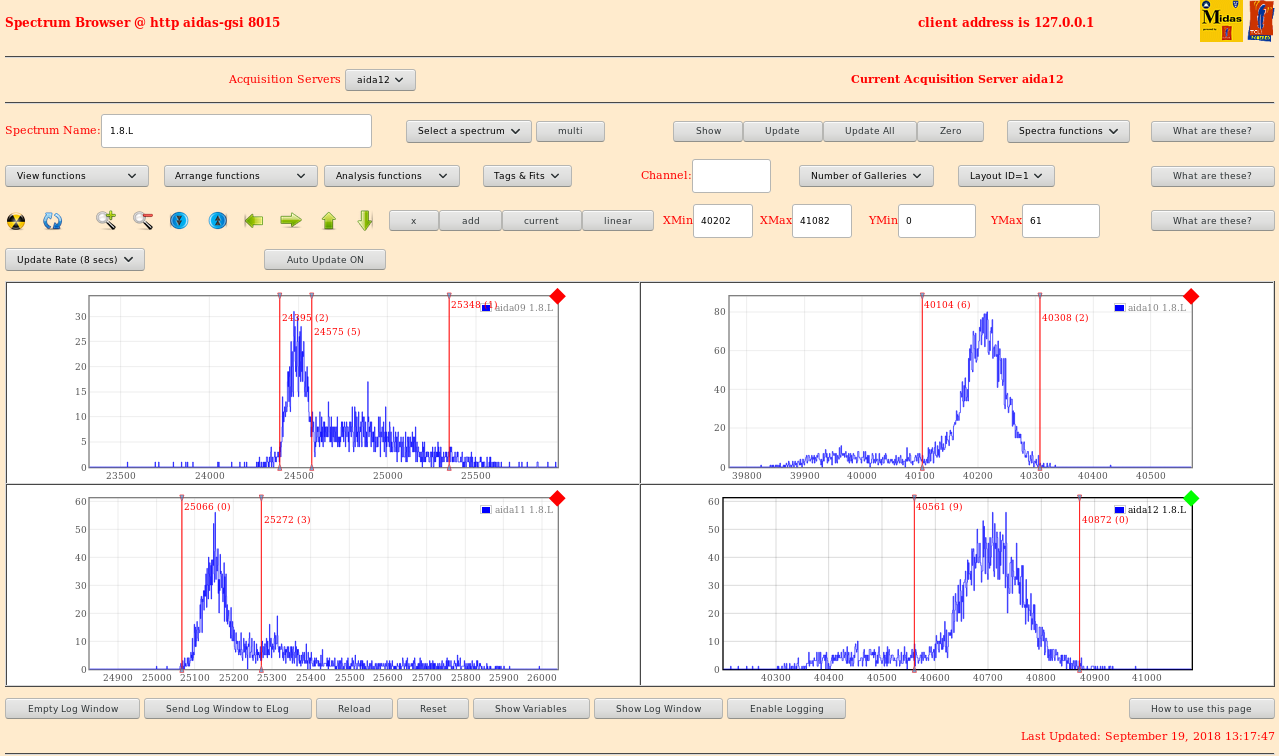
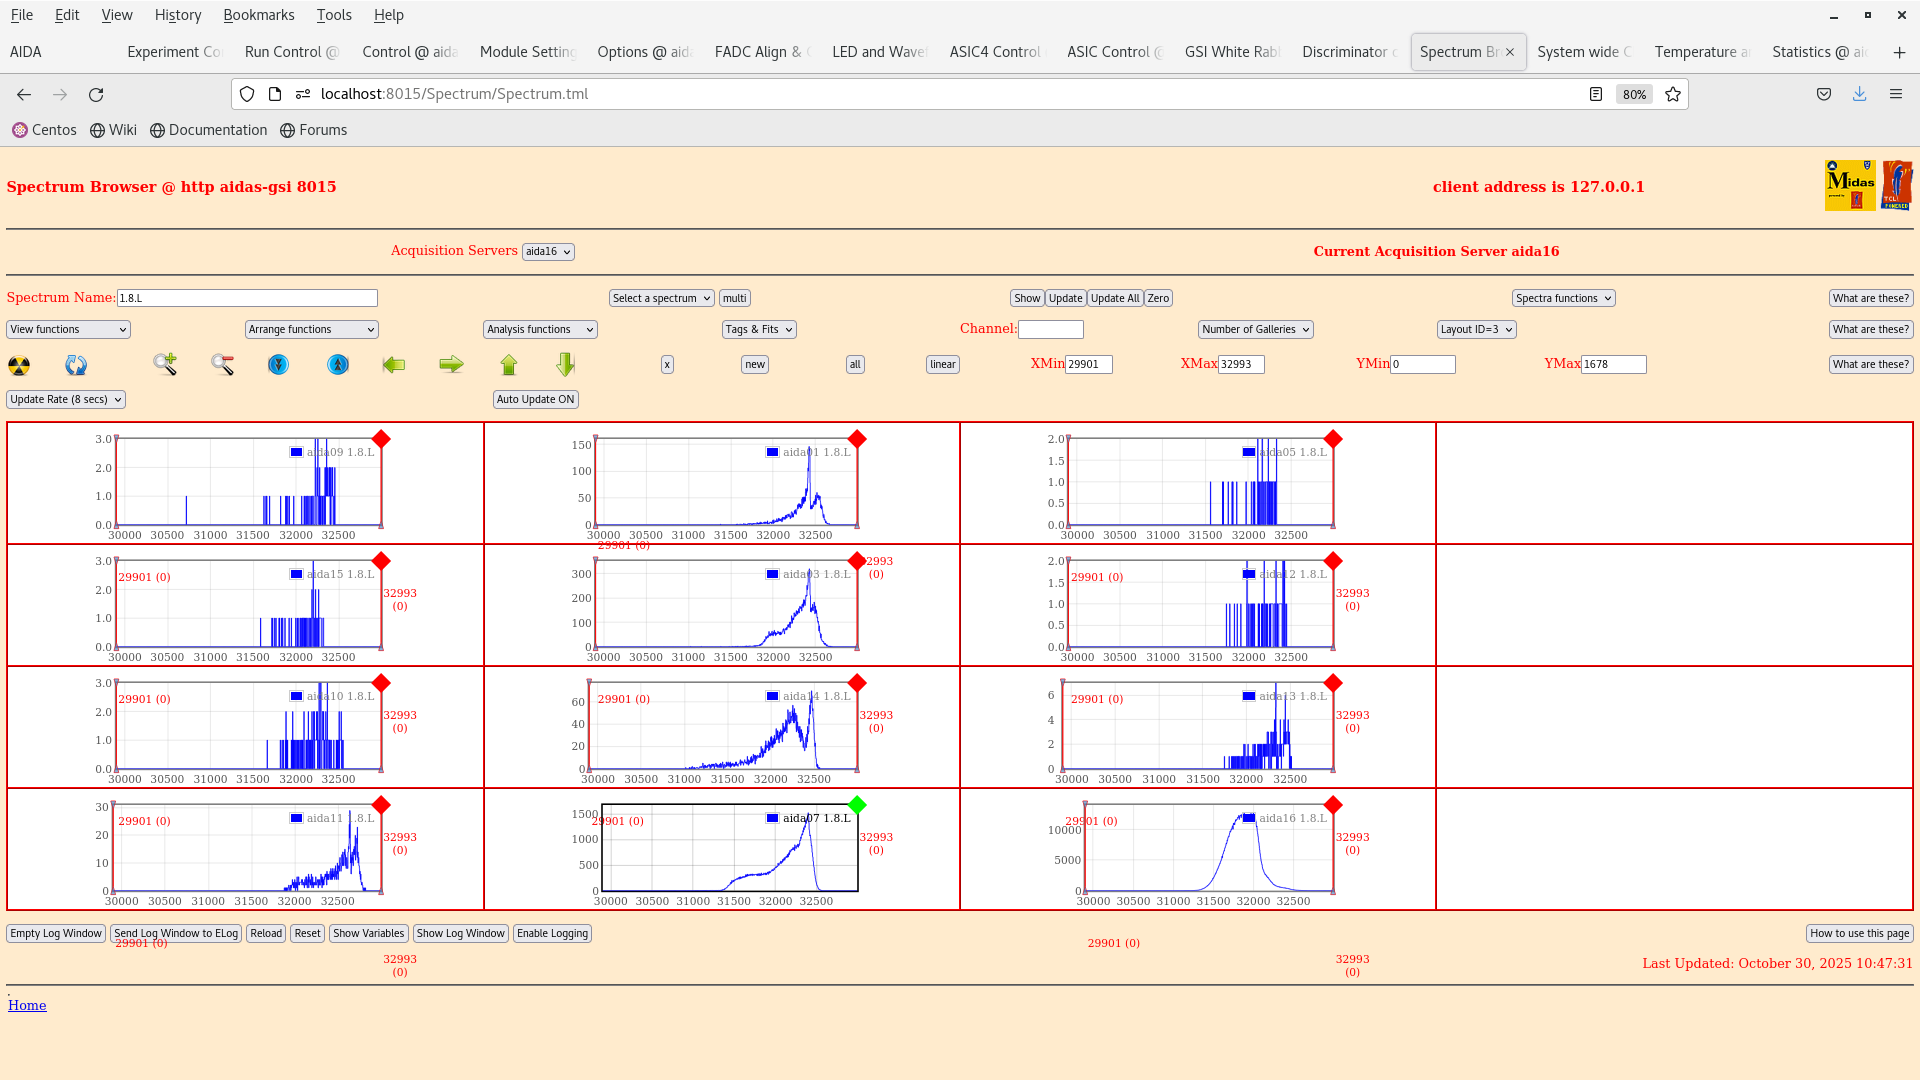
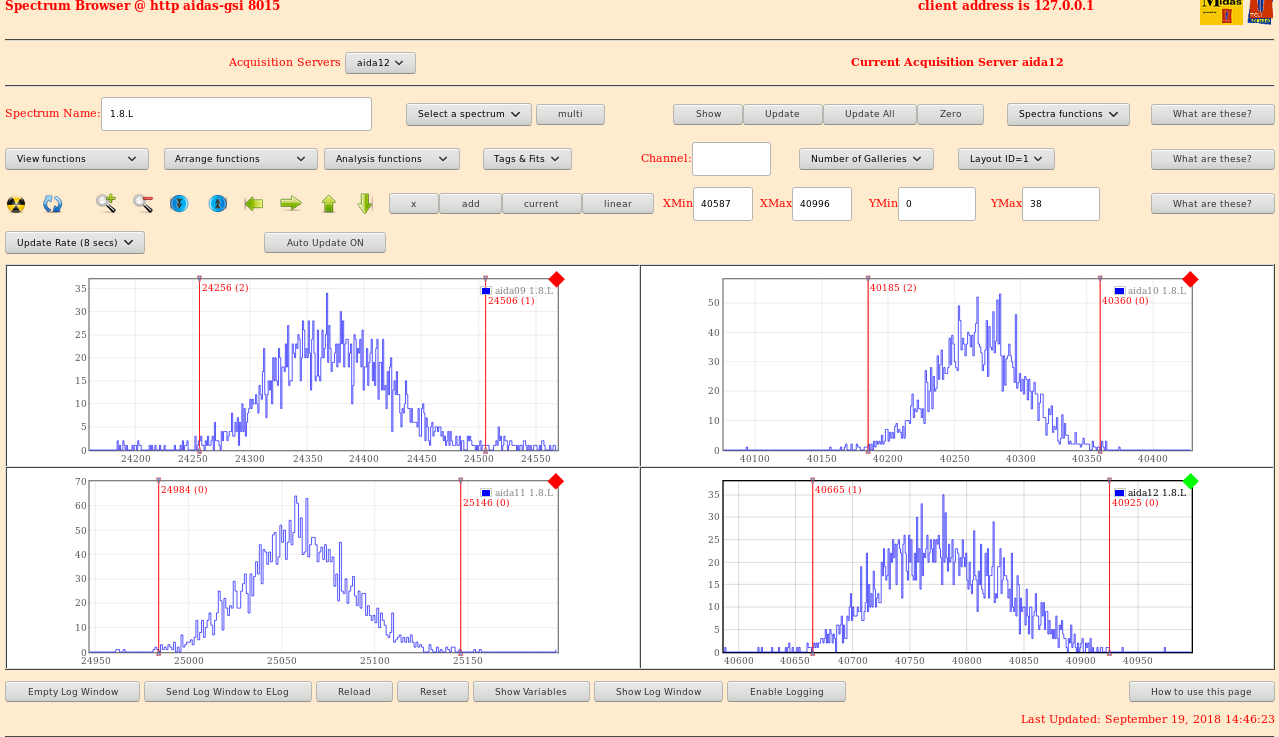
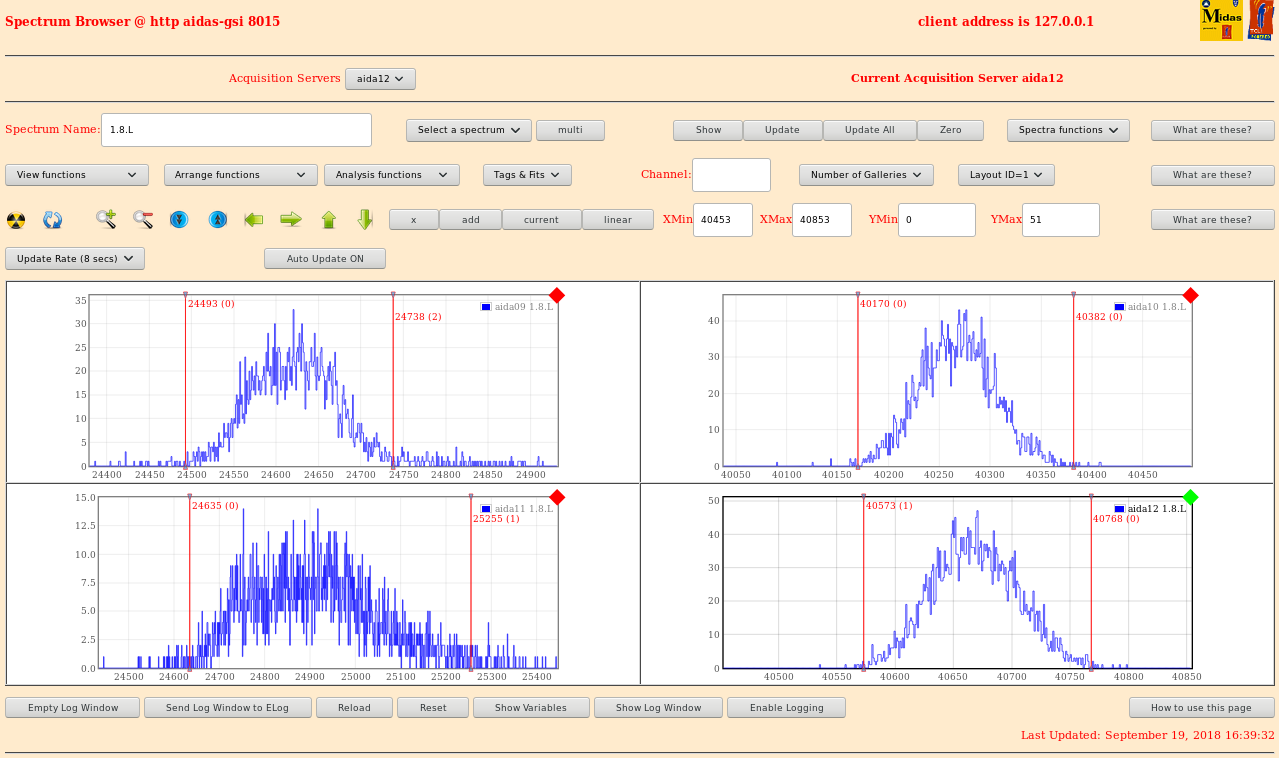
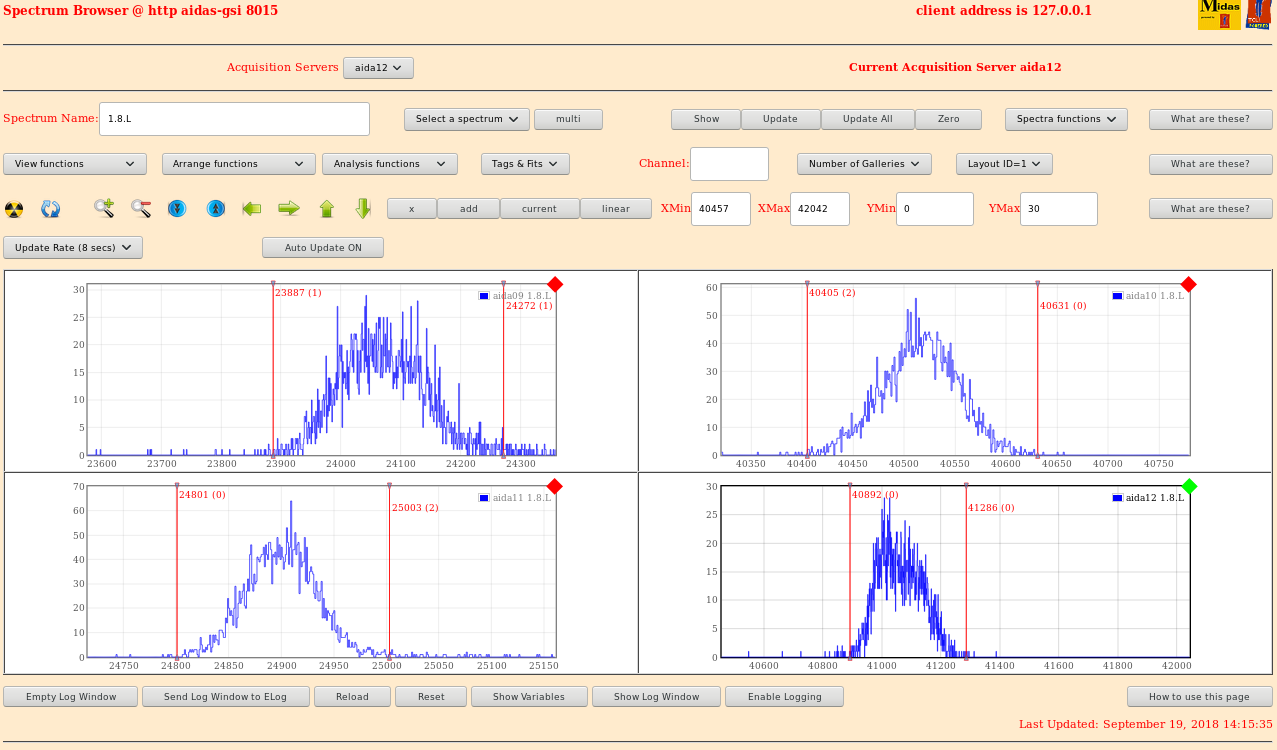
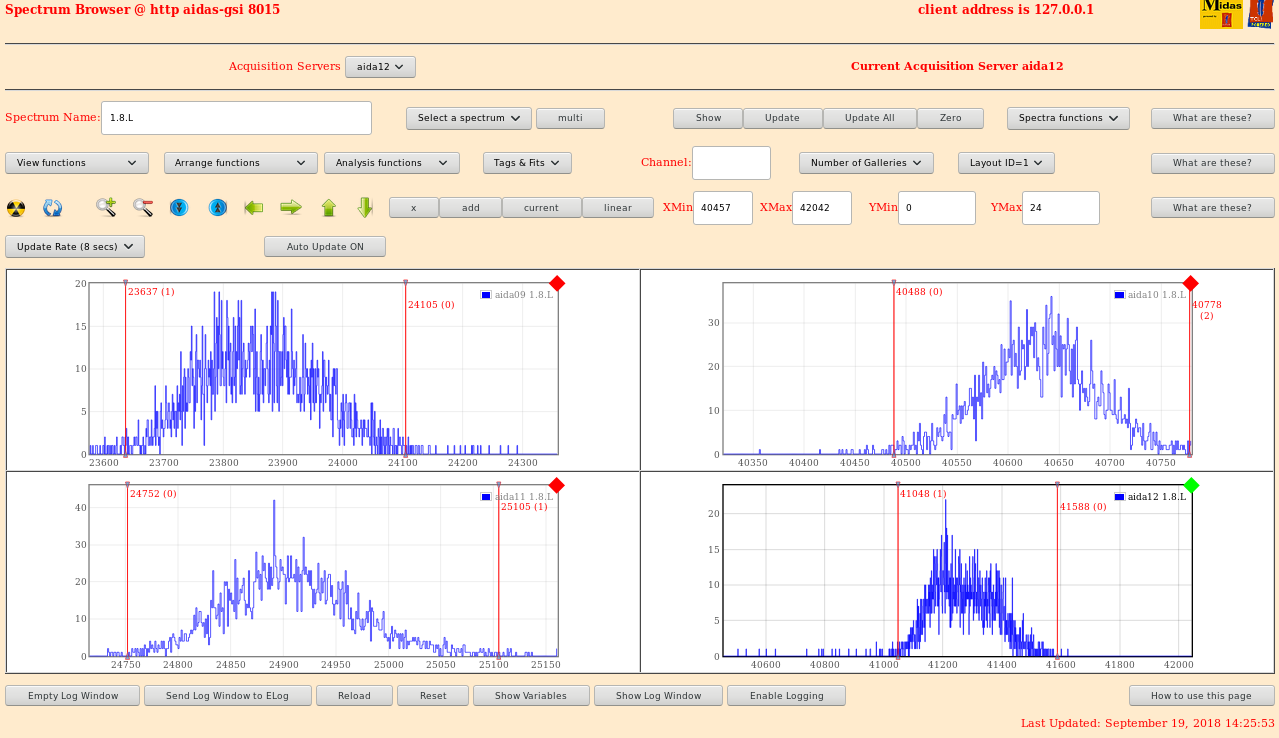
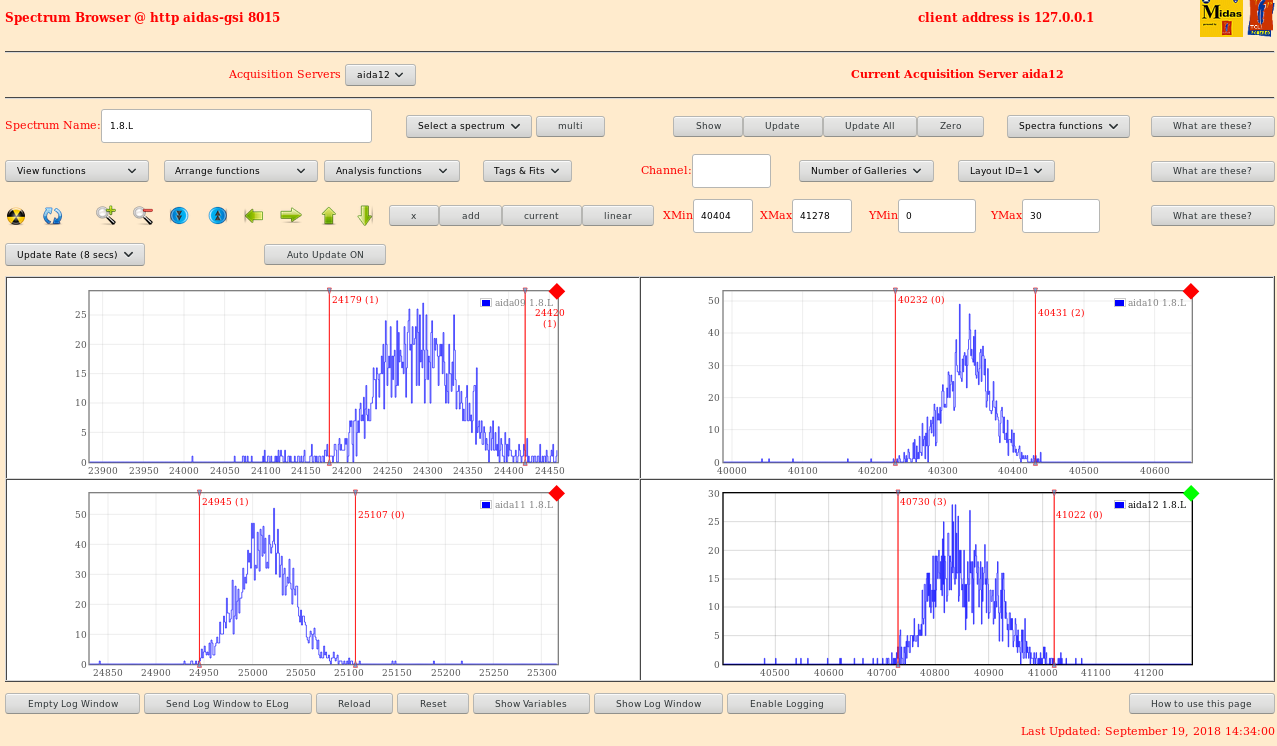
1.8.l Spectra - attachment 5
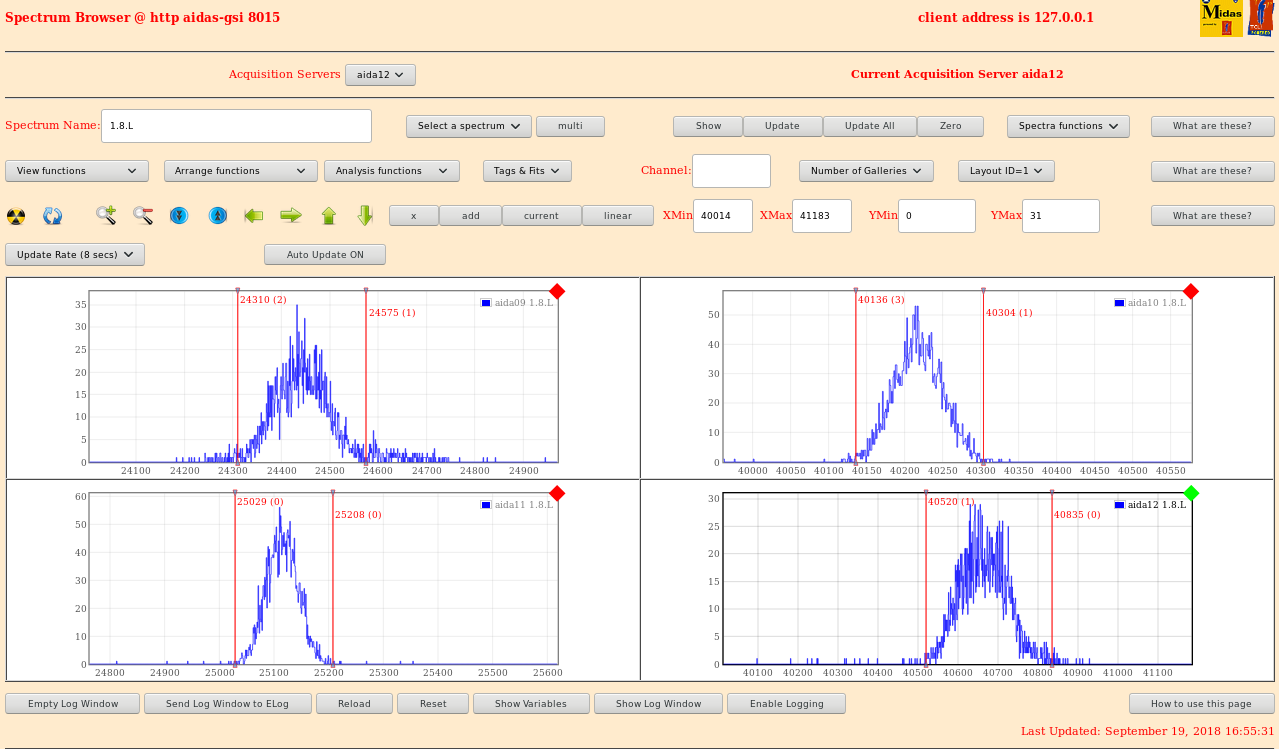
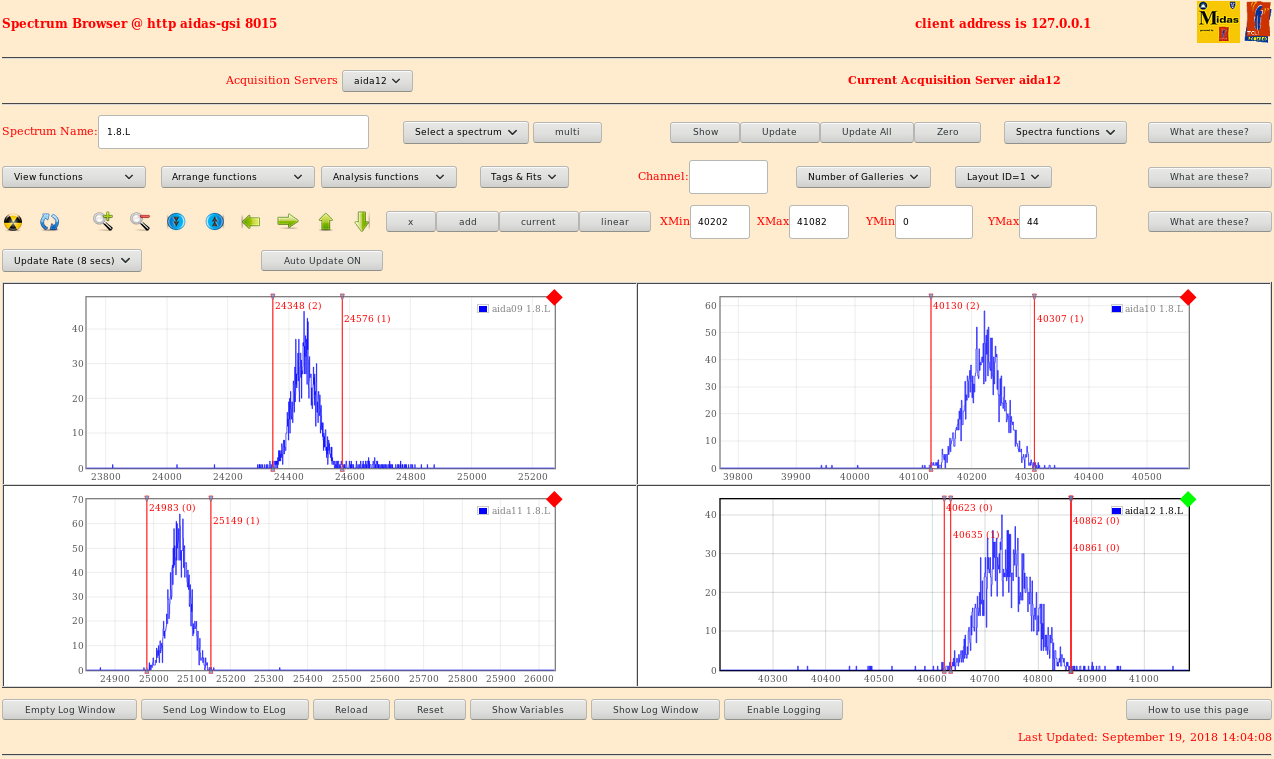
FEEs 10 and 11 around 60FWHM and 9 and 12 around 80-90FWHM
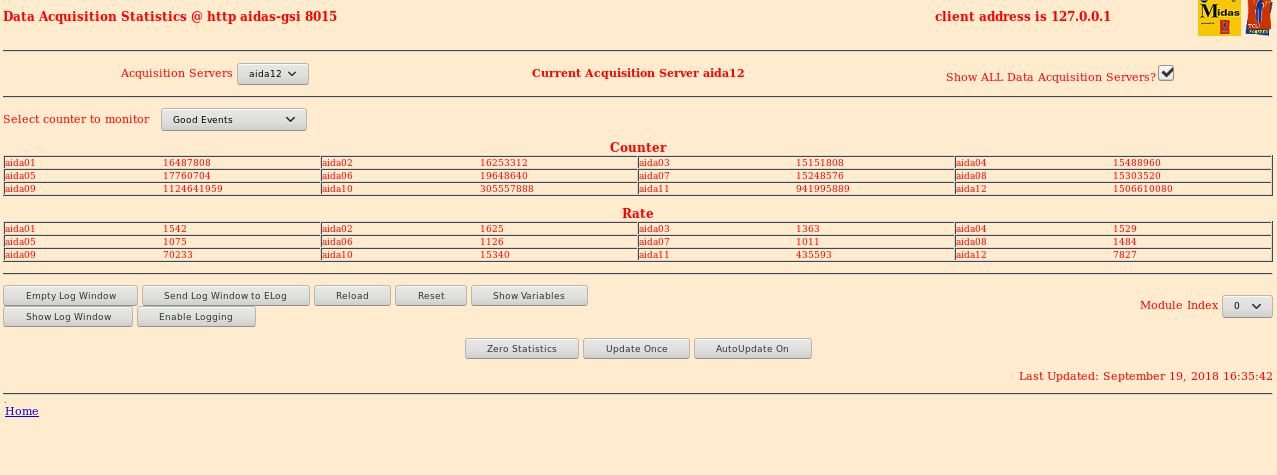
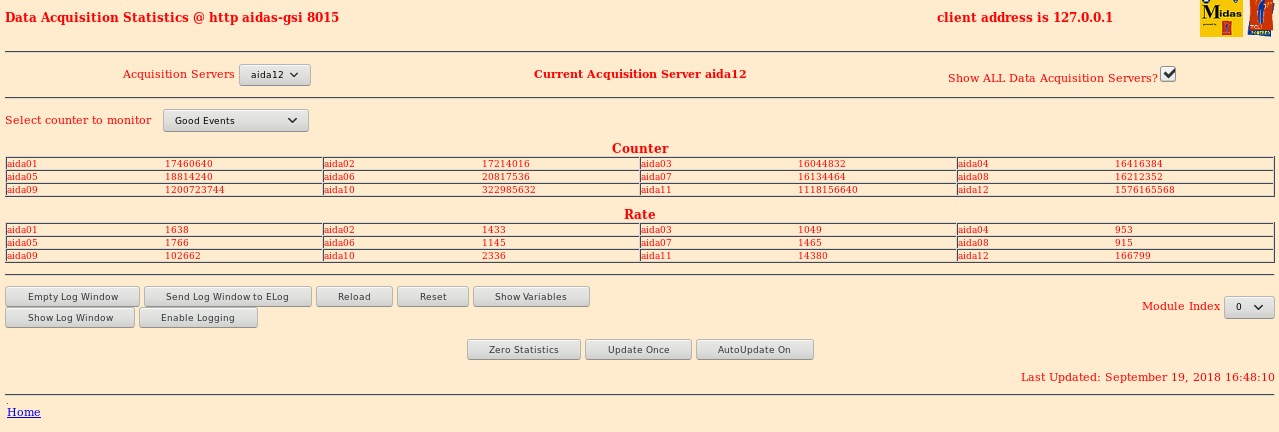
Stats page - attachment 6
Aluminium foil used to make sure all ports are light tight shows a stats drop of around half - attachment 8
New peak widths
aida09 - 79.65
aida10 - 67.37
aida11 - 59.99
aida12 - 97.83
Going to begin a systematic study of shaping time
FWHM
Shaping Time aida09 aida10 aida11 aida12
8 79.65 67.37 59.99 97.83
7 97.55 70.84 62.67 115.34
6 100.72 70.04 62.77 120.05
4 147.47 80.64 71.34 167.23
2 217.62 114.98 133.35 232.47
Shaping time 8us 1.8.L Shots
Shaping time 4us Stats appear obviously worse - attachment 7
1.8.L Widths - attachment 8
Shaping time 2us Stats appear worse again - attachment 9
1.8.L Widths - attachment 10
Shaping time 6us Stats are better than 2 and 4 - attachment 11
1.8.L widths - attachment 12
Shaping time 7us Stats are better than 6 - attachment 13
1.8.L widths - attachment 14
8us is the optimum shaping time.
Taken back to 8us and similar shaping times are observed.
Connected the ground of all 4 adapter boards with direct cables. Observed improvements in both FEEs 9 and 12
however the noise in 11 went
through the roof >500kHz - attachment 15
Tested just having 9,10 and 12 connected the rates are comparable to when disconnected - attachment 16
All 4 grounded together with a ground running to the snout as well stats No difference to all 4 together -
attachment 17
1.8.L Widths - attachment 17
aida09 104.76
aida10 84.58
aida11 281.77
aida12 82.58
Tested just having 10 and 12 directly connected. Same side of the DSSD: Noise is the same as when disconnected.
Stats - attachment 19
1.8.L spectra - attachment 20
aida09 107.13
aida10 67.02
aida11 66.78
aida12 131.51
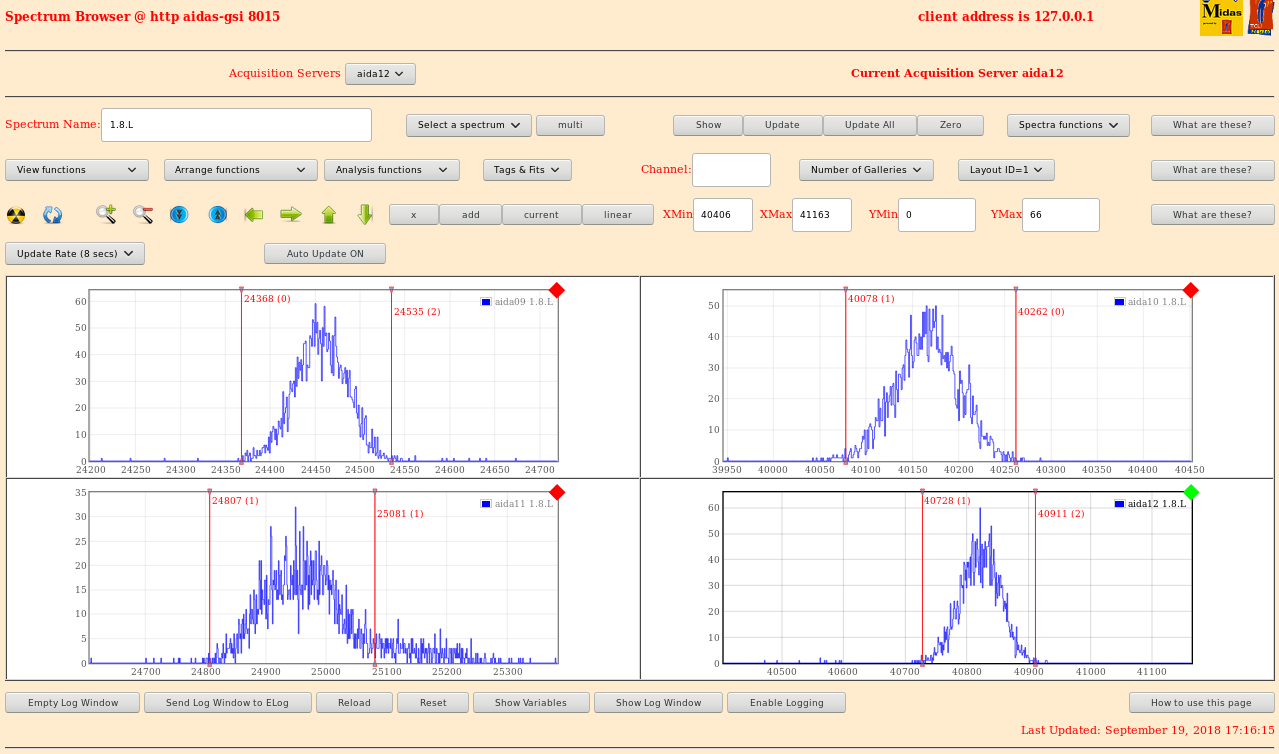
Tested having 11 and 12 connected directly. This is the two adapter boards responsible for the bias with 11
carrying the core and 12 the braid.
Massively reduced noise in 9 and 12, comparable noise in 10 but much more noise in 11. Stats - attachment 21
aida09 63.96
aida10 76.64
aida11 125.96
aida12 68.05
1.8.L spectra - attachment 23
18:39 Alpha run started in /TapeData/Sep18/R2
Writing at 96kb/s
11 Was fast at start bus asic control brought it down
|
Attachment 1: 180919_1447_7us_1_8_L.png
|
|
Attachment 2: 180919_1607_FEEsConnected.png
|
|
Attachment 3: 180919_1635_StatsSnoutGrnd.png
|
|
Attachment 4: 8_L_SnoutGround.png
|
|
Attachment 5: 180919_1648_12and10Connect_Stats.png
|
|
Attachment 6: 180919_1656_10and12_1_8_L.png
|
|
Attachment 7: 180919_1710_11and12_Stats.png
|
|
Attachment 8: 180919_1717_11and12_1_8_L.png
|
|
Attachment 9: 180919_1310_Rate.png
|
|
Attachment 10: 180919_1312_aida10W.png
|
|
Attachment 11: 180919_1312_aida11W.png
|
|
Attachment 12: 180919_1314_aida12W.png
|
|
Attachment 13: 8_L.png
|
|
Attachment 14: 180919_1324_8usStats.png
|
|
Attachment 15: 180919_1346_4usStats.png
|
|
Attachment 16: 180919_1404_8us_1_8_L.png
|
|
Attachment 17: 180919_1416_4us_1_8_L.png
|
|
Attachment 18: 180919_1419_2usStats.png
|
|
Attachment 19: 180919_1426_2us_1_8_L.png
|
|
Attachment 20: 180919_1429_6usStats.png
|
|
Attachment 21: 180919_1438_6us_1_8_L.png
|
|
417
|
Mon May 2 09:52:20 2022 |
OH | Shifter checklist 2022 |
Every 30 minutes:
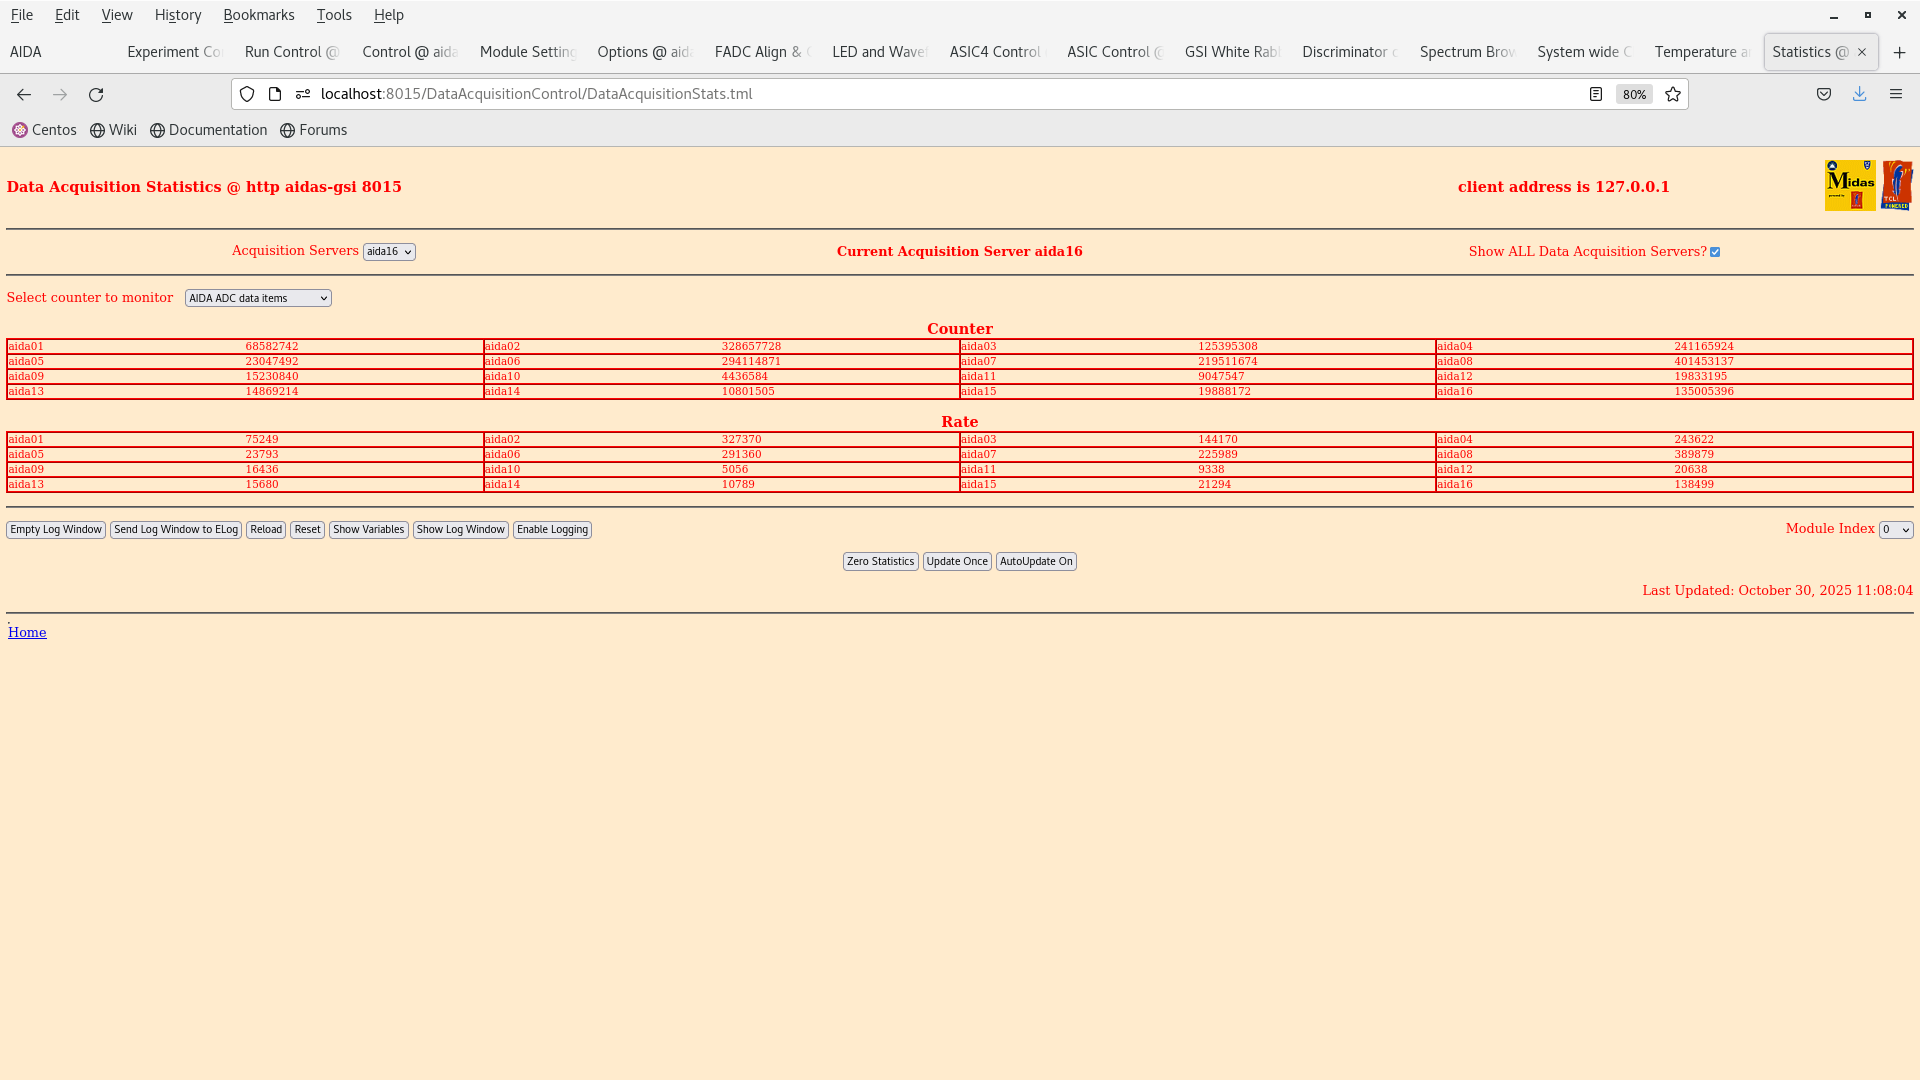
- Reload statistics (Web browser tab screen 1, workspace 3)
- Are all FEEs still showing a rate?
- If one shows 0 after multiple reloads Call Oscar or Tom.
- IGNORE FOR TIME BEING Options database monitor (Top middle terminal screen 2, workspace 3)
- Has the message changed since the last check?
- If so copy the message and place in elog
- Do the ucesb scalers make sense? (Web browser, screen 2, workspace 5)
- If one DSSD is reporting kHz of implants when the others are much less it is likely an ASIC getting stuck.
- Perform and ASIC check (ASIC control tab, web browser, screen 1, workspace 3)
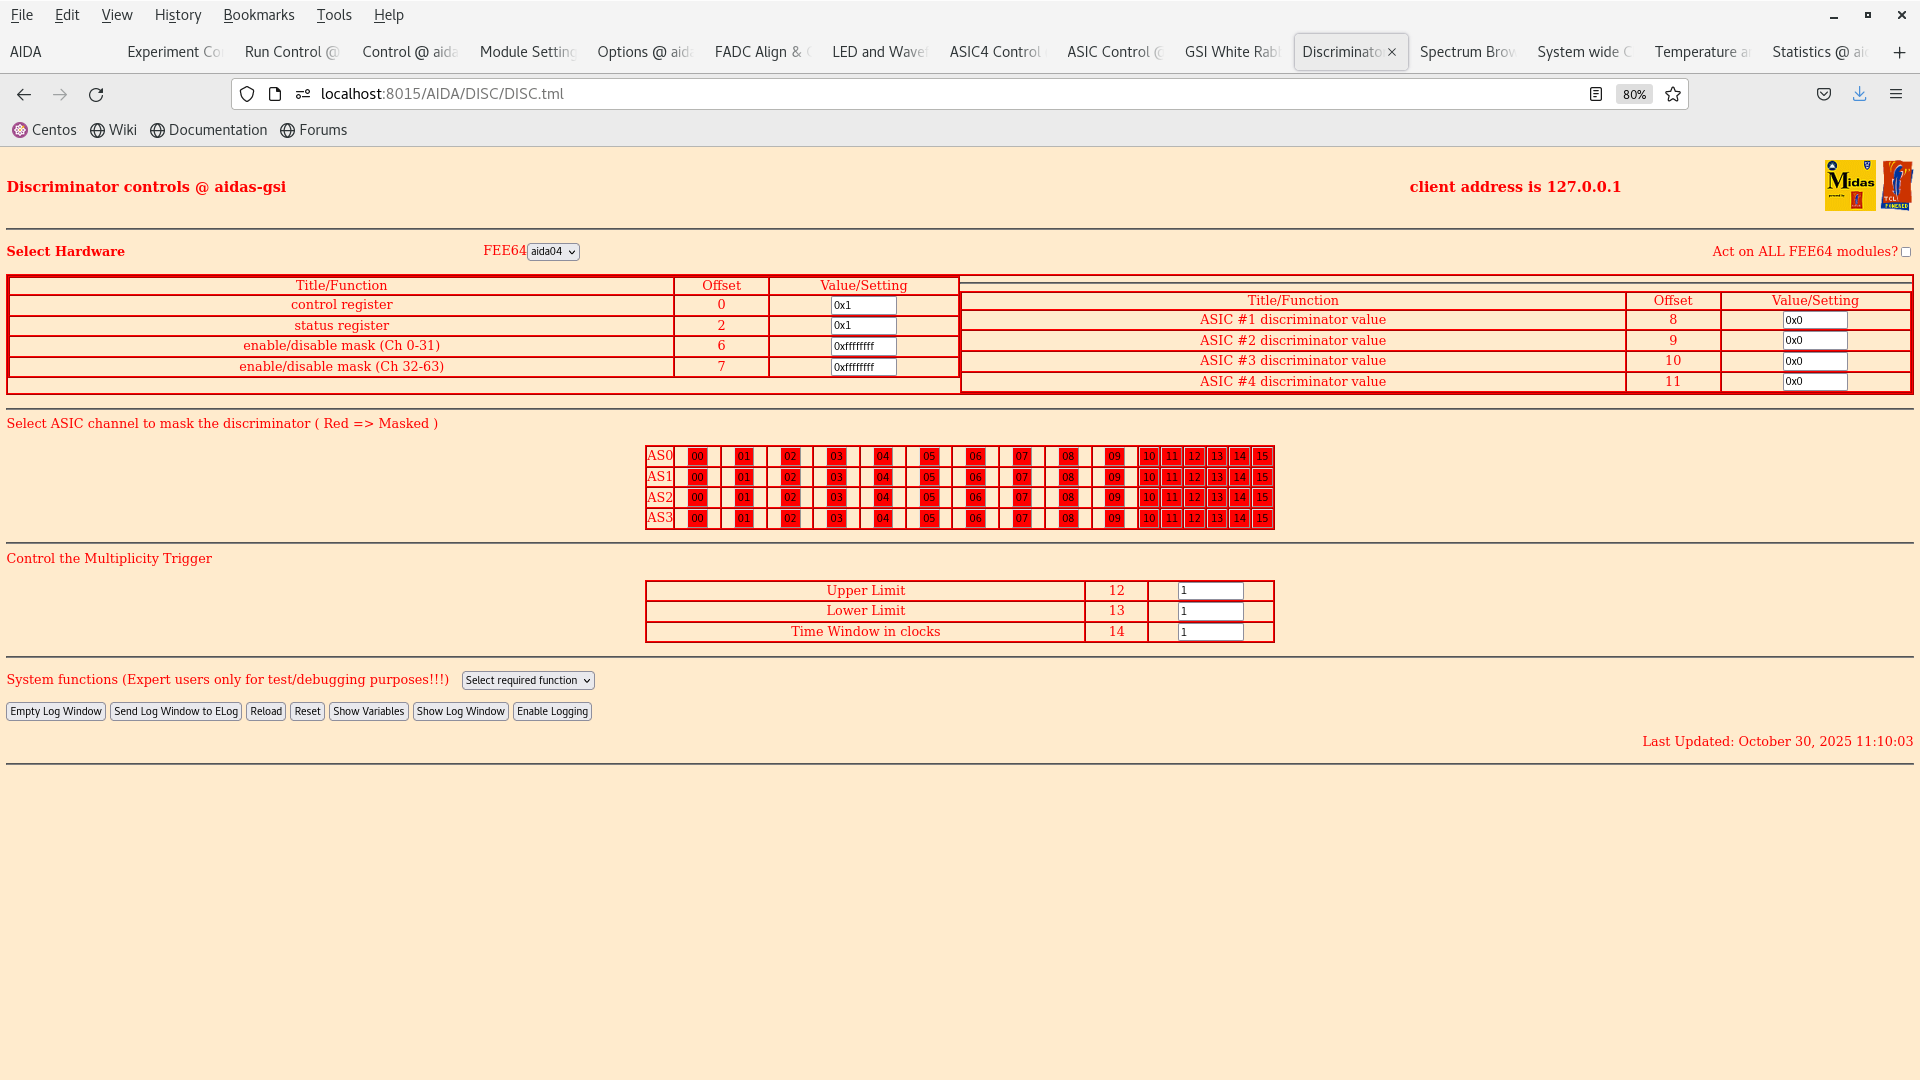
- Ensure "Act on all FEE" and "Act on all asic" selected
- Click on drop down menu in the bottom of the screen and select check ASIC control
- It will take a minute or so be patient (MIDAS can only respond to one command at once so don't try to do anything else)
- A pop up will appear check that all options say ok
- Has the implant rate gone to a more normal amount?
- If not feel free to call
Every two hours:
- Take a screenshot of the statistics page (Web browser tab screen 1, workspace 3)
- Compare to the previous screenshot to check if anything has drastically changed
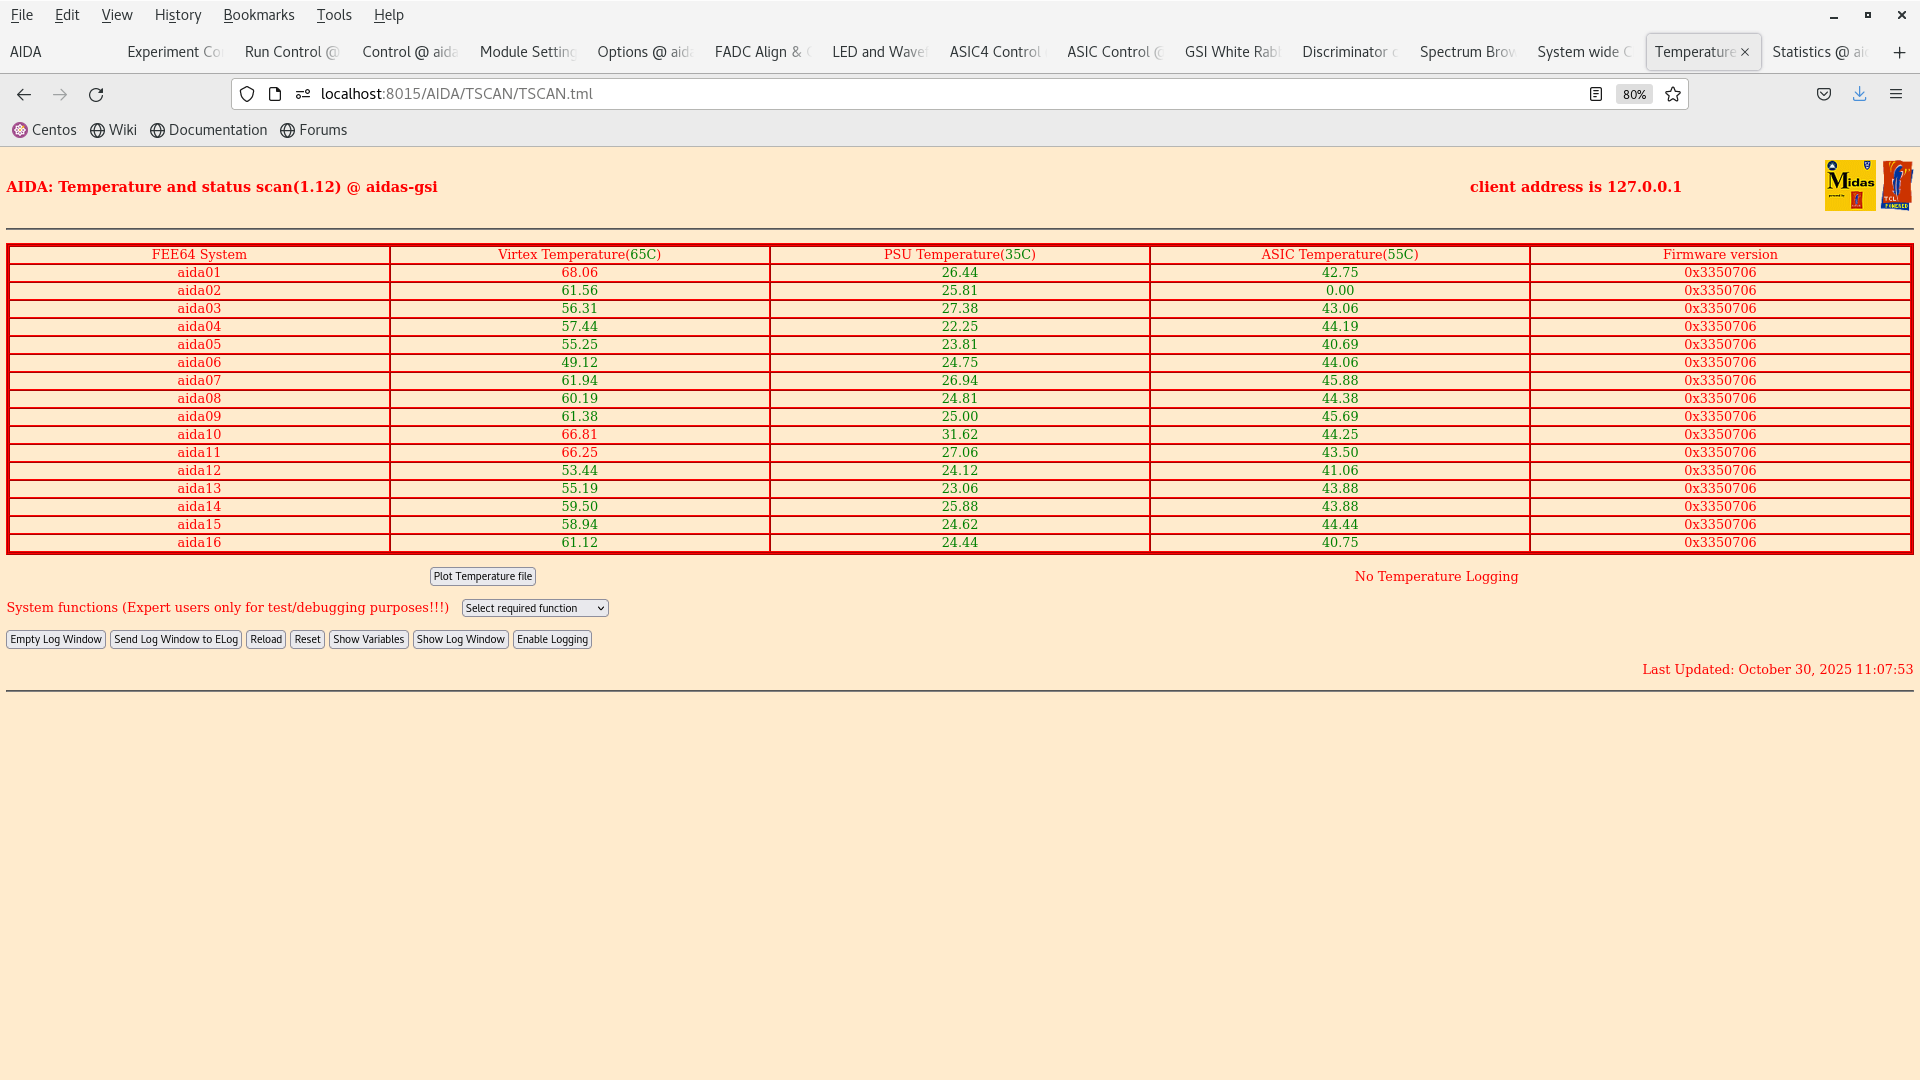
- Take a screenshot of the temperatures (Web browser tab screen 1, workspace 3)
- Do they all appear stable?
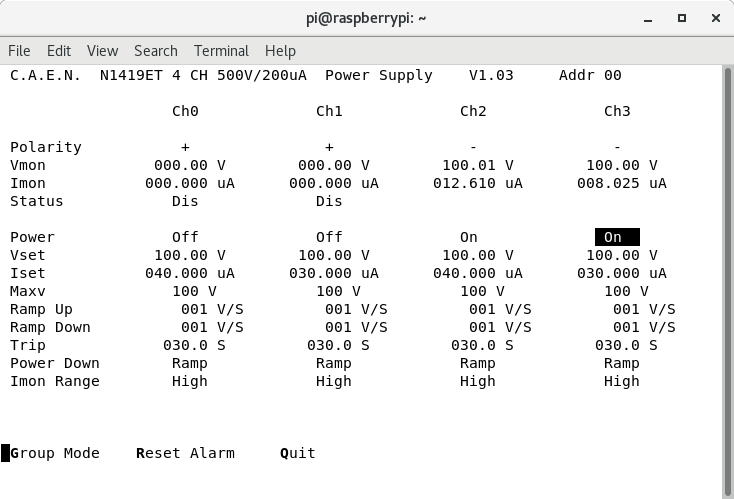
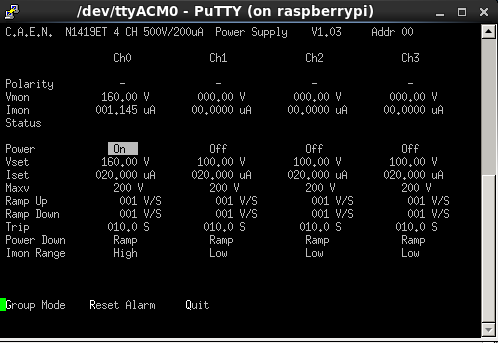
- Take a screenshot of the bias and leakage currents - (Top left terminal, screen 2, workspace 3)
- Perform the five system wide checks (Web browser tab screen 1, workspace 3)
- Ignore the system wide checks for ADC calibration (ADCs are turned off so they will all fail)
- Check memory information also fails.
- Make a note in the elog of which tests are successful
- If failed copy the text from the white box into the elog and make a note of it
- Enter the screenshots into the elog
- Update the leakage current spreadsheet (Web browser, screen 2, workspace 5) |
230
|
Fri Apr 16 11:42:45 2021 |
OH | Shifter checklist |
Every 30 minutes:
- Reload statistics (Web browser tab screen 1, workspace 2)
- Are all FEEs still showing a rate?
- If one shows 0 after multiple reloads Call Oscar or Tom.
- Options database monitor (Top middle terminal screen 2, workspace 2)
- Has the message changed since the last check?
- If so copy the message and place in elog
- Do the ucesb scalers make sense? (Web browser, screen 2, workspace 4)
- If one DSSD is reporting kHz of implants when the others are much less it is likely an ASIC getting stuck.
- Perform and ASIC check (ASIC control tab, web browser, screen 1, workspace 2)
- Ensure "Act on all FEE" and "Act on all asic" selected
- Click on drop down menu in the bottom of the screen and select check ASIC control
- It will take a minute or so be patient (MIDAS can only respond to one command at once so don't try to do anything else)
- A pop up will appear check that all options say ok
- Has the implant rate gone to a more normal amount?
- If not feel free to call
Every two hours:
- Take a screenshot of the statistics page (Web browser tab screen 1, workspace 2)
- Compare to the previous screenshot to check if anything has drastically changed
- Take a screenshot of the temperatures (Web browser tab screen 1, workspace 2)
- Do they all appear stable?
- Take a screenshot of the bias and leakage currents - (Top left terminal, screen 2, workspace 2)
- Perform the five system wide checks (Web browser tab screen 1, workspace 2)
- Make a note in the elog of which tests are successful
- If failed copy the text from the white box into the elog and make a note of it
- Enter the screenshots into the elog
- Update the leakage current spreadsheet (Web browser, screen 2, workspace 4) |
446
|
Sat May 14 03:14:00 2022 |
PP | Shift Checks |
4:13
AIDA stats OK
Leakage current OK
Temperatures OK
grafana OK
ucesb rates OK
System wide check done and same results as earlier: aida09 fails clock (1), aida02 06 09 10 13 fail ADC calibration, all pass WR
Screenshot 1: statistics
Screenshot 2: temperatures
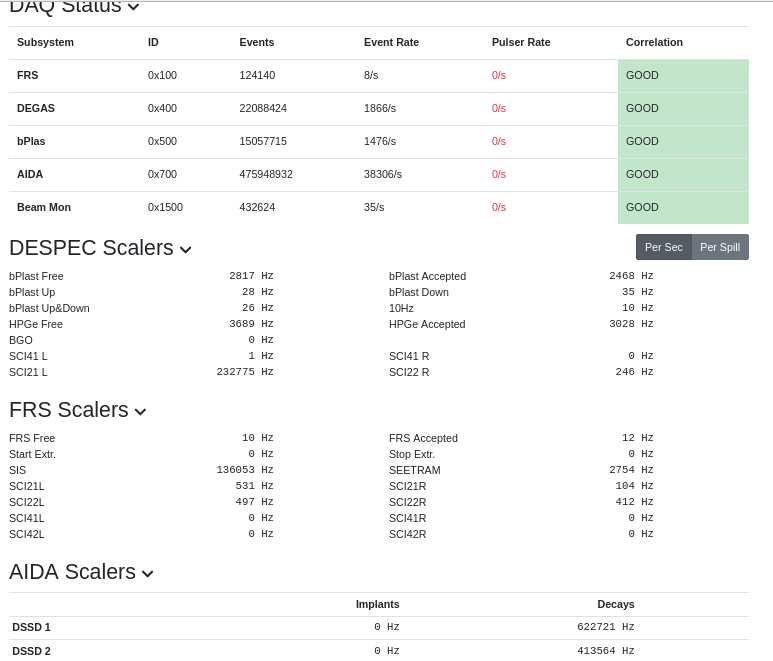
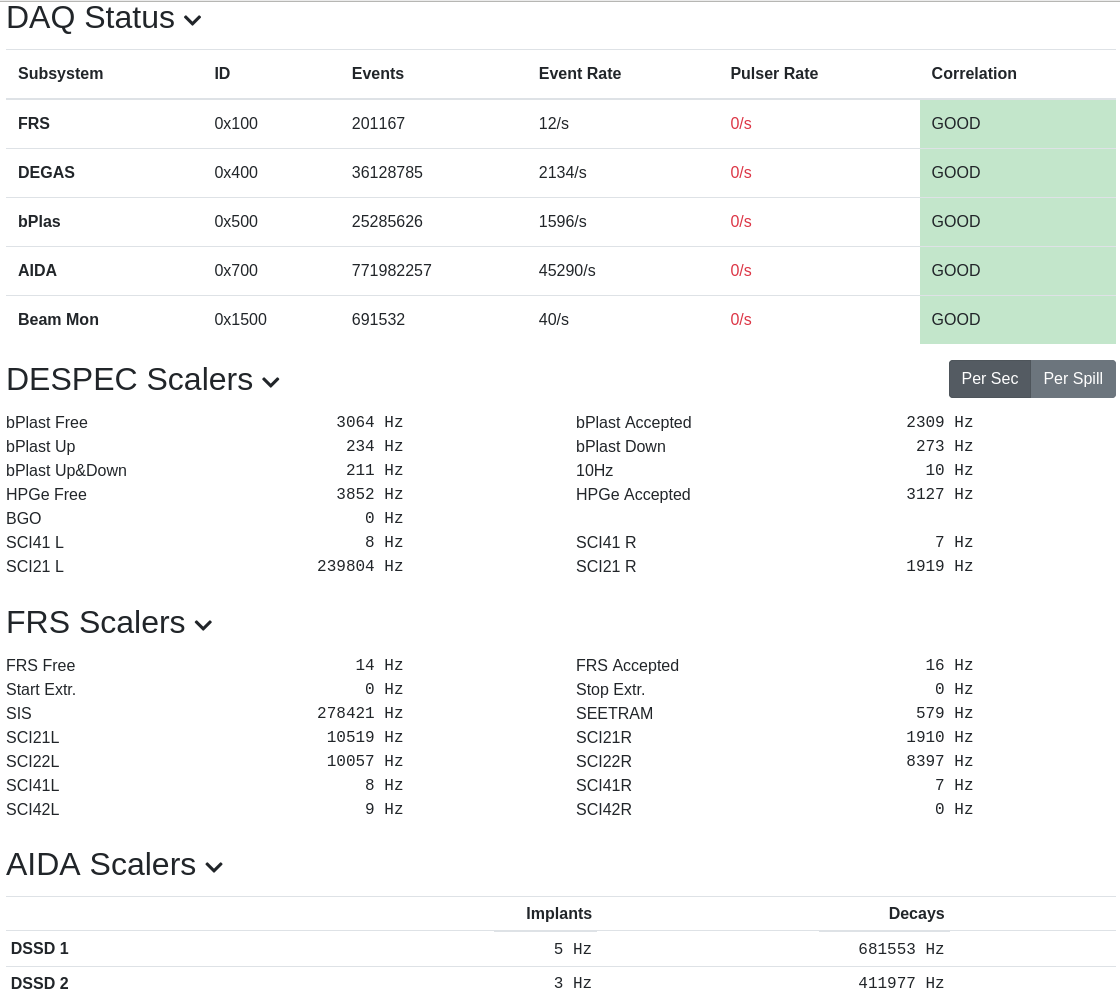
Screenshot 3: scalers
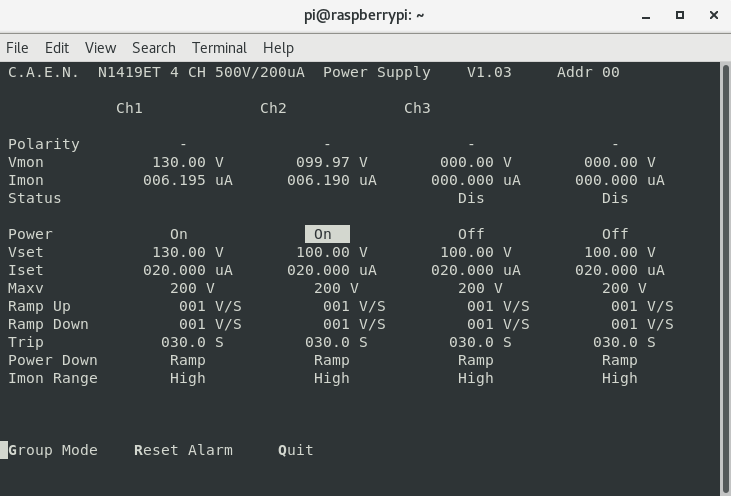
Screenshot 4: Bias and leakage current
6:36
AIDA stats OK
Leakage current OK
Temperatures OK
grafana OK
ucesb rates OK
System wide check done and same results as earlier: aida09 fails clock (1), aida02 06 09 10 13 fail ADC calibration, all pass WR
Screenshot 5: statistics
Screenshot 6: temperatures
Screenshot 7: scalers
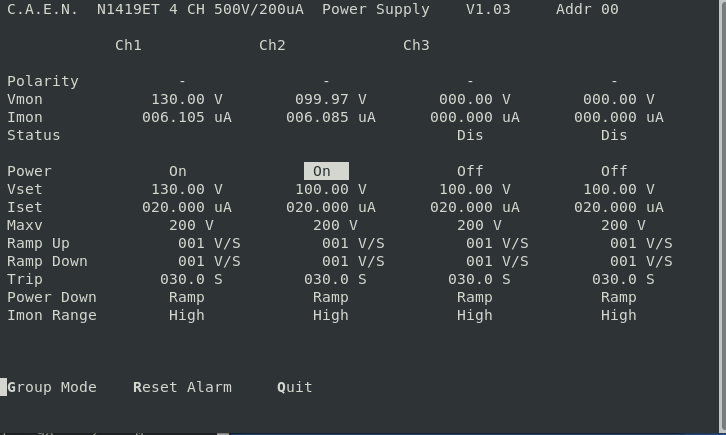
Screenshot 8: Bias and leakage current
|
Attachment 1: stats-220514-0428.png
|
|
Attachment 2: temps-220514-0417.png
|
|
Attachment 3: scalers-220514-0426.png
|
|
Attachment 4: I-V-220514-0431.png
|
|
Attachment 5: stats-220514-0639.png
|
|
Attachment 6: temps-220514-0639.png
|
|
Attachment 7: scalers-220514-0641.png
|
|
Attachment 8: I-V-220514-0640.png
|
|
712
|
Wed Jul 23 13:59:37 2025 |
CC, NK | Shielding of the snout |
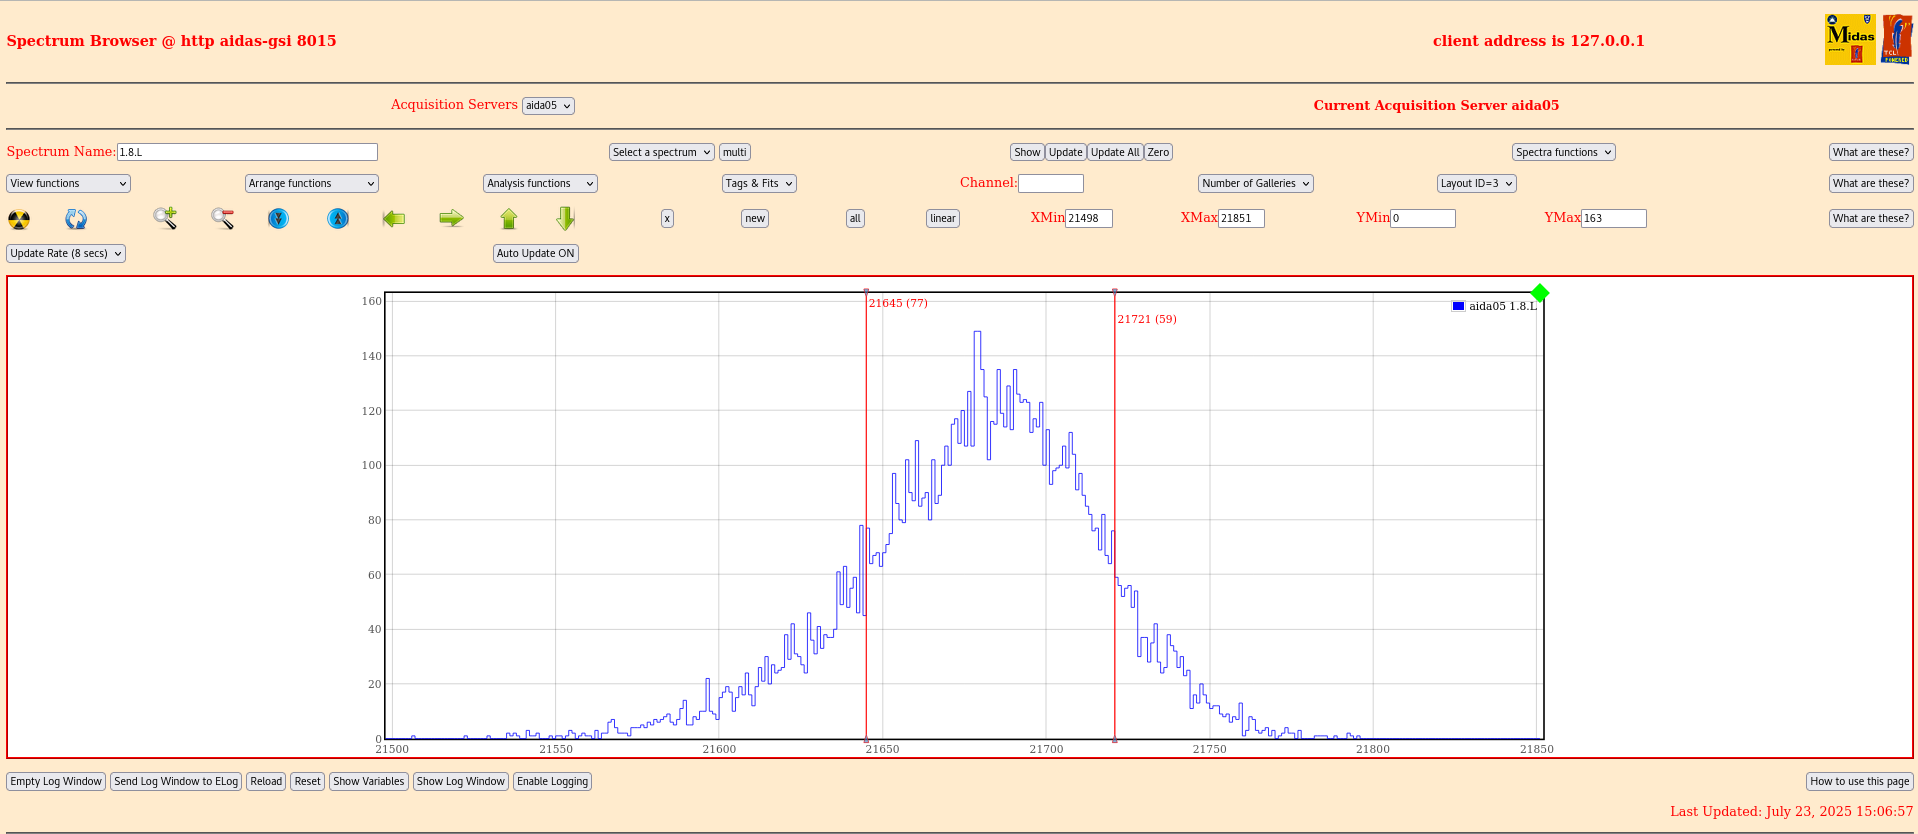
Attachment1: AIDA05.1.8L when AIDA05 connected, biased at 100 V with not-shielded cables, CAEN HT, after the base of the snout (screws) has been connected to the ground via cupper sheets
FWHM: 76 channels (to be compared with the 2 previous elogs 73 channels and 75 channels)
Conclusion: no differences can be observed. |
Attachment 1: Screenshot_from_2025-07-23_15-07-42.png
|
|
14
|
Mon Dec 10 11:09:53 2018 |
CA, TD | Scintillator pictures/system checks for 07.12.18 |
11.12 System wide checks ok (attachment 1)
FEE temperatures ok (attachment 2)
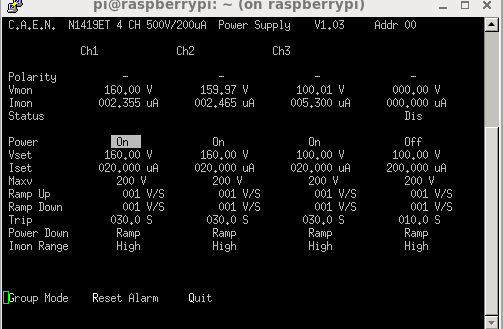
bias/leakage currents ok (attachment 3)
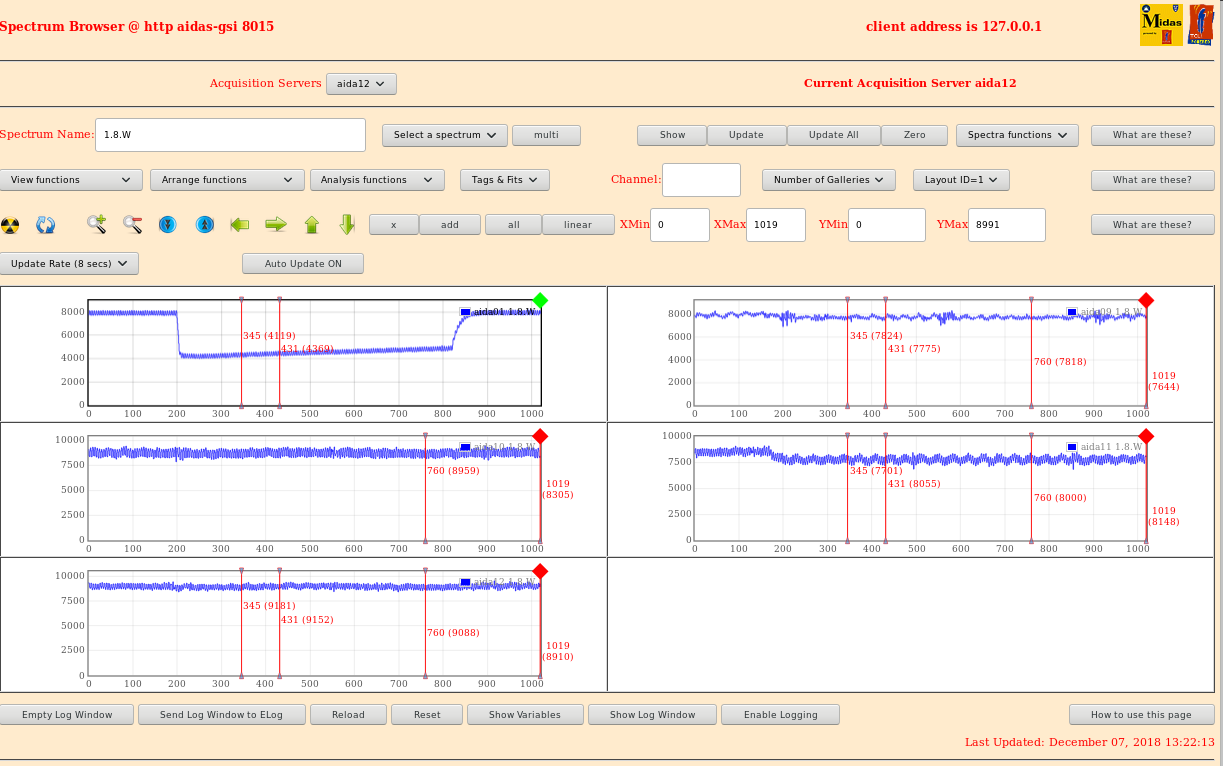
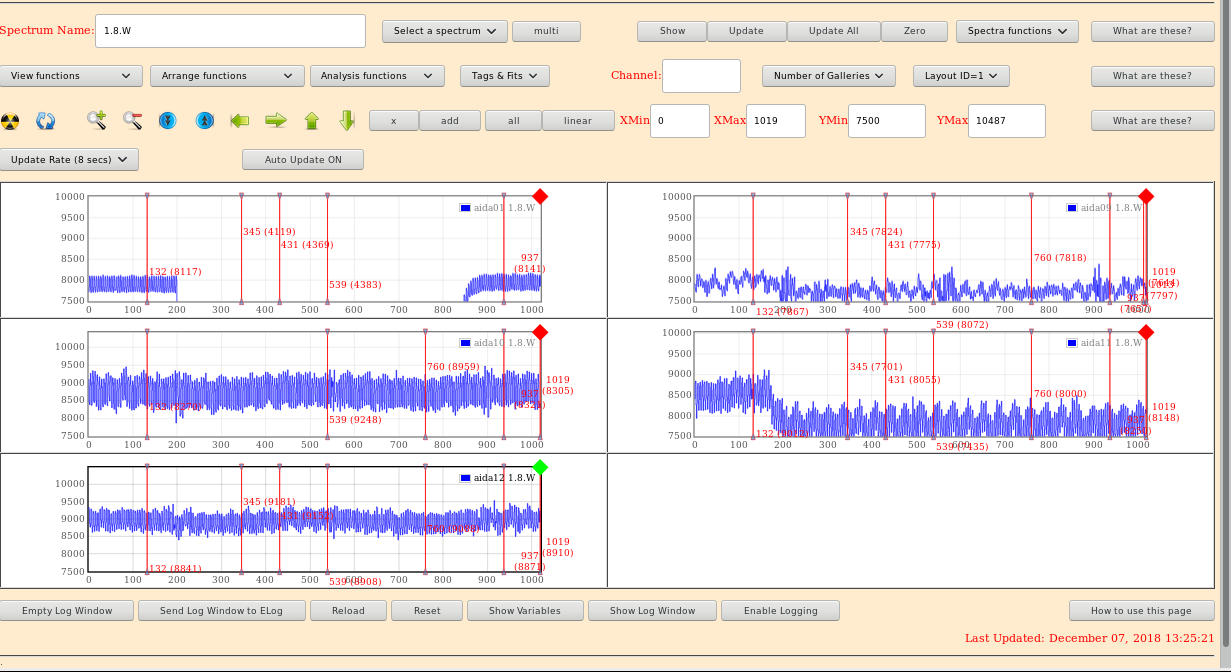
11.13 1.8.W spectra for naida 1,9,10,11,12 (attachment 4)
1.8.W spectra expanded in Y direction (attachment 5)
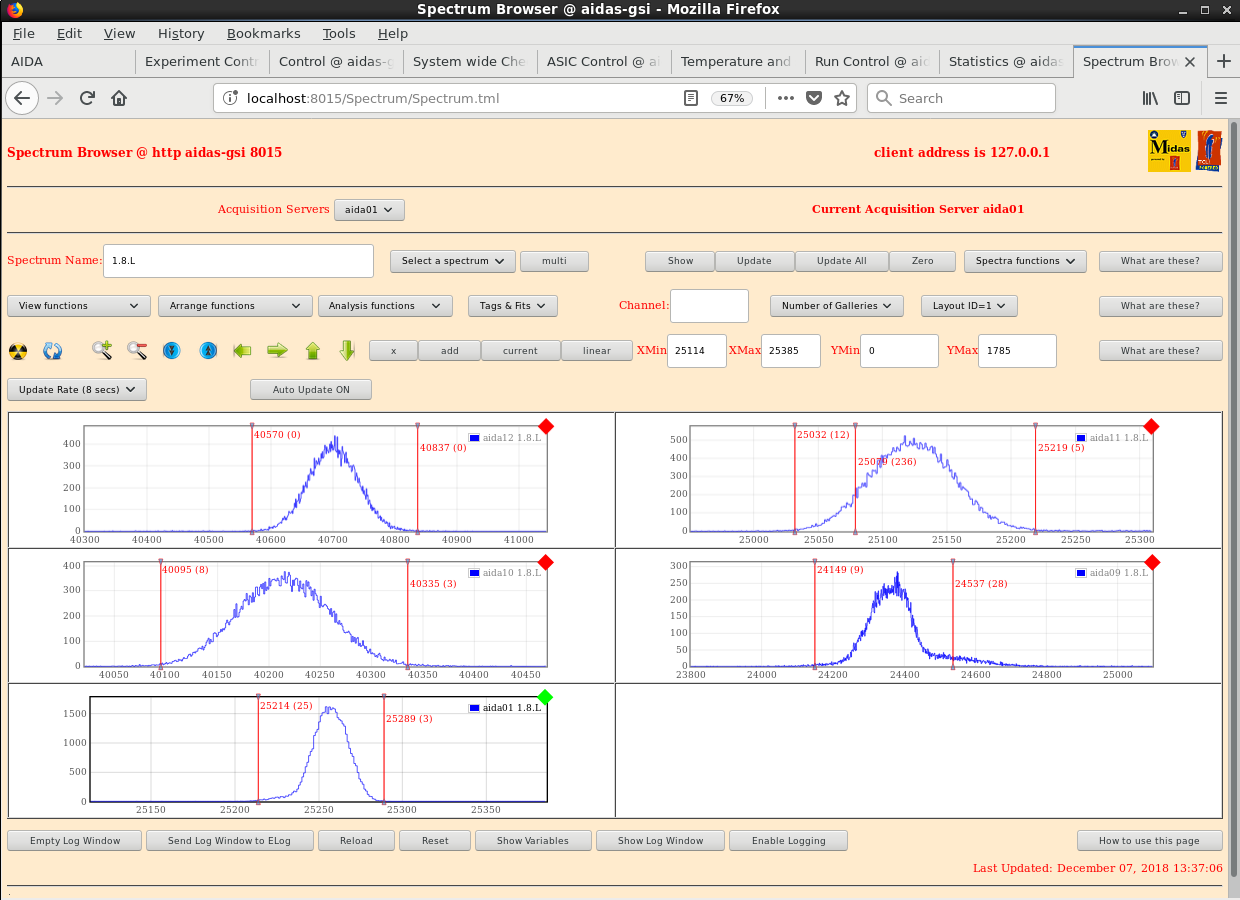
pulser peaks (attachment 6)
11.20 pulser peak widths:
Aida10 -> 98.82
Aida09 -> 109.17
Aida11 -> 71.72
Aida12 -> 92.82
Aida01 -> 24.05
11.23 hit rates (attachment 7)
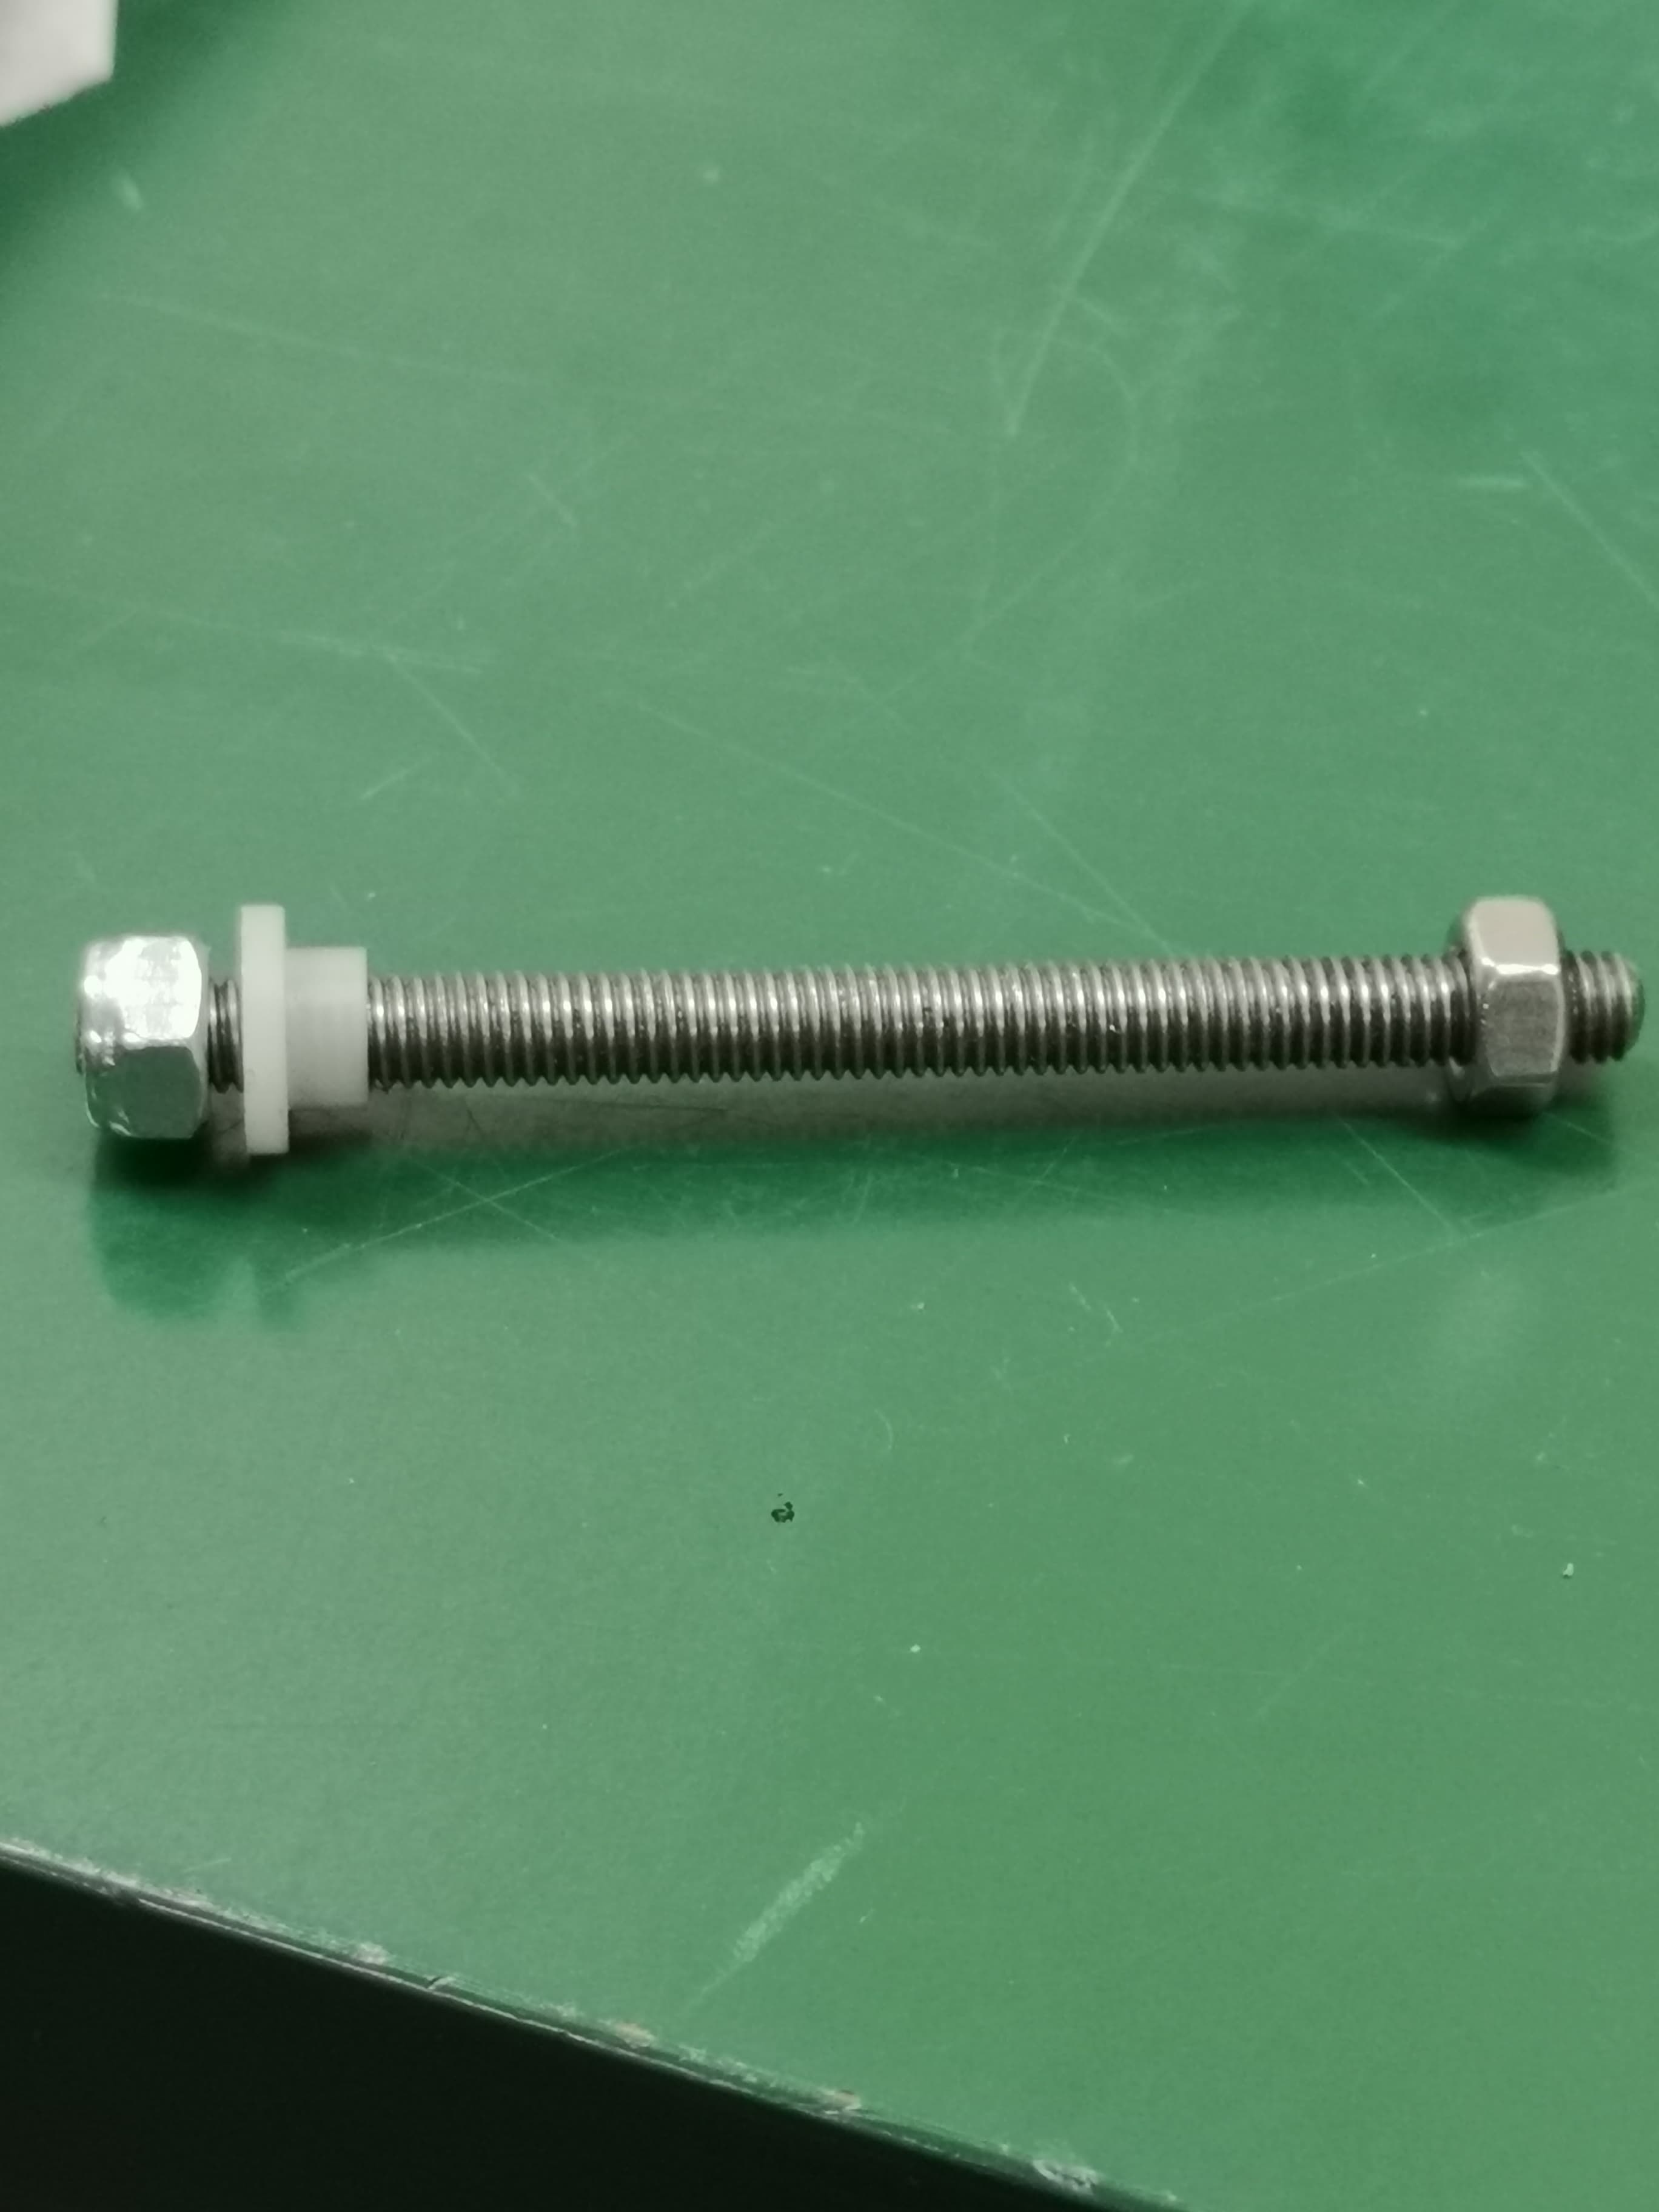
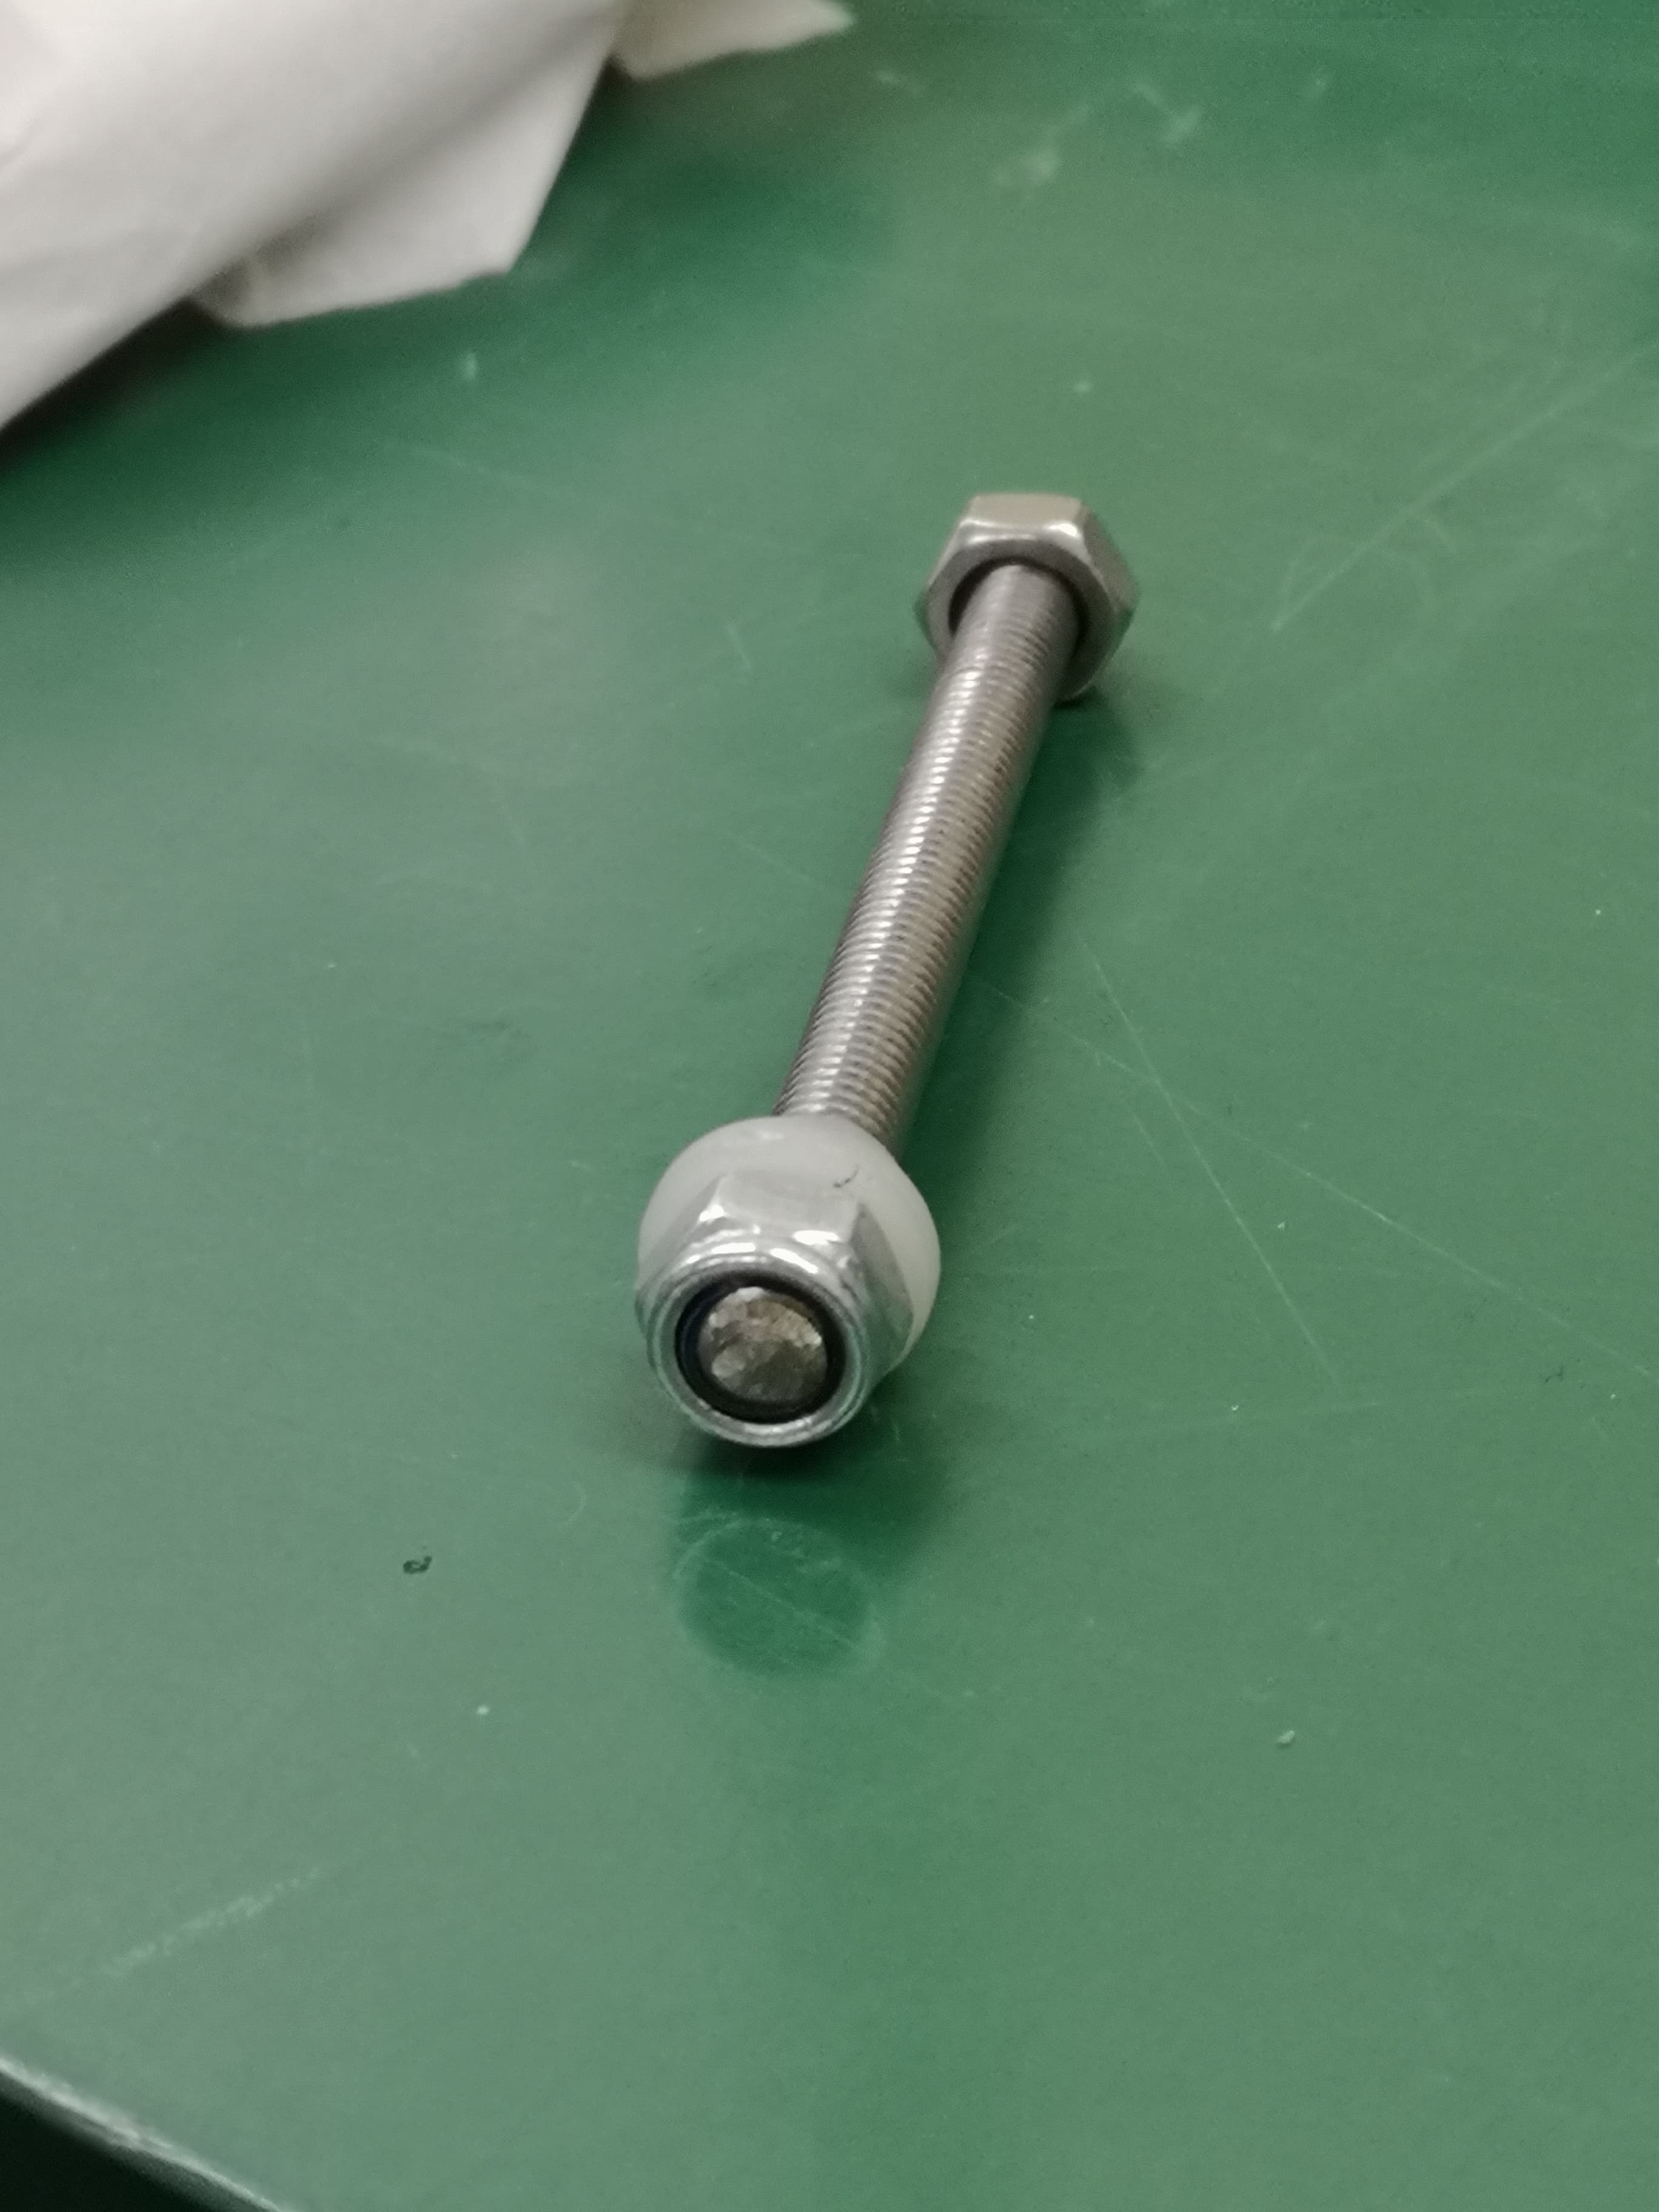
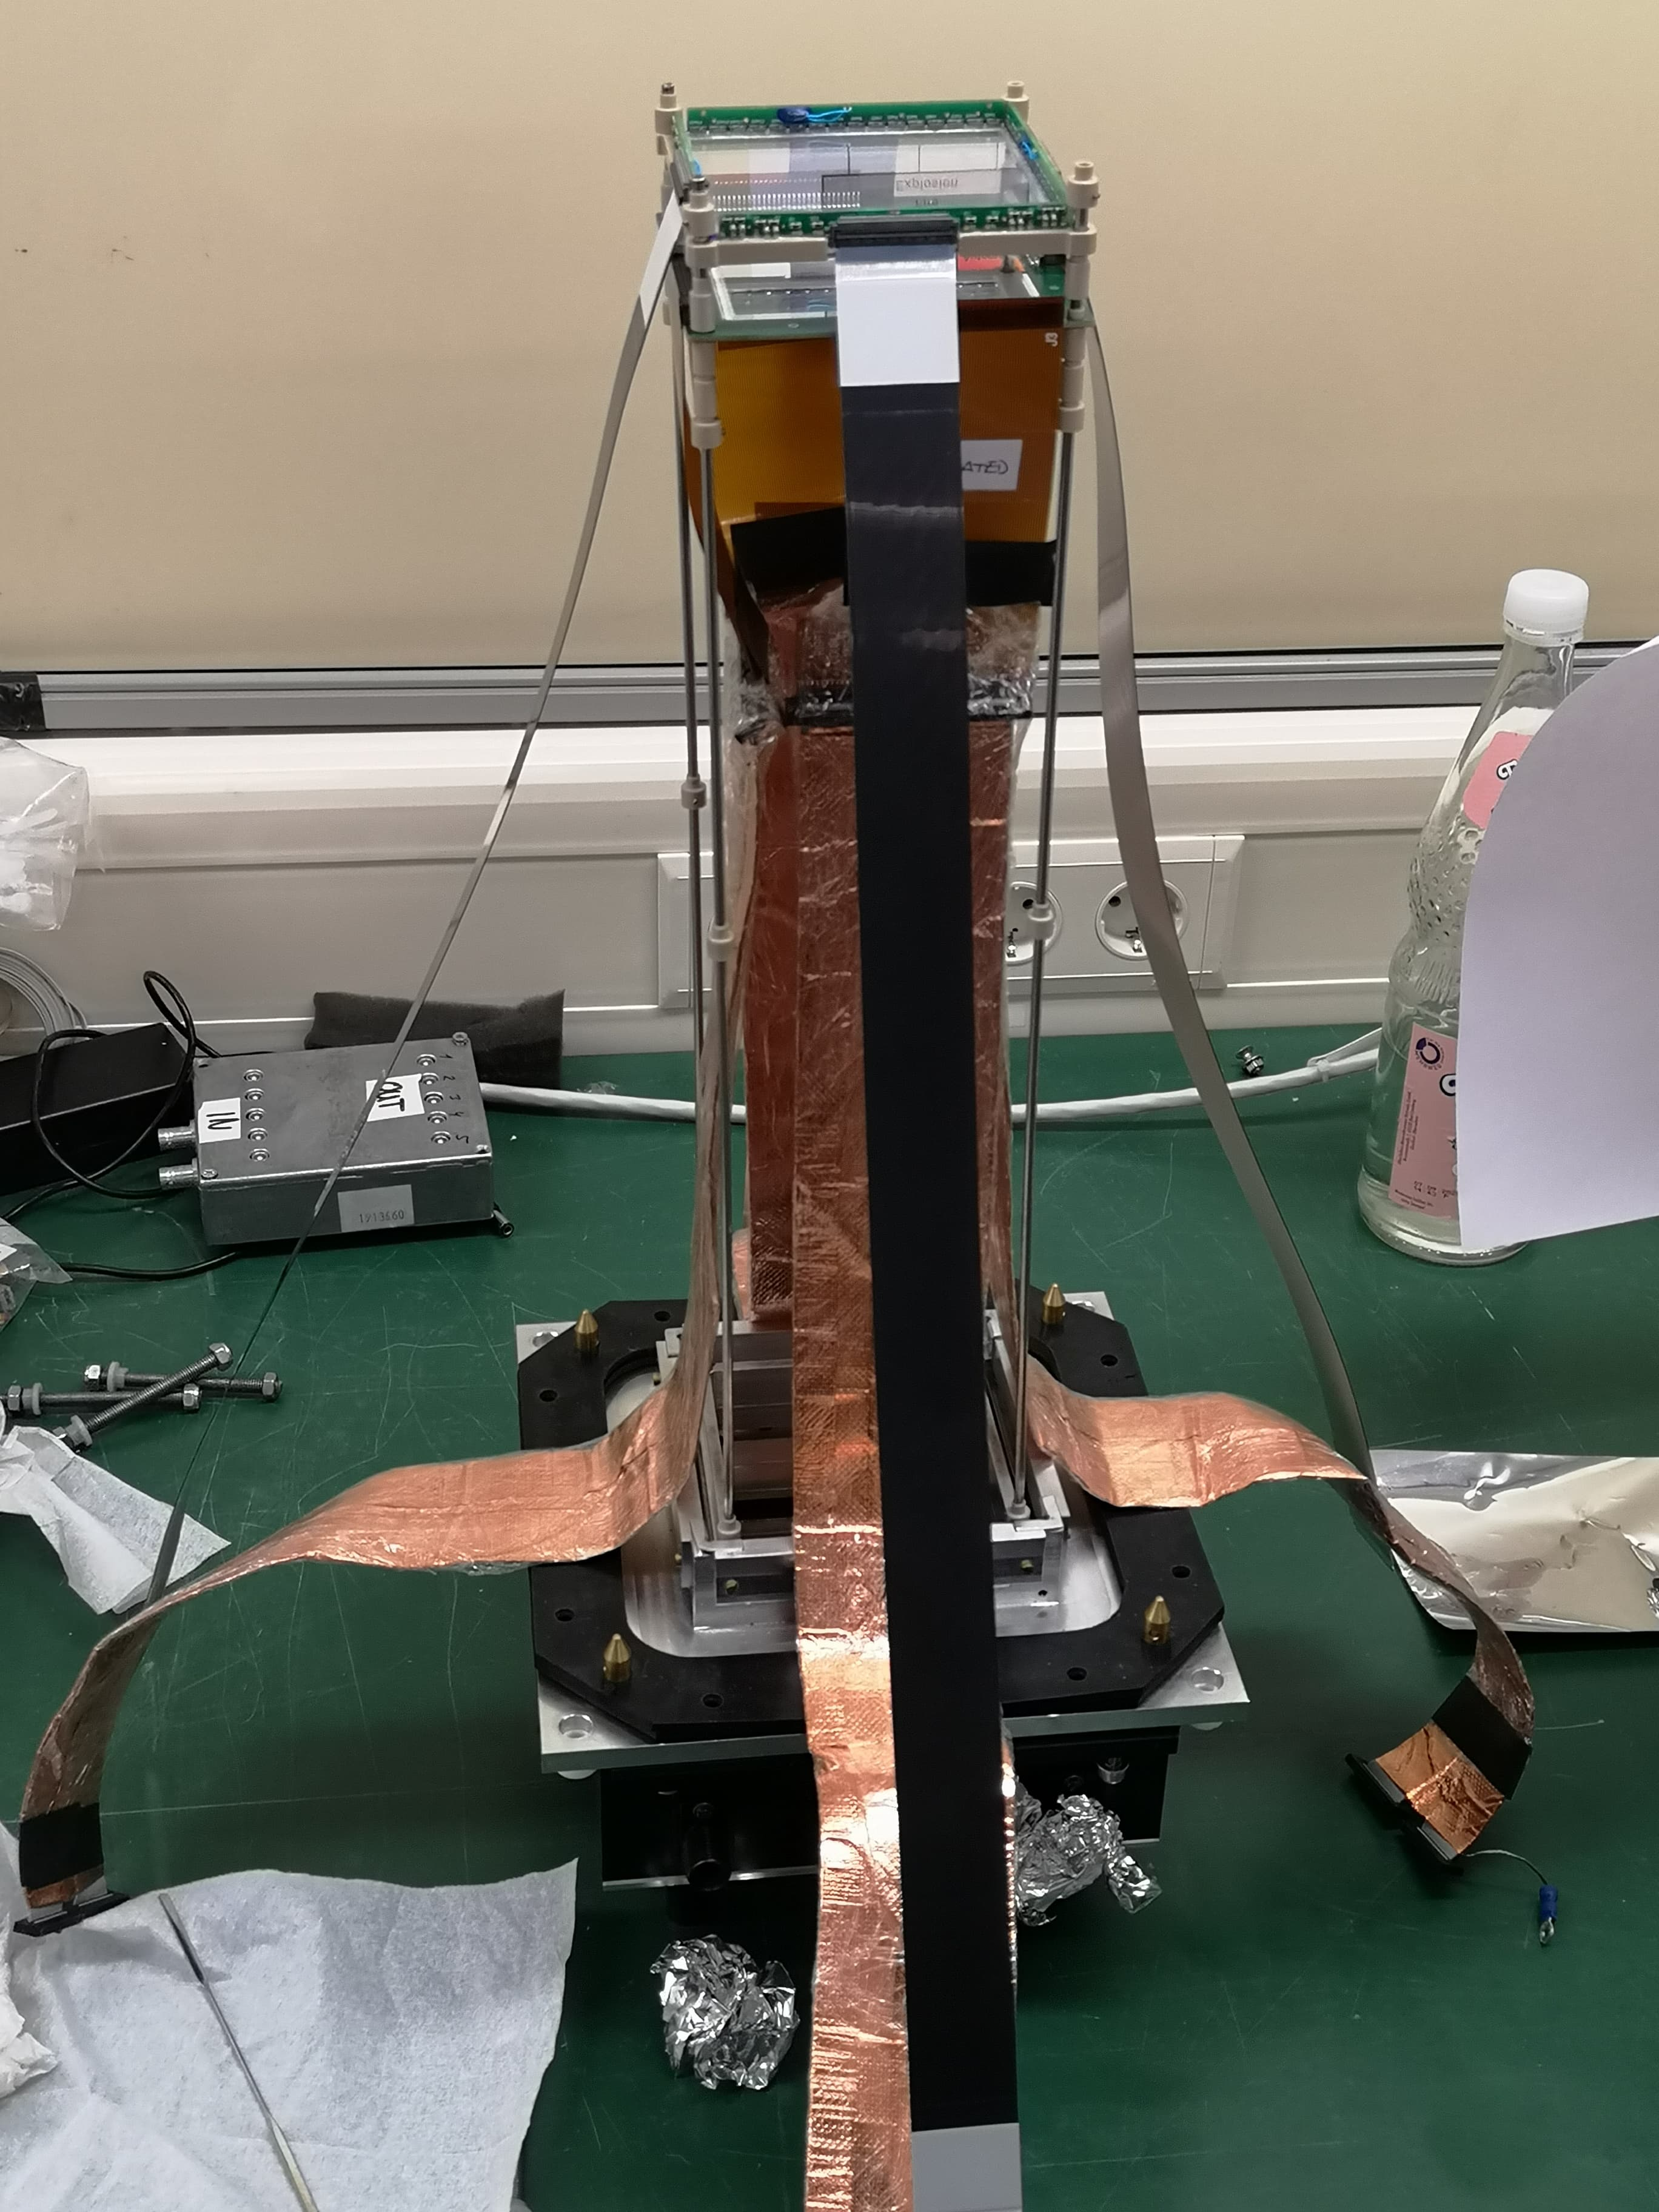
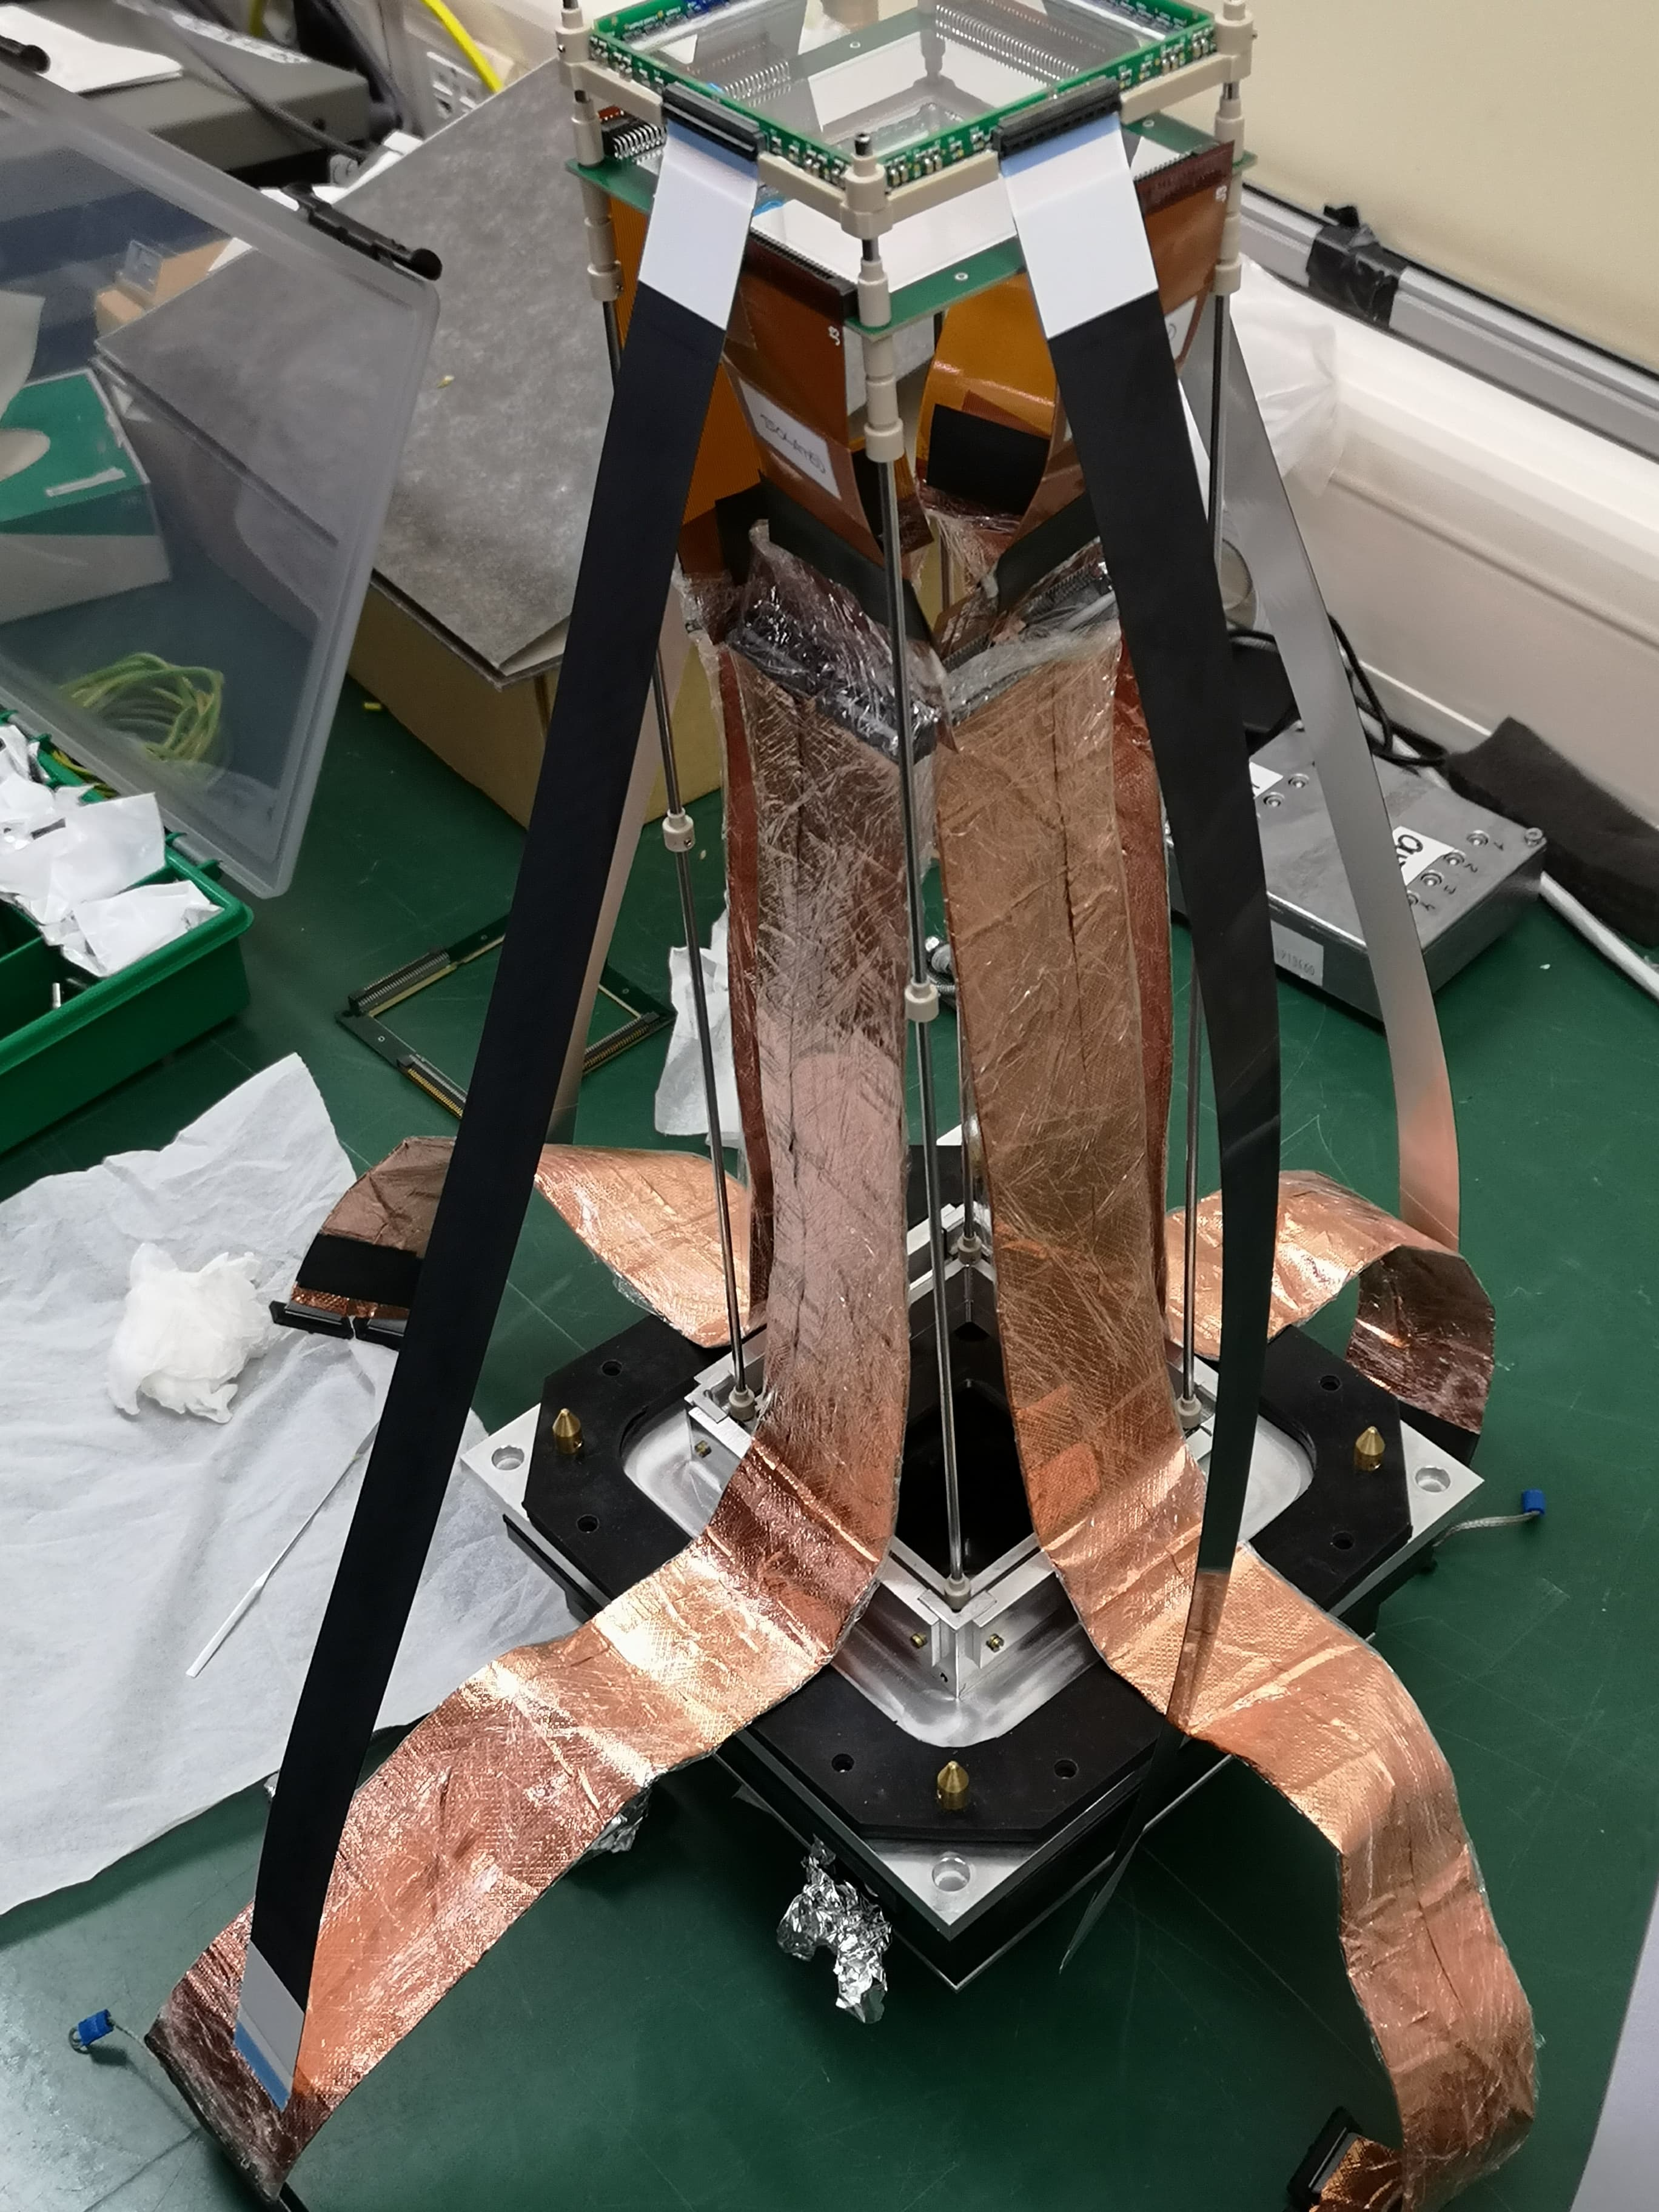
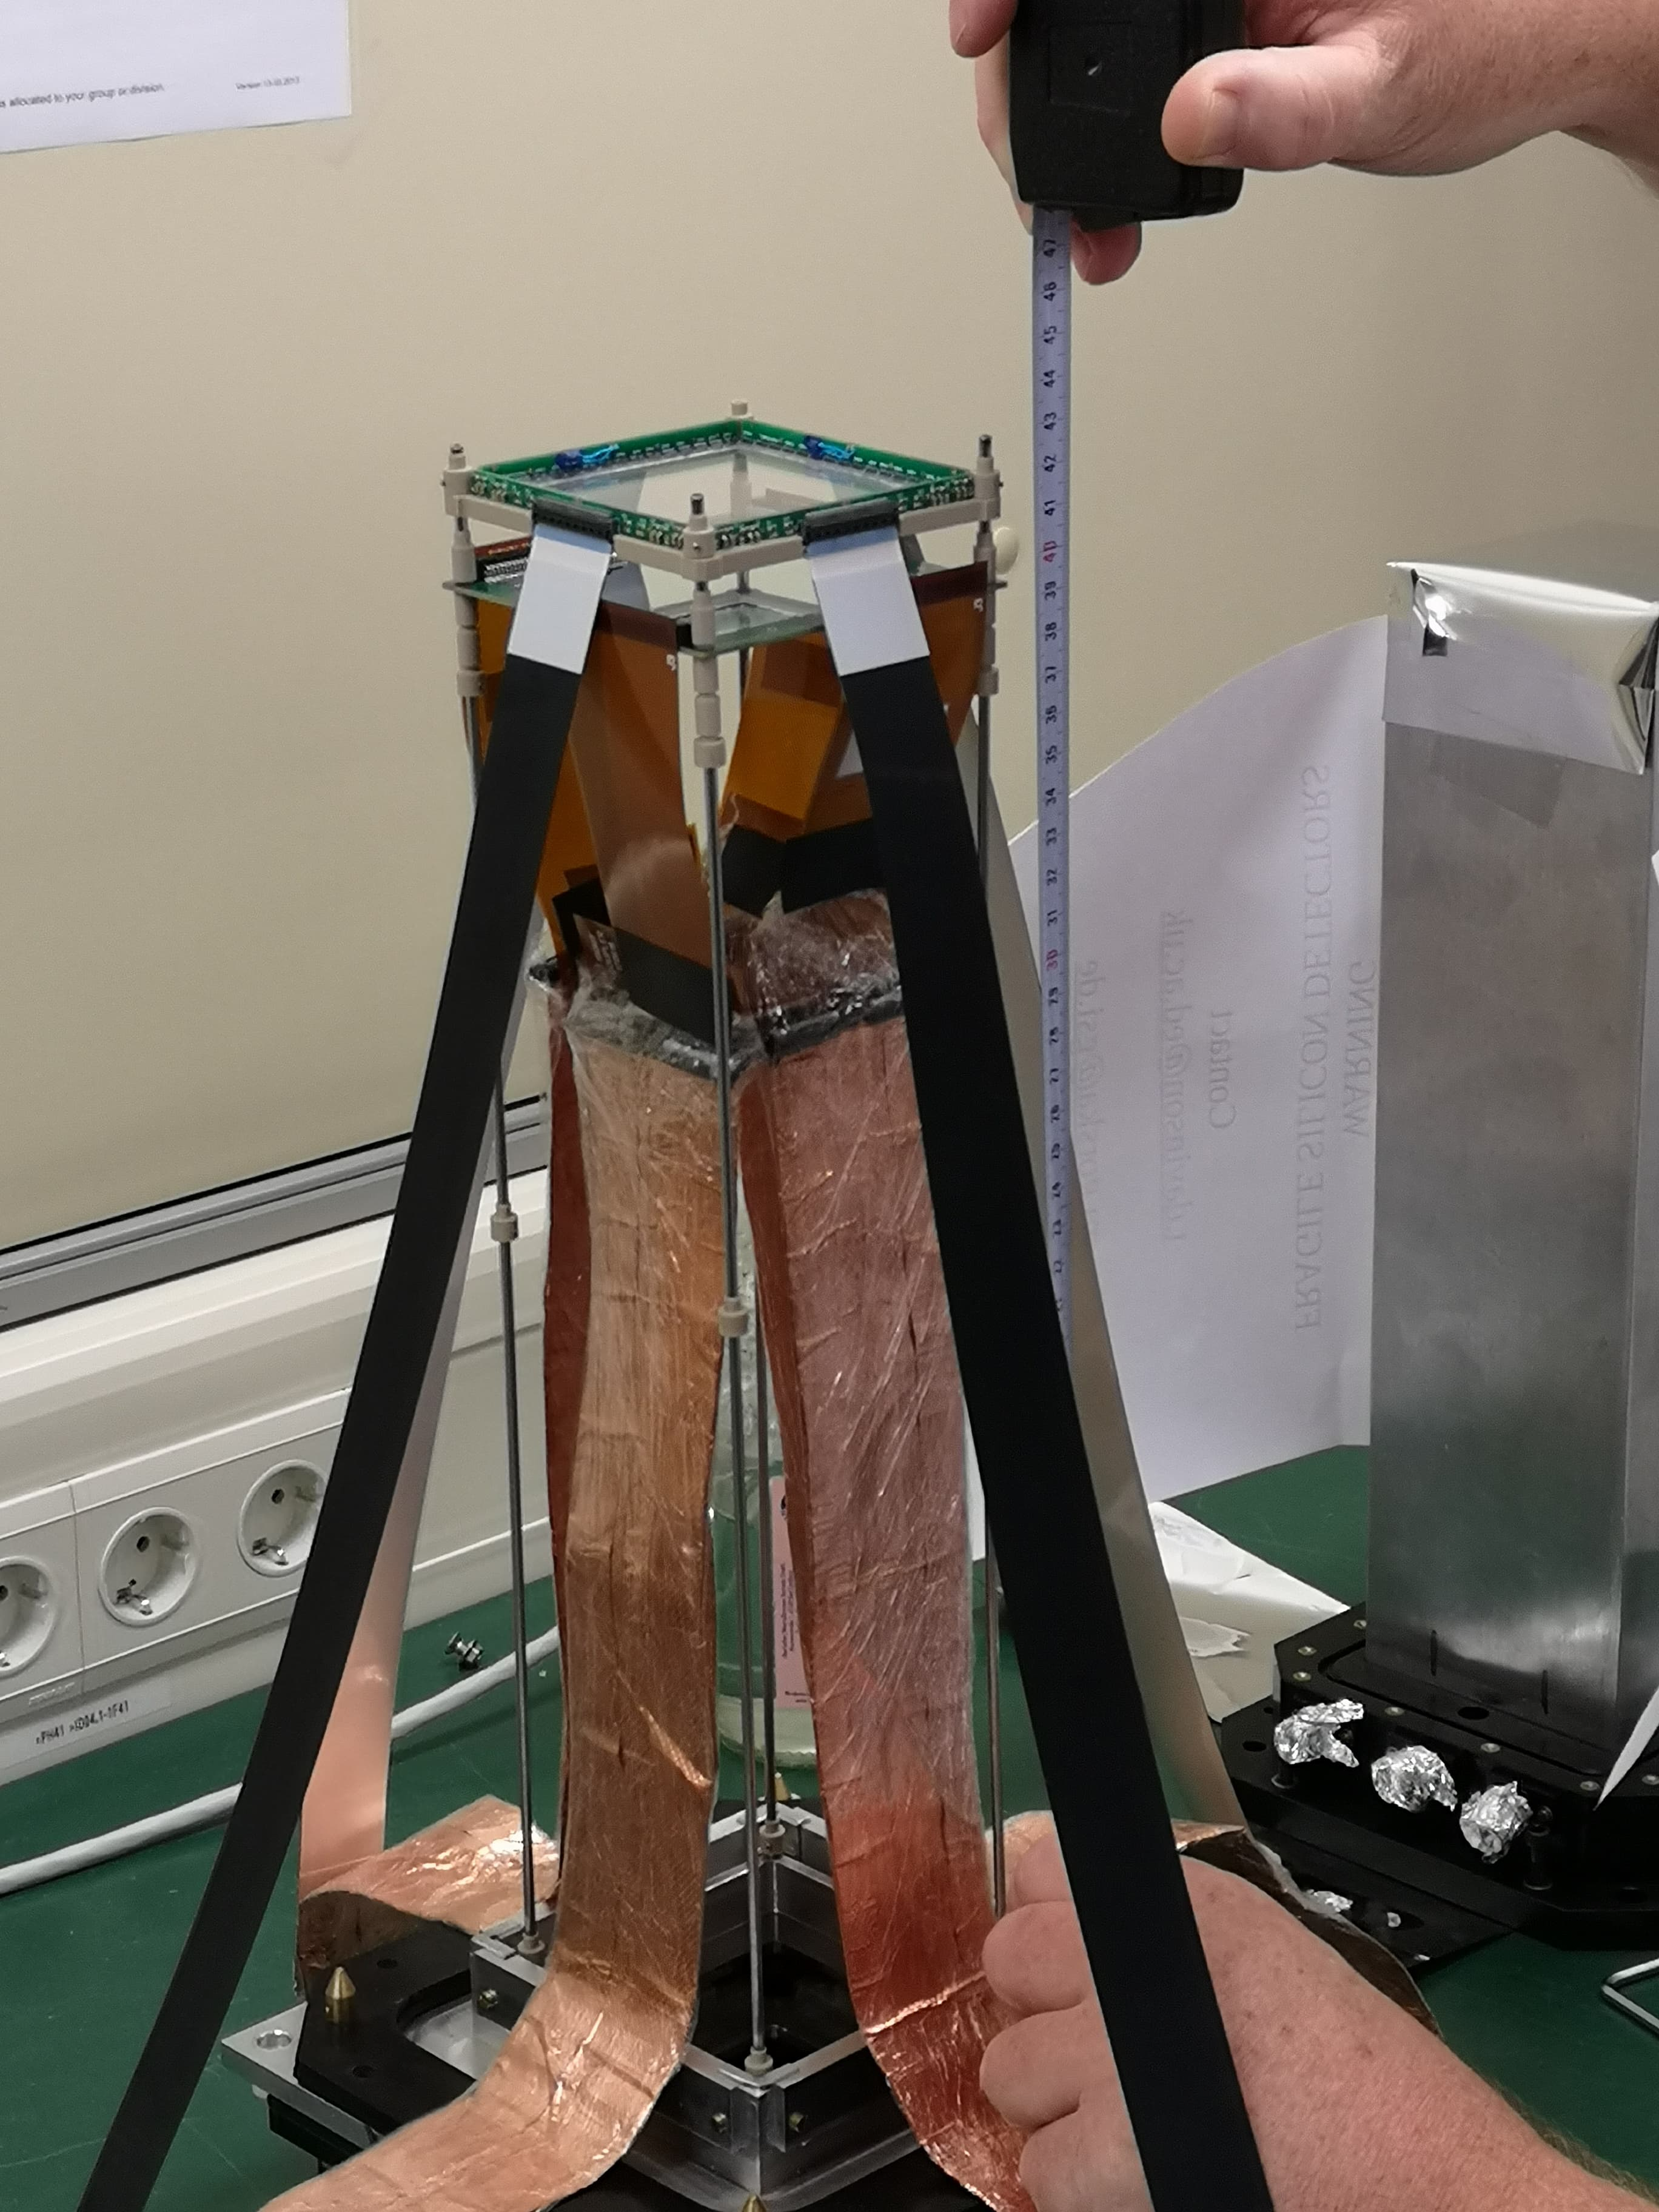
11.41 pictures of setup with scintillator mounted (attachment 8-14) |
Attachment 1: 071218_stats.png
|
|
Attachment 2: 071218_temp.png
|
|
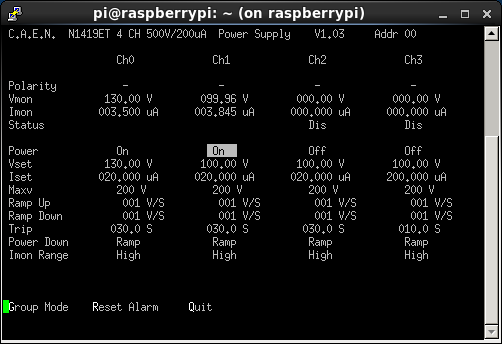
Attachment 3: 071218_bias.png
|
|
Attachment 4: 071218_18W.png
|
|
Attachment 5: 071218_18W_Yexp.png
|
|
Attachment 6: 071218_peakwidth.png
|
|
Attachment 7: 071218_rates.png
|
|
Attachment 8: 47688070_2256762954565054_3334929654510256128_n.jpg
|
|
Attachment 9: 47305799_497118170799030_7486824778062364672_n.jpg
|
|
Attachment 10: 47687230_1459939034137752_2211443514993016832_n.jpg
|
|
Attachment 11: 48336006_599957530448236_3569021065952755712_n.jpg
|
|
Attachment 12: 48357475_2127970327241855_1581049677237714944_n.jpg
|
|
Attachment 13: 48192564_414044639133054_7802028369171709952_n.jpg
|
|
Attachment 14: 47580605_365365260694379_6209069885788520448_n.jpg
|
|
194
|
Fri Mar 12 23:56:00 2021 |
OH | Saturday March 13th 00:00-08:00 |
24:00 Joined in with TD to debug the dropout of AIDA05 - See https://elog.ph.ed.ac.uk/DESPEC/193
After both powercycles and telnet reboots we were still seeing 0 in the statistics but did note that the counter was > 0
The last check we did was a restart of the merger server. This solved the issue.
It is likely that the link to the FEE was dropped but not re-established upon the resets.
There was no error message that this was seen. From now on I recommend refreshing the statistics ever 30 minutes.
01:29 System wide check
N.B. May not have reset baselines after reset
WR fault
Base Current Difference
aida01 fault 0x1ad : 0x1af : 2
aida02 fault 0x4434 : 0x4436 : 2
aida03 fault 0xcf95 : 0xcf99 : 4
aida04 fault 0x25aa : 0x25ae : 4
aida05 fault 0x4b4 : 0x4b7 : 3
aida06 fault 0x834 : 0x837 : 3
aida07 fault 0x146d : 0x1472 : 5
aida08 fault 0xf4a8 : 0xf4ab : 3
aida09 fault 0x4f6f : 0x4f73 : 4
aida10 fault 0x7504 : 0x7506 : 2
aida11 fault 0x26fa : 0x26fc : 2
aida12 fault 0x2858 : 0x285b : 3
White Rabbit error counter test result: Passed 0, Failed 12
Understand the status reports as follows:-
Status bit 3 : White Rabbit decoder detected an error in the received data
Status bit 2 : Firmware registered WR error, no reload of Timestamp
Status bit 0 : White Rabbit decoder reports uncertain of Timestamp information from WR
FPGA Check
Base Current Difference
aida12 fault 0x0 : 0x4 : 4
FPGA Timestamp error counter test result: Passed 11, Failed 1
If any of these counts are reported as in error
The ASIC readout system has detected a timeslip.
That is the timestamp read from the time FIFO is not younger than the last
01:42 Statistics - attachment 1
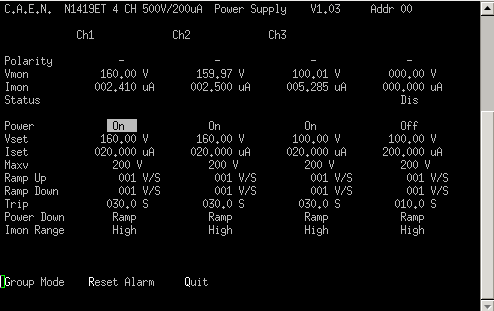
Temperature - attachment 2
Bias and leakage current - attachment 3
03:57 System wide checks
Base Current Difference
aida07 fault 0x1472 : 0x1473 : 1
White Rabbit error counter test result: Passed 11, Failed 1
Understand the status reports as follows:-
Status bit 3 : White Rabbit decoder detected an error in the received data
Status bit 2 : Firmware registered WR error, no reload of Timestamp
Status bit 0 : White Rabbit decoder reports uncertain of Timestamp information from WR
Base Current Difference
aida12 fault 0x4 : 0xc : 8
FPGA Timestamp error counter test result: Passed 11, Failed 1
If any of these counts are reported as in error
The ASIC readout system has detected a timeslip.
That is the timestamp read from the time FIFO is not younger than the last
Statistics - attachment 4
Temp - attachment 5
Bias - attachment 6
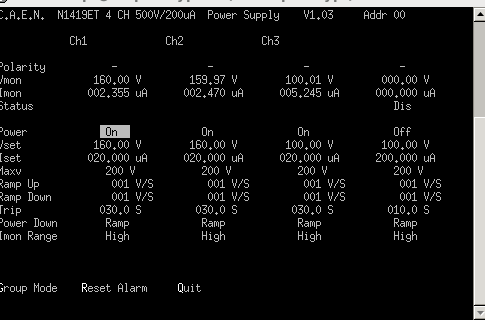
05:27 System wide checks
Base Current Difference
aida07 fault 0x1472 : 0x1474 : 2
White Rabbit error counter test result: Passed 11, Failed 1
Understand the status reports as follows:-
Status bit 3 : White Rabbit decoder detected an error in the received data
Status bit 2 : Firmware registered WR error, no reload of Timestamp
Status bit 0 : White Rabbit decoder reports uncertain of Timestamp information from WR
Base Current Difference
aida07 fault 0x0 : 0x1 : 1
aida12 fault 0x4 : 0x16 : 18
FPGA Timestamp error counter test result: Passed 10, Failed 2
If any of these counts are reported as in error
The ASIC readout system has detected a timeslip.
That is the timestamp read from the time FIFO is not younger than the last
Statistics - attachment 7
Temp - attachment 8
Bias - attachment 9
05:51 Looking into the bad timestamp messages in the merger e.g.
MERGE Data Link (28348): bad timestamp 5 3 0xc14f8415 0x00eea280 0x0000cd2e70eea280 0x166bcd2e70eea280 0x166bcd2e716c1f80
Looking in the merger source for the bad timestamp message:
if (op->Time < LastTimeStamp) {
// invalid time stamp
(*StatsMem[TSSEQERR])++;
(*StatsMem[TSSEQERR+((LinkNum+1)*MAXCOUNTERS)])++;
sprintf(message_buffer, "bad timestamp %d %d 0x%08lx 0x%08lx 0x%016llx 0x%016llx 0x%016llx",LinkNum, link_table[LinkNum]->link_state, op->Data, op->Timestamp, INFO4, op->Time, LastTimeStamp);
report_message(MSG_WARNING); /***************************/
// LastTimeStamp = op->Time;
So the message is generated when the merger detects a timewarp.
Took the first warning a data block of errors (The first instance of that particular `LastTimeStamp` and c alculated the time difference between the new timestamp and the last timestamp
The time and LastTimestamp were 0x166bccef3f424a50 0x166bccef4f4232e0 respectively
The time difference between them is 268429456 which is 268ms which seems quite a large difference
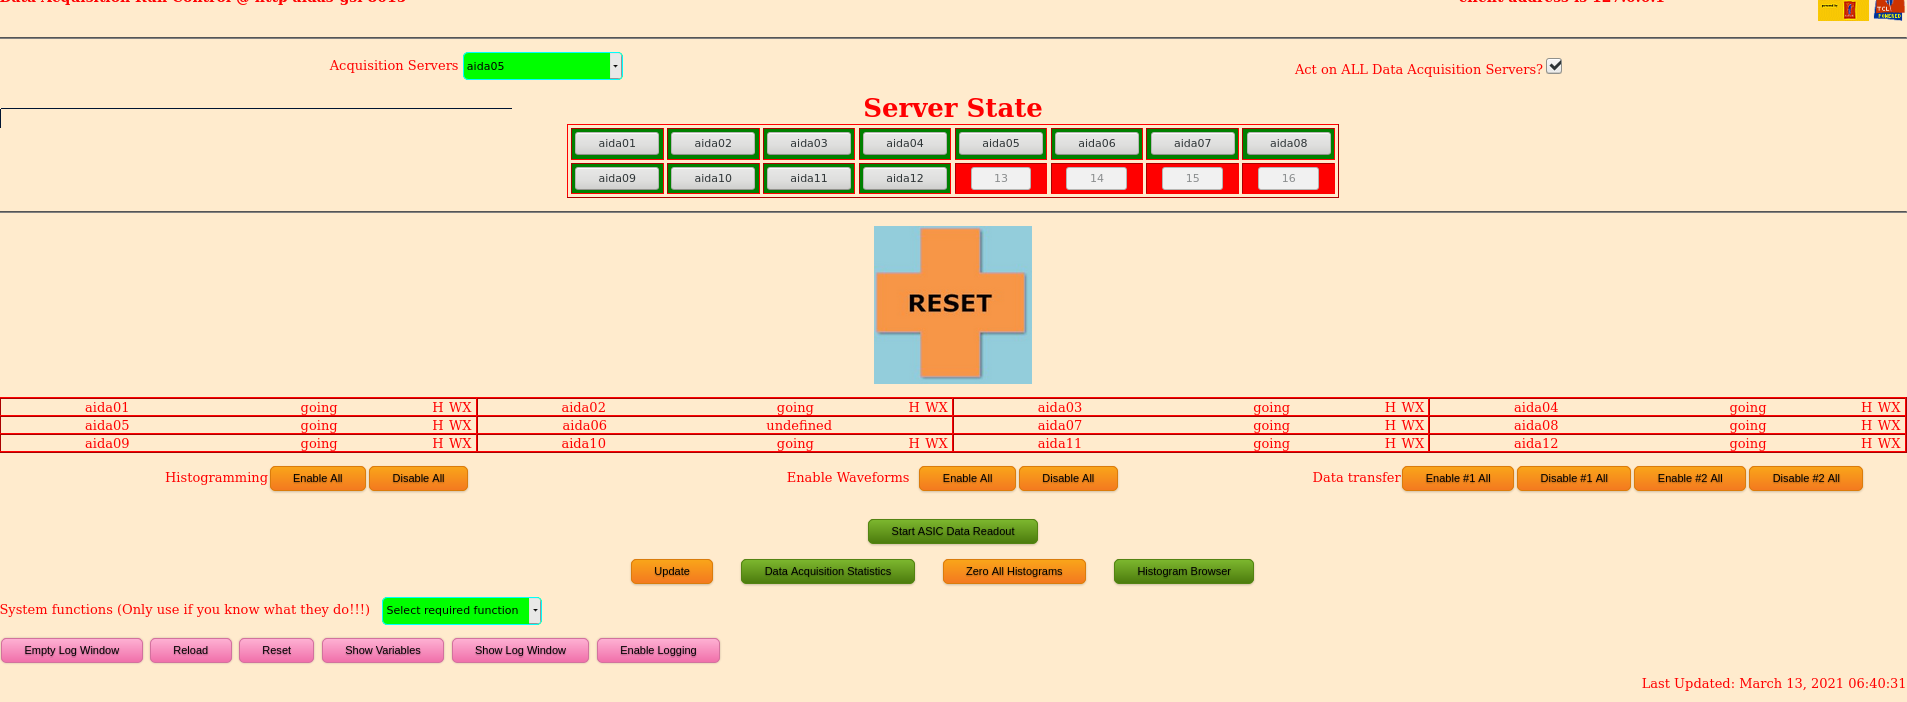
06:39 AIDA Crashed
This time all FEEs were responsive but not showing any stats
When stopping the DAQ all FEEs except aida06 stopped - attachment 10
Did a reset of the DAQ and all recovered but no stats on aida06 - attachment 11
Regained DAQ with a powercycle and a complete restart of the AIDA:8115 Merger and TaperServer
It is worth noting that aida06 is connected to link 5 the data link which had been producing the bad merge messages overnight.
We have now had it in aida05, aida6 and aida07. Could it be to do with the correlation scaler rate going into these FEES?
Going through the var/log/messages on aida-3 aida06 rebooted itself at 06:37
Mar 13 06:37:16 aidas-gsi rpc.mountd[4497]: authenticated mount request from 192.168.11.6:918 for /home/Embedded/XilinxLinux/ppc_4xx/rfs/aida06 (/home/Embedded/XilinxLinux/ppc_4xx/rfs)
Mar 13 06:37:18 aidas-gsi xinetd[4578]: START: time-stream pid=0 from=::ffff:192.168.11.6
Mar 13 06:37:32 aidas-gsi rpc.mountd[4497]: authenticated mount request from 192.168.11.6:862 for /home/npg/MIDAS_Releases/23Jan19/MIDAS_200119 (/home/npg/MIDAS_Releases/23Jan19/MIDAS_200119)
Looking in /var/log/messages on aida06 no evidence of a reason why:
Mar 12 23:30:56 aida06 kernel: Trying to free nonexistent resource <0000000007000000-0000000007ffffff>
Mar 12 23:30:56 aida06 kernel: AIDAMEM: aidamem: mem region start 0x7000000 for 0x1000000 mapped at 0xd2380000
Mar 12 23:30:56 aida06 kernel: AIDAMEM: aidamem: driver assigned major number 253
Mar 12 23:31:13 aida06 kernel: xaida: open:
Mar 12 23:31:14 aida06 kernel: AIDAMEM: aidamem_open:
Mar 12 23:33:06 aida06 kernel: xaida: open:
Mar 13 05:37:30 aida06 syslogd 1.4.2: restart.
Mar 13 05:37:30 aida06 kernel: klogd 1.4.2, log source = /proc/kmsg started.
Mar 13 05:37:30 aida06 kernel: Using Xilinx Virtex440 machine description
Mar 13 05:37:30 aida06 kernel: Linux version 2.6.31 (nf@nnlxb.dl.ac.uk) (gcc version 4.2.2) #34 PREEMPT Tue Nov 15 15:57:04 GMT 2011
Mar 13 05:37:30 aida06 kernel: Zone PFN ranges: |
Attachment 1: 210313_0138_Stats.png
|
|
Attachment 2: 210313_0141_Temp.png
|
|
Attachment 3: 210313_0142_Bias.png
|
|
Attachment 4: 210313_0355_Stats.png
|
|
Attachment 5: 210313_0356_Bias.png
|
|
Attachment 6: 210313_0356_Temp.png
|
|
Attachment 7: 210313_0528_Stats.png
|
|
Attachment 8: 210313_0529_Temp.png
|
|
Attachment 9: 210313_0530_Bias.png
|
|
Attachment 10: 2210313_0640_AIDAissue.png
|
|
Attachment 11: 210313_0647_aida6MMissing.png
|
|
301
|
Sat May 8 09:05:04 2021 |
TD | Saturday 8 May |
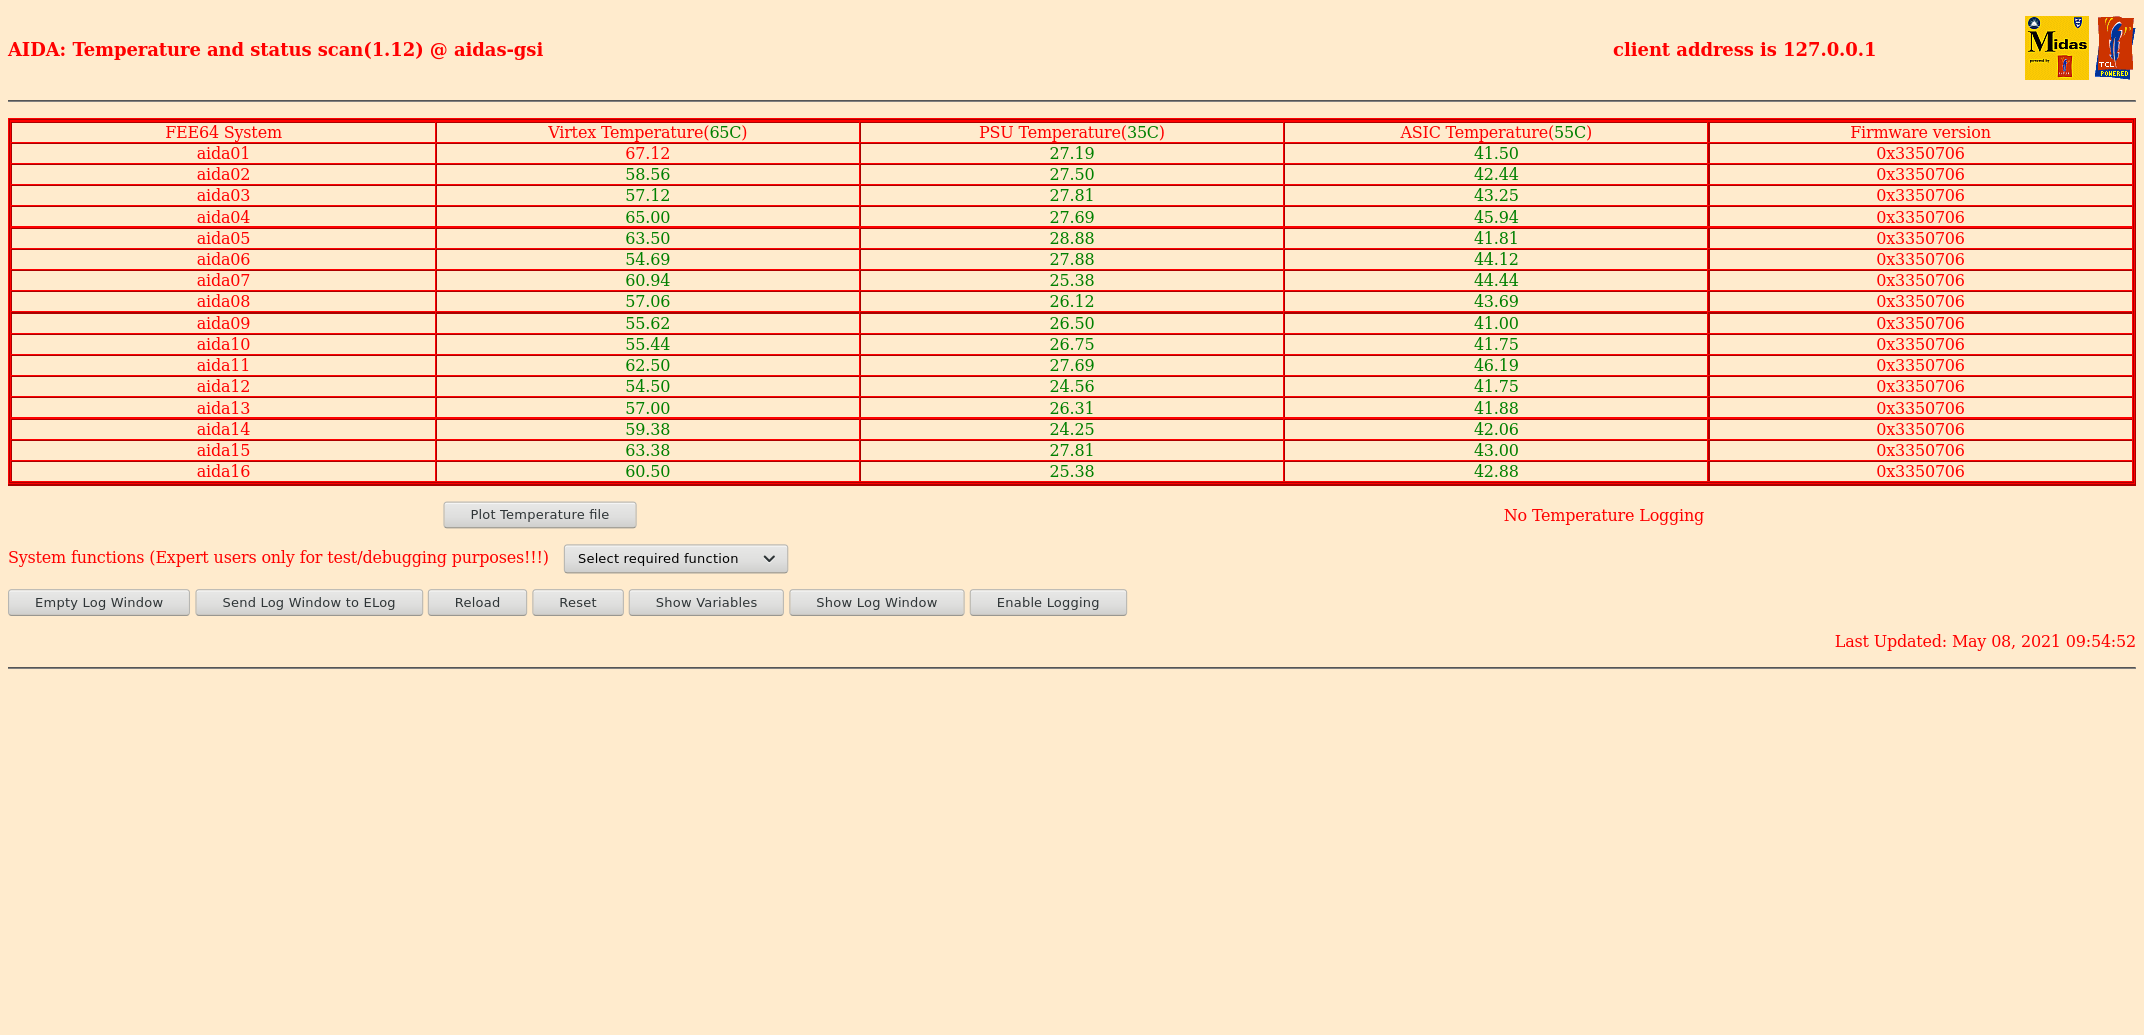
09.54 FEE64 temperatures OK - attachment 1
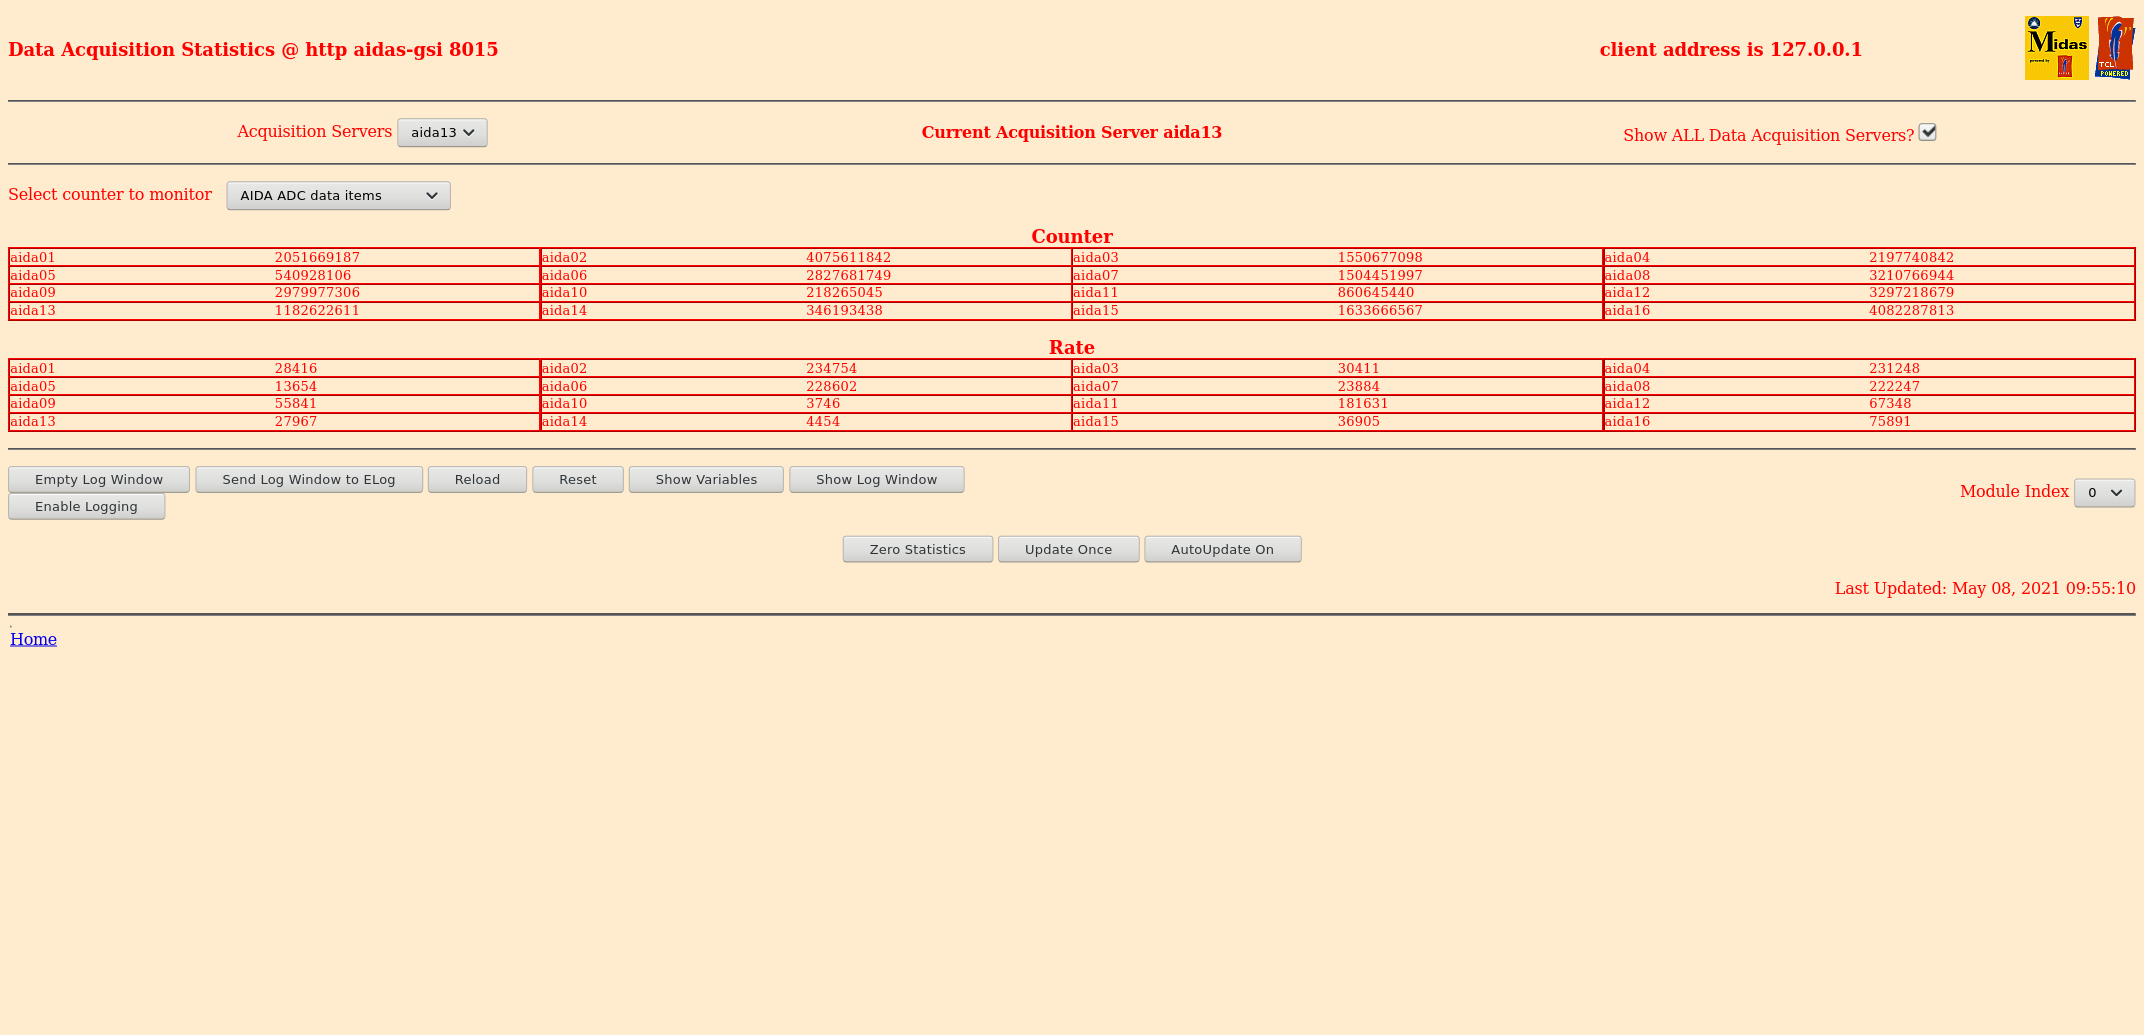
ADC data item stats OK - attachment 2
p+n FEE64s 11x <100k, 1x <200k
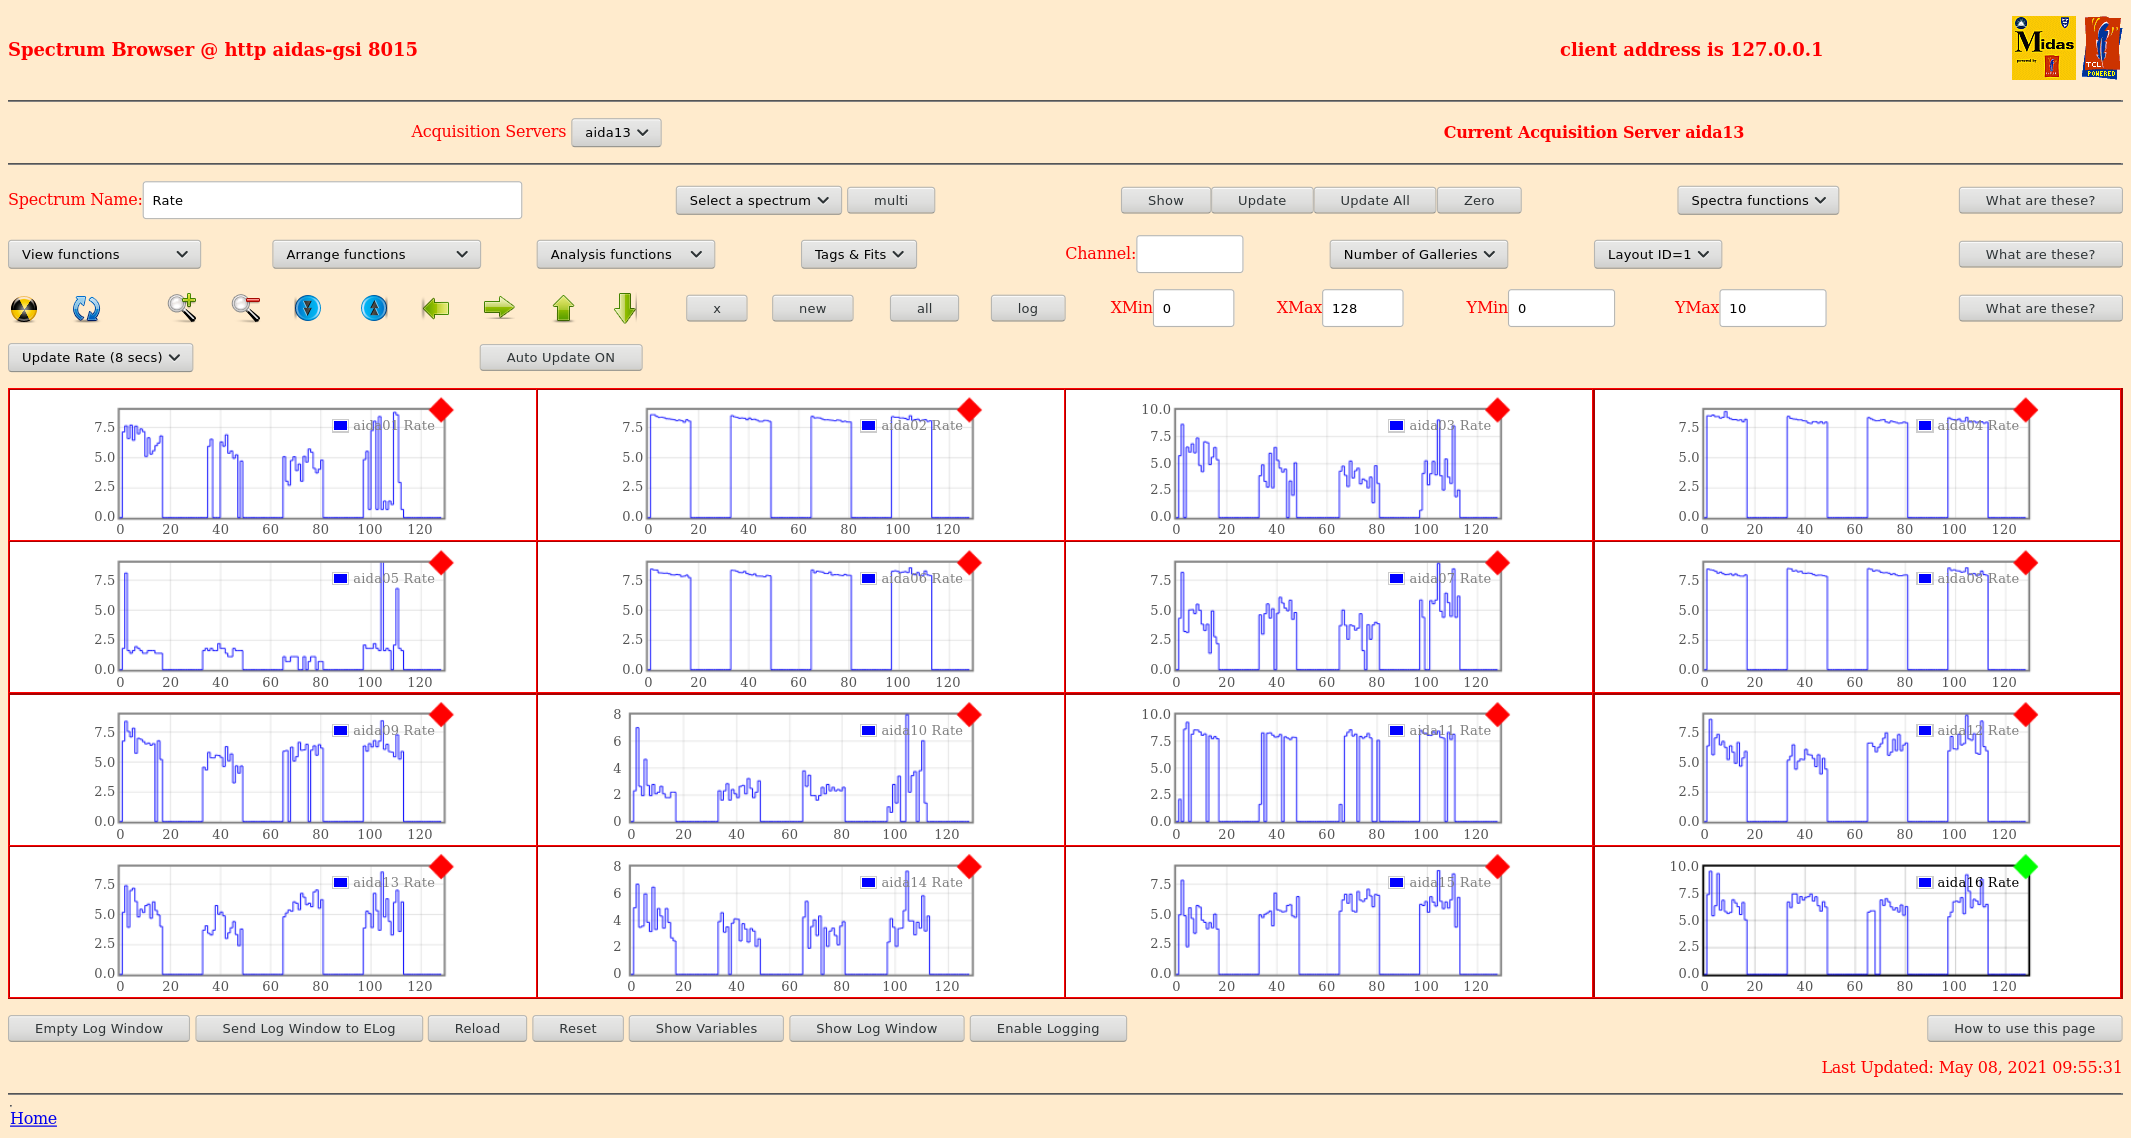
Rate spectra - attachments 3 & 4
before and after ASIC check load
1.8.L spectra - attachments 5 & 6
1.8.W spectra 20us FSR - attachments 7 & 8
Disc, WR-28-47, pause, resume info data items - attachments 9-12
note large number pause/resume for aida13 - legacy numbers since last restart/zero?
attachment 16 for pause stats since stats zero at 10.02 - looks OK
Grafana DSSSD bias & leakage currents for most recent 48h OK - atatchment 13
DSSSD bias & leakage currents - attachment 14
Merger stats/merger/tape server messages - attachment 15
10.02 All histograms and stats zero'd
10.06 All system wide checks OK *except*
Collecting the file size of each FEE64 Options CONTENTS file to check they are all the same
FEE : aida01 => Options file size is 1026 Last changed Thu May 06 15:29:51 CEST 2021
FEE : aida02 => Options file size is 1014 Last changed Thu Apr 29 14:43:46 CEST 2021
FEE : aida03 => Options file size is 1014 Last changed Thu Apr 29 14:43:50 CEST 2021
FEE : aida04 => Options file size is 1014 Last changed Thu Apr 29 14:43:53 CEST 2021
FEE : aida05 => Options file size is 1014 Last changed Thu Apr 29 14:43:55 CEST 2021
FEE : aida06 => Options file size is 1014 Last changed Thu Apr 29 14:43:59 CEST 2021
FEE : aida07 => Options file size is 1014 Last changed Thu Apr 29 14:44:02 CEST 2021
FEE : aida08 => Options file size is 1025 Last changed Wed May 05 12:15:54 CEST 2021
FEE : aida09 => Options file size is 1014 Last changed Thu Apr 29 14:44:08 CEST 2021
FEE : aida10 => Options file size is 1014 Last changed Thu Apr 29 14:44:57 CEST 2021
FEE : aida11 => Options file size is 1014 Last changed Thu Apr 29 14:44:57 CEST 2021
FEE : aida12 => Options file size is 1014 Last changed Thu Apr 29 14:44:57 CEST 2021
FEE : aida13 => Options file size is 1025 Last changed Fri May 07 19:40:34 CEST 2021
FEE : aida14 => Options file size is 1014 Last changed Thu Apr 29 14:44:57 CEST 2021
FEE : aida15 => Options file size is 1014 Last changed Thu Apr 29 14:44:57 CEST 2021
FEE : aida16 => Options file size is 1014 Last changed Thu Apr 29 14:44:57 CEST 2021
10.25 Pulser peak width aida01 97 ch FWHM, aida02 350 ch FWHM
peak widths are increasing cf. earlier this week - see https://elog.ph.ed.ac.uk/DESPEC/291 , https://elog.ph.ed.ac.uk/DESPEC/298 |
Attachment 1: Screenshot_2021-05-08_Temperature_and_status_scan_aidas-gsi.png
|
|
Attachment 2: Screenshot_2021-05-08_Statistics_aidas-gsi.png
|
|
Attachment 3: Screenshot_2021-05-08_Spectrum_Browser_aidas-gsi.png
|
|
Attachment 4: Screenshot_2021-05-08_Spectrum_Browser_aidas-gsi(1).png
|
|
Attachment 5: Screenshot_2021-05-08_Spectrum_Browser_aidas-gsi(2).png
|
|
Attachment 6: Screenshot_2021-05-08_Spectrum_Browser_aidas-gsi(3).png
|
|
Attachment 7: Screenshot_2021-05-08_Spectrum_Browser_aidas-gsi(4).png
|
|
Attachment 8: Screenshot_2021-05-08_Spectrum_Browser_aidas-gsi(5).png
|
|
Attachment 9: Screenshot_2021-05-08_Statistics_aidas-gsi(1).png
|
|
Attachment 10: Screenshot_2021-05-08_Statistics_aidas-gsi(2).png
|
|
Attachment 11: Screenshot_2021-05-08_Statistics_aidas-gsi(3).png
|
|
Attachment 12: Screenshot_2021-05-08_Statistics_aidas-gsi(4).png
|
|
Attachment 13: Screenshot_2021-05-08_AIDA_Alerting_-_Grafana.png
|
|
Attachment 14: 500.png
|
|
Attachment 15: 501.png
|
|
Attachment 16: Screenshot_2021-05-08_Statistics_aidas-gsi(5).png
|
|
Attachment 17: Screenshot_2021-05-08_Statistics_aidas-gsi(5).png
|
|
Attachment 18: Screenshot_2021-05-08_Statistics_aidas-gsi(6).png
|
|
Attachment 19: Screenshot_2021-05-08_Temperature_and_status_scan_aidas-gsi(1).png
|
|
Attachment 20: Screenshot_2021-05-08_Spectrum_Browser_aidas-gsi(6).png
|
|
Attachment 21: Screenshot_2021-05-08_Spectrum_Browser_aidas-gsi(7).png
|
|
Attachment 22: Screenshot_2021-05-08_Spectrum_Browser_aidas-gsi(8).png
|
|
Attachment 23: Screenshot_2021-05-08_Statistics_aidas-gsi(7).png
|
|
Attachment 24: Screenshot_2021-05-08_Statistics_aidas-gsi(8).png
|
|
Attachment 25: Screenshot_2021-05-08_Statistics_aidas-gsi(9).png
|
|
Attachment 26: Screenshot_2021-05-08_Spectrum_Browser_aidas-gsi(9).png
|
|
Attachment 27: Screenshot_2021-05-08_Statistics_aidas-gsi(10).png
|
|
642
|
Sat Jun 8 13:22:36 2024 |
TD | Saturday 8 June |
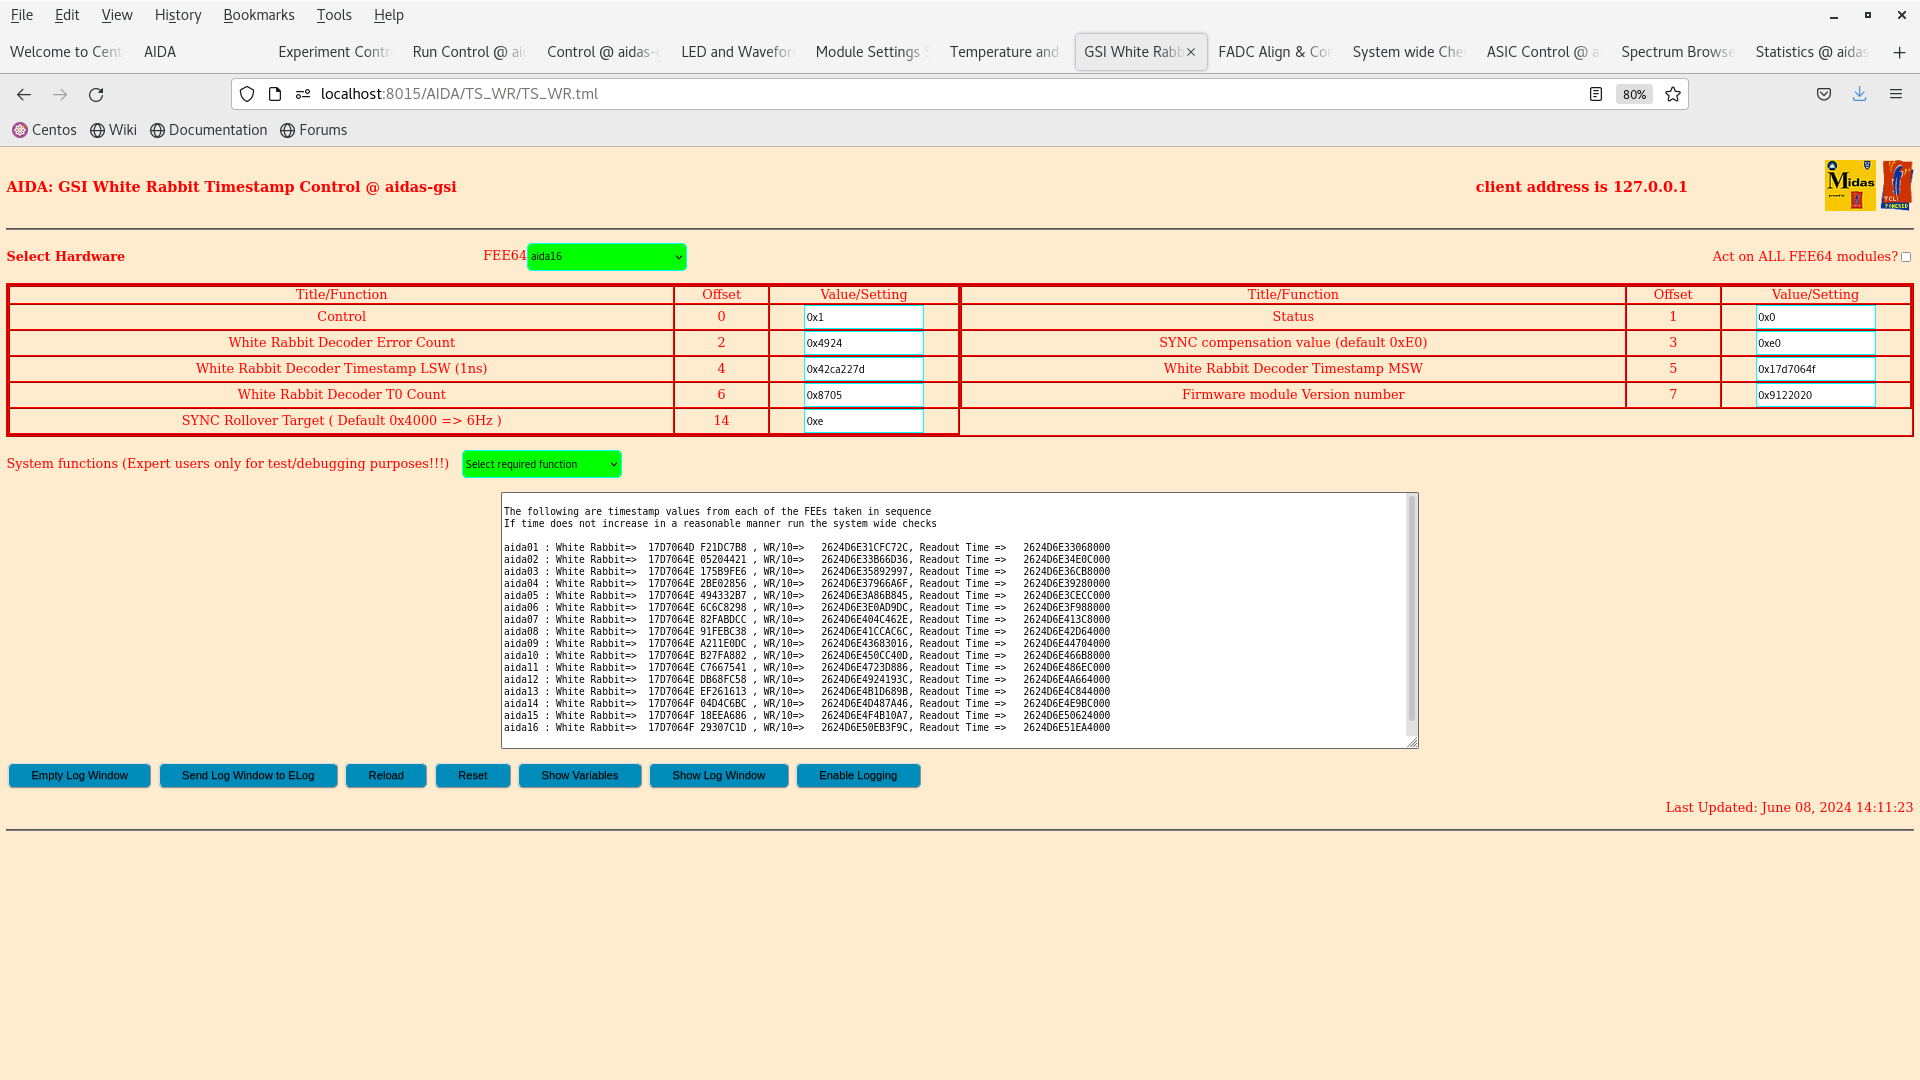
14.09 aida02 WR stall
DAQ STOP
restart Merger, Mrger SETUP, Merger GO
DAQ GO
all histograms & stats zero'd
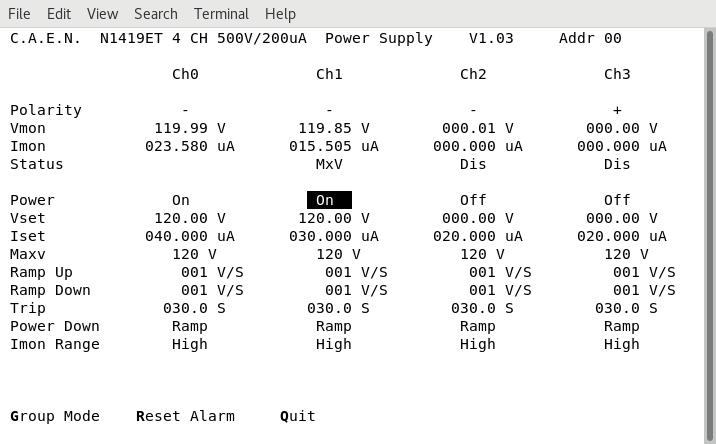
DSSSD bias & leakage current OK - attachments 1-2
FEE64 temperatures OK - attachment 4
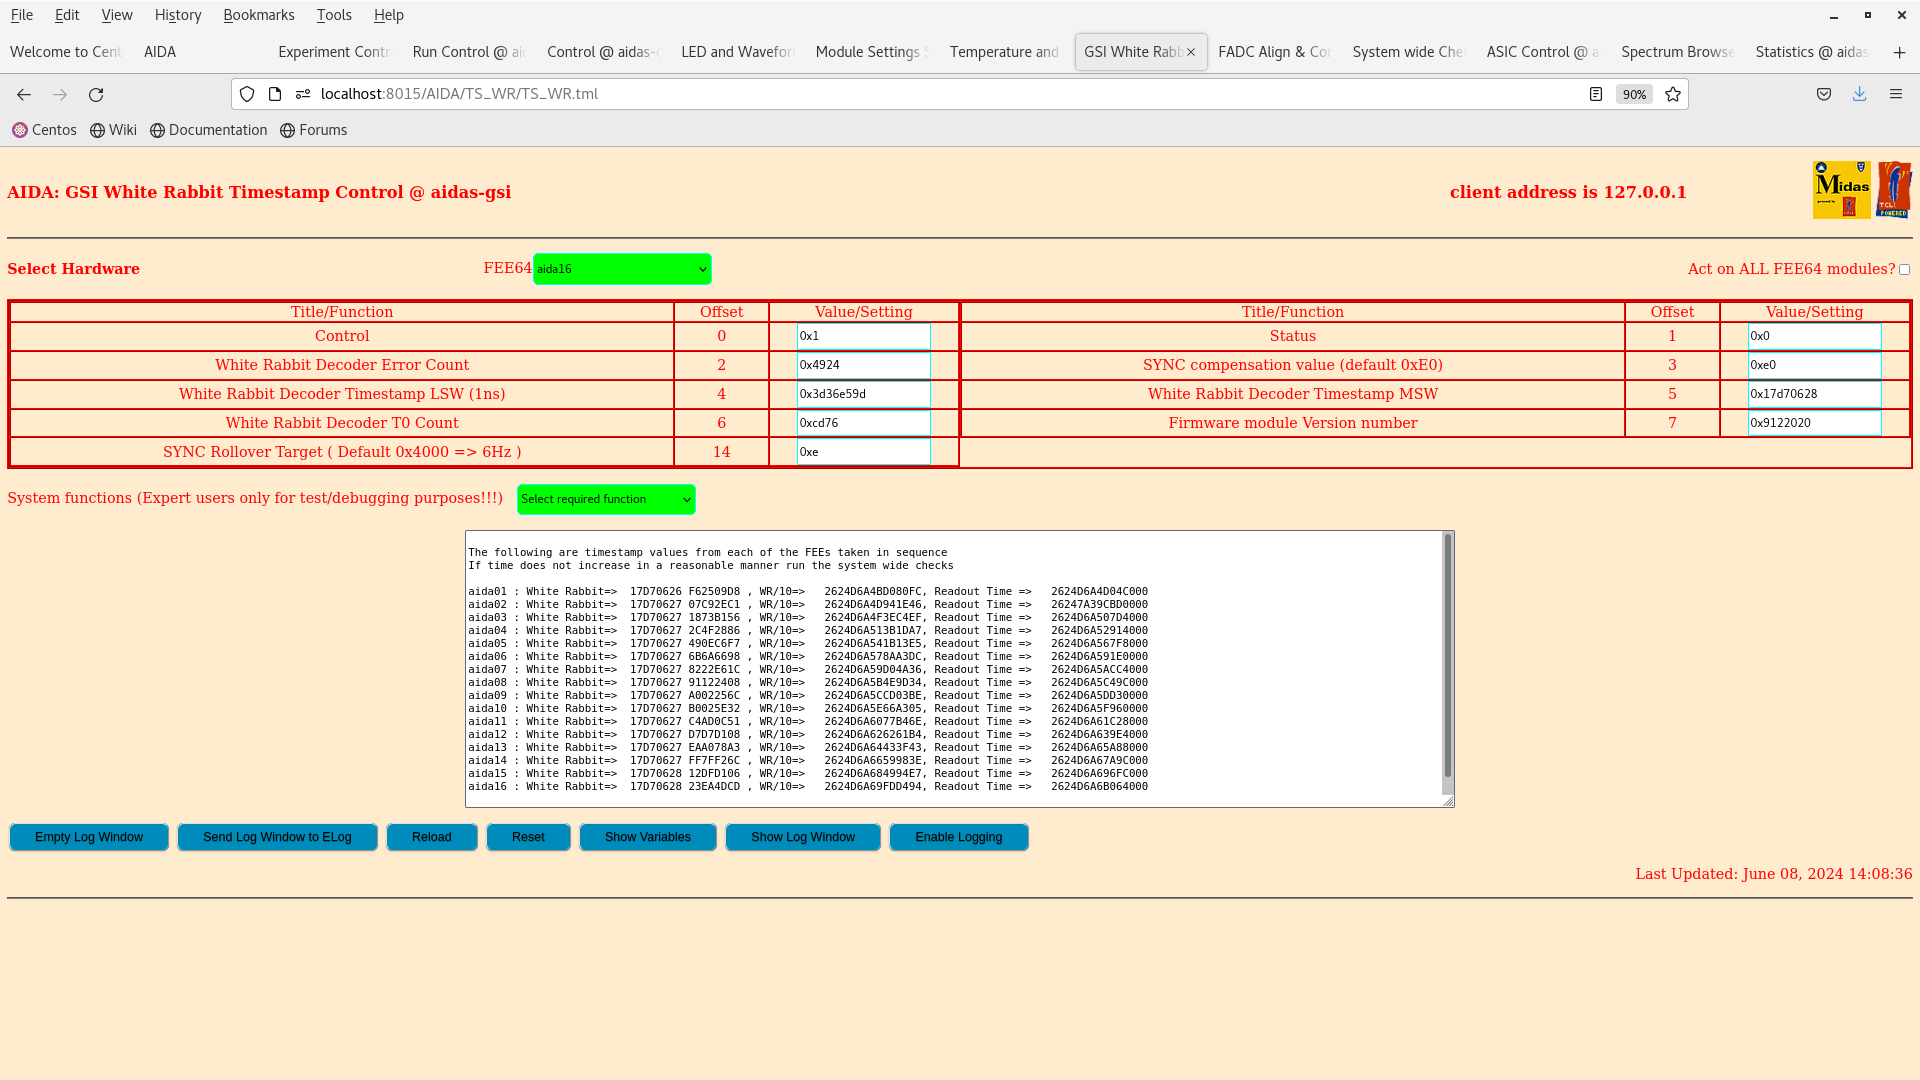
WR timestamp before/after Merger restart - attachments 3 & 5
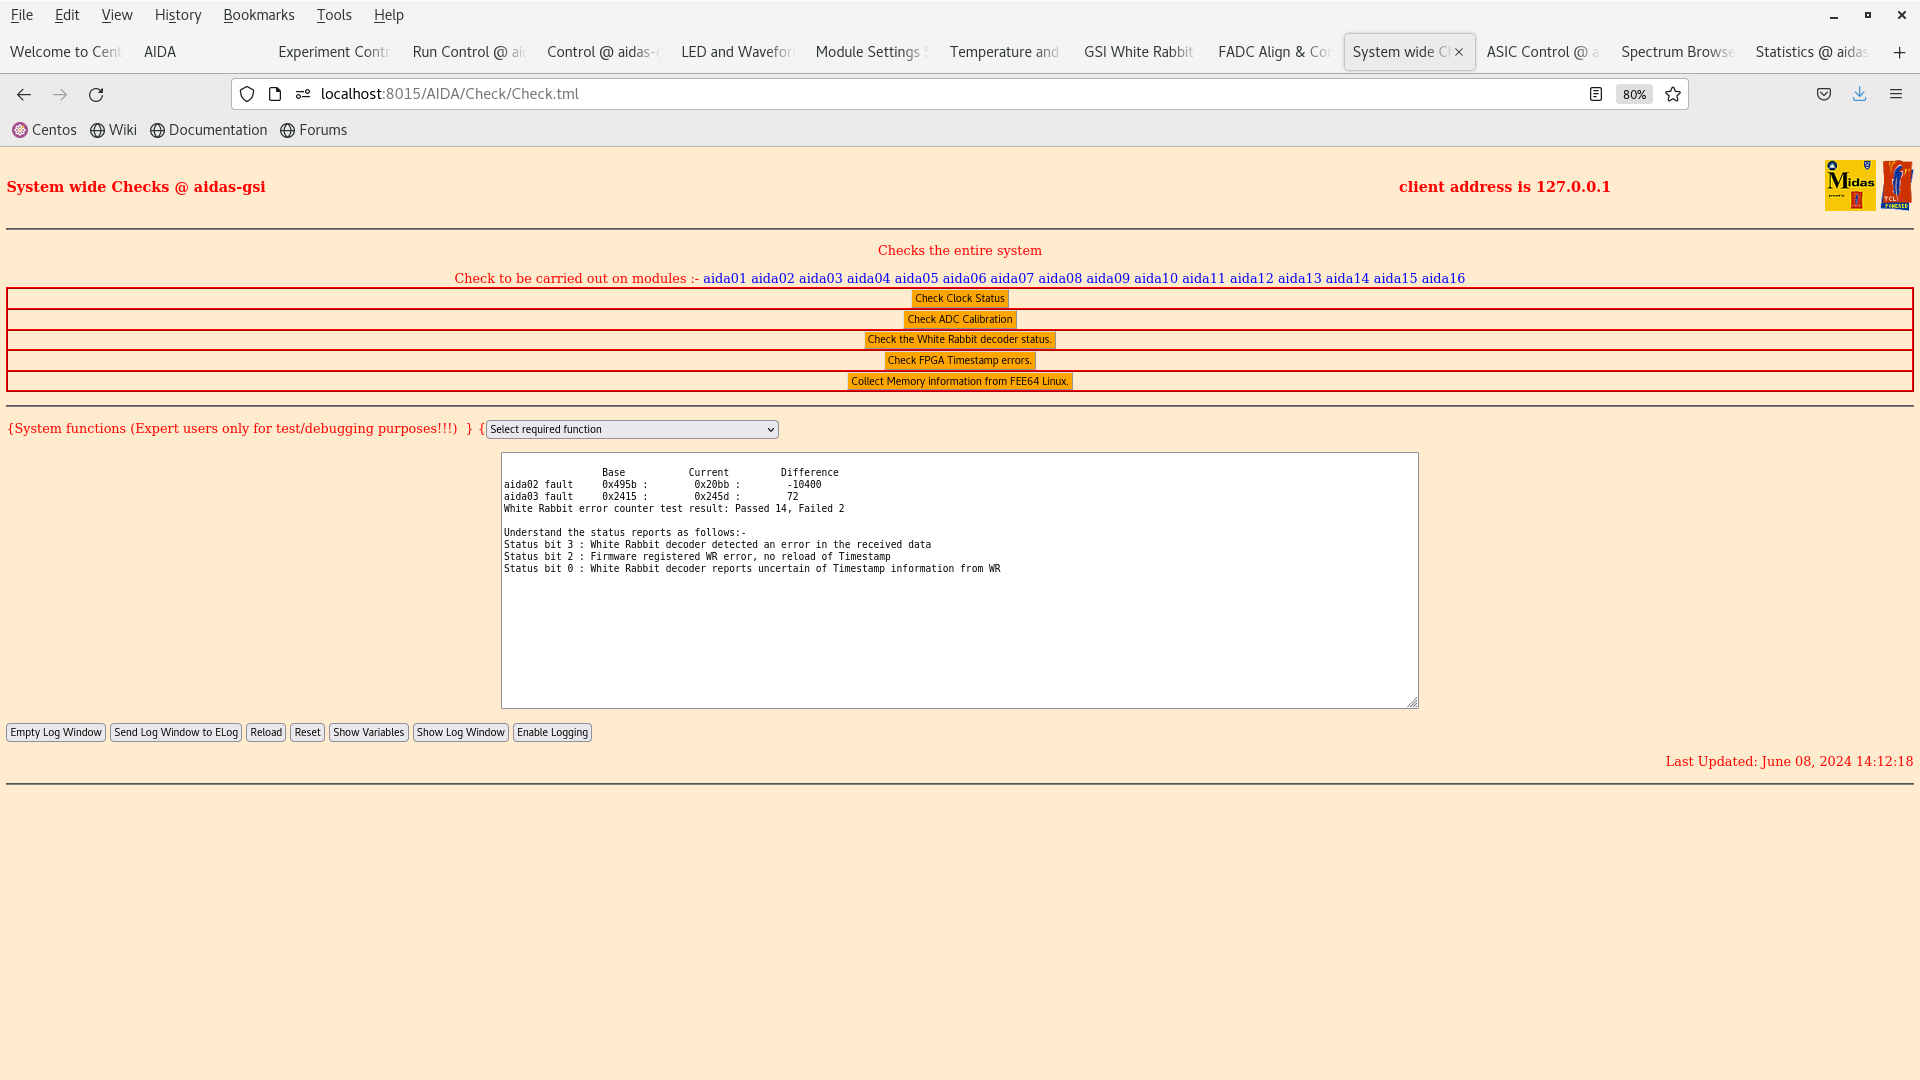
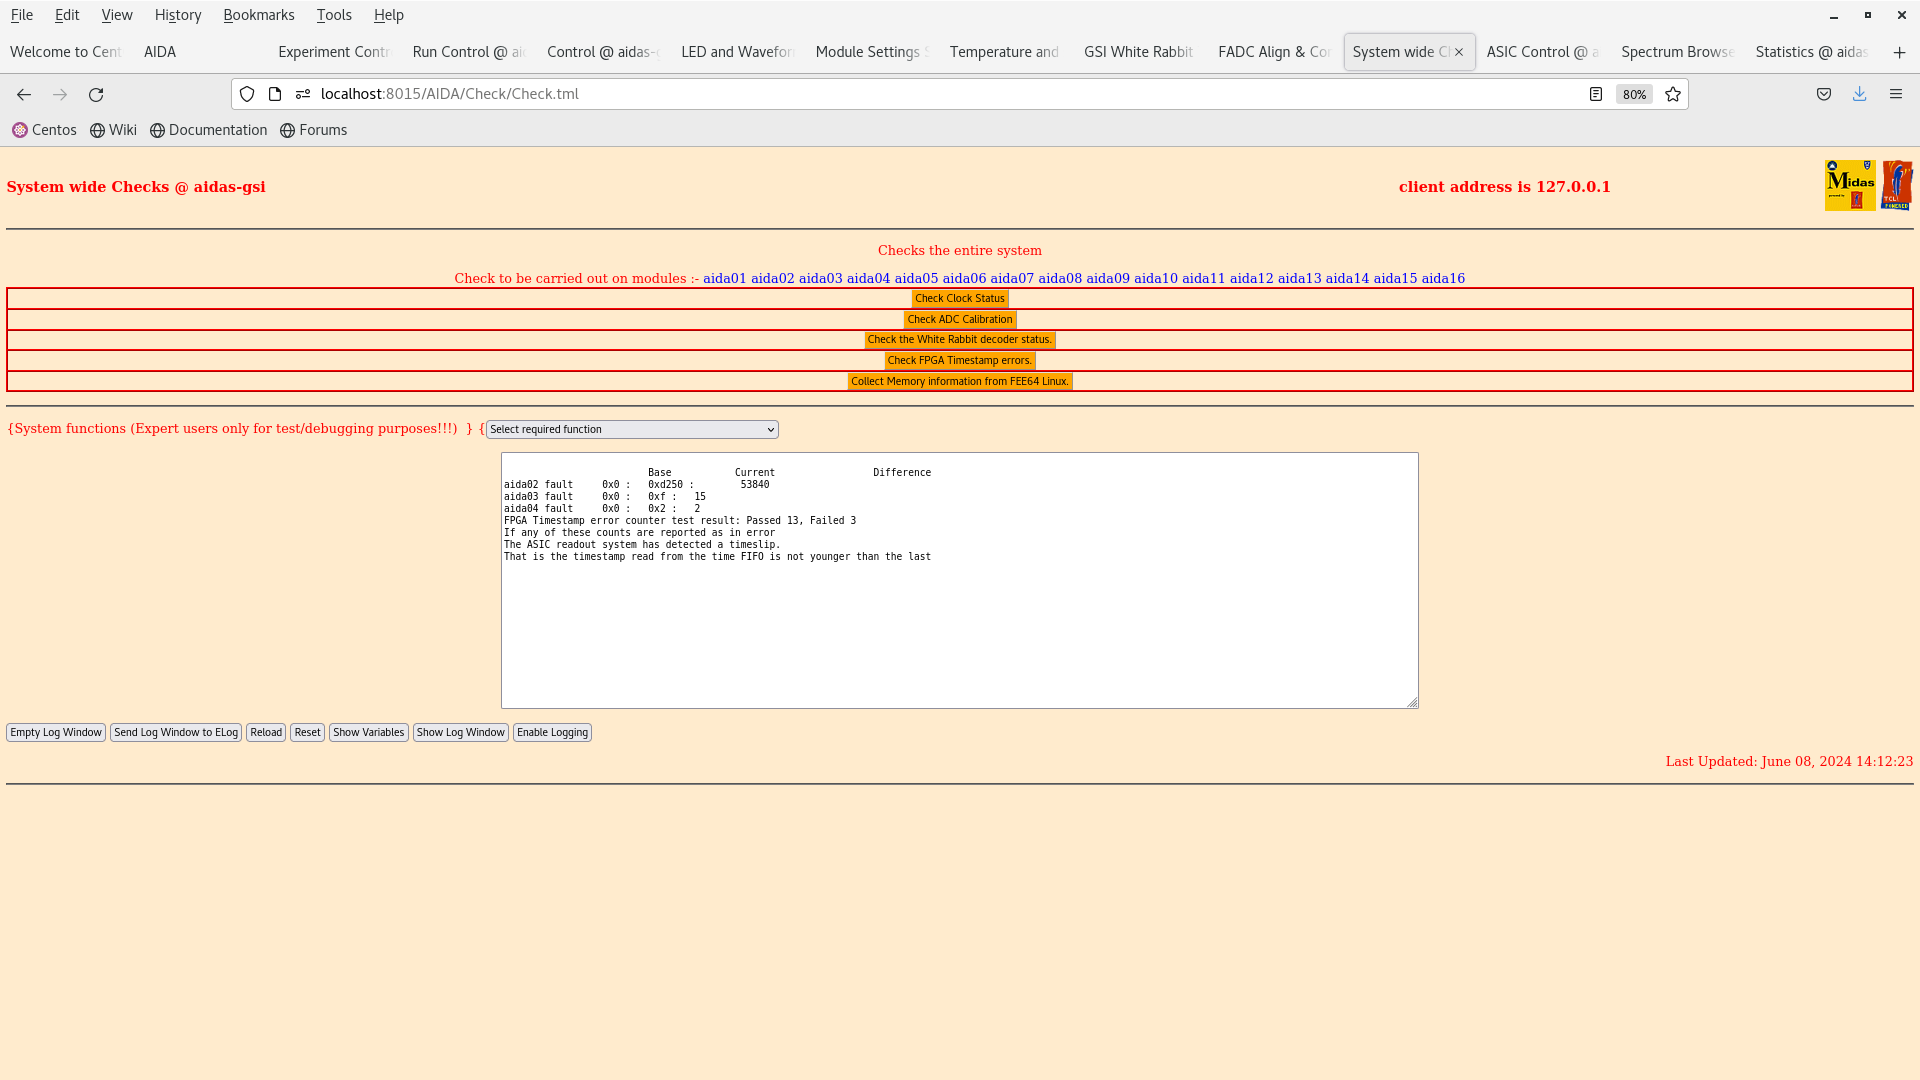
all system wide checks OK *except* attachments 6-7
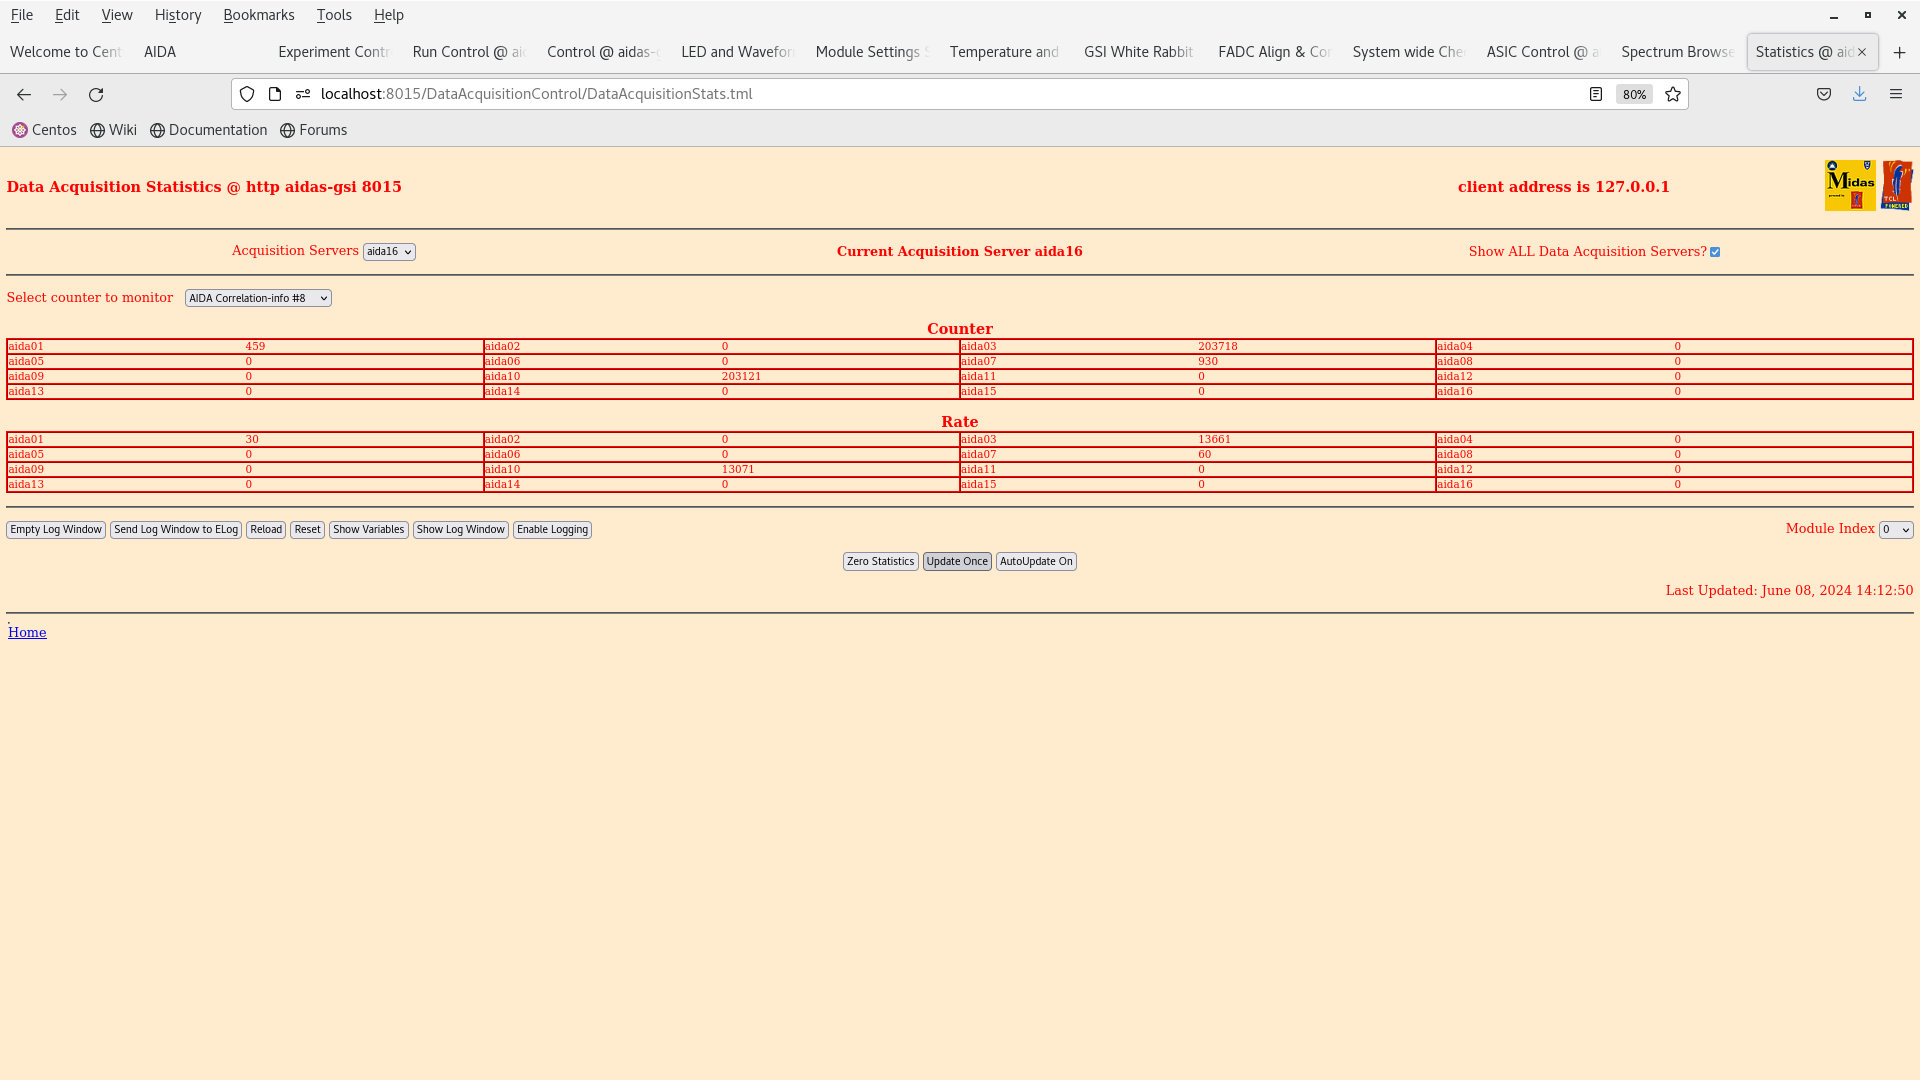
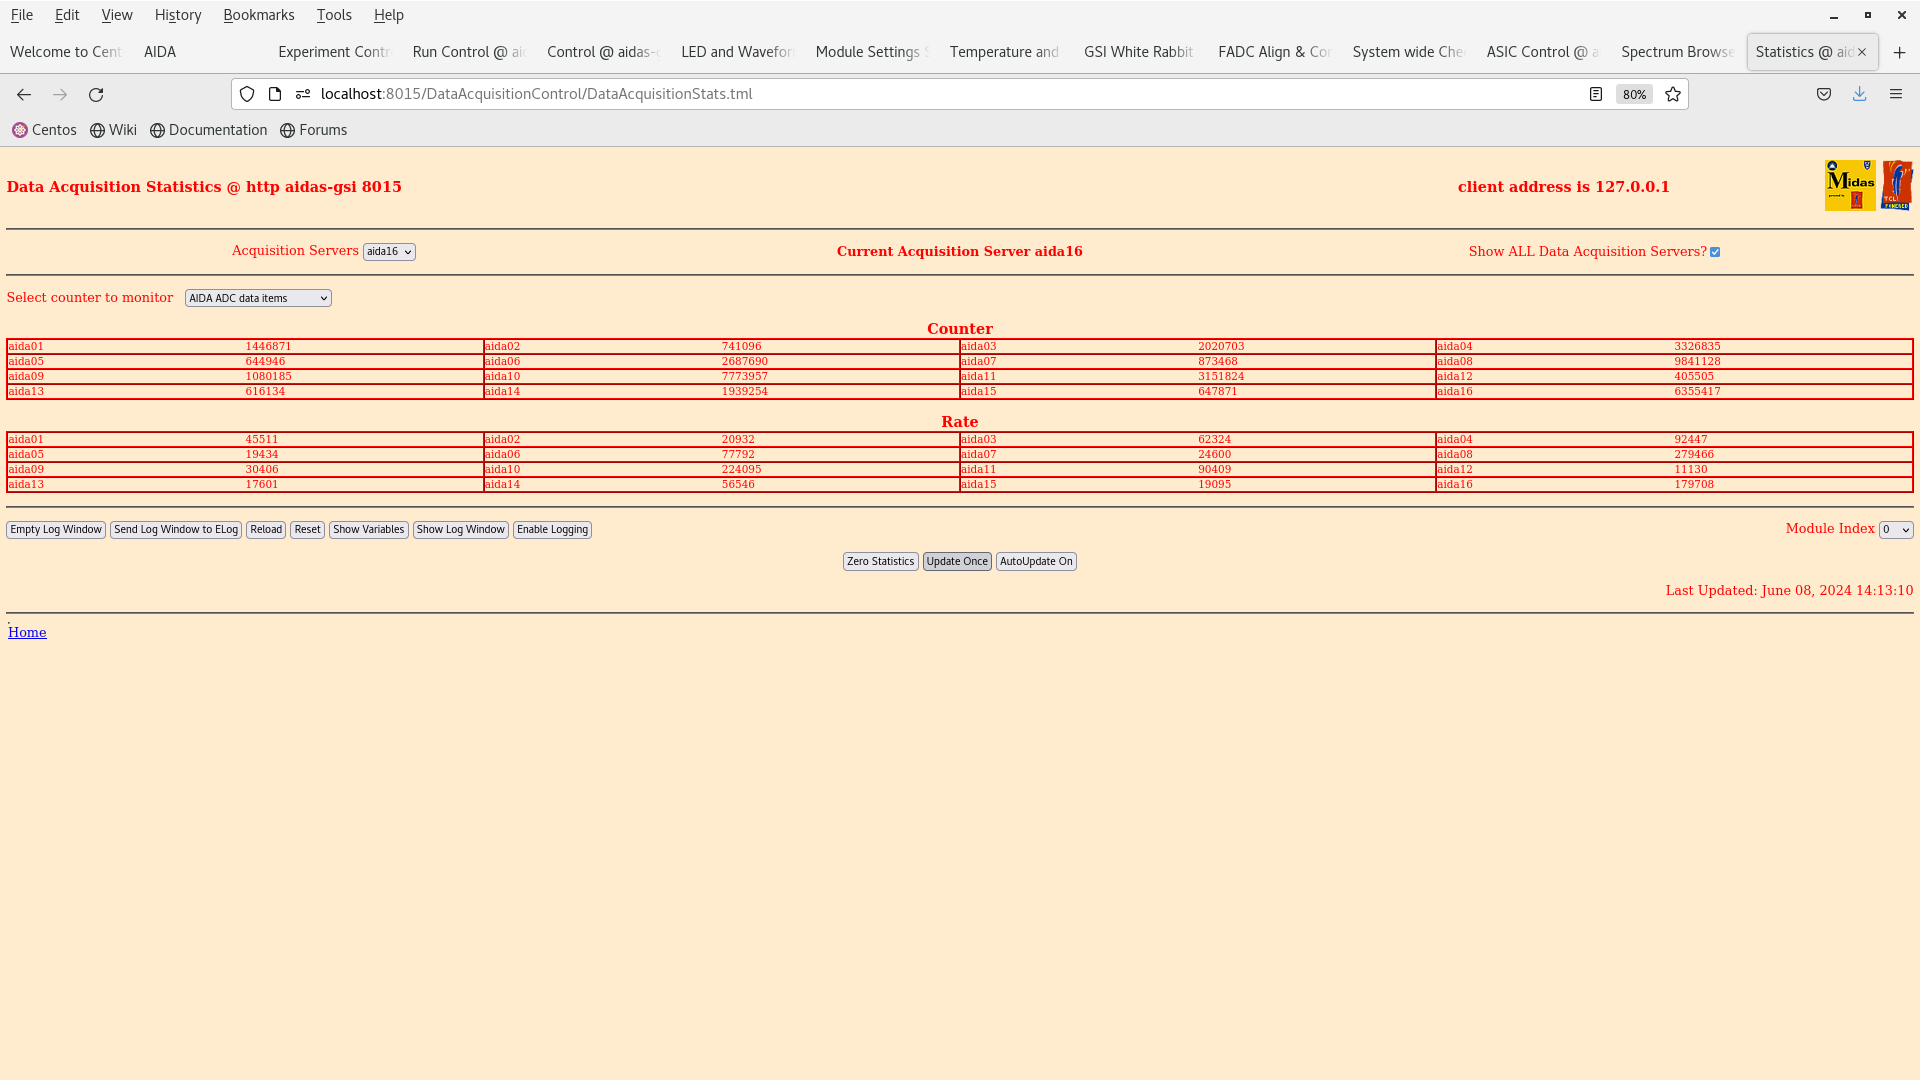
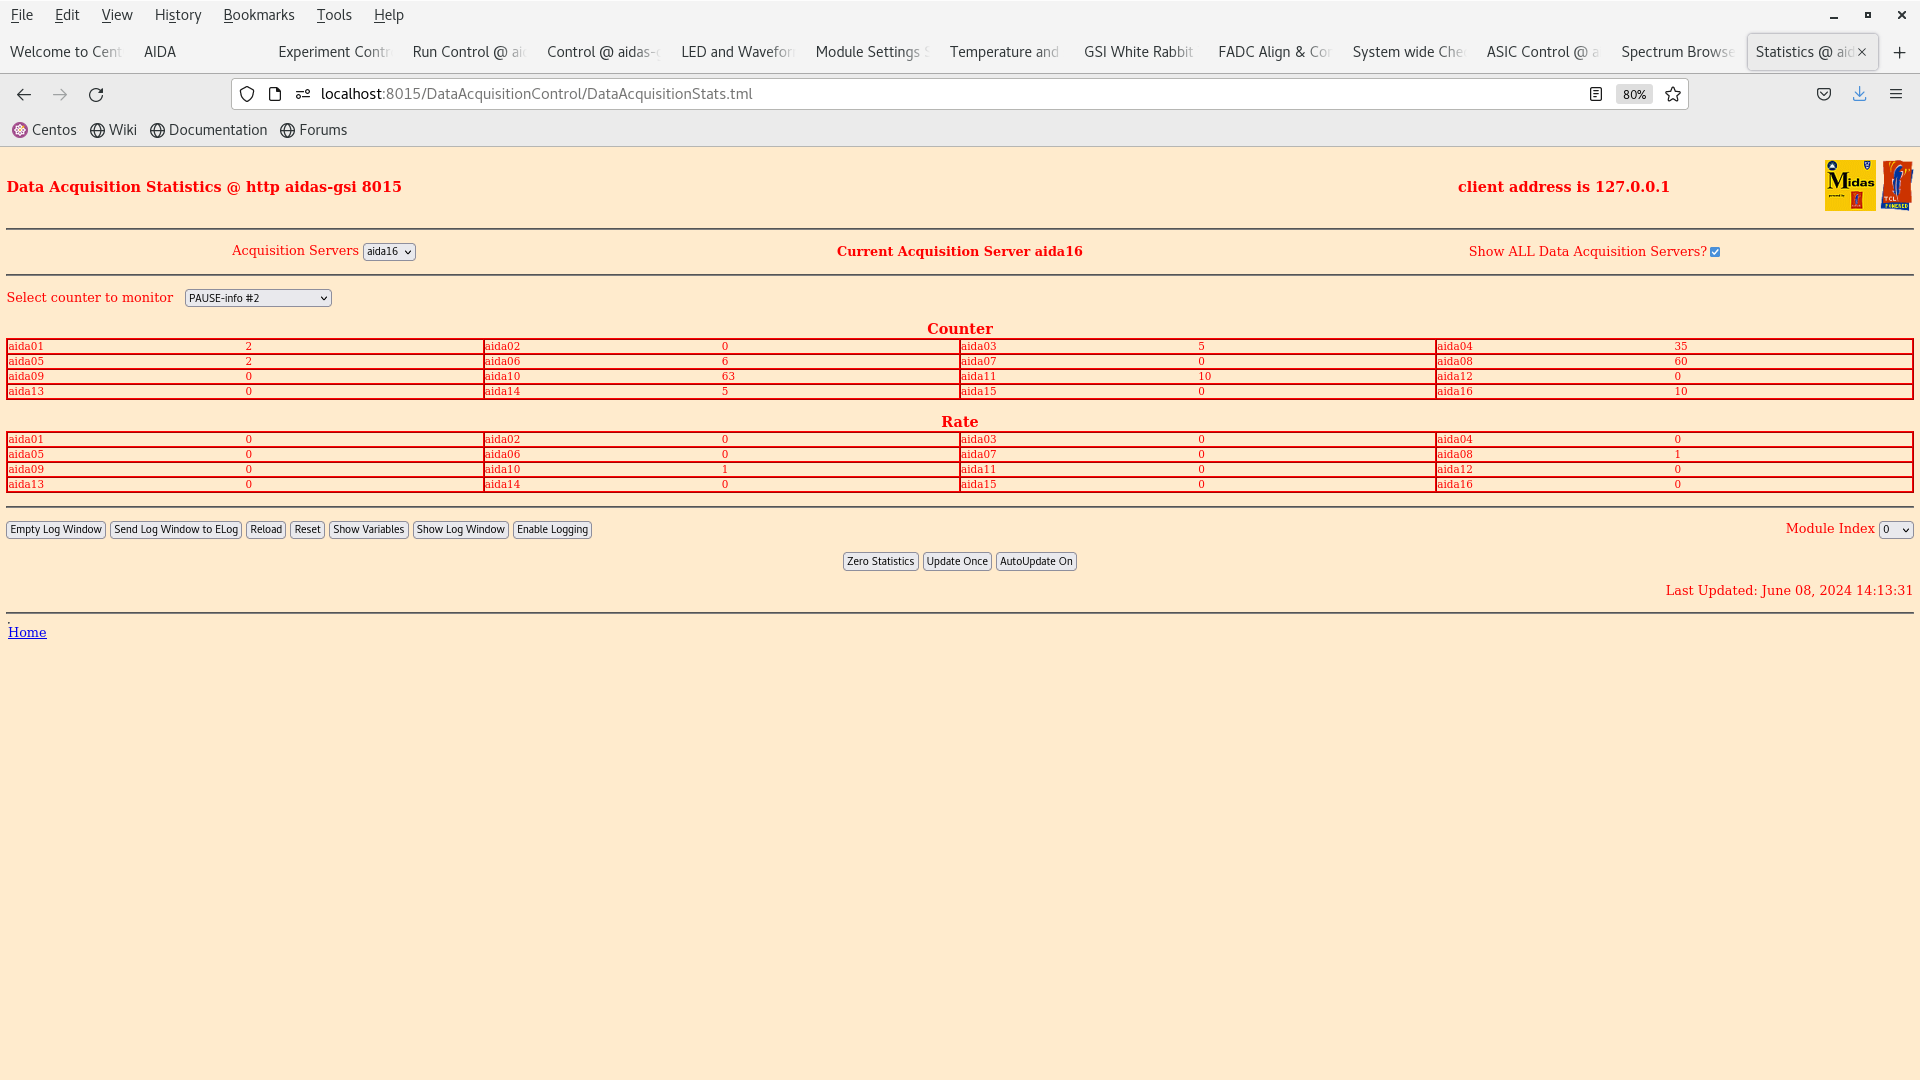
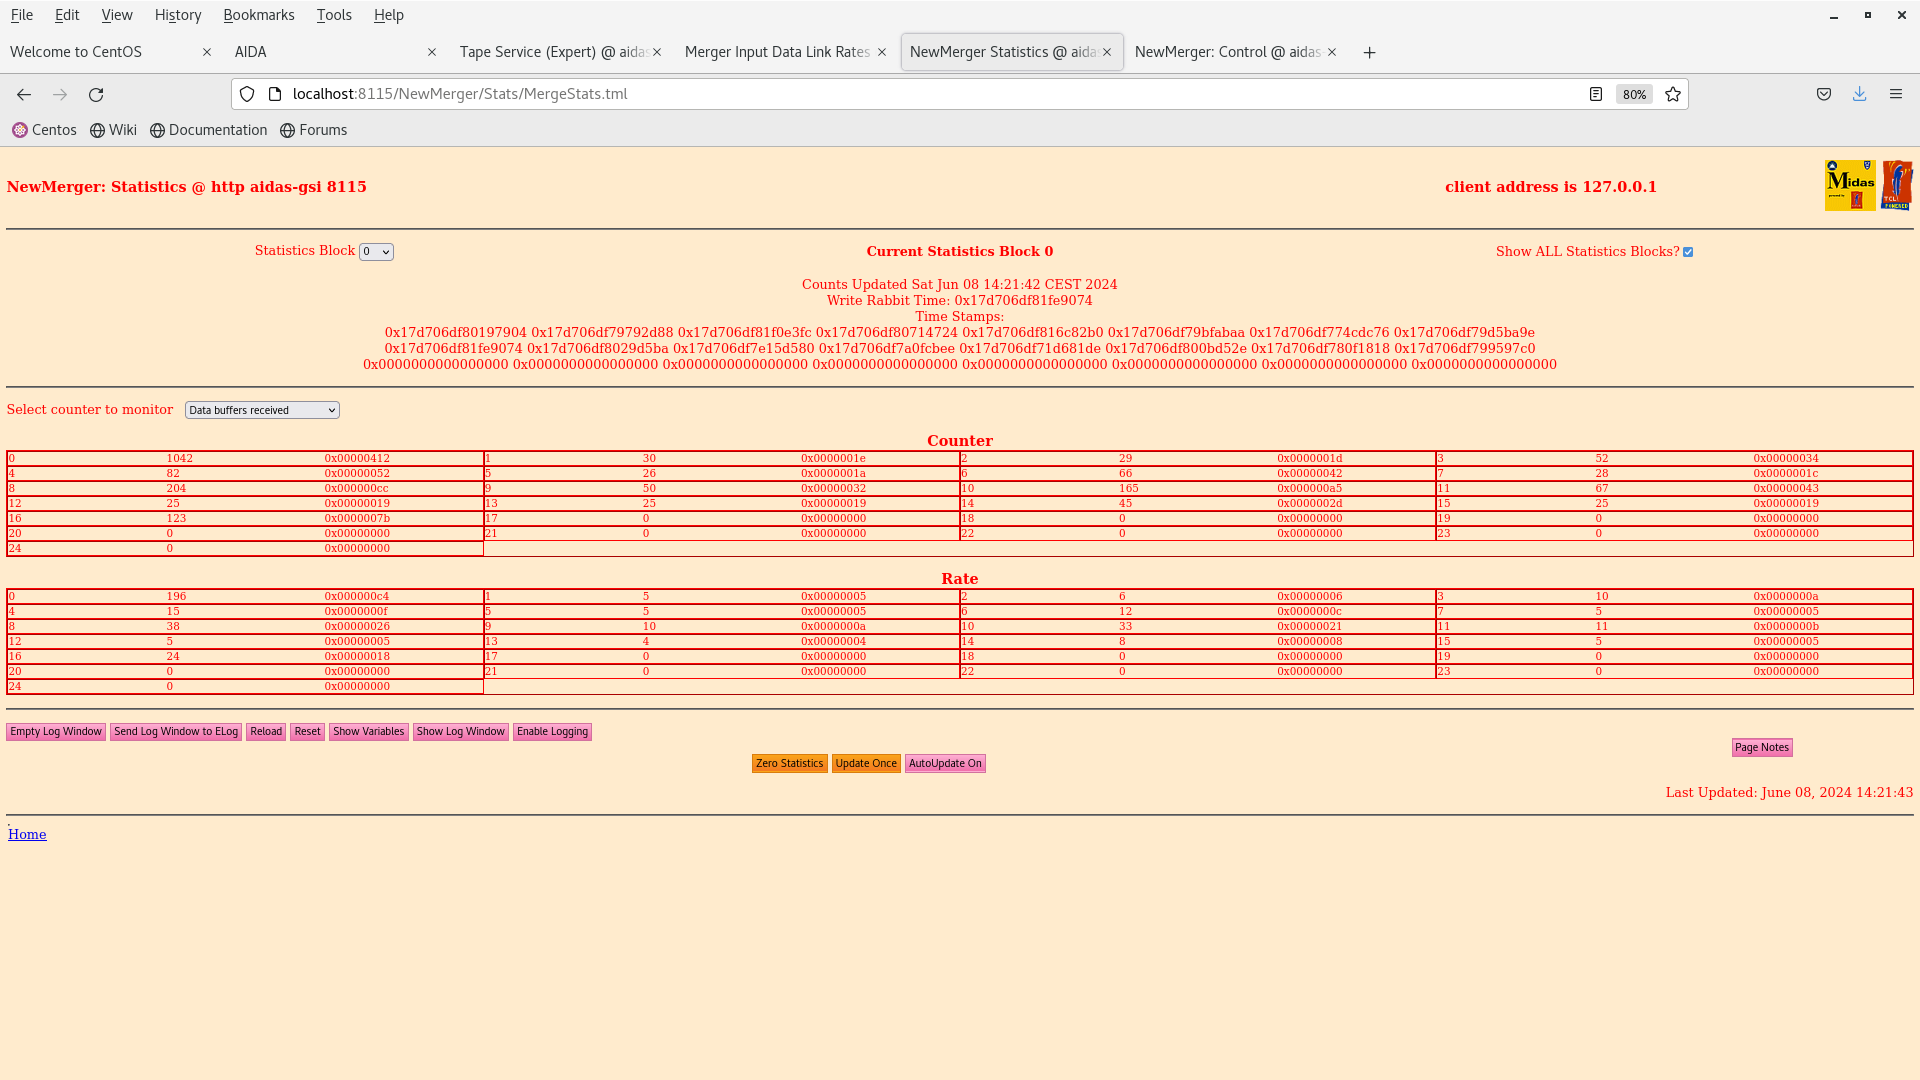
ADC, PAUSE and MBS correlation scaler data item stats - attachments 8-10
ADC data items rates high - source installed?
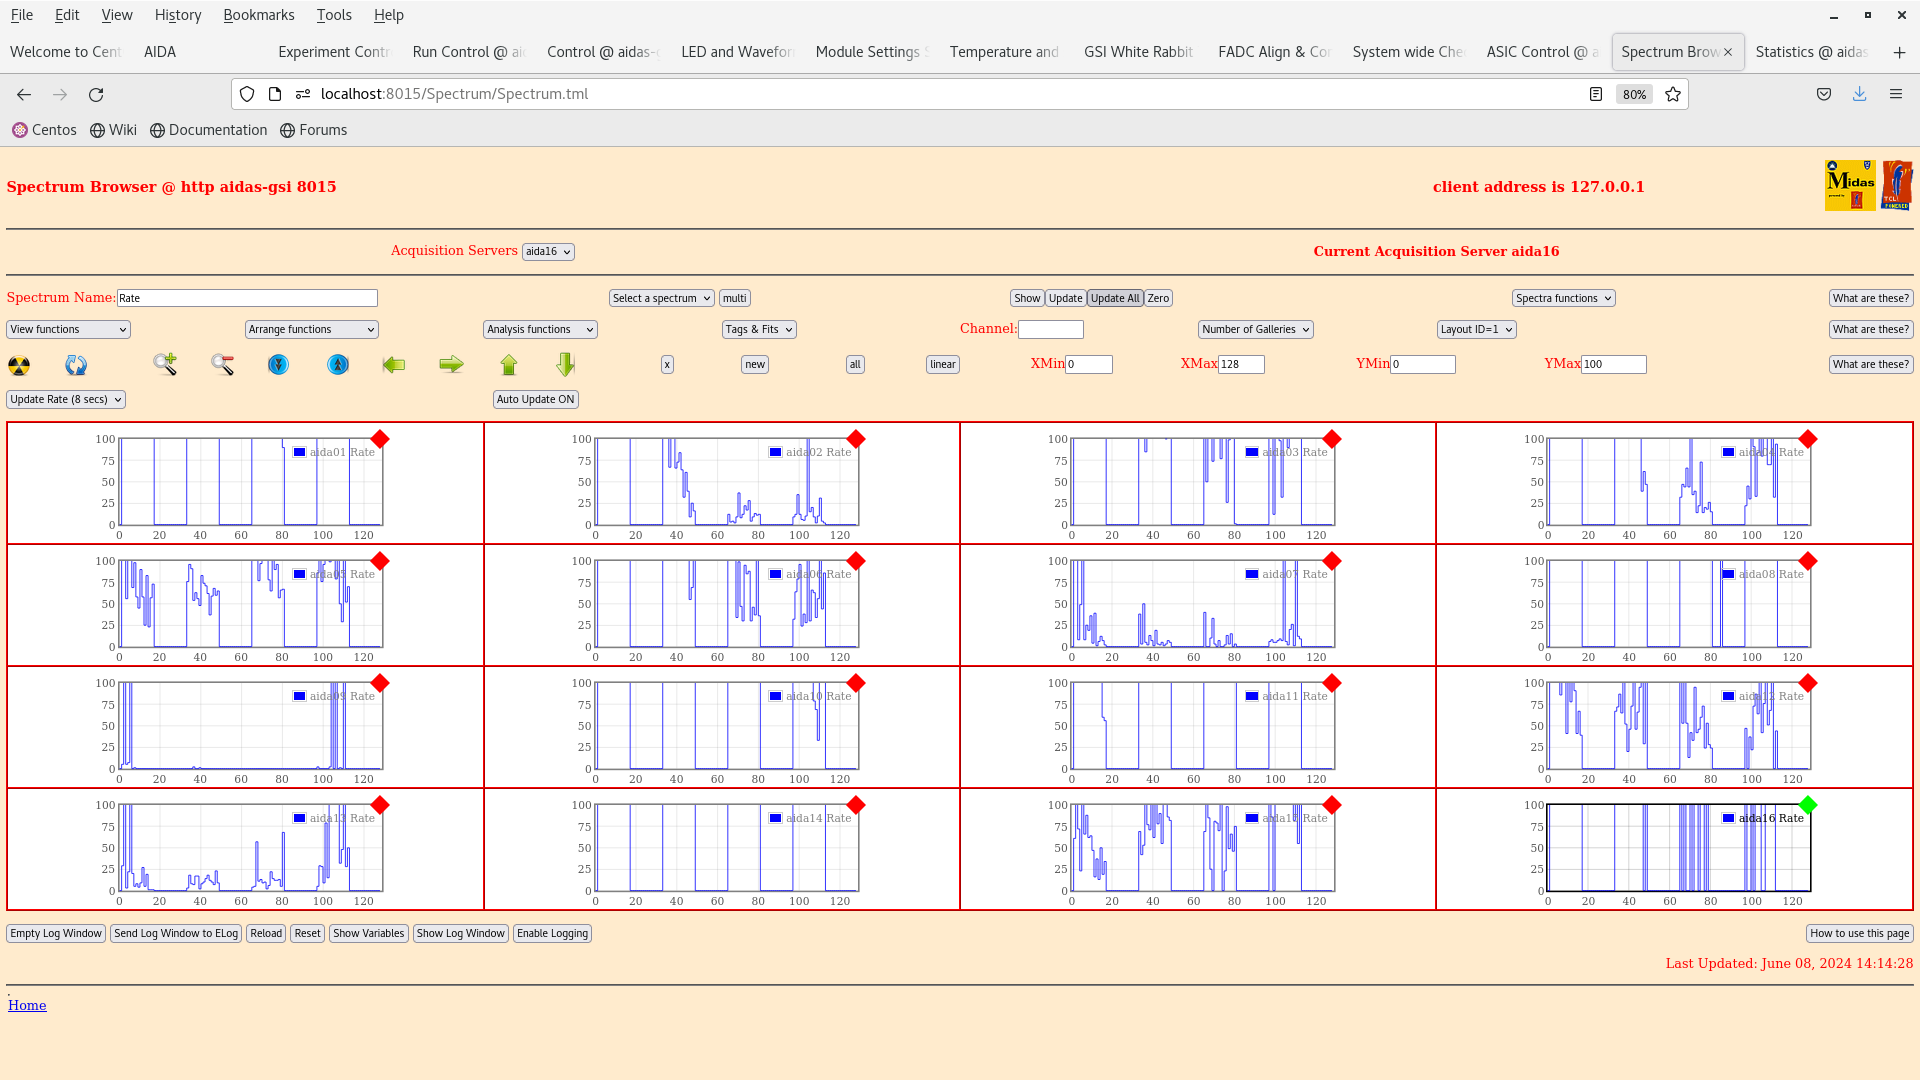
per FEE64 Rate spectra - attachments 11-13
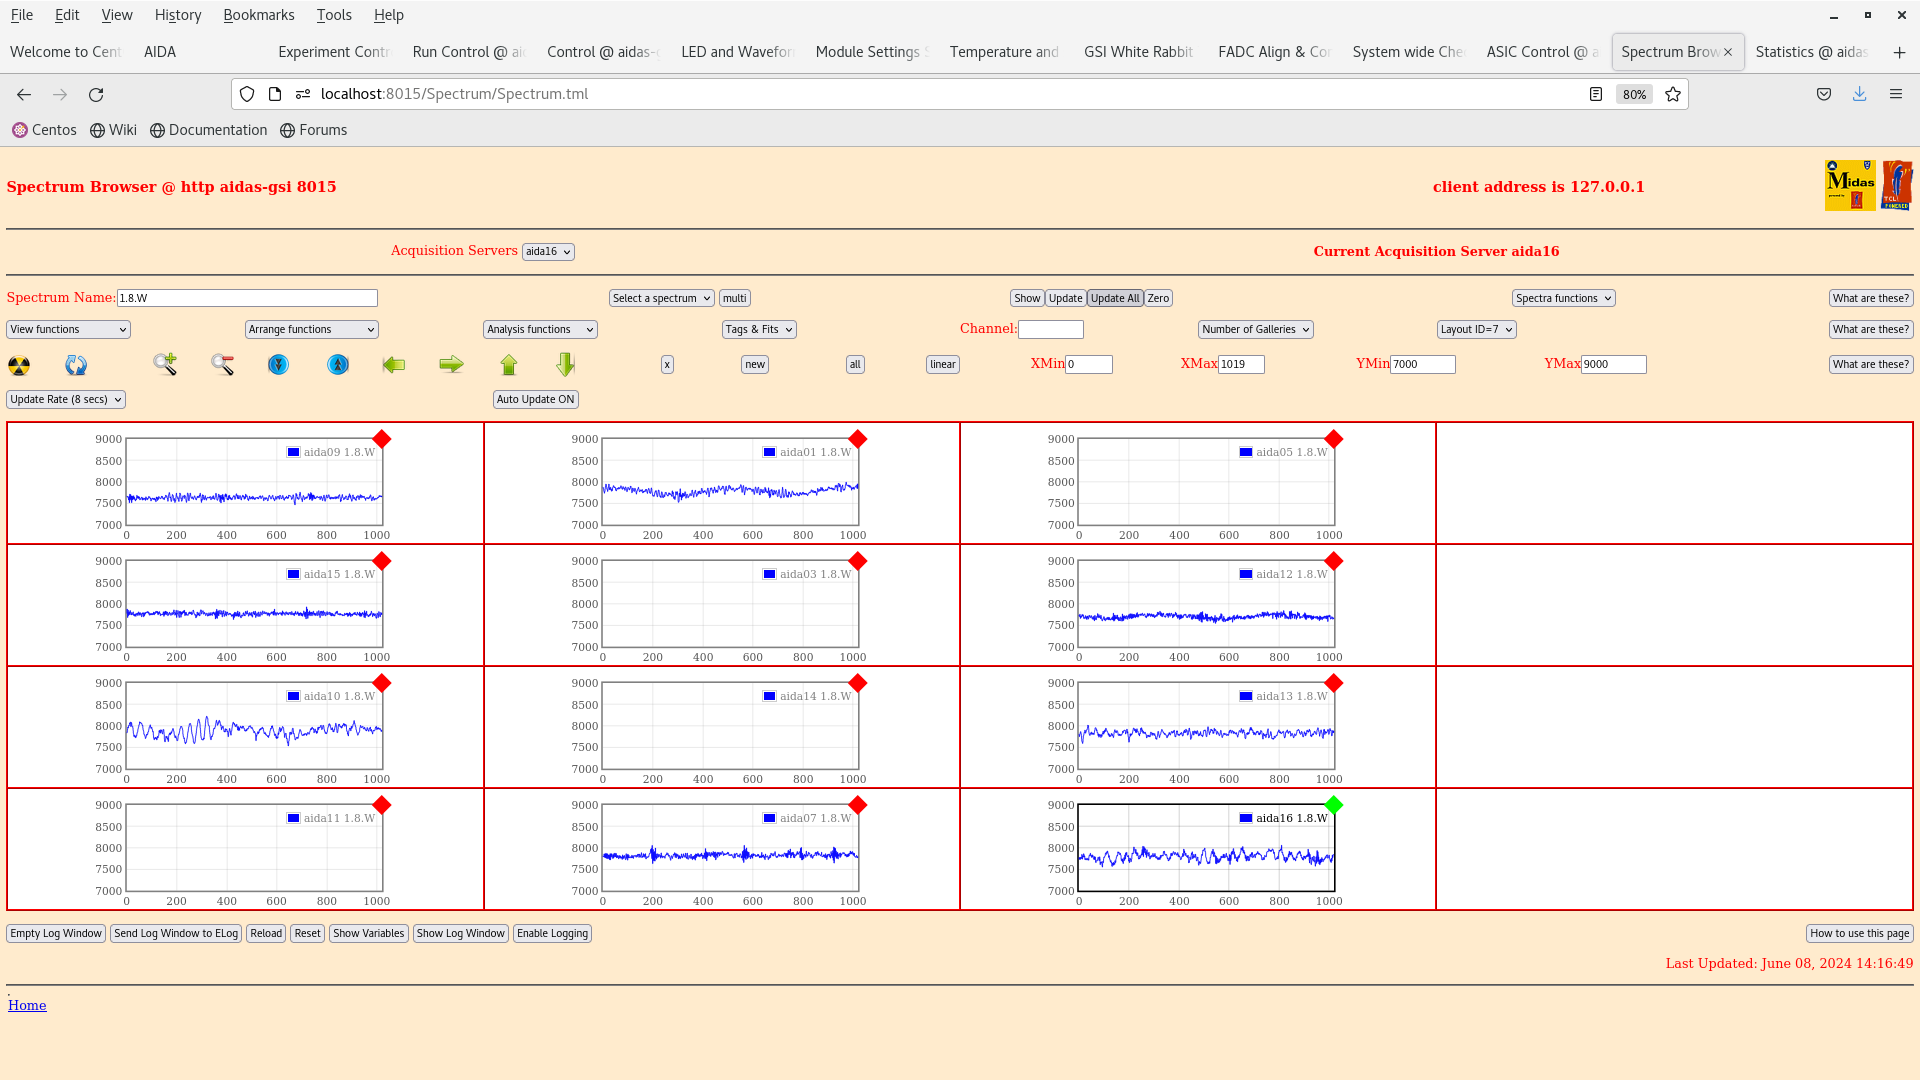
per FEE64 1.8.W spectra - 20us FSR - attachments 14-15
per p+n FEE64 1.8.L spectra - attachment 16
aida09 pulser peak width 60 ch FWHM
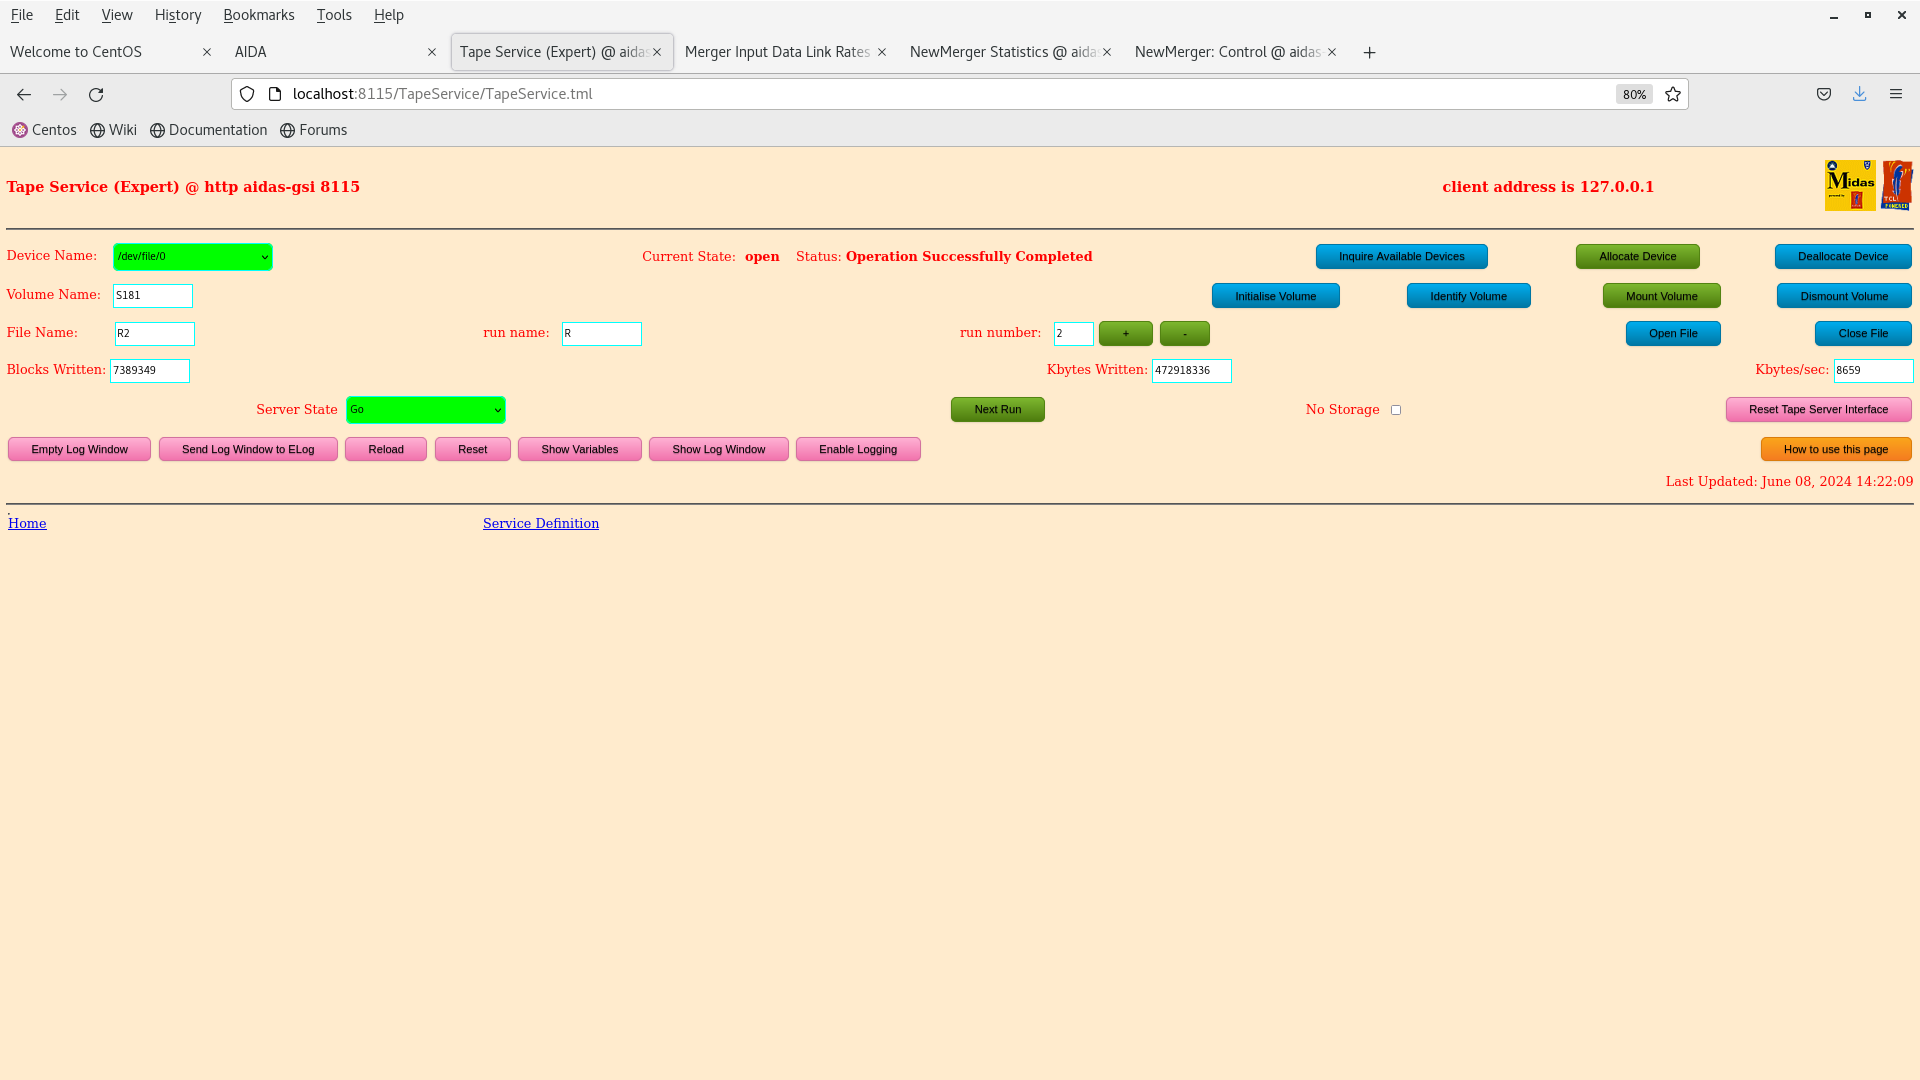
Merger, TapeServer etc - attachments 17-19
data file S181/R2_249 switch TapeServer to No Storage mode
per p+n FEE64 1.8.W spectra - 20us FSR - attachment 20
20.33 DSSSD bias & leakage current OK - attachments 21
FEE64 temperatures OK - attachment 22
ADC data item stats - attachment 23
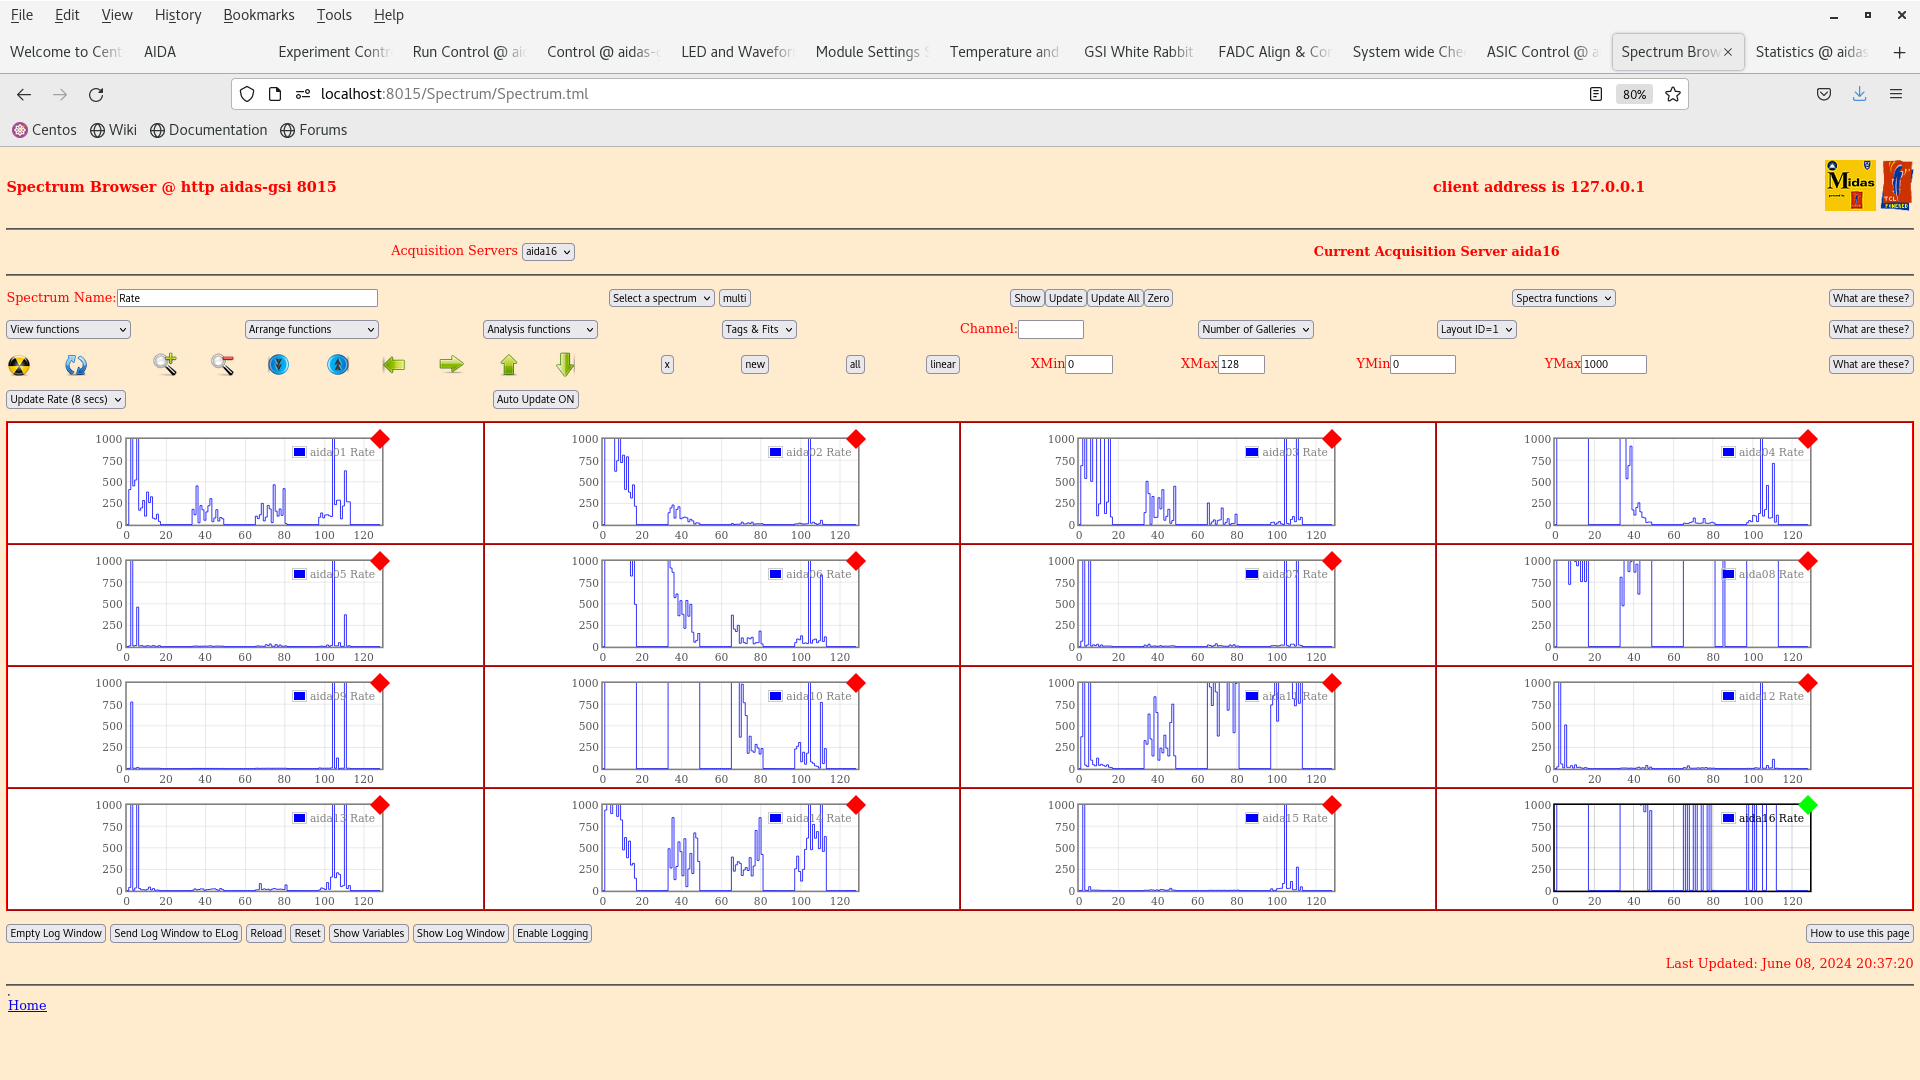
per FEE64 Rate spectra - attachment 24 |
Attachment 1: Screenshot_from_2024-06-08_14-07-37.png
|
|
Attachment 2: Screenshot_from_2024-06-08_14-07-52.png
|
|
Attachment 3: Screenshot_from_2024-06-08_14-08-47.png
|
|
Attachment 4: Screenshot_from_2024-06-08_14-08-21.png
|
|
Attachment 5: Screenshot_from_2024-06-08_14-11-30.png
|
|
Attachment 6: Screenshot_from_2024-06-08_14-12-20.png
|
|
Attachment 7: Screenshot_from_2024-06-08_14-12-25.png
|
|
Attachment 8: Screenshot_from_2024-06-08_14-12-53.png
|
|
Attachment 9: Screenshot_from_2024-06-08_14-13-12.png
|
|
Attachment 10: Screenshot_from_2024-06-08_14-13-34.png
|
|
Attachment 11: Screenshot_from_2024-06-08_14-14-41.png
|
|
Attachment 12: Screenshot_from_2024-06-08_14-14-48.png
|
|
Attachment 13: Screenshot_from_2024-06-08_14-14-54.png
|
|
Attachment 14: Screenshot_from_2024-06-08_14-16-54.png
|
|
Attachment 15: Screenshot_from_2024-06-08_14-17-49.png
|
|
Attachment 16: Screenshot_from_2024-06-08_14-20-04.png
|
|
Attachment 17: Screenshot_from_2024-06-08_14-21-31.png
|
|
Attachment 18: Screenshot_from_2024-06-08_14-22-05.png
|
|
Attachment 19: Screenshot_from_2024-06-08_14-22-12.png
|
|
Attachment 20: Screenshot_from_2024-06-08_14-46-36.png
|
|
Attachment 21: Screenshot_from_2024-06-08_20-33-56.png
|
|
Attachment 22: Screenshot_from_2024-06-08_20-36-17.png
|
|
Attachment 23: Screenshot_from_2024-06-08_20-36-50.png
|
|
Attachment 24: Screenshot_from_2024-06-08_20-37-34.png
|
|
422
|
Sat May 7 09:55:53 2022 |
TD | Saturday 7 May |
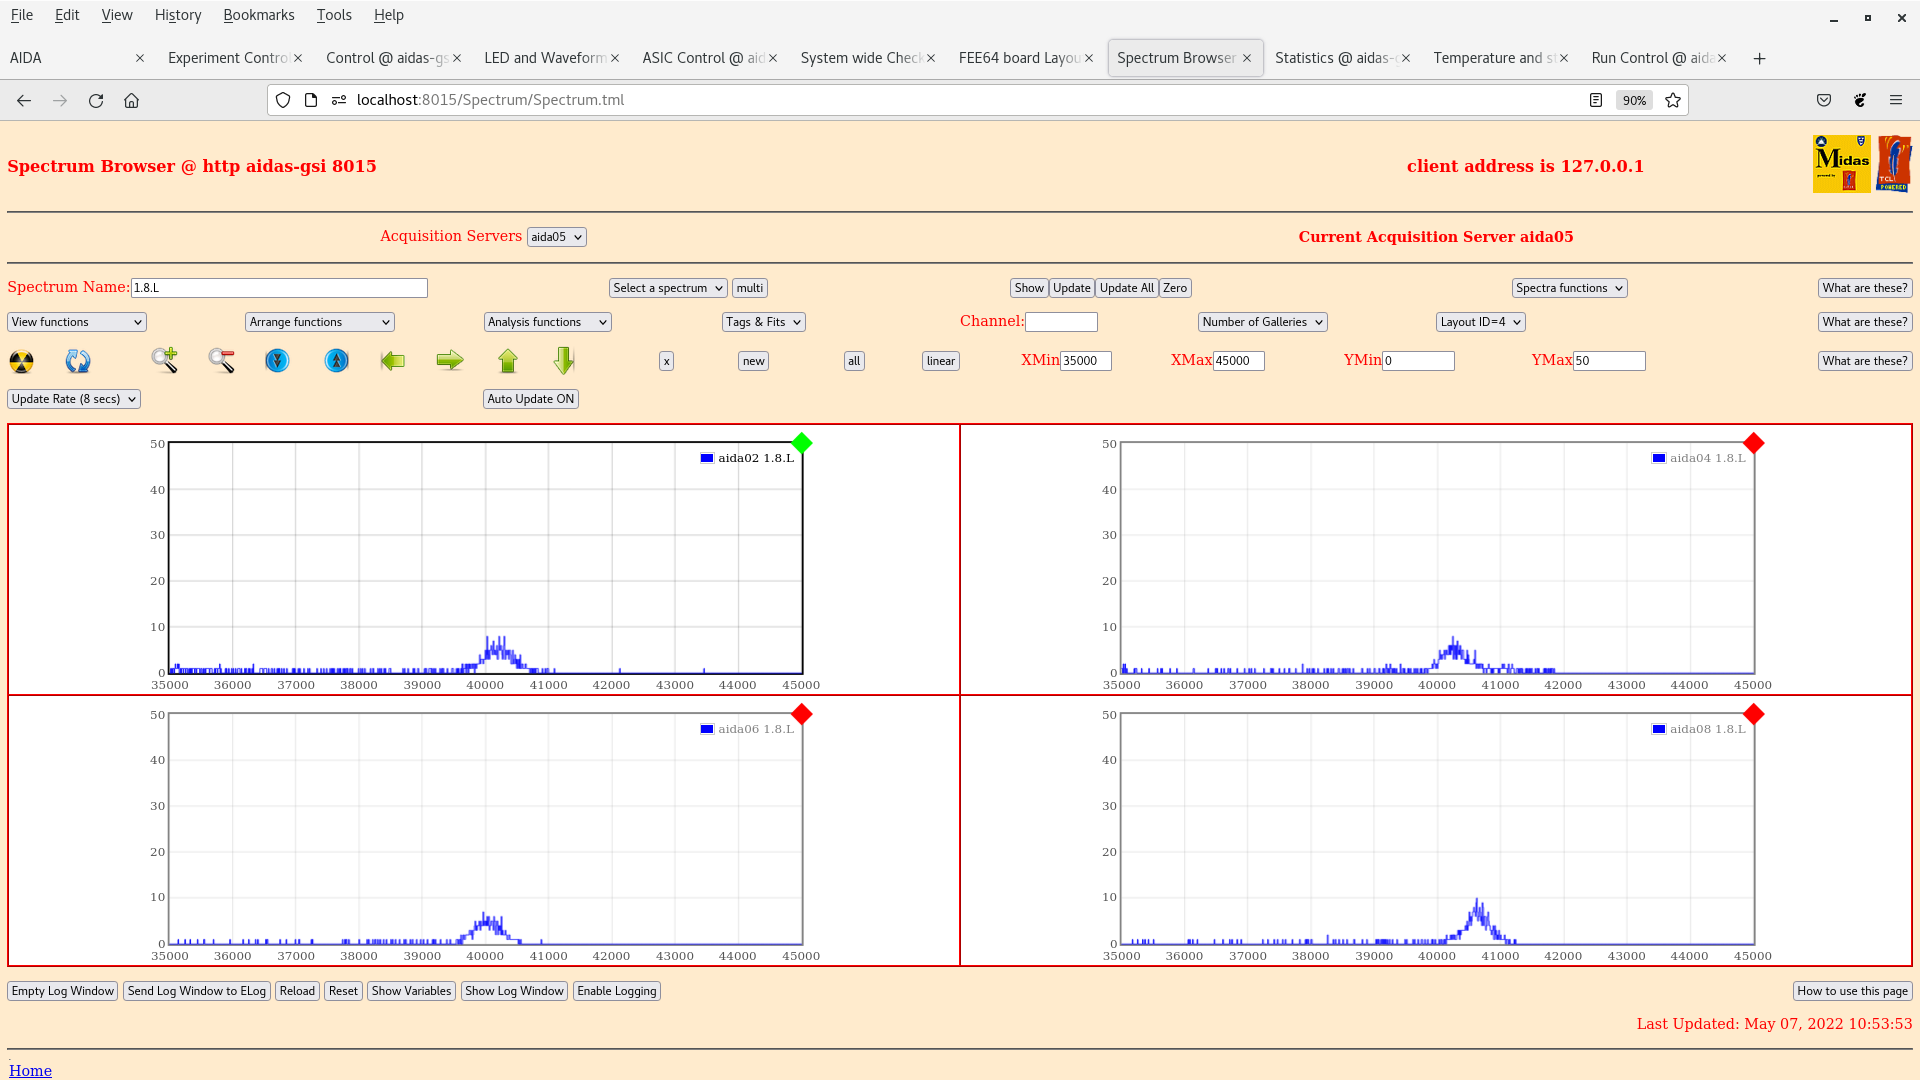
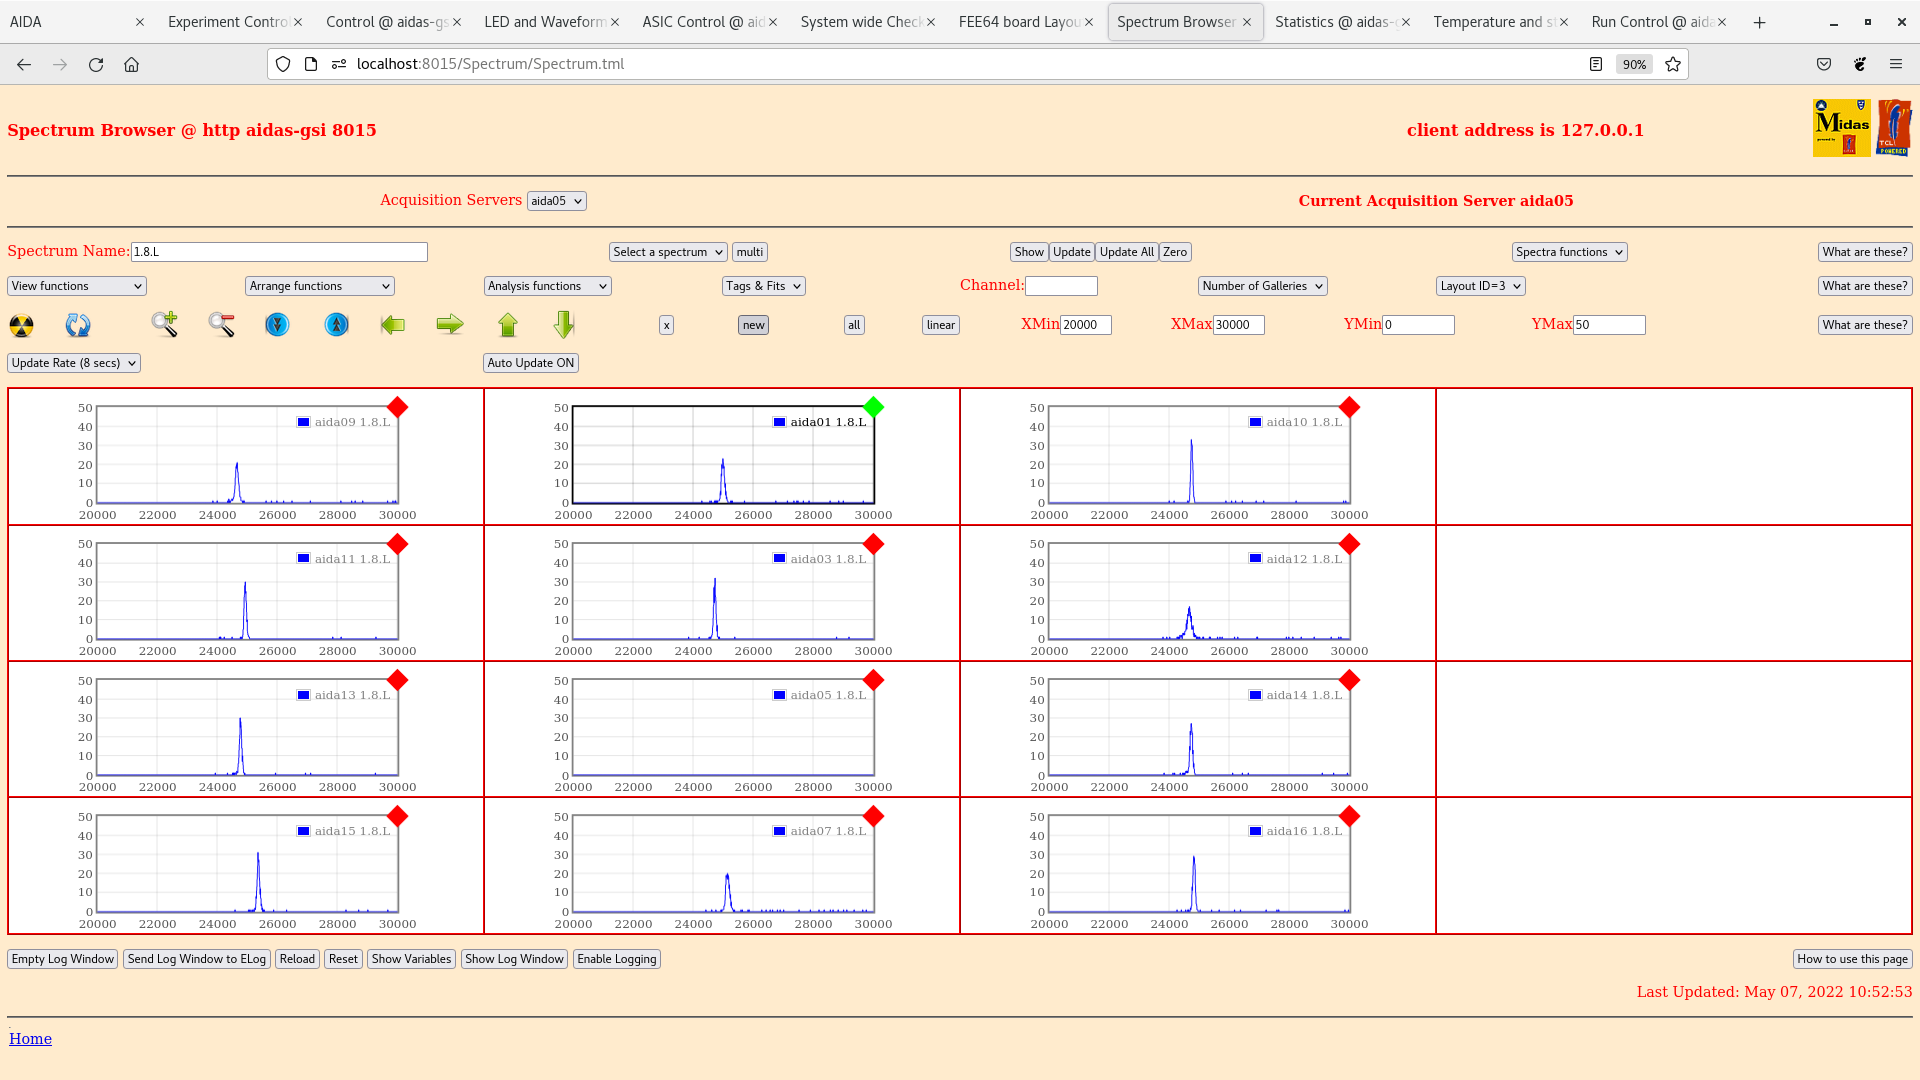
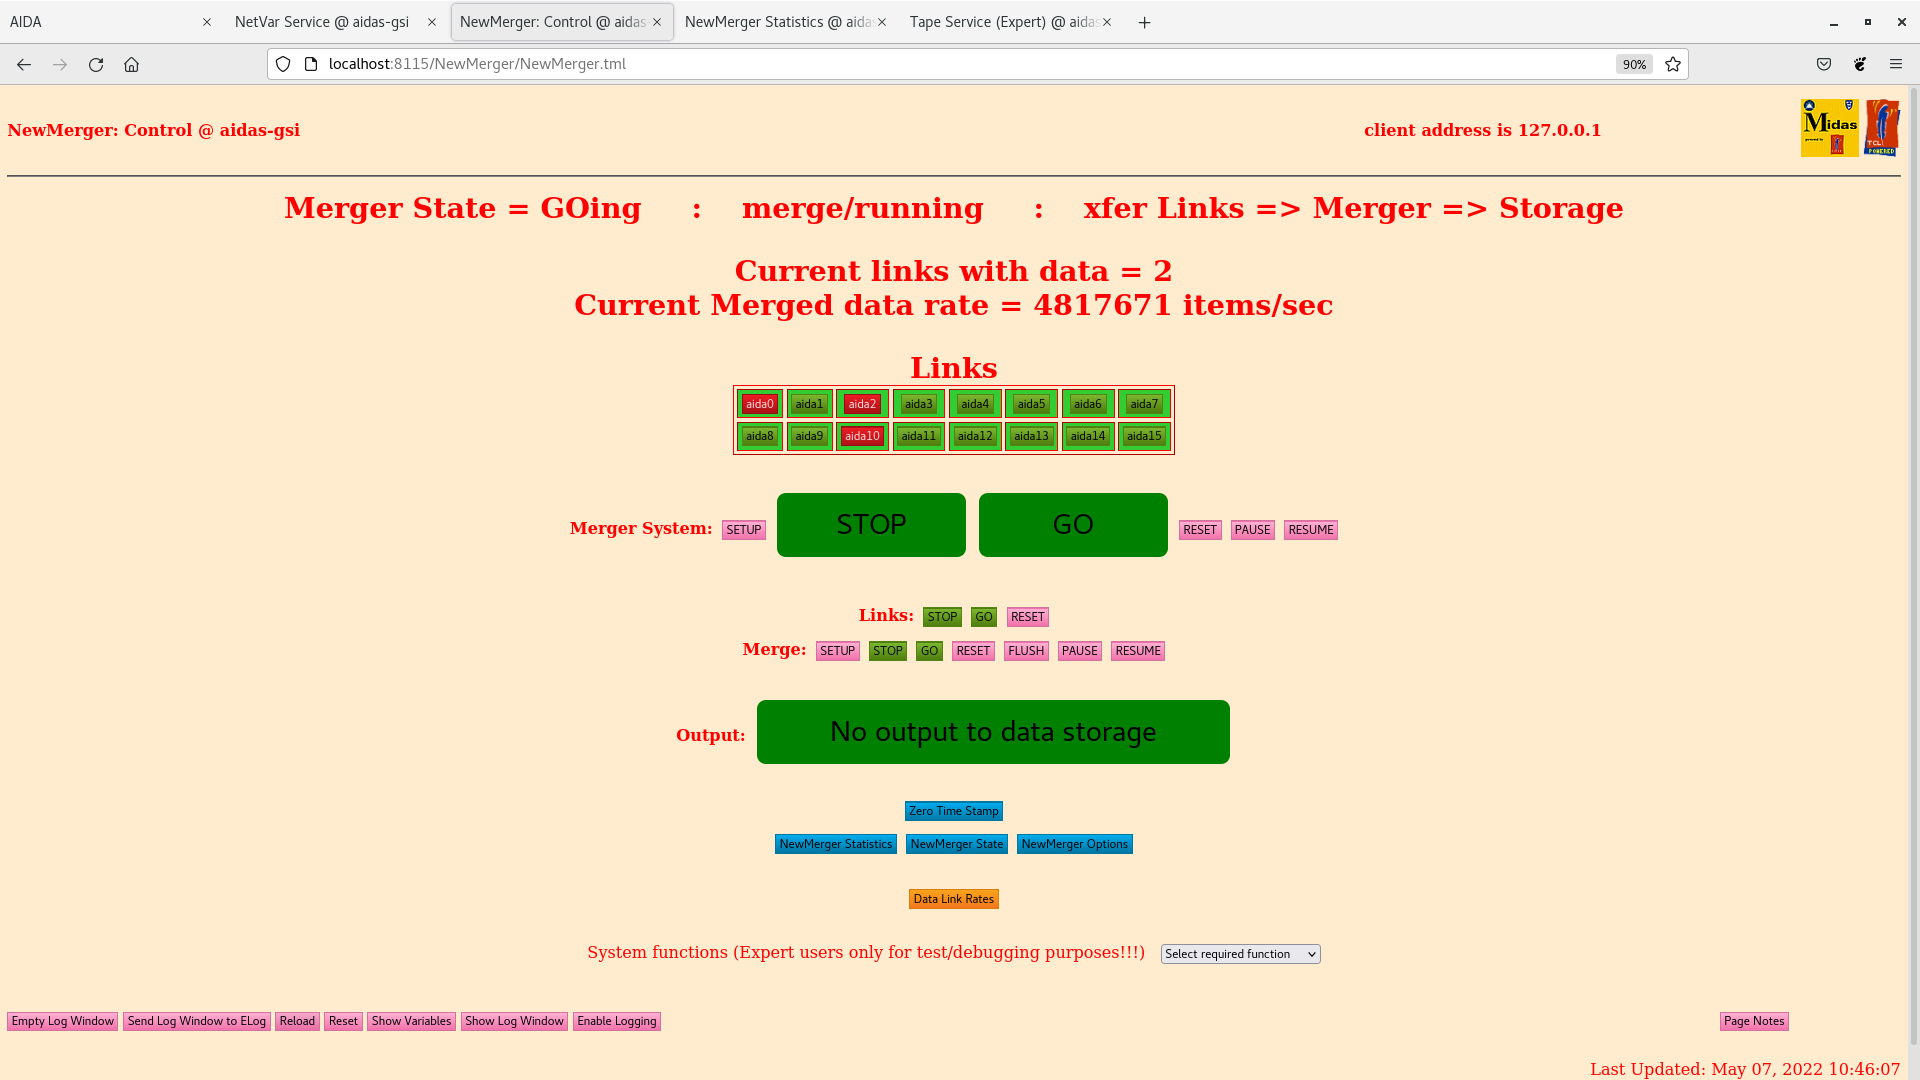
Attachments 1 & 2 per FEE64 1.8.L spectra
pulser peak widths aida01 121 ch FWHM, aida02 517 ch FWHM
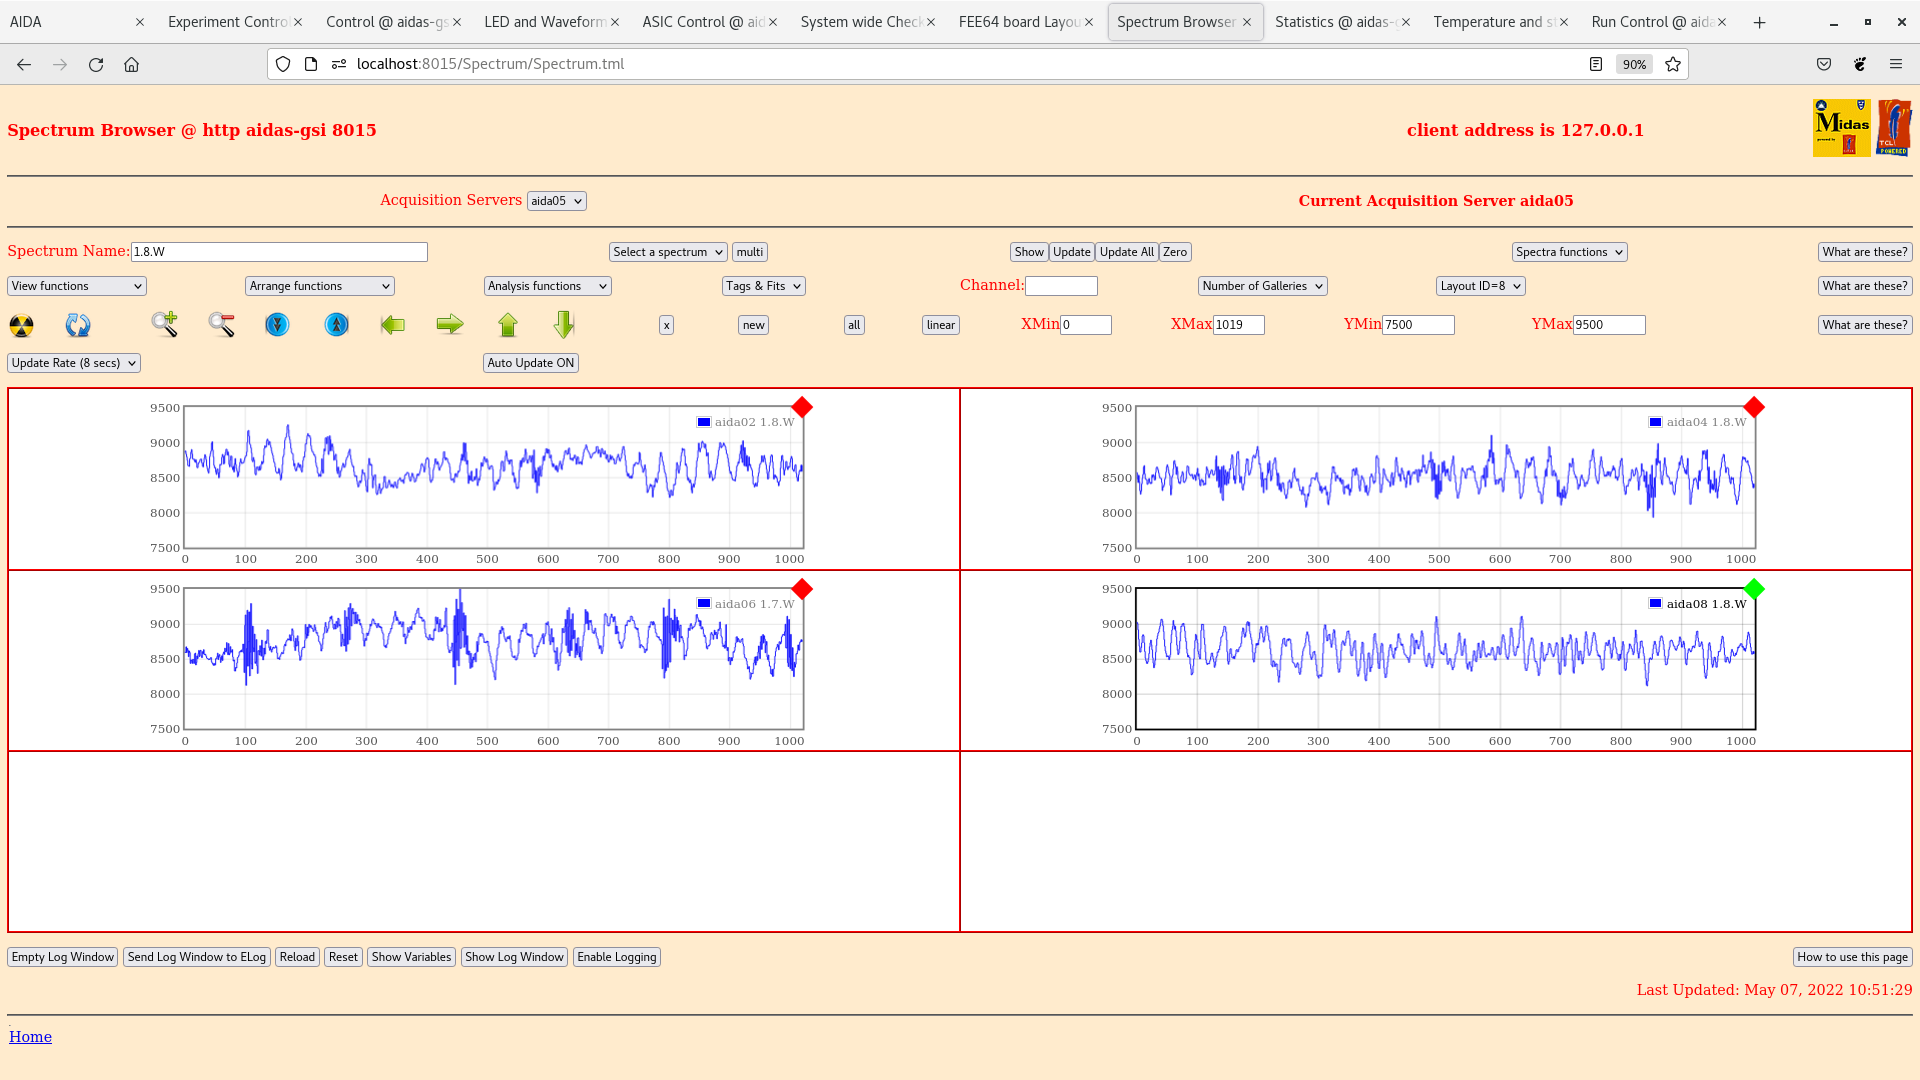
Attachments 3 & 4 per FEE64 1.8.W spectra 20us FSR
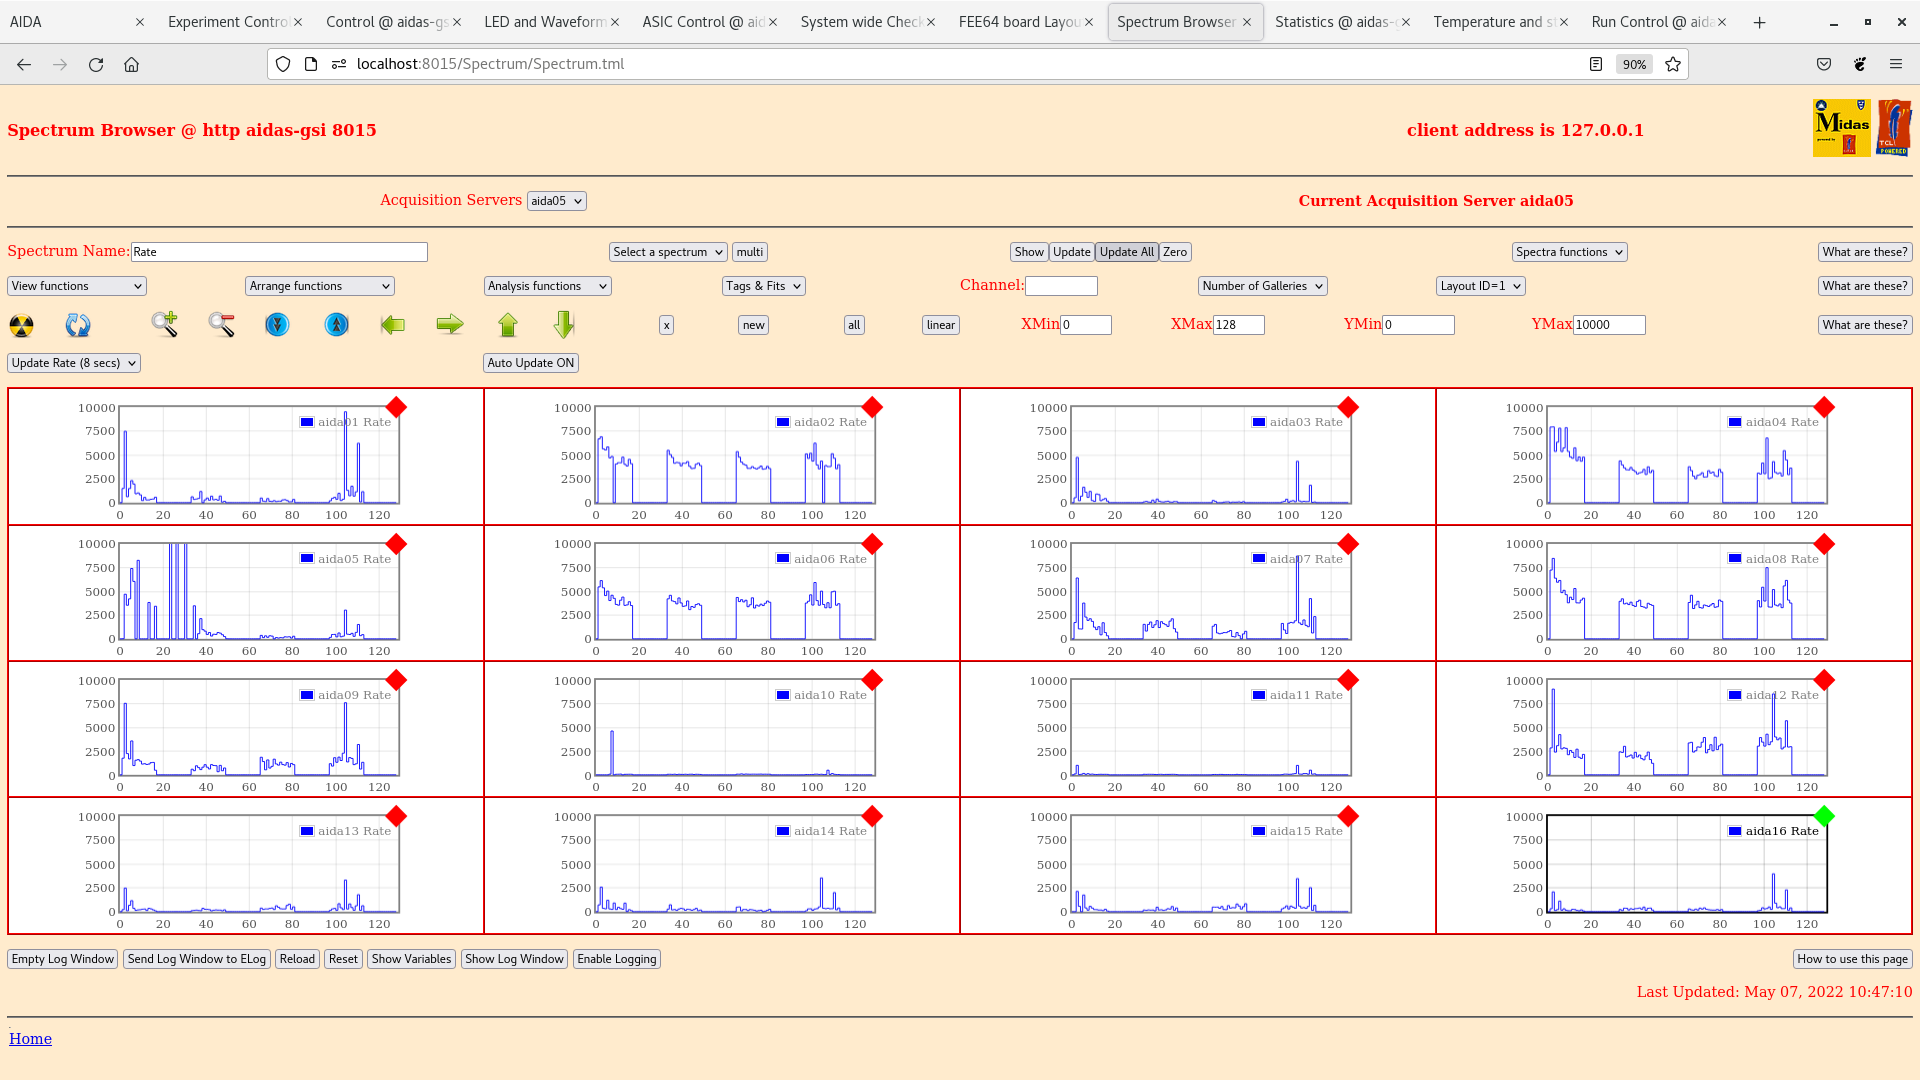
Attachment 5 per FEE64 rate spectra
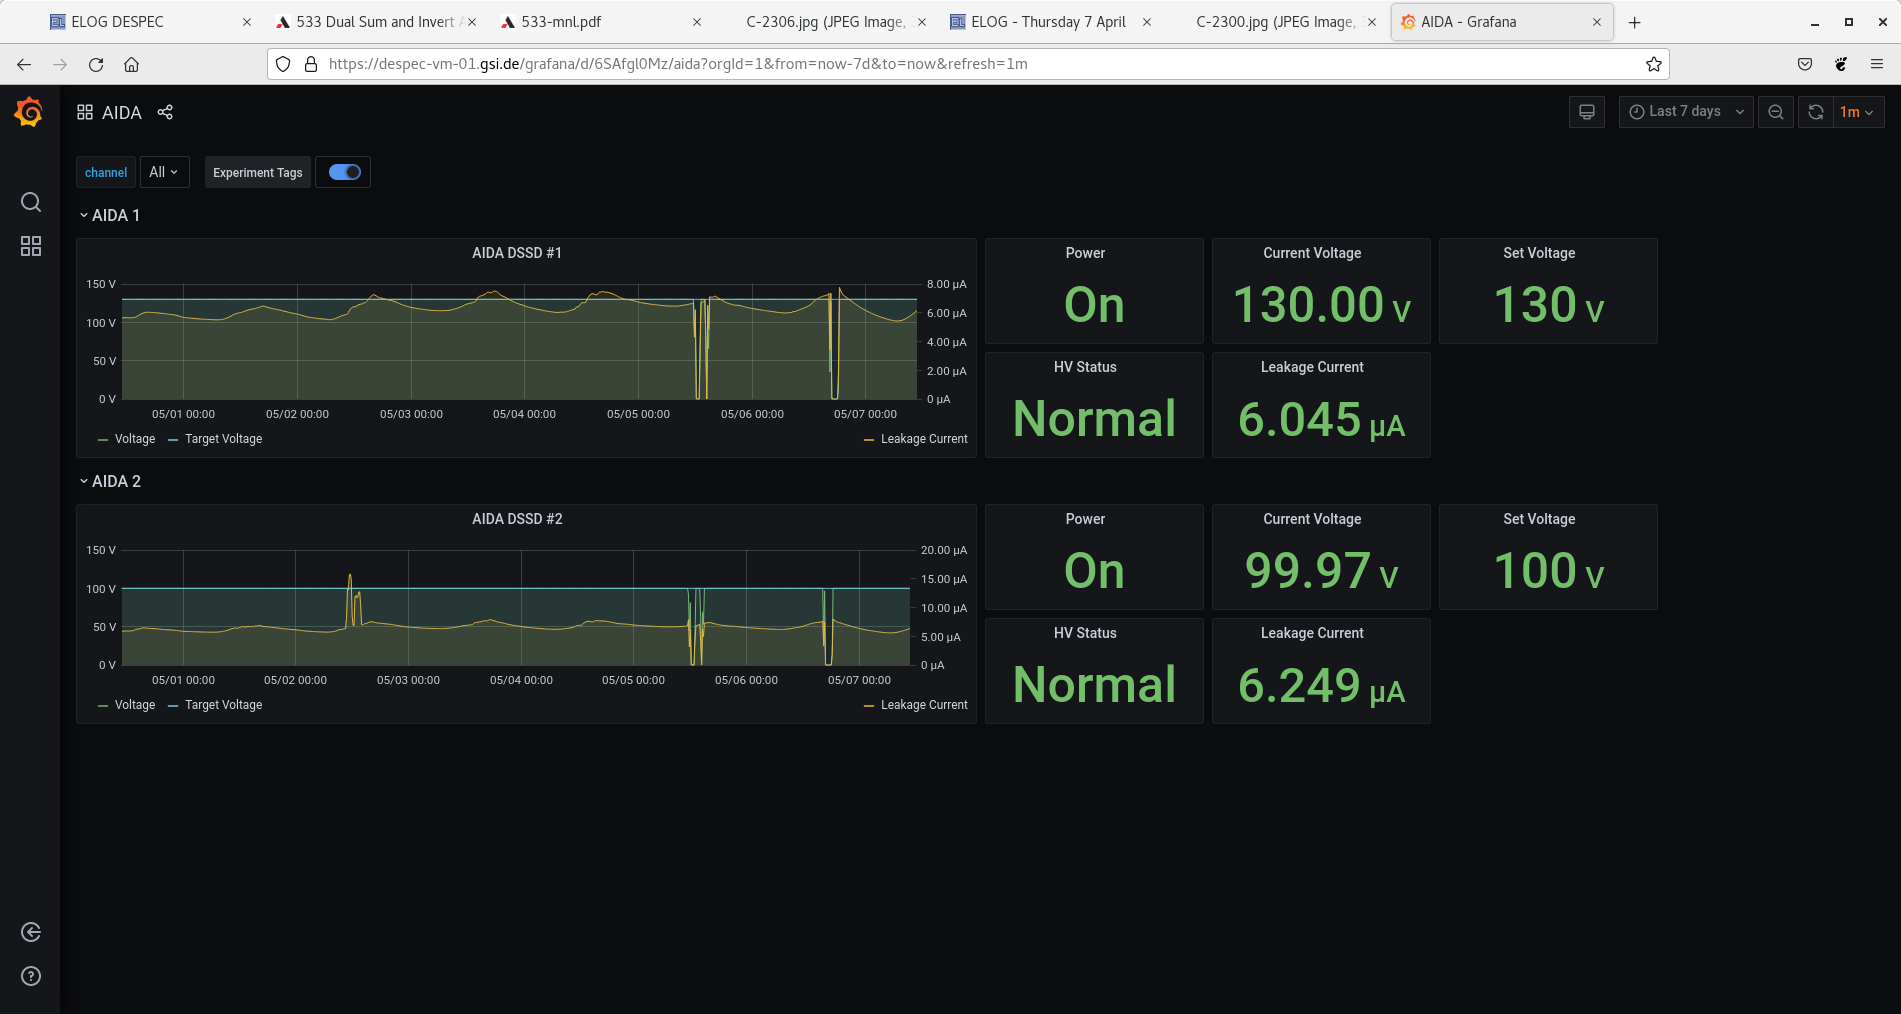
Attachment 6 - grafana DSSSD bias/leakage current for previous 7 days showing effect of day/night temp variations
Attachments 7 & 8 - merger & tape server c. 14Mb/s to disk - no errors reported by servers
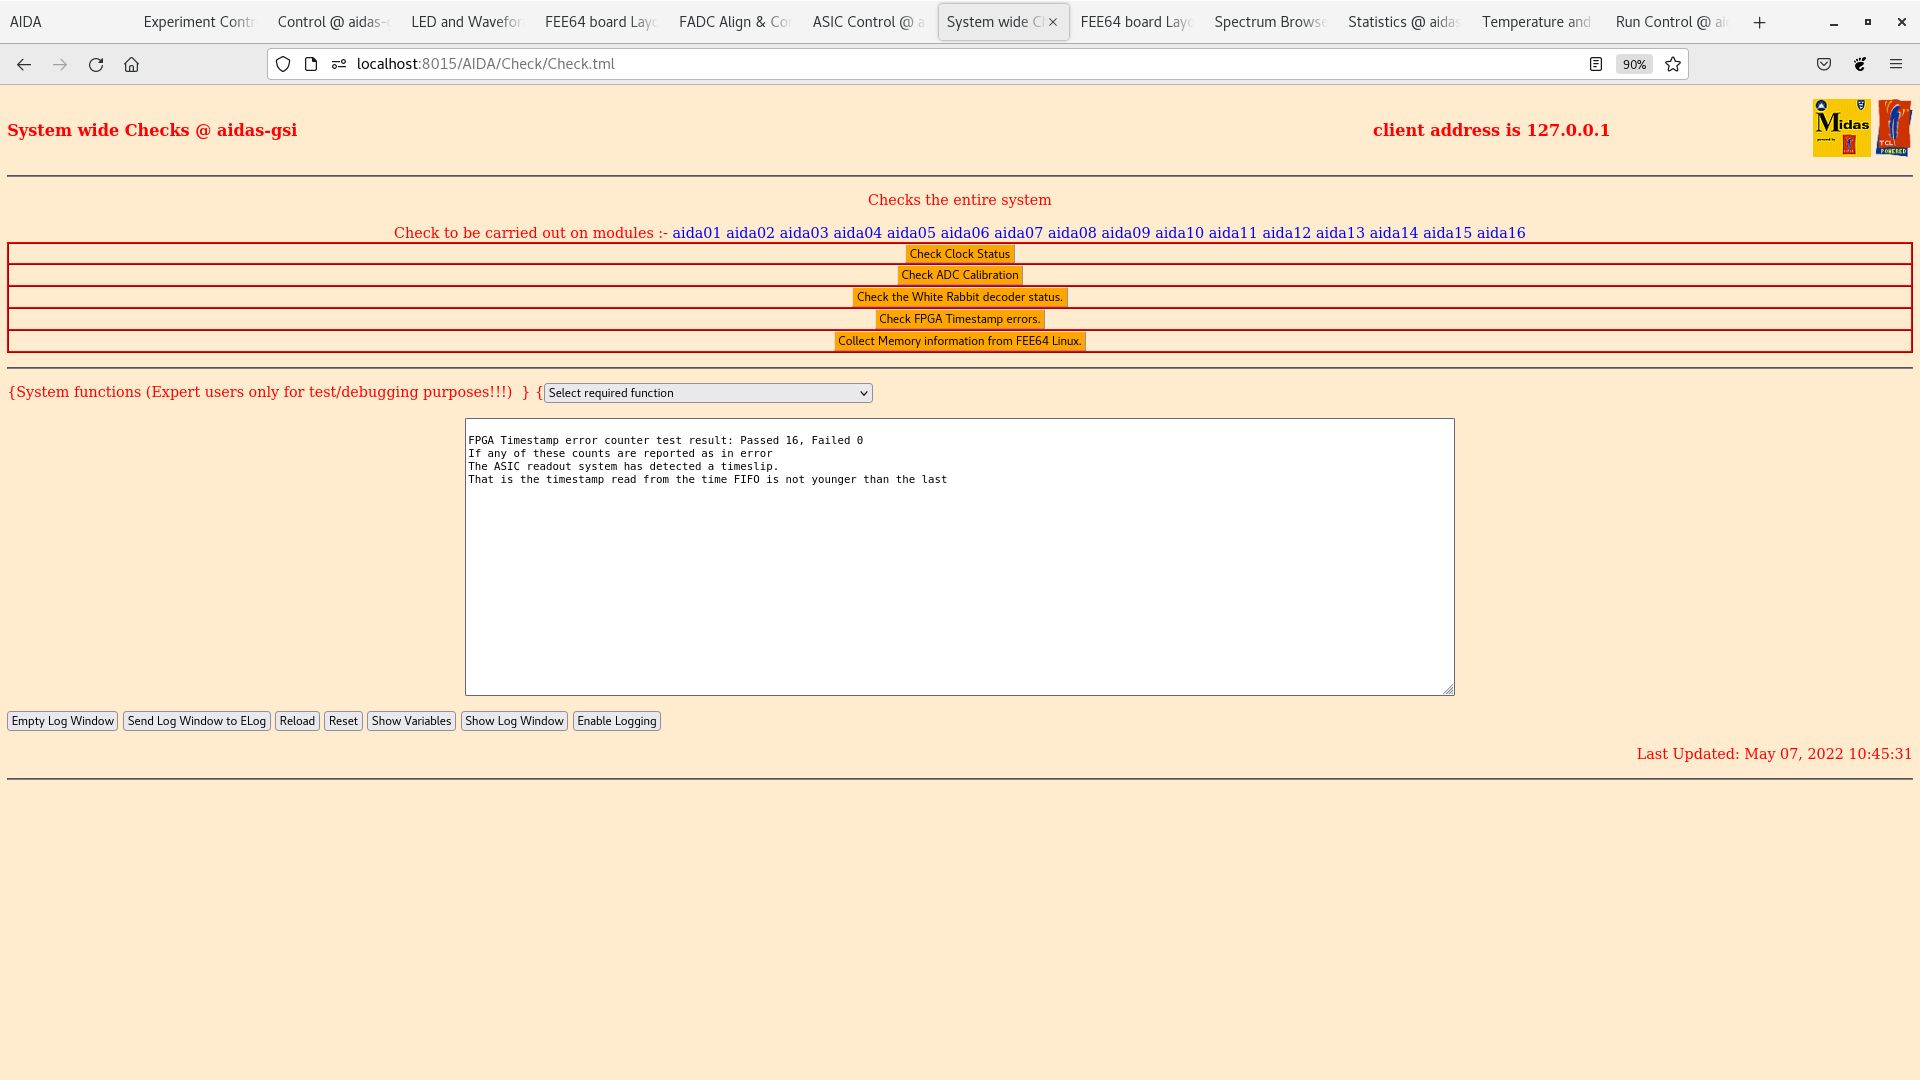
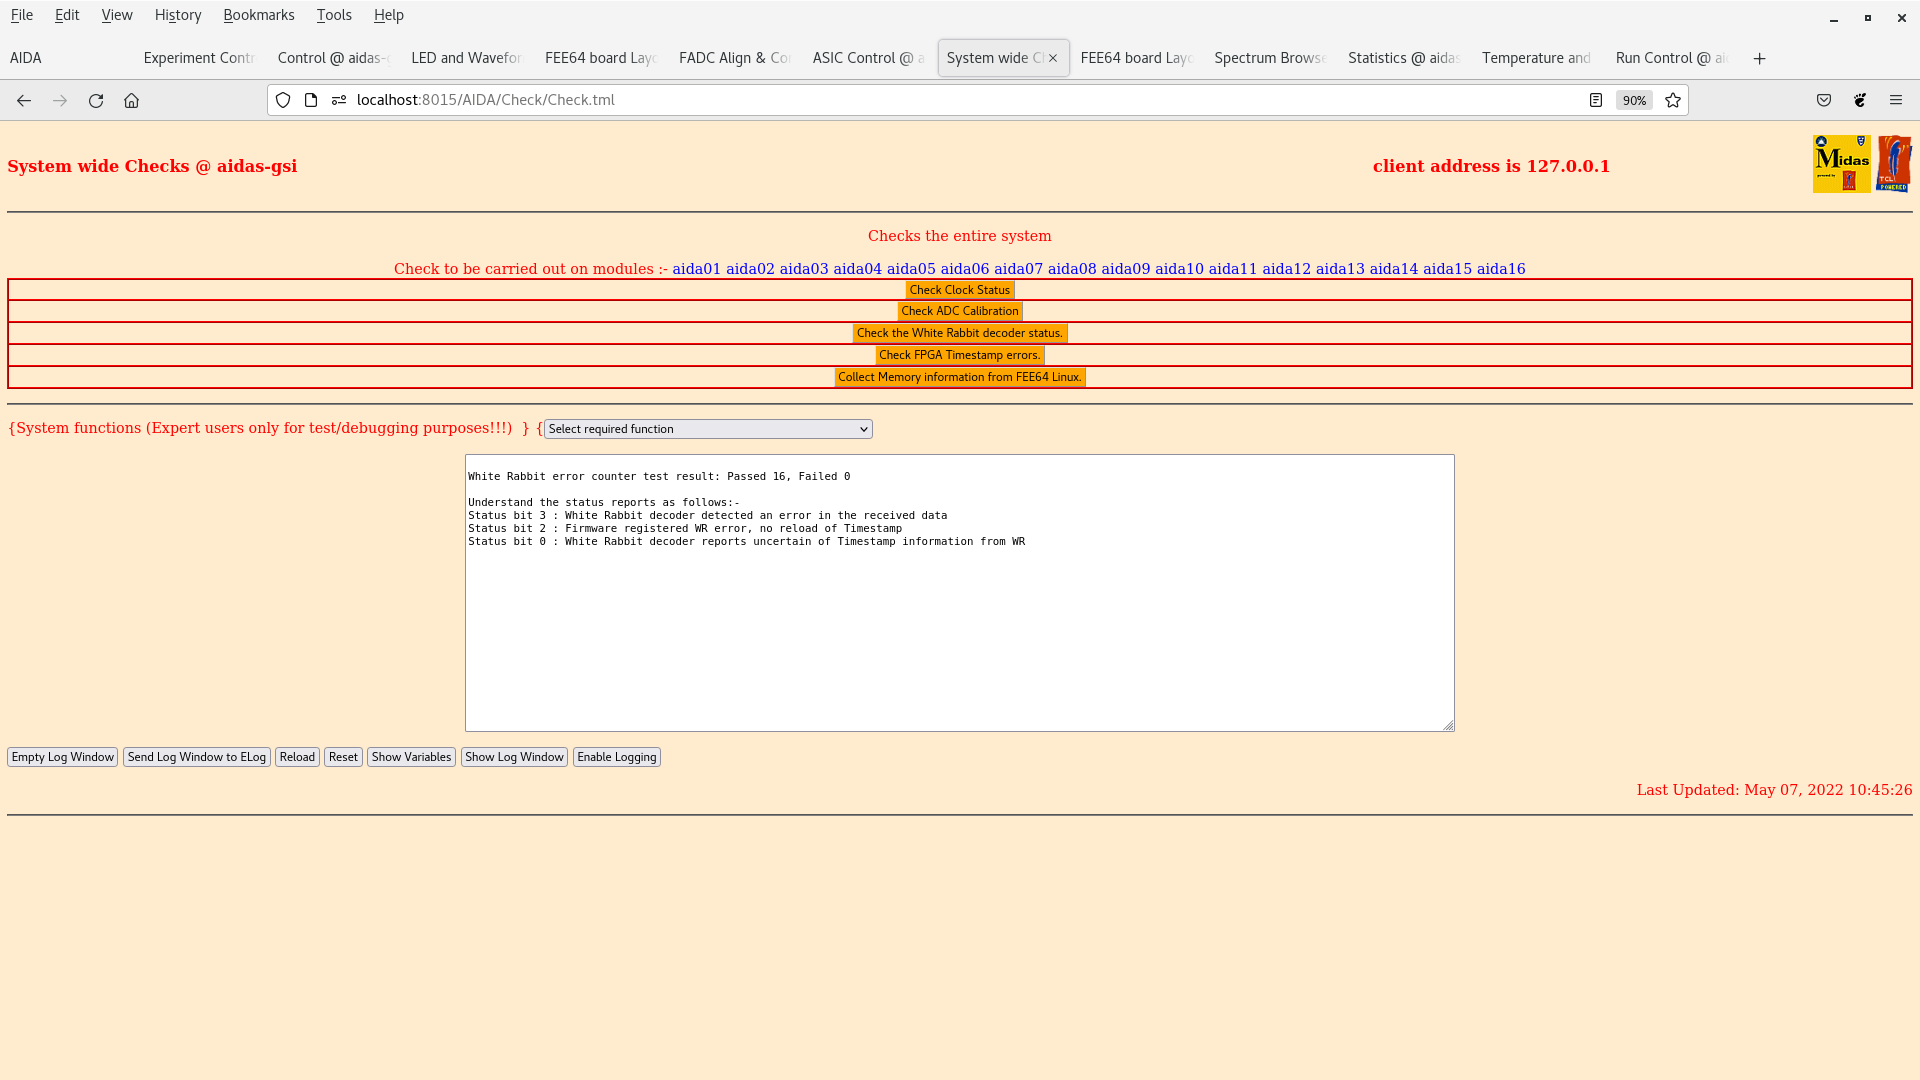
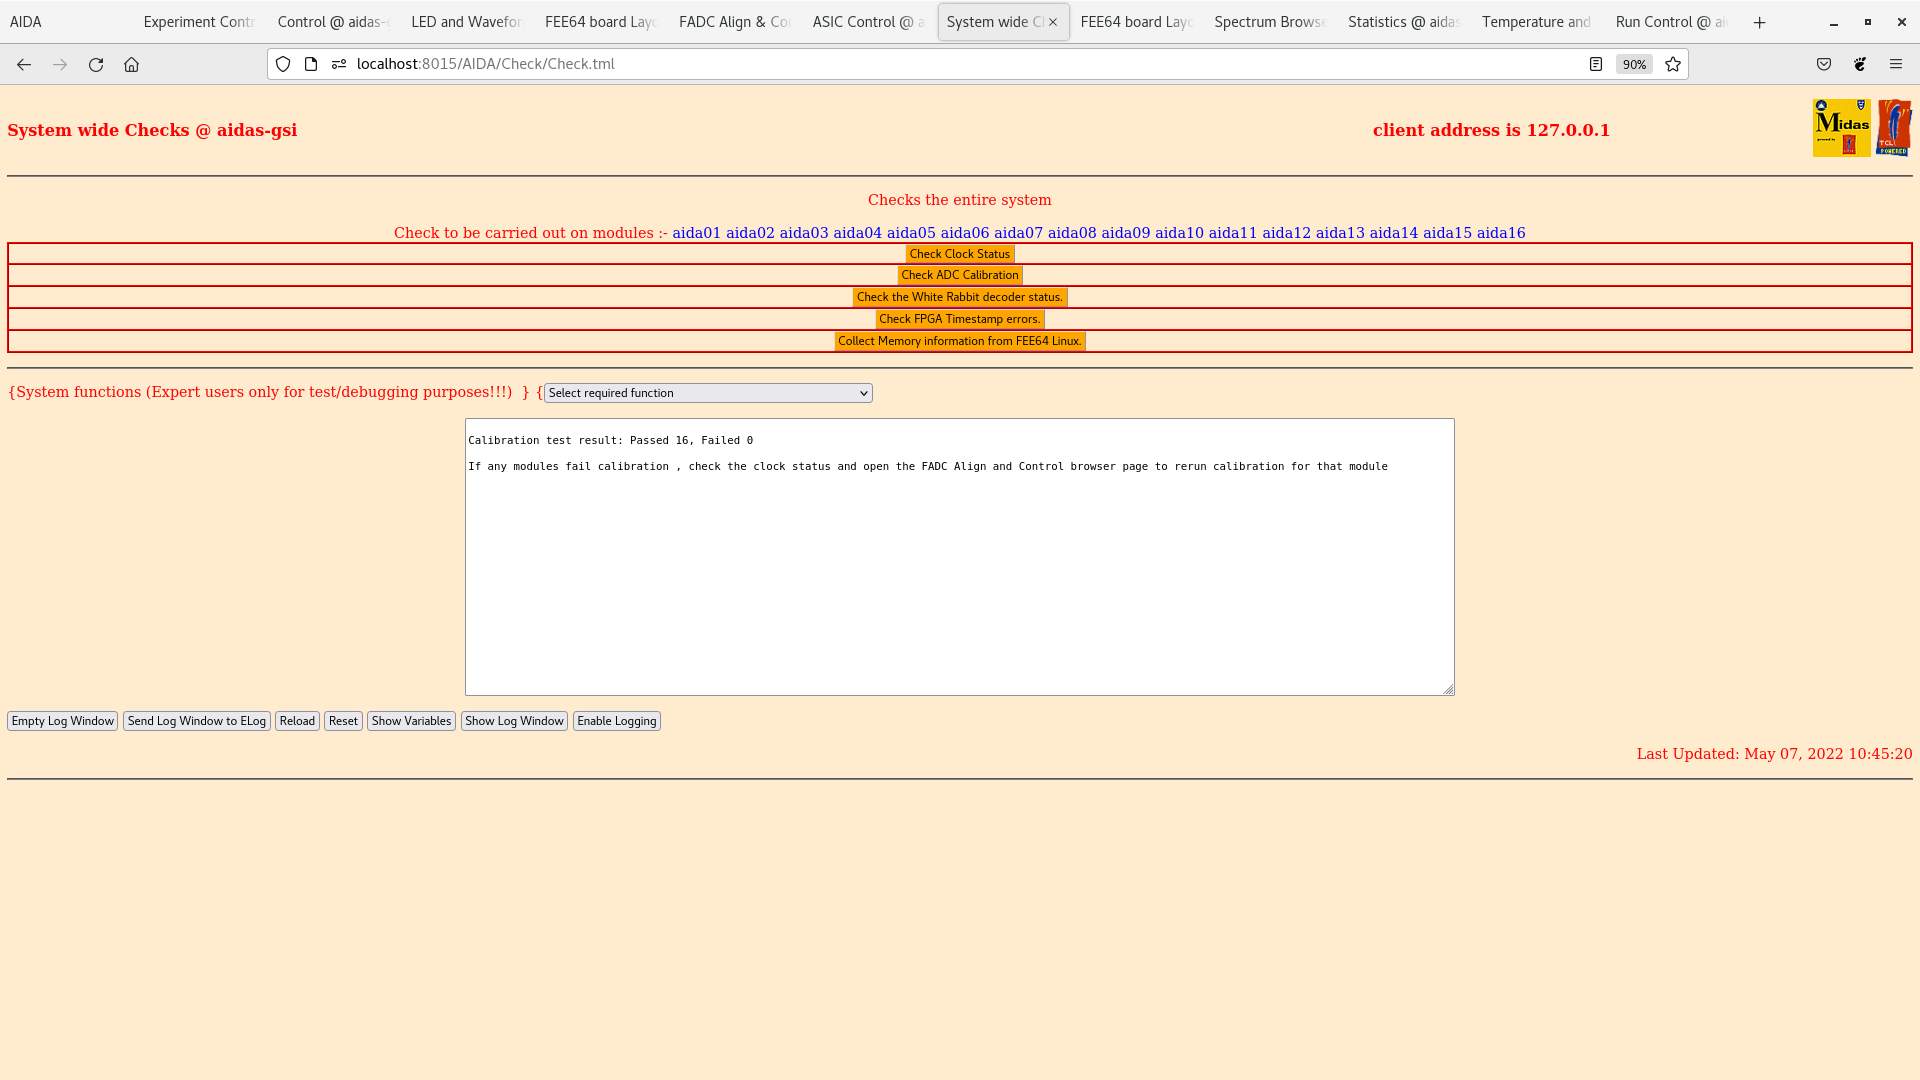
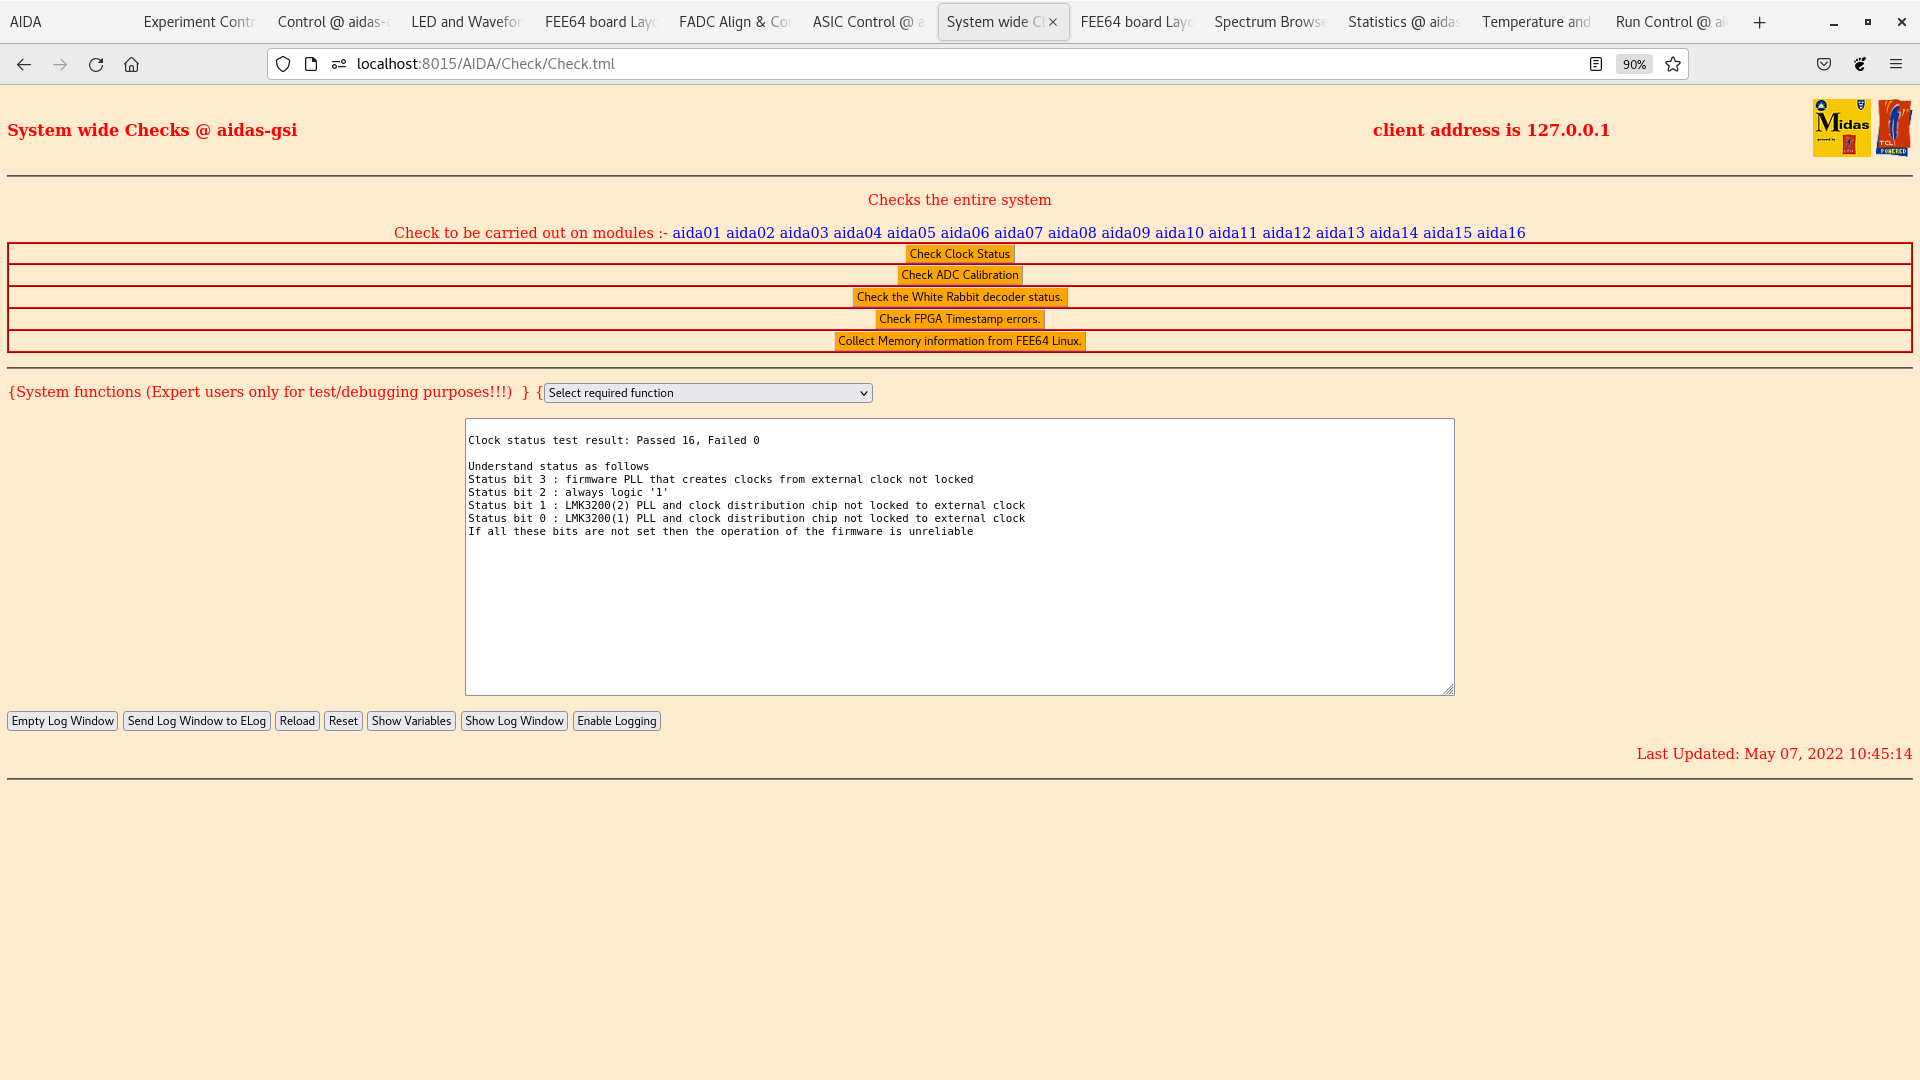
Attachments 9-12 - system wide checks - all OK
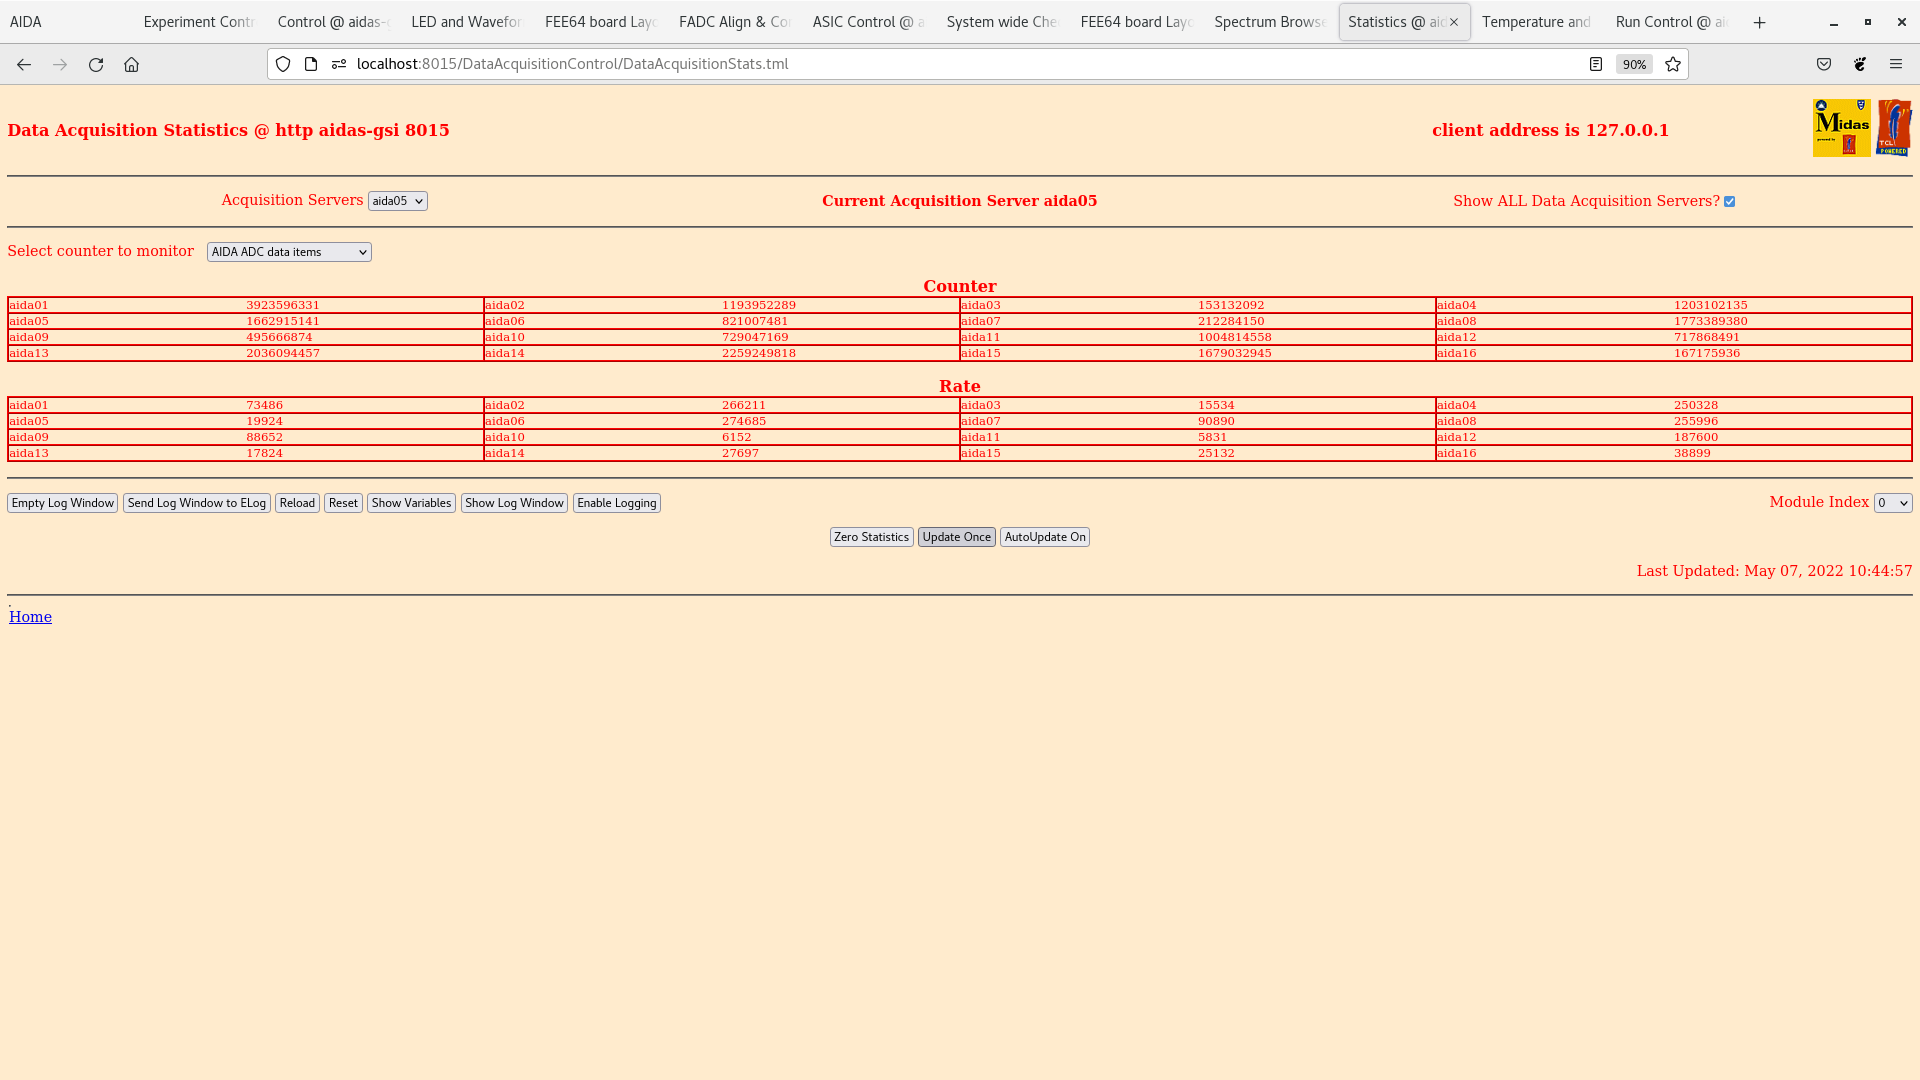
Attachment 13 ADC data item stats
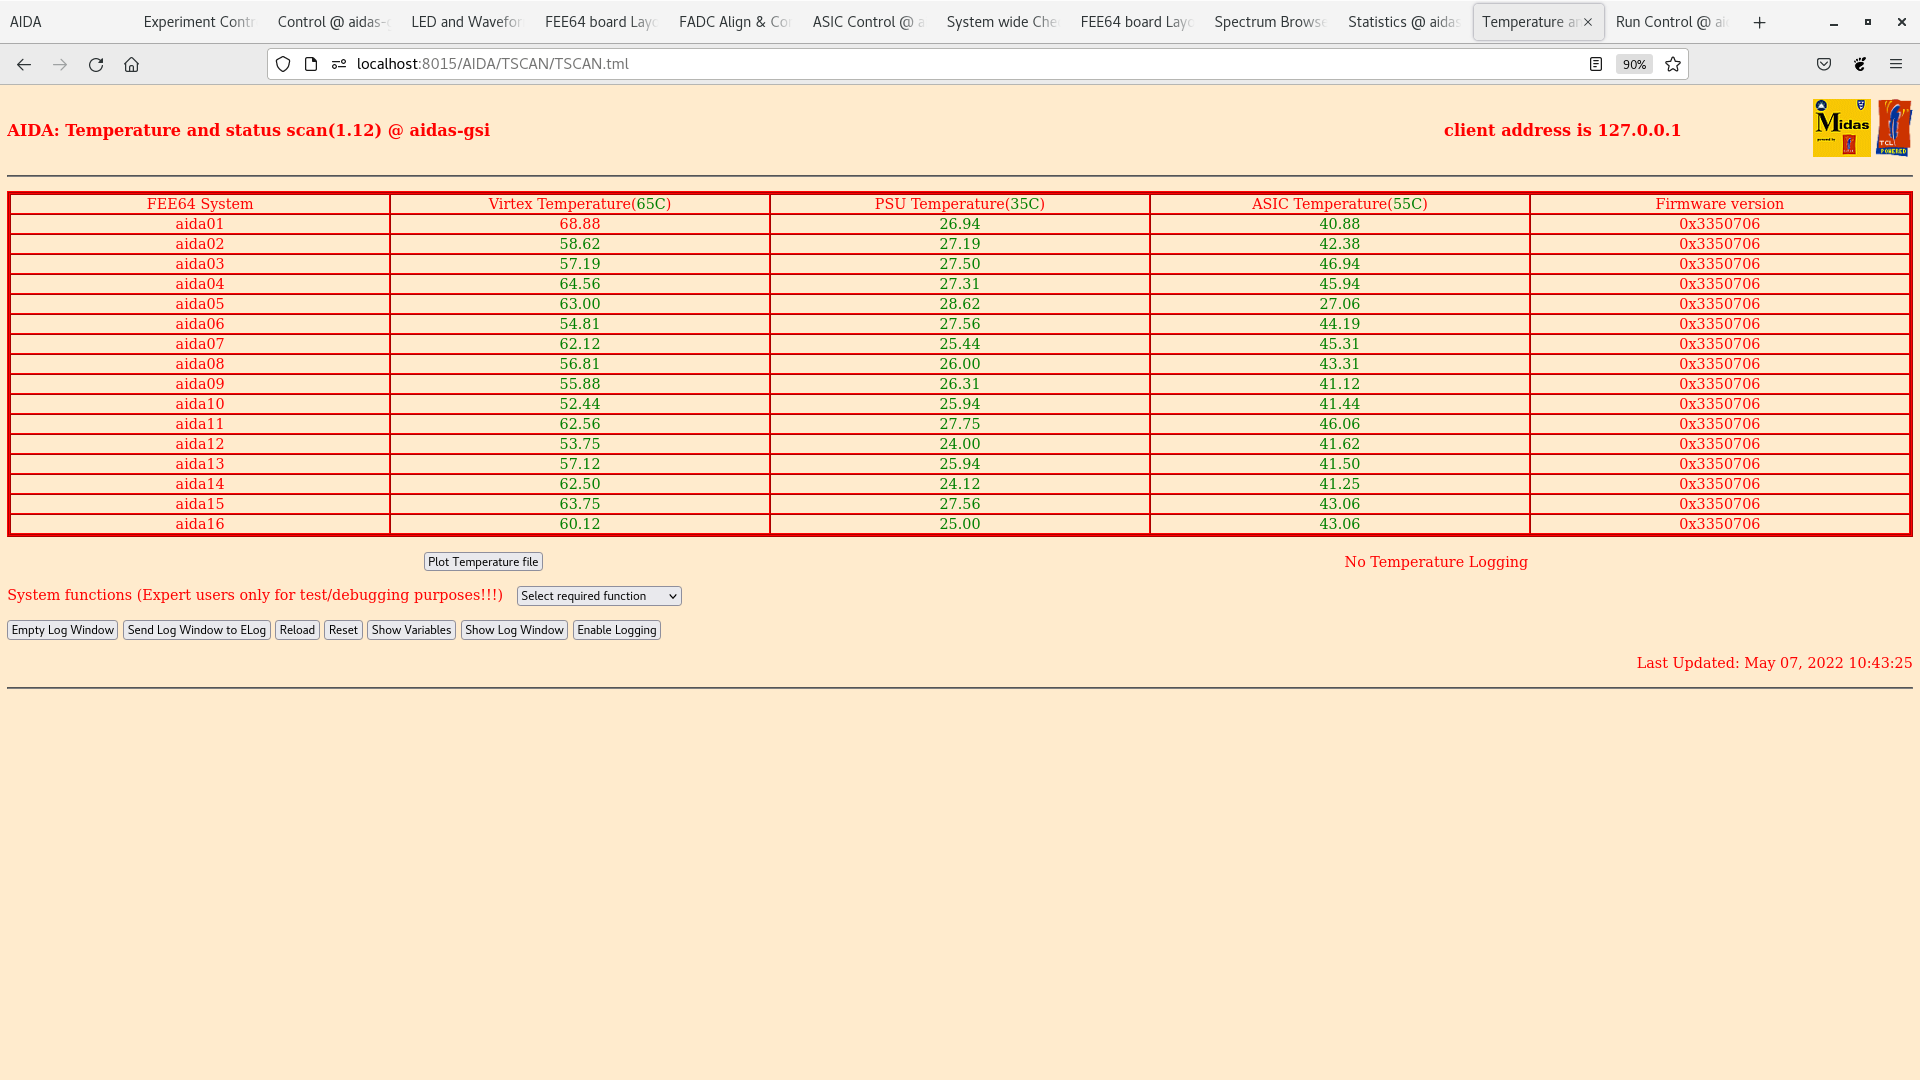
Attachment 14 FEE64 temps OK
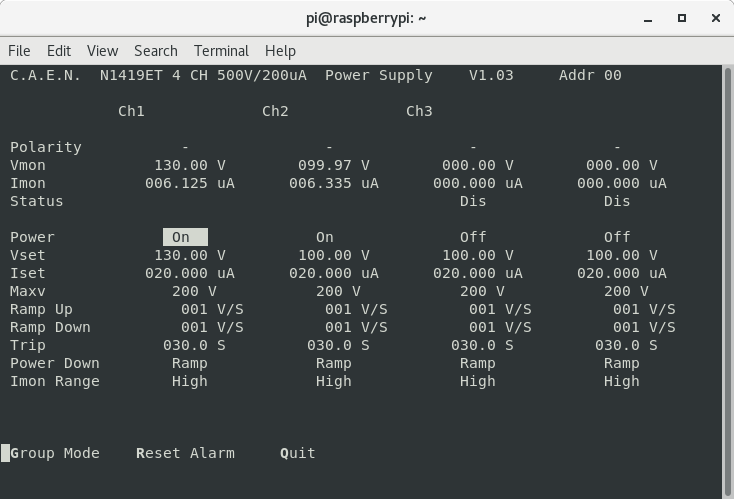
Attachment 15 DSSSD bias & leakage currents OK
16.15 aida05 zero ADC data items stats
merger restart, DAQ STOP/Go cycle to recover
activity is S4 area near AIDA DSSSDs as install of DEGAS detectors commences
19.50 DEGAS install continues
DSSSD bias and FEE64 power OFF
|
Attachment 1: Screenshot_from_2022-05-07_10-53-56.png
|
|
Attachment 2: Screenshot_from_2022-05-07_10-52-54.png
|
|
Attachment 3: Screenshot_from_2022-05-07_10-51-33.png
|
|
Attachment 4: Screenshot_from_2022-05-07_10-51-06.png
|
|
Attachment 5: Screenshot_from_2022-05-07_10-47-13.png
|
|
Attachment 6: Screenshot_from_2022-05-07_10-46-40.png
|
|
Attachment 7: Screenshot_from_2022-05-07_10-46-26.png
|
|
Attachment 8: Screenshot_from_2022-05-07_10-46-16.png
|
|
Attachment 9: Screenshot_from_2022-05-07_10-45-34.png
|
|
Attachment 10: Screenshot_from_2022-05-07_10-45-28.png
|
|
Attachment 11: Screenshot_from_2022-05-07_10-45-23.png
|
|
Attachment 12: Screenshot_from_2022-05-07_10-45-17.png
|
|
Attachment 13: Screenshot_from_2022-05-07_10-45-08.png
|
|
Attachment 14: Screenshot_from_2022-05-07_10-43-29.png
|
|
Attachment 15: Screenshot_from_2022-05-07_10-43-14.png
|
|
175
|
Sat Mar 6 06:52:06 2021 |
OH, LS | Saturday 6th March |
07:50 Pulser settings - attachment 1
07:52 System wide checks all ok
Statistics ok - attachment 2
Bias ok - attachment 3
09:30 The intensity of fragments is being increased
They are trying to do a factor of 10 increase first which should take us to around 100Hz
10:00 System wide checks all ok
Statistics - attachment 4
Layout 1 showing implants - attachment 5
Fee temperatures ok - attachment 6
12.00 System wide checks all okay, no failures
Statistics (screenshot7)
Spectrum rate (screenshot8)
FEE temps were normal except AIDA04 had "no response" (screenshot9), reloaded several minutes later seems to read normal
(screenshot10)
Leakage currents okay, increase from previous values written to sheets (screenshot12)
Rechecked FEETemps this time AIDA03 had "no response" (screenshot11), seems this occurs when the reload takes longer
than
usual, another reload shows all FEE temps as normal.
Merger and tape server okay
14.00 System wide checks all okay, no failures
Statistics (screenshot13)
Spectrum rate (screenshot14)
FEE temps normal, no issue with reload this time (screenshot15)
Leakage currents okay still increasing, written to sheets (screenshot16)
Merger okay ~4.5M items/sec
Tape server ~4.5Mb/sec
14.50 Beam has been shifted to centre beam more onto AIDA (corresponds to run S452f011)
16.00 System wide checks all okay, no failures
Statistics (screenshot17)
Spectrum rate (screenshot18)
FEE temps normal except AIDA08 "no response" (screenshot19), reload returns to normal (screenshot20)
Leakage currents added to sheet (screenshot21)
Merger okay ~4.5M items/sec
Tape server ~4.5Mb/sec
17.17 no beam, preparing for the 190Ta setting
17:44 OH Takes over
System wide checks all ok
Statistics - attachment 22
Temp ok - Attachment 23
Bias and leakage currents ok - Attatchment 24
While MBS was not currently writing data the merger -> tapeserver link was briefly toggle
The Directory for the experiment was then setup S452
The merger -> Tapeserver link was then re-enabled and data forwarding to MBS has continued.
ASIC Check all ok
18:10 Started writing data to file
File directory S452
Run number R1_0
Seems to have skipped a few files First full file R1_10
Currently writing to /media/SecondDrive/TapeData
Current free space 4211084180 kB
Current write speed 46163 kB/s
Time remaining until full 91222 seconds
25 hours remaining space
18:34 DESPEC starting new MBS file
AIDA Currently on file R1_41
19:00 DESPEC Closing file
AIDA Currently on R1_75
19:05 Comparing last years statistics to this years
FEE Last year This year Factor increase
1 60960 183111 3.00
2 183494 201256 1.09
3 91506 196647 2.15
4 73914 208290 2.81
5 31979 63571 1.99
6 54084 144638 2.67
7 35621 137605 3.86
8 38626 95858 2.48
9 264436 225790 0.85
10 209709 198896 0.94
11 88443 133899 1.51
12 183493 204996 1.12
Sum 1316265 1994557 1.51
19:22 DESPEC opens a new file (They forgot to mention they were closing the previous file)
AIDA on R1_104
Looking int to high write rate to see if we can do anything to reduce it
It isn't the correlation scaler as that is coming in at a rate of 16kHz which amounts to around 1.5MB/s - attachment 24
19:46 Much of the rate is coming from a small number of channels - attachment 25
19:17 WR Timestamp error.
Mentioned to Nic and he said that sometimes small glitches like this are observed
Base Current Difference
aida01 fault 0x9e8b : 0x9e8d : 2
aida02 fault 0x9a8f : 0x9a91 : 2
aida03 fault 0x29e9 : 0x29eb : 2
aida04 fault 0x7f66 : 0x7f68 : 2
aida05 fault 0x1f4f : 0x1f51 : 2
aida06 fault 0x8faa : 0x8fac : 2
aida07 fault 0x53f0 : 0x53f2 : 2
aida08 fault 0x7066 : 0x7068 : 2
White Rabbit error counter test result: Passed 4, Failed 8
Understand the status reports as follows:-
Status bit 3 : White Rabbit decoder detected an error in the received data
Status bit 2 : Firmware registered WR error, no reload of Timestamp
Status bit 0 : White Rabbit decoder reports uncertain of Timestamp information from WR
All other checks passed
20:52 DESPEC Stopping file
AIDA on R1_221
20:53 DESPEC Stopped file because UCESB crashed
AIDA on file R1_237
21:20 All system wide checks ok
Statistics DISC info- Attachment 27
FEE Temp ok - Attachment 28
Bias and leakage current ok - Attachment 29
Statistics good events - Attachment 30
20:51 Started compressing data with command nice -n 10 gzip -v R1_*
Have discussed with Helena and Nic about the potential issues we could run into with the high data rate
I am not sure if MBS can keep up with this rate
We are still writing to file though.
23:00 Correlations have been lost with the FRS DAQ and the rest of the DESPEC analysis
23:10 UCESB restarted and correlations have been regained. Verified with the implant-FRS time difference peak at 13us |
Attachment 1: Pulser.png
|
|
Attachment 2: 210306_0752_Stats.png
|
|
Attachment 3: 210306_0754_Bias.png
|
|
Attachment 4: 210306_0958_Stats.png
|
|
Attachment 5: 210306_0959_Layout1.png
|
|
Attachment 6: 210306_1000_Temp.png
|
|
Attachment 7: 1102_Statistics.PNG
|
|
Attachment 8: 1102_SpectrumRate.PNG
|
|
Attachment 9: 1102_FEETemps.PNG
|
|
Attachment 10: 1102_FEETemps2.PNG
|
|
Attachment 11: 1102_FEETemps3.PNG
|
|
Attachment 12: 1102_LeakageCurrents.PNG
|
|
Attachment 13: 1300_Statistics.PNG
|
|
Attachment 14: 1300_SpectrumRate.PNG
|
|
Attachment 15: 1300_FEETemps.PNG
|
|
Attachment 16: 1300_LeakageCurrents.PNG
|
|
Attachment 17: 1500_Statistics.PNG
|
|
Attachment 18: 1500_SpectrumRate.PNG
|
|
Attachment 19: 1500_FEETemps.PNG
|
|
Attachment 20: 1500_FEETemps2.PNG
|
|
Attachment 21: 1500_LeakageCurrents.PNG
|
|
Attachment 22: 210306_1726_Stats.png
|
|
Attachment 23: 210306_1747_Temp.png
|
|
Attachment 24: 210327_1748_Bias.png
|
|
Attachment 25: 210326_1920_MergerStats.png
|
|
Attachment 26: 210306_1946_Layout1.png
|
|
Attachment 27: 210306_2120_Stats.png
|
|
Attachment 28: 210306_2121_Temp.png
|
|
Attachment 29: 210306_2123_Bias.png
|
|
Attachment 30: 210326_1920_MergerStats.png
|
|
357
|
Sat Jun 5 11:20:15 2021 |
TD | Saturday 5 June |
12.25 DAQ continues OK - file S496/R32_48
alpha background
All system wide checks OK *except*
Base Current Difference
aida01 fault 0x8944 : 0x8946 : 2
aida02 fault 0x9b36 : 0x9b38 : 2
aida03 fault 0xf26b : 0xf26d : 2
aida04 fault 0x57a0 : 0x57a2 : 2
aida05 fault 0x4d3c : 0x4d3d : 1
aida05 : WR status 0x10
aida06 fault 0x640c : 0x640d : 1
aida07 fault 0x255e : 0x255f : 1
aida08 fault 0xffbd : 0xffbe : 1
White Rabbit error counter test result: Passed 8, Failed 8
Understand the status reports as follows:-
Status bit 3 : White Rabbit decoder detected an error in the received data
Status bit 2 : Firmware registered WR error, no reload of Timestamp
Status bit 0 : White Rabbit decoder reports uncertain of Timestamp information from WR
Returned 0 0 0 0 0 0 0 0 0 0 0 0 0 0 0 0
Mem(KB) : 4 8 16 32 64 128 256 512 1k 2k 4k
aida01 : 10 6 1 2 4 4 2 2 1 4 7 : 40360
aida02 : 4 3 3 3 3 4 2 2 1 4 7 : 40312
aida03 : 13 5 4 4 2 4 1 3 2 3 7 : 39580
aida04 : 16 5 3 3 2 4 1 3 2 3 7 : 39544
aida05 : 8 6 1 2 3 3 1 3 1 4 7 : 40416
aida06 : 4 3 2 1 3 3 1 3 1 4 7 : 40360
aida07 : 6 6 2 4 4 2 3 2 1 4 7 : 40424
aida08 : 6 4 1 1 4 3 3 2 1 4 7 : 40424
aida09 : 16 1 3 1 0 2 2 3 1 4 7 : 40344
aida10 : 2 5 1 4 1 3 2 4 2 3 7 : 40064
aida11 : 14 3 2 1 4 4 3 3 2 3 7 : 40080
aida12 : 11 2 2 4 4 4 3 3 2 3 7 : 40156
aida13 : 11 3 2 2 3 4 3 3 2 3 7 : 40036
aida14 : 6 5 0 4 3 4 3 3 2 3 7 : 40064
aida15 : 11 6 3 1 3 1 2 4 1 4 7 : 40940
aida16 : 12 5 0 4 4 4 3 3 2 3 7 : 40152
Collecting the file size of each FEE64 Options CONTENTS file to check they are all the same
FEE : aida01 => Options file size is 1026 Last changed Fri Jun 04 09:30:42 CEST 2021
FEE : aida02 => Options file size is 1025 Last changed Sun May 23 00:19:21 CEST 2021
FEE : aida03 => Options file size is 1014 Last changed Thu Apr 29 14:43:50 CEST 2021
FEE : aida04 => Options file size is 1025 Last changed Fri May 14 16:54:56 CEST 2021
FEE : aida05 => Options file size is 1025 Last changed Mon May 17 06:25:41 CEST 2021
FEE : aida06 => Options file size is 1014 Last changed Thu Apr 29 14:43:59 CEST 2021
FEE : aida07 => Options file size is 1014 Last changed Thu Apr 29 14:44:02 CEST 2021
FEE : aida08 => Options file size is 1025 Last changed Sun May 23 00:16:54 CEST 2021
FEE : aida09 => Options file size is 1014 Last changed Thu Apr 29 14:44:08 CEST 2021
FEE : aida10 => Options file size is 1014 Last changed Thu Apr 29 14:44:57 CEST 2021
FEE : aida11 => Options file size is 1014 Last changed Thu Apr 29 14:44:57 CEST 2021
FEE : aida12 => Options file size is 1014 Last changed Thu Apr 29 14:44:57 CEST 2021
FEE : aida13 => Options file size is 1025 Last changed Fri May 07 19:40:34 CEST 2021
FEE : aida14 => Options file size is 1014 Last changed Thu Apr 29 14:44:57 CEST 2021
FEE : aida15 => Options file size is 1014 Last changed Thu Apr 29 14:44:57 CEST 2021
FEE : aida16 => Options file size is 1014 Last changed Thu Apr 29 14:44:57 CEST 2021
Grafana - DSSSD bias & leakage current - most recent 7 days - attachment 1
1.8.W spectra - 20us FSR - attachments 2 & 3
ADC data items - attachment 4
FEE64 temperatures OK - attachment 5
DSSSD bias & leakage currents OK - attachment 6
Merger/Tape Server/Merger statistics - attachment 7
no merger errors reported since previous restart
analysis of file S496/R32_47 - attachment 8
max deadtime 0.35% aida04
13.56 Lost activity monitor - see attachment 9 |
Attachment 1: Screenshot_2021-06-05_AIDA_Alerting_-_Grafana.png
|
|
Attachment 2: Screenshot_2021-06-05_Spectrum_Browser_aidas-gsi(1).png
|
|
Attachment 3: Screenshot_2021-06-05_Spectrum_Browser_aidas-gsi.png
|
|
Attachment 4: Screenshot_2021-06-05_Statistics_aidas-gsi.png
|
|
Attachment 5: Screenshot_2021-06-05_Temperature_and_status_scan_aidas-gsi.png
|
|
Attachment 6: 982.png
|
|
Attachment 7: 983.png
|
|
Attachment 8: R32_47
|
*** TDR format 3.3.0 analyser - TD - May 2021
*** ERROR: READ I/O error: 5002
blocks: 32000
ADC data format: 47883982 ( 17391.8 Hz)
Other data format: 214036019 ( 77739.3 Hz)
Sample trace data format: 0 ( 0.0 Hz)
Undefined format: 0 ( 0.0 Hz)
Other data format type: PAUSE: 184 ( 0.1 Hz)
RESUME: 184 ( 0.1 Hz)
SYNC100: 42255 ( 15.3 Hz)
WR48-63: 42255 ( 15.3 Hz)
FEE64 disc: 1053753 ( 382.7 Hz)
MBS info: 212897388 ( 77325.8 Hz)
Other info: 0 ( 0.0 Hz)
ADC data range bit set: 0 ( 0.0 Hz)
Timewarps: ADC: 0 ( 0.0 Hz)
PAUSE: 0 ( 0.0 Hz)
RESUME: 0 ( 0.0 Hz)
SYNC100: 0 ( 0.0 Hz)
WR48-63: 0 ( 0.0 Hz)
FEE64 disc: 0 ( 0.0 Hz)
MBS info: 0 ( 0.0 Hz)
Undefined: 0 ( 0.0 Hz)
Sample trace: 0 ( 0.0 Hz)
*** Timestamp elapsed time: 2753.252 s
FEE elapsed dead time(s) elapsed idle time(s)
0 0.000 0.000
1 0.000 2696.425
2 0.825 0.000
3 9.735 0.000
4 0.000 0.000
5 0.000 2175.120
6 0.000 0.000
7 0.000 2003.563
8 0.000 0.000
9 0.000 0.000
10 0.000 0.000
11 0.000 0.000
12 0.000 0.000
13 0.000 0.000
14 0.000 0.000
15 0.000 0.000
16 0.000 0.000
17 0.000 0.000
18 0.000 0.000
19 0.000 0.000
20 0.000 0.000
21 0.000 0.000
22 0.000 0.000
23 0.000 0.000
24 0.000 0.000
25 0.000 0.000
26 0.000 0.000
27 0.000 0.000
28 0.000 0.000
29 0.000 0.000
30 0.000 0.000
31 0.000 0.000
32 0.000 0.000
*** Statistics
FEE ADC Data Other Data Sample Undefined Pause Resume SYNC100 WR48-63 Disc MBS Other HEC Data
0 187 0 0 0 0 0 0 0 0 0 0 0
1 86597 40 0 0 0 0 20 20 0 0 0 0
2 381 106659018 0 0 37 37 18746 18746 0 106621452 0 0
3 38584230 107373193 0 0 147 147 21605 21605 1053753 106275936 0 0
4 143 0 0 0 0 0 0 0 0 0 0 0
5 4208337 1756 0 0 0 0 878 878 0 0 0 0
6 545 0 0 0 0 0 0 0 0 0 0 0
7 5000124 2012 0 0 0 0 1006 1006 0 0 0 0
8 478 0 0 0 0 0 0 0 0 0 0 0
9 96 0 0 0 0 0 0 0 0 0 0 0
10 1149 0 0 0 0 0 0 0 0 0 0 0
11 117 0 0 0 0 0 0 0 0 0 0 0
12 706 0 0 0 0 0 0 0 0 0 0 0
13 105 0 0 0 0 0 0 0 0 0 0 0
14 636 0 0 0 0 0 0 0 0 0 0 0
15 151 0 0 0 0 0 0 0 0 0 0 0
16 0 0 0 0 0 0 0 0 0 0 0 0
17 0 0 0 0 0 0 0 0 0 0 0 0
18 0 0 0 0 0 0 0 0 0 0 0 0
19 0 0 0 0 0 0 0 0 0 0 0 0
20 0 0 0 0 0 0 0 0 0 0 0 0
21 0 0 0 0 0 0 0 0 0 0 0 0
22 0 0 0 0 0 0 0 0 0 0 0 0
23 0 0 0 0 0 0 0 0 0 0 0 0
24 0 0 0 0 0 0 0 0 0 0 0 0
25 0 0 0 0 0 0 0 0 0 0 0 0
26 0 0 0 0 0 0 0 0 0 0 0 0
27 0 0 0 0 0 0 0 0 0 0 0 0
28 0 0 0 0 0 0 0 0 0 0 0 0
29 0 0 0 0 0 0 0 0 0 0 0 0
30 0 0 0 0 0 0 0 0 0 0 0 0
31 0 0 0 0 0 0 0 0 0 0 0 0
32 0 0 0 0 0 0 0 0 0 0 0 0
*** Timewarps
FEE ADC Pause Resume SYNC100 WR48-63 Disc MBS Undefined Samples
0 0 0 0 0 0 0 0 0 0
1 0 0 0 0 0 0 0 0 0
2 0 0 0 0 0 0 0 0 0
3 0 0 0 0 0 0 0 0 0
4 0 0 0 0 0 0 0 0 0
5 0 0 0 0 0 0 0 0 0
6 0 0 0 0 0 0 0 0 0
7 0 0 0 0 0 0 0 0 0
8 0 0 0 0 0 0 0 0 0
9 0 0 0 0 0 0 0 0 0
10 0 0 0 0 0 0 0 0 0
11 0 0 0 0 0 0 0 0 0
12 0 0 0 0 0 0 0 0 0
13 0 0 0 0 0 0 0 0 0
14 0 0 0 0 0 0 0 0 0
15 0 0 0 0 0 0 0 0 0
16 0 0 0 0 0 0 0 0 0
17 0 0 0 0 0 0 0 0 0
18 0 0 0 0 0 0 0 0 0
19 0 0 0 0 0 0 0 0 0
20 0 0 0 0 0 0 0 0 0
21 0 0 0 0 0 0 0 0 0
22 0 0 0 0 0 0 0 0 0
23 0 0 0 0 0 0 0 0 0
24 0 0 0 0 0 0 0 0 0
25 0 0 0 0 0 0 0 0 0
26 0 0 0 0 0 0 0 0 0
27 0 0 0 0 0 0 0 0 0
28 0 0 0 0 0 0 0 0 0
29 0 0 0 0 0 0 0 0 0
30 0 0 0 0 0 0 0 0 0
31 0 0 0 0 0 0 0 0 0
32 0 0 0 0 0 0 0 0 0
*** Program elapsed time: 29.996s ( 1066.806 blocks/s, 66.675 Mb/s)
|
Attachment 9: Screenshot_2021-06-05_Lost_activity_monitor_aidas-gsi(1).png
|
|
627
|
Sat May 4 07:36:07 2024 |
TD | Saturday 4 May |
08.32 DSSSD bias & leakage currents - Grafana - attachments 1-2
FEE64 temperatures OK - attachment 3
ADC, correlation scalers data item stats OK attachments 4-5
11/16 <20k max aida16 174k
per FEE64 Rate spectra - attachmnt 6
09.44 per p+n FEE64 1.8.L spectra - attachment 7
aida09 pulser peak width 58 ch FWHM
per FEE64 1.8.W spectra - attachments 8-10
09.47 bias cycle - off and then on
no significant change in leakage current
09.57 FEE64 power OFF
DSSSD bias ON |
Attachment 1: Screenshot_from_2024-05-04_08-35-38.png
|
|
Attachment 2: Screenshot_from_2024-05-04_08-33-29.png
|
|
Attachment 3: Screenshot_from_2024-05-04_08-31-09.png
|
|
Attachment 4: Screenshot_from_2024-05-04_08-31-45.png
|
|
Attachment 5: Screenshot_from_2024-05-04_08-32-21.png
|
|
Attachment 6: Screenshot_from_2024-05-04_08-32-41.png
|
|
Attachment 7: Screenshot_from_2024-05-04_09-37-27.png
|
|
Attachment 8: Screenshot_from_2024-05-04_09-42-27.png
|
|
Attachment 9: Screenshot_from_2024-05-04_09-42-56.png
|
|
Attachment 10: Screenshot_from_2024-05-04_09-44-31.png
|
|
Attachment 11: Capture.PNG
|
|
351
|
Sat May 29 13:13:45 2021 |
TD | Saturday 29 May |
14.10 DAQ continues - file S496/R18_539
alpha background
increased data rate due to ht HEC channels since c. 06.00 this am - ASIC check fixes problem
All system wide checks OK *except*
Base Current Difference
aida01 fault 0x82b0 : 0x82b7 : 7
aida02 fault 0xfe72 : 0xfe79 : 7
aida03 fault 0x97f4 : 0x97fb : 7
aida04 fault 0x950 : 0x957 : 7
aida05 fault 0x8e93 : 0x8e97 : 4
aida06 fault 0x545a : 0x545e : 4
aida07 fault 0xc04d : 0xc051 : 4
aida08 fault 0xa0f7 : 0xa0fb : 4
White Rabbit error counter test result: Passed 8, Failed 8
Understand the status reports as follows:-
Status bit 3 : White Rabbit decoder detected an error in the received data
Status bit 2 : Firmware registered WR error, no reload of Timestamp
Status bit 0 : White Rabbit decoder reports uncertain of Timestamp information from WR
Returned 0 0 0 0 0 0 0 0 0 0 0 0 0 0 0 0
Mem(KB) : 4 8 16 32 64 128 256 512 1k 2k 4k
aida01 : 15 8 7 2 2 2 2 2 2 4 6 : 37036
aida02 : 14 3 5 2 2 4 3 3 2 4 6 : 37984
aida03 : 15 11 8 6 3 3 2 3 3 3 6 : 36884
aida04 : 43 13 5 5 3 4 2 3 3 3 6 : 37060
aida05 : 19 3 5 4 2 2 2 2 2 4 6 : 37044
aida06 : 17 4 1 3 2 3 3 4 2 4 6 : 38356
aida07 : 16 6 2 1 0 2 2 3 2 4 6 : 37296
aida08 : 21 8 1 1 3 4 4 3 2 4 6 : 38276
aida09 : 13 10 2 1 2 3 2 2 2 4 6 : 37060
aida10 : 13 9 4 1 1 3 3 3 1 4 6 : 36764
aida11 : 13 9 2 1 2 3 3 3 1 4 6 : 36796
aida12 : 11 6 4 2 2 4 2 3 2 4 6 : 37724
aida13 : 7 6 6 2 1 3 2 2 2 4 6 : 37036
aida14 : 9 7 7 1 1 3 2 2 2 4 6 : 37036
aida15 : 14 5 2 2 1 3 3 4 2 4 6 : 38272
aida16 : 9 4 10 1 2 3 2 2 2 4 6 : 37124
Collecting the file size of each FEE64 Options CONTENTS file to check they are all the same
FEE : aida01 => Options file size is 1026 Last changed Sun May 23 12:04:25 CEST 2021
FEE : aida02 => Options file size is 1025 Last changed Sun May 23 00:19:21 CEST 2021
FEE : aida03 => Options file size is 1014 Last changed Thu Apr 29 14:43:50 CEST 2021
FEE : aida04 => Options file size is 1025 Last changed Fri May 14 16:54:56 CEST 2021
FEE : aida05 => Options file size is 1025 Last changed Mon May 17 06:25:41 CEST 2021
FEE : aida06 => Options file size is 1014 Last changed Thu Apr 29 14:43:59 CEST 2021
FEE : aida07 => Options file size is 1014 Last changed Thu Apr 29 14:44:02 CEST 2021
FEE : aida08 => Options file size is 1025 Last changed Sun May 23 00:16:54 CEST 2021
FEE : aida09 => Options file size is 1014 Last changed Thu Apr 29 14:44:08 CEST 2021
FEE : aida10 => Options file size is 1014 Last changed Thu Apr 29 14:44:57 CEST 2021
FEE : aida11 => Options file size is 1014 Last changed Thu Apr 29 14:44:57 CEST 2021
FEE : aida12 => Options file size is 1014 Last changed Thu Apr 29 14:44:57 CEST 2021
FEE : aida13 => Options file size is 1025 Last changed Fri May 07 19:40:34 CEST 2021
FEE : aida14 => Options file size is 1014 Last changed Thu Apr 29 14:44:57 CEST 2021
FEE : aida15 => Options file size is 1014 Last changed Thu Apr 29 14:44:57 CEST 2021
FEE : aida16 => Options file size is 1014 Last changed Thu Apr 29 14:44:57 CEST 2021
Grafana - DSSSD bias & leakage current - most recent 7 days - attachment 1
Lost activity monitor - attachment 2
1.8.W spectra - attachments 3 & 4
ADC data item stats - attachment 5
FEE64 temps OK - attachment 6
DSSSD bias & leakage current OK - attachment 7
Merger/Tape Server/Merger stats - attachment 8
no merger errors reported since previous restart
14.24 All histograms, statistics and merger statistics zero'd
16.16 analysis of file S496/R18_541 - attachment 9
max deadtime 0.12% aida04
18.40 DAQ continues - file S496/R18_551
alpha background
increased data rate due to ht HEC channels since c. 18.00 this am - ASIC check fixes problem |
Attachment 1: Screenshot_2021-05-29_AIDA_Alerting_-_Grafana.png
|
|
Attachment 2: Screenshot_2021-05-29_Lost_activity_monitor_aidas-gsi.png
|
|
Attachment 3: Screenshot_2021-05-29_Spectrum_Browser_aidas-gsi(1).png
|
|
Attachment 4: Screenshot_2021-05-29_Spectrum_Browser_aidas-gsi.png
|
|
Attachment 5: Screenshot_2021-05-29_Statistics_aidas-gsi.png
|
|
Attachment 6: Screenshot_2021-05-29_Temperature_and_status_scan_aidas-gsi.png
|
|
Attachment 7: 950.png
|
|
Attachment 8: 951.png
|
|
Attachment 9: R18_541
|
*** TDR format 3.3.0 analyser - TD - May 2021
*** ERROR: READ I/O error: 5002
blocks: 32000
ADC data format: 46792076 ( 18702.9 Hz)
Other data format: 215127929 ( 85987.1 Hz)
Sample trace data format: 0 ( 0.0 Hz)
Undefined format: 0 ( 0.0 Hz)
Other data format type: PAUSE: 89 ( 0.0 Hz)
RESUME: 89 ( 0.0 Hz)
SYNC100: 41318 ( 16.5 Hz)
WR48-63: 41318 ( 16.5 Hz)
FEE64 disc: 1013016 ( 404.9 Hz)
MBS info: 214032099 ( 85549.1 Hz)
Other info: 0 ( 0.0 Hz)
ADC data range bit set: 0 ( 0.0 Hz)
Timewarps: ADC: 0 ( 0.0 Hz)
PAUSE: 0 ( 0.0 Hz)
RESUME: 0 ( 0.0 Hz)
SYNC100: 0 ( 0.0 Hz)
WR48-63: 0 ( 0.0 Hz)
FEE64 disc: 0 ( 0.0 Hz)
MBS info: 0 ( 0.0 Hz)
Undefined: 0 ( 0.0 Hz)
Sample trace: 0 ( 0.0 Hz)
*** Timestamp elapsed time: 2501.862 s
FEE elapsed dead time(s) elapsed idle time(s)
0 0.000 0.000
1 0.000 1964.282
2 0.467 0.000
3 3.050 0.000
4 0.000 1832.921
5 0.000 844.521
6 0.000 1829.325
7 0.000 869.373
8 0.000 0.000
9 0.000 0.000
10 0.000 0.000
11 0.000 0.000
12 0.000 0.000
13 0.000 0.000
14 0.000 0.000
15 0.000 0.000
16 0.000 0.000
17 0.000 0.000
18 0.000 0.000
19 0.000 0.000
20 0.000 0.000
21 0.000 0.000
22 0.000 0.000
23 0.000 0.000
24 0.000 0.000
25 0.000 0.000
26 0.000 0.000
27 0.000 0.000
28 0.000 0.000
29 0.000 0.000
30 0.000 0.000
31 0.000 0.000
32 0.000 0.000
*** Statistics
FEE ADC Data Other Data Sample Undefined Pause Resume SYNC100 WR48-63 Disc MBS Other HEC Data
0 499 0 0 0 0 0 0 0 0 0 0 0
1 74891 24 0 0 0 0 12 12 0 0 0 0
2 1032 92085039 0 0 27 27 16251 16251 0 92052483 0 0
3 37271457 93008741 0 0 62 62 19135 19135 1013015 91957332 0 0
4 552 7507421 0 0 0 0 925 925 0 7505571 0 0
5 4051453 7509613 0 0 0 0 2021 2021 0 7505571 0 0
6 1401 7507471 0 0 0 0 950 950 0 7505571 0 0
7 5387708 7509619 0 0 0 0 2024 2024 0 7505571 0 0
8 460 0 0 0 0 0 0 0 0 0 0 0
9 183 0 0 0 0 0 0 0 0 0 0 0
10 537 0 0 0 0 0 0 0 0 0 0 0
11 388 0 0 0 0 0 0 0 0 0 0 0
12 674 0 0 0 0 0 0 0 0 0 0 0
13 244 1 0 0 0 0 0 0 1 0 0 0
14 0 0 0 0 0 0 0 0 0 0 0 0
15 597 0 0 0 0 0 0 0 0 0 0 0
16 0 0 0 0 0 0 0 0 0 0 0 0
17 0 0 0 0 0 0 0 0 0 0 0 0
18 0 0 0 0 0 0 0 0 0 0 0 0
19 0 0 0 0 0 0 0 0 0 0 0 0
20 0 0 0 0 0 0 0 0 0 0 0 0
21 0 0 0 0 0 0 0 0 0 0 0 0
22 0 0 0 0 0 0 0 0 0 0 0 0
23 0 0 0 0 0 0 0 0 0 0 0 0
24 0 0 0 0 0 0 0 0 0 0 0 0
25 0 0 0 0 0 0 0 0 0 0 0 0
26 0 0 0 0 0 0 0 0 0 0 0 0
27 0 0 0 0 0 0 0 0 0 0 0 0
28 0 0 0 0 0 0 0 0 0 0 0 0
29 0 0 0 0 0 0 0 0 0 0 0 0
30 0 0 0 0 0 0 0 0 0 0 0 0
31 0 0 0 0 0 0 0 0 0 0 0 0
32 0 0 0 0 0 0 0 0 0 0 0 0
*** Timewarps
FEE ADC Pause Resume SYNC100 WR48-63 Disc MBS Undefined Samples
0 0 0 0 0 0 0 0 0 0
1 0 0 0 0 0 0 0 0 0
2 0 0 0 0 0 0 0 0 0
3 0 0 0 0 0 0 0 0 0
4 0 0 0 0 0 0 0 0 0
5 0 0 0 0 0 0 0 0 0
6 0 0 0 0 0 0 0 0 0
7 0 0 0 0 0 0 0 0 0
8 0 0 0 0 0 0 0 0 0
9 0 0 0 0 0 0 0 0 0
10 0 0 0 0 0 0 0 0 0
11 0 0 0 0 0 0 0 0 0
12 0 0 0 0 0 0 0 0 0
13 0 0 0 0 0 0 0 0 0
14 0 0 0 0 0 0 0 0 0
15 0 0 0 0 0 0 0 0 0
16 0 0 0 0 0 0 0 0 0
17 0 0 0 0 0 0 0 0 0
18 0 0 0 0 0 0 0 0 0
19 0 0 0 0 0 0 0 0 0
20 0 0 0 0 0 0 0 0 0
21 0 0 0 0 0 0 0 0 0
22 0 0 0 0 0 0 0 0 0
23 0 0 0 0 0 0 0 0 0
24 0 0 0 0 0 0 0 0 0
25 0 0 0 0 0 0 0 0 0
26 0 0 0 0 0 0 0 0 0
27 0 0 0 0 0 0 0 0 0
28 0 0 0 0 0 0 0 0 0
29 0 0 0 0 0 0 0 0 0
30 0 0 0 0 0 0 0 0 0
31 0 0 0 0 0 0 0 0 0
32 0 0 0 0 0 0 0 0 0
*** Program elapsed time: 31.855s ( 1004.537 blocks/s, 62.784 Mb/s)
|
499
|
Sat Jun 25 06:55:07 2022 |
MS | Saturday 25 June 2022 8:00-16:00 |
Took over the night shift from Tom.
7:00 The beam is back.
8:00 : attachments 1-3
10:00 : attachments 4-6
12:00 : attachments 7-9
14:00 : attachments 10-12
16:00 : attachments 13-15
|
Attachment 1: Screenshot_2022-06-25_at_08-01-16_Statistics_aidas-gsi.png
|
|
Attachment 2: Screenshot_2022-06-25_at_08-01-37_Temperature_and_status_scan_aidas-gsi.png
|
|
Attachment 3: Screenshot_from_2022-06-25_08-02-58.png
|
|
Attachment 4: Screenshot_2022-06-25_at_10-00-41_Statistics_aidas-gsi.png
|
|
Attachment 5: Screenshot_2022-06-25_at_10-01-03_Temperature_and_status_scan_aidas-gsi.png
|
|
Attachment 6: Screenshot_from_2022-06-25_10-01-59.png
|
|
Attachment 7: Screenshot_2022-06-25_at_12-00-54_Statistics_aidas-gsi.png
|
|
Attachment 8: Screenshot_2022-06-25_at_12-01-17_Temperature_and_status_scan_aidas-gsi.png
|
|
Attachment 9: Screenshot_from_2022-06-25_12-02-08.png
|
|
Attachment 10: Screenshot_2022-06-25_at_14-07-36_Statistics_aidas-gsi.png
|
|
Attachment 11: Screenshot_2022-06-25_at_14-07-59_Temperature_and_status_scan_aidas-gsi.png
|
|
Attachment 12: Screenshot_from_2022-06-25_14-08-50.png
|
|
Attachment 13: Screenshot_2022-06-25_at_15-56-41_Statistics_aidas-gsi.png
|
|
Attachment 14: Screenshot_2022-06-25_at_15-56-57_Temperature_and_status_scan_aidas-gsi.png
|
|
Attachment 15: Screenshot_from_2022-06-25_15-58-15.png
|
|
500
|
Sat Jun 25 17:06:42 2022 |
BA, AA | Saturday 25 June 2022 16:00-00:00 |
Took over the night shift from Magda
18:00 : attachments 1-3
20:00 : attachments 4-6
22:00 : attachments 7-9
00:00 : attachments 10-12
|
Attachment 1: Stat_17.png
|
|
Attachment 2: leak_17.png
|
|
Attachment 3: Temp17.png
|
|
Attachment 4: Temp_20.png
|
|
Attachment 5: Stat_20.png
|
|
Attachment 6: lek_20.png
|
|
Attachment 7: stat_22.png
|
|
Attachment 8: temp_22.png
|
|
Attachment 9: lak_22.png
|
|
498
|
Fri Jun 24 22:36:45 2022 |
TD | Saturday 25 June 00:00-08:00 |
23:36 Check ASIC contorol
Zero stats & all histograms
ASIC settings 2021Apr29-13-16-00
slow comparator 0x64 -> 0xa
all waveform AD9252 ADCs disabled
all fast discs disabled
BNC PB-5 settings (to p+n FEE64s only)
amplitude 1.0V
attenuator x1
decay time 1ms
polarity +
frequency 22Hz
analysis of file S505/R5_154 - attachment 1
zero timewarps
max deadtime aida02 c. 17%, all other FEE64s < 5%
stats - attachments 2-6
per FEE64 1.8.H spectra - attachments 7 & 8
per p+n FEE64 1.8.L spectra - attachment 9
aida01 pulser peak width 101 ch FWHM
per FEE64 stat & rate spectra - attachments 10 & 11
adc data item stats - attachment 12
FEE64 temps OK - attachment 13
DSSSD bias & leakage currents OK - attachments 14 & 15
00:20 all system wide checks OK *except* WR and FPGA errors - attachments 16 & 17
03:03
analysis of file S505/R5_189 - attachment 18
zero timewarps
max deadtime aida02 c. 17%, all other FEE64s < 5%
all system wide checks OK *except* WR and FPGA errors - attachments 19 & 20
adc data item stats - attachment 21
FEE64 temps OK - attachment 22
DSSSD bias & leakage currents OK - attachment 23
03:30
per FEE64 1.8.H spectra - attcahments 24 & 25
06:09 no beam
analysis of file S505/R5_221 - attachment 26
zero timewarps
all dead times << 1%
all system wide checks OK *except* WR and FPGA errors - attachments 27 & 28
adc data item stats - attachment 29
FEE64 temps OK - attachment 30
DSSSD bias & leakage currents OK - attachment 31 |
Attachment 1: R5_154
|
*** TDR format 3.3.0 analyser - TD - May 2021
*** ERROR: READ I/O error: 5002
blocks: 32000
ADC data format: 260632197 ( 880101.4 Hz)
Other data format: 1287803 ( 4348.6 Hz)
Sample trace data format: 0 ( 0.0 Hz)
Undefined format: 0 ( 0.0 Hz)
Other data format type: PAUSE: 1443 ( 4.9 Hz)
RESUME: 1443 ( 4.9 Hz)
SYNC100: 33103 ( 111.8 Hz)
WR48-63: 33103 ( 111.8 Hz)
FEE64 disc: 0 ( 0.0 Hz)
MBS info: 1218711 ( 4115.3 Hz)
Other info: 0 ( 0.0 Hz)
ADC data range bit set: 391650 ( 1322.5 Hz)
Timewarps: ADC: 0 ( 0.0 Hz)
PAUSE: 0 ( 0.0 Hz)
RESUME: 0 ( 0.0 Hz)
SYNC100: 0 ( 0.0 Hz)
WR48-63: 0 ( 0.0 Hz)
FEE64 disc: 0 ( 0.0 Hz)
MBS info: 0 ( 0.0 Hz)
Undefined: 0 ( 0.0 Hz)
Sample trace: 0 ( 0.0 Hz)
*** Timestamp elapsed time: 296.139 s
FEE elapsed dead time(s) elapsed idle time(s)
0 14.978 0.000
1 49.946 0.000
2 0.925 0.000
3 8.130 0.000
4 0.131 17.535
5 0.197 0.000
6 0.760 0.000
7 0.599 0.000
8 0.000 0.000
9 0.000 0.000
10 0.000 0.000
11 0.000 0.000
12 0.000 0.000
13 0.000 0.000
14 0.000 0.000
15 0.000 0.000
16 0.000 0.000
17 0.000 0.000
18 0.000 0.000
19 0.000 0.000
20 0.000 0.000
21 0.000 0.000
22 0.000 0.000
23 0.000 0.000
24 0.000 0.000
25 0.000 0.000
26 0.000 0.000
27 0.000 0.000
28 0.000 0.000
29 0.000 0.000
30 0.000 0.000
31 0.000 0.000
32 0.000 0.000
*** Statistics
FEE ADC Data Other Data Sample Undefined Pause Resume SYNC100 WR48-63 Disc MBS Other HEC Data
0 32916598 28529 0 0 287 287 4193 4193 0 19569 0 96572
1 59287487 16678 0 0 710 710 7629 7629 0 0 0 57145
2 20165095 309168 0 0 52 52 2618 2618 0 303828 0 63600
3 42178844 305489 0 0 214 214 5322 5322 0 294417 0 32426
4 5271956 1388 0 0 2 2 692 692 0 0 0 31943
5 18164680 4584 0 0 28 28 2264 2264 0 0 0 38343
6 41060613 306981 0 0 61 61 5168 5168 0 296523 0 54824
7 41586924 314986 0 0 89 89 5217 5217 0 304374 0 16797
8 0 0 0 0 0 0 0 0 0 0 0 0
9 0 0 0 0 0 0 0 0 0 0 0 0
10 0 0 0 0 0 0 0 0 0 0 0 0
11 0 0 0 0 0 0 0 0 0 0 0 0
12 0 0 0 0 0 0 0 0 0 0 0 0
13 0 0 0 0 0 0 0 0 0 0 0 0
14 0 0 0 0 0 0 0 0 0 0 0 0
15 0 0 0 0 0 0 0 0 0 0 0 0
16 0 0 0 0 0 0 0 0 0 0 0 0
17 0 0 0 0 0 0 0 0 0 0 0 0
18 0 0 0 0 0 0 0 0 0 0 0 0
19 0 0 0 0 0 0 0 0 0 0 0 0
20 0 0 0 0 0 0 0 0 0 0 0 0
21 0 0 0 0 0 0 0 0 0 0 0 0
22 0 0 0 0 0 0 0 0 0 0 0 0
23 0 0 0 0 0 0 0 0 0 0 0 0
24 0 0 0 0 0 0 0 0 0 0 0 0
25 0 0 0 0 0 0 0 0 0 0 0 0
26 0 0 0 0 0 0 0 0 0 0 0 0
27 0 0 0 0 0 0 0 0 0 0 0 0
28 0 0 0 0 0 0 0 0 0 0 0 0
29 0 0 0 0 0 0 0 0 0 0 0 0
30 0 0 0 0 0 0 0 0 0 0 0 0
31 0 0 0 0 0 0 0 0 0 0 0 0
32 0 0 0 0 0 0 0 0 0 0 0 0
*** Timewarps
FEE ADC Pause Resume SYNC100 WR48-63 Disc MBS Undefined Samples
0 0 0 0 0 0 0 0 0 0
1 0 0 0 0 0 0 0 0 0
2 0 0 0 0 0 0 0 0 0
3 0 0 0 0 0 0 0 0 0
4 0 0 0 0 0 0 0 0 0
5 0 0 0 0 0 0 0 0 0
6 0 0 0 0 0 0 0 0 0
7 0 0 0 0 0 0 0 0 0
8 0 0 0 0 0 0 0 0 0
9 0 0 0 0 0 0 0 0 0
10 0 0 0 0 0 0 0 0 0
11 0 0 0 0 0 0 0 0 0
12 0 0 0 0 0 0 0 0 0
13 0 0 0 0 0 0 0 0 0
14 0 0 0 0 0 0 0 0 0
15 0 0 0 0 0 0 0 0 0
16 0 0 0 0 0 0 0 0 0
17 0 0 0 0 0 0 0 0 0
18 0 0 0 0 0 0 0 0 0
19 0 0 0 0 0 0 0 0 0
20 0 0 0 0 0 0 0 0 0
21 0 0 0 0 0 0 0 0 0
22 0 0 0 0 0 0 0 0 0
23 0 0 0 0 0 0 0 0 0
24 0 0 0 0 0 0 0 0 0
25 0 0 0 0 0 0 0 0 0
26 0 0 0 0 0 0 0 0 0
27 0 0 0 0 0 0 0 0 0
28 0 0 0 0 0 0 0 0 0
29 0 0 0 0 0 0 0 0 0
30 0 0 0 0 0 0 0 0 0
31 0 0 0 0 0 0 0 0 0
32 0 0 0 0 0 0 0 0 0
*** Program elapsed time: 44.250s ( 723.164 blocks/s, 45.198 Mb/s)
|
Attachment 2: Screenshot_from_2022-06-24_23-58-03.png
|
|
Attachment 3: Screenshot_from_2022-06-24_23-56-54.png
|
|
Attachment 4: Screenshot_from_2022-06-24_23-56-18.png
|
|
Attachment 5: Screenshot_from_2022-06-24_23-55-53.png
|
|
Attachment 6: Screenshot_from_2022-06-24_23-55-15.png
|
|
Attachment 7: Screenshot_from_2022-06-24_23-54-37.png
|
|
Attachment 8: Screenshot_from_2022-06-24_23-53-22.png
|
|
Attachment 9: Screenshot_from_2022-06-24_23-51-35.png
|
|
Attachment 10: Screenshot_from_2022-06-24_23-50-18.png
|
|
Attachment 11: Screenshot_from_2022-06-24_23-49-08.png
|
|
Attachment 12: Screenshot_from_2022-06-24_23-48-14.png
|
|
Attachment 13: Screenshot_from_2022-06-24_23-47-40.png
|
|
Attachment 14: Screenshot_from_2022-06-24_23-46-10.png
|
|
Attachment 15: Screenshot_from_2022-06-24_23-44-08.png
|
|
Attachment 16: Screenshot_from_2022-06-25_00-17-58.png
|
|
Attachment 17: Screenshot_from_2022-06-25_00-17-36.png
|
|
Attachment 18: R5_189
|
*** TDR format 3.3.0 analyser - TD - May 2021
*** ERROR: READ I/O error: 5002
blocks: 32000
ADC data format: 260527466 ( 871545.5 Hz)
Other data format: 1392534 ( 4658.5 Hz)
Sample trace data format: 0 ( 0.0 Hz)
Undefined format: 0 ( 0.0 Hz)
Other data format type: PAUSE: 1393 ( 4.7 Hz)
RESUME: 1393 ( 4.7 Hz)
SYNC100: 33113 ( 110.8 Hz)
WR48-63: 33113 ( 110.8 Hz)
FEE64 disc: 0 ( 0.0 Hz)
MBS info: 1323522 ( 4427.6 Hz)
Other info: 0 ( 0.0 Hz)
ADC data range bit set: 429409 ( 1436.5 Hz)
Timewarps: ADC: 0 ( 0.0 Hz)
PAUSE: 0 ( 0.0 Hz)
RESUME: 0 ( 0.0 Hz)
SYNC100: 0 ( 0.0 Hz)
WR48-63: 0 ( 0.0 Hz)
FEE64 disc: 0 ( 0.0 Hz)
MBS info: 0 ( 0.0 Hz)
Undefined: 0 ( 0.0 Hz)
Sample trace: 0 ( 0.0 Hz)
*** Timestamp elapsed time: 298.926 s
FEE elapsed dead time(s) elapsed idle time(s)
0 14.659 0.000
1 49.890 0.000
2 0.405 2.804
3 7.856 0.000
4 0.000 45.637
5 0.052 0.000
6 0.331 0.000
7 0.206 0.000
8 0.000 0.000
9 0.000 0.000
10 0.000 0.000
11 0.000 0.000
12 0.000 0.000
13 0.000 0.000
14 0.000 0.000
15 0.000 0.000
16 0.000 0.000
17 0.000 0.000
18 0.000 0.000
19 0.000 0.000
20 0.000 0.000
21 0.000 0.000
22 0.000 0.000
23 0.000 0.000
24 0.000 0.000
25 0.000 0.000
26 0.000 0.000
27 0.000 0.000
28 0.000 0.000
29 0.000 0.000
30 0.000 0.000
31 0.000 0.000
32 0.000 0.000
*** Statistics
FEE ADC Data Other Data Sample Undefined Pause Resume SYNC100 WR48-63 Disc MBS Other HEC Data
0 33437852 29241 0 0 298 298 4430 4430 0 19785 0 105011
1 60873066 16872 0 0 713 713 7723 7723 0 0 0 63589
2 19991278 336066 0 0 51 51 2502 2502 0 330960 0 70003
3 42622163 327782 0 0 194 194 5471 5471 0 316452 0 35634
4 5450705 1394 0 0 0 0 697 697 0 0 0 34276
5 18430449 4608 0 0 17 17 2287 2287 0 0 0 41850
6 41735438 335959 0 0 67 67 5311 5311 0 325203 0 60533
7 37986515 340612 0 0 53 53 4692 4692 0 331122 0 18513
8 0 0 0 0 0 0 0 0 0 0 0 0
9 0 0 0 0 0 0 0 0 0 0 0 0
10 0 0 0 0 0 0 0 0 0 0 0 0
11 0 0 0 0 0 0 0 0 0 0 0 0
12 0 0 0 0 0 0 0 0 0 0 0 0
13 0 0 0 0 0 0 0 0 0 0 0 0
14 0 0 0 0 0 0 0 0 0 0 0 0
15 0 0 0 0 0 0 0 0 0 0 0 0
16 0 0 0 0 0 0 0 0 0 0 0 0
17 0 0 0 0 0 0 0 0 0 0 0 0
18 0 0 0 0 0 0 0 0 0 0 0 0
19 0 0 0 0 0 0 0 0 0 0 0 0
20 0 0 0 0 0 0 0 0 0 0 0 0
21 0 0 0 0 0 0 0 0 0 0 0 0
22 0 0 0 0 0 0 0 0 0 0 0 0
23 0 0 0 0 0 0 0 0 0 0 0 0
24 0 0 0 0 0 0 0 0 0 0 0 0
25 0 0 0 0 0 0 0 0 0 0 0 0
26 0 0 0 0 0 0 0 0 0 0 0 0
27 0 0 0 0 0 0 0 0 0 0 0 0
28 0 0 0 0 0 0 0 0 0 0 0 0
29 0 0 0 0 0 0 0 0 0 0 0 0
30 0 0 0 0 0 0 0 0 0 0 0 0
31 0 0 0 0 0 0 0 0 0 0 0 0
32 0 0 0 0 0 0 0 0 0 0 0 0
*** Timewarps
FEE ADC Pause Resume SYNC100 WR48-63 Disc MBS Undefined Samples
0 0 0 0 0 0 0 0 0 0
1 0 0 0 0 0 0 0 0 0
2 0 0 0 0 0 0 0 0 0
3 0 0 0 0 0 0 0 0 0
4 0 0 0 0 0 0 0 0 0
5 0 0 0 0 0 0 0 0 0
6 0 0 0 0 0 0 0 0 0
7 0 0 0 0 0 0 0 0 0
8 0 0 0 0 0 0 0 0 0
9 0 0 0 0 0 0 0 0 0
10 0 0 0 0 0 0 0 0 0
11 0 0 0 0 0 0 0 0 0
12 0 0 0 0 0 0 0 0 0
13 0 0 0 0 0 0 0 0 0
14 0 0 0 0 0 0 0 0 0
15 0 0 0 0 0 0 0 0 0
16 0 0 0 0 0 0 0 0 0
17 0 0 0 0 0 0 0 0 0
18 0 0 0 0 0 0 0 0 0
19 0 0 0 0 0 0 0 0 0
20 0 0 0 0 0 0 0 0 0
21 0 0 0 0 0 0 0 0 0
22 0 0 0 0 0 0 0 0 0
23 0 0 0 0 0 0 0 0 0
24 0 0 0 0 0 0 0 0 0
25 0 0 0 0 0 0 0 0 0
26 0 0 0 0 0 0 0 0 0
27 0 0 0 0 0 0 0 0 0
28 0 0 0 0 0 0 0 0 0
29 0 0 0 0 0 0 0 0 0
30 0 0 0 0 0 0 0 0 0
31 0 0 0 0 0 0 0 0 0
32 0 0 0 0 0 0 0 0 0
*** Program elapsed time: 35.010s ( 914.031 blocks/s, 57.127 Mb/s)
|
Attachment 19: Screenshot_from_2022-06-25_03-05-56.png
|
|
Attachment 20: Screenshot_from_2022-06-25_03-05-35.png
|
|
Attachment 21: Screenshot_from_2022-06-25_03-04-59.png
|
|
Attachment 22: Screenshot_from_2022-06-25_03-04-24.png
|
|
Attachment 23: Screenshot_from_2022-06-25_03-03-54.png
|
|
Attachment 24: Screenshot_from_2022-06-25_03-31-28.png
|
|
Attachment 25: Screenshot_from_2022-06-25_03-30-31.png
|
|
Attachment 26: R5_221
|
*** TDR format 3.3.0 analyser - TD - May 2021
*** ERROR: READ I/O error: 5002
blocks: 32000
ADC data format: 261819129 ( 557711.5 Hz)
Other data format: 100871 ( 214.9 Hz)
Sample trace data format: 0 ( 0.0 Hz)
Undefined format: 0 ( 0.0 Hz)
Other data format type: PAUSE: 371 ( 0.8 Hz)
RESUME: 371 ( 0.8 Hz)
SYNC100: 33749 ( 71.9 Hz)
WR48-63: 33749 ( 71.9 Hz)
FEE64 disc: 0 ( 0.0 Hz)
MBS info: 32631 ( 69.5 Hz)
Other info: 0 ( 0.0 Hz)
ADC data range bit set: 2 ( 0.0 Hz)
Timewarps: ADC: 0 ( 0.0 Hz)
PAUSE: 0 ( 0.0 Hz)
RESUME: 0 ( 0.0 Hz)
SYNC100: 0 ( 0.0 Hz)
WR48-63: 0 ( 0.0 Hz)
FEE64 disc: 0 ( 0.0 Hz)
MBS info: 0 ( 0.0 Hz)
Undefined: 0 ( 0.0 Hz)
Sample trace: 0 ( 0.0 Hz)
*** Timestamp elapsed time: 469.453 s
FEE elapsed dead time(s) elapsed idle time(s)
0 0.000 0.000
1 0.835 0.000
2 0.000 15.780
3 0.000 0.000
4 0.000 132.034
5 0.000 0.000
6 0.000 0.000
7 0.000 0.000
8 0.000 0.000
9 0.000 0.000
10 0.000 0.000
11 0.000 0.000
12 0.000 0.000
13 0.000 0.000
14 0.000 0.000
15 0.000 0.000
16 0.000 0.000
17 0.000 0.000
18 0.000 0.000
19 0.000 0.000
20 0.000 0.000
21 0.000 0.000
22 0.000 0.000
23 0.000 0.000
24 0.000 0.000
25 0.000 0.000
26 0.000 0.000
27 0.000 0.000
28 0.000 0.000
29 0.000 0.000
30 0.000 0.000
31 0.000 0.000
32 0.000 0.000
*** Statistics
FEE ADC Data Other Data Sample Undefined Pause Resume SYNC100 WR48-63 Disc MBS Other HEC Data
0 18255571 37491 0 0 0 0 2430 2430 0 32631 0 1
1 67878845 18770 0 0 371 371 9014 9014 0 0 0 0
2 8103831 2048 0 0 0 0 1024 1024 0 0 0 1
3 41453255 10648 0 0 0 0 5324 5324 0 0 0 0
4 3384177 880 0 0 0 0 440 440 0 0 0 0
5 15593071 3880 0 0 0 0 1940 1940 0 0 0 0
6 55917021 14018 0 0 0 0 7009 7009 0 0 0 0
7 51233358 13136 0 0 0 0 6568 6568 0 0 0 0
8 0 0 0 0 0 0 0 0 0 0 0 0
9 0 0 0 0 0 0 0 0 0 0 0 0
10 0 0 0 0 0 0 0 0 0 0 0 0
11 0 0 0 0 0 0 0 0 0 0 0 0
12 0 0 0 0 0 0 0 0 0 0 0 0
13 0 0 0 0 0 0 0 0 0 0 0 0
14 0 0 0 0 0 0 0 0 0 0 0 0
15 0 0 0 0 0 0 0 0 0 0 0 0
16 0 0 0 0 0 0 0 0 0 0 0 0
17 0 0 0 0 0 0 0 0 0 0 0 0
18 0 0 0 0 0 0 0 0 0 0 0 0
19 0 0 0 0 0 0 0 0 0 0 0 0
20 0 0 0 0 0 0 0 0 0 0 0 0
21 0 0 0 0 0 0 0 0 0 0 0 0
22 0 0 0 0 0 0 0 0 0 0 0 0
23 0 0 0 0 0 0 0 0 0 0 0 0
24 0 0 0 0 0 0 0 0 0 0 0 0
25 0 0 0 0 0 0 0 0 0 0 0 0
26 0 0 0 0 0 0 0 0 0 0 0 0
27 0 0 0 0 0 0 0 0 0 0 0 0
28 0 0 0 0 0 0 0 0 0 0 0 0
29 0 0 0 0 0 0 0 0 0 0 0 0
30 0 0 0 0 0 0 0 0 0 0 0 0
31 0 0 0 0 0 0 0 0 0 0 0 0
32 0 0 0 0 0 0 0 0 0 0 0 0
*** Timewarps
FEE ADC Pause Resume SYNC100 WR48-63 Disc MBS Undefined Samples
0 0 0 0 0 0 0 0 0 0
1 0 0 0 0 0 0 0 0 0
2 0 0 0 0 0 0 0 0 0
3 0 0 0 0 0 0 0 0 0
4 0 0 0 0 0 0 0 0 0
5 0 0 0 0 0 0 0 0 0
6 0 0 0 0 0 0 0 0 0
7 0 0 0 0 0 0 0 0 0
8 0 0 0 0 0 0 0 0 0
9 0 0 0 0 0 0 0 0 0
10 0 0 0 0 0 0 0 0 0
11 0 0 0 0 0 0 0 0 0
12 0 0 0 0 0 0 0 0 0
13 0 0 0 0 0 0 0 0 0
14 0 0 0 0 0 0 0 0 0
15 0 0 0 0 0 0 0 0 0
16 0 0 0 0 0 0 0 0 0
17 0 0 0 0 0 0 0 0 0
18 0 0 0 0 0 0 0 0 0
19 0 0 0 0 0 0 0 0 0
20 0 0 0 0 0 0 0 0 0
21 0 0 0 0 0 0 0 0 0
22 0 0 0 0 0 0 0 0 0
23 0 0 0 0 0 0 0 0 0
24 0 0 0 0 0 0 0 0 0
25 0 0 0 0 0 0 0 0 0
26 0 0 0 0 0 0 0 0 0
27 0 0 0 0 0 0 0 0 0
28 0 0 0 0 0 0 0 0 0
29 0 0 0 0 0 0 0 0 0
30 0 0 0 0 0 0 0 0 0
31 0 0 0 0 0 0 0 0 0
32 0 0 0 0 0 0 0 0 0
*** Program elapsed time: 34.299s ( 932.977 blocks/s, 58.311 Mb/s)
|
Attachment 27: Screenshot_from_2022-06-25_06-11-13.png
|
|
Attachment 28: Screenshot_from_2022-06-25_06-10-50.png
|
|
Attachment 29: Screenshot_from_2022-06-25_06-10-11.png
|
|
Attachment 30: Screenshot_from_2022-06-25_06-09-40.png
|
|
Attachment 31: Screenshot_from_2022-06-25_06-09-06.png
|
|