ID |
Date |
Author |
Subject |
|
238
|
Sun Apr 18 07:30:20 2021 |
DJ, TD | Sunday 18th April 08:00-12:00 |
---- 09-26
FEE64 module aida06 failed
FEE64 module aida07 failed
FEE64 module aida10 failed
Calibration test result: Passed 9, Failed 3
If any modules fail calibration , check the clock status and open the FADC Align and Control browser page to rerun calibration for that module
---
Base Current Difference
aida01 fault 0x7685 : 0x7686 : 1
aida02 fault 0x941c : 0x941d : 1
aida03 fault 0x7cd6 : 0x7cd7 : 1
aida04 fault 0xb86c : 0xb86d : 1
aida05 fault 0x1a52 : 0x1a59 : 7
aida06 fault 0x4f3e : 0x4f45 : 7
aida07 fault 0x3bcd : 0x3bfc : 47
aida08 fault 0xc7c7 : 0xc7ce : 7
aida09 fault 0xb33a : 0xb33b : 1
White Rabbit error counter test result: Passed 3, Failed 9
Understand the status reports as follows:-
Status bit 3 : White Rabbit decoder detected an error in the received data
Status bit 2 : Firmware registered WR error, no reload of Timestamp
Status bit 0 : White Rabbit decoder reports uncertain of Timestamp information from WR
--
Base Current Difference
aida01 fault 0x7685 : 0x7686 : 1
aida02 fault 0x941c : 0x941d : 1
aida03 fault 0x7cd6 : 0x7cd7 : 1
aida04 fault 0xb86c : 0xb86d : 1
aida05 fault 0x1a52 : 0x1a59 : 7
aida06 fault 0x4f3e : 0x4f45 : 7
aida07 fault 0x3bcd : 0x3bfc : 47
aida08 fault 0xc7c7 : 0xc7ce : 7
aida09 fault 0xb33a : 0xb33b : 1
White Rabbit error counter test result: Passed 3, Failed 9
Understand the status reports as follows:-
Status bit 3 : White Rabbit decoder detected an error in the received data
Status bit 2 : Firmware registered WR error, no reload of Timestamp
Status bit 0 : White Rabbit decoder reports uncertain of Timestamp information from WR
-
Base Current Difference
aida01 fault 0x7685 : 0x7686 : 1
aida02 fault 0x941c : 0x941d : 1
aida03 fault 0x7cd6 : 0x7cd7 : 1
aida04 fault 0xb86c : 0xb86d : 1
aida05 fault 0x1a52 : 0x1a59 : 7
aida06 fault 0x4f3e : 0x4f45 : 7
aida07 fault 0x3bcd : 0x3bfc : 47
aida08 fault 0xc7c7 : 0xc7ce : 7
aida09 fault 0xb33a : 0xb33b : 1
White Rabbit error counter test result: Passed 3, Failed 9
Understand the status reports as follows:-
Status bit 3 : White Rabbit decoder detected an error in the received data
Status bit 2 : Firmware registered WR error, no reload of Timestamp
Status bit 0 : White Rabbit decoder reports uncertain of Timestamp information from WR
08.45 TD resets baseline for WR and FPGA errors
|
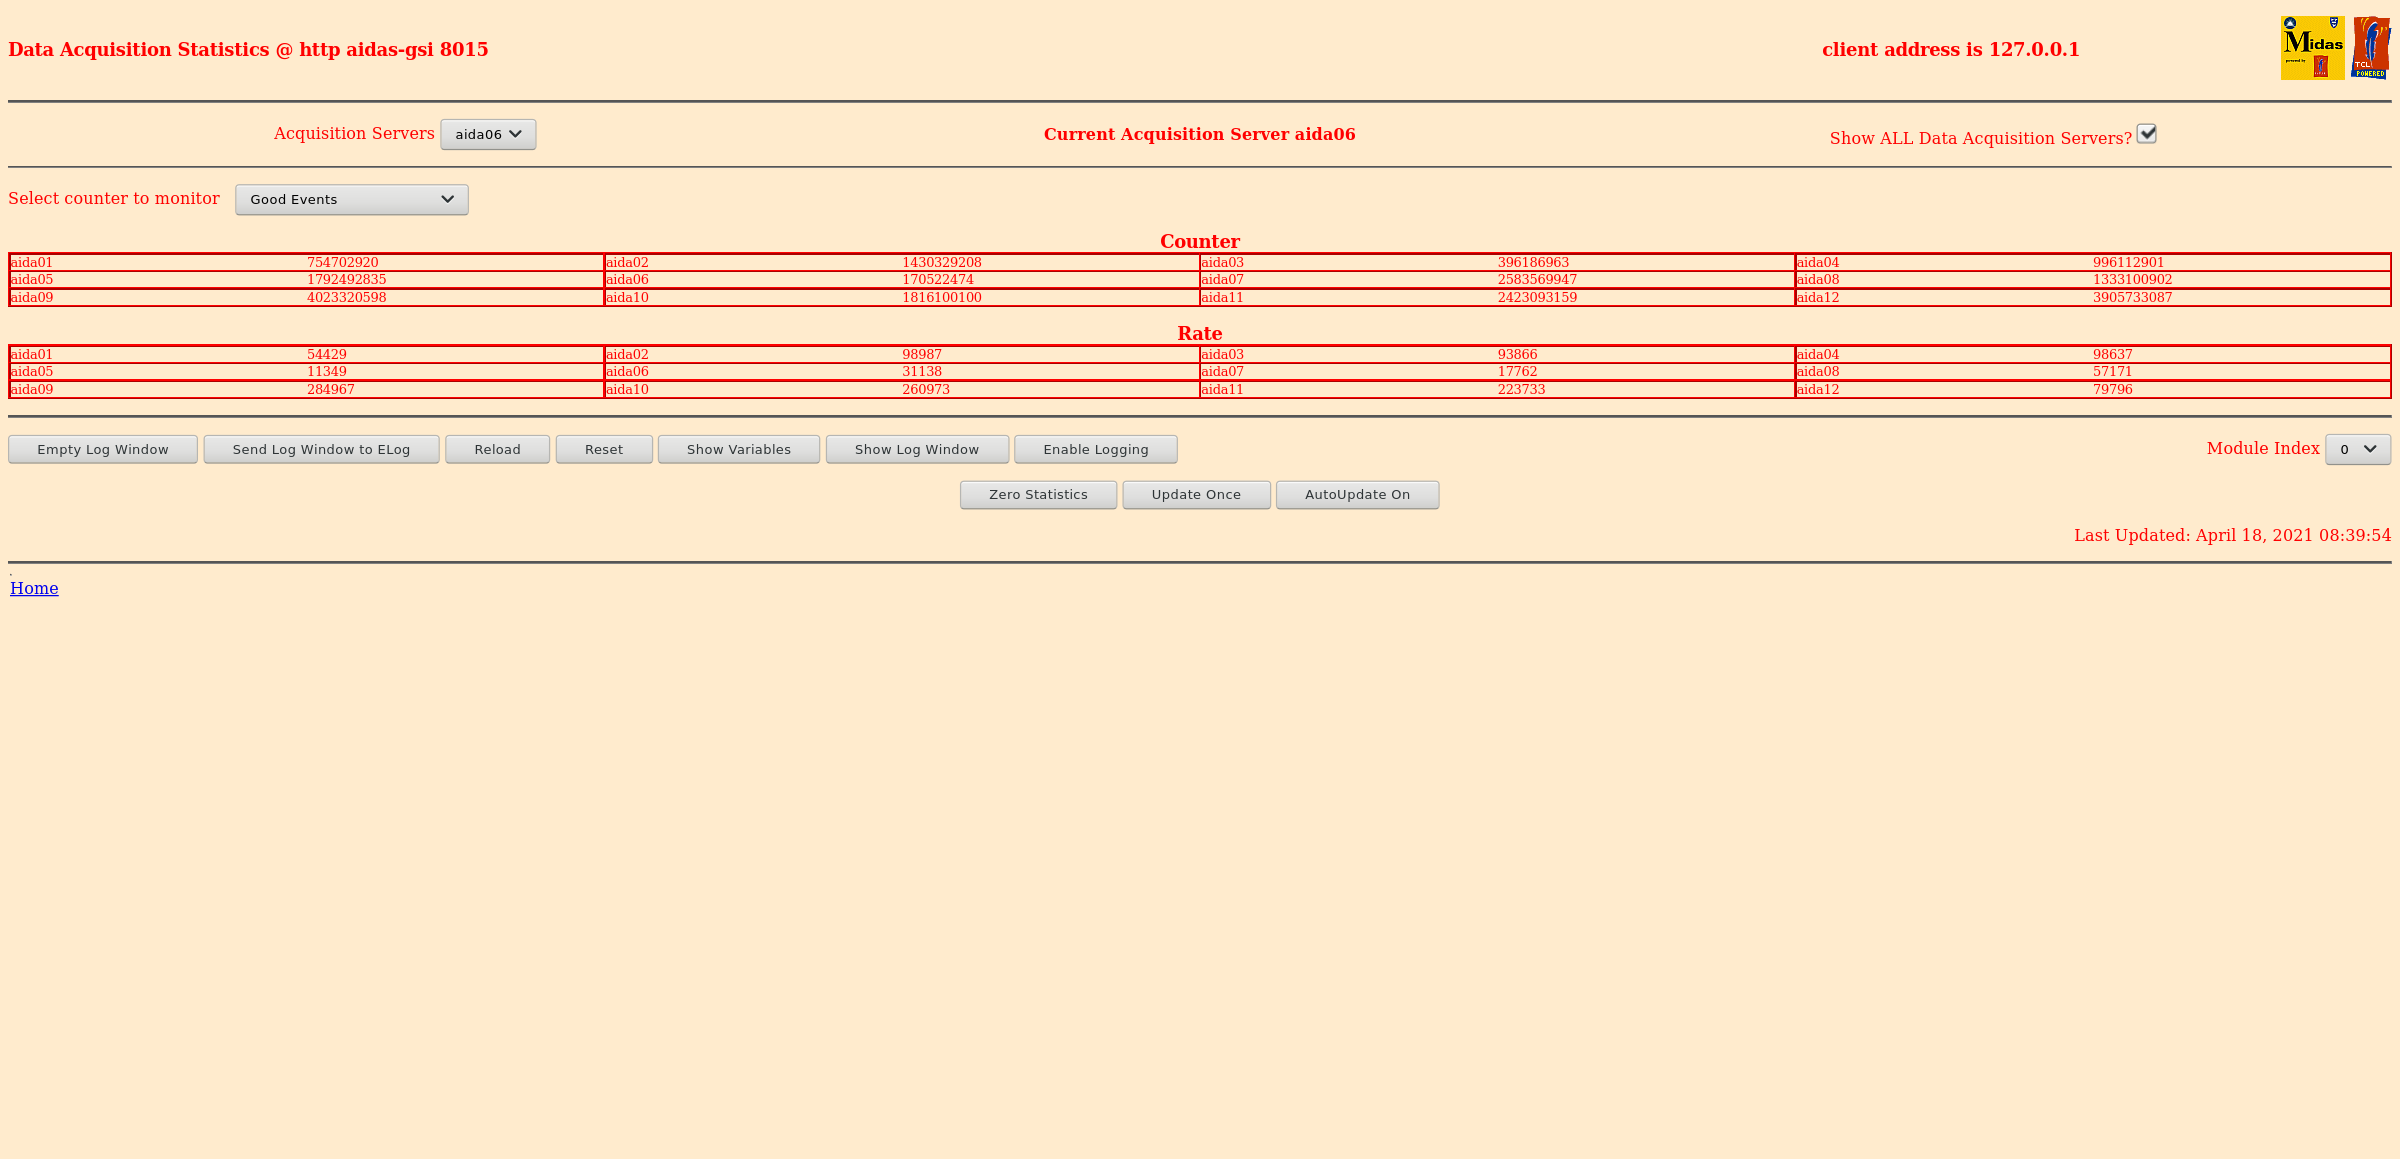
| Attachment 1: Screenshot_2021-04-18_Statistics_aidas-gsi.png
|
|
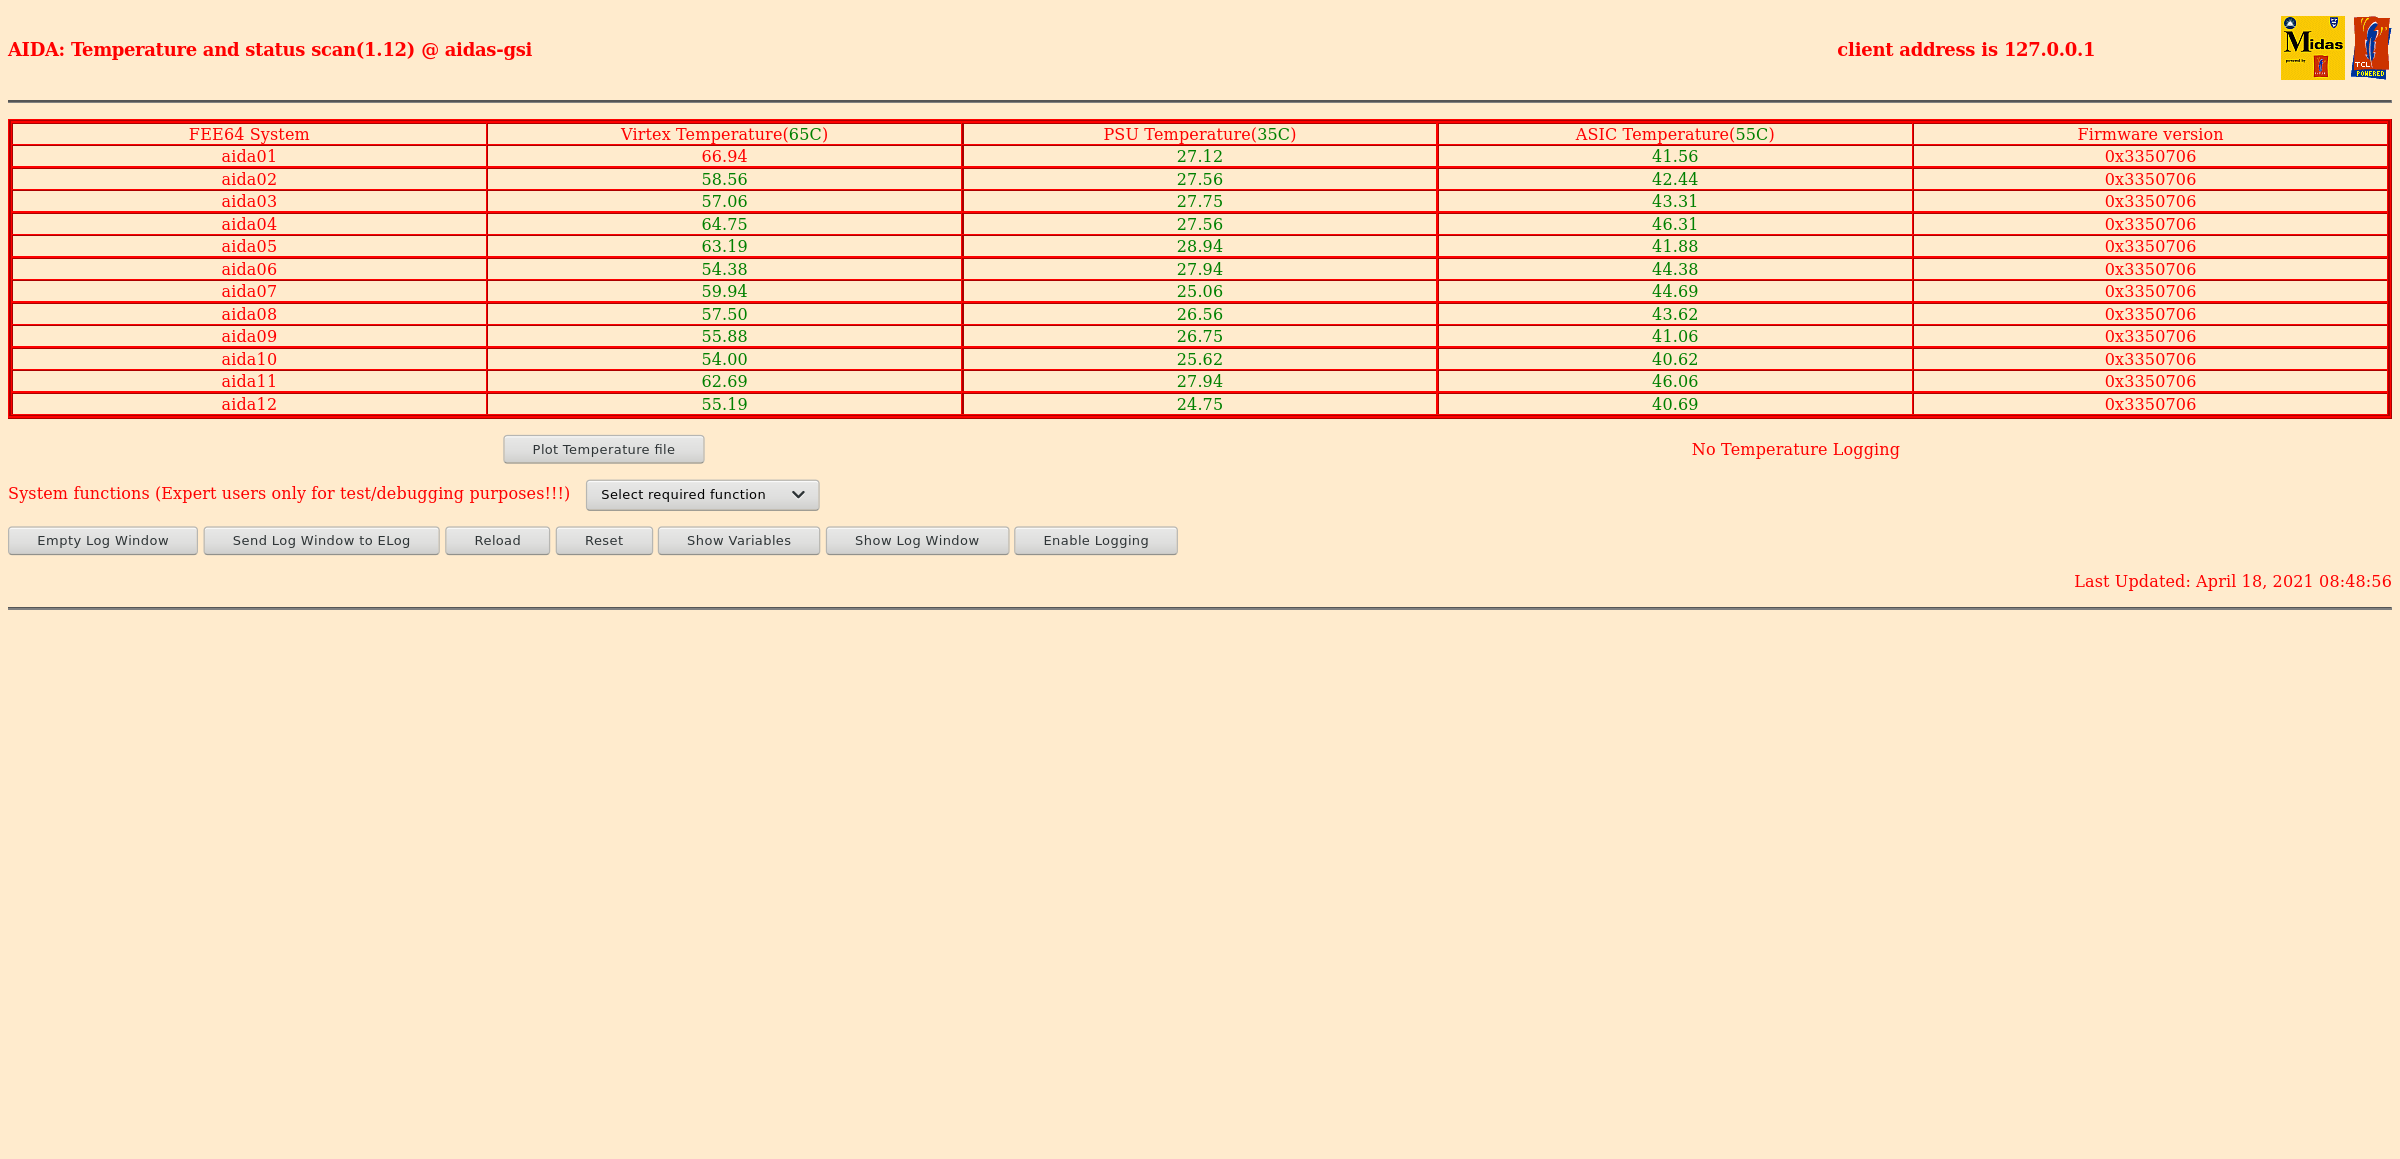
| Attachment 2: Screenshot_2021-04-18_Temperature_and_status_scan_aidas-gsi.png
|
|
| Attachment 3: 52.png
|

|
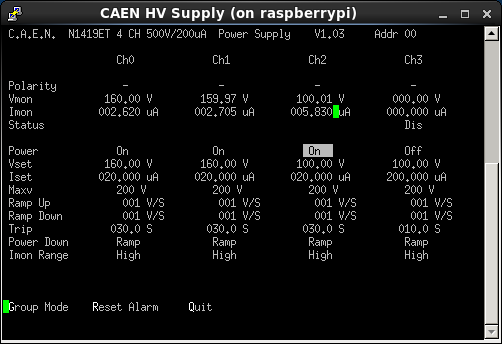
| Attachment 4: 53.png
|
|
| Attachment 5: Screenshot_2021-04-18_Temperature_and_status_scan_aidas-gsi(1).png
|
.png.png)
|
| Attachment 6: 54.png
|

|
| Attachment 7: Screenshot_2021-04-18_Statistics_aidas-gsi(1).png
|
.png.png)
|
|
237
|
Sun Apr 18 00:57:36 2021 |
BA, MA | Sanday 18 April 00.00-08.00 |
02:01 Beam has stopped at 01:37 and returend at 01:43 for few min and then stopped again and not knowen how it will take until it is back
AIDA scalers attached 1
statistic attached 2
temretuer attached 3
bias attached 4
Clock check ok
ADC check :
FEE64 module aida06 failed
FEE64 module aida07 failed
FEE64 module aida10 failed
Calibration test result: Passed 9, Failed 3
If any modules fail calibration , check the clock status and open the FADC Align and Control browser page to rerun calibration for that module
Base Current Difference
aida05 fault 0x1a52 : 0x1a55 : 3
aida06 fault 0x4f3e : 0x4f41 : 3
aida07 fault 0x3bcd : 0x3bea : 29
aida08 fault 0xc7c7 : 0xc7ca : 3
White Rabbit error counter test result: Passed 8, Failed 4
Understand the status reports as follows:-
Status bit 3 : White Rabbit decoder detected an error in the received data
Status bit 2 : Firmware registered WR error, no reload of Timestamp
Status bit 0 : White Rabbit decoder reports uncertain of Timestamp information from WR
Base Current Difference
aida09 fault 0x0 : 0x1 : 1
aida12 fault 0x0 : 0x9 : 9
FPGA Timestamp error counter test result: Passed 10, Failed 2
If any of these counts are reported as in error
The ASIC readout system has detected a timeslip.
That is the timestamp read from the time FIFO is not younger than the last
Returned 0 0 0 0 0 0 0 0 0 0 0 0
Mem(KB) : 4 8 16 32 64 128 256 512 1k 2k 4k
aida01 : 32 8 3 1 0 3 1 3 3 3 6 : 36240
aida02 : 11 7 9 3 1 2 2 4 2 3 6 : 35988
aida03 : 32 4 13 5 5 4 3 3 2 3 6 : 36432
aida04 : 26 7 6 1 2 3 2 4 2 3 6 : 36128
aida05 : 18 8 8 7 4 2 2 2 2 4 6 : 37352
aida06 : 24 11 3 1 2 5 1 3 3 3 6 : 36616
aida07 : 14 5 3 3 3 2 3 2 4 3 6 : 37296
aida08 : 21 7 1 5 0 1 2 3 3 3 6 : 36284
aida09 : 0 7 1 1 1 3 2 2 3 3 6 : 35880
aida10 : 22 5 3 4 1 2 2 2 3 3 6 : 35952
aida11 : 4 3 1 1 2 2 3 3 2 3 6 : 35544
aida12 : 22 10 5 4 4 4 1 3 3 3 6 : 36728
02:19 beam is back
03:58 The beam has not been stable yet
The rate reach 1.5 kHz, they will contact FRS team to lower the intensity of the beam
AIDA scalers attached 8
statistic attached 7
temretuer attached 6
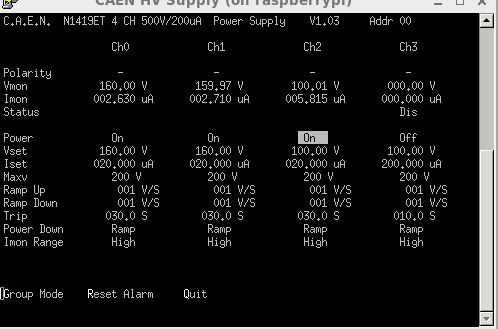
bias attached 5
FEE64 module aida06 failed
FEE64 module aida07 failed
FEE64 module aida10 failed
Calibration test result: Passed 9, Failed 3
If any modules fail calibration , check the clock status and open the FADC Align and Control browser page to rerun calibration for that module
Base Current Difference
aida05 fault 0x1a52 : 0x1a55 : 3
aida06 fault 0x4f3e : 0x4f41 : 3
aida07 fault 0x3bcd : 0x3beb : 30
aida08 fault 0xc7c7 : 0xc7ca : 3
White Rabbit error counter test result: Passed 8, Failed 4
Understand the status reports as follows:-
Status bit 3 : White Rabbit decoder detected an error in the received data
Status bit 2 : Firmware registered WR error, no reload of Timestamp
Status bit 0 : White Rabbit decoder reports uncertain of Timestamp information from WR
Base Current Difference
aida09 fault 0x0 : 0x1 : 1
aida12 fault 0x0 : 0x9 : 9
FPGA Timestamp error counter test result: Passed 10, Failed 2
If any of these counts are reported as in error
The ASIC readout system has detected a timeslip.
That is the timestamp read from the time FIFO is not younger than the last
Returned 0 0 0 0 0 0 0 0 0 0 0 0
Mem(KB) : 4 8 16 32 64 128 256 512 1k 2k 4k
aida01 : 21 8 6 2 1 2 1 3 3 3 6 : 36212
aida02 : 24 14 14 2 1 2 2 4 2 3 6 : 36144
aida03 : 31 5 10 5 5 4 2 3 2 3 6 : 36132
aida04 : 12 11 12 2 2 2 3 4 2 3 6 : 36360
aida05 : 23 8 5 7 4 2 2 2 2 4 6 : 37324
aida06 : 21 14 14 1 3 5 1 3 3 3 6 : 36868
aida07 : 15 9 5 0 3 2 3 2 4 3 6 : 37268
aida08 : 21 11 10 3 0 1 2 3 3 3 6 : 36396
aida09 : 5 7 5 1 1 3 1 3 3 3 6 : 36220
aida10 : 15 13 12 3 2 1 2 2 3 3 6 : 36036
aida11 : 13 10 1 0 2 2 2 4 2 3 6 : 35860
aida12 : 29 5 4 5 5 3 1 3 3 3 6 : 36668
05: 07 The rate was a bout 1500 and 2000, we contacted Oscar he said (if it's just bursts it should be ok), so they decided to do nothing.
06:26
AIDA scalers attached 9
statistic attached 10
temretuer attached 11
bias attached 12
Clock status test result: Passed 12, Failed 0
Understand status as follows
Status bit 3 : firmware PLL that creates clocks from external clock not locked
Status bit 2 : always logic '1'
Status bit 1 : LMK3200(2) PLL and clock distribution chip not locked to external clock
Status bit 0 : LMK3200(1) PLL and clock distribution chip not locked to external clock
If all these bits are not set then the operation of the firmware is unreliable
FEE64 module aida06 failed
FEE64 module aida07 failed
FEE64 module aida10 failed
Calibration test result: Passed 9, Failed 3
If any modules fail calibration , check the clock status and open the FADC Align and Control browser page to rerun calibration for that module
Base Current Difference
aida01 fault 0x7685 : 0x7686 : 1
aida02 fault 0x941c : 0x941d : 1
aida03 fault 0x7cd6 : 0x7cd7 : 1
aida04 fault 0xb86c : 0xb86d : 1
aida05 fault 0x1a52 : 0x1a59 : 7
aida06 fault 0x4f3e : 0x4f45 : 7
aida07 fault 0x3bcd : 0x3bf9 : 44
aida08 fault 0xc7c7 : 0xc7ce : 7
aida09 fault 0xb33a : 0xb33b : 1
White Rabbit error counter test result: Passed 3, Failed 9
Understand the status reports as follows:-
Status bit 3 : White Rabbit decoder detected an error in the received data
Status bit 2 : Firmware registered WR error, no reload of Timestamp
Status bit 0 : White Rabbit decoder reports uncertain of Timestamp information from WR
Base Current Difference
aida09 fault 0x0 : 0x1 : 1
aida12 fault 0x0 : 0xa : 10
FPGA Timestamp error counter test result: Passed 10, Failed 2
If any of these counts are reported as in error
The ASIC readout system has detected a timeslip.
That is the timestamp read from the time FIFO is not younger than the last
Returned 0 0 0 0 0 0 0 0 0 0 0 0
Mem(KB) : 4 8 16 32 64 128 256 512 1k 2k 4k
aida01 : 17 12 6 2 1 2 1 3 3 3 6 : 36228
aida02 : 19 11 12 3 2 2 2 4 2 3 6 : 36164
aida03 : 25 8 12 5 4 4 3 3 2 3 6 : 36356
aida04 : 22 19 11 3 1 2 3 4 2 3 6 : 36416
aida05 : 35 6 5 6 3 2 2 2 3 3 6 : 36236
aida06 : 12 11 11 2 3 4 1 3 3 3 6 : 36664
aida07 : 18 6 2 1 3 2 3 2 3 3 6 : 36216
aida08 : 27 10 8 3 0 1 2 3 3 3 6 : 36380
aida09 : 18 6 6 1 0 2 2 2 3 3 6 : 35832
aida10 : 3 14 10 3 1 1 2 3 3 3 6 : 36412
aida11 : 1 3 2 0 2 2 2 4 2 3 6 : 35772
aida12 : 0 5 6 3 3 4 1 3 3 3 6 : 36520
07:57 The beam stopped and they said there is a water leak !
|
| Attachment 1: 20210418_0154.png
|

|
| Attachment 2: 20210418_0152_rate.png
|

|
| Attachment 3: 20210418_0150_tem.png
|

|
| Attachment 4: 20210418_0150_bias.png
|

|
| Attachment 5: 20210418_0407.png
|
|
| Attachment 6: 20210418_0409.png
|

|
| Attachment 7: 20210418_0411.png
|

|
| Attachment 8: 20210418_0413.png
|

|
| Attachment 9: 18042021_0722_AIDA.png
|

|
| Attachment 10: 18042021_0615_rate.png
|

|
| Attachment 11: 18042021_0616_temp.png
|

|
| Attachment 12: 18042021_0620_bias.png
|

|
|
236
|
Sat Apr 17 19:39:56 2021 |
DJ, TD | Saturday 17 April 20.00-00.00 |
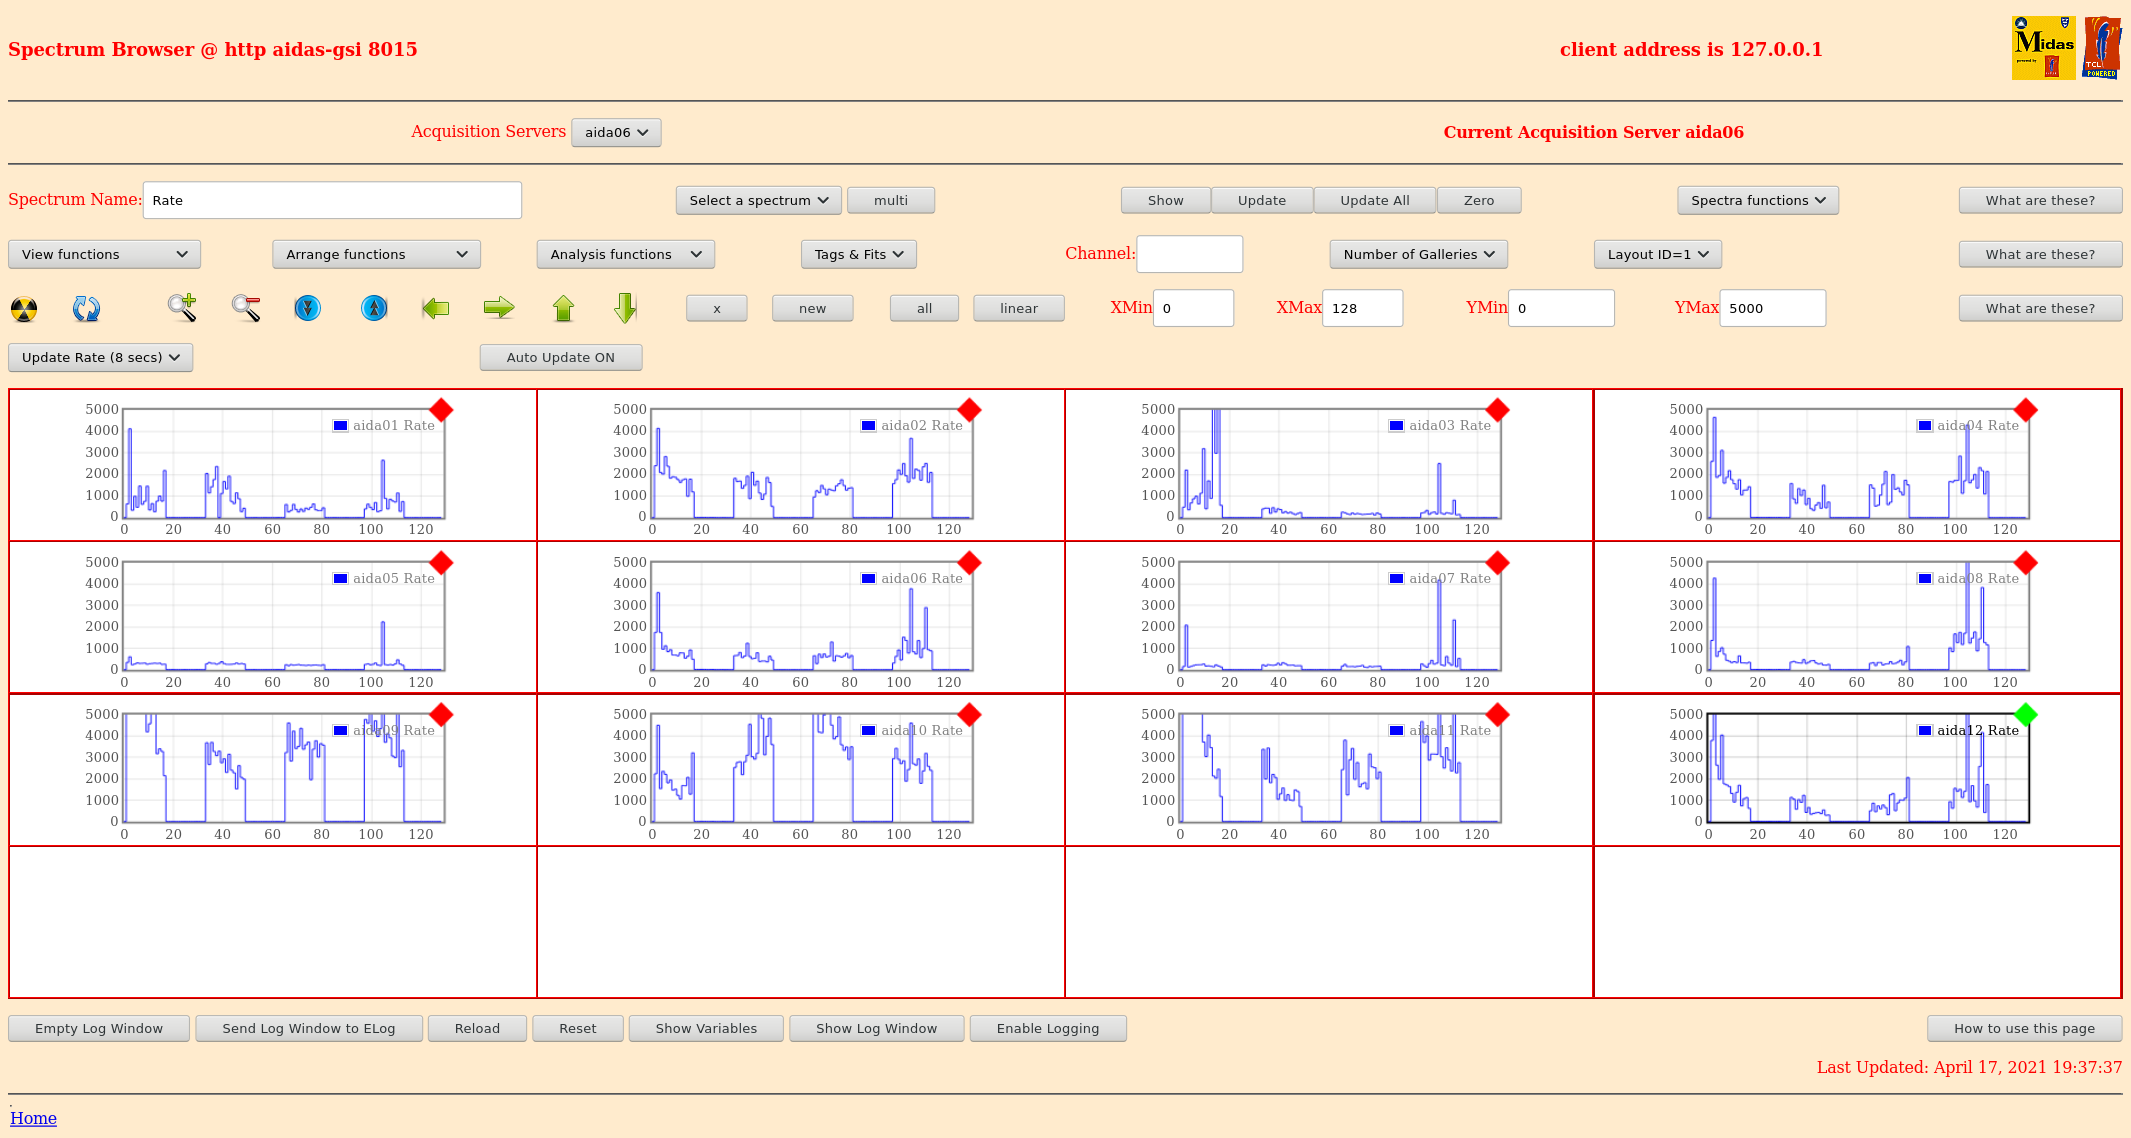
19.37 per FEE64 rate spectra - attachments 1 & 2
      1.8.L spectra - attachments 3 & 4
      1.8.H spectra - attachments 5-8
      1.8.W spectra - attachments 9 & 10

20.42 DAQ contrinues file NULL/R30_233


		 Base 		Current 	Difference
aida05 fault 	 0x1a52 : 	 0x1a55 : 	 3
aida06 fault 	 0x4f3e : 	 0x4f41 : 	 3
aida07 fault 	 0x3bcd : 	 0x3bd7 : 	 10
aida08 fault 	 0xc7c7 : 	 0xc7ca : 	 3
White Rabbit error counter test result: Passed 8, Failed 4

Understand the status reports as follows:-
Status bit 3 : White Rabbit decoder detected an error in the received data
Status bit 2 : Firmware registered WR error, no reload of Timestamp
Status bit 0 : White Rabbit decoder reports uncertain of Timestamp information from WR


			 Base 		Current 		Difference
aida09 fault 	 0x0 : 	 0x1 : 	 1
aida12 fault 	 0x0 : 	 0x4 : 	 4
FPGA Timestamp error counter test result: Passed 10, Failed 2
If any of these counts are reported as in error
The ASIC readout system has detected a timeslip.
That is the timestamp read from the time FIFO is not younger than the last

-------
23:48
Clock status test result: Passed 12, Failed 0

Understand status as follows
Status bit 3 : firmware PLL that creates clocks from external clock not locked
Status bit 2 : always logic '1'
Status bit 1 : LMK3200(2) PLL and clock distribution chip not locked to external clock
Status bit 0 : LMK3200(1) PLL and clock distribution chip not locked to external clock
If all these bits are not set then the operation of the firmware is unreliable


FEE64 module aida06 failed
FEE64 module aida07 failed
FEE64 module aida10 failed
Calibration test result: Passed 9, Failed 3

If any modules fail calibration , check the clock status and open the FADC Align and Control browser page to rerun calibration for that module


		 Base 		Current 	Difference
aida05 fault 	 0x1a52 : 	 0x1a55 : 	 3
aida06 fault 	 0x4f3e : 	 0x4f41 : 	 3
aida07 fault 	 0x3bcd : 	 0x3bde : 	 17
aida08 fault 	 0xc7c7 : 	 0xc7ca : 	 3
White Rabbit error counter test result: Passed 8, Failed 4

Understand the status reports as follows:-
Status bit 3 : White Rabbit decoder detected an error in the received data
Status bit 2 : Firmware registered WR error, no reload of Timestamp
Status bit 0 : White Rabbit decoder reports uncertain of Timestamp information from WR


			 Base 		Current 		Difference
aida09 fault 	 0x0 : 	 0x1 : 	 1
aida12 fault 	 0x0 : 	 0x7 : 	 7
FPGA Timestamp error counter test result: Passed 10, Failed 2
If any of these counts are reported as in error
The ASIC readout system has detected a timeslip.
That is the timestamp read from the time FIFO is not younger than the last

Returned 0 0 0 0 0 0 0 0 0 0 0 0
Mem(KB) :	4	8	16	32	64	128	256	512	1k	2k	4k
aida01 :     26      5      6      2      1      3      1      3      3      3      6   : 36336
aida02 :      7      9     10      3      2      2      2      4      2      3      6   : 36068
aida03 :     26      7      8      4      3      4      2      4      2      3      6   : 36448
aida04 :     18      8      2      1      2      2      3      4      2      3      6   : 36168
aida05 :     24      7      9      4      3      1      3      2      2      4      6   : 37352
aida06 :     17     10      3      1      3      5      1      3      3      3      6   : 36644
aida07 :      7     11      2      2      3      2      3      2      4      3      6   : 37268
aida08 :     23      4      1      5      1      1      2      3      3      3      6   : 36332
aida09 :     14      6      3      2      1      3      2      3      3      3      6   : 36504
aida10 :      2      2      2      2      1      2      2      2      3      3      6   : 35768
aida11 :      2      2      1      2      2      2      2      4      2      3      6   : 35816
aida12 :     26      8      5      5      4      3      1      3      3      3      6   : 36632
---- |
| Attachment 1: Screenshot_2021-04-17_Spectrum_Browser_aidas-gsi.png
|
|
| Attachment 2: Screenshot_2021-04-17_Spectrum_Browser_aidas-gsi(1).png
|
.png.png)
|
| Attachment 3: Screenshot_2021-04-17_Spectrum_Browser_aidas-gsi(2).png
|
.png.png)
|
| Attachment 4: Screenshot_2021-04-17_Spectrum_Browser_aidas-gsi(3).png
|
.png.png)
|
| Attachment 5: Screenshot_2021-04-17_Spectrum_Browser_aidas-gsi(4).png
|
.png.png)
|
| Attachment 6: Screenshot_2021-04-17_Spectrum_Browser_aidas-gsi(5).png
|
.png.png)
|
| Attachment 7: Screenshot_2021-04-17_Spectrum_Browser_aidas-gsi(6).png
|
.png.png)
|
| Attachment 8: Screenshot_2021-04-17_Spectrum_Browser_aidas-gsi(7).png
|
.png.png)
|
| Attachment 9: Screenshot_2021-04-17_Spectrum_Browser_aidas-gsi(8).png
|
.png.png)
|
| Attachment 10: Screenshot_2021-04-17_Statistics_aidas-gsi(4).png
|
.png.png)
|
| Attachment 11: Screenshot_2021-04-17_Temperature_and_status_scan_aidas-gsi(4).png
|
.png.png)
|
| Attachment 12: 50.png
|

|
| Attachment 13: 51.png
|
|
|
235
|
Sat Apr 17 15:29:27 2021 |
MS | Saturday 17 April 16:00-20:00 2021 |
16:21


FEE64 module aida06 failed
FEE64 module aida07 failed
FEE64 module aida10 failed
Calibration test result: Passed 9, Failed 3

If any modules fail calibration , check the clock status and open the FADC Align and Control browser page to rerun calibration for that module


		 Base 		Current 	Difference
aida05 fault 	 0x1a52 : 	 0x1a53 : 	 1
aida06 fault 	 0x4f3e : 	 0x4f3f : 	 1
aida07 fault 	 0x3bcd : 	 0x3bcf : 	 2
aida08 fault 	 0xc7c7 : 	 0xc7c8 : 	 1
White Rabbit error counter test result: Passed 8, Failed 4

Understand the status reports as follows:-
Status bit 3 : White Rabbit decoder detected an error in the received data
Status bit 2 : Firmware registered WR error, no reload of Timestamp
Status bit 0 : White Rabbit decoder reports uncertain of Timestamp information from WR


			 Base 		Current 		Difference
aida09 fault 	 0x0 : 	 0x1 : 	 1
aida12 fault 	 0x0 : 	 0x2 : 	 2
FPGA Timestamp error counter test result: Passed 10, Failed 2
If any of these counts are reported as in error
The ASIC readout system has detected a timeslip.
That is the timestamp read from the time FIFO is not younger than the last


 Collecting the file size of each FEE64 Options CONTENTS file to check they are all the same

 FEE : aida01 =>   Options file size is 1025 	 Last changed Sat Apr 17 06:14:30 CEST 2021
 FEE : aida02 =>   Options file size is 1014 	 Last changed Fri Apr 16 00:56:20 CEST 2021
 FEE : aida03 =>   Options file size is 1014 	 Last changed Wed Apr 14 21:52:04 CEST 2021
 FEE : aida04 =>   Options file size is 1025 	 Last changed Sat Apr 17 06:07:36 CEST 2021
 FEE : aida05 =>   Options file size is 1025 	 Last changed Fri Apr 16 00:53:25 CEST 2021
 FEE : aida06 =>   Options file size is 1014 	 Last changed Wed Apr 14 21:52:04 CEST 2021
 FEE : aida07 =>   Options file size is 1014 	 Last changed Wed Apr 14 21:52:04 CEST 2021
 FEE : aida08 =>   Options file size is 1014 	 Last changed Wed Apr 14 21:52:04 CEST 2021
 FEE : aida09 =>   Options file size is 1014 	 Last changed Wed Apr 14 21:52:05 CEST 2021
 FEE : aida10 =>   Options file size is 1014 	 Last changed Wed Apr 14 21:52:06 CEST 2021
 FEE : aida11 =>   Options file size is 1014 	 Last changed Wed Apr 14 21:52:05 CEST 2021
 FEE : aida12 =>   Options file size is 1025 	 Last changed Wed Apr 14 21:58:54 CEST 2021


18:29

Clock status test result: Passed 12, Failed 0

Understand status as follows
Status bit 3 : firmware PLL that creates clocks from external clock not locked
Status bit 2 : always logic '1'
Status bit 1 : LMK3200(2) PLL and clock distribution chip not locked to external clock
Status bit 0 : LMK3200(1) PLL and clock distribution chip not locked to external clock
If all these bits are not set then the operation of the firmware is unreliable


FEE64 module aida06 failed
FEE64 module aida07 failed
FEE64 module aida10 failed
Calibration test result: Passed 9, Failed 3

If any modules fail calibration , check the clock status and open the FADC Align and Control browser page to rerun calibration for that module


		 Base 		Current 	Difference
aida05 fault 	 0x1a52 : 	 0x1a53 : 	 1
aida06 fault 	 0x4f3e : 	 0x4f3f : 	 1
aida07 fault 	 0x3bcd : 	 0x3bd1 : 	 4
aida08 fault 	 0xc7c7 : 	 0xc7c8 : 	 1
White Rabbit error counter test result: Passed 8, Failed 4

Understand the status reports as follows:-
Status bit 3 : White Rabbit decoder detected an error in the received data
Status bit 2 : Firmware registered WR error, no reload of Timestamp
Status bit 0 : White Rabbit decoder reports uncertain of Timestamp information from WR


			 Base 		Current 		Difference
aida09 fault 	 0x0 : 	 0x1 : 	 1
aida12 fault 	 0x0 : 	 0x2 : 	 2
FPGA Timestamp error counter test result: Passed 10, Failed 2
If any of these counts are reported as in error
The ASIC readout system has detected a timeslip.
That is the timestamp read from the time FIFO is not younger than the last


Returned 0 0 0 0 0 0 0 0 0 0 0 0
Mem(KB) :	4	8	16	32	64	128	256	512	1k	2k	4k
aida01 :     21      3      4      4      1      3      1      3      3      3      6   : 36332
aida02 :      4      3     13      2      2      3      2      4      2      3      6   : 36152
aida03 :     12      7      5      2      2      3      2      4      2      3      6   : 36088
aida04 :     17      6      9      5      1      1      2      3      3      3      6   : 36452
aida05 :     26      8      0      3      1      1      2      3      3      3      6   : 36296
aida06 :     22      6      9      4      3      4      2      3      3      3      6   : 36952
aida07 :     17      7      3      1      2      3      3      2      3      3      6   : 36300
aida08 :     24      5      4      4      1      1      2      3      3      3      6   : 36360
aida09 :     15     11      3      2      1      3      1      3      3      3      6   : 36292
aida10 :      2      3      5      2      1      2      2      2      3      3      6   : 35824
aida11 :      2      2      0      0      3      2      2      4      2      3      6   : 35800
aida12 :     18     15      7      5      4      3      1      3      3      3      6   : 36688
|
| Attachment 1: 40.png
|
|
| Attachment 2: Screenshot_2021-04-17_Statistics_aidas-gsi(2).png
|
.png.png)
|
| Attachment 3: Screenshot_2021-04-17_Temperature_and_status_scan_aidas-gsi(2).png
|
.png.png)
|
| Attachment 4: Screenshot_2021-04-17_Statistics_aidas-gsi(3).png
|
.png.png)
|
| Attachment 5: Screenshot_2021-04-17_Temperature_and_status_scan_aidas-gsi(3).png
|
.png.png)
|
| Attachment 6: 41.png
|

|
|
234
|
Sat Apr 17 11:27:38 2021 |
JS, TD | Saturday 17th April 12:00-16:00 |
		 Base 		Current 	Difference
aida05 fault 	 0x1a52 : 	 0x1a53 : 	 1
aida06 fault 	 0x4f3e : 	 0x4f3f : 	 1
aida07 fault 	 0x3bcd : 	 0x3bce : 	 1
aida08 fault 	 0xc7c7 : 	 0xc7c8 : 	 1
White Rabbit error counter test result: Passed 8, Failed 4

Understand the status reports as follows:-
Status bit 3 : White Rabbit decoder detected an error in the received data
Status bit 2 : Firmware registered WR error, no reload of Timestamp
Status bit 0 : White Rabbit decoder reports uncertain of Timestamp information from WR

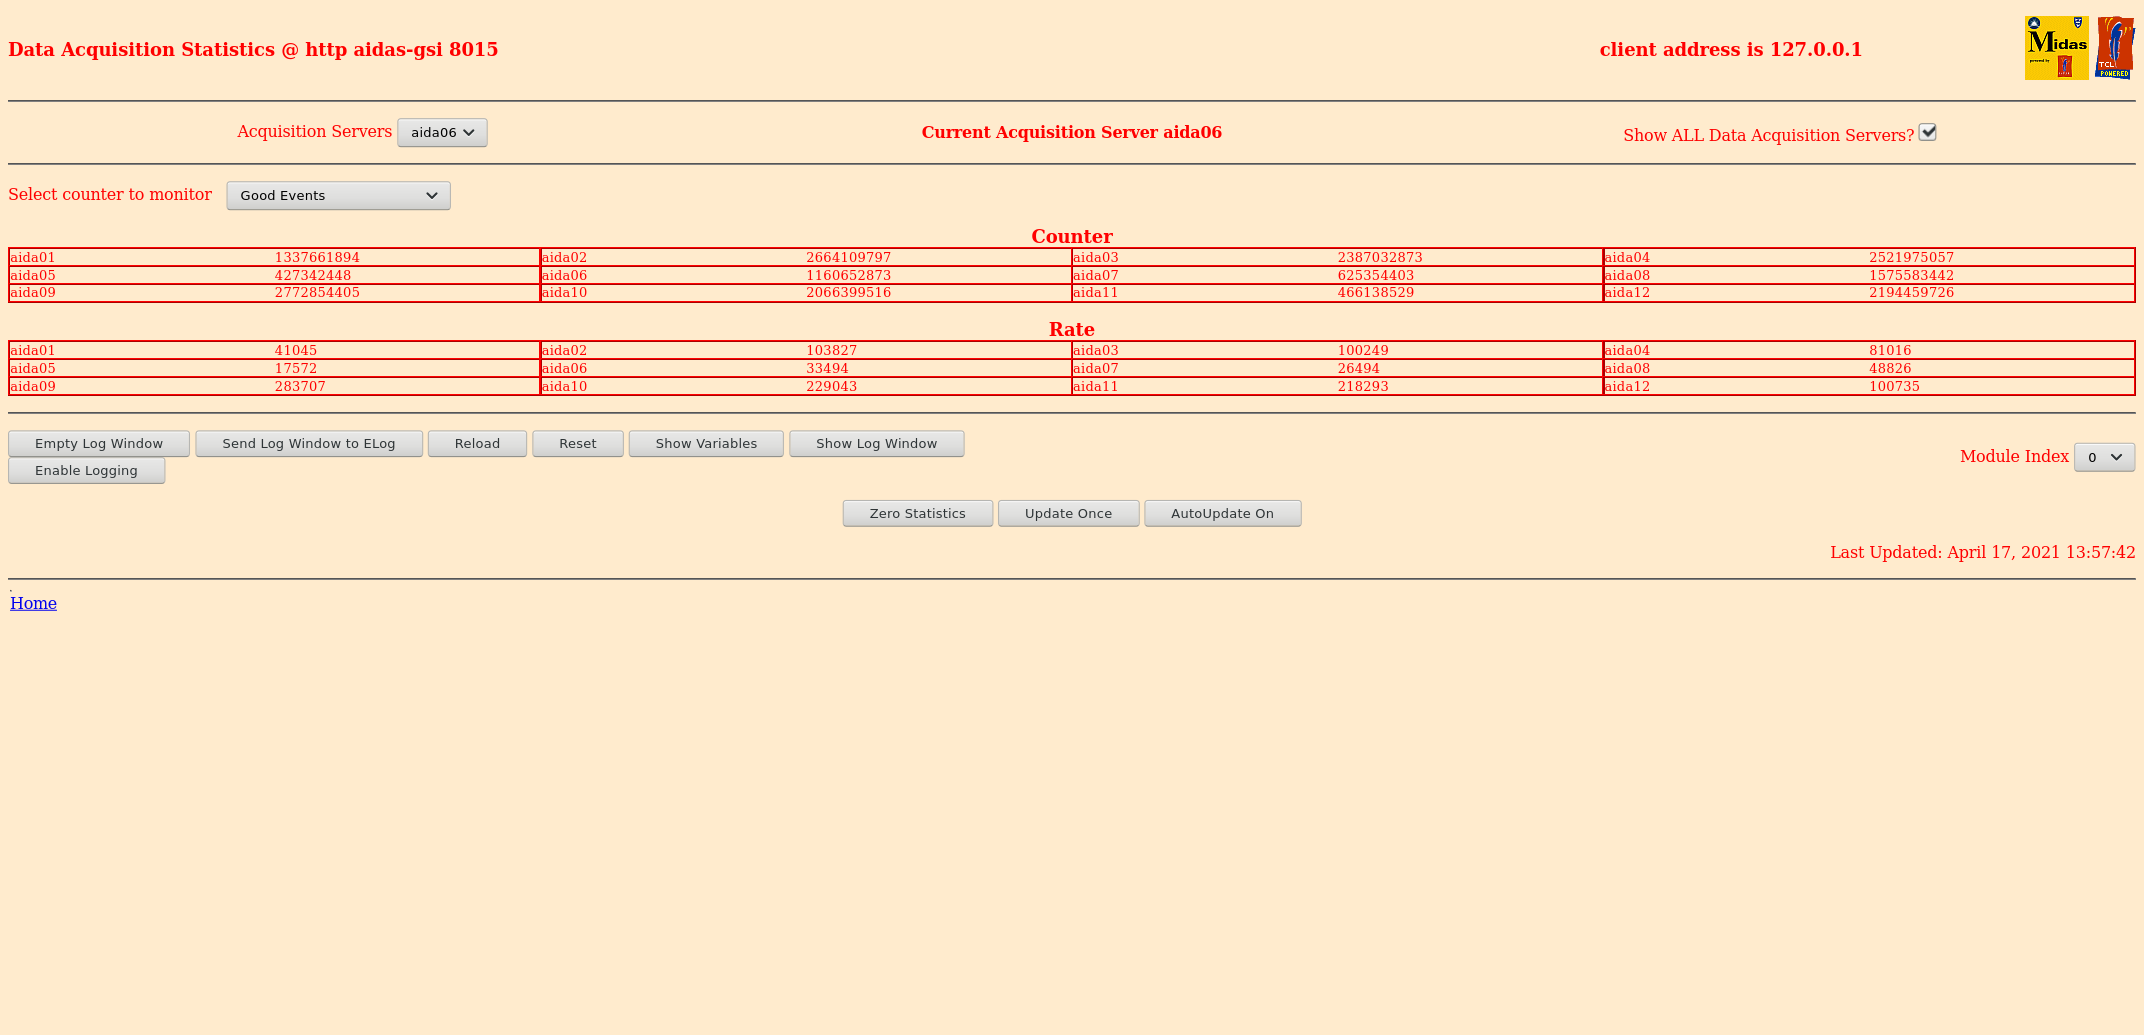
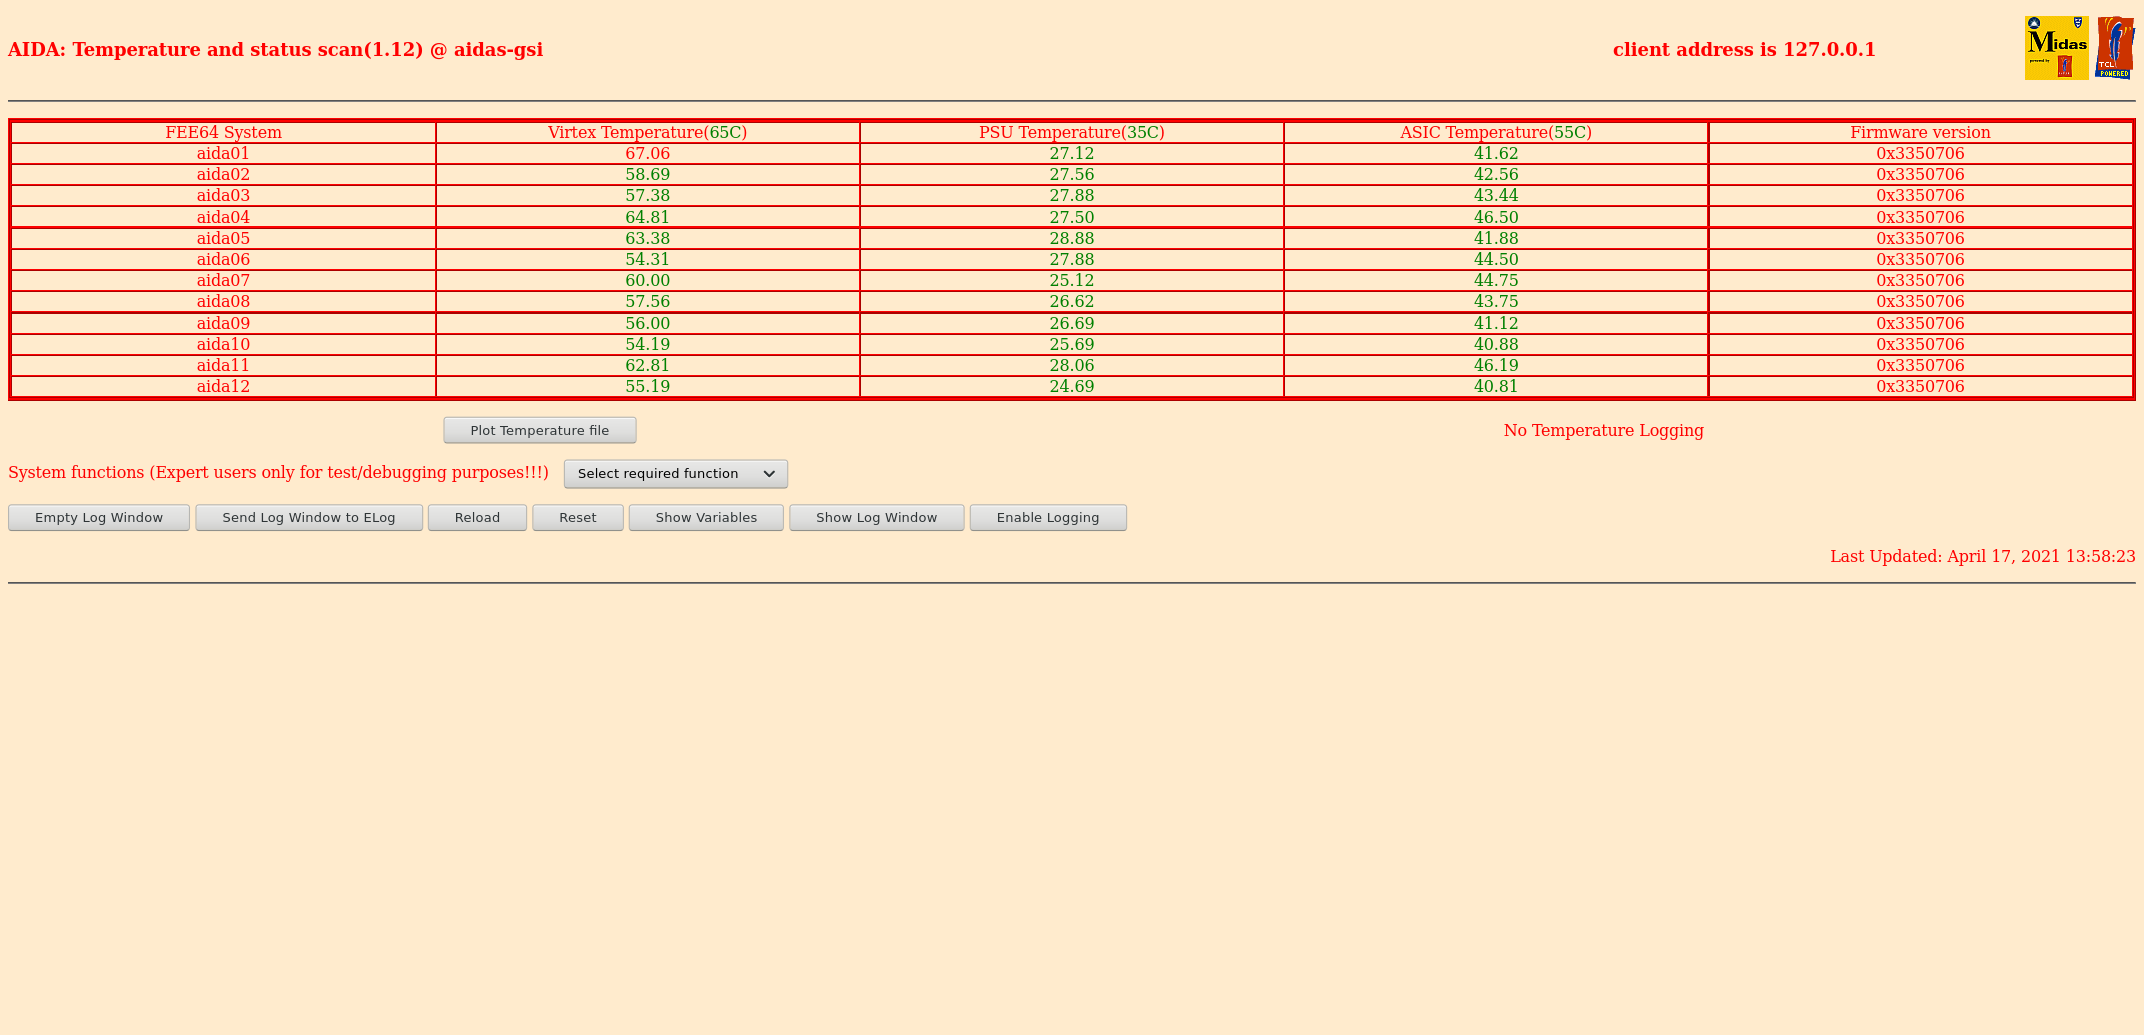
13:55 CEST

Statistics : ok elog:234/4
Temp : ok  elog:234/5
Bias : ok  elog:234/6
ucesb : ok
DB: No faults found

ADC Calibration check:
FEE64 module aida06 failed
FEE64 module aida07 failed
FEE64 module aida10 failed
Calibration test result: Passed 9, Failed 3

If any modules fail calibration , check the clock status and open the FADC Align and
Control browser page to rerun calibration for that module

White Rabbit Check:
		 Base 		Current 	Difference
aida05 fault 	 0x1a52 : 	 0x1a53 : 	 1
aida06 fault 	 0x4f3e : 	 0x4f3f : 	 1
aida07 fault 	 0x3bcd : 	 0x3bcf : 	 2
aida08 fault 	 0xc7c7 : 	 0xc7c8 : 	 1
White Rabbit error counter test result: Passed 8, Failed 4

FPGA check:
			 Base 		Current 		Difference
aida09 fault 	 0x0 : 	 0x1 : 	 1
aida12 fault 	 0x0 : 	 0x2 : 	 2
FPGA Timestamp error counter test result: Passed 10, Failed 2
If any of these counts are reported as in error
The ASIC readout system has detected a timeslip.
That is the timestamp read from the time FIFO is not younger than the last

14:05 no beam
14:10 beam back
14:15 no beam, beam current being optimised, going to thicker degrader when beam returns


14:37 CEST

Statistics : ok
Temp : ok
Bias : ok   (ch3 now over 6uA)
ucesb : ok
DB: No faults found

15:03 CEST

Statistics : ok
Temp : ok
Bias : ok
ucesb : ok
DB: No faults found

15:31 CEST

Statistics : ok
Temp : ok
Bias : ok
ucesb : ok
DB: No faults found

15:50

Statistics : ok elog:234/7
Temp : ok  elog:234/8
Bias : ok  elog:234/9
ucesb : ok elog:234/10
DB: No faults found

ADC Calibration check:
FEE64 module aida06 failed
FEE64 module aida07 failed
FEE64 module aida10 failed
Calibration test result: Passed 9, Failed 3

If any modules fail calibration , check the clock status and open the FADC Align and Control browser page to rerun calibration for that module

White Rabbit Check:
		 Base 		Current 	Difference
aida05 fault 	 0x1a52 : 	 0x1a53 : 	 1
aida06 fault 	 0x4f3e : 	 0x4f3f : 	 1
aida07 fault 	 0x3bcd : 	 0x3bcf : 	 2
aida08 fault 	 0xc7c7 : 	 0xc7c8 : 	 1
White Rabbit error counter test result: Passed 8, Failed 4

Understand the status reports as follows:-
Status bit 3 : White Rabbit decoder detected an error in the received data
Status bit 2 : Firmware registered WR error, no reload of Timestamp
Status bit 0 : White Rabbit decoder reports uncertain of Timestamp information from WR

FPGA check:
			 Base 		Current 		Difference
aida09 fault 	 0x0 : 	 0x1 : 	 1
aida12 fault 	 0x0 : 	 0x2 : 	 2
FPGA Timestamp error counter test result: Passed 10, Failed 2
If any of these counts are reported as in error
The ASIC readout system has detected a timeslip.
That is the timestamp read from the time FIFO is not younger than the last |
| Attachment 1: 30.png
|

|
| Attachment 2: Screenshot_2021-04-17_Statistics_aidas-gsi(3).png
|
.png.png)
|
| Attachment 3: Screenshot_2021-04-17_Temperature_and_status_scan_aidas-gsi(3).png
|
.png.png)
|
| Attachment 4: Screenshot_2021-04-17_Statistics_aidas-gsi.png
|
|
| Attachment 5: Screenshot_2021-04-17_Temperature_and_status_scan_aidas-gsi.png
|
|
| Attachment 6: 31.png
|

|
| Attachment 7: Screenshot_2021-04-17_Statistics_aidas-gsi(1).png
|
.png.png)
|
| Attachment 8: Screenshot_2021-04-17_Temperature_and_status_scan_aidas-gsi(1).png
|
.png.png)
|
| Attachment 9: 32.png
|

|
| Attachment 10: 33.png
|

|
|
233
|
Sat Apr 17 07:28:02 2021 |
LPG, TD | Saturday 08:00 - 12:00 |
08:30 CEST
HV and leakage currents: elog:233/1
Detector rates: elog:233/2
Temperatures: elog:233/3
WR status:
FEE64 module aida06 failed
FEE64 module aida07 failed
FEE64 module aida10 failed
Calibration test result: Passed 9, Failed 3
If any modules fail calibration , check the clock status and open the FADC Align and Control browser page to rerun calibration for that module
FPGA�status:
�� ��� ��� � Base �� ��� �Current �� ��� �Difference
aida12 fault �� � 0x0 : �� � 0x1 : �� � 1 �
FPGA Timestamp error counter test result: Passed 11, Failed 1
If any of these counts are reported as in error
The ASIC readout system has detected a timeslip.
That is the timestamp read from the time FIFO is not younger than the last
09:20 CEST
Stats: ok!
DB: No faults found
ucesb: ok!
09:40 CEST
Beam will be stopped in order to increase intensity. Expected to be around 3-4 hours.
For now, we still get implants when Beam spill is on. Seems to be fluctuating as they play around.
10:00 CEST
Still getting beam, it is fluctuating in intensity
Stats: ok!
DB: No faults found
ucesb: ok!
HV and leakage currents: elog:233/4
Detector rates: elog:233/5
Temperatures: elog:233/6
Clock check: ok!
ADC calibration:
FEE64 module aida06 failed
FEE64 module aida07 failed
FEE64 module aida10 failed
Calibration test result: Passed 9, Failed 3
WR check: ok!
FPGA check:
Base Current Difference
aida12 fault 0x0 : 0x1 : 1
FPGA Timestamp error counter test result: Passed 11, Failed 1
Memory check: ok!
10:40 CEST
Stats: ok!
DB: No faults found
ucesb: ok!
11:00 CEST
Stats: ok!
DB: No faults found
ucesb: ok!
11:30 CEST
Stats: ok!
DB: No faults found
ucesb: ok!
12:00 BST
Stats: ok!
DB: No faults found
ucesb: ok!
HV and leakage currents: elog:233/7
Detector rates: elog:233/8
Temperatures: elog:233/9
Clock check: ok!
ADC calibration:
FEE64 module aida06 failed
FEE64 module aida07 failed
FEE64 module aida10 failed
Calibration test result: Passed 9, Failed 3
WR check:
Base Current Difference
aida05 fault 0x1a52 : 0x1a53 : 1
aida06 fault 0x4f3e : 0x4f3f : 1
aida07 fault 0x3bcd : 0x3bce : 1
aida08 fault 0xc7c7 : 0xc7c8 : 1
White Rabbit error counter test result: Passed 8, Failed 4
FPGA check:
Base Current Difference
aida09 fault 0x0 : 0x1 : 1
aida12 fault 0x0 : 0x2 : 2
Memory check: ok! |
| Attachment 1: 20.png
|

|
| Attachment 2: Screenshot_2021-04-17_Statistics_aidas-gsi.png
|

|
| Attachment 3: Screenshot_2021-04-17_Temperature_and_status_scan_aidas-gsi.png
|

|
| Attachment 4: 21.png
|

|
| Attachment 5: Screenshot_2021-04-17_Statistics_aidas-gsi(1).png
|
.png.png)
|
| Attachment 6: Screenshot_2021-04-17_Temperature_and_status_scan_aidas-gsi(1).png
|
.png.png)
|
| Attachment 7: 22.png
|

|
| Attachment 8: Screenshot_2021-04-17_Statistics_aidas-gsi(2).png
|
.png.png)
|
| Attachment 9: Screenshot_2021-04-17_Temperature_and_status_scan_aidas-gsi(2).png
|
.png.png)
|
|
232
|
Fri Apr 16 23:13:57 2021 |
CA, MA, BA | Saturday 16th 00:00 - 08:00 |
00:05 DESPEC tuning beam, changing spill length

00:21 DAQ continues ok
      Merger/TapeServer ok

00:25 still no beam in AIDA

00:30 statistics ok, all FEE64 showing rates

      no error messages in database check

      AIDA scalars on ucesb ok - attachment 1

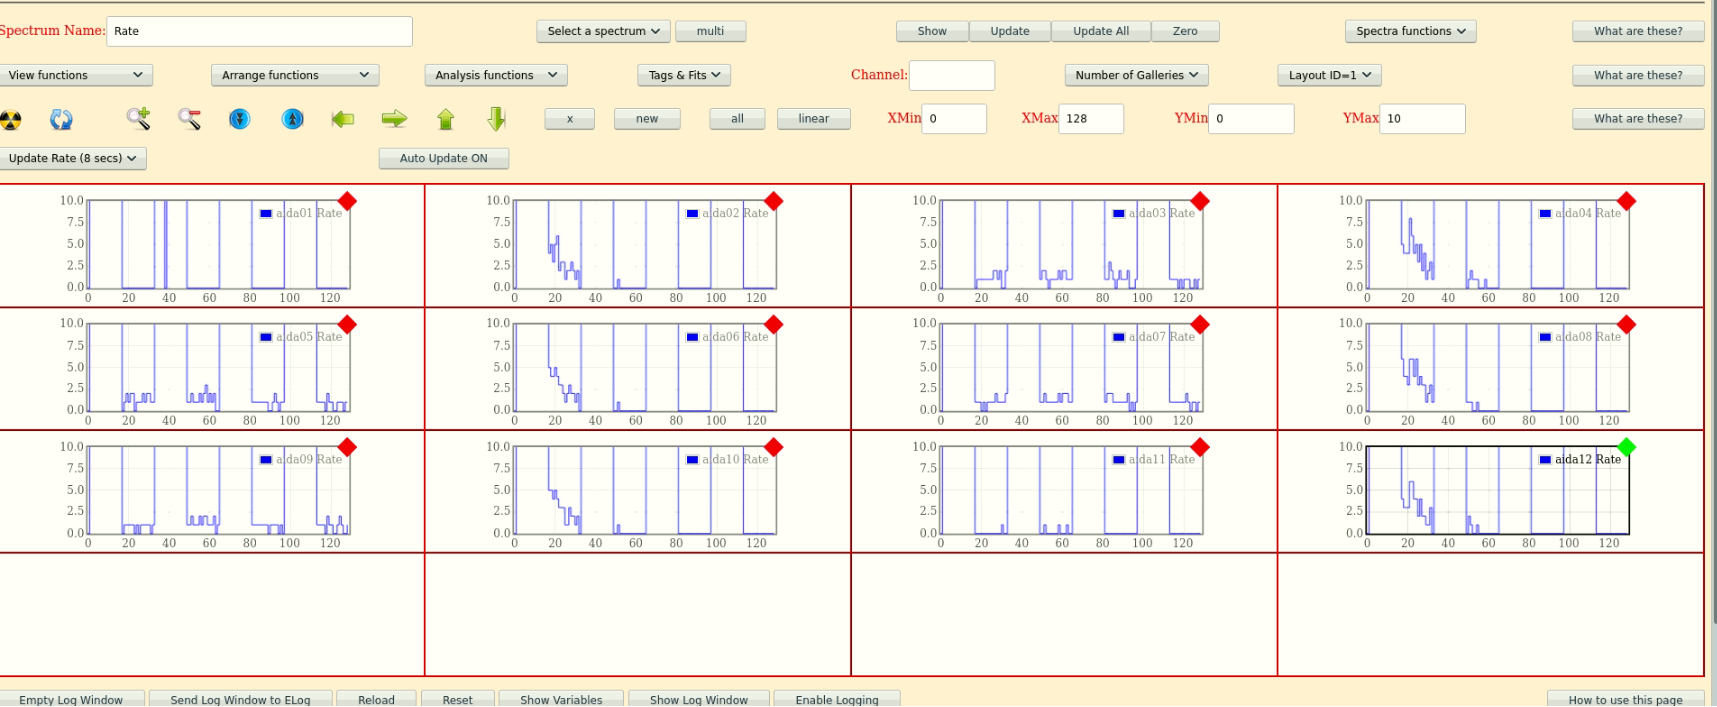
00:52 beam in AIDA - rates spectra - attachment 2

01:05 statistics ok, all FEE64 showing rates

      no error messages in database check

      AIDA scalars on ucesb ok - attachment 3

      beam is off again

01:30 beam back

01:32 statistics ok, all FEE64 showing rates

      no error messages in database check

      AIDA scalars on ucesb ok - attachment 4

01:37 beam off - FRS increasing spill length to 5s

01:48 beam back with new spill setting - 5s on spill, 2s off spill

02:07 system wide checks ok except;

WR decoder status

      		 Base 		Current 	Difference
aida05 fault 	 0xc879 : 	 0xc87b : 	 2
aida06 fault 	 0x323c : 	 0x323e : 	 2
aida07 fault 	 0xfb3a : 	 0xfb42 : 	 8
aida08 fault 	 0xd3d6 : 	 0xd3d8 : 	 2
White Rabbit error counter test result: Passed 8, Failed 4

Understand the status reports as follows:-
Status bit 3 : White Rabbit decoder detected an error in the received data
Status bit 2 : Firmware registered WR error, no reload of Timestamp
Status bit 0 : White Rabbit decoder reports uncertain of Timestamp information from WR

FPGA check :

			 Base 		Current 		Difference
aida07 fault 	 0xf : 	 0x10 : 	 1
FPGA Timestamp error counter test result: Passed 11, Failed 1
If any of these counts are reported as in error
The ASIC readout system has detected a timeslip.
That is the timestamp read from the time FIFO is not younger than the last

02:10 FEE64 Temps ok - attachment 5

02:20 good event statistics ok - attachment 6

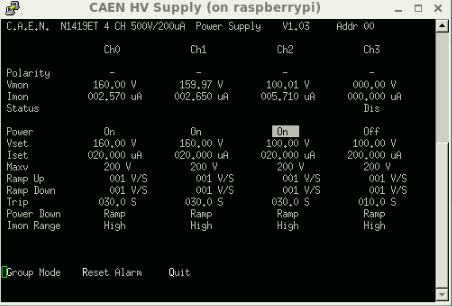
02:27 detector bias / leakage currents ok - attachment 7

02:30 statistics ok, all FEE64 showing rates

      no error messages in database check

      AIDA scalars on ucesb ok

      beam off

03:00 stats/ucesb/database checks ok

03:30 stats/ucesb/database checks ok

      still no beam in AIDA

05:11 system is checked, beam is back with low intensity

05:13 FEE64 Temps ok - attachment 8

05:13 good event statistics ok - attachment 9

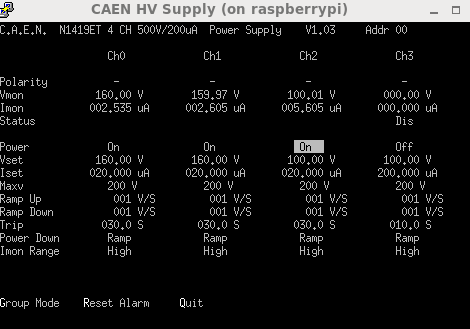
05:13 detector bias / leakage currents ok - attachment 10

05:33 stats/ucesb/database checks ok

06:00 AIDA crashes, lose connection to aida09

06:20 aida08 does not respond on powercycle and reset

06:30 Called TD

06:50 successfully reset AIDA. Writing to file R30

      synchronise ASIC clocks:

FEE64 module aida01  => 	7
FEE64 module aida02  => 	7
FEE64 module aida03  => 	7
FEE64 module aida04  => 	7
FEE64 module aida05  => 	7
FEE64 module aida06  => 	7
FEE64 module aida07  => 	7
FEE64 module aida08  => 	7
FEE64 module aida09  => 	7
FEE64 module aida10  => 	7
FEE64 module aida11  => 	7
FEE64 module aida12  => 	7


ASIC Clock Timestamp check test result: Passed 12, Failed 0

Database options file size check:


If any of the above values are different from the rest then check the clocks and the White Rabbit decoder status

 Collecting the file size of each FEE64 Options CONTENTS file to check they are all the same

 FEE : aida01 =>   Options file size is 1025 	 Last changed Sat Apr 17 06:14:30 CEST 2021
 FEE : aida02 =>   Options file size is 1014 	 Last changed Fri Apr 16 00:56:20 CEST 2021
 FEE : aida03 =>   Options file size is 1014 	 Last changed Wed Apr 14 21:52:04 CEST 2021
 FEE : aida04 =>   Options file size is 1025 	 Last changed Sat Apr 17 06:07:36 CEST 2021
 FEE : aida05 =>   Options file size is 1025 	 Last changed Fri Apr 16 00:53:25 CEST 2021
 FEE : aida06 =>   Options file size is 1014 	 Last changed Wed Apr 14 21:52:04 CEST 2021
 FEE : aida07 =>   Options file size is 1014 	 Last changed Wed Apr 14 21:52:04 CEST 2021
 FEE : aida08 =>   Options file size is 1014 	 Last changed Wed Apr 14 21:52:04 CEST 2021
 FEE : aida09 =>   Options file size is 1014 	 Last changed Wed Apr 14 21:52:05 CEST 2021
 FEE : aida10 =>   Options file size is 1014 	 Last changed Wed Apr 14 21:52:06 CEST 2021
 FEE : aida11 =>   Options file size is 1014 	 Last changed Wed Apr 14 21:52:05 CEST 2021
 FEE : aida12 =>   Options file size is 1025 	 Last changed Wed Apr 14 21:58:54 CEST 2021

System wide checks ok *except*

FEE64 module aida06 failed
FEE64 module aida07 failed
FEE64 module aida10 failed
Calibration test result: Passed 9, Failed 3

If any modules fail calibration , check the clock status and open the FADC Align and Control browser page to rerun calibration for that module

re-calibration of these FEE modules unsuccessful in FADC align and control.

07:05 FEE64 Temps ok - attachment 12

      good event statistics ok - attachment 13

      detector bias / leakage currents ok - attachment 14

07:10 stats/ucesb/database checks ok

07:30 stats/ucesb/database checks ok
|
| Attachment 1: Screenshot_from_2021-04-16_23-35-20.png
|

|
| Attachment 2: Screenshot_from_2021-04-16_23-52-09.png
|
|
| Attachment 3: Screenshot_from_2021-04-17_00-05-06.png
|

|
| Attachment 4: Screenshot_from_2021-04-17_00-31-46.png
|

|
| Attachment 5: Screenshot_from_2021-04-17_01-11-18.png
|

|
| Attachment 6: Screenshot_from_2021-04-17_01-12-26.png
|

|
| Attachment 7: Screenshot_from_2021-04-17_01-13-22.png
|
|
| Attachment 8: 20210417_0506.png
|

|
| Attachment 9: 20210417_0602_tem.png
|

|
| Attachment 10: 20210417_0601.png
|

|
| Attachment 11: 20210417_0603_Bias.png
|
|
| Attachment 12: Screenshot_from_2021-04-17_06-03-52.png
|

|
| Attachment 13: Screenshot_from_2021-04-17_06-04-14.png
|

|
| Attachment 14: Screenshot_from_2021-04-17_06-04-37.png
|
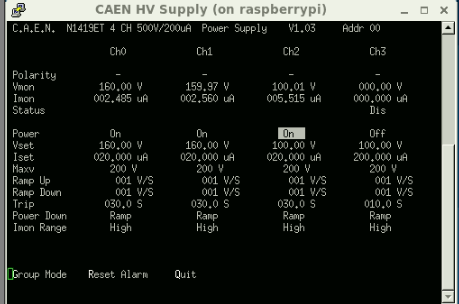
|
|
231
|
Fri Apr 16 15:52:08 2021 |
DSJ | 16 April 16.00 shift |
Clock status test result: Passed 12, Failed 0

Understand status as follows
Status bit 3 : firmware PLL that creates clocks from external clock not locked
Status bit 2 : always logic '1'
Status bit 1 : LMK3200(2) PLL and clock distribution chip not locked to external clock
Status bit 0 : LMK3200(1) PLL and clock distribution chip not locked to external clock
If all these bits are not set then the operation of the firmware is unreliable


Calibration test result: Passed 12, Failed 0

If any modules fail calibration , check the clock status and open the FADC Align and Control browser page to rerun calibration for that module


		 Base 		Current 	Difference
aida05 fault 	 0xc879 : 	 0xc87b : 	 2
aida06 fault 	 0x323c : 	 0x323e : 	 2
aida07 fault 	 0xfb3a : 	 0xfb3f : 	 5
aida08 fault 	 0xd3d6 : 	 0xd3d8 : 	 2
White Rabbit error counter test result: Passed 8, Failed 4

Understand the status reports as follows:-
Status bit 3 : White Rabbit decoder detected an error in the received data
Status bit 2 : Firmware registered WR error, no reload of Timestamp
Status bit 0 : White Rabbit decoder reports uncertain of Timestamp information from WR


FPGA Timestamp error counter test result: Passed 12, Failed 0
If any of these counts are reported as in error
The ASIC readout system has detected a timeslip.
That is the timestamp read from the time FIFO is not younger than the last


Returned 0 0 0 0 0 0 0 0 0 0 0 0
Mem(KB) :	4	8	16	32	64	128	256	512	1k	2k	4k
aida01 :     23     10      3      1      1      2      1      3      3      3      6   : 36156
aida02 :     25     10      4      3      1      2      2      3      3      3      6   : 36500
aida03 :     27      8      5      2      3      4      3      3      2      3      6   : 36092
aida04 :     30      4      4      5      0      2      4      2      3      3      6   : 36472
aida05 :     19      5      7      1      3      2      2      2      2      4      6   : 37060
aida06 :     18     13      1      2      1      3      2      3      3      3      6   : 36544
aida07 :     24      7      3      2      2      3      1      3      2      4      6   : 37384
aida08 :     15     11      2      5      2      4      1      4      3      3      6   : 37076
aida09 :      7      3      4      1      5      6      5      4      3      2      6   : 36308
aida10 :      8      3     13      4      3      3      1      4      2      3      6   : 36040
aida11 :     18     11     17      7      4      4      4      3      2      3      6   : 36752
aida12 :     12      7      7      7      4      4      2      3      2      3      6   : 36024


 Collecting the file size of each FEE64 Options CONTENTS file to check they are all the same

 FEE : aida01 =>   Options file size is 1025 	 Last changed Fri Apr 16 01:00:12 CEST 2021
 FEE : aida02 =>   Options file size is 1014 	 Last changed Fri Apr 16 00:56:20 CEST 2021
 FEE : aida03 =>   Options file size is 1014 	 Last changed Wed Apr 14 21:52:04 CEST 2021
 FEE : aida04 =>   Options file size is 1014 	 Last changed Wed Apr 14 21:52:04 CEST 2021
 FEE : aida05 =>   Options file size is 1025 	 Last changed Fri Apr 16 00:53:25 CEST 2021
 FEE : aida06 =>   Options file size is 1014 	 Last changed Wed Apr 14 21:52:04 CEST 2021
 FEE : aida07 =>   Options file size is 1014 	 Last changed Wed Apr 14 21:52:04 CEST 2021
 FEE : aida08 =>   Options file size is 1014 	 Last changed Wed Apr 14 21:52:04 CEST 2021
 FEE : aida09 =>   Options file size is 1014 	 Last changed Wed Apr 14 21:52:05 CEST 2021
 FEE : aida10 =>   Options file size is 1014 	 Last changed Wed Apr 14 21:52:06 CEST 2021
 FEE : aida11 =>   Options file size is 1014 	 Last changed Wed Apr 14 21:52:05 CEST 2021
 FEE : aida12 =>   Options file size is 1025 	 Last changed Wed Apr 14 21:58:54 CEST 2021


17:27.  Checked system stats, temps, leakage etc. looks ok


18:49. Tape server writing to disk /NULL/R21_9+
       /TapeData points to /media/SecondDrive/ - 3.6Tb free

19.15. checks

Clock status test result: Passed 12, Failed 0

Understand status as follows
Status bit 3 : firmware PLL that creates clocks from external clock not locked
Status bit 2 : always logic '1'
Status bit 1 : LMK3200(2) PLL and clock distribution chip not locked to external clock
Status bit 0 : LMK3200(1) PLL and clock distribution chip not locked to external clock
If all these bits are not set then the operation of the firmware is unreliable


Calibration test result: Passed 12, Failed 0

If any modules fail calibration , check the clock status and open the FADC Align and Control browser page to rerun calibration for that module


		 Base 		Current 	Difference
aida05 fault 	 0xc879 : 	 0xc87b : 	 2
aida06 fault 	 0x323c : 	 0x323e : 	 2
aida07 fault 	 0xfb3a : 	 0xfb3f : 	 5
aida08 fault 	 0xd3d6 : 	 0xd3d8 : 	 2
White Rabbit error counter test result: Passed 8, Failed 4

Understand the status reports as follows:-
Status bit 3 : White Rabbit decoder detected an error in the received data
Status bit 2 : Firmware registered WR error, no reload of Timestamp
Status bit 0 : White Rabbit decoder reports uncertain of Timestamp information from WR


			 Base 		Current 		Difference
aida07 fault 	 0xf : 	 0x10 : 	 1
FPGA Timestamp error counter test result: Passed 11, Failed 1
If any of these counts are reported as in error
The ASIC readout system has detected a timeslip.
That is the timestamp read from the time FIFO is not younger than the last


Returned 0 0 0 0 0 0 0 0 0 0 0 0
Mem(KB) :	4	8	16	32	64	128	256	512	1k	2k	4k
aida01 :     16      9     16      2      2      2      1      3      3      3      6   : 36424
aida02 :      1      3      5      4      1      3      3      2      3      3      6   : 36268
aida03 :     24     13     11      6      3      3      2      4      2      3      6   : 36472
aida04 :      5      4      4      4      3      3      3      2      3      3      6   : 36404
aida05 :     17      8      4      2      2      2      2      2      2      4      6   : 36996
aida06 :     26     11      3      2      0      3      2      3      3      3      6   : 36528
aida07 :     24      7      2      1      1      1      2      3      2      4      6   : 37272
aida08 :     13     12      6      3      3      4      1      4      3      3      6   : 37140
aida09 :     22     15     19      2      6      5      4      4      3      2      6   : 36416
aida10 :     16     11      6      4      3      3      1      4      2      3      6   : 36024
aida11 :     12      4      5      4      2      3      3      3      2      3      6   : 35872
aida12 :     18     12      9      4      4      4      2      3      2      3      6   : 36024


 Collecting the file size of each FEE64 Options CONTENTS file to check they are all the same

 FEE : aida01 =>   Options file size is 1025 	 Last changed Fri Apr 16 01:00:12 CEST 2021
 FEE : aida02 =>   Options file size is 1014 	 Last changed Fri Apr 16 00:56:20 CEST 2021
 FEE : aida03 =>   Options file size is 1014 	 Last changed Wed Apr 14 21:52:04 CEST 2021
 FEE : aida04 =>   Options file size is 1014 	 Last changed Wed Apr 14 21:52:04 CEST 2021
 FEE : aida05 =>   Options file size is 1025 	 Last changed Fri Apr 16 00:53:25 CEST 2021
 FEE : aida06 =>   Options file size is 1014 	 Last changed Wed Apr 14 21:52:04 CEST 2021
 FEE : aida07 =>   Options file size is 1014 	 Last changed Wed Apr 14 21:52:04 CEST 2021
 FEE : aida08 =>   Options file size is 1014 	 Last changed Wed Apr 14 21:52:04 CEST 2021
 FEE : aida09 =>   Options file size is 1014 	 Last changed Wed Apr 14 21:52:05 CEST 2021
 FEE : aida10 =>   Options file size is 1014 	 Last changed Wed Apr 14 21:52:06 CEST 2021
 FEE : aida11 =>   Options file size is 1014 	 Last changed Wed Apr 14 21:52:05 CEST 2021
 FEE : aida12 =>   Options file size is 1025 	 Last changed Wed Apr 14 21:58:54 CEST 2021


19.53.  Checked system stats, temps, leakage etc. looks ok

20:30.  Checked system stats, temps, leakage etc. looks ok

20:59.  Checked system stats, temps, leakage etc. looks ok


21:31 System checks

Clock status test result: Passed 12, Failed 0

Understand status as follows
Status bit 3 : firmware PLL that creates clocks from external clock not locked
Status bit 2 : always logic '1'
Status bit 1 : LMK3200(2) PLL and clock distribution chip not locked to external clock
Status bit 0 : LMK3200(1) PLL and clock distribution chip not locked to external clock
If all these bits are not set then the operation of the firmware is unreliable

Calibration test result: Passed 12, Failed 0

If any modules fail calibration , check the clock status and open the FADC Align and Control browser page to rerun calibration for that module


		 Base 		Current 	Difference
aida05 fault 	 0xc879 : 	 0xc87b : 	 2
aida06 fault 	 0x323c : 	 0x323e : 	 2
aida07 fault 	 0xfb3a : 	 0xfb40 : 	 6
aida08 fault 	 0xd3d6 : 	 0xd3d8 : 	 2
White Rabbit error counter test result: Passed 8, Failed 4

Understand the status reports as follows:-
Status bit 3 : White Rabbit decoder detected an error in the received data
Status bit 2 : Firmware registered WR error, no reload of Timestamp
Status bit 0 : White Rabbit decoder reports uncertain of Timestamp information from WR


			 Base 		Current 		Difference
aida07 fault 	 0xf : 	 0x10 : 	 1
FPGA Timestamp error counter test result: Passed 11, Failed 1
If any of these counts are reported as in error
The ASIC readout system has detected a timeslip.
That is the timestamp read from the time FIFO is not younger than the last


Returned 0 0 0 0 0 0 0 0 0 0 0 0
Mem(KB) :	4	8	16	32	64	128	256	512	1k	2k	4k
aida01 :     21      9     17      3      2      2      1      3      3      3      6   : 36492
aida02 :      5      1      1      6      0      2      2      3      3      3      6   : 36332
aida03 :      2     10     11      6      4      4      3      3      2      3      6   : 36296
aida04 :     27     12      3      4      0      2      3      2      3      3      6   : 36220
aida05 :     19      9      7      2      1      2      2      2      2      4      6   : 36996
aida06 :     28      5      0      4      0      3      1      3      3      3      6   : 36248
aida07 :     19     13     10      6      2      2      1      3      2      4      6   : 37524
aida08 :     18      9      6      0      1      4      1      3      3      3      6   : 36400
aida09 :     17     19     12      3      6      5      4      4      3      2      6   : 36348
aida10 :     23      9      7      4      2      3      1      4      2      3      6   : 35988
aida11 :     19     10      3      3      2      3      3      3      2      3      6   : 35884
aida12 :     12      6      0      3      2      4      2      3      2      3      6   : 35648


 Collecting the file size of each FEE64 Options CONTENTS file to check they are all the same

 FEE : aida01 =>   Options file size is 1025 	 Last changed Fri Apr 16 01:00:12 CEST 2021
 FEE : aida02 =>   Options file size is 1014 	 Last changed Fri Apr 16 00:56:20 CEST 2021
 FEE : aida03 =>   Options file size is 1014 	 Last changed Wed Apr 14 21:52:04 CEST 2021
 FEE : aida04 =>   Options file size is 1014 	 Last changed Wed Apr 14 21:52:04 CEST 2021
 FEE : aida05 =>   Options file size is 1025 	 Last changed Fri Apr 16 00:53:25 CEST 2021
 FEE : aida06 =>   Options file size is 1014 	 Last changed Wed Apr 14 21:52:04 CEST 2021
 FEE : aida07 =>   Options file size is 1014 	 Last changed Wed Apr 14 21:52:04 CEST 2021
 FEE : aida08 =>   Options file size is 1014 	 Last changed Wed Apr 14 21:52:04 CEST 2021
 FEE : aida09 =>   Options file size is 1014 	 Last changed Wed Apr 14 21:52:05 CEST 2021
 FEE : aida10 =>   Options file size is 1014 	 Last changed Wed Apr 14 21:52:06 CEST 2021
 FEE : aida11 =>   Options file size is 1014 	 Last changed Wed Apr 14 21:52:05 CEST 2021
 FEE : aida12 =>   Options file size is 1025 	 Last changed Wed Apr 14 21:58:54 CEST 2021


22.06.  Checked system stats, temps, leakage etc. looks ok

22.18CEST BNC PB-5 amplitude changed from 1V to 2V
          fioler NULL/R21_67

22.23CEST All histograms zero'd

22.43.  Checked system stats, temps, leakage etc. looks ok
23.21.  Checked system stats, temps, leakage etc. looks ok


23.46 system checks
Clock status test result: Passed 12, Failed 0

Understand status as follows
Status bit 3 : firmware PLL that creates clocks from external clock not locked
Status bit 2 : always logic '1'
Status bit 1 : LMK3200(2) PLL and clock distribution chip not locked to external clock
Status bit 0 : LMK3200(1) PLL and clock distribution chip not locked to external clock
If all these bits are not set then the operation of the firmware is unreliable


Calibration test result: Passed 12, Failed 0

If any modules fail calibration , check the clock status and open the FADC Align and Control browser page to rerun calibration for that module


		 Base 		Current 	Difference
aida05 fault 	 0xc879 : 	 0xc87b : 	 2
aida06 fault 	 0x323c : 	 0x323e : 	 2
aida07 fault 	 0xfb3a : 	 0xfb40 : 	 6
aida08 fault 	 0xd3d6 : 	 0xd3d8 : 	 2
White Rabbit error counter test result: Passed 8, Failed 4

Understand the status reports as follows:-
Status bit 3 : White Rabbit decoder detected an error in the received data
Status bit 2 : Firmware registered WR error, no reload of Timestamp
Status bit 0 : White Rabbit decoder reports uncertain of Timestamp information from WR

			 Base 		Current 		Difference
aida07 fault 	 0xf : 	 0x10 : 	 1
FPGA Timestamp error counter test result: Passed 11, Failed 1
If any of these counts are reported as in error
The ASIC readout system has detected a timeslip.
That is the timestamp read from the time FIFO is not younger than the last


Returned 0 0 0 0 0 0 0 0 0 0 0 0
Mem(KB) :	4	8	16	32	64	128	256	512	1k	2k	4k
aida01 :     17     12      7      0      3      3      2      4      2      3      6   : 36180
aida02 :     35      3      5      2      0      2      1      3      3      3      6   : 36148
aida03 :     22      6     10      2      1      3      2      4      2      3      6   : 36136
aida04 :     27      9      3      5      2      4      3      3      2      3      6   : 36100
aida05 :     20      9      3      3      2      2      2      2      2      4      6   : 37032
aida06 :     25     11      1      2      0      3      1      3      3      3      6   : 36236
aida07 :     20      6      6      2      3      3      2      4      1      4      6   : 37216
aida08 :     25     10      0      2      1      3      1      3      3      3      6   : 36276
aida09 :     10      4      3      4      4      5      4      4      3      2      6   : 35960
aida10 :     26      9      3      0      1      3      1      4      2      3      6   : 35744
aida11 :      2      3      4      2      2      3      3      3      2      3      6   : 35744
aida12 :      4      9      7      2      2      4      2      3      2      3      6   : 35720

 Collecting the file size of each FEE64 Options CONTENTS file to check they are all the same

 FEE : aida01 =>   Options file size is 1025 	 Last changed Fri Apr 16 01:00:12 CEST 2021
 FEE : aida02 =>   Options file size is 1014 	 Last changed Fri Apr 16 00:56:20 CEST 2021
 FEE : aida03 =>   Options file size is 1014 	 Last changed Wed Apr 14 21:52:04 CEST 2021
 FEE : aida04 =>   Options file size is 1014 	 Last changed Wed Apr 14 21:52:04 CEST 2021
 FEE : aida05 =>   Options file size is 1025 	 Last changed Fri Apr 16 00:53:25 CEST 2021
 FEE : aida06 =>   Options file size is 1014 	 Last changed Wed Apr 14 21:52:04 CEST 2021
 FEE : aida07 =>   Options file size is 1014 	 Last changed Wed Apr 14 21:52:04 CEST 2021
 FEE : aida08 =>   Options file size is 1014 	 Last changed Wed Apr 14 21:52:04 CEST 2021
 FEE : aida09 =>   Options file size is 1014 	 Last changed Wed Apr 14 21:52:05 CEST 2021
 FEE : aida10 =>   Options file size is 1014 	 Last changed Wed Apr 14 21:52:06 CEST 2021
 FEE : aida11 =>   Options file size is 1014 	 Last changed Wed Apr 14 21:52:05 CEST 2021
FEE : aida12 => Options file size is 1025 Last changed Wed Apr 14 21:58:54 CEST 2021 |
| Attachment 1: Screenshot_2021-04-16_Statistics_aidas-gsi.png
|

|
| Attachment 2: Screenshot_2021-04-16_Temperature_and_status_scan_aidas-gsi.png
|

|
| Attachment 3: 10.png
|

|
| Attachment 4: Screenshot_2021-04-16_Statistics_aidas-gsi(1).png
|
.png.png)
|
| Attachment 5: 11.png
|

|
| Attachment 6: Screenshot_2021-04-16_Temperature_and_status_scan_aidas-gsi(2).png
|
.png.png)
|
| Attachment 7: Screenshot_2021-04-16_Statistics_aidas-gsi(2).png
|
.png.png)
|
| Attachment 8: Screenshot_2021-04-16_Temperature_and_status_scan_aidas-gsi(3).png
|
.png.png)
|
| Attachment 9: 12.png
|

|
| Attachment 10: Screenshot_2021-04-16_Statistics_aidas-gsi(3).png
|
.png.png)
|
| Attachment 11: Screenshot_2021-04-16_Temperature_and_status_scan_aidas-gsi(4).png
|
.png.png)
|
| Attachment 12: 13.png
|
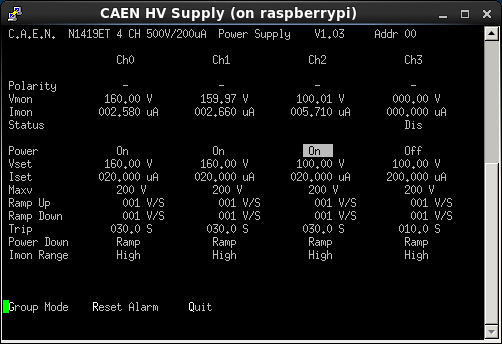
|
|
230
|
Fri Apr 16 11:42:45 2021 |
OH | Shifter checklist |
Every 30 minutes:

- Reload statistics (Web browser tab screen 1, workspace 2)
    - Are all FEEs still showing a rate?
    - If one shows 0 after multiple reloads Call Oscar or Tom.

- Options database monitor (Top middle terminal screen 2, workspace 2)
    - Has the message changed since the last check?
    - If so copy the message and place in elog

- Do the ucesb scalers make sense? (Web browser, screen 2, workspace 4)
    - If one DSSD is reporting kHz of implants when the others are much less it is likely an ASIC getting stuck.
    - Perform and ASIC check (ASIC control tab, web browser, screen 1, workspace 2)
        - Ensure "Act on all FEE" and "Act on all asic" selected
        - Click on drop down menu in the bottom of the screen and select check ASIC control
        - It will take a minute or so be patient (MIDAS can only respond to one command at once so don't try to do anything else)
        - A pop up will appear check that all options say ok
        - Has the implant rate gone to a more normal amount?
            - If not feel free to call

Every two hours:

- Take a screenshot of the statistics page (Web browser tab screen 1, workspace 2)
     - Compare to the previous screenshot to check if anything has drastically changed

- Take a screenshot of the temperatures (Web browser tab screen 1, workspace 2)
     - Do they all appear stable?

- Take a screenshot of the bias and leakage currents - (Top left terminal, screen 2, workspace 2)

- Perform the five system wide checks (Web browser tab screen 1, workspace 2)
     - Make a note in the elog of which tests are successful
     - If failed copy the text from the white box into the elog and make a note of it

- Enter the screenshots into the elog

- Update the leakage current spreadsheet (Web browser, screen 2, workspace 4) |
|
229
|
Fri Apr 16 07:19:00 2021 |
OH, MA | Friday 16th April 08:00-16:00 |
08:19 System wide checks all ok
      Baselines reset on WR and FPGA checks for the start of the day

      Statistics ok - attachment 1
      Temperatures ok - attachment 2
      Bias and leakage currents ok - attachment 3

09:03 During the reset last night I repaired the OptionsDB for aida02 from the Options.Pristine directory.
      No corruptions have been noted since

10:10 System check, clcock and ADC ok

	 Base 		Current 	Difference
aida07 fault 	 0xfb3a : 	 0xfb3d : 	 3
White Rabbit error counter test result: Passed 11, Failed 1

Understand the status reports as follows:-
Status bit 3 : White Rabbit decoder detected an error in the received data
Status bit 2 : Firmware registered WR error, no reload of Timestamp
Status bit 0 : White Rabbit decoder reports uncertain of Timestamp information from WR

FPGA and memory check ok

      Statistics ok - attachment 4
      Temperatures ok - attachment 5
      Bias and leakage currents ok - attachment 6

10:39 Fission fragments were punching through AIDA
      This was even with the maxmimum degraders in place
      They are now placing a thick plate in front of AIDA to block the fragments while they beam tune.

11:38 They have found the issue with the degrader and have corrected it.
      We now see next to no implants in AIDA as expect.
      Histograms reset at around 11:35
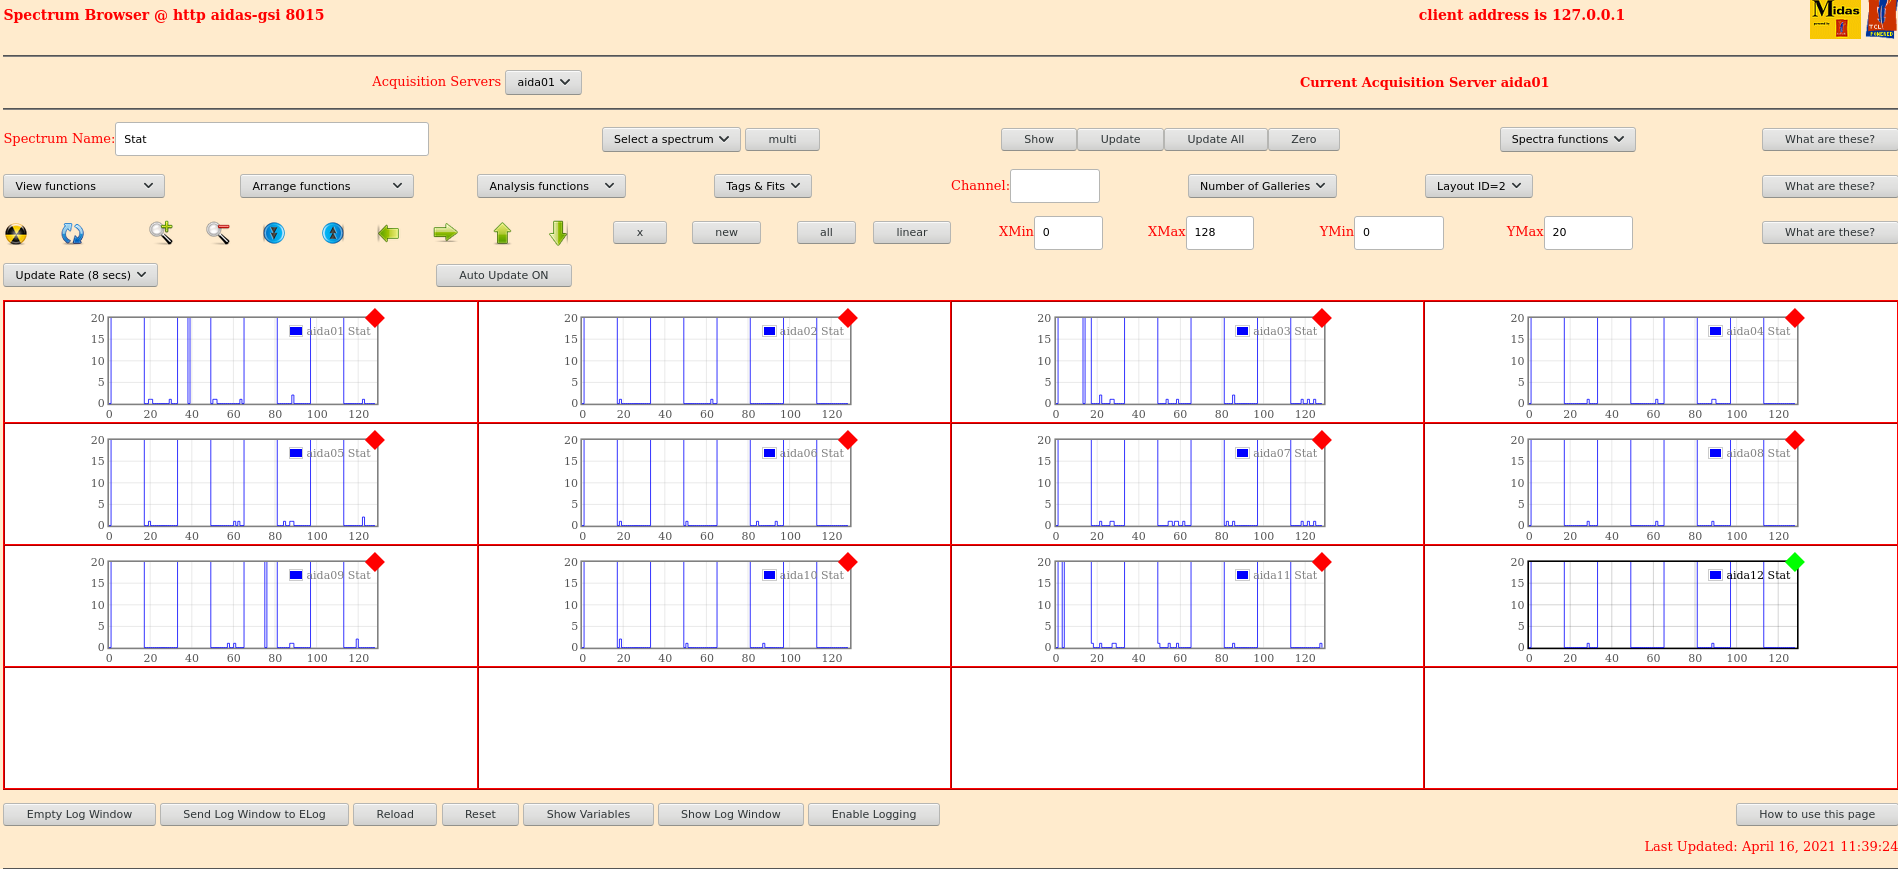
      Layout 2 shows very few implants in 5 minutes - attachment 7

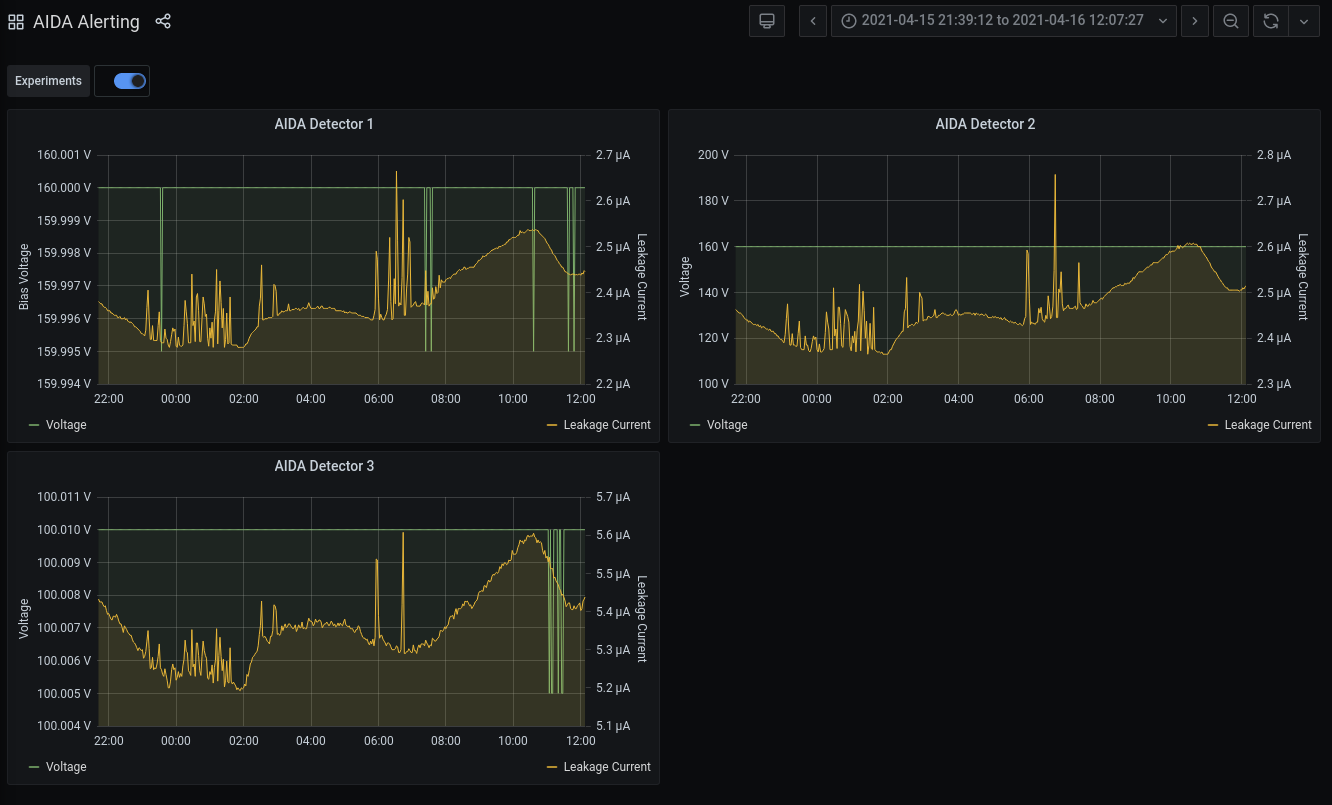
12:08 The high implantation rates of ions into AIDA is clearly seen in the large transients on the leakage currents - attachment 8
      This was a large amount of dose going into the detectors which we should try to avoid

13:25 system check, clock and ADC ok

	 Base 		Current 	Difference
aida05 fault 	 0xc879 : 	 0xc87b : 	 2
aida06 fault 	 0x323c : 	 0x323e : 	 2
aida07 fault 	 0xfb3a : 	 0xfb3f : 	 5
aida08 fault 	 0xd3d6 : 	 0xd3d8 : 	 2
White Rabbit error counter test result: Passed 8, Failed 4

Understand the status reports as follows:-
Status bit 3 : White Rabbit decoder detected an error in the received data
Status bit 2 : Firmware registered WR error, no reload of Timestamp
Status bit 0 : White Rabbit decoder reports uncertain of Timestamp information from WR

      Statistics ok - attachment 9
      Temperatures ok - attachment 10
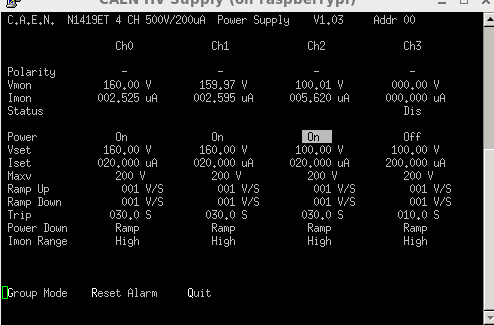
      Bias and leakage currents ok - attachment 11
FPGA and memory check ok


16:10 system check, clock and ADC ok


		 Base 		Current 	Difference
aida05 fault 	 0xc879 : 	 0xc87b : 	 2
aida06 fault 	 0x323c : 	 0x323e : 	 2
aida07 fault 	 0xfb3a : 	 0xfb3f : 	 5
aida08 fault 	 0xd3d6 : 	 0xd3d8 : 	 2
White Rabbit error counter test result: Passed 8, Failed 4

Understand the status reports as follows:-
Status bit 3 : White Rabbit decoder detected an error in the received data
Status bit 2 : Firmware registered WR error, no reload of Timestamp
Status bit 0 : White Rabbit decoder reports uncertain of Timestamp information from WR


      Statistics ok - attachment 12
      Temperatures ok - attachment 13
      Bias and leakage currents ok - attachment 14
FPGA and memory check ok |
| Attachment 1: 210416_0820_Stats.png
|

|
| Attachment 2: 210416_0821_Temp.png
|

|
| Attachment 3: 210416_0824_Bias.png
|
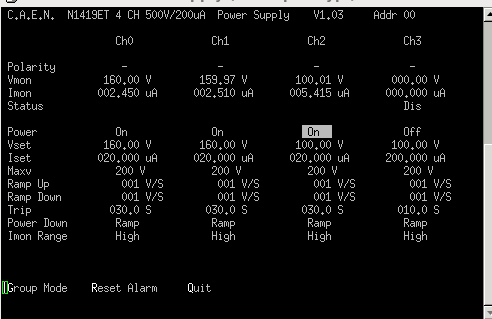
|
| Attachment 4: 210416_1003Stats.png
|

|
| Attachment 5: 210416_1007Temp.png
|

|
| Attachment 6: 210416_1019_voltages.png
|
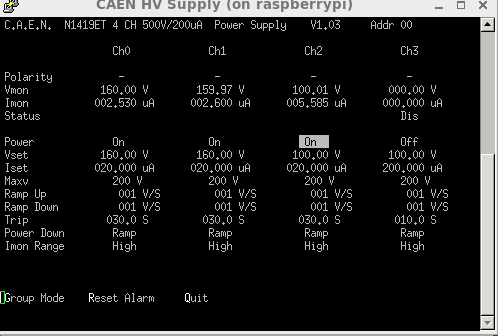
|
| Attachment 7: 210416_1139_layout2.png
|
|
| Attachment 8: 210416_1207_Leakage.png
|
|
| Attachment 9: 210416_1311_Stats.png
|

|
| Attachment 10: 210416_1312_Temp.png
|

|
| Attachment 11: 210416_1315_Voltages.png
|
|
| Attachment 12: 210416_1412_Voltages.png
|

|
| Attachment 13: 210416_1548_Stats.png
|

|
| Attachment 14: 210416_1553_Temp.png
|

|
|
228
|
Fri Apr 16 05:13:09 2021 |
ML | system wide checks |
system wide checks:
Done around 4am.
#################################
To be noted:
-1- White rabbit and FPGA checks failed for 1 FEE and passed for 11
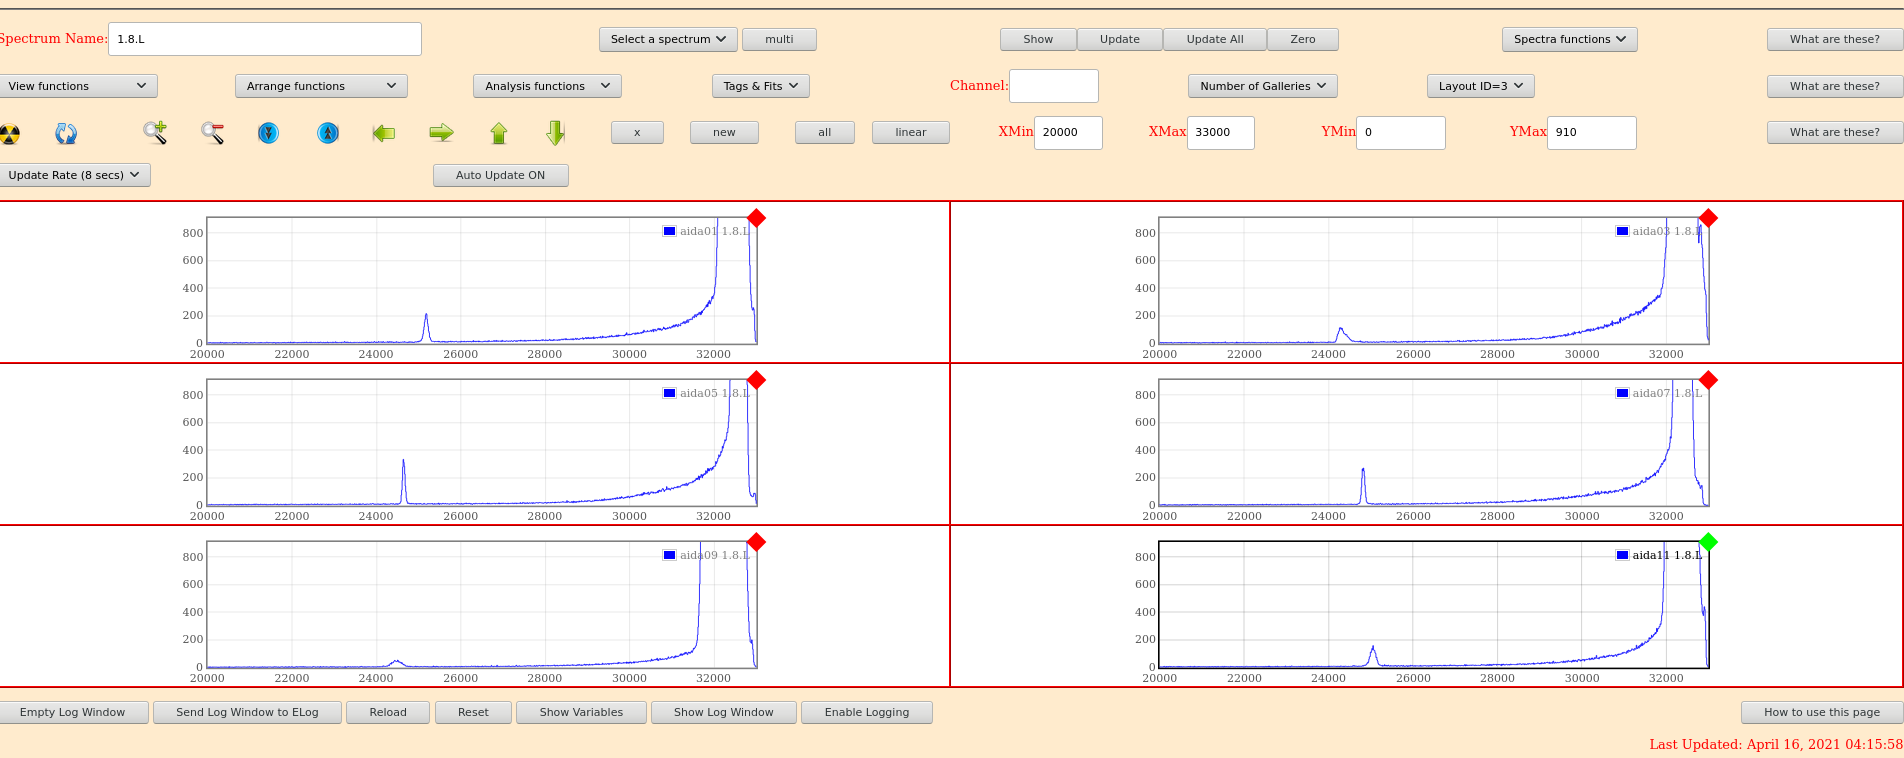
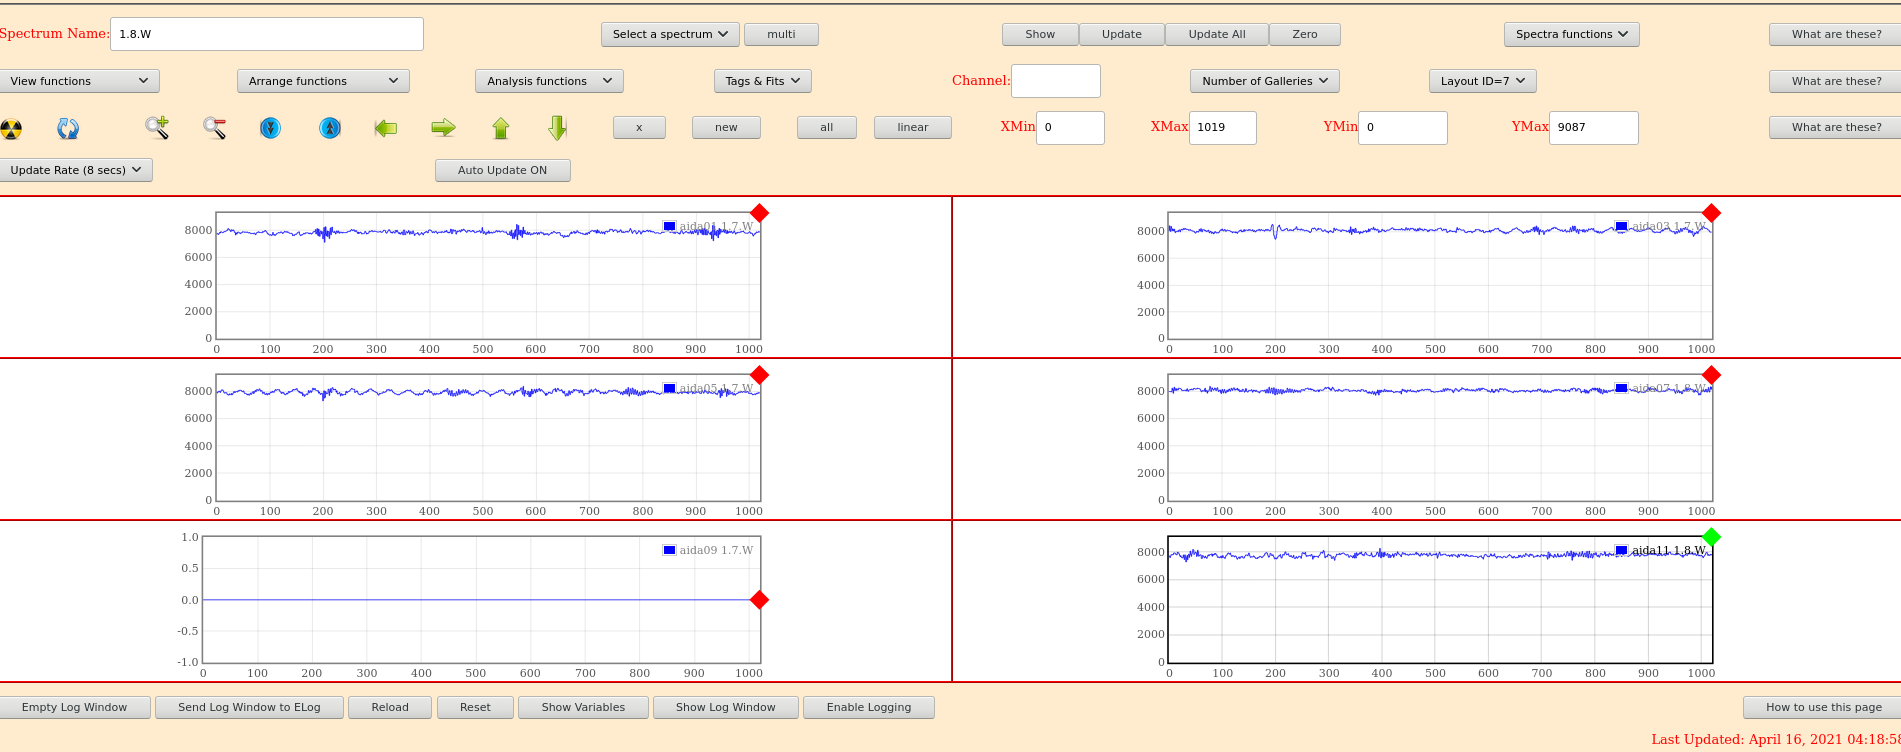
-2- No waveform for AIDA09 in 1.8.L spectrum
-3- AIDA 7 is red in the NewMerger control window (?)
#################################
Details:
Clock status test result: Passed 12, Failed 0
Understand status as follows
Status bit 3 : firmware PLL that creates clocks from external clock not locked
Status bit 2 : always logic '1'
Status bit 1 : LMK3200(2) PLL and clock distribution chip not locked to external clock
Status bit 0 : LMK3200(1) PLL and clock distribution chip not locked to external clock
If all these bits are not set then the operation of the firmware is unreliable
Calibration test result: Passed 12, Failed 0
White Rabbit checks:
Base Current Difference
aida07 fault 0xfa8c : 0xfb37 : 171
White Rabbit error counter test result: Passed 11, Failed 1
Understand the status reports as follows:-
Status bit 3 : White Rabbit decoder detected an error in the received data
Status bit 2 : Firmware registered WR error, no reload of Timestamp
Status bit 0 : White Rabbit decoder reports uncertain of Timestamp information from WR
FPGA timestamp check:
Base Current Difference
aida07 fault 0x0 : 0xe : 14
FPGA Timestamp error counter test result: Passed 11, Failed 1
If any of these counts are reported as in error
The ASIC readout system has detected a timeslip.
That is the timestamp read from the time FIFO is not younger than the last
Memory check:
Returned 0 0 0 0 0 0 0 0 0 0 0 0
Mem(KB) : 4 8 16 32 64 128 256 512 1k 2k 4k
aida01 : 45 9 7 3 4 3 2 3 3 3 6 : 36940
aida02 : 23 9 6 7 4 3 2 3 3 3 6 : 36964
aida03 : 40 8 5 4 5 3 2 3 3 3 6 : 36976
aida04 : 37 13 7 3 4 3 4 2 3 3 6 : 36940
aida05 : 35 11 6 3 4 4 2 3 2 4 6 : 38052
aida06 : 42 8 2 3 4 4 2 3 3 3 6 : 36968
aida07 : 42 10 5 5 5 3 2 3 3 3 6 : 37032
aida08 : 40 8 1 6 3 4 2 3 3 3 6 : 36976
aida09 : 18 18 14 8 5 5 5 4 3 2 6 : 36728
aida10 : 1 8 9 6 3 3 1 4 2 3 6 : 36052
aida11 : 24 11 14 6 2 2 4 2 3 3 6 : 36824
aida12 : 17 13 8 5 5 4 2 3 2 3 6 : 36108 |
| Attachment 1: 16-04-2021_3h45am_HV.png
|

|
| Attachment 2: 48_temperature.png
|
|
| Attachment 3: 16-04-2021_3h51_StatGoodEvt.png
|

|
| Attachment 4: 16-04-2021_3h53_StatADCdataItem.png
|

|
| Attachment 5: 16-04-2021_3h58_StatWR#4.png
|

|
| Attachment 6: 16-04-2021_4h04_StatWR#5.png
|

|
| Attachment 7: 16-04-2021_3h59_StatPause#2.png
|

|
| Attachment 8: 16-04-2021_4h01_StatResume#3.png
|

|
| Attachment 9: 16-04-2021_4h02_StatCorrelation#8.png
|

|
| Attachment 10: 16-04-2021_4h06_SpecRate.png
|

|
| Attachment 11: 16-04-2021_4h08_SpecRate2.png
|

|
| Attachment 12: 16-04-2021_4h17_Spec1.8L.png
|
|
| Attachment 13: 16-04-2021_4h29_Spec1.8L_id4.png
|

|
| Attachment 14: 16-04-2021_4h20_Spec1.8W_id7.png
|
|
| Attachment 15: 25_Spec1.8W_id8.png
|

|
| Attachment 16: 16-04-2021_4h48_NewMergerControl.png
|

|
|
227
|
Fri Apr 16 02:15:12 2021 |
NH | Implants/Punchthrough |
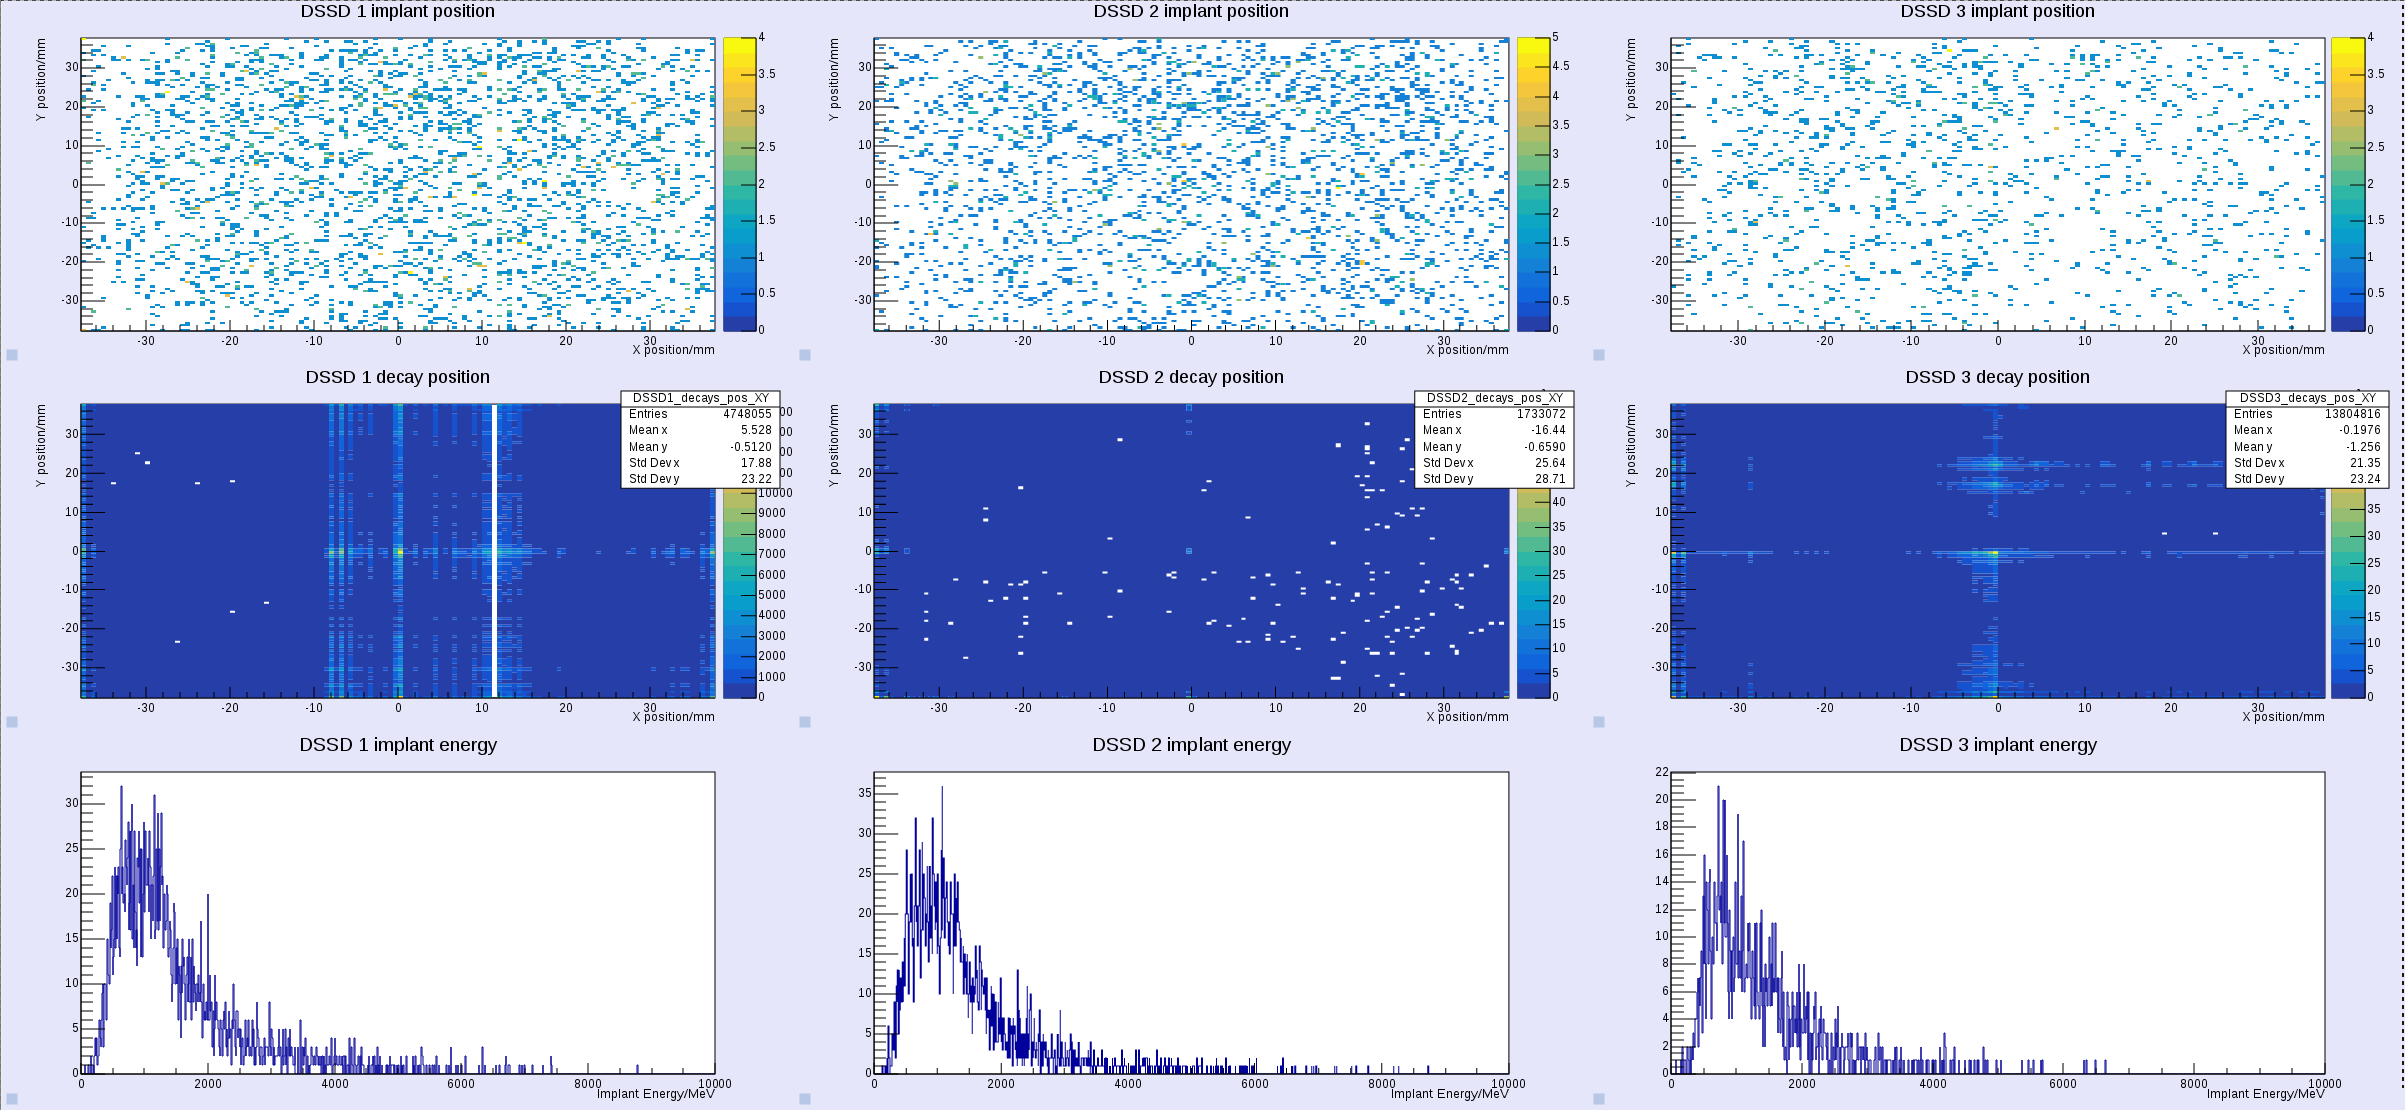
Rate with beam < 1000 Hz still

Not Uranium but some fragments possibly produced in the thick 9g degrader
S4 slits are +/- 20mm but these punchthrough and cover the +/- 40mm of AIDA |
| Attachment 1: 53_AM.png
|
|
|
225
|
Fri Apr 16 00:47:36 2021 |
OH-ML | AIDA DAQ Reset |
1:18 (CET) No rate in AIDA 07.
Oscar did a AIDA DAQ reset and a quick wide check.
(Power cycle
All back to normal. |
|
224
|
Thu Apr 15 22:38:18 2021 |
OH | Thursday 15th April - 16th April |
23:38 They are testing the finger detector
      It is a lot of U they are putting into it which is passing through to AIDA ~3500Hz
      Most seems to be punching through

23:45 Rate seems to be reduced to peaking at 1000Hz

00:06 DAQ Running to no storage
      ASIC settings 2019Dec19-16.19.51
      DSSSD#1 slow comparator 0xa
      DSSSD#2 slow comparator 0xa
      DSSSD#3 slow comparator 0xa


      BNC PB-5 Pulser
      Amplitude1.0V
      Attenuation x1
      Frequency 2Hz
      tau_d 1ms
      - polarity
Delay 250ns, tail pulse |
|
223
|
Thu Apr 15 13:28:07 2021 |
TD | Thursday 15 April |
13.28 System wide checks

Clock status test result: Passed 12, Failed 0

Understand status as follows
Status bit 3 : firmware PLL that creates clocks from external clock not locked
Status bit 2 : always logic '1'
Status bit 1 : LMK3200(2) PLL and clock distribution chip not locked to external clock
Status bit 0 : LMK3200(1) PLL and clock distribution chip not locked to external clock
If all these bits are not set then the operation of the firmware is unreliable

Calibration test result: Passed 12, Failed 0

If any modules fail calibration , check the clock status and open the FADC Align and Control browser page to rerun calibration for that module

		 Base 		Current 	Difference
aida01 fault 	 0x44c2 : 	 0x44c5 : 	 3
aida02 fault 	 0xc81f : 	 0xc822 : 	 3
aida03 fault 	 0x9342 : 	 0x9344 : 	 2
aida04 fault 	 0xdb3f : 	 0xdb41 : 	 2
aida05 fault 	 0x4baf : 	 0x4bb3 : 	 4
aida06 fault 	 0xd2a4 : 	 0xd2a8 : 	 4
aida07 fault 	 0xc51c : 	 0xc51f : 	 3
aida08 fault 	 0xe853 : 	 0xe856 : 	 3
aida09 fault 	 0x5212 : 	 0x5216 : 	 4
aida10 fault 	 0xf81d : 	 0xf81f : 	 2
aida11 fault 	 0x810 : 	 0x812 : 	 2
aida12 fault 	 0xa279 : 	 0xa27a : 	 1
White Rabbit error counter test result: Passed 0, Failed 12

Understand the status reports as follows:-
Status bit 3 : White Rabbit decoder detected an error in the received data
Status bit 2 : Firmware registered WR error, no reload of Timestamp
Status bit 0 : White Rabbit decoder reports uncertain of Timestamp information from WR


			 Base 		Current 		Difference
aida09 fault 	 0x0 : 	 0x5 : 	 5
aida12 fault 	 0x0 : 	 0xc : 	 12
FPGA Timestamp error counter test result: Passed 10, Failed 2
If any of these counts are reported as in error
The ASIC readout system has detected a timeslip.
That is the timestamp read from the time FIFO is not younger than the last


Returned 0 0 0 0 0 0 0 0 0 0 0 0
Mem(KB) :	4	8	16	32	64	128	256	512	1k	2k	4k
aida01 :     57     33     12     15      3      3      3      2      3      2      6   : 35276
aida02 :     15      3      5      2      1      4      1      3      3      3      6   : 36388
aida03 :     13      4      2      1      4      3      1      3      3      3      6   : 36372
aida04 :     21      5      2      1      2      4      4      2      3      3      6   : 36668
aida05 :     10      5      6      3      2      3      3      3      1      4      6   : 36880
aida06 :     22     12      1      0      3      3      1      3      3      3      6   : 36360
aida07 :     19      3      3      0      3      3      2      4      1      4      6   : 37076
aida08 :     21      6      2      4      2      3      1      3      3      3      6   : 36388
aida09 :      2      7      5      3      2      4      2      3      2      3      6   : 35696
aida10 :      7      3      1      3      1      3      3      3      2      3      6   : 35684
aida11 :      1      2      1      3      2      5      2      2      3      3      6   : 36228
aida12 :     17     10      4      2      3      2      2      4      2      3      6   : 36052


 Collecting the file size of each FEE64 Options CONTENTS file to check they are all the same

 FEE : aida01 =>   Options file size is 1014 	 Last changed Wed Apr 14 21:52:04 CEST 2021
 FEE : aida02 =>   Options file size is 2114 	 Last changed Wed Apr 14 21:52:05 CEST 2021
 FEE : aida03 =>   Options file size is 1014 	 Last changed Wed Apr 14 21:52:04 CEST 2021
 FEE : aida04 =>   Options file size is 1014 	 Last changed Wed Apr 14 21:52:04 CEST 2021
 FEE : aida05 =>   Options file size is 1014 	 Last changed Wed Apr 14 21:52:05 CEST 2021
 FEE : aida06 =>   Options file size is 1014 	 Last changed Wed Apr 14 21:52:04 CEST 2021
 FEE : aida07 =>   Options file size is 1014 	 Last changed Wed Apr 14 21:52:04 CEST 2021
 FEE : aida08 =>   Options file size is 1014 	 Last changed Wed Apr 14 21:52:04 CEST 2021
 FEE : aida09 =>   Options file size is 1014 	 Last changed Wed Apr 14 21:52:05 CEST 2021
 FEE : aida10 =>   Options file size is 1014 	 Last changed Wed Apr 14 21:52:06 CEST 2021
 FEE : aida11 =>   Options file size is 1014 	 Last changed Wed Apr 14 21:52:05 CEST 2021
 FEE : aida12 =>   Options file size is 1025 	 Last changed Wed Apr 14 21:58:54 CEST 2021

13.30 Output of ~/oh/OptionsCheck.py

02:25:00 PM
FAULTS!

Unknown option in FEE2 Options database
Unknown entry starts:
et&&Aida_Hist_W_Enable&&TS_SYNC_PHASE&&ExtClk&&Aida.shift&&MACB_TRIG_MODE&&Aida.offset&&RunNumber&&Aida_GroupBase&&Rate.channels&&Stat.channels&&Aida_Hist_D_Enable&&WAVE_DMA_HWM&&ASIC.se
ttings&&Aida.Vchannels&&Aida.Wchannels&&Stat.shift&&Aida.channels&&Include.Aida&&Aida_Hist_V_Enable&&DataFormat&&Aida_Hist_H_Enable&&DataAcqPgm&&ASIC_DMA_HWM&&Aida_Hist_L_Enable

Unknown option in FEE2 Options database
Unknown entry starts:
da_Hist_W_Enable&&TS_SYNC_PHASE&&ExtClk&&Aida.shift&&MACB_TRIG_MODE&&Aida.offset&&RunNumber&&Aida_GroupBase&&Rate.channels&&Stat.channels&&Aida.Vchannels&&ASIC.settings&&WAVE_DMA_HWM&&Ai
da_Hist_D_Enable&&Stat.shift&&Aida.Wchannels&&Aida_Hist_V_Enable&&Include.Aida&&Aida.channels&&DataAcqPgm&&Aida_Hist_H_Enable&&DataFormat&&ASIC_DMA_HWM&&Aida_Hist_L_Enable

Unknown option in FEE2 Options database
Unknown entry starts:
et&&Aida_Hist_W_Enable&&TS_SYNC_PHASE&&ExtClk&&Aida.shift&&MACB_TRIG_MODE&&Aida.offset&&RunNumber&&Aida_GroupBase&&Rate.channels&&Stat.channels&&Aida.Vchannels&&ASIC.settings&&WAVE_DMA_H
WM&&Aida_Hist_D_Enable&&Stat.shift&&Aida.Wchannels&&Aida_Hist_V_Enable&&Include.Aida&&Aida.channels&&DataAcqPgm&&Aida_Hist_H_Enable&&DataFormat&&ASIC_DMA_HWM&&Aida_Hist_L_Enable

13.37 Detector bias & leakage currents OK - attachment 1
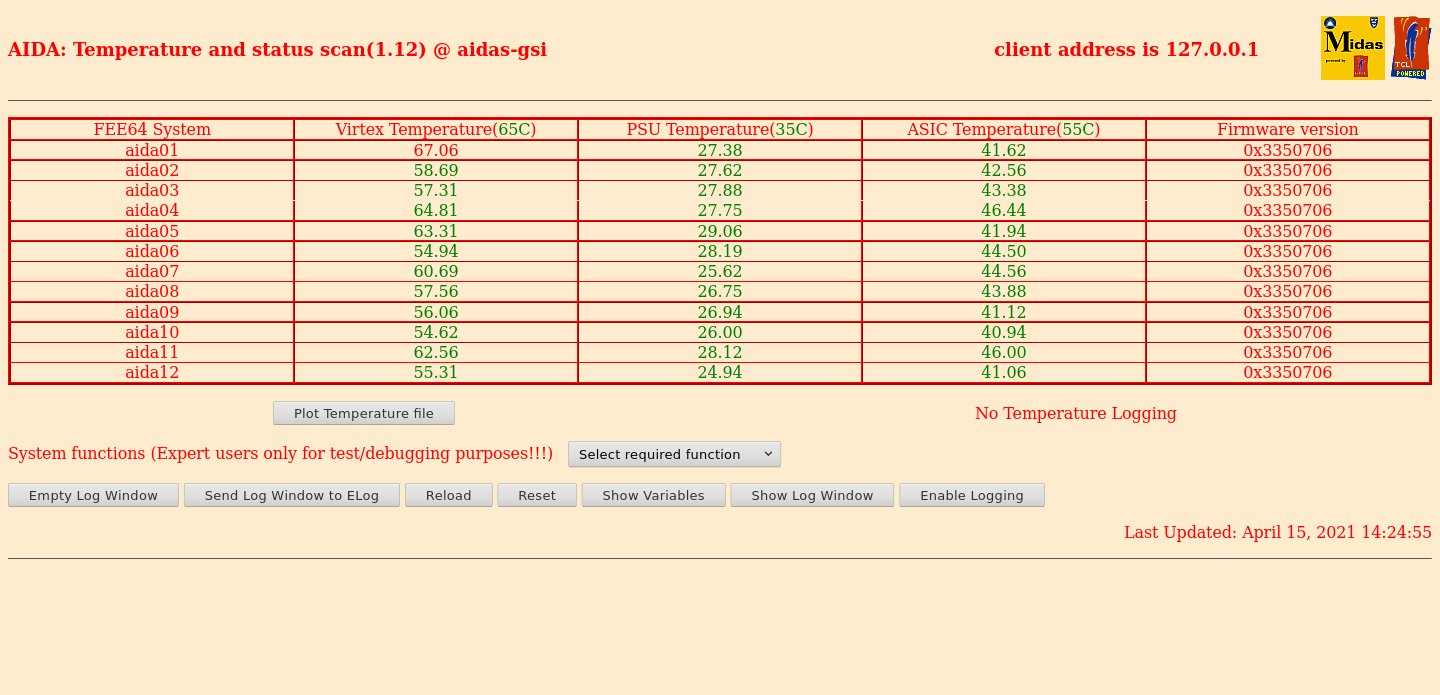
      FEE64 temps OK - attachments 2
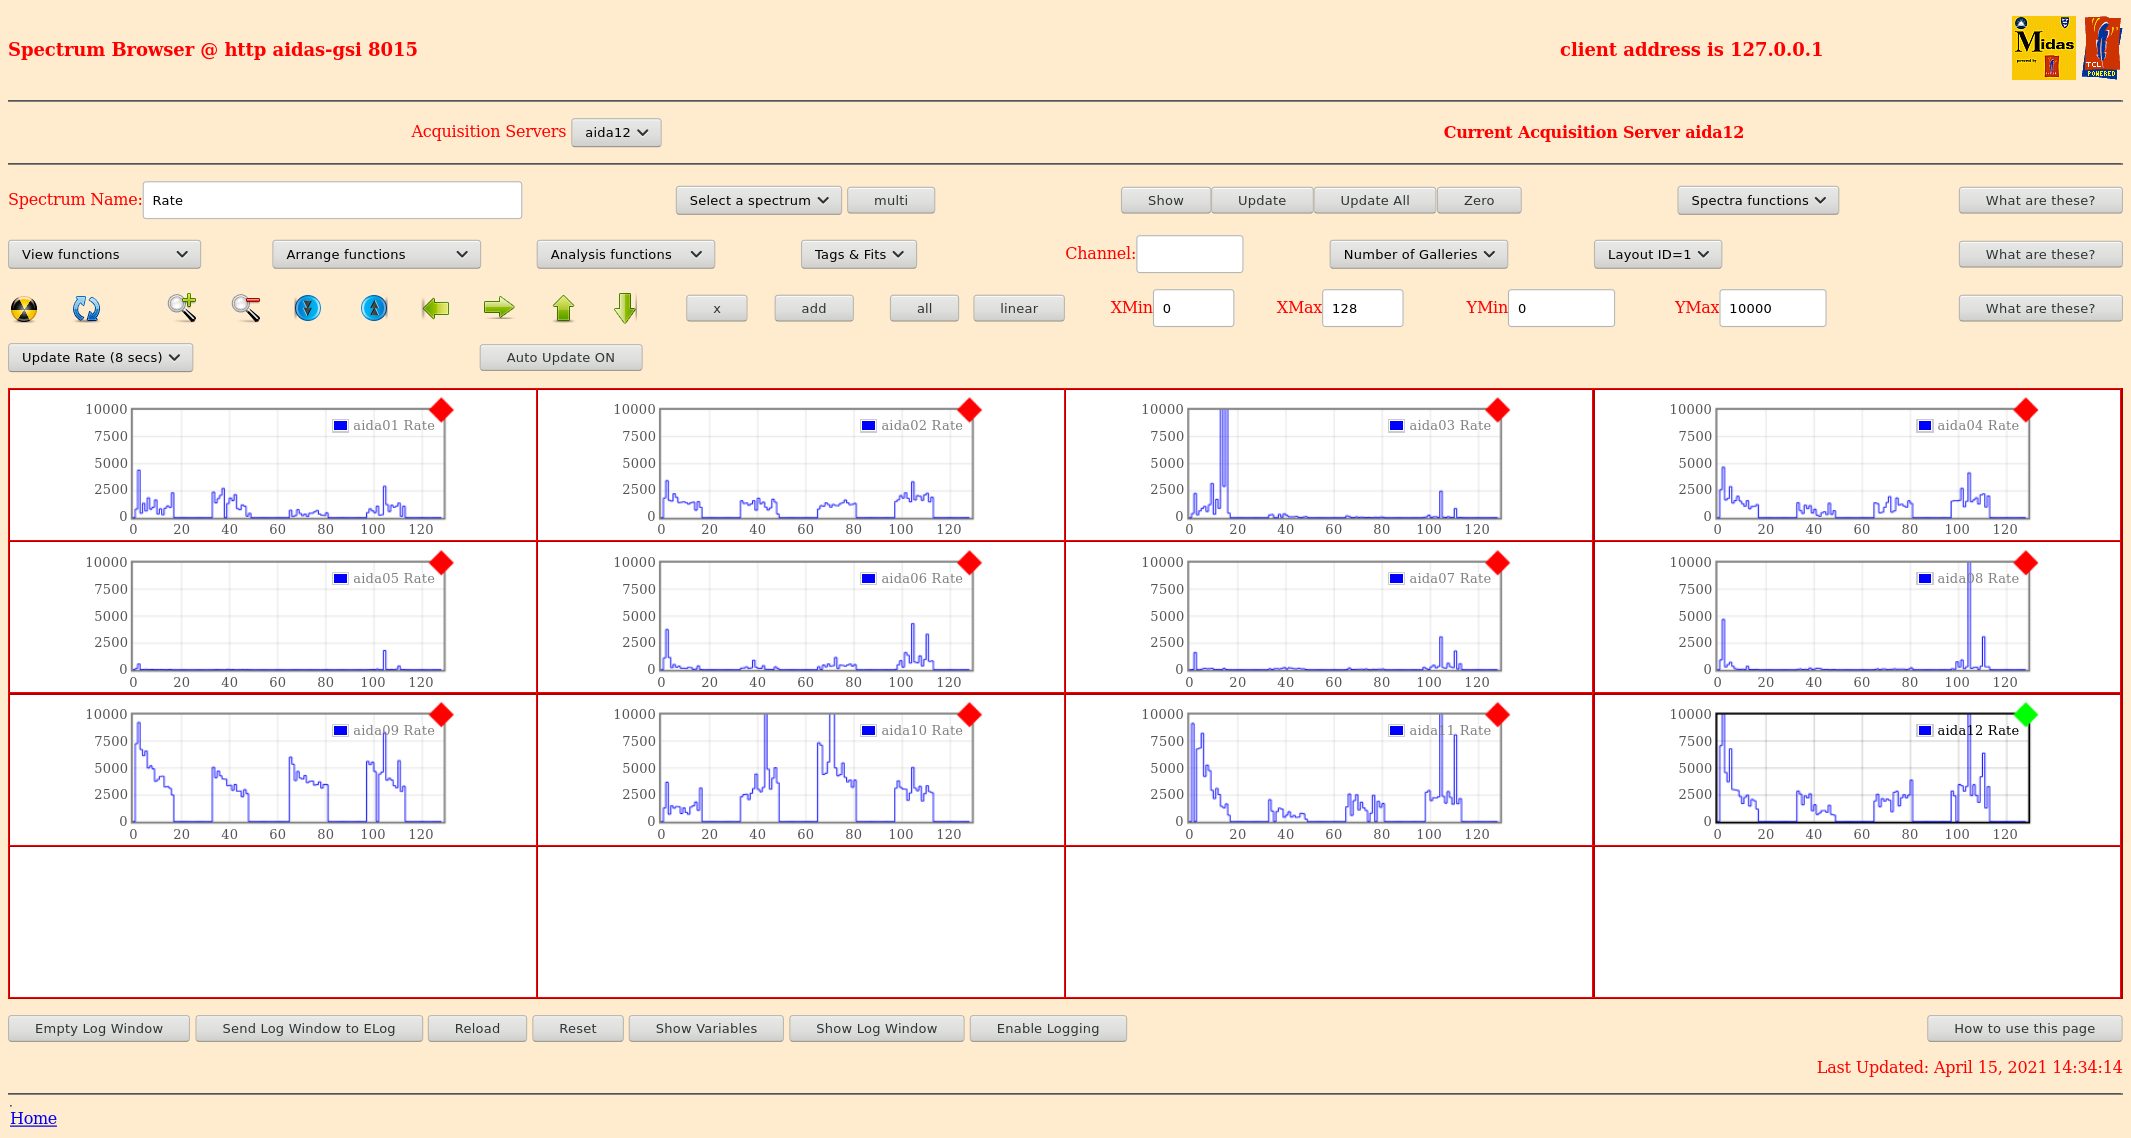
      Statistics - good events, ADC data, disc data, info code 4 & 5, pause & resume, correlation - attachments 3-10
      per FEE64 rate spectra - attachments 11 & 12
      per FEE64 1.8.L spectra - attachments 13 & 19
       aida5 peak width 70 ch FWHM, aida06 peak width 89ch FWHM
      per FEE64 1.8.W spectra 20us FSR - attachments 14 & 15
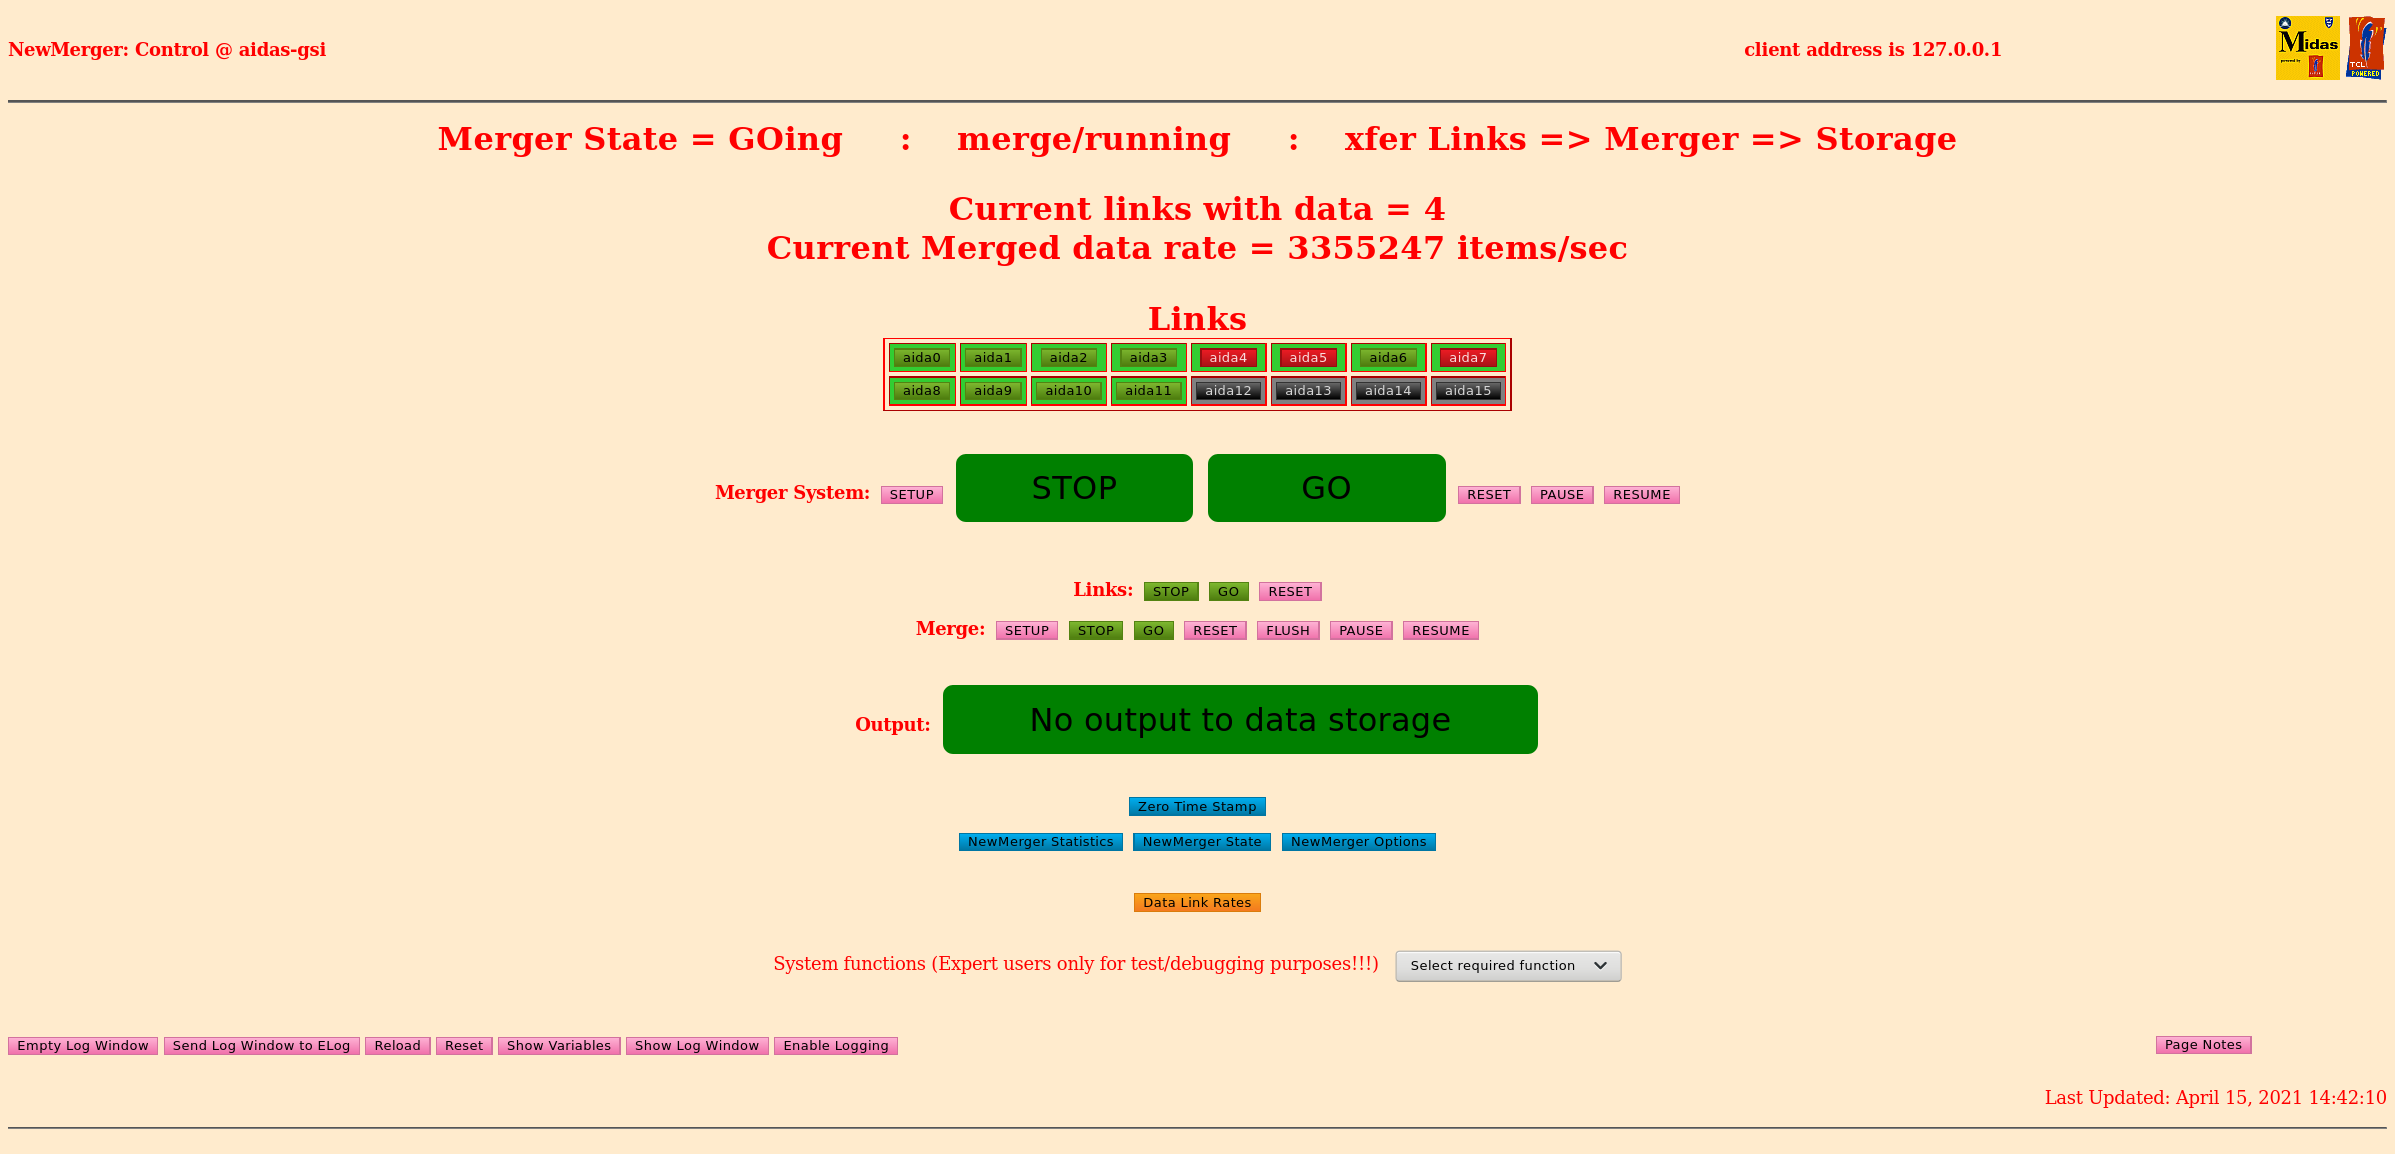
      meger & tape server - attachments 16-18
|
| Attachment 1: 4.png
|

|
| Attachment 2: Screenshot_2021-04-15_Temperature_and_status_scan_aidas-gsi.png
|
|
| Attachment 3: Screenshot_2021-04-15_Statistics_aidas-gsi.png
|

|
| Attachment 4: Screenshot_2021-04-15_Statistics_aidas-gsi(1).png
|
.png.png)
|
| Attachment 5: Screenshot_2021-04-15_Statistics_aidas-gsi(2).png
|
.png.png)
|
| Attachment 6: Screenshot_2021-04-15_Statistics_aidas-gsi(3).png
|
.png.png)
|
| Attachment 7: Screenshot_2021-04-15_Statistics_aidas-gsi(4).png
|
.png.png)
|
| Attachment 8: Screenshot_2021-04-15_Statistics_aidas-gsi(5).png
|
.png.png)
|
| Attachment 9: Screenshot_2021-04-15_Statistics_aidas-gsi(6).png
|
.png.png)
|
| Attachment 10: Screenshot_2021-04-15_Statistics_aidas-gsi(7).png
|
.png.png)
|
| Attachment 11: Screenshot_2021-04-15_Spectrum_Browser_aidas-gsi.png
|
|
| Attachment 12: Screenshot_2021-04-15_Spectrum_Browser_aidas-gsi(1).png
|
.png.png)
|
| Attachment 13: Screenshot_2021-04-15_Spectrum_Browser_aidas-gsi(2).png
|
.png.png)
|
| Attachment 14: Screenshot_2021-04-15_Spectrum_Browser_aidas-gsi(3).png
|
.png.png)
|
| Attachment 15: Screenshot_2021-04-15_Spectrum_Browser_aidas-gsi(4).png
|
.png.png)
|
| Attachment 16: Screenshot_2021-04-15_NewMerger_Control_aidas-gsi.png
|
|
| Attachment 17: Screenshot_2021-04-15_Tape_Service_(Expert)_aidas-gsi.png
|
_aidas-gsi.png.png)
|
| Attachment 18: 5.png
|

|
| Attachment 19: Screenshot_2021-04-15_Spectrum_Browser_aidas-gsi(5).png
|
.png.png)
|
|
222
|
Thu Apr 15 12:23:22 2021 |
NH | Fast Discriminator Masks |
It is possible to get good rates with the fast discriminators with a few hot channels mask in aida03 and aida10
Threshold is 0x20 = 3.2 MeV

They can be tested in beam to see performance, especially note the first setting will involve alpha emitters to check in AIDA

All FEEs:
AS01 01, AS3 07 10 13 are masked

aida03:
AS0 12 and 14 are masked in addition

aida10:
AS1 10, 11 and AS2 05, 06 are masked in addiction |
| Attachment 1: Image_Pasted_at_2021-4-14_18-57.png
|

|
|
221
|
Wed Apr 14 15:14:55 2021 |
PJCS | Note Well |
Please note that for the forseeable future the system function in the menu on the System Wide Checks browser page labelled as
"Collect the Timestamp RAM values" and "Start the Readout Timestamp error tracing"
Are for the use of engineers only unless otherwise instructed.
There is no harm in using them but the results may be confusing and it is not possible, at present, to detail a definitive set of instructions for their use. |
|
220
|
Wed Apr 14 12:14:47 2021 |
PJCS | Corrections and changes |
14/4/21 @12:00 UK time
Corrected the failure of FADC re-calibration All modules. The problem was a missing > in the .tml file
Edited the sys.tcl file in /MIDAS/TclHttpd/Html/RunControl to comment out where the status of the waveform enable was able to stop the creation of the .W spectra. This will now function at SETUP.
Edited the sys.tcl file to remove the test for Master module at the enable of the Correlation Scalar readout. All modules will now be enabled.
Successfully re-calibrated the LMK3200 in aida09 to remove the clock fault reported in System Wide Checks.
Successfully "sync ASIC clocks" followed by calibrate all module FADCs ( except aida09 which required seperate attention. )
All the Edits first carried out and tested at Daresbury T9 system. |
|
219
|
Wed Apr 14 09:55:12 2021 |
TD | Tuesday 13 April |
Two further comments

1) The 'pristine' Options files produced by OH fixed *all* of the undefined spectra issues,
   i.e. we now have *L, *H, Rate, Stat, Hit, HitRate spectra for all FEE64s

2) The system has undegone 1x power cycle/reset/setup and 1x reset/setup cycle since the
   new Options files were installed and we currently have 2x errors reported in aida02.
   There is an open Options tab and we have viewed the Options settings for aida01 and aida02
   (currently viewing aida02) - *no* changes/saves/restores requested.

>
> Rename Options directory
>
> mv Options Options.BAK-130421
>
> Copy Options.PRISTINE to Options
>
> cp -r Options.PRISTINE Options
> chmod -R 777 Options
>
> Start Options directory monitor (will check directory every 5 minutes)
>
> Python ~/oh/OptionsCheck
>
>
> 17.32 Power cycle FEE64s
>
>
> FEE64 module aida09 global clocks failed, 6
>  Clock status test result: Passed 11, Failed 1
>
> Understand status as follows
> Status bit 3 : firmware PLL that creates clocks from external clock not locked
> Status bit 2 : always logic '1'
> Status bit 1 : LMK3200(2) PLL and clock distribution chip not locked to external clock
> Status bit 0 : LMK3200(1) PLL and clock distribution chip not locked to external clock
> If all these bits are not set then the operation of the firmware is unreliable
>
> Calibration test result: Passed 12, Failed 0
>
> If any modules fail calibration , check the clock status and open the FADC Align and Control browser page to rerun calibration for that module
>
> White Rabbit error counter test result: Passed 12, Failed 0
>
> Understand the status reports as follows:-
> Status bit 3 : White Rabbit decoder detected an error in the received data
> Status bit 2 : Firmware registered WR error, no reload of Timestamp
> Status bit 0 : White Rabbit decoder reports uncertain of Timestamp information from WR
>
>
> FPGA Timestamp error counter test result: Passed 12, Failed 0
> If any of these counts are reported as in error
> The ASIC readout system has detected a timeslip.
> That is the timestamp read from the time FIFO is not younger than the last
>
>
>
> Returned 0 0 0 0 0 0 0 0 0 0 0 0
> Mem(KB) :	4	8	16	32	64	128	256	512	1k	2k	4k
> aida01 :      3      5      2      2      1      3      3      2      2      3      8   : 43348
> aida02 :      2      3      0      2      1      2      2      3      2      3      8   : 43424
> aida03 :      3      4      0      1      1      2      2      3      2      3      8   : 43404
> aida04 :      1      4      2      0      3      3      3      2      2      3      8   : 43396
> aida05 :      1      4      2      2      2      3      3      2      2      3      8   : 43396
> aida06 :      2      3      2      1      1      2      2      3      2      3      8   : 43424
> aida07 :      4      1      3      3      1      3      1      3      2      3      8   : 43368
> aida08 :      1      4      2      2      2      3      3      2      2      3      8   : 43396
> aida09 :      2      3      3      3      2      4      2      2      2      3      8   : 43312
> aida10 :      1      3      1      2      2      3      2      2      2      3      8   : 43116
> aida11 :      1      3      3      1      2      3      2      2      2      3      8   : 43116
> aida12 :      3      2      1      0      1      2      1      3      2      3      8   : 43116
>
>
> Note that system wide checks identify 1x file of different size immediately after boot/reset/setup
>
>  Collecting the file size of each FEE64 Options CONTENTS file to check they are all the same
>
>  FEE : aida01 =>   Options file size is 1014 	 Last changed Tue Apr 13 17:59:03 CEST 2021
>  FEE : aida02 =>   Options file size is 1025 	 Last changed Tue Apr 13 17:59:04 CEST 2021
>  FEE : aida03 =>   Options file size is 1014 	 Last changed Tue Apr 13 17:59:03 CEST 2021
>  FEE : aida04 =>   Options file size is 1014 	 Last changed Tue Apr 13 17:59:03 CEST 2021
>  FEE : aida05 =>   Options file size is 1014 	 Last changed Tue Apr 13 17:59:04 CEST 2021
>  FEE : aida06 =>   Options file size is 1014 	 Last changed Tue Apr 13 17:59:03 CEST 2021
>  FEE : aida07 =>   Options file size is 1014 	 Last changed Tue Apr 13 17:59:03 CEST 2021
>  FEE : aida08 =>   Options file size is 1014 	 Last changed Tue Apr 13 17:59:03 CEST 2021
>  FEE : aida09 =>   Options file size is 1014 	 Last changed Tue Apr 13 17:59:03 CEST 2021
>  FEE : aida10 =>   Options file size is 1014 	 Last changed Tue Apr 13 17:59:04 CEST 2021
>  FEE : aida11 =>   Options file size is 1014 	 Last changed Tue Apr 13 17:59:03 CEST 2021
>  FEE : aida12 =>   Options file size is 1014 	 Last changed Tue Apr 13 17:59:05 CEST 2021
>
> 06:25:00 PM
> FAULTS!
>
> Unknown option in FEE2 Options database
> Unknown entry starts:
>
da_Hist_W_Enable&&TS_SYNC_PHASE&&ExtClk&&Aida.shift&&MACB_TRIG_MODE&&Aida.offset&&RunNumber&&Aida_GroupBase&&Rate.channels&&Stat.channels&&Aida.Vchannels&&ASIC.settings&&WAV
E_DMA_HWM&&Ai
> da_Hist_D_Enable&&Stat.shift&&Aida.Wchannels&&Aida_Hist_V_Enable&&Include.Aida&&Aida.channels&&DataAcqPgm&&Aida_Hist_H_Enable&&DataFormat&&ASIC_DMA_HWM&&Aida_Hist_L_Enable
>
> 06:30:00 PM
> FAULTS!
>
> Unknown option in FEE2 Options database
> Unknown entry starts:
>
da_Hist_W_Enable&&TS_SYNC_PHASE&&ExtClk&&Aida.shift&&MACB_TRIG_MODE&&Aida.offset&&RunNumber&&Aida_GroupBase&&Rate.channels&&Stat.channels&&Aida.Vchannels&&ASIC.settings&&WAV
E_DMA_HWM&&Ai
> da_Hist_D_Enable&&Stat.shift&&Aida.Wchannels&&Aida_Hist_V_Enable&&Include.Aida&&Aida.channels&&DataAcqPgm&&Aida_Hist_H_Enable&&DataFormat&&ASIC_DMA_HWM&&Aida_Hist_L_Enable
>
> Unknown option in FEE2 Options database
> Unknown entry starts:
>
et&&Aida_Hist_W_Enable&&TS_SYNC_PHASE&&ExtClk&&Aida.shift&&MACB_TRIG_MODE&&Aida.offset&&RunNumber&&Aida_GroupBase&&Rate.channels&&Stat.channels&&Aida.Vchannels&&ASIC.setting
s&&WAVE_DMA_H
>
WM&&Aida_Hist_D_Enable&&Stat.shift&&Aida.Wchannels&&Aida_Hist_V_Enable&&Include.Aida&&Aida.channels&&DataAcqPgm&&Aida_Hist_H_Enable&&DataFormat&&ASIC_DMA_HWM&&Aida_Hist_L_En
able
>
>
>
>
>
> FEE64 module aida01  => 	7
> FEE64 module aida02  => 	7
> FEE64 module aida03  => 	7
> FEE64 module aida04  => 	7
> FEE64 module aida05  => 	7
> FEE64 module aida06  => 	7
> FEE64 module aida07  => 	7
> FEE64 module aida08  => 	7
> FEE64 module aida09  => 	7
> FEE64 module aida10  => 	7
> FEE64 module aida11  => 	7
> FEE64 module aida12  => 	7
>
>
> ASIC Clock Timestamp check test result: Passed 12, Failed 0
>
>
>  If any of the above values are different from the rest then check the clocks and the White Rabbit decoder status
>
>
>
>
>  aida01 timestamp memory	No stop found : 0x0
> 0		0	0	0	0
> 4		0	0	0	0
> 8		0	0	0	0
> 12		0	0	0	0
> 16		0	0	0	0
> 20		0	0	0	0
> 24		0	0	0	0
> 28		0	0	0	0
>
>  aida02 timestamp memory	No stop found : 0x0
> 0		0	0	0	0
> 4		0	0	0	0
> 8		0	0	0	0
> 12		0	0	0	0
> 16		0	0	0	0
> 20		0	0	0	0
> 24		0	0	0	0
> 28		0	0	0	0
>
>  aida03 timestamp memory	No stop found : 0x0
> 0		0	0	0	0
> 4		0	0	0	0
> 8		0	0	0	0
> 12		0	0	0	0
> 16		0	0	0	0
> 20		0	0	0	0
> 24		0	0	0	0
> 28		0	0	0	0
>
>  aida04 timestamp memory	No stop found : 0x0
> 0		0	0	0	0
> 4		0	0	0	0
> 8		0	0	0	0
> 12		0	0	0	0
> 16		0	0	0	0
> 20		0	0	0	0
> 24		0	0	0	0
> 28		0	0	0	0
>
>  aida05 timestamp memory	No stop found : 0x0
> 0		0	0	0	0
> 4		0	0	0	0
> 8		0	0	0	0
> 12		0	0	0	0
> 16		0	0	0	0
> 20		0	0	0	0
> 24		0	0	0	0
> 28		0	0	0	0
>
>  aida06 timestamp memory	No stop found : 0x0
> 0		0	0	0	0
> 4		0	0	0	0
> 8		0	0	0	0
> 12		0	0	0	0
> 16		0	0	0	0
> 20		0	0	0	0
> 24		0	0	0	0
> 28		0	0	0	0
>
>  aida07 timestamp memory	No stop found : 0x0
> 0		0	0	0	0
> 4		0	0	0	0
> 8		0	0	0	0
> 12		0	0	0	0
> 16		0	0	0	0
> 20		0	0	0	0
> 24		0	0	0	0
> 28		0	0	0	0
>
>  aida08 timestamp memory	No stop found : 0x0
> 0		0	0	0	0
> 4		0	0	0	0
> 8		0	0	0	0
> 12		0	0	0	0
> 16		0	0	0	0
> 20		0	0	0	0
> 24		0	0	0	0
> 28		0	0	0	0
>
>  aida09 timestamp memory	No stop found : 0x0
> 0		0	0	0	0
> 4		0	0	0	0
> 8		0	0	0	0
> 12		0	0	0	0
> 16		0	0	0	0
> 20		0	0	0	0
> 24		0	0	0	0
> 28		0	0	0	0
>
>  aida10 timestamp memory	No stop found : 0x0
> 0		0	0	0	0
> 4		0	0	0	0
> 8		0	0	0	0
> 12		0	0	0	0
> 16		0	0	0	0
> 20		0	0	0	0
> 24		0	0	0	0
> 28		0	0	0	0
>
>  aida11 timestamp memory	No stop found : 0x0
> 0		0	0	0	0
> 4		0	0	0	0
> 8		0	0	0	0
> 12		0	0	0	0
> 16		0	0	0	0
> 20		0	0	0	0
> 24		0	0	0	0
> 28		0	0	0	0
>
>  aida12 timestamp memory	No stop found : 0x0
> 0		0	0	0	0
> 4		0	0	0	0
> 8		0	0	0	0
> 12		0	0	0	0
> 16		0	0	0	0
> 20		0	0	0	0
> 24		0	0	0	0
> 28		0	0	0	0
>
> 17.14 rate spectra - attachment 1
>
>       1.8.L spectra - attachments 2 & 3
>       pulser peak width aida06 c.75 ch FWHM, aida07  c.85 ch FWHM
>
>       1.8.W spectra - attachments 4 & 5
>
>       good events statistics (slow comparator 0xa) - attachment 6
>
>       FEE64 temperatures OK - attachment 7
>
>       DSSSD bias & leakage currents OK - attachment 8
>
>
>
>
> 17.38 DAQ starts file NULL/R14
>       slow comparator 0xa -> 0x64
>       BNC PB-5 pulser OFF
>       alpha background
>
> 10:40 CET 14.04.2021 - NH
> Close file NULL/R14 |
|
218
|
Tue Apr 13 16:49:41 2021 |
TD | Tuesday 13 April |
Rename Options directory

mv Options Options.BAK-130421

Copy Options.PRISTINE to Options

cp -r Options.PRISTINE Options
chmod -R 777 Options

Start Options directory monitor (will check directory every 5 minutes)

Python ~/oh/OptionsCheck


17.32 Power cycle FEE64s


FEE64 module aida09 global clocks failed, 6
 Clock status test result: Passed 11, Failed 1

Understand status as follows
Status bit 3 : firmware PLL that creates clocks from external clock not locked
Status bit 2 : always logic '1'
Status bit 1 : LMK3200(2) PLL and clock distribution chip not locked to external clock
Status bit 0 : LMK3200(1) PLL and clock distribution chip not locked to external clock
If all these bits are not set then the operation of the firmware is unreliable

Calibration test result: Passed 12, Failed 0

If any modules fail calibration , check the clock status and open the FADC Align and Control browser page to rerun calibration for that module

White Rabbit error counter test result: Passed 12, Failed 0

Understand the status reports as follows:-
Status bit 3 : White Rabbit decoder detected an error in the received data
Status bit 2 : Firmware registered WR error, no reload of Timestamp
Status bit 0 : White Rabbit decoder reports uncertain of Timestamp information from WR


FPGA Timestamp error counter test result: Passed 12, Failed 0
If any of these counts are reported as in error
The ASIC readout system has detected a timeslip.
That is the timestamp read from the time FIFO is not younger than the last


Returned 0 0 0 0 0 0 0 0 0 0 0 0
Mem(KB) :	4	8	16	32	64	128	256	512	1k	2k	4k
aida01 :      3      5      2      2      1      3      3      2      2      3      8   : 43348
aida02 :      2      3      0      2      1      2      2      3      2      3      8   : 43424
aida03 :      3      4      0      1      1      2      2      3      2      3      8   : 43404
aida04 :      1      4      2      0      3      3      3      2      2      3      8   : 43396
aida05 :      1      4      2      2      2      3      3      2      2      3      8   : 43396
aida06 :      2      3      2      1      1      2      2      3      2      3      8   : 43424
aida07 :      4      1      3      3      1      3      1      3      2      3      8   : 43368
aida08 :      1      4      2      2      2      3      3      2      2      3      8   : 43396
aida09 :      2      3      3      3      2      4      2      2      2      3      8   : 43312
aida10 :      1      3      1      2      2      3      2      2      2      3      8   : 43116
aida11 :      1      3      3      1      2      3      2      2      2      3      8   : 43116
aida12 :      3      2      1      0      1      2      1      3      2      3      8   : 43116


Note that system wide checks identify 1x file of different size immediately after boot/reset/setup

 Collecting the file size of each FEE64 Options CONTENTS file to check they are all the same

 FEE : aida01 =>   Options file size is 1014 	 Last changed Tue Apr 13 17:59:03 CEST 2021
 FEE : aida02 =>   Options file size is 1025 	 Last changed Tue Apr 13 17:59:04 CEST 2021
 FEE : aida03 =>   Options file size is 1014 	 Last changed Tue Apr 13 17:59:03 CEST 2021
 FEE : aida04 =>   Options file size is 1014 	 Last changed Tue Apr 13 17:59:03 CEST 2021
 FEE : aida05 =>   Options file size is 1014 	 Last changed Tue Apr 13 17:59:04 CEST 2021
 FEE : aida06 =>   Options file size is 1014 	 Last changed Tue Apr 13 17:59:03 CEST 2021
 FEE : aida07 =>   Options file size is 1014 	 Last changed Tue Apr 13 17:59:03 CEST 2021
 FEE : aida08 =>   Options file size is 1014 	 Last changed Tue Apr 13 17:59:03 CEST 2021
 FEE : aida09 =>   Options file size is 1014 	 Last changed Tue Apr 13 17:59:03 CEST 2021
 FEE : aida10 =>   Options file size is 1014 	 Last changed Tue Apr 13 17:59:04 CEST 2021
 FEE : aida11 =>   Options file size is 1014 	 Last changed Tue Apr 13 17:59:03 CEST 2021
 FEE : aida12 =>   Options file size is 1014 	 Last changed Tue Apr 13 17:59:05 CEST 2021

06:25:00 PM
FAULTS!

Unknown option in FEE2 Options database
Unknown entry starts:
da_Hist_W_Enable&&TS_SYNC_PHASE&&ExtClk&&Aida.shift&&MACB_TRIG_MODE&&Aida.offset&&RunNumber&&Aida_GroupBase&&Rate.channels&&Stat.channels&&Aida.Vchannels&&ASIC.settings&&WAVE_DMA_HWM&&Ai
da_Hist_D_Enable&&Stat.shift&&Aida.Wchannels&&Aida_Hist_V_Enable&&Include.Aida&&Aida.channels&&DataAcqPgm&&Aida_Hist_H_Enable&&DataFormat&&ASIC_DMA_HWM&&Aida_Hist_L_Enable

06:30:00 PM
FAULTS!

Unknown option in FEE2 Options database
Unknown entry starts:
da_Hist_W_Enable&&TS_SYNC_PHASE&&ExtClk&&Aida.shift&&MACB_TRIG_MODE&&Aida.offset&&RunNumber&&Aida_GroupBase&&Rate.channels&&Stat.channels&&Aida.Vchannels&&ASIC.settings&&WAVE_DMA_HWM&&Ai
da_Hist_D_Enable&&Stat.shift&&Aida.Wchannels&&Aida_Hist_V_Enable&&Include.Aida&&Aida.channels&&DataAcqPgm&&Aida_Hist_H_Enable&&DataFormat&&ASIC_DMA_HWM&&Aida_Hist_L_Enable

Unknown option in FEE2 Options database
Unknown entry starts:
et&&Aida_Hist_W_Enable&&TS_SYNC_PHASE&&ExtClk&&Aida.shift&&MACB_TRIG_MODE&&Aida.offset&&RunNumber&&Aida_GroupBase&&Rate.channels&&Stat.channels&&Aida.Vchannels&&ASIC.settings&&WAVE_DMA_H
WM&&Aida_Hist_D_Enable&&Stat.shift&&Aida.Wchannels&&Aida_Hist_V_Enable&&Include.Aida&&Aida.channels&&DataAcqPgm&&Aida_Hist_H_Enable&&DataFormat&&ASIC_DMA_HWM&&Aida_Hist_L_Enable


FEE64 module aida01  => 	7
FEE64 module aida02  => 	7
FEE64 module aida03  => 	7
FEE64 module aida04  => 	7
FEE64 module aida05  => 	7
FEE64 module aida06  => 	7
FEE64 module aida07  => 	7
FEE64 module aida08  => 	7
FEE64 module aida09  => 	7
FEE64 module aida10  => 	7
FEE64 module aida11  => 	7
FEE64 module aida12  => 	7


ASIC Clock Timestamp check test result: Passed 12, Failed 0


 If any of the above values are different from the rest then check the clocks and the White Rabbit decoder status


 aida01 timestamp memory	No stop found : 0x0
0		0	0	0	0
4		0	0	0	0
8		0	0	0	0
12		0	0	0	0
16		0	0	0	0
20		0	0	0	0
24		0	0	0	0
28		0	0	0	0

 aida02 timestamp memory	No stop found : 0x0
0		0	0	0	0
4		0	0	0	0
8		0	0	0	0
12		0	0	0	0
16		0	0	0	0
20		0	0	0	0
24		0	0	0	0
28		0	0	0	0

 aida03 timestamp memory	No stop found : 0x0
0		0	0	0	0
4		0	0	0	0
8		0	0	0	0
12		0	0	0	0
16		0	0	0	0
20		0	0	0	0
24		0	0	0	0
28		0	0	0	0

 aida04 timestamp memory	No stop found : 0x0
0		0	0	0	0
4		0	0	0	0
8		0	0	0	0
12		0	0	0	0
16		0	0	0	0
20		0	0	0	0
24		0	0	0	0
28		0	0	0	0

 aida05 timestamp memory	No stop found : 0x0
0		0	0	0	0
4		0	0	0	0
8		0	0	0	0
12		0	0	0	0
16		0	0	0	0
20		0	0	0	0
24		0	0	0	0
28		0	0	0	0

 aida06 timestamp memory	No stop found : 0x0
0		0	0	0	0
4		0	0	0	0
8		0	0	0	0
12		0	0	0	0
16		0	0	0	0
20		0	0	0	0
24		0	0	0	0
28		0	0	0	0

 aida07 timestamp memory	No stop found : 0x0
0		0	0	0	0
4		0	0	0	0
8		0	0	0	0
12		0	0	0	0
16		0	0	0	0
20		0	0	0	0
24		0	0	0	0
28		0	0	0	0

 aida08 timestamp memory	No stop found : 0x0
0		0	0	0	0
4		0	0	0	0
8		0	0	0	0
12		0	0	0	0
16		0	0	0	0
20		0	0	0	0
24		0	0	0	0
28		0	0	0	0

 aida09 timestamp memory	No stop found : 0x0
0		0	0	0	0
4		0	0	0	0
8		0	0	0	0
12		0	0	0	0
16		0	0	0	0
20		0	0	0	0
24		0	0	0	0
28		0	0	0	0

 aida10 timestamp memory	No stop found : 0x0
0		0	0	0	0
4		0	0	0	0
8		0	0	0	0
12		0	0	0	0
16		0	0	0	0
20		0	0	0	0
24		0	0	0	0
28		0	0	0	0

 aida11 timestamp memory	No stop found : 0x0
0		0	0	0	0
4		0	0	0	0
8		0	0	0	0
12		0	0	0	0
16		0	0	0	0
20		0	0	0	0
24		0	0	0	0
28		0	0	0	0

 aida12 timestamp memory	No stop found : 0x0
0		0	0	0	0
4		0	0	0	0
8		0	0	0	0
12		0	0	0	0
16		0	0	0	0
20		0	0	0	0
24		0	0	0	0
28		0	0	0	0

17.14 rate spectra - attachment 1

      1.8.L spectra - attachments 2 & 3
      pulser peak width aida06 c.75 ch FWHM, aida07  c.85 ch FWHM

      1.8.W spectra - attachments 4 & 5

      good events statistics (slow comparator 0xa) - attachment 6

      FEE64 temperatures OK - attachment 7

      DSSSD bias & leakage currents OK - attachment 8


17.38 DAQ starts file NULL/R14
      slow comparator 0xa -> 0x64
      BNC PB-5 pulser OFF
      alpha background

10:40 CET 14.04.2021 - NH
Close file NULL/R14 |
| Attachment 1: Screenshot_2021-04-13_Spectrum_Browser_aidas-gsi.png
|
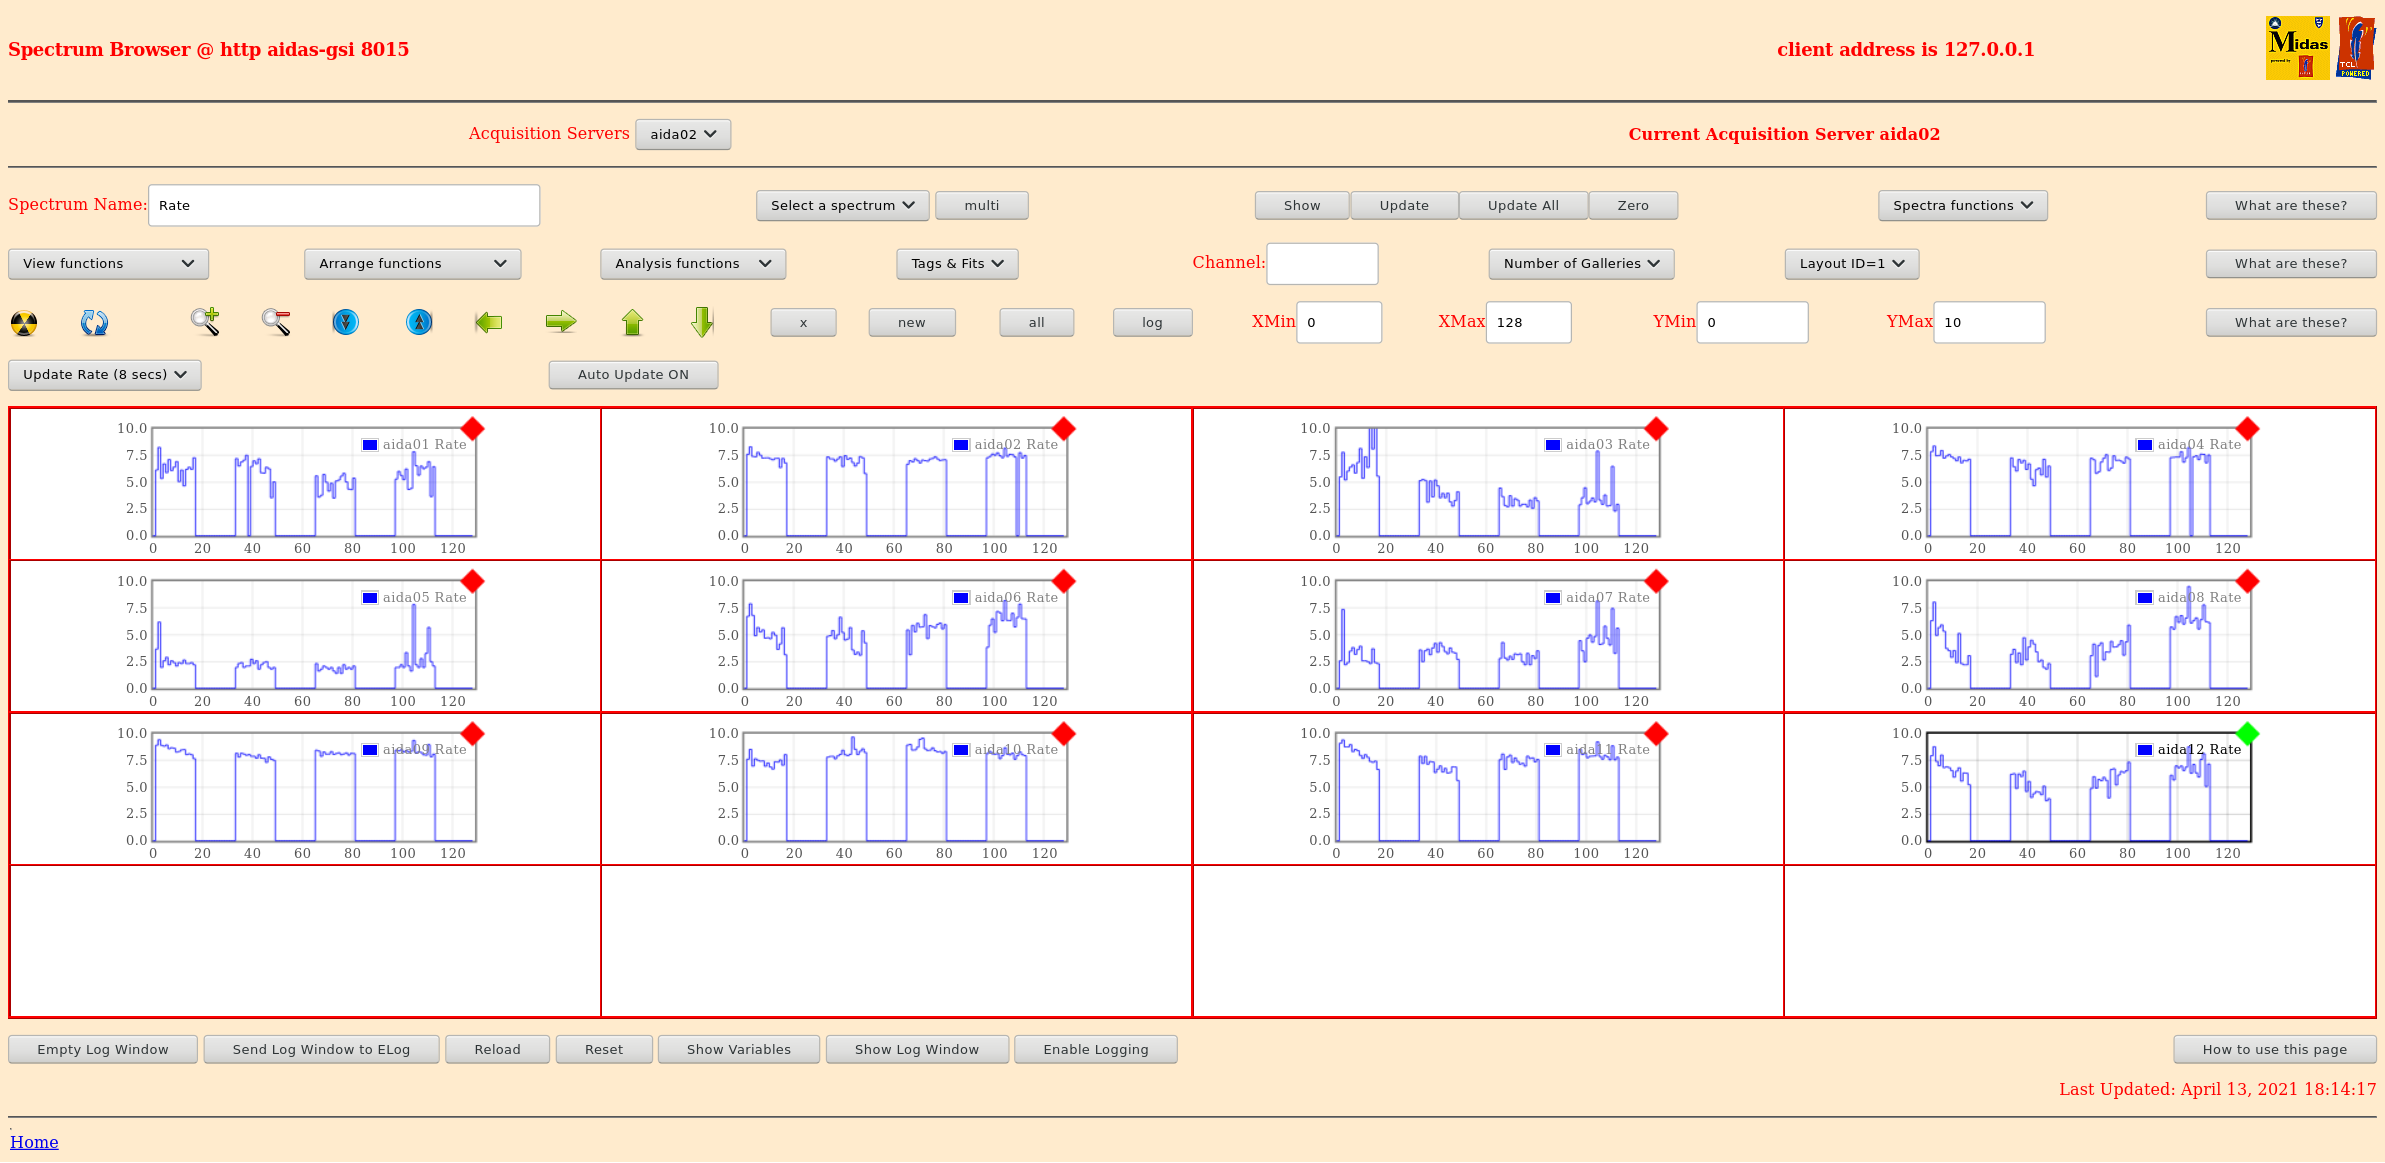
|
| Attachment 2: Screenshot_2021-04-13_Spectrum_Browser_aidas-gsi(1).png
|
.png.png)
|
| Attachment 3: Screenshot_2021-04-13_Spectrum_Browser_aidas-gsi(2).png
|
.png.png)
|
| Attachment 4: Screenshot_2021-04-13_Spectrum_Browser_aidas-gsi(3).png
|
.png.png)
|
| Attachment 5: Screenshot_2021-04-13_Spectrum_Browser_aidas-gsi(4).png
|
.png.png)
|
| Attachment 6: Screenshot_2021-04-13_Statistics_aidas-gsi.png
|

|
| Attachment 7: Screenshot_2021-04-13_Temperature_and_status_scan_aidas-gsi.png
|

|
| Attachment 8: 3.png
|

|