| ID |
Date |
Author |
Subject |
|
669
|
Wed Aug 14 12:40:11 2024 |
JB | Repaired DSSSD delivery 14.09.2024 |
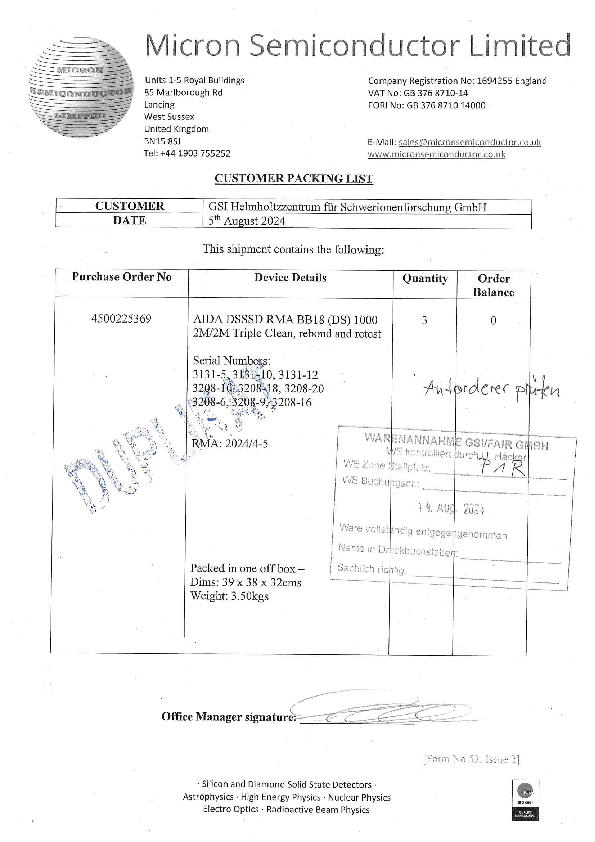
Three BB18-1000 triples AIDAs collected on 14.09.2024
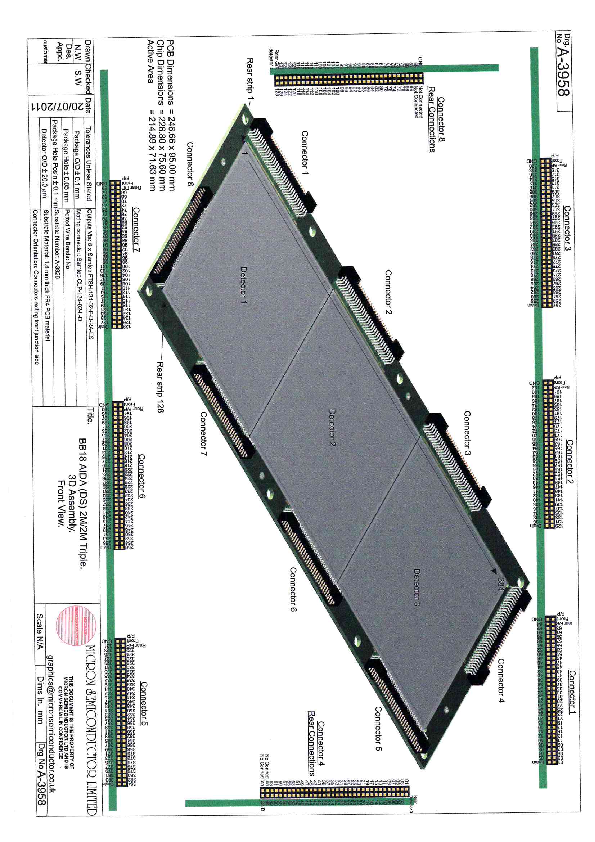
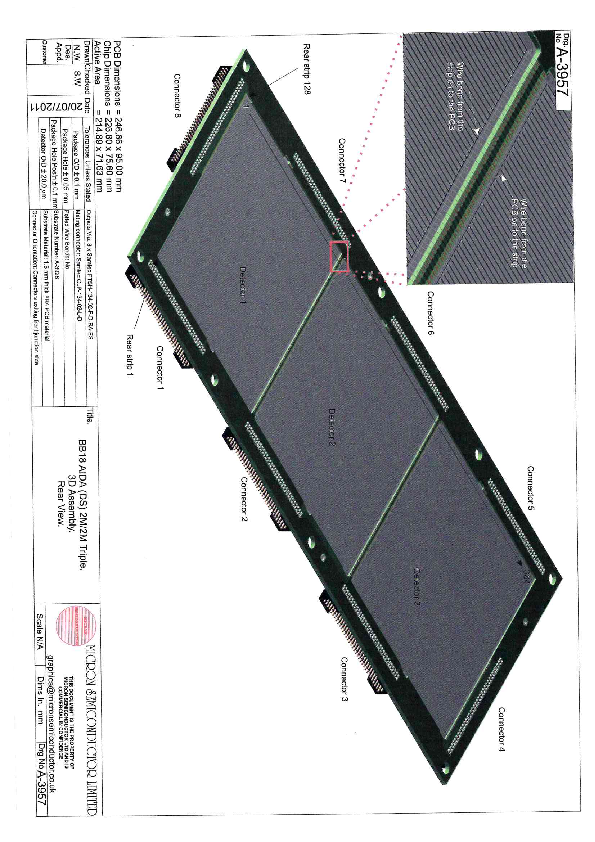
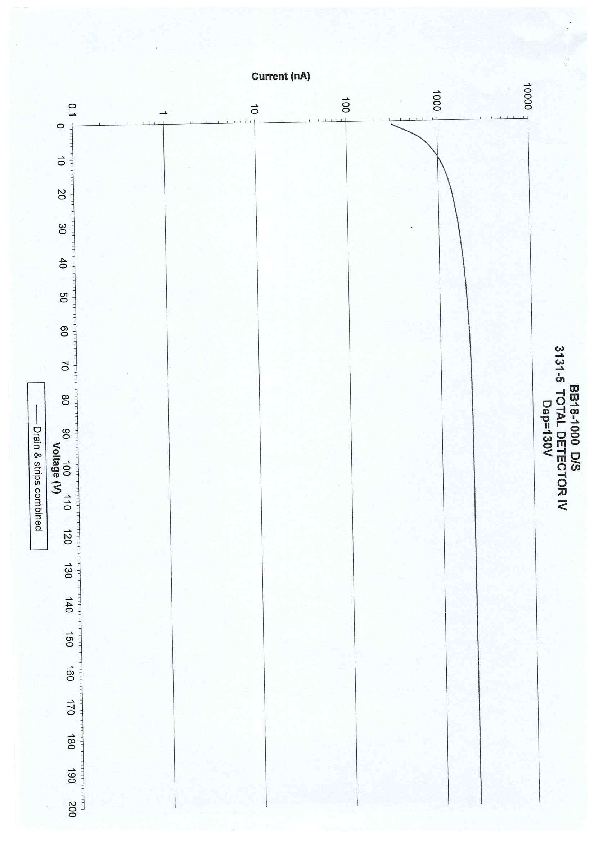
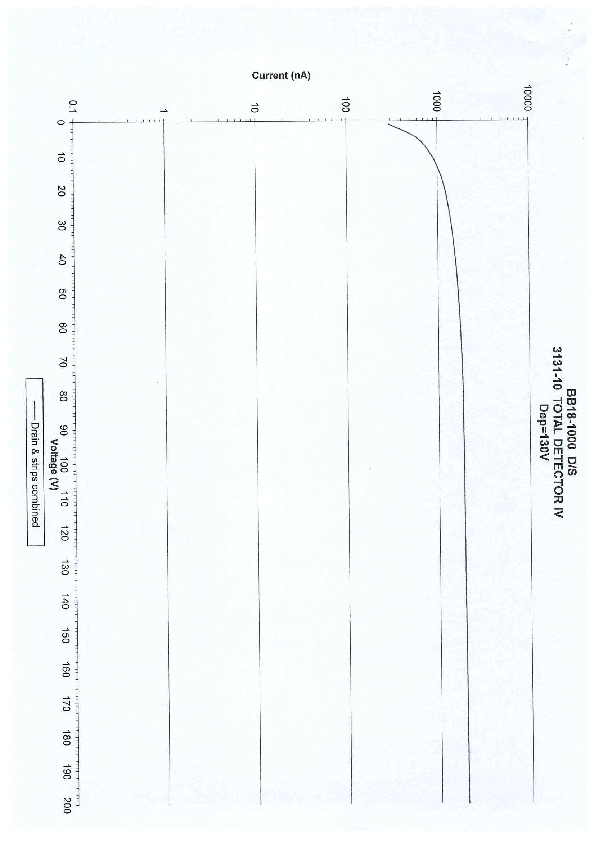
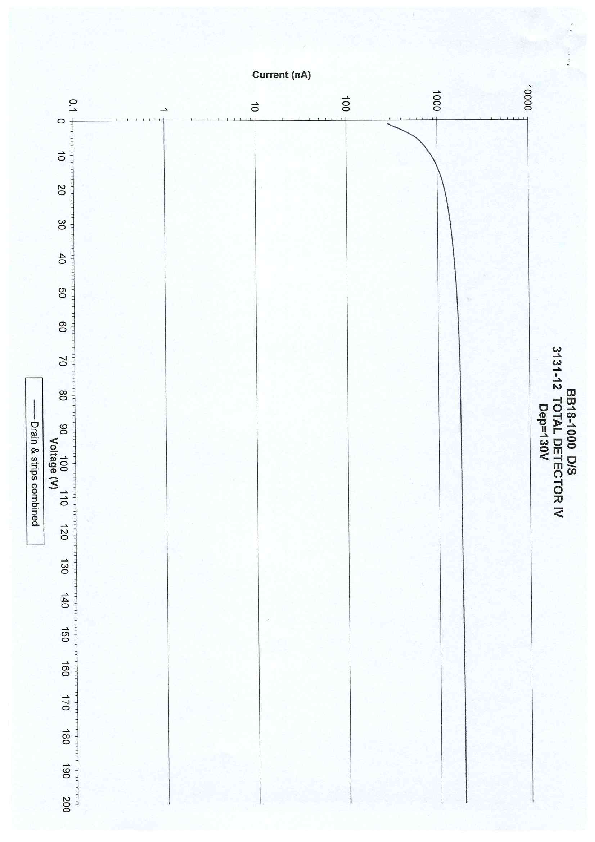
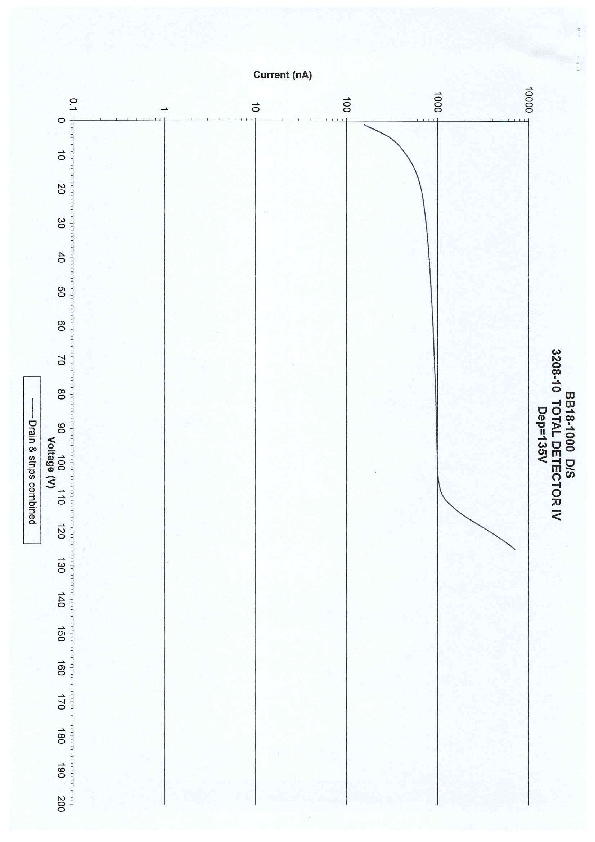
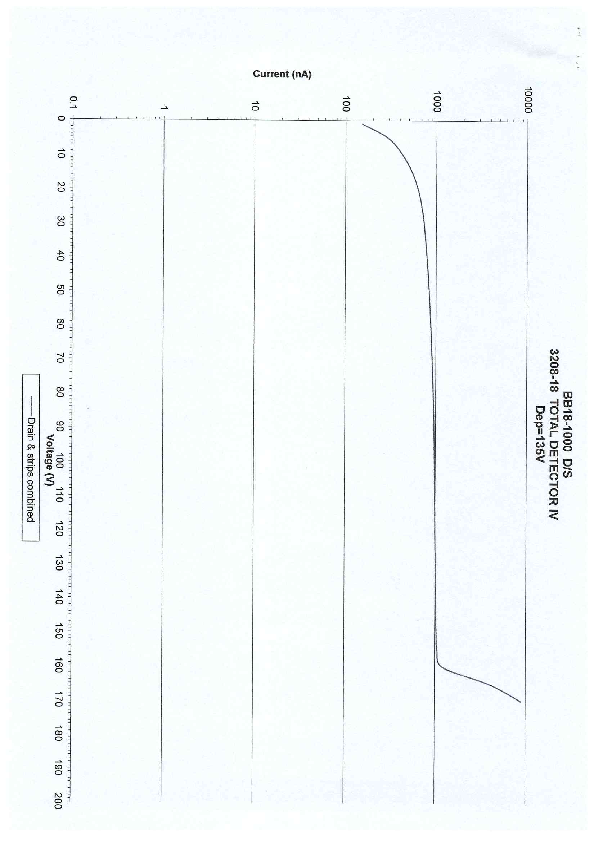
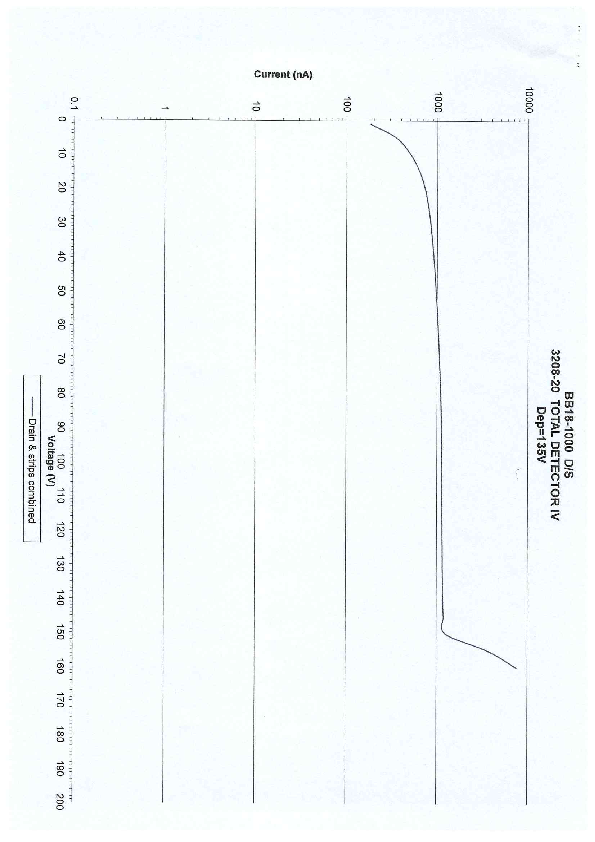
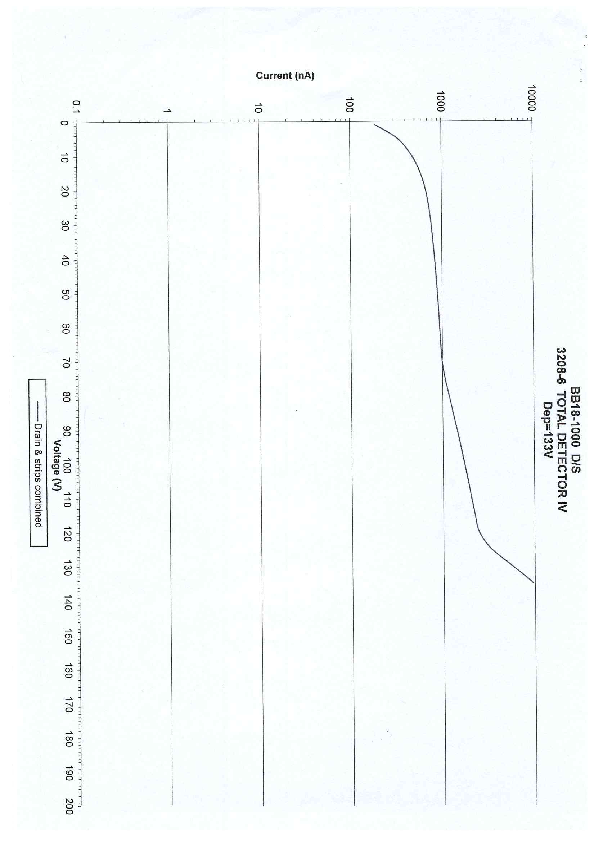
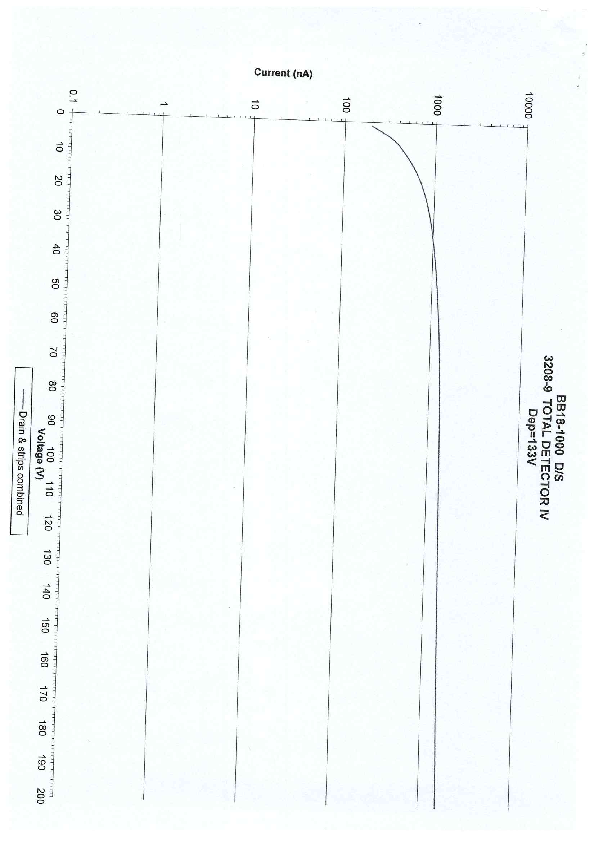
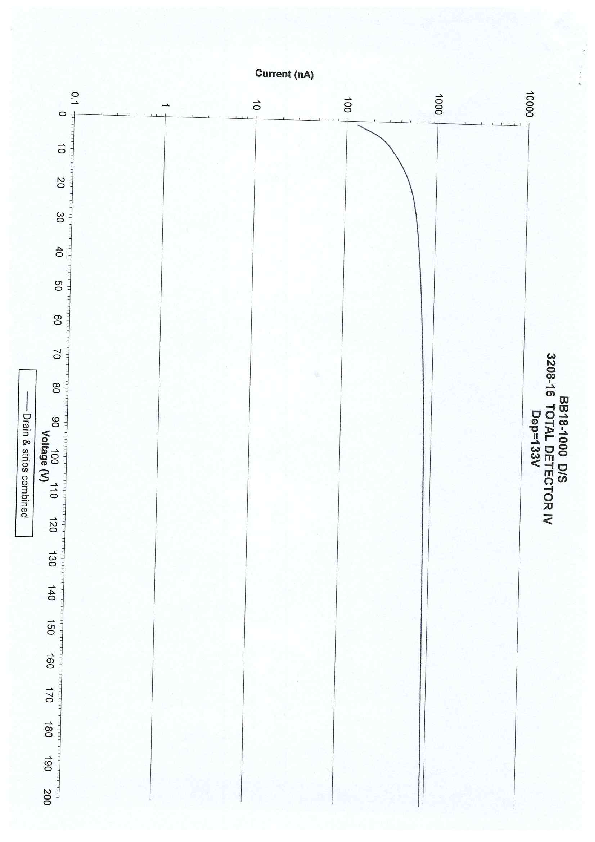
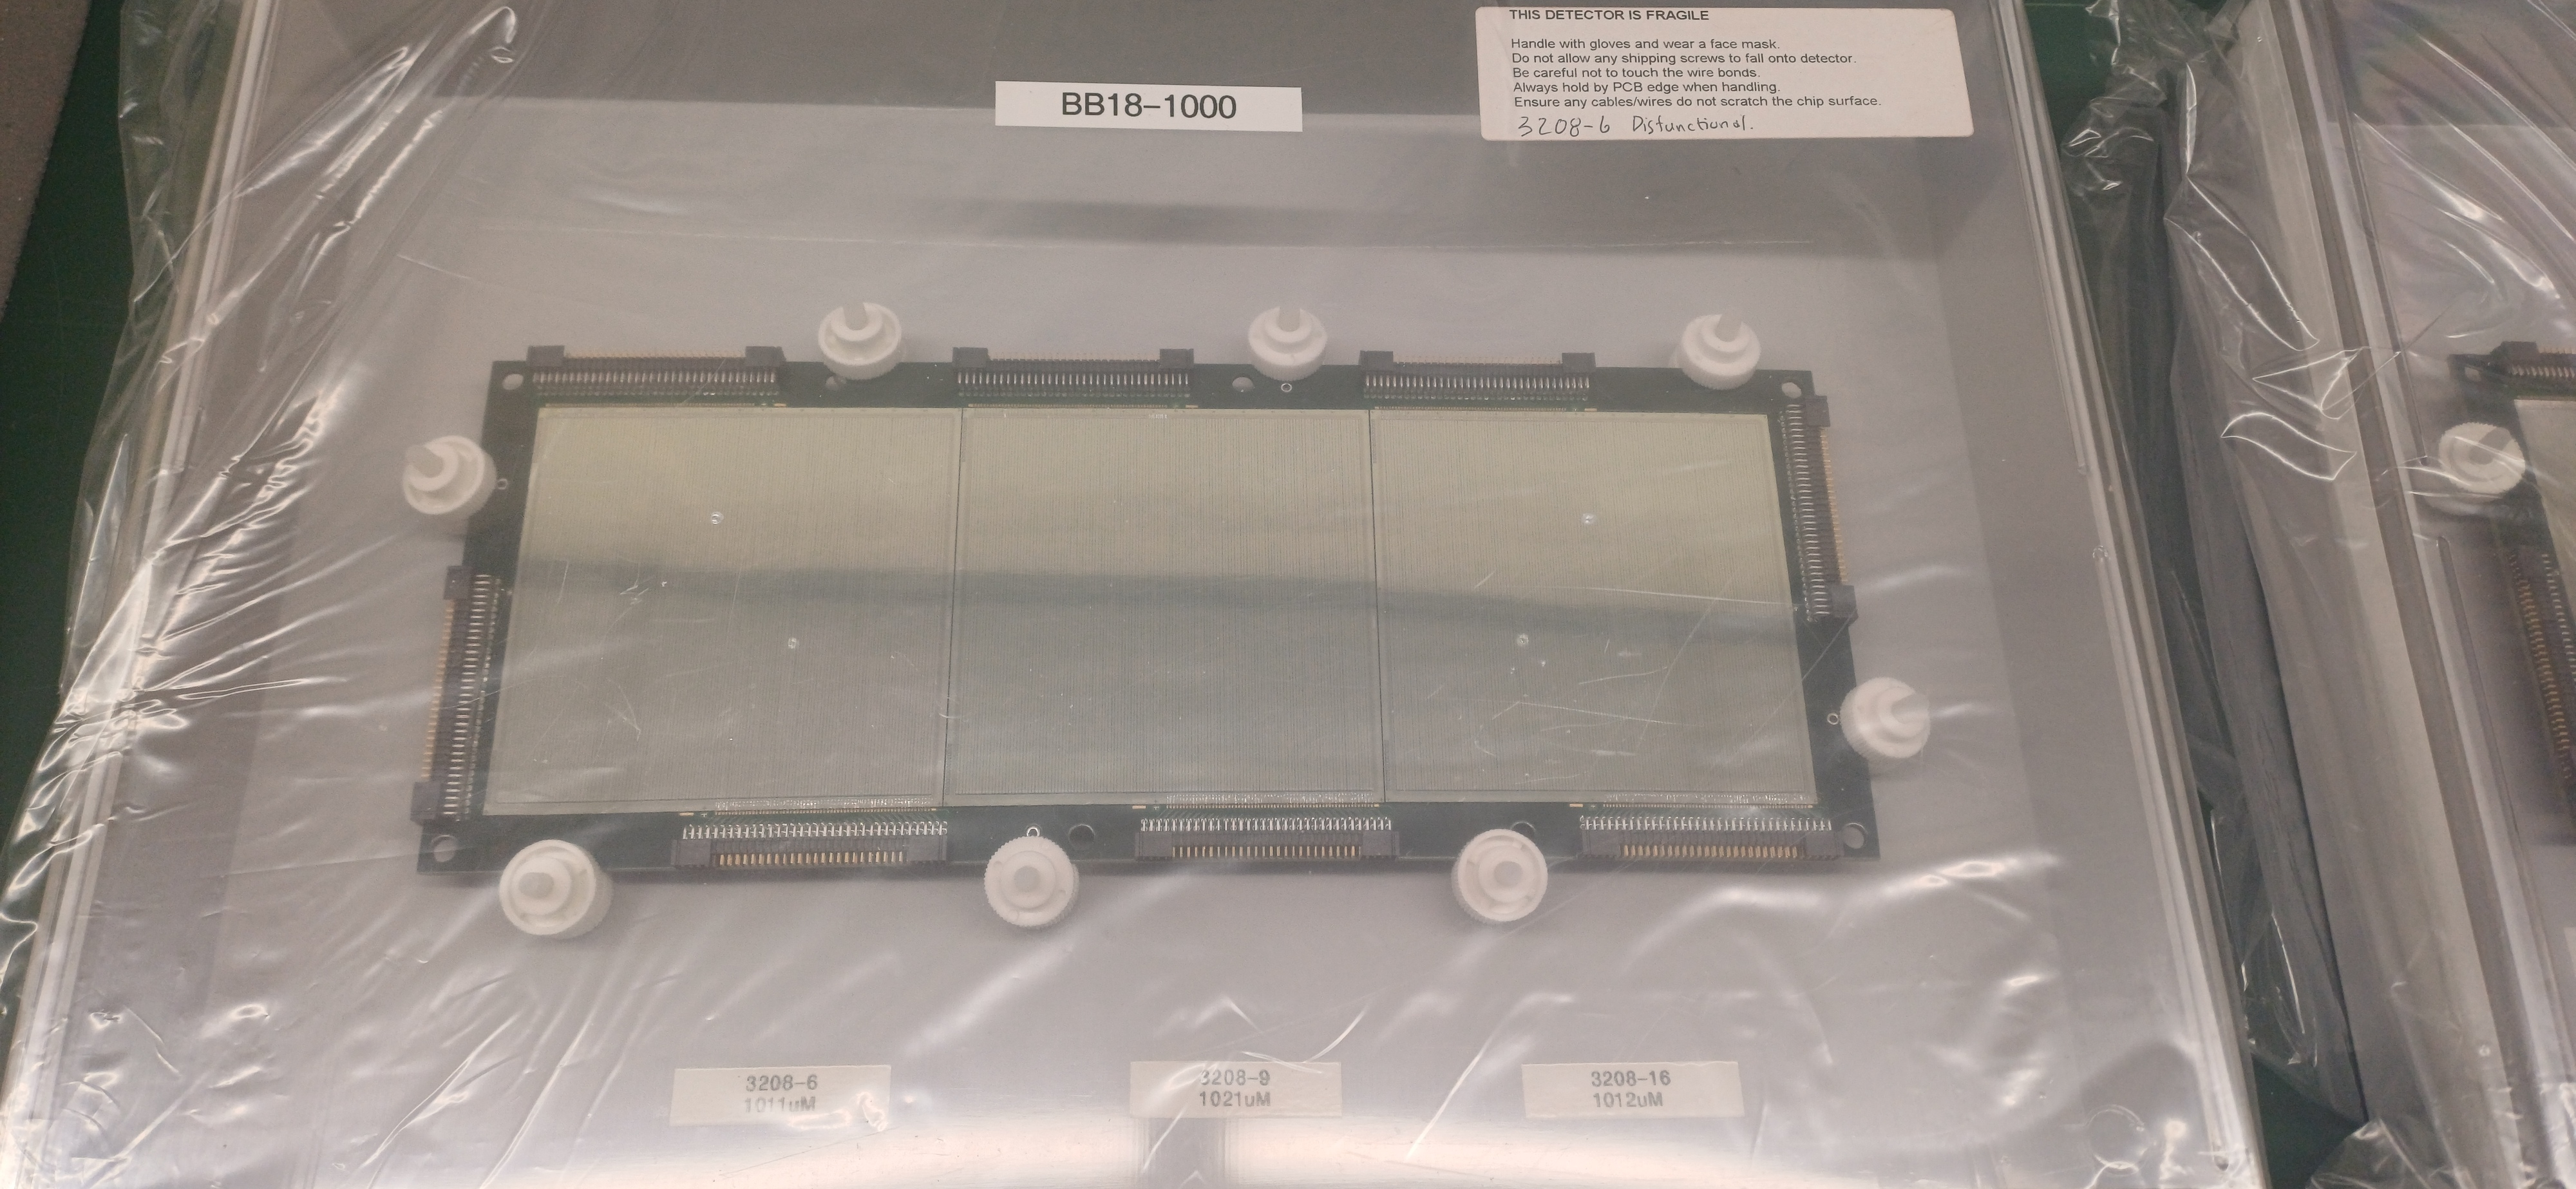
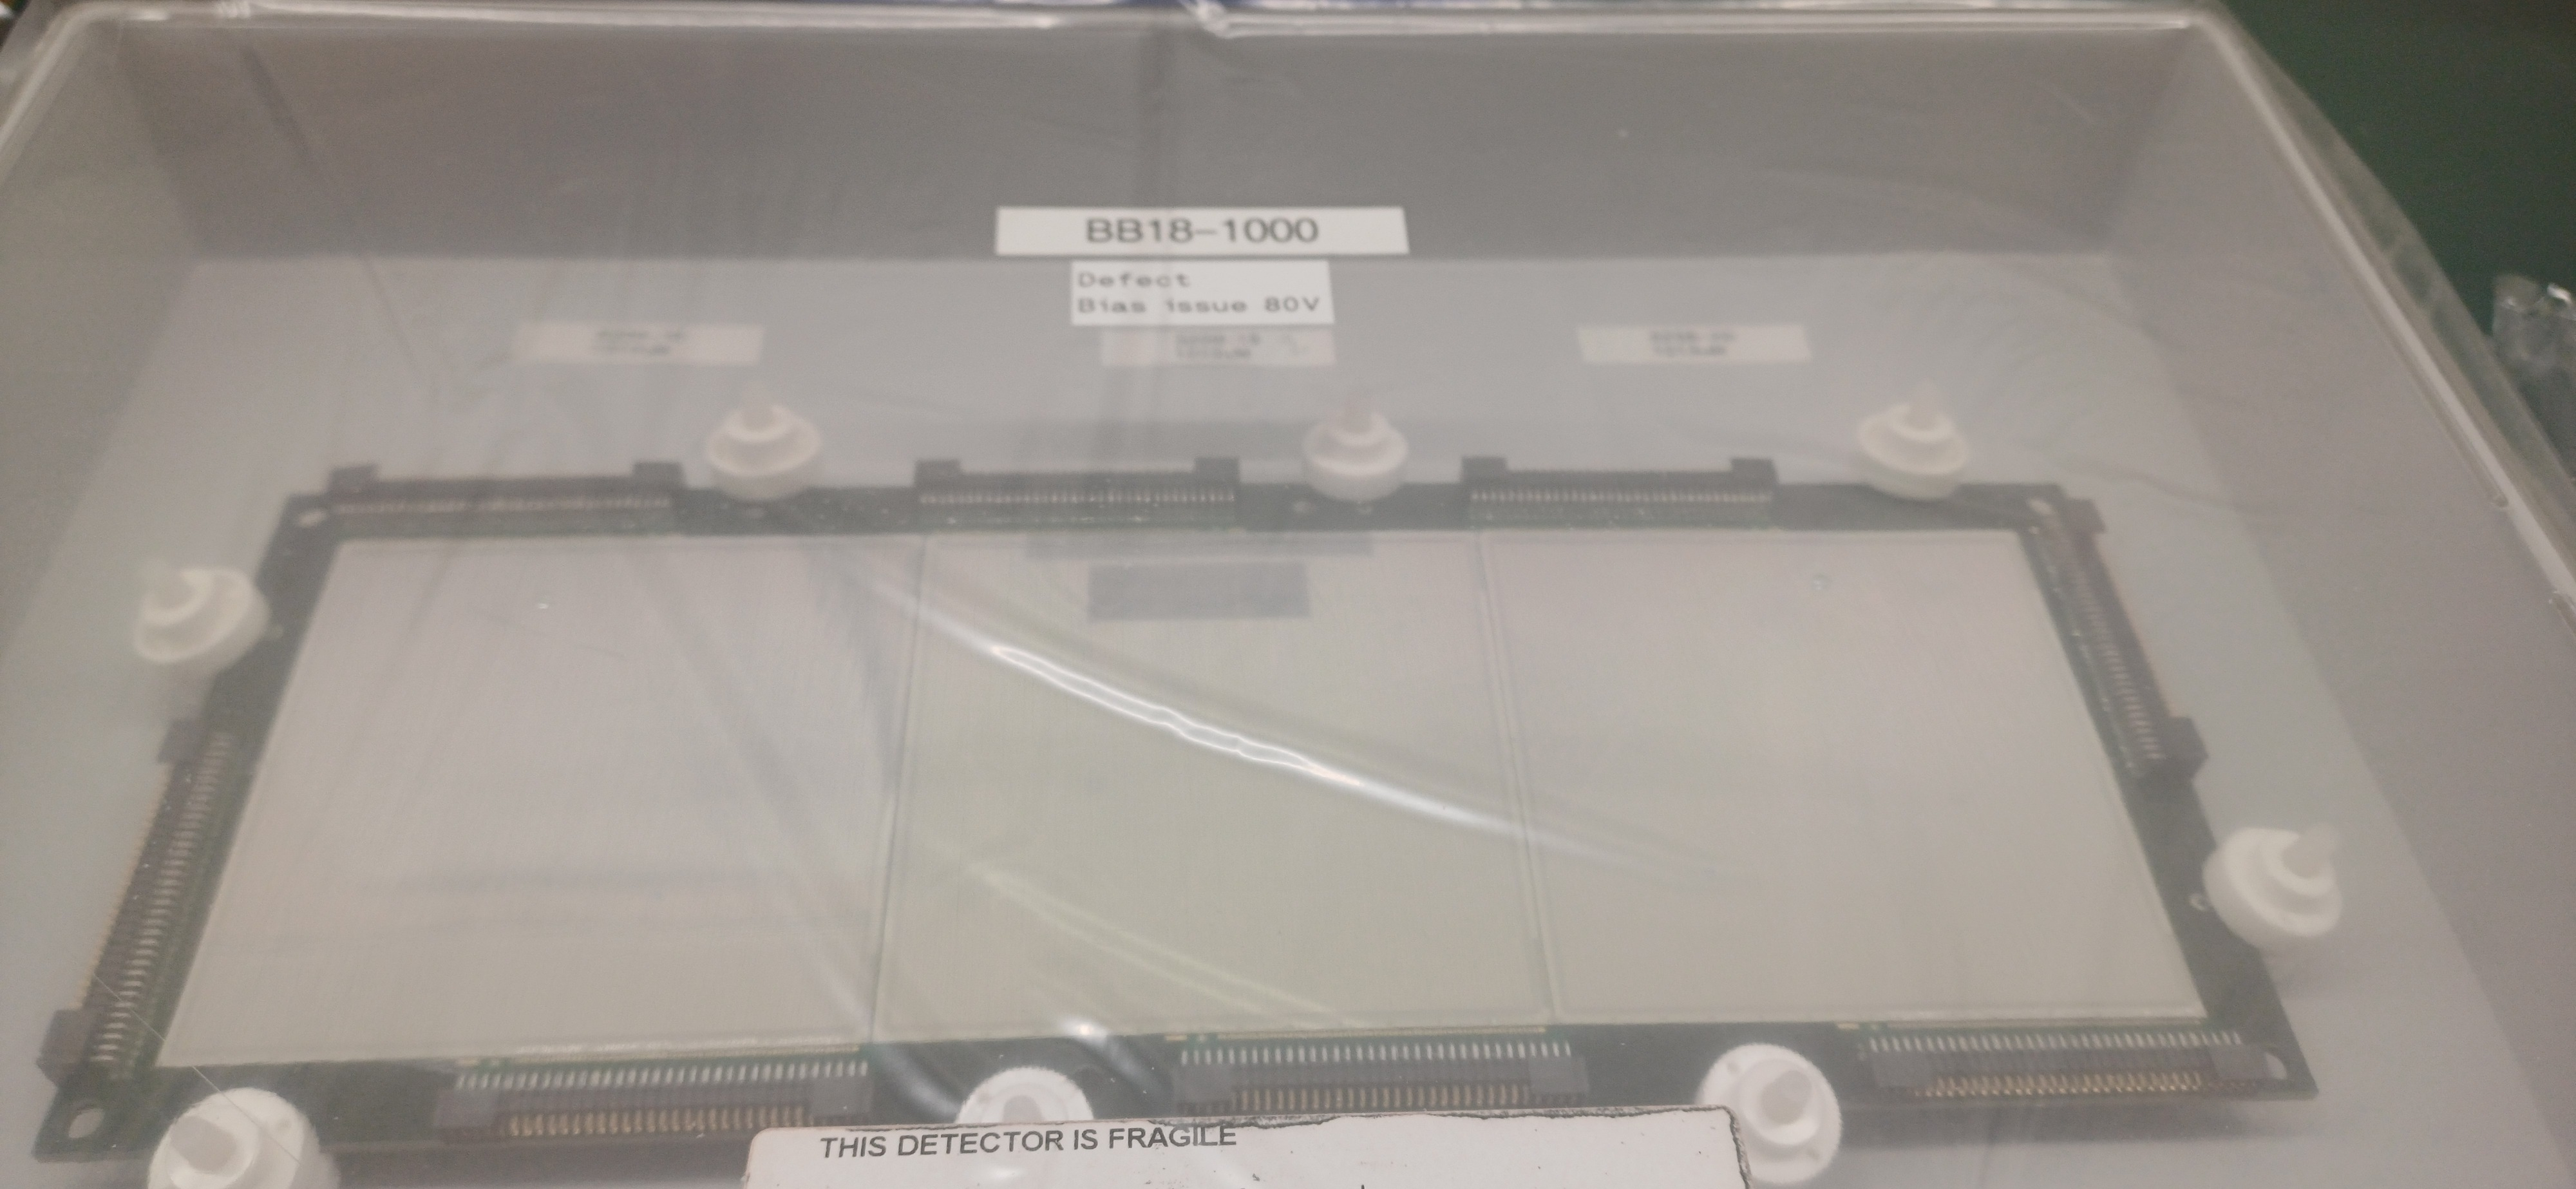
Find attached visual of the wafer and bond wire + factory bias tests accompanying the DSSSDs. elog:669/1 elog:669/2 elog:669/3
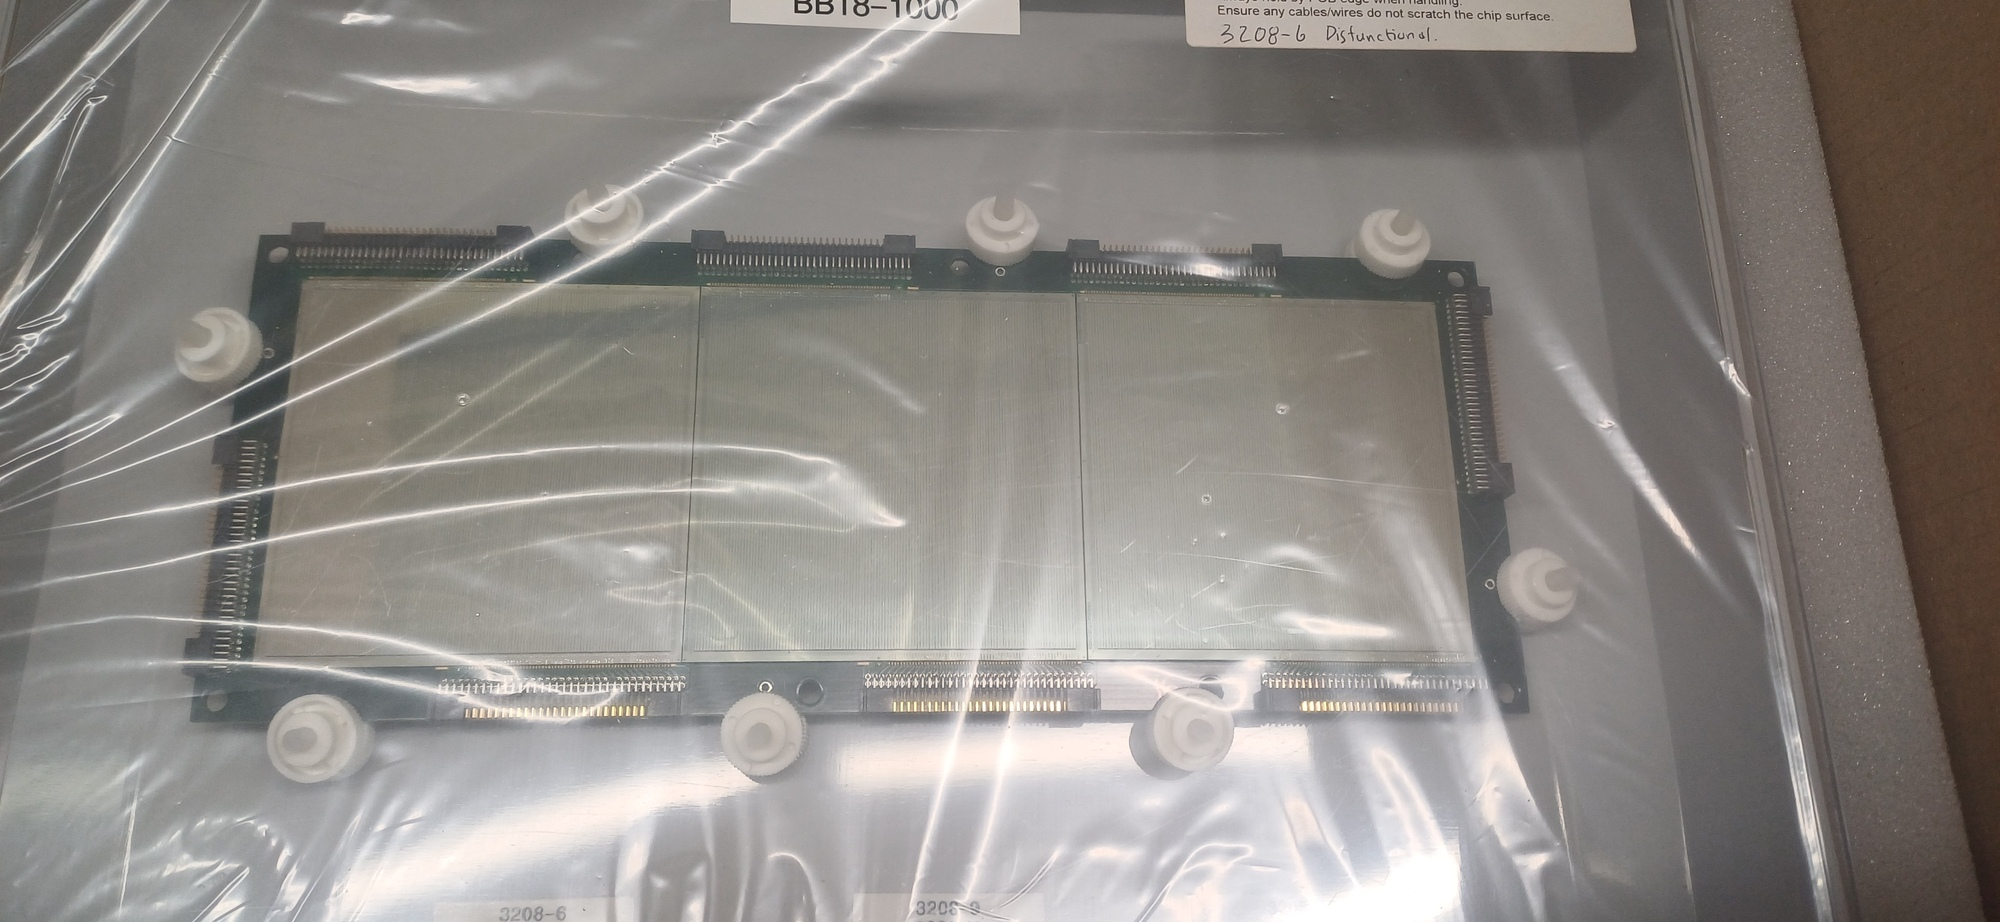
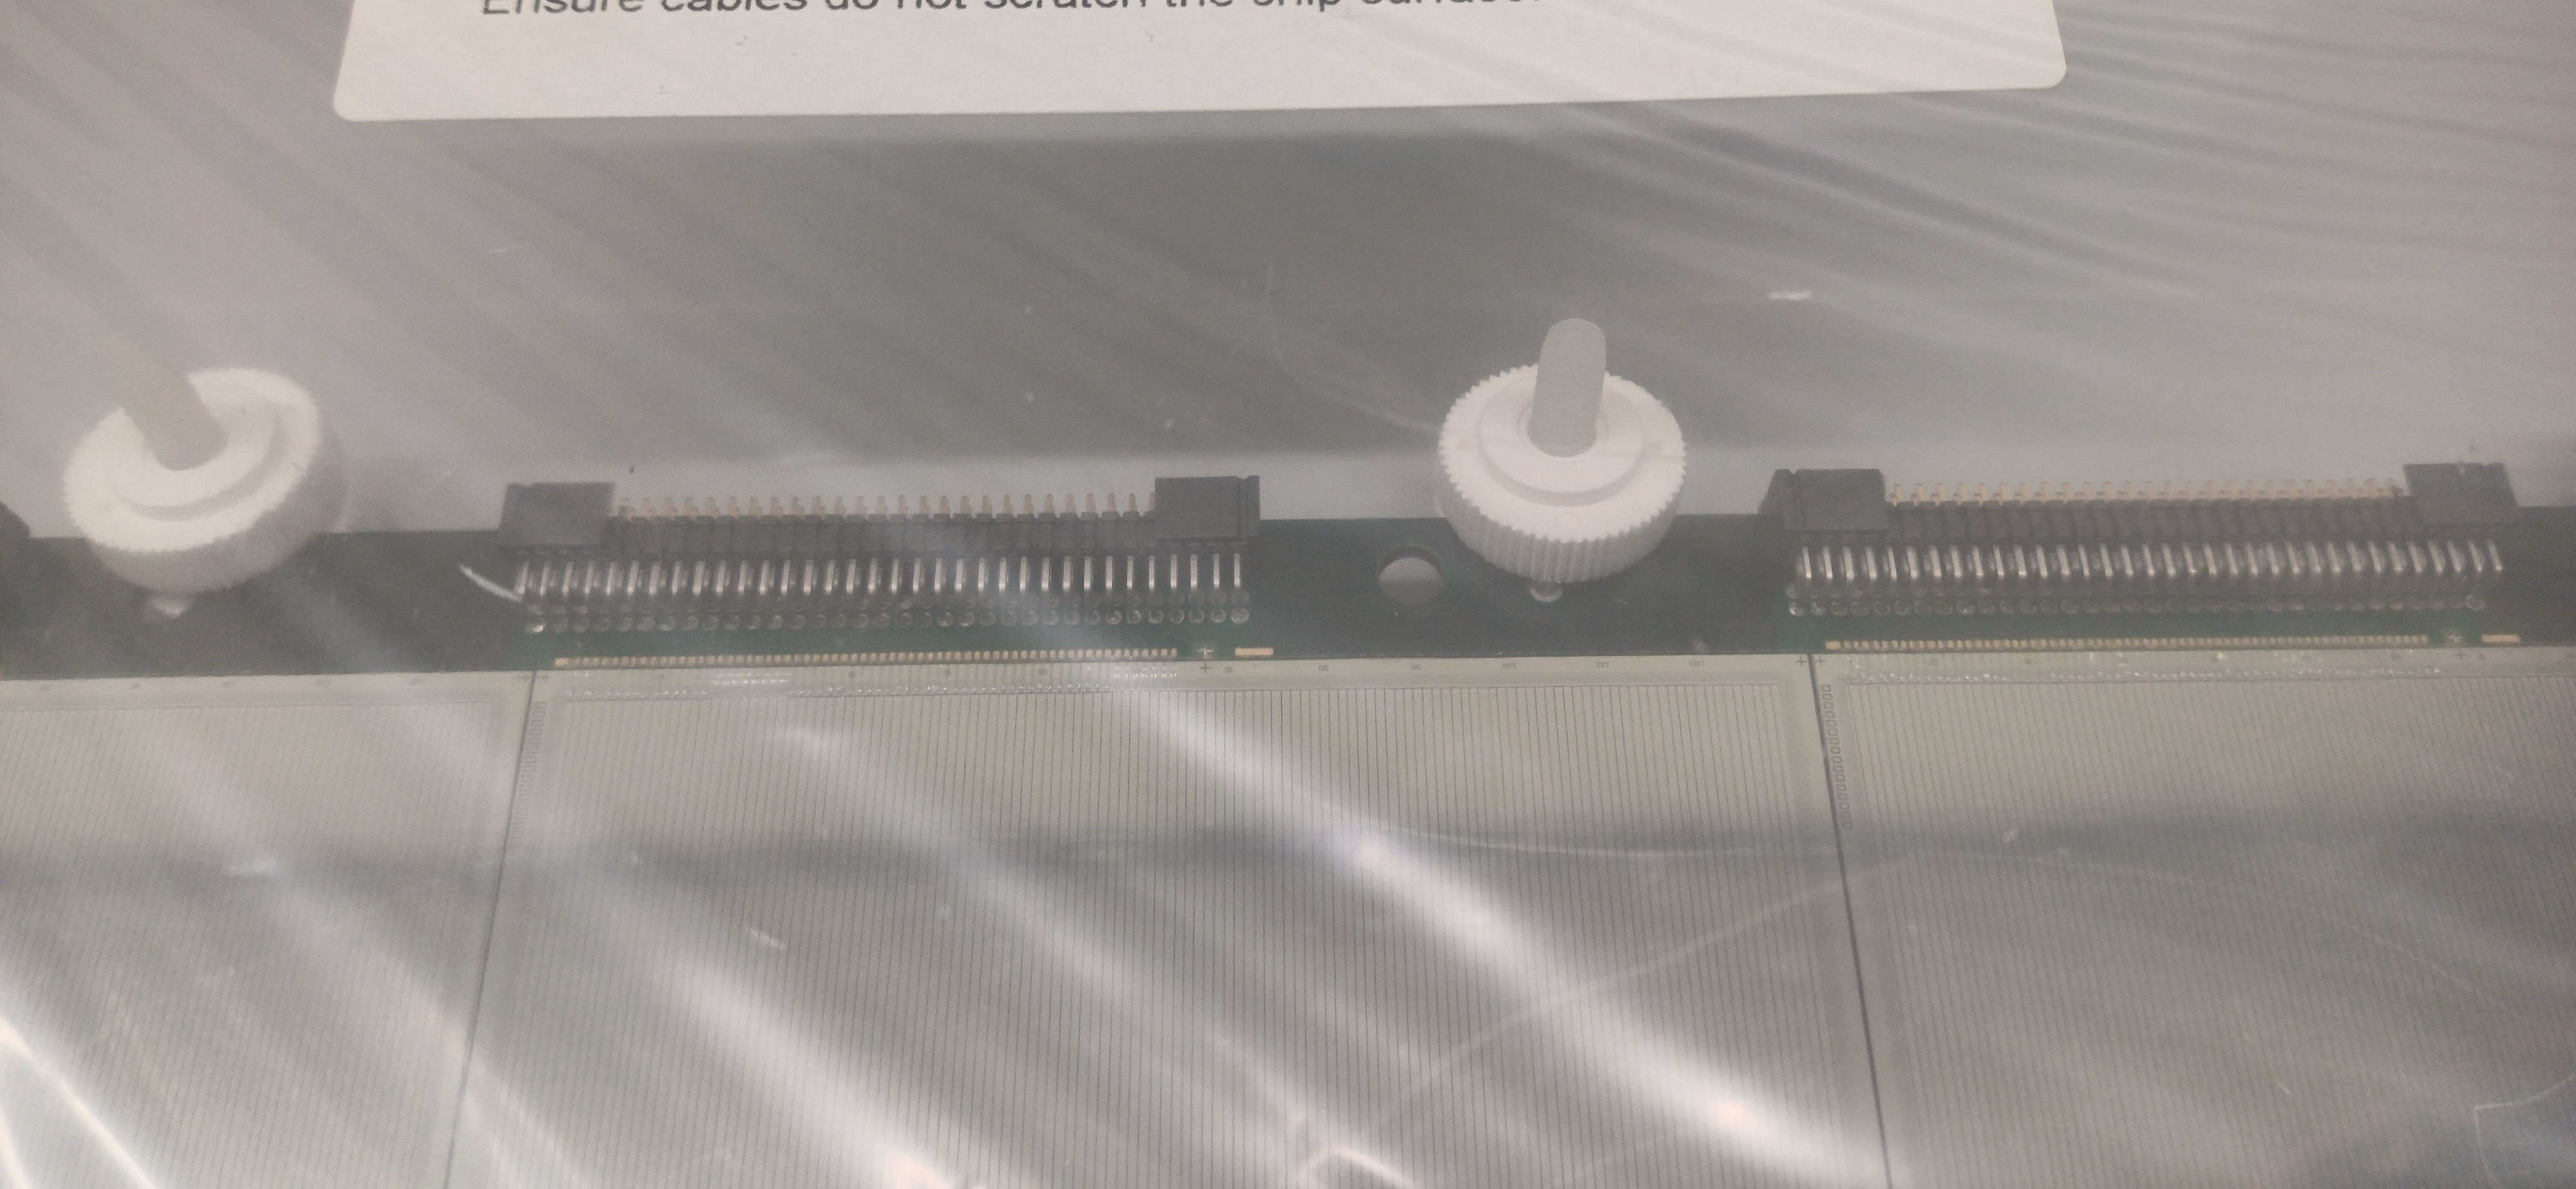
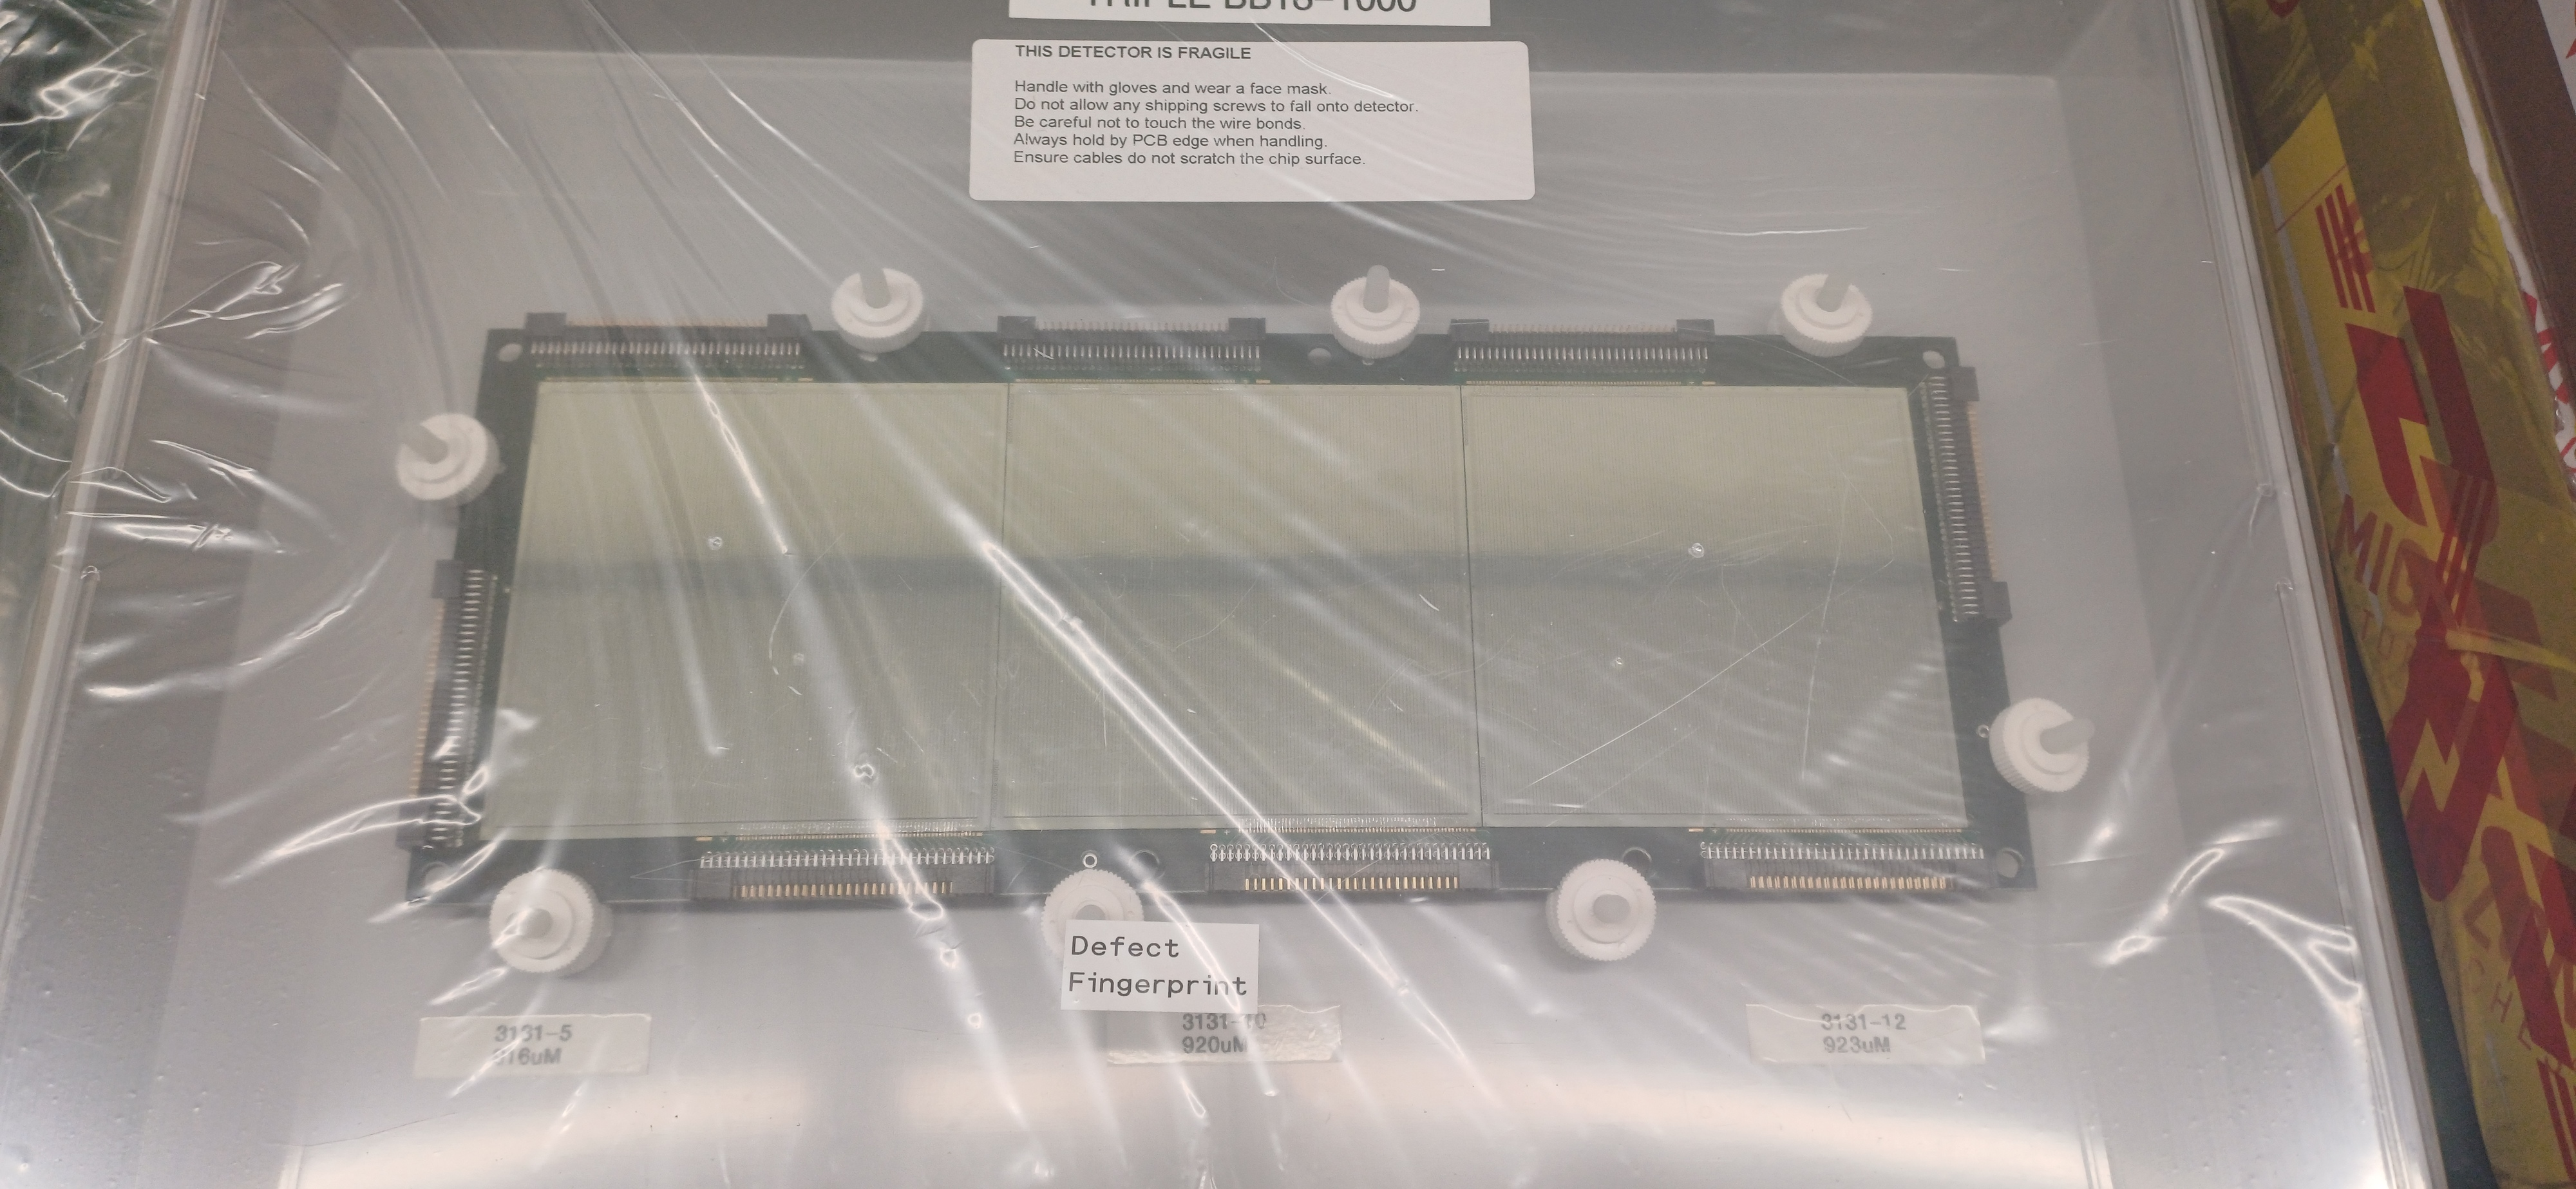
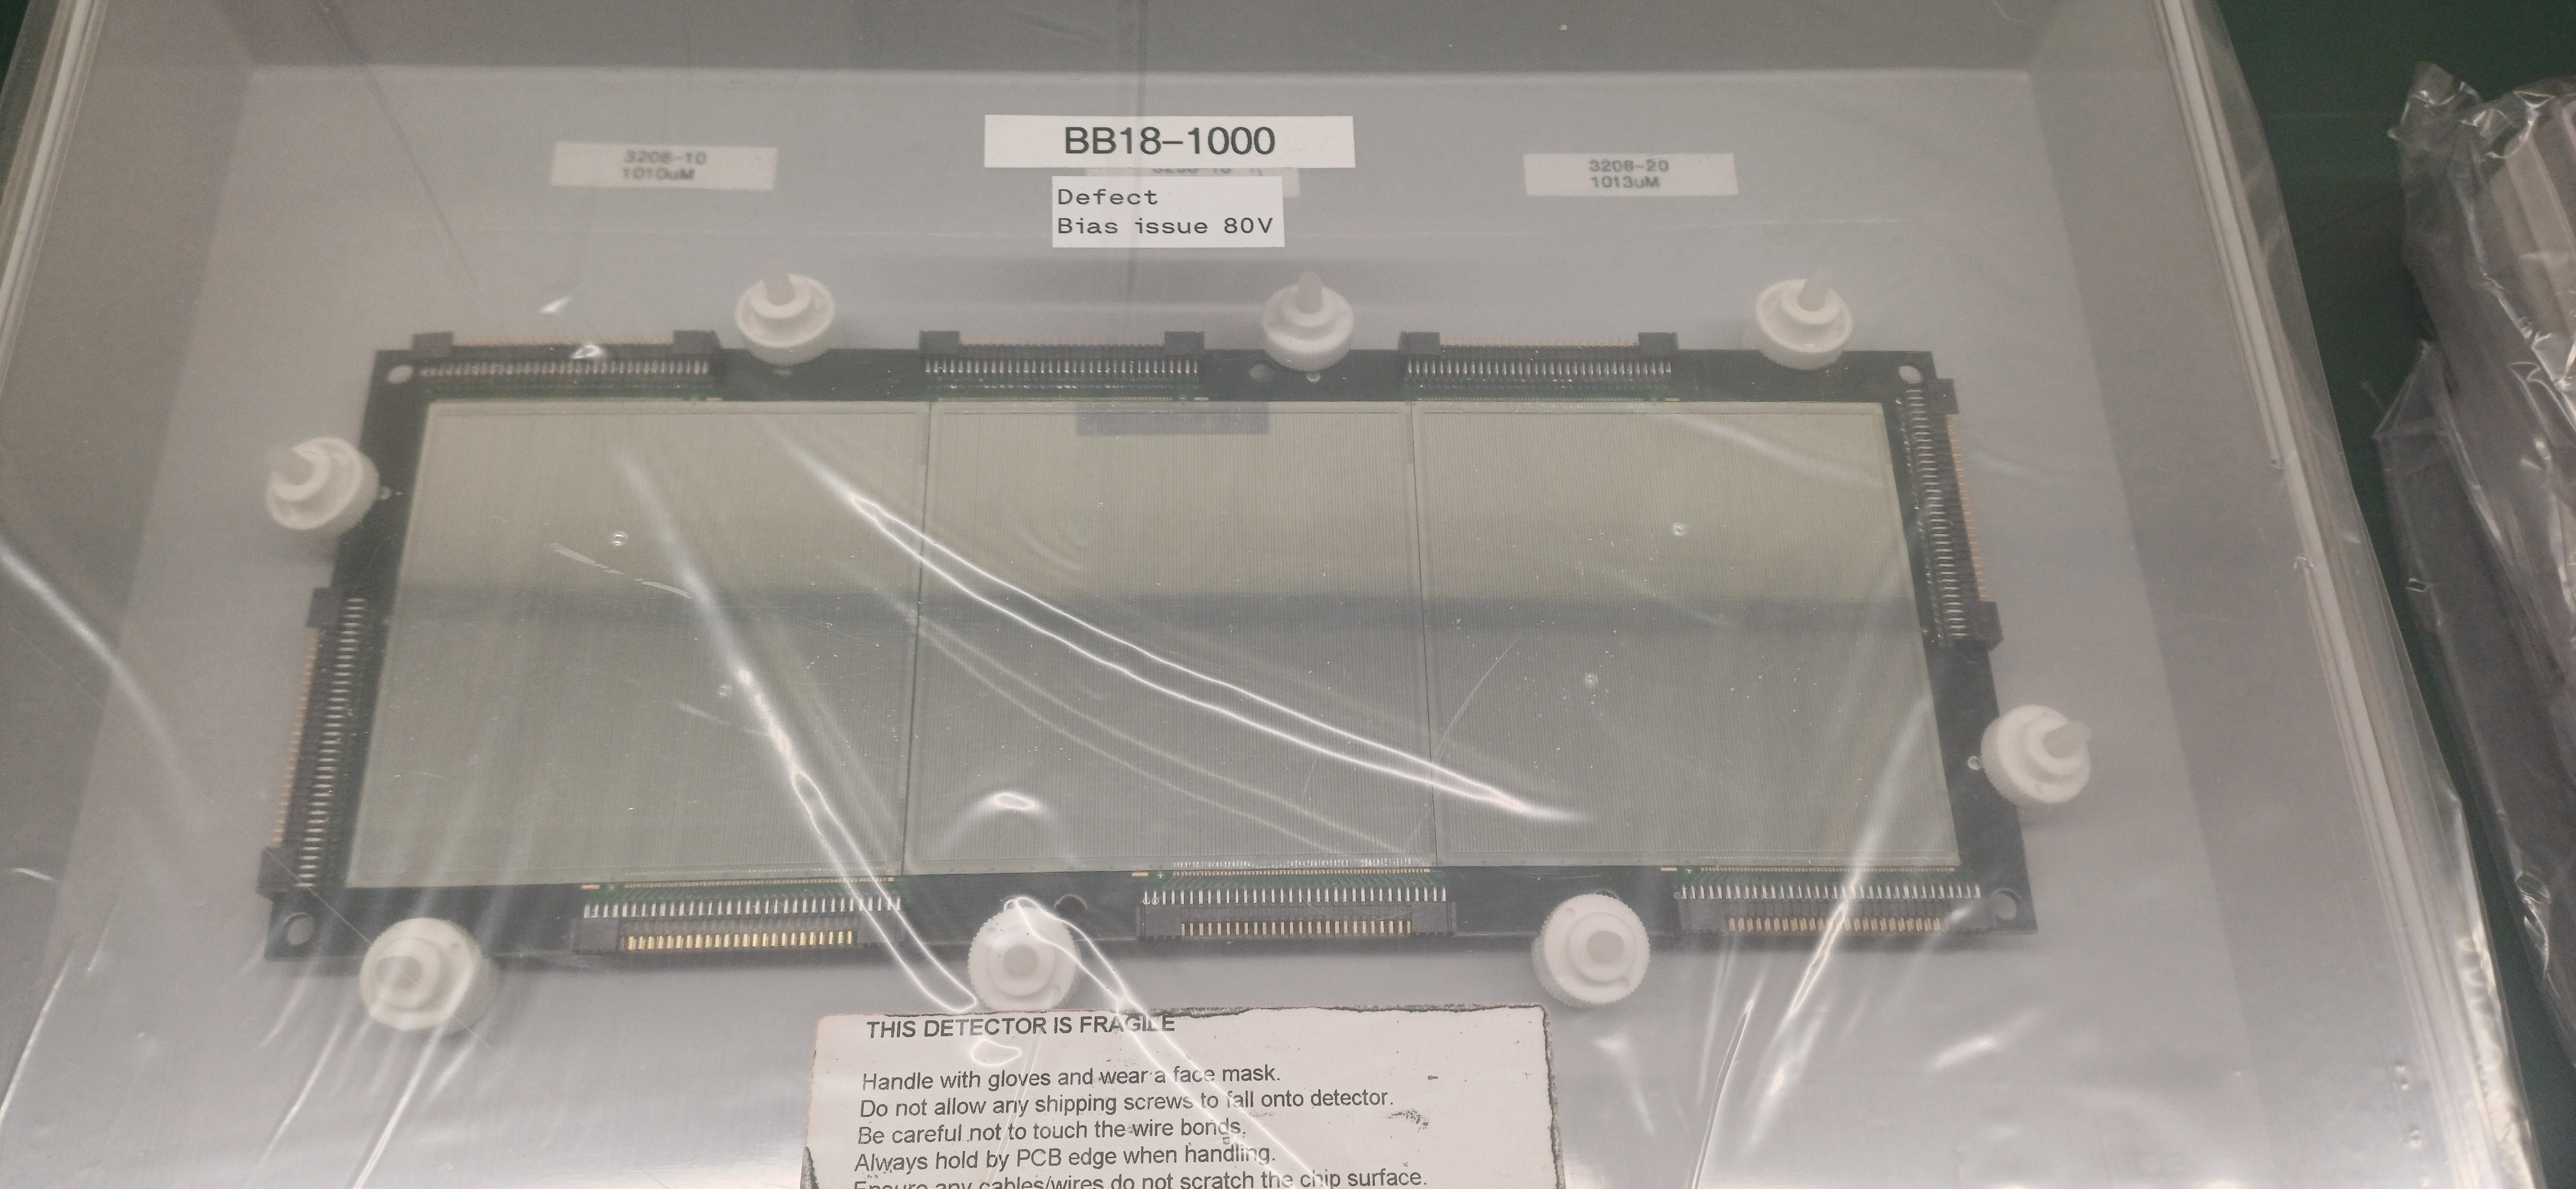
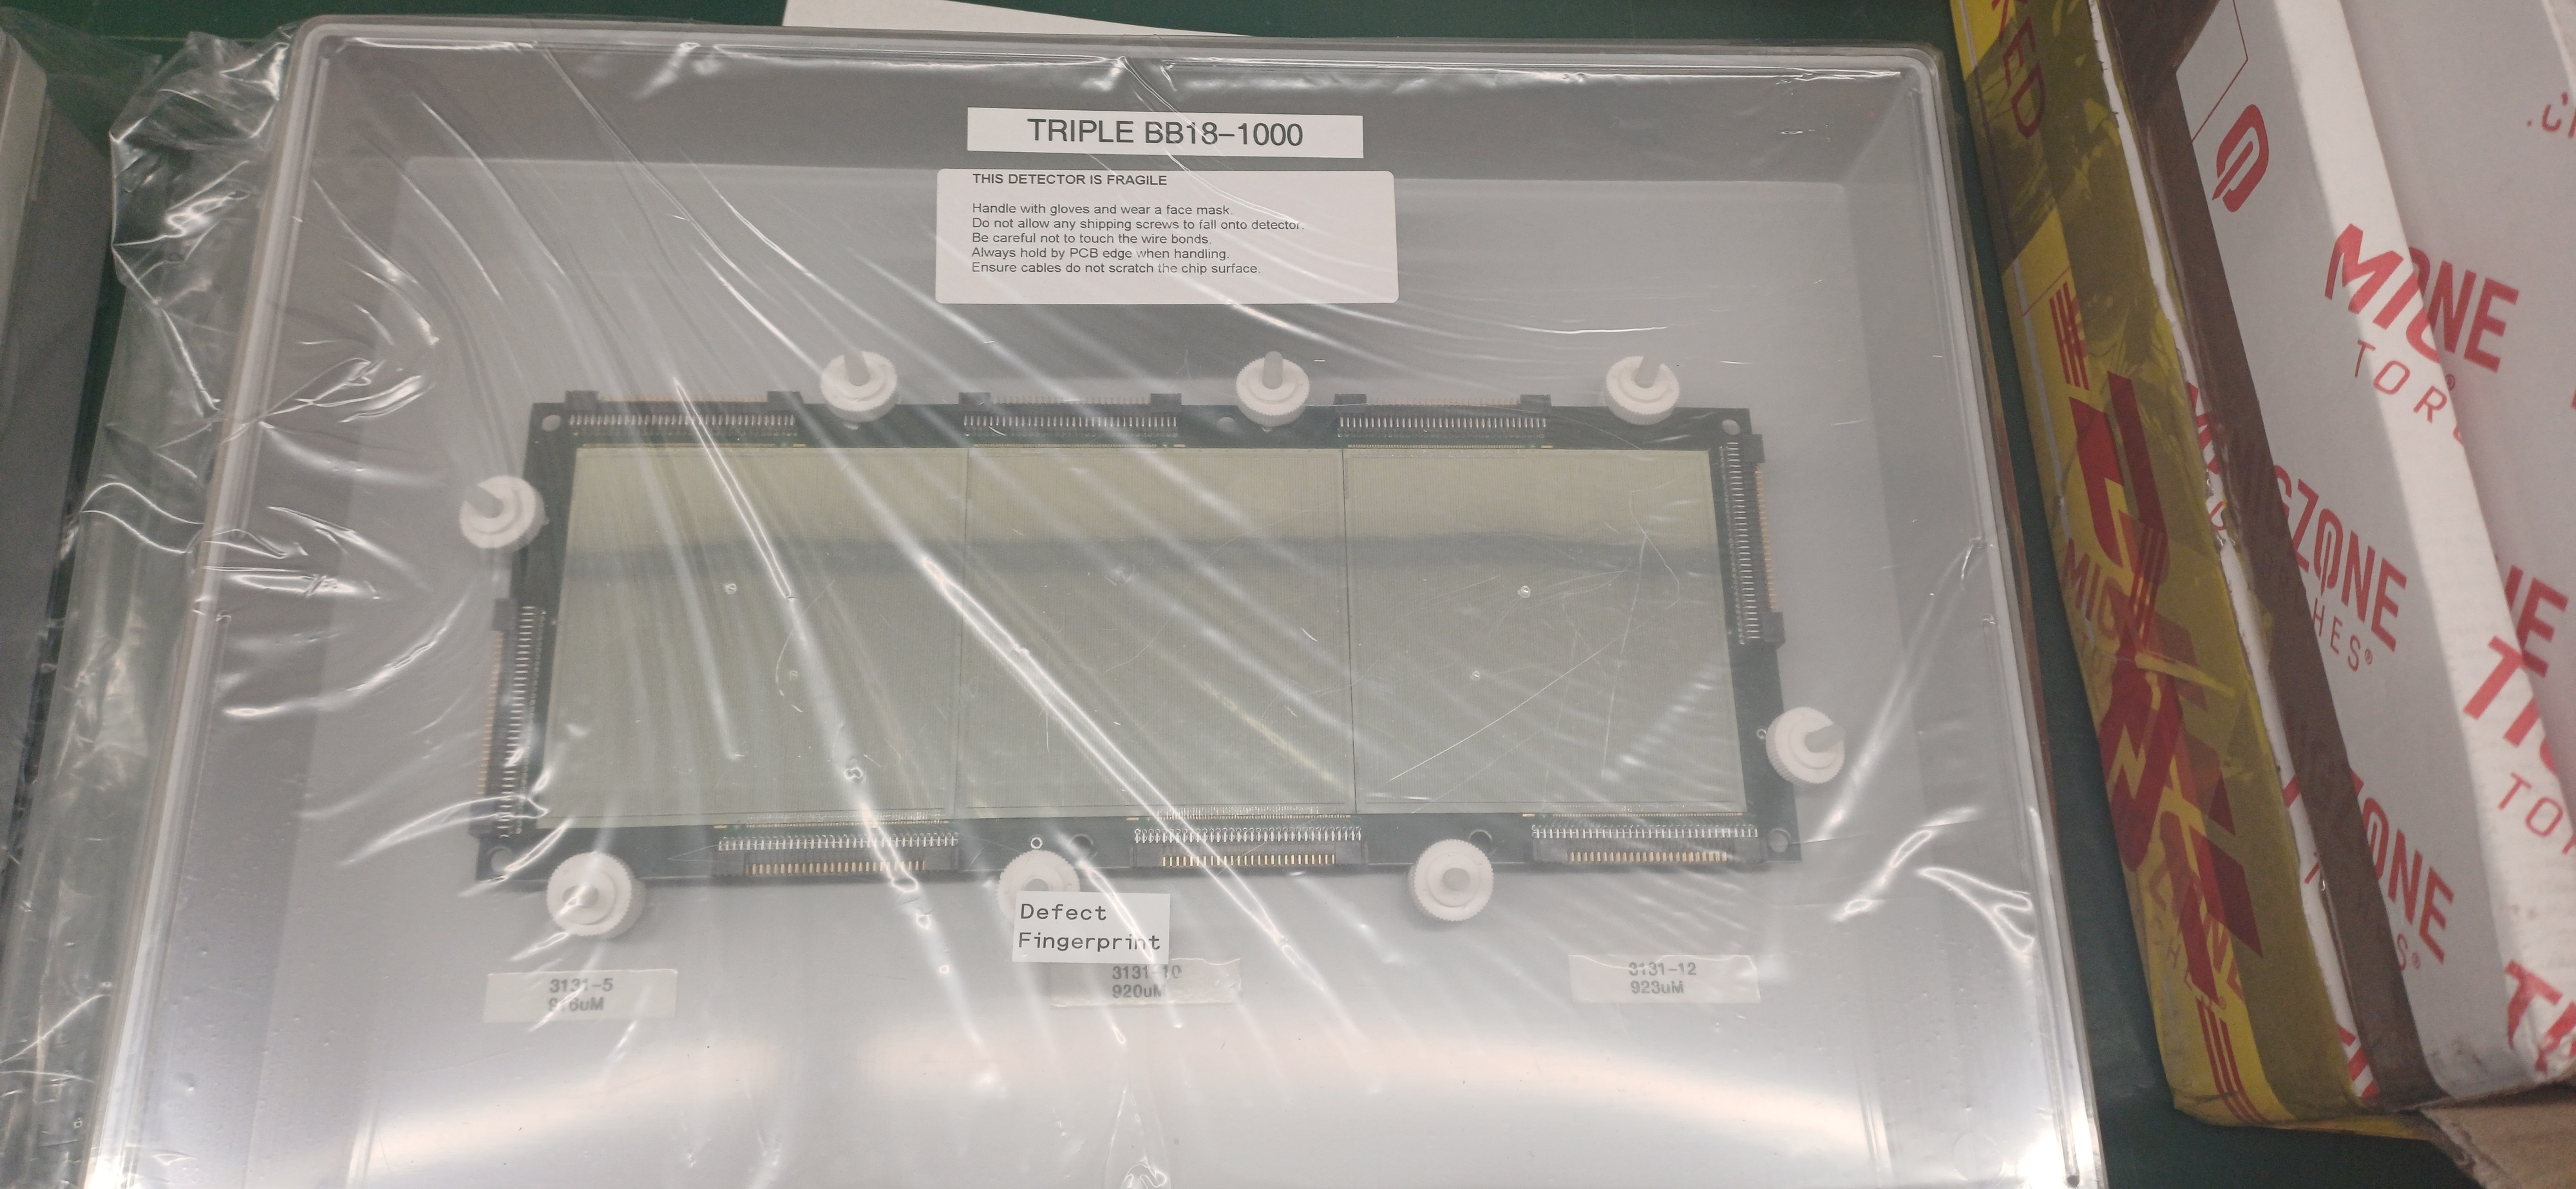
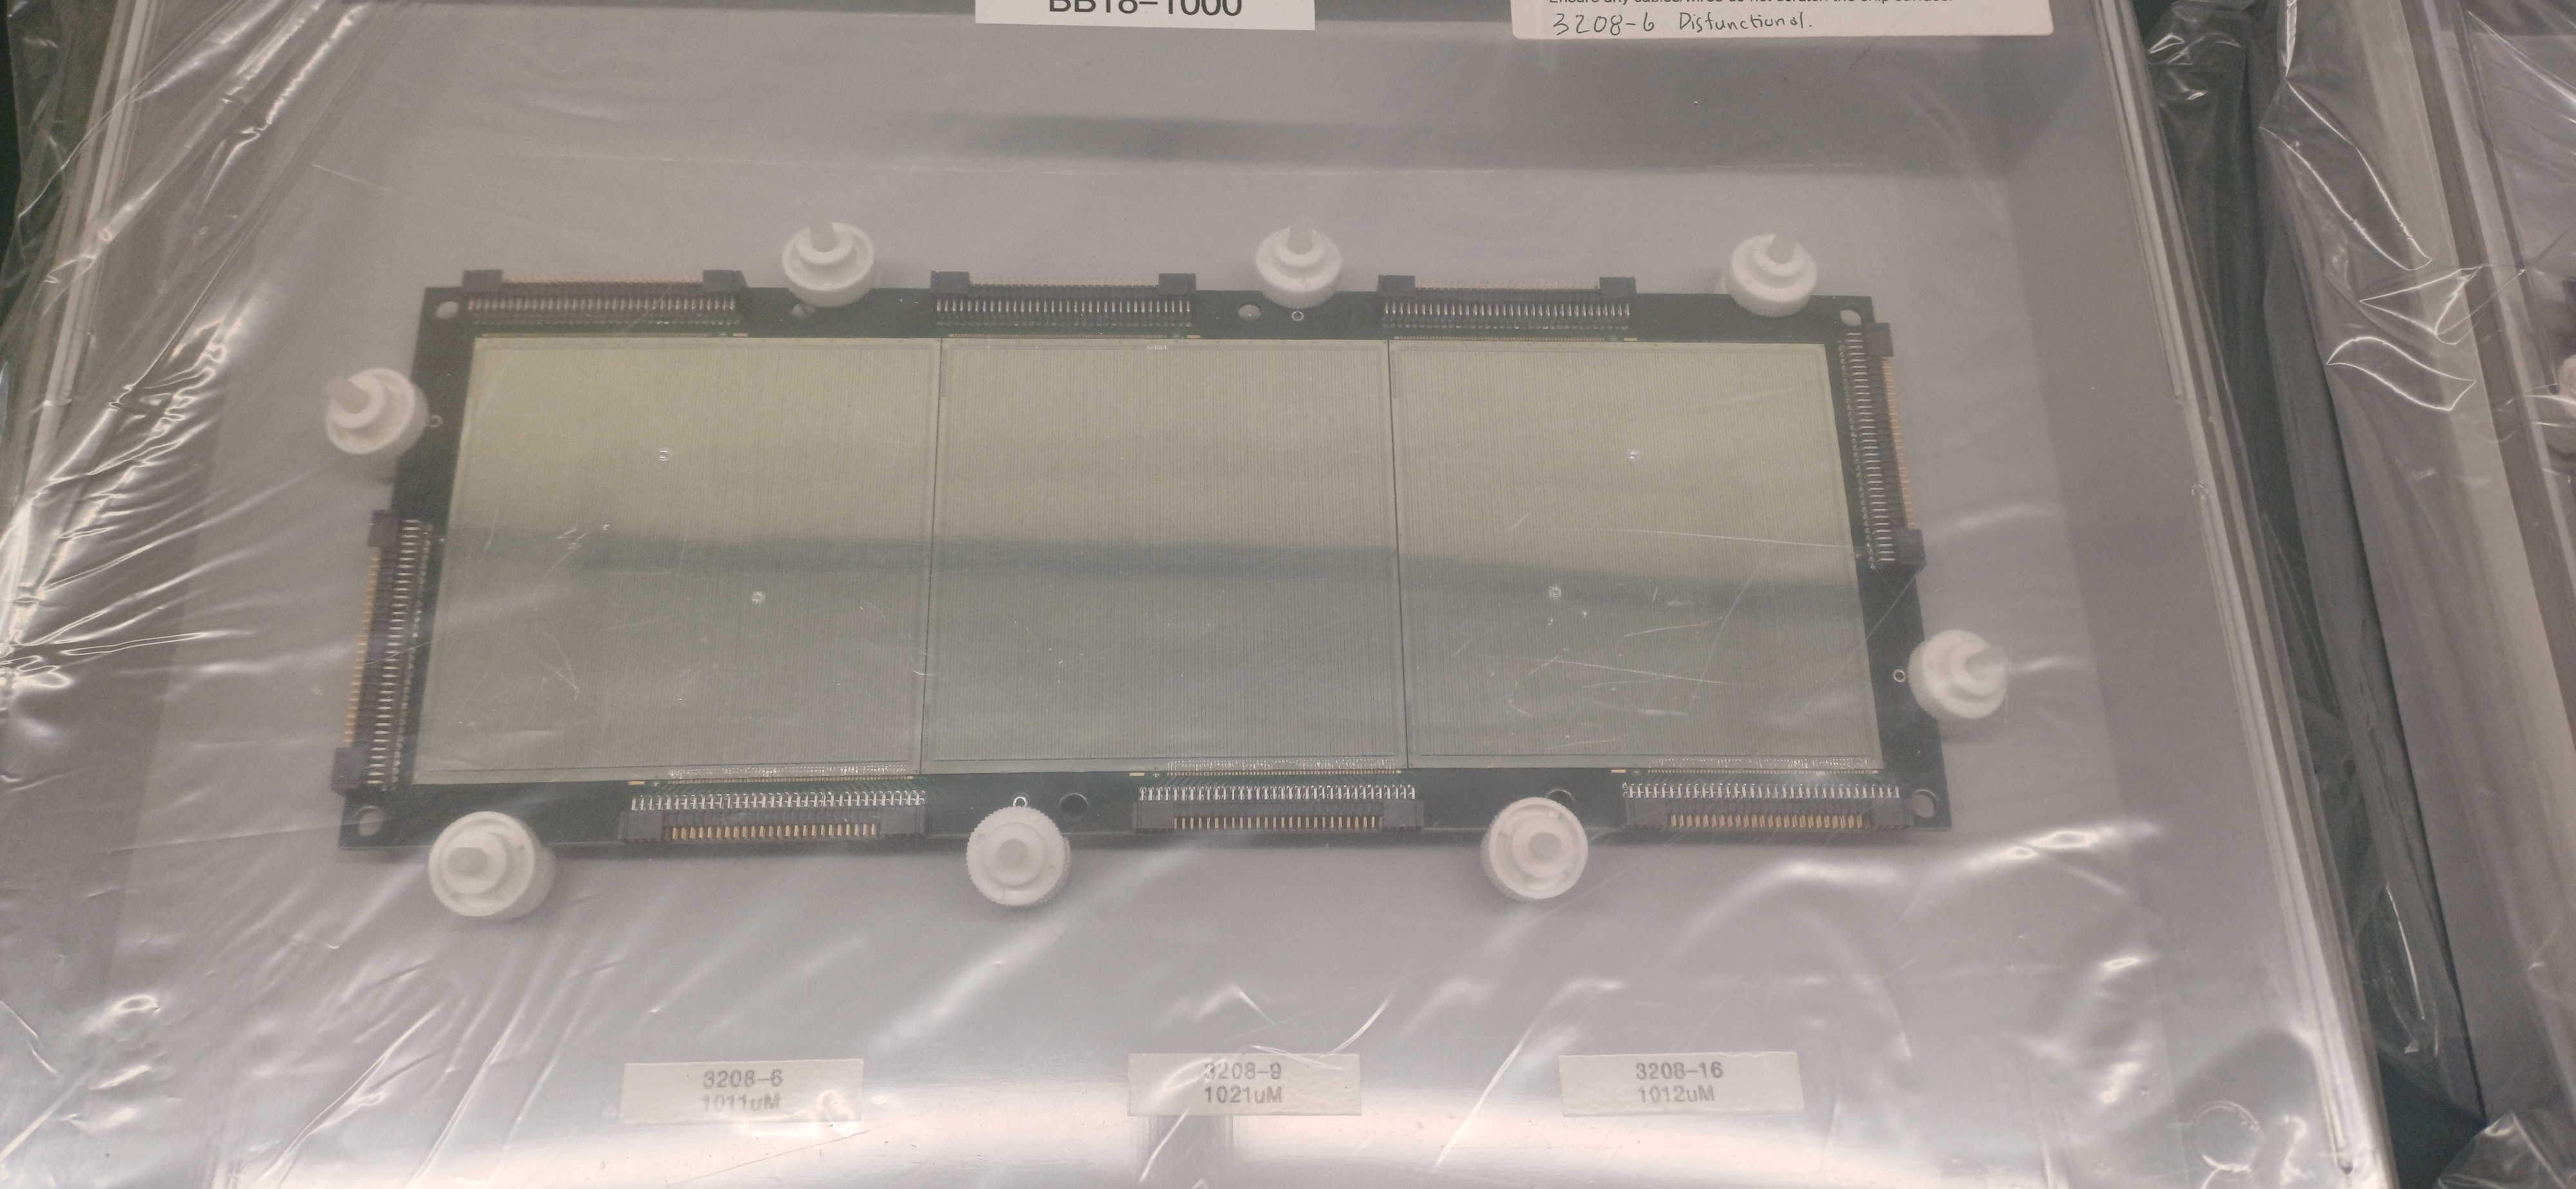
Visual inspection carried out showed that bond wires have been fixed + fingerprint on one DSSSD removed and wires repaired. elog:669/4 elog:669/5 elog:669/6 elog:669/7 elog:669/8 elog:669/9 elog:669/10 elog:669/11
DSSSD 1 (defect bias issue 80V): 3208-10 / 3208-18 / 3208-20
DSSSD 2 (3208-6 dysfunctional): 3208-6 / 3208-9 / 3208-16
DSSSD 3 (defect fingerprint): 3131-5 / 3131-10 / 3131-12
|
| Attachment 1: doc00418120240814132739.pdf
|
|
| Attachment 2: doc00418020240814132419.pdf
|
|
| Attachment 3: doc00417920240814132325.pdf
|
|
| Attachment 4: 20240814_132617.jpg
|
|
| Attachment 5: 20240814_133316.jpg
|
|
| Attachment 6: 20240814_133306.jpg
|
|
| Attachment 7: 20240814_133225.jpg
|
|
| Attachment 8: 20240814_133321.jpg
|
|
| Attachment 9: 20240814_133328.jpg
|
|
| Attachment 10: 20240814_133300.jpg
|
|
| Attachment 11: 20240814_133313.jpg
|
|
|
696
|
Fri Jan 31 13:48:29 2025 |
JB | AIDA analysis from HI-DESPEC meeting 20.11.2024 |
AIDA analysis and presentation by J. Bormans for AIDA made in the HISPEC-DESPEC collaboration meeting.
https://docs.google.com/presentation/d/1hlZ30r294UqbVKGy3jg-wompFpc7TSfD/edit?usp=sharing&ouid=102131181856760114019&rtpof=true&sd=true |
|
529
|
Thu Mar 7 11:09:05 2024 |
HA, JB, CC, TD, MG | Thursday 7 March |
Snout assembly

DSSSDs

Upstream   3208-10/3208-18/3208-20
Downstream 3131-5/3131-10/3131-12

p+n junction side bias continuity checked OK for *all* wafers
 all c. 22 Ohm as expected

n+n Ohmic side bias continuity checked OK for both DSSSDs
 upstream 73 Ohm, downstream 92 Ohm

n+n Ohmic side bias wafer #2
 positioned at top of snout assembly ( lower stage snout side marked 'T' )

p+n junction side faces downstream


Distances

Using top edge of lower stage snout as reference

ref - middle of upstream bPlas 8.0cm
ref - upstream DSSSD 11.0cm
ref - downstream DSSSD 12.0cm
ref - middle of downstream bPlas 14.0cm

Measurements consistent to +/-1mm between LHS and RHS of snout assembly as viewed from top side


13.00 At this position the Kapton PCBs bulged in/out and there was some concern that when the upper stage
snout was installed it would the Kapton PCBs into the 'active' area. It was decided to move the 2x bPlas
and 2x DSSSDs c. 5mm downstream.

Jeroen and Phillip cut sections from 4x PEEK 6mm spacers so that they would clip onto 3mm dia support rods.

We raised the assembly fro the inter stage and inserted the modified spacers between the inter stage and
the other spacers above. The Kapton PCBs now run fairly straight to the DSSSD connectors.

Distances re-measured as

Using top edge of lower stage snout as reference

ref - middle of upstream bPlas 8.6cm
ref - upstream DSSSD 11.5cm
ref - downstream DSSSD 12.4cm
ref - middle of downstream bPlas 14.5cm |
|
703
|
Thu Jun 12 13:15:25 2025 |
GB, CC, NK, MP, TD | Thursday 12 June 2025 |
EMC tests with NK (Orsay)

Stack configuration (upstream->downstream)

bPlas
AIDA DSSSD #0
AIDA DSSSD #1
bPlas
3x MSL type BB7(DS)-1000 (1x aida10, 2x Mesytec preamplifiers)

AIDA DSSSD #0 bias -100V leakage current -13.23uA
AIDA DSSSD #1 bias -100V leakage current -9.68uA

BNC PB-5 settings
Amplitude 1.0V
Attenuator x1
Frequency 25Hz
Polarity +
tau_d 1ms
Tail pulse

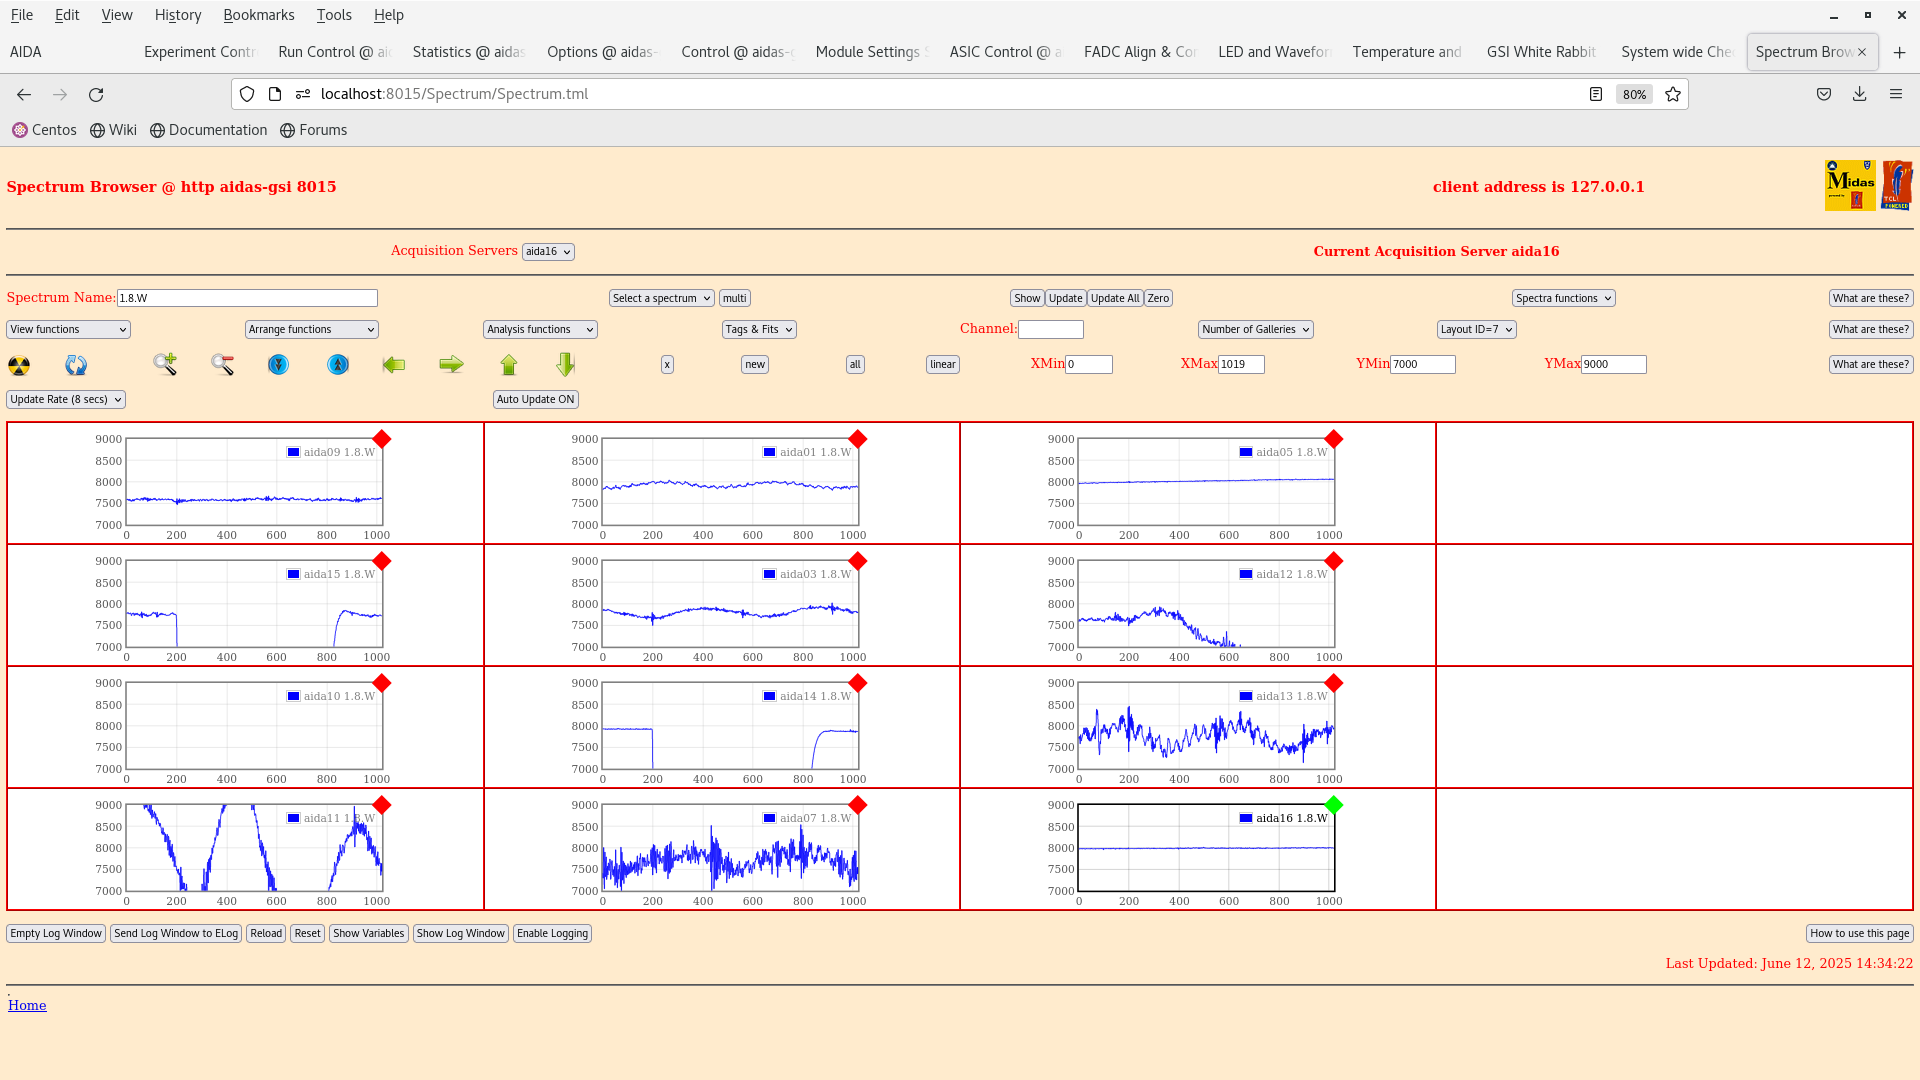
14.39 per p+n FEE64 1.8.W spectra - 20us FSR - attachment 1

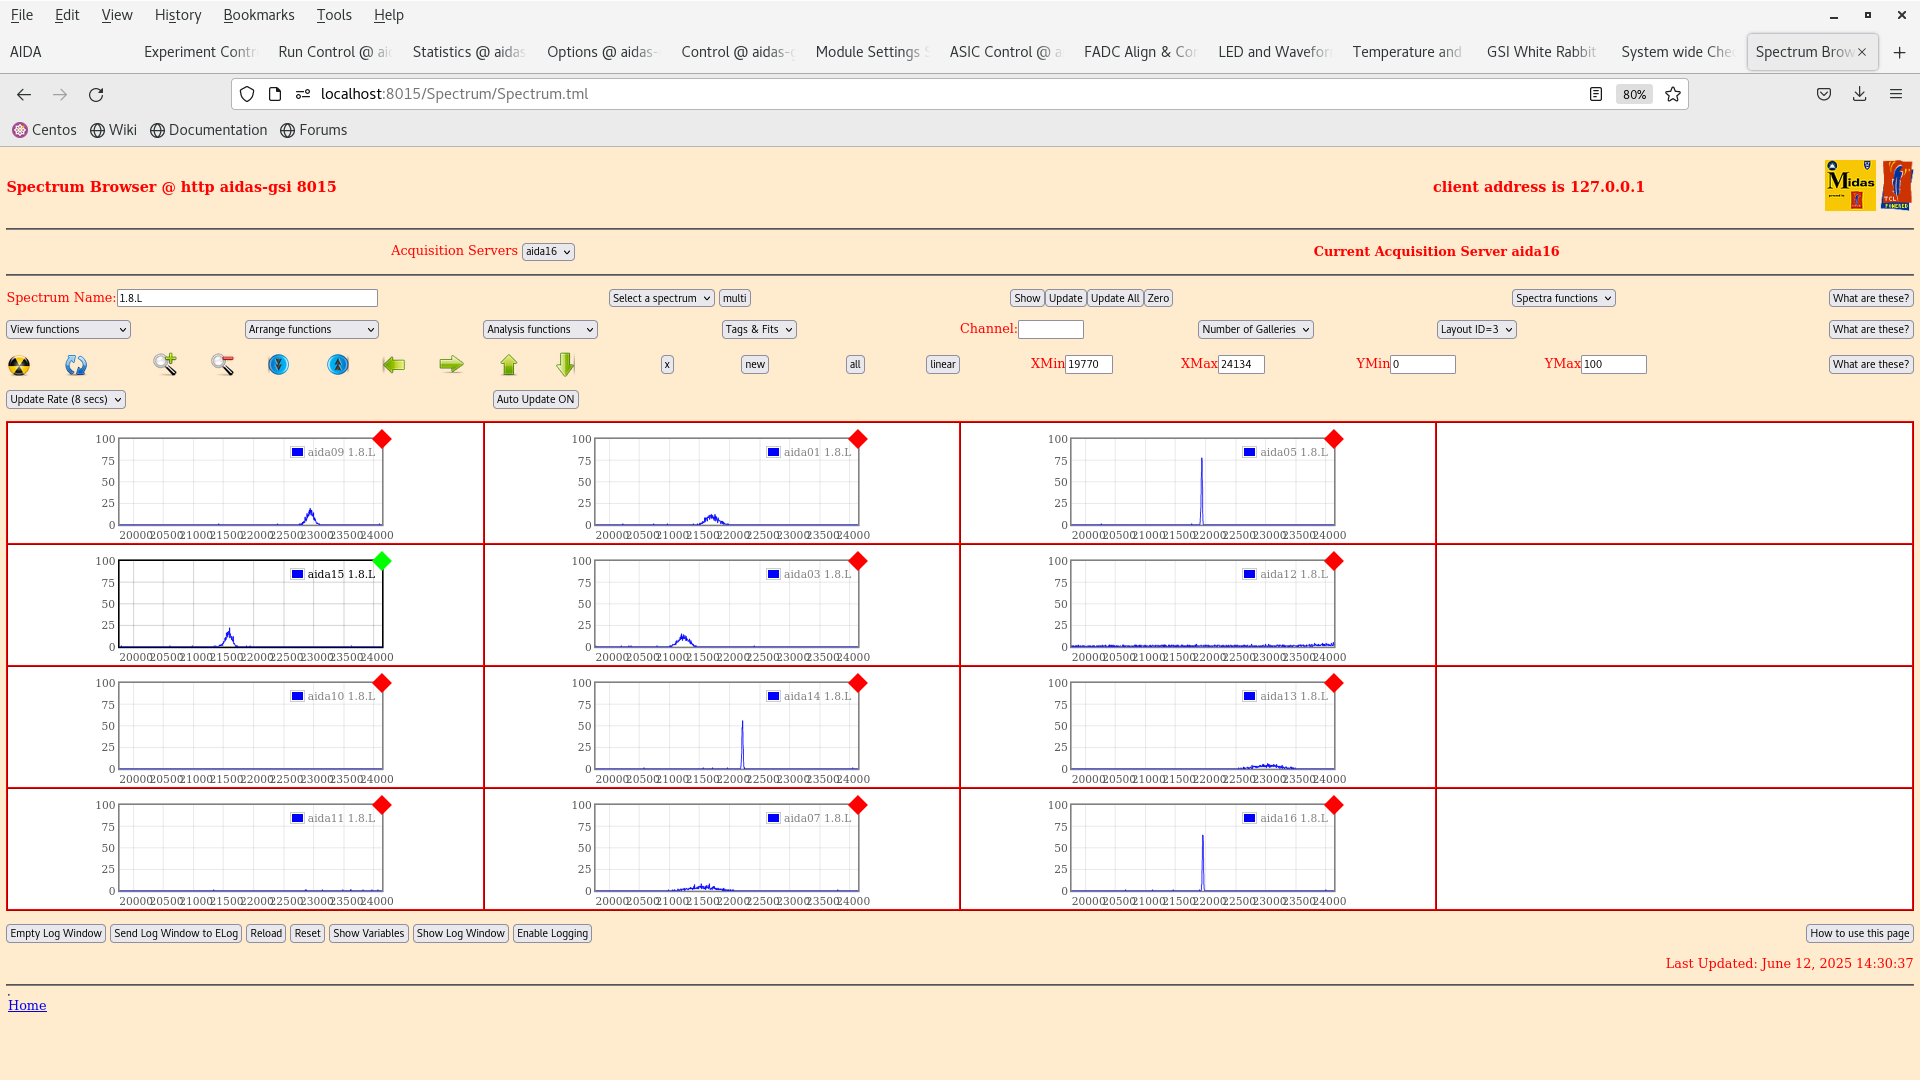
      per p+n FEE64 1.8.L spectra - attachment 2

      Pulser peak widths ch FWHM

      DSSSD #0 (DSSSD - FEE64 cables with heavy duty braid - electrically connected to ground of adaptor PCB and internally connected to ground within snout)

9  1   5
120 201  21
15  3  12
114 180  broad

      DSSSD #1 (DSSSD - FEE64 cables with mesh - currently not connected i.e. floating to adaptor PCB and internally connected to ground within snout)
10 14  13
-   22   374
11  7  16
broad 417 20

       Pulser peak widths c. 20 ch FWHM probably indicate cable from DSSSD *not* connected to FEE64 adaptor PCB
|
| Attachment 1: Screenshot_from_2025-06-12_14-39-35.png
|
|
| Attachment 2: Screenshot_from_2025-06-12_14-33-26.png
|
|
|
149
|
Fri Mar 13 15:48:11 2020 |
Friday 13th 16:00 - 24:00 | OH, TD |
ASIC settings 2019Oct31-13.24.23
     slow comparator 0xa

BNC PB-5 pulser
     amplitude 1.0V , attenuator x1
     frequency 2Hz
     decay time 1ms

16:51 Bias and leakage currents ok but starting to increase in DSSD 1 predominantly - attachment 1
      Statistics ok - attachment 2
      FEE temp ok - attachment 3
      System wide checks all ok

16:57 Histograms zeroed

17:17 ASIC control check done

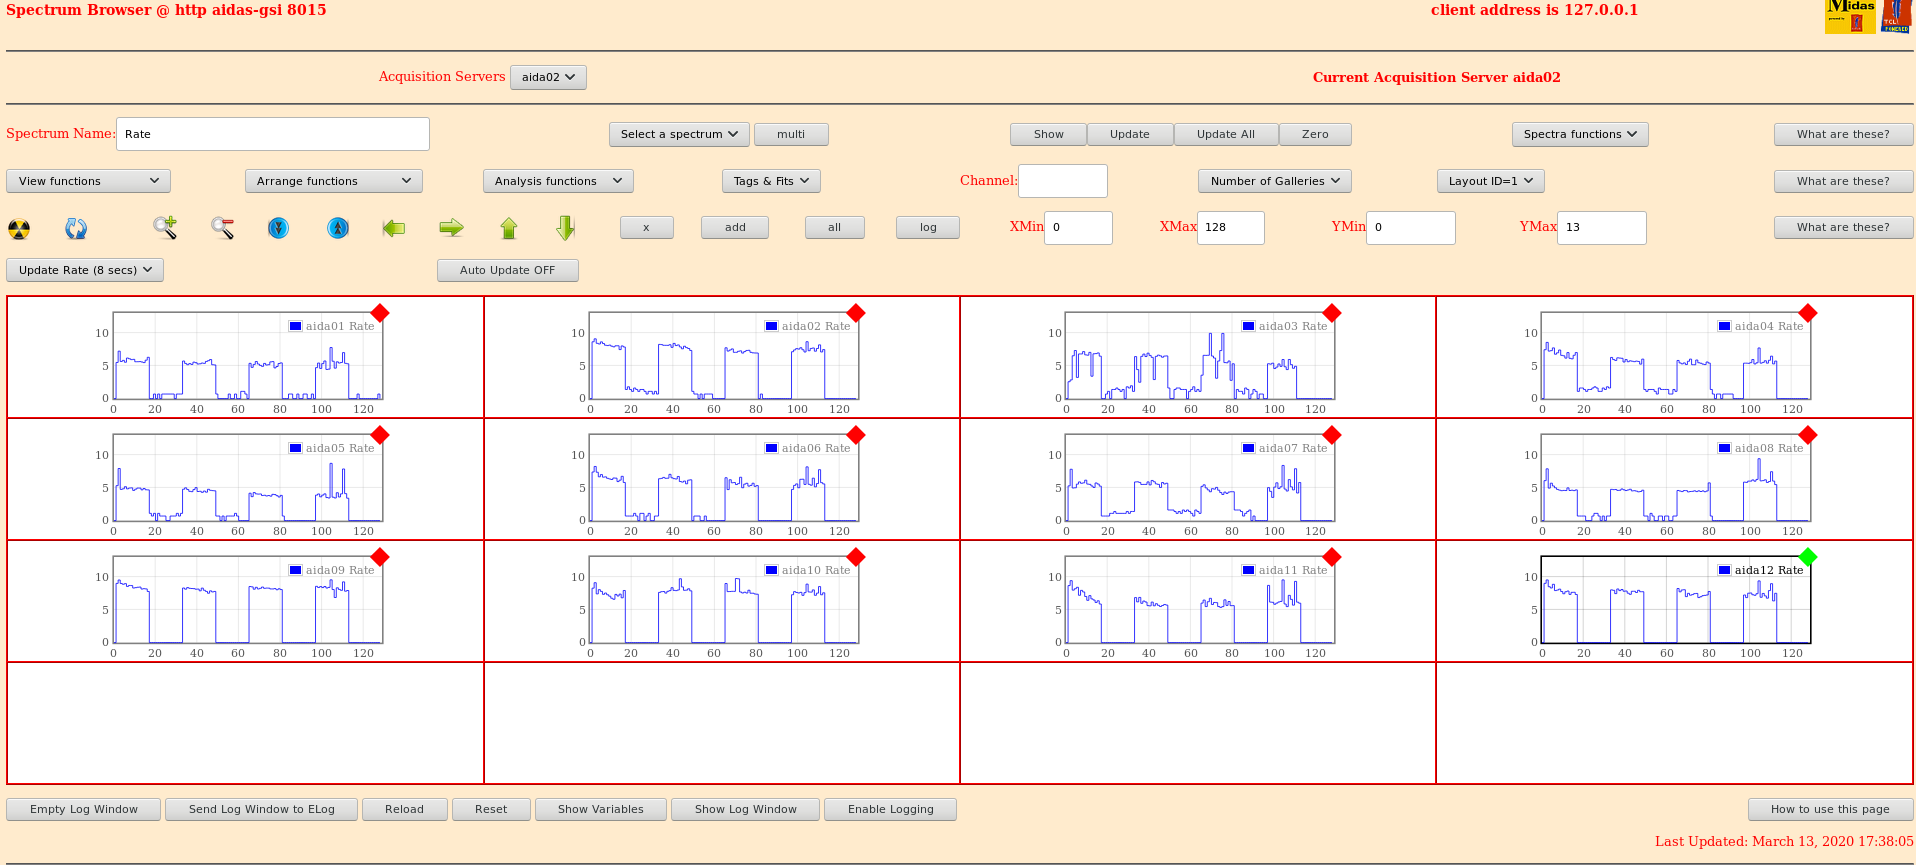
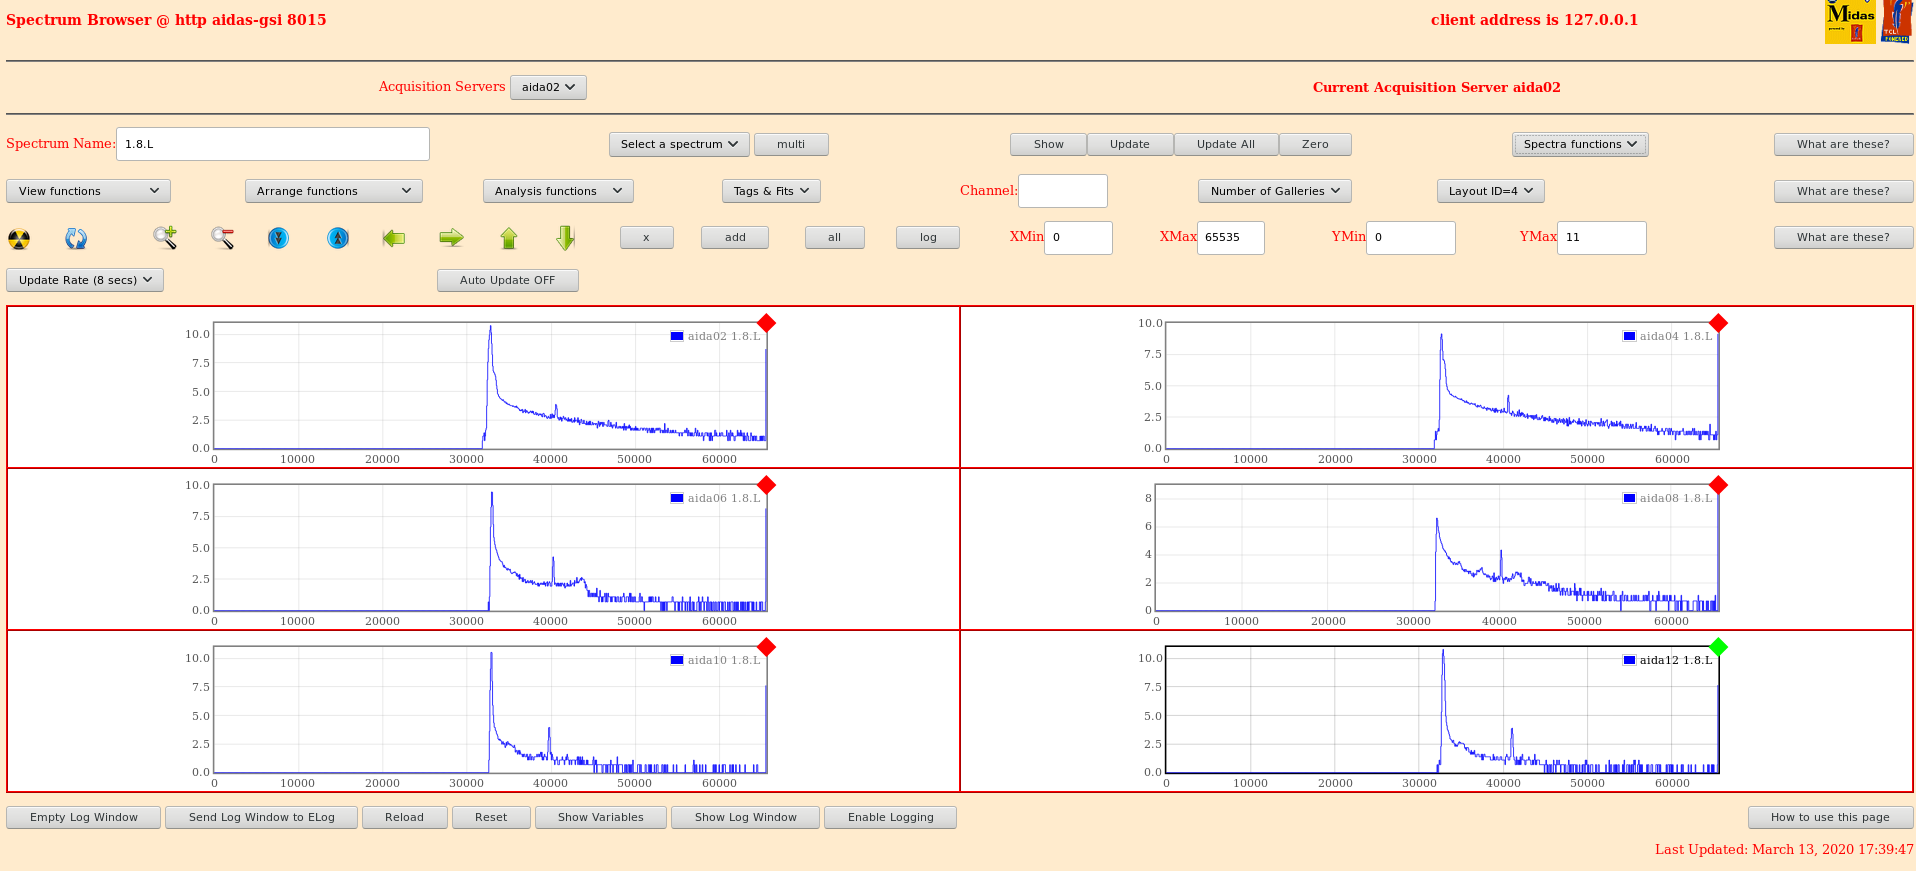
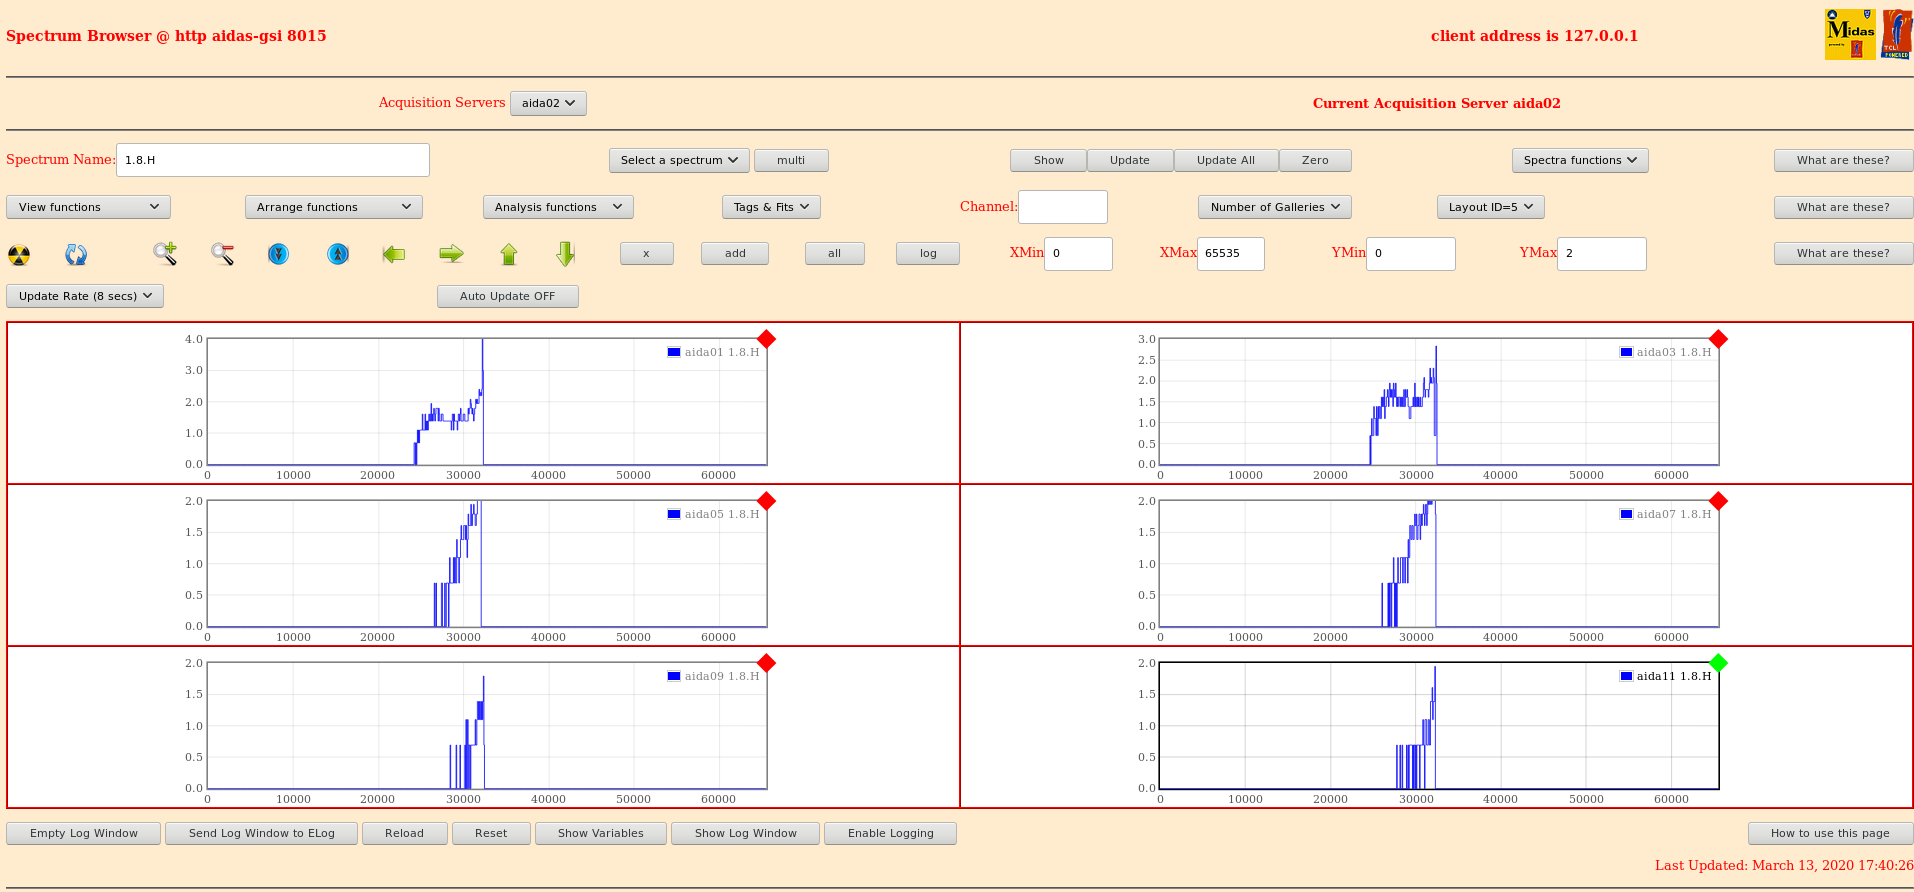
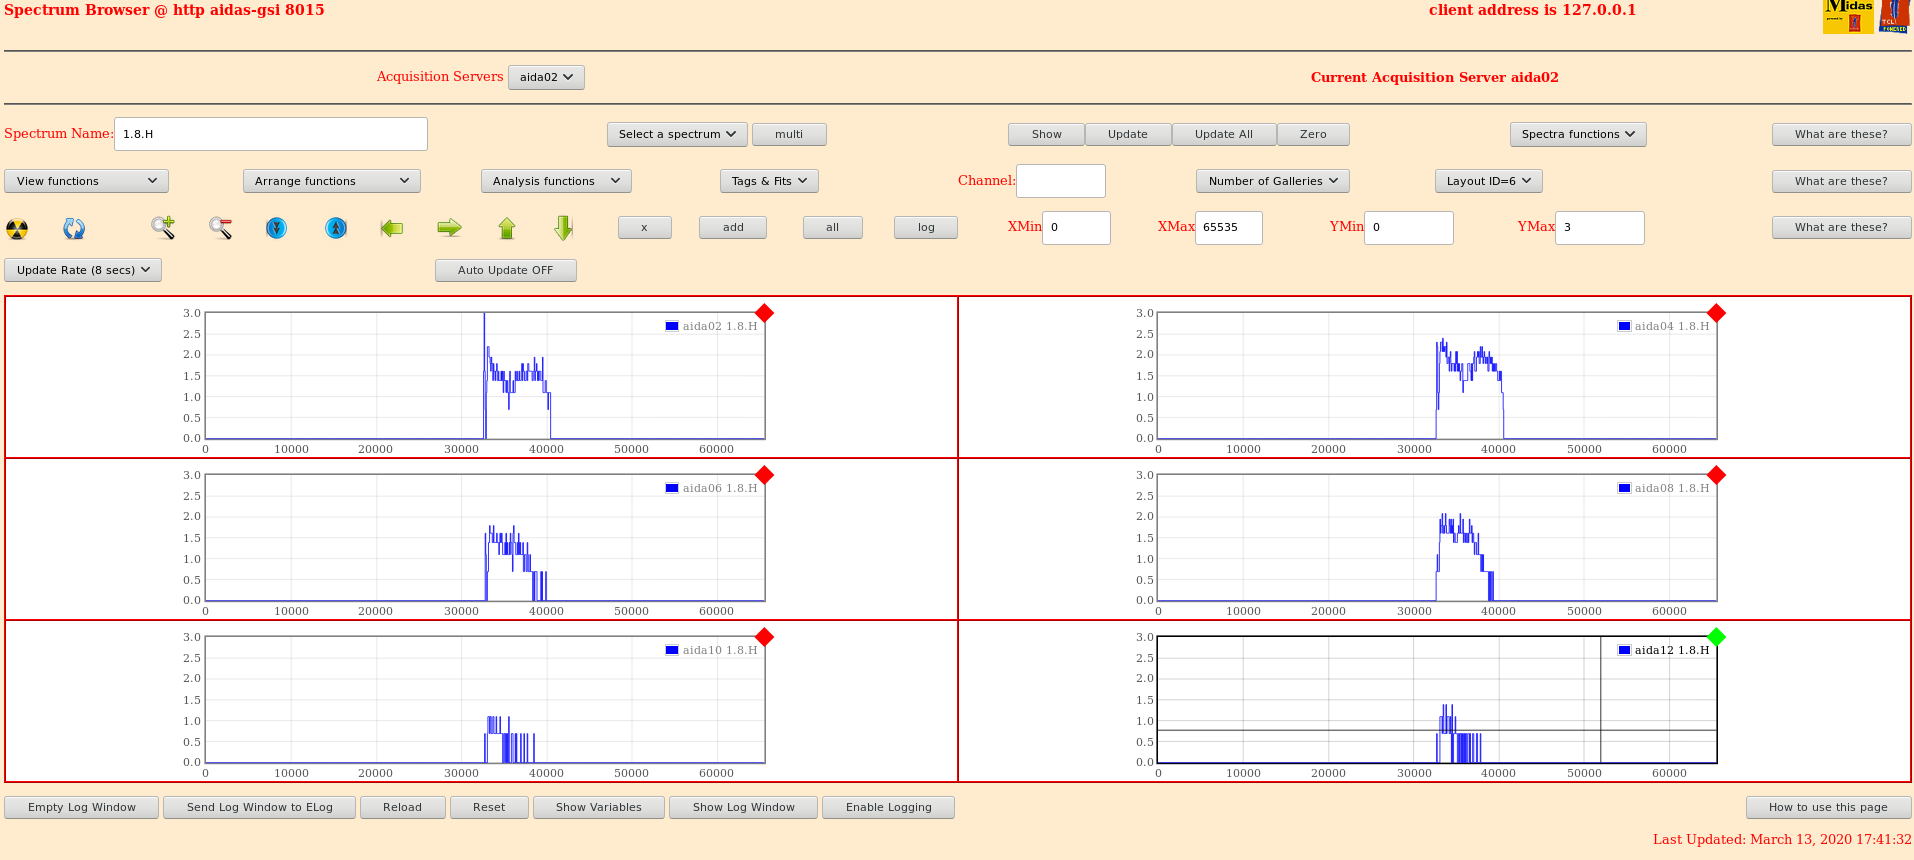
17:40 Layout 1 - attachment 4
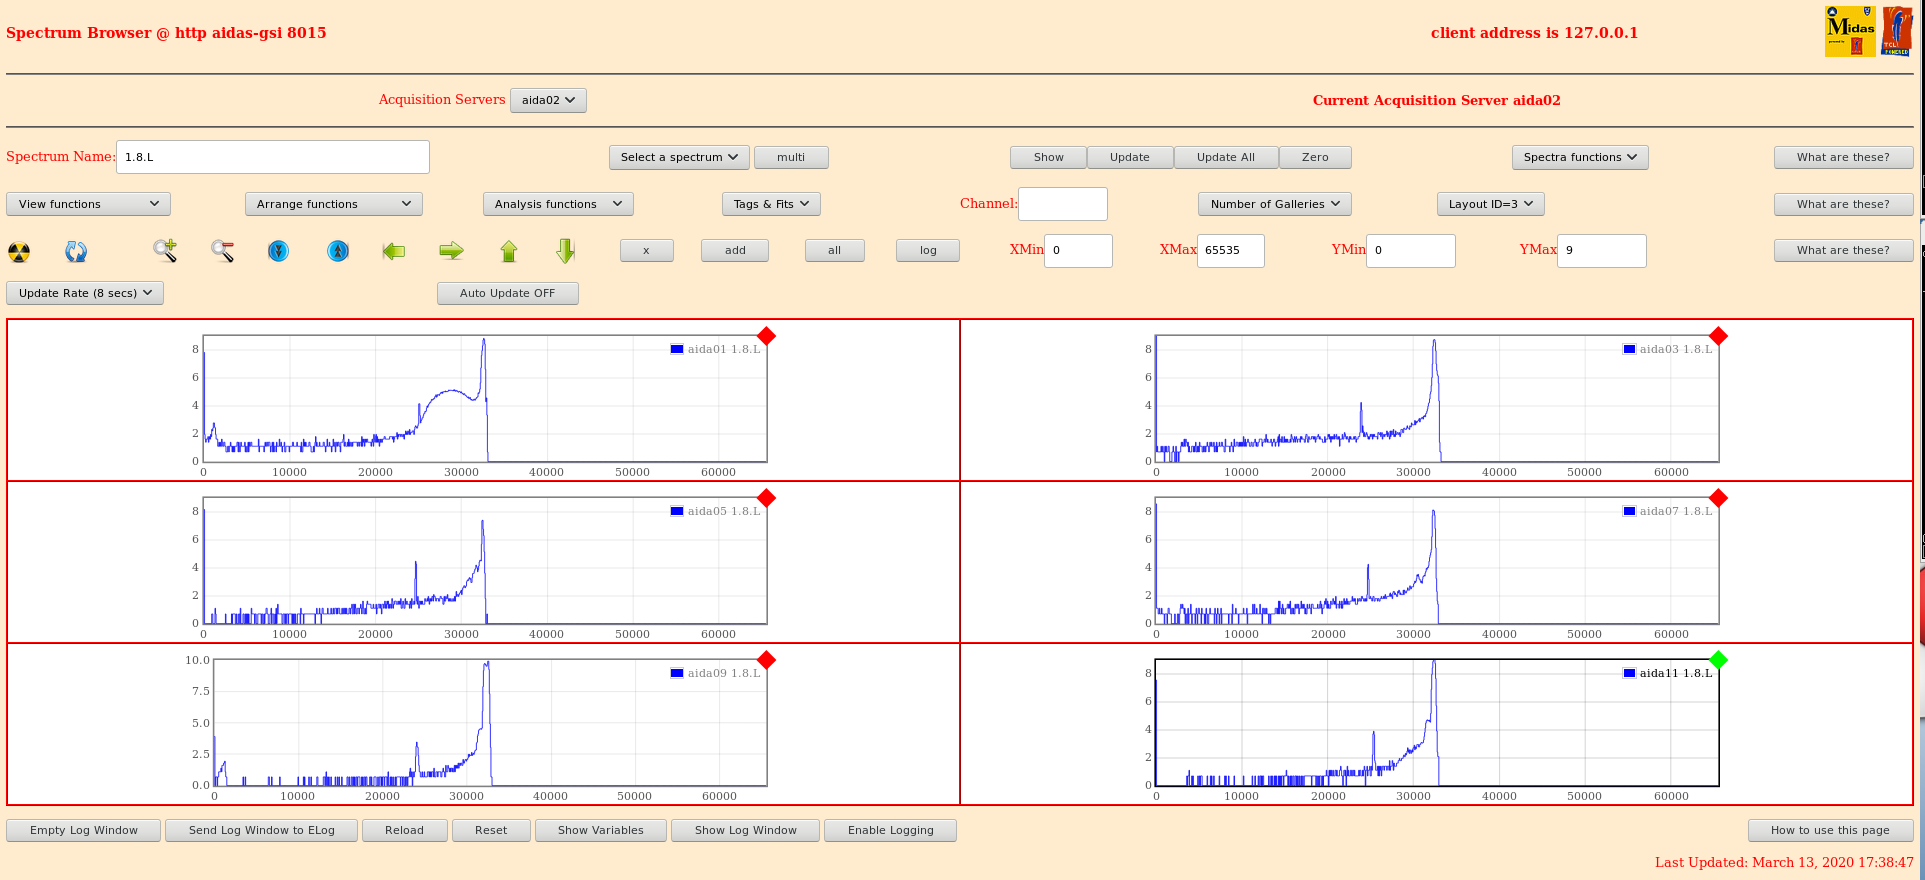
      Layouts 3 and 4 - attachments 4 and 5
      Layouts 5 and 6 - attachments 6 and 7

19:06 Earlier in the shift two extra 8TB drives were formatted and mounted
      Named SecondDrive and ThirdDrive
      TapeData folder created on SecondDrive
      Plan is before the end of this shift to move the symbolic link from the filling up drive to the new drive
      Current prediction is drive would otherwise be full by 12:20 tomorrow.
      Playing it safe and switching early

21:57 Bias and leakage ok - attachment 8
      Statistics ok - attachment 9
FEE Temps ok - attachment 10 |
| Attachment 1: 200313_1649_bias.png
|

|
| Attachment 2: 200313_1652_stats.png
|

|
| Attachment 3: 200313_1653_temp.png
|

|
| Attachment 4: 200313_1738_Layout1.png
|
|
| Attachment 5: 200313_1739_layout2.png
|
|
| Attachment 6: 200313_1740_layout4.png
|
|
| Attachment 7: 200313_1740_layout5.png
|
|
| Attachment 8: 200313_1741_layout6.png
|
|
| Attachment 9: 200313_2155_bias
|
| Attachment 10: 200313_2156_stats.png
|

|
| Attachment 11: 200313_2156_Temps.png
|

|
|
661
|
Thu Jun 13 23:04:01 2024 |
Dan Judson, TD | 0.00-8.00 14/6/24 |
0.00 checks - all looks ok
Voltage/currents - attachment 1
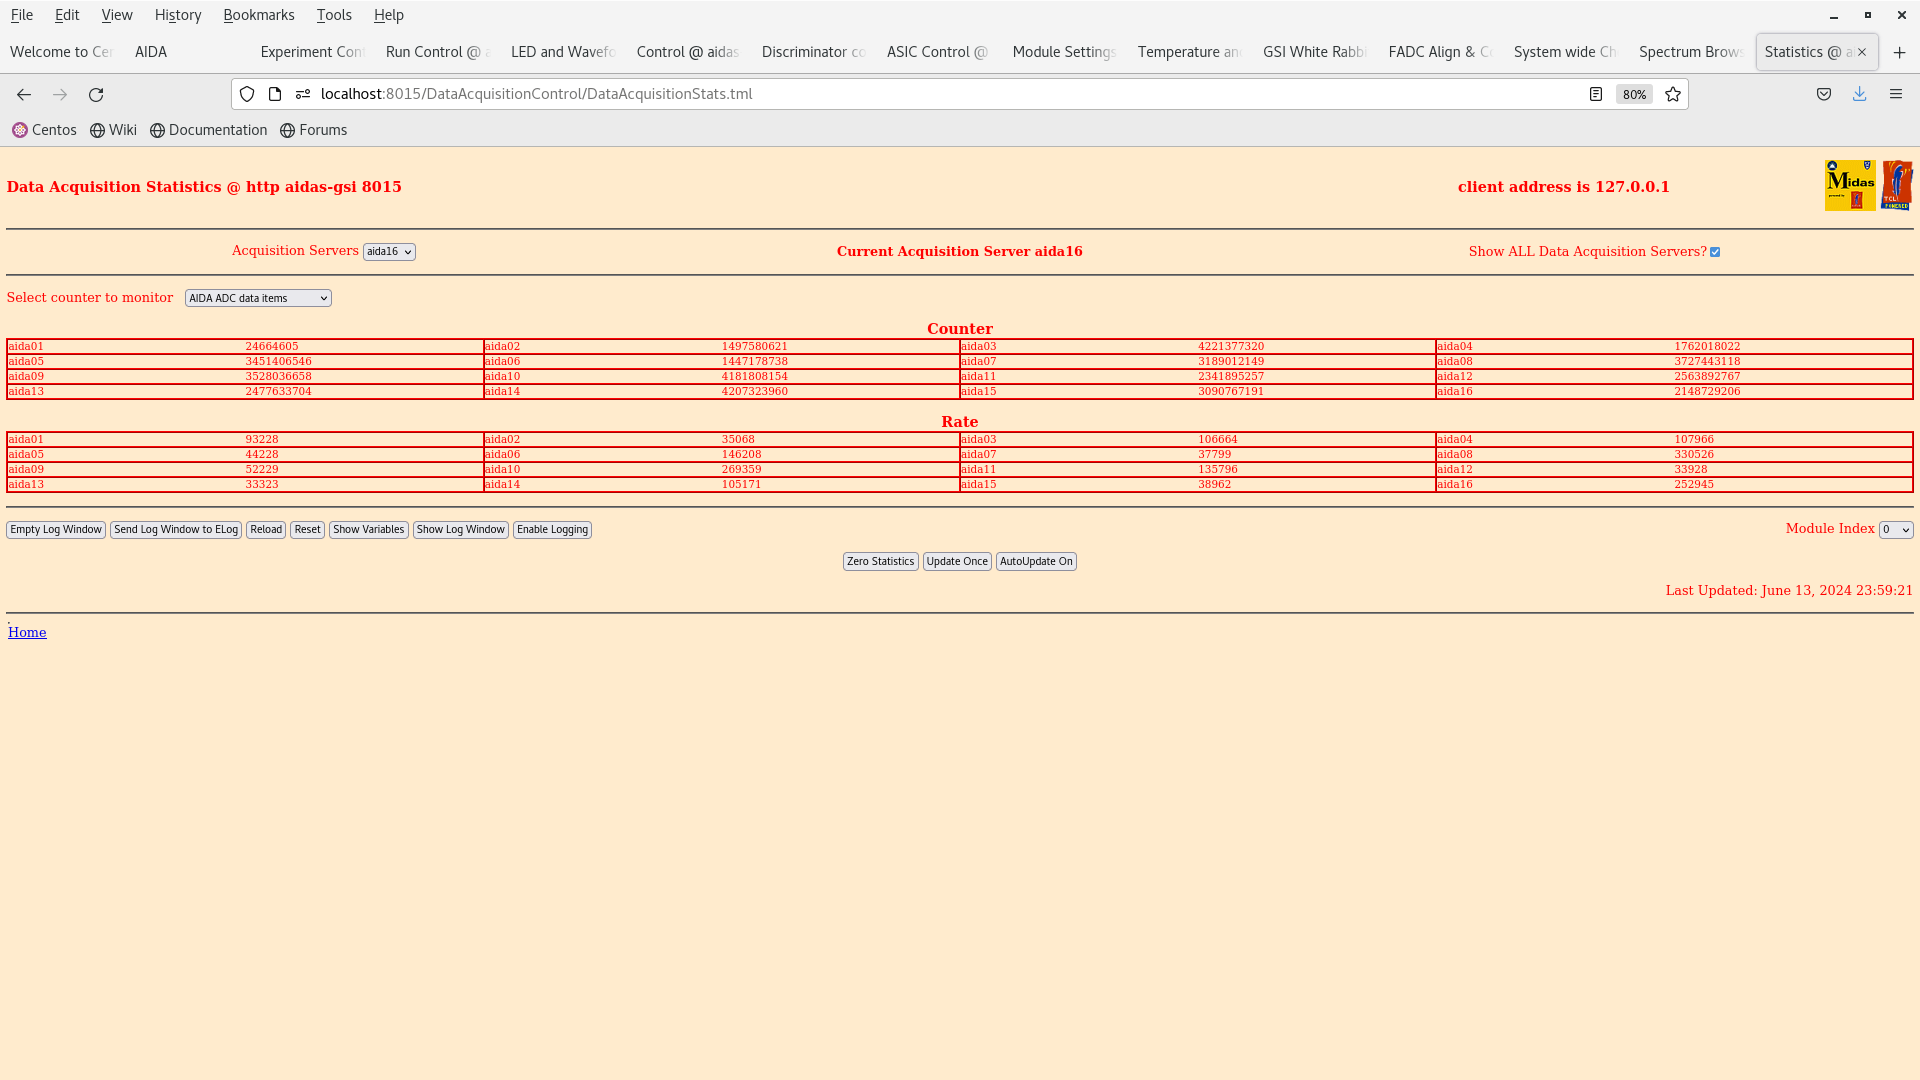
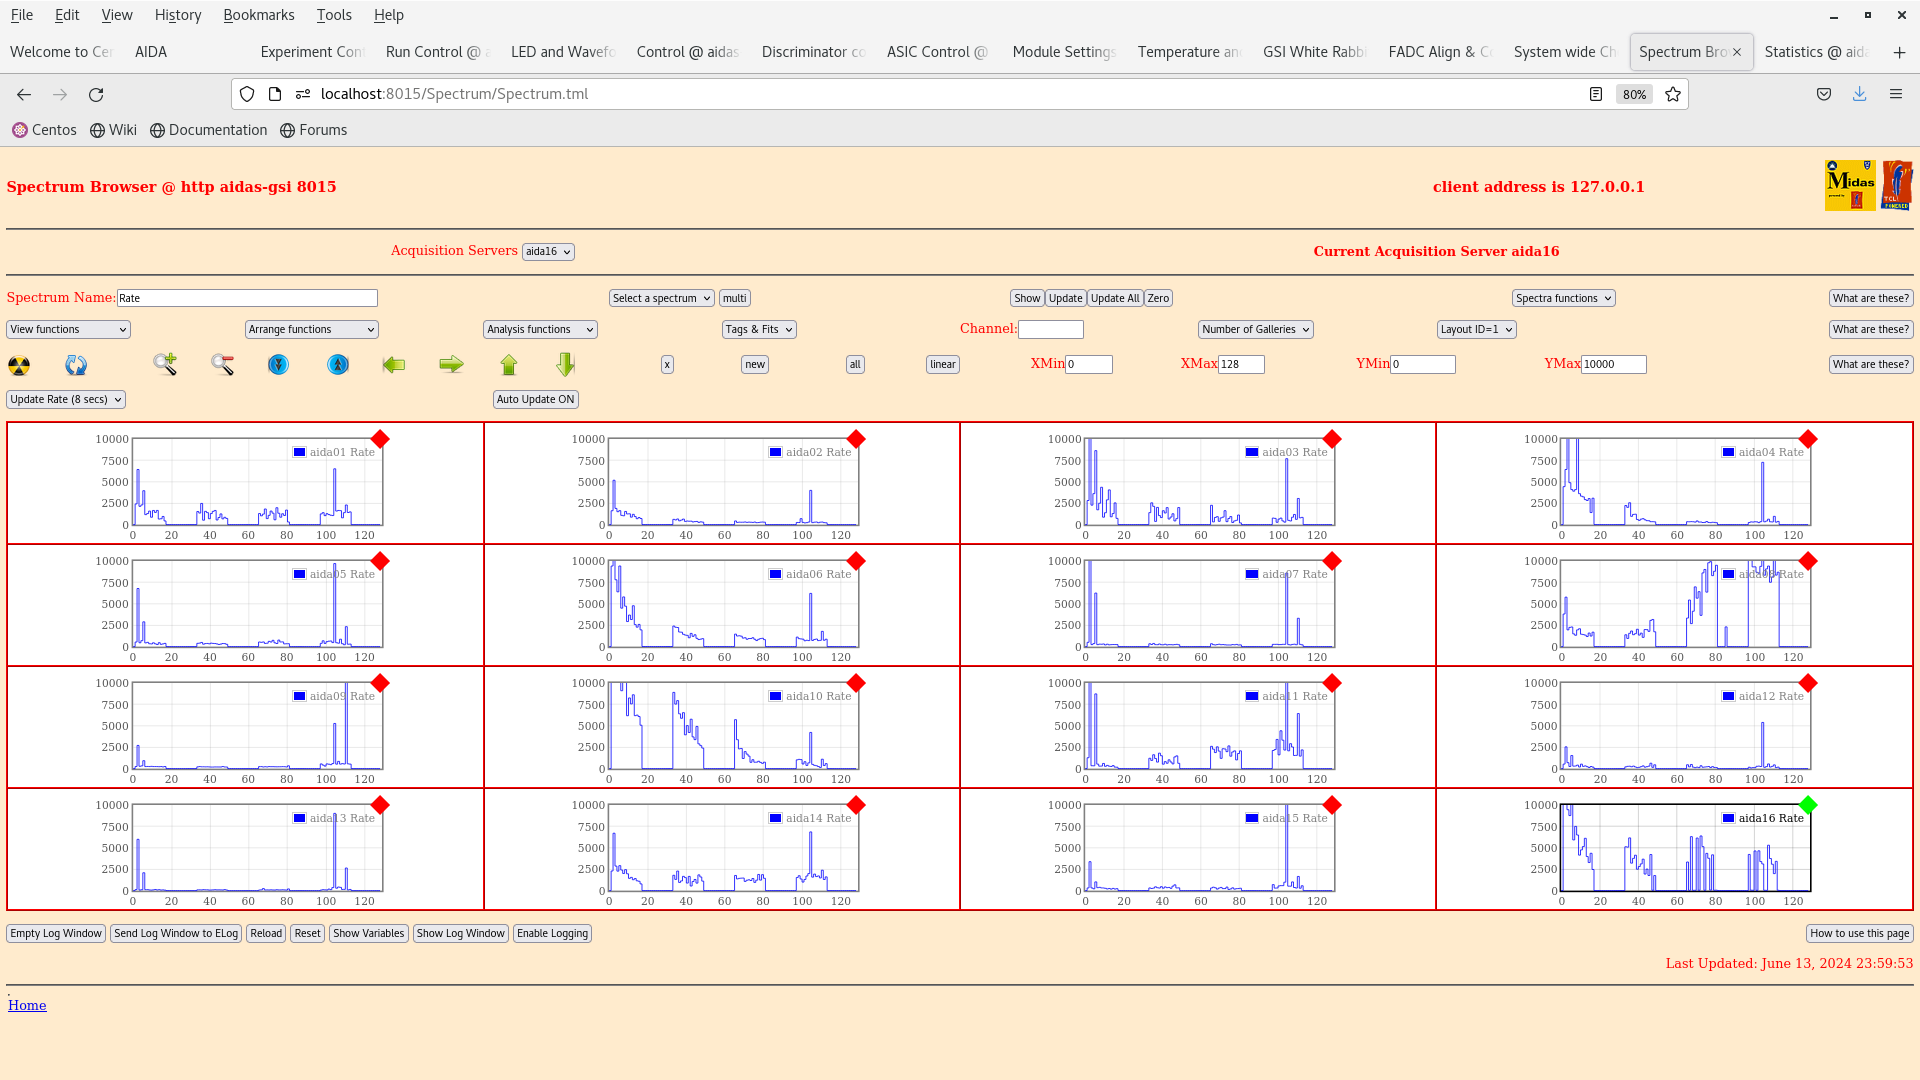
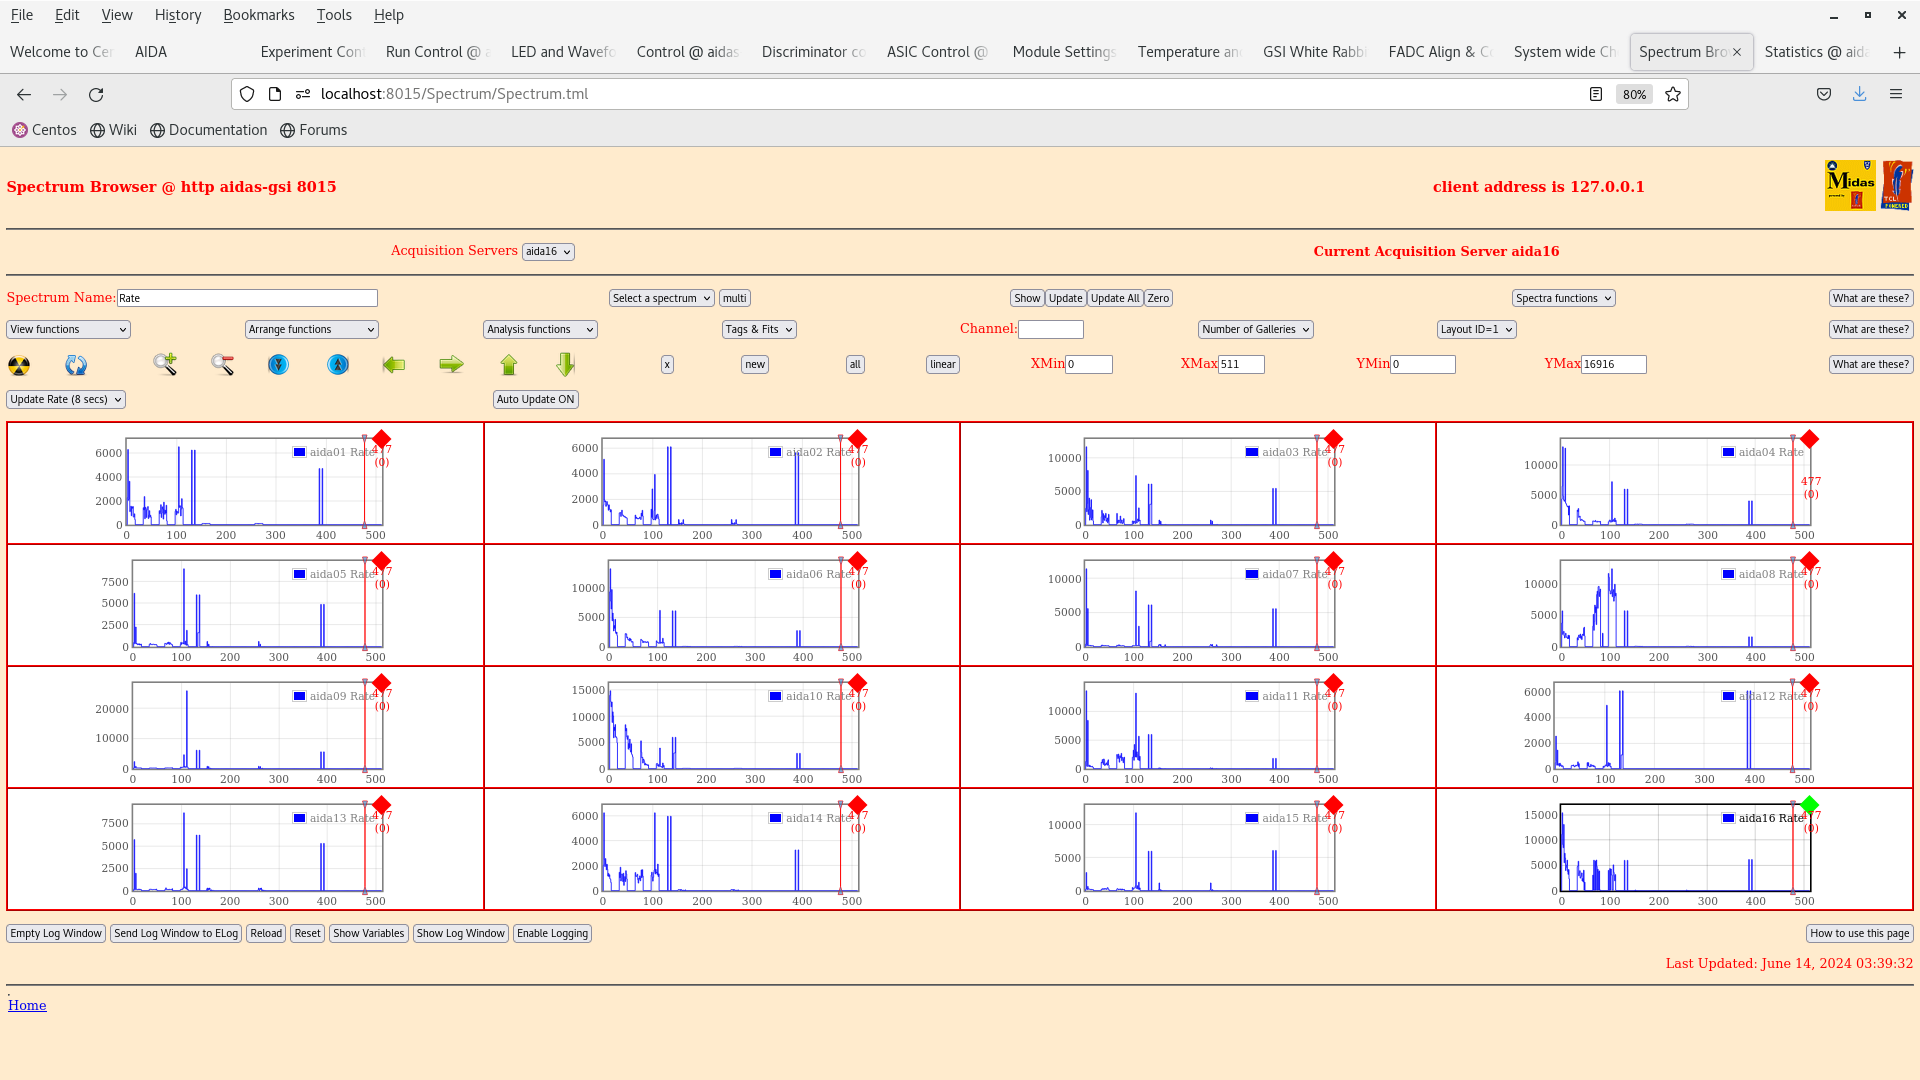
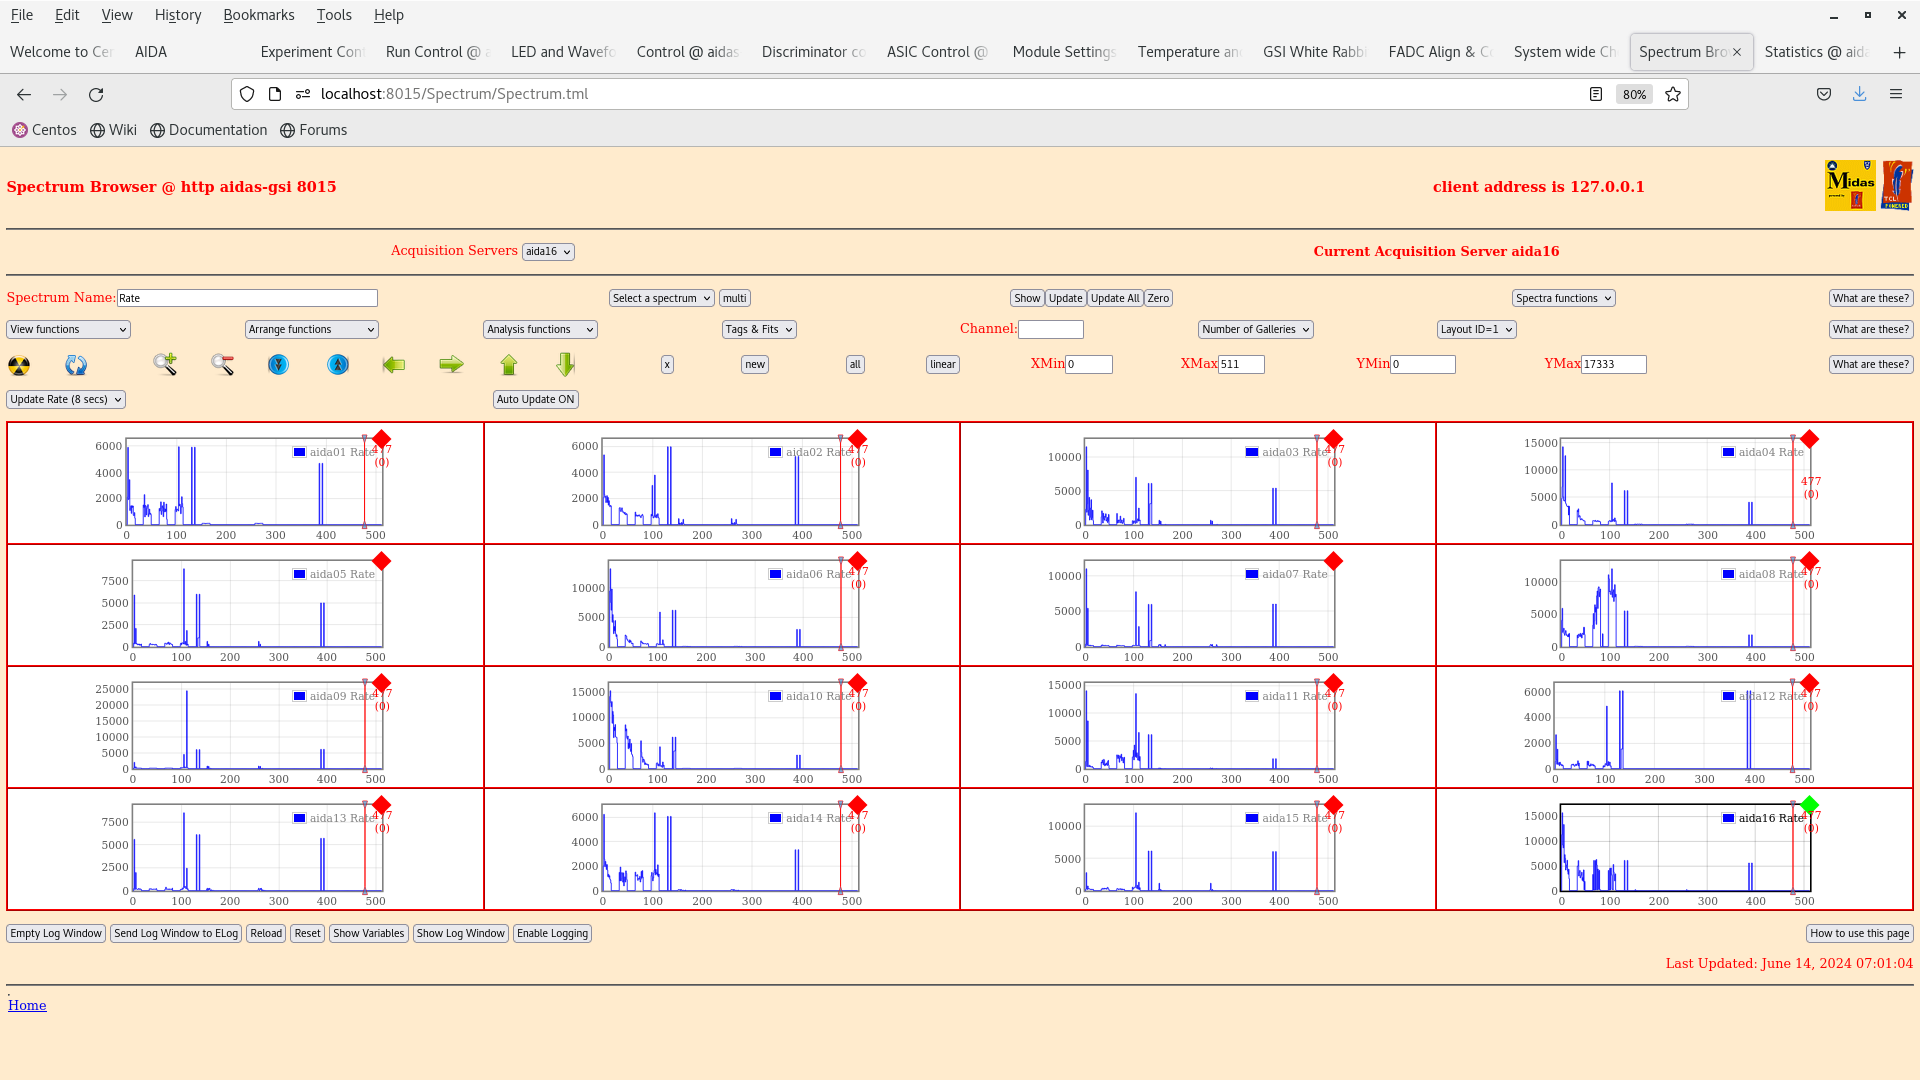
Rates attachment 2 + 3
Temps - attachment 4
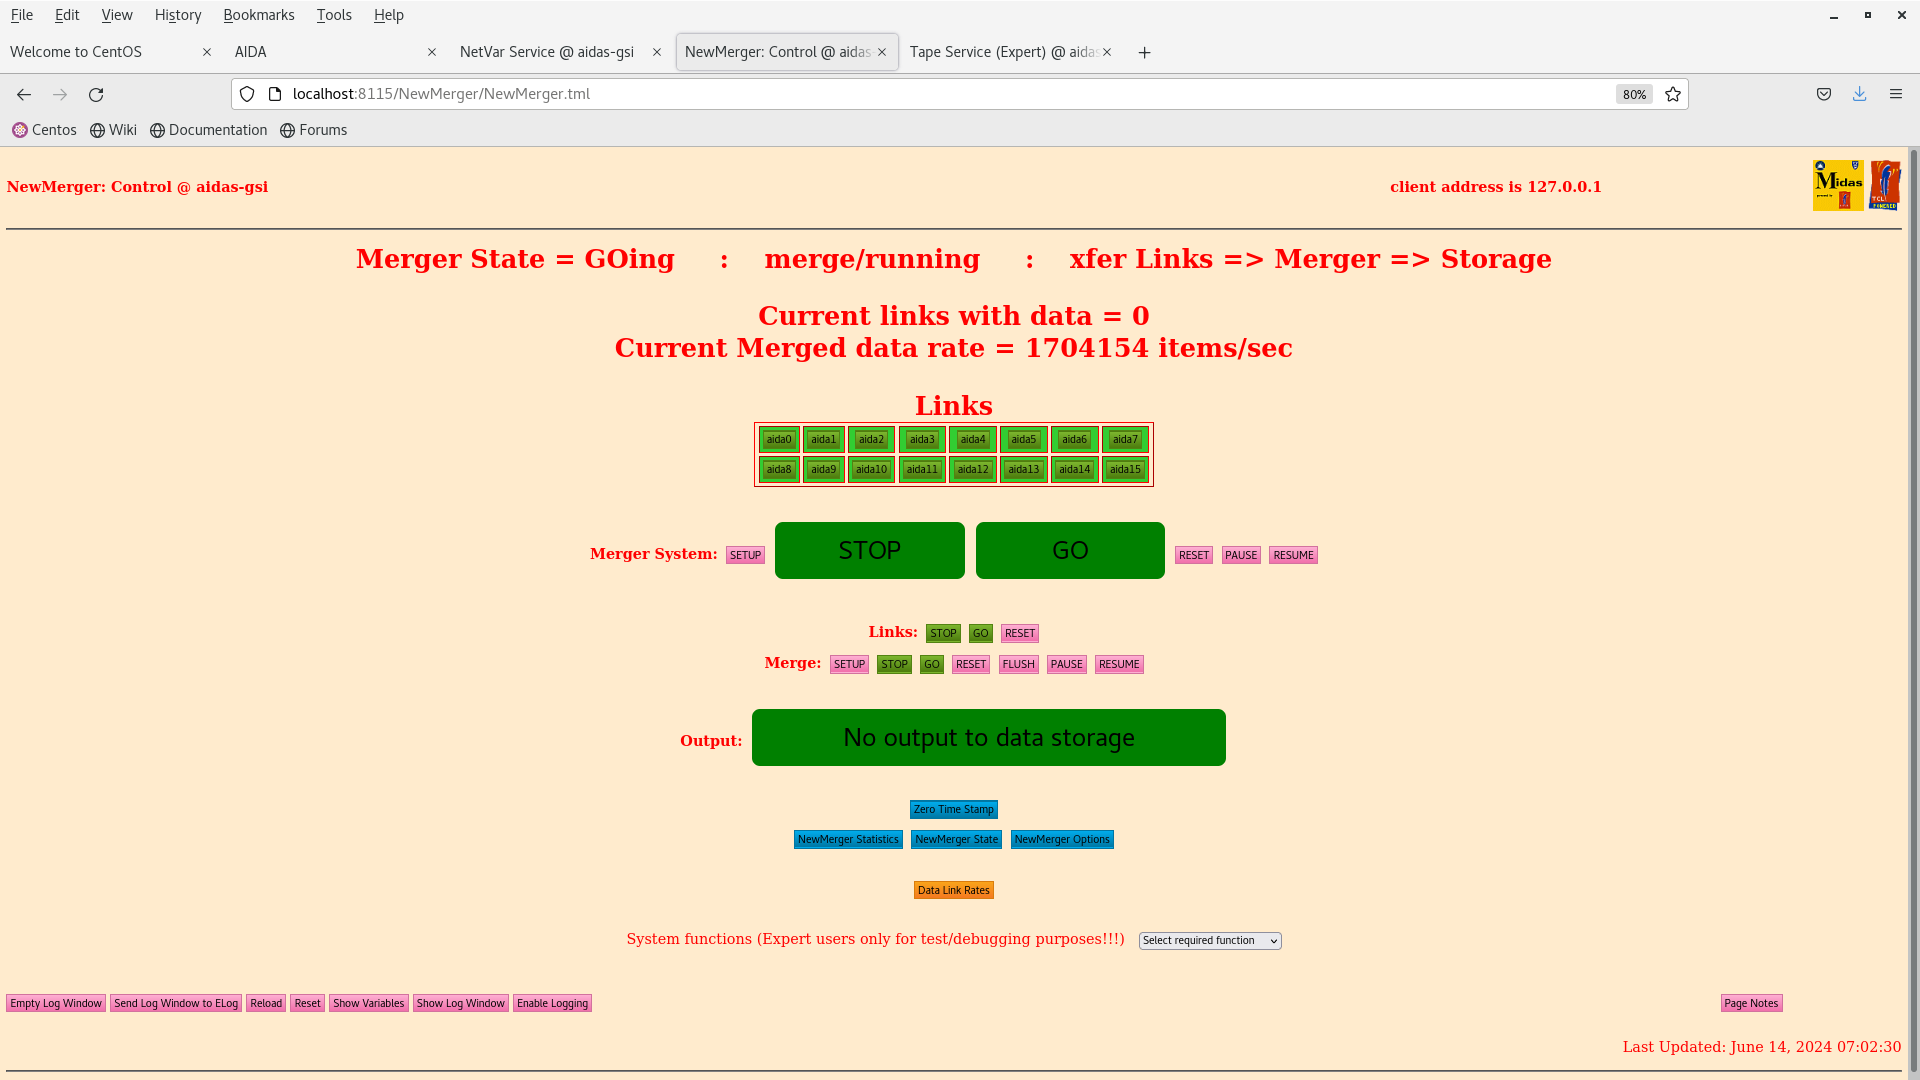
Merger - attachment 5
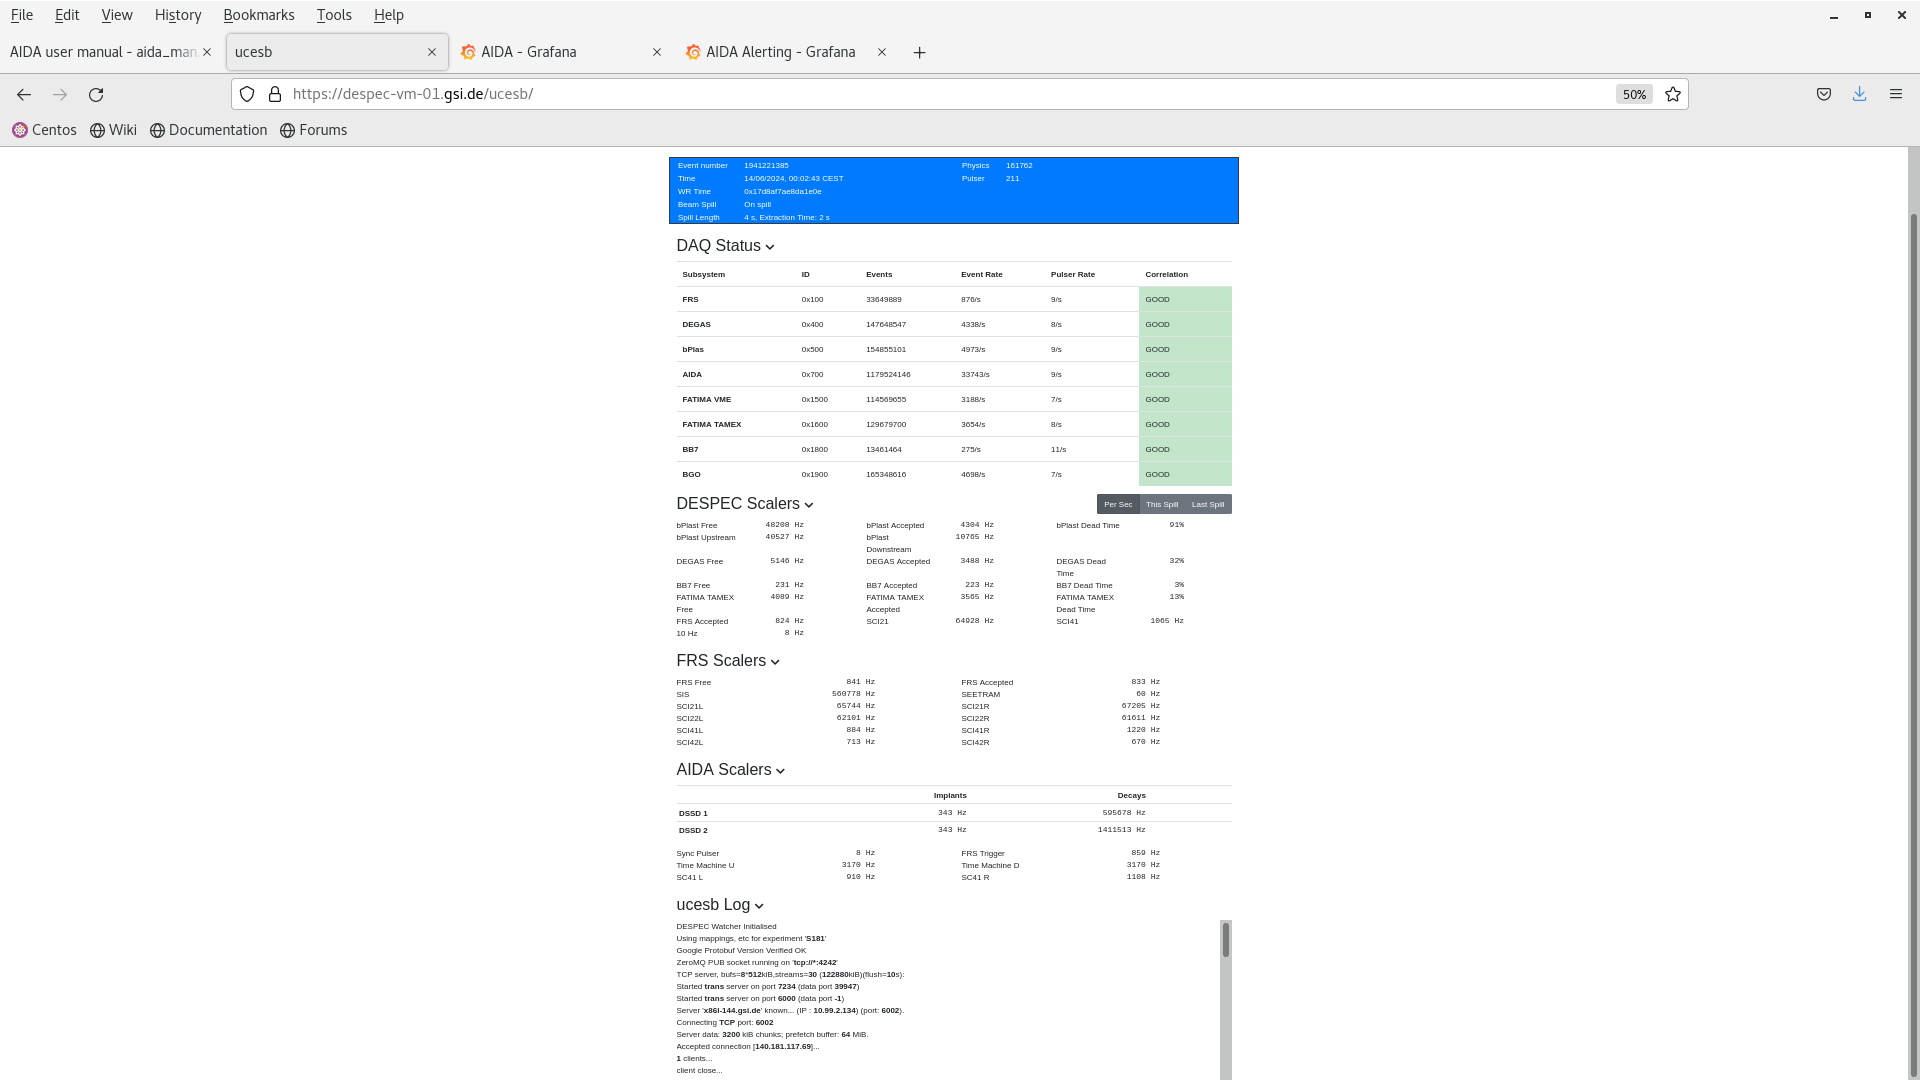
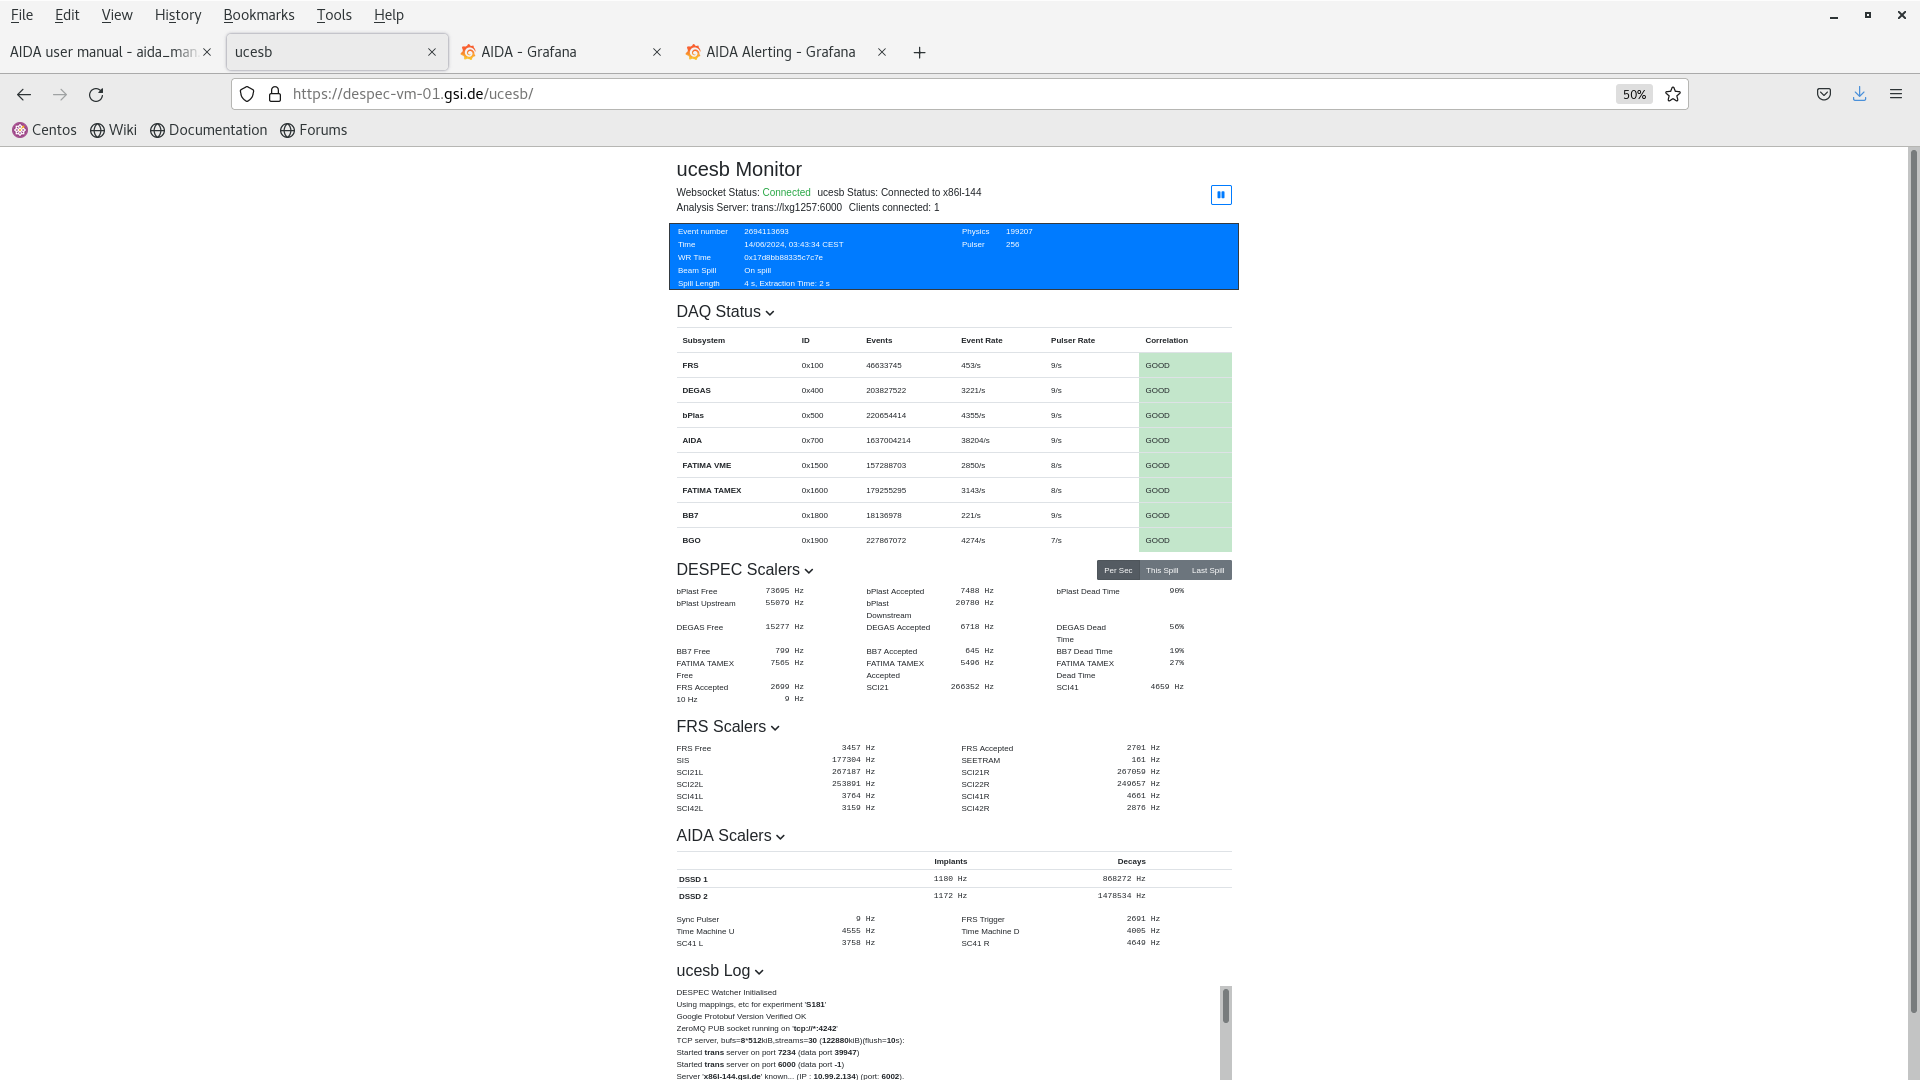
ucesb - attachment 6
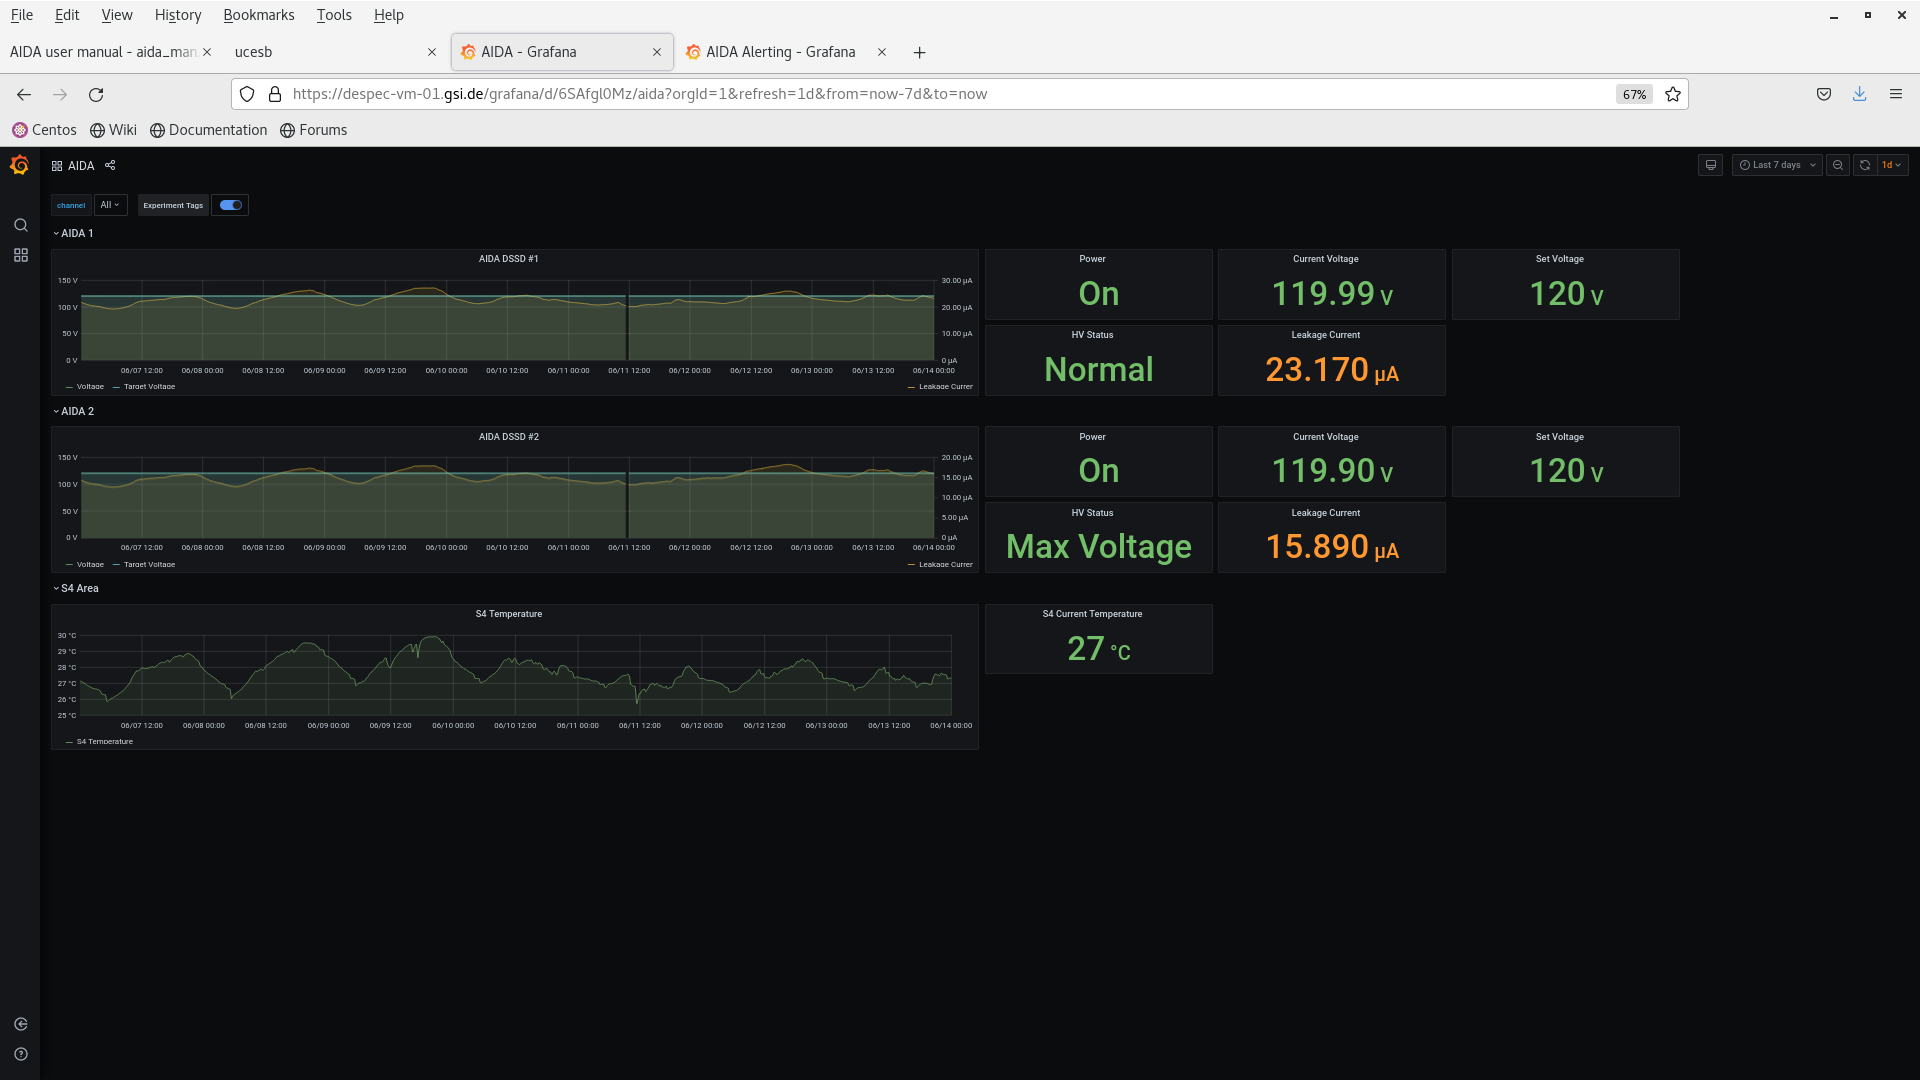
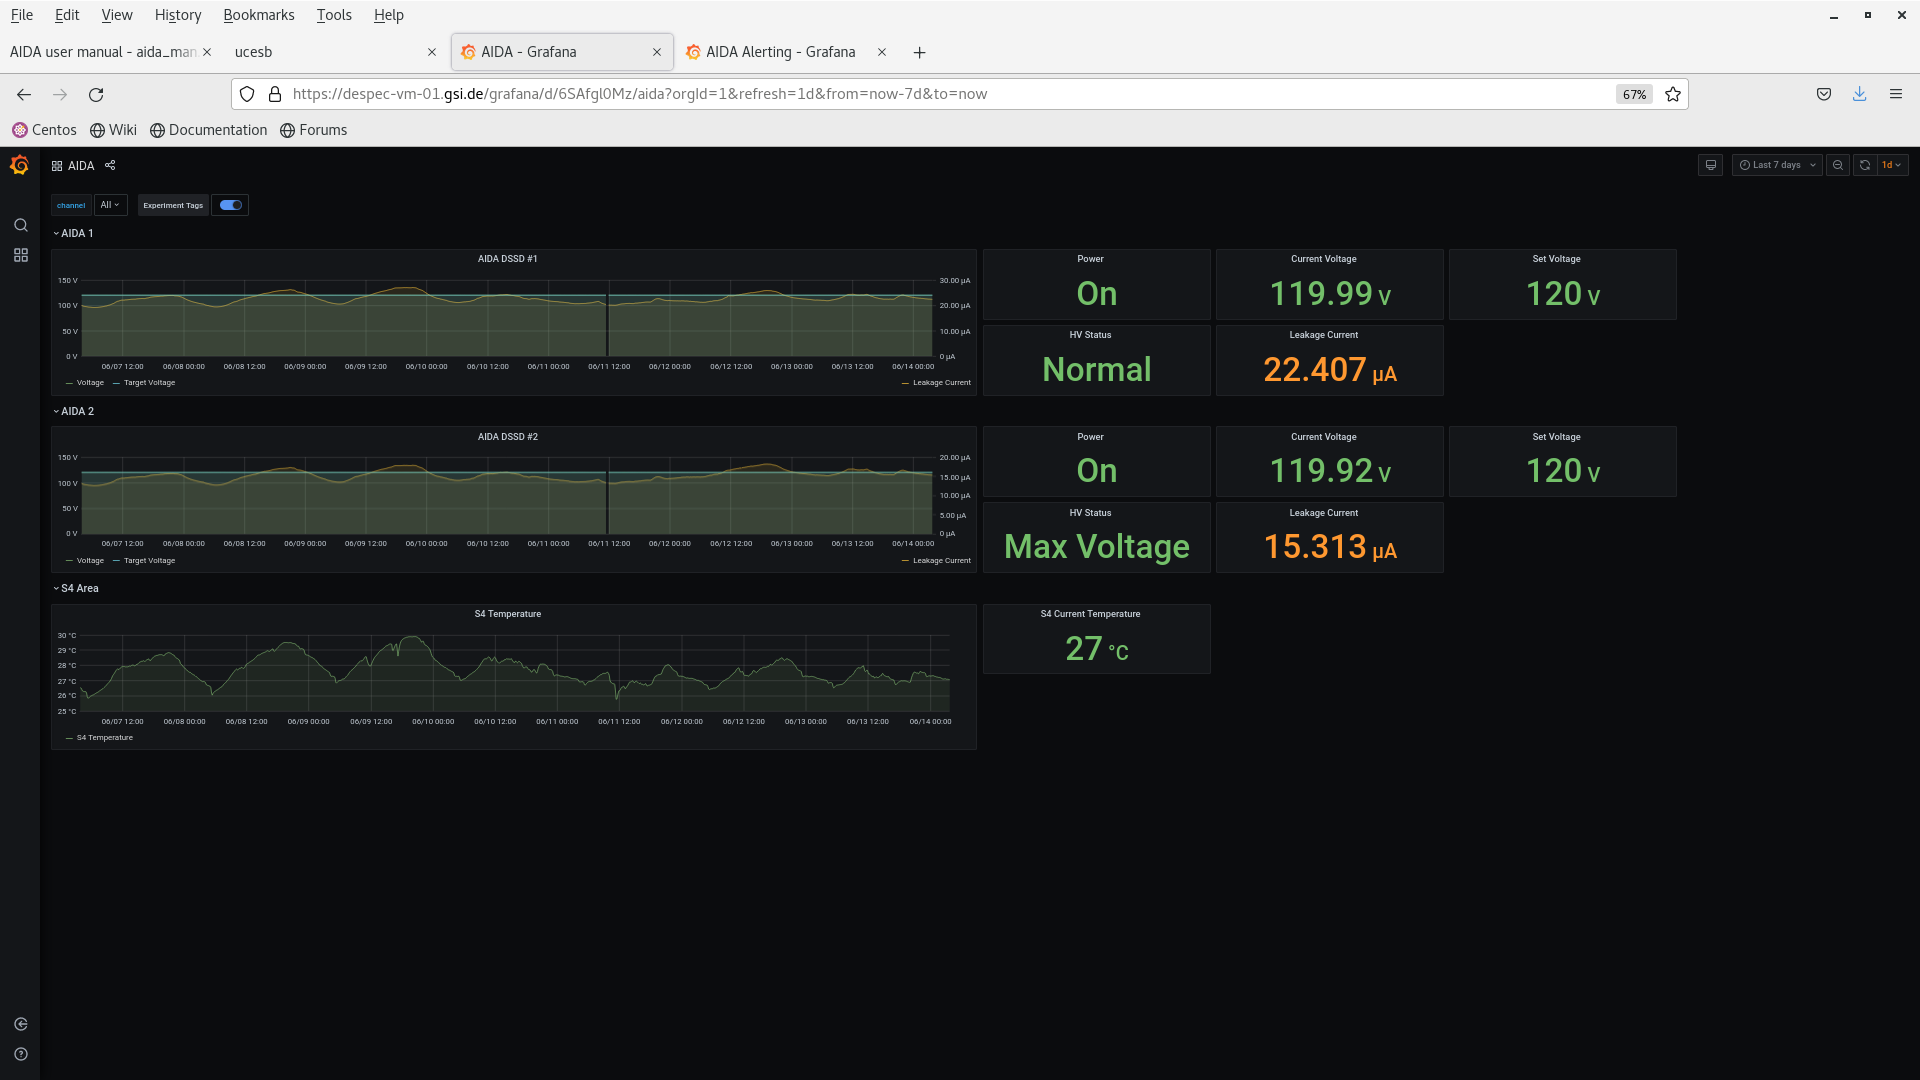
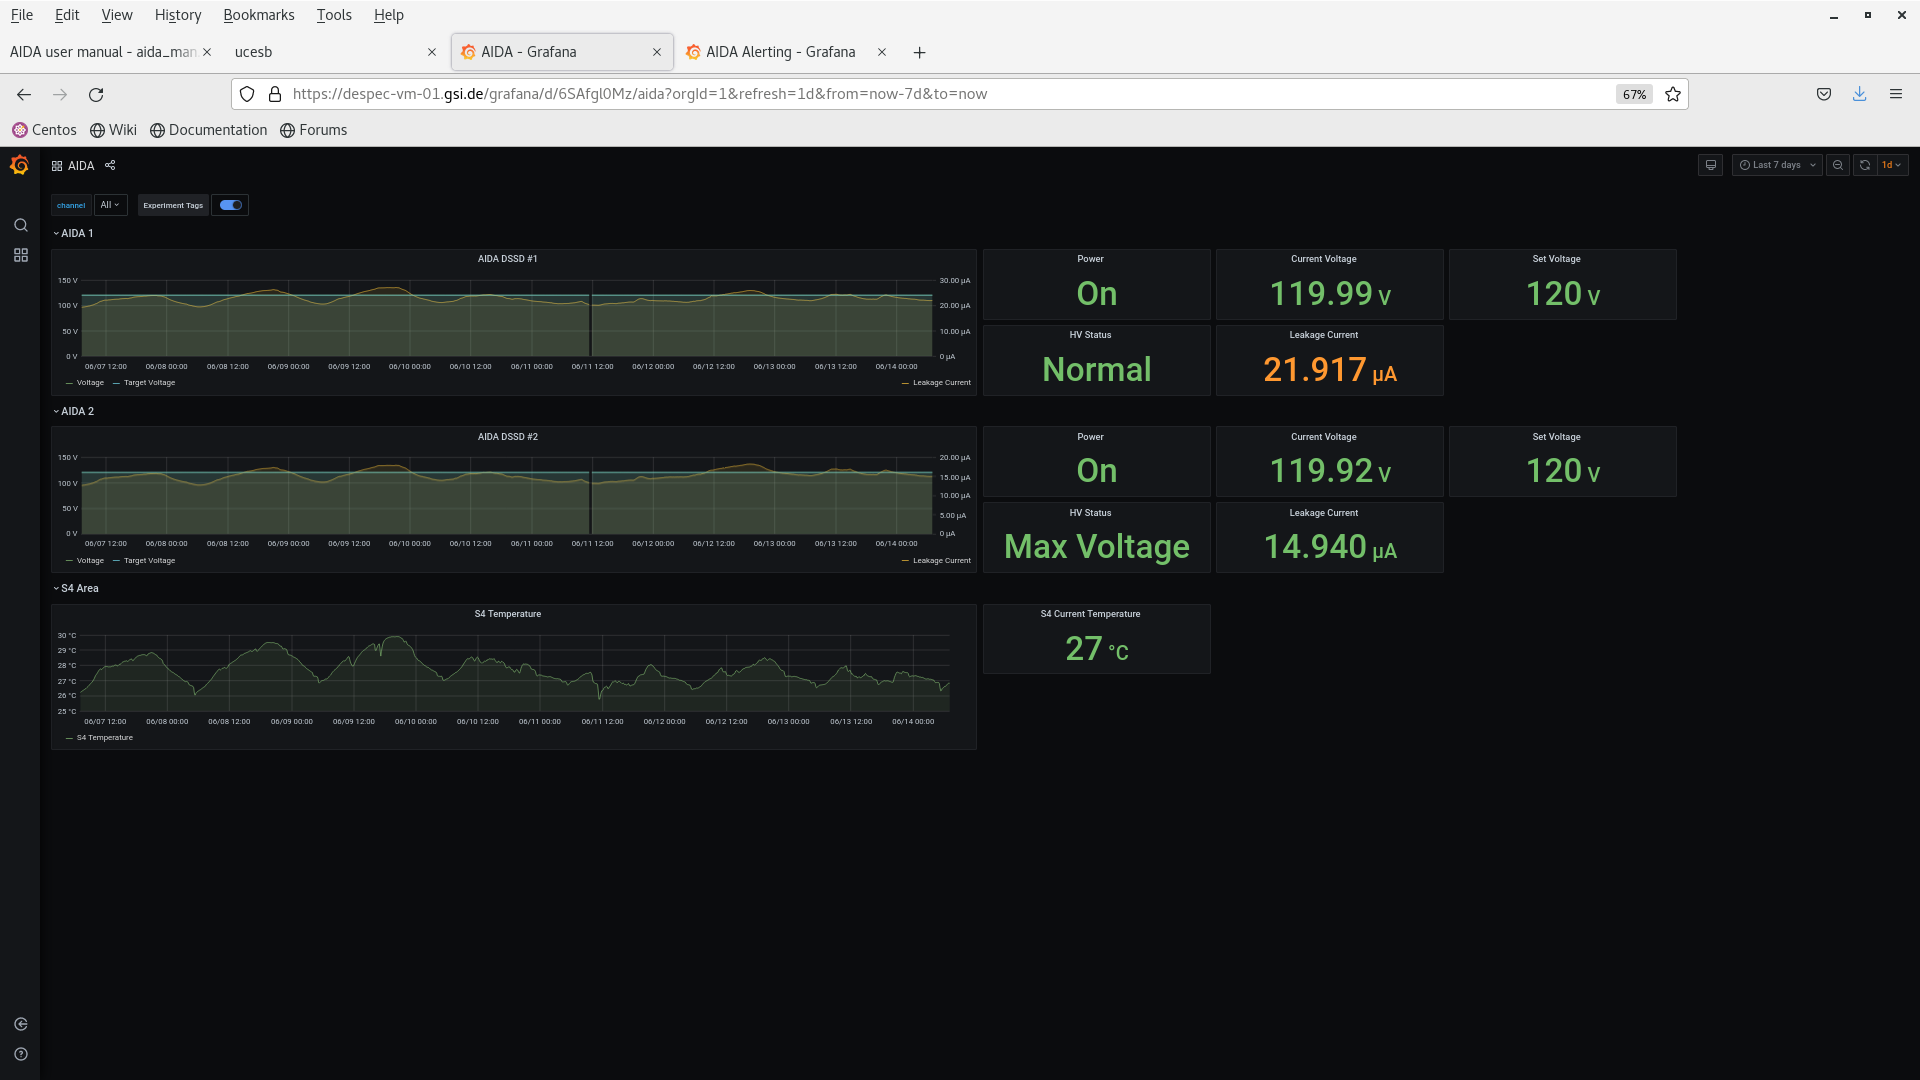
Grafana - attachment 7
1.30 -aida1 in merger Links, aida02 in rate spectra, has stopped - resetting DAQ.
Datafile R7_961 being written when stopped
1.40 - seems ok
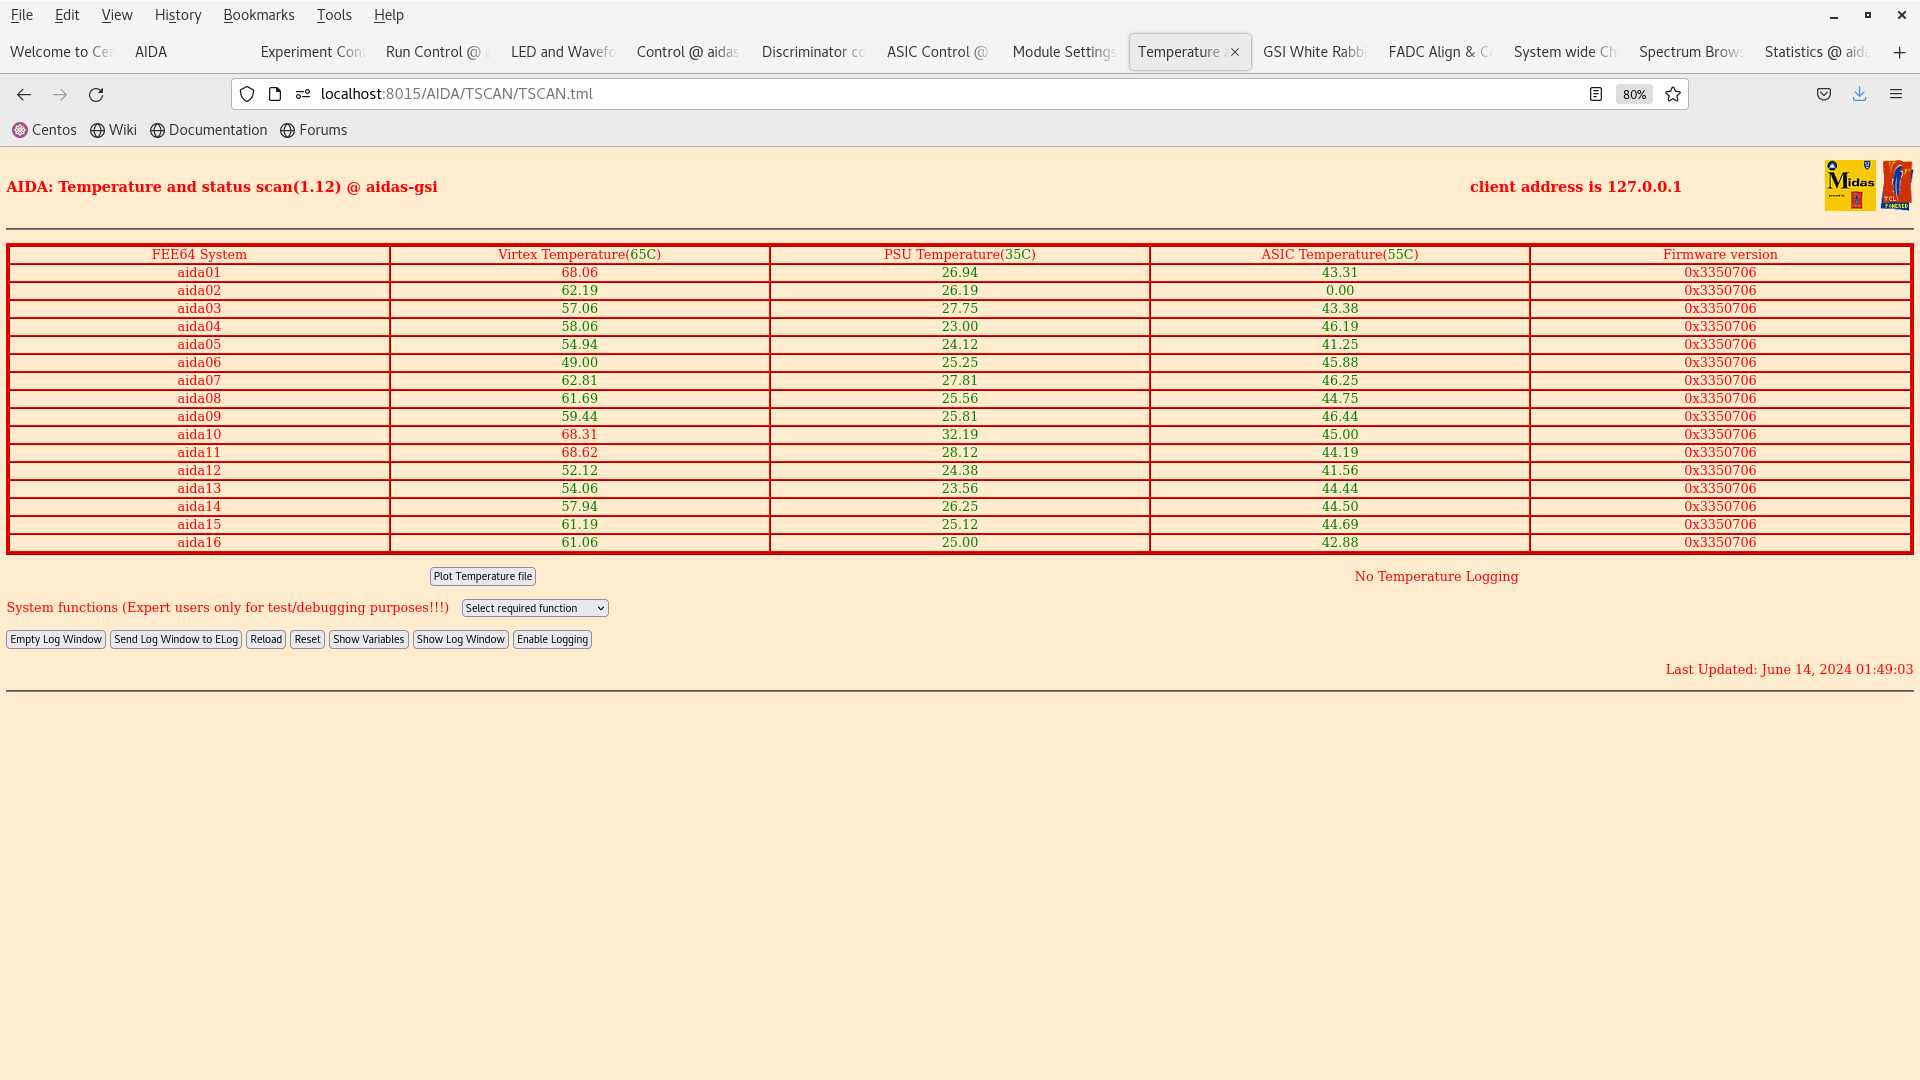
1.50 checks - seems ok
Voltage/currents - attachment 8
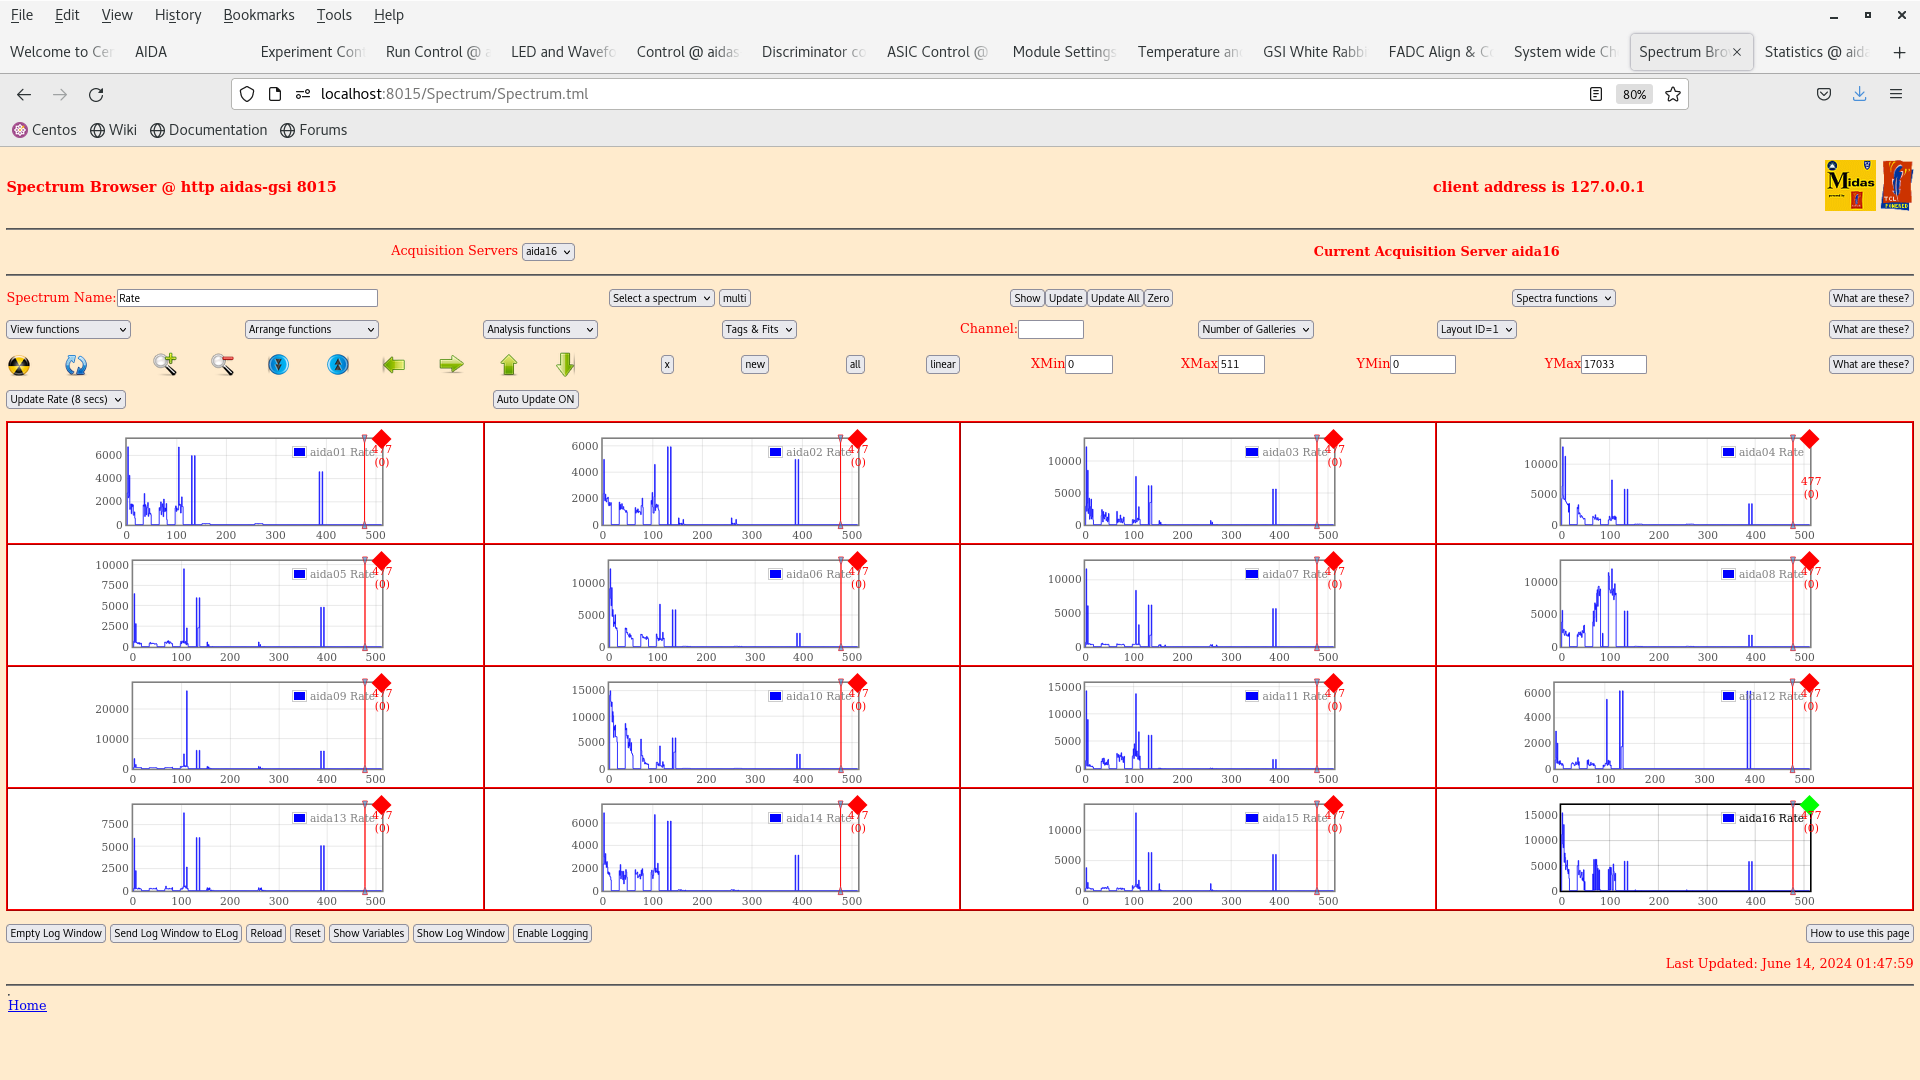
Rates attachment 9 + 10
Temps - attachment 11
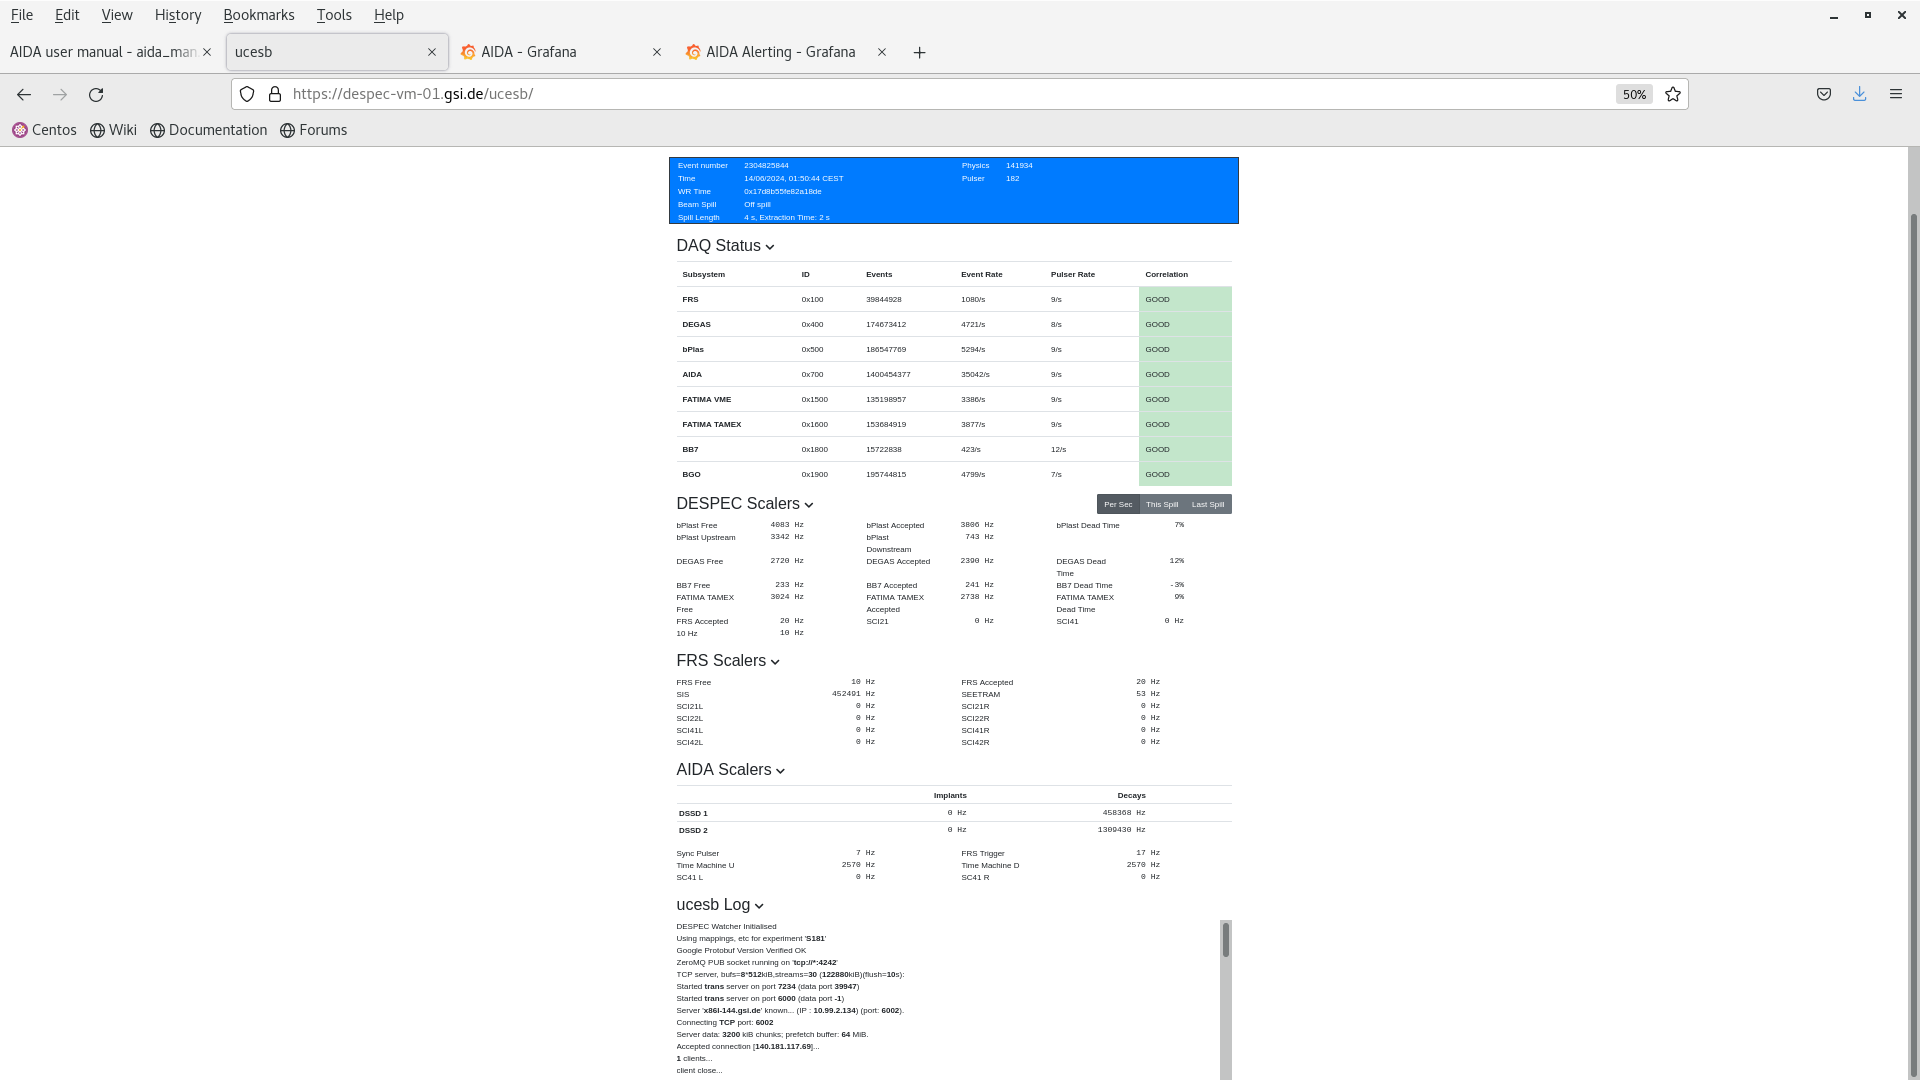
Merger - attachment 12
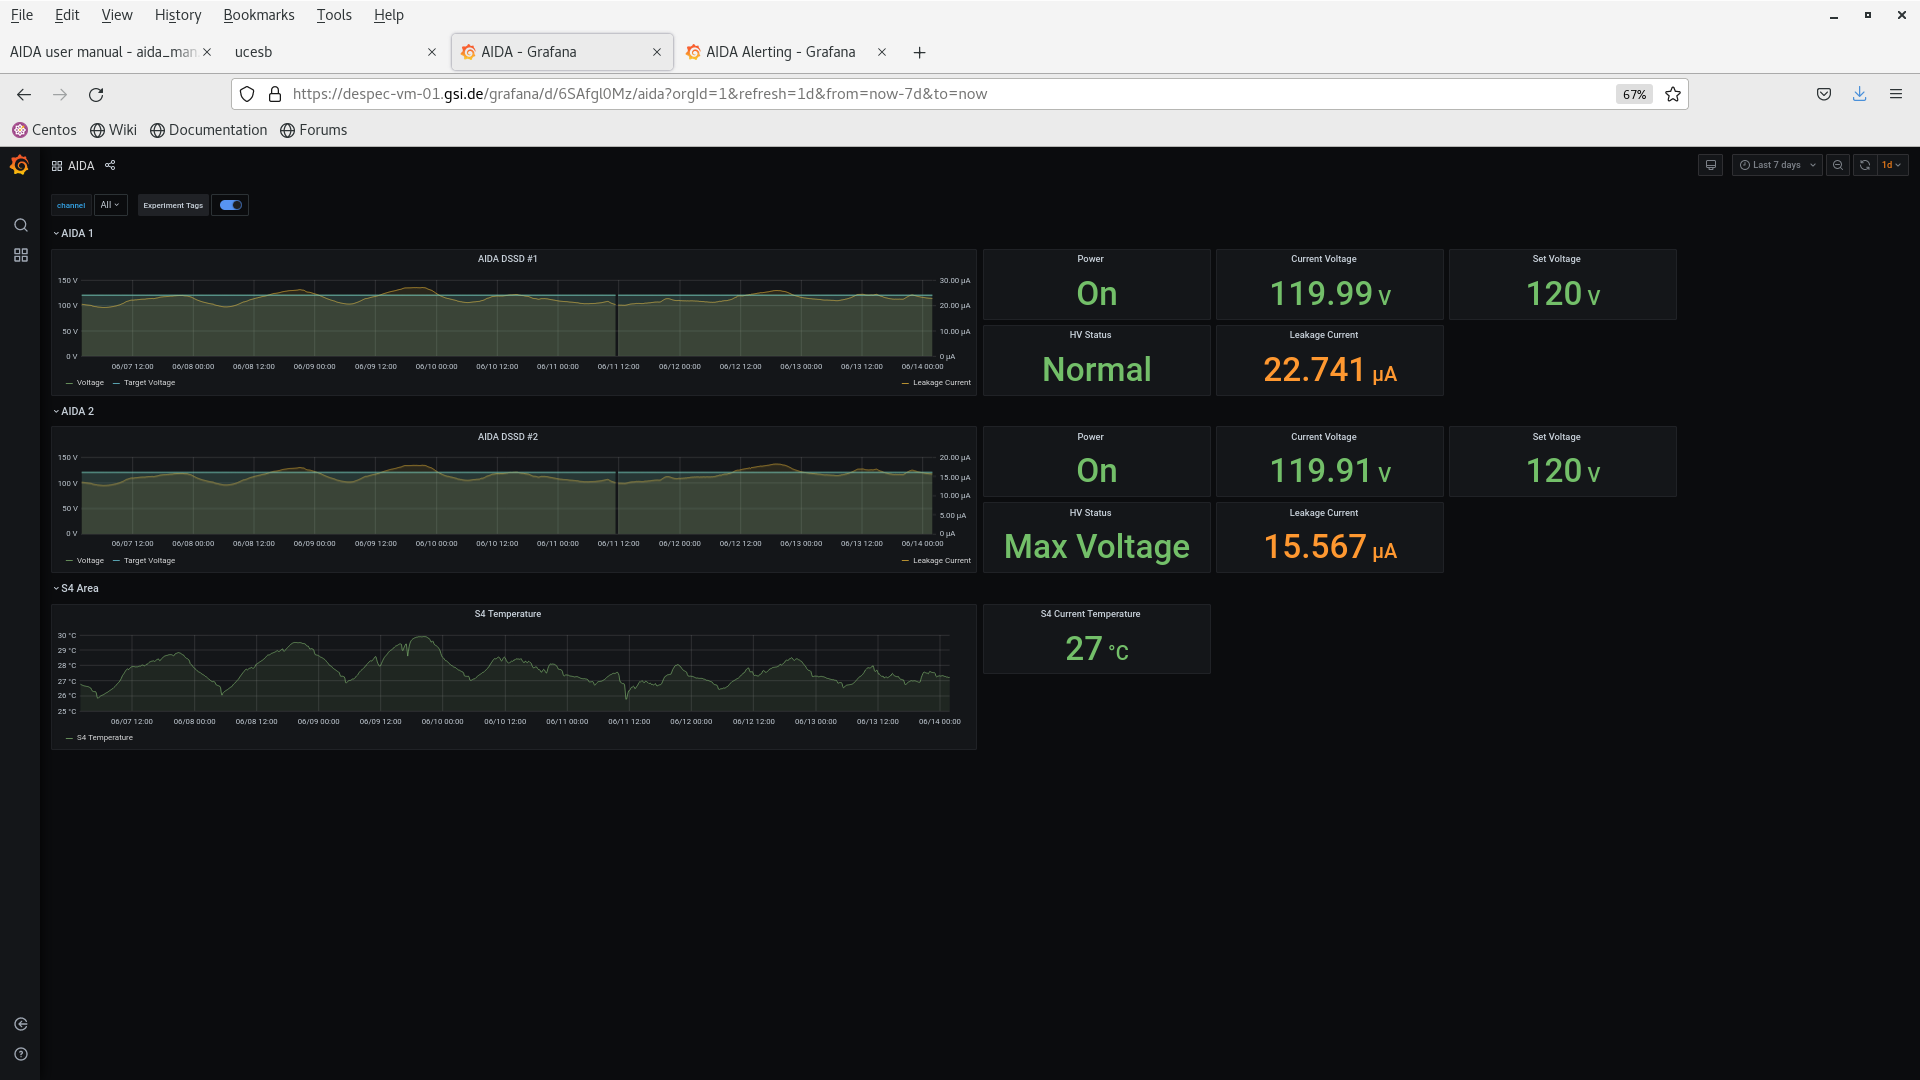
ucesb - attachment 13
Grafana - attachment 14
3.30 -aida1 in merger Links, aida02 in rate spectra, has stopped again - resetting DAQ.
Datafile R7_1010 being written when stopped
3.38 - seems ok
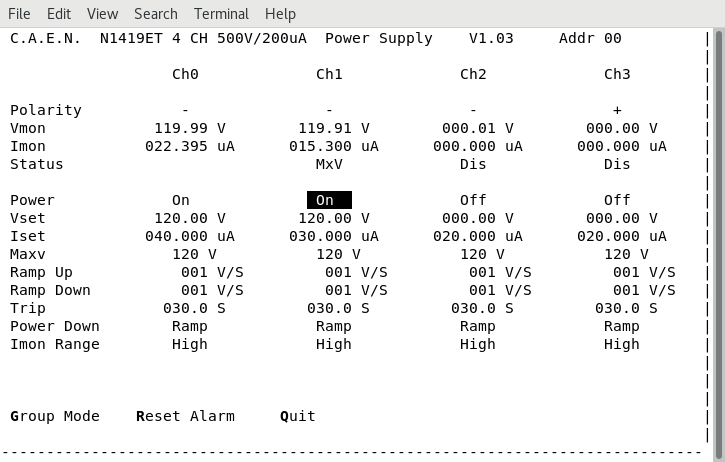
3.40 checks - all looks ok
Voltage/currents - attachment 15
Rates attachment 16 + 17
Temps - attachment 18
Merger - attachment 19
ucesb - attachment 20
Grafana - attachment 21
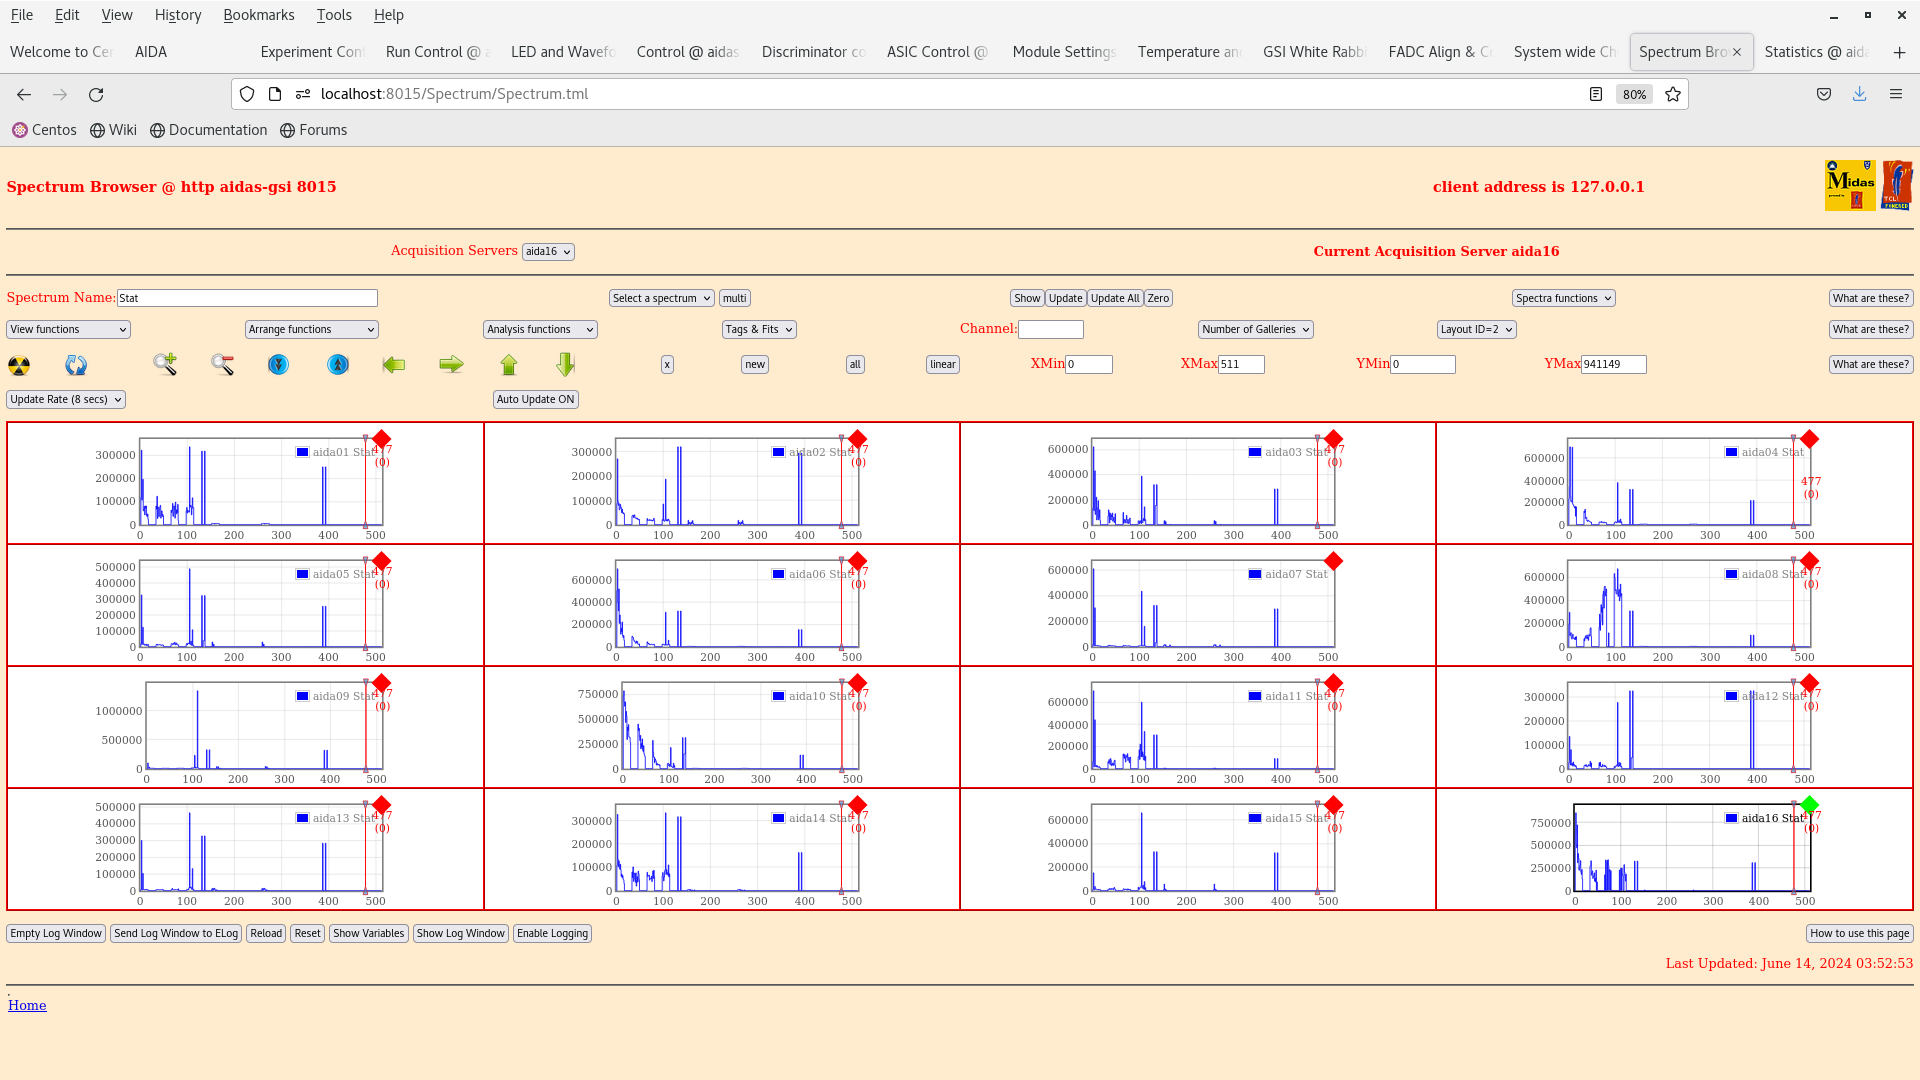
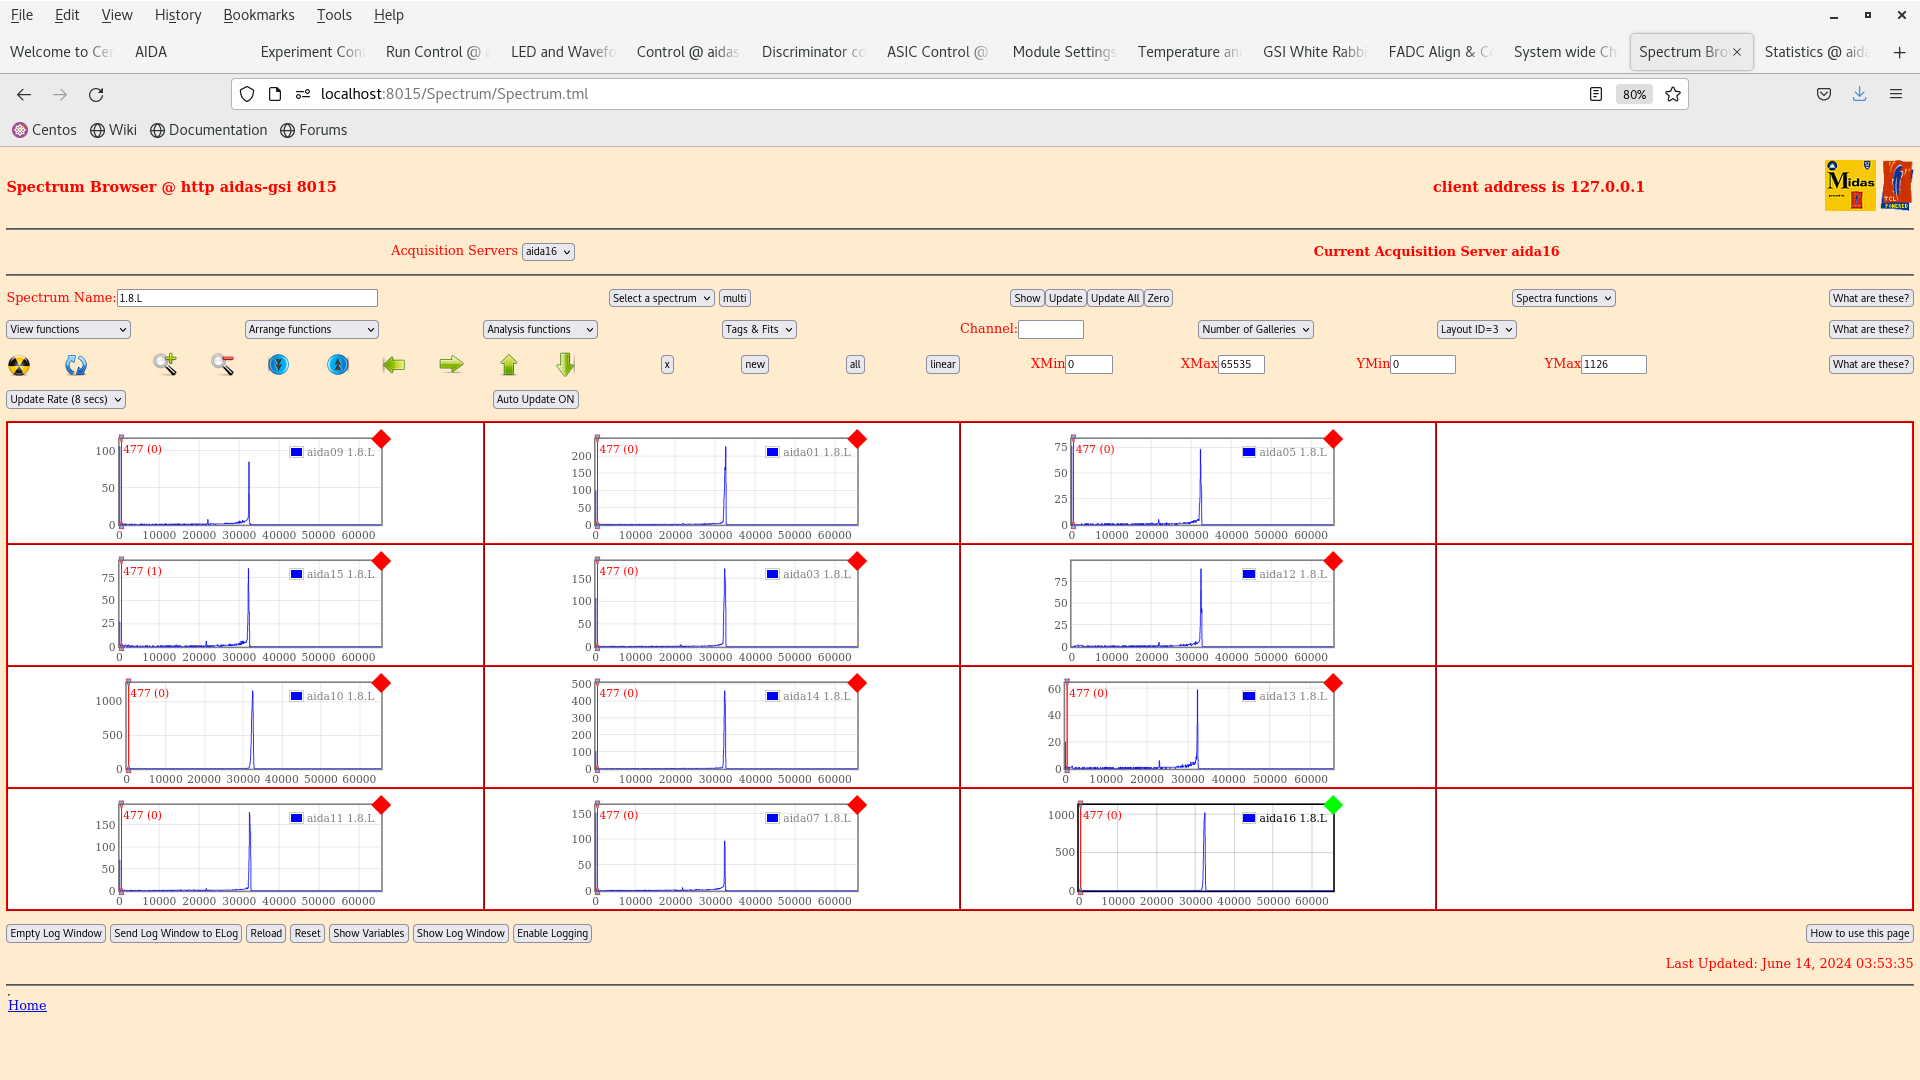
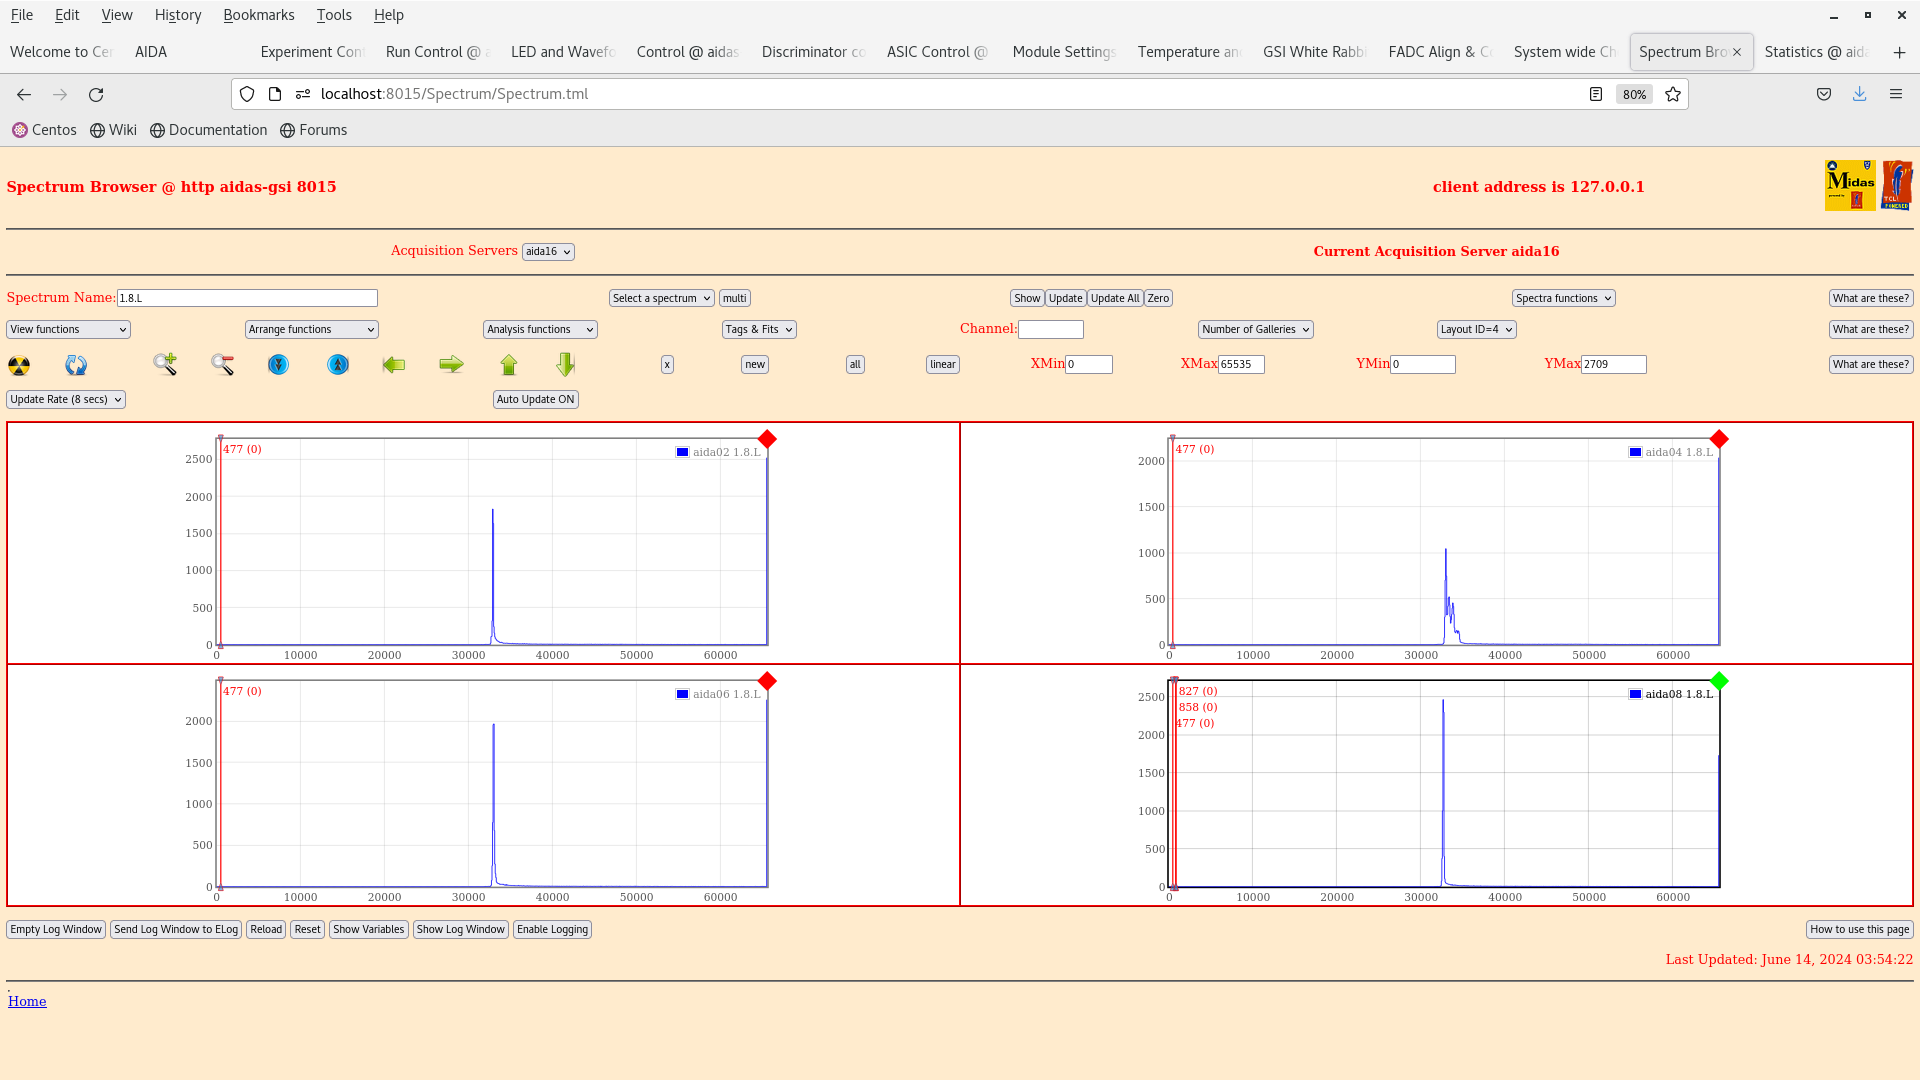
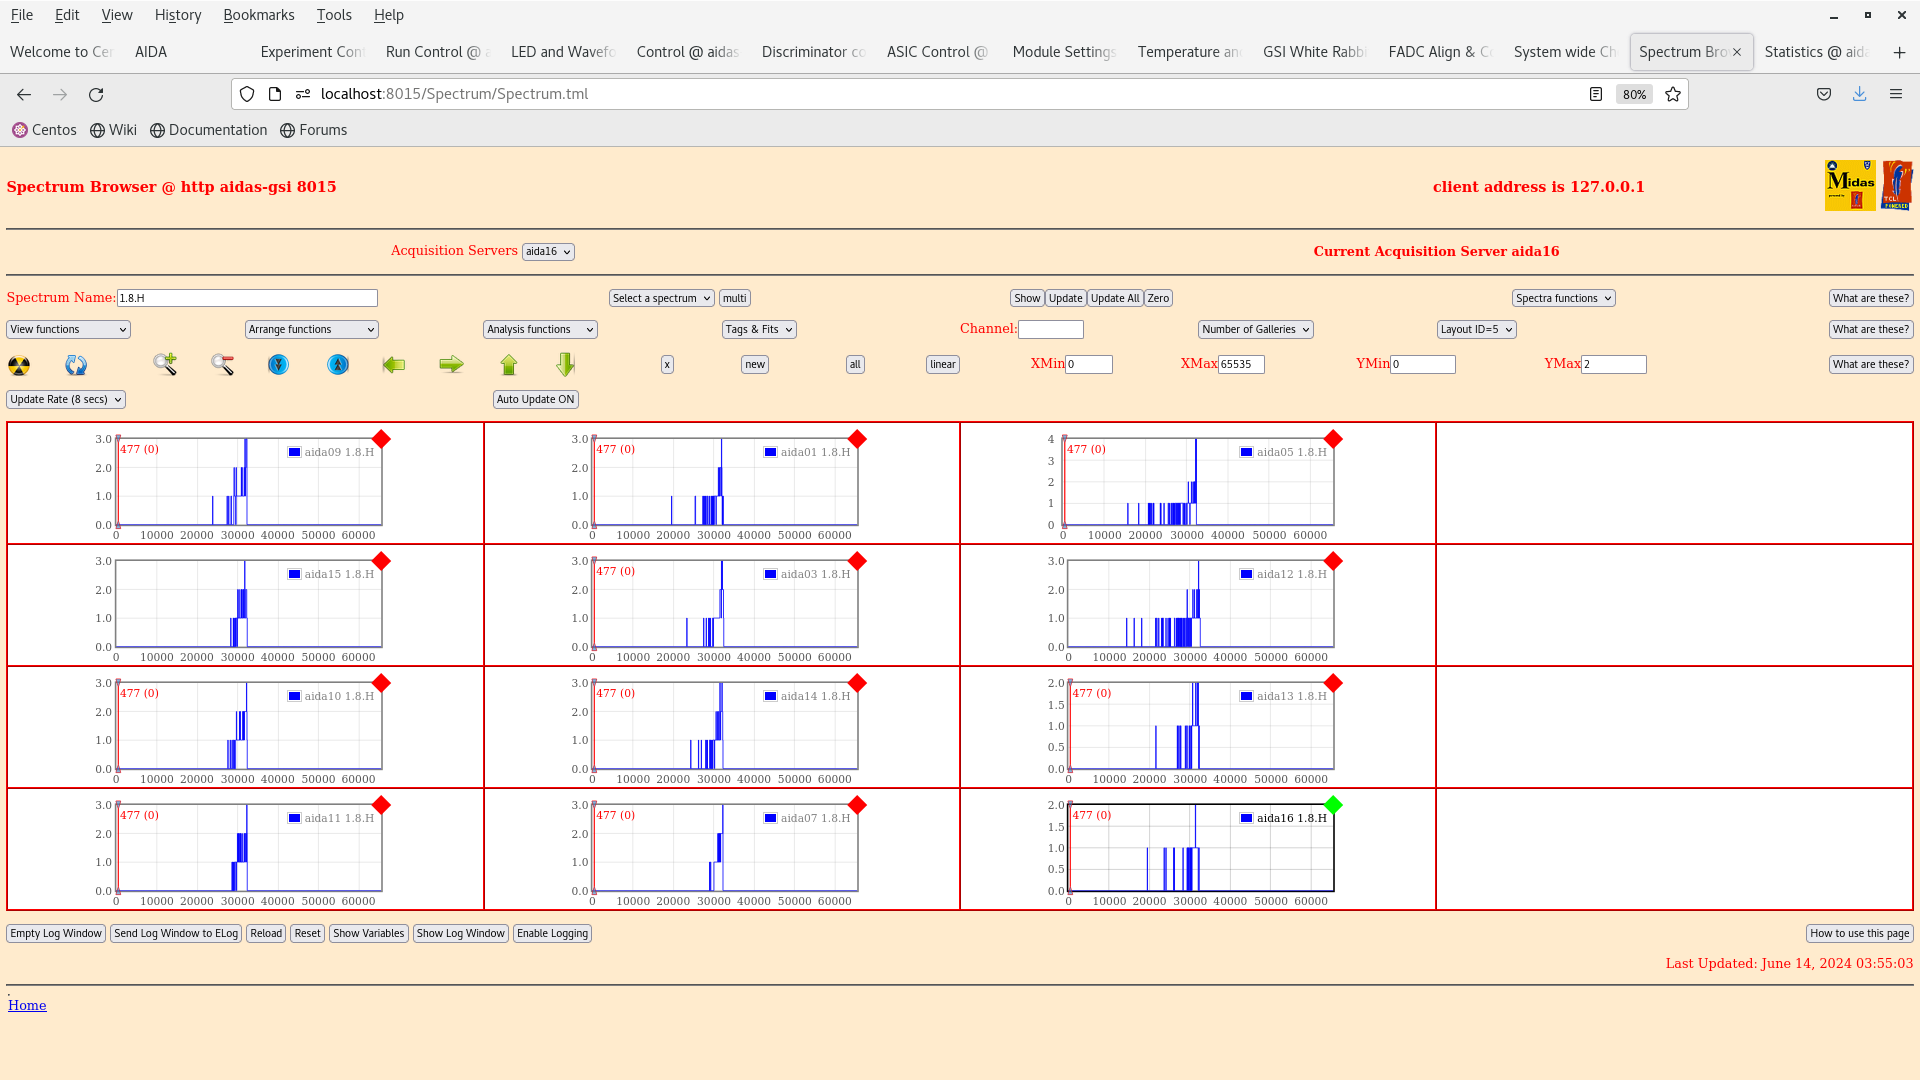
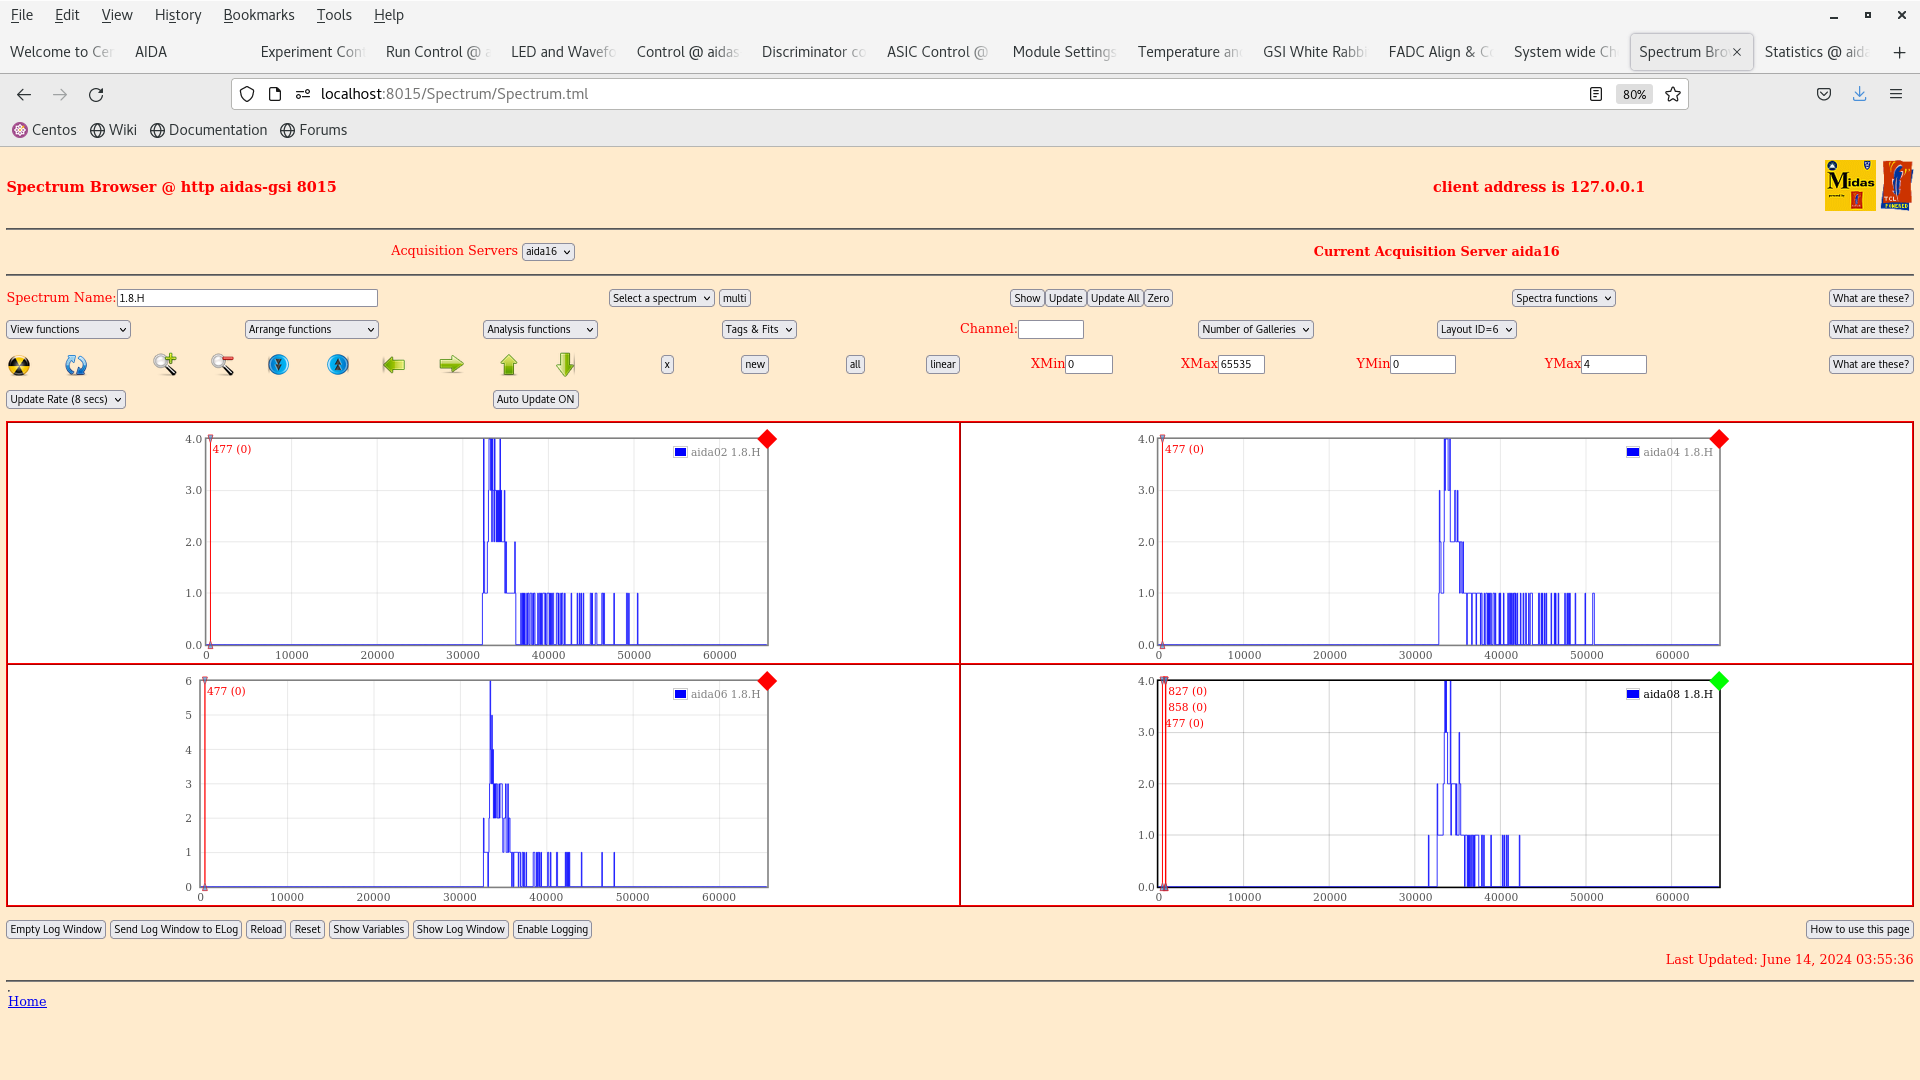
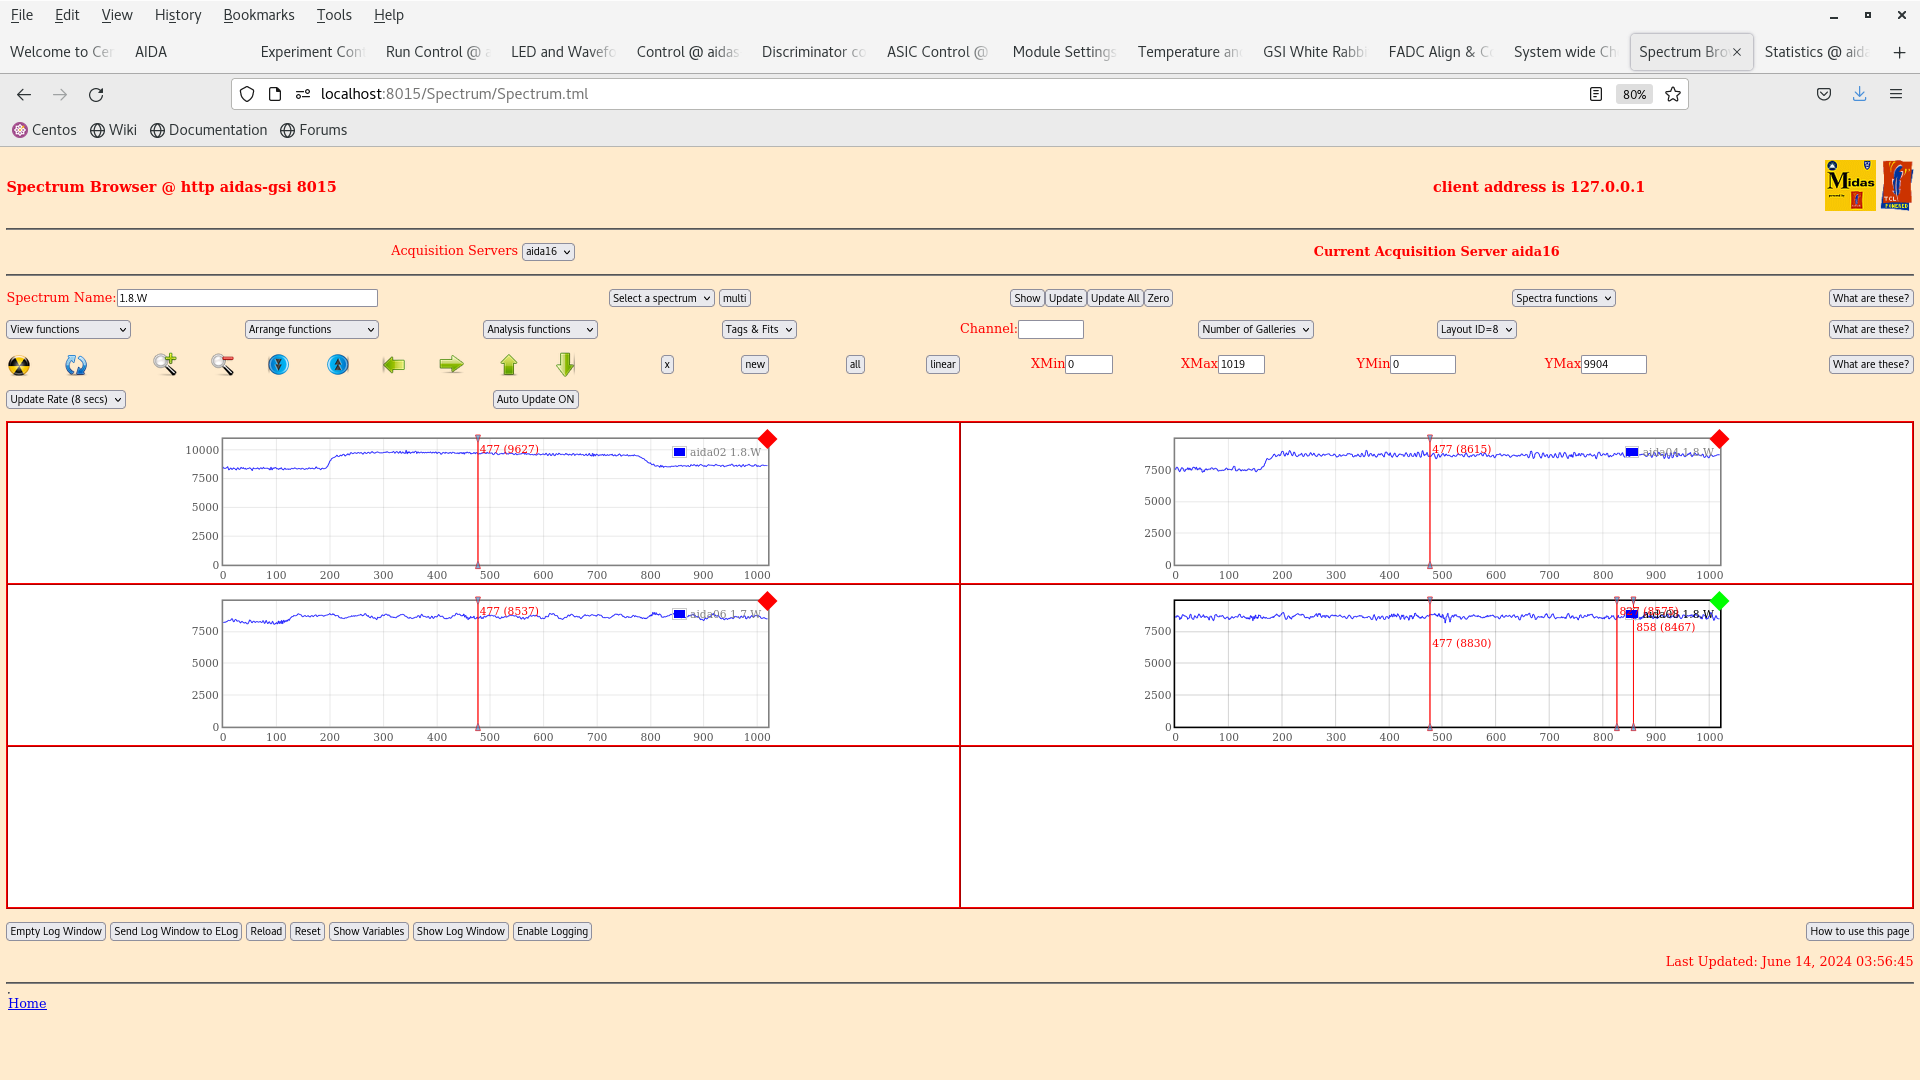
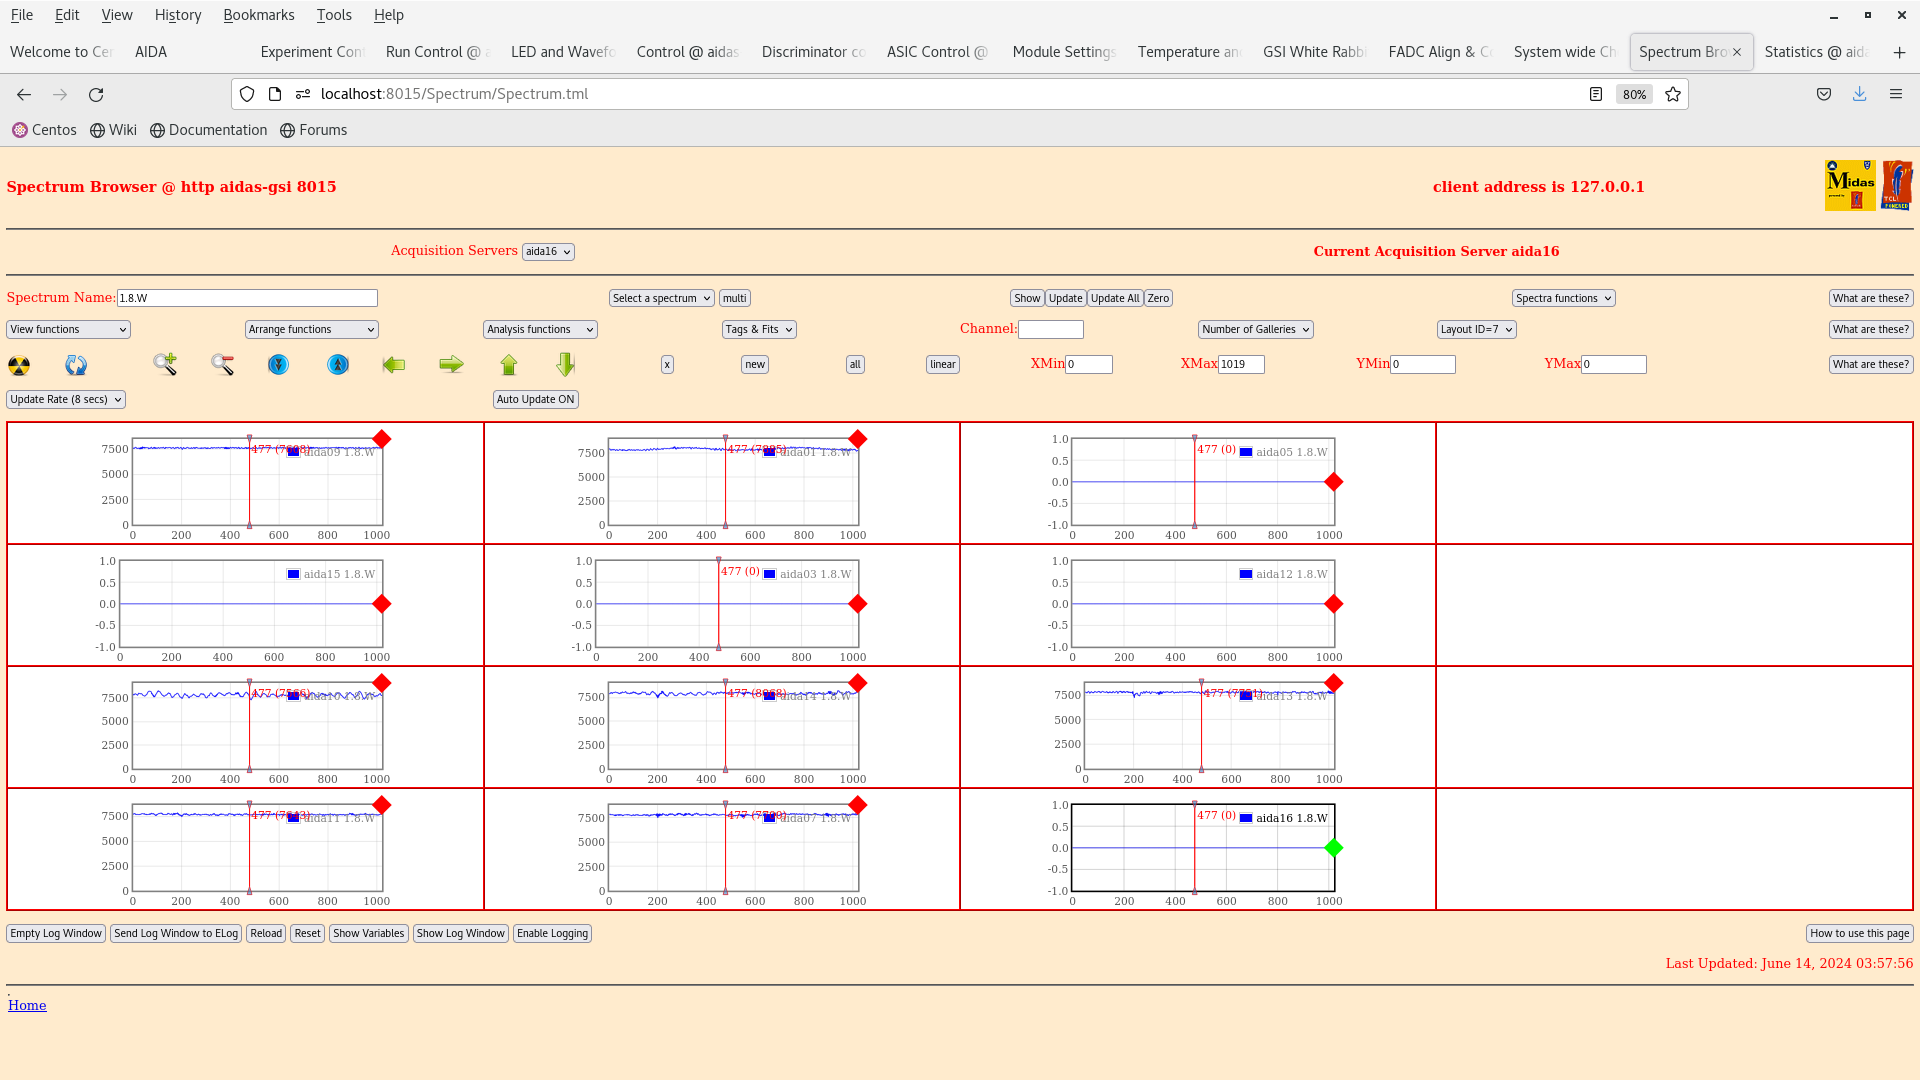
Zeroed spectra - attachments 22-28
5.39 -aida1 in merger Links, aida02 in rate spectra, has stopped again - resetting DAQ.
Datafile R7_1062 being written when stopped
AIDA out of the main data
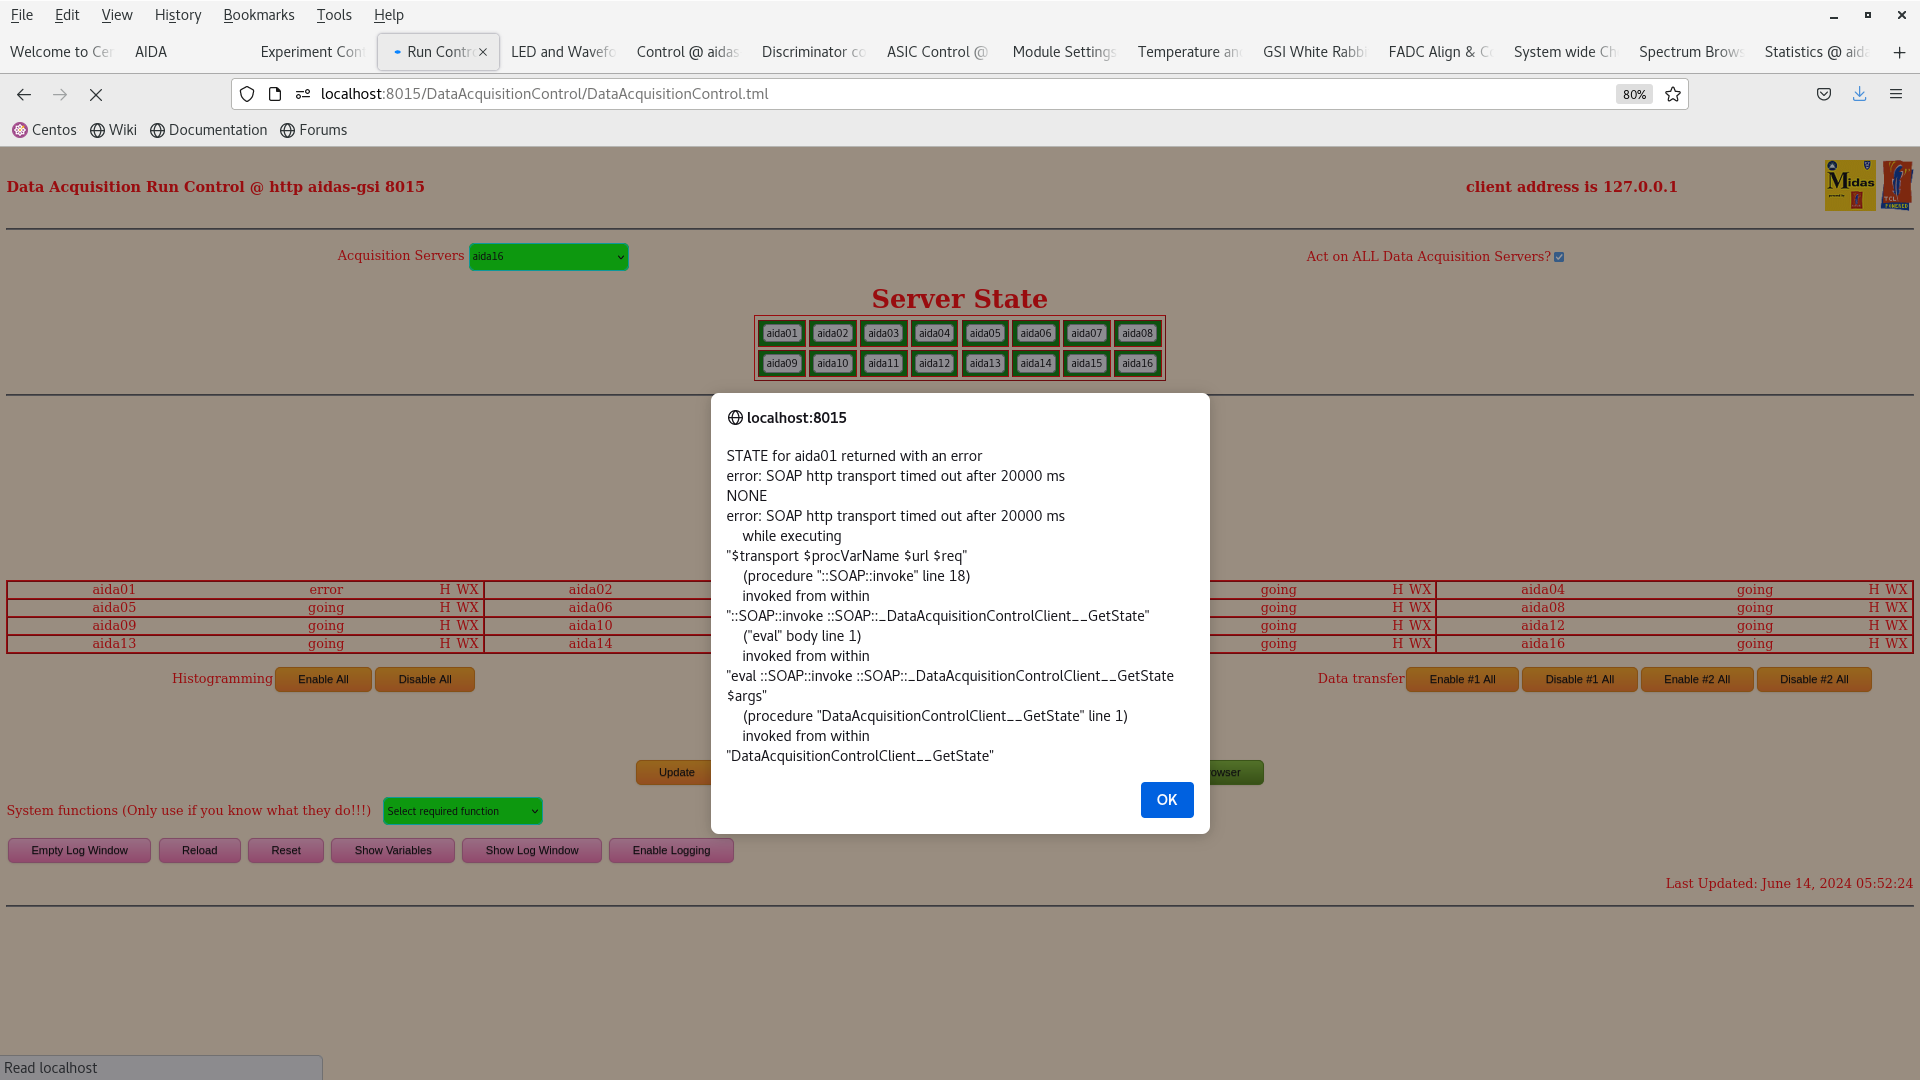
Could not get it to restart folowing the notes on the elog - SOAP errors as shown in attachment 29. called Tom who''s logged in
6.10 - seems to be working again. Not sure what happened. Tom thinks multiple restarts fixed it
Started data file R8
AIDA back in the main data
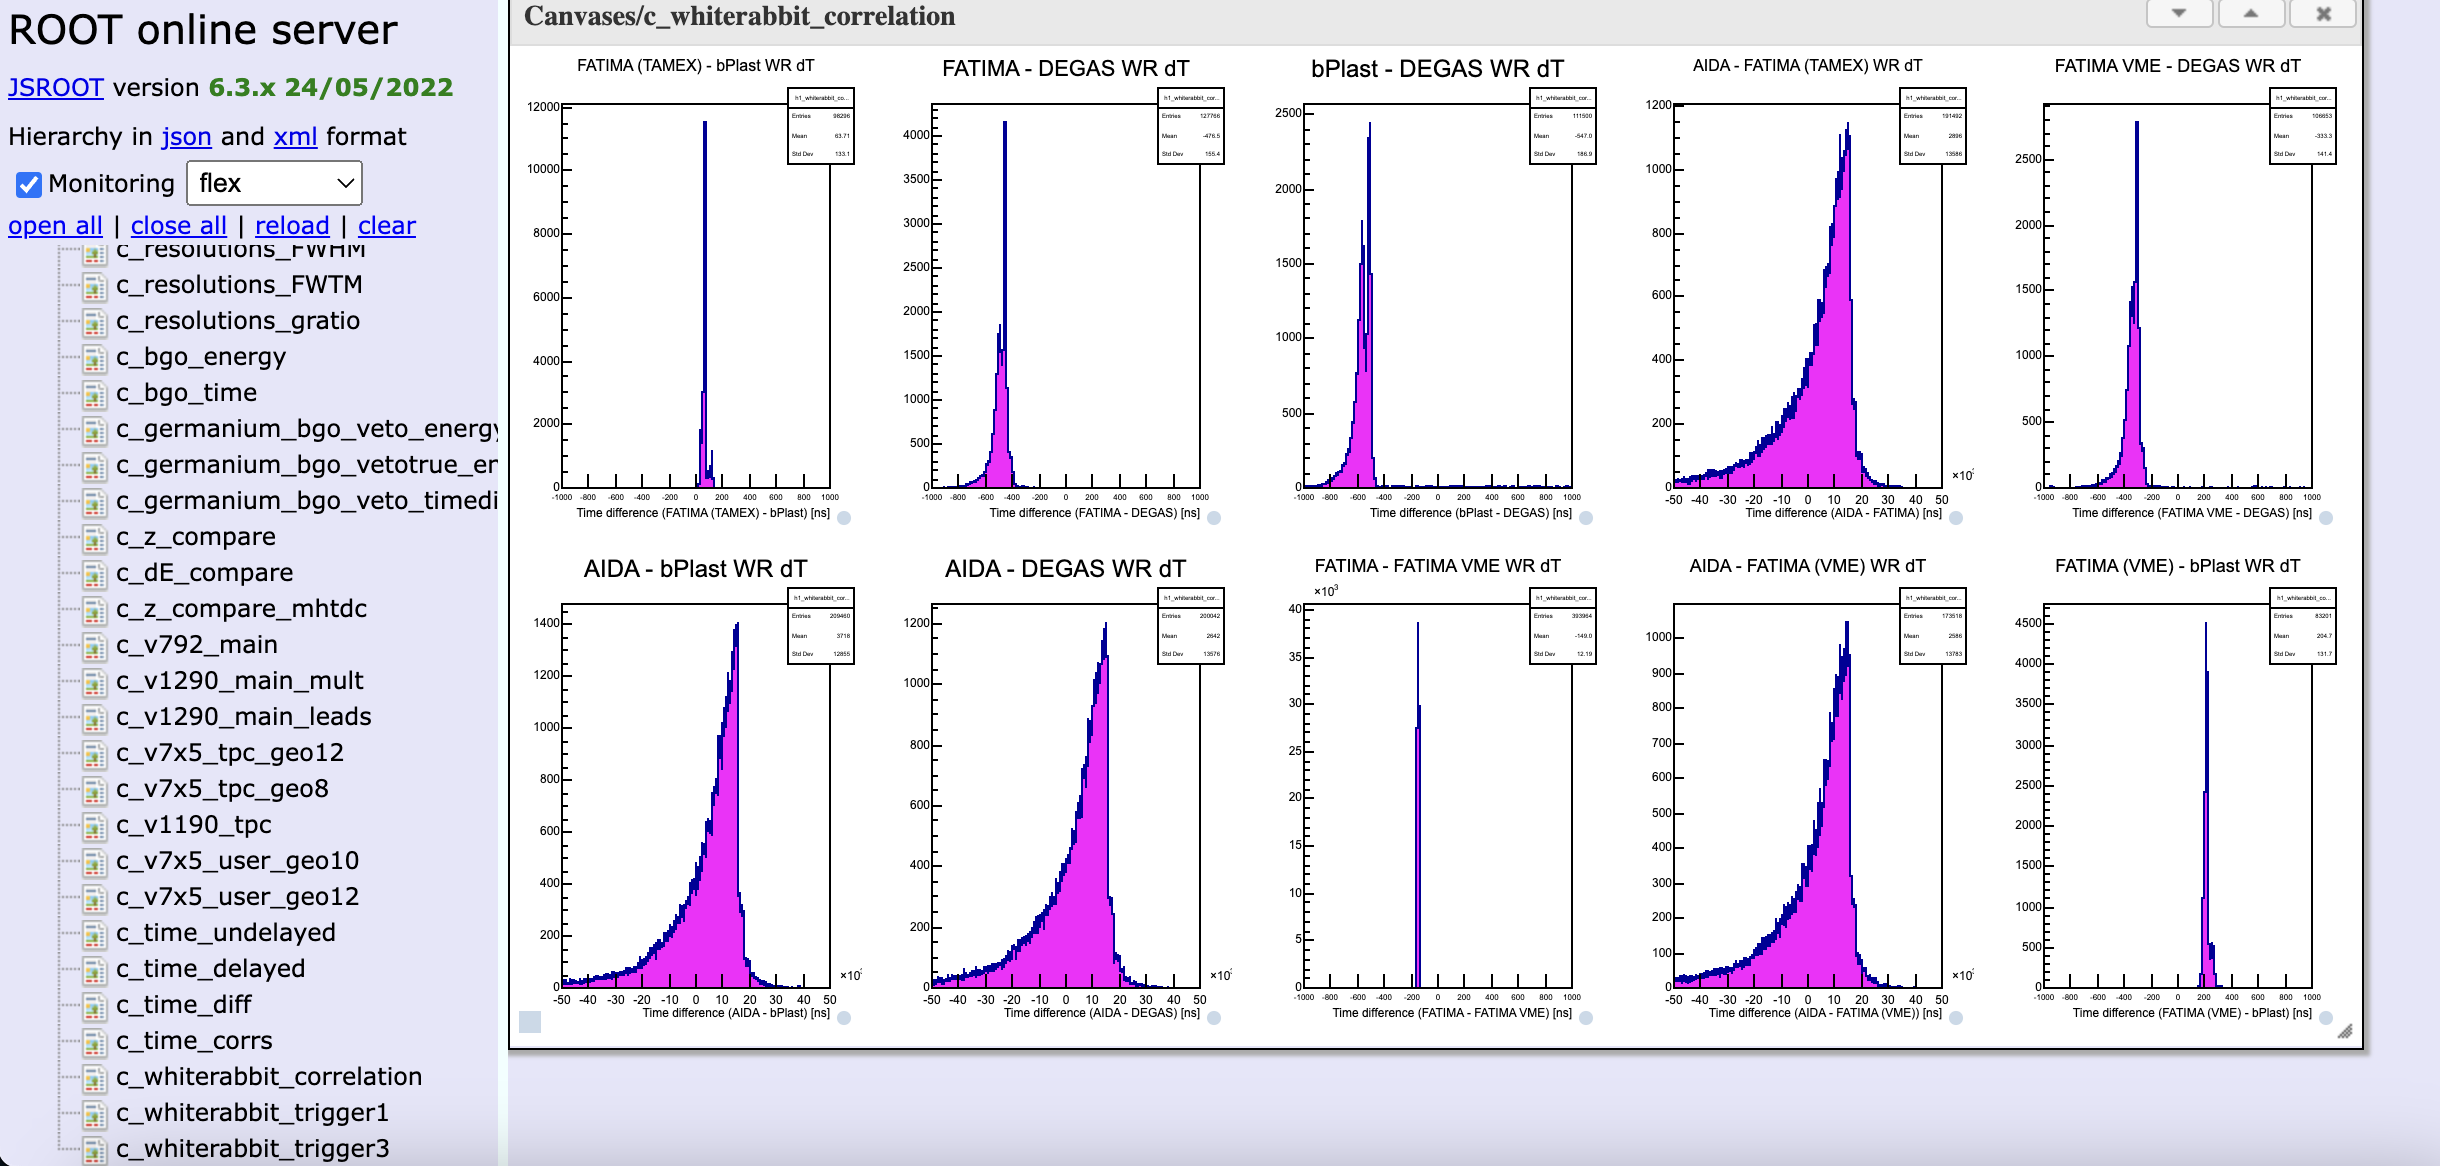
FRS shifters report a problem with the AIDA white rabbit time stamp - attachment 30
The following are timestamp values from each of the FEEs taken in sequence
If time does not increase in a reasonable manner run the system wide checks
aida01 : White Rabbit=> 17D8C4ED 8F46CF7B , WR/10=> 2627A17C18714BF, Readout Time => 2627A17C2A74000
aida02 : White Rabbit=> 17D8C4ED A0A1B623 , WR/10=> 2627A17C3435F03, Readout Time => 2627A17C4410000
aida03 : White Rabbit=> 17D8C4ED AFDACE68 , WR/10=> 2627A17C4C914A4, Readout Time => 2627A17C5D3C000
aida04 : White Rabbit=> 17D8C4ED C0516FC2 , WR/10=> 2627A17C66E8B2D, Readout Time => 2627A17C7AC4000
aida05 : White Rabbit=> 17D8C4ED D3B93DAB , WR/10=> 2627A17C85F52F7, Readout Time => 2627A17C9AEC000
aida06 : White Rabbit=> 17D8C4ED E8C9B243 , WR/10=> 2627A17CA7A91D3, Readout Time => 2627A17CB704000
aida07 : White Rabbit=> 17D8C4ED FFE475FD , WR/10=> 2627A17CCCA0BCC, Readout Time => 2627A17CDD94000
aida08 : White Rabbit=> 17D8C4EE 103232A6 , WR/10=> 2627A17CE6B6B77, Readout Time => 2627A17CF7BC000
aida09 : White Rabbit=> 17D8C4EE 20A1F612 , WR/10=> 2627A17D0103235, Readout Time => 2627A17D112C000
aida10 : White Rabbit=> 17D8C4EE 307D8FE7 , WR/10=> 2627A17D1A627FD, Readout Time => 2627A17D2958000
aida11 : White Rabbit=> 17D8C4EE 4402829D , WR/10=> 2627A17D399D9DC, Readout Time => 2627A17D4570000
aida12 : White Rabbit=> 17D8C4EE 6288B04D , WR/10=> 2627A17D6A744D4, Readout Time => 2627A17D7D94000
aida13 : White Rabbit=> 17D8C4EE 751E1306 , WR/10=> 2627A17D88301E7, Readout Time => 2627A17D9C34000
aida14 : White Rabbit=> 17D8C4EE 894E8806 , WR/10=> 2627A17DA87DA67, Readout Time => 2627A17DBFF4000
aida15 : White Rabbit=> 17D8C4EE 9EEEB997 , WR/10=> 2627A17DCB178F5, Readout Time => 2627A17DDC18000
aida16 : White Rabbit=> 17D8C4EE AF0BC923 , WR/10=> 2627A17DE4DFA83, Readout Time => 2627A17DF5C8000
Tom thinks everything appears ok with AIDA
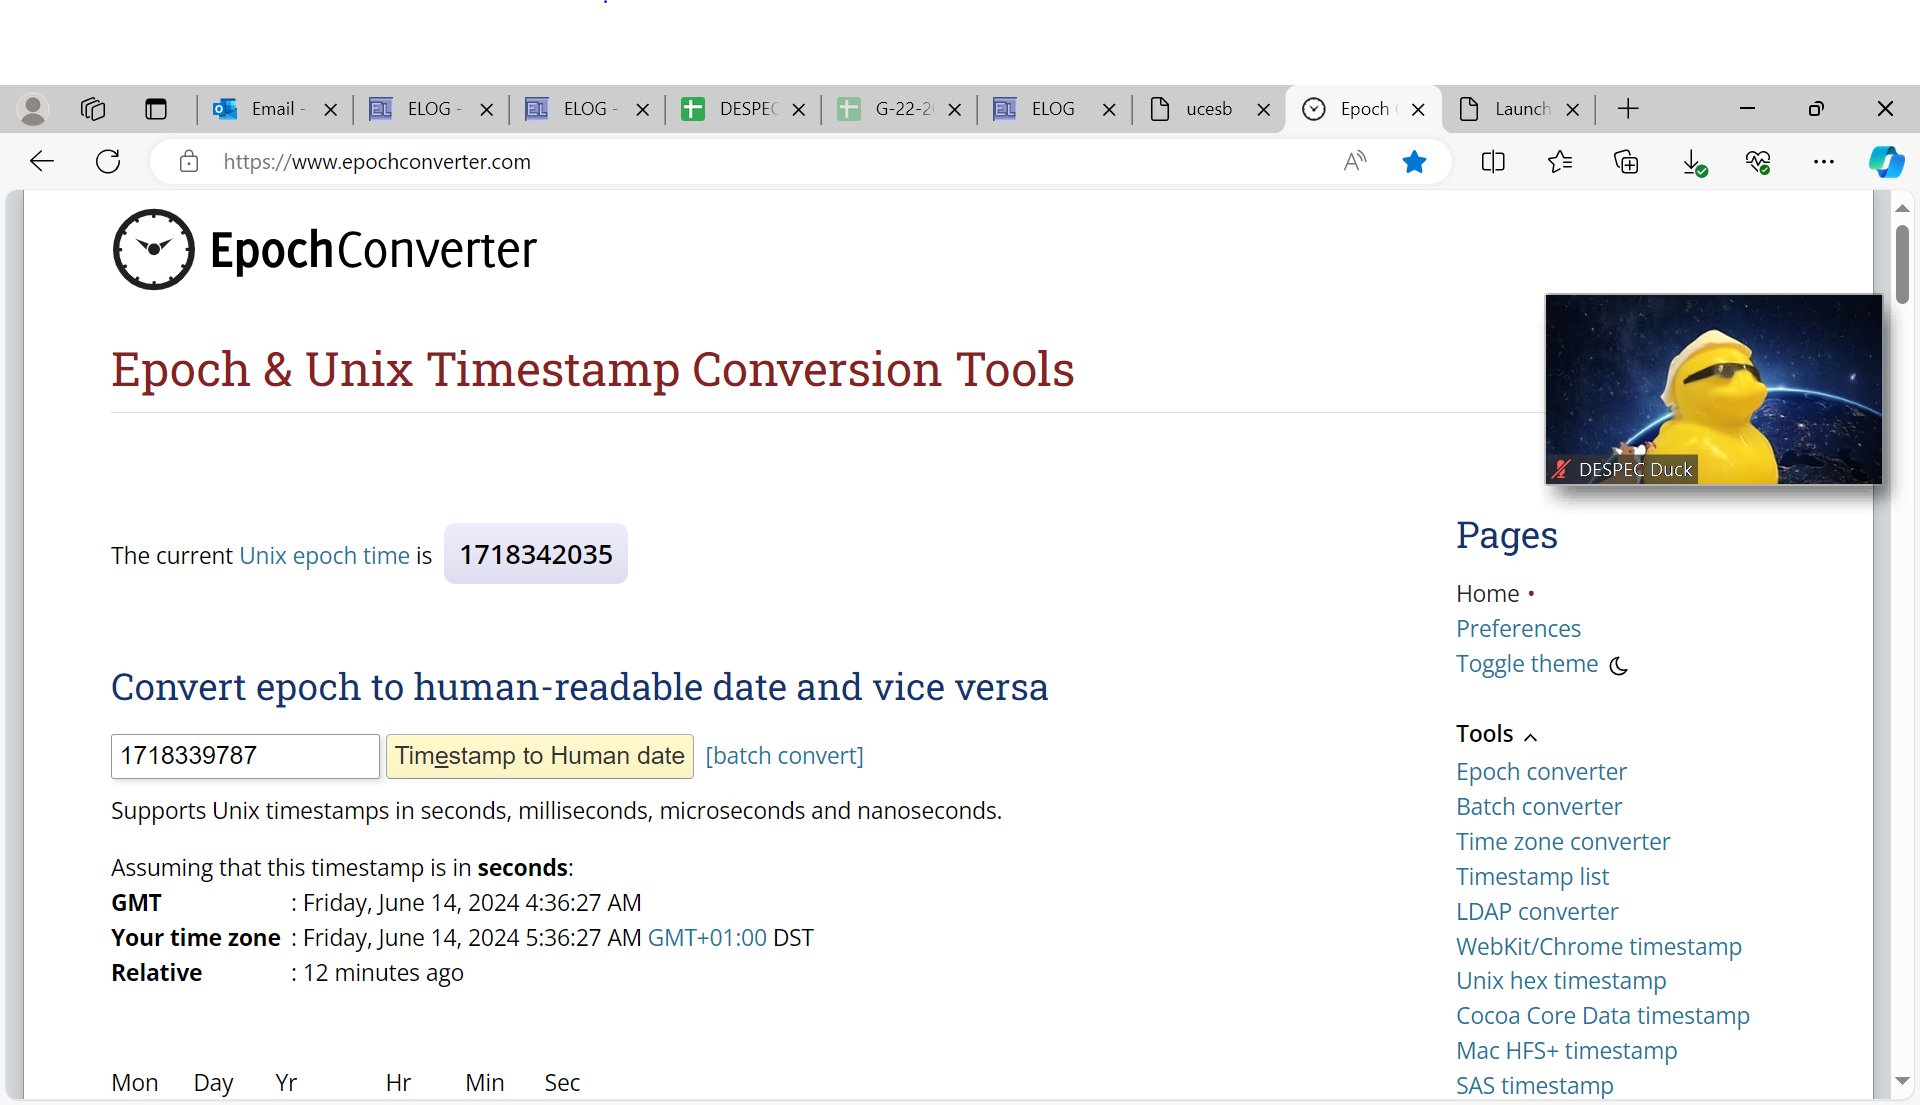
Have converted WR timestamp to data/time - see attachment 40
At the ~second timescale AIDA WR timestamp looks OK, i.e. no gross errors. Will need to check correlations with other detector sub-systems to confirm WR on the ~us time timescale..
However, ~10us offset reported by DESPEC online crew is correct (AIDA timestamps data at a later point in the signal processing cycle than other detector sub-systems). Have suggested online crew contact Nic or Calum to check what the AIDA WR timediff spectra should look like.
7.00 checks - all looks ok
Voltage/currents - attachment 31
Rates attachment 32 + 33
Temps - attachment 36
Merger - attachment 37
ucesb - attachment 39
Grafana - attachment 38
Handed over to Tom
|
| Attachment 1: Screenshot_from_2024-06-13_23-58-44.png
|

|
| Attachment 2: Screenshot_from_2024-06-13_23-59-34.png
|
|
| Attachment 3: Screenshot_from_2024-06-14_00-00-09.png
|
|
| Attachment 4: Screenshot_from_2024-06-14_00-00-43.png
|

|
| Attachment 5: Screenshot_from_2024-06-14_00-01-36.png
|

|
| Attachment 6: Screenshot_from_2024-06-14_00-02-45.png
|
|
| Attachment 7: Screenshot_from_2024-06-14_00-03-26.png
|
|
| Attachment 8: Screenshot_from_2024-06-14_01-47-38.png
|

|
| Attachment 9: Screenshot_from_2024-06-14_01-48-12.png
|
|
| Attachment 10: Screenshot_from_2024-06-14_01-48-45.png
|

|
| Attachment 11: Screenshot_from_2024-06-14_01-49-16.png
|
|
| Attachment 12: Screenshot_from_2024-06-14_01-49-48.png
|

|
| Attachment 13: Screenshot_from_2024-06-14_01-50-46.png
|
|
| Attachment 14: Screenshot_from_2024-06-14_01-51-18.png
|
|
| Attachment 15: Screenshot_from_2024-06-14_03-40-33.png
|
|
| Attachment 16: Screenshot_from_2024-06-14_03-40-56.png
|
|
| Attachment 17: Screenshot_from_2024-06-14_03-41-35.png
|

|
| Attachment 18: Screenshot_from_2024-06-14_03-42-15.png
|

|
| Attachment 19: Screenshot_from_2024-06-14_03-42-42.png
|

|
| Attachment 20: Screenshot_from_2024-06-14_03-43-39.png
|
|
| Attachment 21: Screenshot_from_2024-06-14_03-44-11.png
|
|
| Attachment 22: Screenshot_from_2024-06-14_03-53-08.png
|
|
| Attachment 23: Screenshot_from_2024-06-14_03-53-51.png
|
|
| Attachment 24: Screenshot_from_2024-06-14_03-54-36.png
|
|
| Attachment 25: Screenshot_from_2024-06-14_03-55-19.png
|
|
| Attachment 26: Screenshot_from_2024-06-14_03-55-50.png
|
|
| Attachment 27: Screenshot_from_2024-06-14_03-56-56.png
|
|
| Attachment 28: Screenshot_from_2024-06-14_03-58-10.png
|
|
| Attachment 29: Screenshot_from_2024-06-14_05-52-47.png
|
|
| Attachment 30: Screenshot_2024-06-14_at_05.31.21.png
|
|
| Attachment 31: Screenshot_from_2024-06-14_07-02-14.png
|

|
| Attachment 32: Screenshot_from_2024-06-14_07-00-53.png
|

|
| Attachment 33: Screenshot_from_2024-06-14_07-01-20.png
|
|
| Attachment 34: Screenshot_from_2024-06-14_07-01-55.png
|

|
| Attachment 35: Screenshot_from_2024-06-14_07-02-47.png
|
|
| Attachment 36: Screenshot_from_2024-06-14_07-01-55.png
|

|
| Attachment 37: Screenshot_from_2024-06-14_07-02-47.png
|

|
| Attachment 38: Screenshot_from_2024-06-14_07-03-23.png
|
|
| Attachment 39: Screenshot_from_2024-06-14_07-04-01.png
|

|
| Attachment 40: Capture.PNG
|
|
|
647
|
Mon Jun 10 07:15:48 2024 |
Dan | 08.00-16.00 Monday 10th June |
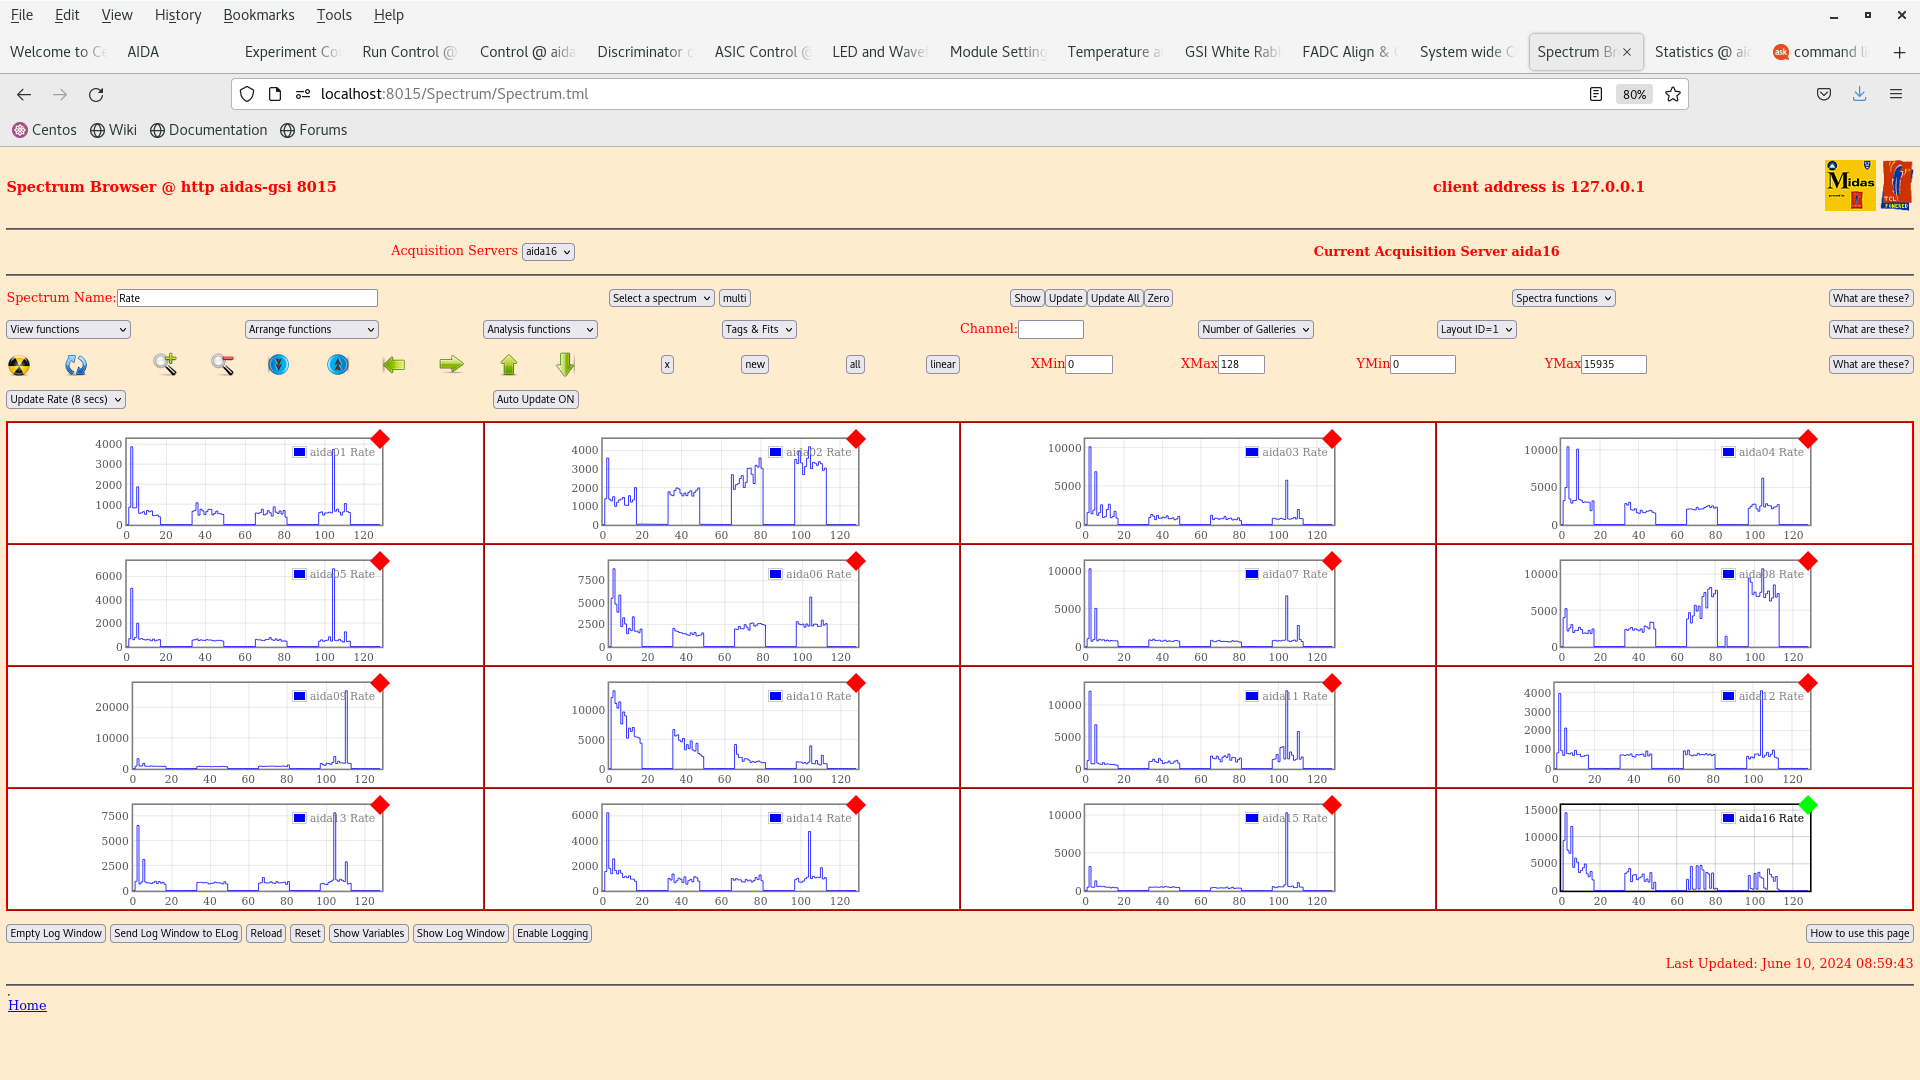
8am checks
temps ok - attachment 2
rates ok - attachment 8
voltage ok - attachment 5
merger ok - attachment 6
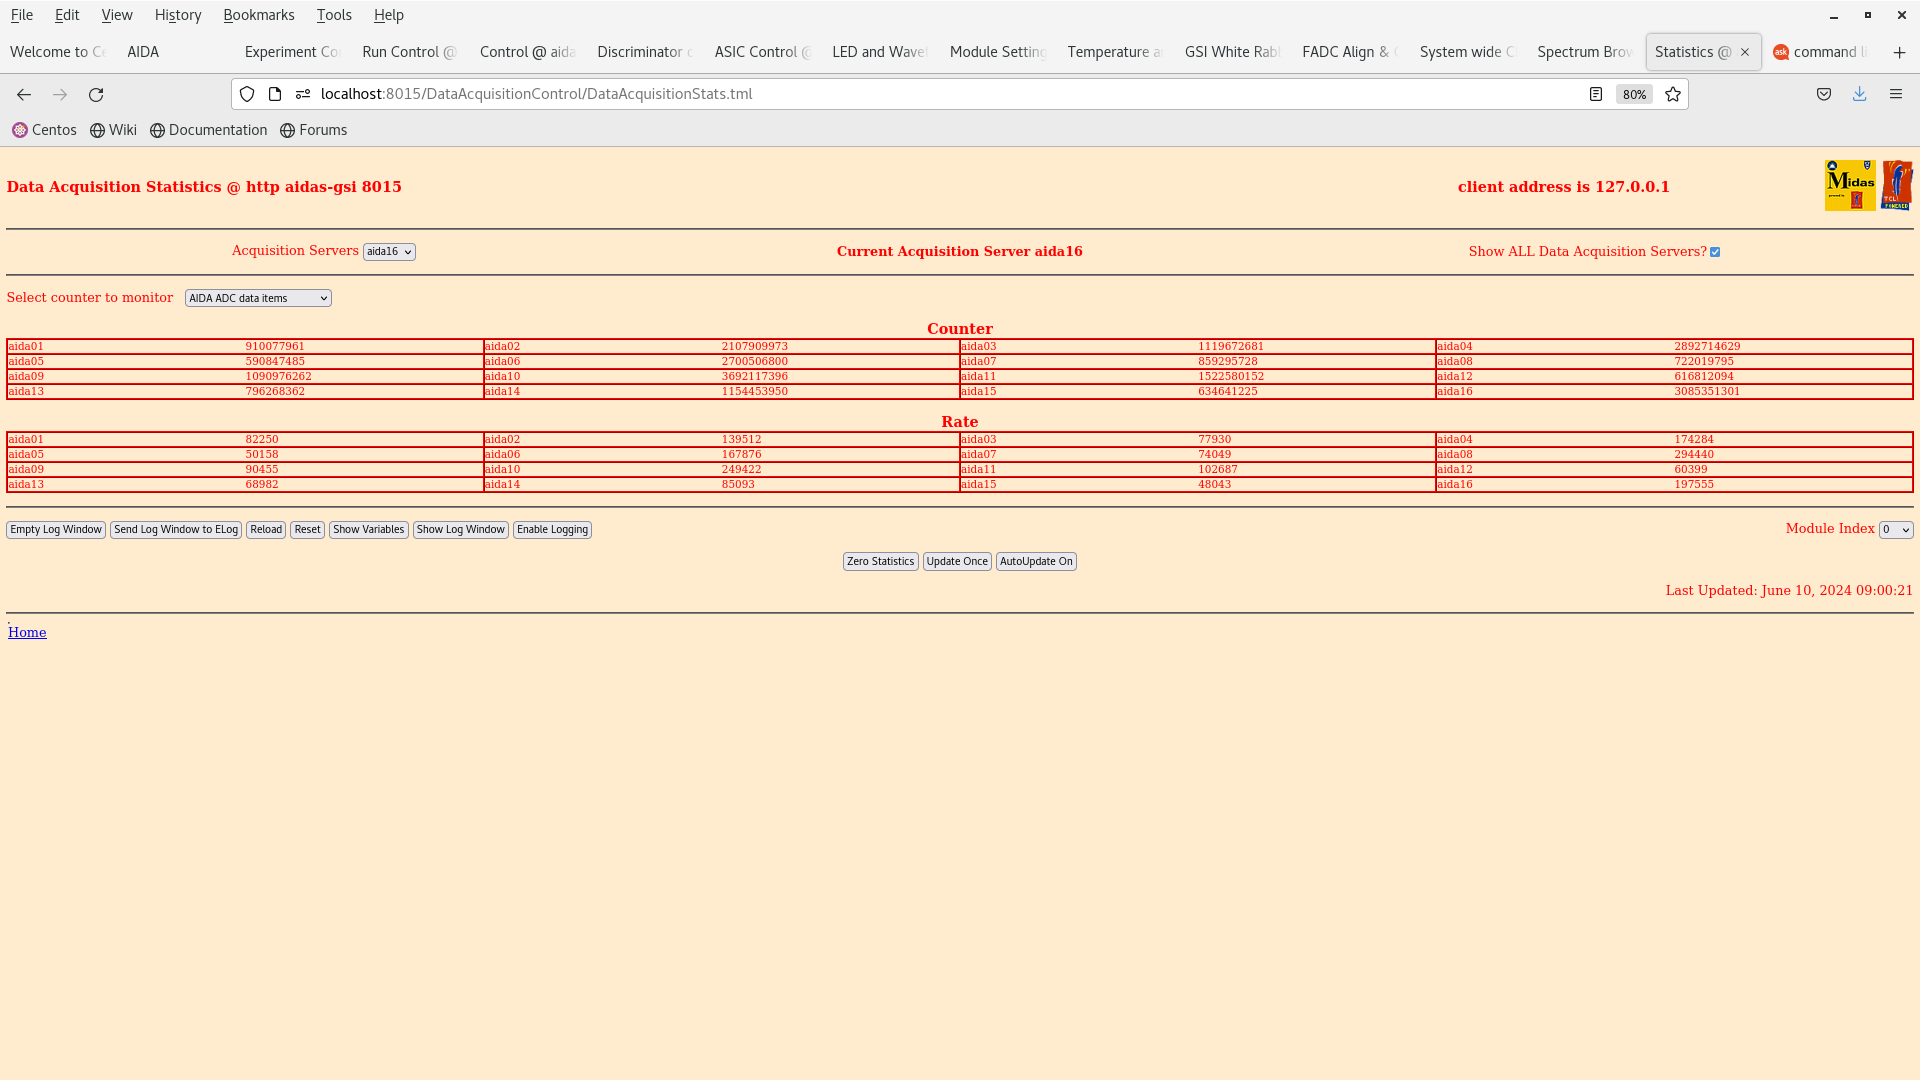
9am checks
temps ok - attachment 10
rates ok - attachment 9
voltage ok - attachment 12
merger ok - attachment 11
(Ignore Grafana plots 13-43 inc - not refreshed)
9.16 beam stopped to optimise beam intensity
10.00 checks - still no beam
temps ok - attachment 17
rates ok - attachment 15+16
voltage ok - attachment 14
merger ok - attachment 18
11.00 checks - still no beam
temps ok - attachment 23
rates ok - attachment 21+22
voltage ok - attachment 20
merger ok - attachment 24
12pm checks
temps ok - attachment 28
rates ok - attachment 26+27
voltage ok - attachment 29
merger ok - attachment 30
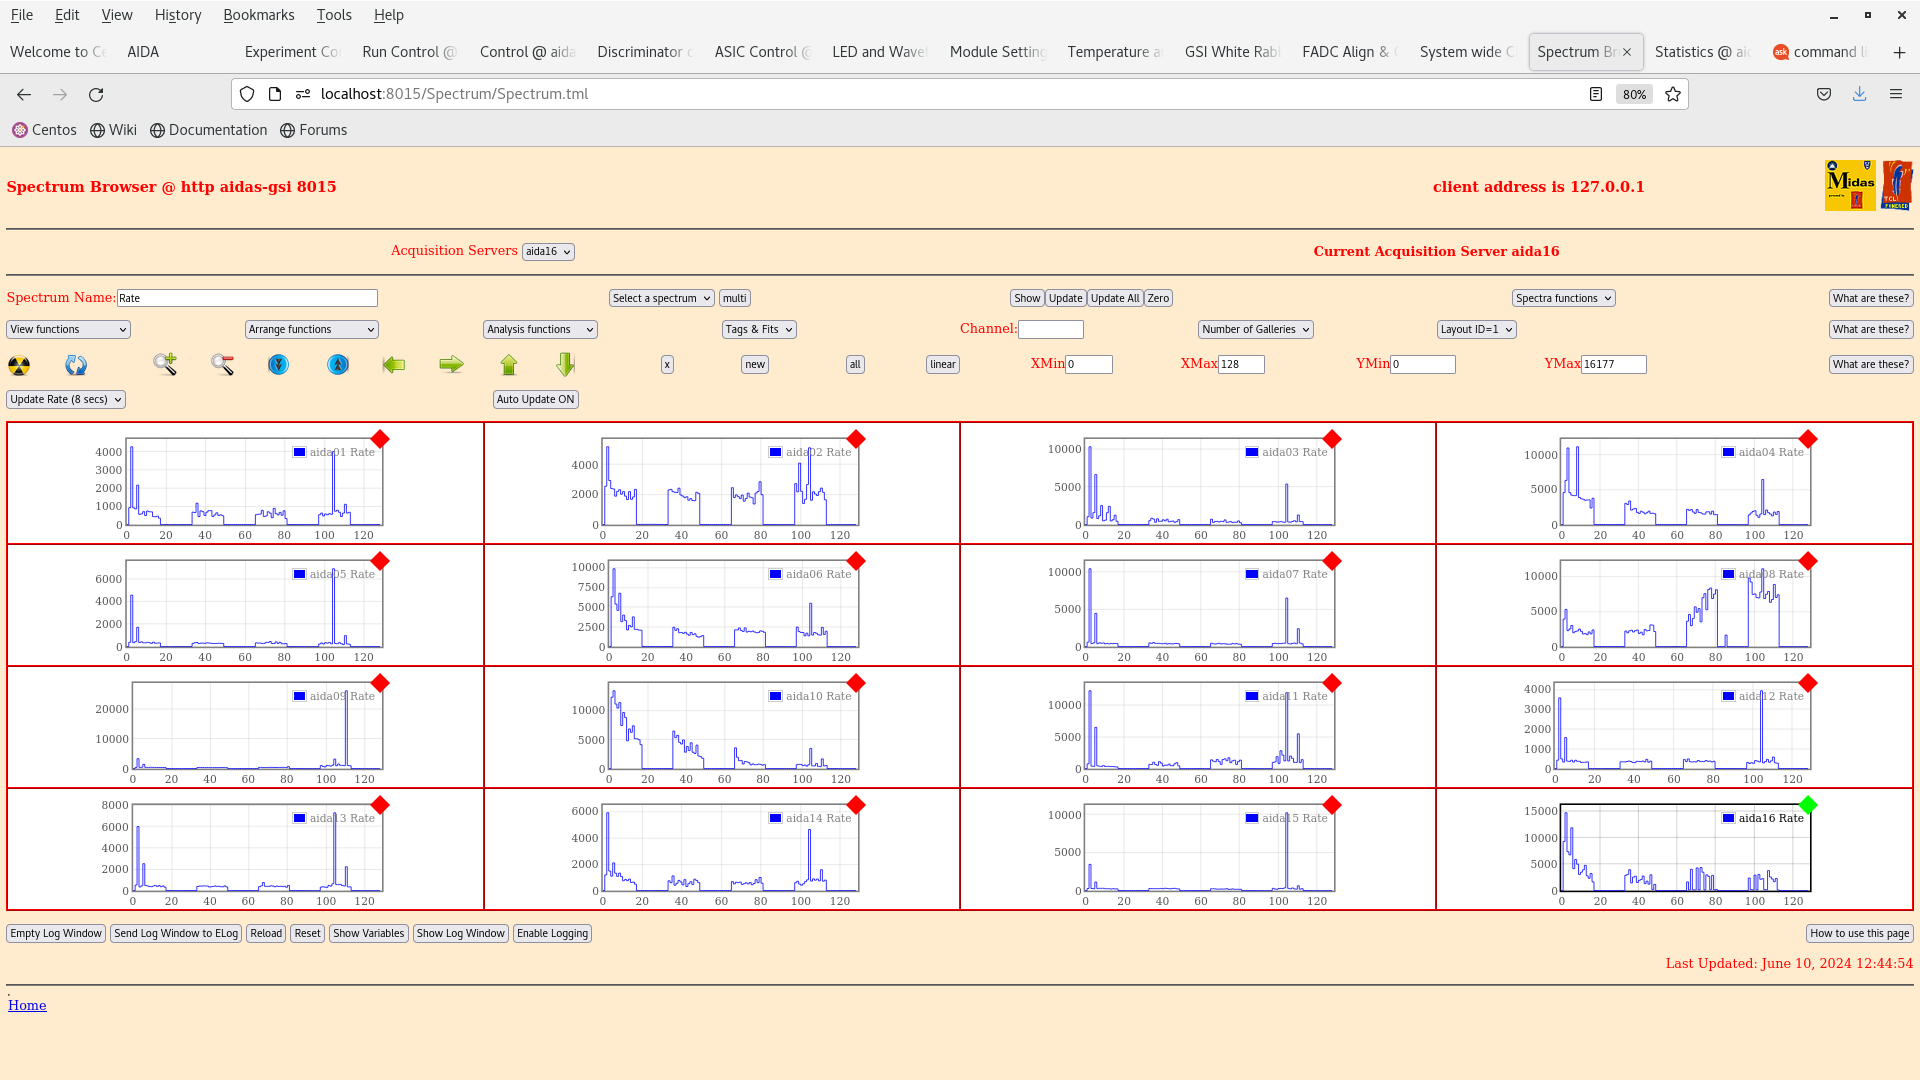
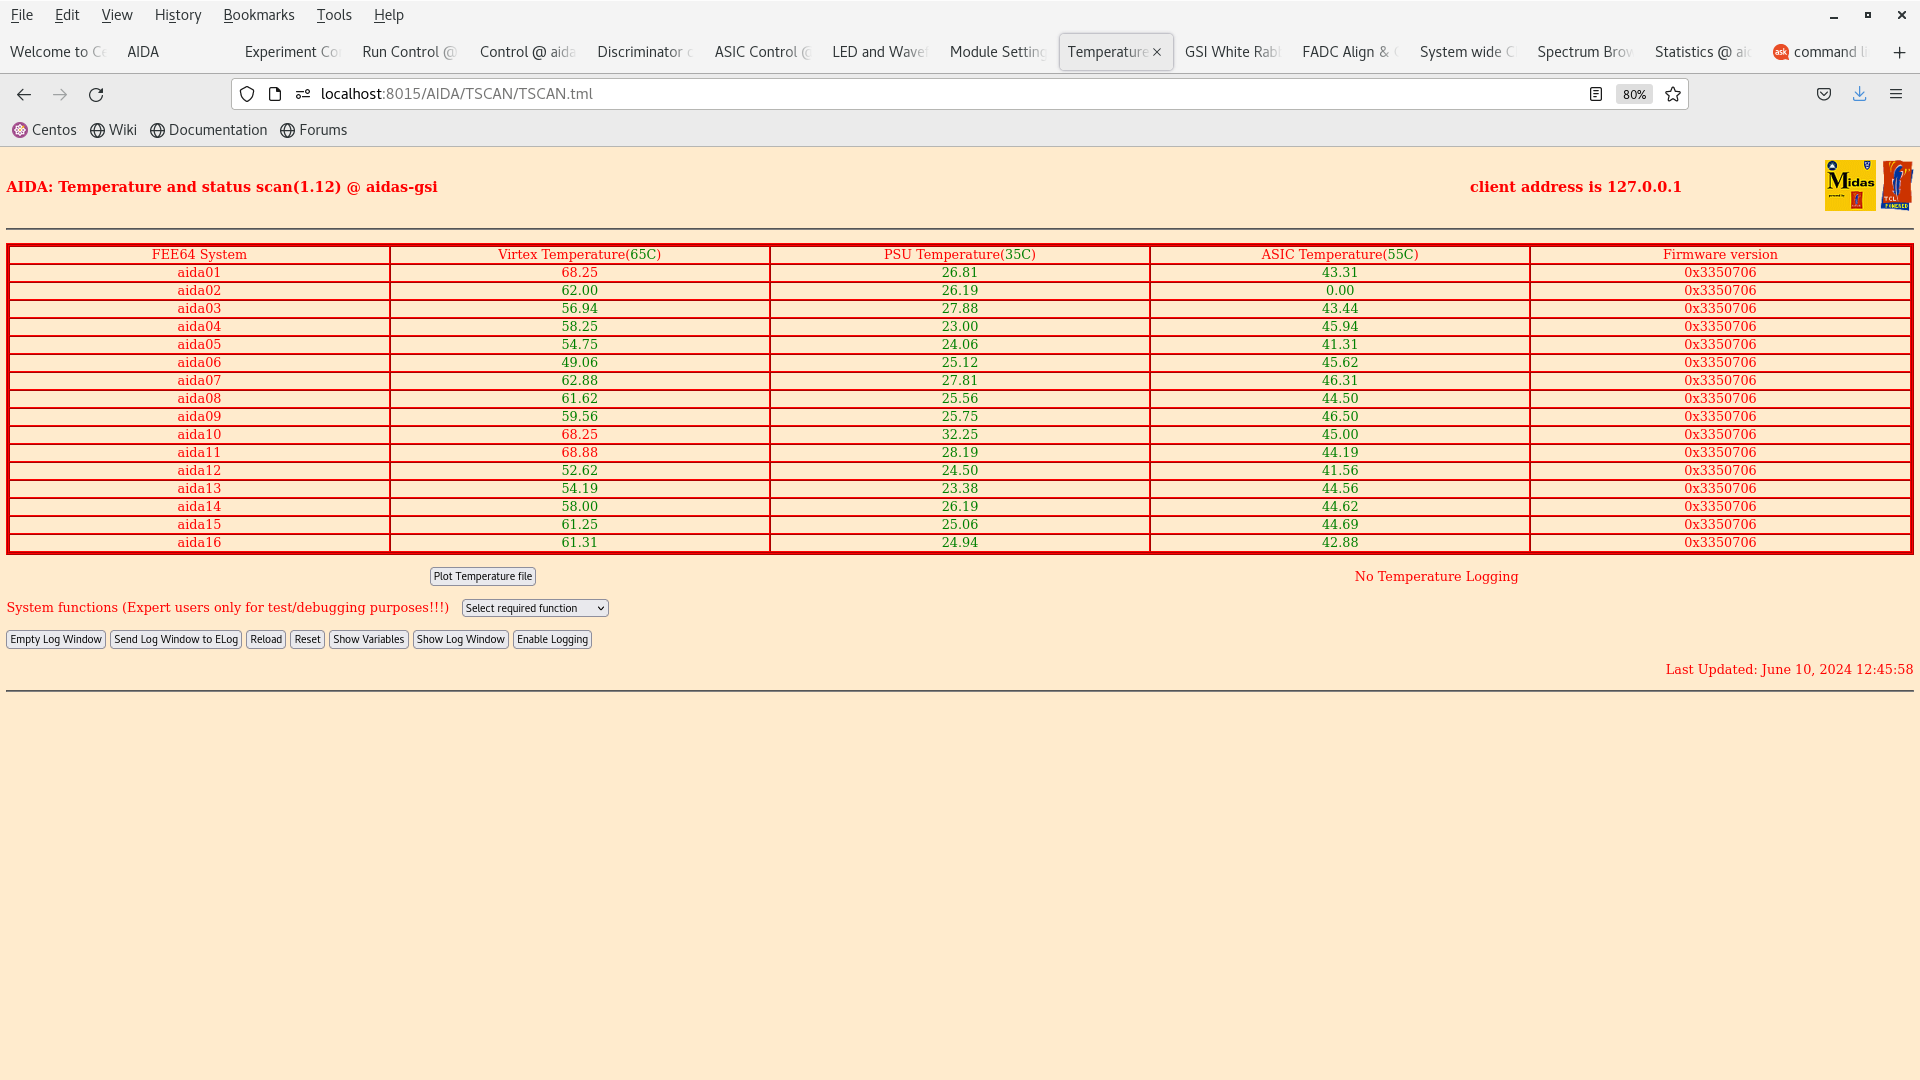
12.45 - beam back
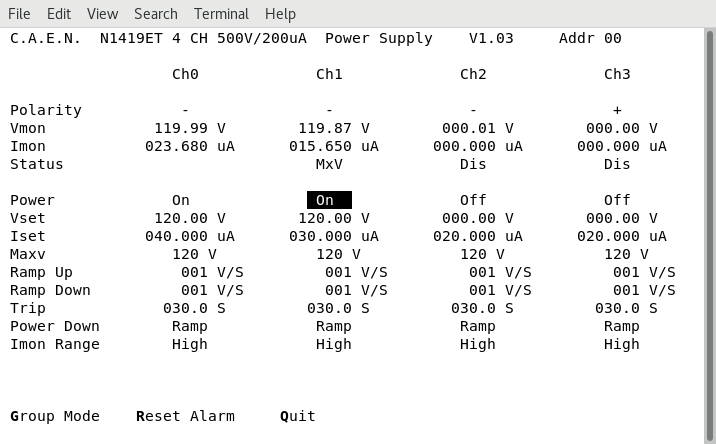
temps ok - attachment 34
rates ok - attachment 32+33
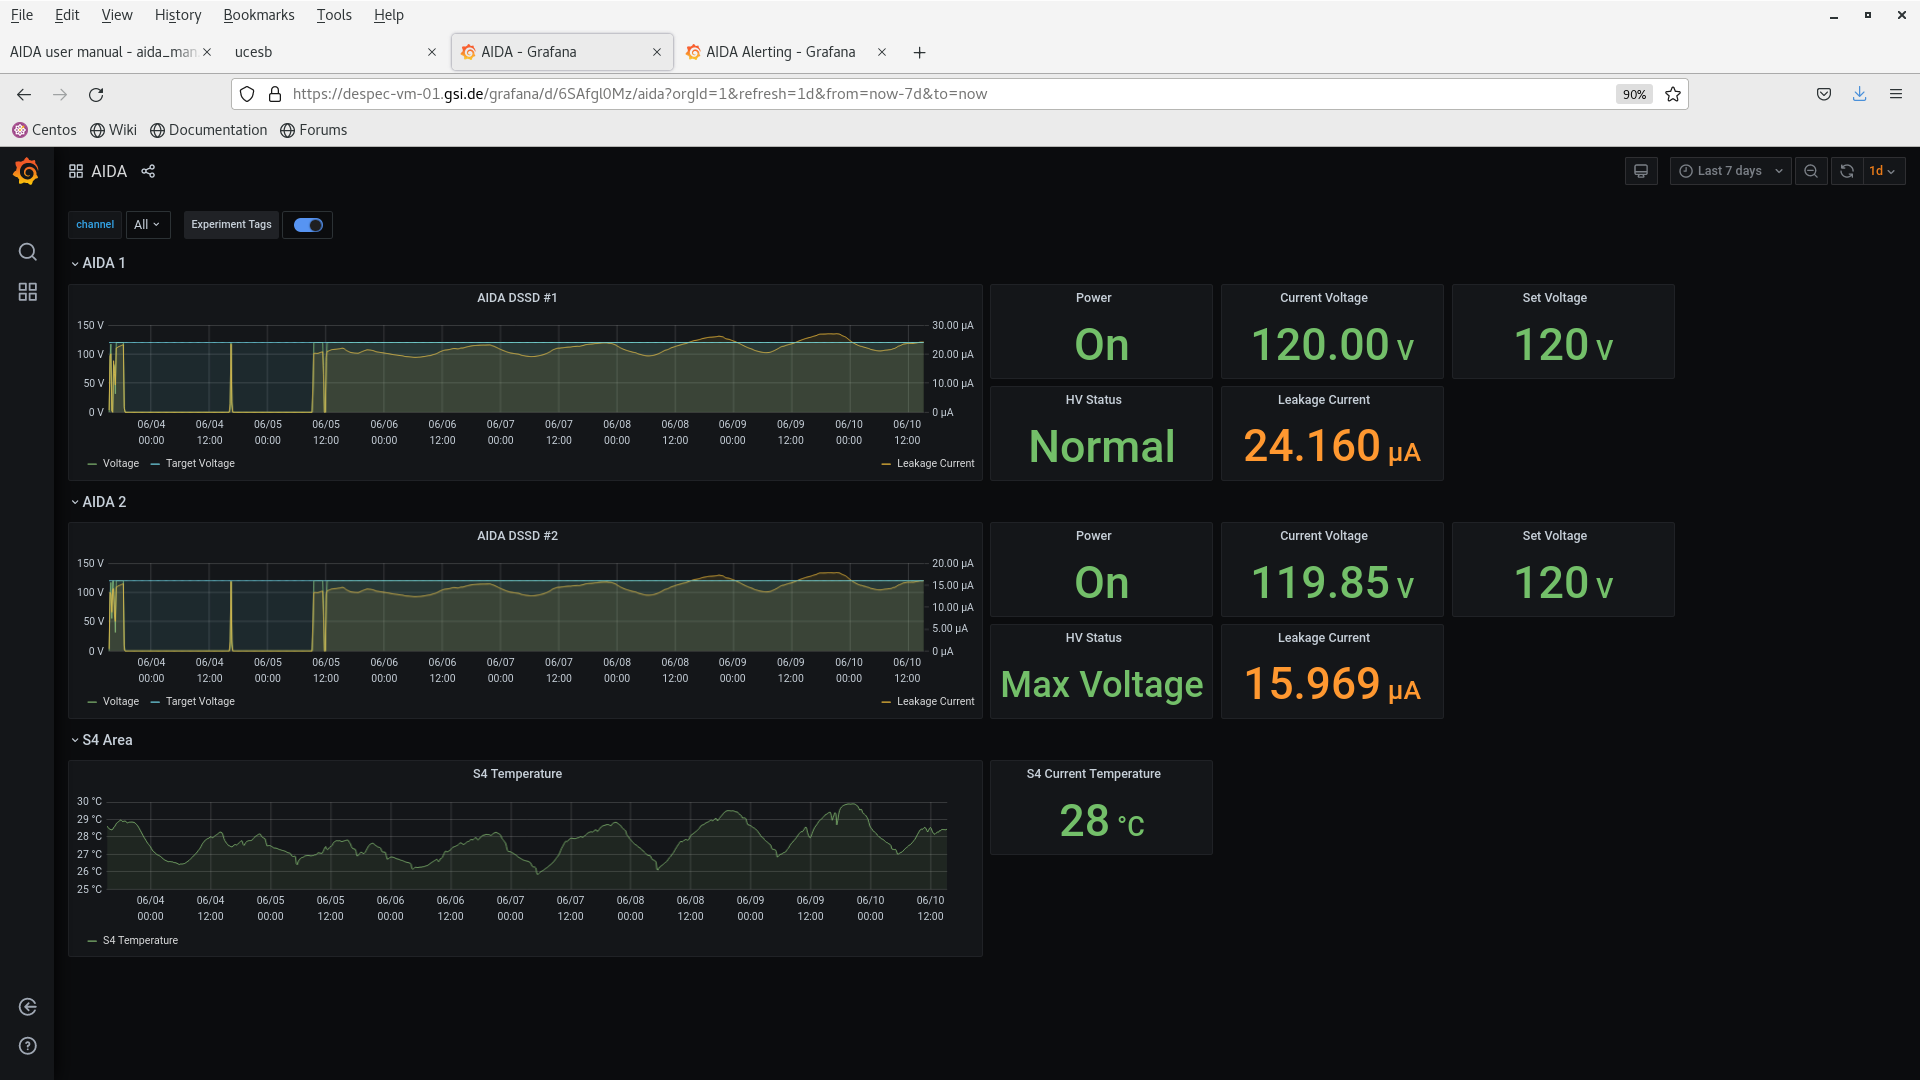
voltage ok - attachment 35
merger ok - attachment 36
2pm checks
temps ok - attachment 40
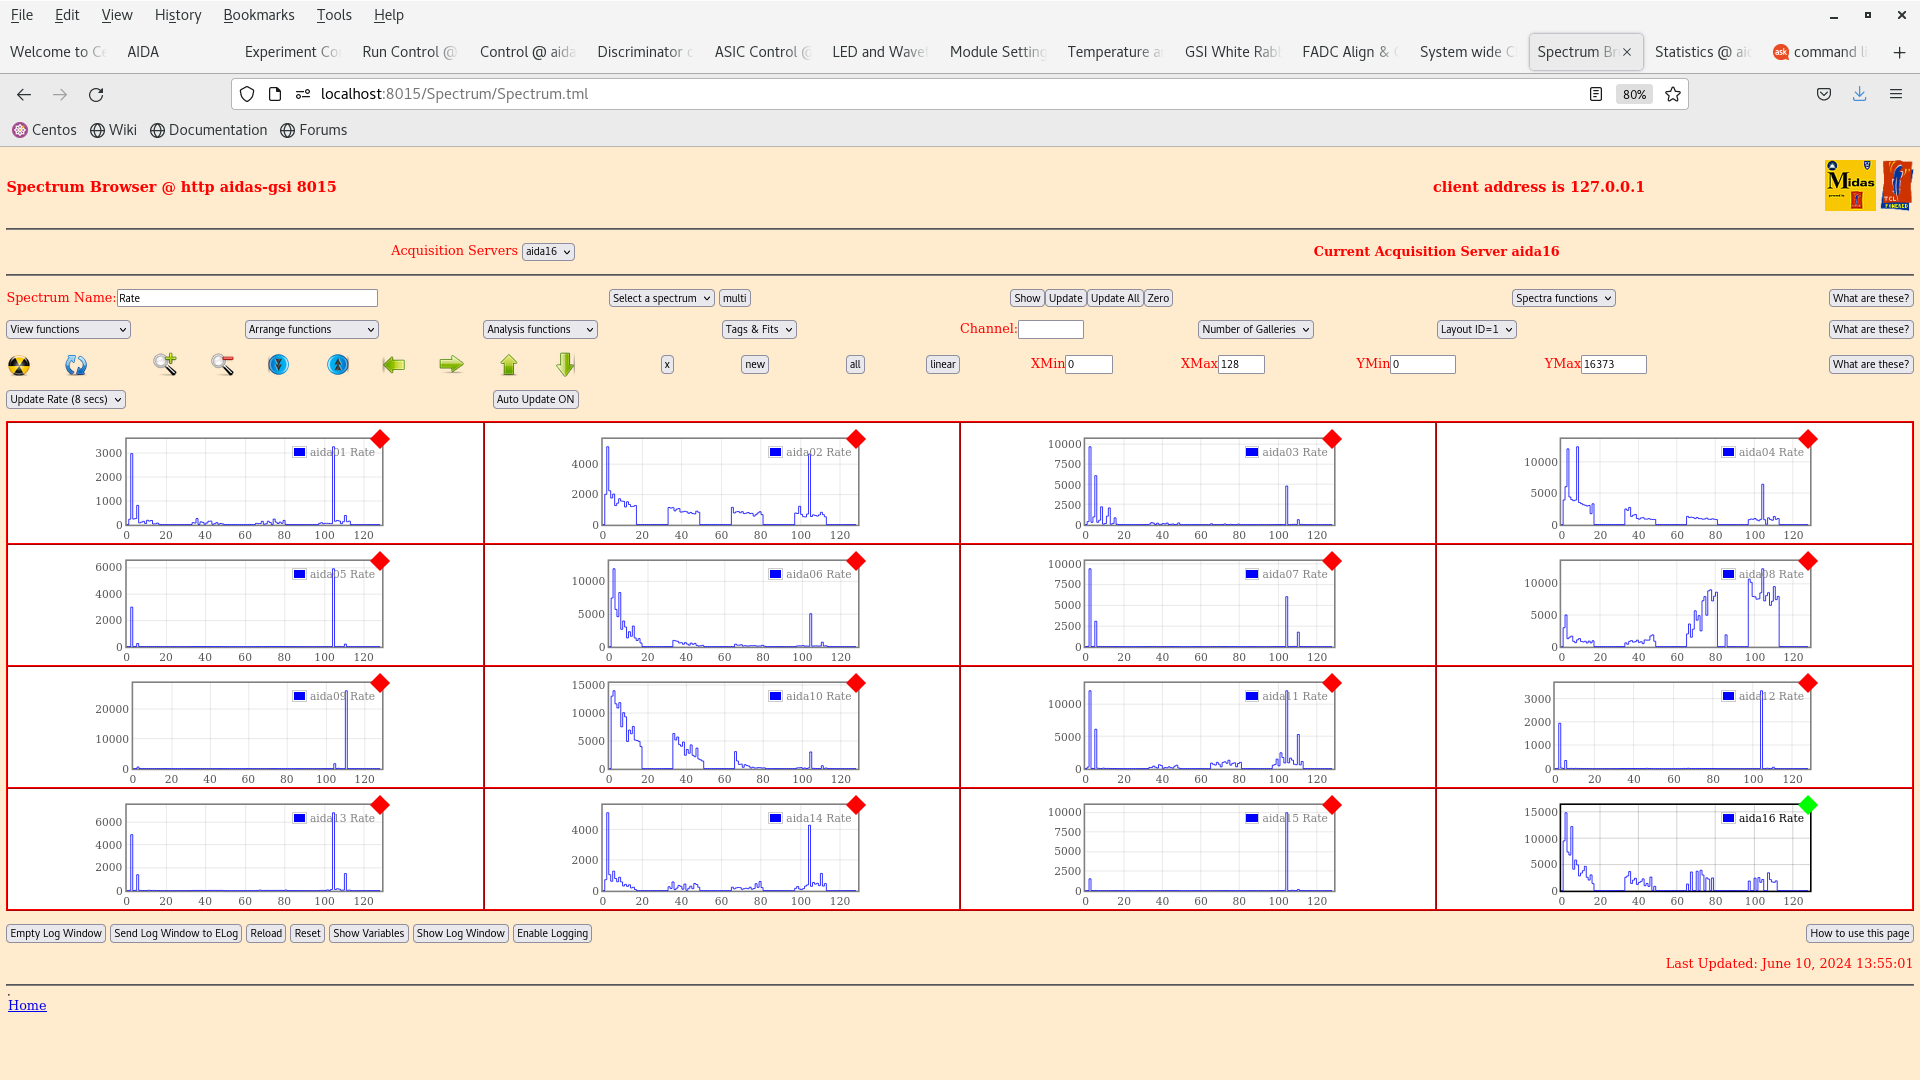
rates ok - attachment 38+39
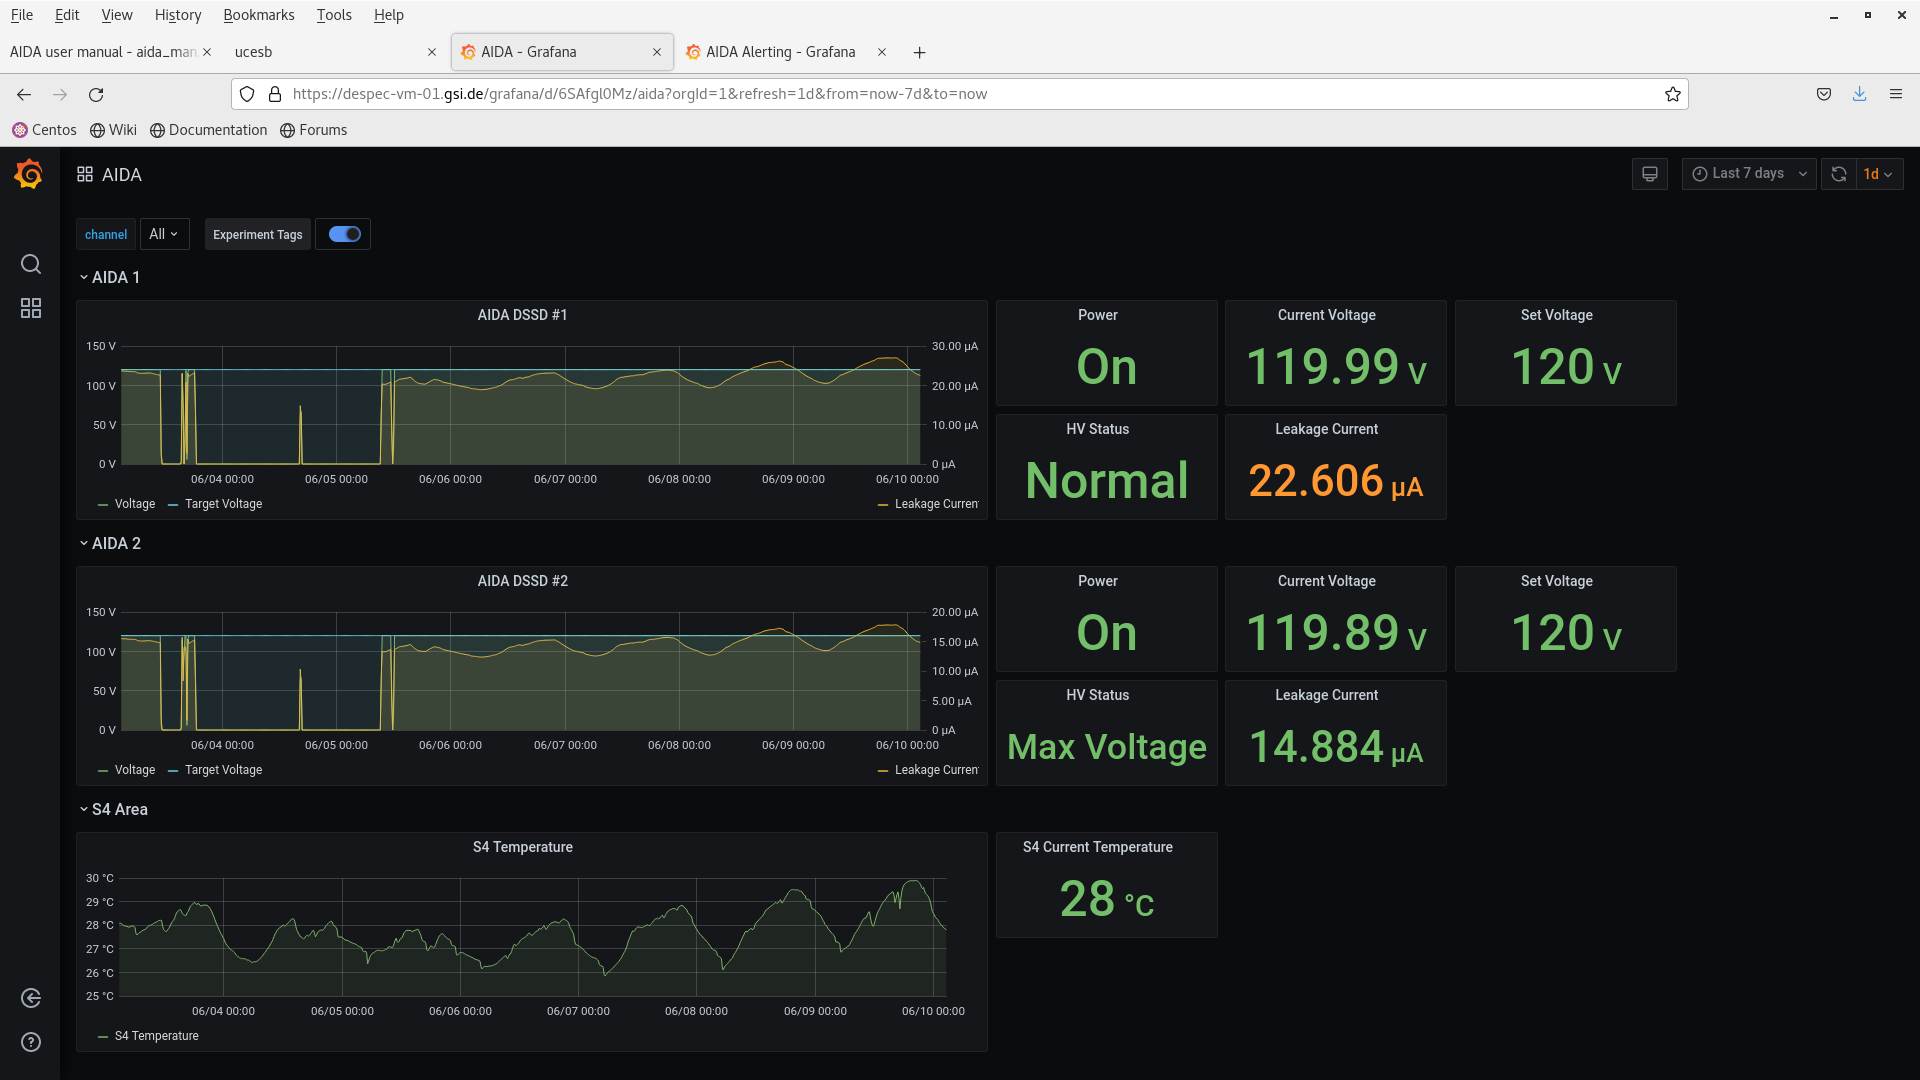
voltage ok - attachment 41
merger ok - attachment 42
/tmp/R4_276 added - attachment 44
max deadtime 10.5% (aida08)
n+n FEE64s deadtime
3pm checks
temps ok - attachment 48
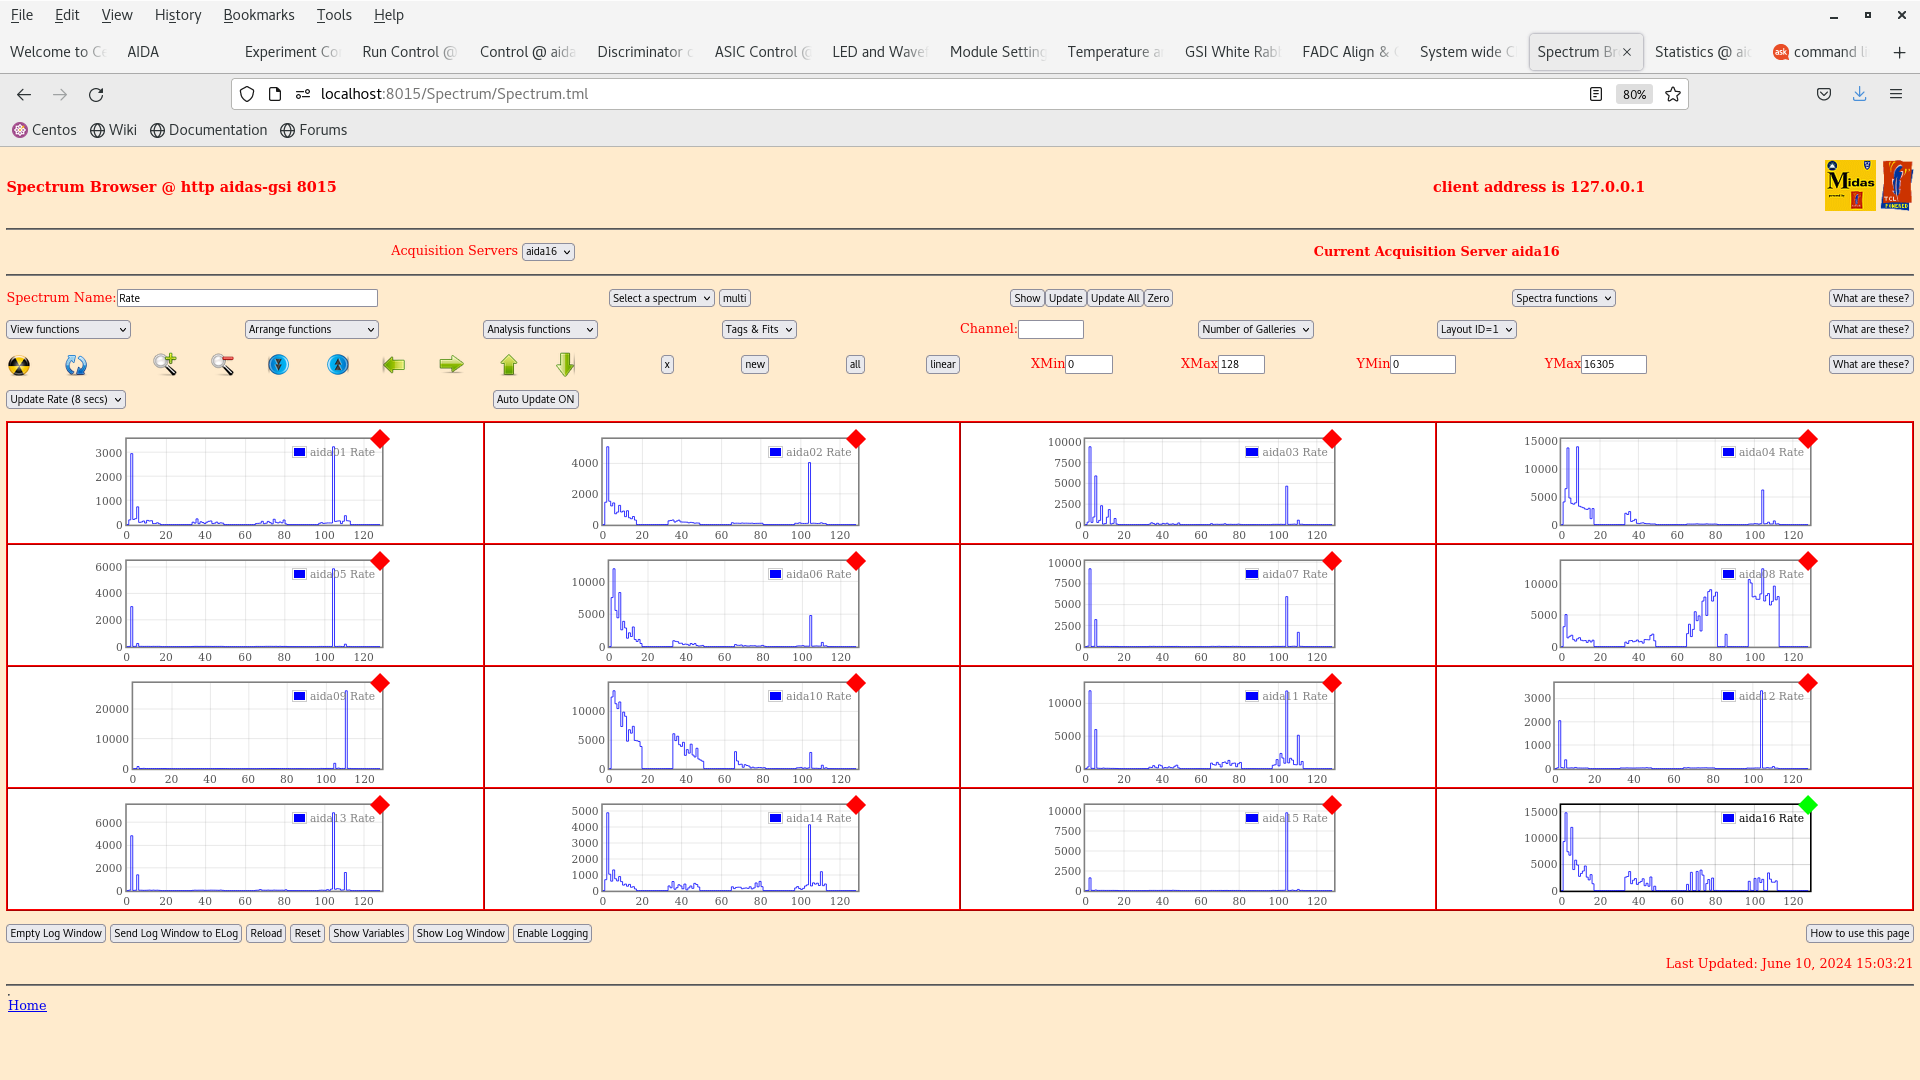
rates ok - attachment 46+47
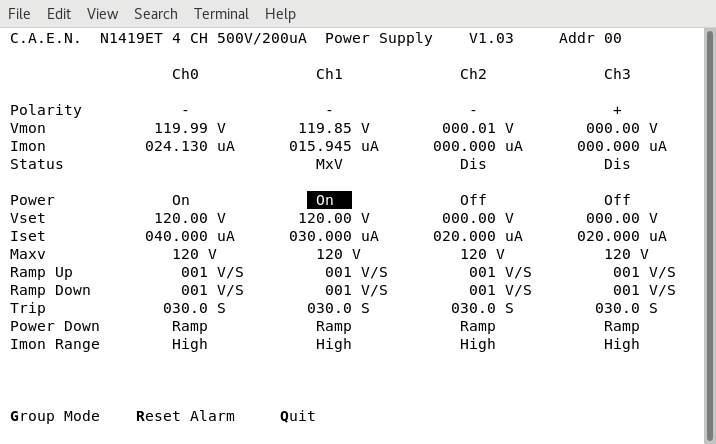
voltage ok - attachment 45+50
merger ok - attachment 49 |
| Attachment 1: Screenshot_from_2024-06-10_08-07-10.png
|

|
| Attachment 2: Screenshot_from_2024-06-10_08-07-54.png
|

|
| Attachment 3: Screenshot_from_2024-06-10_08-11-27.png
|

|
| Attachment 4: Screenshot_from_2024-06-10_08-13-25.png
|

|
| Attachment 5: Screenshot_from_2024-06-10_08-22-19.png
|

|
| Attachment 6: Screenshot_from_2024-06-10_08-28-14.png
|

|
| Attachment 7: Screenshot_from_2024-06-10_08-33-04.png
|

|
| Attachment 8: Screenshot_from_2024-06-10_09-00-04.png
|
|
| Attachment 9: Screenshot_from_2024-06-10_09-00-35.png
|
|
| Attachment 10: Screenshot_from_2024-06-10_09-01-05.png
|

|
| Attachment 11: Screenshot_from_2024-06-10_09-03-04.png
|

|
| Attachment 12: Screenshot_from_2024-06-10_09-03-40.png
|

|
| Attachment 13: Screenshot_from_2024-06-10_09-04-27.png
|

|
| Attachment 14: Screenshot_from_2024-06-10_10-04-59.png
|

|
| Attachment 15: Screenshot_from_2024-06-10_10-05-36.png
|

|
| Attachment 16: Screenshot_from_2024-06-10_10-06-07.png
|

|
| Attachment 17: Screenshot_from_2024-06-10_10-06-40.png
|

|
| Attachment 18: Screenshot_from_2024-06-10_10-07-24.png
|

|
| Attachment 19: Screenshot_from_2024-06-10_10-09-01.png
|

|
| Attachment 20: Screenshot_from_2024-06-10_11-00-43.png
|

|
| Attachment 21: Screenshot_from_2024-06-10_11-01-36.png
|

|
| Attachment 22: Screenshot_from_2024-06-10_11-02-19.png
|

|
| Attachment 23: Screenshot_from_2024-06-10_11-03-06.png
|

|
| Attachment 24: Screenshot_from_2024-06-10_11-03-58.png
|

|
| Attachment 25: Screenshot_from_2024-06-10_11-04-27.png
|

|
| Attachment 26: Screenshot_from_2024-06-10_12-03-07.png
|

|
| Attachment 27: Screenshot_from_2024-06-10_12-03-36.png
|

|
| Attachment 28: Screenshot_from_2024-06-10_12-04-16.png
|

|
| Attachment 29: Screenshot_from_2024-06-10_12-04-48.png
|

|
| Attachment 30: Screenshot_from_2024-06-10_12-05-27.png
|

|
| Attachment 31: Screenshot_from_2024-06-10_12-06-06.png
|

|
| Attachment 32: Screenshot_from_2024-06-10_12-45-12.png
|
|
| Attachment 33: Screenshot_from_2024-06-10_12-45-39.png
|

|
| Attachment 34: Screenshot_from_2024-06-10_12-46-16.png
|
|
| Attachment 35: Screenshot_from_2024-06-10_12-46-53.png
|
|
| Attachment 36: Screenshot_from_2024-06-10_12-50-29.png
|

|
| Attachment 37: Screenshot_from_2024-06-10_12-51-03.png
|

|
| Attachment 38: Screenshot_from_2024-06-10_13-54-46.png
|

|
| Attachment 39: Screenshot_from_2024-06-10_13-55-20.png
|
|
| Attachment 40: Screenshot_from_2024-06-10_13-55-55.png
|

|
| Attachment 41: Screenshot_from_2024-06-10_13-56-15.png
|

|
| Attachment 42: Screenshot_from_2024-06-10_13-57-11.png
|

|
| Attachment 43: Screenshot_from_2024-06-10_13-57-46.png
|
|
| Attachment 44: R4_276
|
*** TDR format 3.3.0 analyser - TD - May 2021
*** ERROR: READ I/O error: 5002
blocks: 32000
ADC data format: 257167172 ( 1454701.6 Hz)
Other data format: 4752828 ( 26885.0 Hz)
Sample trace data format: 0 ( 0.0 Hz)
Undefined format: 0 ( 0.0 Hz)
Other data format type: PAUSE: 1210 ( 6.8 Hz)
RESUME: 1214 ( 6.9 Hz)
SYNC100: 32658 ( 184.7 Hz)
WR48-63: 32658 ( 184.7 Hz)
FEE64 disc: 0 ( 0.0 Hz)
MBS info: 4685088 ( 26501.8 Hz)
Other info: 0 ( 0.0 Hz)
ADC data range bit set: 717535 ( 4058.8 Hz)
Timewarps: ADC: 0 ( 0.0 Hz)
PAUSE: 0 ( 0.0 Hz)
RESUME: 0 ( 0.0 Hz)
SYNC100: 0 ( 0.0 Hz)
WR48-63: 0 ( 0.0 Hz)
FEE64 disc: 0 ( 0.0 Hz)
MBS info: 0 ( 0.0 Hz)
Undefined: 0 ( 0.0 Hz)
Sample trace: 0 ( 0.0 Hz)
*** Timestamp elapsed time: 176.783 s
FEE elapsed dead time(s) elapsed idle time(s)
0 0.207 0.000
1 13.018 0.000
2 0.307 0.000
3 15.029 0.000
4 0.460 0.000
5 16.031 0.000
6 0.053 0.000
7 18.555 0.000
8 0.064 0.000
9 2.767 0.000
10 0.156 0.000
11 0.013 0.000
12 0.042 0.000
13 0.120 0.000
14 0.011 0.000
15 1.165 0.000
16 0.000 0.000
17 0.000 0.000
18 0.000 0.000
19 0.000 0.000
20 0.000 0.000
21 0.000 0.000
22 0.000 0.000
23 0.000 0.000
24 0.000 0.000
25 0.000 0.000
26 0.000 0.000
27 0.000 0.000
28 0.000 0.000
29 0.000 0.000
30 0.000 0.000
31 0.000 0.000
32 0.000 0.000
*** Statistics
FEE ADC Data Other Data Sample Undefined Pause Resume SYNC100 WR48-63 Disc MBS Other HEC Data
0 6985399 7079 0 0 19 19 870 870 0 5301 0 23500
1 14902829 3959 0 0 133 134 1846 1846 0 0 0 30106
2 9849800 1542328 0 0 15 15 1400 1400 0 1539498 0 34705
3 24099351 6585 0 0 273 274 3019 3019 0 0 0 21224
4 4358270 608906 0 0 22 22 570 570 0 607722 0 20659
5 21810185 6107 0 0 208 209 2845 2845 0 0 0 26202
6 6709059 419440 0 0 8 8 900 900 0 417624 0 34989
7 50592433 13110 0 0 251 251 6304 6304 0 0 0 314546
8 8465407 2084 0 0 5 5 1037 1037 0 0 0 35796
9 38024962 1522758 0 0 170 171 4988 4988 0 1512441 0 34088
10 15224642 3818 0 0 25 25 1884 1884 0 0 0 21218
11 4023142 603616 0 0 2 2 555 555 0 602502 0 30177
12 5915692 1460 0 0 7 7 723 723 0 0 0 19261
13 9709569 2380 0 0 14 14 1176 1176 0 0 0 33030
14 4832393 1204 0 0 3 3 599 599 0 0 0 22476
15 31664039 7994 0 0 55 55 3942 3942 0 0 0 15558
16 0 0 0 0 0 0 0 0 0 0 0 0
17 0 0 0 0 0 0 0 0 0 0 0 0
18 0 0 0 0 0 0 0 0 0 0 0 0
19 0 0 0 0 0 0 0 0 0 0 0 0
20 0 0 0 0 0 0 0 0 0 0 0 0
21 0 0 0 0 0 0 0 0 0 0 0 0
22 0 0 0 0 0 0 0 0 0 0 0 0
23 0 0 0 0 0 0 0 0 0 0 0 0
24 0 0 0 0 0 0 0 0 0 0 0 0
25 0 0 0 0 0 0 0 0 0 0 0 0
26 0 0 0 0 0 0 0 0 0 0 0 0
27 0 0 0 0 0 0 0 0 0 0 0 0
28 0 0 0 0 0 0 0 0 0 0 0 0
29 0 0 0 0 0 0 0 0 0 0 0 0
30 0 0 0 0 0 0 0 0 0 0 0 0
31 0 0 0 0 0 0 0 0 0 0 0 0
32 0 0 0 0 0 0 0 0 0 0 0 0
*** Timewarps
FEE ADC Pause Resume SYNC100 WR48-63 Disc MBS Undefined Samples
0 0 0 0 0 0 0 0 0 0
1 0 0 0 0 0 0 0 0 0
2 0 0 0 0 0 0 0 0 0
3 0 0 0 0 0 0 0 0 0
4 0 0 0 0 0 0 0 0 0
5 0 0 0 0 0 0 0 0 0
6 0 0 0 0 0 0 0 0 0
7 0 0 0 0 0 0 0 0 0
8 0 0 0 0 0 0 0 0 0
9 0 0 0 0 0 0 0 0 0
10 0 0 0 0 0 0 0 0 0
11 0 0 0 0 0 0 0 0 0
12 0 0 0 0 0 0 0 0 0
13 0 0 0 0 0 0 0 0 0
14 0 0 0 0 0 0 0 0 0
15 0 0 0 0 0 0 0 0 0
16 0 0 0 0 0 0 0 0 0
17 0 0 0 0 0 0 0 0 0
18 0 0 0 0 0 0 0 0 0
19 0 0 0 0 0 0 0 0 0
20 0 0 0 0 0 0 0 0 0
21 0 0 0 0 0 0 0 0 0
22 0 0 0 0 0 0 0 0 0
23 0 0 0 0 0 0 0 0 0
24 0 0 0 0 0 0 0 0 0
25 0 0 0 0 0 0 0 0 0
26 0 0 0 0 0 0 0 0 0
27 0 0 0 0 0 0 0 0 0
28 0 0 0 0 0 0 0 0 0
29 0 0 0 0 0 0 0 0 0
30 0 0 0 0 0 0 0 0 0
31 0 0 0 0 0 0 0 0 0
32 0 0 0 0 0 0 0 0 0
*** Program elapsed time: 33.457s ( 956.451 blocks/s, 59.778 Mb/s)
|
| Attachment 45: Screenshot_from_2024-06-10_15-02-52.png
|
|
| Attachment 46: Screenshot_from_2024-06-10_15-03-47.png
|
|
| Attachment 47: Screenshot_from_2024-06-10_15-04-15.png
|

|
| Attachment 48: Screenshot_from_2024-06-10_15-04-48.png
|

|
| Attachment 49: Screenshot_from_2024-06-10_15-05-18.png
|

|
| Attachment 50: Screenshot_from_2024-06-10_15-15-55.png
|
|
|
231
|
Fri Apr 16 15:52:08 2021 |
DSJ | 16 April 16.00 shift |
Clock status test result: Passed 12, Failed 0

Understand status as follows
Status bit 3 : firmware PLL that creates clocks from external clock not locked
Status bit 2 : always logic '1'
Status bit 1 : LMK3200(2) PLL and clock distribution chip not locked to external clock
Status bit 0 : LMK3200(1) PLL and clock distribution chip not locked to external clock
If all these bits are not set then the operation of the firmware is unreliable


Calibration test result: Passed 12, Failed 0

If any modules fail calibration , check the clock status and open the FADC Align and Control browser page to rerun calibration for that module


		 Base 		Current 	Difference
aida05 fault 	 0xc879 : 	 0xc87b : 	 2
aida06 fault 	 0x323c : 	 0x323e : 	 2
aida07 fault 	 0xfb3a : 	 0xfb3f : 	 5
aida08 fault 	 0xd3d6 : 	 0xd3d8 : 	 2
White Rabbit error counter test result: Passed 8, Failed 4

Understand the status reports as follows:-
Status bit 3 : White Rabbit decoder detected an error in the received data
Status bit 2 : Firmware registered WR error, no reload of Timestamp
Status bit 0 : White Rabbit decoder reports uncertain of Timestamp information from WR


FPGA Timestamp error counter test result: Passed 12, Failed 0
If any of these counts are reported as in error
The ASIC readout system has detected a timeslip.
That is the timestamp read from the time FIFO is not younger than the last


Returned 0 0 0 0 0 0 0 0 0 0 0 0
Mem(KB) :	4	8	16	32	64	128	256	512	1k	2k	4k
aida01 :     23     10      3      1      1      2      1      3      3      3      6   : 36156
aida02 :     25     10      4      3      1      2      2      3      3      3      6   : 36500
aida03 :     27      8      5      2      3      4      3      3      2      3      6   : 36092
aida04 :     30      4      4      5      0      2      4      2      3      3      6   : 36472
aida05 :     19      5      7      1      3      2      2      2      2      4      6   : 37060
aida06 :     18     13      1      2      1      3      2      3      3      3      6   : 36544
aida07 :     24      7      3      2      2      3      1      3      2      4      6   : 37384
aida08 :     15     11      2      5      2      4      1      4      3      3      6   : 37076
aida09 :      7      3      4      1      5      6      5      4      3      2      6   : 36308
aida10 :      8      3     13      4      3      3      1      4      2      3      6   : 36040
aida11 :     18     11     17      7      4      4      4      3      2      3      6   : 36752
aida12 :     12      7      7      7      4      4      2      3      2      3      6   : 36024


 Collecting the file size of each FEE64 Options CONTENTS file to check they are all the same

 FEE : aida01 =>   Options file size is 1025 	 Last changed Fri Apr 16 01:00:12 CEST 2021
 FEE : aida02 =>   Options file size is 1014 	 Last changed Fri Apr 16 00:56:20 CEST 2021
 FEE : aida03 =>   Options file size is 1014 	 Last changed Wed Apr 14 21:52:04 CEST 2021
 FEE : aida04 =>   Options file size is 1014 	 Last changed Wed Apr 14 21:52:04 CEST 2021
 FEE : aida05 =>   Options file size is 1025 	 Last changed Fri Apr 16 00:53:25 CEST 2021
 FEE : aida06 =>   Options file size is 1014 	 Last changed Wed Apr 14 21:52:04 CEST 2021
 FEE : aida07 =>   Options file size is 1014 	 Last changed Wed Apr 14 21:52:04 CEST 2021
 FEE : aida08 =>   Options file size is 1014 	 Last changed Wed Apr 14 21:52:04 CEST 2021
 FEE : aida09 =>   Options file size is 1014 	 Last changed Wed Apr 14 21:52:05 CEST 2021
 FEE : aida10 =>   Options file size is 1014 	 Last changed Wed Apr 14 21:52:06 CEST 2021
 FEE : aida11 =>   Options file size is 1014 	 Last changed Wed Apr 14 21:52:05 CEST 2021
 FEE : aida12 =>   Options file size is 1025 	 Last changed Wed Apr 14 21:58:54 CEST 2021


17:27.  Checked system stats, temps, leakage etc. looks ok


18:49. Tape server writing to disk /NULL/R21_9+
       /TapeData points to /media/SecondDrive/ - 3.6Tb free

19.15. checks

Clock status test result: Passed 12, Failed 0

Understand status as follows
Status bit 3 : firmware PLL that creates clocks from external clock not locked
Status bit 2 : always logic '1'
Status bit 1 : LMK3200(2) PLL and clock distribution chip not locked to external clock
Status bit 0 : LMK3200(1) PLL and clock distribution chip not locked to external clock
If all these bits are not set then the operation of the firmware is unreliable


Calibration test result: Passed 12, Failed 0

If any modules fail calibration , check the clock status and open the FADC Align and Control browser page to rerun calibration for that module


		 Base 		Current 	Difference
aida05 fault 	 0xc879 : 	 0xc87b : 	 2
aida06 fault 	 0x323c : 	 0x323e : 	 2
aida07 fault 	 0xfb3a : 	 0xfb3f : 	 5
aida08 fault 	 0xd3d6 : 	 0xd3d8 : 	 2
White Rabbit error counter test result: Passed 8, Failed 4

Understand the status reports as follows:-
Status bit 3 : White Rabbit decoder detected an error in the received data
Status bit 2 : Firmware registered WR error, no reload of Timestamp
Status bit 0 : White Rabbit decoder reports uncertain of Timestamp information from WR


			 Base 		Current 		Difference
aida07 fault 	 0xf : 	 0x10 : 	 1
FPGA Timestamp error counter test result: Passed 11, Failed 1
If any of these counts are reported as in error
The ASIC readout system has detected a timeslip.
That is the timestamp read from the time FIFO is not younger than the last


Returned 0 0 0 0 0 0 0 0 0 0 0 0
Mem(KB) :	4	8	16	32	64	128	256	512	1k	2k	4k
aida01 :     16      9     16      2      2      2      1      3      3      3      6   : 36424
aida02 :      1      3      5      4      1      3      3      2      3      3      6   : 36268
aida03 :     24     13     11      6      3      3      2      4      2      3      6   : 36472
aida04 :      5      4      4      4      3      3      3      2      3      3      6   : 36404
aida05 :     17      8      4      2      2      2      2      2      2      4      6   : 36996
aida06 :     26     11      3      2      0      3      2      3      3      3      6   : 36528
aida07 :     24      7      2      1      1      1      2      3      2      4      6   : 37272
aida08 :     13     12      6      3      3      4      1      4      3      3      6   : 37140
aida09 :     22     15     19      2      6      5      4      4      3      2      6   : 36416
aida10 :     16     11      6      4      3      3      1      4      2      3      6   : 36024
aida11 :     12      4      5      4      2      3      3      3      2      3      6   : 35872
aida12 :     18     12      9      4      4      4      2      3      2      3      6   : 36024


 Collecting the file size of each FEE64 Options CONTENTS file to check they are all the same

 FEE : aida01 =>   Options file size is 1025 	 Last changed Fri Apr 16 01:00:12 CEST 2021
 FEE : aida02 =>   Options file size is 1014 	 Last changed Fri Apr 16 00:56:20 CEST 2021
 FEE : aida03 =>   Options file size is 1014 	 Last changed Wed Apr 14 21:52:04 CEST 2021
 FEE : aida04 =>   Options file size is 1014 	 Last changed Wed Apr 14 21:52:04 CEST 2021
 FEE : aida05 =>   Options file size is 1025 	 Last changed Fri Apr 16 00:53:25 CEST 2021
 FEE : aida06 =>   Options file size is 1014 	 Last changed Wed Apr 14 21:52:04 CEST 2021
 FEE : aida07 =>   Options file size is 1014 	 Last changed Wed Apr 14 21:52:04 CEST 2021
 FEE : aida08 =>   Options file size is 1014 	 Last changed Wed Apr 14 21:52:04 CEST 2021
 FEE : aida09 =>   Options file size is 1014 	 Last changed Wed Apr 14 21:52:05 CEST 2021
 FEE : aida10 =>   Options file size is 1014 	 Last changed Wed Apr 14 21:52:06 CEST 2021
 FEE : aida11 =>   Options file size is 1014 	 Last changed Wed Apr 14 21:52:05 CEST 2021
 FEE : aida12 =>   Options file size is 1025 	 Last changed Wed Apr 14 21:58:54 CEST 2021


19.53.  Checked system stats, temps, leakage etc. looks ok

20:30.  Checked system stats, temps, leakage etc. looks ok

20:59.  Checked system stats, temps, leakage etc. looks ok


21:31 System checks

Clock status test result: Passed 12, Failed 0

Understand status as follows
Status bit 3 : firmware PLL that creates clocks from external clock not locked
Status bit 2 : always logic '1'
Status bit 1 : LMK3200(2) PLL and clock distribution chip not locked to external clock
Status bit 0 : LMK3200(1) PLL and clock distribution chip not locked to external clock
If all these bits are not set then the operation of the firmware is unreliable

Calibration test result: Passed 12, Failed 0

If any modules fail calibration , check the clock status and open the FADC Align and Control browser page to rerun calibration for that module


		 Base 		Current 	Difference
aida05 fault 	 0xc879 : 	 0xc87b : 	 2
aida06 fault 	 0x323c : 	 0x323e : 	 2
aida07 fault 	 0xfb3a : 	 0xfb40 : 	 6
aida08 fault 	 0xd3d6 : 	 0xd3d8 : 	 2
White Rabbit error counter test result: Passed 8, Failed 4

Understand the status reports as follows:-
Status bit 3 : White Rabbit decoder detected an error in the received data
Status bit 2 : Firmware registered WR error, no reload of Timestamp
Status bit 0 : White Rabbit decoder reports uncertain of Timestamp information from WR


			 Base 		Current 		Difference
aida07 fault 	 0xf : 	 0x10 : 	 1
FPGA Timestamp error counter test result: Passed 11, Failed 1
If any of these counts are reported as in error
The ASIC readout system has detected a timeslip.
That is the timestamp read from the time FIFO is not younger than the last


Returned 0 0 0 0 0 0 0 0 0 0 0 0
Mem(KB) :	4	8	16	32	64	128	256	512	1k	2k	4k
aida01 :     21      9     17      3      2      2      1      3      3      3      6   : 36492
aida02 :      5      1      1      6      0      2      2      3      3      3      6   : 36332
aida03 :      2     10     11      6      4      4      3      3      2      3      6   : 36296
aida04 :     27     12      3      4      0      2      3      2      3      3      6   : 36220
aida05 :     19      9      7      2      1      2      2      2      2      4      6   : 36996
aida06 :     28      5      0      4      0      3      1      3      3      3      6   : 36248
aida07 :     19     13     10      6      2      2      1      3      2      4      6   : 37524
aida08 :     18      9      6      0      1      4      1      3      3      3      6   : 36400
aida09 :     17     19     12      3      6      5      4      4      3      2      6   : 36348
aida10 :     23      9      7      4      2      3      1      4      2      3      6   : 35988
aida11 :     19     10      3      3      2      3      3      3      2      3      6   : 35884
aida12 :     12      6      0      3      2      4      2      3      2      3      6   : 35648


 Collecting the file size of each FEE64 Options CONTENTS file to check they are all the same

 FEE : aida01 =>   Options file size is 1025 	 Last changed Fri Apr 16 01:00:12 CEST 2021
 FEE : aida02 =>   Options file size is 1014 	 Last changed Fri Apr 16 00:56:20 CEST 2021
 FEE : aida03 =>   Options file size is 1014 	 Last changed Wed Apr 14 21:52:04 CEST 2021
 FEE : aida04 =>   Options file size is 1014 	 Last changed Wed Apr 14 21:52:04 CEST 2021
 FEE : aida05 =>   Options file size is 1025 	 Last changed Fri Apr 16 00:53:25 CEST 2021
 FEE : aida06 =>   Options file size is 1014 	 Last changed Wed Apr 14 21:52:04 CEST 2021
 FEE : aida07 =>   Options file size is 1014 	 Last changed Wed Apr 14 21:52:04 CEST 2021
 FEE : aida08 =>   Options file size is 1014 	 Last changed Wed Apr 14 21:52:04 CEST 2021
 FEE : aida09 =>   Options file size is 1014 	 Last changed Wed Apr 14 21:52:05 CEST 2021
 FEE : aida10 =>   Options file size is 1014 	 Last changed Wed Apr 14 21:52:06 CEST 2021
 FEE : aida11 =>   Options file size is 1014 	 Last changed Wed Apr 14 21:52:05 CEST 2021
 FEE : aida12 =>   Options file size is 1025 	 Last changed Wed Apr 14 21:58:54 CEST 2021


22.06.  Checked system stats, temps, leakage etc. looks ok

22.18CEST BNC PB-5 amplitude changed from 1V to 2V
          fioler NULL/R21_67

22.23CEST All histograms zero'd

22.43.  Checked system stats, temps, leakage etc. looks ok
23.21.  Checked system stats, temps, leakage etc. looks ok


23.46 system checks
Clock status test result: Passed 12, Failed 0

Understand status as follows
Status bit 3 : firmware PLL that creates clocks from external clock not locked
Status bit 2 : always logic '1'
Status bit 1 : LMK3200(2) PLL and clock distribution chip not locked to external clock
Status bit 0 : LMK3200(1) PLL and clock distribution chip not locked to external clock
If all these bits are not set then the operation of the firmware is unreliable


Calibration test result: Passed 12, Failed 0

If any modules fail calibration , check the clock status and open the FADC Align and Control browser page to rerun calibration for that module


		 Base 		Current 	Difference
aida05 fault 	 0xc879 : 	 0xc87b : 	 2
aida06 fault 	 0x323c : 	 0x323e : 	 2
aida07 fault 	 0xfb3a : 	 0xfb40 : 	 6
aida08 fault 	 0xd3d6 : 	 0xd3d8 : 	 2
White Rabbit error counter test result: Passed 8, Failed 4

Understand the status reports as follows:-
Status bit 3 : White Rabbit decoder detected an error in the received data
Status bit 2 : Firmware registered WR error, no reload of Timestamp
Status bit 0 : White Rabbit decoder reports uncertain of Timestamp information from WR

			 Base 		Current 		Difference
aida07 fault 	 0xf : 	 0x10 : 	 1
FPGA Timestamp error counter test result: Passed 11, Failed 1
If any of these counts are reported as in error
The ASIC readout system has detected a timeslip.
That is the timestamp read from the time FIFO is not younger than the last


Returned 0 0 0 0 0 0 0 0 0 0 0 0
Mem(KB) :	4	8	16	32	64	128	256	512	1k	2k	4k
aida01 :     17     12      7      0      3      3      2      4      2      3      6   : 36180
aida02 :     35      3      5      2      0      2      1      3      3      3      6   : 36148
aida03 :     22      6     10      2      1      3      2      4      2      3      6   : 36136
aida04 :     27      9      3      5      2      4      3      3      2      3      6   : 36100
aida05 :     20      9      3      3      2      2      2      2      2      4      6   : 37032
aida06 :     25     11      1      2      0      3      1      3      3      3      6   : 36236
aida07 :     20      6      6      2      3      3      2      4      1      4      6   : 37216
aida08 :     25     10      0      2      1      3      1      3      3      3      6   : 36276
aida09 :     10      4      3      4      4      5      4      4      3      2      6   : 35960
aida10 :     26      9      3      0      1      3      1      4      2      3      6   : 35744
aida11 :      2      3      4      2      2      3      3      3      2      3      6   : 35744
aida12 :      4      9      7      2      2      4      2      3      2      3      6   : 35720

 Collecting the file size of each FEE64 Options CONTENTS file to check they are all the same

 FEE : aida01 =>   Options file size is 1025 	 Last changed Fri Apr 16 01:00:12 CEST 2021
 FEE : aida02 =>   Options file size is 1014 	 Last changed Fri Apr 16 00:56:20 CEST 2021
 FEE : aida03 =>   Options file size is 1014 	 Last changed Wed Apr 14 21:52:04 CEST 2021
 FEE : aida04 =>   Options file size is 1014 	 Last changed Wed Apr 14 21:52:04 CEST 2021
 FEE : aida05 =>   Options file size is 1025 	 Last changed Fri Apr 16 00:53:25 CEST 2021
 FEE : aida06 =>   Options file size is 1014 	 Last changed Wed Apr 14 21:52:04 CEST 2021
 FEE : aida07 =>   Options file size is 1014 	 Last changed Wed Apr 14 21:52:04 CEST 2021
 FEE : aida08 =>   Options file size is 1014 	 Last changed Wed Apr 14 21:52:04 CEST 2021
 FEE : aida09 =>   Options file size is 1014 	 Last changed Wed Apr 14 21:52:05 CEST 2021
 FEE : aida10 =>   Options file size is 1014 	 Last changed Wed Apr 14 21:52:06 CEST 2021
 FEE : aida11 =>   Options file size is 1014 	 Last changed Wed Apr 14 21:52:05 CEST 2021
FEE : aida12 => Options file size is 1025 Last changed Wed Apr 14 21:58:54 CEST 2021 |
| Attachment 1: Screenshot_2021-04-16_Statistics_aidas-gsi.png
|

|
| Attachment 2: Screenshot_2021-04-16_Temperature_and_status_scan_aidas-gsi.png
|

|
| Attachment 3: 10.png
|

|
| Attachment 4: Screenshot_2021-04-16_Statistics_aidas-gsi(1).png
|
.png.png)
|
| Attachment 5: 11.png
|

|
| Attachment 6: Screenshot_2021-04-16_Temperature_and_status_scan_aidas-gsi(2).png
|
.png.png)
|
| Attachment 7: Screenshot_2021-04-16_Statistics_aidas-gsi(2).png
|
.png.png)
|
| Attachment 8: Screenshot_2021-04-16_Temperature_and_status_scan_aidas-gsi(3).png
|
.png.png)
|
| Attachment 9: 12.png
|

|
| Attachment 10: Screenshot_2021-04-16_Statistics_aidas-gsi(3).png
|
.png.png)
|
| Attachment 11: Screenshot_2021-04-16_Temperature_and_status_scan_aidas-gsi(4).png
|
.png.png)
|
| Attachment 12: 13.png
|
|
|
267
|
Fri Apr 23 15:13:28 2021 |
DSJ | 23 April 16.00-20.00 shift |
16:00 taking over from Muneerah
16:15 - temp, ucesb, database, stats etc. look ok.
16:41 - Nic restarting MBS
17:05 - temp, ucesb, database, stats etc. look ok.
17:43 - temp, ucesb, database, stats etc. look ok.
18.10 - system wide checks. All same as previous checks - eg elog 264 + 266
FEE64 module aida06 global clocks failed, 6
Clock status test result: Passed 11, Failed 1
Understand status as follows
Status bit 3 : firmware PLL that creates clocks from external clock not locked
Status bit 2 : always logic '1'
Status bit 1 : LMK3200(2) PLL and clock distribution chip not locked to external clock
Status bit 0 : LMK3200(1) PLL and clock distribution chip not locked to external clock
If all these bits are not set then the operation of the firmware is unreliable
FEE64 module aida06 failed
FEE64 module aida07 failed
FEE64 module aida12 failed
Calibration test result: Passed 9, Failed 3
If any modules fail calibration , check the clock status and open the FADC Align and Control browser page to rerun calibration for that module
Base Current Difference
aida06 fault 0x679f : 0x67a2 : 3
White Rabbit error counter test result: Passed 11, Failed 1
Understand the status reports as follows:-
Status bit 3 : White Rabbit decoder detected an error in the received data
Status bit 2 : Firmware registered WR error, no reload of Timestamp
Status bit 0 : White Rabbit decoder reports uncertain of Timestamp information from WR
Check FPGA Timestamp Error - HTML errors
Returned 0 0 0 0 0 0 0 0 0 0 0 0
Mem(KB) : 4 8 16 32 64 128 256 512 1k 2k 4k
aida01 : 19 7 4 7 4 3 2 4 2 3 6 : 36388
aida02 : 1 2 5 2 0 4 3 4 3 4 3 : 27044
aida03 : 28 4 4 4 4 4 2 2 3 3 6 : 36432
aida04 : 5 5 2 6 2 3 3 3 3 3 6 : 36892
aida05 : 24 4 7 3 3 3 2 2 3 3 6 : 36240
aida06 : 21 6 6 3 3 4 2 2 3 3 6 : 36356
aida07 : 15 7 4 3 3 4 2 2 3 3 6 : 36308
aida08 : 23 6 7 1 3 4 1 3 3 3 6 : 36572
aida09 : 1 8 2 1 1 2 4 2 3 3 6 : 36292
aida10 : 3 4 6 2 2 2 3 3 2 3 6 : 35660
aida11 : 15 7 4 1 2 3 2 4 2 3 6 : 36052
aida12 : 25 13 5 2 2 3 2 3 3 3 6 : 36700
18:45 - temp, ucesb, database, stats etc. look ok.
19:03 - temp, ucesb, database, stats etc. look ok.
19:26 - temp, ucesb, database, stats etc. look ok.
TapeData (df -h) - 7.2T 3.9T 2.9T 58% /media/1e121361-83d3-4825-b6ae-8700b07e0ca7
19:30 - beam being shared with R3B, implantation rates fluctuation by~ 50% back to normal 19:40
19:50 system checks - all as previous
FEE64 module aida06 global clocks failed, 6
Clock status test result: Passed 11, Failed 1
Understand status as follows
Status bit 3 : firmware PLL that creates clocks from external clock not locked
Status bit 2 : always logic '1'
Status bit 1 : LMK3200(2) PLL and clock distribution chip not locked to external clock
Status bit 0 : LMK3200(1) PLL and clock distribution chip not locked to external clock
If all these bits are not set then the operation of the firmware is unreliable
FEE64 module aida06 failed
FEE64 module aida07 failed
FEE64 module aida12 failed
Calibration test result: Passed 9, Failed 3
If any modules fail calibration , check the clock status and open the FADC Align and Control browser page to rerun calibration for that module
Base Current Difference
aida06 fault 0x679f : 0x67a2 : 3
White Rabbit error counter test result: Passed 11, Failed 1
Understand the status reports as follows:-
Status bit 3 : White Rabbit decoder detected an error in the received data
Status bit 2 : Firmware registered WR error, no reload of Timestamp
Status bit 0 : White Rabbit decoder reports uncertain of Timestamp information from WR
Check FPGA Timestamp Error - HTML errors
Returned 0 0 0 0 0 0 0 0 0 0 0 0
Mem(KB) : 4 8 16 32 64 128 256 512 1k 2k 4k
aida01 : 25 6 4 7 4 3 2 4 2 3 6 : 36404
aida02 : 20 7 5 1 0 4 2 3 2 3 4 : 27384
aida03 : 28 6 3 5 3 5 2 2 3 3 6 : 36528
aida04 : 19 8 4 6 2 4 4 2 3 3 6 : 36876
aida05 : 7 3 8 3 4 3 1 3 3 3 6 : 36500
aida06 : 25 8 4 3 3 4 2 3 3 3 6 : 36868
aida07 : 18 7 3 4 3 4 2 2 3 3 6 : 36336
aida08 : 16 10 6 2 3 3 1 3 3 3 6 : 36464
aida09 : 0 3 1 1 1 3 4 2 3 3 6 : 36360
aida10 : 8 1 10 0 2 2 2 4 2 3 6 : 35912
aida11 : 2 2 2 3 3 4 3 3 2 3 6 : 35928
aida12 : 12 7 4 1 3 3 2 3 3 3 6 : 36616
|
| Attachment 1: Screenshot_2021-04-23_Statistics_aidas-gsi(5).png
|
.png.png)
|
| Attachment 2: Screenshot_2021-04-23_Temperature_and_status_scan_aidas-gsi(5).png
|
.png.png)
|
| Attachment 3: 555.png
|

|
| Attachment 4: Screenshot_2021-04-23_Temperature_and_status_scan_aidas-gsi(6).png
|
.png.png)
|
| Attachment 5: Screenshot_2021-04-23_Statistics_aidas-gsi(6).png
|
.png.png)
|
| Attachment 6: 556.png
|

|
|
322
|
Mon May 17 23:17:16 2021 |
DSJ | Tuesday 18 May 0.00-8.00 shift |
0.00 - Taking over from Lewis
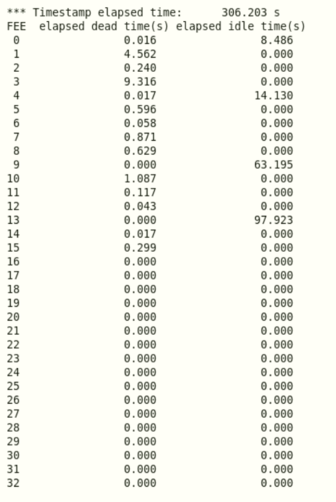
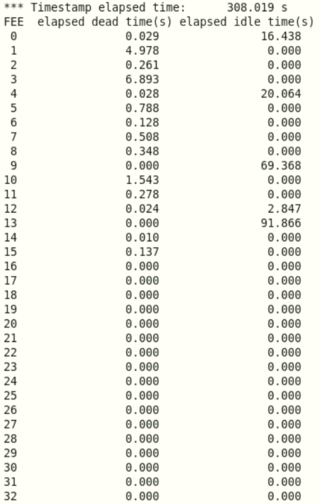
00.30 - Rates look ok (fig1), Ran R14_147 through analyser, dead times all good (fig2)
01.00 - Rates look ok (Fig3), Ran R14_153 through analyser, dead times all good (fig4)
01.30 - Rates look ok (Fig5), Ran R14_158 through analyser, dead times all good (fig6)
02.00 - Rates look ok (Fig7), Ran R14_164 through analyser, dead times all good (fig8)
Leakage current ok (fig 9), Temps OK (fig10), UCESB looks ok (fig11)
System Wide Checks:
Clock status test result: Passed 16, Failed 0
Calibration test result: Passed 0, Failed 16
Base Current Difference
aida05 fault 0x4da : 0x4ee : 20
White Rabbit error counter test result: Passed 15, Failed 1
FPGA Timestamp error counter test result: Passed 16, Failed 0
Returned 0 0 0 0 0 0 0 0 0 0 0 0 0 0 0 0
Mem(KB) : 4 8 16 32 64 128 256 512 1k 2k 4k
aida01 : 43 12 6 4 1 4 2 2 1 3 7 : 38444
aida02 : 21 12 4 4 2 3 3 3 3 3 6 : 36980
aida03 : 23 8 4 2 2 4 2 3 3 3 6 : 36764
aida04 : 34 12 10 5 1 4 1 4 3 3 6 : 37224
aida05 : 18 5 5 1 2 3 2 2 1 3 7 : 38112
aida06 : 40 12 5 7 2 4 2 4 3 3 6 : 37552
aida07 : 40 10 6 2 2 4 2 2 2 2 7 : 37392
aida08 : 19 11 3 3 1 4 3 3 3 3 6 : 36980
aida09 : 43 6 2 4 3 4 3 3 3 3 6 : 37180
aida10 : 32 14 10 3 4 1 2 4 1 3 7 : 39280
aida11 : 40 7 2 5 4 3 1 4 3 3 6 : 37144
aida12 : 37 14 13 2 2 3 2 4 3 3 6 : 37396
aida13 : 18 9 3 1 1 5 3 3 3 3 6 : 37024
aida14 : 36 13 6 4 2 3 2 3 1 3 7 : 38872
aida15 : 32 11 7 4 3 4 2 3 2 4 6 : 38024
aida16 : 26 9 4 1 0 3 1 4 3 3 6 : 36752
02.30 - rates ok (fig 12), Ran R14_170 through analyser, dead times all good (fig13)
03.00 - rates ok (fig 14), Ran R14_175 through analyser, dead times all good (fig15)
03.05 - No beam, problem with SIS, don't know how long will be off
03.14 - Beam is back
03.30 - rates ok (fig 16), Ran R14_180 through analyser, dead times all good (fig17)
04.00 - rates ok (fig 18), Ran R14_186 through analyser, dead times all good (fig19)
Leakage current ok (fig 20), Temps OK (fig21), UCESB looks ok (fig22)
System Wide Checks:
Clock status test result: Passed 16, Failed 0
Calibration test result: Passed 0, Failed 16
Base Current Difference
aida05 fault 0x4da : 0x4f2 : 24
White Rabbit error counter test result: Passed 15, Failed 1
FPGA Timestamp error counter test result: Passed 16, Failed 0
Returned 0 0 0 0 0 0 0 0 0 0 0 0 0 0 0 0
Mem(KB) : 4 8 16 32 64 128 256 512 1k 2k 4k
aida01 : 26 11 5 6 1 4 2 2 1 3 7 : 38416
aida02 : 16 9 5 4 2 4 2 2 3 3 6 : 36312
aida03 : 9 7 4 4 2 4 2 3 3 3 6 : 36764
aida04 : 36 11 8 4 3 4 1 3 4 3 6 : 37800
aida05 : 20 4 3 2 2 3 2 2 1 3 7 : 38112
aida06 : 22 13 10 7 2 4 3 3 4 3 6 : 38336
aida07 : 28 7 7 2 2 4 2 2 2 2 7 : 37336
aida08 : 2 3 4 4 1 3 2 3 3 3 6 : 36512
aida09 : 40 7 1 4 4 3 3 3 3 3 6 : 37096
aida10 : 26 9 12 2 3 2 2 4 1 3 7 : 39280
aida11 : 30 7 1 5 4 3 1 3 2 4 6 : 37600
aida12 : 15 10 6 4 2 3 2 4 3 3 6 : 37228
aida13 : 1 3 2 1 2 4 3 2 3 3 6 : 36316
aida14 : 34 12 7 4 2 3 2 3 1 3 7 : 38872
aida15 : 18 11 5 3 4 4 2 3 2 4 6 : 37968
aida16 : 22 7 4 2 0 3 1 4 3 3 6 : 36752
04.30 - rates ok (fig23), Ran R14_192 through analyser, dead times all good (fig24)
05.00 - rates ok (fig25), Ran R14_198 through analyser, dead times all good (fig26)
05.30 - Rates ok (Fig27), Ran R14_203 through analyser, dead times all good (fig28)
06.00 - Rates ok (Fig29), Ran R14_203 through analyser, dead times all good (fig30)
Leakage current ok (fig 31), Temps OK (fig32), UCESB looks ok (fig33)
System Wide Checks:
Clock status test result: Passed 16, Failed 0
Calibration test result: Passed 0, Failed 16
Base Current Difference
aida05 fault 0x4da : 0x4f9 : 31
White Rabbit error counter test result: Passed 15, Failed 1
FPGA Timestamp error counter test result: Passed 16, Failed 0
Returned 0 0 0 0 0 0 0 0 0 0 0 0 0 0 0 0
Mem(KB) : 4 8 16 32 64 128 256 512 1k 2k 4k
aida01 : 16 9 3 7 1 5 1 3 1 3 7 : 38744
aida02 : 18 3 5 2 3 3 3 2 3 3 6 : 36400
aida03 : 21 9 4 2 2 4 2 4 3 3 6 : 37276
aida04 : 32 12 7 3 3 4 1 3 4 3 6 : 37744
aida05 : 12 8 3 2 2 4 2 2 1 3 7 : 38240
aida06 : 28 14 4 8 2 4 3 3 3 3 6 : 37280
aida07 : 40 12 5 2 2 4 1 3 2 2 7 : 37648
aida08 : 13 8 4 4 1 3 2 3 3 3 6 : 36596
aida09 : 35 5 2 4 3 4 2 4 3 3 6 : 37396
aida10 : 6 10 4 1 1 3 2 2 1 3 7 : 38024
aida11 : 41 9 1 4 4 3 2 4 3 3 6 : 37372
aida12 : 29 11 9 4 2 3 2 4 3 3 6 : 37340
aida13 : 24 10 5 1 2 4 3 2 3 3 6 : 36512
aida14 : 34 16 5 4 2 3 2 3 1 3 7 : 38872
aida15 : 42 8 6 2 4 4 2 3 2 4 6 : 38024
aida16 : 8 9 6 1 0 3 1 4 3 3 6 : 36712
06.30 - Rates look ok (Fig34), Ran R14_215 through analyser, dead times all good (fig35)
07.00 - Rates look ok (Fig36), Ran R14_221 through analyser, dead times all good (fig 37)
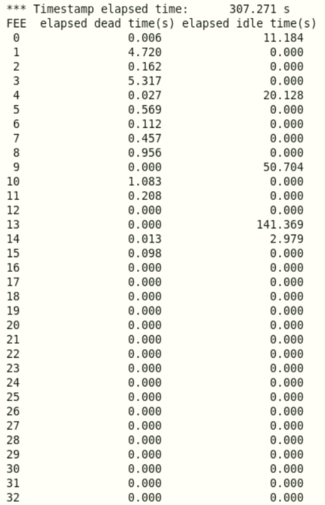
07.25 - Rates look ok (Fig38), Ran R14_226 through analyser, dead times all good (fig 39) |
| Attachment 1: Screenshot_2021-05-18_Statistics_aidas-gsi(1).png
|
.png.png)
|
| Attachment 2: R14_147_deadtime_23.41.06.png
|
|
| Attachment 3: Screenshot_2021-05-18_Statistics_aidas-gsi(2).png
|
.png.png)
|
| Attachment 4: R14_153_deadtime_00.07.12.png
|
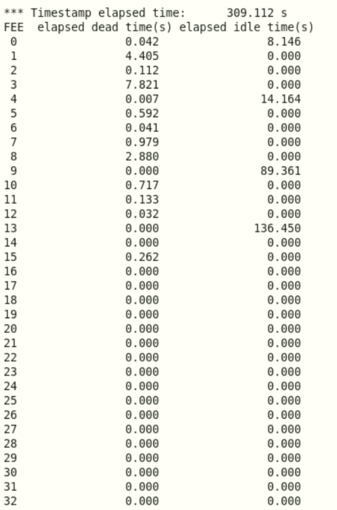
|
| Attachment 5: Screenshot_2021-05-18_Statistics_aidas-gsi(3).png
|
.png.png)
|
| Attachment 6: R14_158_deadtime_00.32.42.png
|
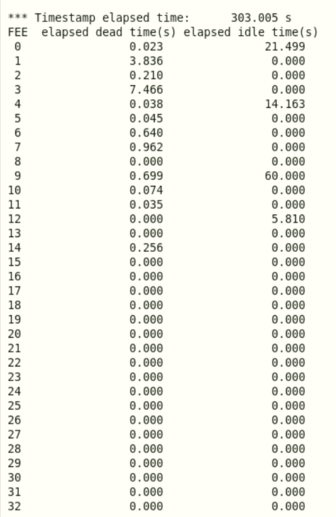
|
| Attachment 7: Screenshot_2021-05-18_Statistics_aidas-gsi(4).png
|
.png.png)
|
| Attachment 8: R14_164_deadtime_01.02.32.png
|
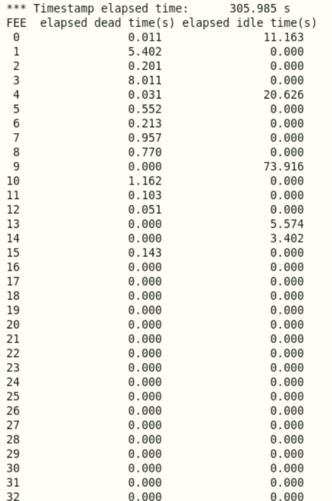
|
| Attachment 9: TMP.png
|
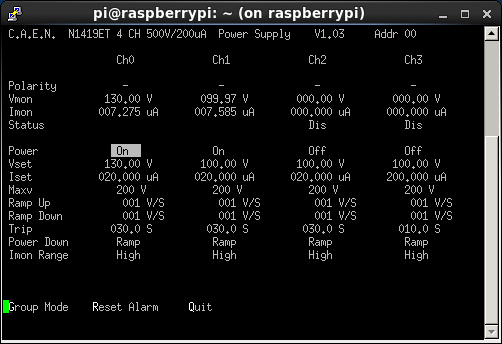
|
| Attachment 10: Screenshot_2021-05-18_Temperature_and_status_scan_aidas-gsi.png
|

|
| Attachment 11: Screenshot_2021-05-18_ucesb.png
|
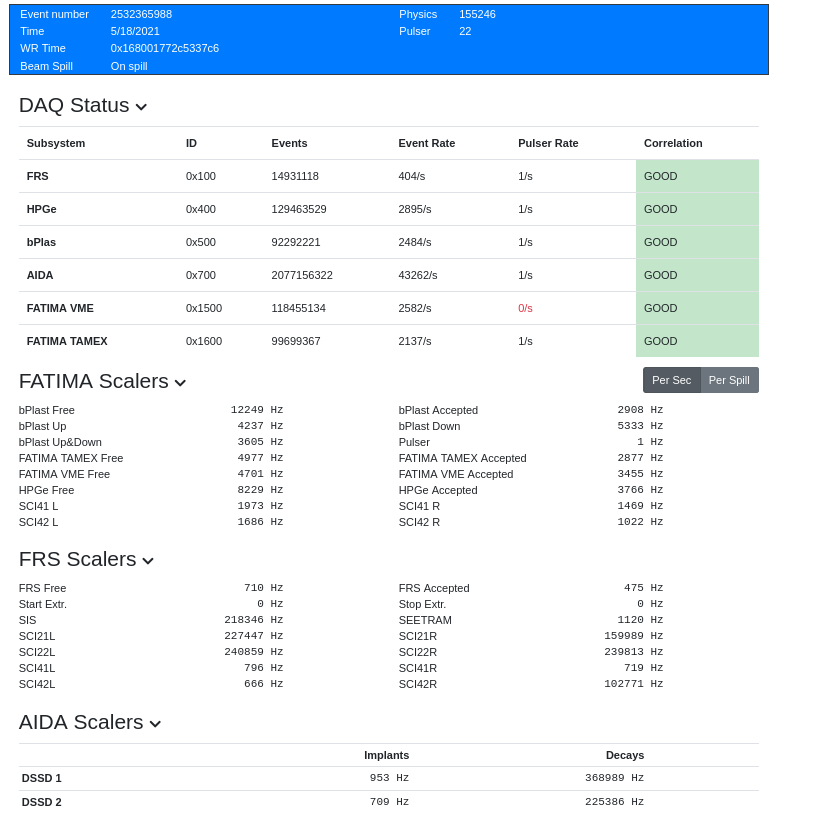
|
| Attachment 12: Screenshot_2021-05-18_Statistics_aidas-gsi(5).png
|
.png.png)
|
| Attachment 13: R14_170_deadtime_01.35.24.png
|
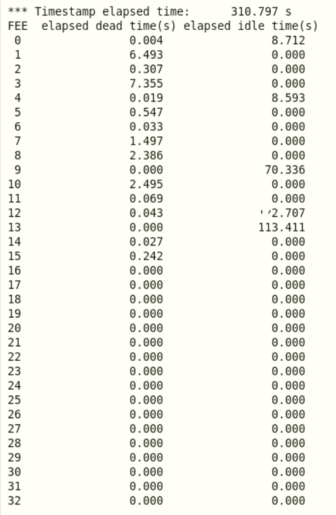
|
| Attachment 14: Screenshot_2021-05-18_Statistics_aidas-gsi(6).png
|
.png.png)
|
| Attachment 15: R14_175_deadtime_01.59.37.png
|
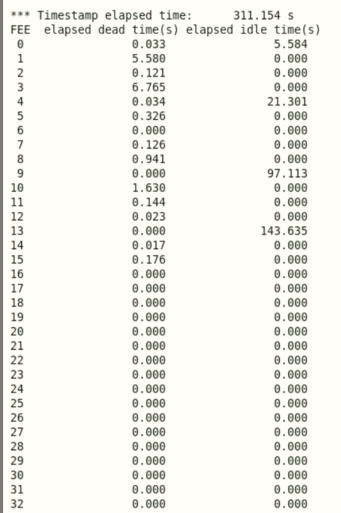
|
| Attachment 16: Screenshot_2021-05-18_Statistics_aidas-gsi(7).png
|
.png.png)
|
| Attachment 17: R14_180_deadtime_02.31.32.png
|
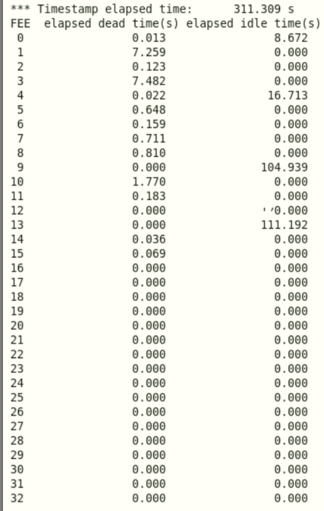
|
| Attachment 18: Screenshot_2021-05-18_Statistics_aidas-gsi(8).png
|
.png.png)
|
| Attachment 19: R14_186_deadtime_03.00.27.png
|
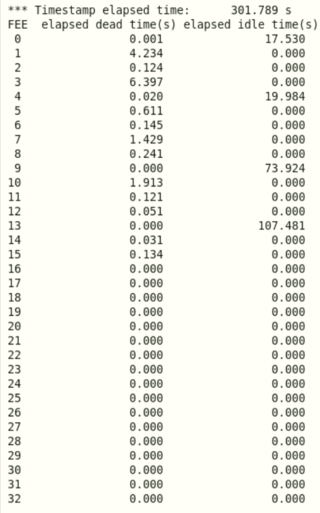
|
| Attachment 20: TMP.png
|

|
| Attachment 21: Screenshot_2021-05-18_Temperature_and_status_scan_aidas-gsi(1).png
|
.png.png)
|
| Attachment 22: Screenshot_2021-05-18_ucesb(1).png
|
.png.png)
|
| Attachment 23: Screenshot_2021-05-18_Statistics_aidas-gsi(9).png
|
.png.png)
|
| Attachment 24: R14_192_deadtime_03.31.26.png
|

|
| Attachment 25: Screenshot_2021-05-18_Statistics_aidas-gsi(10).png
|
.png.png)
|
| Attachment 26: R14_198_deadtime_04.00.21.png
|
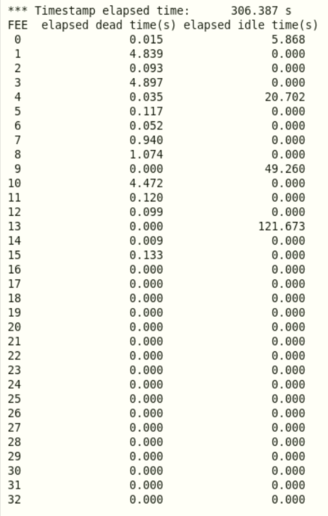
|
| Attachment 27: Screenshot_2021-05-18_Statistics_aidas-gsi(11).png
|
.png.png)
|
| Attachment 28: R14_198_deadtime_04.27.46.png
|
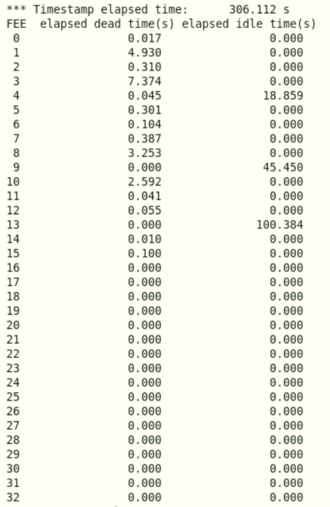
|
| Attachment 29: Screenshot_2021-05-18_Statistics_aidas-gsi(12).png
|
.png.png)
|
| Attachment 30: R14_203_deadtime_05.png
|
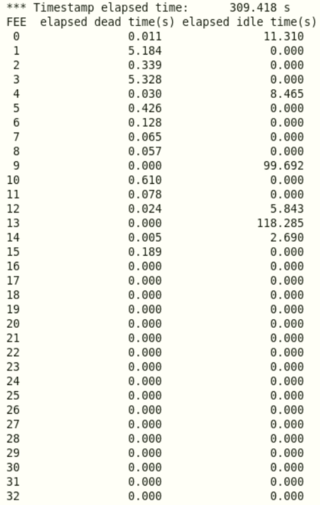
|
| Attachment 31: TMP.png
|

|
| Attachment 32: Screenshot_2021-05-18_Temperature_and_status_scan_aidas-gsi(2).png
|
.png.png)
|
| Attachment 33: Screenshot_2021-05-18_ucesb(3).png
|
.png.png)
|
| Attachment 34: Screenshot_2021-05-18_Statistics_aidas-gsi(13).png
|
.png.png)
|
| Attachment 35: R14_215_deadtime_05.30.26.png
|
|
| Attachment 36: Screenshot_2021-05-18_Statistics_aidas-gsi(14).png
|
.png.png)
|
| Attachment 37: R14__221_DEADTIME_06.00.35.png
|

|
| Attachment 38: Screenshot_2021-05-18_Statistics_aidas-gsi(15).png
|
.png.png)
|
| Attachment 39: R14_226_deadtime_06.25.32.png
|
|
|
588
|
Mon Apr 22 15:17:07 2024 |
DSJ | 16.00-0.00 22/04/24 |
First checks of shift. All looks ok.
Screenshot of HV, temps, rates, Merger attached. Attachments 1-4.
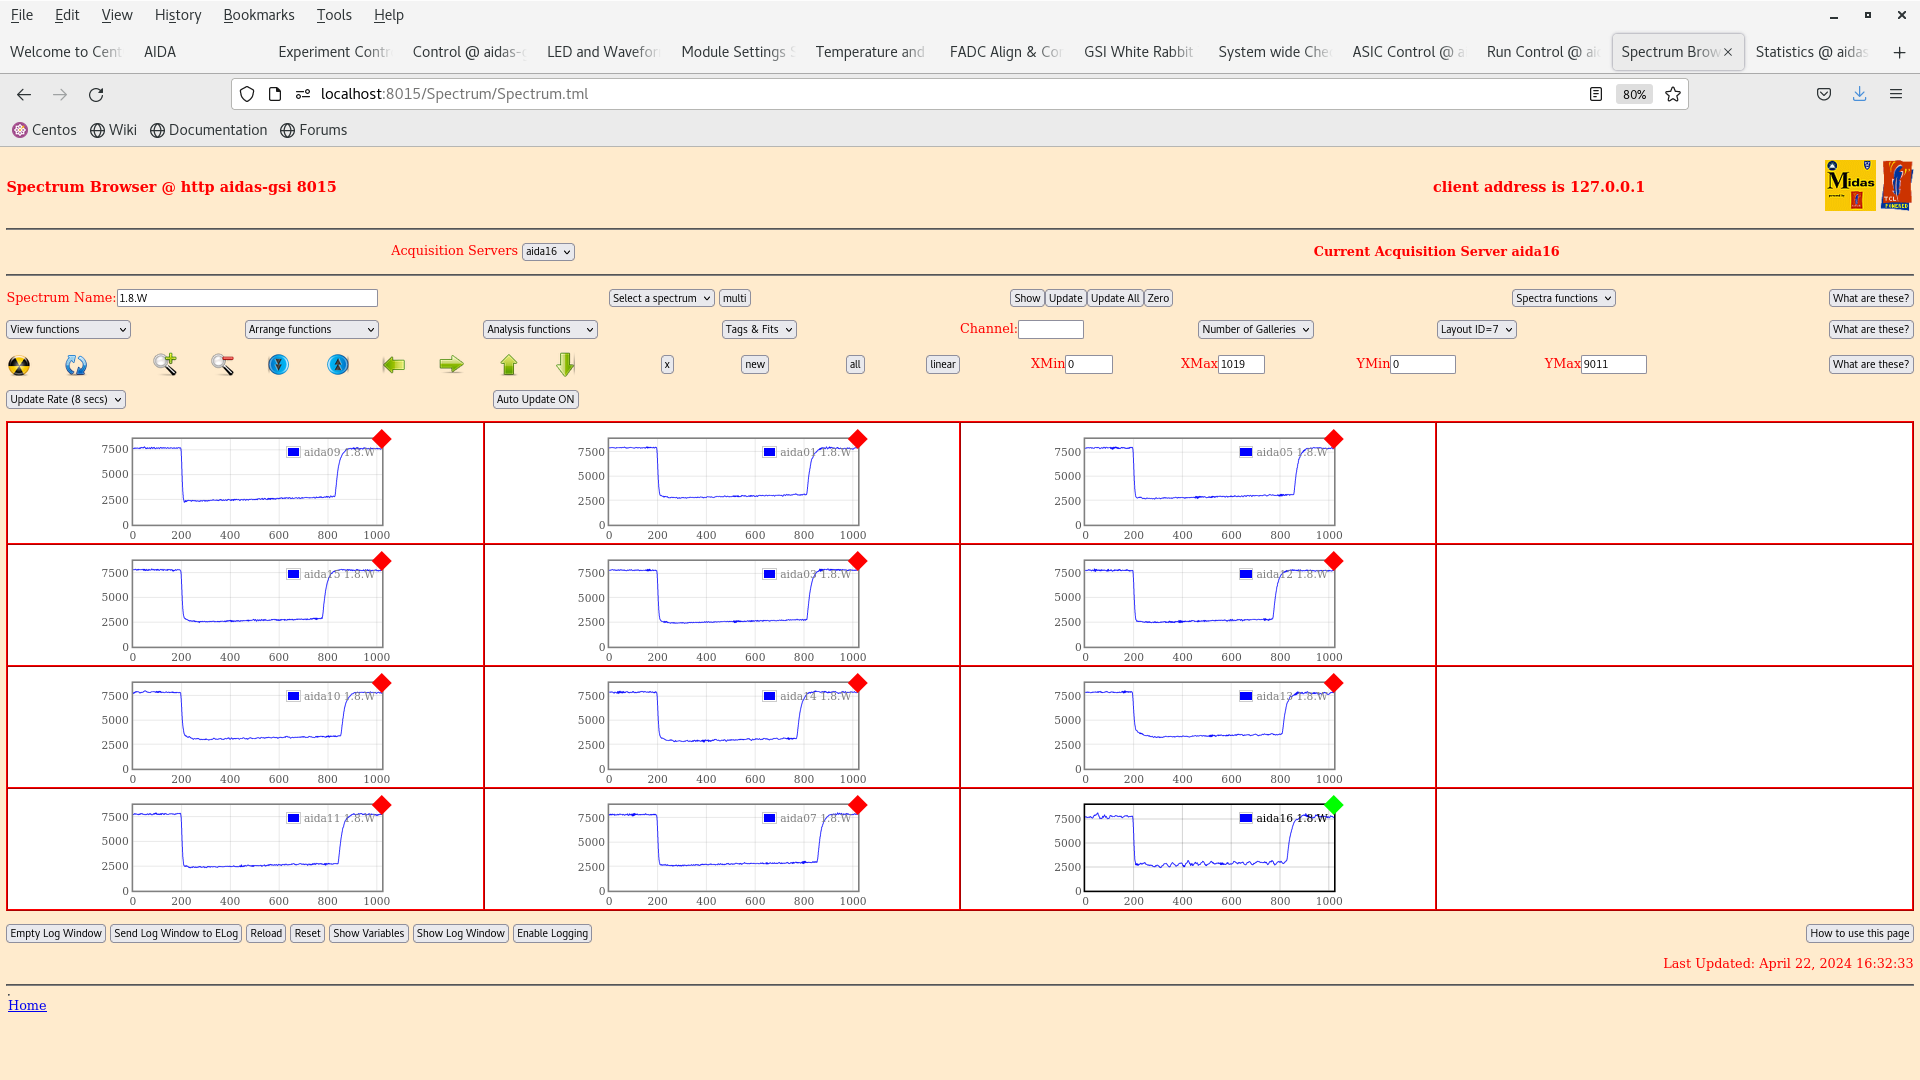
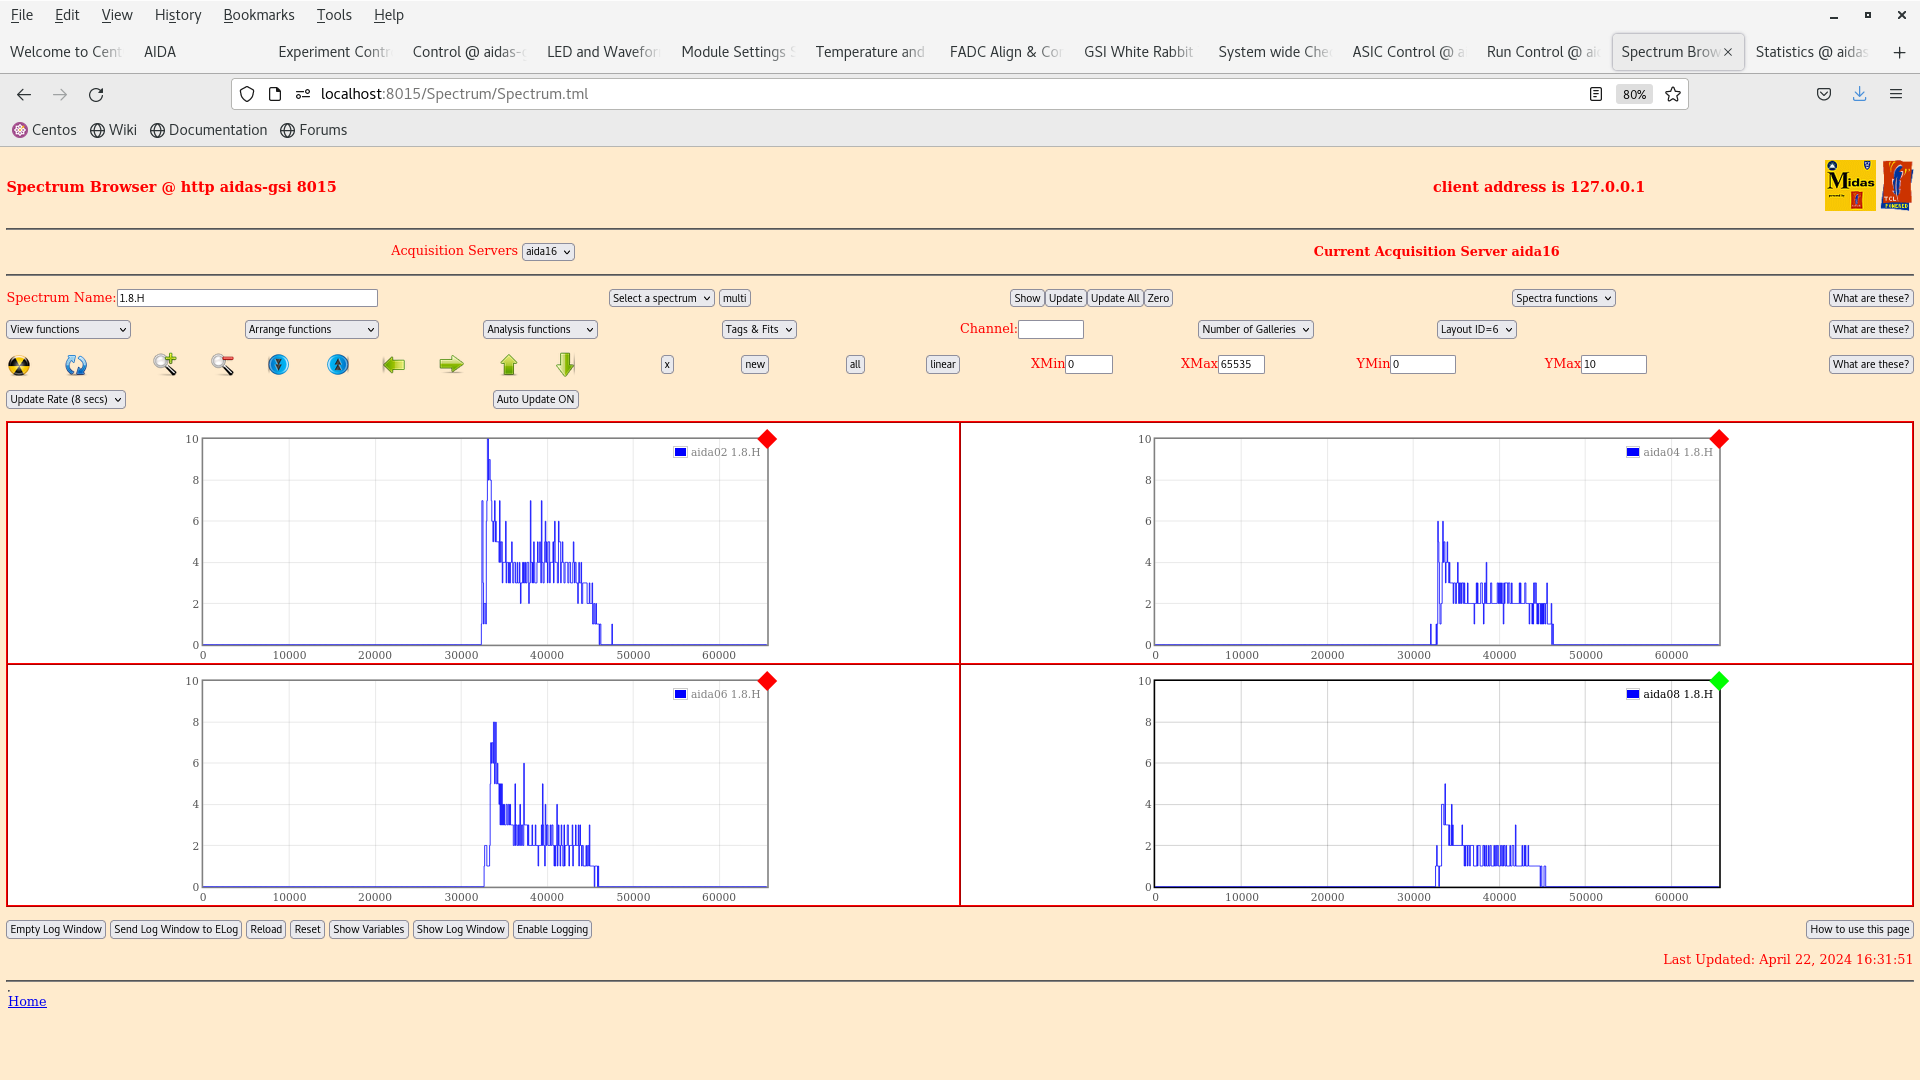
Screenshots of all spectrum Layout IDs taken before zeroing at 16.35. (Attachments 5-12)
checks at 16.00 - merger has crashed - aida01 dropped out - Tom tried to stop DAQ but got an error. Restart servers restarted at 16.09
Reset 01, restarted DAQ, and restarted as R16.
16.15 Data seems to be collected but spectra not being incremented in aida01. Timestamps look to be out of sync. Tom restarting aida01 again.
Did not fix, power cycle all FEEs - all spectra reset. aida3,6,11,12,14,15 wont calibrate adcs so wont have waveforms
RUN17 STARTED 16.51|
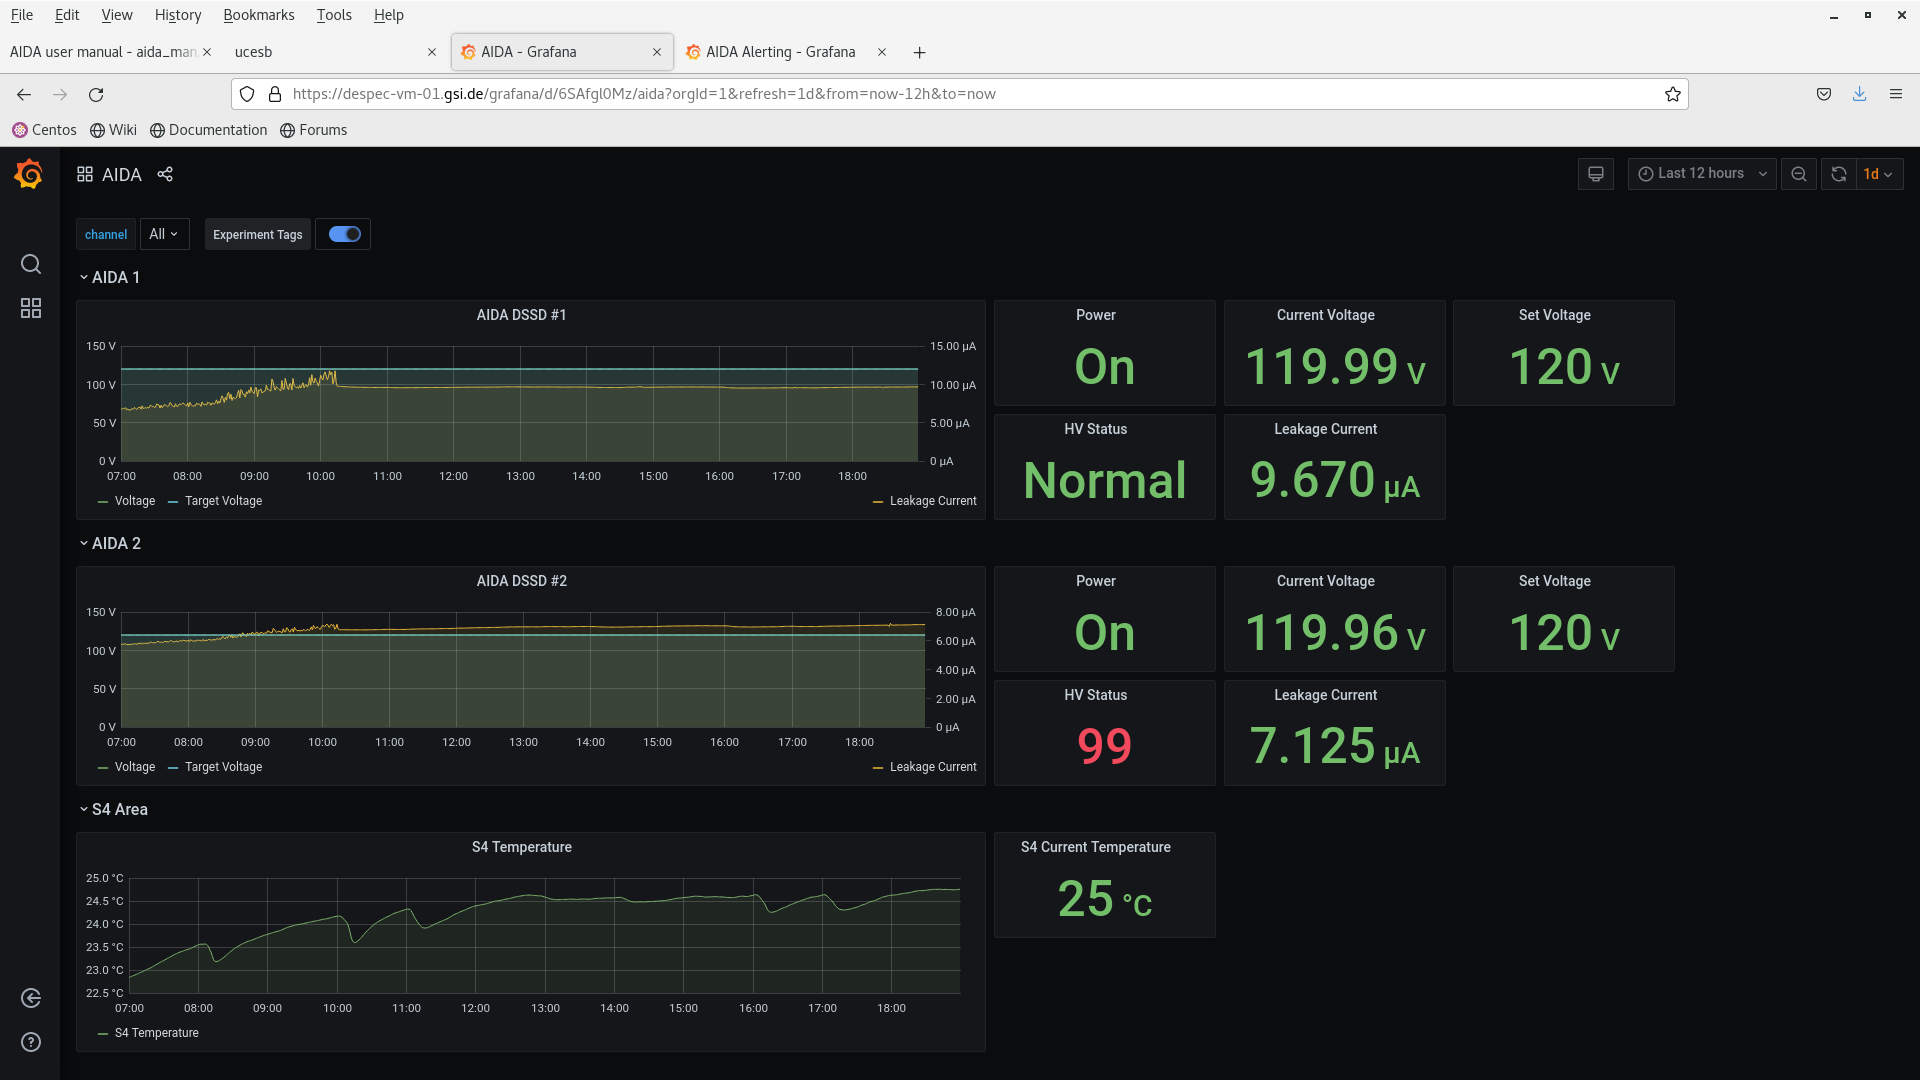
HV, temps, rates, Merger looks ok 17.00. Plots saved as attachments 13-16.
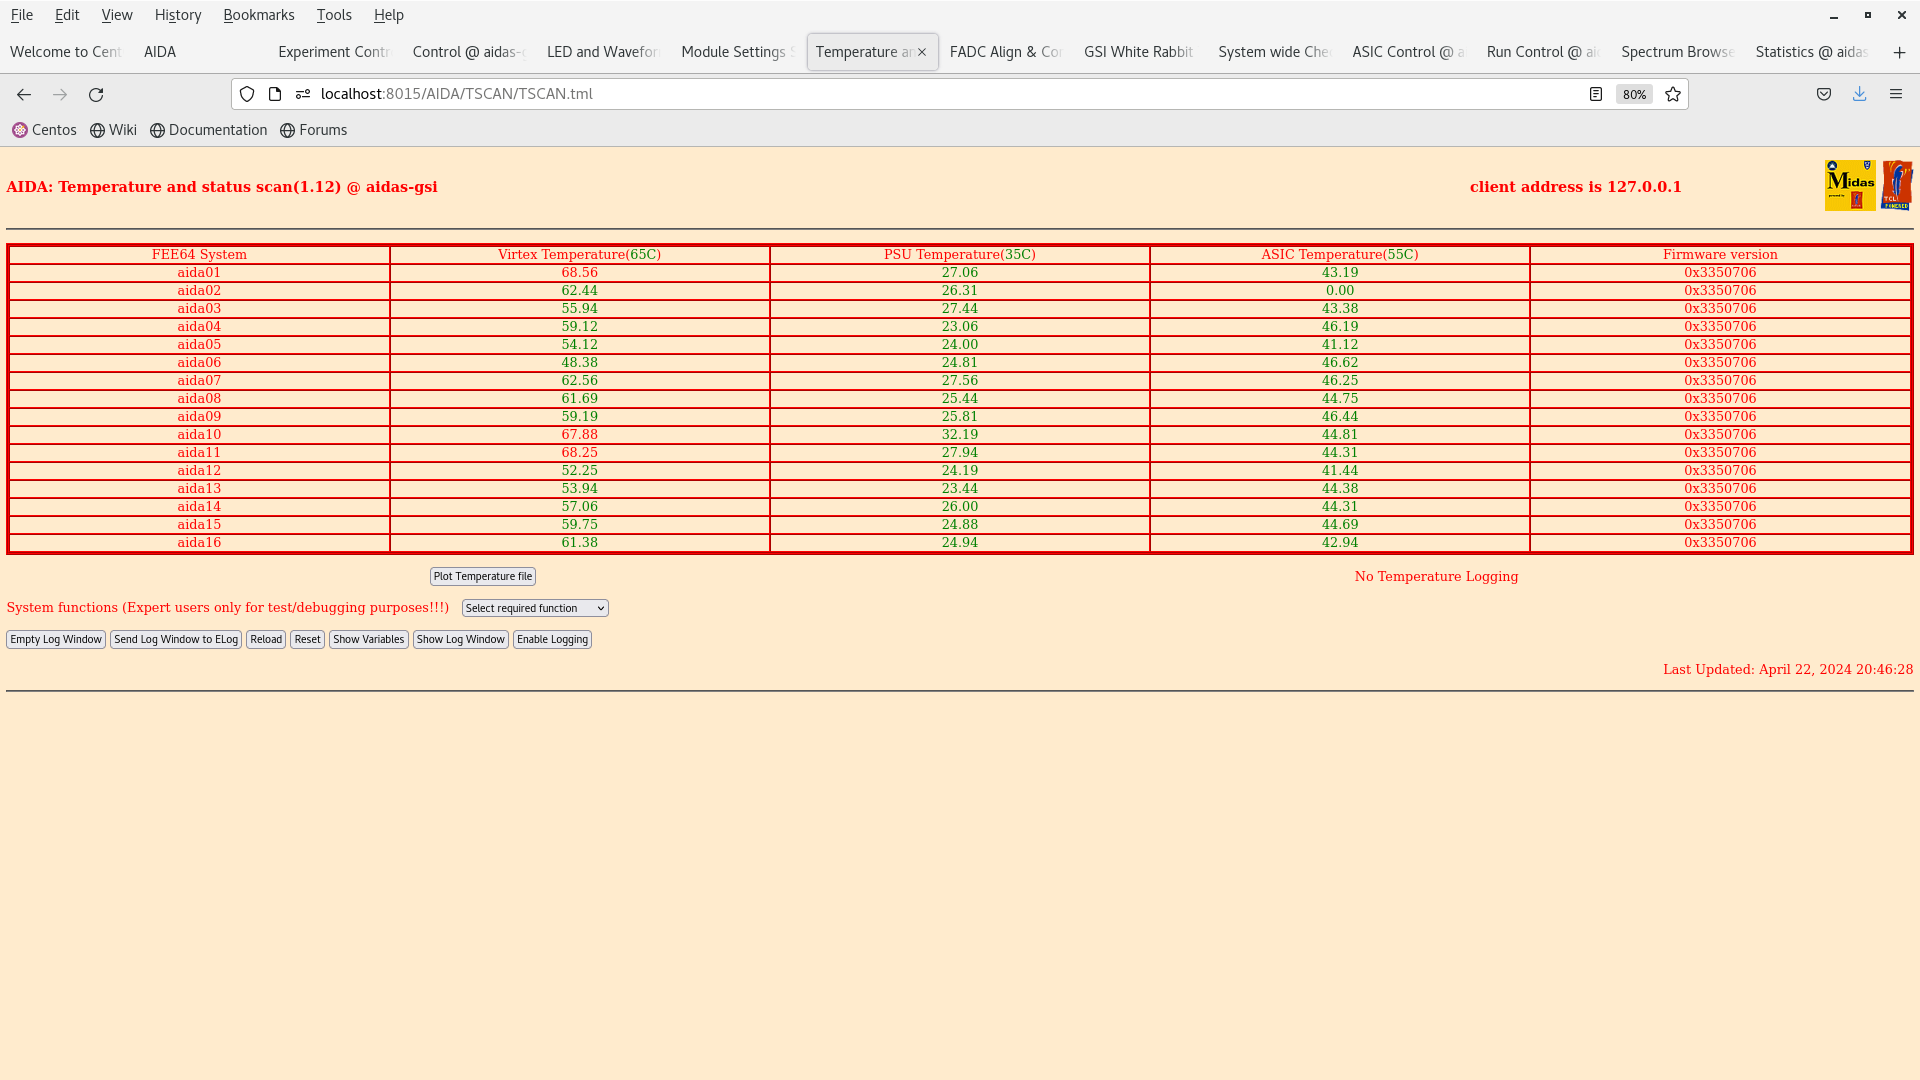
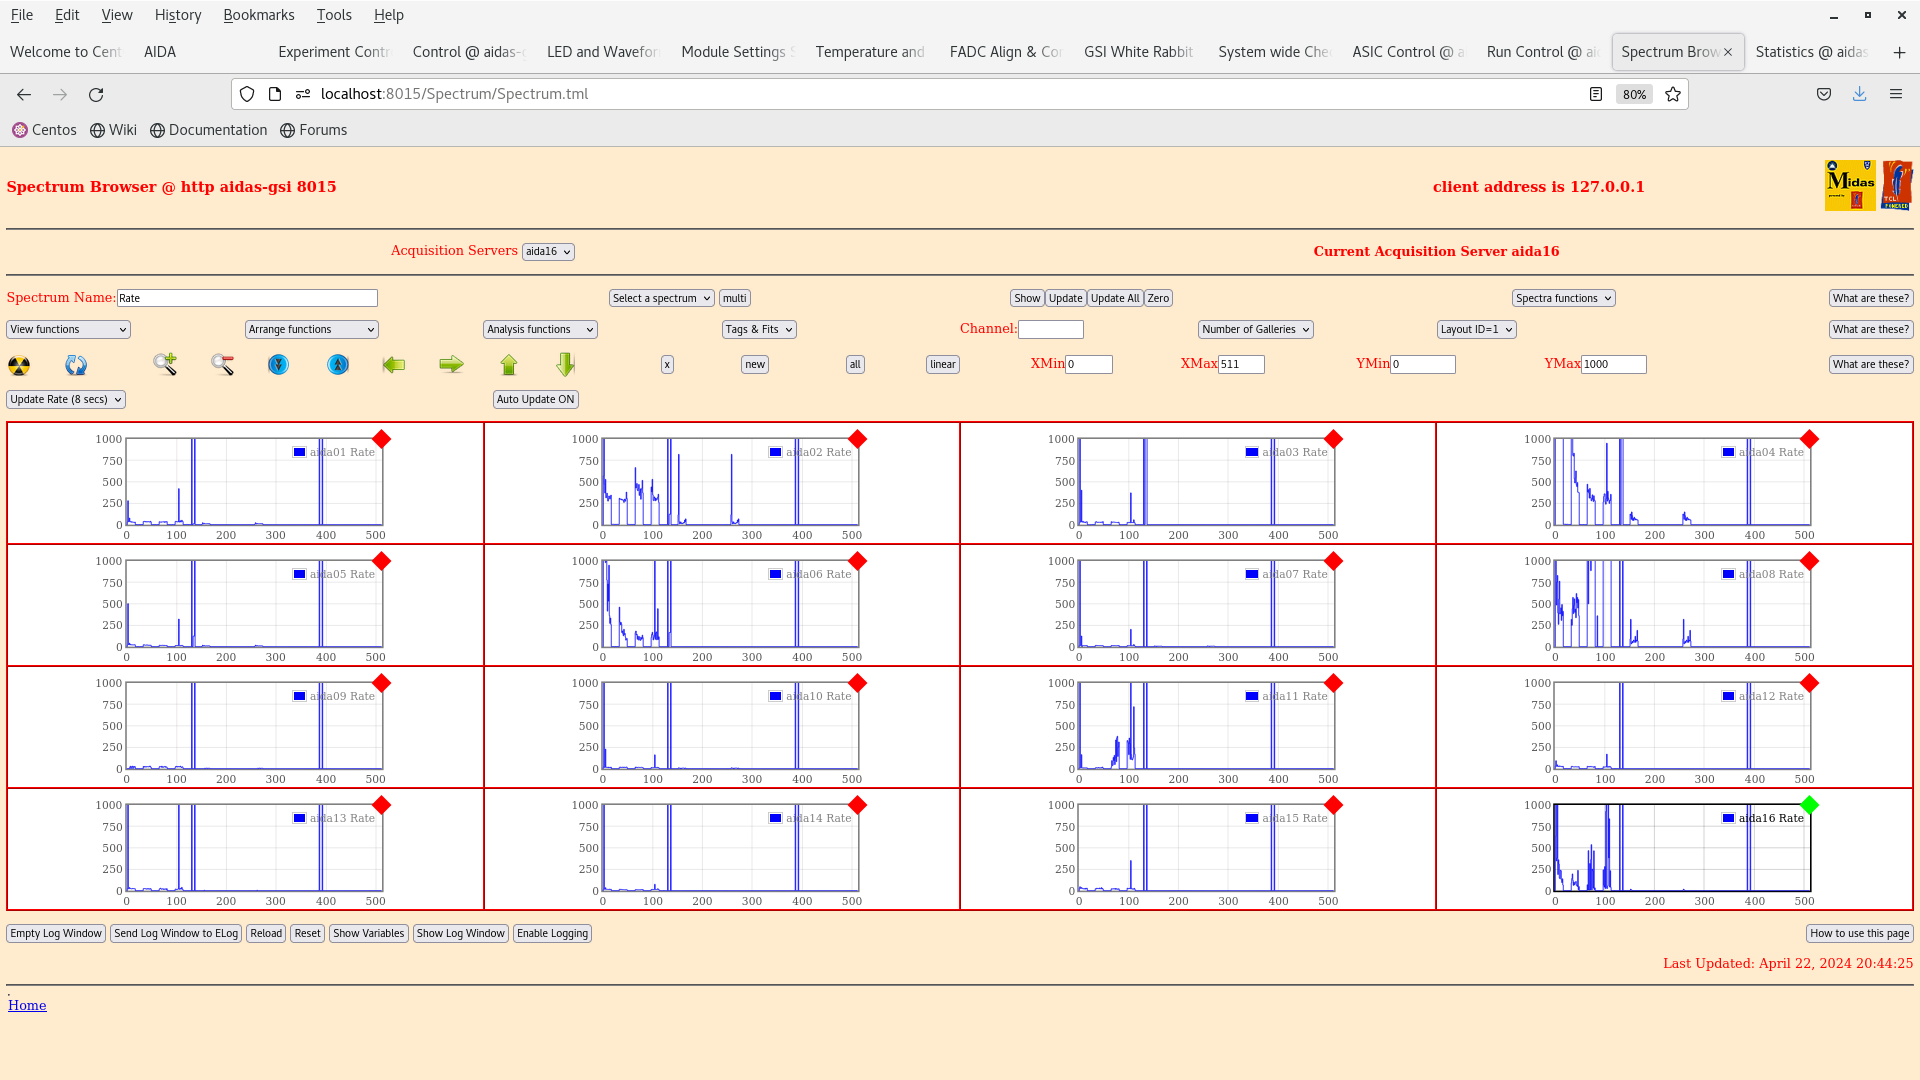
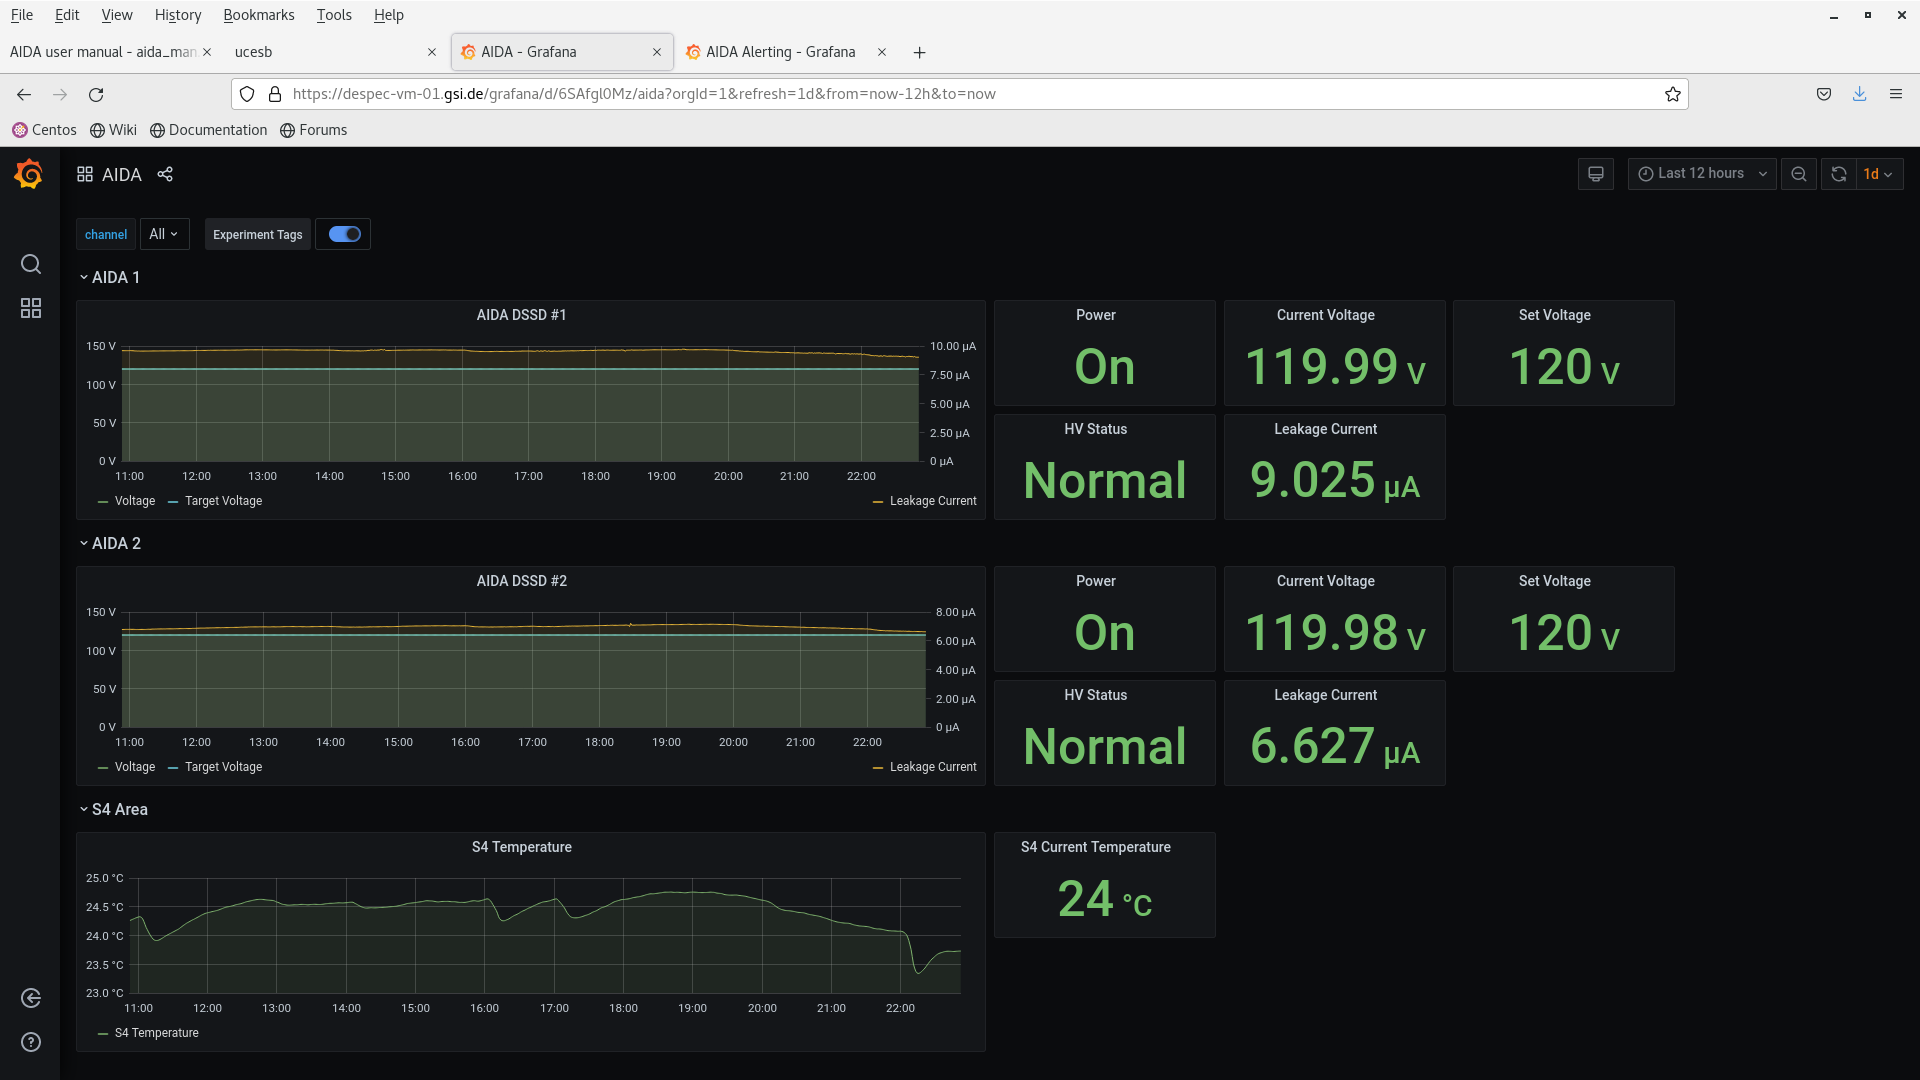
20.47, all looks ok - see attachment 17-20. Rates are higher in attachment 20 than in attachment 2 from start of shift
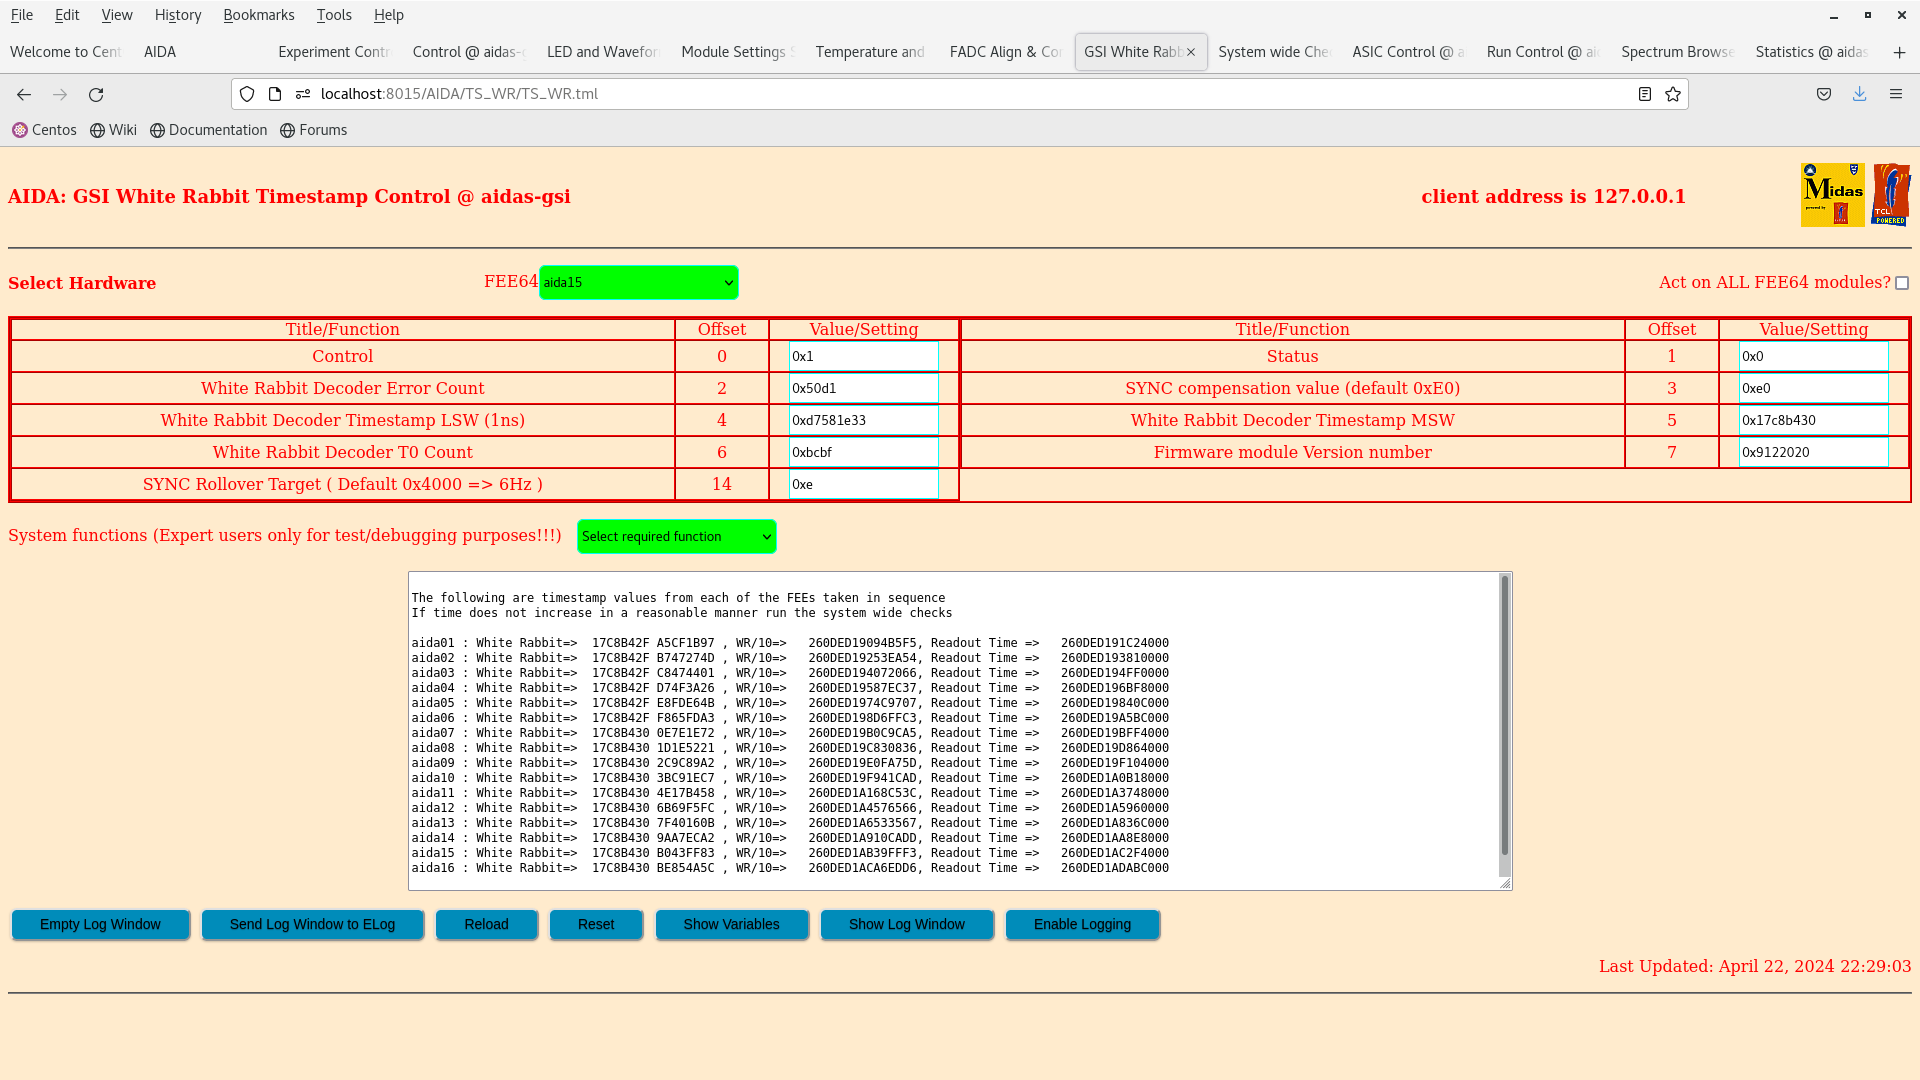
21.59 aida02 (link aida1) stopped taking data and dropped out of the merger (see attachment 21). Came back to life after about 15 miutes. Tom logged in remotely to investigate. Seems to be ok. see attachment 22 for timestamps
22.48 - things apear ok. (Attachments 23-26) |
| Attachment 1: Screenshot_from_2024-04-22_16-16-30.png
|

|
| Attachment 2: Screenshot_from_2024-04-22_16-14-31.png
|

|
| Attachment 3: Screenshot_from_2024-04-22_16-09-16.png
|

|
| Attachment 4: Screenshot_from_2024-04-22_16-05-22.png
|

|
| Attachment 5: Screenshot_from_2024-04-22_16-33-34.png
|

|
| Attachment 6: Screenshot_from_2024-04-22_16-32-54.png
|
|
| Attachment 7: Screenshot_from_2024-04-22_16-32-04.png
|
|
| Attachment 8: Screenshot_from_2024-04-22_16-31-03.png
|

|
| Attachment 9: Screenshot_from_2024-04-22_16-30-00.png
|

|
| Attachment 10: Screenshot_from_2024-04-22_16-29-03.png
|

|
| Attachment 11: Screenshot_from_2024-04-22_16-27-01.png
|

|
| Attachment 12: Screenshot_from_2024-04-22_16-25-30.png
|

|
| Attachment 13: Screenshot_from_2024-04-22_19-00-04.png
|
|
| Attachment 14: Screenshot_from_2024-04-22_18-59-25.png
|

|
| Attachment 15: Screenshot_from_2024-04-22_18-58-21.png
|

|
| Attachment 16: Screenshot_from_2024-04-22_18-56-34.png
|

|
| Attachment 17: Screenshot_from_2024-04-22_20-46-50.png
|
|
| Attachment 18: Screenshot_from_2024-04-22_20-45-57.png
|

|
| Attachment 19: Screenshot_from_2024-04-22_20-45-10.png
|

|
| Attachment 20: Screenshot_from_2024-04-22_20-44-41.png
|
|
| Attachment 21: Screenshot_from_2024-04-22_22-00-30.png
|

|
| Attachment 22: Screenshot_from_2024-04-22_22-53-11.png
|
|
| Attachment 23: Screenshot_from_2024-04-22_22-52-19.png
|
|
| Attachment 24: Screenshot_from_2024-04-22_22-50-52.png
|

|
| Attachment 25: Screenshot_from_2024-04-22_22-49-07.png
|

|
| Attachment 26: Screenshot_from_2024-04-22_22-48-31.png
|

|
|
151
|
Sat Mar 14 07:13:59 2020 |
DK, TD, LS, CG | Saturday 14th March 08:00 - 24:00 |
8:15
    All system wide checks passed
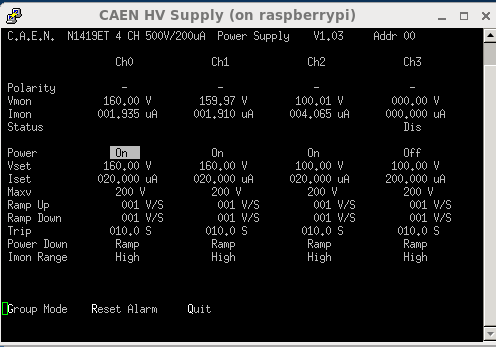
    Leak currents are continuing to creep up - attachment #1
    FEE temperatures fine - attachment #2
    Stats about where they have been - attachment #3
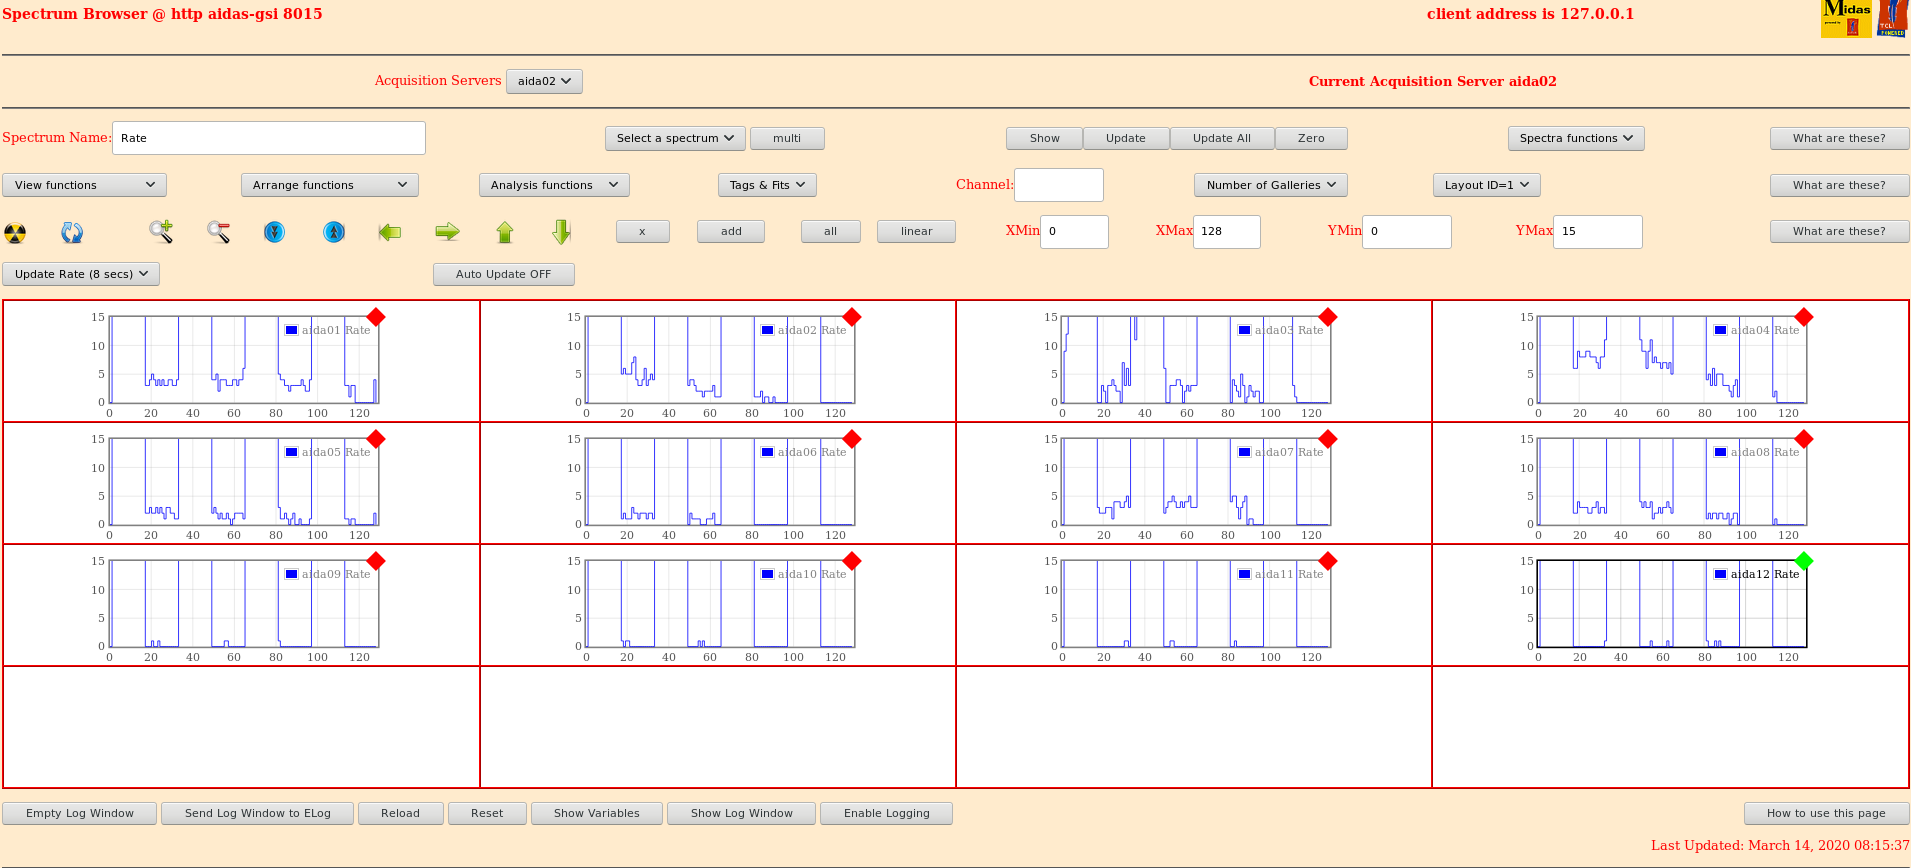
    Implants look as previously (5ish counts per channel in SSD1 and SSD2) - attachment #4
    Merger fine, 3 Mega items / sec
    TapeServer still writing about 25 MB/s

09.37 analysis of data file S480/R12_443
      deadtime aida09 c. 5%, all other FEE64s <<1%
      See attachment #5

09.54.51
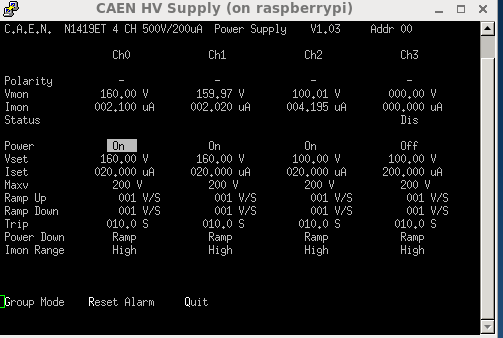
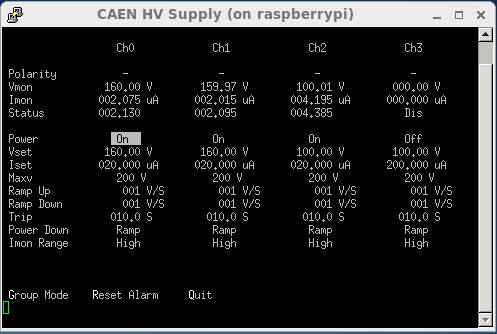
      biases, SSD1 and 2 over 2 uA each now -  attachment #6

11:20
    All  system-wide checks okay
    Merger okay, 3 Mega items / sec
    TapeServer normal, 27 MB/sec
    Biases as attachment #7
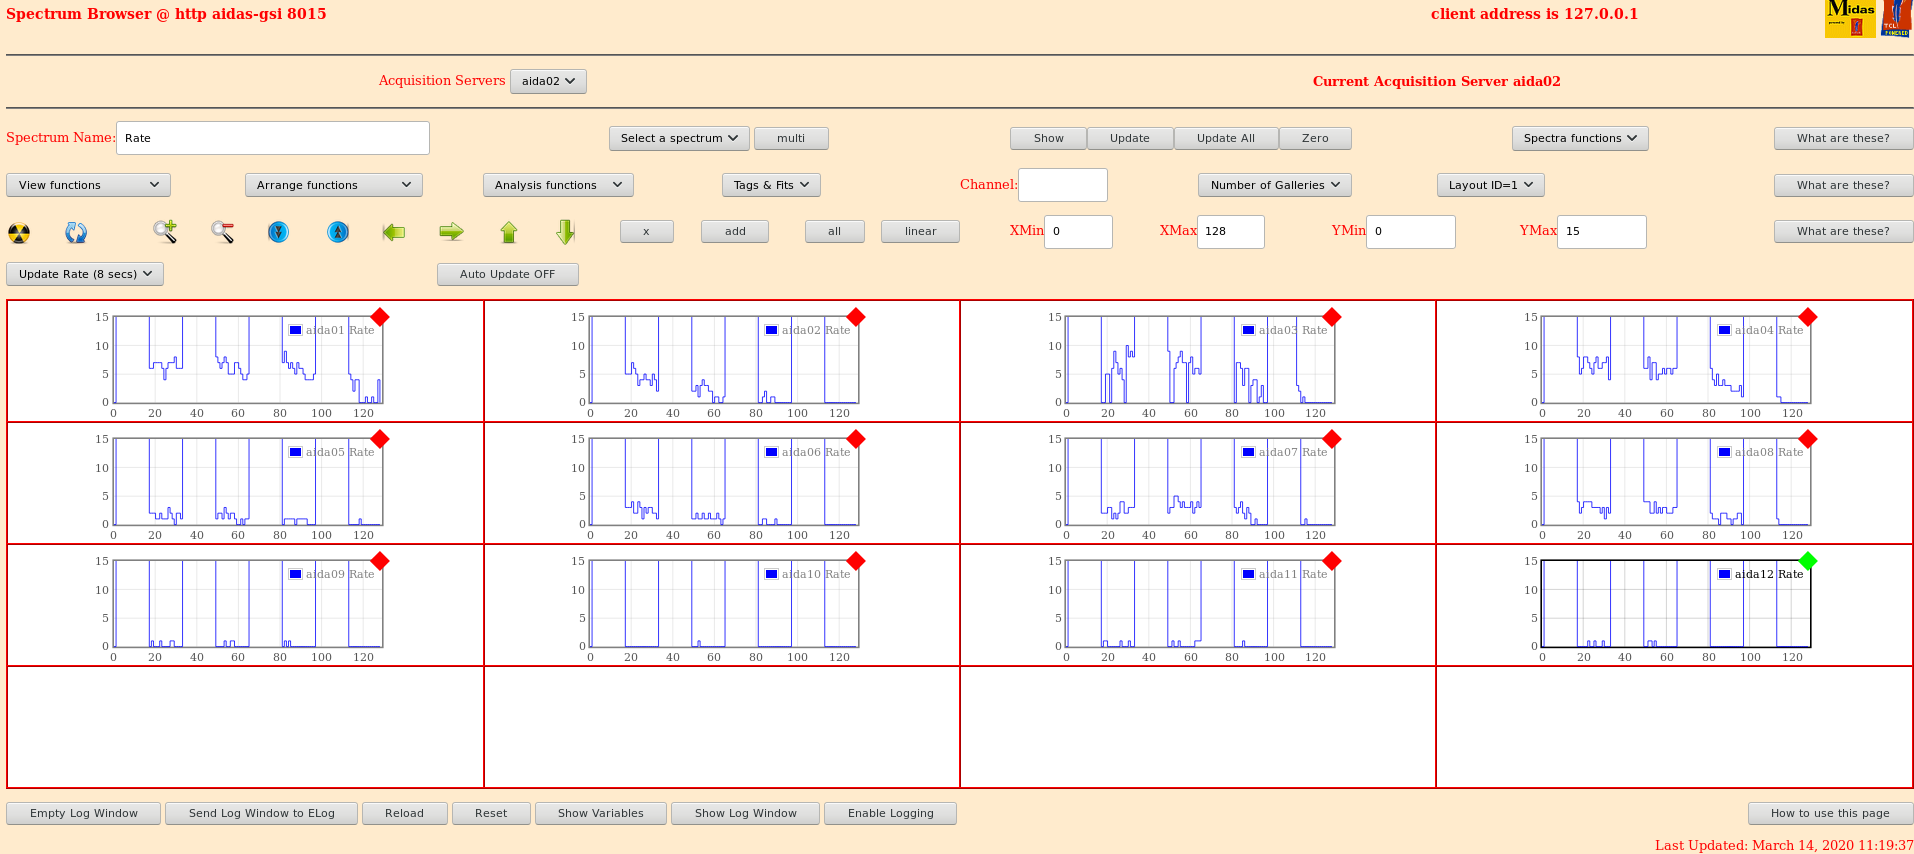
    Stats as #8
    Temps as #9
    Histos as #10

14:10
    All system wide checks okay
    Stats #11
    Temps #12
    Implants #13
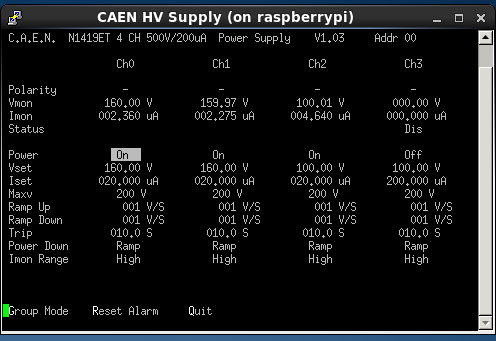
    Leak currents are getting a bit higher #14

15:30
    All system wide checks passed
    Stats attachment  #15
    Temps attachment  #16
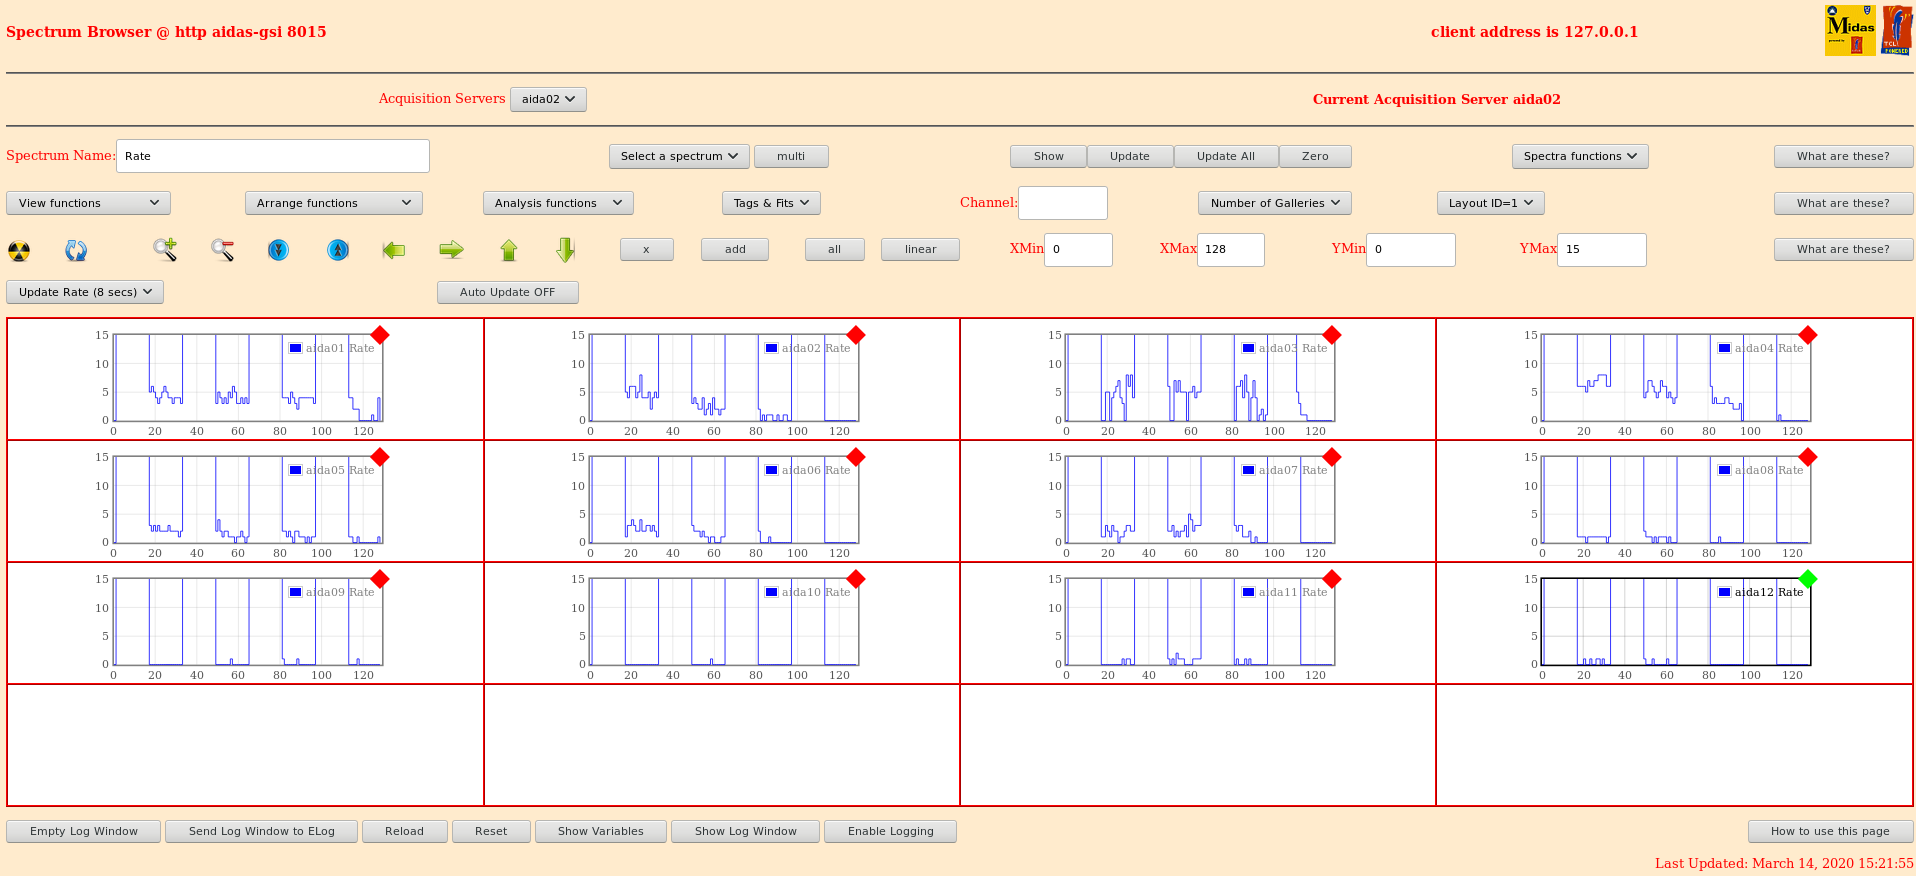
    Implants  attachment #17
    Biases / leak currents attachment  #18
    Merger okay, 3 Mega items / sec
    TapeServer okay, writing 27 MB/s

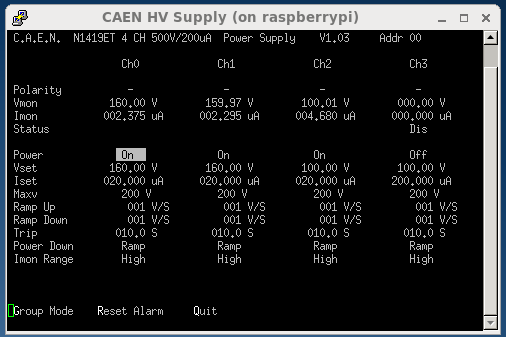
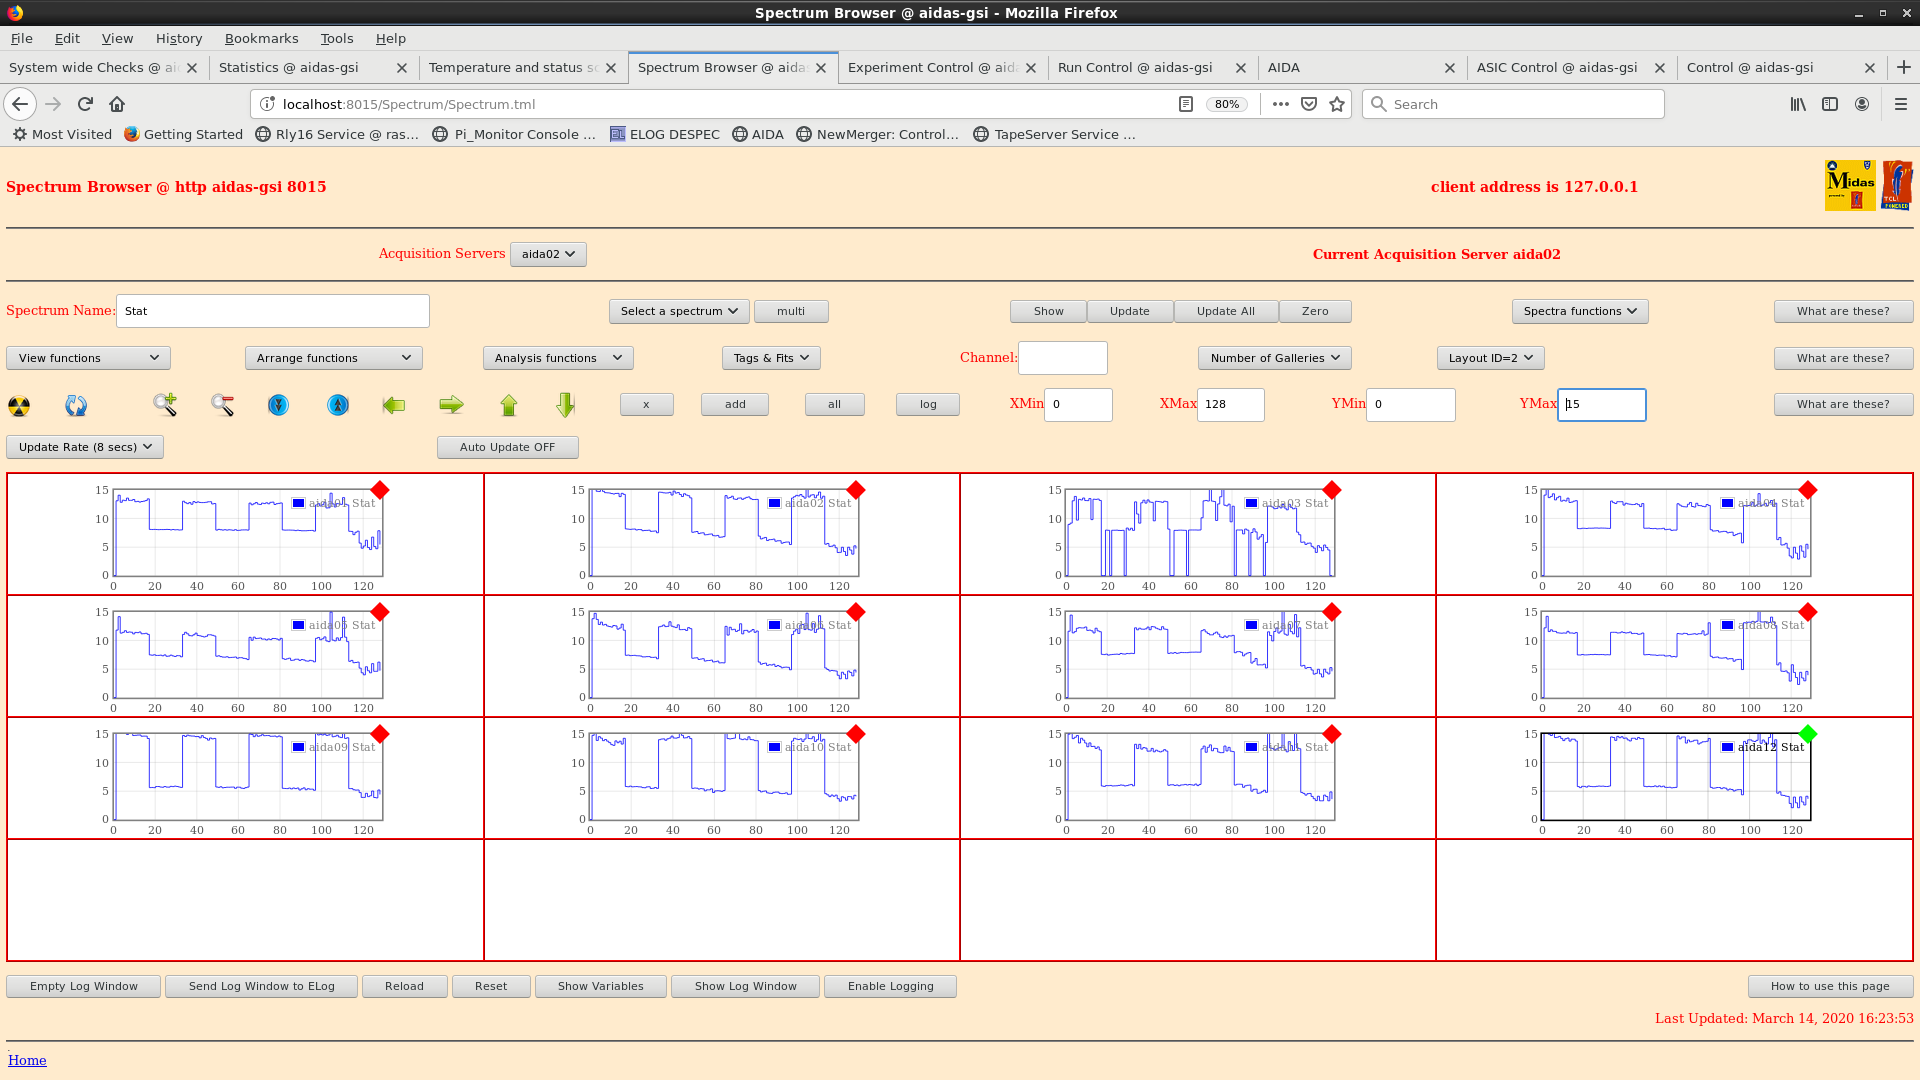
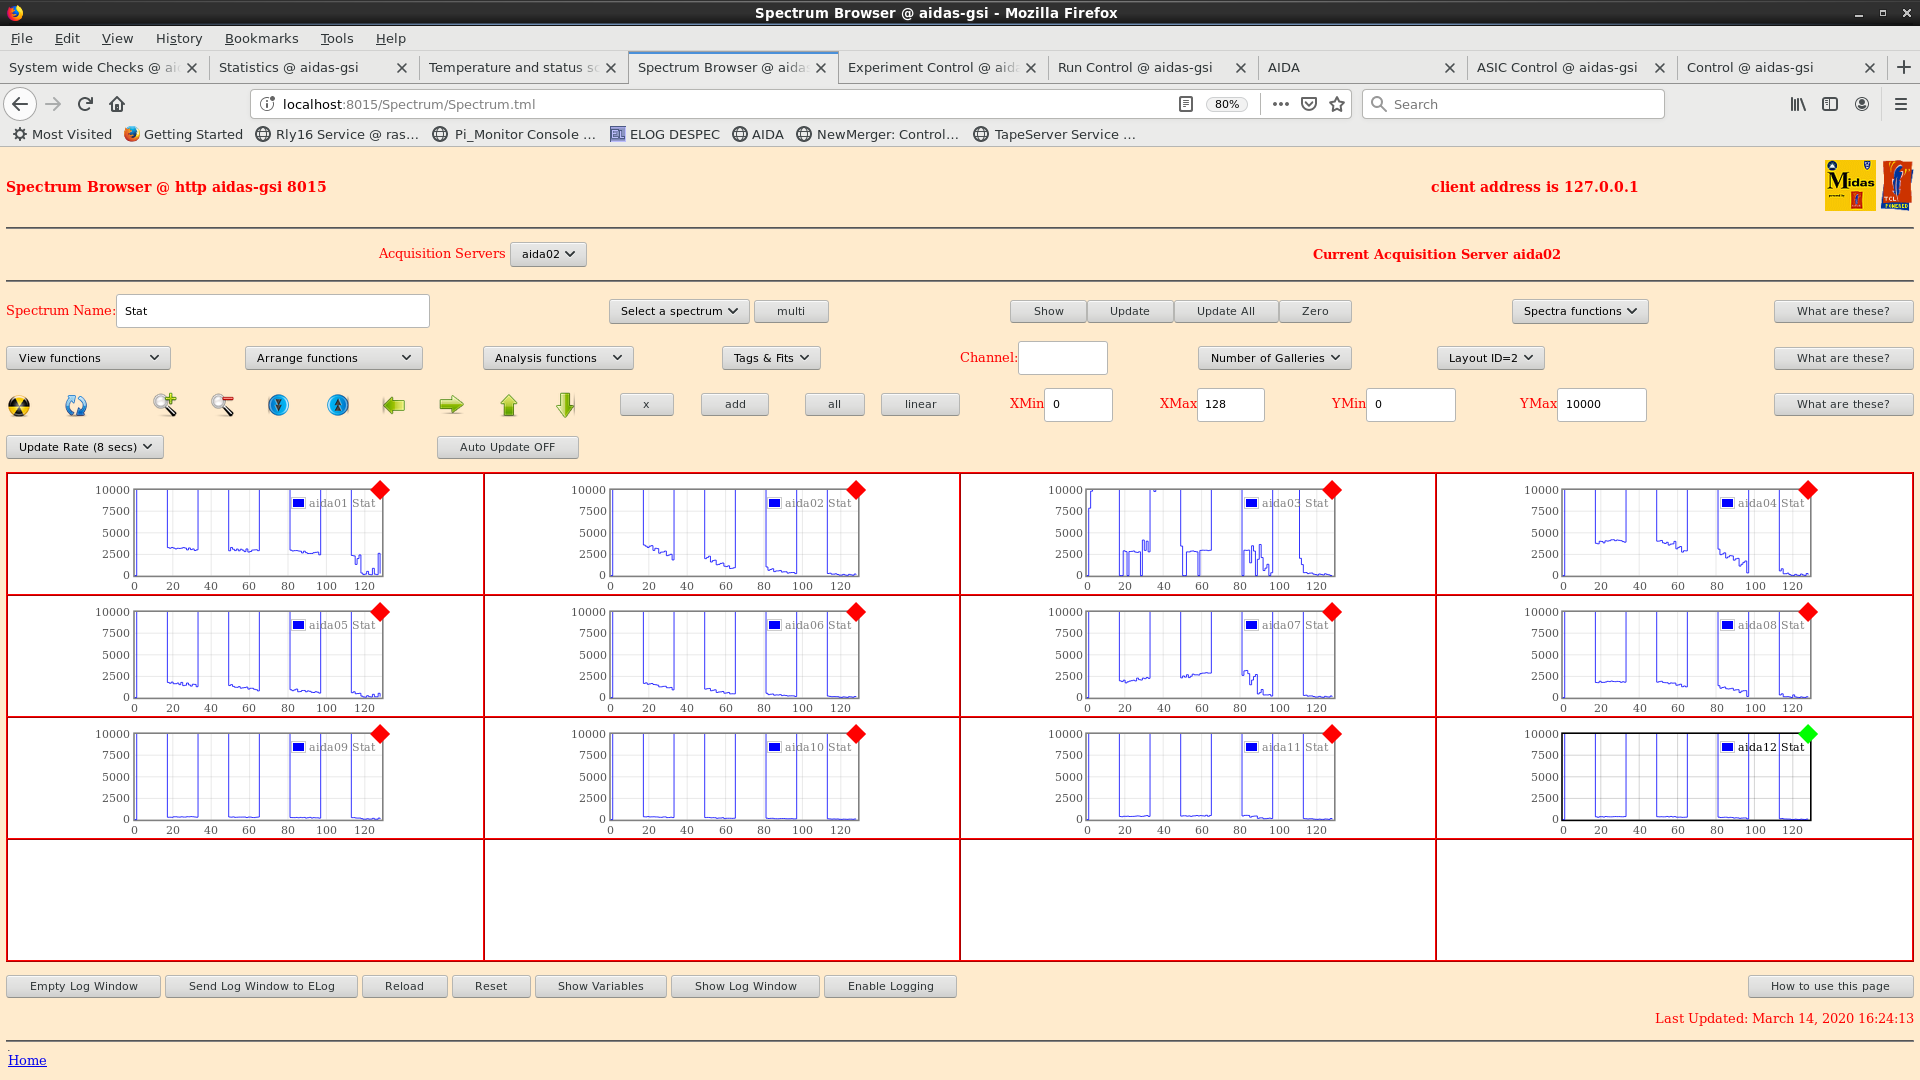
16.12 all online spectra zero'd

16.31 stat & rate spectra - attachments 19-22
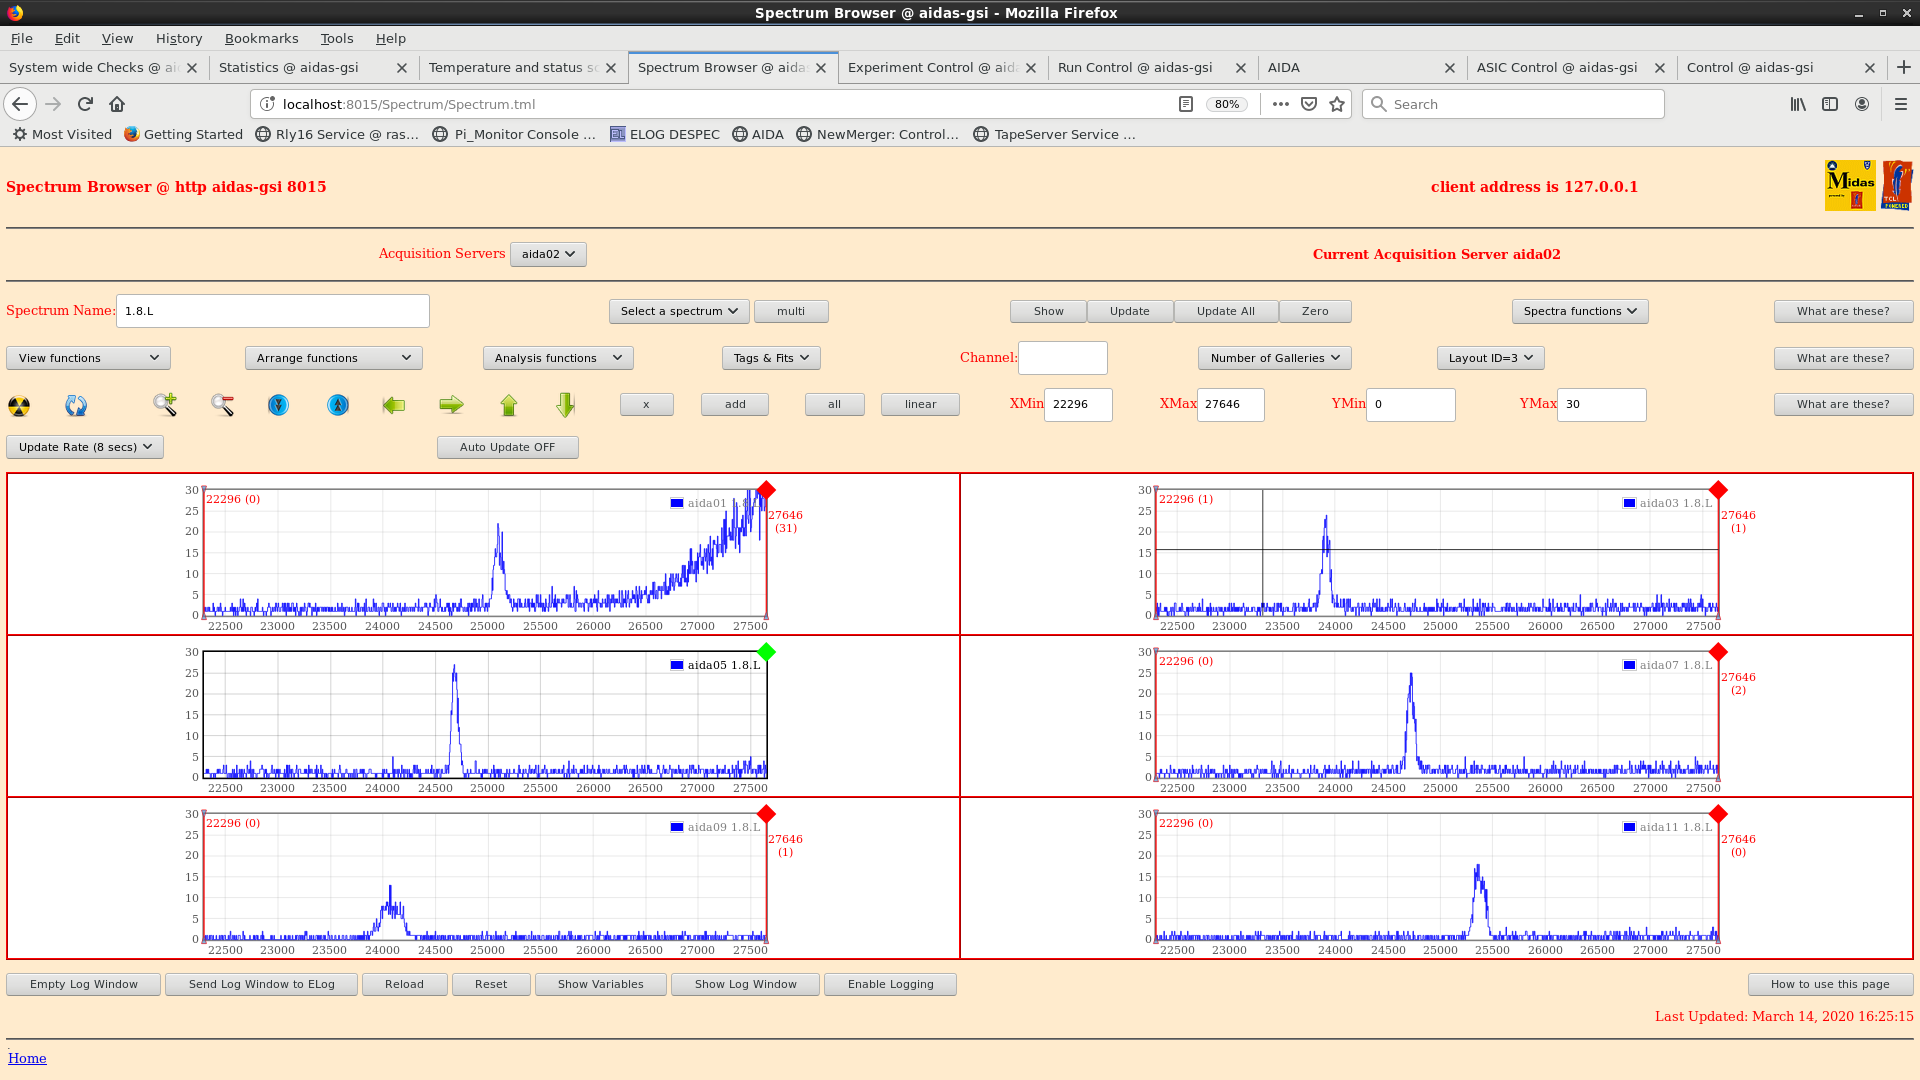
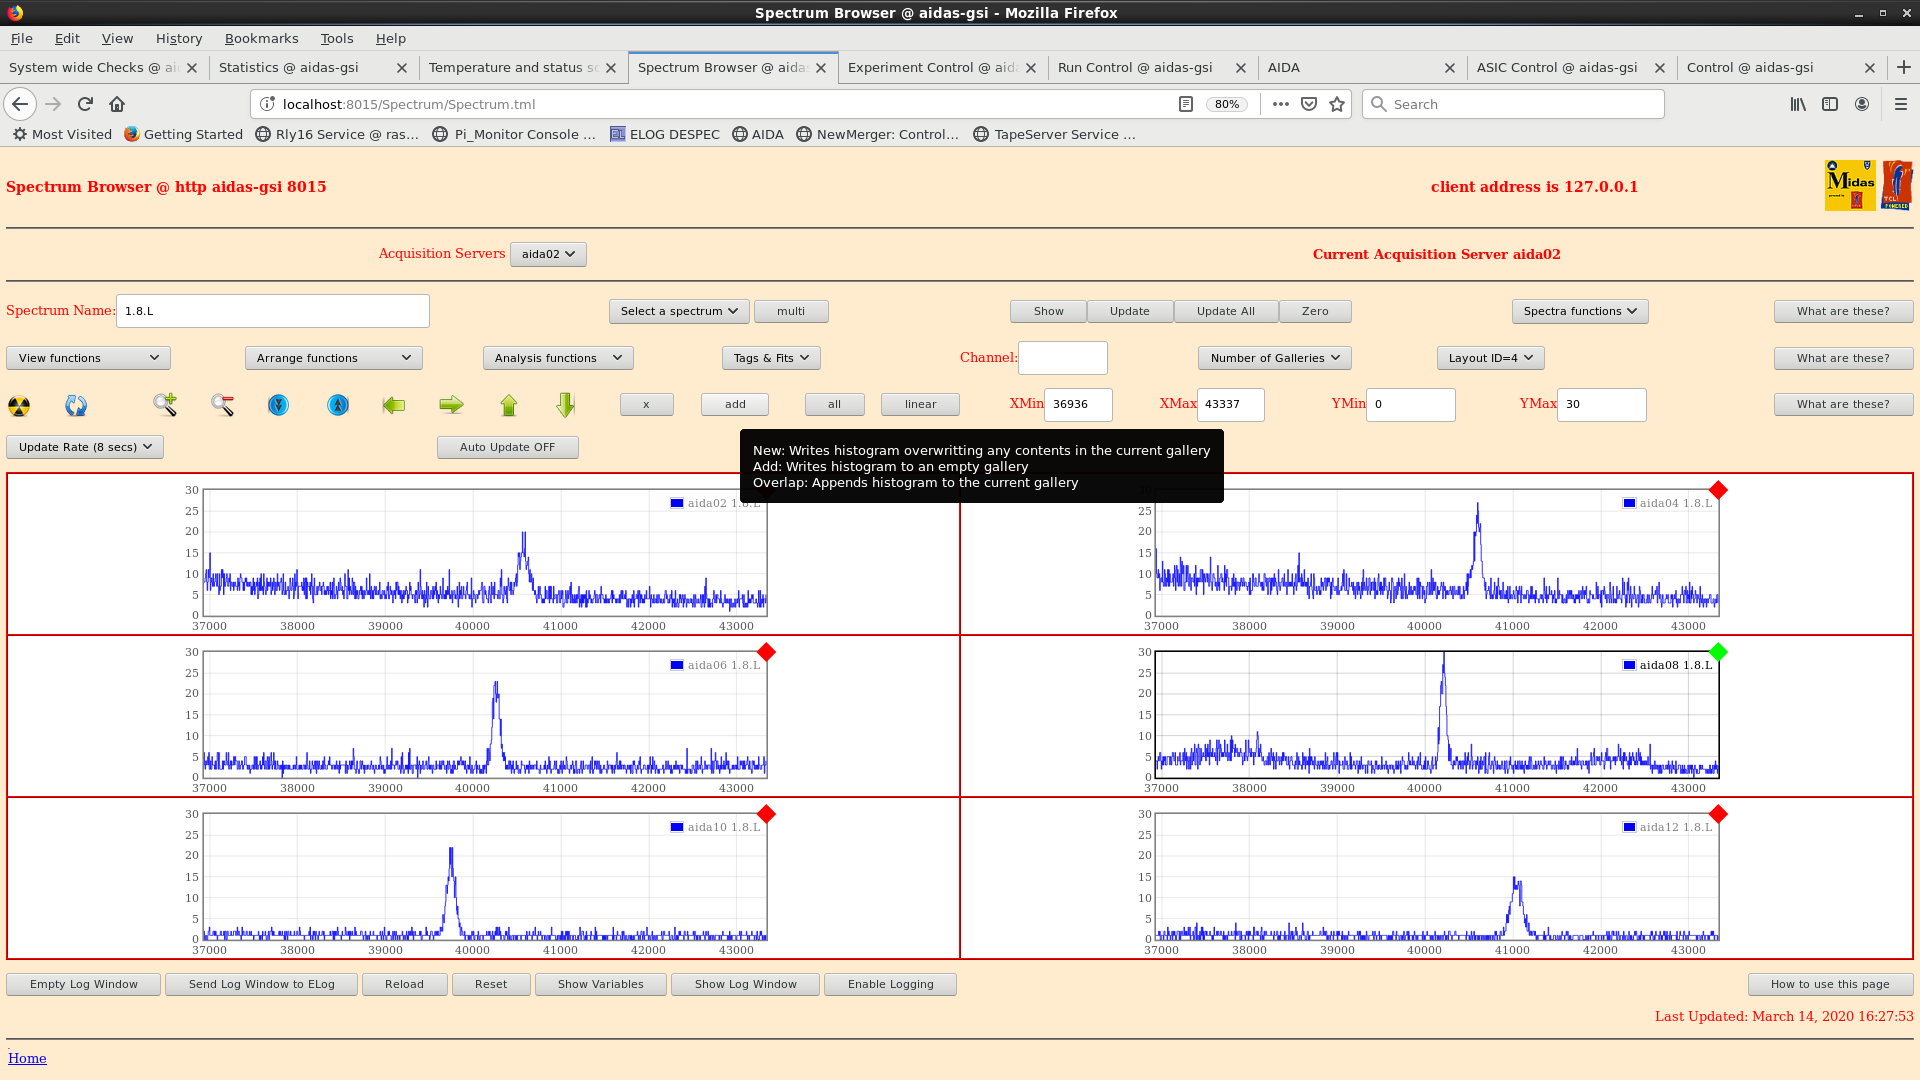
      1.8.L spectra - attachments 23 & 24
      aida03 pulser peak 57 ch FWHM
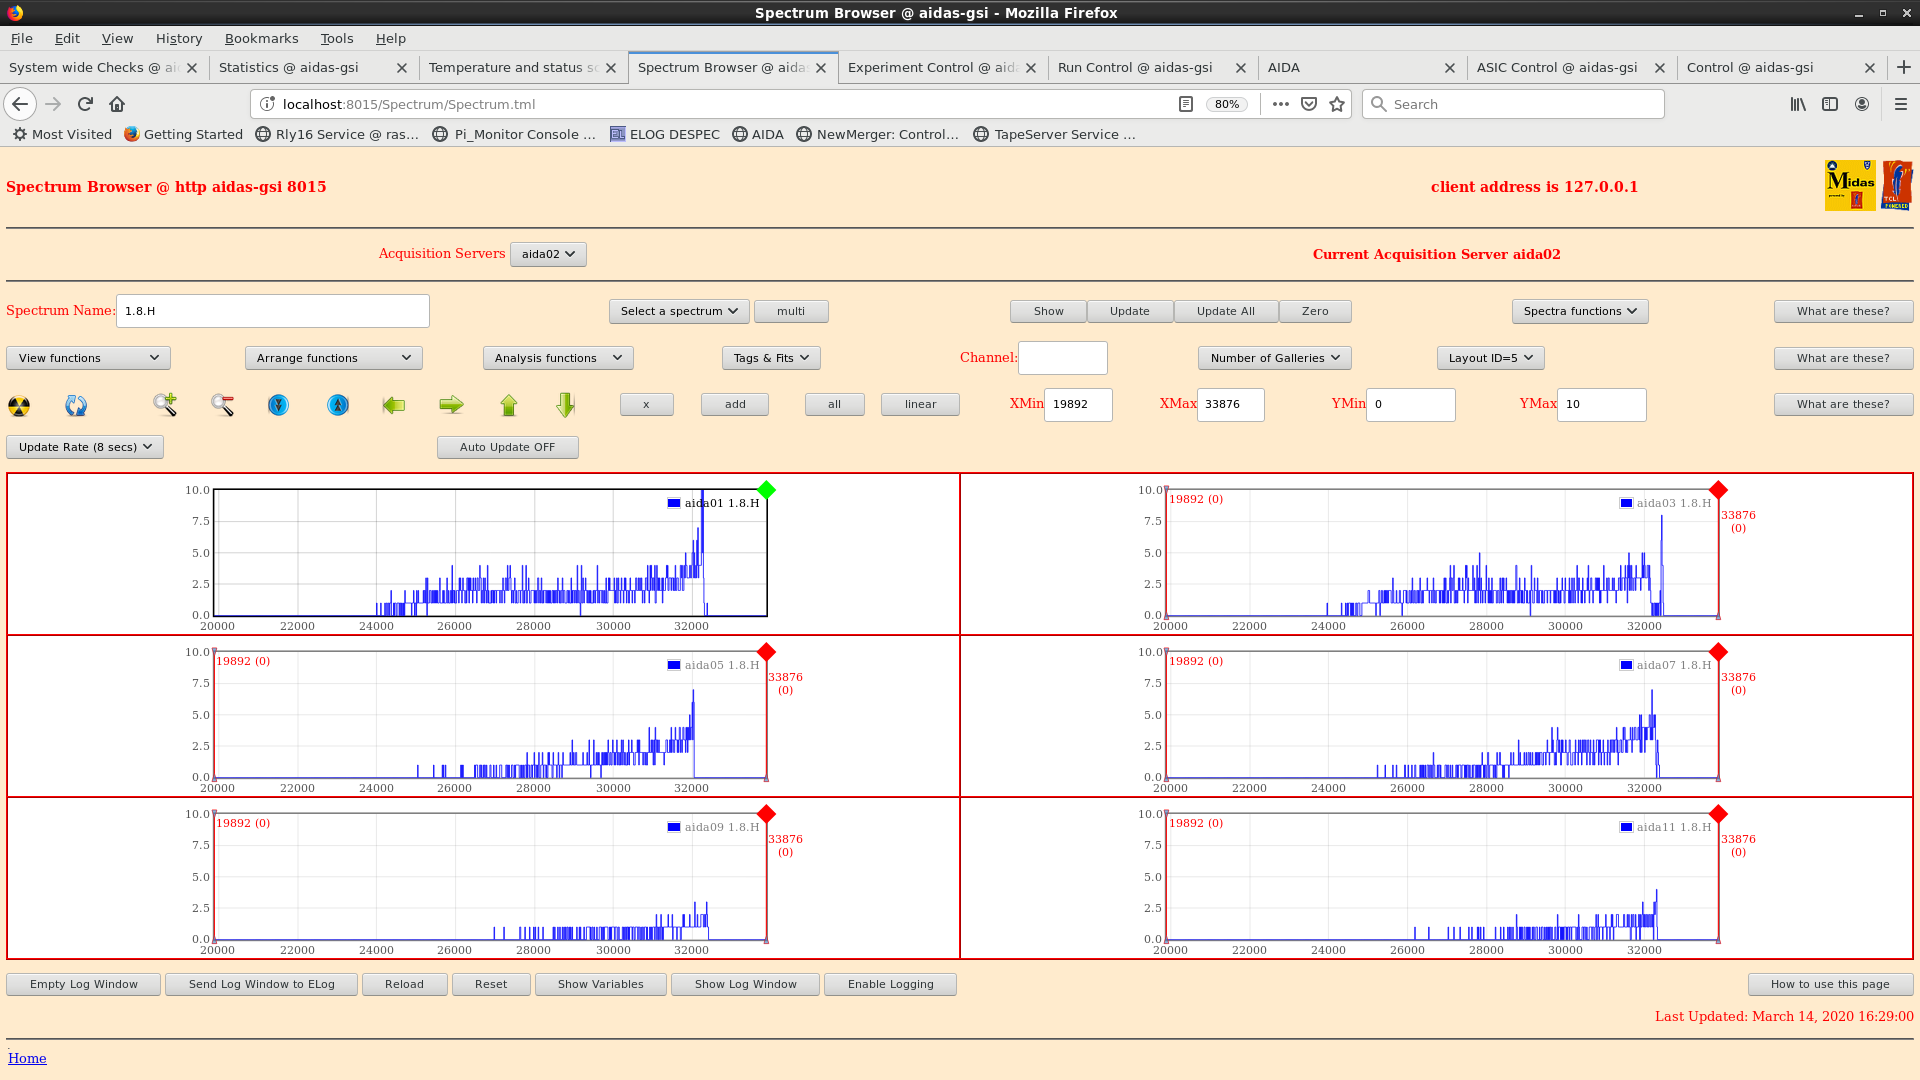
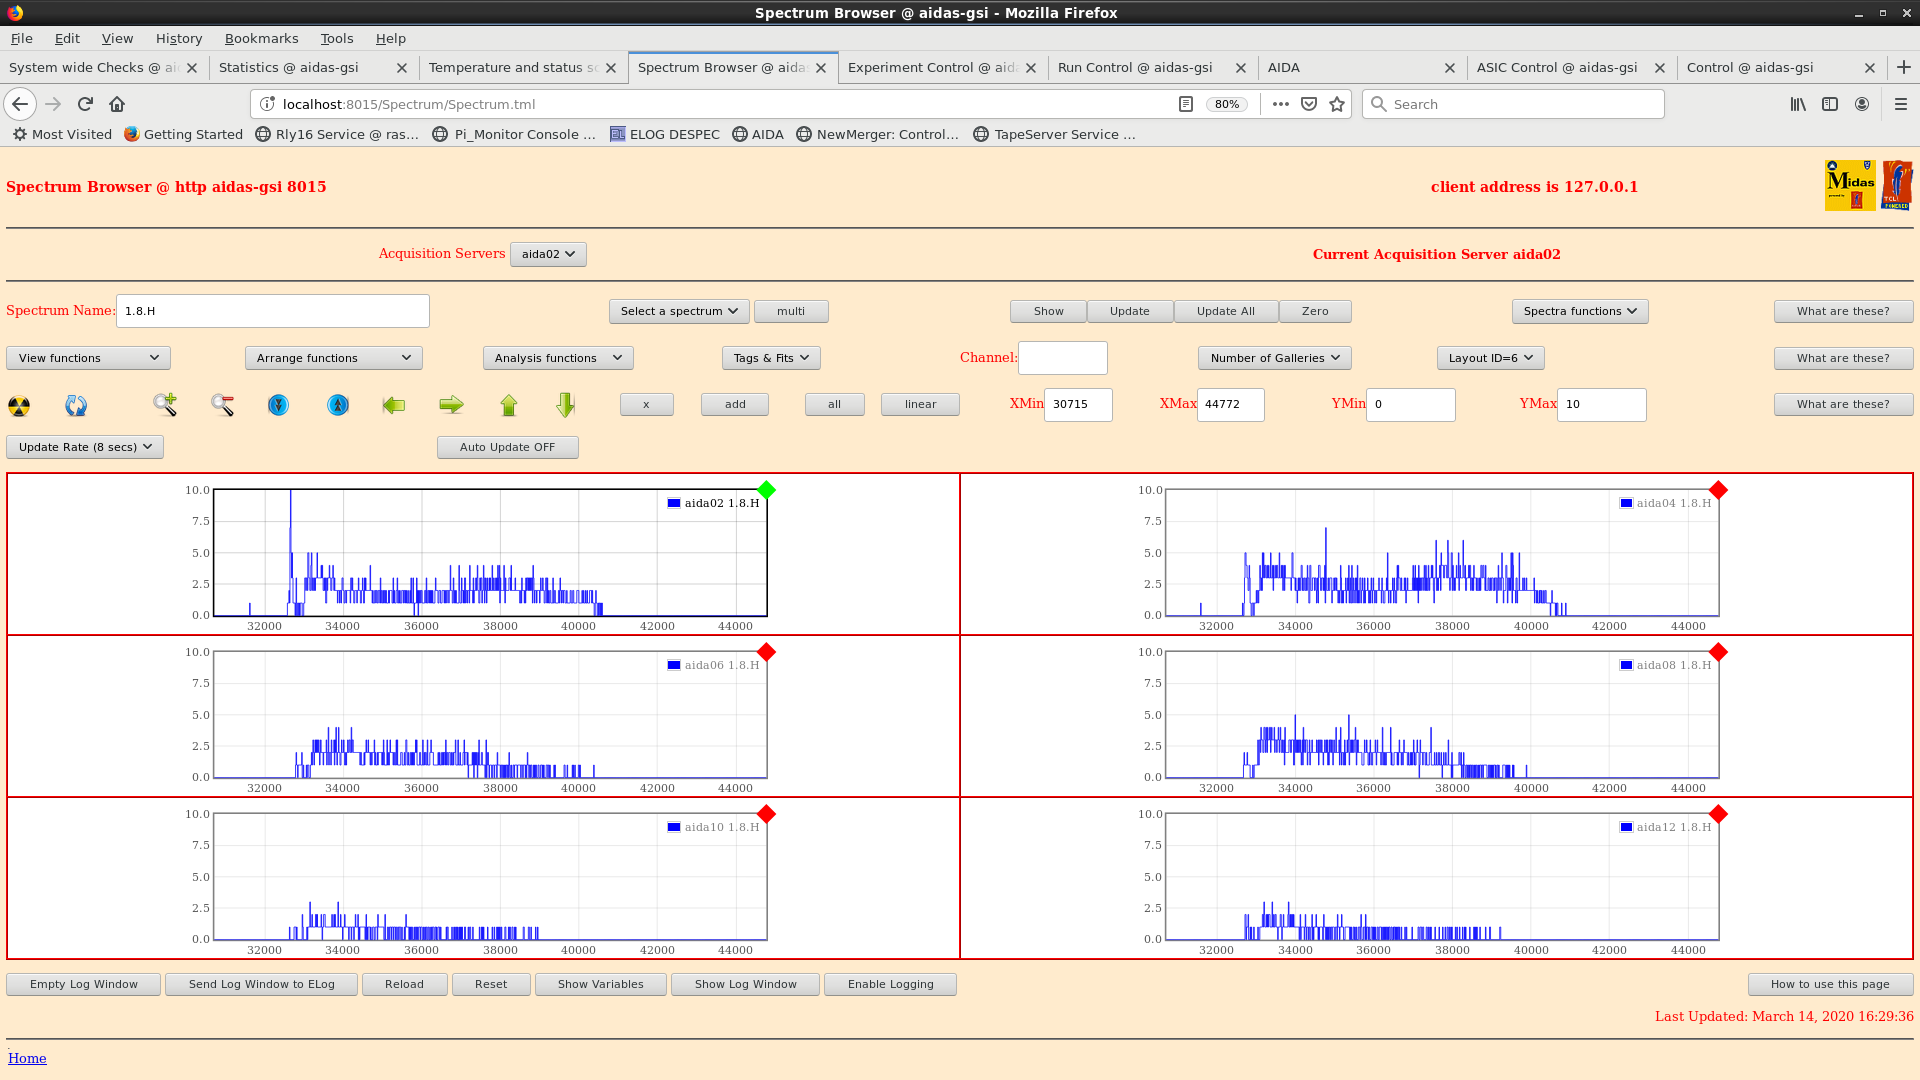
      1.8.H spectra - attachments 25 & 26
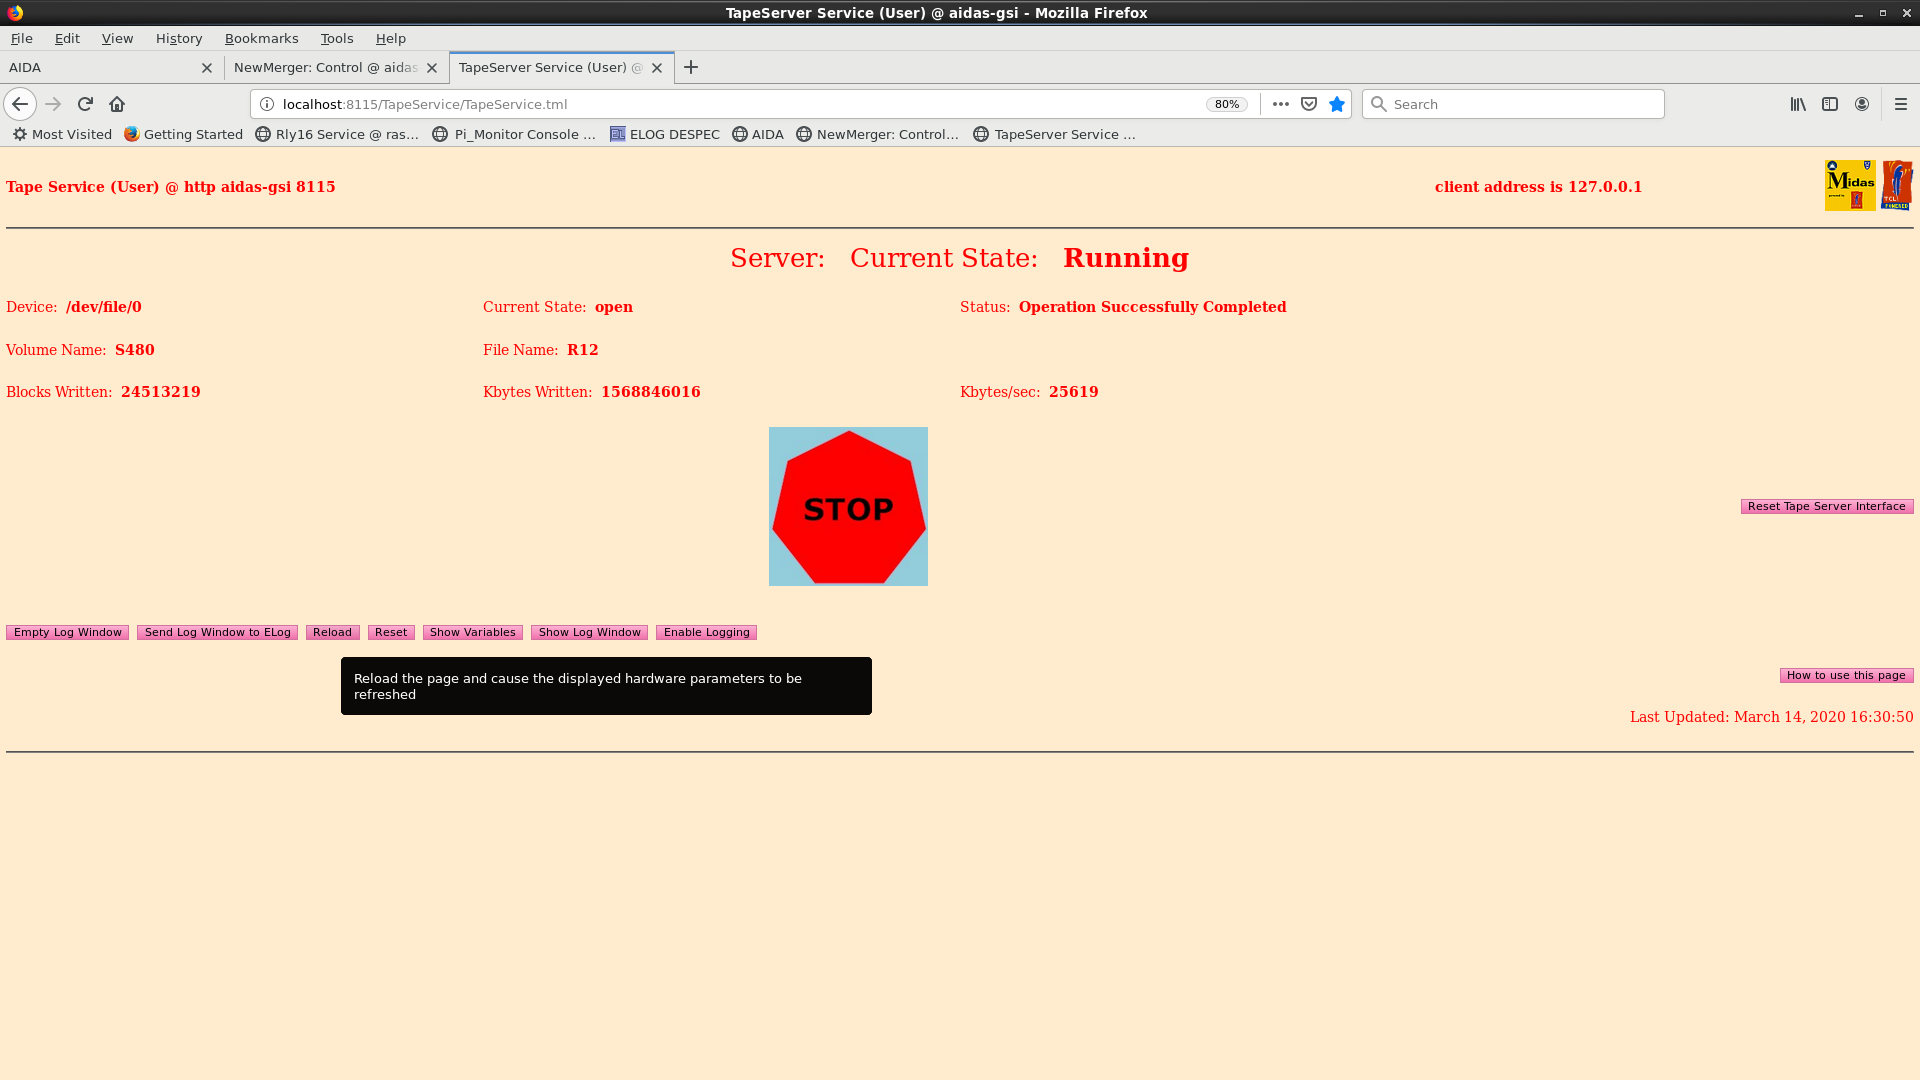
      NewMerger & TapeServer - attachments 27 & 28

18.29

     system wide checks all okay
     FEE temperatures normal (attachment 29)
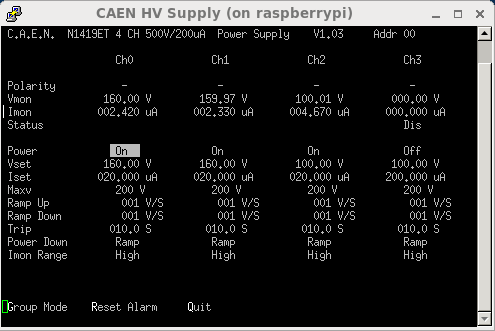
     Leakage currents okay and recorded to spreadsheet (attachment 30)
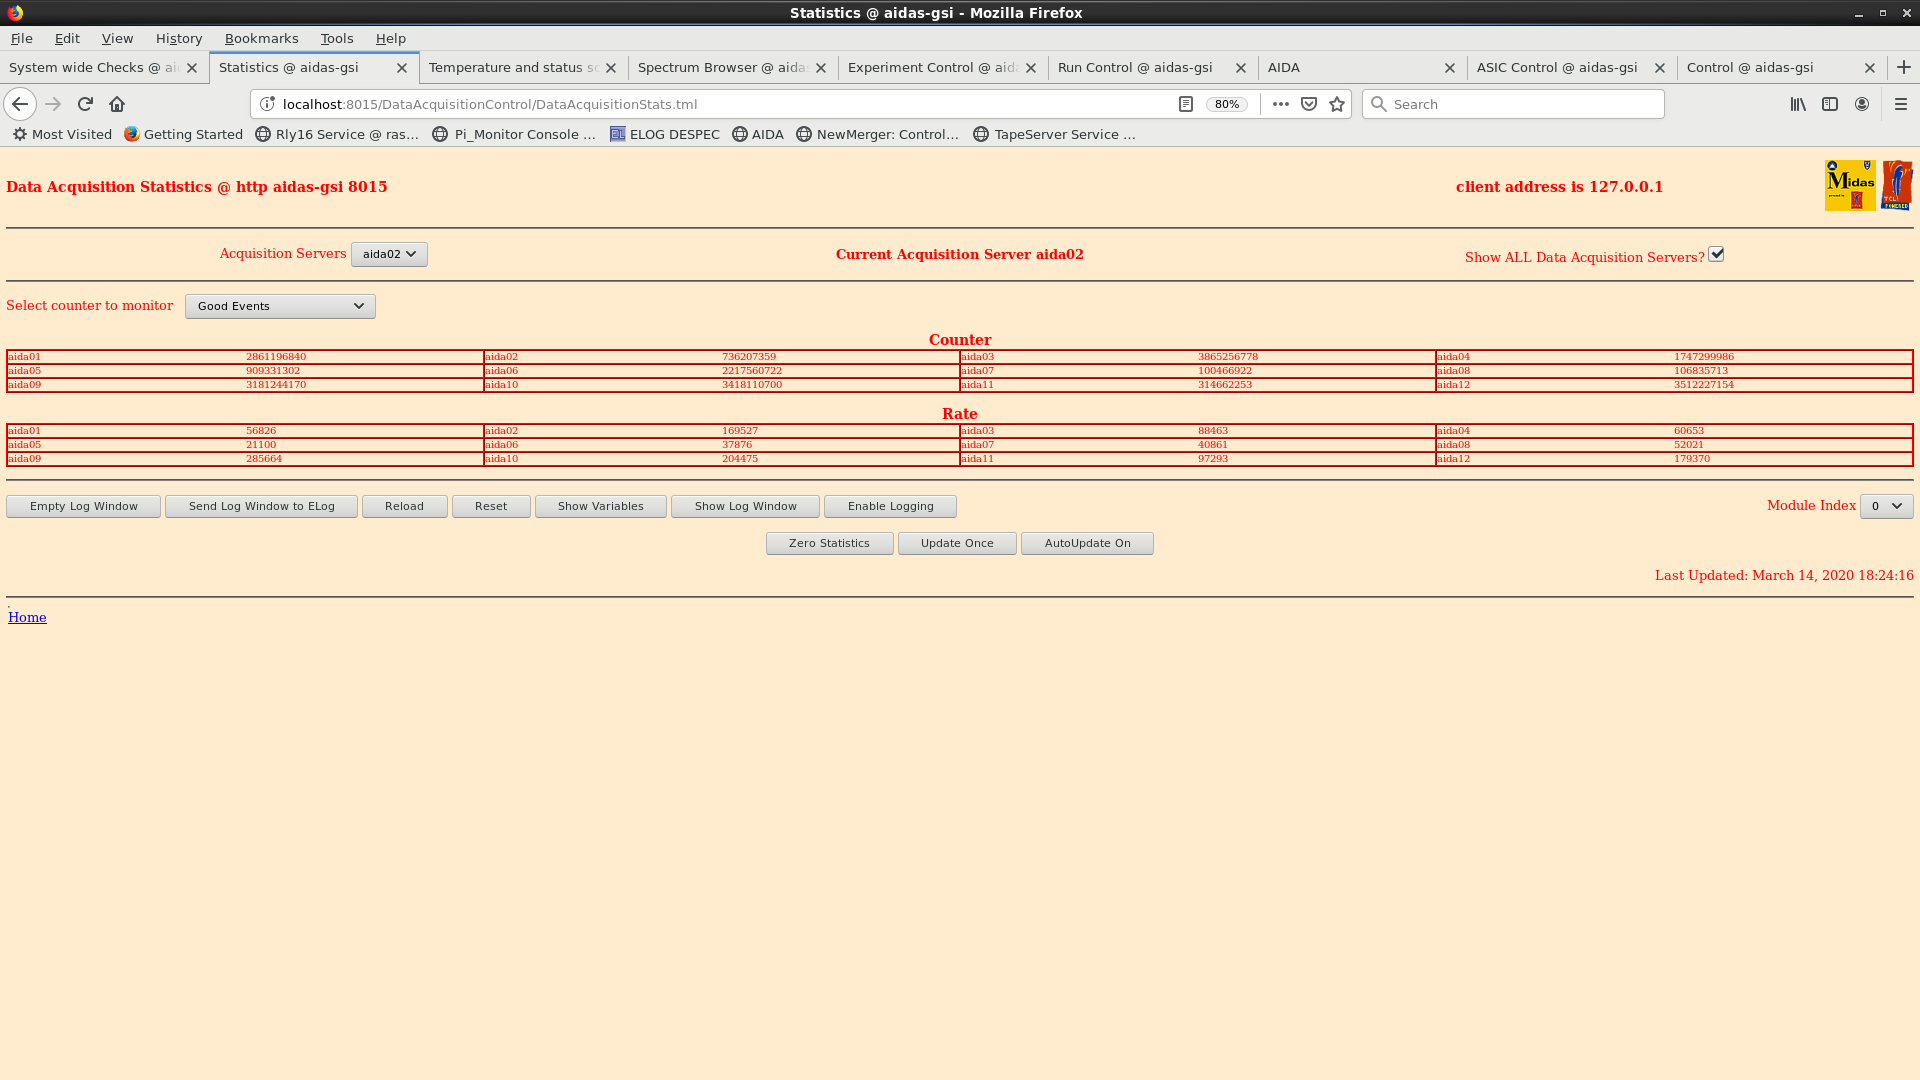
     Good event statistics okay (attachment 31)
     Merger running at 3M items/sec
     Tape server running at 25MB/sec

20.25
     system wide checks all okay
     FEE temperatures normal (attachment 32)
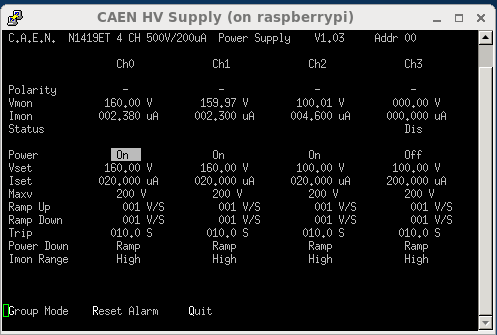
     Leakage currents okay and recorded to spreadsheet (attachment 33)
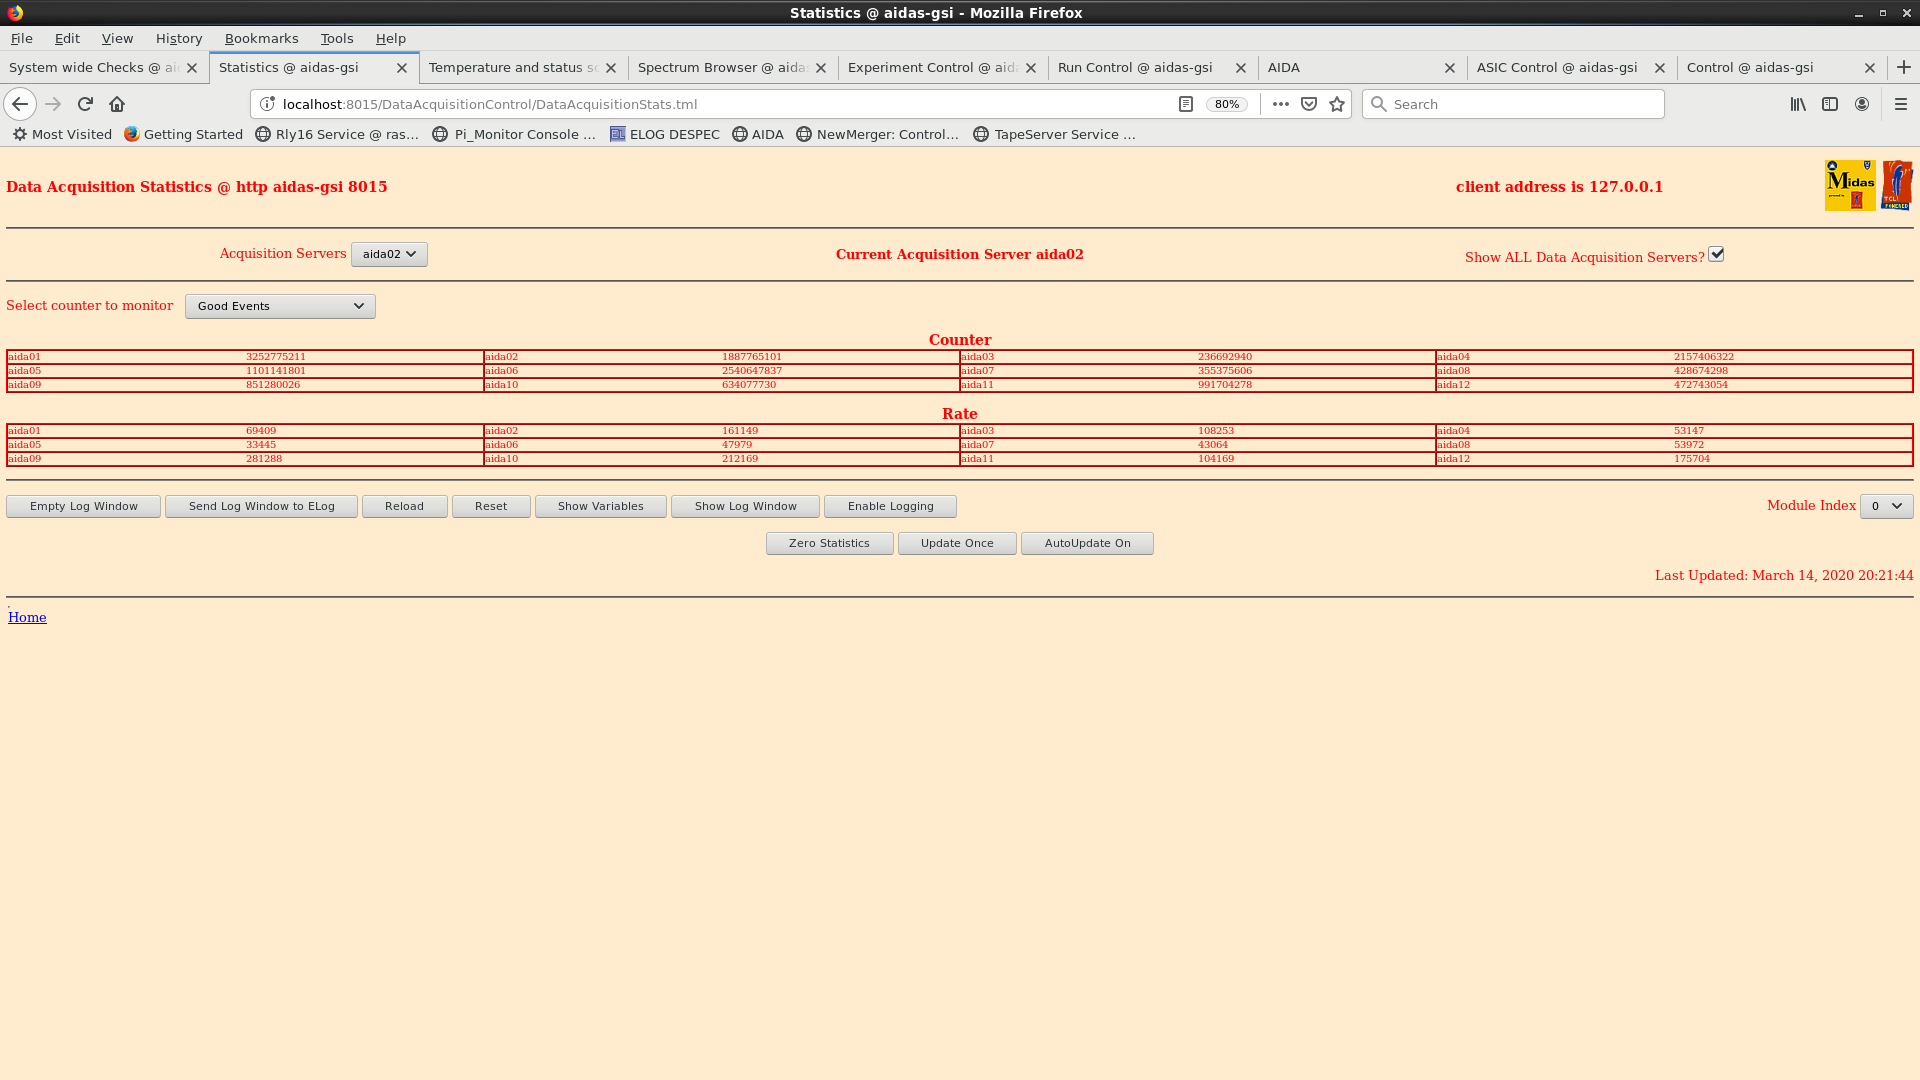
     Good event statistics okay (attachment 34)
     Merger running at 3M items/sec
     Tape server running at 26MB/sec

as of 20.39 just finished R12_961

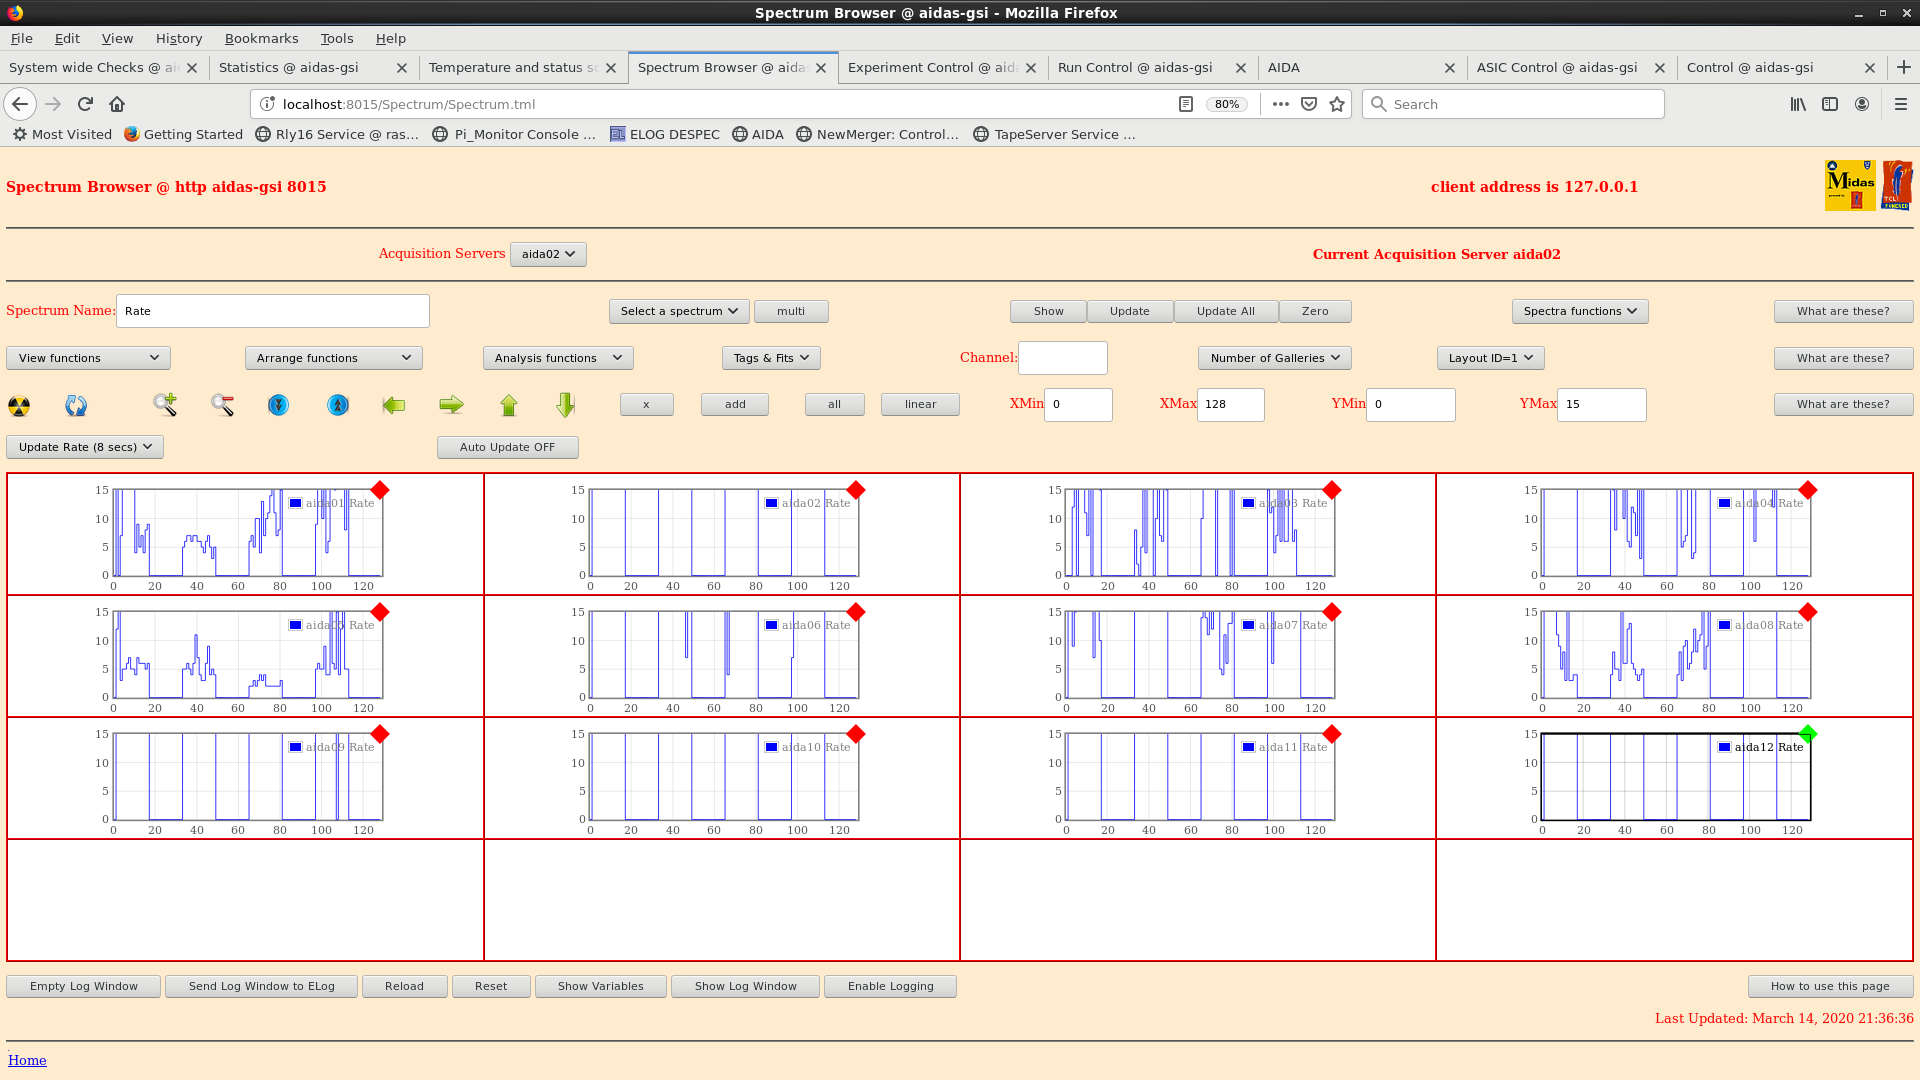
21.36 beam is down confirmed by rates histogram (attachment 35), informed others on shift
      was down for maybe 5 minutes is back on at 21.40 (attachment 36)
      think between R12_1004 to R12_1008

22.10
     system wide checks all okay
     FEE temperatures normal (attachment 37)
     Leakage currents okay and recorded to spreadsheet (attachment 38)
     Good event statistics okay (attachment 39)
     Merger running at 3M items/sec
     Tape server running at 26MB/sec

23.03 someone comes to ask if we see an increase in implantation rate as they do their side
      I checked the rates histogram and good events and see nothing that would indicate an increase (attachment 40 and 41)
      FEE temperatures and leakage currents do not seem any different either
      believe they are calling someone about the issue

23.30 leaving now to catch bus but people on night shift have been told how to check on AIDA and know that CG is on call if needed |
| Attachment 1: daid-14-biasA.png
|
|
| Attachment 2: daid-14-tempA.png
|

|
| Attachment 3: daid-14-statsA.png
|

|
| Attachment 4: daid-14-histosA.png
|
|
| Attachment 5: R12_443
|
*** TDR format 3.3.0 analyser - TD - January 2019
*** ERROR: READ I/O error: 5002
blocks: 32000
ADC data format: 86997080 ( 1109430.4 Hz)
Other data format: 174986804 ( 2231519.6 Hz)
Sample trace data format: 0 ( 0.0 Hz)
Undefined format: 0 ( 0.0 Hz)
Other data format type: PAUSE: 29 ( 0.4 Hz)
RESUME: 29 ( 0.4 Hz)
SYNC100: 87327942 ( 1113649.7 Hz)
WR48-63: 87327942 ( 1113649.7 Hz)
FEE64 disc: 330862 ( 4219.3 Hz)
MBS info: 0 ( 0.0 Hz)
Other info: 0 ( 0.0 Hz)
ADC data range bit set: 102097 ( 1302.0 Hz)
Timewarps: ADC: 0 ( 0.0 Hz)
PAUSE: 0 ( 0.0 Hz)
RESUME: 0 ( 0.0 Hz)
SYNC100: 0 ( 0.0 Hz)
WR48-63: 0 ( 0.0 Hz)
FEE64 disc: 0 ( 0.0 Hz)
MBS info: 0 ( 0.0 Hz)
Undefined: 0 ( 0.0 Hz)
Sample trace: 0 ( 0.0 Hz)
*** Timestamp elapsed time: 78.416 s
FEE elapsed dead time(s) elapsed idle time(s)
1 0.000 0.000
2 0.116 0.000
3 0.000 0.000
4 0.000 0.000
5 0.066 0.000
6 0.000 0.000
7 0.000 0.000
8 4.659 3.647
9 0.000 0.000
10 0.112 0.000
11 0.000 0.000
12 0.000 0.000
13 0.000 0.000
14 0.000 0.000
15 0.000 0.000
16 0.000 0.000
17 0.000 0.000
18 0.000 0.000
19 0.000 0.000
20 0.000 0.000
21 0.000 0.000
22 0.000 0.000
23 0.000 0.000
24 0.000 0.000
25 0.000 0.000
26 0.000 0.000
27 0.000 0.000
28 0.000 0.000
29 0.000 0.000
30 0.000 0.000
31 0.000 0.000
32 0.000 0.000
*** Statistics
FEE ADC Data Other Data Sample Undefined Pause Resume SYNC100 WR48-63 Disc MBS Other HEC Data
0 3143962 6596287 0 0 1 1 3246749 3246749 102787 0 0 19287
1 11441532 22943556 0 0 0 0 11461696 11461696 20164 0 0 9627
2 6435721 13042134 0 0 2 2 6492617 6492617 56896 0 0 12957
3 3633801 7382655 0 0 0 0 3672152 3672152 38351 0 0 19271
4 1100939 2276428 0 0 0 0 1125789 1125789 24850 0 0 7339
5 2632637 5296610 0 0 2 2 2643081 2643081 10444 0 0 4759
6 1846149 3780603 0 0 0 0 1875584 1875584 29435 0 0 12550
7 2374464 4801965 0 0 0 0 2392143 2392143 17679 0 0 8964
8 20263627 40557223 0 0 22 22 20273602 20273602 9975 0 0 2005
9 14853979 29722517 0 0 0 0 14858832 14858832 4853 0 0 1283
10 6417731 12865067 0 0 2 2 6427598 6427598 9867 0 0 2254
11 12852538 25721759 0 0 0 0 12858099 12858099 5561 0 0 1801
12 0 0 0 0 0 0 0 0 0 0 0 0
13 0 0 0 0 0 0 0 0 0 0 0 0
14 0 0 0 0 0 0 0 0 0 0 0 0
15 0 0 0 0 0 0 0 0 0 0 0 0
16 0 0 0 0 0 0 0 0 0 0 0 0
17 0 0 0 0 0 0 0 0 0 0 0 0
18 0 0 0 0 0 0 0 0 0 0 0 0
19 0 0 0 0 0 0 0 0 0 0 0 0
20 0 0 0 0 0 0 0 0 0 0 0 0
21 0 0 0 0 0 0 0 0 0 0 0 0
22 0 0 0 0 0 0 0 0 0 0 0 0
23 0 0 0 0 0 0 0 0 0 0 0 0
24 0 0 0 0 0 0 0 0 0 0 0 0
25 0 0 0 0 0 0 0 0 0 0 0 0
26 0 0 0 0 0 0 0 0 0 0 0 0
27 0 0 0 0 0 0 0 0 0 0 0 0
28 0 0 0 0 0 0 0 0 0 0 0 0
29 0 0 0 0 0 0 0 0 0 0 0 0
30 0 0 0 0 0 0 0 0 0 0 0 0
31 0 0 0 0 0 0 0 0 0 0 0 0
32 0 0 0 0 0 0 0 0 0 0 0 0
*** Timewarps
FEE ADC Pause Resume SYNC100 WR48-63 Disc MBS Undefined Samples
0 0 0 0 0 0 0 0 0 0
1 0 0 0 0 0 0 0 0 0
2 0 0 0 0 0 0 0 0 0
3 0 0 0 0 0 0 0 0 0
4 0 0 0 0 0 0 0 0 0
5 0 0 0 0 0 0 0 0 0
6 0 0 0 0 0 0 0 0 0
7 0 0 0 0 0 0 0 0 0
8 0 0 0 0 0 0 0 0 0
9 0 0 0 0 0 0 0 0 0
10 0 0 0 0 0 0 0 0 0
11 0 0 0 0 0 0 0 0 0
12 0 0 0 0 0 0 0 0 0
13 0 0 0 0 0 0 0 0 0
14 0 0 0 0 0 0 0 0 0
15 0 0 0 0 0 0 0 0 0
16 0 0 0 0 0 0 0 0 0
17 0 0 0 0 0 0 0 0 0
18 0 0 0 0 0 0 0 0 0
19 0 0 0 0 0 0 0 0 0
20 0 0 0 0 0 0 0 0 0
21 0 0 0 0 0 0 0 0 0
22 0 0 0 0 0 0 0 0 0
23 0 0 0 0 0 0 0 0 0
24 0 0 0 0 0 0 0 0 0
25 0 0 0 0 0 0 0 0 0
26 0 0 0 0 0 0 0 0 0
27 0 0 0 0 0 0 0 0 0
28 0 0 0 0 0 0 0 0 0
29 0 0 0 0 0 0 0 0 0
30 0 0 0 0 0 0 0 0 0
31 0 0 0 0 0 0 0 0 0
32 0 0 0 0 0 0 0 0 0
*** Program elapsed time:34518.602s ( 0.927 blocks/s, 0.058 Mb/s)
|
| Attachment 6: bias-daid-14B.png
|
|
| Attachment 7: daid-14-biasC.png
|
|
| Attachment 8: daid-14-tempC.png
|

|
| Attachment 9: daid-14-statsC.png
|

|
| Attachment 10: daid-14-histosC.png
|
|
| Attachment 11: daid-14-tempsD.png
|

|
| Attachment 12: daid-14-statsD.png
|

|
| Attachment 13: daid-14-histosD.png
|

|
| Attachment 14: daid-14-biasD.png
|
|
| Attachment 15: daid-14-statsE.png
|

|
| Attachment 16: daid-14-tempsE.png
|

|
| Attachment 17: daid-14-histosE.png
|
|
| Attachment 18: daid-14-biasE.png
|
|
| Attachment 19: 1.png
|

|
| Attachment 20: 2.png
|

|
| Attachment 21: 3.png
|
|
| Attachment 22: 4.png
|
|
| Attachment 23: 5.png
|
|
| Attachment 24: 6.png
|
|
| Attachment 25: 7.png
|
|
| Attachment 26: 8.png
|
|
| Attachment 27: 9.png
|

|
| Attachment 28: 10.png
|
|
| Attachment 29: 200314_1823_feetemps.png
|

|
| Attachment 30: 200314_1827_leakagecurrents.png
|
|
| Attachment 31: 200314_1824_goodevents.png
|
|
| Attachment 32: 200314_2020_feetemps.png
|

|
| Attachment 33: 200314_2023_leakagecurrents.png
|
|
| Attachment 34: 200314_2022_goodevents.png
|
|
| Attachment 35: 200314_2136_BEAMDOWN.png
|
|
| Attachment 36: 200314_2141_beamback.png
|

|
| Attachment 37: 200314_2207_feetemps.png
|

|
| Attachment 38: 200314_2210_leakagecurrents.png
|

|
| Attachment 39: 200314_2208_goodevents.png
|

|
| Attachment 40: 200314_2303_rates.png
|

|
| Attachment 41: 200314_2303_goodevents.png
|

|
|
105
|
Sat Dec 7 02:39:02 2019 |
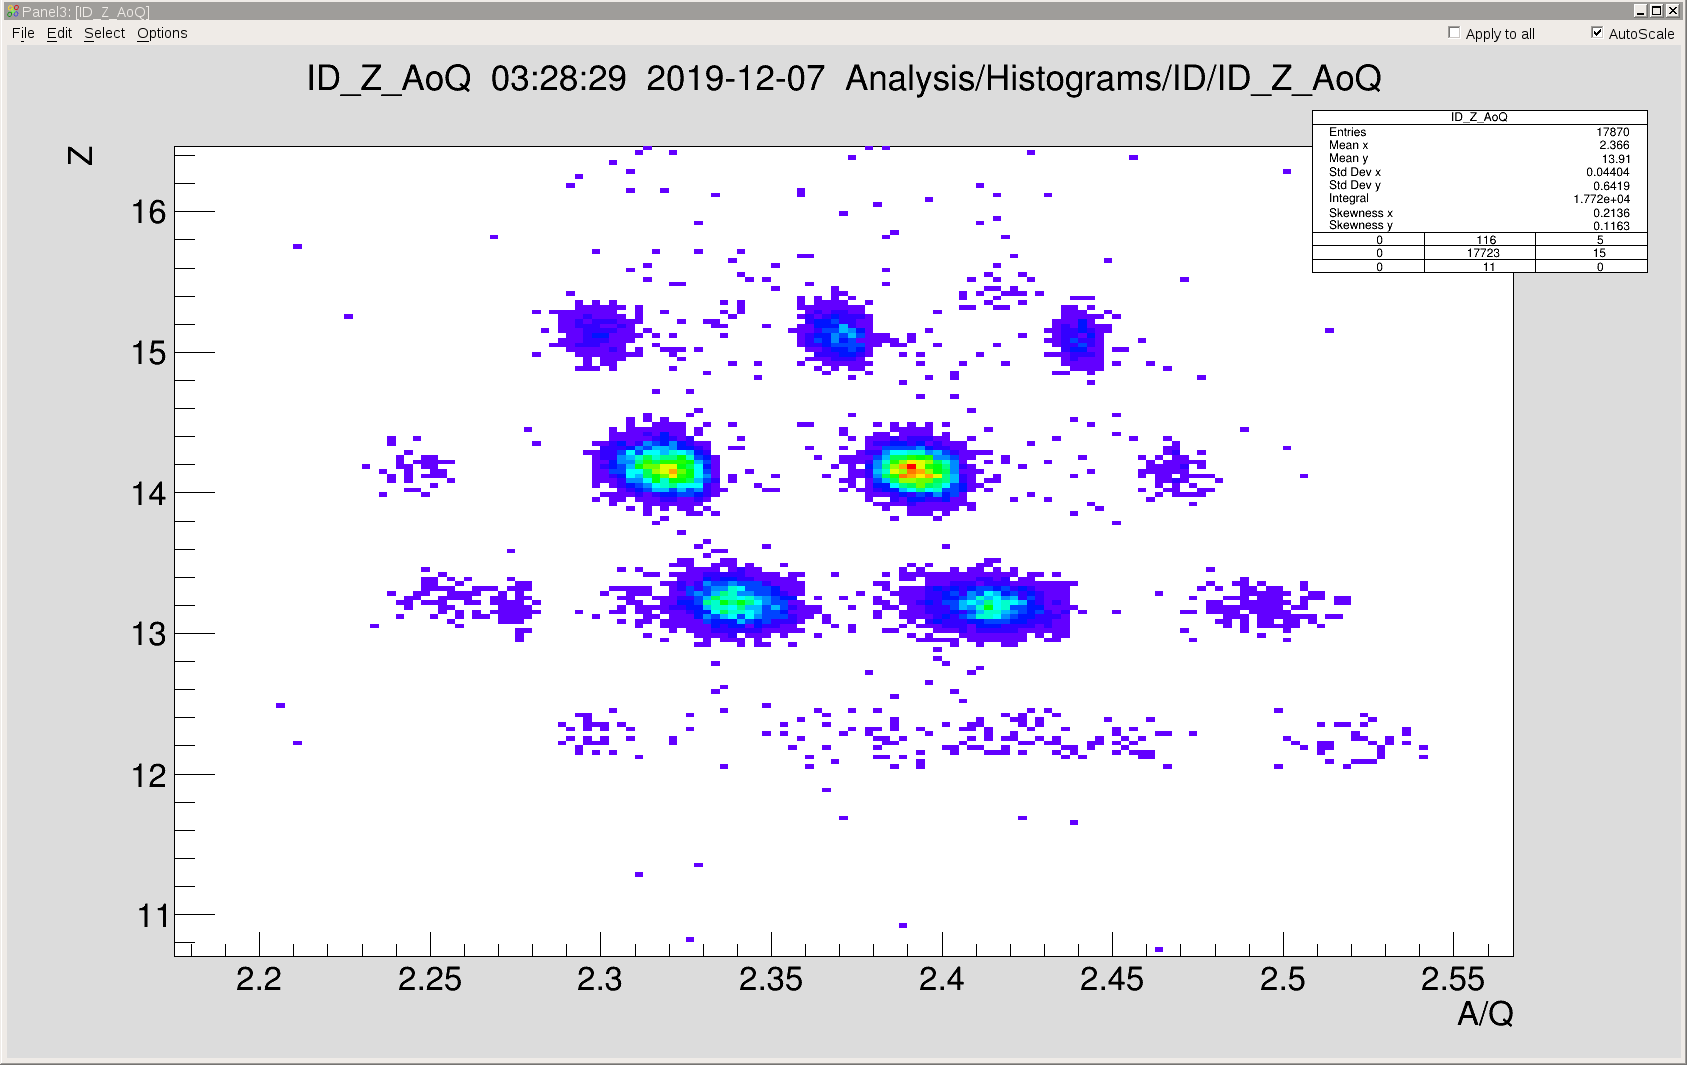
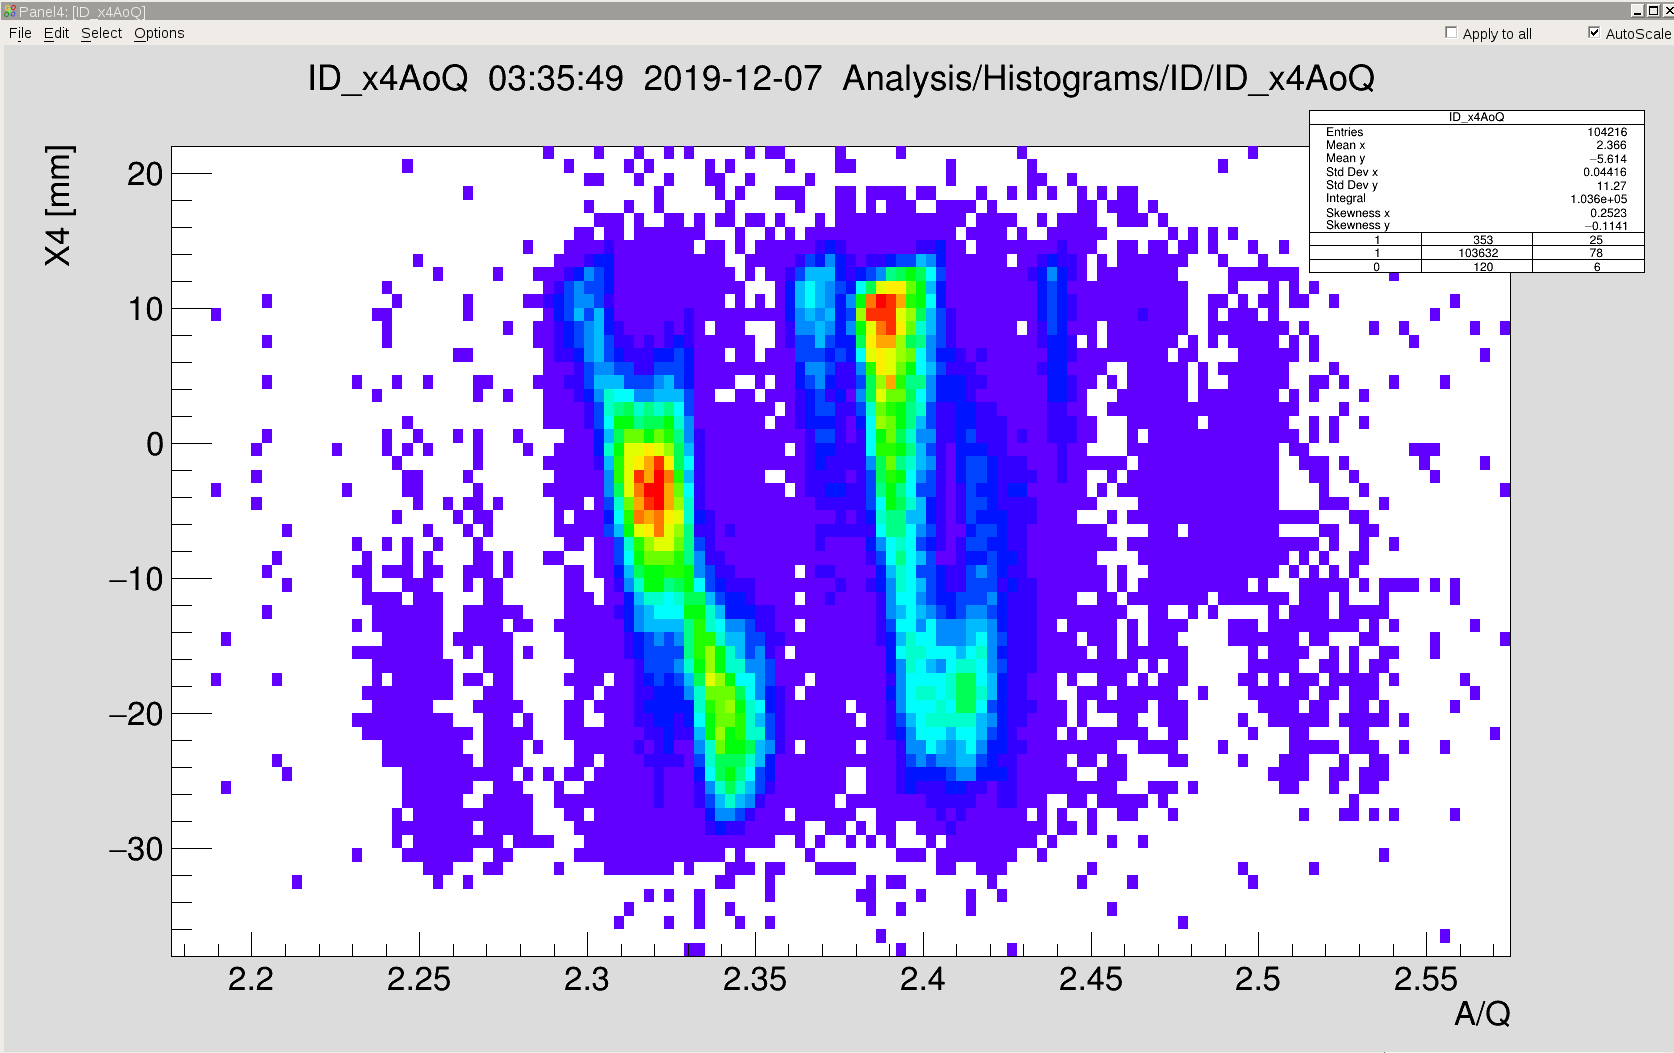
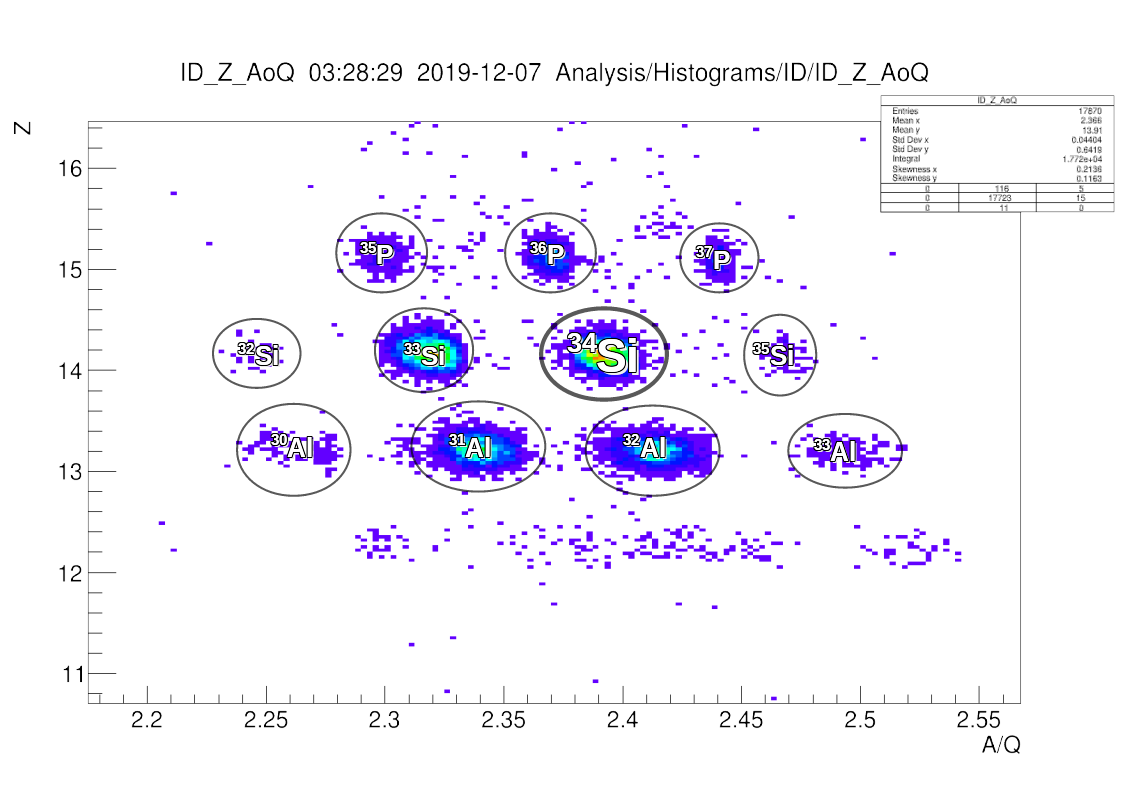
DK, NH et al. | 34Si Fragments PID |
See attached

Tentative PID (DK) as attachment #3

DESPEC LISE++ file as attachment #4 |
| Attachment 1: 2019-12-07-PID.png
|
|
| Attachment 2: 59_AM.png
|
|
| Attachment 3: pid.png
|
|
| Attachment 4: Ar-300_S4_updated_matter_DEPSEC_34Si.lpp
|
Version 11.0.88
{============================= Main Part ======================================}
[general]
File = C:\Users\Nic\Documents\Ar-300_S4_updated matter_DEPSEC 34Si.lpp
Date = 06-12-2019
Time = 23:05:23
Configuration = GSI\FRS-TA2-S4_2014.lcn
Optionsfile = GSI_FRS_2012.lopt
Title = GSI FRS - TA2 -2014
BlockStructure = MMMDSWMDMSAMMMMMMWMMDMSDMMMMMMMMMMMMMMMMMMSMMMWMMMMMMMMMMMMMMMMMM
[settings]
A,Z,Q = 40Ar18+ ; Mass ElementName Charge+ Beam
Energy = 300 MeV/u
Intensity = 1e+7 pps ; enA,pna,pps,kW
RF frequency = 20 MHz
Bunch length = 1 ns
Settings on A,Z = 34Si ; Mass ElementName Charge+ Beam
[OpticsBeam]
BX = 1 (�)mm ; one-half the horisontal beam extent (x)
BT = 5 (�)mrad ; one-half the horisontal beam divergence(x')
BY = 1.5 (�)mm ; one-half the vertical beam extent (y)
BF = 3.33 (�)mrad ; one-half the vertical beam divergence (y')
BL = 0 (�)mm
BD = 0.05 (�)% ; one-half of the momentum spread (dp/p)
ShiftX = 0 mm ; beam respect to the spectrometer axis
AngleX = 0 mrad ; beam respect to the spectrometer axis
ShiftY = 0 mm ; beam respect to the spectrometer axis
AngleY = 0 mrad ; beam respect to the spectrometer axis
Scheme Angle = 0 degrees
ShapeX = 1
ShapeT = 1
ShapeY = 1
ShapeF = 1
ShapeL = 1
ShapeD = 1
OptBeam_X = 1 (�)mm
OptBeam_T = 30 (�)mrad
OptBeam_Y = 1 (�)mm
OptBeam_F = 30 (�)mrad
OptBeam_L = 0 (�)mm
OptBeam_D = 1.5 (�)%
[options]
NP simple = 32 ; Number of points in distribution
NP charge states = 32 ; Number of points in distribution
NP wedge = 32 ; Number of points in distribution
Charge states = No ; No & Yes
CutEdgeEffect = 1 ; 1-Yes. Default, 0-no - for extended configurations
Prim.beam scatter = 0 ; 0-without, 1-with
Delta peak = 0 ; 0-without, 1-with
BrhoMeanMax = 1 ; 0-Max, 1-Mean
BrhoMeMaLeRi = 3 ; 0-Max, 1-Mean, 2-Left, 3-Right /for fission/
[target]
Target contents = 0,4,1,9.012 ; Nomer,Z,Atoms,Mass
Target thickness = 1,2500.7,1.848,0,0,0 ; State,Thickness,density,angle,SolidGas,..
Target fusion compound = 0
Targ use for Q-states = 1
Target Defect = 1,0 ; [0] choice - % or micron at 0 degree, [1]=value;
Degrader contents = 0,22,1,47.9 ; Nomer,Z,Atoms,Mass
Degrader thickness = 0,35,4.519,0,0,0 ; State,Thickness,density,angle,SolidGas,..
Degra use for Q-states = 1
Degrader Defect = 1,0 ; [0] choice - % or micron at 0 degree, [1]=value;
[mechanism]
Reaction = 0 ; 0 - fragm, 1 - fusion-resid, 2 - fusion-fission
CalcOther = 1 ; calculate other reactions
V calculation = 5 ; 0 - constant, 1 - Borrel, 2 - Rami, 3-convolution, 4-two body reaction
V_opt/Vbeam = 1 ; default 1
Velocity_exceed = 1 ; 0 - without, 1-with - two-body recations velocity corrections
Binding Energy for Vf/Vp = 8 MeV ; Binding energy for Borrel's expression
Shift for Vf/Vp calc = 0
Prefragment_Rami = 1 ; 1-Yes, 0-No
Sigma0 = 90 MeV/c ; default 90
SigmaD = 0 MeV/c ; default 200
SigmaM = 87 MeV/c ; default 87
Asymmetry = 0 % ; default 0
Method v-sigma = 0 ; 0 - Goldhaber, 1-Morrissey,2-Friedman,3-Convolution
G_Surface = 0.95 MeV/fm^2
Symmetry around half_Ab = 1 ; 1 - yes, 0-no
Pfaff pickup correction = 0 ; 1 - yes, 0-no
ChargeExchangePfaff = 0 ; 1 - exclude, 0-forget
Sigma corr 0 = 0 ; Coulomb energy
Sigma corr 1 = 0 ; Projectile mass
Friedman mode = 2 ; 0-Qgg, 1-Surface, 2-Qgg+Surface
Prefragment_Fri = 1 ; 1-Yes, 0-No
Coulomb_Friedman = 1 ; 1-Yes, 0-No
K_Morr = 8 MeV/A ; E/A=8MeV/A default; D.Morrissey coef.
K_MorHalf = 8 MeV/A ; E/A=8MeV/A default at Afrag=Aproj/2; D.Morrissey coef.
AA_fast = 0 ; 1-Yes, 0-No
BarrierShape = 1 ; 0-classical, 1-quantum mech.
H_omega = 5 MeV ; default 3
Probabilty_CN = 0 ; 0/1 use Prbabilty for CN formation
UseVanishing = 1 ; 1-Yes, 0-No
VanishMode = 0 ; 0-Sierk, 1-Cohen
NuclPotential = 1 ; 0-Bass, 1-WS
WS_V0 = 105 MeV
WS_R0 = 1.12 fm
WS_a = 0.75 fm
FusDiffuseness = 1
Width Coef = 1 ; default 1; for Leon's charge state distribution
gZt Correction = 1 ; default 1; Leon's C.S.D.
PowerCoefLeon = 0.477 ; default 0.477; Leon's C.S.D.
Cross section = File ; Fit & File
Charge method = 3 ; charge calculations method 0-5
EPAX Cross Section = 4 ; cross section calculations method 0-4
SR Cross Section = 2 ; EPAX for SR 0-2
Energy Loss = 2 ; energy loss calculation method 0-3
Anglular straggling = 1 ; 0-LISE, 1-ATIMA
StragglingCoef1 = 0.217
StragglingCoef2 = 1.12
Energy straggling = 1 ; 0-LISE, 1-ATIMA
EnergyStragMethod = 0 ; 0-integrate, 1-table
EnergyStragShape = 0 ; 0-Gauss, 1-Landau-Vavilov
EquilThickness = 1 ; 0-Charge, 1-Global
MassMethod = 0 ; 0-DB+calcul, 1 + just calcul
MassDataBase = 0 ; 0-A&W, 1-User ME
Mass formula = 2 ; 0-LDM, 1-Myerer, 2: 1+corrections
UseChargeForEnergy = 2 ; 0-No, 1-Yes, 2-Auto
EnergyValueAuto = 30 ; default value 30 MeV/u
EquilibriumMode = 1 ; 0-Equil, 1-NonEquil
UB_Global = 70 ; default 70 MeV/u
MinZ_Global = 2 ; default Z>=29
ChargeStateOptim = 1 ; 0-No, 1-Yes
ZmQ_AfterReactn = 0 ; default 0 (full stripped)
EPAX_p_Norm = 1
EPAX_p_Un = 1.65
EPAX_p_Up0 = 1.79
EPAX_p_Up1 = 0.00472
EPAX_p_Up2 = -1.3e-5
EPAX_p_H = 1
[fission]
FisAngDistShape = 0 ; 0-isotropic; 1-anisotropic
FisMomCutForAngDist = 2 ; 0-dont use; 1-use just MatrixKinematics; 2-use for all; (default 2)
OddEvenCorrections = 1 ; 0-dont use; 1-use
PostScissionEvaporation = 1 ; 0-dont use; 1-use
DeexcitFunctionPoints = 0 ; 0- average deexcitation energy; 1- 3 points; 2 - manually
FisEXmanually = 20 ; Excitation energy manually
FisCSmanually = 1000 ; Cross section manually
FisTXEmethod = 1 ; 0-from Edissipated, 1 from Q-value
Fis_f = 0.0045 ; default 0.0045
FisEXsigma = 5.5 MeV ; default 5.5
FisCS_Global = 1e-11
FisCS_TKE = 1e-8
FisBeta1 = 0.625 ; deformation of light fragment
FisBeta2 = 0.625 ; deformation of heavy fragment
FisTKE_d = 2 fm ; d-param in Wilkins formula
FisBetaFit = 1 ; 0-manual, 1-fit
N0 = 83 ; default 82
dU0 = -2.65 ; default -2.5
C0 = 0.7 ; default 1.4
cpol0 = 0.65 ; default 0.65
width0 = 0.63 ; default 0.63
N1 = 90 ; default 90
dU1 = -3.8 ; default -5.5
C1 = 0.15 ; default 0.16
cpol1 = 0.55 ; default 0.55
width1 = 0.97 ; default 0.97
[charge_suppression]
FragInd = 1e-3
FragTotal = 1e-5
BeamInd = 1e-20
BeamTotal = 1e-20
[convolution]
Convolution mode = 1 ; 0-Qgg, 1-Surface, 2-Qgg+Surface
SigmaConv = 91.5 MeV/c ; default 90 for Convolution
CoefConv_0 = 3.344
CoefConv_1 = 3
CoefConv_2 = 2.936
ShiftConv_0 = 0.158
ShiftConv_1 = 0.149
ShiftConv_2 = 0.153
[evaporation]
NP evaporation = 32 ; Number of points in distribution
EvapMethod = 2
StateDensityMode = 2 ; 0, 1+pairing, 2+shell
EvapUnstableNuclei = 1 ; 0 - only stable,1 +unstable
Tunnelling = 1 ; 1-Yes, 0-No
AvoidUnboundCS = 1 ; 1-Yes, 0-No
ProtectedChannels = 1 ; 1-Yes, 0-No
R_Evaporation = 5.7 fm ; correction for the effective Coulomb barrier
Mode_Apf_manual = 0 ; 1-manual, 0-auto
Energy_in_T = 2 ; default 2
EvaporationVelocity = 0 ; 0 - quality, 1 -fast
DeltaOddEvenEvap = 12
DeltaOddEvenFission = 14
BreakupTemperature250 = 4.7
BreakupTemperature150 = 5.9
BreakupTemperature050 = 8
BreakupDiffuseness = 0.05
DissipationKramers = 0 ; 0 - no, 1 - use
DissipationStepFunction = 1 ; 0 - no, 1 - use
DissipationBeta = 1 ; default 2.0
mode_1n = 1 ; 1-Yes, 0-No
mode_2n = 0 ; 1-Yes, 0-No
mode_1p = 1 ; 1-Yes, 0-No
mode_2p = 0 ; 1-Yes, 0-No
mode_a = 1 ; 1-Yes, 0-No
mode_d = 0 ; 1-Yes, 0-No
mode_t = 0 ; 1-Yes, 0-No
mode_3he = 0 ; 1-Yes, 0-No
mode_fis = 1 ; 1-Yes, 0-No
mode_brk_up = 1 ; 1-Yes, 0-No
mode_gamma = 0 ; 1-Yes, 0-No
[fission_barrier]
FissionBarrierFactor = 1
FissionBarrierMode = 1 ; #0-4
OddEvenCorrections = 1 ; 1-Yes, 0-No
ShellCorrections = 1 ; 1-Yes, 0-No
FB_InOutMax = 2 ; #0-2 - in/out/max
ModeForUser = 1 ; #0-2
NdeltaOddEven = 2.5
ZdeltaOddEven = 9
[excitation_energy]
GeomAA_Correction = 1 ; 0 - don't use,1 - use -default
Thermalization = 0 ; 1-Yes, 0-No
ThermaTimeCoef = 3e+0 ; 2.1e-22 MeV *s/e(t)
Friction = 0 ; 0 - off,1 - on
Ev_A_SigmaCoef = 9.6
G_FrictionCoef1 = 6.5
G_FrictionCoef2 = 0
G_FactorCoef1 = 1.5
G_FactorCoef2 = 2.5
DepthHole = 40
EnergyCoef_CB0 = 0
EnergyCoef_CB1 = 13.3
EnergyCoef_CB2 = 0
SigmaCoef_CB0 = 0
SigmaCoef_CB1 = 9.6
SigmaCoef_CB2 = 0
D_MeanTemp = 13
AA_factor = 1
ApplyLimitTemp = 0 ; 1-Yes, 0-No
[evapauto]
tun_a0 = -0.61392
tun_a1 = 0.44559
tun_a2 = 0.12008
A_Bound = 300 ; mass
A_Pairing = 70 ; mass
[plot]
Start target = Detector ; Detector & RF
Start of TOF = M7
Stop of TOF = M34
dE-detector-1st = M28
dE-detector-2nd = M7
TKE-detector = M41
PlotBrho = D1
PlotWedge = S4
X-detector = M19
Y-detector = M19
Tilting = M1
Stopper = W1
RO_Wedge = n
ConditionBlock = A10
Plot threshold = 1e-10 pps ; minimal value for plot scale
Shift of TOF for RF = 0 ns ; for dE-TOF plot with RF
Fraction of RF trigger = 2
UseCondition = 0
TKE_calibration = 1,1,0,MeV ; Input PV(0) or CH(1), A, B, dimension
[cs_file]
UserDiffCS = 0 ; Number of User Diff CS saved in this file
AppendOverwrite = 1
AttachedInside = 1
ShowCSinPlot = 1
Chi2 = 1
CSfilename =
[sec_reactions]
NP sec.reactions = 16 ; Number of points in distribution
Secondary reactions = 0 ; 0/1 - use secondary reactions in calculations
fiss_FilterUse0 = 1
fiss_FilterUse1 = 1
fiss_FilterUse2 = 1
fiss_ellipse = 5
fiss_NdeltaTop = 0
fiss_ZdeltaTop = 0
fiss_NdeltaBot = 25
fiss_ZdeltaBot = 20
frag_FilterUse0 = 3
frag_FilterUse1 = 3
frag_FilterUse2 = 3
frag_ellipse = 4
frag_NdeltaTop = 5
frag_ZdeltaTop = 5
frag_NdeltaBot = 6
frag_ZdeltaBot = 6
[abrasion_fission]
... 2087 more lines ...
|
|
140
|
Tue Mar 10 23:17:31 2020 |
DK, LS, PW, TD, CA | Wednesday 11 March 2020 |
00:15 Shift change near AIDA R6_475

  We continue with spill cycles around 0.2 Hz or one beginning once each ~5 seconds.

  All system-wide checks passed successfully
  Temperatures ok (aida01 still a bit hot) - see attachment #1
  Stats as normal (SSD3 still noisy) - see attachment #2
  Bias and pulser settings remain sane - see attachment #3
  Writing data to disk at ~26 MB/s as yesterday - see attachment #4
  Merging fine, 2.6 to 3.3 Mega items / sec (all aida## seen to go on) - see attachment #5
  Rates look not unreasonable for expected implantation in short time window - see attachment #6

2:26
   We are near R6_574
   All system checks are fine
   Temps are fine - attachment #7
   Stats look as before - attachment #8
   Biases and leaks typical - attachment #9
   Merger fine, 3 x 10^6 items / sec (skip screencap)
   TapeServer still sits near 25 MB/s (skip screencap)
   Cumulative implants look reasonable, but NB that histos have not been cleared - attachment #10

2:44 R6_587 or R6_588
   The spills seem to have stopped based on the beeping scalars.  Confirmed with other group there are no scint counts.
   See attachment of AIDA rates where no implants can be seen.  See attachment #11

2:46 Spill beeps heard briefly, but they cut again.  R6_590

2:49 Beam seems to be back R6_592
  Scints have counts in DESPEC DAQ, scalars are beeping, AIDA sees implants.  No problem.  See attachment #12 for implants.

4:35
  System checks all pass (except expected error on master clock)
  Temps okay - attachment #13
  Biases and leak currents normal - attachment #14
  Stats as before - attachment #15
  Merger going, 3 mega items per sec
  TapeServer going, 25 MB/s

5:59 Beam is gone again, near R6_738.  As before, we get consistent confirmation from the trigger clicks and the plastic scint data of DESPEC group.
   See attachment #16 which shows no implants in the rate.


Contact phones for Control Room: 2222

We called, they are aware of a problem with the magnets and they are working to resolve it.  So we will await them.

Expert is scheduled for 7:30, but he may come earlier like 7:00 if he can make it in.

We leave AIDA writing to disk since there are some longer lived daughters (hour or more) so we may still get some interesting decays with beam off

7:14  Beam is still off, but I make some notes
   System wide checks all okay
   Temps as normal (see attachment #17)
   Biases and leak currents okay (see attachment #18)
   Stats as normal (see attachment #19)
   Merger going at 3 mega cps
   TapeServer on, around 25 MB/sec
   Implants not seen in histogram rate as expected (see attachment #20)

7:32 We called the operators to confirm that they don't change anything before calling us first.
     Surely they said they don't touch the settings without telling us first, and just one magnet (maybe upstream of SIS) is down, and no plan to alter settings.

8.00 shift change at file R6_823
     beam is back on, no settings changed.
     particles per spill is similar to before (2k~3k per spill)
     implants now being seen in rate histogram (attachment 21)

8.32 system wide checks all okay
     FEE temperatures are normal (attachment 22)
     leak currents are okay and have been recorded to sheet (attachment 23)
     good event stats seem normal, although noted that all FEEs in DSSD3 now over 100k (attachment 24)
     merger rate is running around 3M items/sec
     tape service rate is running around 26MB/sec

9.20 high energy spectra histograms for even FEEs was not displaying correctly (attachment 25). can also be seen on yesterdays elog on attachment 34
     problem can be seen clearly in /tmp/LayOut6.mlf for the line corresponding to aida4 was 1.8h not 1.8H as the information was somehow saved in the layout (attachment 26).
     remaking each histogram and saving layout6 seems to be fixed (attachment 27)

Top of the error message showed the problem, like:
====
Using /tmp/LayOut6.mlf
restore server=aida02 spectrum=1.8.H to gallery=1 overlap=1
restore server=aida04 spectrum=1.8.h to gallery=2 overlap=1
SpecDetails returned with an error
0x30004
SOAP-ENV:Server-Error detected in method SpecDetails
Invalid spectrum name
    invoked from within
"SpecDetails 1.8.h"
    (in namespace inscope "::urn:SpectrumService" script line 1)
    invoked from within
====

10.05 beam is being stopped to change some thresholds

10.34 system wide checks all okay
      FEE temperatures are normal (attachment 28)
      leak currents are okay and have been recorded to spreadsheet (attachment 29)
      good event stats are normal, as previously mentioned aida11 rate was over 100k this looks to have just been a fluctuation (attachment 30)
      merger is running at a rate of 3M items/sec
      tape service is running at a rate of 24MB/sec
      implants not seen in histogram rate as expected as beam still down (see attachment 30)

10.42 beam still down but taking data, currently file finishing R6_946
      as of now we have 3.2Tb left which should correspond to around 26 hours left until space is full
      have zeroed all histograms so will take screenshots at 11.00

11.06 checked rates histograms, for aida3 some low energy channels in ASICs 1,2, and 3 were missing so performed ASIC control checks

11.25 beam back file S480/R6_975

12.00 analysis file S480/R6_1001 - attachment 33
      FEE aida09 deadtime c. 5% (highest rate good events c. 250k), all other FEE64s << 1%
      all HEC data rate c. 1kHz
      all ADC data rate c. 1.2MHz

12.23 system wide checks all okay
      FEE temperatures are normal (attachment 34)
      leak currents are okay and have been recorded to spreadsheet (attachment 35)
      good event stats are okay (attachment 36)
      merger is running at a rate of 3M items/sec
      tape service is running at a rate of 26MB/sec

13.00 beam off, unknown reason at the moment, but can confirm from rates histogram (attachment 37)
      seems to be intermittent. file R6_1051

13.10 beam back on, no one was called. currently on file R6_1061

13.22 beam off as going to higher intensity beam. file R6_1069

14.42 system wide checks all okay
      FEE temperatures are normal (attachment 38)
      leak currents are okay and have been recorded to spreadsheet (attachment 39)
      good event stats are okay (attachment 40)
      merger is running at a rate of 3M items/sec
      tape service is running at a rate of 24M/sec
14.48 on file R6_1131

16.19 beam stop for 2 hours. TapeServer stopped and restarted - AIDA writing to No Storage
      file R6_1193

16:35 compression of files R6_[200-999] commenced (nice -20)

16:40 system wide checks all okay
      FEE temperatures are normal (attachment 41)
      leak currents are okay and have been recorded to spreadsheet (attachment 42)
good event stats are okay (attachment 43) |
| Attachment 1: daid-11-tempsA.png
|

|
| Attachment 2: daid-11-statsA.png
|

|
| Attachment 3: daid-11-biasA.png
|
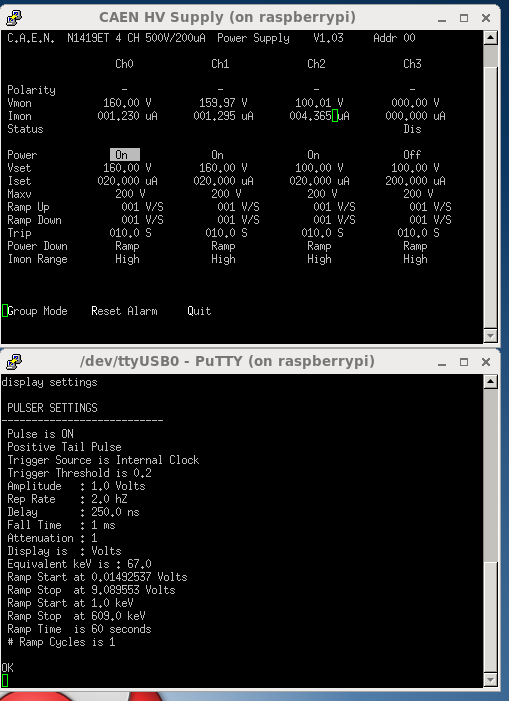
|
| Attachment 4: daid-11-TSA.png
|

|
| Attachment 5: daid-11-mergerA.png
|
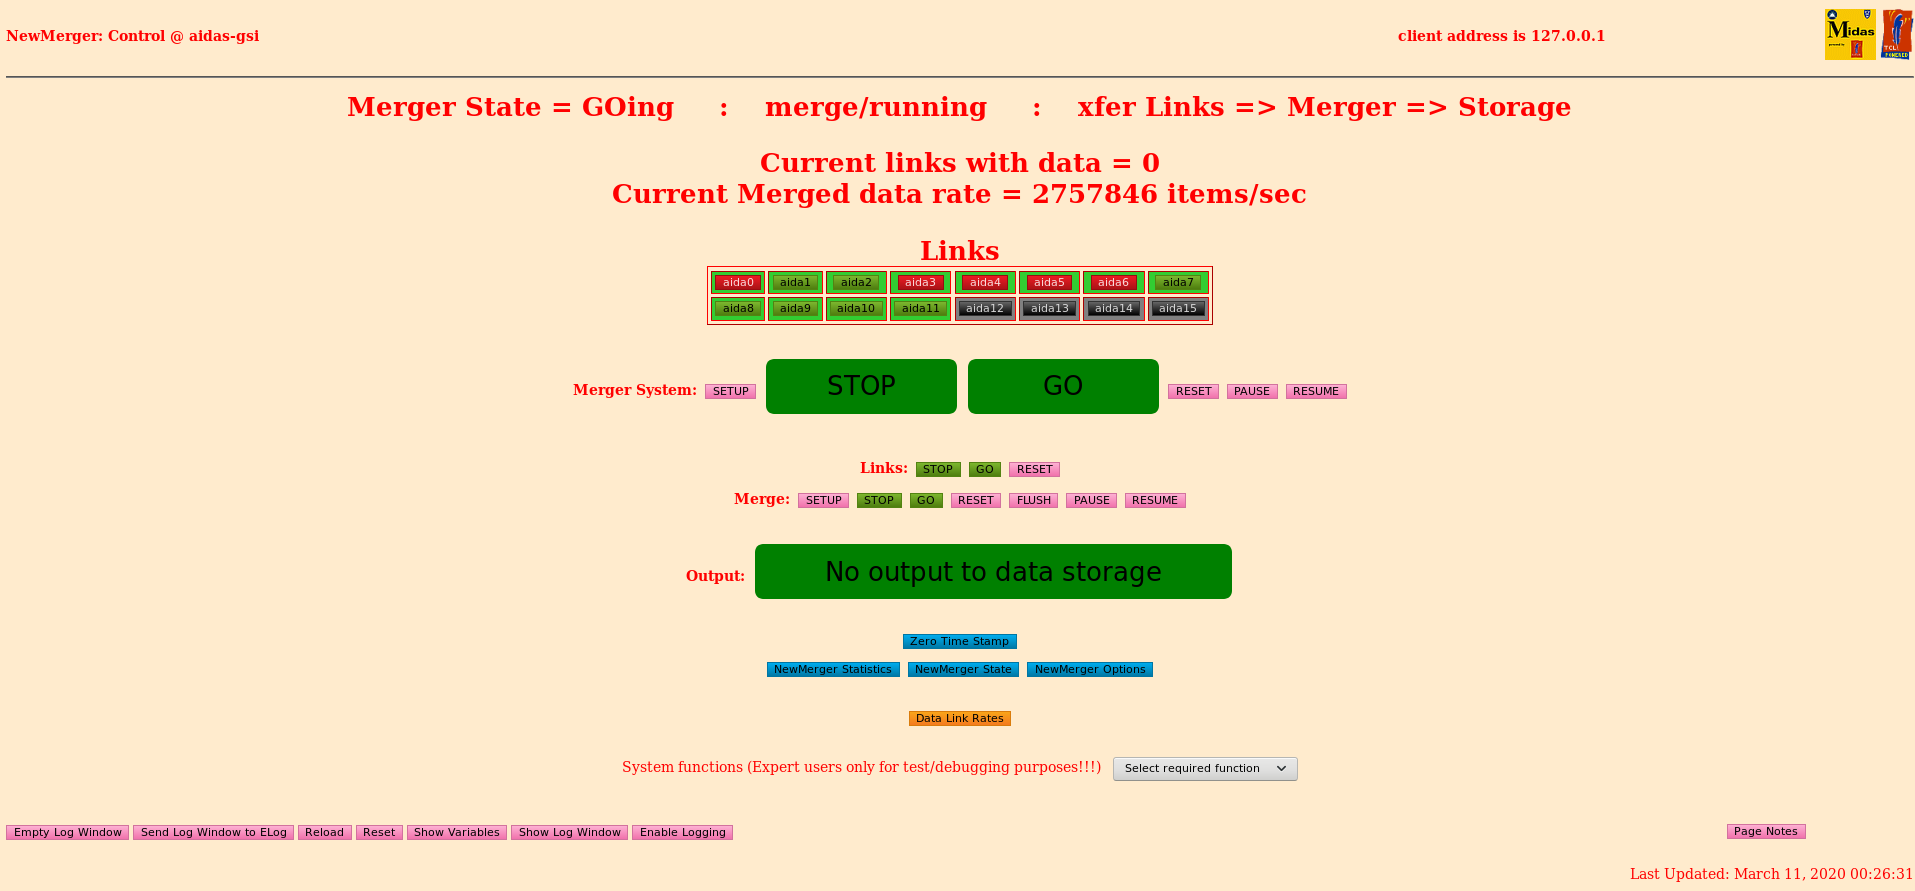
|
| Attachment 6: daid-11-implantsA.png
|

|
| Attachment 7: daid-11-tempB.png
|

|
| Attachment 8: daid-11-statsB.png
|

|
| Attachment 9: daid-11-biasB.png
|
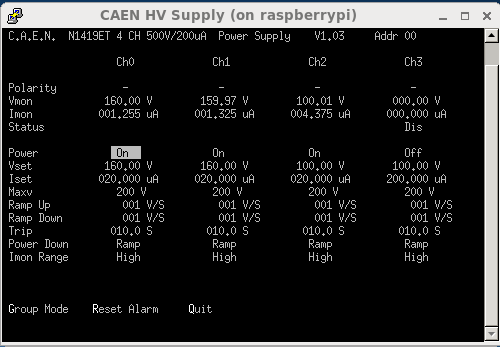
|
| Attachment 10: daid-11-histoB.png
|
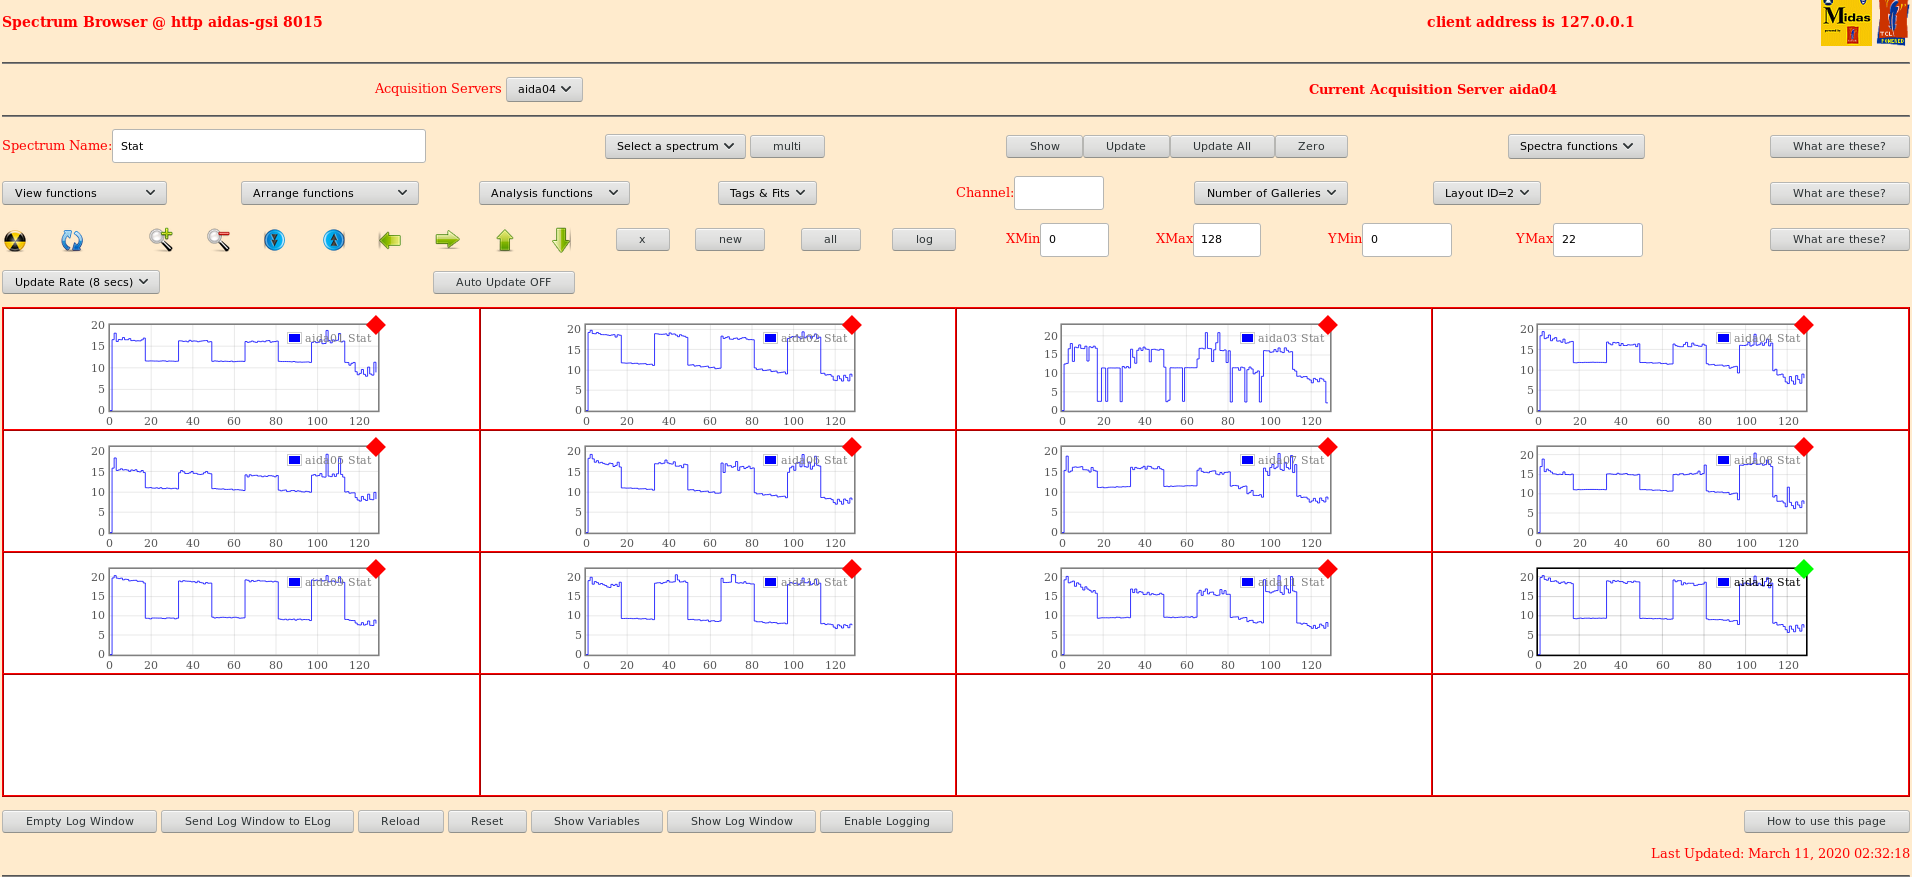
|
| Attachment 11: daid-11-histos-beamdrop.png
|
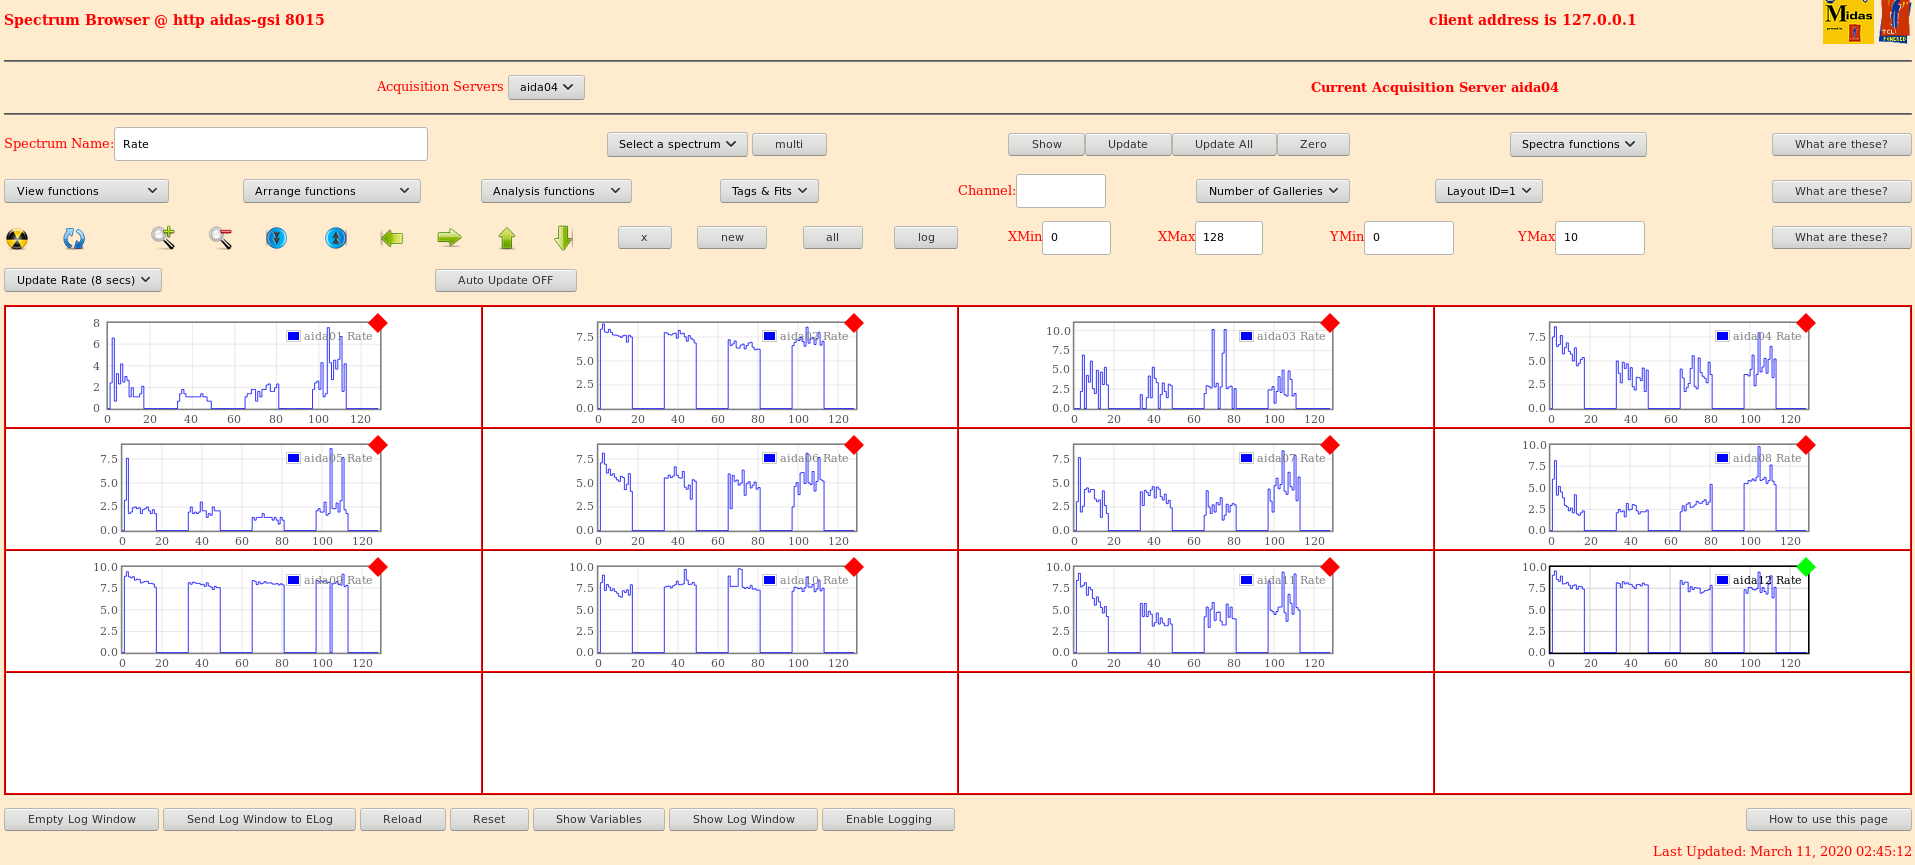
|
| Attachment 12: daid-11-beamreturn.png
|
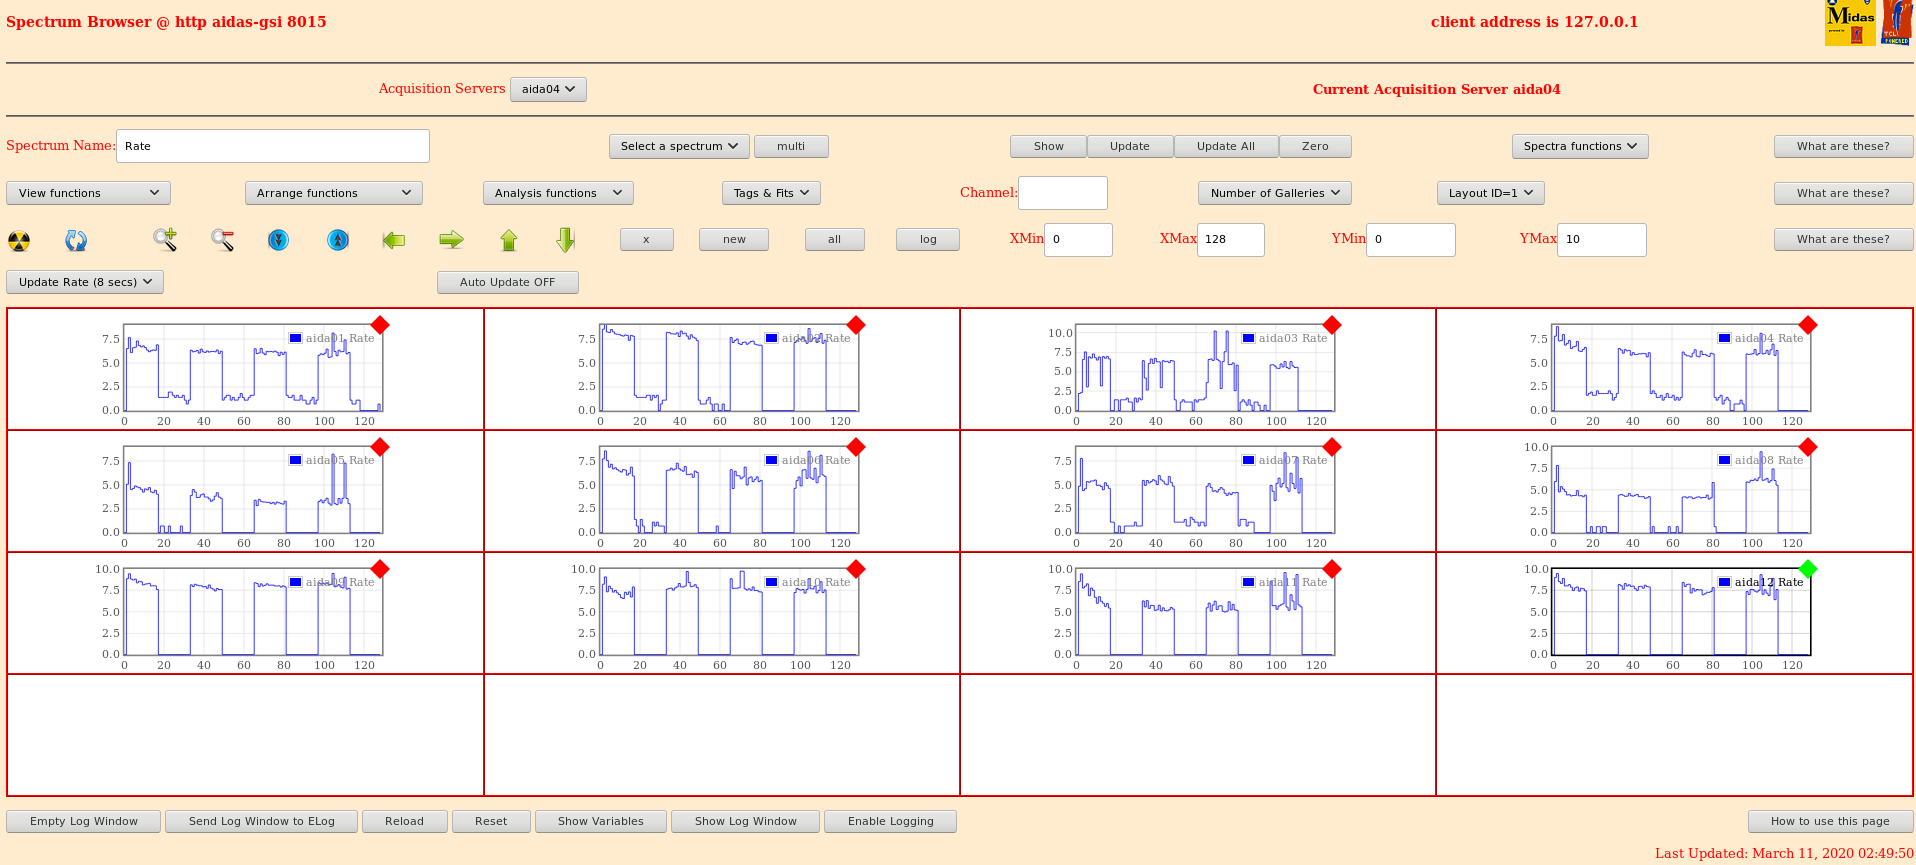
|
| Attachment 13: daid-11-tempC.png
|

|
| Attachment 14: daid-11-biasC.png
|
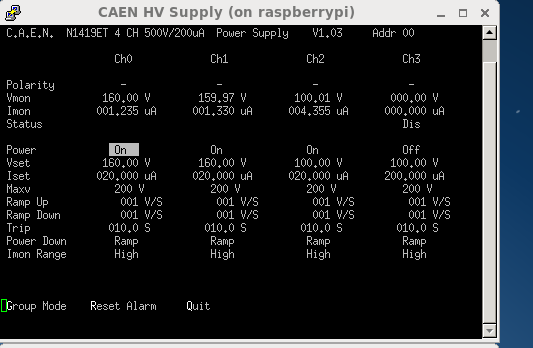
|
| Attachment 15: daid-11-statsC.png
|

|
| Attachment 16: daid-beamstop2.png
|
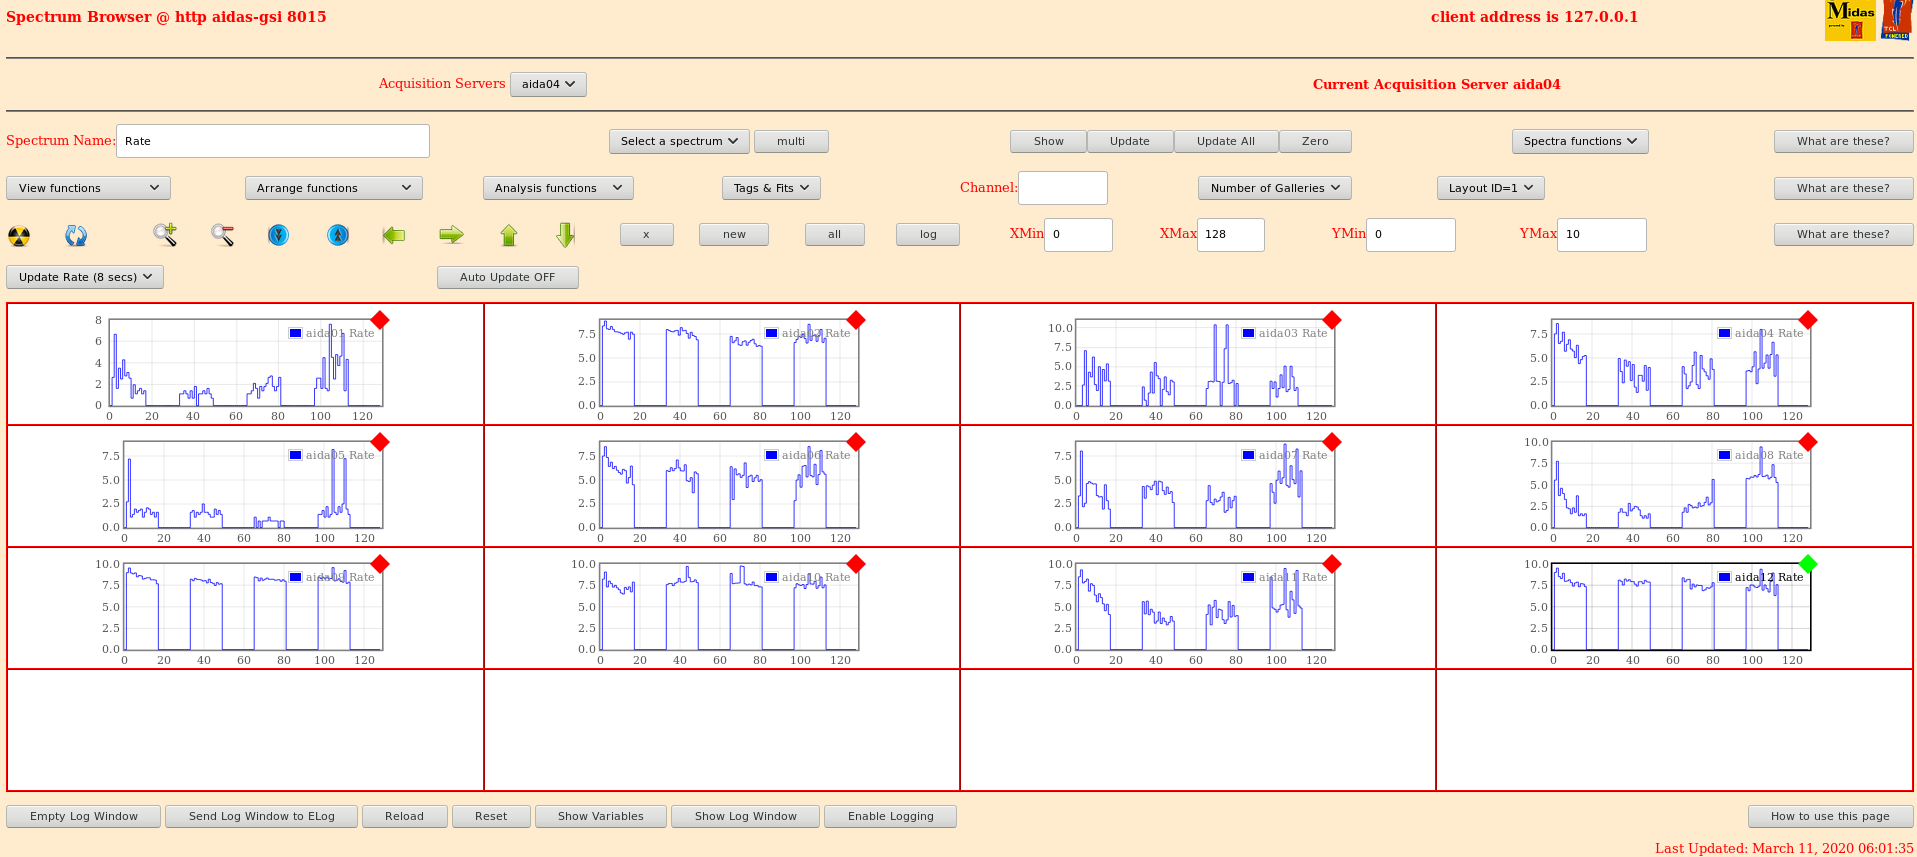
|
| Attachment 17: daid-11-tempD.png
|

|
| Attachment 18: daid-11-biasD.png
|
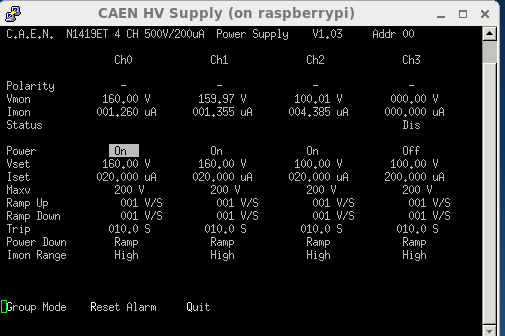
|
| Attachment 19: daid-11-statsD.png
|

|
| Attachment 20: daid-11-histosD.png
|
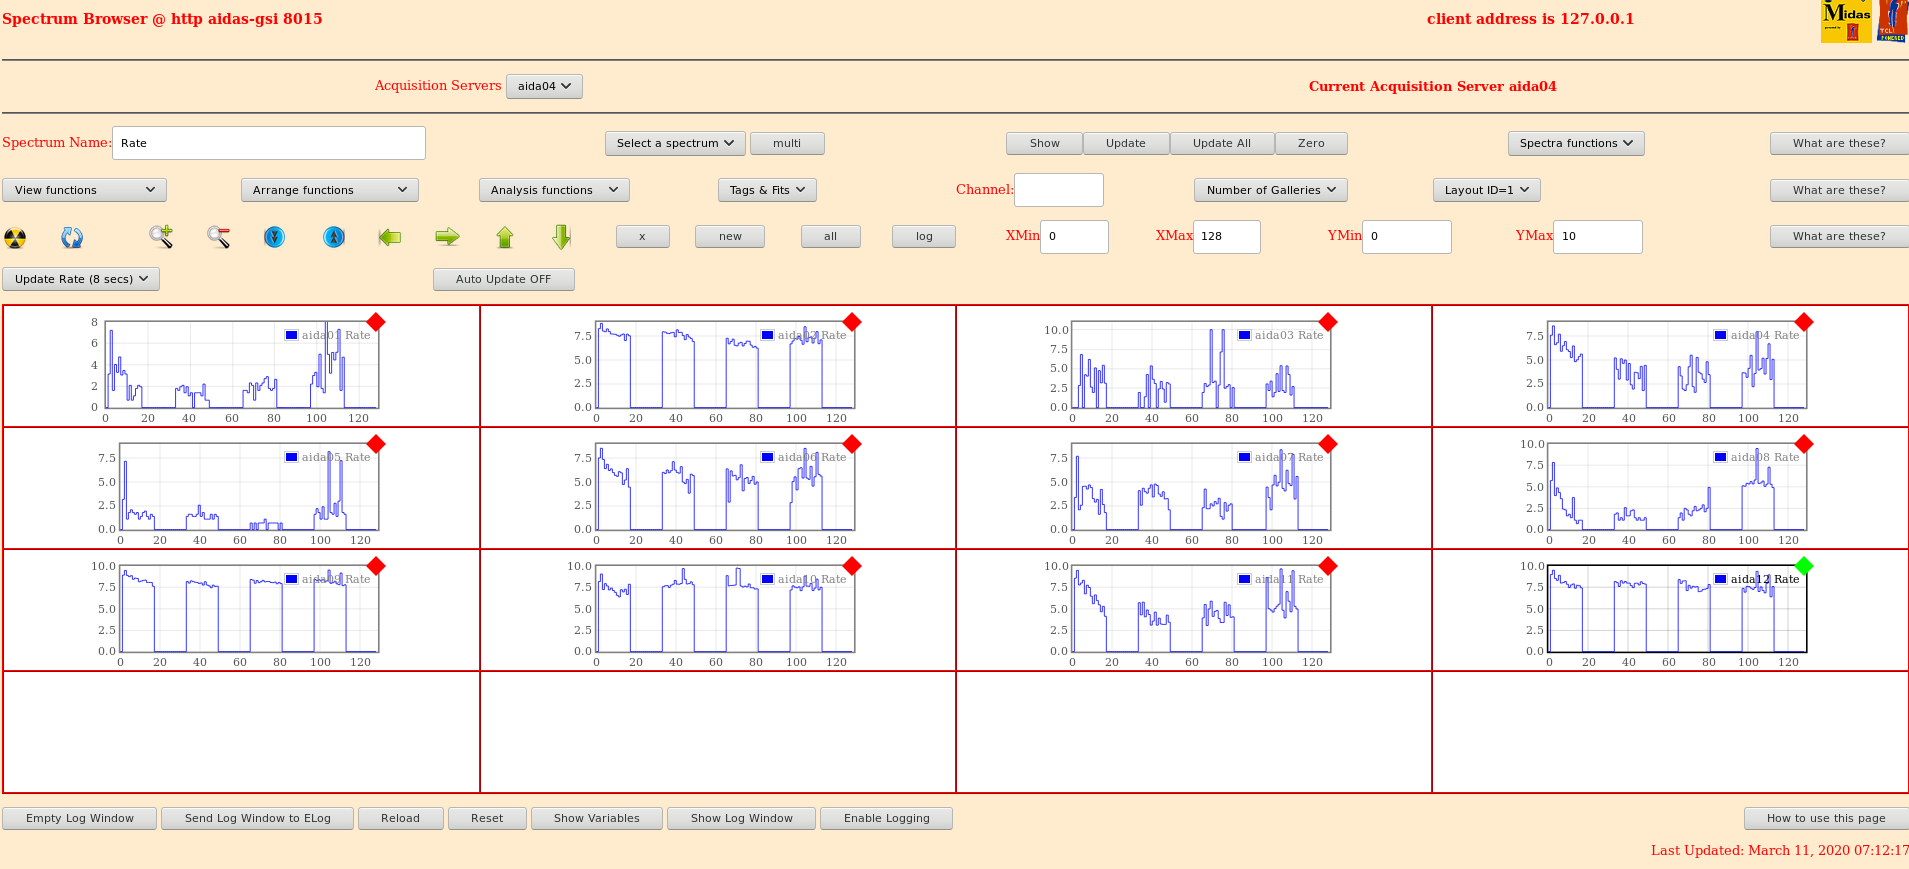
|
| Attachment 21: 200311_804_rateshistograms.png
|

|
| Attachment 22: 200311_28_feetemps.png
|

|
| Attachment 23: 200311_831_leakcurrents.png
|

|
| Attachment 24: 200311_829_goodevents.png
|

|
| Attachment 25: 200311_845_highEevenfees.png
|

|
| Attachment 26: daid-11-histos-lowgaineven.png
|

|
| Attachment 27: 200311_919_highEevenfixed.png
|

|
| Attachment 28: 200311_1030_feetemps.png
|

|
| Attachment 29: 200311_1032_leakcurrents.png
|

|
| Attachment 30: 200311_1031_goodevents.png
|

|
| Attachment 31: 200311_1040_ratehistogram.png
|

|
| Attachment 32: 200311_1107_rates.png
|
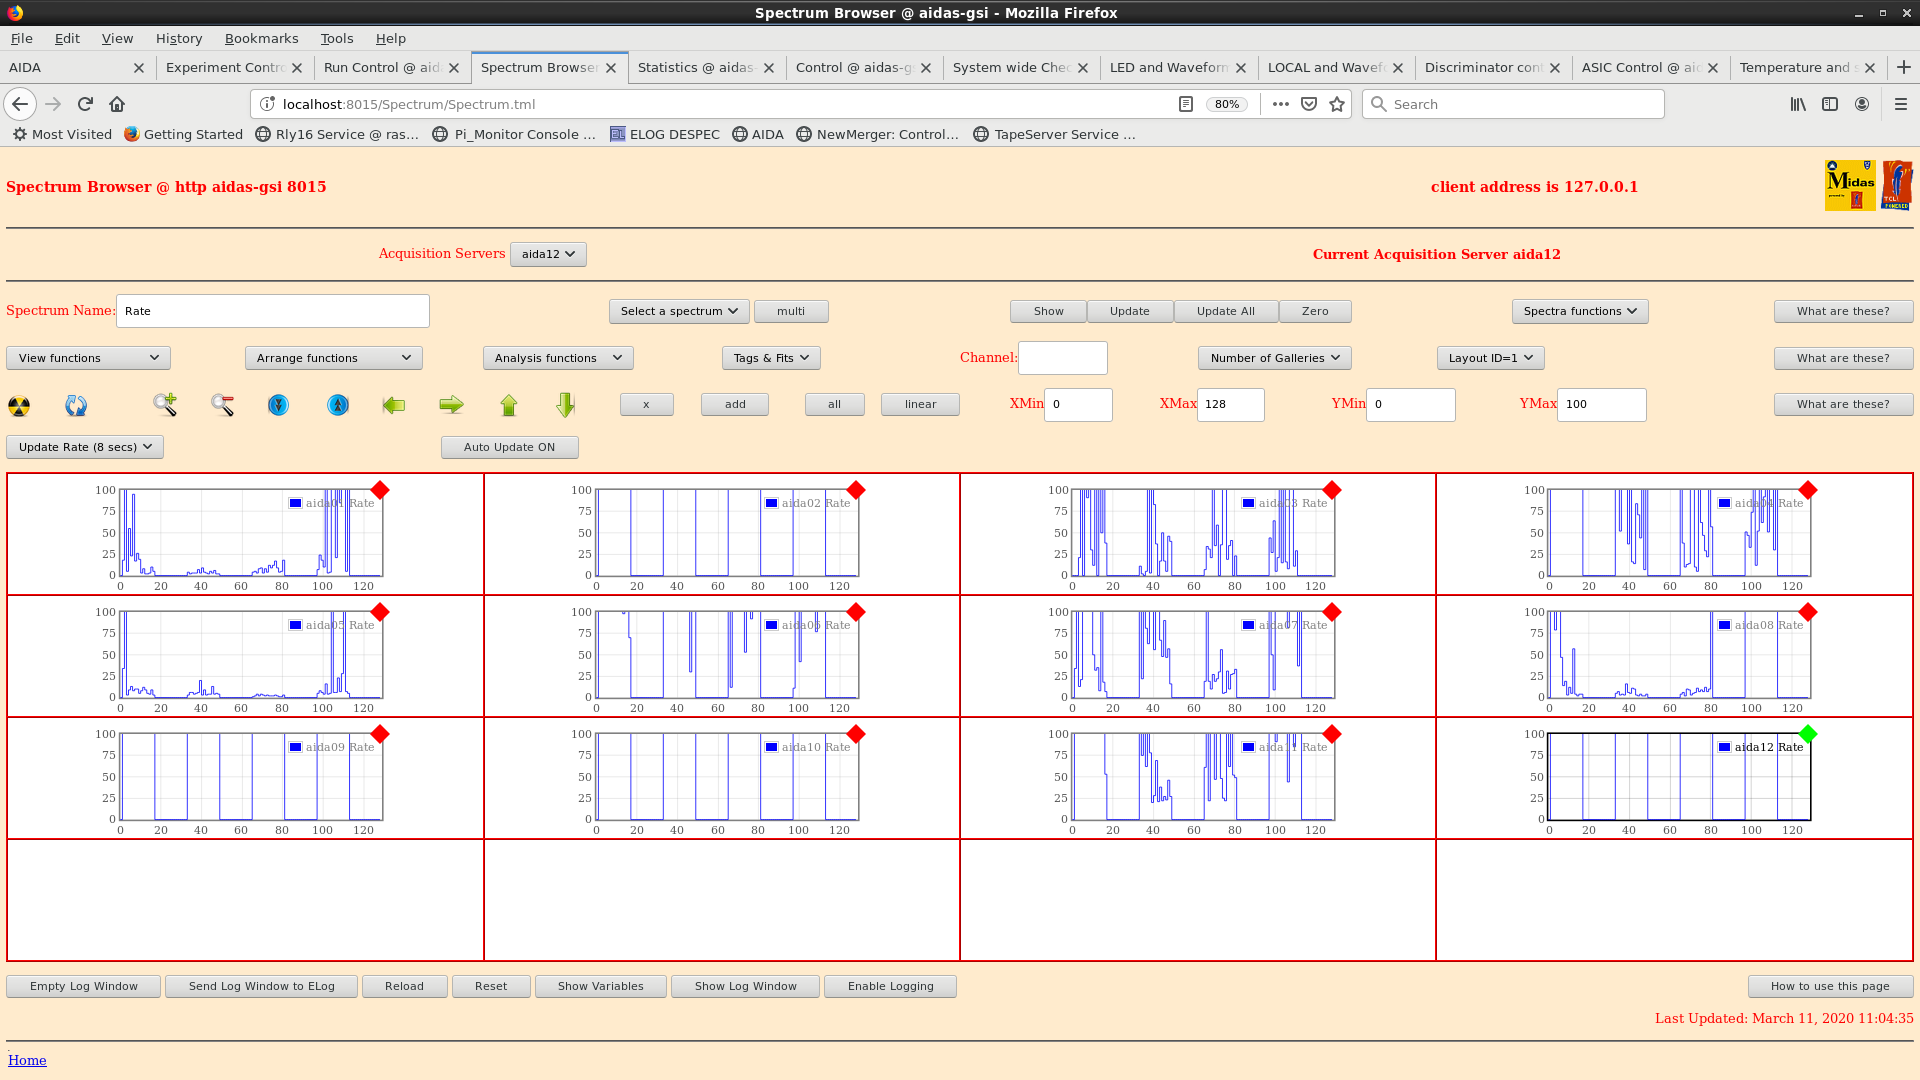
|
| Attachment 33: R6_1001
|
*** TDR format 3.3.0 analyser - TD - January 2019
*** ERROR: READ I/O error: 5002
blocks: 32000
ADC data format: 87080536 ( 1162937.9 Hz)
Other data format: 174903340 ( 2335788.5 Hz)
Sample trace data format: 0 ( 0.0 Hz)
Undefined format: 0 ( 0.0 Hz)
Other data format type: PAUSE: 31 ( 0.4 Hz)
RESUME: 31 ( 0.4 Hz)
SYNC100: 87327938 ( 1166241.9 Hz)
WR48-63: 87327938 ( 1166241.9 Hz)
FEE64 disc: 247402 ( 3304.0 Hz)
MBS info: 0 ( 0.0 Hz)
Other info: 0 ( 0.0 Hz)
ADC data range bit set: 73144 ( 976.8 Hz)
Timewarps: ADC: 0 ( 0.0 Hz)
PAUSE: 0 ( 0.0 Hz)
RESUME: 0 ( 0.0 Hz)
SYNC100: 0 ( 0.0 Hz)
WR48-63: 0 ( 0.0 Hz)
FEE64 disc: 0 ( 0.0 Hz)
MBS info: 0 ( 0.0 Hz)
Undefined: 0 ( 0.0 Hz)
Sample trace: 0 ( 0.0 Hz)
*** Timestamp elapsed time: 74.880 s
FEE elapsed dead time(s) elapsed idle time(s)
1 0.000 0.000
2 0.000 0.000
3 0.144 0.000
4 0.000 0.000
5 0.033 0.000
6 0.000 0.000
7 0.033 0.000
8 4.160 3.444
9 0.111 0.000
10 0.116 0.000
11 0.111 0.000
12 0.000 0.000
13 0.000 0.000
14 0.000 0.000
15 0.000 0.000
16 0.000 0.000
17 0.000 0.000
18 0.000 0.000
19 0.000 0.000
20 0.000 0.000
21 0.000 0.000
22 0.000 0.000
23 0.000 0.000
24 0.000 0.000
25 0.000 0.000
26 0.000 0.000
27 0.000 0.000
28 0.000 0.000
29 0.000 0.000
30 0.000 0.000
31 0.000 0.000
32 0.000 0.000
*** Statistics
FEE ADC Data Other Data Sample Undefined Pause Resume SYNC100 WR48-63 Disc MBS Other HEC Data
0 2537909 5321817 0 0 1 1 2619908 2619908 81999 0 0 13572
1 12374388 24792837 0 0 0 0 12389075 12389075 14687 0 0 7144
2 5995747 12118373 0 0 0 0 6038040 6038040 42293 0 0 8968
3 3245929 6571235 0 0 3 3 3272386 3272386 26457 0 0 13205
4 1018810 2094536 0 0 0 0 1037782 1037782 18972 0 0 5843
5 3175371 6374045 0 0 1 1 3183138 3183138 7767 0 0 3654
6 1851746 3764473 0 0 0 0 1872073 1872073 20327 0 0 9037
7 2503081 5045008 0 0 1 1 2516029 2516029 12948 0 0 6580
8 19164914 38353829 0 0 20 20 19172901 19172901 7987 0 0 1389
9 15009332 30028700 0 0 2 2 15012676 15012676 3344 0 0 894
10 5573107 11166435 0 0 2 2 5579846 5579846 6739 0 0 1608
11 14630202 29272052 0 0 1 1 14634084 14634084 3882 0 0 1250
12 0 0 0 0 0 0 0 0 0 0 0 0
13 0 0 0 0 0 0 0 0 0 0 0 0
14 0 0 0 0 0 0 0 0 0 0 0 0
15 0 0 0 0 0 0 0 0 0 0 0 0
16 0 0 0 0 0 0 0 0 0 0 0 0
17 0 0 0 0 0 0 0 0 0 0 0 0
18 0 0 0 0 0 0 0 0 0 0 0 0
19 0 0 0 0 0 0 0 0 0 0 0 0
20 0 0 0 0 0 0 0 0 0 0 0 0
21 0 0 0 0 0 0 0 0 0 0 0 0
22 0 0 0 0 0 0 0 0 0 0 0 0
23 0 0 0 0 0 0 0 0 0 0 0 0
24 0 0 0 0 0 0 0 0 0 0 0 0
25 0 0 0 0 0 0 0 0 0 0 0 0
26 0 0 0 0 0 0 0 0 0 0 0 0
27 0 0 0 0 0 0 0 0 0 0 0 0
28 0 0 0 0 0 0 0 0 0 0 0 0
29 0 0 0 0 0 0 0 0 0 0 0 0
30 0 0 0 0 0 0 0 0 0 0 0 0
31 0 0 0 0 0 0 0 0 0 0 0 0
32 0 0 0 0 0 0 0 0 0 0 0 0
*** Timewarps
FEE ADC Pause Resume SYNC100 WR48-63 Disc MBS Undefined Samples
0 0 0 0 0 0 0 0 0 0
1 0 0 0 0 0 0 0 0 0
2 0 0 0 0 0 0 0 0 0
3 0 0 0 0 0 0 0 0 0
4 0 0 0 0 0 0 0 0 0
5 0 0 0 0 0 0 0 0 0
6 0 0 0 0 0 0 0 0 0
7 0 0 0 0 0 0 0 0 0
8 0 0 0 0 0 0 0 0 0
9 0 0 0 0 0 0 0 0 0
10 0 0 0 0 0 0 0 0 0
11 0 0 0 0 0 0 0 0 0
12 0 0 0 0 0 0 0 0 0
13 0 0 0 0 0 0 0 0 0
14 0 0 0 0 0 0 0 0 0
15 0 0 0 0 0 0 0 0 0
16 0 0 0 0 0 0 0 0 0
17 0 0 0 0 0 0 0 0 0
18 0 0 0 0 0 0 0 0 0
19 0 0 0 0 0 0 0 0 0
20 0 0 0 0 0 0 0 0 0
21 0 0 0 0 0 0 0 0 0
22 0 0 0 0 0 0 0 0 0
23 0 0 0 0 0 0 0 0 0
24 0 0 0 0 0 0 0 0 0
25 0 0 0 0 0 0 0 0 0
26 0 0 0 0 0 0 0 0 0
27 0 0 0 0 0 0 0 0 0
28 0 0 0 0 0 0 0 0 0
29 0 0 0 0 0 0 0 0 0
30 0 0 0 0 0 0 0 0 0
31 0 0 0 0 0 0 0 0 0
32 0 0 0 0 0 0 0 0 0
*** Program elapsed time:43185.973s ( 0.741 blocks/s, 0.046 Mb/s)
|
| Attachment 34: 200311_1219_feetemps.png
|
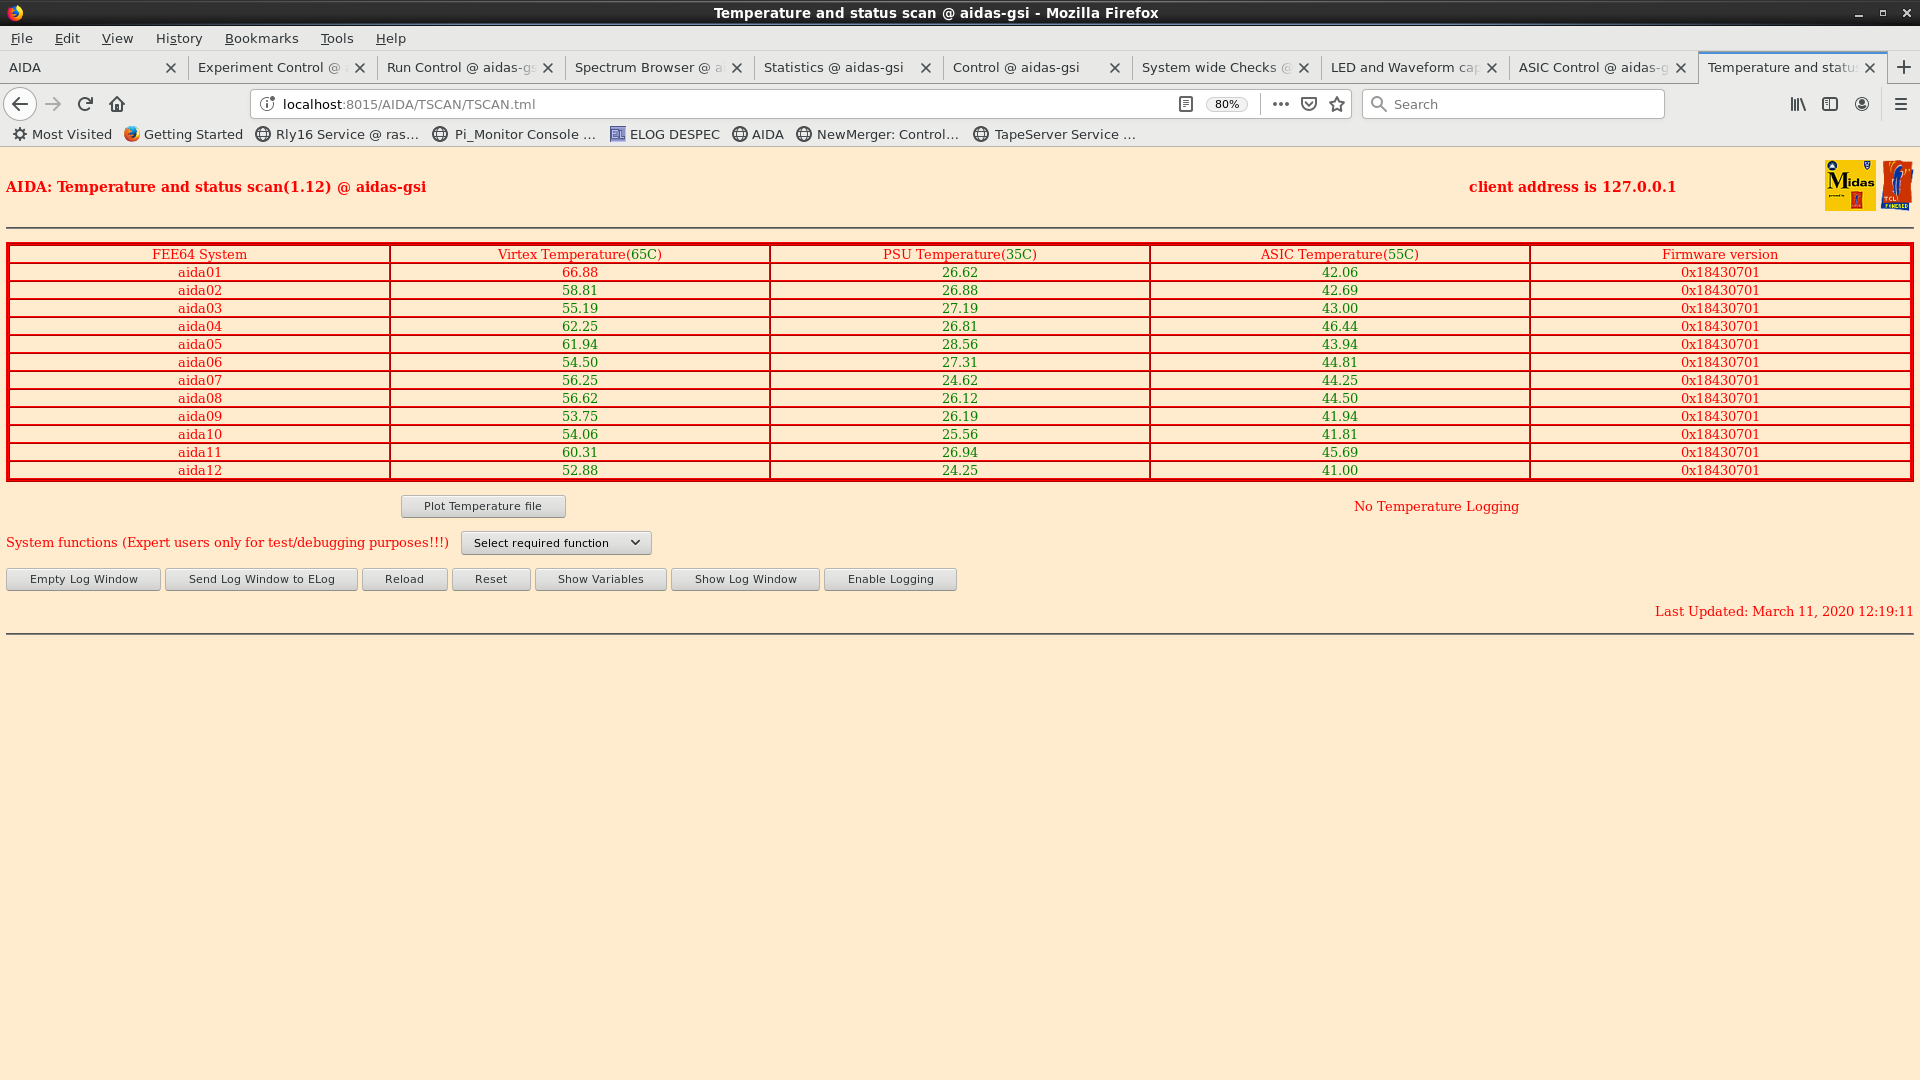
|
| Attachment 35: 200311_1221_leakcurrents.png
|
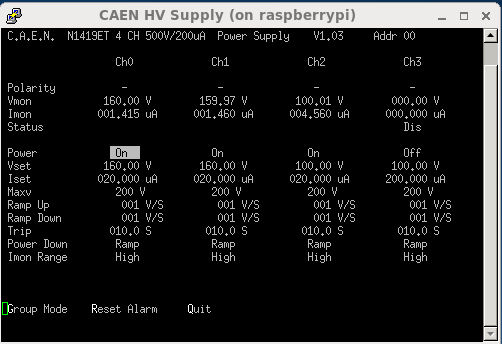
|
| Attachment 36: 200311_1220_goodevents.png
|

|
| Attachment 37: 200311_1300_rateshistogram.png
|

|
| Attachment 38: 200311_1440_FEETEMPS.png
|

|
| Attachment 39: 200311_1442_leakcurrents.png
|
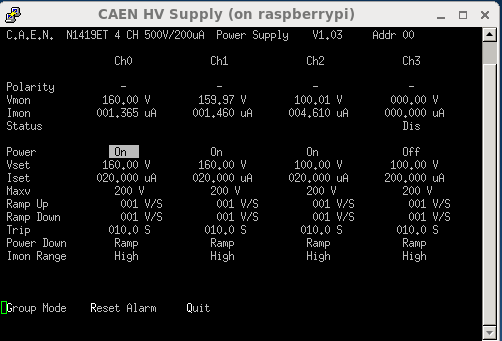
|
| Attachment 40: 200311_1442_GOODEVENTS.png
|

|
| Attachment 41: 200311_1638_temp.png
|

|
| Attachment 42: 200311_1639_bias.png
|
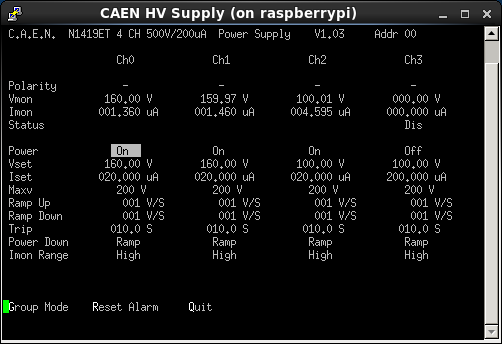
|
| Attachment 43: 200311_1639_stats.png
|

|
|
147
|
Thu Mar 12 23:44:48 2020 |
DK | PID Plots |
Labelled PID plots.  Note that the A/Q calibration is shifted by +0.02 units, and Z calibration is offset by about +5.

There was an error in the printouts for Cd isotopes, but the below attachments are corrected.

The Z-depth (color, not nuclear charge) is log scale. |
| Attachment 1: pid.png
|
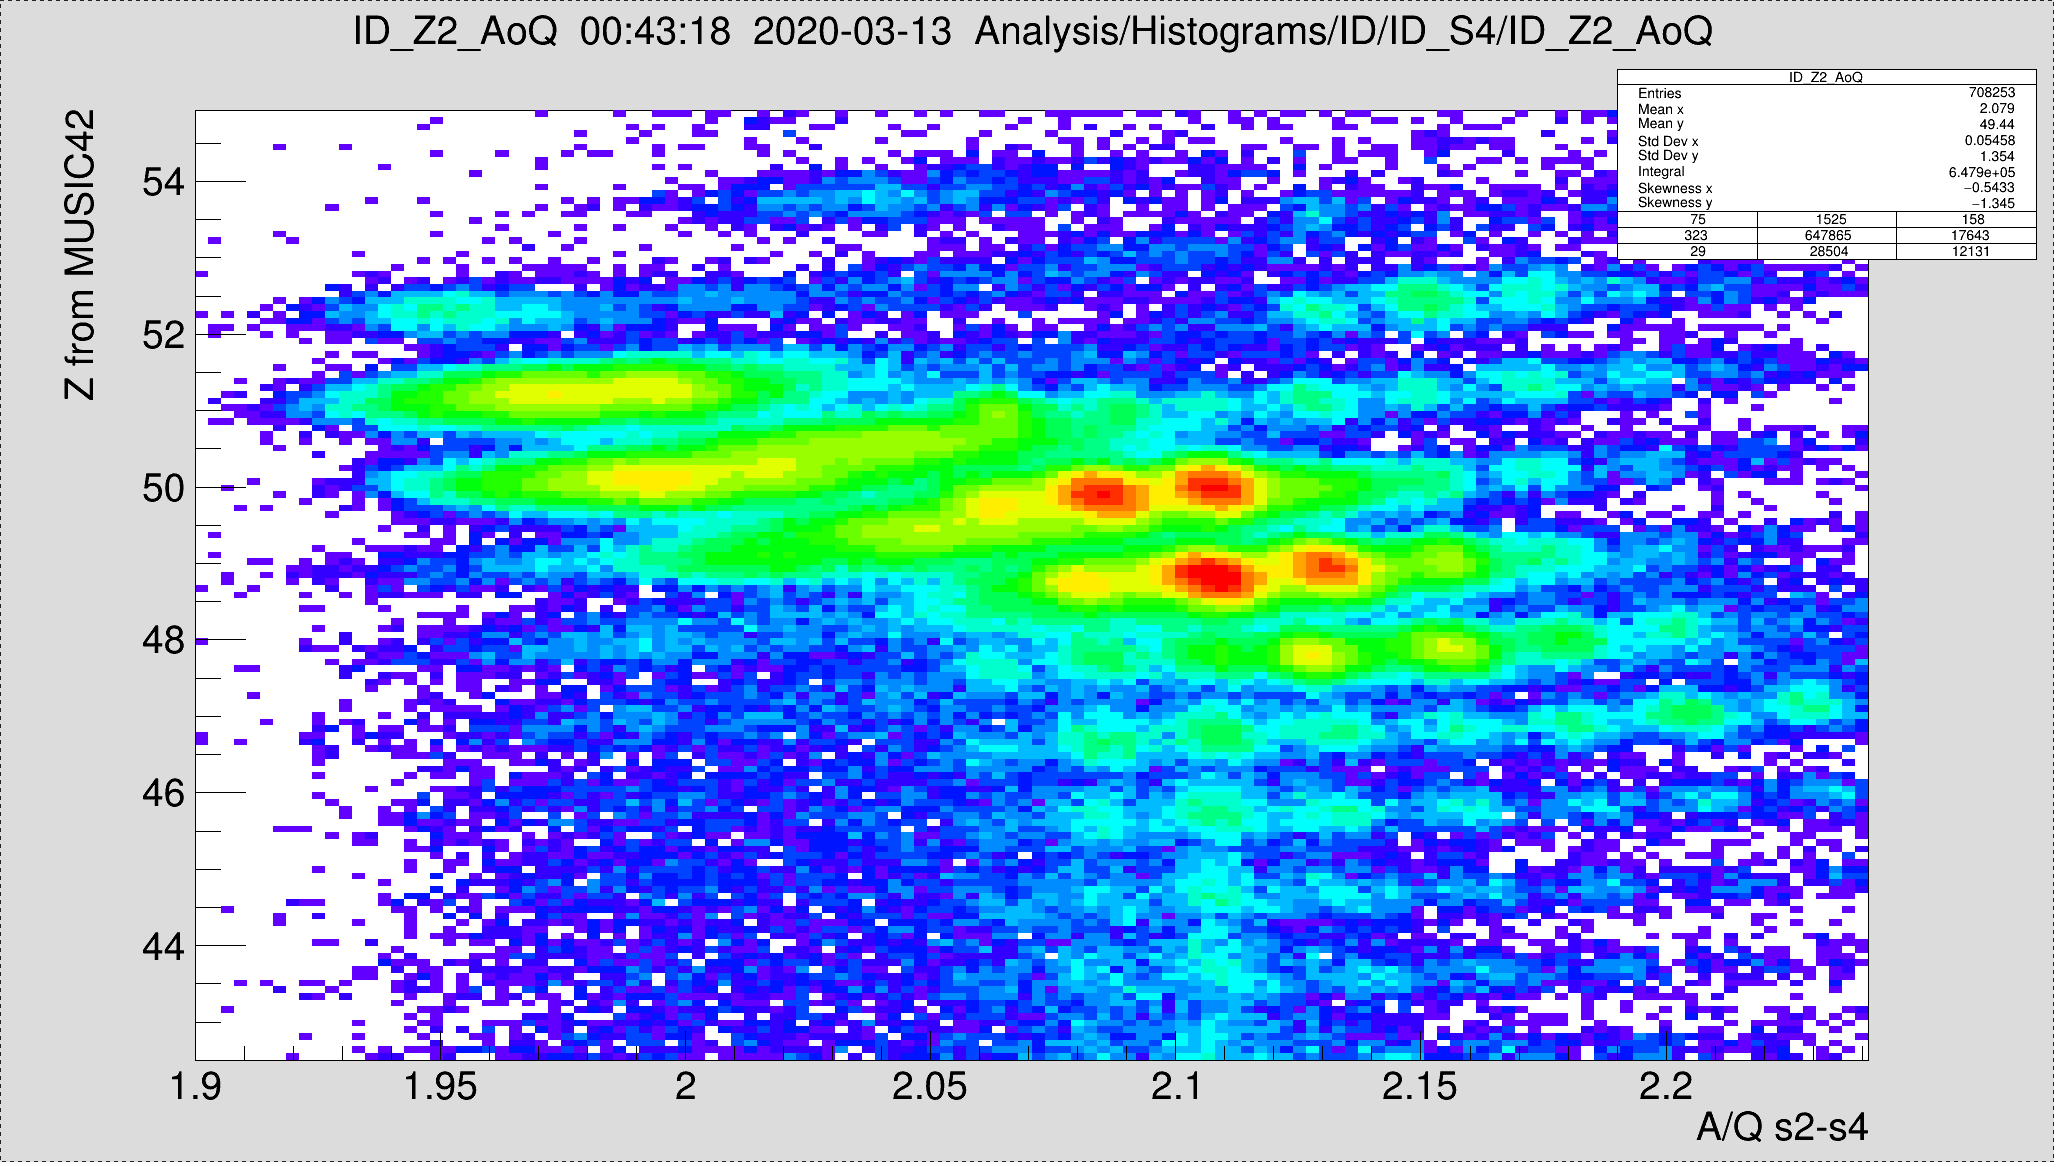
|
| Attachment 2: pid.png
|
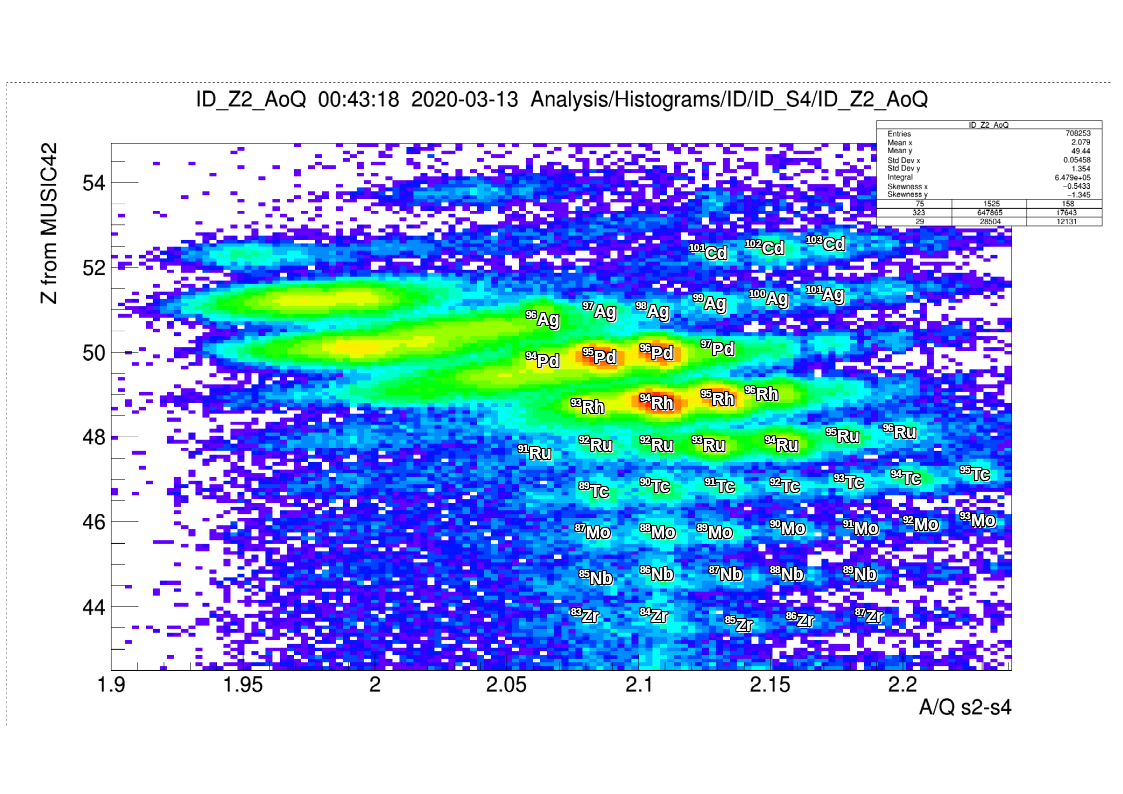
|
| Attachment 3: pid.pdf
|
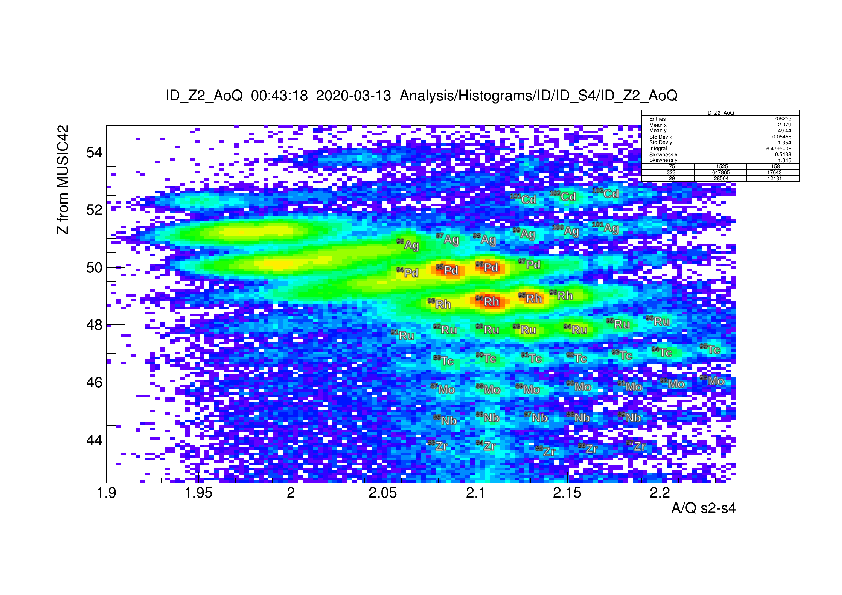
|
|
148
|
Fri Mar 13 08:01:53 2020 |
DK | Friday 13th 8:00 to 16:00 shift |
8:00 - See previous shift's elog entry.  All good.

9:00
    All system wide checks passed
    Merger okay, 3 Mega items / sec, all nnaida twinkle or stay lit
    Tape Server okay - 27 MB/s
    Histograms of implants look normal, about 5 counts per bin in SSD1 and SSD2 - see attachment #1
    Stats as usual - attachment #2
    Temps normal - attachment #3
    Biases and leaks fine -  attachment #4

Disk usage projection
    Space remaining: ~2 TB
    Fill rate: ~2 GB / 1 minute
    -> 1000 minutes =~ 17 hours

Still gzipping from R6_823

10:13 I noticed that the integer for the TapeServer UI feedbackk has been exceeded.
     	Kbytes Written:  -1986382400	Kbytes/sec:  26816
        Rate is fixed at that value on update.
        However, actual data files are being updated so data has been coming.
        DK and NH consulted and believe the situation is fine.
        We agreed next time the DESPEC team closes a run and starts a new one, they inform DK so he can restart the TapeServer for posterity and peace of mind.

10:25 Now we are on R10 after start and stop the TapeServer.  Problem is resolved.

11:30
      Implants: attachment #5
      Stats: attachment #6
      Biases / leaks: attachment #7
      Temps: attachment #8
System wide checks performed, situation normal. |
| Attachment 1: daid-13-histosA.png
|
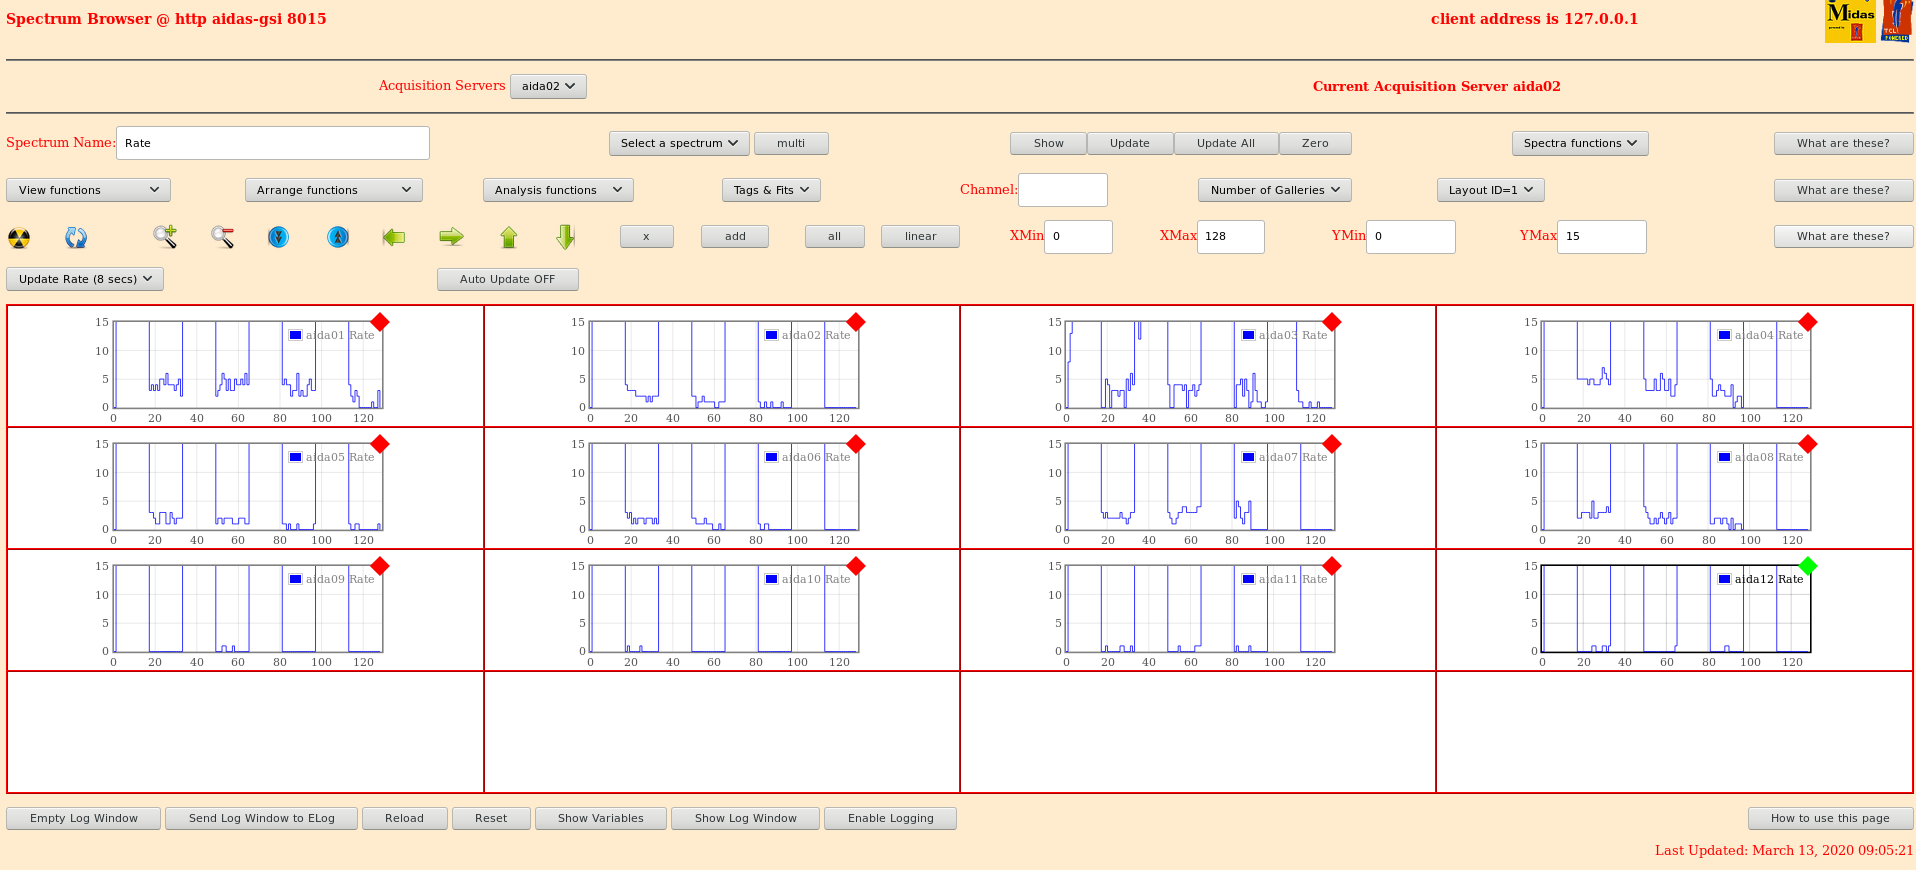
|
| Attachment 2: daid-13-statsA.png
|

|
| Attachment 3: daid-13-tempsA.png
|

|
| Attachment 4: daid-13-biasA.png
|
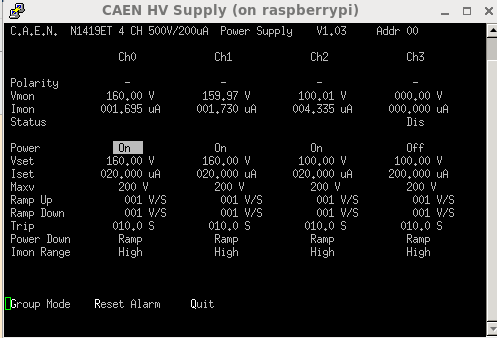
|
| Attachment 5: daid-13-implantsB.png
|

|
| Attachment 6: daid-13-statsB.png
|

|
| Attachment 7: daid-13-biasesB.png
|
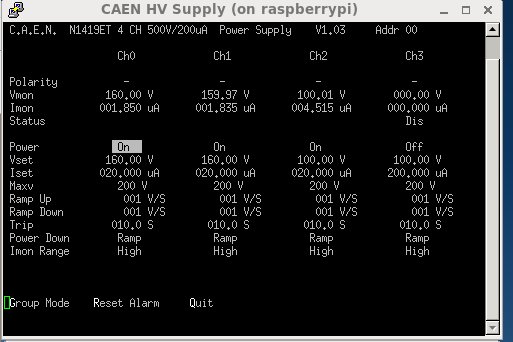
|
| Attachment 8: daid-13-tempsB.png
|

|
|
236
|
Sat Apr 17 19:39:56 2021 |
DJ, TD | Saturday 17 April 20.00-00.00 |
19.37 per FEE64 rate spectra - attachments 1 & 2
      1.8.L spectra - attachments 3 & 4
      1.8.H spectra - attachments 5-8
      1.8.W spectra - attachments 9 & 10

20.42 DAQ contrinues file NULL/R30_233


		 Base 		Current 	Difference
aida05 fault 	 0x1a52 : 	 0x1a55 : 	 3
aida06 fault 	 0x4f3e : 	 0x4f41 : 	 3
aida07 fault 	 0x3bcd : 	 0x3bd7 : 	 10
aida08 fault 	 0xc7c7 : 	 0xc7ca : 	 3
White Rabbit error counter test result: Passed 8, Failed 4

Understand the status reports as follows:-
Status bit 3 : White Rabbit decoder detected an error in the received data
Status bit 2 : Firmware registered WR error, no reload of Timestamp
Status bit 0 : White Rabbit decoder reports uncertain of Timestamp information from WR


			 Base 		Current 		Difference
aida09 fault 	 0x0 : 	 0x1 : 	 1
aida12 fault 	 0x0 : 	 0x4 : 	 4
FPGA Timestamp error counter test result: Passed 10, Failed 2
If any of these counts are reported as in error
The ASIC readout system has detected a timeslip.
That is the timestamp read from the time FIFO is not younger than the last

-------
23:48
Clock status test result: Passed 12, Failed 0

Understand status as follows
Status bit 3 : firmware PLL that creates clocks from external clock not locked
Status bit 2 : always logic '1'
Status bit 1 : LMK3200(2) PLL and clock distribution chip not locked to external clock
Status bit 0 : LMK3200(1) PLL and clock distribution chip not locked to external clock
If all these bits are not set then the operation of the firmware is unreliable


FEE64 module aida06 failed
FEE64 module aida07 failed
FEE64 module aida10 failed
Calibration test result: Passed 9, Failed 3

If any modules fail calibration , check the clock status and open the FADC Align and Control browser page to rerun calibration for that module


		 Base 		Current 	Difference
aida05 fault 	 0x1a52 : 	 0x1a55 : 	 3
aida06 fault 	 0x4f3e : 	 0x4f41 : 	 3
aida07 fault 	 0x3bcd : 	 0x3bde : 	 17
aida08 fault 	 0xc7c7 : 	 0xc7ca : 	 3
White Rabbit error counter test result: Passed 8, Failed 4

Understand the status reports as follows:-
Status bit 3 : White Rabbit decoder detected an error in the received data
Status bit 2 : Firmware registered WR error, no reload of Timestamp
Status bit 0 : White Rabbit decoder reports uncertain of Timestamp information from WR


			 Base 		Current 		Difference
aida09 fault 	 0x0 : 	 0x1 : 	 1
aida12 fault 	 0x0 : 	 0x7 : 	 7
FPGA Timestamp error counter test result: Passed 10, Failed 2
If any of these counts are reported as in error
The ASIC readout system has detected a timeslip.
That is the timestamp read from the time FIFO is not younger than the last

Returned 0 0 0 0 0 0 0 0 0 0 0 0
Mem(KB) :	4	8	16	32	64	128	256	512	1k	2k	4k
aida01 :     26      5      6      2      1      3      1      3      3      3      6   : 36336
aida02 :      7      9     10      3      2      2      2      4      2      3      6   : 36068
aida03 :     26      7      8      4      3      4      2      4      2      3      6   : 36448
aida04 :     18      8      2      1      2      2      3      4      2      3      6   : 36168
aida05 :     24      7      9      4      3      1      3      2      2      4      6   : 37352
aida06 :     17     10      3      1      3      5      1      3      3      3      6   : 36644
aida07 :      7     11      2      2      3      2      3      2      4      3      6   : 37268
aida08 :     23      4      1      5      1      1      2      3      3      3      6   : 36332
aida09 :     14      6      3      2      1      3      2      3      3      3      6   : 36504
aida10 :      2      2      2      2      1      2      2      2      3      3      6   : 35768
aida11 :      2      2      1      2      2      2      2      4      2      3      6   : 35816
aida12 :     26      8      5      5      4      3      1      3      3      3      6   : 36632
---- |
| Attachment 1: Screenshot_2021-04-17_Spectrum_Browser_aidas-gsi.png
|
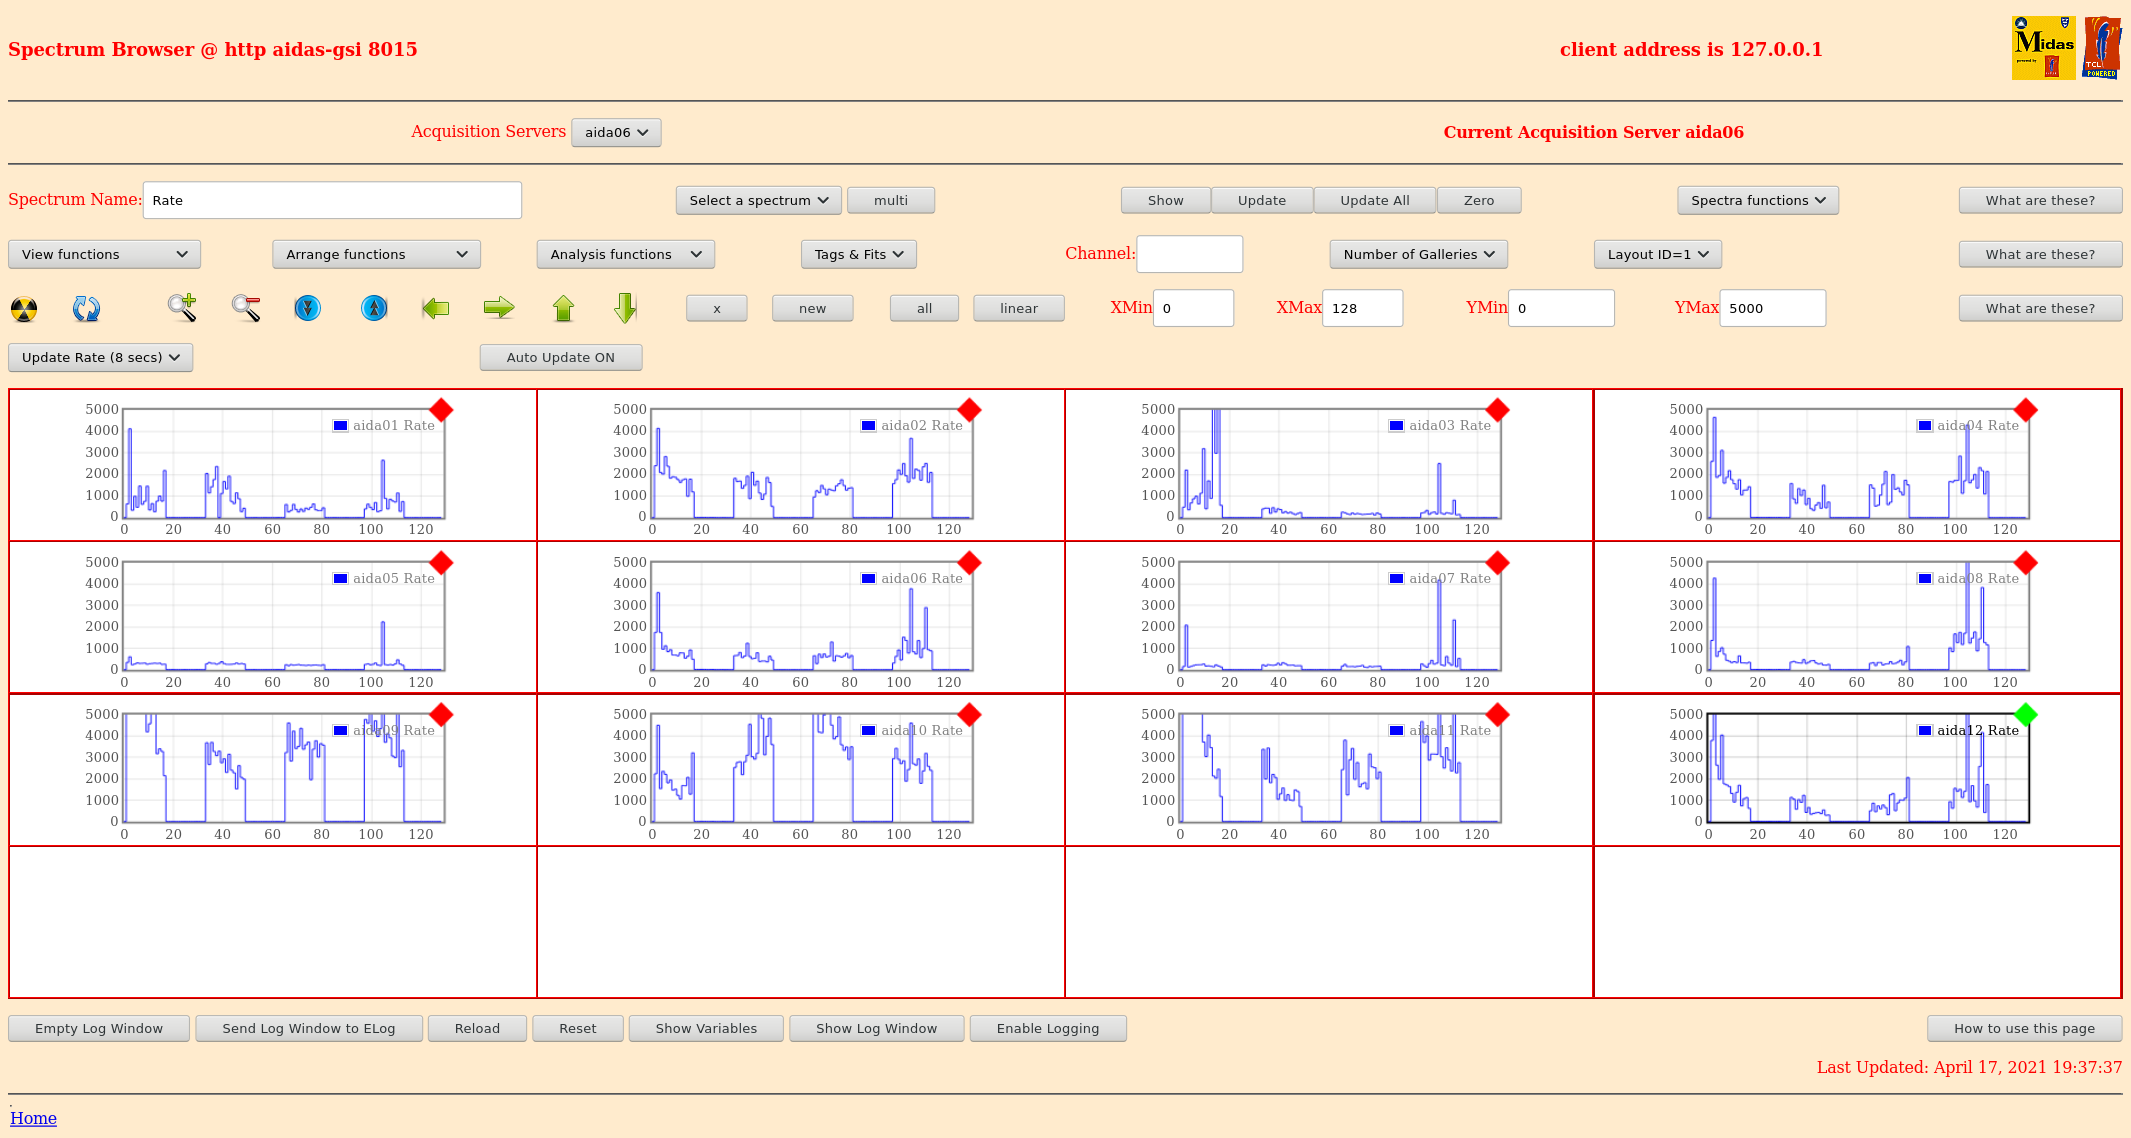
|
| Attachment 2: Screenshot_2021-04-17_Spectrum_Browser_aidas-gsi(1).png
|
.png.png)
|
| Attachment 3: Screenshot_2021-04-17_Spectrum_Browser_aidas-gsi(2).png
|
.png.png)
|
| Attachment 4: Screenshot_2021-04-17_Spectrum_Browser_aidas-gsi(3).png
|
.png.png)
|
| Attachment 5: Screenshot_2021-04-17_Spectrum_Browser_aidas-gsi(4).png
|
.png.png)
|
| Attachment 6: Screenshot_2021-04-17_Spectrum_Browser_aidas-gsi(5).png
|
.png.png)
|
| Attachment 7: Screenshot_2021-04-17_Spectrum_Browser_aidas-gsi(6).png
|
.png.png)
|
| Attachment 8: Screenshot_2021-04-17_Spectrum_Browser_aidas-gsi(7).png
|
.png.png)
|
| Attachment 9: Screenshot_2021-04-17_Spectrum_Browser_aidas-gsi(8).png
|
.png.png)
|
| Attachment 10: Screenshot_2021-04-17_Statistics_aidas-gsi(4).png
|
.png.png)
|
| Attachment 11: Screenshot_2021-04-17_Temperature_and_status_scan_aidas-gsi(4).png
|
.png.png)
|
| Attachment 12: 50.png
|

|
| Attachment 13: 51.png
|
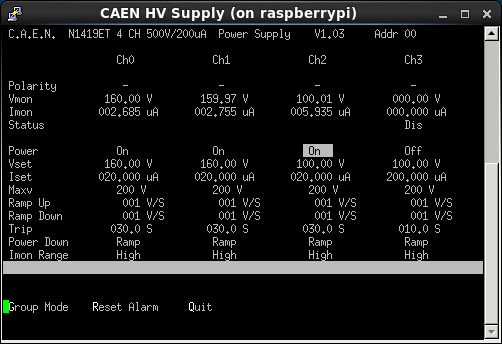
|
|
238
|
Sun Apr 18 07:30:20 2021 |
DJ, TD | Sunday 18th April 08:00-12:00 |
---- 09-26
FEE64 module aida06 failed
FEE64 module aida07 failed
FEE64 module aida10 failed
Calibration test result: Passed 9, Failed 3
If any modules fail calibration , check the clock status and open the FADC Align and Control browser page to rerun calibration for that module
---
Base Current Difference
aida01 fault 0x7685 : 0x7686 : 1
aida02 fault 0x941c : 0x941d : 1
aida03 fault 0x7cd6 : 0x7cd7 : 1
aida04 fault 0xb86c : 0xb86d : 1
aida05 fault 0x1a52 : 0x1a59 : 7
aida06 fault 0x4f3e : 0x4f45 : 7
aida07 fault 0x3bcd : 0x3bfc : 47
aida08 fault 0xc7c7 : 0xc7ce : 7
aida09 fault 0xb33a : 0xb33b : 1
White Rabbit error counter test result: Passed 3, Failed 9
Understand the status reports as follows:-
Status bit 3 : White Rabbit decoder detected an error in the received data
Status bit 2 : Firmware registered WR error, no reload of Timestamp
Status bit 0 : White Rabbit decoder reports uncertain of Timestamp information from WR
--
Base Current Difference
aida01 fault 0x7685 : 0x7686 : 1
aida02 fault 0x941c : 0x941d : 1
aida03 fault 0x7cd6 : 0x7cd7 : 1
aida04 fault 0xb86c : 0xb86d : 1
aida05 fault 0x1a52 : 0x1a59 : 7
aida06 fault 0x4f3e : 0x4f45 : 7
aida07 fault 0x3bcd : 0x3bfc : 47
aida08 fault 0xc7c7 : 0xc7ce : 7
aida09 fault 0xb33a : 0xb33b : 1
White Rabbit error counter test result: Passed 3, Failed 9
Understand the status reports as follows:-
Status bit 3 : White Rabbit decoder detected an error in the received data
Status bit 2 : Firmware registered WR error, no reload of Timestamp
Status bit 0 : White Rabbit decoder reports uncertain of Timestamp information from WR
-
Base Current Difference
aida01 fault 0x7685 : 0x7686 : 1
aida02 fault 0x941c : 0x941d : 1
aida03 fault 0x7cd6 : 0x7cd7 : 1
aida04 fault 0xb86c : 0xb86d : 1
aida05 fault 0x1a52 : 0x1a59 : 7
aida06 fault 0x4f3e : 0x4f45 : 7
aida07 fault 0x3bcd : 0x3bfc : 47
aida08 fault 0xc7c7 : 0xc7ce : 7
aida09 fault 0xb33a : 0xb33b : 1
White Rabbit error counter test result: Passed 3, Failed 9
Understand the status reports as follows:-
Status bit 3 : White Rabbit decoder detected an error in the received data
Status bit 2 : Firmware registered WR error, no reload of Timestamp
Status bit 0 : White Rabbit decoder reports uncertain of Timestamp information from WR
08.45 TD resets baseline for WR and FPGA errors
|
| Attachment 1: Screenshot_2021-04-18_Statistics_aidas-gsi.png
|
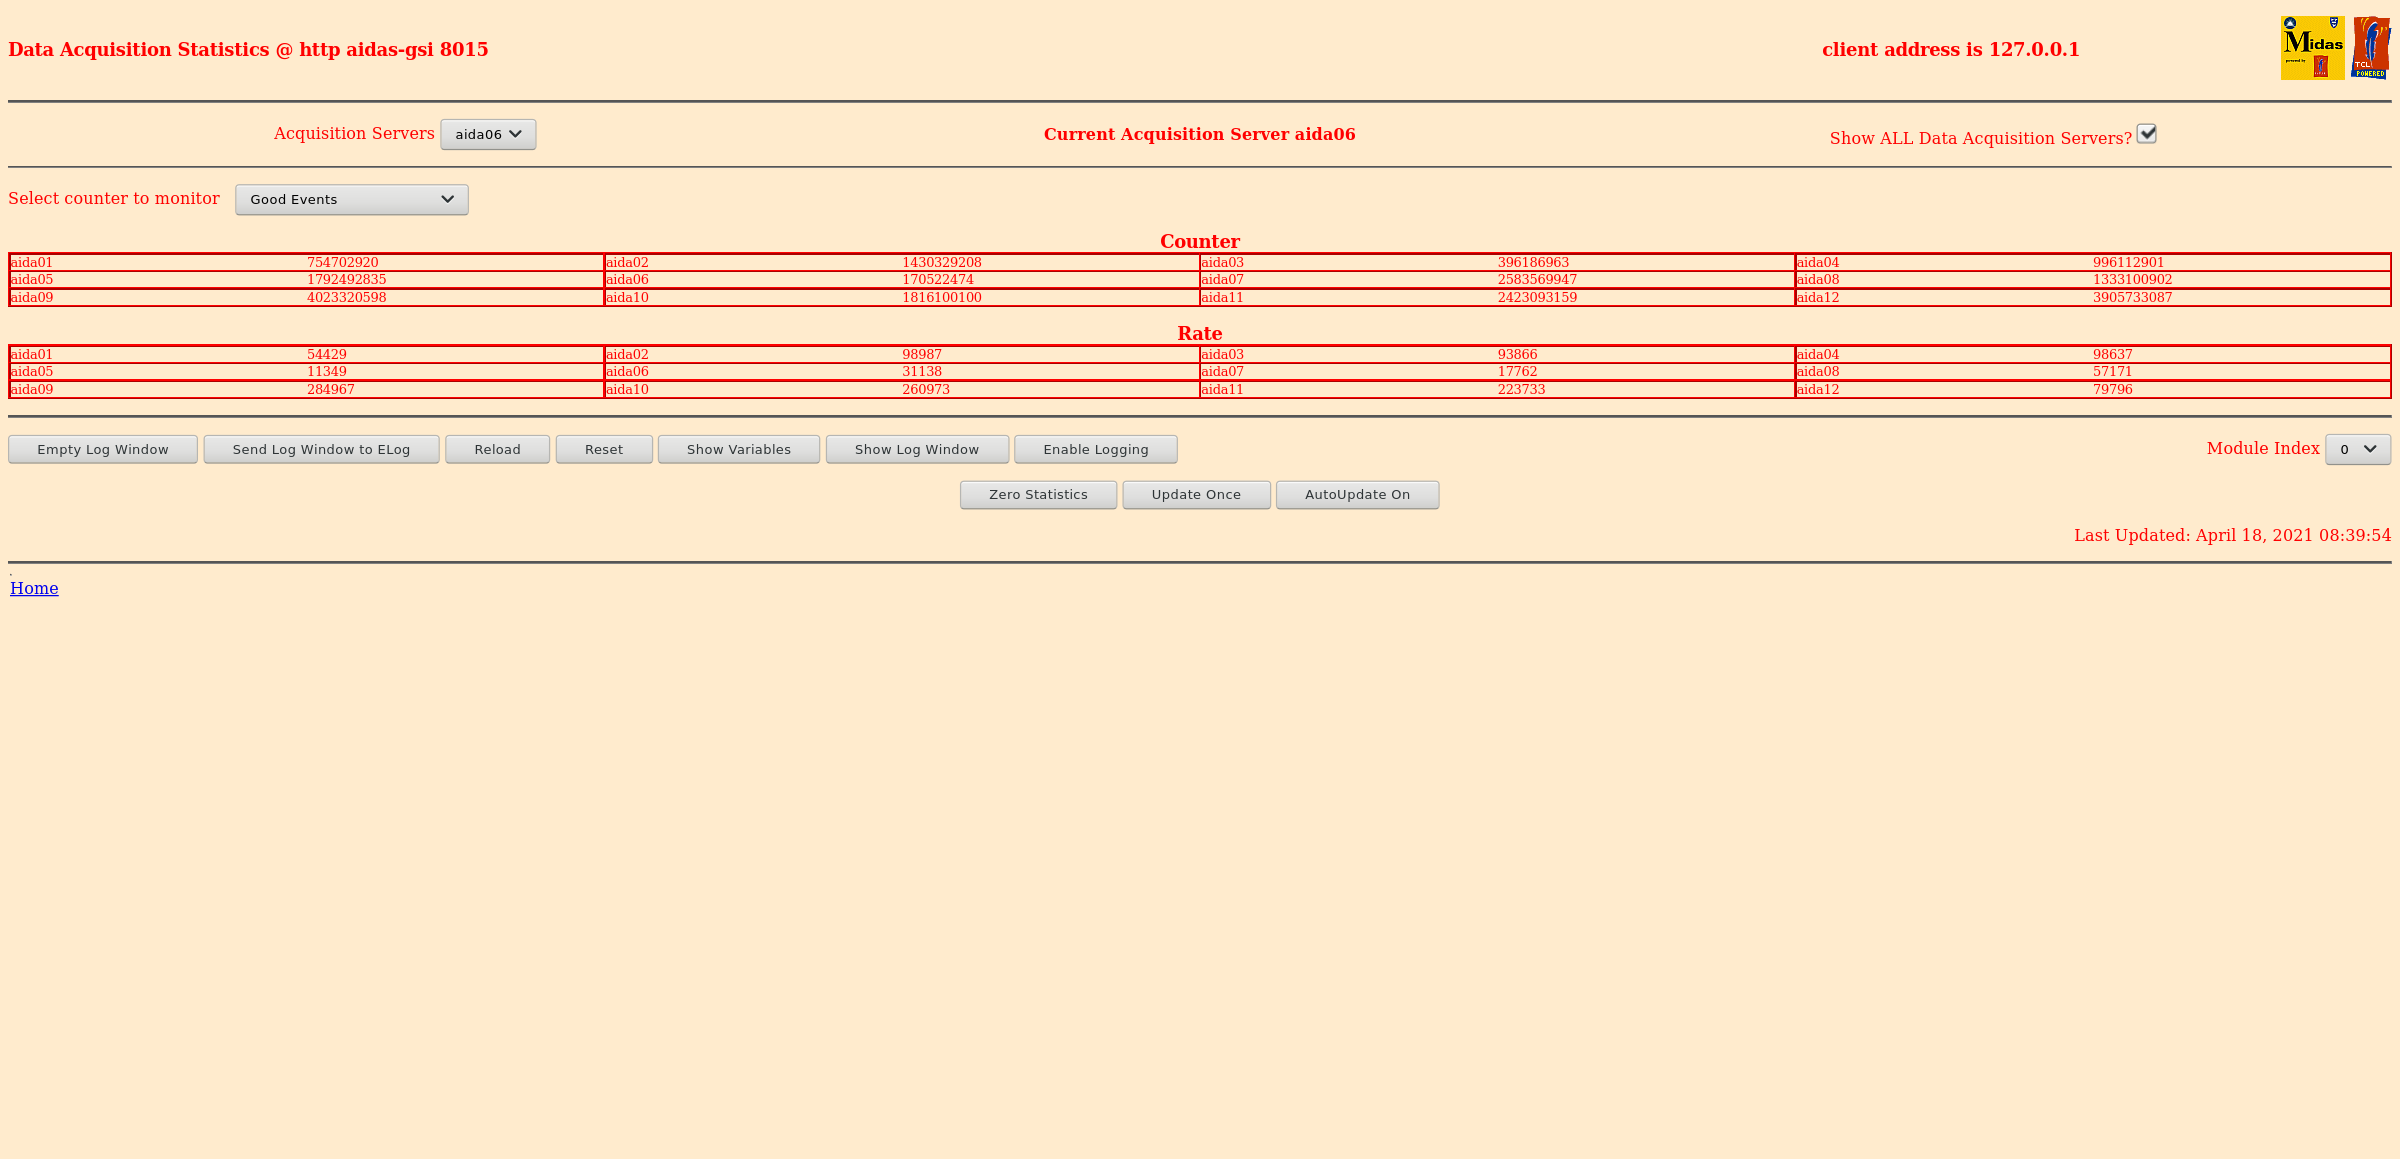
|
| Attachment 2: Screenshot_2021-04-18_Temperature_and_status_scan_aidas-gsi.png
|
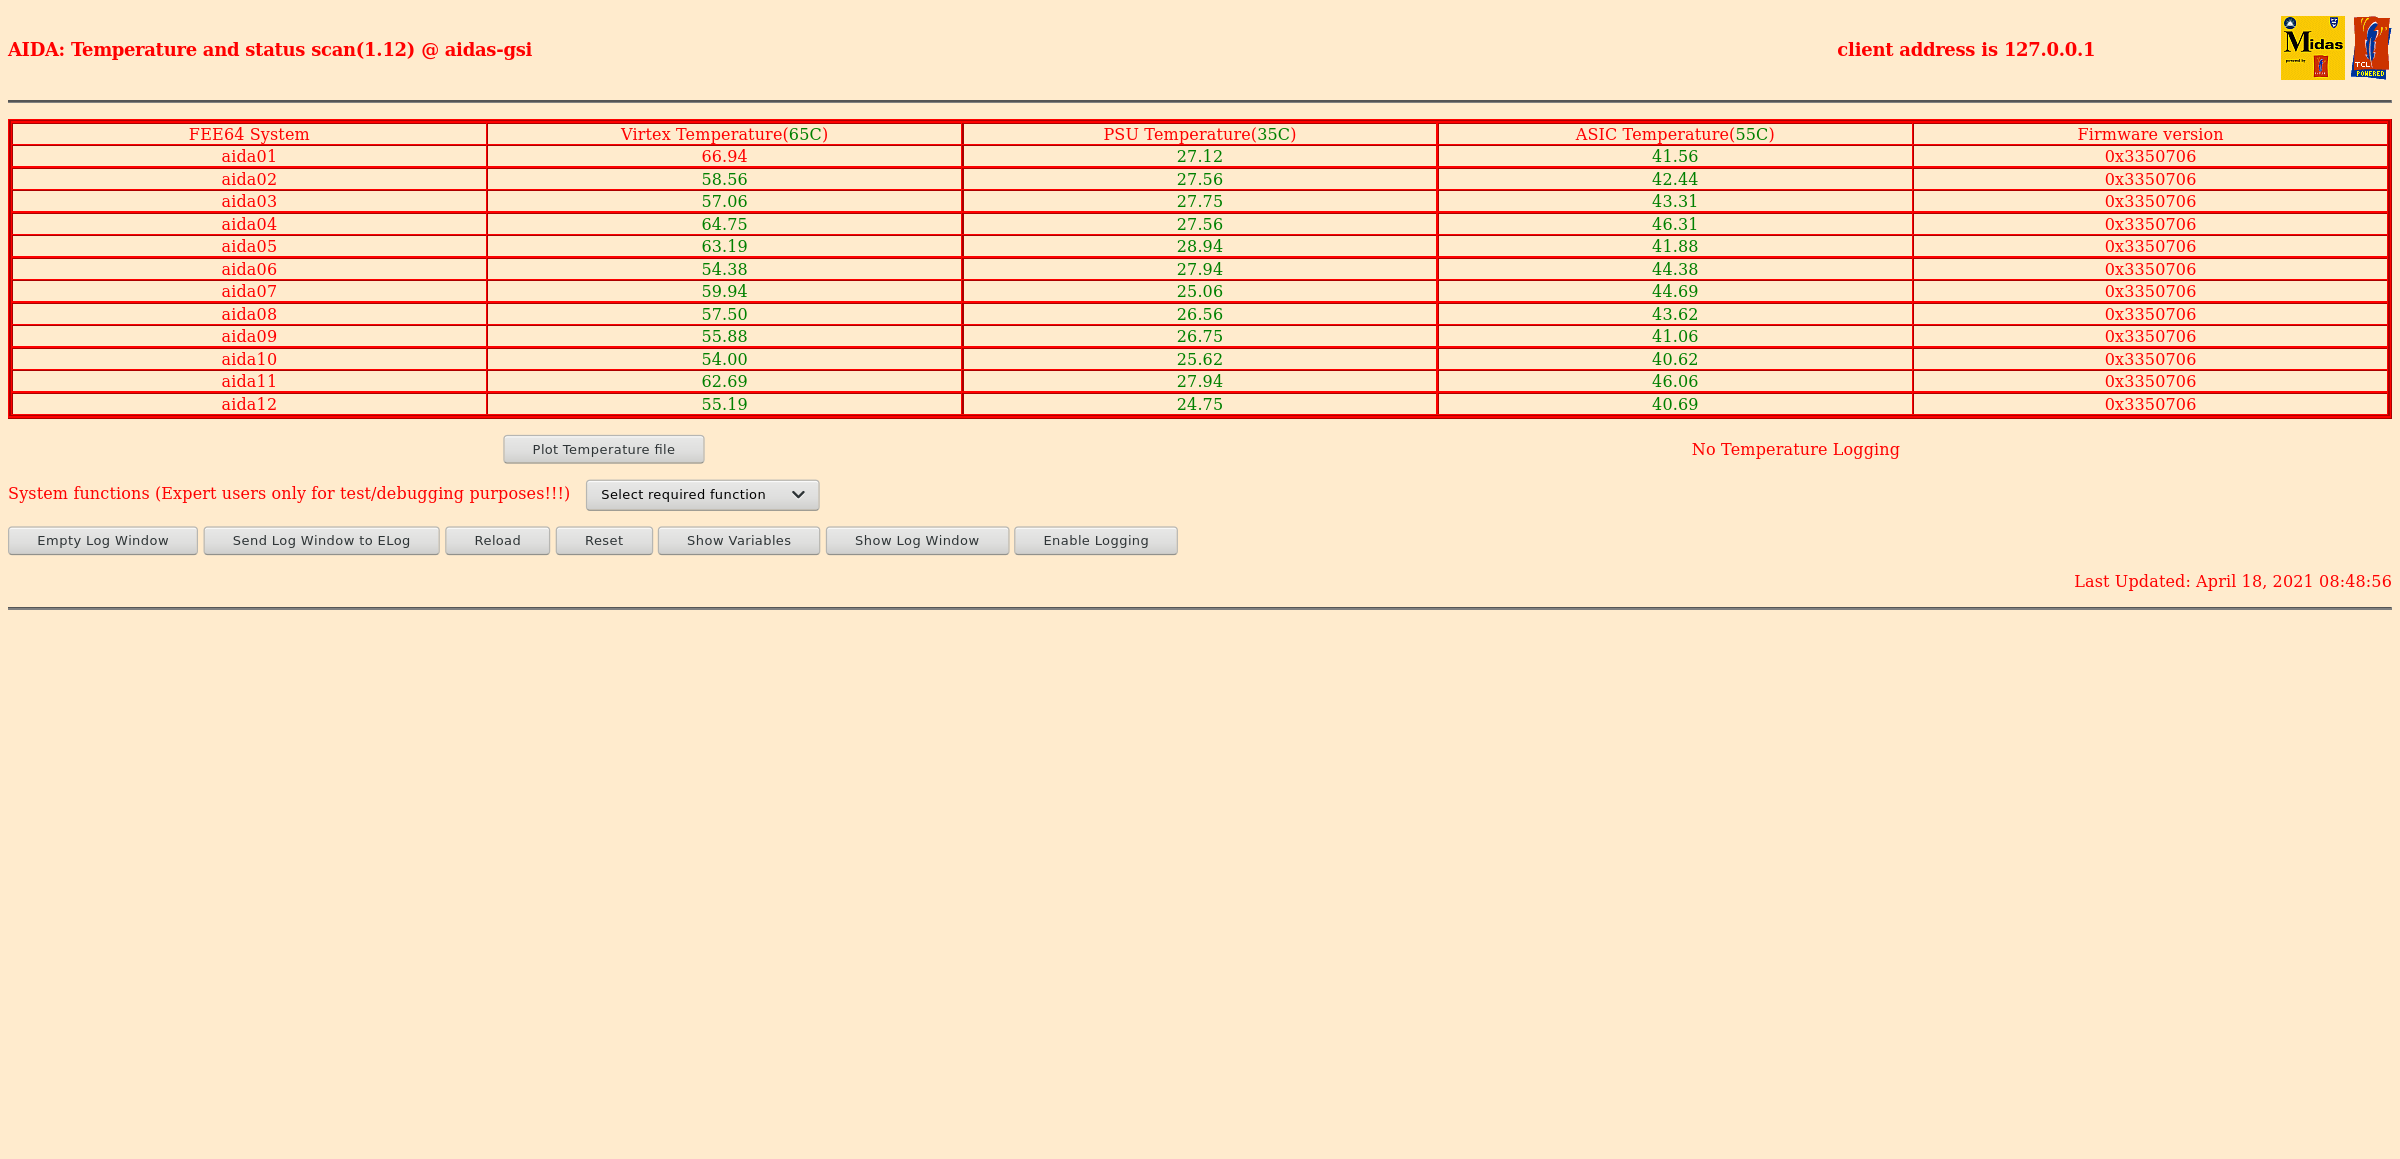
|
| Attachment 3: 52.png
|

|
| Attachment 4: 53.png
|
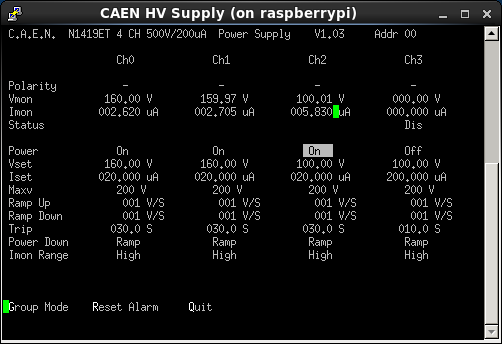
|
| Attachment 5: Screenshot_2021-04-18_Temperature_and_status_scan_aidas-gsi(1).png
|
.png.png)
|
| Attachment 6: 54.png
|
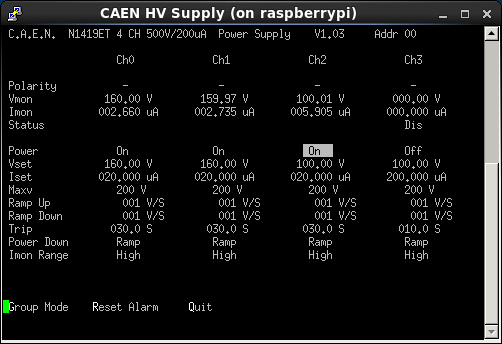
|
| Attachment 7: Screenshot_2021-04-18_Statistics_aidas-gsi(1).png
|
.png.png)
|
|
263
|
Thu Apr 22 23:17:46 2021 |
DJ | Friday 23rd April 00:00-08:00 |
Took over from TD ... All is well.
00:45 System Wide Checks
Clock: 12 passed, 0 failed.
ADC Calibration: Passed 12, 0 failed.
White Rabbit Decoder: Passed 4,failed 8. - See screenshot.
FPGA Passed 11, failed 1. - See screenshot.
FEE64 Linux: See screenshot.
-----
02:49 run closed. Checking beam.
03:00 File 55 opened.
03:13:23 DAQ crashed due to AIDA02 rebooting. TD restarted DAQ. Ready at approx 04:00.
File 56 opened at 4:24.
---------
04:30 System Wide Checks (See screenshots)
White Rabbit Decoder: Passed 12, failed 0.
FPGA: page not loading properly.
----
05:37 System wide checks. See screenshots
Clock: Status: 11 passed. 1 fail.
ADC calibration: Passed 9, failed 3.
White Rabbit decoder: Passed 12, failed 0.
-----
07:32 System wide checks (See screenshots).
|
| Attachment 1: Screenshot_2021-04-23_Statistics_aidas-gsi.png
|

|
| Attachment 2: Screenshot_2021-04-23_Temperature_and_status_scan_aidas-gsi.png
|
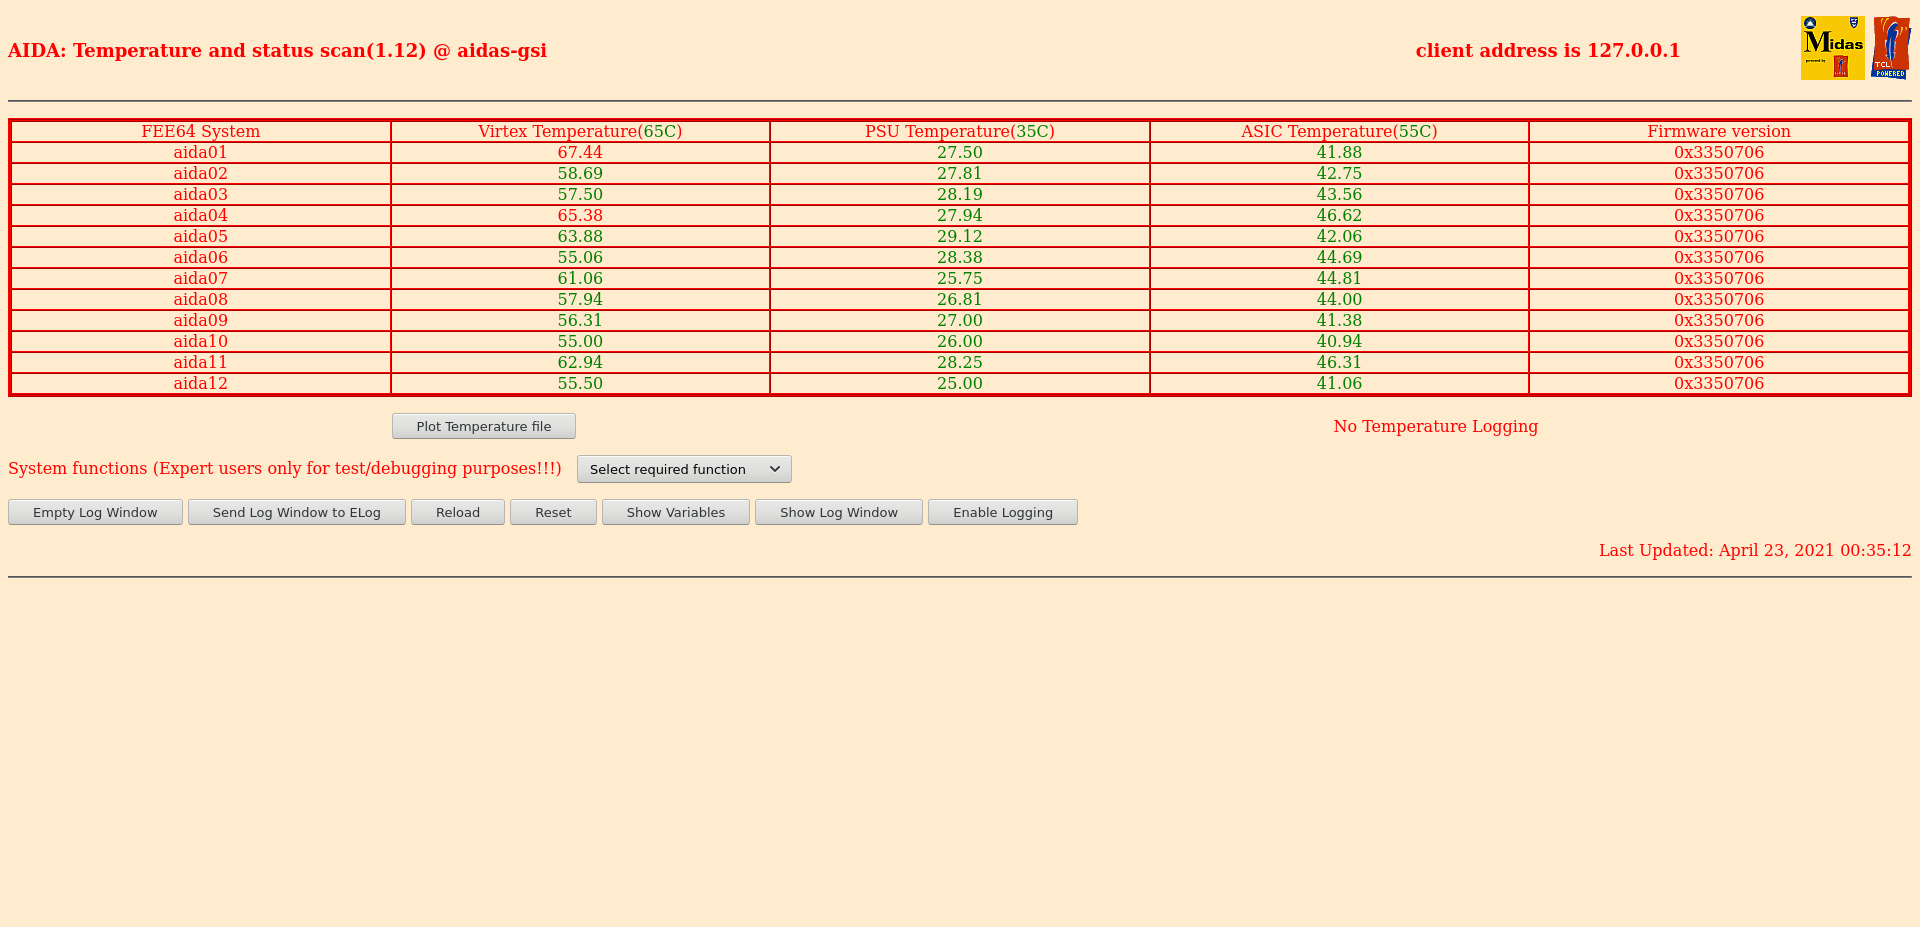
|
| Attachment 3: Screenshot-CAEN_HV_Supply.png
|

|
| Attachment 4: Screenshot_2021-04-23_System_wide_Checks_aidas-gsi.png
|
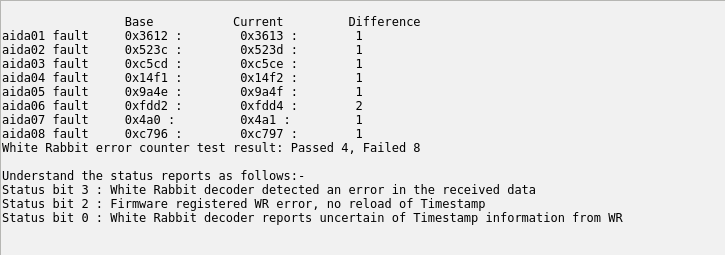
|
| Attachment 5: Screenshot_2021-04-23_System_wide_Checks_aidas-gsi(1).png
|
.png.png)
|
| Attachment 6: Screenshot_2021-04-23_System_wide_Checks_aidas-gsi(2).png
|
.png.png)
|
| Attachment 7: Screenshot_2021-04-23_Statistics_aidas-gsi(1).png
|
.png.png)
|
| Attachment 8: Screenshot_2021-04-23_Temperature_and_status_scan_aidas-gsi(1).png
|
.png.png)
|
| Attachment 9: 60.png
|

|
| Attachment 10: Screenshot_2021-04-23_System_wide_Checks_aidas-gsi(3).png
|
.png.png)
|
| Attachment 11: Screenshot_2021-04-23_System_wide_Checks_aidas-gsi(4).png
|
.png.png)
|
| Attachment 12: Screenshot_2021-04-23_System_wide_Checks_aidas-gsi(5).png
|
.png.png)
|
| Attachment 13: Screenshot_2021-04-23_Spectrum_Browser_aidas-gsi.png
|

|
| Attachment 14: Screenshot_2021-04-23_Spectrum_Browser_aidas-gsi.png
|
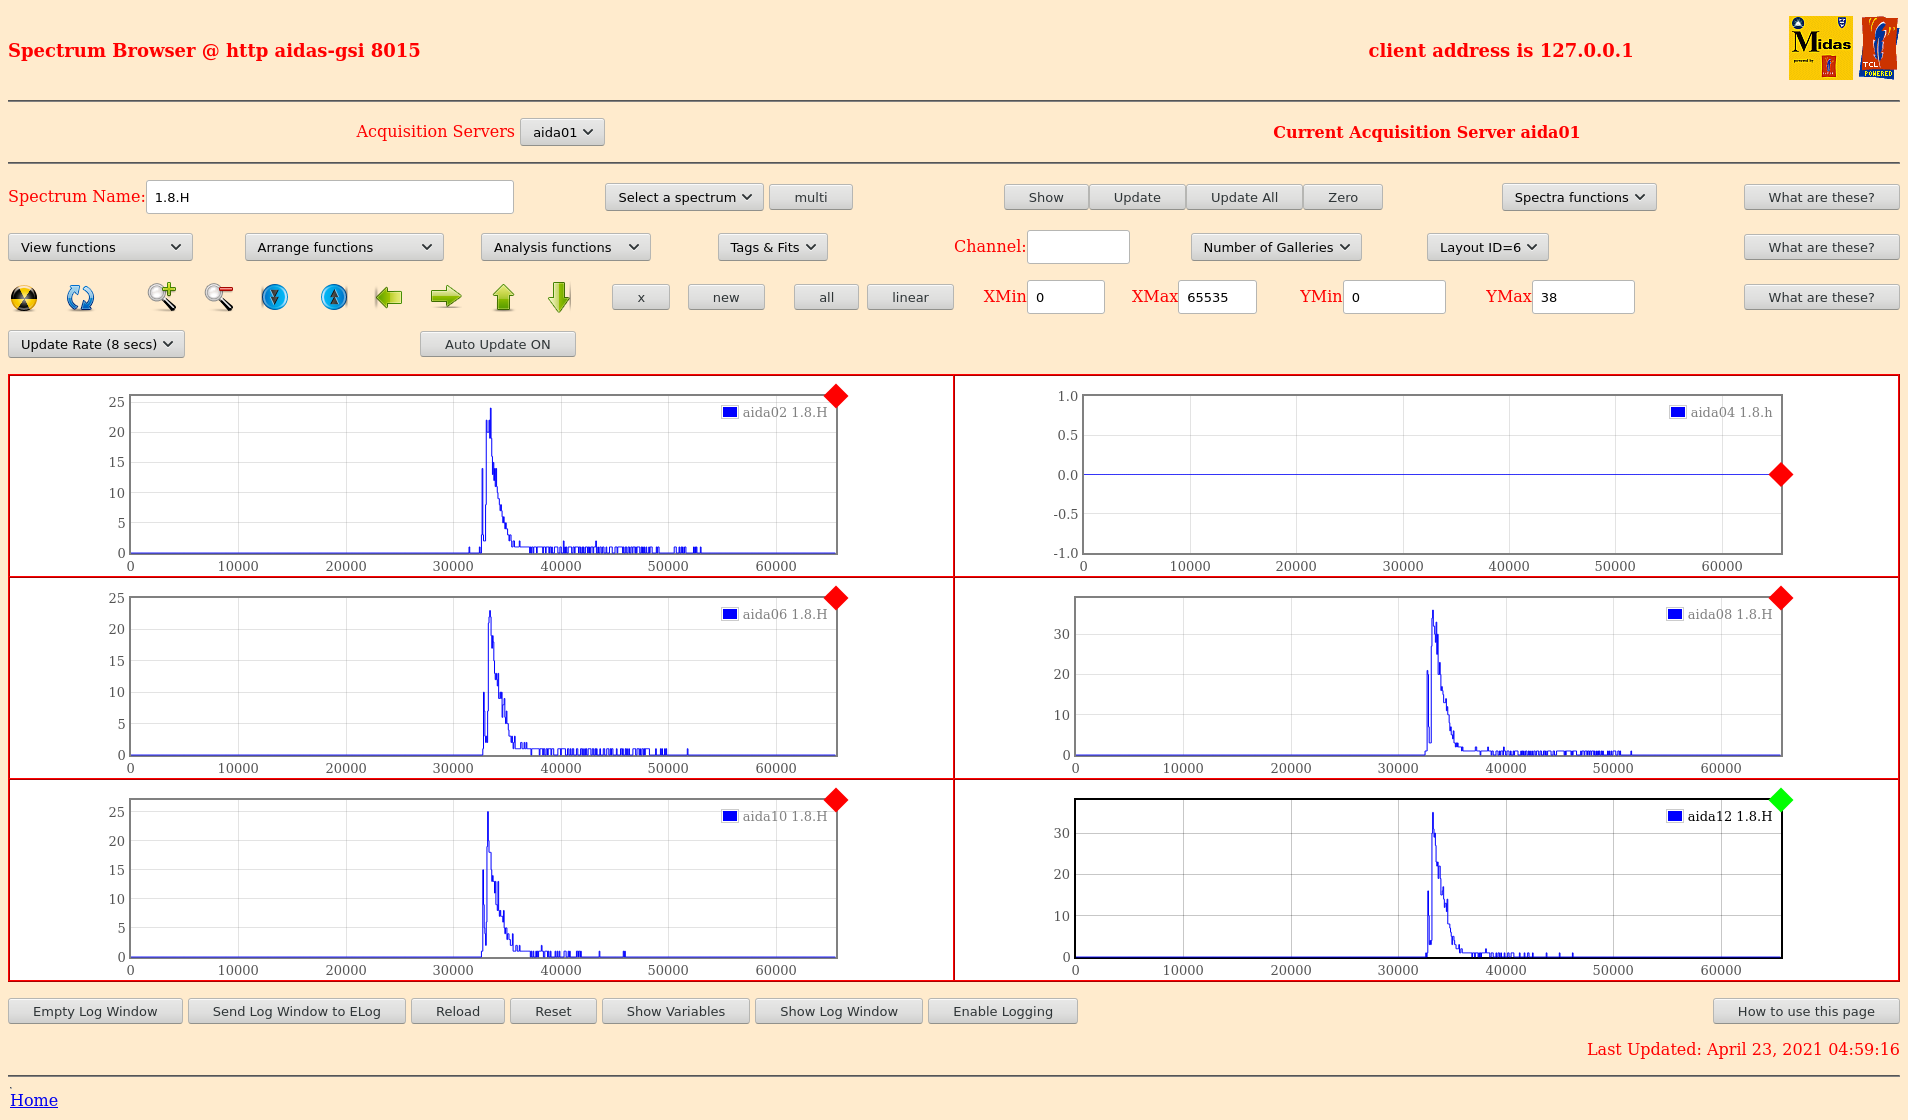
|
| Attachment 15: Screenshot_2021-04-23_Temperature_and_status_scan_aidas-gsi(2).png
|
.png.png)
|
| Attachment 16: Screenshot_2021-04-23_Statistics_aidas-gsi(2).png
|
.png.png)
|
| Attachment 17: 61.png
|
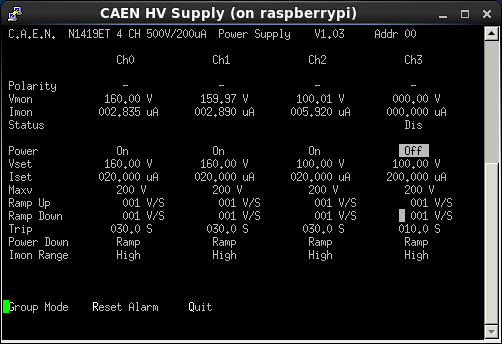
|
| Attachment 18: Screenshot_2021-04-23_System_wide_Checks_aidas-gsi(6).png
|
.png.png)
|
| Attachment 19: Screenshot_2021-04-23_System_wide_Checks_aidas-gsi(7).png
|
.png.png)
|
| Attachment 20: Screenshot_2021-04-23_System_wide_Checks_aidas-gsi(8).png
|
.png.png)
|
| Attachment 21: Screenshot_2021-04-23_Temperature_and_status_scan_aidas-gsi(3).png
|
.png.png)
|
| Attachment 22: Screenshot_2021-04-23_Statistics_aidas-gsi(3).png
|
.png.png)
|
| Attachment 23: 63.png
|
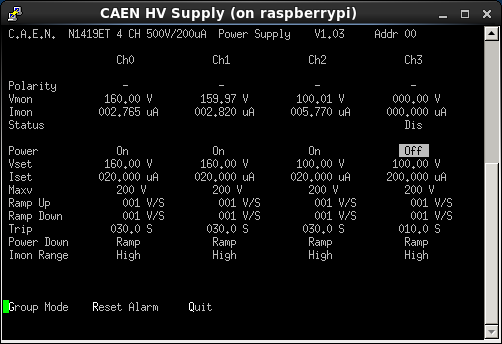
|
| Attachment 24: Screenshot_2021-04-23_System_wide_Checks_aidas-gsi(9).png
|
.png.png)
|
| Attachment 25: Screenshot_2021-04-23_System_wide_Checks_aidas-gsi(10).png
|
.png.png)
|
| Attachment 26: Screenshot_2021-04-23_System_wide_Checks_aidas-gsi(11).png
|
.png.png)
|
| Attachment 27: Screenshot_2021-04-23_System_wide_Checks_aidas-gsi(12).png
|
.png.png)
|
|
695
|
Fri Jan 31 09:37:47 2025 |
CC, TD, MP | Friday 31 January |
Implantation stack mounted - BB18(DS)-1000 + bPlas + bPlas + 3x BB7(DS)-1000

N.B. aida02, aida09 & aida15 have grounded copper screen (3M 1245 - aluminimum braid to copper screen of ribbon cables) for Kapton PCBs connecting the Samtec ribbon cables to the BB18 DSSSD.

n+n FEE64s aida02, aida04, aida06 and aida08 LK1 fitted
p+n FEE64s aida03 and aida07 LK3 fitted

BB7 aida10 (asics #1-2 p+n, #3-4 n+n)

BB18 p+n FEE64s 9-15, 1-3, 5-12 - n+n FEE64s 2-4 (L-R looking downstream)

10.30 FEE64 power ON

      DSSSD bias ON (BB18 only) - attachment 1
       leakage current OK

      ASIC settings 2024Dec13-17.02.45 restored
       p+n FEE64 slow comparator 0xa, n+n FEE64 slow comparator 0xf

      Attachments 2-7 WR timestamp aida05 & aida12, system wide check
       aida12 & aida05 global clock status 6 - to be checked - OK for initial tests without merger
       WR decoder status aida02

      per FEE64 Rate spectra - attachment 8
       aida10 high rate - BB7 not biased
       rates OK for p+n FEE64s, rates high for n+n FEE64s - to be checked
       BNC PB-5 pulser ON to p+n FEE64s - no obvious adaptor PCB misalignments

      ADC data item stats - attachment 9
       rates generally OK
       aida10 high - BB7 not biased
       aida02 & aida04 n+n FEE64s - rates high - to be checked when bPlas install complete
       all p+n FEE64s connected to BB18 <10K except aida05 25k - very good!

      BNC PB-5 settings - attachment 10

      WR timestamps OK - attachment 11

      FEE64 temperatures OK - attachment 12

12.15 bPlas driver PCB installed, bPlas cabling and grounds *not* connected yet

      ADC data item stats - attachment 13
       all rates higher cf. attachment 9

      per FEE64 Rate spectra - attachment 14

      per p+n FEE64 1.8.L spectra - attachment 15
       aida09 pulser peak width 69 ch FWHM = 49keV FWHM
       aida14 pulser peak width 50 ch FWHM = 35keV FWHM

      per p+n FEE64 1.8.W spectra - 20us FSR - attachments 16-17

      per n+n FEE64 1.8W spectra - 20us FSR - attachment 18

      DSSSD bias & leakage current OK - attachment 19
       ambient temperature +21.6 deg C, d.p. +0.4 deg C, RH 24.4%

      FEE64 temperatures OK - attachment 20

      DSSSD bias volatge & leakage current OK - attachment 21
       CAEN N1419ET ch#0 BB18, ch#1 BB7

      Install of bPlas drivers, cabling, grounds complete

      ADC data item stats - attachment 22

      per FEE64 Rate spectra - attachment 23
       all BB18 p+n FEE64s *except* aida05 show very low rates of noise

      per p+n FEE64 1.8.L spectra - attachment 24
       aida09 pulser peak width 62 ch FWHM = 42keV FWHM
       BB18 p+n FEE64s better electronic noise cf. p+n FEE64s not connected to a DSSSD

per FEE64 1.8.W spectra - 20us FSR - attachments 25-26 |
| Attachment 1: Screenshot_from_2025-01-31_10-39-16.png
|

|
| Attachment 2: Screenshot_from_2025-01-31_10-58-48.png
|

|
| Attachment 3: Screenshot_from_2025-01-31_10-58-59.png
|

|
| Attachment 4: Screenshot_from_2025-01-31_10-59-11.png
|
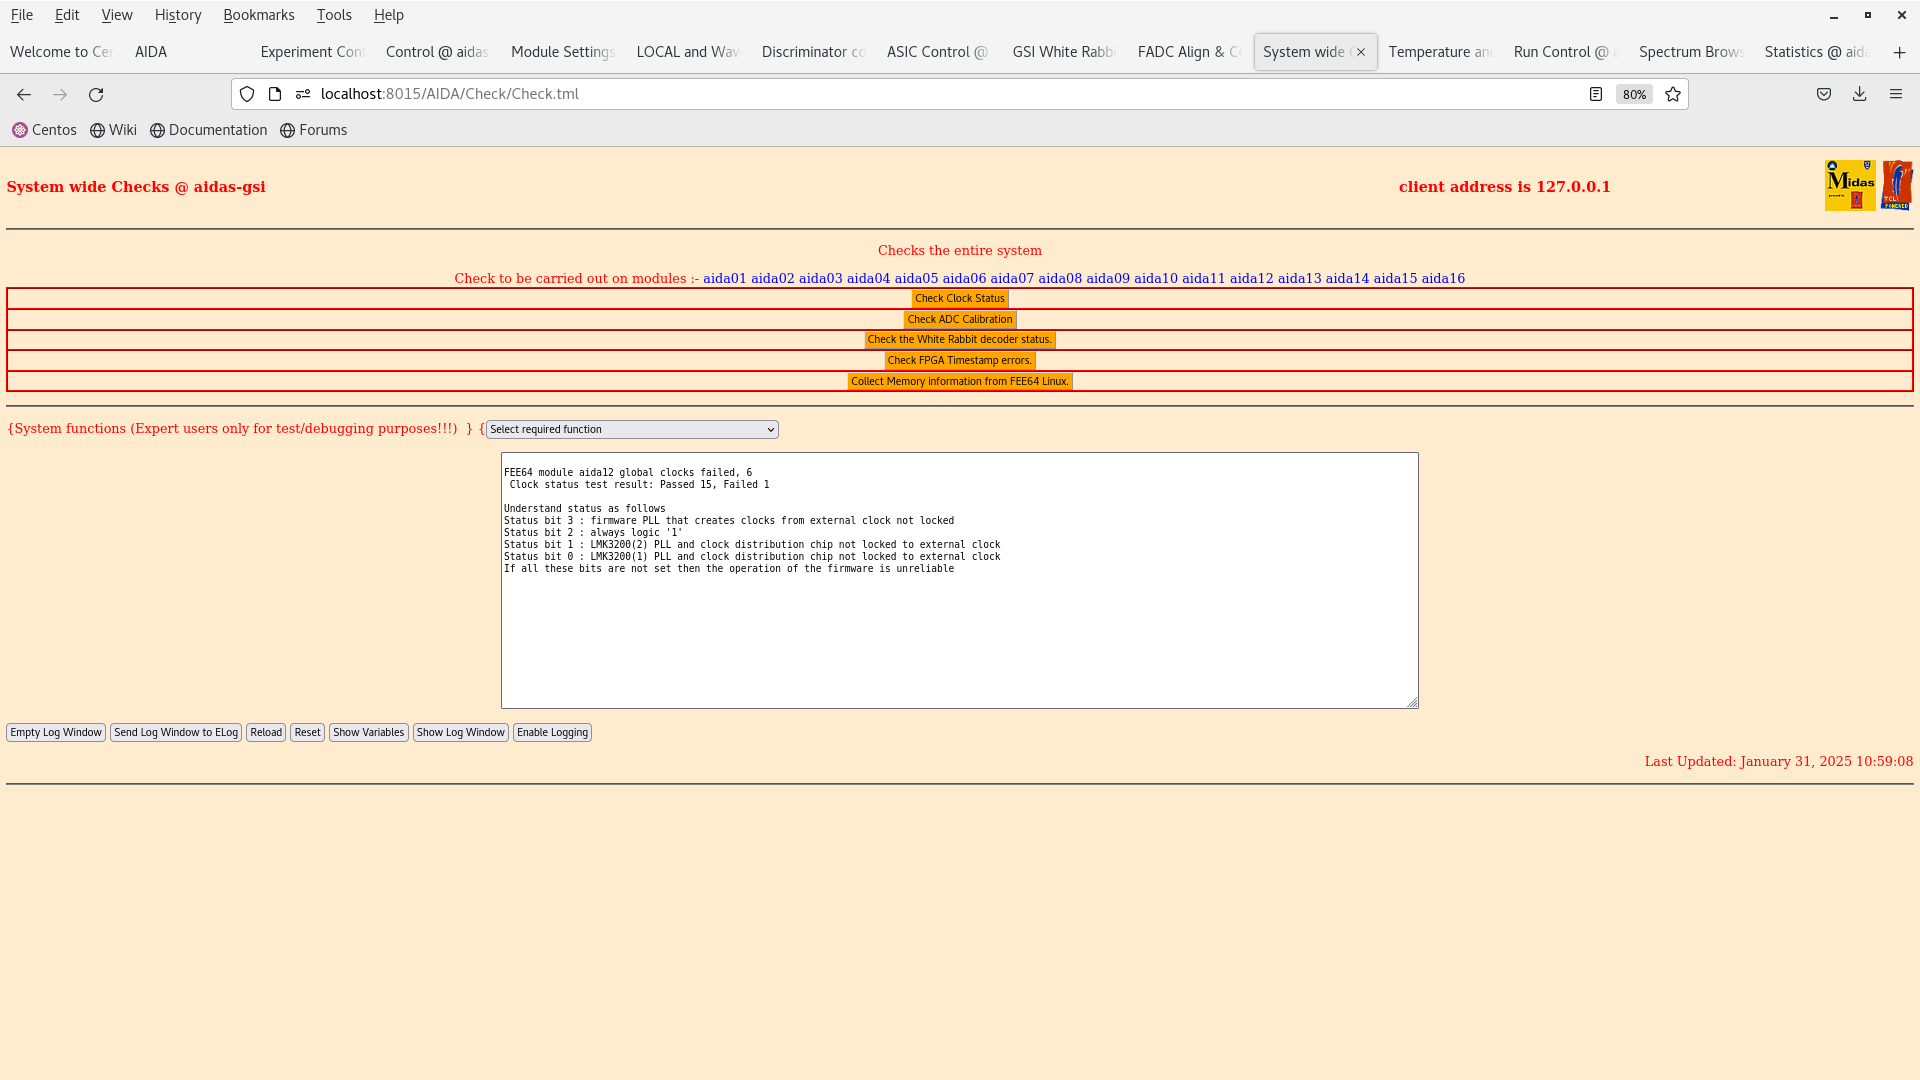
|
| Attachment 5: Screenshot_from_2025-01-31_10-59-11.png
|

|
| Attachment 6: Screenshot_from_2025-01-31_10-59-52.png
|

|
| Attachment 7: Screenshot_from_2025-01-31_11-00-02.png
|
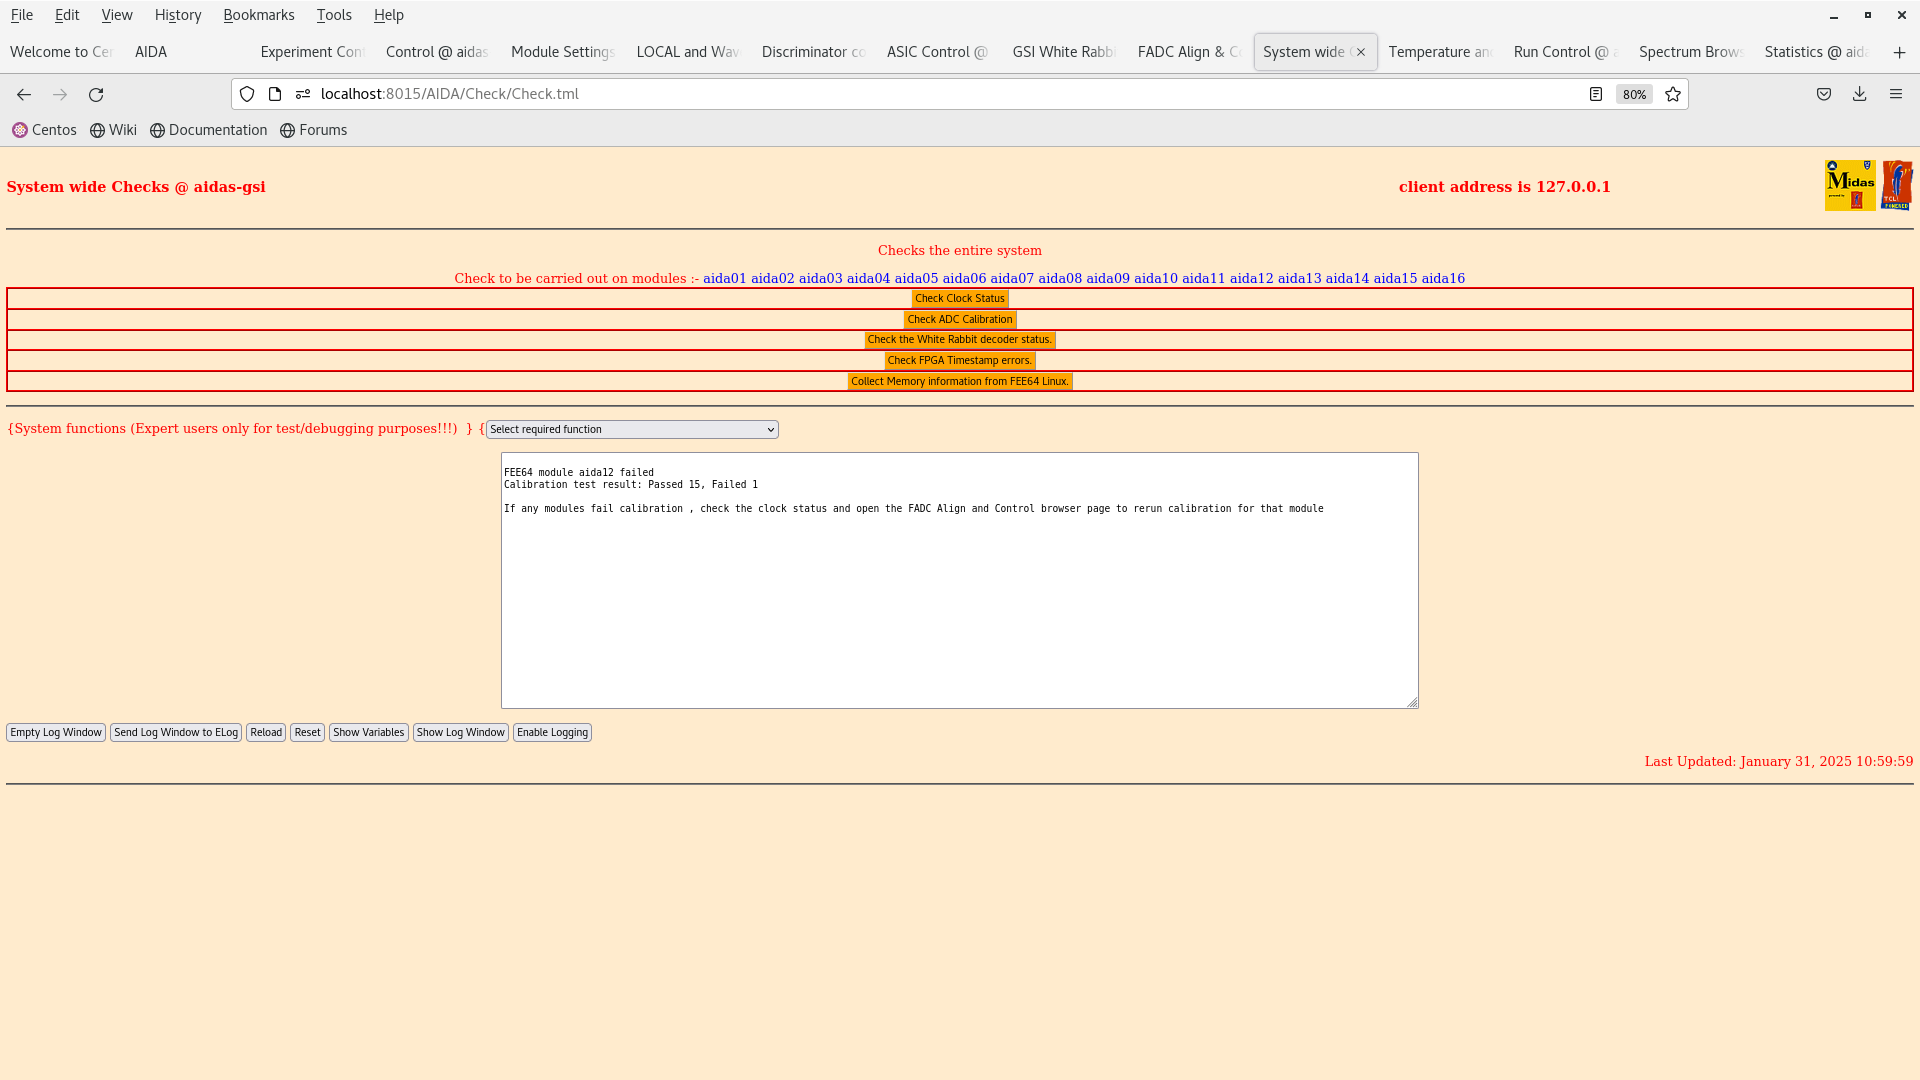
|
| Attachment 8: Screenshot_from_2025-01-31_11-17-59.png
|

|
| Attachment 9: Screenshot_from_2025-01-31_11-18-43.png
|

|
| Attachment 10: Screenshot_from_2025-01-31_11-18-50.png
|

|
| Attachment 11: Screenshot_from_2025-01-31_11-21-05.png
|
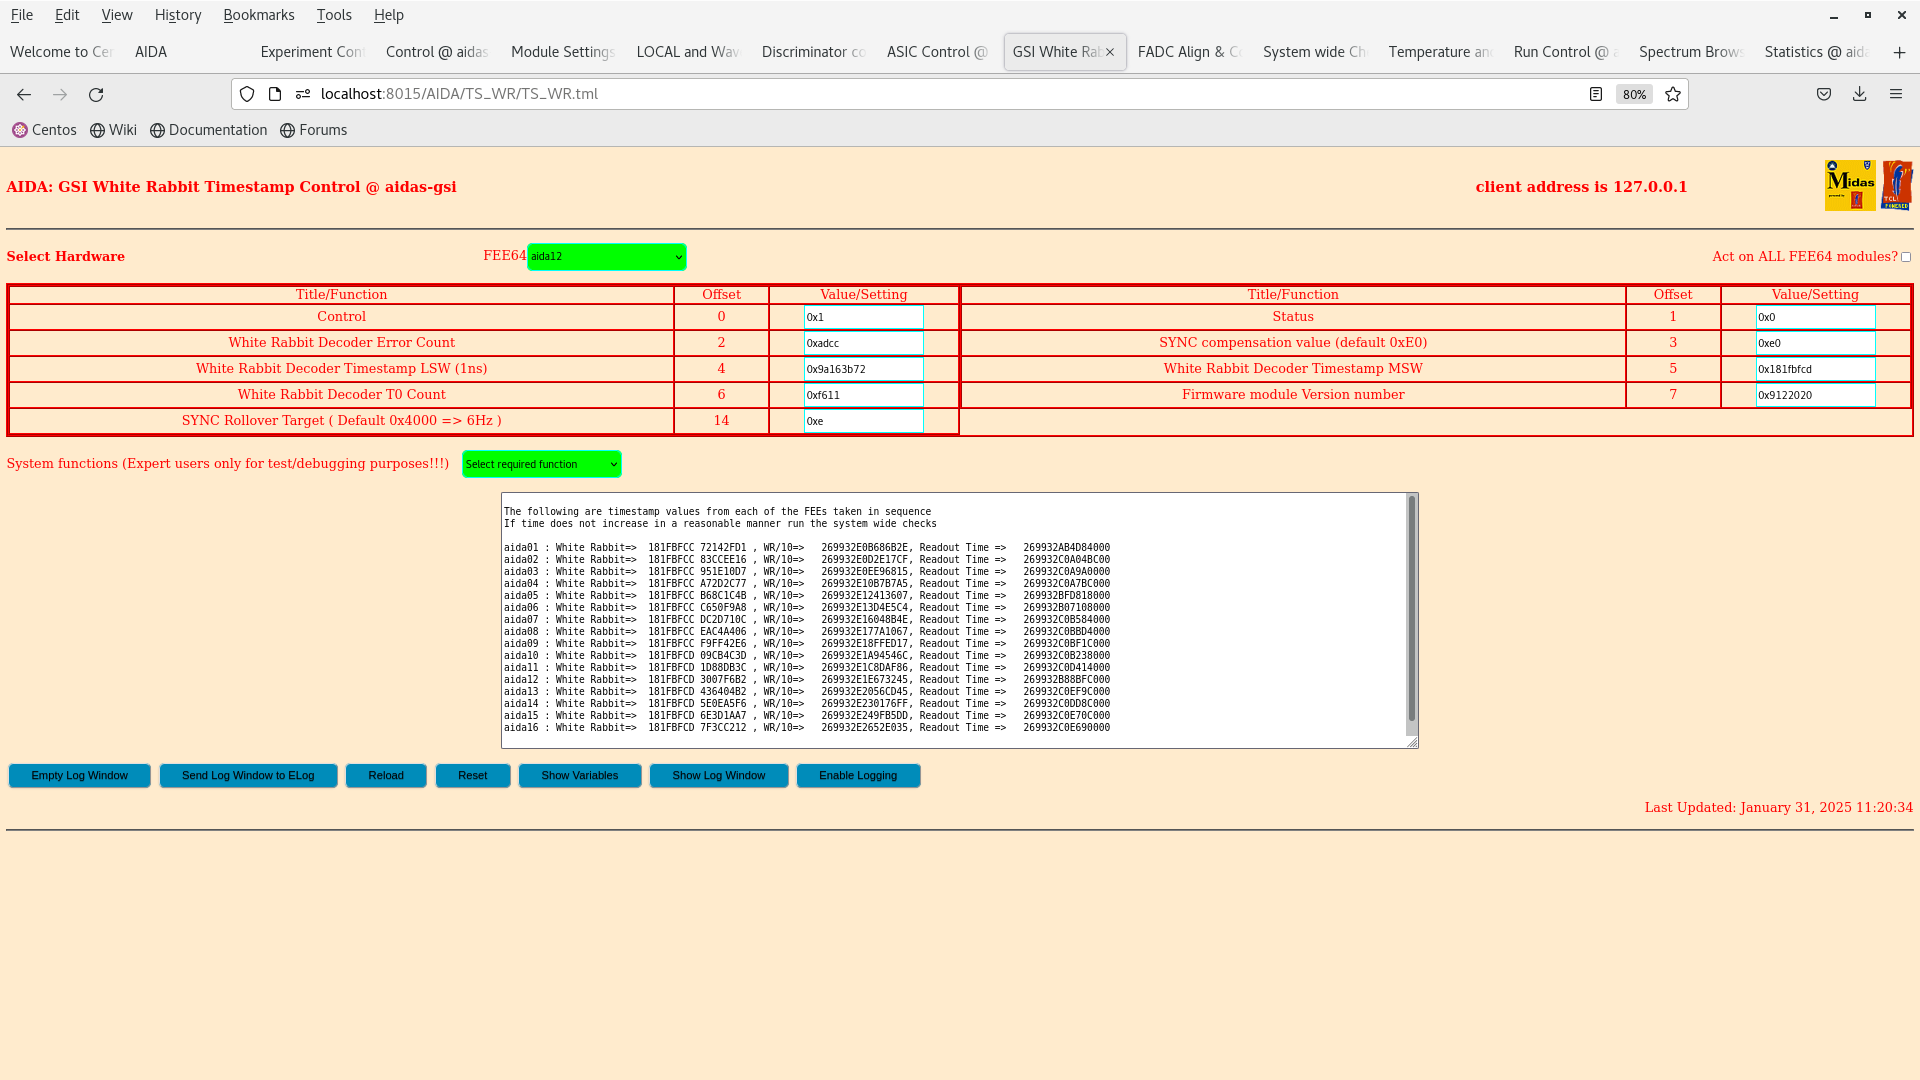
|
| Attachment 12: Screenshot_from_2025-01-31_11-21-29.png
|

|
| Attachment 13: Screenshot_from_2025-01-31_12-21-09.png
|

|
| Attachment 14: Screenshot_from_2025-01-31_12-21-55.png
|

|
| Attachment 15: Screenshot_from_2025-01-31_12-26-26.png
|
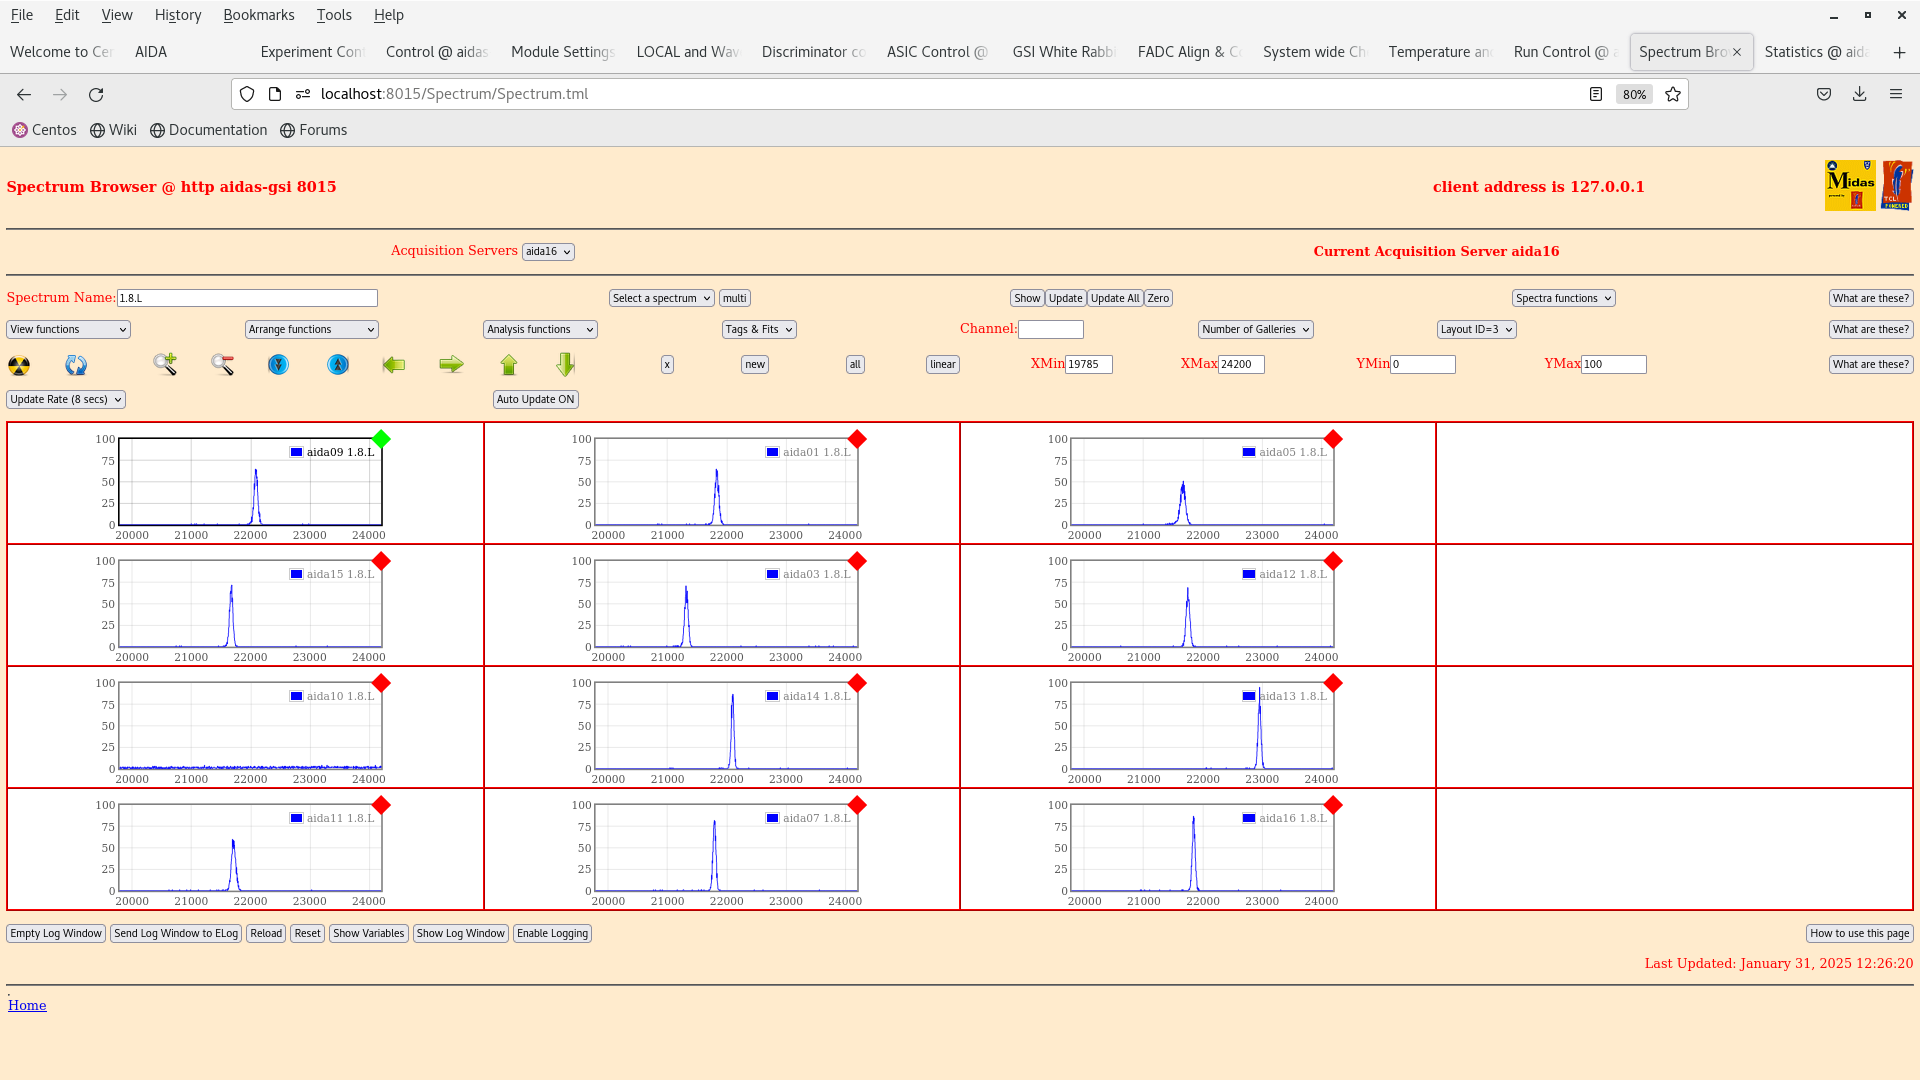
|
| Attachment 16: Screenshot_from_2025-01-31_12-30-13.png
|
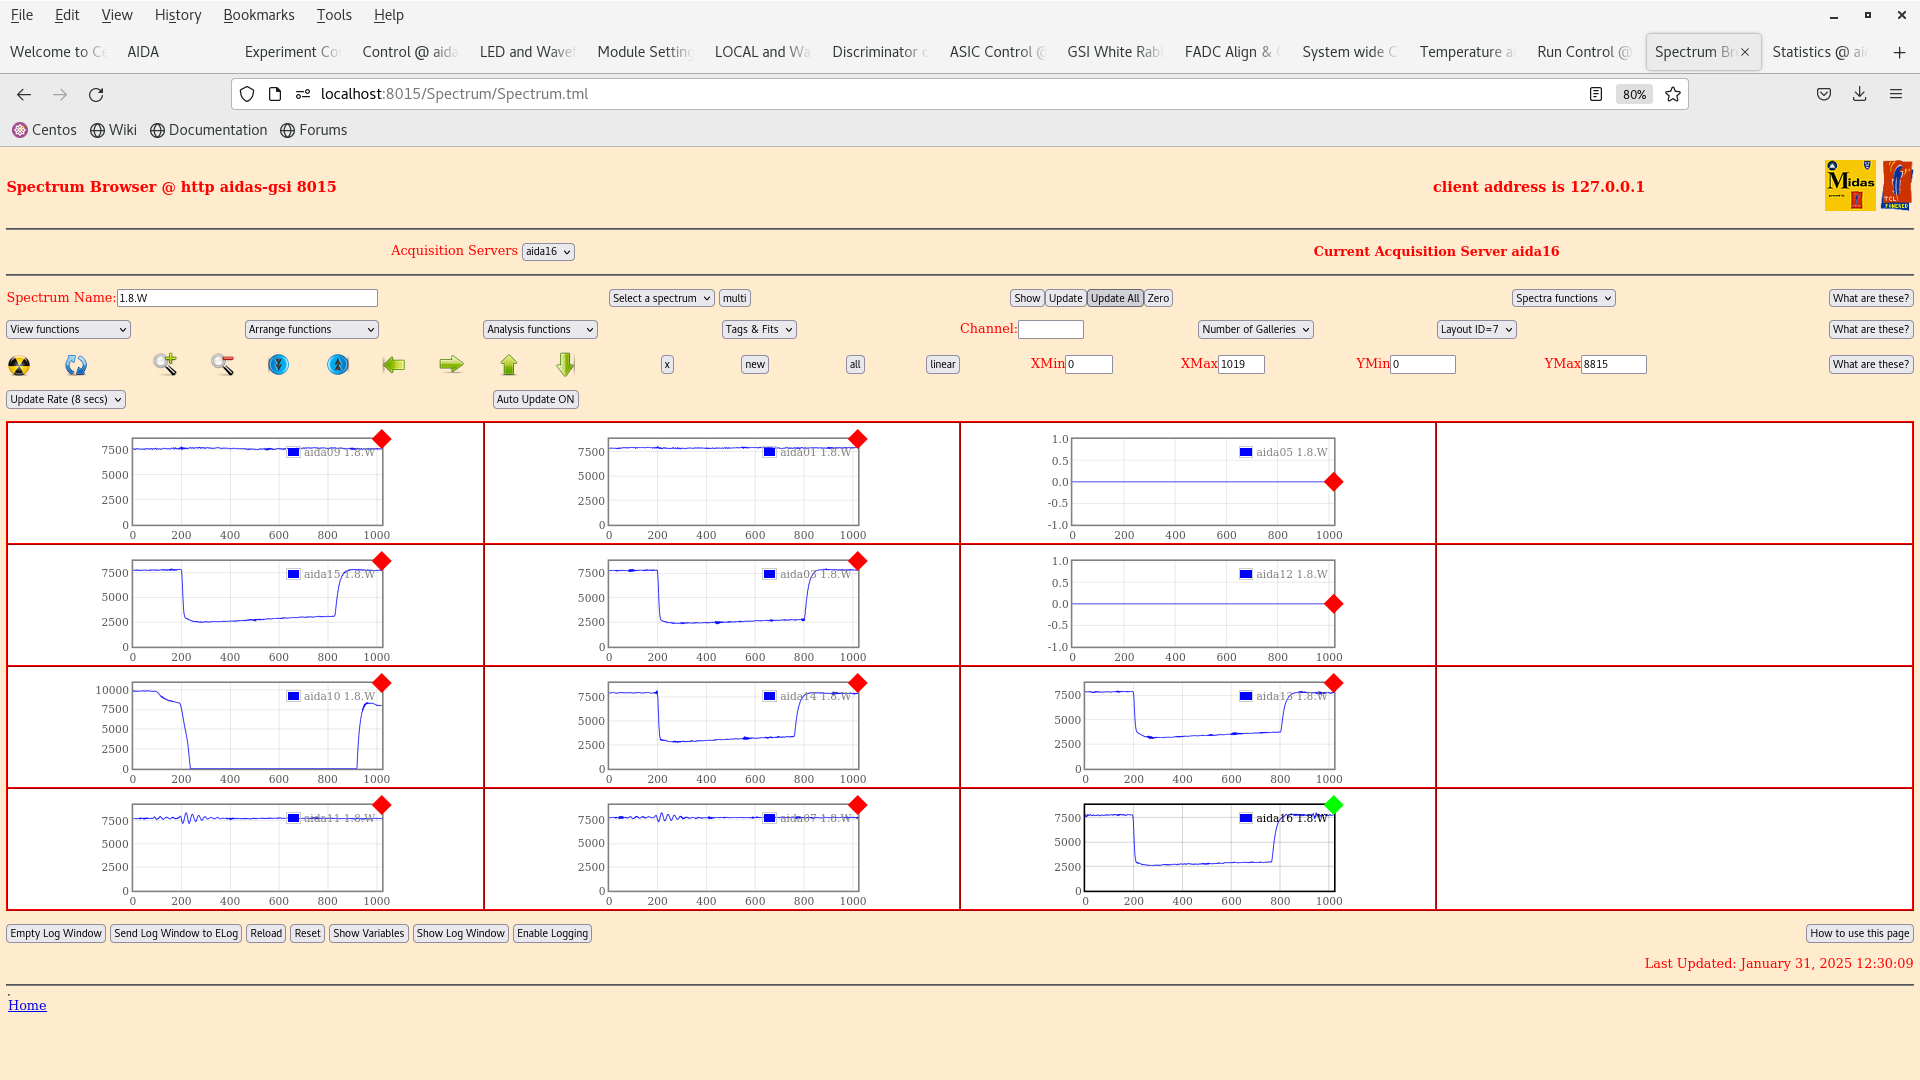
|
| Attachment 17: Screenshot_from_2025-01-31_12-30-34.png
|
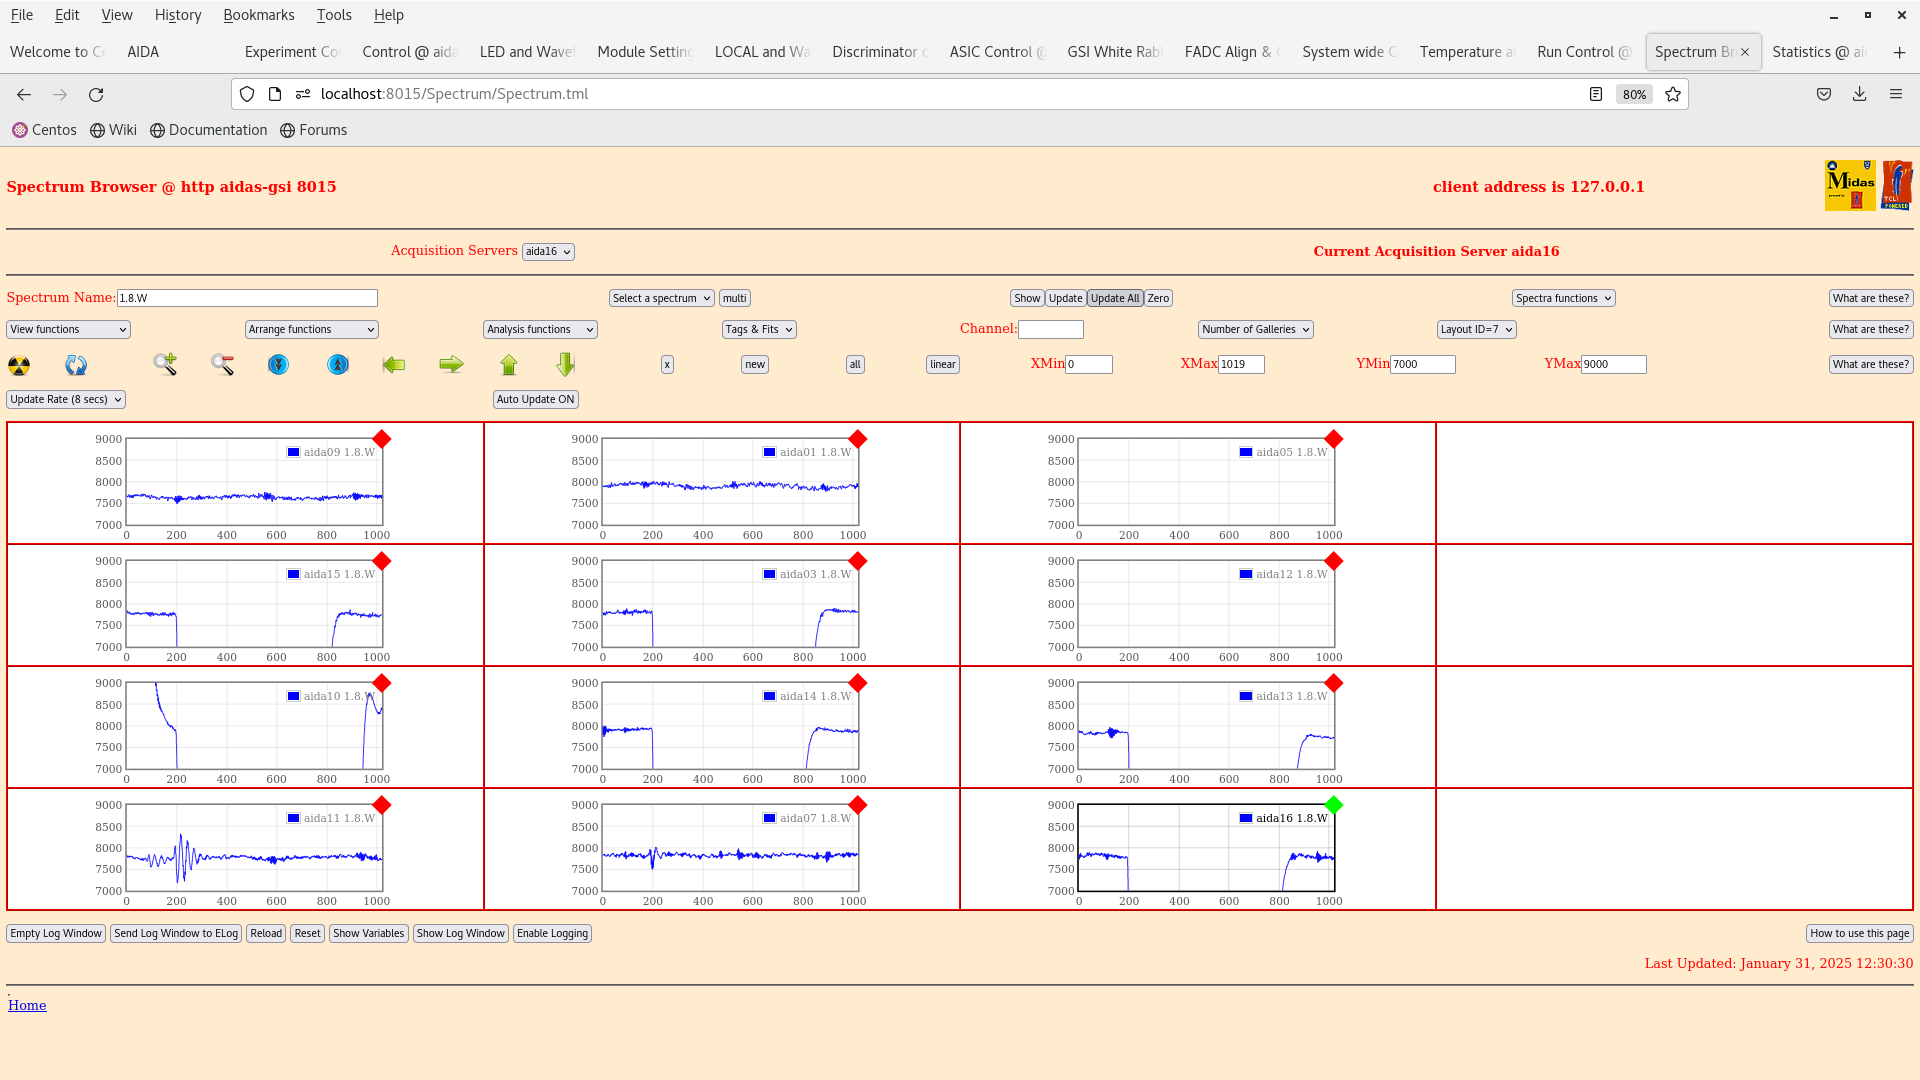
|
| Attachment 18: Screenshot_from_2025-01-31_12-31-25.png
|

|
| Attachment 19: Screenshot_from_2025-01-31_12-41-33.png
|
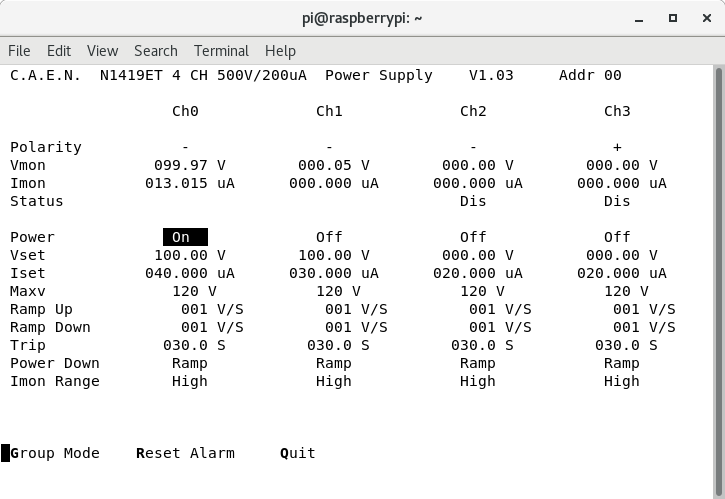
|
| Attachment 20: Screenshot_from_2025-01-31_12-42-08.png
|

|
| Attachment 21: Screenshot_from_2025-01-31_15-59-26.png
|
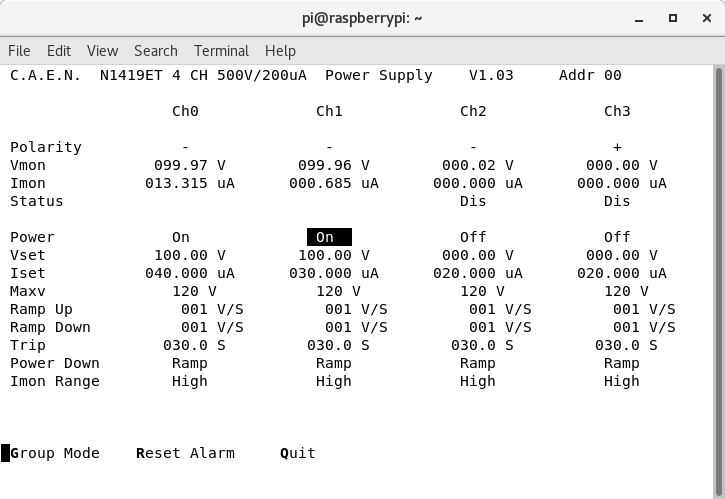
|
| Attachment 22: Screenshot_from_2025-01-31_16-07-21.png
|

|
| Attachment 23: Screenshot_from_2025-01-31_16-07-31.png
|
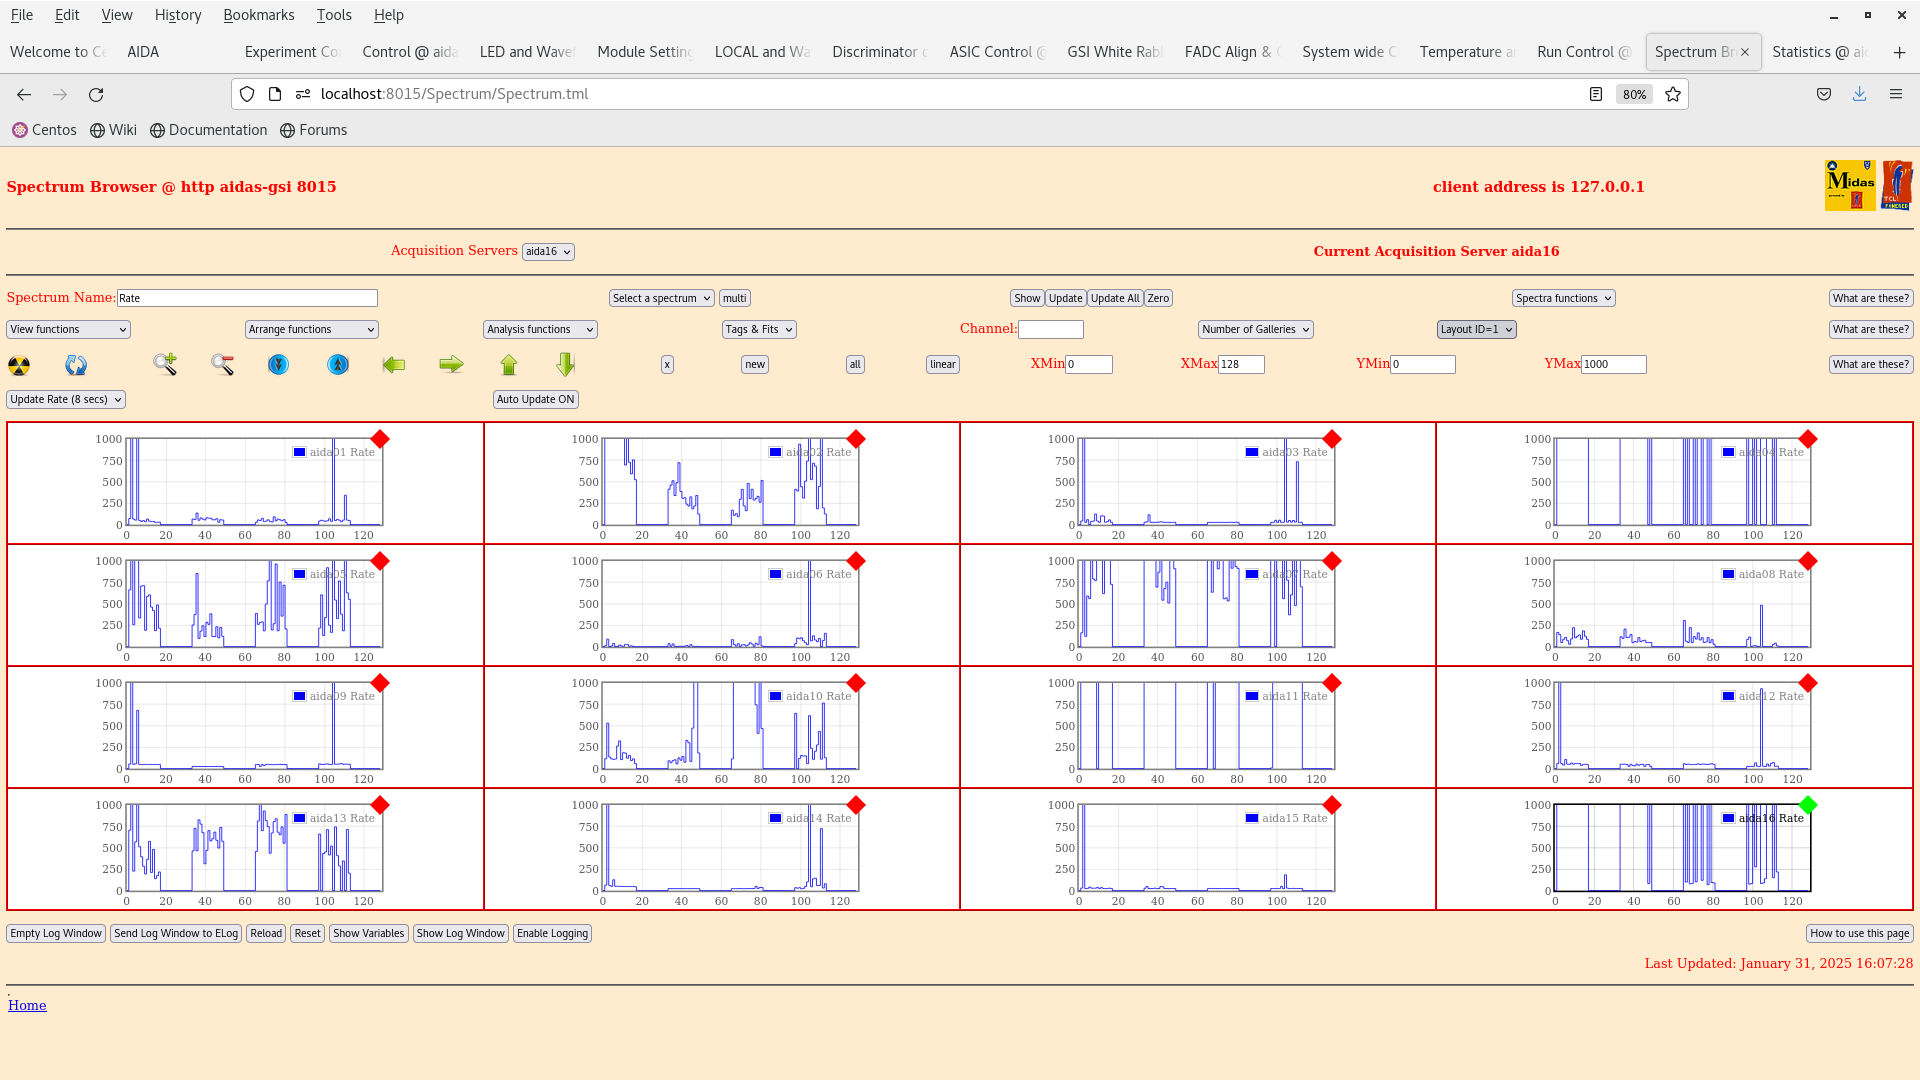
|
| Attachment 24: Screenshot_from_2025-01-31_16-08-39.png
|

|
| Attachment 25: Screenshot_from_2025-01-31_16-10-48.png
|
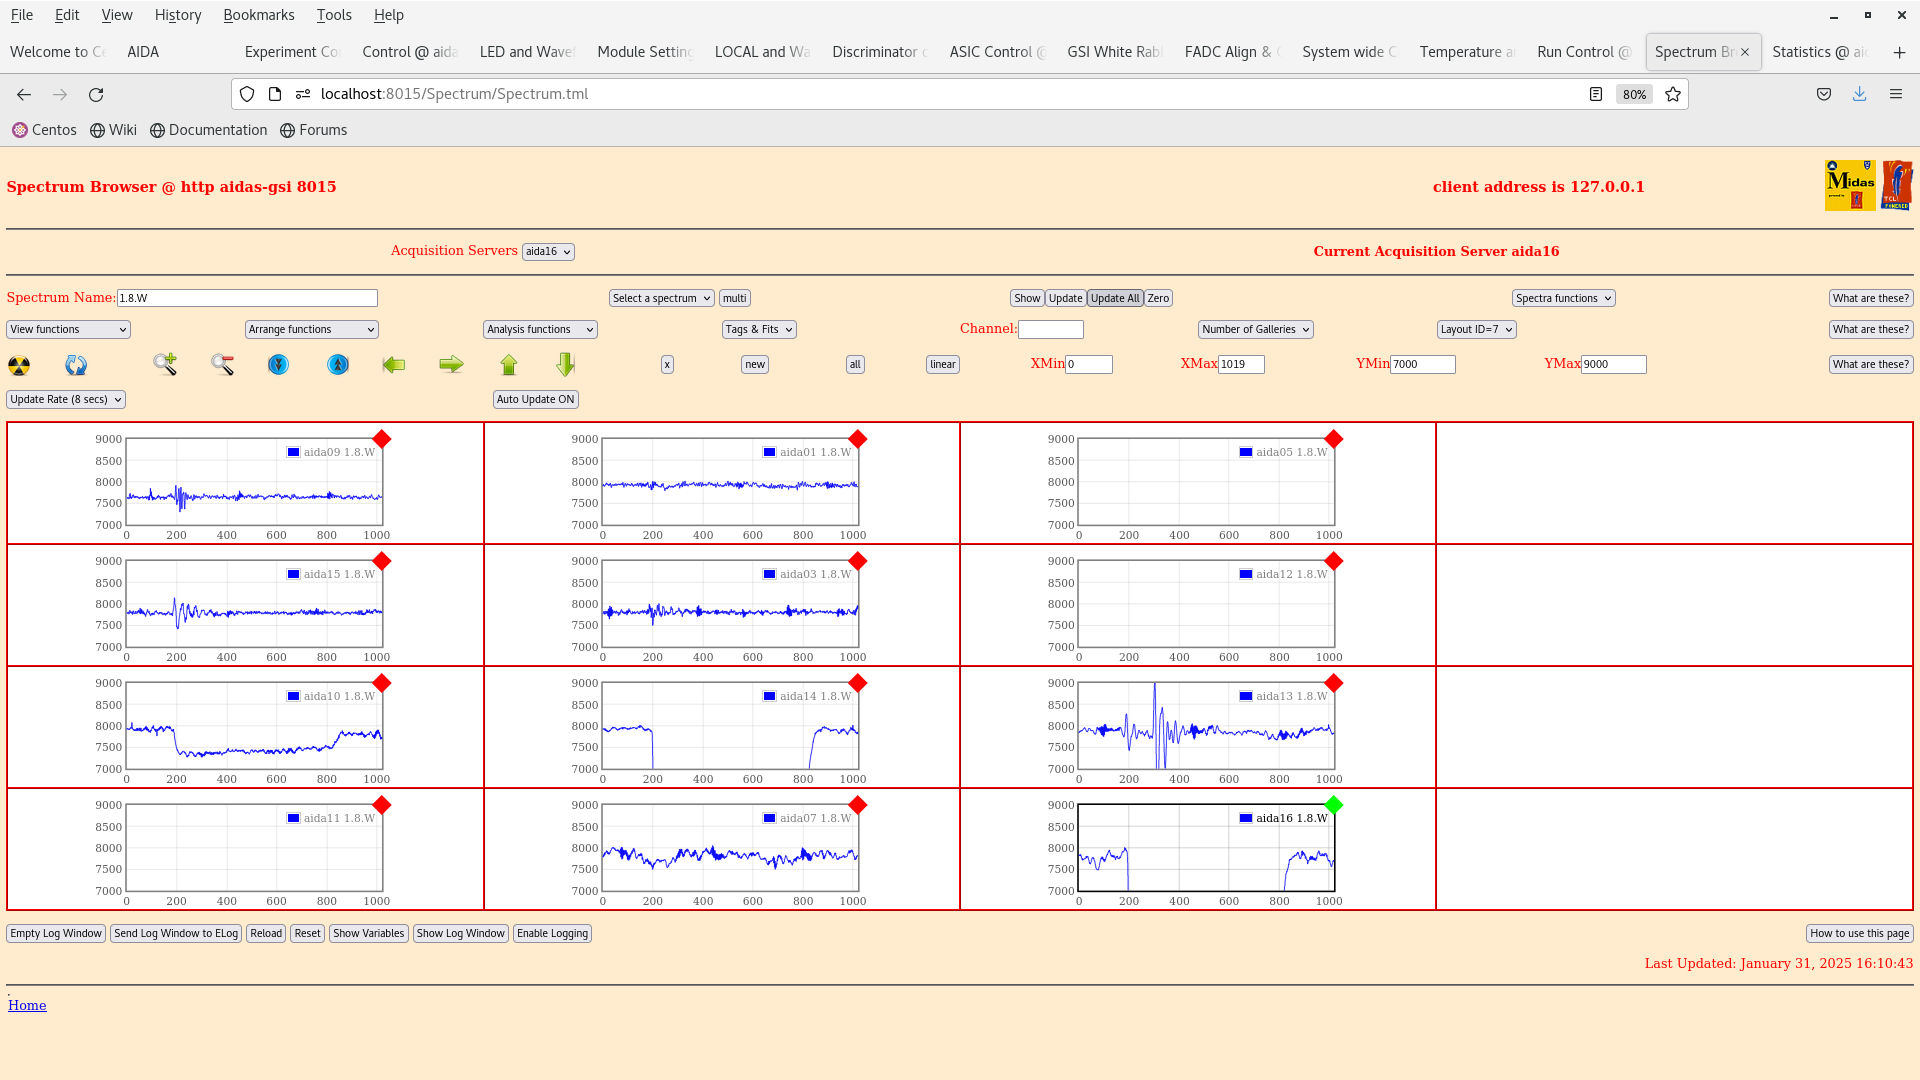
|
| Attachment 26: Screenshot_from_2025-01-31_16-11-30.png
|
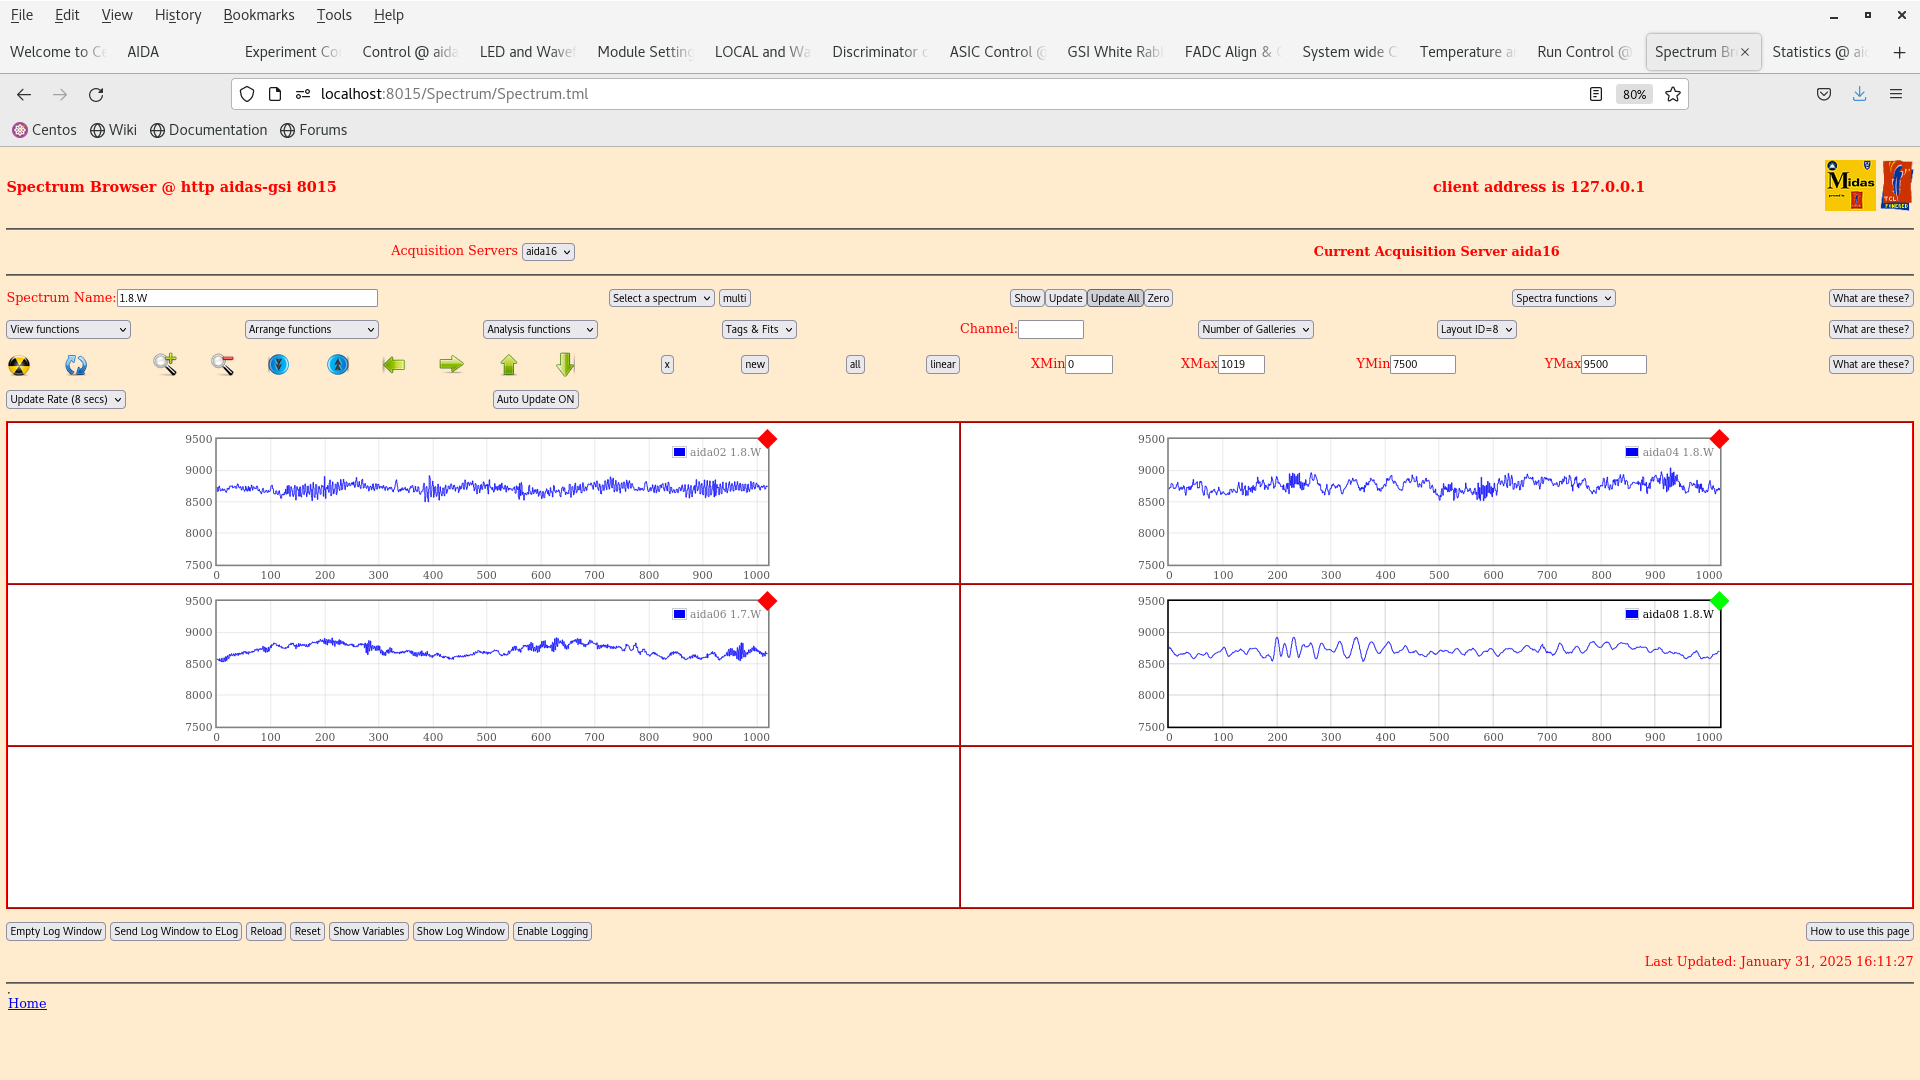
|