AIDA GELINA BRIKEN nToF CRIB ISOLDE CIRCE nTOFCapture DESPEC DTAS EDI_PSA 179Ta CARME StellarModelling DCF K40
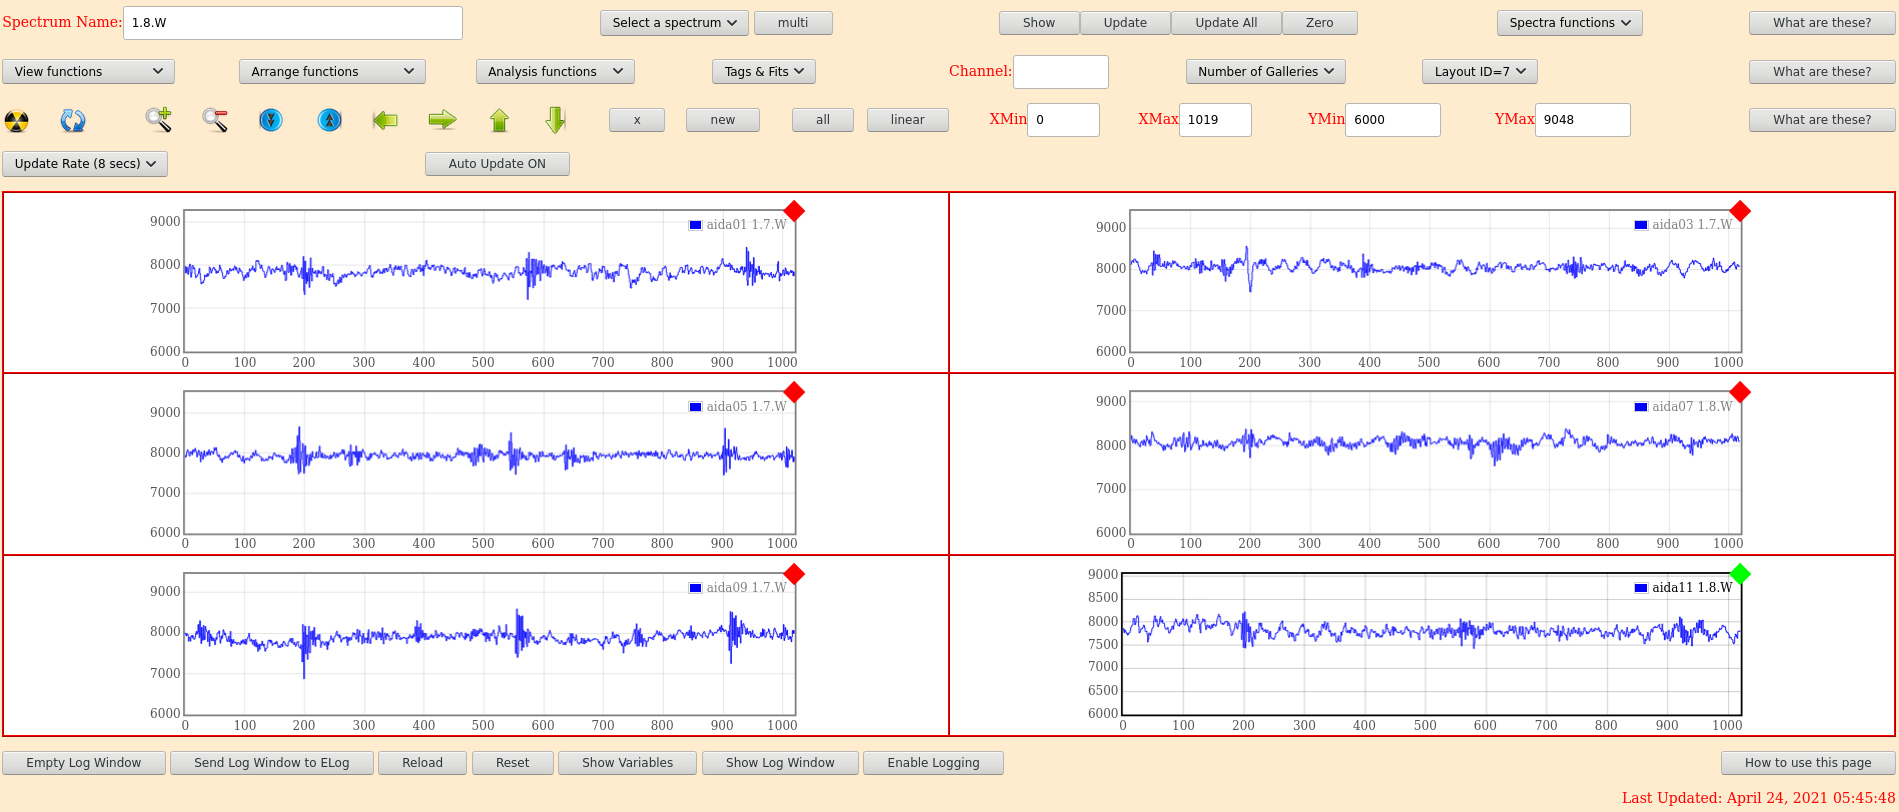
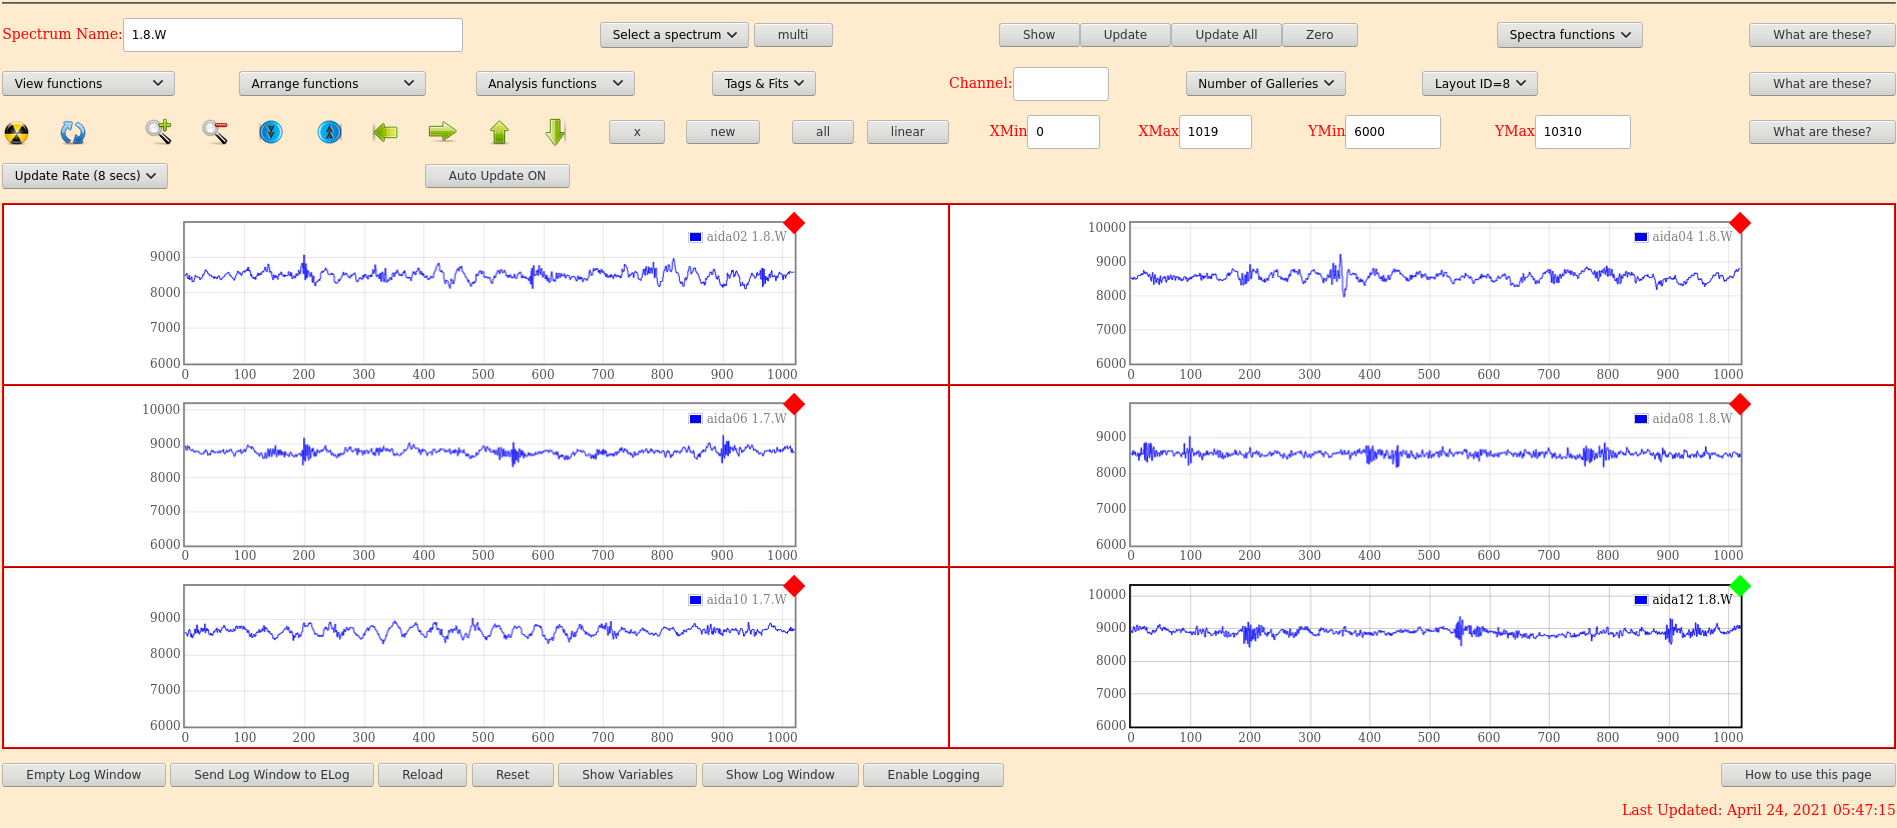
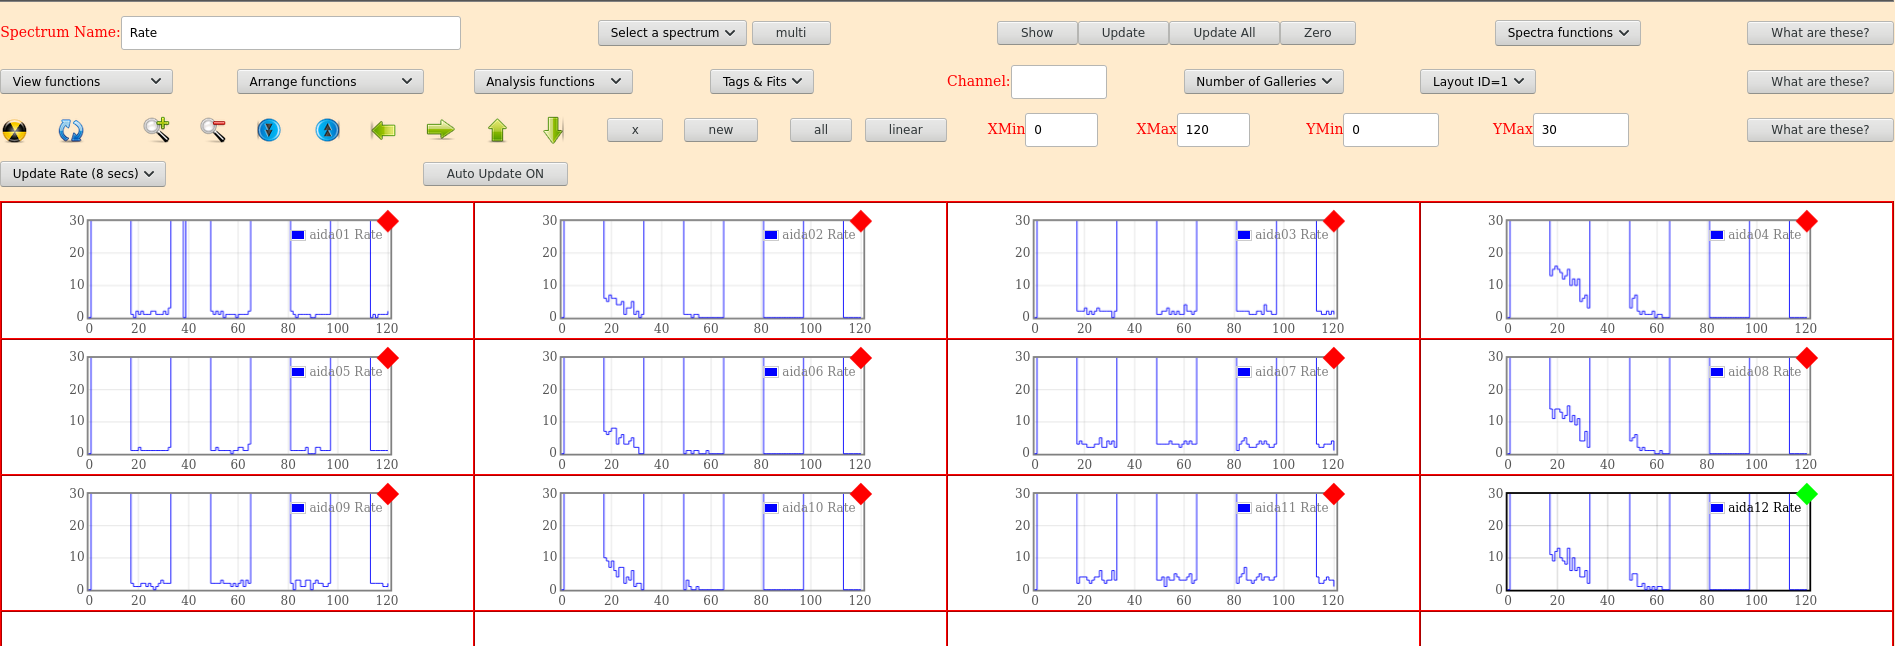
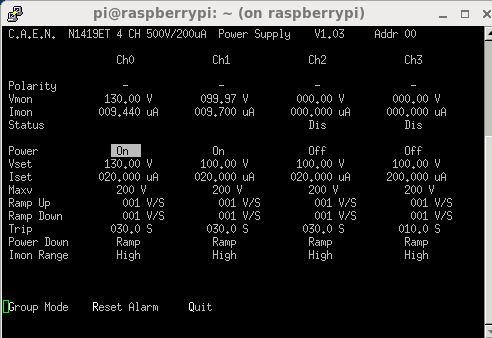
  DESPEC, Page 28 of 36  ELOG logo
New entries since:Thu Jan 1 01:00:00 1970
ID Date Authordown Subject
  445   Sat May 14 01:52:03 2022 ML2h-Shift Checks

AIDA stats ok

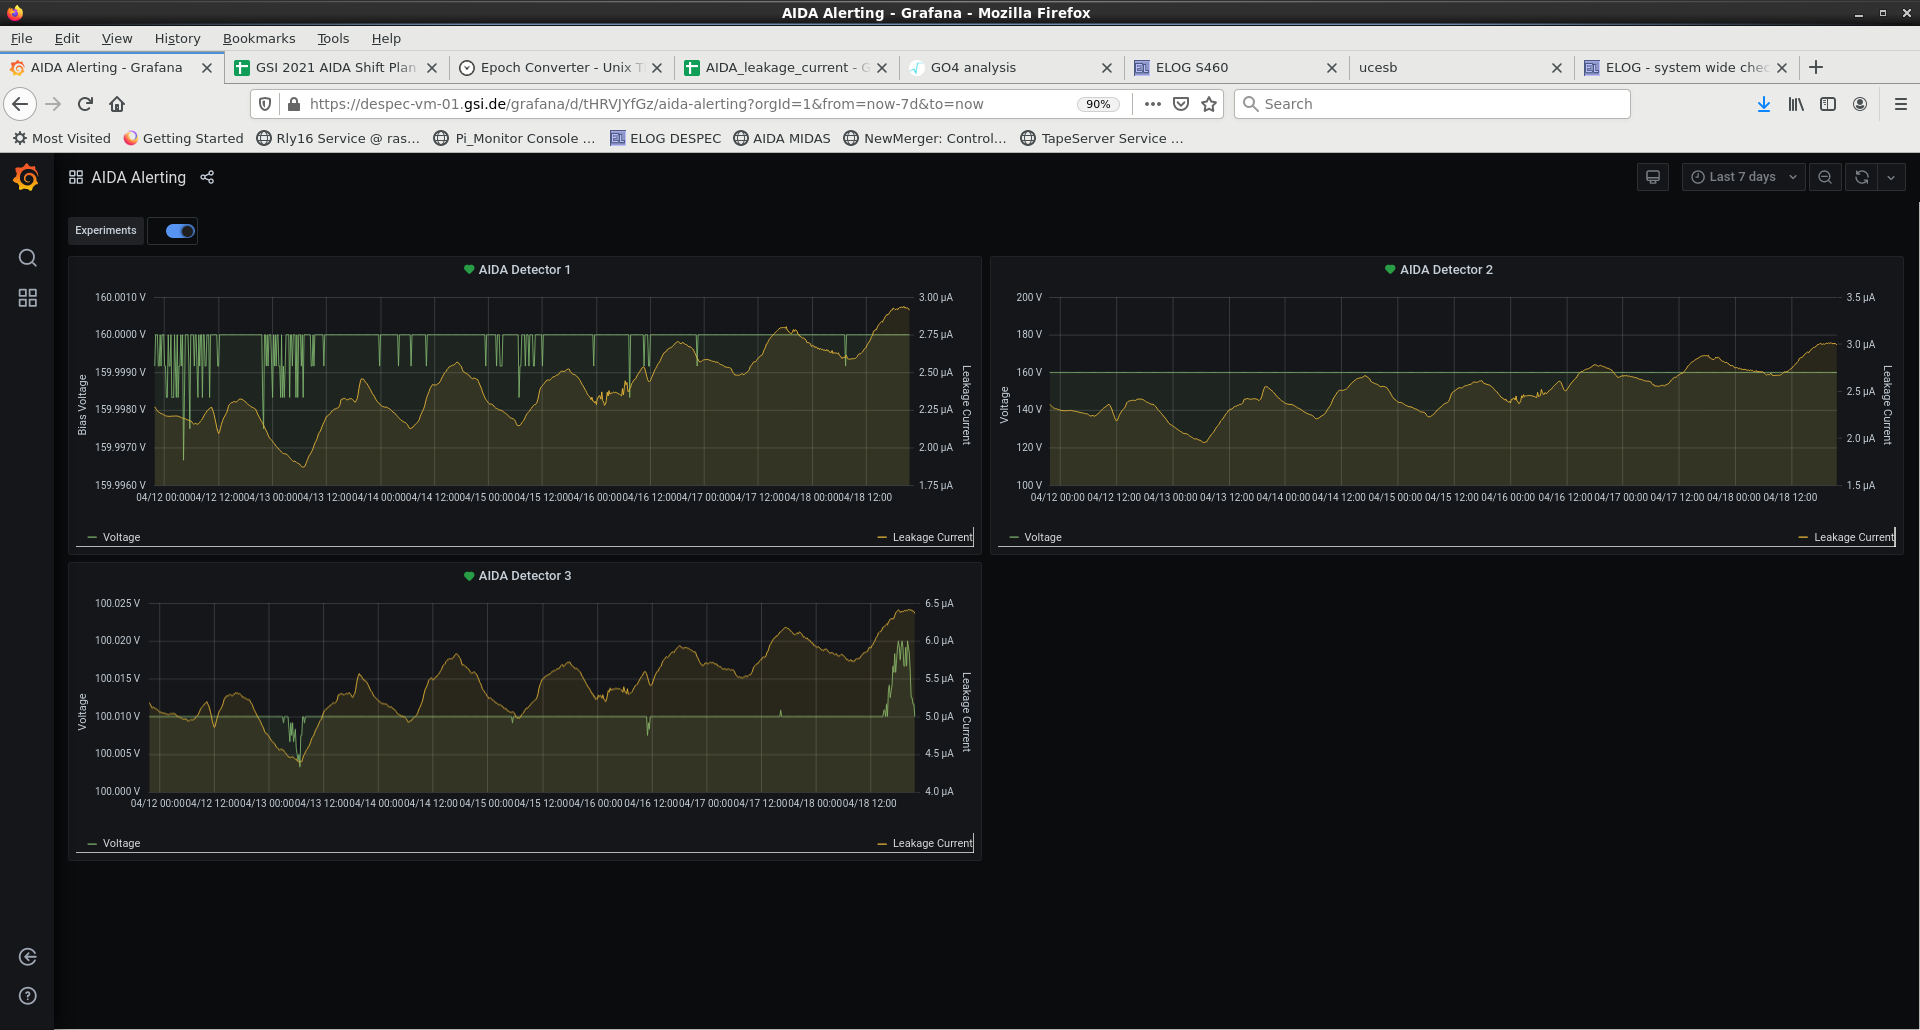
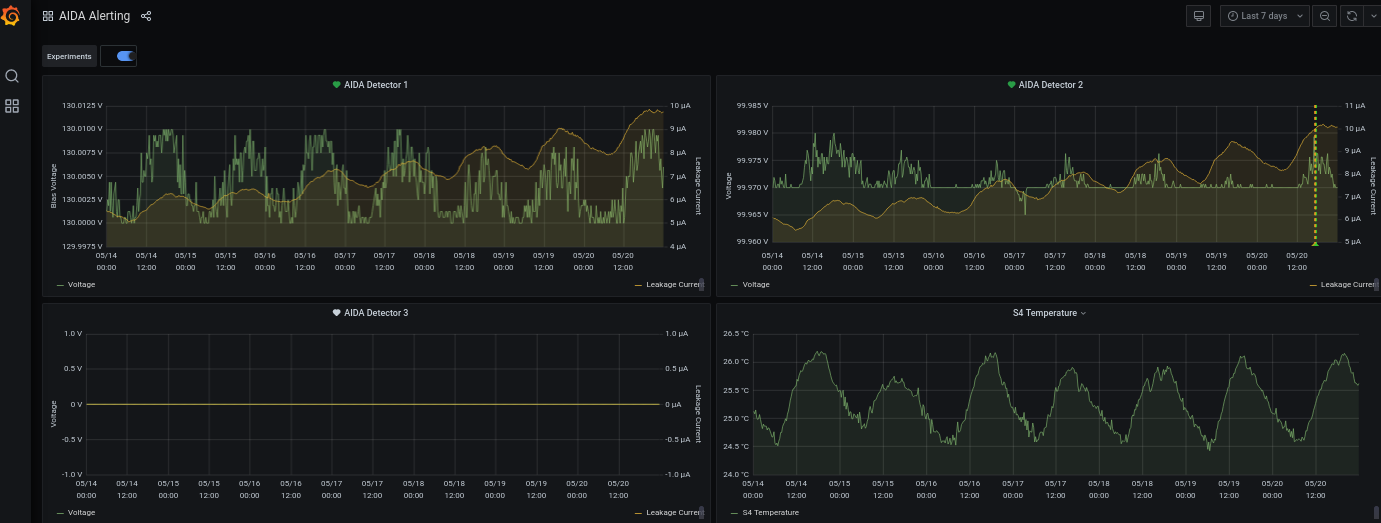
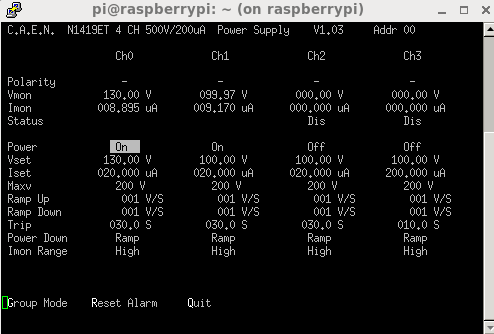
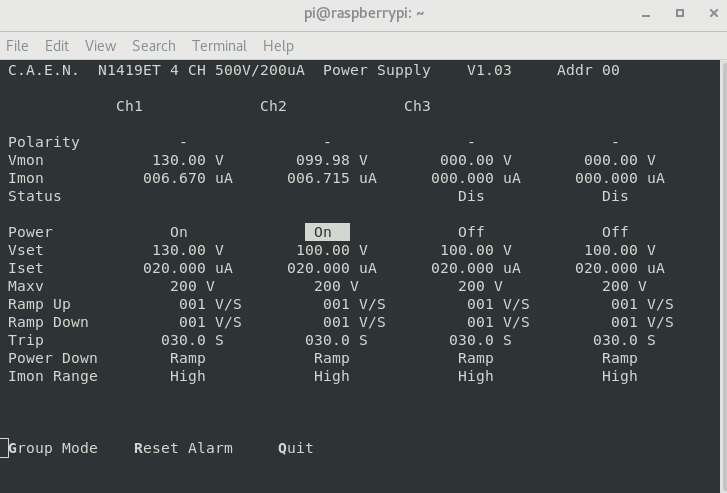
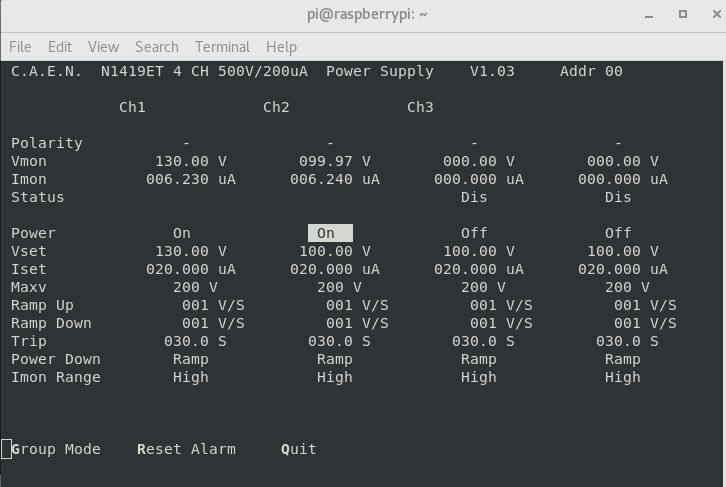
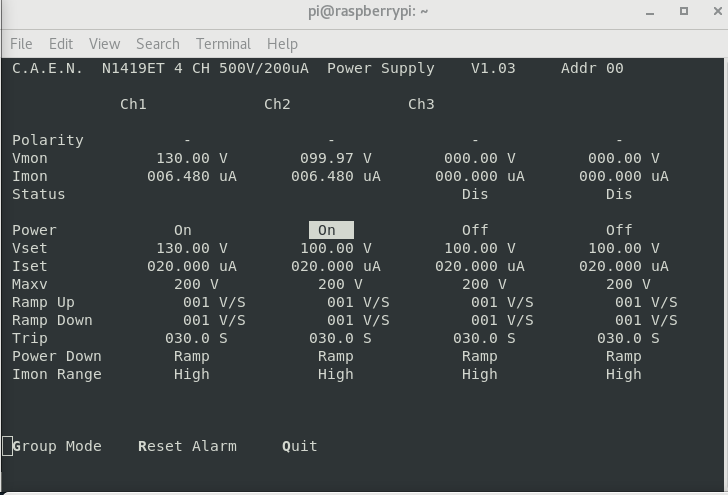
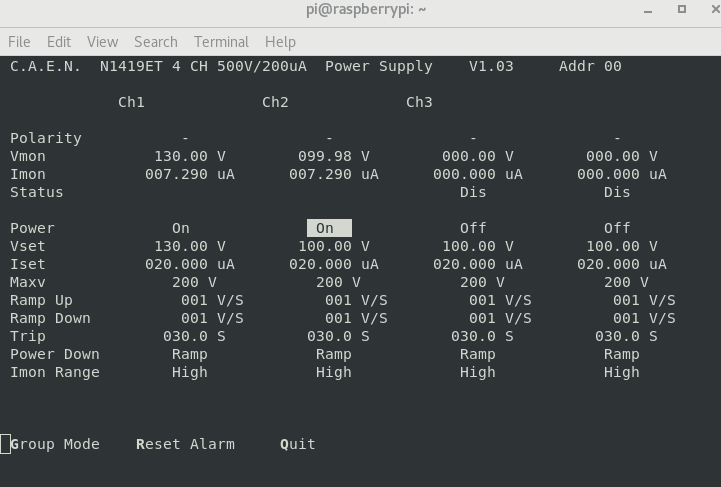
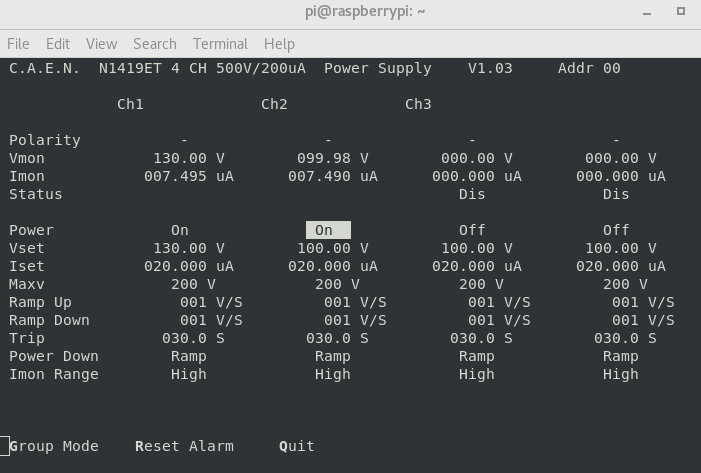
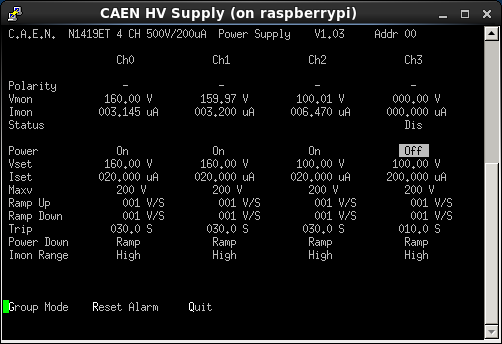
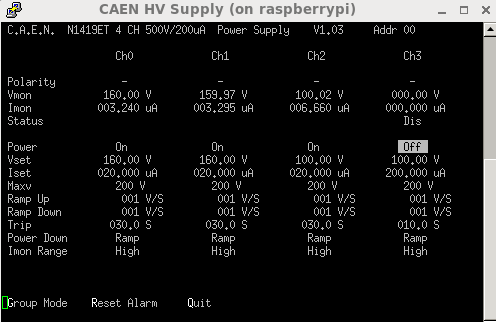
Leakage current ok

Temperatires ok

grafana ok

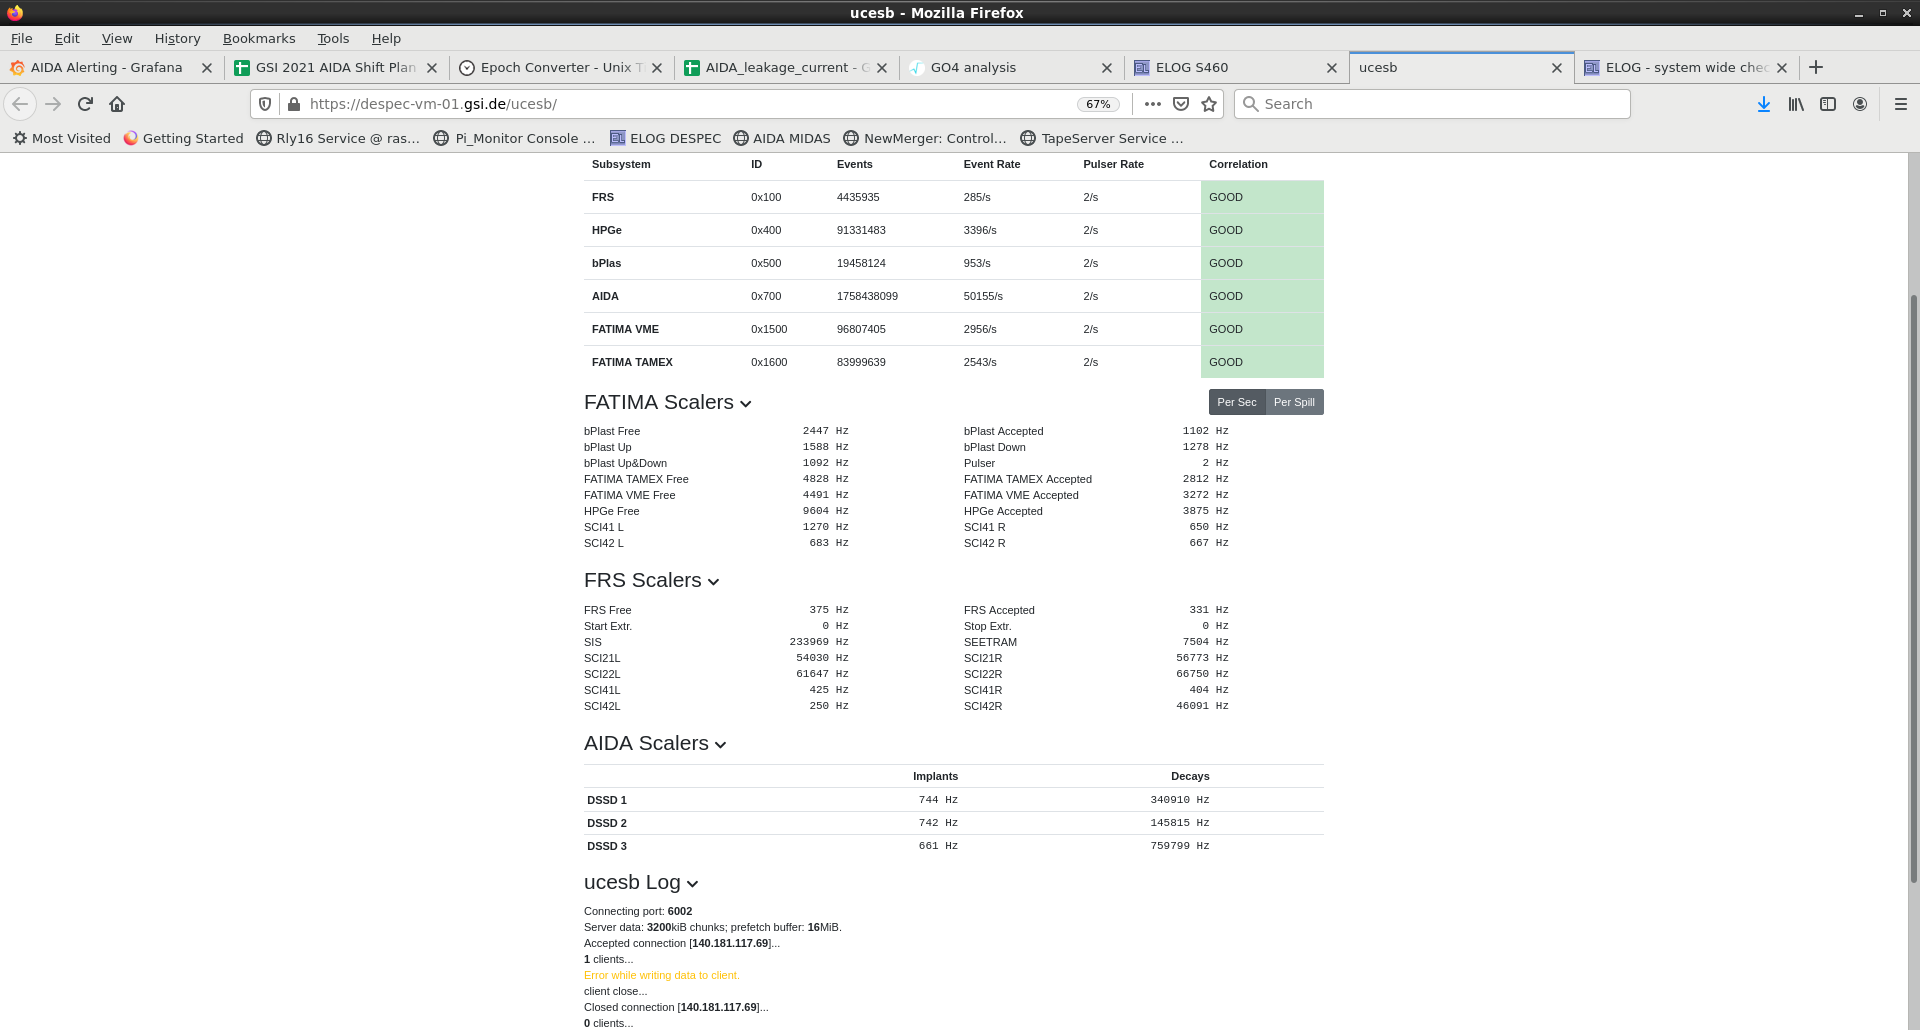
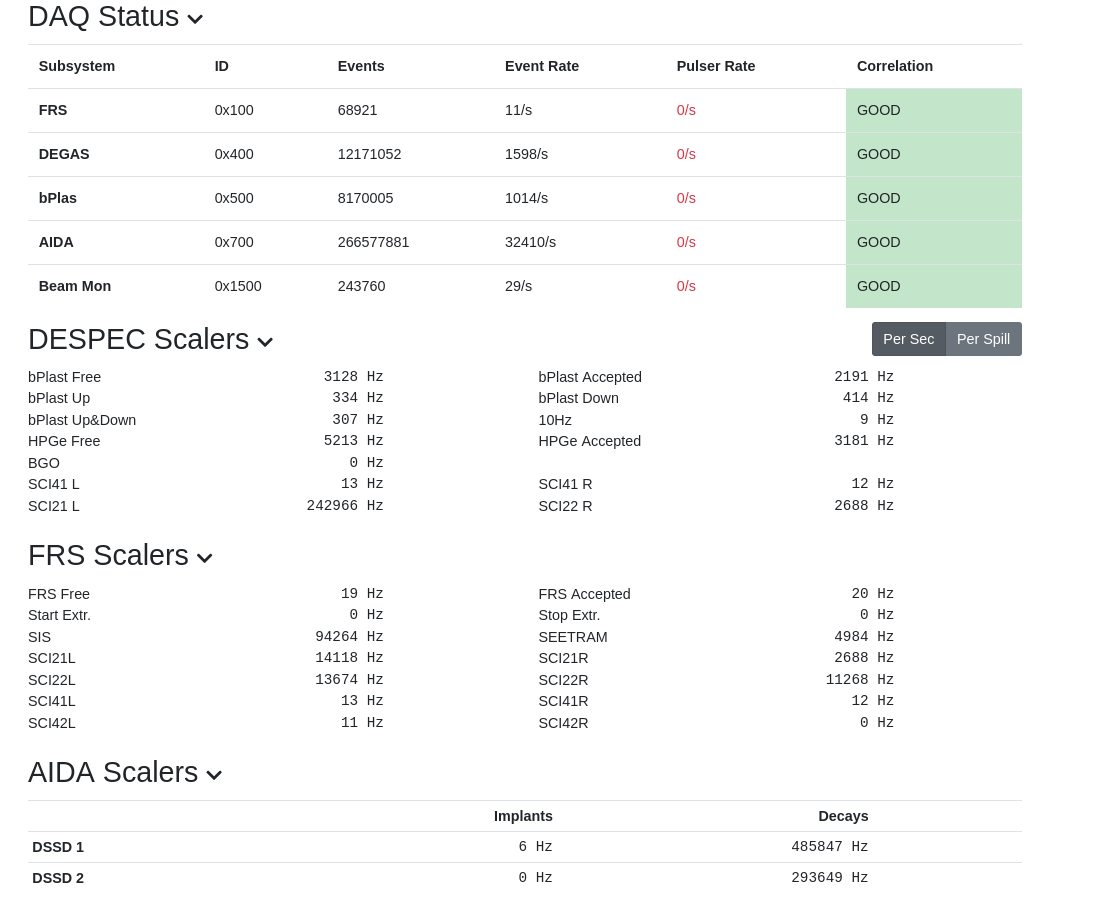
ucesb rates dropped a bit in all scalers so beam intensity must have dropped a bit.

System wide check done and same results as earlier:

aida09 fails clock (1), aida02 06 09 10 13 fail ADC calibration, all pass WR
Attachment 1: Stats_Screenshot_from_2022-05-14_02-48-14.png
Stats_Screenshot_from_2022-05-14_02-48-14.png
Attachment 2: Temp_Screenshot_from_2022-05-14_02-47-31.png
Temp_Screenshot_from_2022-05-14_02-47-31.png
Attachment 3: HV_LC_Screenshot_from_2022-05-14_02-46-42.png
HV_LC_Screenshot_from_2022-05-14_02-46-42.png
Attachment 4: ucesb_rates_Screenshot_from_2022-05-14_02-50-36.png
ucesb_rates_Screenshot_from_2022-05-14_02-50-36.png
Attachment 5: Grafana_Screenshot_from_2022-05-14_03-50-00.png
Grafana_Screenshot_from_2022-05-14_03-50-00.png
  457   Sun May 15 15:51:49 2022 MLSunday 15th May 16:00-0:00

Status at 16:45 (CET)

The expreiment continues to run smoothly.

AIDA Stats look ok - Attachment 1

AIDA Temperature ok - Attachment 2

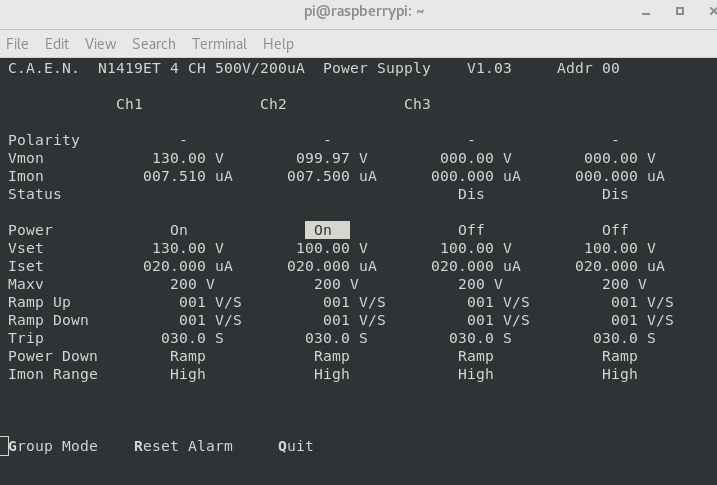
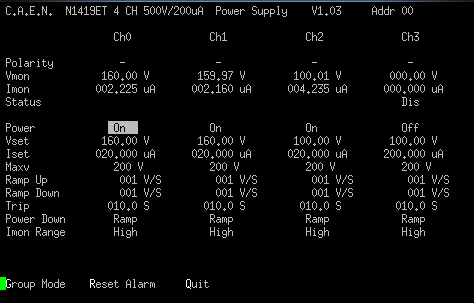
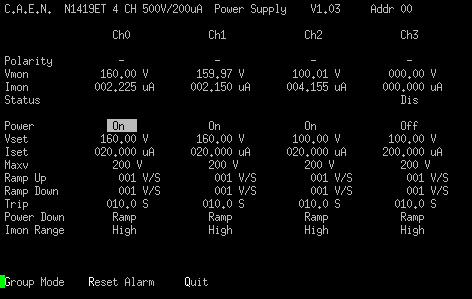
AIDA Leakage current: ok - Attachment 3

System wide check:

Clock: 13 passed, 1 failed (aida09)

ADC Calibration: 9 passed, 5 fialed (aida2,6,9,10,13)

White rabbit decoder: 14 passed, 0 failed.

FPGA timestamp: 14 passed, 0 failed.


Status at 18:45 (CET):

All rates ok on ucesb.

AIDA Stats ok - Attachment 4

AIDA Temperature ok - Attachment 5

AIDA Leakage current: increase slightly - Attachment 6

System wide check: No changes, same as above


Status at 20:45 (CET):

All rates ok on ucesb.

AIDA Stats ok - Attachment 7

AIDA Temperature ok - Attachment 8

AIDA Leakage current: increase slightly - Attachment 9

System wide check: No changes, same as above


Status at 22:45 (CET):

All rates ok on ucesb.

AIDA Stats ok - Attachment 10

AIDA Temperature ok - Attachment 11

AIDA Leakage current: increase slightly - Attachment 12

System wide check: No changes, same as above

Attachment 1: Stats_Screenshot_from_2022-05-15_16-49-06.png
Stats_Screenshot_from_2022-05-15_16-49-06.png
Attachment 2: Temp_Screenshot_from_2022-05-15_16-48-31.png
Temp_Screenshot_from_2022-05-15_16-48-31.png
Attachment 3: HV_LC_Screenshot_from_2022-05-15_16-47-44.png
HV_LC_Screenshot_from_2022-05-15_16-47-44.png
Attachment 4: Stats_Screenshot_from_2022-05-15_18-43-16.png
Stats_Screenshot_from_2022-05-15_18-43-16.png
Attachment 5: Temp_Screenshot_from_2022-05-15_18-44-06.png
Temp_Screenshot_from_2022-05-15_18-44-06.png
Attachment 6: HV_LC_Screenshot_from_2022-05-15_18-42-23.png
HV_LC_Screenshot_from_2022-05-15_18-42-23.png
Attachment 7: Stats_Screenshot_from_2022-05-15_20-42-03.png
Stats_Screenshot_from_2022-05-15_20-42-03.png
Attachment 8: Temp_Screenshot_from_2022-05-15_20-42-42.png
Temp_Screenshot_from_2022-05-15_20-42-42.png
Attachment 9: HV_LC_Screenshot_from_2022-05-15_20-36-28.png
HV_LC_Screenshot_from_2022-05-15_20-36-28.png
Attachment 10: Stats_Screenshot_from_2022-05-15_22-43-37.png
Stats_Screenshot_from_2022-05-15_22-43-37.png
Attachment 11: Temp_Screenshot_from_2022-05-15_22-44-20.png
Temp_Screenshot_from_2022-05-15_22-44-20.png
Attachment 12: HV_LC_Screenshot_from_2022-05-15_22-42-36.png
HV_LC_Screenshot_from_2022-05-15_22-42-36.png
  152   Sat Mar 14 23:09:28 2020 MB, SJ, MRSunday 15th March 0:00-8:00

AIDA ELog filled out by DESPEC night shift members Matthew Brunet (MB), Shaheen Jazrawi (SJ), and Matthias Rudiger (MR).

0:05-0:08 Beam operators altering settings, beam off/sporadic during this period.

0:46
    All system wide checks passed
    Leak currents lower than previous measurement - attachment #1
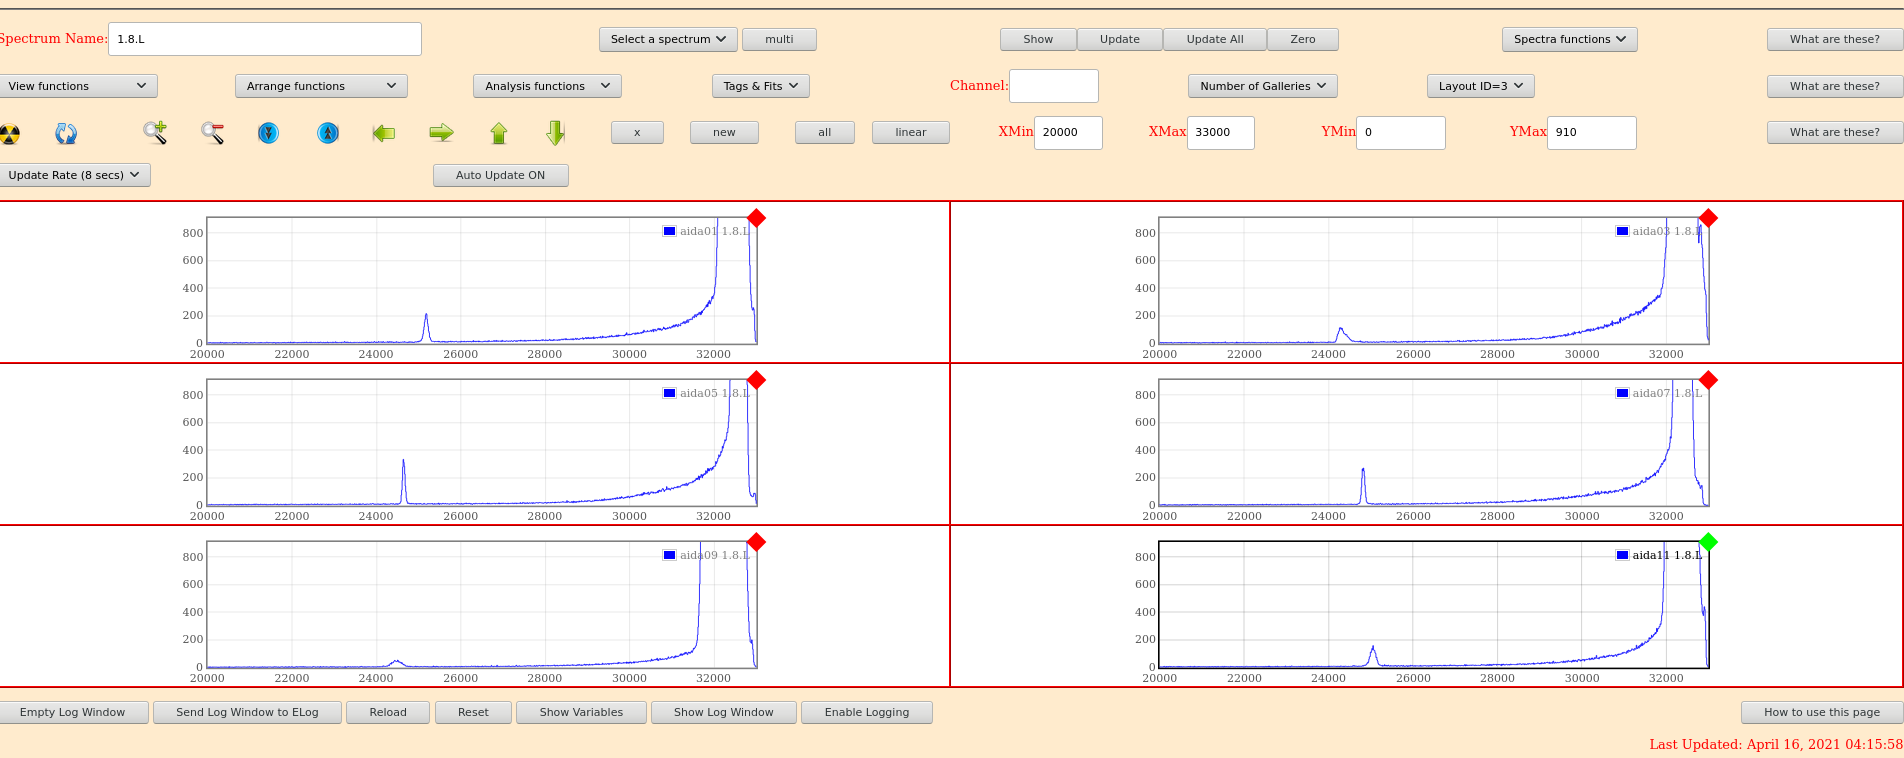
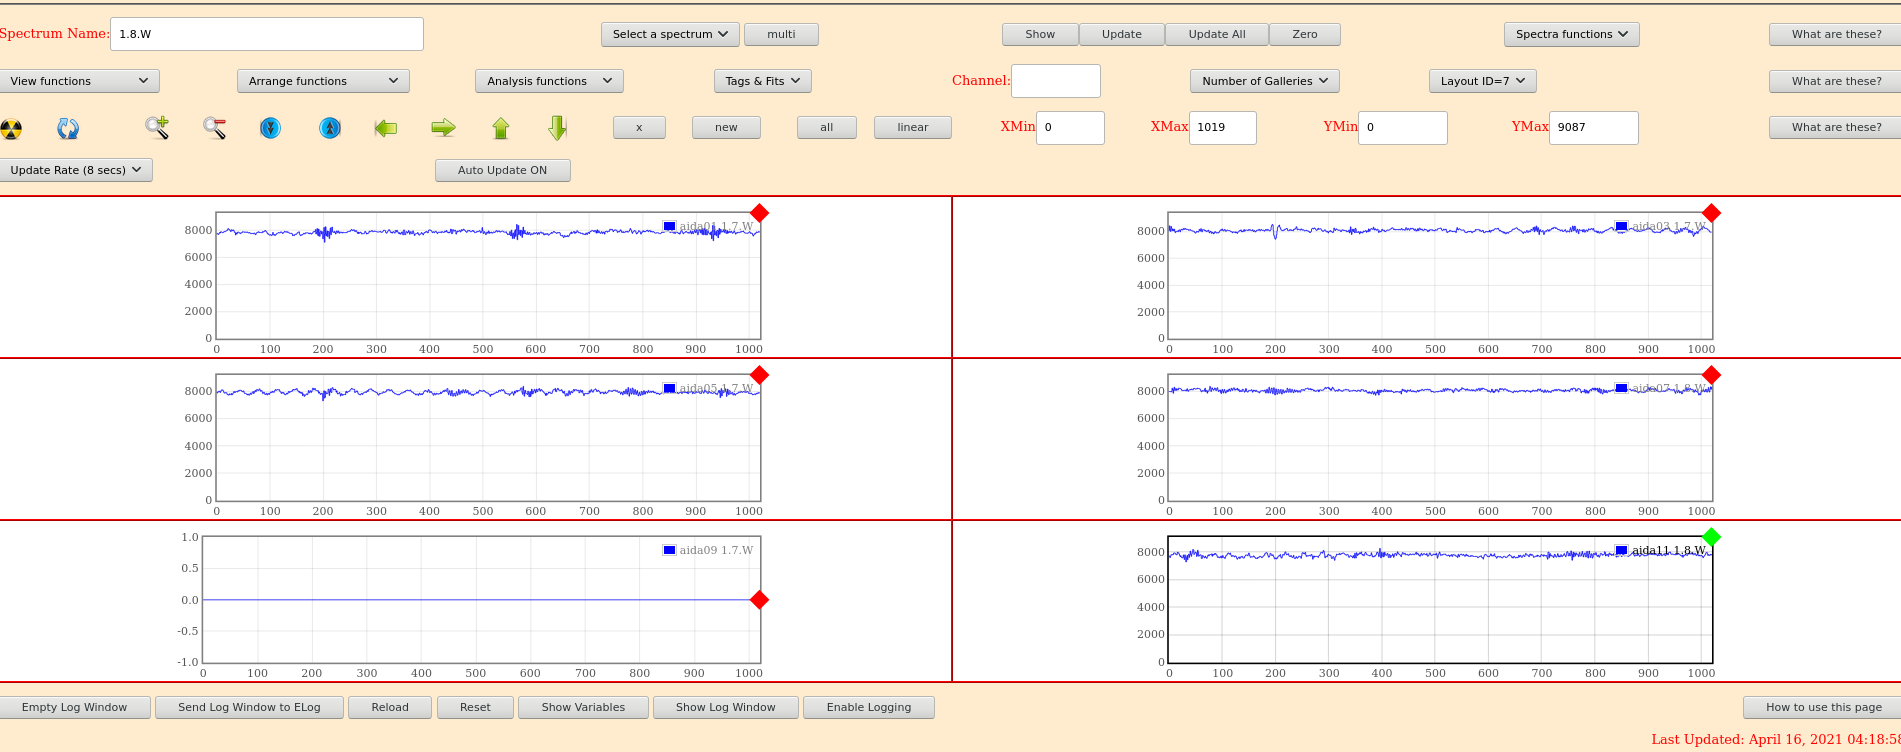
    Implants look as previously - attachment #2
    Stats about where they have been - attachment #3
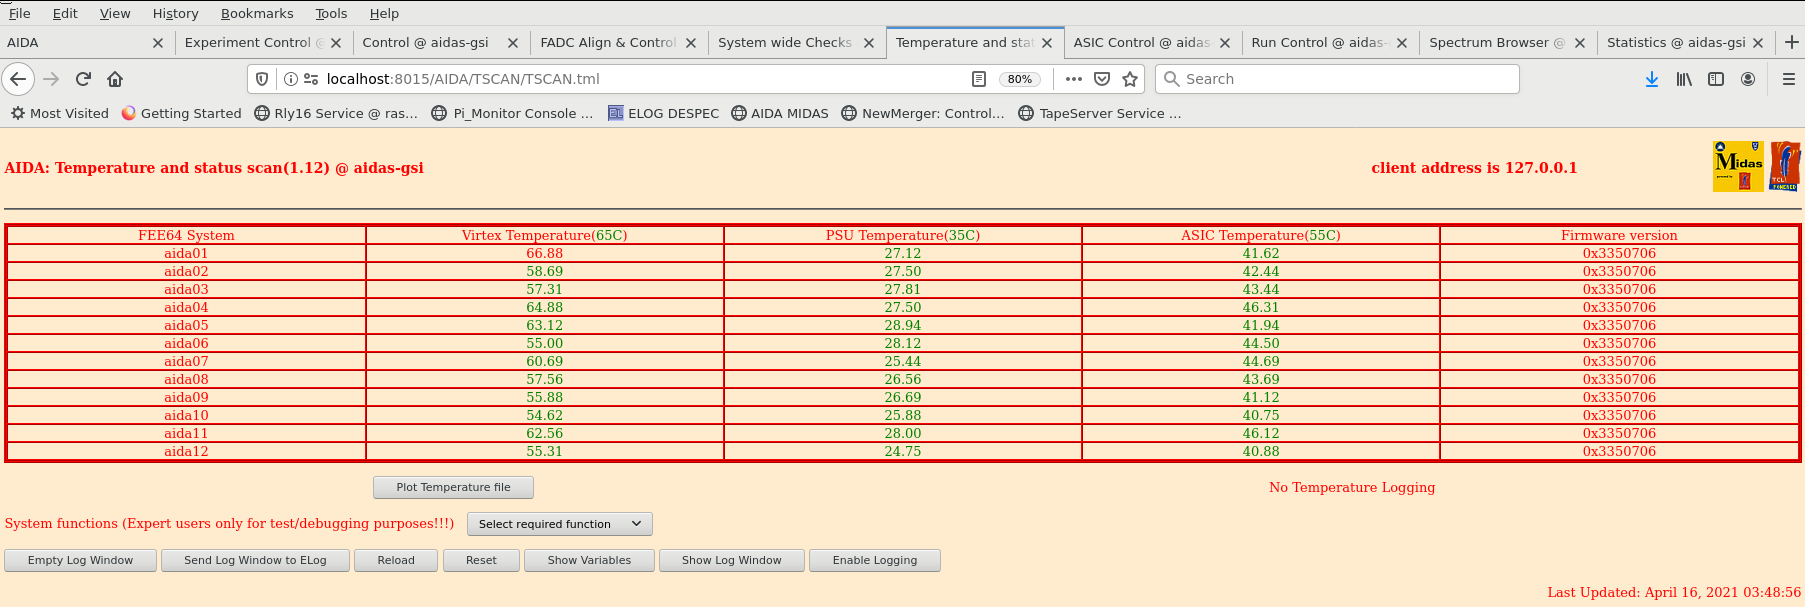
    FEE temperatures fine - attachment #4
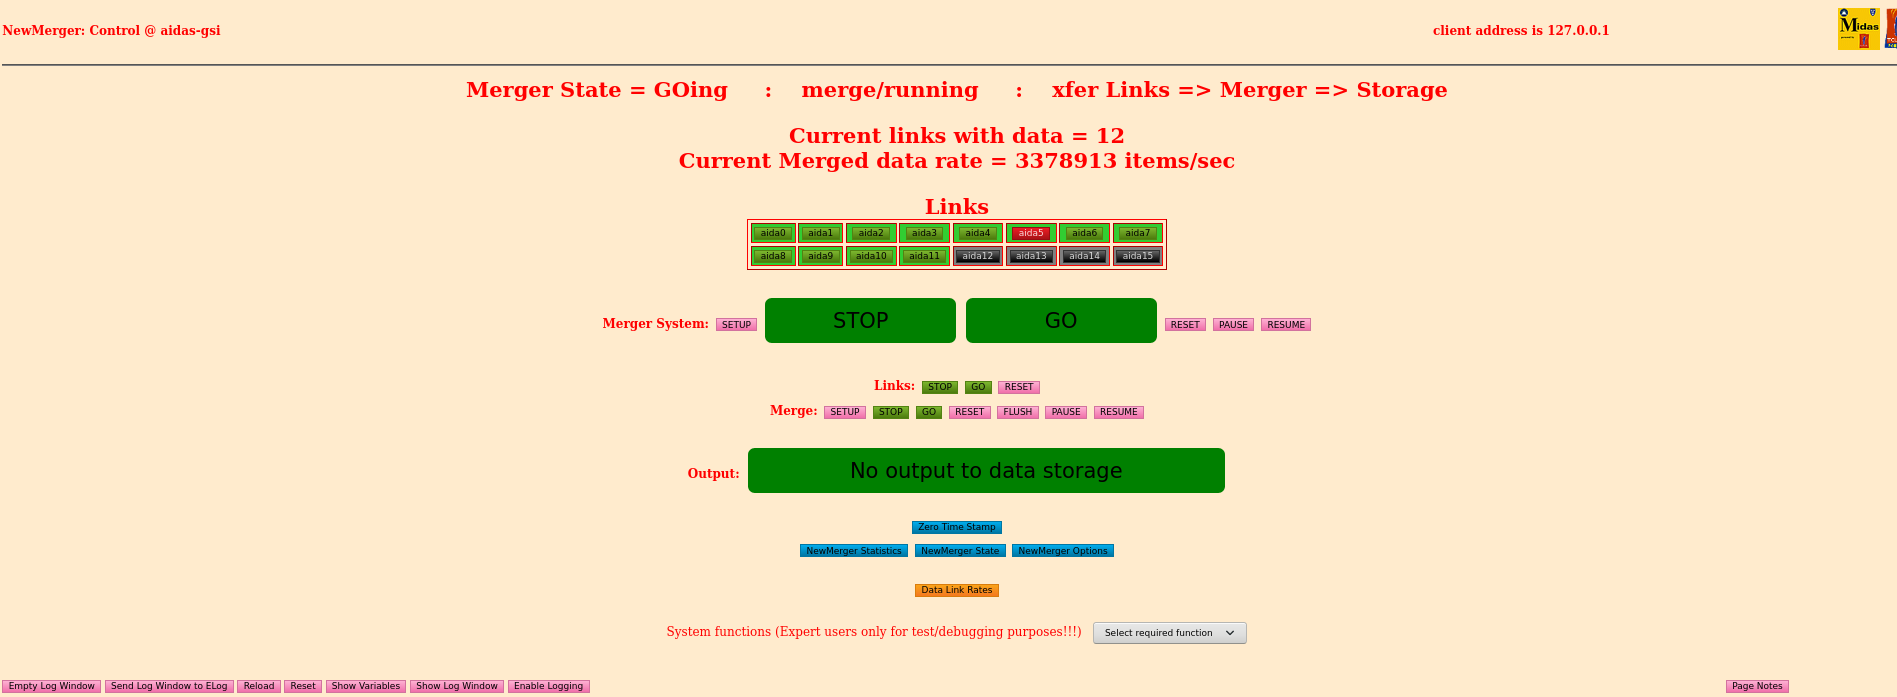
    Merger fine, 3 Mega items / sec
    TapeServer writing about 25 MB/s


2:46

      All system wide checks passed
     Leak currents similar to previous - attachment #5 
     Implants look as previously - attachment #6
     Stats about where they have been - attachment #7
     FEE temperatures fine - attachment #8
     Merger fine, 3 Mega items / sec
     TapeServer writing about 27 MB/s
 

4:49

      All system wide checks passed
     Leak currents similar to previous - attachment #9
     Implants look as previously - attachment #10
     Stats good - attachment #11
     FEE temperatures fine - attachment #12
     Merger fine, 3 Mega items / sec
     TapeServer writing about 27 MB/s

6:49

      All system wide checks passed
     Leak currents no significant change - attachment #13
     Implants look as previously - attachment #14
     Stats good - attachment #15
     FEE temperatures fine - attachment #16
     Merger fine, 3 Mega items / sec
     TapeServer writing about 25 MB/s

Attachment 1: Matt-15-BiasesA.png
Matt-15-BiasesA.png
Attachment 2: Matt-15-HistosA.png
Matt-15-HistosA.png
Attachment 3: Matt-15-StatsA.png
Matt-15-StatsA.png
Attachment 4: Matt-15-TempsA-.png
Matt-15-TempsA-.png
Attachment 5: Matt-15-BiasesB.png
Matt-15-BiasesB.png
Attachment 6: Matt-15-HistosB.png
Matt-15-HistosB.png
Attachment 7: Matt-15-StatsB.png
Matt-15-StatsB.png
Attachment 8: Matt-15-TempsB.png
Matt-15-TempsB.png
Attachment 9: Matt-15-BiasesC.png
Matt-15-BiasesC.png
Attachment 10: Matt-15-HistosC.png
Matt-15-HistosC.png
Attachment 11: Matt-15-StatsC.png
Matt-15-StatsC.png
Attachment 12: Matt-15-TempsC.png
Matt-15-TempsC.png
Attachment 13: Matt-15-BiasesD.png
Matt-15-BiasesD.png
Attachment 14: Matt-15-HistosD.png
Matt-15-HistosD.png
Attachment 15: Matt-15-StatsD.png
Matt-15-StatsD.png
Attachment 16: Matt-15-TempsD.png
Matt-15-TempsD.png
  266   Fri Apr 23 13:13:46 2021 MA, TDFriday 23 April 12.00-16.00
14.15 System wide checks

FEE64 module aida06 global clocks failed, 6
 Clock status test result: Passed 11, Failed 1

Understand status as follows
Status bit 3 : firmware PLL that creates clocks from external clock not locked
Status bit 2 : always logic '1' 
Status bit 1 : LMK3200(2) PLL and clock distribution chip not locked to external clock
Status bit 0 : LMK3200(1) PLL and clock distribution chip not locked to external clock
If all these bits are not set then the operation of the firmware is unreliable

FEE64 module aida06 failed
FEE64 module aida07 failed
FEE64 module aida12 failed
Calibration test result: Passed 9, Failed 3

If any modules fail calibration , check the clock status and open the FADC Align and Control browser page to rerun calibration for that module

	 Base 		Current 	Difference
aida06 fault 	 0x679f : 	 0x67a2 : 	 3  
White Rabbit error counter test result: Passed 11, Failed 1

Understand the status reports as follows:-
Status bit 3 : White Rabbit decoder detected an error in the received data
Status bit 2 : Firmware registered WR error, no reload of Timestamp
Status bit 0 : White Rabbit decoder reports uncertain of Timestamp information from WR

FPGA timestamp errors - reports 'server internal error'

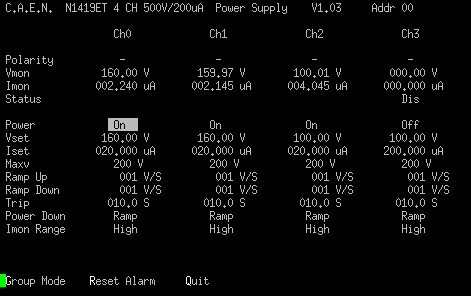
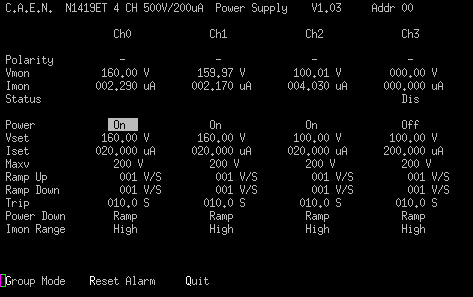
14.16 DSSSD bias & leakage currents OK - attachment 1
      FEE64 temps OK - attachment 2
      good events stats - attachment 3

14.22 DAQ continues file S460/R51_205
      beam intensity 2.2e+09/s


15:53 system check
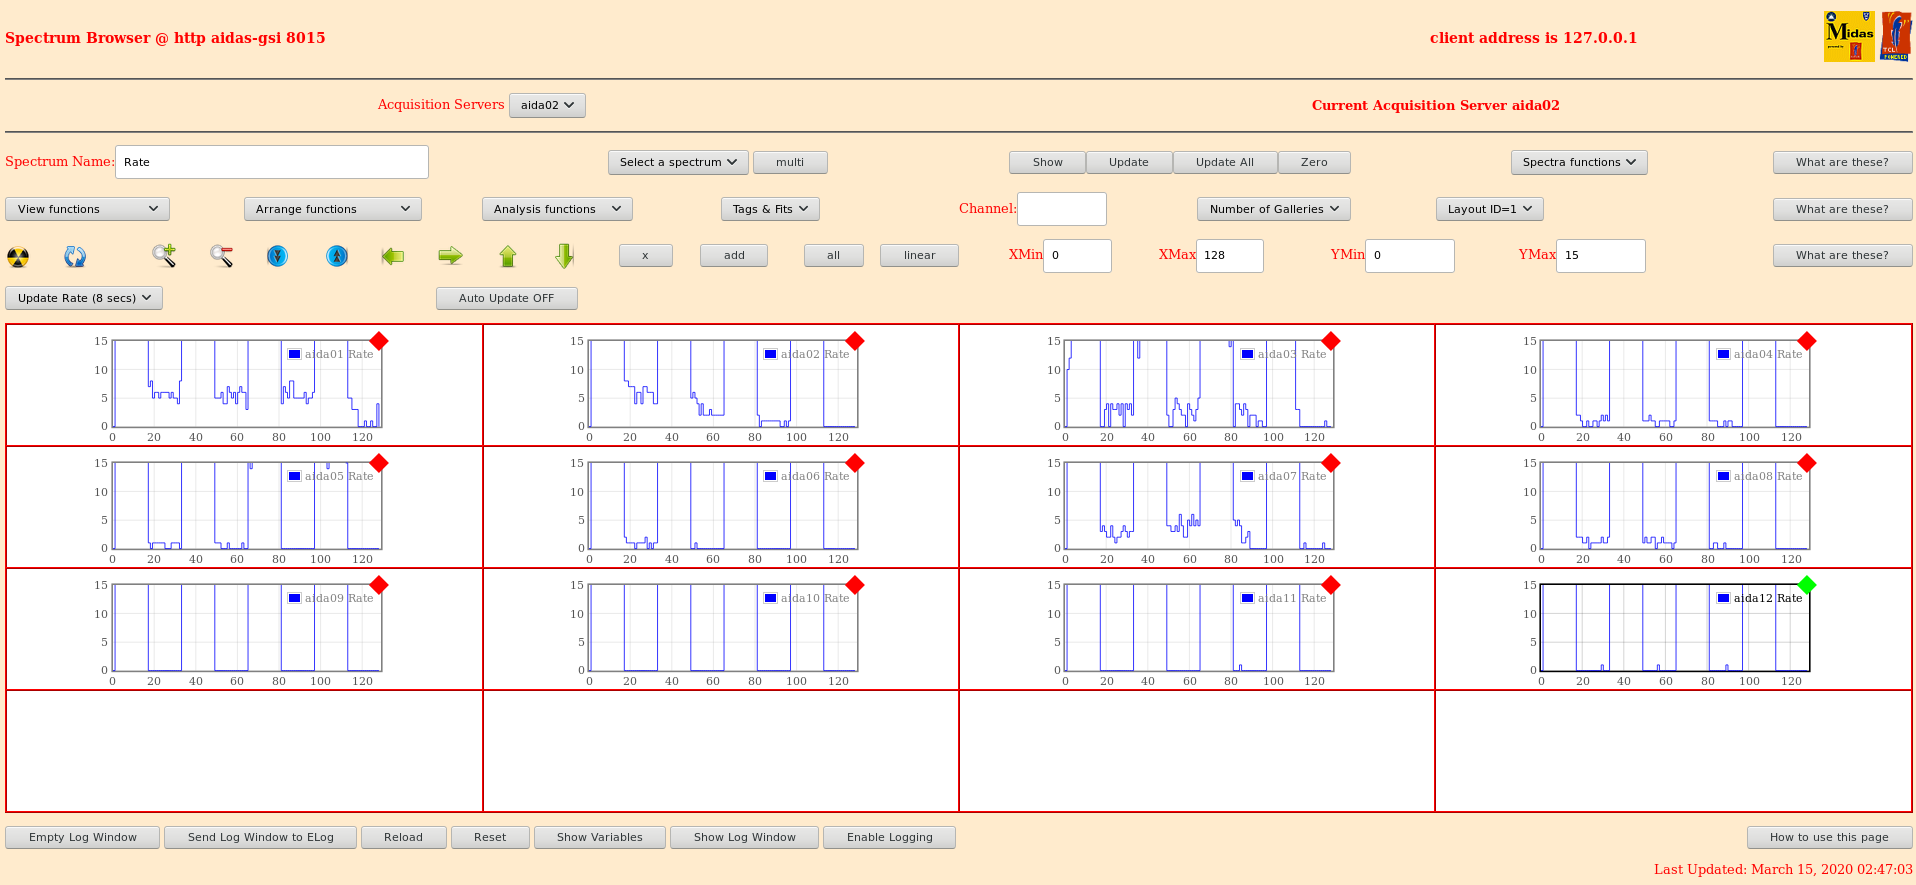
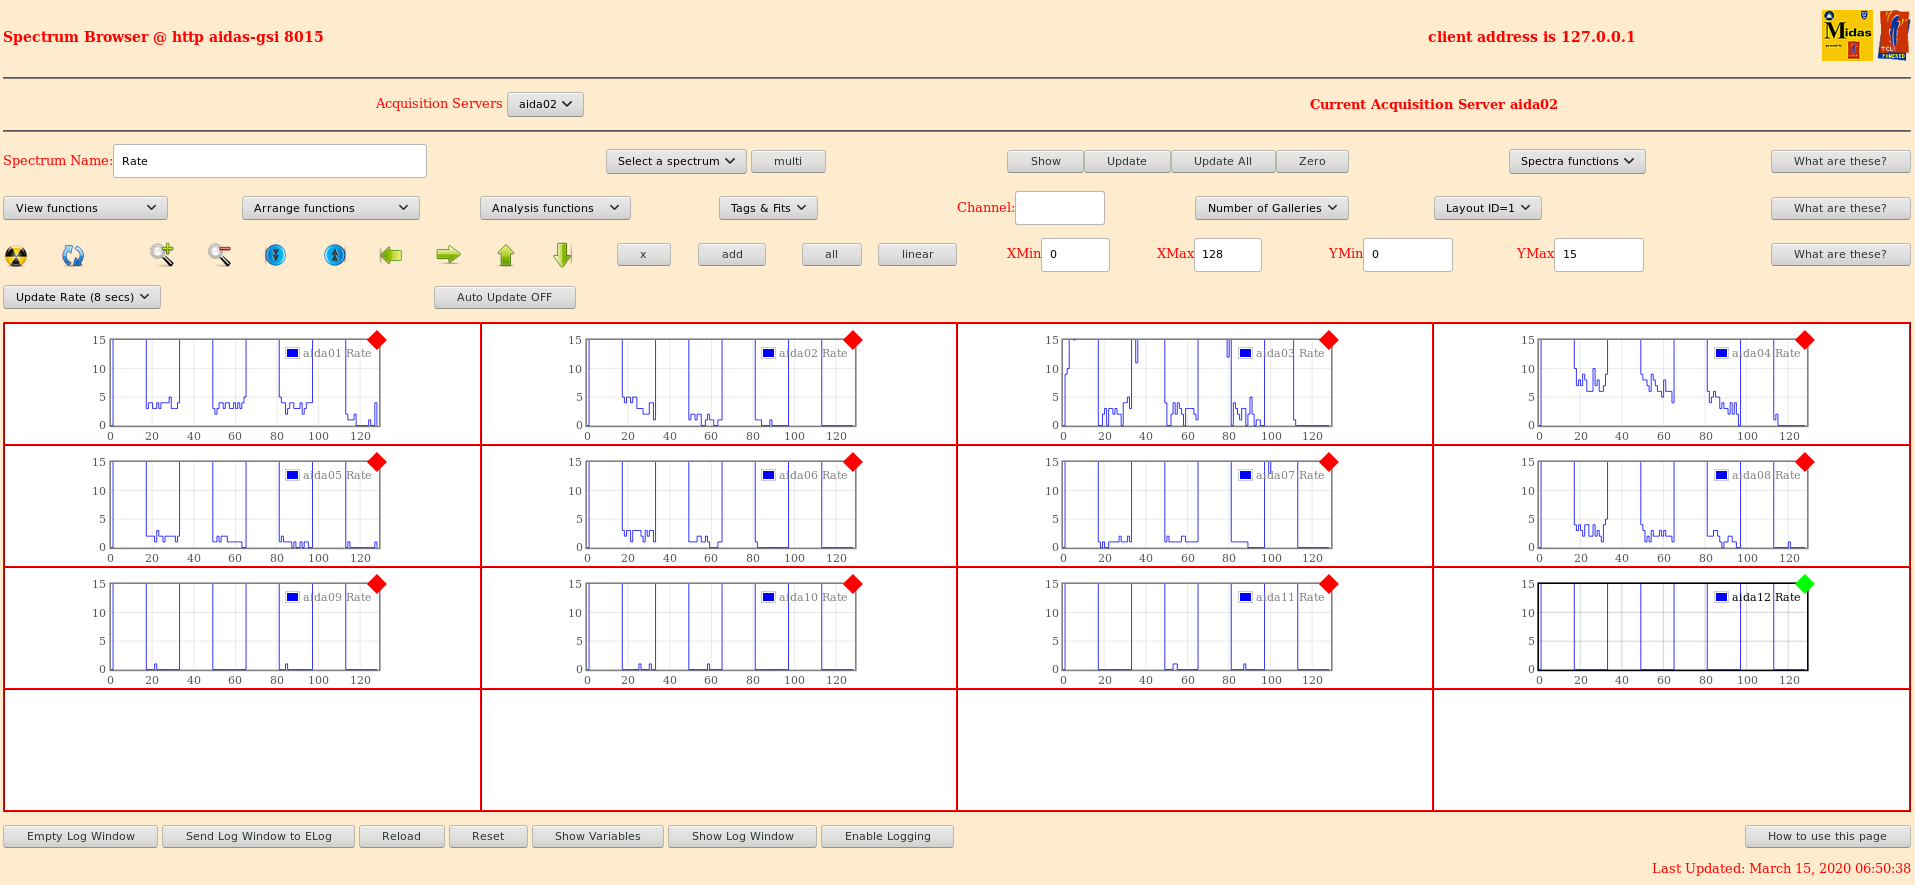
Rates, Temperatures, Voltages are ok and attached 4,5,6


Clock check

FEE64 module aida06 global clocks failed, 6
 Clock status test result: Passed 11, Failed 1

Understand status as follows
Status bit 3 : firmware PLL that creates clocks from external clock not locked
Status bit 2 : always logic '1' 
Status bit 1 : LMK3200(2) PLL and clock distribution chip not locked to external clock
Status bit 0 : LMK3200(1) PLL and clock distribution chip not locked to external clock
If all these bits are not set then the operation of the firmware is unreliable

ADC check

FEE64 module aida06 failed
FEE64 module aida07 failed
FEE64 module aida12 failed
Calibration test result: Passed 9, Failed 3

If any modules fail calibration , check the clock status and open the FADC Align and Control browser page to rerun calibration for that module


White Rabbit


		 Base 		Current 	Difference
aida06 fault 	 0x679f : 	 0x67a2 : 	 3  
White Rabbit error counter test result: Passed 11, Failed 1

Understand the status reports as follows:-
Status bit 3 : White Rabbit decoder detected an error in the received data
Status bit 2 : Firmware registered WR error, no reload of Timestamp
Status bit 0 : White Rabbit decoder reports uncertain of Timestamp information from WR


FPGA
Loge page error!

Memory check
Returned 0 0 0 0 0 0 0 0 0 0 0 0  
Mem(KB) :	4	8	16	32	64	128	256	512	1k	2k	4k
aida01 :     23      6      2      1      2      3      2      4      2      3      6   : 36044
aida02 :     15      3      2      2      0      3      2      3      2      3      4   : 27188
aida03 :     29      4      0      3      2      4      2      2      3      3      6   : 36212
aida04 :      4      6      4      4      2      3      3      3      3      3      6   : 36864
aida05 :     19      5      4      2      3      3      1      3      3      3      6   : 36404
aida06 :     24      9      5      2      3      3      3      2      3      3      6   : 36472
aida07 :     20      4      9      0      2      3      2      2      3      3      6   : 36096
aida08 :     22      9      4      3      1      3      1      3      3      3      6   : 36352
aida09 :     20      7      3      2      2      3      3      2      3      3      6   : 36344
aida10 :     25      9      9      5      2      3      2      3      3      3      6   : 36828
aida11 :     24     11      2      0      1      3      1      3      3      3      6   : 36248
aida12 :     26      5      4      2      1      3      2      2      3      3      6   : 36048
Attachment 1: 200.png
200.png
Attachment 2: Screenshot_2021-04-23_Temperature_and_status_scan_aidas-gsi(4).png
Screenshot_2021-04-23_Temperature_and_status_scan_aidas-gsi(4).png
Attachment 3: Screenshot_2021-04-23_Statistics_aidas-gsi(4).png
Screenshot_2021-04-23_Statistics_aidas-gsi(4).png
Attachment 4: 210423_1550_Voltages.png
210423_1550_Voltages.png
Attachment 5: 210423_1550_Stats.png
210423_1550_Stats.png
Attachment 6: 210423_1550_Temp.png
210423_1550_Temp.png
  528   Tue Mar 5 09:10:01 2024 MA, JB, TDTuesday 5 March
Old ribbon cable assemblies - attachments 1  2

Length of cable from base of AIDA snout assembly to Samtec FFSD ribbon cable connectors

p+n junction side 10-11cm & 25.5cm
n+n Ohmic side 11cm & 25cm

Distance from Delron base of AIDA snout assembly to Samtec CLP connectors ( Kapton PCBs ) 51.5cm & 52.5cm


Manufacture of new ribbon cable assemblies - attachment 3

8x 2x 29" Samtec FFSD 34-way cables
8x 2x 23" Samtec FFSD 34-way cables


17.52 from Helena

"These are the detector positions within the snout:

Total snout length of 573 mm (380 mm bottom stage + 193 top stage), relative to the 'black flange' of the AIDA frame

Upstream AIDA @ 513 mm

Downstream AIDA @ 523 mm

This leaves 5cm space for the Downstream bPlast AND the BB7 layer together. I believe this should be enough space - can you all confirm for AIDA/bPlast/BB7 if this is 
agreed upon? It would be great to get a fast response so that we are ready for mounting tomorrow. If we need more space we could think of shifting everything upstream by 
10mm.

The upstream bPlast will need to go first such that the upstream AIDA is at 513mm. I don't have the measurements to hand to give the position."
Attachment 1: 20240305_101140.jpg
20240305_101140.jpg
Attachment 2: 20240305_101146.jpg
20240305_101146.jpg
Attachment 3: 20240305_165949.jpg
20240305_165949.jpg
  306   Wed May 12 02:07:59 2021 MA, BAWed 12 May 00:00-08:00

03:12 System Check

attachment 1 : Current

attachment 2 : Temperature

attachment 3 : Rates


Clock status test result: Passed 16, Failed 0

Understand status as follows
Status bit 3 : firmware PLL that creates clocks from external clock not locked
Status bit 2 : always logic '1'
Status bit 1 : LMK3200(2) PLL and clock distribution chip not locked to external clock
Status bit 0 : LMK3200(1) PLL and clock distribution chip not locked to external clock
If all these bits are not set then the operation of the firmware is unreliable

   
Calibration test result: Passed 16, Failed 0

If any modules fail calibration , check the clock status and open the FADC Align and Control browser page to rerun calibration for that module

   
         Base         Current     Difference
aida05 fault      0x36ca :      0x36cb :      1  
White Rabbit error counter test result: Passed 15, Failed 1

Understand the status reports as follows:-
Status bit 3 : White Rabbit decoder detected an error in the received data
Status bit 2 : Firmware registered WR error, no reload of Timestamp
Status bit 0 : White Rabbit decoder reports uncertain of Timestamp information from WR


             Base         Current         Difference
aida13 fault      0xa :      0xf :      5  
FPGA Timestamp error counter test result: Passed 15, Failed 1
If any of these counts are reported as in error
The ASIC readout system has detected a timeslip.
That is the timestamp read from the time FIFO is not younger than the last

   
Returned 0 0 0 0 0 0 0 0 0 0 0 0 0 0 0 0  
Mem(KB) :    4    8    16    32    64    128    256    512    1k    2k    4k
aida01 :     22      5      7      2      1      2      2      3      3      3      6   : 36464
aida02 :      9      8      3      3      1      4      1      2      4      3      6   : 36916
aida03 :      5      2      6      2      0      3      2      3      3      3      6   : 36420
aida04 :      6      5      2      3      4      4      2      3      3      3      6   : 36800
aida05 :     17      6      6      2      2      4      1      3      2      4      6   : 37524
aida06 :      7     12      3      4      3      3      1      3      3      3      6   : 36460
aida07 :     17     11      5      1      3      3      3      2      3      3      6   : 36428
aida08 :      3      5      0      1      4      2      2      4      2      3      6   : 35924
aida09 :     27      6      4      2      0      2      2      2      3      3      6   : 35868
aida10 :     16     11      8      0      2      2      1      3      2      4      6   : 37272
aida11 :     15      2      2      3      1      4      3      4      2      3      6   : 36364
aida12 :      1      6      4      3      1      3      2      4      2      3      6   : 35988
aida13 :     22     14     10      2      4      2      2      4      2      3      6   : 36264
aida14 :     26     10      4      3      2      1      1      3      3      3      6   : 36184
aida15 :     14      2      3      2      2      4      1      2      3      3      6   : 35896
aida16 :      7      5      4      0      2      4      2      3      2      3      6   : 35588

06:10 DSSD1 rate high!

Attached 4

Called OH and he woke up to fix it :)

It was a problem with one of the ASIC according to what he says:

One of the ASICs HEC was running crazy!. Forced the ASICs to check their settings which brings them to back into line see attachment 9. This done by around 06:35


07:03 System check

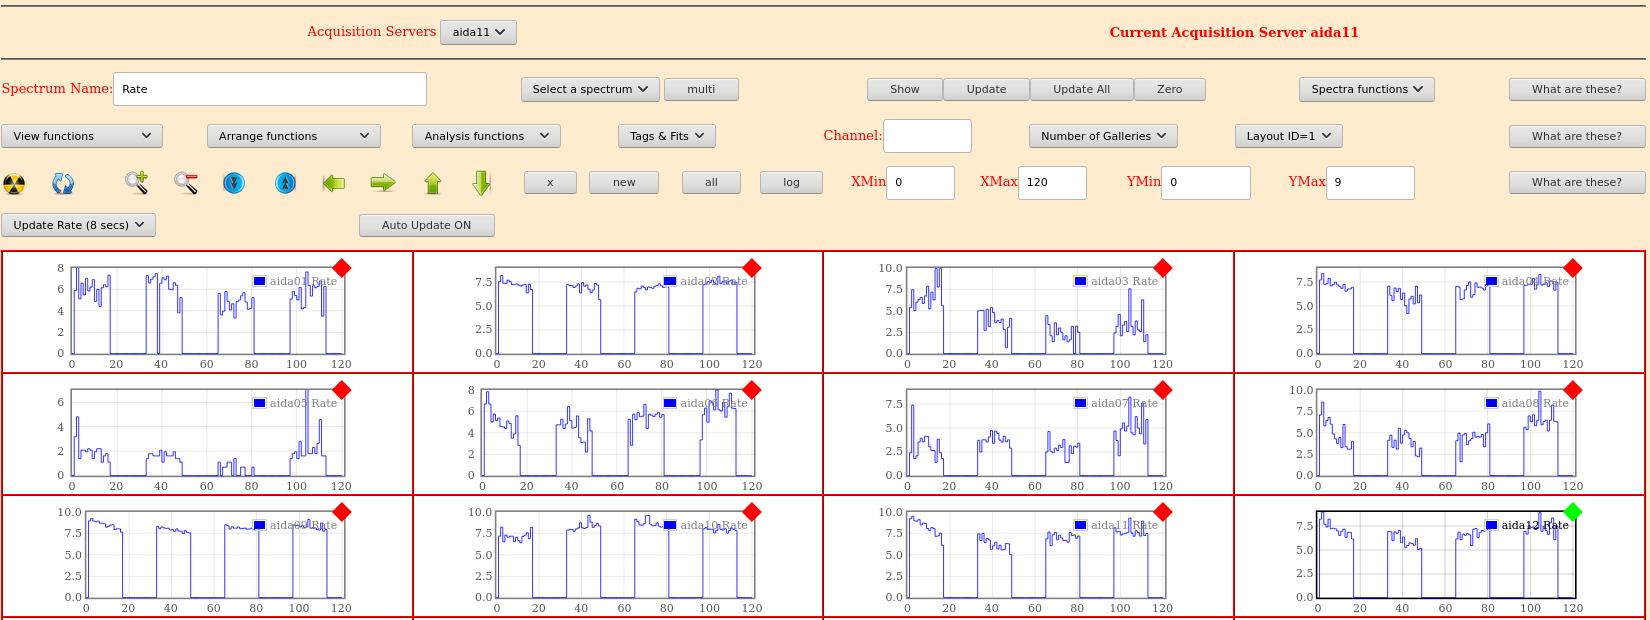
attachment 5 Spectrum rate

attachment 6 Voltages

attachment 7 Rates

attachment 8 Temperature

System wide clock are all ok except

White rabbit

 Base         Current     Difference
aida05 fault      0x36ca :      0x36cb :      1  
White Rabbit error counter test result: Passed 15, Failed 1

Understand the status reports as follows:-
Status bit 3 : White Rabbit decoder detected an error in the received data
Status bit 2 : Firmware registered WR error, no reload of Timestamp
Status bit 0 : White Rabbit decoder reports uncertain of Timestamp information from WR

FPGA

 Base         Current         Difference
aida13 fault      0xa :      0x14 :      10  
FPGA Timestamp error counter test result: Passed 15, Failed 1
If any of these counts are reported as in error
The ASIC readout system has detected a timeslip.
That is the timestamp read from the time FIFO is not younger than the last


Attachment 1: 1205_0310.png
1205_0310.png
Attachment 2: 1205_0311.png
1205_0311.png
Attachment 3: 1205_0312.png
1205_0312.png
Attachment 4: 120521_0630ucesb.png
120521_0630ucesb.png
Attachment 5: 120521_0639_SpecRates.png
120521_0639_SpecRates.png
Attachment 6: 120521_0655_Voltages.png
120521_0655_Voltages.png
Attachment 7: 120521_0657_Rates.png
120521_0657_Rates.png
Attachment 8: 120521_0685_Temp.png
120521_0685_Temp.png
Attachment 9: 120521_0635_ASICs.png
120521_0635_ASICs.png
  243   Mon Apr 19 01:08:40 2021 MAMonday 19th April 00:00-08:00

03:09   General check

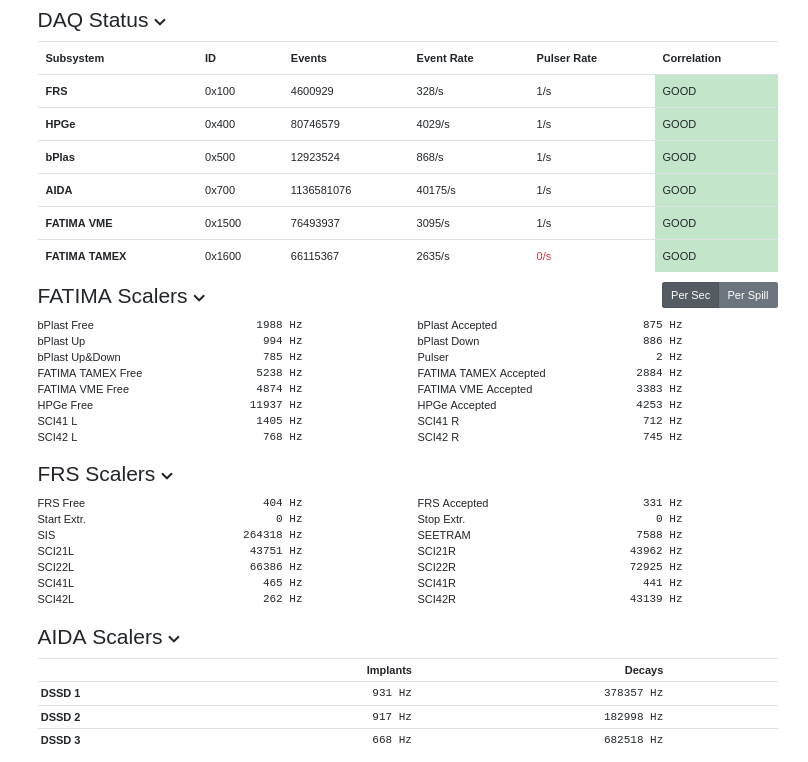
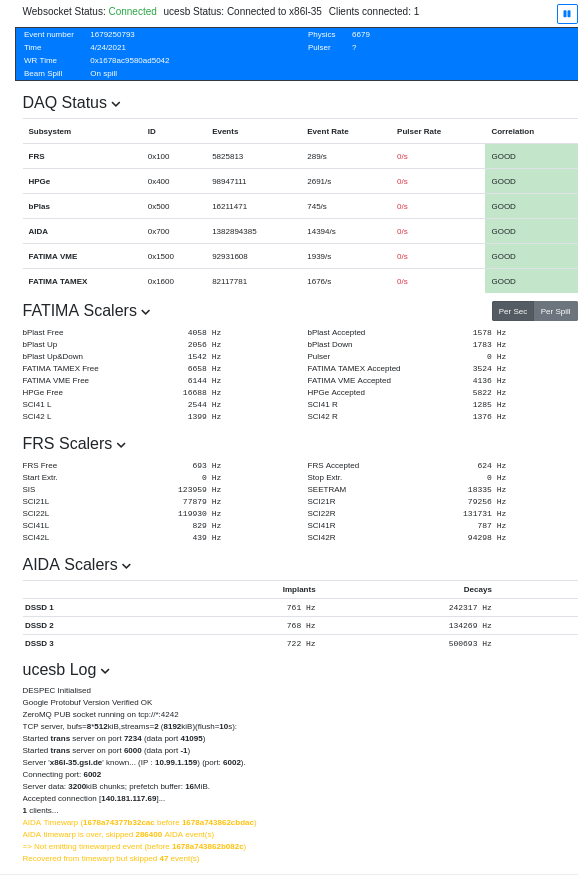
Rates, temptature, voltages are OK attached 1, 2, 3, 4


****Clock Ckeck******

OK
Clock status test result: Passed 12, Failed 0

Understand status as follows
Status bit 3 : firmware PLL that creates clocks from external clock not locked
Status bit 2 : always logic '1'
Status bit 1 : LMK3200(2) PLL and clock distribution chip not locked to external clock
Status bit 0 : LMK3200(1) PLL and clock distribution chip not locked to external clock
If all these bits are not set then the operation of the firmware is unreliable

******ADC check ******
FEE64 module aida06 failed
FEE64 module aida07 failed
FEE64 module aida10 failed
Calibration test result: Passed 9, Failed 3

If any modules fail calibration , check the clock status and open the FADC Align and Control browser page to rerun calibration for that module

****** White Rabbit check******

     Base         Current     Difference
aida01 fault      0x7686 :      0x768a :      4  
aida02 fault      0x941d :      0x9421 :      4  
aida03 fault      0x7cd7 :      0x7cdb :      4  
aida04 fault      0xb86d :      0xb871 :      4  
aida05 fault      0x1a59 :      0x1a61 :      8  
aida06 fault      0x4f45 :      0x4f4d :      8  
aida07 fault      0x3bfc :      0x3c2c :      48  
aida08 fault      0xc7ce :      0xc7d5 :      7  
aida09 fault      0xb33b :      0xb33c :      1  
White Rabbit error counter test result: Passed 3, Failed 9

Understand the status reports as follows:-
Status bit 3 : White Rabbit decoder detected an error in the received data
Status bit 2 : Firmware registered WR error, no reload of Timestamp
Status bit 0 : White Rabbit decoder reports uncertain of Timestamp information from WR

*****FPGA check ******


             Base         Current         Difference
aida09 fault      0x1 :      0x2 :      1  
aida12 fault      0xa :      0x10 :      6  
FPGA Timestamp error counter test result: Passed 10, Failed 2
If any of these counts are reported as in error
The ASIC readout system has detected a timeslip.
That is the timestamp read from the time FIFO is not younger than the last

*****Memory check*****


Returned 0 0 0 0 0 0 0 0 0 0 0 0  
Mem(KB) :    4    8    16    32    64    128    256    512    1k    2k    4k
aida01 :      6     12     11      7      2      3      2      4      2      3      6   : 36360
aida02 :     21     15      7      3      2      3      1      4      2      3      6   : 35996
aida03 :      9     10     10      2      4      3      3      3      2      3      6   : 36052
aida04 :     17     17     17      4      0      2      3      4      2      3      6   : 36444
aida05 :     25      7      3      1      1      1      2      3      2      4      6   : 37292
aida06 :     29     15      7      2      3      4      1      3      3      3      6   : 36700
aida07 :     17     17      6      5      2      3      2      3      3      3      6   : 36812
aida08 :     22      6     10      5      3      1      3      4      2      3      6   : 36360
aida09 :     18     28     14      4      2      3      3      3      2      3      6   : 36232
aida10 :     26     16      4      3      3      1      3      4      2      3      6   : 36296
aida11 :     16     10      4      0      3      3      1      4      2      3      6   : 35856
aida12 :     19     14      4      2      4      4      1      3      3      3      6   : 36668


04:15      General Check

Rates, Tempratures, Voltages are ok, attached 5,6,7,8

******Clock Check*******

OK

Clock status test result: Passed 12, Failed 0

Understand status as follows
Status bit 3 : firmware PLL that creates clocks from external clock not locked
Status bit 2 : always logic '1'
Status bit 1 : LMK3200(2) PLL and clock distribution chip not locked to external clock
Status bit 0 : LMK3200(1) PLL and clock distribution chip not locked to external clock
If all these bits are not set then the operation of the firmware is unreliable


******ADC******

Clock status test result: Passed 12, Failed 0

Understand status as follows
Status bit 3 : firmware PLL that creates clocks from external clock not locked
Status bit 2 : always logic '1'
Status bit 1 : LMK3200(2) PLL and clock distribution chip not locked to external clock
Status bit 0 : LMK3200(1) PLL and clock distribution chip not locked to external clock
If all these bits are not set then the operation of the firmware is unreliable


******White Rabbit check******


         Base         Current     Difference
aida01 fault      0x7686 :      0x768a :      4  
aida02 fault      0x941d :      0x9421 :      4  
aida03 fault      0x7cd7 :      0x7cdb :      4  
aida04 fault      0xb86d :      0xb871 :      4  
aida05 fault      0x1a59 :      0x1a61 :      8  
aida06 fault      0x4f45 :      0x4f4d :      8  
aida07 fault      0x3bfc :      0x3c39 :      61  
aida08 fault      0xc7ce :      0xc7d5 :      7  
aida09 fault      0xb33b :      0xb33c :      1  
White Rabbit error counter test result: Passed 3, Failed 9

Understand the status reports as follows:-
Status bit 3 : White Rabbit decoder detected an error in the received data
Status bit 2 : Firmware registered WR error, no reload of Timestamp
Status bit 0 : White Rabbit decoder reports uncertain of Timestamp information from WR


******FPGA Check******

     Base         Current         Difference
aida09 fault      0x1 :      0x2 :      1  
aida12 fault      0xa :      0x11 :      7  
FPGA Timestamp error counter test result: Passed 10, Failed 2
If any of these counts are reported as in error
The ASIC readout system has detected a timeslip.
That is the timestamp read from the time FIFO is not younger than the last


****** Memorey check******


Returned 0 0 0 0 0 0 0 0 0 0 0 0  
Mem(KB) :    4    8    16    32    64    128    256    512    1k    2k    4k
aida01 :     27     21     10      7      1      3      2      4      2      3      6   : 36436
aida02 :     28     21      3      3      1      3      1      4      2      3      6   : 35944
aida03 :     15      8     11      3      3      3      3      3      2      3      6   : 36044
aida04 :     25     19     14      4      1      3      4      3      2      3      6   : 36380
aida05 :     12      6      5      1      0      2      2      3      2      4      6   : 37328
aida06 :     29     21      4      2      3      4      1      3      3      3      6   : 36700
aida07 :     19     14      7      6      2      3      2      2      3      3      6   : 36332
aida08 :     11      8      8      6      3      1      3      4      2      3      6   : 36332
aida09 :     16     25     11      3      1      2      2      4      2      3      6   : 36184
aida10 :     14     13      4      2      3      2      2      4      2      3      6   : 36064
aida11 :      4      9      4      0      3      3      1      4      2      3      6   : 35800
aida12 :     38     17      4      2      4      4      1      3      3      3      6   : 36768


Attachment 1: 210419_0302_Voltages.png
210419_0302_Voltages.png
Attachment 2: 210419_0303_Stats.png
210419_0303_Stats.png
Attachment 3: 210419_0303_Temp.png
210419_0303_Temp.png
Attachment 4: 210419_0406_ucesb.png
210419_0406_ucesb.png
Attachment 5: 210419_0402_Stats.png
210419_0402_Stats.png
Attachment 6: 210419_0402_Voltages.png
210419_0402_Voltages.png
Attachment 7: 210419_0406_ucesb.png
210419_0406_ucesb.png
Attachment 8: 210419_0414_ucesb.png
210419_0414_ucesb.png
  491   Wed Jun 22 15:09:37 2022 MAWednesday 22 June 16:00-00:00

16:00 Take over from Magda mrning shift

Beam was off of sometime for tunning to Mercurey setting.

17:00 attached 1-3

19:00 attached 4-6

21:00 attached 7-9

23:30 10-12


Attachment 1: BiasCurrent2022-06-22_17-11-07.png
BiasCurrent2022-06-22_17-11-07.png
Attachment 2: Statistics_2022-06-22_17-13-52.png
Statistics_2022-06-22_17-13-52.png
Attachment 3: Temperature2022-06-22_17-12-35.png
Temperature2022-06-22_17-12-35.png
Attachment 4: BiasCurrent2022-06-22_19-00-31.png
BiasCurrent2022-06-22_19-00-31.png
Attachment 5: Temperature2022-06-22_19-02-18.png
Temperature2022-06-22_19-02-18.png
Attachment 6: Statics2022-06-22_19-03-11.png
Statics2022-06-22_19-03-11.png
Attachment 7: BiasCurrent2022-06-22_21-04-38.png
BiasCurrent2022-06-22_21-04-38.png
Attachment 8: Statistics2022-06-22_21-07-07.png
Statistics2022-06-22_21-07-07.png
Attachment 9: Temperature2022-06-22_21-05-51.png
Temperature2022-06-22_21-05-51.png
Attachment 10: BiasCurrent2022-06-22_23-29-40.png
BiasCurrent2022-06-22_23-29-40.png
Attachment 11: Statistics2022-06-22_23-31-30.png
Statistics2022-06-22_23-31-30.png
Attachment 12: Temperature2022-06-22_23-30-28.png
Temperature2022-06-22_23-30-28.png
  505   Mon Jun 27 17:03:09 2022 MAMonday 27th June 16:00-00:00

16:00 Took over the shift from OH no beam yet.

18:00 Still no beam yet.

Statistics, Temperature, Current are checked and attached 1-3

system wide checks same as last updated in the previoues shift.

22:00 The beam is back but not taking data yet! FRS team doing some checkings

Statistics, Temperature, Current are checked and attached 4-6

system wide checks same as last updated in the previoues shift.

23:30 beam is back and taking data

Attachment 1: Statistics2022-06-27_18-02-25.png
Statistics2022-06-27_18-02-25.png
Attachment 2: Temperature2022-06-27_18-01-14.png
Temperature2022-06-27_18-01-14.png
Attachment 3: Current2022-06-27_17-59-55.png
Current2022-06-27_17-59-55.png
Attachment 4: Statics2022-06-27_22-12-07.png
Statics2022-06-27_22-12-07.png
Attachment 5: Temperature2022-06-27_22-11-21.png
Temperature2022-06-27_22-11-21.png
Attachment 6: Current2022-06-27_22-10-12.png
Current2022-06-27_22-10-12.png
  146   Thu Mar 12 23:04:24 2020 LS, DKFriday 13th 00:00 to 08:00 shift
   Shift file starting R9_639

   system wide checks okay
   FEE temperatures okay (attachment 1)
   leakage currents normal and recorded to spreadsheet (attachment 2)
   good event stats are normal (attachment 3)
   merger running at 3.5 M items/sec
   tape running at 26 MB/sec
   
   rates histogram (attachment 4)
   low energy histograms (attachment 5 and 6)
   high energy histograms (attachment 7 and 8)

02.02 
   system wide checks okay
   FEE temperatures okay (attachment 9)
   leakage currents normal and recorded to spreadsheet (attachment 10)
   good event stats are normal (attachment 11)
   merger running at 3.5 M items/sec
   tape running at 27 MB/sec

04.09 
   system wide checks okay
   FEE temperatures okay (attachment 12)
   leakage currents normal and recorded to spreadsheet (attachment 13)
   good event stats are normal (attachment 14)
   merger running at 3 M items/sec
   tape running at 27 MB/sec
   writing to file R9_840

06.07 
   system wide checks okay
   FEE temperatures okay (attachment 15)
   leakage currents normal and recorded to spreadsheet (attachment 16)
   good event stats are normal (attachment 17)
   merger running at 3 M items/sec
   tape running at 27 MB/sec
 
07.59 
   system wide checks okay
   FEE temperatures okay (attachment 18)
   leakage currents normal and recorded to spreadsheet (attachment 19)
   good event stats are normal (attachment 20)
   merger running at 3 M items/sec
   tape running at 26 MB/sec

as of 08.00 just finished R9_1021
gzip is going through the R6_8* files
2.1TB left of space
Attachment 1: 200313_0006_feetemps.png
200313_0006_feetemps.png
Attachment 2: 200313_0008_leakcurrents.png
200313_0008_leakcurrents.png
Attachment 3: 200313_0008_goodevents.png
200313_0008_goodevents.png
Attachment 4: 200313_0015_rateshisto.png
200313_0015_rateshisto.png
Attachment 5: 200313_0018_loweoddfees.png
200313_0018_loweoddfees.png
Attachment 6: 200313_0019_loweevenfees.png
200313_0019_loweevenfees.png
Attachment 7: 200313_0021_higheoddfees.png
200313_0021_higheoddfees.png
Attachment 8: 200313_0022_higheevenfees.png
200313_0022_higheevenfees.png
Attachment 9: 200313_0203_feetemps.png
200313_0203_feetemps.png
Attachment 10: 200313_0203_leakagecurrents.png
200313_0203_leakagecurrents.png
Attachment 11: 200313_0205_goodevents.png
200313_0205_goodevents.png
Attachment 12: 200313_0403_feetemps.png
200313_0403_feetemps.png
Attachment 13: 200313_0408_leakagecurrents.png
200313_0408_leakagecurrents.png
Attachment 14: 200313_0406_goodevents.png
200313_0406_goodevents.png
Attachment 15: 200313_0602_feetemps.png
200313_0602_feetemps.png
Attachment 16: 200313_0605_leakagecurrents.png
200313_0605_leakagecurrents.png
Attachment 17: 200313_0605_goodevents.png
200313_0605_goodevents.png
Attachment 18: 200313_0756_feetemps.png
200313_0756_feetemps.png
Attachment 19: 200313_0758_leakagecurrents.png
200313_0758_leakagecurrents.png
Attachment 20: 200313_0758_goodevents.png
200313_0758_goodevents.png
  136   Mon Mar 9 13:50:08 2020 LS, CA, DK09/03/2020 system checks
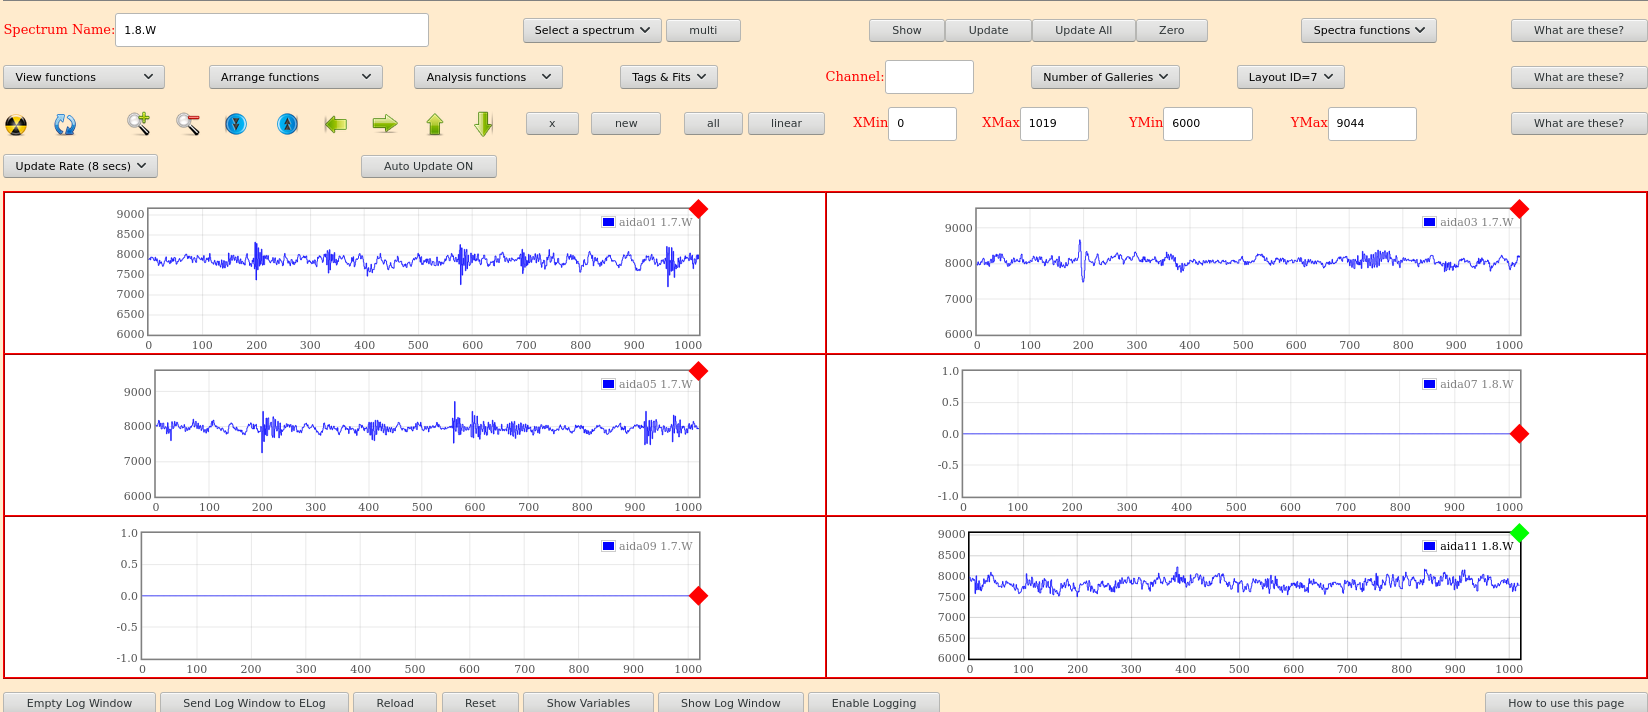
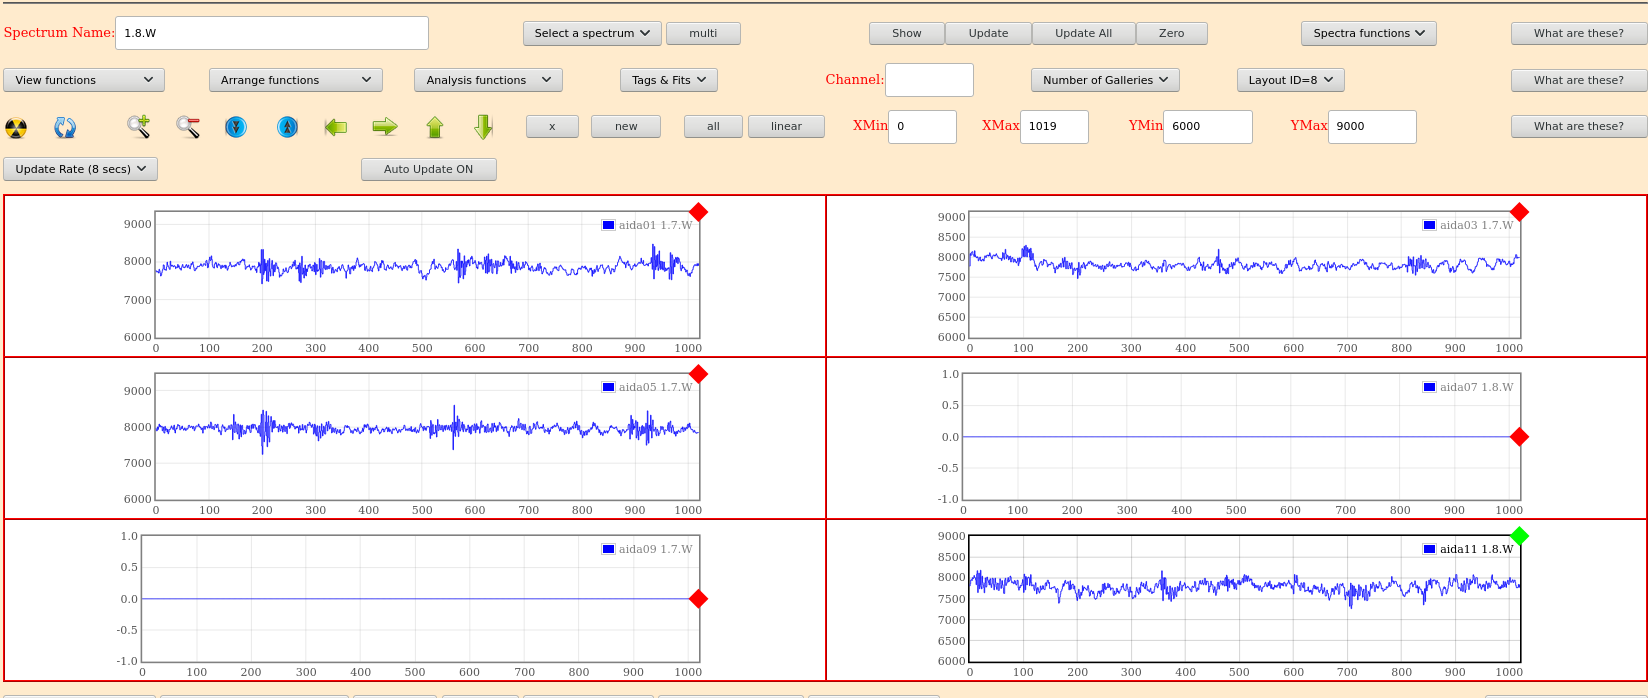
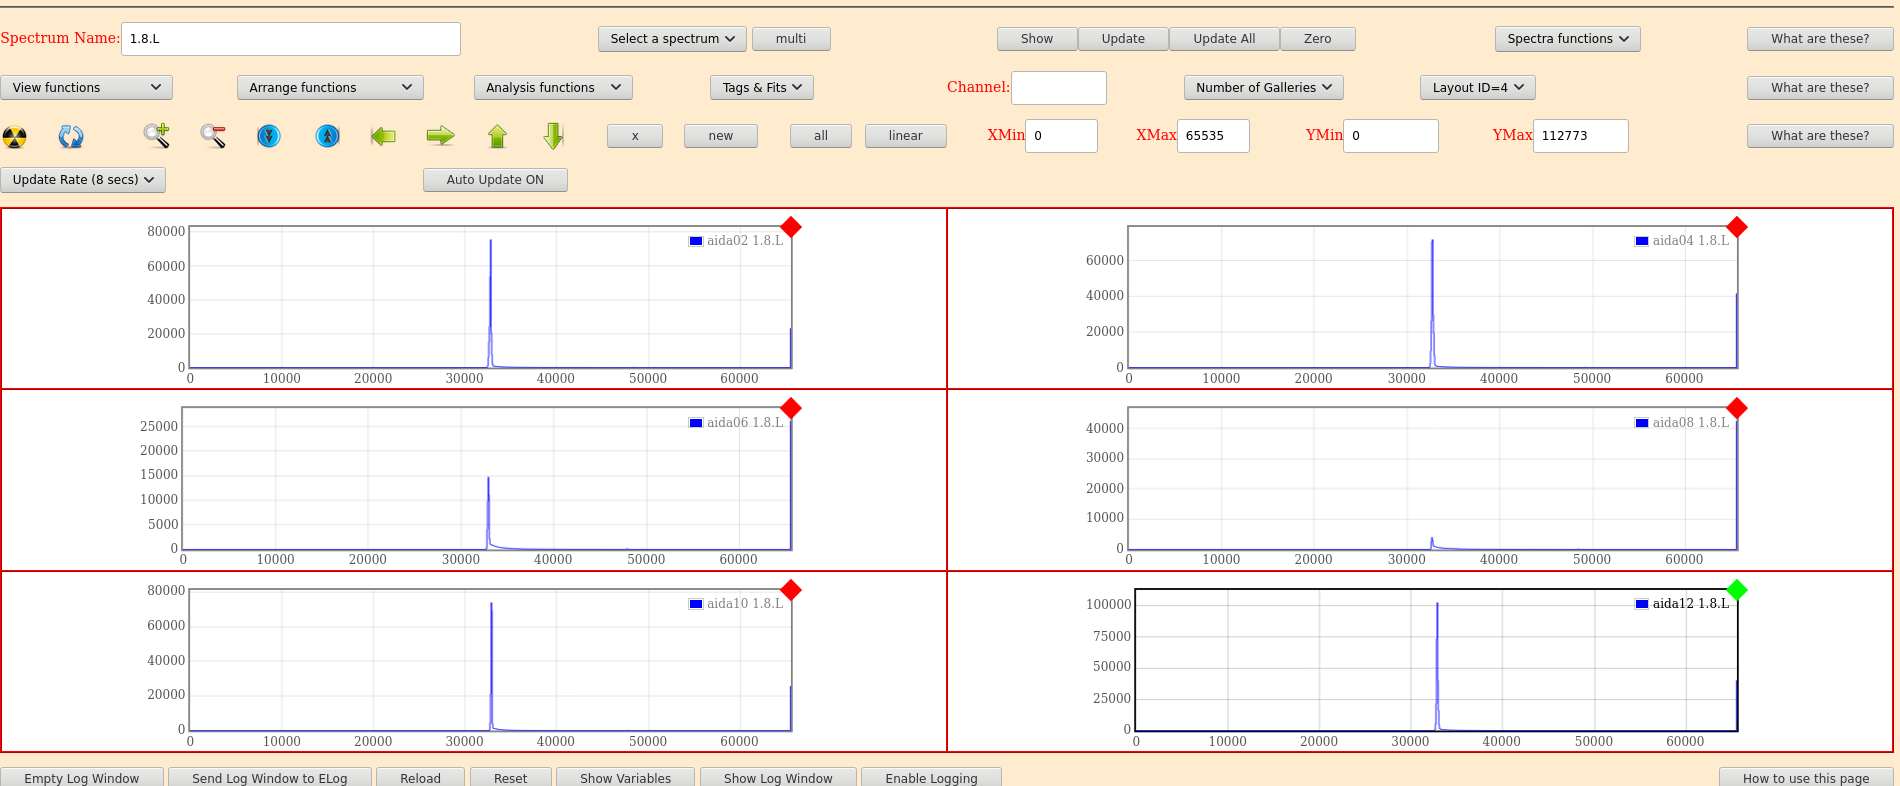
14:52 Attachment 1 shows low energy spectra. AIDA06 shows strange baseline, possible double-hit?

15:06 Systems checks fine.
      Master clock failed (no master clock)
      all checks passed
      memory checks all around 38k as normal

      Attachment 2: Temperature check all normal except aida01 virtex temp slightly over 65 degrees

      Attachment 3: Good event stats seem normal except downstream SSD seems to be high around 200k

      Attachment 4: leakage currents seem normal at expected values

15:16 Merger working for all FEEs
      tape server is on but no storage
      data rate is around 25 MB per second (high but consistent with the high stats of downstream SSD)

ASIC controls checked and are all OK

15.48 low energy pulsar peak FWHM

      fee   FHWM
      1     89.08
      2     132.06
      3     70.73
      4     81.84
      5     62.86
      6     79.92
      7     122.13
      8     73.31
      9     198.39
      10    115.53
      11    100.55
      12    144.04

ALL FEEs in downstream SSD are high

16:21 included low energy pulsar peaks (Attachments 5 & 6) and waveforms for all FEEs (Attachments 7 & 8)

16:25 included rates, note not to common scale in y (attachment 9)

ASIC settings file 2019Dec19-16.19.51 but some others are on 2019Oct31-13.24.23
  Did not seem completely reproducible?
  We carefully checked all the individual FEE and ASIC settings, and they are all the same (except shaping reference), with NO 0xad

Now we made sure they are all using 2019Dec19-16.19.51 (which we had saved first on a good one)


19:15 Update

There is a safety interlock box in S4 to monitor humidity, dew point, temperature, etc for safety.  
It had a loose solder connection, and when someone moved it out of the way, the interlock was tripped.
After some debugging, the interlock is now in a more stable condition, but a lot of power was cut from AIDA systems

One unusual thing was that one of the RPi systems got a full /var/messages (or similar) and ate all the available disk space 
  This meant that ssh -X (to, e.g., activate putty) could not work, giving a permission denial error (ssh connection was allowed, but not X11 forwarding)

Now we have brought back up the AIDA systems and should run through the checks

Most system checks look good (except some calibration errors)

Temps were running high until we reloaded the ASIC settings, then the temperatures began to cool

Bias and leak currents attached as #10

Temps as #11

Stats as #12

19:50 Started writing to disk so that we can do an implantation depth profile. Will analyse near online using AIDASort.

21:45 Stopped writing to file -> Runs where AIDA thickness were investigated corresponds to R3_62 to R3_72
      A rough method using the rates histogram was used to judge roughly when depositing in each histogram - see attachment 12 (Stopping in 2)
      Can match to the FRS files to work out degrader thickness with timestamps (File stopped at Mon 09 Mar 2020 09:44:51 PM CET

21:51 AIDA running to no storage again
Attachment 1: 200309_lowE_spectra.png
200309_lowE_spectra.png
Attachment 2: 200309_FEEtemp.png
200309_FEEtemp.png
Attachment 3: 200309_stats.png
200309_stats.png
Attachment 4: 200309_leakcurrents.png
200309_leakcurrents.png
Attachment 5: 200309_lowE_pulsarpeaksodd.png
200309_lowE_pulsarpeaksodd.png
Attachment 6: 200309_lowE_pulsarpeakseven.png
200309_lowE_pulsarpeakseven.png
Attachment 7: 200309_waveformsodd.png
200309_waveformsodd.png
Attachment 8: 200309_waveformseven.png
200309_waveformseven.png
Attachment 9: 200309_rates.png
200309_rates.png
Attachment 10: biases_after_trip.png
biases_after_trip.png
Attachment 11: temps-after-crash.png
temps-after-crash.png
Attachment 12: stats-after-crash.png
stats-after-crash.png
Attachment 13: ImplantRangeRough.png
ImplantRangeRough.png
  192   Fri Mar 12 10:09:19 2021 LS, CAFriday 12th March 11.00-
11.00(Germany) System wide checks okay except:

      FEE64 module aida09 global clocks failed, 6
      Clock status test result: Passed 11, Failed 1
      Understand status as follows
      Status bit 3 : firmware PLL that creates clocks from external clock not locked
      Status bit 2 : always logic '1' 
      Status bit 1 : LMK3200(2) PLL and clock distribution chip not locked to external clock
      Status bit 0 : LMK3200(1) PLL and clock distribution chip not locked to external clock
      If all these bits are not set then the operation of the firmware is unreliable

      FEE64 module aida07 failed
      FEE64 module aida09 failed
      Calibration test result: Passed 10, Failed 2
      If any modules fail calibration , check the clock status and open the FADC Align and Control browser page to rerun 
      calibration for that module

      Statistics (attachment1)
      Spectra rates (attachment2)
      FEE temps (attachment3)
      Leakage currents, written to google sheet (attachment4)  
      Merger~ 4.9M items/s
      Tapeserver ~17MB/s 

      In MBS control terminal, connection has been closed intentionally since this morning (file S452f160),
      AIDA has been taken out of the timesorter due to the high data rate, buffers were full
      AIDA cannot be seen in ucesb or Go4.

13.00 System wide checks okay except:

      FEE64 module aida09 global clocks failed, 6
      Clock status test result: Passed 11, Failed 1
      Understand status as follows
      Status bit 3 : firmware PLL that creates clocks from external clock not locked
      Status bit 2 : always logic '1' 
      Status bit 1 : LMK3200(2) PLL and clock distribution chip not locked to external clock
      Status bit 0 : LMK3200(1) PLL and clock distribution chip not locked to external clock
      If all these bits are not set then the operation of the firmware is unreliable

      FEE64 module aida07 failed
      FEE64 module aida09 failed
      Calibration test result: Passed 10, Failed 2
      If any modules fail calibration , check the clock status and open the FADC Align and Control browser page to rerun 
      calibration for that module

      Statistics (attachment5)
      Spectra rates (attachment6)
      FEE temps (attachment7)
      Leakage currents, written to google sheet (attachment8)  
      Merger~ 5.1M items/s
      Tapeserver ~18MB/s 

      No timestamp related errors this shift

13.37 AIDA MBS control restarted R33_388
      System wide checks same as previous time

13.54 beam stopped for access,  file R33_396

13.57 seen recent batch of bad timestamp errors in new merger terminal (attachment9) should be around R33_397
      Analysed R33_395, 396, 397, 398 no timewarps
      
14.29 beam back R33_415

14.54 see more bad timestamps in new merger terminal (attachment10)

14.55 System wide checks okay except:

      FEE64 module aida09 global clocks failed, 6
      Clock status test result: Passed 11, Failed 1
      Understand status as follows
      Status bit 3 : firmware PLL that creates clocks from external clock not locked
      Status bit 2 : always logic '1' 
      Status bit 1 : LMK3200(2) PLL and clock distribution chip not locked to external clock
      Status bit 0 : LMK3200(1) PLL and clock distribution chip not locked to external clock
      If all these bits are not set then the operation of the firmware is unreliable

      FEE64 module aida07 failed
      FEE64 module aida09 failed
      Calibration test result: Passed 10, Failed 2
      If any modules fail calibration , check the clock status and open the FADC Align and Control browser page to rerun 
      calibration for that module

      Statistics (attachment11)
      Spectra rates (attachment12)
      FEE temps (attachment13)
      Leakage currents, written to google sheet (attachment14)  
      Merger~ 5.0M items/s
      Tapeserver ~17MB/s 

16.05 AIDA included back into timesorter, AIDA scalers now seen in ucesb, file R33_463

16.15 CA takes over until 18:00

17:11 System wide checks:

      FEE64 module aida09 global clocks failed, 6
      Clock status test result: Passed 11, Failed 1
      Understand status as follows
      Status bit 3 : firmware PLL that creates clocks from external clock not locked
      Status bit 2 : always logic '1' 
      Status bit 1 : LMK3200(2) PLL and clock distribution chip not locked to external clock
      Status bit 0 : LMK3200(1) PLL and clock distribution chip not locked to external clock
      If all these bits are not set then the operation of the firmware is unreliable

      FEE64 module aida07 failed
      FEE64 module aida09 failed
      Calibration test result: Passed 10, Failed 2
      If any modules fail calibration , check the clock status and open the FADC Align and Control browser page to rerun 
      calibration for that module

		 Base 		Current 	Difference
aida07 fault 	 0xcdd6 : 	 0xcdd7 : 	 1  
White Rabbit error counter test result: Passed 11, Failed 1

17:13 FEE64 temps ok - attachment 15
      Statistics ok - attachment 16
      bias and leakage currents ok - attachment 17
Attachment 1: 1100_Statistics.PNG
1100_Statistics.PNG
Attachment 2: 1100_SpectraRate.PNG
1100_SpectraRate.PNG
Attachment 3: 1100_FEETemps.PNG
1100_FEETemps.PNG
Attachment 4: 1100_LeakageCurrents.PNG
1100_LeakageCurrents.PNG
Attachment 5: 1300_Statistics.PNG
1300_Statistics.PNG
Attachment 6: 1300_SpectraRate.PNG
1300_SpectraRate.PNG
Attachment 7: 1300_FEETemps.PNG
1300_FEETemps.PNG
Attachment 8: 1300_LeakageCurrents.PNG
1300_LeakageCurrents.PNG
Attachment 9: 1358_NewMerger.PNG
1358_NewMerger.PNG
Attachment 10: 1454_NewMerger.PNG
1454_NewMerger.PNG
Attachment 11: 1500_Statistics.PNG
1500_Statistics.PNG
Attachment 12: 1500_SpectraRate.PNG
1500_SpectraRate.PNG
Attachment 13: 1500_FEETemps.PNG
1500_FEETemps.PNG
Attachment 14: 1500_LeakageCurrents.PNG
1500_LeakageCurrents.PNG
Attachment 15: Screenshot_from_2021-03-12_16-18-13.png
Screenshot_from_2021-03-12_16-18-13.png
Attachment 16: Screenshot_from_2021-03-12_16-18-51.png
Screenshot_from_2021-03-12_16-18-51.png
Attachment 17: Screenshot_from_2021-03-12_16-21-21.png
Screenshot_from_2021-03-12_16-21-21.png
  321   Mon May 17 19:05:23 2021 LSMonday 17th May 20.00-24.00
20.30
Checked stats, seem okay (Fig 1)
Ran R14_99 through analyser, dead times all good (Fig 2)
Merger rate 1.8M items/s
Tape server 6.4MB/s

21.00
Checked stats seem okay (Fig 3)
Ran R14_106 through analyser, dead times all good (Fig 4)

21.30
Checked stats seem okay (Fig 5)
Ran R14_112 through analyser, dead times all good (Fig 6)

22.00
Stats okay (Fig 7)
FEE temps okay (Fig 8)
Rate spectra (Fig 9)
Leakage currents (Fig 10)

System wide checks:
Clock status all passed

White rabbit 1 fail:
		 Base 		Current 	Difference
aida05 fault 	 0x4da : 	 0x4e7 : 	 13  
White Rabbit error counter test result: Passed 15, Failed 1

Understand the status reports as follows:-
Status bit 3 : White Rabbit decoder detected an error in the received data
Status bit 2 : Firmware registered WR error, no reload of Timestamp
Status bit 0 : White Rabbit decoder reports uncertain of Timestamp information from WR

FPGA timestamp all passed

Merger rate 2.4M items/s
Tape server 6.3MB/s

Ran R14_119 through analyser, dead times all good (Fig 11)

22.30
Checked stats seem okay (Fig 12)
Ran R14_123 through analyser, dead times all good (Fig 13)

23.00
Checked stats seem okay (Fig 14)
Ran R14_129 through analyser, dead times all good (Fig 15)

23.30
Checked stats seem okay (Fig 16)
Ran R14_135 through analyser, dead times all good (Fig 17)

24.00
Stats okay (Fig 18)
FEE temps okay (Fig 19)
Leakage currents (Fig 20)

System wide checks:
Clock status all passed

White rabbit 1 fail:
		 Base 		Current 	Difference
aida05 fault 	 0x4da : 	 0x4eb : 	 17  
White Rabbit error counter test result: Passed 15, Failed 1

Understand the status reports as follows:-
Status bit 3 : White Rabbit decoder detected an error in the received data
Status bit 2 : Firmware registered WR error, no reload of Timestamp
Status bit 0 : White Rabbit decoder reports uncertain of Timestamp information from WR

FPGA timestamp all passed

Merger rate 2.5M items/s
Tape server 6.5MB/s

Ran R14_142 through analyser, dead times all good (Fig 21)
Attachment 1: 210517_Stats_2026.png
210517_Stats_2026.png
Attachment 2: 210517_Deadtime_R14_99.png
210517_Deadtime_R14_99.png
Attachment 3: 210517_Stats_2101.png
210517_Stats_2101.png
Attachment 4: 210517_Deadtimes_R14_106.png
210517_Deadtimes_R14_106.png
Attachment 5: 210517_Stats_2128.png
210517_Stats_2128.png
Attachment 6: 210517_Deadtimes_R14_112.png
210517_Deadtimes_R14_112.png
Attachment 7: 210517_Stats_2159.png
210517_Stats_2159.png
Attachment 8: 210517_FEEtemps_2159.png
210517_FEEtemps_2159.png
Attachment 9: 210517_Spectra_2159.png
210517_Spectra_2159.png
Attachment 10: 210517_Bias_2159.png
210517_Bias_2159.png
Attachment 11: 210517_Deadtimes_R14_119.png
210517_Deadtimes_R14_119.png
Attachment 12: 210517_Stats_2230.png
210517_Stats_2230.png
Attachment 13: 210517_Deadtimes_R14_123.png
210517_Deadtimes_R14_123.png
Attachment 14: 210517_Stats_2300.png
210517_Stats_2300.png
Attachment 15: 210517_Deadtimes_R14_129.png
210517_Deadtimes_R14_129.png
Attachment 16: 210517_Stats_2328.png
210517_Stats_2328.png
Attachment 17: 210517_Deadtimes_R14_135.png
210517_Deadtimes_R14_135.png
Attachment 18: 210517_Stats_2359.png
210517_Stats_2359.png
Attachment 19: 210517_FEEtemps_2359.png
210517_FEEtemps_2359.png
Attachment 20: 210517_bias_2359.png
210517_bias_2359.png
Attachment 21: 210517_deadtime_R14_142_1.png
210517_deadtime_R14_142_1.png
  325   Tue May 18 18:47:25 2021 LSTuesday 18th May 20:00 - 24:00
19.50
Stats okay (Fig 1)
FEE temps okay (Fig 2)
Bias okay (Fig 3)

System wide checks okay except:

		 Base 		Current 	Difference
aida05 fault 	 0x500 : 	 0x520 : 	 32  
White Rabbit error counter test result: Passed 15, Failed 1

Understand the status reports as follows:-
Status bit 3 : White Rabbit decoder detected an error in the received data
Status bit 2 : Firmware registered WR error, no reload of Timestamp
Status bit 0 : White Rabbit decoder reports uncertain of Timestamp information from WR

Merger rate ~1.8M items/s
Tape server ~7MB/s

Analysed R14_399, deadtimes are okay (Fig 4)

20.30
Stats okay (Fig 5)
Analysed R14_407, deadtimes are okay (Fig 6)

21.00
Stats okay (Fig 7)
Analysed R14_415, deadtimes are okay (Fig 8)

21.30
Stats okay (Fig 9)
Analysed R14_422, deadtimes are okay (Fig 10)

22.00
Stats okay (Fig 11)
FEE temps okay (Fig 12)
Bias okay (Fig 13)

System wide checks okay except:

		 Base 		Current 	Difference
aida05 fault 	 0x500 : 	 0x524 : 	 36  
White Rabbit error counter test result: Passed 15, Failed 1

Understand the status reports as follows:-
Status bit 3 : White Rabbit decoder detected an error in the received data
Status bit 2 : Firmware registered WR error, no reload of Timestamp
Status bit 0 : White Rabbit decoder reports uncertain of Timestamp information from WR

Merger rate ~2.3M items/s
Tape server ~8MB/s

Analysed R14_430, deadtimes are okay (Fig 14)

22.30
Stats okay (Fig 15)
Analysed R14_438, deadtimes are okay (Fig 16)
FEE8 deadtime seems to be abit higher (7s previous now 11s, total elapsed time both 232s) but still within 5%

23.00
Stats okay (Fig 17)
Analysed R14_445, deadtimes are okay (Fig 18)

23.30
Stats okay (Fig 19)
Analysed R14_454, deadtimes are okay (Fig 20)

24.00
Stats okay (Fig 21)
FEE temps okay (Fig 22)
Bias okay (Fig 23)

System wide checks okay except:

		 Base 		Current 	Difference
aida05 fault 	 0x500 : 	 0x529 : 	 41  
White Rabbit error counter test result: Passed 15, Failed 1

Understand the status reports as follows:-
Status bit 3 : White Rabbit decoder detected an error in the received data
Status bit 2 : Firmware registered WR error, no reload of Timestamp
Status bit 0 : White Rabbit decoder reports uncertain of Timestamp information from WR

The difference has increased over time (not sure if an issue)

Merger rate ~3M items/s
Tape server ~8MB/s

Analysed R14_462, deadtimes are okay (Fig 24)
Attachment 1: 210518_Stats_1950.png
210518_Stats_1950.png
Attachment 2: 210518_FEEtemps_1950.png
210518_FEEtemps_1950.png
Attachment 3: 210518_Bias_1950.png
210518_Bias_1950.png
Attachment 4: 210518_Deadtimes_R14_399.png
210518_Deadtimes_R14_399.png
Attachment 5: 210518_Stats_2028.png
210518_Stats_2028.png
Attachment 6: 210518_Deadtimes_R14_407.png
210518_Deadtimes_R14_407.png
Attachment 7: 210518_Stats_2059.png
210518_Stats_2059.png
Attachment 8: 210518_Deadtimes_R14_415.png
210518_Deadtimes_R14_415.png
Attachment 9: 210518_Stats_2130.png
210518_Stats_2130.png
Attachment 10: 210518_Deadtimes_R14_422.png
210518_Deadtimes_R14_422.png
Attachment 11: 210518_Stats_2158.png
210518_Stats_2158.png
Attachment 12: 210518_FEEtemps_2158.png
210518_FEEtemps_2158.png
Attachment 13: 210518_bias_2158.png
210518_bias_2158.png
Attachment 14: 210518_Deadtimes_R14_430.png
210518_Deadtimes_R14_430.png
Attachment 15: 210518_Stats_2230.png
210518_Stats_2230.png
Attachment 16: 210518_deadtimes_R14_438.png
210518_deadtimes_R14_438.png
Attachment 17: 210518_Stats_2300.png
210518_Stats_2300.png
Attachment 18: 210518_Deadtimes_R14_445.png
210518_Deadtimes_R14_445.png
Attachment 19: 210518_Stats_2330.png
210518_Stats_2330.png
Attachment 20: 210518_Deadtimes_R14_454.png
210518_Deadtimes_R14_454.png
Attachment 21: 210518_Stats_2400.png
210518_Stats_2400.png
Attachment 22: 210518_FEEtemps_2400.png
210518_FEEtemps_2400.png
Attachment 23: 210518_bias_2400.png
210518_bias_2400.png
Attachment 24: 210518_Deadtimes_R14_462.png
210518_Deadtimes_R14_462.png
  333   Wed May 19 18:50:01 2021 LSWednesday 19th May 20:00 to 24:00
20.00
Stats okay (Fig 1)
Analysed R14_762 deadtimes are okay (Fig 2)

20.30
Stats okay (Fig 3)
Analysed R14_771 deadtimes are okay (Fig 4)

21.00
Stats okay (Fig 5)
FEE temps okay (Fig 6)
Bias (Fig 7)
Rate spectra (Fig 8)

System wide checks okay except white rabbit 1 fail:
		 Base 		Current 	Difference
aida05 fault 	 0x500 : 	 0x569 : 	 105  
White Rabbit error counter test result: Passed 15, Failed 1

Understand the status reports as follows:-
Status bit 3 : White Rabbit decoder detected an error in the received data
Status bit 2 : Firmware registered WR error, no reload of Timestamp
Status bit 0 : White Rabbit decoder reports uncertain of Timestamp information from WR

Merger rate ~2.8M items/s
Tape server ~10MB/s

Analysed R14_781 deadtimes are okay (Fig 9)

21.30
Stats okay (Fig 10)
Analysed R14_789 deadtimes are okay (Fig 11)

22.00
Stats okay (Fig 12)
Analysed R14_799 deadtimes are okay (Fig 13)

22.30
Stats okay (Fig 14)
Analysed R14_807 deadtimes are okay (Fig 15)

23.00
Stats okay (Fig 16)
FEE temps okay (Fig 17)
Bias (Fig 18)

System wide checks okay except white rabbit 1 fail:
		 Base 		Current 	Difference
aida05 fault 	 0x500 : 	 0x569 : 	 105  
White Rabbit error counter test result: Passed 15, Failed 1

Understand the status reports as follows:-
Status bit 3 : White Rabbit decoder detected an error in the received data
Status bit 2 : Firmware registered WR error, no reload of Timestamp
Status bit 0 : White Rabbit decoder reports uncertain of Timestamp information from WR

Merger rate ~3M items/s
Tape server ~10MB/s

Analysed R14_819 deadtimes are okay (Fig 19)

23.30
Stats okay (Fig 20)
Analysed R14_827 deadtimes are okay (Fig 21)
Attachment 1: 210519_Stats_2000.png
210519_Stats_2000.png
Attachment 2: Deadtimes_R14_762.png
Deadtimes_R14_762.png
Attachment 3: 210519_Stats_2030.png
210519_Stats_2030.png
Attachment 4: Deadtimes_R14_771.png
Deadtimes_R14_771.png
Attachment 5: 210519_Stats_2100.png
210519_Stats_2100.png
Attachment 6: 210519_FEEtemps_2100.png
210519_FEEtemps_2100.png
Attachment 7: 210519_BIAS_2100.png
210519_BIAS_2100.png
Attachment 8: 210519_Spectra_2100.png
210519_Spectra_2100.png
Attachment 9: deadtimes_R14_781.png
deadtimes_R14_781.png
Attachment 10: 210519_Stats_2130.png
210519_Stats_2130.png
Attachment 11: deadtimes_R14_789.png
deadtimes_R14_789.png
Attachment 12: 210519_Stats_2200.png
210519_Stats_2200.png
Attachment 13: deadtimes_R14_799.png
deadtimes_R14_799.png
Attachment 14: 210519_Stats_2230.png
210519_Stats_2230.png
Attachment 15: deatimes_R14_807.png
deatimes_R14_807.png
Attachment 16: 210519_Stats_2300.png
210519_Stats_2300.png
Attachment 17: 210519_FEEtemps_2300.png
210519_FEEtemps_2300.png
Attachment 18: 210519_bias_2300.png
210519_bias_2300.png
Attachment 19: deatimes_R14_819.png
deatimes_R14_819.png
Attachment 20: 210519_Stats_2330.png
210519_Stats_2330.png
Attachment 21: deadtimes_R14_827.png
deadtimes_R14_827.png
  233   Sat Apr 17 07:28:02 2021 LPG, TDSaturday 08:00 - 12:00
08:30 CEST

HV and leakage currents: elog:233/1
Detector rates: elog:233/2
Temperatures: elog:233/3

WR status:


FEE64 module aida06 failed
FEE64 module aida07 failed
FEE64 module aida10 failed
Calibration test result: Passed 9, Failed 3

If any modules fail calibration , check the clock status and open the FADC Align and Control browser page to rerun calibration for that module


FPGA status:


             Base         Current         Difference
aida12 fault      0x0 :      0x1 :      1  
FPGA Timestamp error counter test result: Passed 11, Failed 1
If any of these counts are reported as in error
The ASIC readout system has detected a timeslip.
That is the timestamp read from the time FIFO is not younger than the last


09:20 CEST

Stats: ok!
DB: No faults found
ucesb: ok!


09:40 CEST

Beam will be stopped in order to increase intensity. Expected to be around 3-4 hours.
For now, we still get implants when Beam spill is on. Seems to be fluctuating as they play around.

10:00 CEST

Still getting beam, it is fluctuating in intensity

Stats: ok!
DB: No faults found
ucesb: ok!

HV and leakage currents: elog:233/4
Detector rates: elog:233/5
Temperatures: elog:233/6

Clock check: ok!
ADC calibration:
FEE64 module aida06 failed
FEE64 module aida07 failed
FEE64 module aida10 failed
Calibration test result: Passed 9, Failed 3
WR check: ok!
FPGA check:
Base Current Difference
aida12 fault 0x0 : 0x1 : 1
FPGA Timestamp error counter test result: Passed 11, Failed 1
Memory check: ok!


10:40 CEST

Stats: ok!
DB: No faults found
ucesb: ok!

11:00 CEST

Stats: ok!
DB: No faults found
ucesb: ok!


11:30 CEST

Stats: ok!
DB: No faults found
ucesb: ok!

12:00 BST

Stats: ok!
DB: No faults found
ucesb: ok!

HV and leakage currents: elog:233/7
Detector rates: elog:233/8
Temperatures: elog:233/9


Clock check: ok!
ADC calibration:
FEE64 module aida06 failed
FEE64 module aida07 failed
FEE64 module aida10 failed
Calibration test result: Passed 9, Failed 3
WR check:
Base Current Difference
aida05 fault 0x1a52 : 0x1a53 : 1
aida06 fault 0x4f3e : 0x4f3f : 1
aida07 fault 0x3bcd : 0x3bce : 1
aida08 fault 0xc7c7 : 0xc7c8 : 1
White Rabbit error counter test result: Passed 8, Failed 4
FPGA check:
Base Current Difference
aida09 fault 0x0 : 0x1 : 1
aida12 fault 0x0 : 0x2 : 2
Memory check: ok!
Attachment 1: 20.png
20.png
Attachment 2: Screenshot_2021-04-17_Statistics_aidas-gsi.png
Screenshot_2021-04-17_Statistics_aidas-gsi.png
Attachment 3: Screenshot_2021-04-17_Temperature_and_status_scan_aidas-gsi.png
Screenshot_2021-04-17_Temperature_and_status_scan_aidas-gsi.png
Attachment 4: 21.png
21.png
Attachment 5: Screenshot_2021-04-17_Statistics_aidas-gsi(1).png
Screenshot_2021-04-17_Statistics_aidas-gsi(1).png
Attachment 6: Screenshot_2021-04-17_Temperature_and_status_scan_aidas-gsi(1).png
Screenshot_2021-04-17_Temperature_and_status_scan_aidas-gsi(1).png
Attachment 7: 22.png
22.png
Attachment 8: Screenshot_2021-04-17_Statistics_aidas-gsi(2).png
Screenshot_2021-04-17_Statistics_aidas-gsi(2).png
Attachment 9: Screenshot_2021-04-17_Temperature_and_status_scan_aidas-gsi(2).png
Screenshot_2021-04-17_Temperature_and_status_scan_aidas-gsi(2).png
  253   Tue Apr 20 14:56:38 2021 LPGTuesday 20th 16:00-20:00
16:00

New shift, ready to go! Beam stopped just as I started... Waiting for update.
Beam back at 16:08, ucesb scalers shown in elog:253/1

Database ok!
Stats ok!
ucesb ok!

Temperatures ok! elog:253/2
Statistics ok! elog:253/3
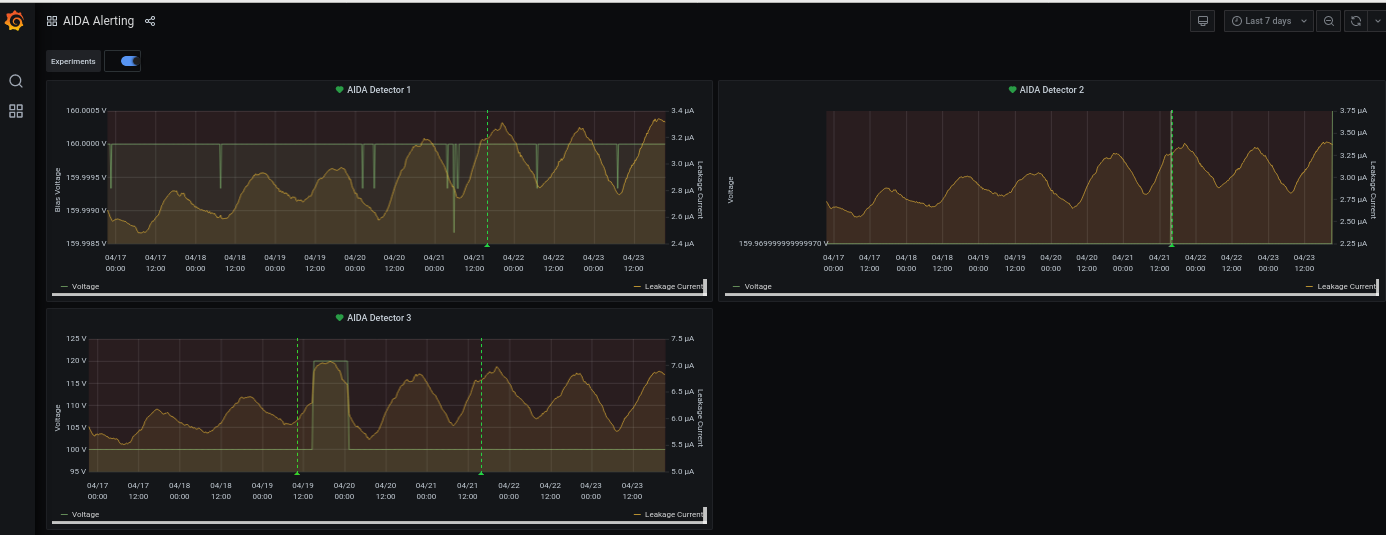
Leakage currents ok! Steadily rising, day/night effect? - elog:253/4 and elog:253/5

16:21

Online histograms zeroed in MIDAS. Same done in MBS DAQ.

16:45

Database ok!
Stats ok!
ucesb ok!

System wide checks:
Clock ok!
ADC 1 failed:
FEE64 module aida06 failed
WR ok!
FPGA ok!
Memory ok!

17:15

Database ok!
Stats ok!
ucesb ok!

17:45

Database ok!
Stats ok!
ucesb ok!

18:15

Database ok!
Stats ok!
ucesb ok!

System wide checks:
Clock ok!
ADC 1 fail:
FEE64 module aida06 failed
Calibration test result: Passed 11, Failed 1
WR ok!
FPGA ok!
Memory ok!

MIDAS Rates ok! elog:253/6
Temperatures ok! elog:253/7
Leakage currents ok, but still slowly rising! Topped out at ~20:30 yesterday elog:253/8


18:42
Message in the Merger terminal window (elog:253/9)
MERGE Actor (15671): Working with 0 from 12 data sources


19:05

Database ok!
Stats ok!
ucesb ok!

19:30

Some MIDAS spectra in elog:253/10 and elog:253/11

Database ok!
Stats ok!
ucesb ok!

19:50

Database ok!
Stats ok!
ucesb ok! elog:253/12

System wide checks:
Clock ok!
ADC 1 fail:
FEE64 module aida06 failed
Calibration test result: Passed 11, Failed 1
WR ok!
FPGA ok!
Memory ok!

MIDAS Rates ok! elog:253/13
Temperatures ok! elog:253/14
Leakage currents ok, now plateaued! elog:253/15


19:55 - Handing over to James Smile
Attachment 1: Screenshot_2021-04-20_at_15.09.52.png
Screenshot_2021-04-20_at_15.09.52.png
Attachment 2: Screenshot_2021-04-20_Temperature_and_status_scan_aidas-gsi.png
Screenshot_2021-04-20_Temperature_and_status_scan_aidas-gsi.png
Attachment 3: Screenshot_2021-04-20_Statistics_aidas-gsi.png
Screenshot_2021-04-20_Statistics_aidas-gsi.png
Attachment 4: lpg1.png
lpg1.png
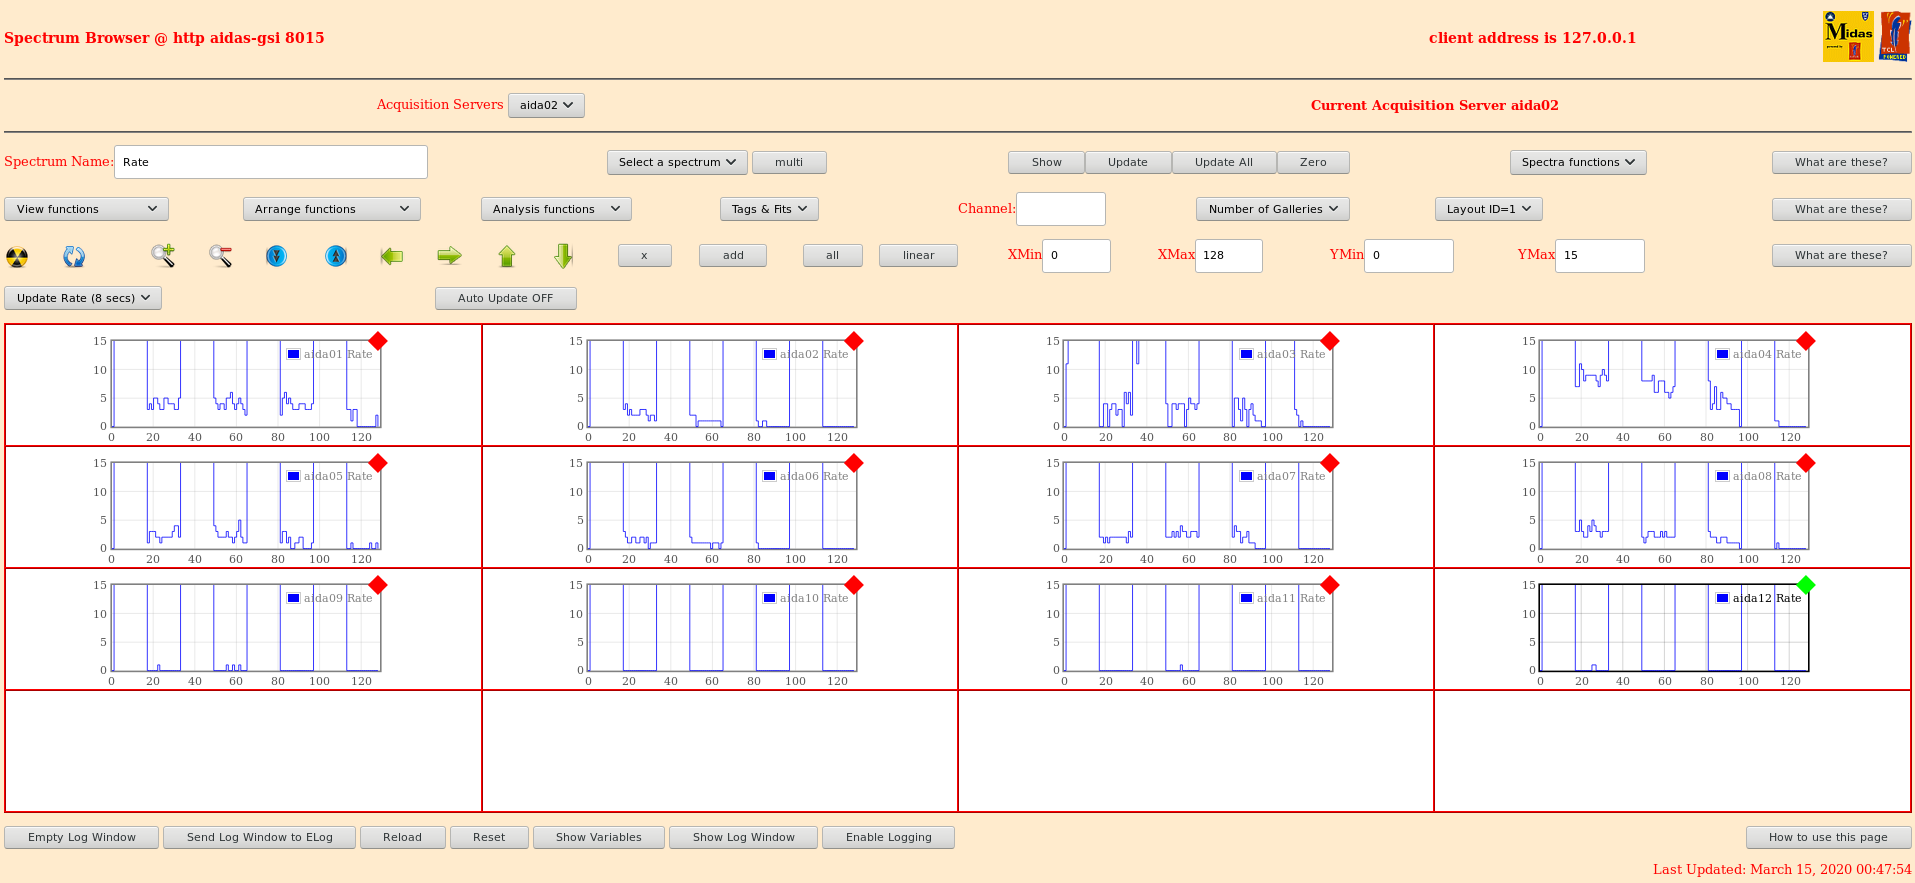
Attachment 5: Screenshot_2021-04-20_at_15.13.14.png
Screenshot_2021-04-20_at_15.13.14.png
Attachment 6: Screenshot_2021-04-20_Statistics_aidas-gsi.png
Screenshot_2021-04-20_Statistics_aidas-gsi.png
Attachment 7: Screenshot_2021-04-20_Temperature_and_status_scan_aidas-gsi(1).png
Screenshot_2021-04-20_Temperature_and_status_scan_aidas-gsi(1).png
Attachment 8: lpg2.png
lpg2.png
Attachment 9: lpg3_merger.png
lpg3_merger.png
Attachment 10: Screenshot_2021-04-20_Spectrum_Browser_aidas-gsi.png
Screenshot_2021-04-20_Spectrum_Browser_aidas-gsi.png
Attachment 11: Screenshot_2021-04-20_Spectrum_Browser_aidas-gsi(1).png
Screenshot_2021-04-20_Spectrum_Browser_aidas-gsi(1).png
Attachment 12: Screenshot_2021-04-20_at_18.50.56.png
Screenshot_2021-04-20_at_18.50.56.png
Attachment 13: Screenshot_2021-04-20_Statistics_aidas-gsi(2).png
Screenshot_2021-04-20_Statistics_aidas-gsi(2).png
Attachment 14: Screenshot_2021-04-20_Temperature_and_status_scan_aidas-gsi(2).png
Screenshot_2021-04-20_Temperature_and_status_scan_aidas-gsi(2).png
Attachment 15: lpg3.png
lpg3.png
  260   Thu Apr 22 07:06:37 2021 LPGThursday 22nd April: 08:00-12:00
08:01 - Taking over from Corrigan...

ucesb ok!
DB ok!
Stats ok!

08:30

ucesb ok!
DB ok!
Stats ok!

09:15

ucesb ok! elog:260/4
DB ok!
Stats ok!

Leakage currents ok! elog:260/1
Temperatures ok! elog:260/2
MIDAS Rates ok! elog:260/3

System wide checks
Clock ok!
ADC ok!
WR ok!
FPGA 1 fail
Base Current Difference
aida12 fault 0x0 : 0x40 : 64
FPGA Timestamp error counter test result: Passed 11, Failed 1
Memory ok!


09:45

ucesb ok!
DB ok!
Stats ok!

10:30

ucesb ok!
DB ok!
Stats ok!


11:00

ucesb ok! elog:260/5
DB ok!
Stats ok!

Leakage currents ok! elog:260/6
Temperatures ok! elog:260/7
MIDAS Rates ok! elog:260/8

System wide checks
Clock ok!
ADC ok!
WR ok!
FPGA 1 fail
Base Current Difference
aida12 fault 0x0 : 0x42 : 66
FPGA Timestamp error counter test result: Passed 11, Failed 1
Memory ok!


11:30

ucesb ok! elog:260/5
DB ok!
Stats ok!

11:55

ucesb ok!
DB ok!
Stats ok!
Attachment 1: lpg20.png
lpg20.png
Attachment 2: Screenshot_2021-04-22_Temperature_and_status_scan_aidas-gsi.png
Screenshot_2021-04-22_Temperature_and_status_scan_aidas-gsi.png
Attachment 3: Screenshot_2021-04-22_Statistics_aidas-gsi.png
Screenshot_2021-04-22_Statistics_aidas-gsi.png
Attachment 4: Screenshot_2021-04-22_at_08.19.51.png
Screenshot_2021-04-22_at_08.19.51.png
Attachment 5: Screenshot_2021-04-22_at_09.57.10.png
Screenshot_2021-04-22_at_09.57.10.png
Attachment 6: lpg21.png
lpg21.png
Attachment 7: Screenshot_2021-04-22_Temperature_and_status_scan_aidas-gsi(1).png
Screenshot_2021-04-22_Temperature_and_status_scan_aidas-gsi(1).png
Attachment 8: Screenshot_2021-04-22_Statistics_aidas-gsi(1).png
Screenshot_2021-04-22_Statistics_aidas-gsi(1).png
  258   Wed Apr 21 15:01:14 2021 LJW, MAWednesday 21st April 16:00-20:00

16:30

All System checks okay, except for:

FPGA Timestamp error:

   
             Base         Current         Difference
aida12 fault      0x0 :      0x1b :      27  
FPGA Timestamp error counter test result: Passed 11, Failed 1
If any of these counts are reported as in error
The ASIC readout system has detected a timeslip.
That is the timestamp read from the time FIFO is not younger than the last


Temperature Checks: See attachment 1

Statistics Checks: See attachment 2

Bias & Leakage Currents: See attachment 3


18:09

All system checks okay, except for:

FPGA Timestamp error:

   
             Base         Current         Difference
aida12 fault      0x0 :      0x1d :      29  
FPGA Timestamp error counter test result: Passed 11, Failed 1
If any of these counts are reported as in error
The ASIC readout system has detected a timeslip.
That is the timestamp read from the time FIFO is not younger than the last


Temperature checks: See attachment 4

Statistics Checks: See attachment 5

Bias & Leakage Currents: See attachment 6


19:40

All system checks okay, except for:

FPGA Timestamp error:

             Base         Current         Difference
aida12 fault      0x0 :      0x1d :      29  
FPGA Timestamp error counter test result: Passed 11, Failed 1
If any of these counts are reported as in error
The ASIC readout system has detected a timeslip.
That is the timestamp read from the time FIFO is not younger than the last

Temperature checks: See attachment 7

Statistics Checks: See attachment 8

Bias & Leakage Currents: See attachment 9


*Beam being tuned to another experiment (R3B) - all DSSD implants fluctuating back and forth to 0 Hz for around the last hour or so*

22:30

General check

Rates, Voltages, Temperatures, Ucesb are attached 10,11,12,13

Its been noticed that aida04 temp. is incresing to about 65 (red), still below 70.

the system wide check are all ok except FPGA


             Base         Current         Difference
aida12 fault      0x0 :      0x1d :      29  
FPGA Timestamp error counter test result: Passed 11, Failed 1
If any of these counts are reported as in error
The ASIC readout system has detected a timeslip.
That is the timestamp read from the time FIFO is not younger than the last


Attachment 1: 210421_1.png
210421_1.png
Attachment 2: 210421_2.png
210421_2.png
Attachment 3: 2104211_3.png
2104211_3.png
Attachment 4: 210421_4.png
210421_4.png
Attachment 5: 210421_5.png
210421_5.png
Attachment 6: 210421_6.png
210421_6.png
Attachment 7: 210421_7.png
210421_7.png
Attachment 8: 210421_8.png
210421_8.png
Attachment 9: 210421_9.png
210421_9.png
Attachment 10: 210421_2230_Stats.png
210421_2230_Stats.png
Attachment 11: 210421_2230_Temp.png
210421_2230_Temp.png
Attachment 12: 210421_2230_Ucesb.png
210421_2230_Ucesb.png
Attachment 13: 210421_2230_Voltages.png
210421_2230_Voltages.png
  248   Mon Apr 19 16:58:29 2021 LJWMonday 19th April 16:00-20:00 Shift
System Checks @ ~18:10 :


FEE64 module aida09 global clocks failed, 6
 Clock status test result: Passed 11, Failed 1

Understand status as follows
Status bit 3 : firmware PLL that creates clocks from external clock not locked
Status bit 2 : always logic '1' 
Status bit 1 : LMK3200(2) PLL and clock distribution chip not locked to external clock
Status bit 0 : LMK3200(1) PLL and clock distribution chip not locked to external clock
If all these bits are not set then the operation of the firmware is unreliable

	
FEE64 module aida07 failed
FEE64 module aida09 failed
Calibration test result: Passed 10, Failed 2

If any modules fail calibration , check the clock status and open the FADC Align and Control browser page to rerun calibration for that module

	
		 Base 		Current 	Difference
aida07 fault 	 0xd052 : 	 0xd05a : 	 8  
White Rabbit error counter test result: Passed 11, Failed 1

Understand the status reports as follows:-
Status bit 3 : White Rabbit decoder detected an error in the received data
Status bit 2 : Firmware registered WR error, no reload of Timestamp
Status bit 0 : White Rabbit decoder reports uncertain of Timestamp information from WR

	
			 Base 		Current 		Difference
aida12 fault 	 0x0 : 	 0x23 : 	 35  
FPGA Timestamp error counter test result: Passed 11, Failed 1
If any of these counts are reported as in error
The ASIC readout system has detected a timeslip.
That is the timestamp read from the time FIFO is not younger than the last

	
Returned 0 0 0 0 0 0 0 0 0 0 0 0  
Mem(KB) :	4	8	16	32	64	128	256	512	1k	2k	4k
aida01 :      1      6      4      0      1      5      2      3      2      3      6   : 35636
aida02 :     27      3      2      0      2      3      2      3      3      3      6   : 36516
aida03 :     33      9      2      1      1      3      2      3      3      3      6   : 36556
aida04 :     11      6      5      4      2      4      3      3      3      3      6   : 37036
aida05 :     15      8      7      4      3      4      4      2      3      3      6   : 36908
aida06 :     13      9      7      3      3      4      2      3      3      3      6   : 36876
aida07 :      1      3      3      2      2      3      1      3      3      3      6   : 36236
aida08 :     29      5      2      1      1      2      2      3      3      3      6   : 36380
aida09 :      3      8      2      0      2      3      2      2      2      4      6   : 36972
aida10 :      9      5      3      3      1      4      2      4      2      3      6   : 36124
aida11 :      5      7      3      2      2      2      2      4      2      3      6   : 35900
aida12 :     24      6      3      1      2      3      2      2      3      3      6   : 36064


System Checks @ ~19:55

FEE64 module aida09 global clocks failed, 6
 Clock status test result: Passed 11, Failed 1

Understand status as follows
Status bit 3 : firmware PLL that creates clocks from external clock not locked
Status bit 2 : always logic '1' 
Status bit 1 : LMK3200(2) PLL and clock distribution chip not locked to external clock
Status bit 0 : LMK3200(1) PLL and clock distribution chip not locked to external clock
If all these bits are not set then the operation of the firmware is unreliable

	
FEE64 module aida07 failed
FEE64 module aida09 failed
Calibration test result: Passed 10, Failed 2

If any modules fail calibration , check the clock status and open the FADC Align and Control browser page to rerun calibration for that module


		 Base 		Current 	Difference
aida05 fault 	 0xdb9a : 	 0xdb9d : 	 3  
aida06 fault 	 0xb74f : 	 0xb752 : 	 3  
aida07 fault 	 0xd052 : 	 0xd05e : 	 12  
aida08 fault 	 0xe4c1 : 	 0xe4c4 : 	 3  
aida09 fault 	 0xaf4b : 	 0xaf4d : 	 2  
White Rabbit error counter test result: Passed 7, Failed 5

Understand the status reports as follows:-
Status bit 3 : White Rabbit decoder detected an error in the received data
Status bit 2 : Firmware registered WR error, no reload of Timestamp
Status bit 0 : White Rabbit decoder reports uncertain of Timestamp information from WR


			 Base 		Current 		Difference
aida12 fault 	 0x0 : 	 0x27 : 	 39  
FPGA Timestamp error counter test result: Passed 11, Failed 1
If any of these counts are reported as in error
The ASIC readout system has detected a timeslip.
That is the timestamp read from the time FIFO is not younger than the last


Returned 0 0 0 0 0 0 0 0 0 0 0 0  
Mem(KB) :	4	8	16	32	64	128	256	512	1k	2k	4k
aida01 :     18     10      2      2      1      5      2      3      2      3      6   : 35768
aida02 :     21      9      2      1      2      2      2      3      3      3      6   : 36444
aida03 :     13      5      6      1      2      2      2      3      3      3      6   : 36444
aida04 :     30     11      4      3      2      4      3      3      3      3      6   : 37104
aida05 :     10      9      8      4      4      4      4      2      3      3      6   : 36976
aida06 :     22     17     10      3      2      3      1      4      3      3      6   : 37088
aida07 :     20      8      4      1      2      4      1      2      3      3      6   : 35952
aida08 :     14      4      3      0      1      2      2      3      3      3      6   : 36296
aida09 :     24      8      4      0      1      3      3      3      3      3      6   : 36768
aida10 :     19      8      4      1      1      4      2      3      3      3      6   : 36652
aida11 :      6      6      1      2      3      1      2      4      2      3      6   : 35800
aida12 :     15      7      1      1      2      4      1      2      3      3      6   : 35876
Attachment 1: 63.png
63.png
Attachment 2: Screenshot_2021-04-19_Statistics_aidas-gsi(3).png
Screenshot_2021-04-19_Statistics_aidas-gsi(3).png
Attachment 3: Screenshot_2021-04-19_Temperature_and_status_scan_aidas-gsi(4).png
Screenshot_2021-04-19_Temperature_and_status_scan_aidas-gsi(4).png
Attachment 4: 64.png
64.png
Attachment 5: 65.png
65.png
Attachment 6: 66.png
66.png
ELOG V3.1.4-unknown